 N O V E M B E R 8 , 2 0 0 7 Charlie Scharf Chief Executive Officer, Retail Financial Services 2007 BancAnalysts Association of Boston Conference Exhibit 99.1 |
 2 Agenda RFS financial results Home equity credit Home lending opportunity Branch banking update |
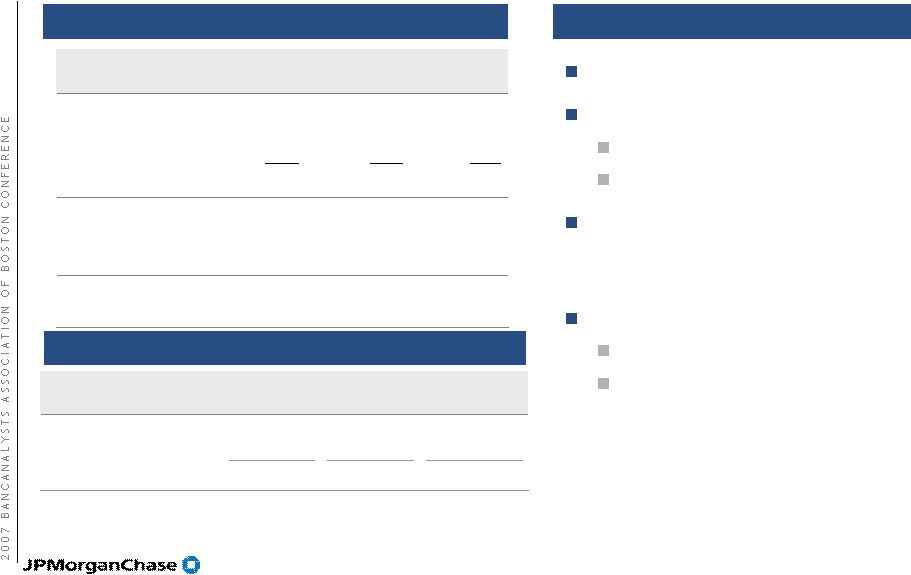 3 Retail Financial Services results YTD YTD 3Q06 3Q07 $O/(U) Revenue¹ $11,097 $12,664 $1,567 Credit Costs 299 1,559 (1,260) Expense¹ 6,636 7,360 (724) Net Income $2,495 $2,283 ($212) Regional Banking $2,265 $1,930 ($335) Mortgage ($51) $107 $158 Auto Finance $281 $246 ($35) ROE 24% 19% Overhead (ex. CDI) 57% 55% Financial results ($mm) 2007 includes impact of BNY Revenue growth of 14% driven by: Regional Banking up 7% Mortgage Production up 68% Credit costs increased due to home equity and subprime mortgage Expense growth reflects: Increased production and sales Investment in retail distribution YTD 3Q06 YTD 3Q07 $O/(U) Net Charge-offs $362 $805 ($443) Increase in Allowance (63) 754 (817) Total $299 $1,559 ($1,260) Comments Credit Costs ($mm) 1 As a result of the adoption of SFAS 159 ("Fair Value Option") certain loan origination costs commenced being recorded as expense in 1Q07 |
 4 HOME EQUITY CREDIT |
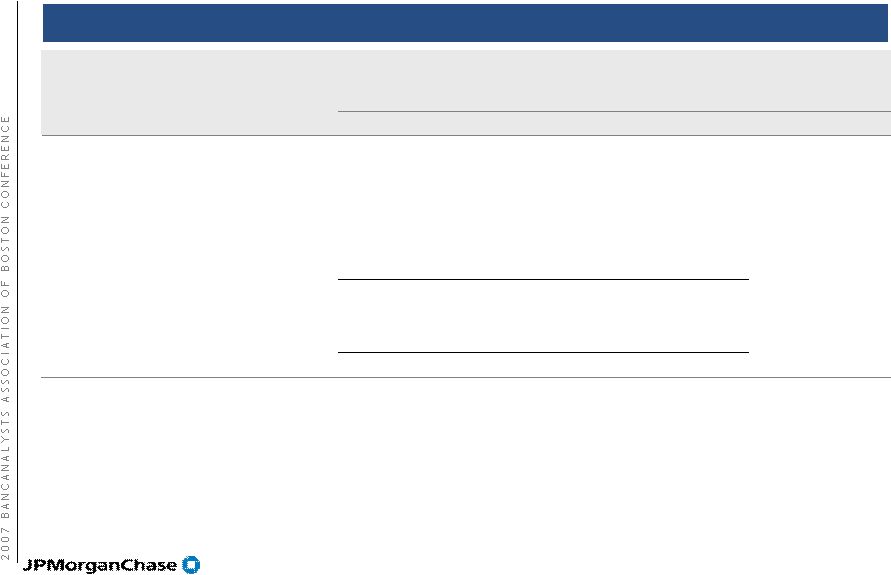 5 Consumer real estate exposure Balances 1 Prime warehouse loans include prime mortgage loans originated with the intent to sell, which, for new originations on or after January 1, 2007, were accounted for at fair value under FAS 159. These loans, classified as Trading Assets on the Consolidated Balance Sheet totaled $14.4 billion, $15.2 billion, and $11.6 billion at September 30, 2007, June 30, 2007 and March 31, 2007 2 Includes ($329) in 2Q07 and ($306) in 3Q07 3 Held-for-investment prime mortgage loans were transferred from RFS to the Corporate segment for risk management and reporting purposes Balances EOP ($B) Markdowns/Net Reserve Build ($mm) 1Q07 2Q07 3Q07 3Q07YTD Mortgage Banking Warehouse 1 $20.3 $20.0 $14.7 ($186) RFS – Portfolio Prime Mortgage $2.4 $2.3 $2.5 Subprime Mortgage 9.0 8.7 12.1 ($121) Home Equity $87.7 $91.0 $93.0 ($635) 2 RFS Portfolio $99.1 $102.0 $107.6 Prime Mortgage - Corporate³ 26.5 27.3 32.8 Total Consumer Real Estate Exposure $125.6 $129.3 $140.4 |
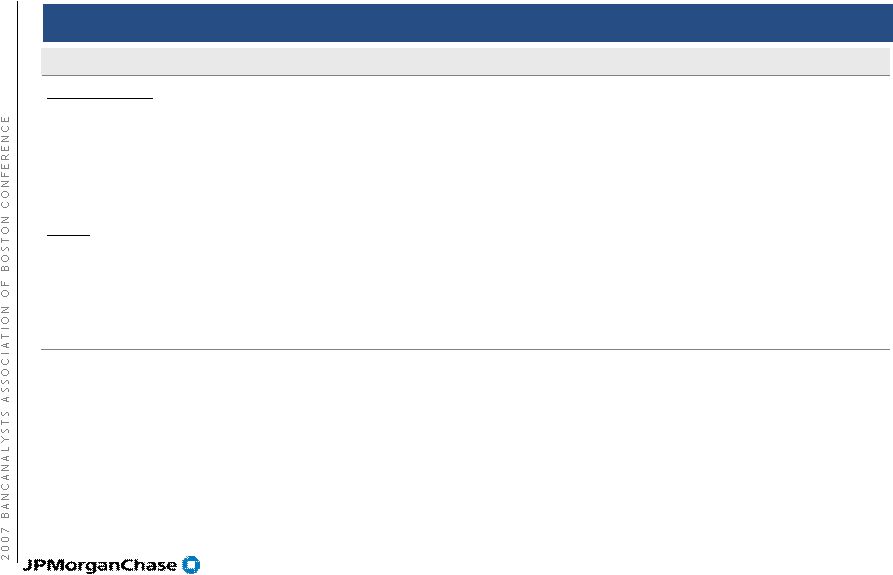 6 Credit performance Key credit statistics 3Q06 4Q06 1Q07 2Q07 3Q07 Home Equity Average Outstandings ($B) $78.8 $84.2 $86.3 $89.2 $91.8 Net Charge-offs ($mm) $29 $51 $68 $98 $150 Net Charge-off Rate 0.15% 0.24% 0.32% 0.44% 0.65% Total Allowance for Loan Losses ($mm) $1,306 $1,392 $1,453 $1,772 $2,105 Nonperforming Loans ($mm)¹ $1,404 $1,677 $1,655 $1,760 $1,991 Allowance to Annualized NCOs 2.6x 1.6x 2.0x 1.7x 1.5x Allowance to NPLs² 95% 89% 94% 115% 107% ¹ NPLs included loans hold-for-sale and loans accounted for at fair value under SFAS 159 2 Loans held-for-sale and Loans accounted for at fair value under SFAS 159 were excluded when calculating the allowance coverage ratio and the Net charge-off rate |
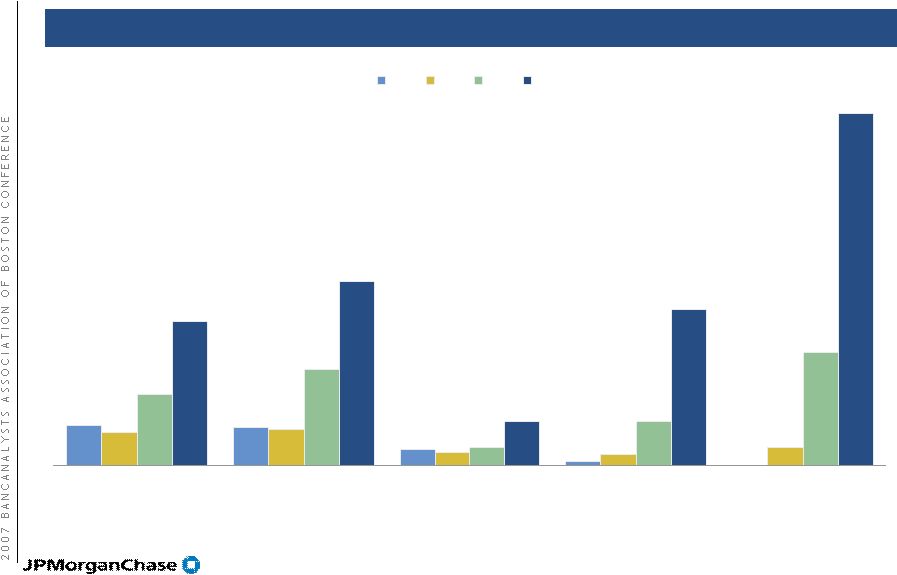 7 0.18% 0.17% 0.07% 0.02% 0.15% 0.16% 0.06% 0.05% 0.08% 0.32% 0.43% 0.08% 0.20% 0.51% 0.65% 0.83% 0.20% 0.70% 1.59% JPM WFC BAC WM CFC 1Q06 3Q06 1Q07 3Q07 Home Equity net charge-off trends Peer trend comparison Source: Company reports; home equity as defined by each company |
 8 0.60% 0.31% 0.21% 0.18% 0.50% 0.30% 0.26% 0.30% 0.40% 0.52% 0.34% 0.40% 0.53% 0.90% 0.62% 0.32% 0.76% 0.86% 1.00% JPM WFC BAC WM CFC 1Q06 3Q06 1Q07 3Q07 Home Equity nonperforming loan trends Peer trend comparison Source: Company reports; home equity and NPL as defined by each company |
 9 Housing price decline Historically relied on FICO and underlying property value Risk layering High CLTV, especially purchase loans Stated income vs. full documentation Direct vs. indirect channels Owner-occupied vs. investor Home Equity - credit issues |
 10 Prime Home Equity – credit issues Losses by CLTV CLTV % 2004 2005 2006 1Q07 2Q07 3Q07 < 80 0.05% 0.04% 0.05% 0.08% 0.10% 0.13% 80 – 90 0.12% 0.12% 0.18% 0.32% 0.33% 0.60% 90 – 95 0.20% 0.17% 0.29% 0.40% 0.60% 1.23% > 95 0.92% 0.71% 0.79% 1.14% 1.54% 2.08% Total 0.16% 0.13% 0.17% 0.27% 0.35% 0.53% Note: CLTV at origination Losses up across all CLTVs but not necessarily above expected levels |
 11 Prime Home Equity – credit issues Loss rates for key markets ¹ House price change is based on OFHEO HPI between September 2006 and September 2007 Declining housing prices are a key determinant of loss rates 9/06 -9/07 House Price Chang e 1 2005 2006 YTD 3Q07 Texas 5.1% 0.09% 0.09% 0.14% Illinois 2.4% 0.09% 0.13% 0.16% Indiana 2.3% 0.47% 0.51% 0.53% New Jersey -0.2% 0.02% 0.05% 0.16% New York -0.2% 0.01% 0.04% 0.11% Ohio -0.9% 0.43% 0.58% 0.69% Florida -2.6% 0.00% 0.04% 0.68% Michigan -3.2% 0.32% 0.59% 1.13% Arizona -3.6% 0.04% 0.00% 0.21% California -3.7% 0.01% 0.06% 0.62% |
 12 2003 2004 2005 2006 YTD 3Q07 Origination ($B) $8.5 $14.6 $15.9 $13.7 $9.7 Weighted Avg FICO 733 735 739 742 746 Weighted Avg CLTV 78% 78% 80% 81% 82% % CLTV >90 11% 16% 20% 27% 31% % CA and FL 51% 50% 45% 44% 44% Prime Home Equity – origination profile Banking Center Channel¹ 2003 2004 2005 2006 YTD 3Q07 Origination ($B) $14.3 $16.4 $17.5 $15.2 $12.8 Weighted Avg FICO 736 733 737 745 748 Weighted Avg CLTV 67% 68% 68% 68% 68% % CLTV >90 10% 10% 8% 6% 4% % CA and FL 0.4% 0.6% 0.8% 0.7% 0.7% Broker Channel¹ ¹ CLTV and FICO at origination |
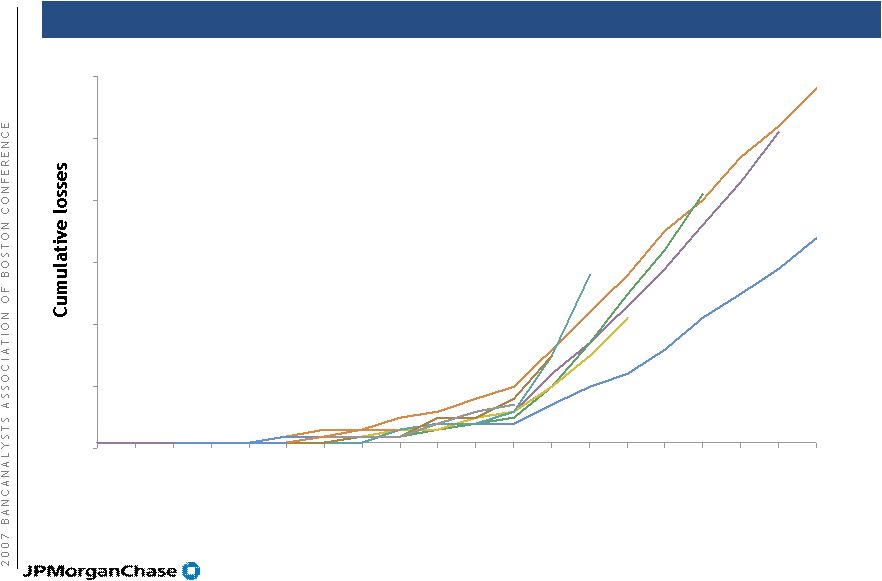 13 -0.01% 0.09% 0.19% 0.29% 0.39% 0.49% 0.59% 1 2 3 4 5 6 7 8 9 10 11 12 15 18 21 24 27 30 33 36 Prime Home Equity - Banking Center Channel 2002 2004 2003 1Q06 1H05 2H05 2Q06 3Q06 4Q06 1Q07 2Q07 Cumulative loss rates by months on books as of 9/30/2007 # of months on books |
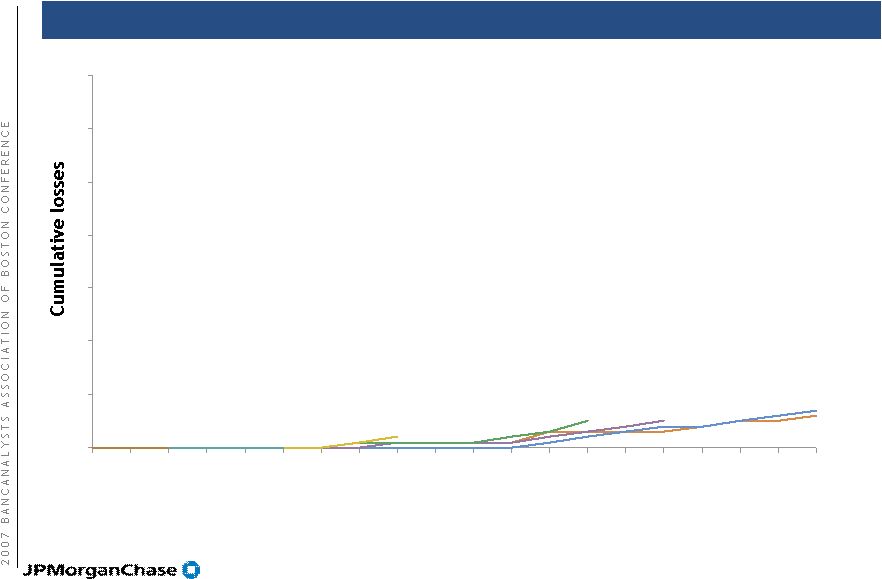 14 0.00% 0.10% 0.20% 0.30% 0.40% 0.50% 0.60% 0.70% 1 2 3 4 5 6 7 8 9 10 11 12 15 18 21 24 27 30 33 36 Prime Home Equity - Broker Channel 2002 2004 2003 1Q06 1H05 2H05 2Q06 Cumulative loss rates by months on books as of 9/30/2006 # of months on books 2H05 |
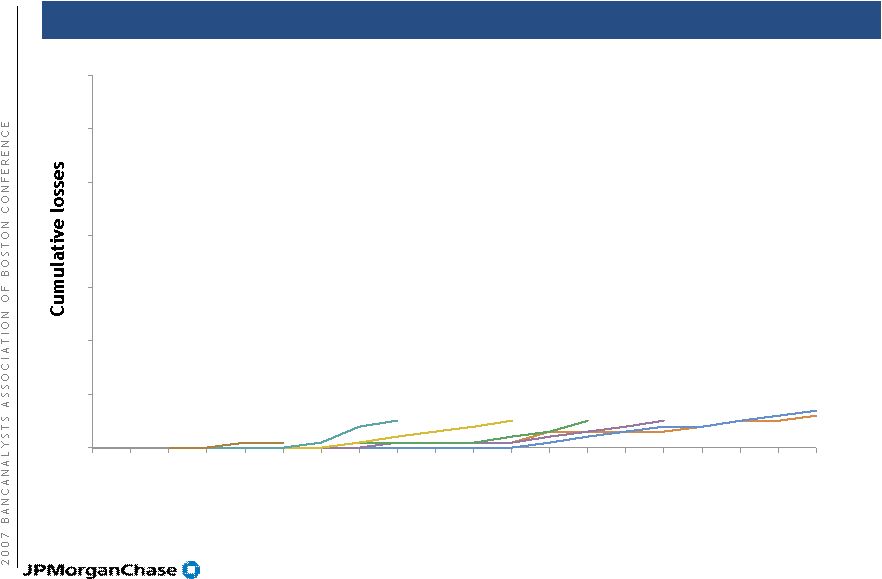 15 0.00% 0.10% 0.20% 0.30% 0.40% 0.50% 0.60% 0.70% 1 2 3 4 5 6 7 8 9 10 11 12 15 18 21 24 27 30 33 36 Prime Home Equity - Broker Channel 2002 2004 2003 1Q06 1H05 2H05 2Q06 3Q06 Cumulative loss rates by months on books as of 12/31/2006 # of months on books |
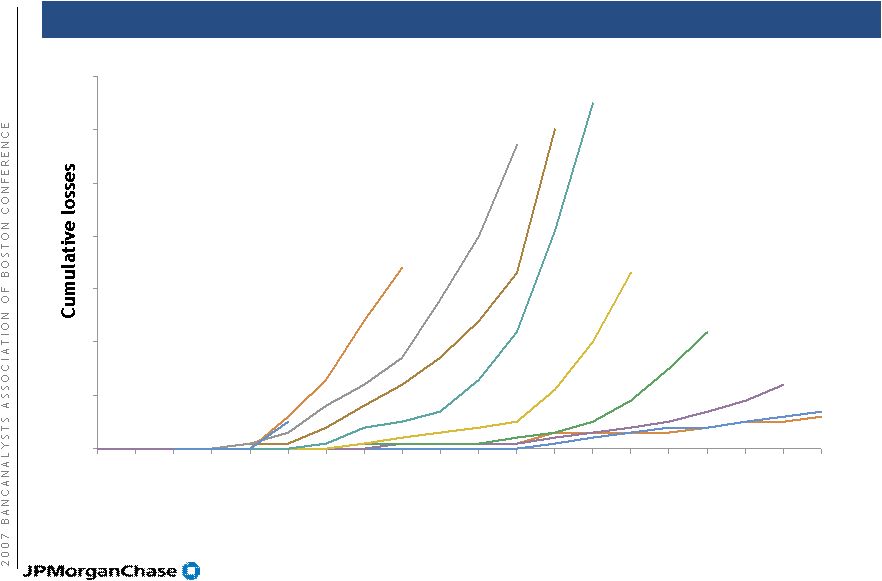 16 0.00% 0.10% 0.20% 0.30% 0.40% 0.50% 0.60% 0.70% 1 2 3 4 5 6 7 8 9 10 11 12 15 18 21 24 27 30 33 36 Prime Home Equity - Broker Channel Cumulative loss rates by months on books as of 9/30/2007 2003 2002 2H05 2004 1H05 1Q06 2Q06 # of months on books 3Q06 1Q07 2Q07 4Q06 |
 17 Home Equity credit underwriting Changed maximum CLTV to 90% in broker channel — Less than 90% CLTV in certain states Eliminated stated income across wholesale channel Eliminated stated income with debt-to-income over 50% across all channels Investor/second homes CLTV capped at 80% Significantly strengthened underwriting process relating to appraisal, income/cash flow assessment and owner occupancy Stopped originating subprime home equity Changes and impacts Estimate underwriting changes would have eliminated: — Approximately 30% of 2006 originations — Approximately 85% of 2006 vintage losses in 2007 |
 18 HOME LENDING OPPORTUNITY |
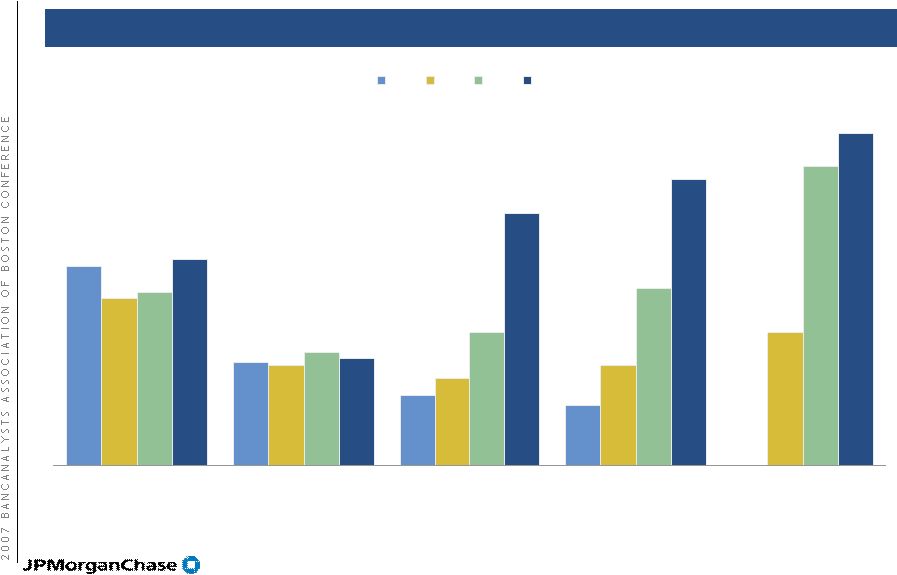
 19 3Q06 3Q07 $ Amt Rank % Share $ Amt Rank % Share YoY Change CFC 116.6 1 15.4% 94.6 1 16.6% (19)% WFC 77.3 2 10.2% 68.1 2 12.0% (12)% JPM 42.7 5 5.7% 51.1 3 9.0% 20% BAC 42.4 6 5.6% 48.0 4 8.4% 13% C 48.8 3 6.5% 45.2 5 7.9% (7)% All others in top 10 136.0 18.0% 103.6 18.2% (24)% Total Top 10 463.8 61.4% 410.6 72% (11)% Total Market 755.0 570.0 (25)% Home lending opportunity Market share - production JPM increased market share to 9.0% and has become the #3 originator JPM volume and market share up in a contracting market due to expanded distribution Salesforce 3Q06 3Q07 O/(U) Retail 3,145 3,947 802 Wholesale 622 851 229 Direct to Consumer 495 479 (16) Home Equity 287 291 4 Total Salesforce 4,549 5,568 1,019 Expanded distribution capability Source: Inside Mortgage Finance |
 20 BRANCH BANKING UPDATE |
 21 3Q06 4Q06 1Q07 2Q07 3Q07 Consumer & Business Banking $498 $490 $506 $585 $591 Loan Portfolio/Other 246 129 184 44 20 Total $744 $619 $690 $629 $611 Branch Banking profitability and growth drivers 3Q07 Key statistics 1 Average deposits of $205B, up 10% 3,096 branches, up by 419; 8,943 ATMs, up by 1,118 Average mortgage loans owned of $10B vs $48B 2,3 Average home equity loans owned of $92B, up 16% Net Income ($mm) 1 Growth rates are YoY ² Does not include held-for-sale loans ³ Reflects primarily subprime mortgage loans owned. $19.4B of prime mortgage loans were transferred to Corporate on 1/1/07 |
 22 Branch Banking Managing margin through the cycle Continue to grow branch presence Growth in salesforce Growth in production and sales Bank of New York update Priorities |
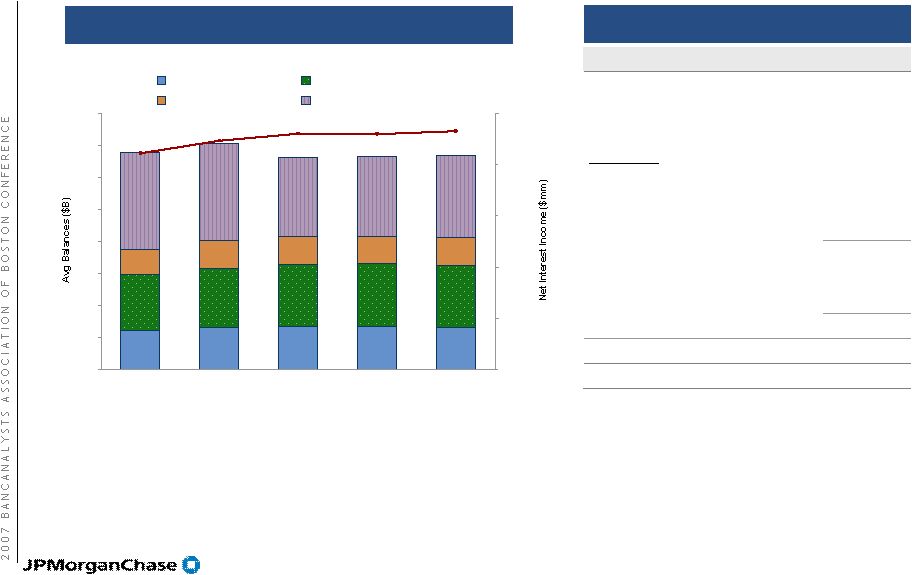 23 Fed Funds 5.25% 5.25% 5.25% 5.25% 4.75% $2,299 $2,296 $2,325 $2,229 $2,107 0 50 100 150 200 250 300 350 400 3Q06 4Q06 1Q07 2Q07 3Q07 0 500 1,000 1,500 2,000 2,500 Checking Savings Time Loan Balances Regional Banking: managing margin through the cycle Balance sheet mix and margin Balance sheet mix and margin ($mm) 2 2 2 1 3Q06 does not include BNY 2 Held-for-investment prime mortgage loans were transferred from RFS to the Corporate segment for risk management and reporting purposes 3Q06 Margin ($B) $2,107 Deposits Account Growth (#) 173 Avg. Account Balance (48) Migration/Spreads 11 Subtotal - Deposits $135 Lending 82 Total Variance $218 3Q07 Margin $2,325 1 |
 24 2.75% 2.73% 2.73% 2.73% 2.73% 2.50% 2.60% 2.70% 2.80% 2.90% 3.00% 3Q06 4Q06 1Q07 2Q07 3Q07 Managing deposit margin Manage customer dollars in total to optimize economics as dollars shift between investment alternatives Actively introduce new products to meet changing customer needs CD-only households and balances are consistent with prior year levels Narrower product spreads are creating ongoing pressure Pricing by region Competitive in markets where appropriate Retail Banking deposit margin |
 25 New build investment Targeting 130-140 new branches in 2007; 125–150 branches annually Focused on expansion in major footprint markets New branches 2003 2004 2005 2006 YTD 3Q07 Total Metro NY — 13 51 22 9 95 Chicago 20 54 25 15 10 124 Arizona 7 10 19 11 8 55 Texas 17 30 26 22 15 110 Michigan 2 3 10 35 5 55 Colorado 5 2 6 12 4 29 Other 8 12 9 8 5 42 Total 59 124 146 125 56 510 |
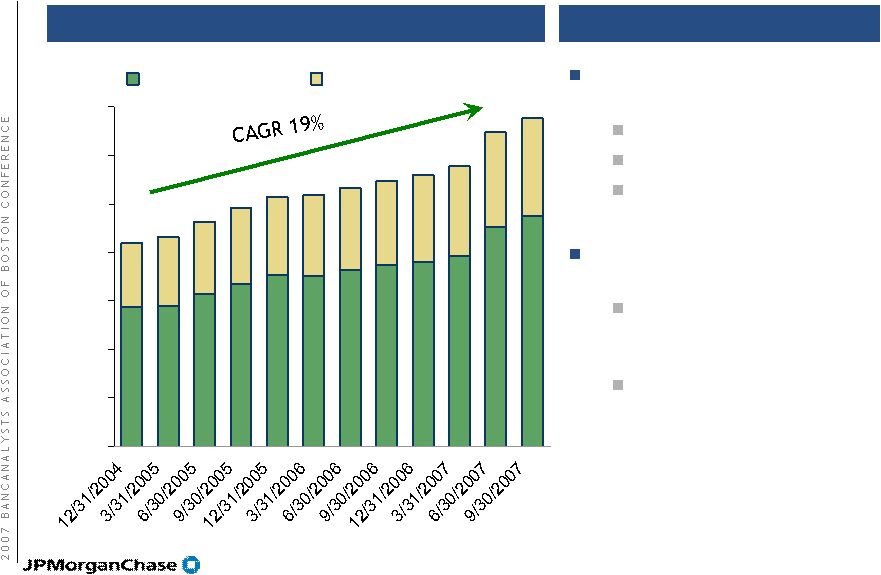 26 Adding sales specialists and bankers Loan officers Investment sales reps Business banking relationship managers Optimizing support staff in the branches Reduction in same-store tellers from 4.9 to 4.3 tellers per branch since 12/31/04 The personal banker to teller ratio expected to reach 1:1 by end of 2008 Salesforce growth Quarterly trend 0 2,000 4,000 6,000 8,000 10,000 12,000 14,000 Personal Bankers Sales Specialists Highlights |
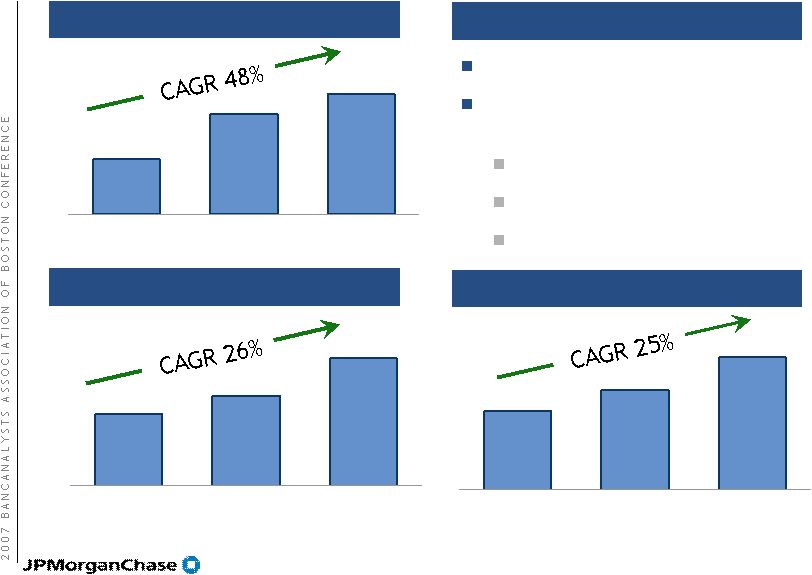 27 486 889 1,068 3Q05 YTD 3Q06 YTD 3Q07 YTD $8 $6 $5 3Q05 YTD 3Q06 YTD 3Q07 YTD Growth in cross-sell Mortgage sales ($B) Credit cards (# units in 000s) Highlights Investment sales ($B) Deepening customer relationships Same store production (3Q07 vs 3Q06): Credit card sales up 61% Mortgage originations up 18% Investment sales up 21% $14 $11 $9 3Q05 YTD 3Q06 YTD 3Q07 YTD Note: 3Q05 YTD and 3Q06 YTD exclude BNY |
 28 Developing and deepening customer relationships Total core retail households 1 New retail customers after 90 days 1 Branch based households (i.e., no credit card only or out of footprint lending) Total Households Checking Households With Credit Card With Online Banking With Online Billpay Multi Product (Core) Single Product (Core) Checking Only Checking Households With Credit Card With Online Banking With Online Billpay 8,829,843 81% 48% 42% 14% 10,223,126 83% 53% 57% 27% Sep 2007 Jan 2006 45% 55% 45% 89% 16% 31% 9% 49% 51% 44% 92% 21% 56% 14% June 2007 Vintage Jan 2006 Vintage |
 29 Sales through inbound call center 2003 2006 2003 2006 2003 2006 Credit cards Sales per 1,000 calls Online banking Note: 2003 data includes ONE only |
 30 Bank of New York branch update 339 branches purchased — All branches have been rebranded — 100% of interior renovation work complete 18 consolidations completed through 10/5/07 27 branch consolidations remaining for 2007 and 2008 Showing progress |
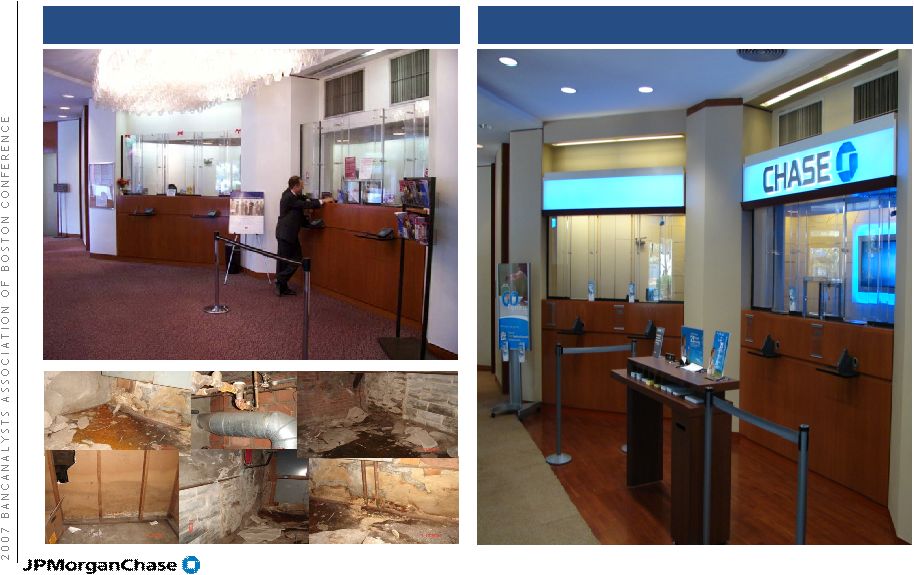 31 BNY – before and after Before After |
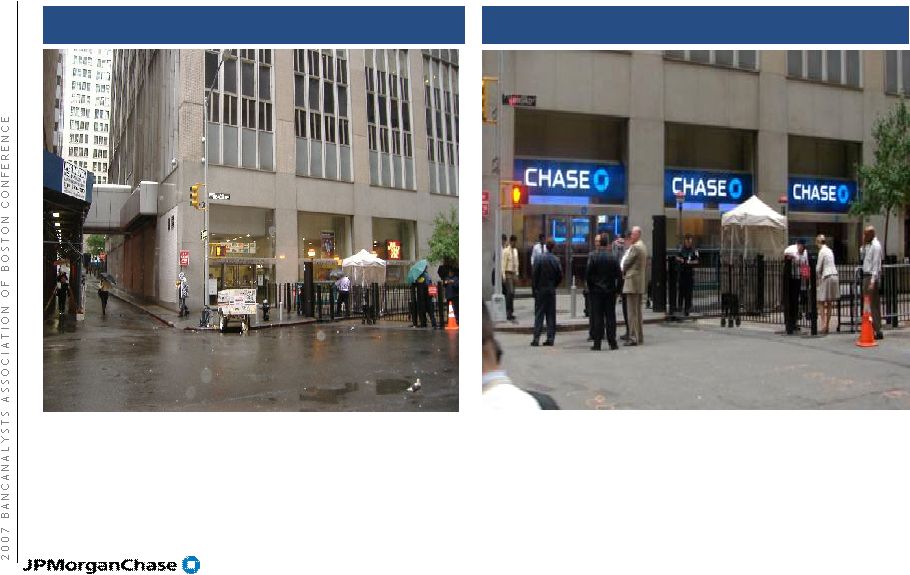 32 BNY – before and after Before After |
 33 Bank of New York – integration timeline 1Q07 Extend branch hours Training System conversions Sales campaigns Facility and equipment upgrade 2Q07 Job family mapping Salesforce growth Sales management process Rebranding Credit card/debit card reissue Chase incentive program implemented Branch consolidations begin 3Q07 Branch P&L roll-out 50% of Personal Bankers trained and licensed 4Q07 Salesforce fully trained Branch consolidations on track as planned; 50% complete |
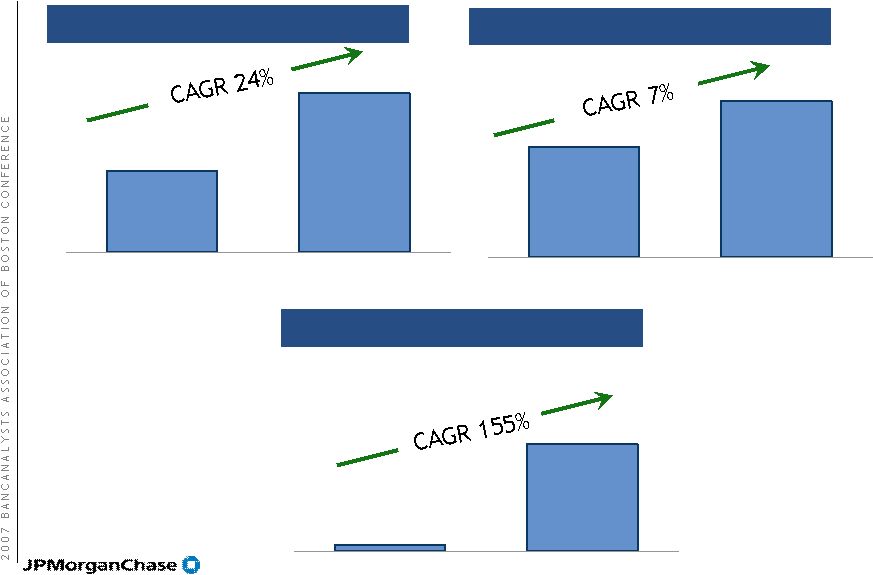
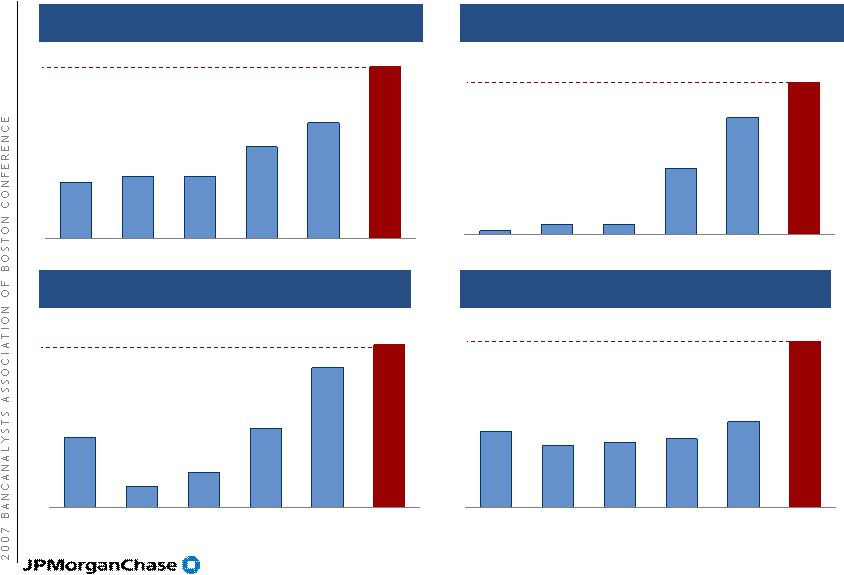 34 Growth in BNY cross-sell Credit Cards¹ (# units) New Checking Accounts¹ Investment Sales¹ ($mm) Mortgage and Home Equity¹ ($mm) 2005 BNY 4Q06 1Q07 2Q07 3Q07 Target 2008 2005 BNY 4Q06 1Q07 2Q07 3Q07 Target 2008 2005 BNY 4Q06 1Q07 2Q07 3Q07 Target 2008 2005 BNY 4Q06 1Q07 2Q07 3Q07 Target 2008 2 Sales per branch; per month 1.0x 2.0x 3.0x higher 40.0x higher 1.0x 2.2x higher 1.0x 30.6x 1.1x 1.0x 2.3x higher 2.0x 1.0x 1 Based on average of comparable deposit size Chase branches in NY, NJ, CT 2 Target exit rate at end of 2008 2 2 2 |
 35 Summary Cautious about housing market and effect on Home Equity portfolio losses Actively building businesses Chase branch build-out and Bank of New York branches — Enhanced distribution capabilities leading to increased production and sales Home Lending opportunity — Gaining share in mortgage market — Well-positioned for further share consolidation |
 36 This presentation contains forward-looking statements within the meaning of the Private Securities Litigation Reform Act of 1995. Such statements are based upon the current beliefs and expectations of JPMorgan Chase’s management and are subject to significant risks and uncertainties. Actual results may differ from those set forth in the forward-looking statements. Factors that could cause JPMorgan Chase’s results to differ materially from those described in the forward-looking statements can be found in the firm’s Quarterly Report on Form 10-Q for the quarter ended June 30, 2007 and in the Annual Report on Form 10-K for the year ended December 31, 2006 (as amended), filed with the Securities and Exchange Commission and available at the Securities and Exchange Commission’s Internet site (http://www.sec.gov). Forward-looking statements |