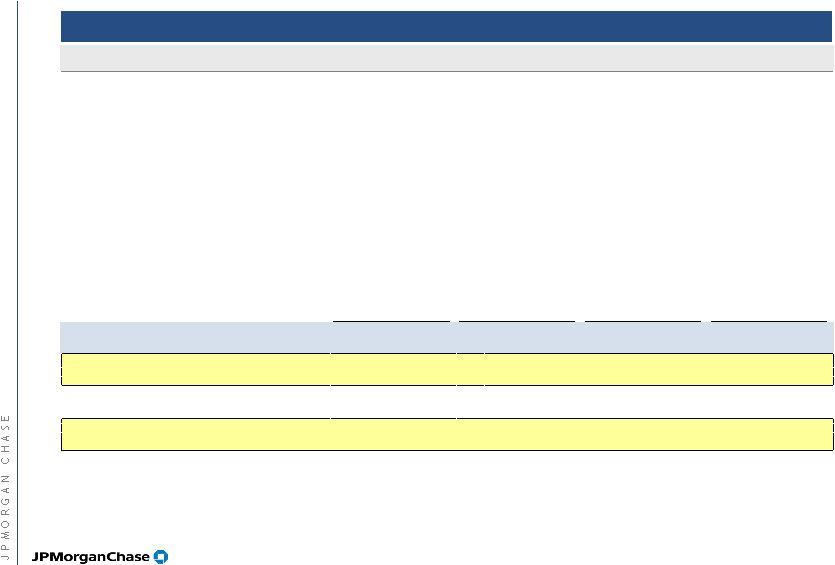
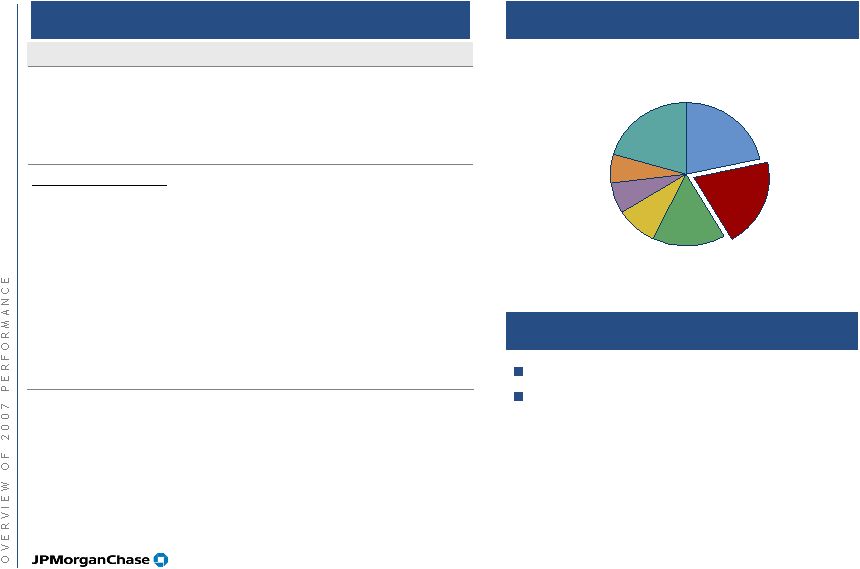
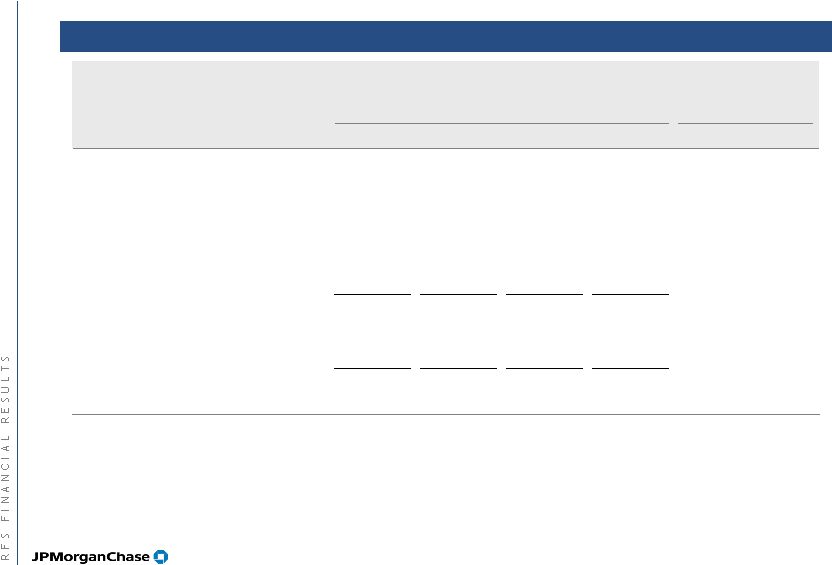
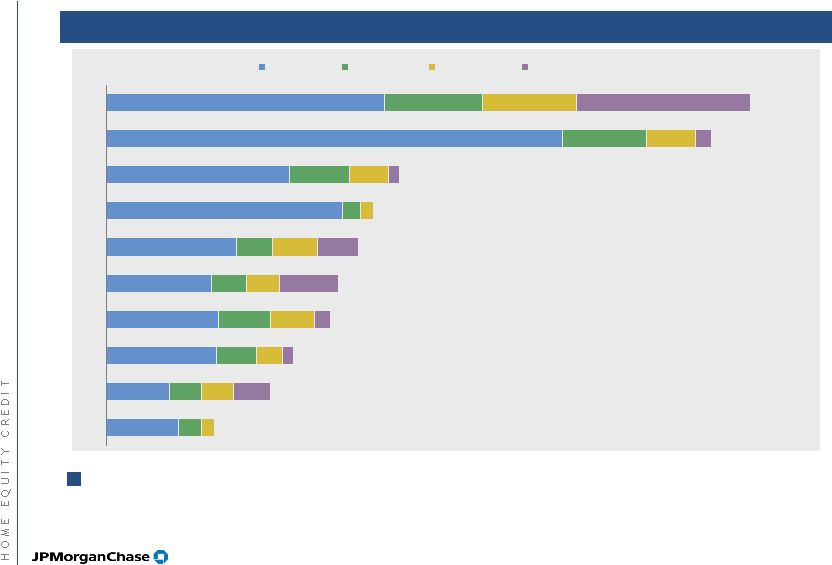
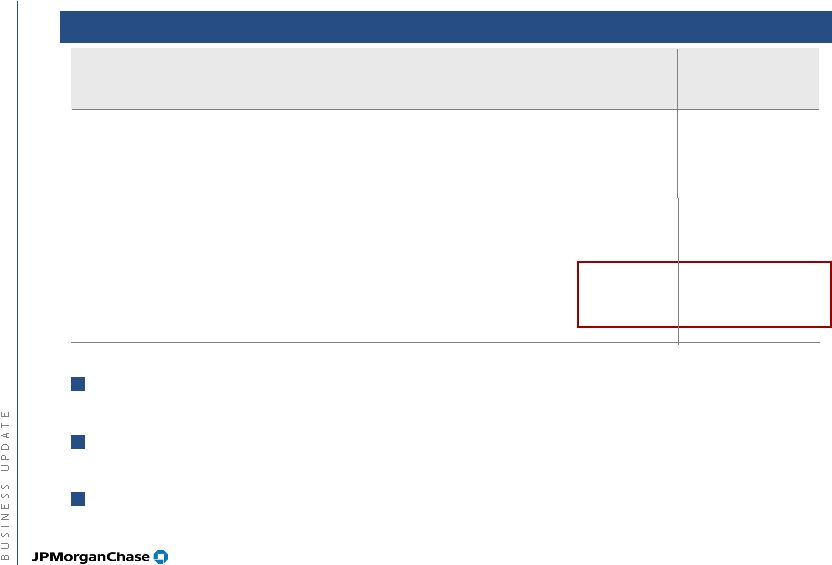
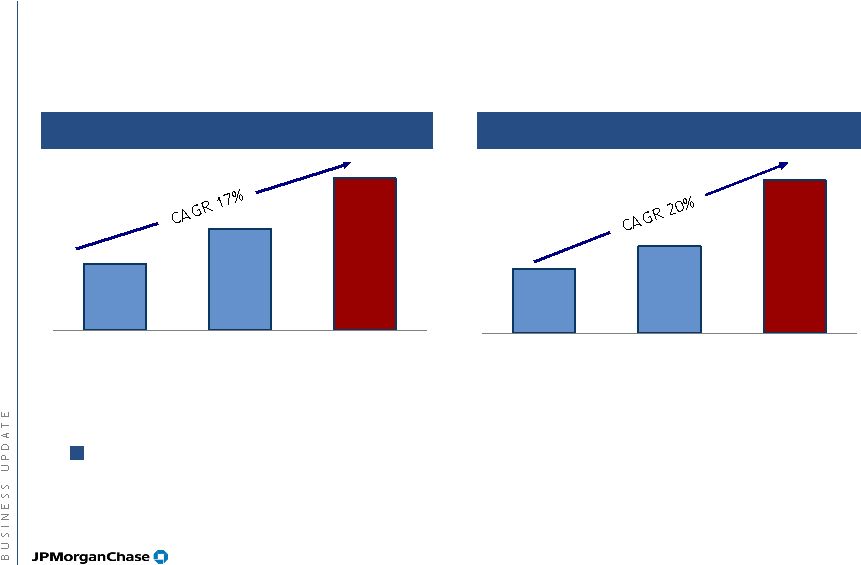
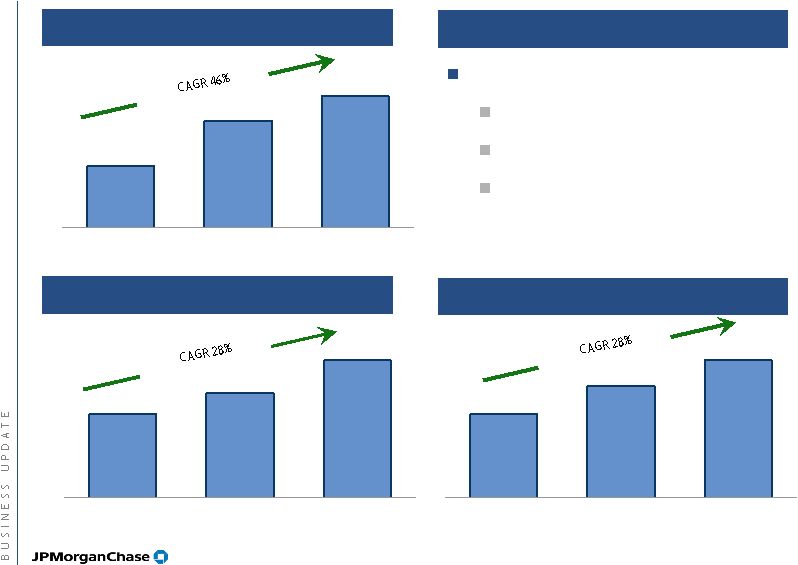
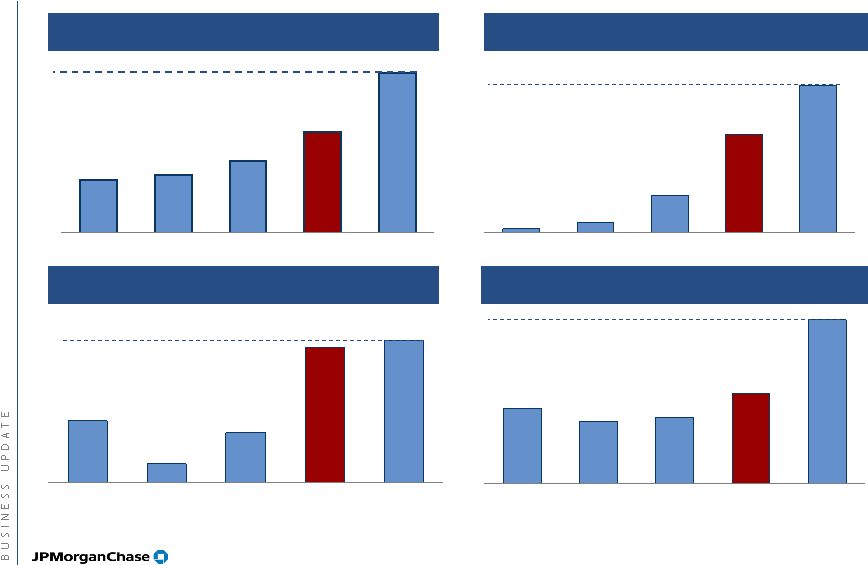
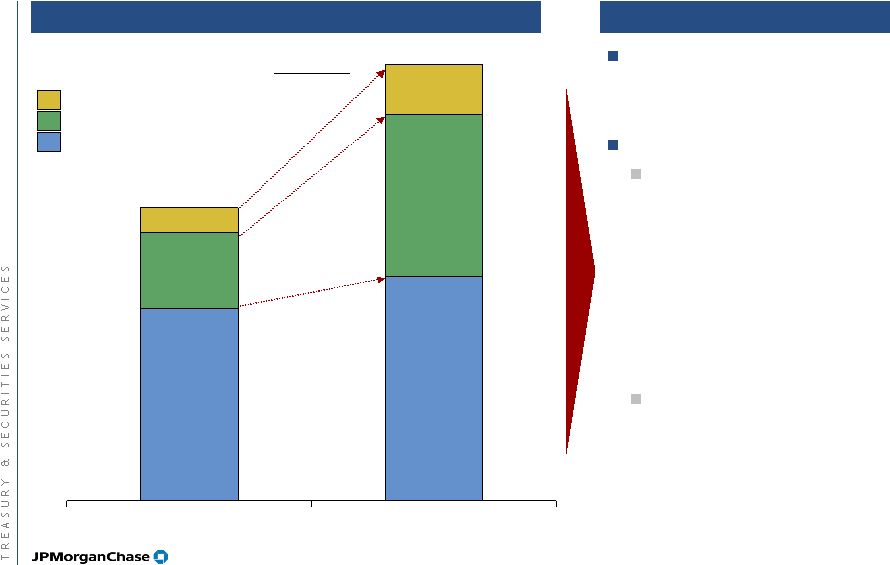
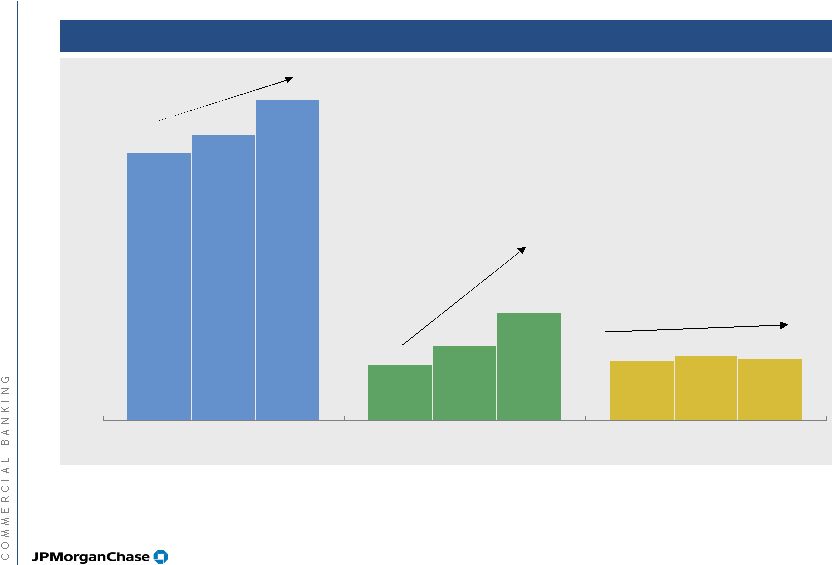
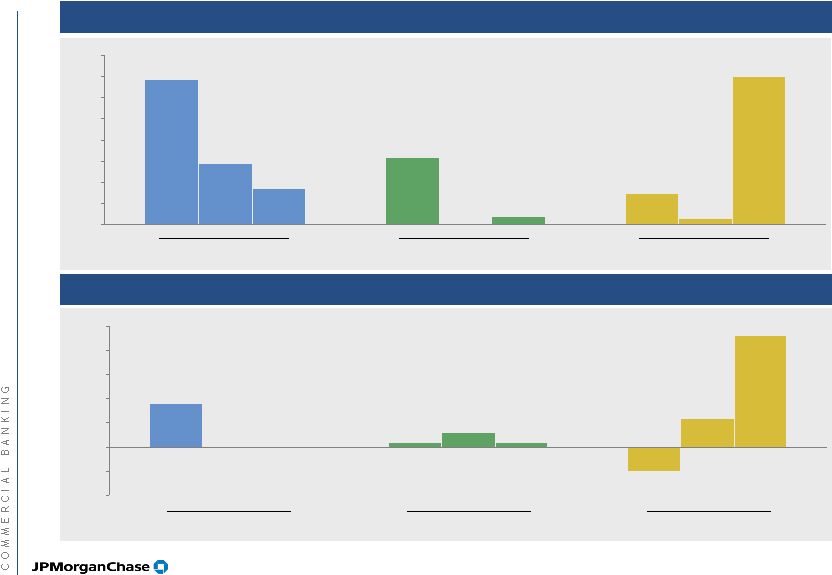
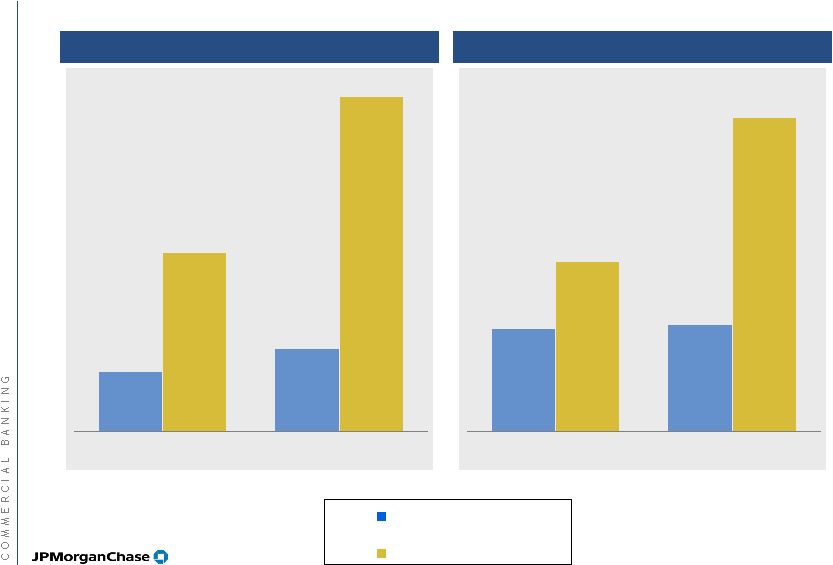
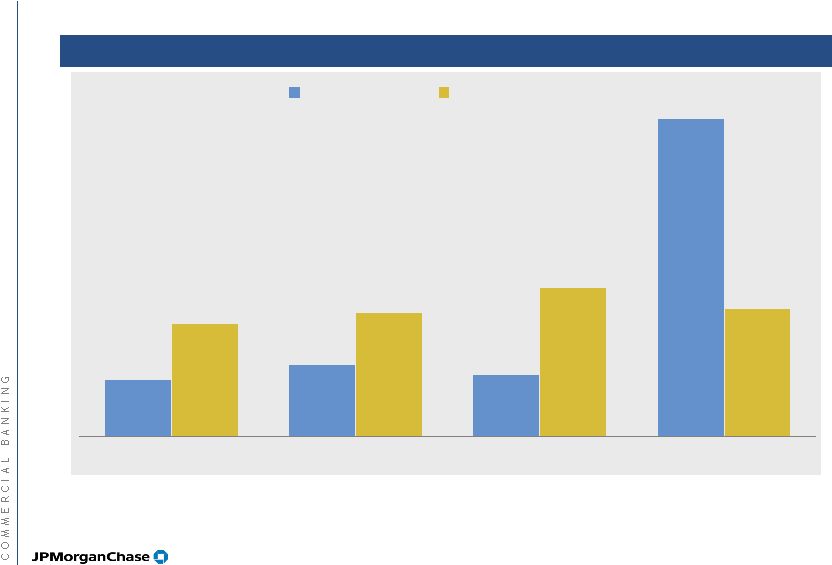
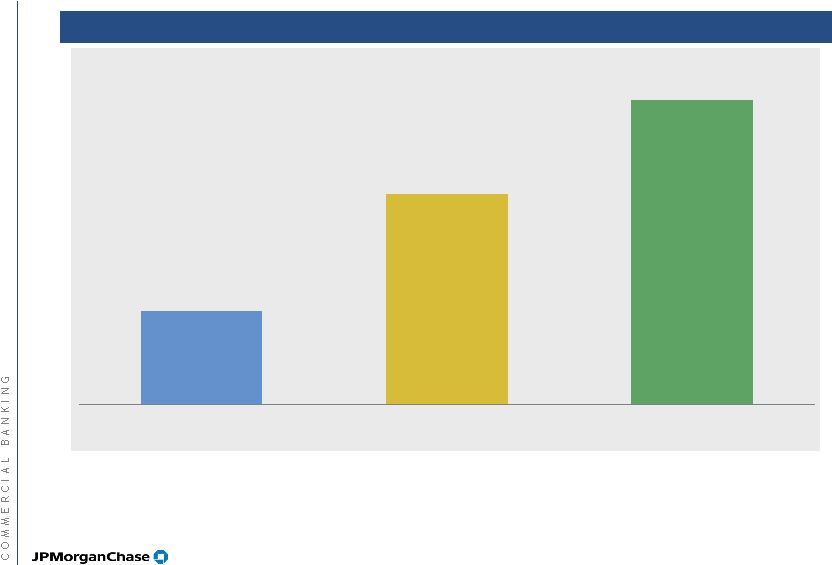
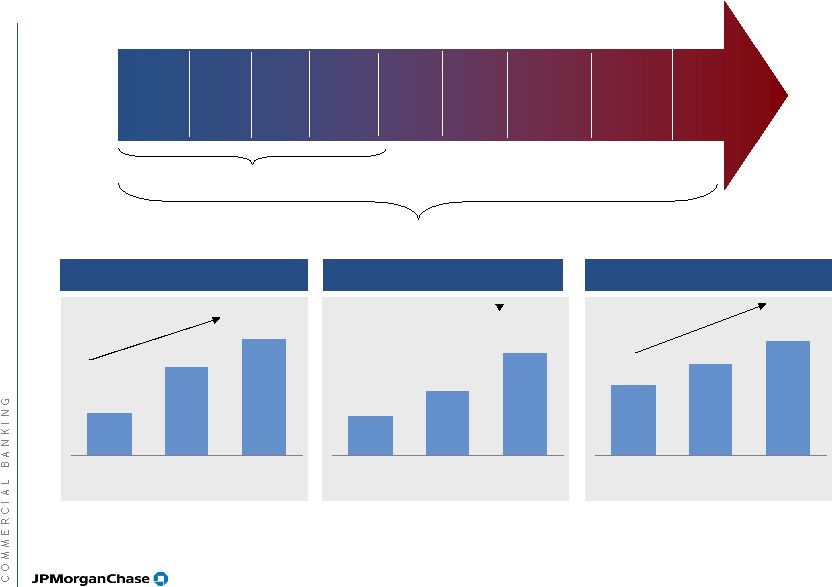
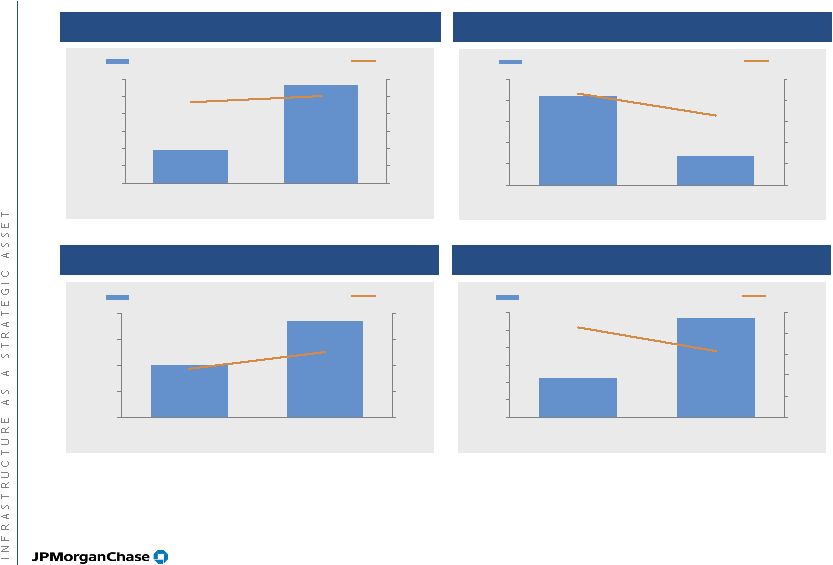
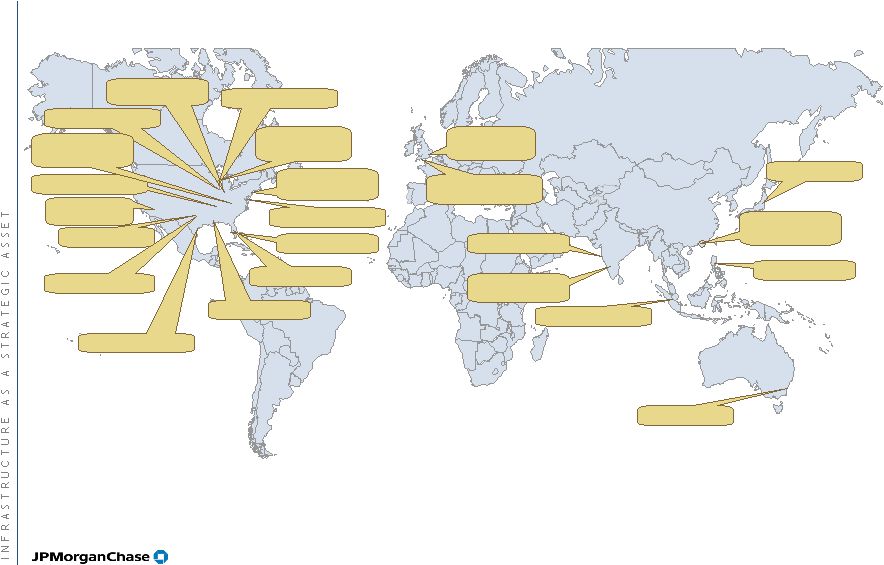
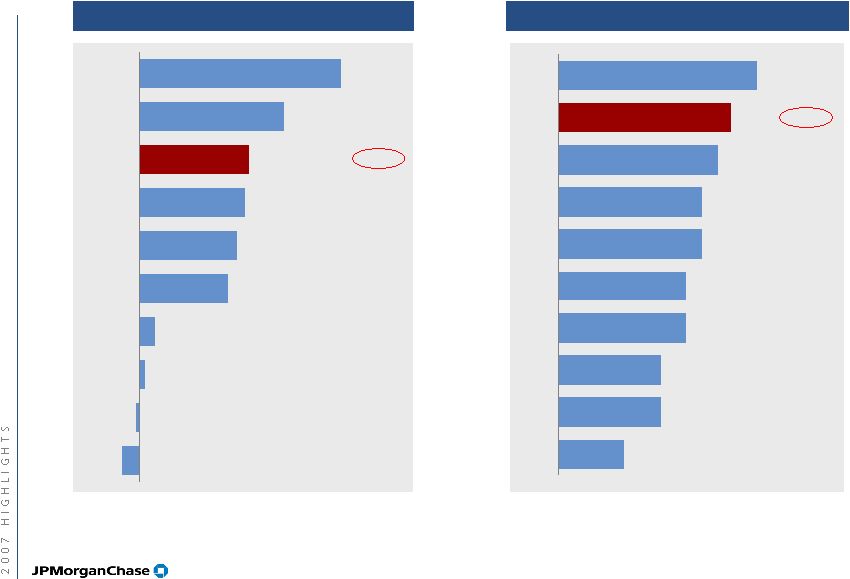
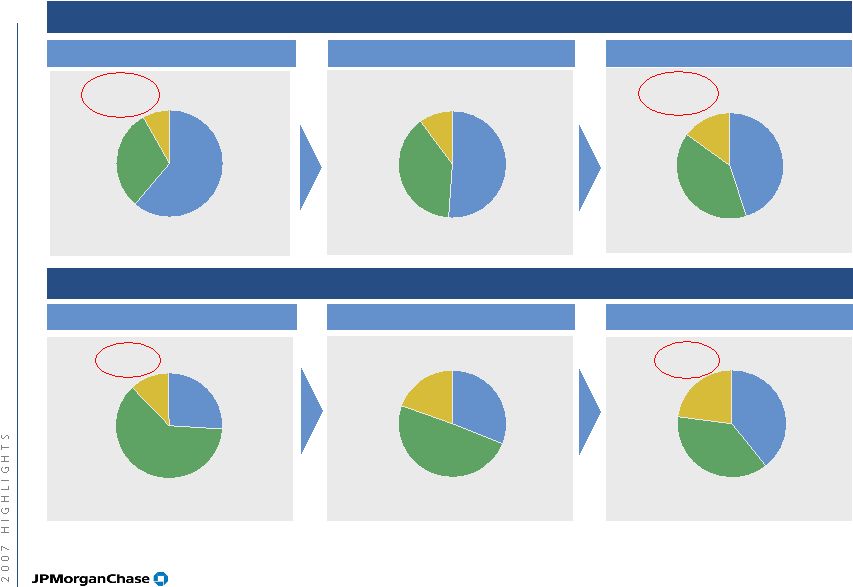
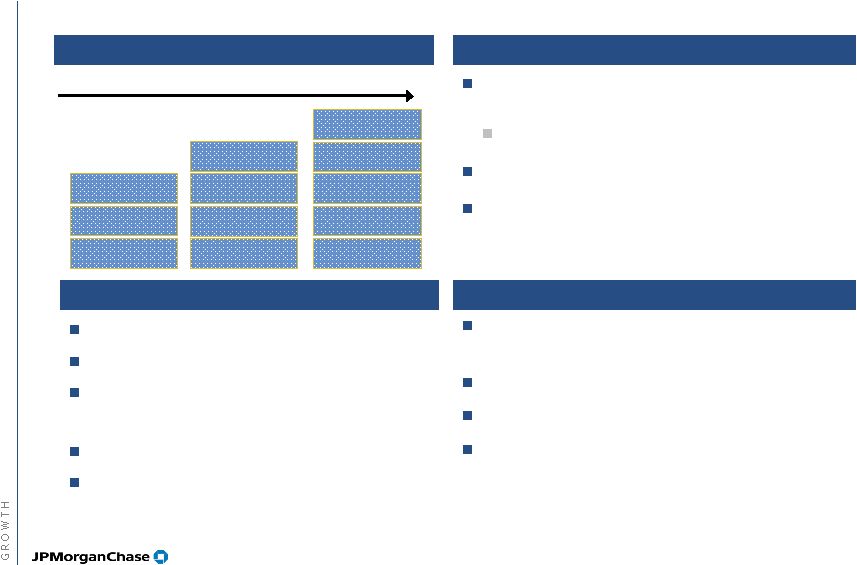
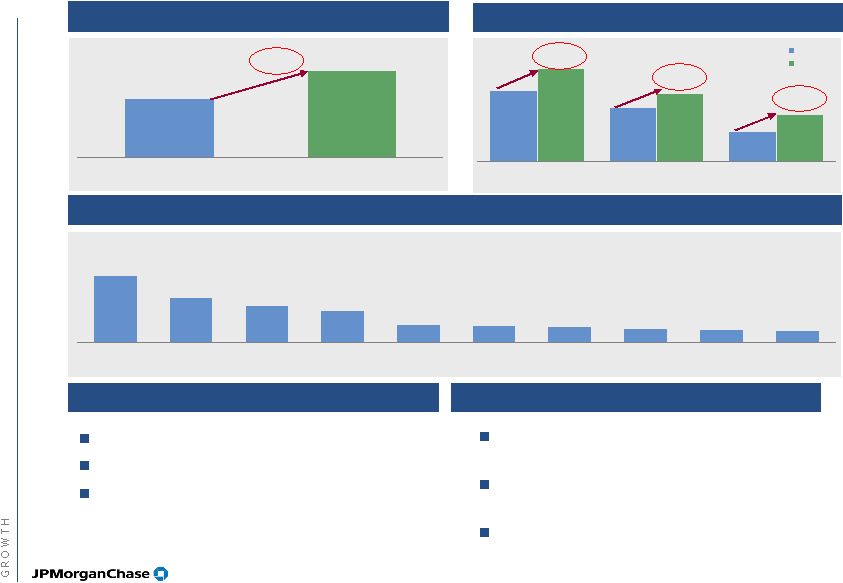
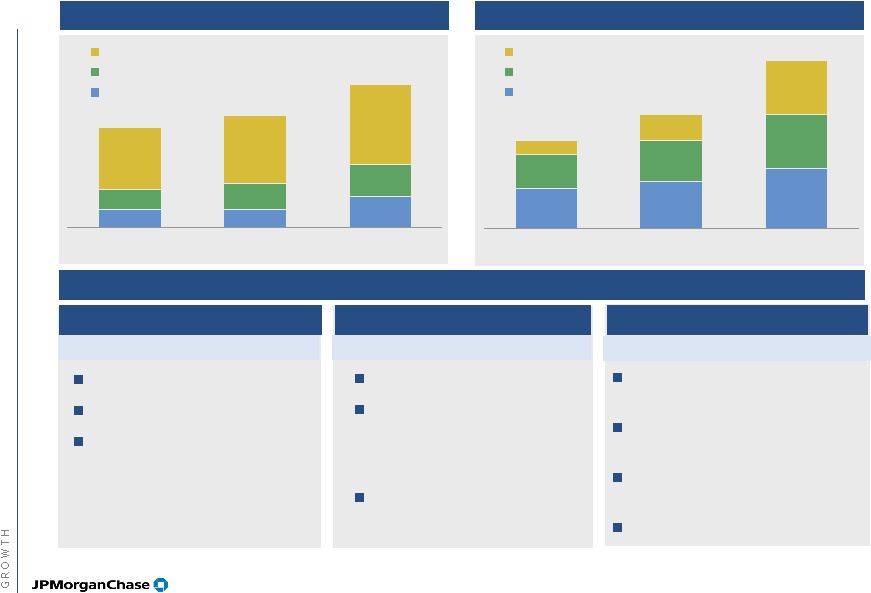
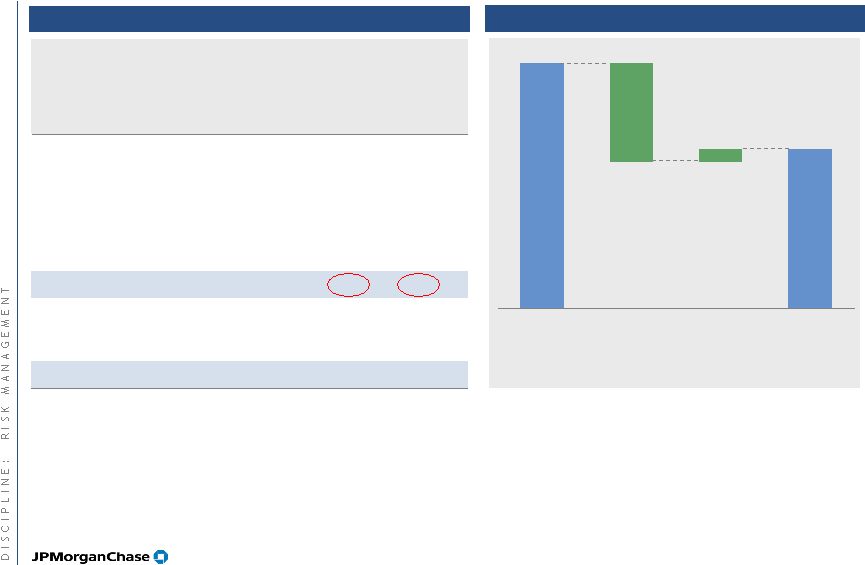
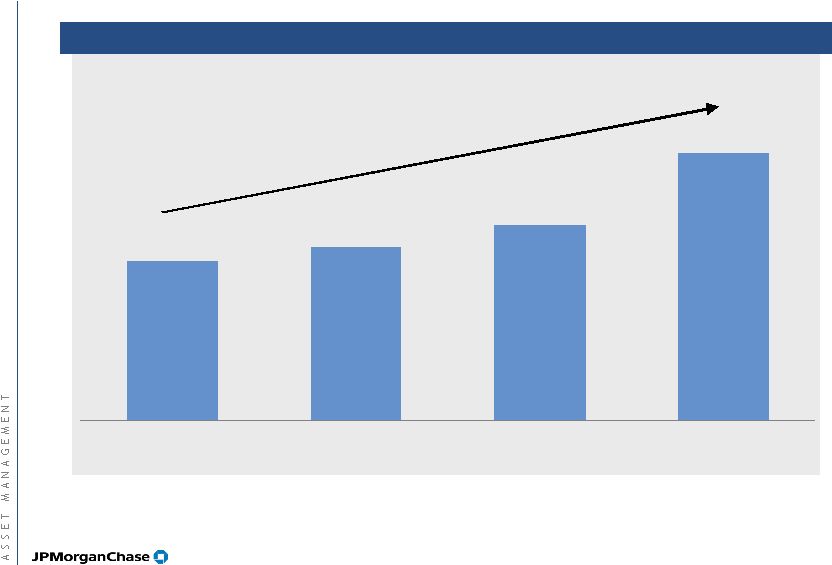
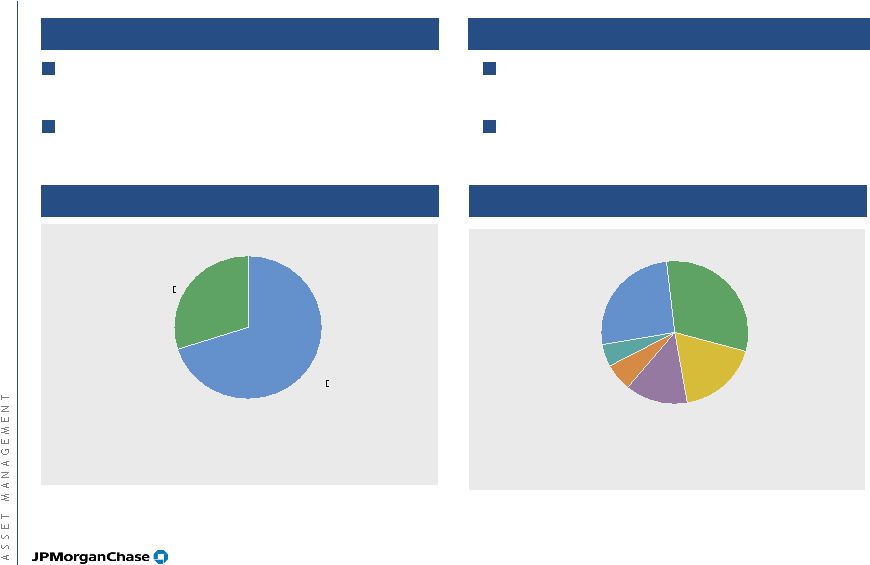
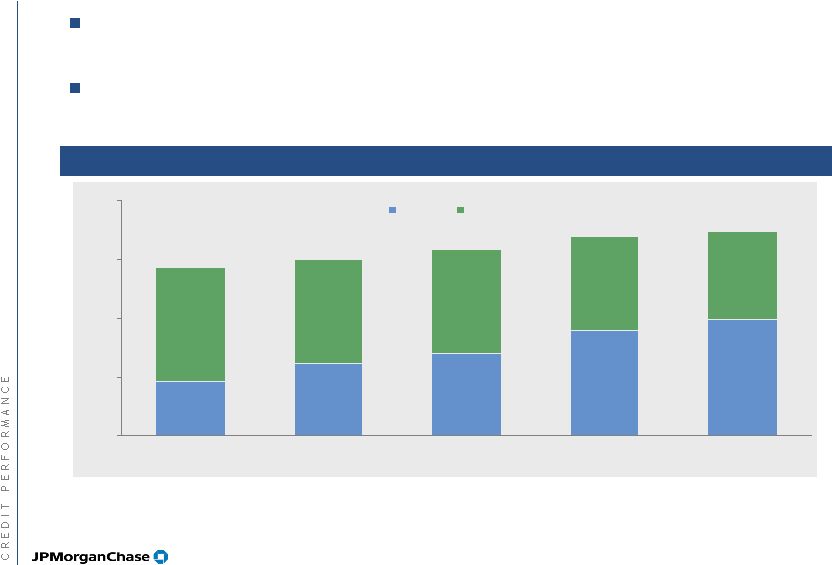
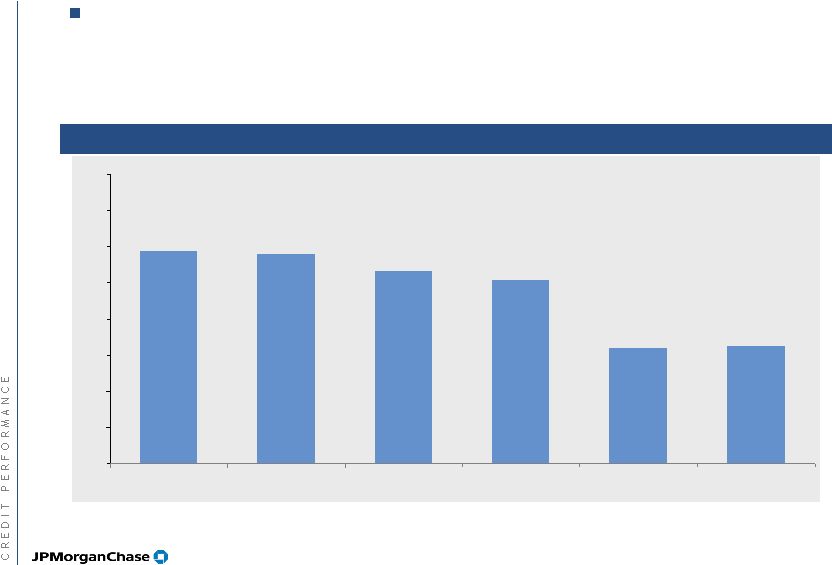
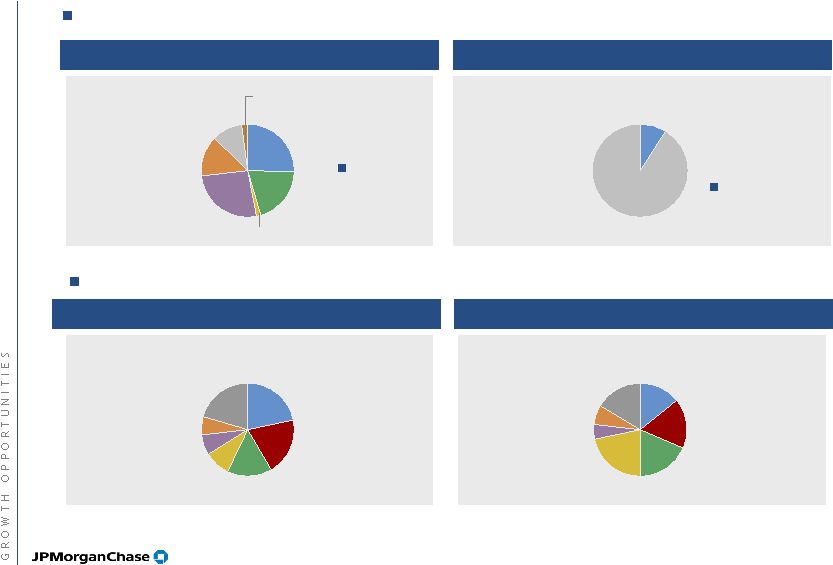
Growth reflects expanded volumes across all products Metric Highlights² Assets Under Custody ($T) USD Clearing Trans Originated (mm) International Clearing Vols (mm) USD ACH Transfers Originated (B) Liability Balances ($B) Sec. Lending Loans Outstanding ($mm) Net Asset Values (mm) ADR Shares Issued / Cancelled (B) GlobeClear Volumes (mm) Americas AUC increased by $3.7T since 2004 Americas AUC increased by $3.7T since 2004 Substantial market share and scale advantage Substantial market share and scale advantage Improved functionality/competitiveness Improved functionality/competitiveness Rollout of Accounts Receivables Conversion product Rollout of Accounts Receivables Conversion product Foreign Deposits growing at 23% Foreign Deposits growing at 23% Increase in lendable assets and utilization Increase in lendable assets and utilization EMEA NAVs growing at 94% EMEA NAVs growing at 94% Surge in cross-border equity investment as investors seek global returns (e.g., Russia, Brazil) Surge in cross-border equity investment as investors seek global returns (e.g., Russia, Brazil) CAGR +20% +20% +11% +11% +55% +55% +16% +22% +22% +20% +20% +55% +55% +22% +22% +77% +77% Entered 38 new markets since 2004. On- exchange clearing grew 145% Entered 38 new markets since 2004. On- exchange clearing grew 145% 9.3 9.3 81 81 46 46 2.5 128 128 221 221 0.6 0.6 1.7 1.7 1.1 1.1 15.9 15.9 111 111 169 169 3.9 229 229 386 386 2.1 2.1 3.1 3.1 6.0 6.0 2004¹ 2007 1 Figures are pro forma for the Bank One merger and Discontinued Operations 2 Growth figures represent a 2004 to 2007 CAGR 1 Figures are pro forma for the Bank One merger and Discontinued Operations 2 Growth figures represent a 2004 to 2007 CAGR 2 |