 M A Y 1 2 , 2 0 0 8 Jamie Dimon Chairman and Chief Executive Officer UBS Global Financial Services Conference Exhibit 99.1 |
 Firm and line of business update Key investor topics Prime mortgage Comments on home lending credit Commercial Banking credit Bear Stearns merger update Capital management 2Q08 Comments on environment 2Q08 outlook Conclusions Agenda |
 F I R M A N D L I N E OF B U S I N E S S U P D A T E |
 1Q08 Managed Results1 1 Managed basis presents revenue and credit costs without the effect of credit card securitizations. Revenue is on a fully taxable-equivalent (FTE) basis. All references to credit costs refer to managed provision for credit losses 2 Includes merger costs of $22mm in 4Q07 and $62mm in 1Q07 3 Actual numbers for all periods, not over/under 4 See note 1 on slide 31 $ in millions 1 1Q08 4Q07 1Q07 4Q07 1Q07 Revenue (FTE)1 $17,898 ($377) ($1,843) (2)% (9)% Credit Costs 1 5,105 1,944 3,504 61% 219% Expense 2 8,931 (1,789) (1,697) (17)% (16)% Reported Net Income $2,373 ($598) ($2,414) (20)% (50)% Reported EPS $0.68 ($0.18) ($0.66) (21)% (49)% ROE 3 8% 10% 17% ROE Net of GW 3 12% 15% 27% ROTCE 3, 4 13% 17% 30% $ O/(U) O/(U) % |
 Investment Bank $ in millions Net loss of $87mm on revenue of $3.0B, down 52% YoY IB fees of $1.2B down 30% YoY, driven primarily by a decline in debt underwriting fees Ranked #1 for total Global Investment Banking Fees³; market share grew from 7.2%³ in 2007 to 7.4%³ in 1Q08 Ranked #1 in Global Debt, Equity and Equity-Related 4 for first time ever Fixed Income Markets revenue of $466mm decreased 82% YoY reflecting: Markdowns of $2.6B: $1.2B on prime, Alt-A and subprime mortgages; $1.1B on leveraged lending commitments; $266mm on CDO warehouse and unsold positions All other trading results include record rates & currencies and strong trading results in credit trading, commodities and emerging markets. Mixed results in all other businesses Gain of $662mm from the widening of the firm’s credit spread on certain structured liabilities Equity Markets revenue of $1.0B down 37% YoY, driven by weak trading results, offset partially by strong client flows and gains of $287mm from the widening of the firm’s credit spread on certain structured liabilities Credit costs of $618mm were driven by increased allowance, including the impact of the transfer of $4.9B of leveraged lending commitments to the retained loan portfolio 1 Actual numbers for all periods, not over/under 2 Average Trading and Credit Portfolio VAR 3 Source: Dealogic 4 Source: Thomson Financial 2 1Q08 4Q07 1Q07 Revenue $3,011 ($161) ($3,243) Investment Banking Fees 1,206 (451) (523) Fixed Income Markets 466 (149) (2,126) Equity Markets 976 398 (563) Credit Portfolio 363 41 (31) Credit Costs 618 418 555 Expense 2,553 (458) (1,278) Net Income ($87) ($211) ($1,627) Key Statistics 1 Overhead Ratio 85% 95% 61% Comp/Revenue 41% 49% 42% Allowance for loan losses to average loans 2.55% 1.93% 1.76% ROE (2)% 2% 30% VAR ($mm) 2 $122 $123 $83 $ O/(U) |
 2007 1Q08 Rank Share Rank Share Global M&A Announced¹ #4 27% #4 27% Global Debt, Equity & Equity-related #2 8% #1 10% US Debt, Equity & Equity-related #2 10% #1 15% Global Equity & Equity-related #2 9% #4 7% US Equity & Equity-related #5 11% #4 9% Global Long-term Debt #3 7% #1 10% Global Investment Grade Debt #3 7% #2 8% Global High Yield Debt #1 12% #1 20% Global Loan Syndications #1 13% #1 11% League table results Major 2007 Awards Best Overall Investment Bank Five bankers named to 2007 Rainmaker List Best Equity Capital Markets – Global Best Debt House- Western Europe Supranational/ Sovereign/ Agency/ Regional Bond House Asia-Pacific Equity-linked House U.S. Leveraged Finance House Source: Thomson Financial 1 Global announced M&A market share and ranking for 2007 includes transactions withdrawn since the end of 12/31/07 1Q08 IB fee and market share performance 2007 Derivatives House of the Year Best Derivatives House over the Past 20 Years Best Credit Derivatives House – Pioneer and Modern Great 3 |
 Leveraged Lending Net additional markdown of $1.1B in 1Q08 on the remaining funded and unfunded commitments of $22.5B with gross markdowns in excess of 11% at 3/31/08 Mortgage-related Prime / Alt-A exposure of $12.8B - markdowns of $1.1B in 1Q08 Prime - securities of $5.6B, mostly AAA-rated and $1.5B of first lien mortgages Alt-A - securities of $3.5B, mostly AAA-rated and $2.2B of first lien mortgages Subprime exposure of $1.9B – markdowns of $152mm in 1Q08 Exposure is hedged by approximately ($1.6B) of hedges and short positions CMBS exposure of $13.5B The majority is comprised of loans and securities of which 50% are AAA-rated Collateralized Debt Obligation (“CDO”) Warehouse and Unsold Positions CDO warehouse and unsold positions of $4.4B - markdowns of $266mm in 1Q08 Mostly corporate credit underlying; no subprime Municipal Finance-related Municipal finance-related positions of $3.1B Investment Bank Risk Topics (as of 3/31/08) Bear Stearns will add to risk positions 4 |
 Retail Financial Services - Drivers Key Statistics¹ ($ in billions) 1 Actual numbers for all periods, not over/under 2 Does not include held-for-sale loans 3 Reflects primarily subprime mortgage loans owned. As of 3/31/08, $34.3B of held-for-investment prime mortgage loans sourced by RFS are reflected in Corporate for reporting and risk management purposes. The economic benefits of these loans flow to RFS Average deposits up 4% YoY Branch production statistics YoY: Checking accounts up 9% Credit card sales up 18% Mortgage originations up 39% Investment sales down 15% Home equity originations down 47% YoY due to tighter underwriting standards and housing market deterioration Mortgage loan originations up 30% YoY 76% of 1Q08 mortgage loan originations are conforming 3rd party mortgage loans serviced up 15% YoY 5 1Q08 4Q07 1Q07 Regional Banking Average Deposits $214.3 $208.5 $206.5 Checking Accts (mm) 11.1 10.8 10.2 # of Branches 3,146 3,152 3,071 # of ATMs 9,237 9,186 8,560 Investment Sales ($mm) $4,084 $4,114 $4,783 Home Equity Originations $6.7 $9.8 $12.7 Avg Home Equity Loans Owned $95.0 $94.0 $86.3 Avg Mortgage Loans Owned 2,3 $15.8 $13.7 $8.9 Mortgage Banking Mortgage Loan Originations $47.1 $40.0 $36.1 3rd Party Mortgage Loans Svc'd $627 $615 $546 Auto Auto Originations $7.2 $5.6 $5.2 Avg Auto Loans and Leases $45.1 $43.5 $42.5 |
 Retail Financial Services $ in millions 1 Actual numbers for all periods, not over/under 2 The net charge-off rate for 1Q08 and 4Q07 excluded $14mm and $2mm, respectively, of charge-offs related to prime mortgage loans held by Treasury in the Corporate sector Net loss of $227mm driven by increased credit costs Revenue of $4.7B grew 15% YoY Credit costs in 1Q08 include a $1.7B addition to allowance (including $1.1B home equity and $417mm subprime mortgage) and higher net charge-offs across all segments Expense growth of 7% YoY reflects higher mortgage production and servicing expense and investments in retail distribution Regional Banking net loss of $433mm reflects a significant increase in the provision for credit losses. Net revenue of $3.4B was up 11% YoY, benefiting from higher loan balances, wider loan spreads, increased deposit-related fees and higher deposit balances Mortgage Banking net income of $132mm was up 57% YoY driven by increased production revenue Auto Finance net income of $74mm declined 13% YoY primarily due to increased credit costs 6 1Q08 4Q07 1Q07 Net Interest Income $3,011 $306 $394 Noninterest Revenue 1,691 (419) 202 Total Revenue 4,702 (113) 596 Credit Costs 2,492 1,441 2,200 Expense 2,570 30 163 Net Income ($227) ($979) ($1,086) Regional Banking ($433) ($804) ($1,123) Consumer and Business Banking 545 (17) 37 Loan Portfolio/Other (978) (787) (1,160) Mortgage Banking 132 (200) 48 Auto Finance $74 $25 ($11) Key Statistics 1 Overhead (excl. CDI) 53% 50% 56% Net Charge-off Rate 2 1.71% 1.17% 0.46% Allowance for Loan Losses to EOP Loans 2.28% 1.46% 0.89% ROE (5)% 19% 22% $ O/(U) |
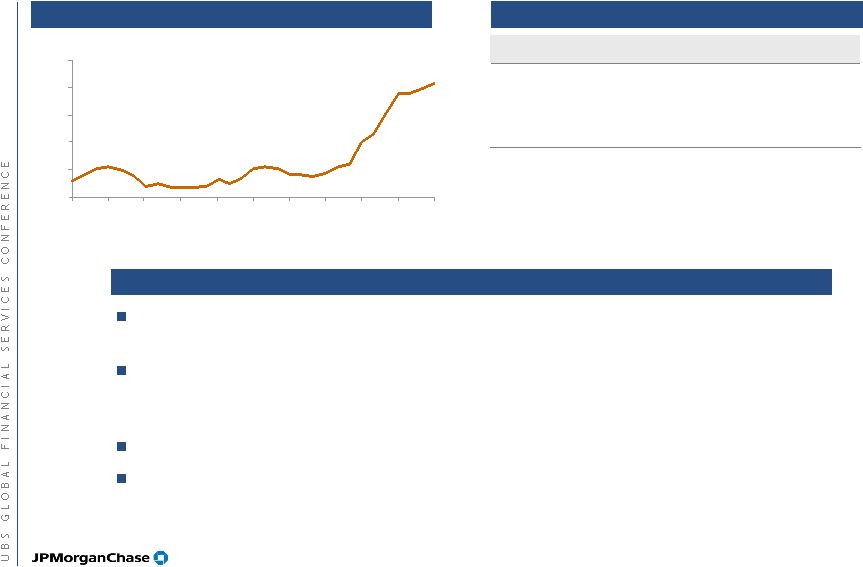 Key statistics JPM 30-day delinquency trend Comments on home equity Home Equity 1Q08 4Q07 1Q07 EOP owned portfolio ($B) $95.0 $94.8 $87.7 Net charge-offs ($mm) $447 $248 $68 Net charge-off rate 1.89% 1.05% 0.32% 1.00% 1.25% 1.50% 1.75% 2.00% 2.25% Sep- 05 Dec- 05 Mar- 06 Jun- 06 Sep- 06 Dec- 06 Mar- 07 Jun- 07 Sep- 07 Dec- 07 Mar- 08 1Q08 addition to allowance for loan losses of $1.1B is sufficient to cover annual net charge- offs of approximately $2.6B Significant underwriting changes made over the past year include elimination of stated income loans and state/MSA based reductions in maximum CLTVs based on expected housing price trends. Maximum CLTVs now range from 60% to 85% 2008 originations are expected to be down significantly from 2006-2007 levels High CLTVs continue to perform poorly, exacerbated by housing price declines in key geographies Note: CLTV = Combined-Loan-to-Value. This metric represents how much equity the borrower has in the property 7 |
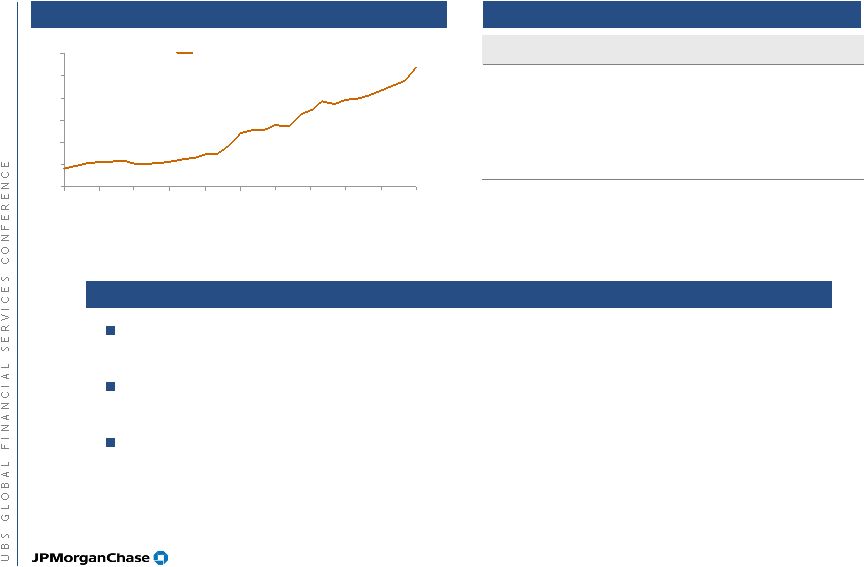 Subprime Mortgage Key statistics JPM 30-day delinquency trend Comments on subprime mortgage portfolio 1 Excludes mortgage loans held in the Community Development loan portfolio 1Q08 4Q07 1Q07 EOP owned portfolio ($B) 1 $15.8 $15.5 $9.0 EOP held-for-sale ($B) - - $3.7 Net charge-offs ($mm) $149 $71 $20 Net charge-off rate 3.82% 2.08% 0.92% 0% 3% 6% 9% 12% 15% 18% Sep- 05 Dec- 05 Mar- 06 Jun- 06 Sep- 06 Dec- 06 Mar- 07 Jun- 07 Sep- 07 Dec- 07 Mar- 08 Subprime 1Q08 addition to allowance for loan losses of $417mm is sufficient to cover annual net charge-offs of approximately $700mm Portfolio experiencing credit deterioration as a result of risk layering and housing price declines Additional underwriting changes have effectively eliminated new production in the current environment 8 |
 Card Services (Managed) ¹ Actual numbers for all periods, not over/under Net income of $609mm down by $156mm, or 20% YoY; decline in results driven by increase in credit costs Credit costs up by $441mm, or 36% YoY due to a higher level of charge-offs and an $85mm prior-year reduction of the allowance for loan losses Average outstandings of $153.6B up 3% YoY and 1% QoQ Charge volume growth of 5% YoY reflects a 10% increase in sales volume, offset partially by a lower level of balance transfers, the result of more targeted marketing efforts Revenue of $3.9B up by $224mm or 6% YoY Managed margin increased to 8.34% from 8.11% YoY and 8.20% in the prior quarter Expense of $1.3B up by $31mm, or 2% YoY, primarily due to higher marketing expense $ in millions 9 1Q08 4Q07 1Q07 Revenue $3,904 ($67) $224 Credit Costs 1,670 (118) 441 Expense 1,272 49 31 Net Income $609 - ($156) Key Statistics ($B) 1 Avg Outstandings $153.6 $151.7 $149.4 EOP Outstandings $150.9 $157.1 $146.6 Charge Volume $85.4 $95.5 $81.3 Net Accts Opened (mm) 3.4 5.3 3.4 Managed Margin 8.34% 8.20% 8.11% Net Charge-Off Rate 4.37% 3.89% 3.57% 30-Day Delinquency Rate 3.66% 3.48% 3.07% ROO (pretax) 2.52% 2.51% 3.28% ROE 17% 17% 22% $ O/(U) |
 Commercial Banking ¹ Actual numbers for all periods, not over/under 2 Includes deposits and deposits swept to on-balance sheet liabilities Net income of $292mm down 4% YoY driven by an increase in the provision for credit losses, largely offset by higher net revenue Average loans up 18% and liability balances up 22% YoY Revenue of $1.1B up 6% YoY primarily due to higher treasury services and lending revenue, partially offset by lower IB revenue Credit costs reflect higher net charge- offs, primarily related to residential real estate, the effect of the weakening credit environment and growth in loan balances Expense relatively flat YoY, with overhead ratio of 45% $ in millions 10 1Q08 4Q07 1Q07 Revenue $1,067 ($17) $64 Middle Market Banking 706 11 45 Mid-Corporate Banking 207 (32) (5) Real Estate Banking 97 (5) (5) Other 57 9 29 Credit Costs 101 (4) 84 Expense 485 (19) - Net Income $292 $4 ($12) Key Statistics ($B) 1 Avg Loans & Leases $68.0 $65.5 $57.7 Avg Liability Balances 2 $99.5 $96.7 $81.8 Overhead Ratio 45% 46% 48% Net Charge-Off Rate 0.48% 0.21% (0.01)% Allowance for loan losses to average loans 2.65% 2.66% 2.68% ROE 17% 17% 20% $ O/(U) |
 Treasury & Securities Services 1 Actual numbers for all periods, not over/under 2 Includes deposits and deposits swept to on-balance sheet liabilities Net income of $403mm up 53% YoY Pretax margin of 34% Liability balances up 21% YoY Assets under custody up 7% YoY Revenue up 25% YoY driven by: Double-digit revenue growth in both TS and WSS Higher client volumes across businesses WSS benefited from wider spreads in securities lending and foreign exchange driven by recent market conditions Expense up 14% YoY driven by: Higher expense related to business and volume growth Investment in new product platforms $ in millions 11 1Q08 4Q07 1Q07 Revenue $1,913 ($17) $387 Treasury Services 813 (11) 124 Worldwide Securities Svcs 1,100 (6) 263 Expense 1,228 6 153 Net Income $403 ($19) $140 Key Statistics 1 Avg Liability Balances ($B) 2 $254.4 $250.6 $210.6 Assets under Custody ($T) $15.7 $15.9 $14.7 Pretax Margin 34% 35% 27% ROE 46% 56% 36% TSS Firmwide Revenue $2,598 $2,636 $2,142 TS Firmwide Revenue $1,498 $1,530 $1,305 TSS Firmwide Avg Liab Bal ($B)2 $353.8 $347.4 $292.4 $ O/(U) |
    Asset Management 1 Actual numbers for all periods, not over/under 2 Reflects the transfer in 2007 of held-for-investment prime mortgage loans from AM to Treasury within the Corporate segment Net income of $356mm down 16% YoY and 32% QoQ Pretax margin of 30% Revenue of $1.9B flat YoY as the benefit from higher AUM and deposit and loan growth was offset by lower performance fees and lower market valuations for seed capital investments Revenue decline of 20% QoQ driven by seasonality in the recognition of performance fees and a decline in AUM due to lower market levels Assets under management of $1.2T, up 13% YoY and flat QoQ Net AUM inflows of $47B for 1Q08 and $143B for the past twelve months 1Q08 AUM balances affected by markets Continued mixed global investment performance 75% of mutual fund AUM ranked in first or second quartiles over past five years; 73% over past three years; 52% over one year Expense up 7% YoY, driven by higher compensation related to increased headcount $ in millions 1Q08 4Q07 1Q07 Revenue $1,901 ($488) ($3) Private Bank 655 (58) 95 Institutional 490 (264) (61) Retail 466 (174) (61) Private Client Services 290 8 24 Credit Costs 16 17 25 Expense 1,323 (236) 88 Net Income $356 ($171) ($69) Key Statistics ($B)¹ Assets under Management $1,187 $1,193 $1,053 Assets under Supervision $1,569 $1,572 $1,395 Average Loans² $36.6 $32.6 $25.6 Average Deposits $68.2 $64.6 $54.8 Pretax Margin 30% 35% 36% ROE 29% 52% 46% $ O/(U) 12 |
  Corporate/Private Equity $ in millions Private Equity Private Equity gains of $189mm in 1Q08 EOP Private Equity portfolio of $6.6B Represents 8.3% of common equity less goodwill Corporate Net income of $15mm excluding sale proceeds on Visa Sale proceeds of $955mm (after-tax) on the sale of Visa shares in initial public offering 1 Includes after-tax merger costs of $14mm in 4Q07 and $38mm in 1Q07 1Q08 4Q07 1Q07 Private Equity $57 ($299) ($641) Corporate ex. Visa 15 108 44 Visa 955 955 955 Net Income¹ $1,027 $778 $396 $ O/(U) 13 |
 8.3% 8.4% 8.4% 8.4% 8.5% 6.8% 6.7% 6.6% 6.5% 6.6% 1Q08 4Q07 3Q07 2Q07 1Q07 Tier 1 Capital Ratio TCE/Managed RWA 1 See note 1 on slide 31 Capital management / fortress balance sheet Strong capital positions with Tier I capital ratio of 8.3% at 3/31/08 Recent preferred stock issuance of $6B Provides flexibility to be opportunistic in current environment Strong liquidity and funding position Reserve coverage ratios remain strong 1Q08 4Q07 1Q07 Consumer ex. Card Services 2.00% 1.23% 0.79% Card Services 4.49% 4.04% 3.96% Investment Bank 2.55% 1.93% 1.76% Commercial Banking 2.65% 2.66% 2.68% 1 Current position Capital Ratios Allowance for loans losses to loans 1 14 |
 Revenue growth drivers Key metrics 1 Includes deposits and deposits swept to on-balance sheet liabilities 2 Reflects the transfer in 2007 of held-for-investment prime mortgage loans from AM to Treasury within the Corporate segment Good underlying momentum in core business drivers propelling organic growth across businesses % Change YoY 1Q08 4Q07 3Q07 2Q07 1Q07 Retail Financial Services Regional Banking Average Deposits 4% 4% 10% 10% 12% Mortgage Loan Originations 30% 34% 35% 41% 24% Credit Cards Originated in Branches 18% 34% 59% (7)% 17% Commercial Banking Liability Balances¹ 22% 22% 22% 16% 16% Loans & Leases 18% 14% 15% 14% 13% Treasury and Securities Services Liability Balances¹ 21% 30% 23% 12% 18% Assets under Custody 7% 15% 21% 32% 31% Asset Management Assets under Management 13% 18% 24% 23% 21% Loans² 43% 13% 16% 11% 5% Deposits 24% 26% 17% 9% 14% Investing for the Future # of ATMs 8% 8% 14% 12% 16% # of Branches 2% 2% 16% 16% 16% # of Branch Bankers & Sales Specialists 21% 23% 23% 22% 12% 15 |
 K E Y I N V E S T O R T O P I C S 16 |
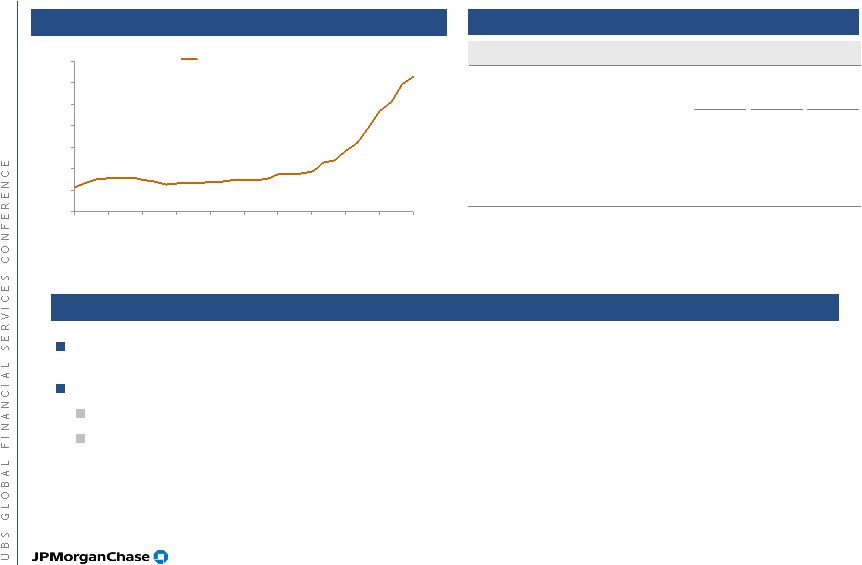 Prime Mortgage Comments on prime mortgage portfolio JPM 30-day delinquency trend 0.00% 0.50% 1.00% 1.50% 2.00% 2.50% 3.00% 3.50% Sep- 05 Dec- 05 Mar- 06 Jun- 06 Sep- 06 Dec- 06 Mar- 07 Jun- 07 Sep- 07 Dec- 07 Mar- 08 Prime 1Q08 4Q07 1Q07 EOP balances in Corporate ($B) $41.1 $36.9 $26.5 EOP balances in RFS¹ ($B) 4.0 3.6 7.4 Total $45.1 $40.5 $33.9 Net charge-offs 2 ($mm) $50 $17 $3 Net charge-off rate 0.48% 0.18% 0.04% 1Q08 addition to allowance for loan losses of $256mm Prime mortgage includes³: $32.1B of jumbo mortgages $2.6B of Alt-A mortgages Key statistics Note: CLTV = Combined-Loan-to-Value. This metric represents how much equity the borrower has in the property 1 Includes Construction Loans and Loans eligible for repurchase as well as loans repurchased from GNMA pools that are insured by US government agencies 2 Net charge-offs include $14mm in RFS and $36mm in Corporate 3 $0.3B jumbo mortgages and $1.2B Alt-A mortgages are in warehouse 17 |
 Prime Mortgage – 1Q08 Performance Profile of loans charged off in 1Q08 High CLTVs at origination (e.g., 80/20 stackers) Limited income documentation California and Florida 2006 and 2007 origination years Changes in credit policy Performance of ongoing vs. discontinued loans in 1Q08 Eliminated Alt-A Implemented declining markets policy, limiting CLTVs Eliminated stated income/assets in wholesale and correspondent channels Note: Discontinued Businesses = High CLTV and Stated Income Note: CLTV = Combined-Loan-to-Value. This metric represents how much equity the borrower has in the property 0% 20% 40% 60% 80% 100% Ongoing business Discontinued business % of outstanding % of 30+ day delinquencies % of net charge-offs 18 |
 Comments on Home Lending Credit Home equity losses could double to $900mm by end of year Expect increase in subprime mortgage losses to approximately $200mm- $250mm in 2Q08 Expect increase in prime mortgage losses to approximately $100mm in 2Q08 Across all home lending portfolios, credit could deteriorate further in future depending on home prices, unemployment and the economy Possible additions to reserves 19 |
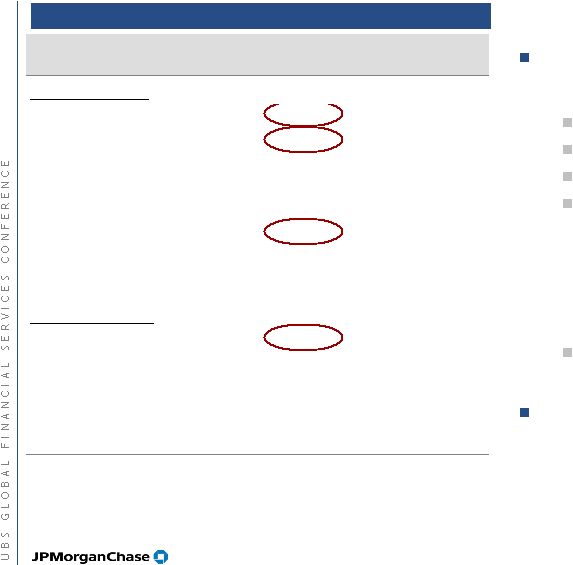
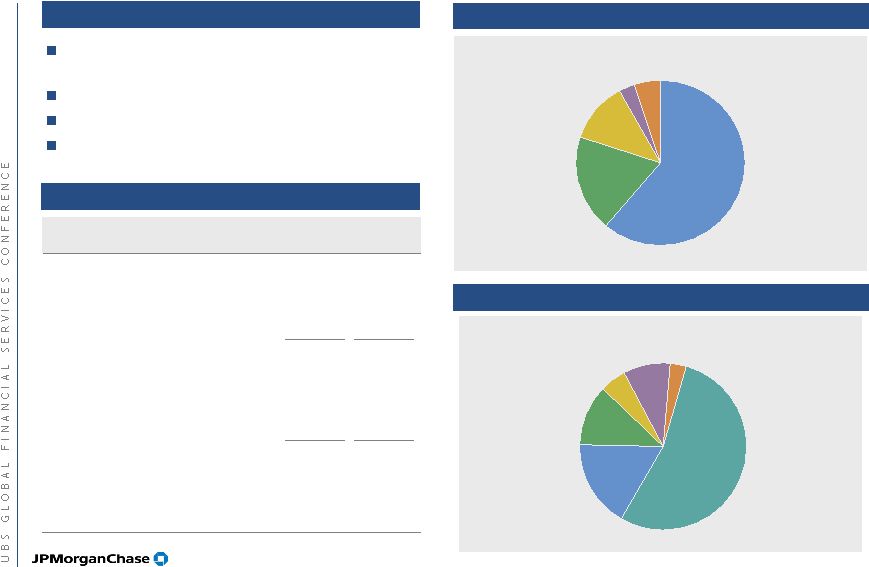 California 17% Other 54% Arizona 9% Colorado 3% Illinois 5% Texas 12% Homebuilders 19% Other 12% Condos 5% Land 3% Income producing 61% CB real estate exposure as of 3/31/08 ($B) Real Estate Banking by industry as of 3/31/08 Total outstanding: $7.5B Investment Real Estate: O/S RCE Real Estate Banking $7.5 $11.8 Middle Market & Mid-Corporate Community Development $3.2 $1.1 $4.5 $2.4 Total Investment $11.8 $18.8 % of total CB 17% 13% Owner-Occupied 4.5 6.3 Total Investment & Owner- Occupied $16.3 $25.4 % of total CB 24% 17% Commercial Banking - Diversified Real Estate Exposure Real Estate Banking by geography as of 3/31/08 Total outstanding: $7.5B Total CB loan portfolio characteristics Granular portfolio with 24% in loans below $3mm; 5% in loans over $100mm Average maturity of less than 3 years Responsible balance sheet growth Limited real estate exposure 20 |
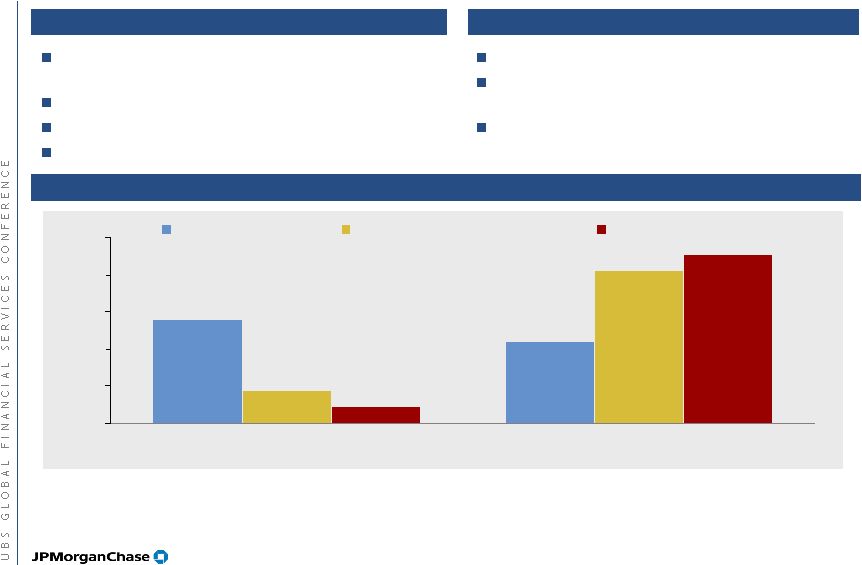
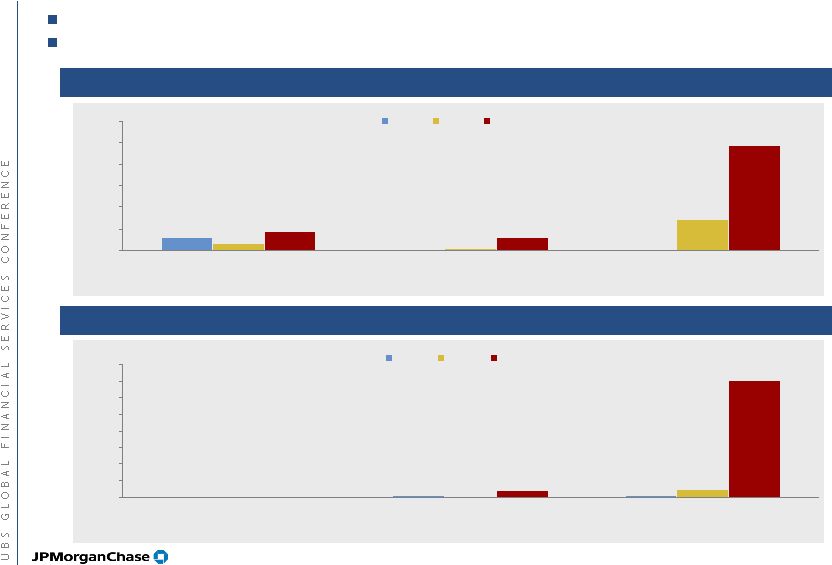 NPL Ratio by business NCO Ratio by business 0.00% 0.04% 0.06% 0.00% 0.01% 0.23% 0.00% 0.22% 3.51% 0.00% 0.50% 1.00% 1.50% 2.00% 2.50% 3.00% 3.50% 4.00% Middle Market Mid-Corporate Real Estate Banking 2006 2007 1Q08 0.29% 0.01% 0.03% 0.17% 0.05% 0.44% 0.28% 2.44% 0.72% 0.00% 0.50% 1.00% 1.50% 2.00% 2.50% 3.00% Middle Market Mid-Corporate Real Estate Banking 2006 2007 1Q08 1 Real Estate reflects credit ratios in Real Estate Banking only 1 1 Commercial Banking Credit Quality Majority of NPLs and NCOs have come from real estate, as expected Credit quality still outperforming peers but expected to continue trending towards normalized levels 21 |
 Bear Stearns Merger Integration Firmwide Merger Integration Office of Senior Executives meets weekly 95%+ systems selection completed Plans are in place to bridge the general ledger, HR, payroll and back office processing and convert the back office Acquiring 4.1mm sq ft of real estate of which 1mm sq ft will be eliminated; acquiring 5 trading floors and building 2 more Co-location of Equities, Research, IB and back office to occur in 2008 Broker dealer consolidation to occur by end of 2008 Infrastructure Leadership teams have been announced to approximately 3 levels down within the organization All 14,000+ BSC employees have a manager within the new organization who is responsible for ensuring appropriate decisioning is being made Businesses are 75% complete in making people selection decisions; communication is ongoing and expected to be complete to all staff by merger close Have identified positions for approximately 40% of BSC staff Have identified more than 1,500 redeployment job opportunities through the Talent Network process People 22 |
 Bear Stearns Balance Sheet – Estimated Projections Risk Weighted Assets (RWA) - $ in billions 3/17/08 Estimate 6/30/08 Target run-rate Trading $155 $100 $30 Credit 63 60 20 Mortgages 73 20 5 Repo 8 10 0 Other Trading 11 10 5 Prime Services 41 30 50 Other Assets 30 20 15 Total RWA 225 150 95 Total GAAP Assets $410 $225 $250 New risk limits and risk measures for BSC activity have been set for all businesses to match the appetite of the combined firm Daily risk reporting is in place Balance sheet and RWA reduction plans and targets are in place and being actioned Riskiness of BSC balance sheet substantially reduced since announcement. BSC VAR down roughly 50% RWA calculated under Basel I rules as applied by JPM Whether all BSC positions remain in IB (vs. Corporate) is TBD 23 |
 Bear Stearns Future Earnings Potential (exit ‘09) Business Estimated Earnings Equities + Prime Services $600-$750 Energy 50-80 Other Markets 100-200 Corporate Finance 50-100 Total Investment Bank $800-$1,130 Asset Management $0 +/- $ in millions 24 |
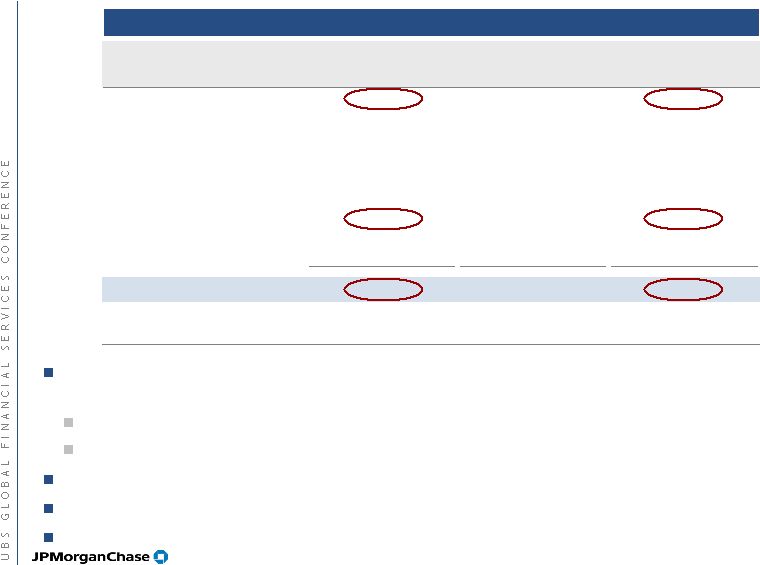
 Bear Stearns Impact on 2Q08 – Extremely Rough Estimates/Illustrative Above the line earnings impact in 2Q08 JPM pro rata share of BSC losses through close and month of June ’08 ($200mm realized to date) - ESTIMATED1 ($400) Merger costs – ESTIMATED (100) Total ($500) Extraordinary gain BSC capital at 2/29/08 $11,500 De-leveraging/de-risking, purchase accounting, restructuring, litigation, BSC 2Q08 operating losses, etc. – ESTIMATED (9,000) Purchase price (1,500) Total $1,000 Equity increase Above the line losses – ESTIMATED ($500) Extraordinary gain – ESTIMATED 1,000 Equity issued 1,500 Total $2,000 $ in millions 1 JPM pro rata share is based on 49.5% ownership of BSC as of April 8, 2008 Prior estimate was $5B +/- +/- several hundred million +/- $1 billion 25 |
 Bear Stearns Impact Post 2Q08 – Rough Estimates Approximately $900mm after-tax merger expense through the end of 2009 IB - approximately $300mm after-tax merger expense Spread evenly through the end of 2009 Primarily related to systems conversion Asset Management Net losses expected through 2009 Includes approximately $300mm in merger-related expense Corporate – approximately $300mm after-tax merger expense Majority recognized in 2009 Primarily related to real estate 26 |
 Capital Management 2Q08 – Rough Projections 2Q08 projections: Tier 1 capital ratio projected to be high 8% range +/- Leverage ratio projected to be 6.25% +/- Expect to maintain Tier 1 capital ratio of 8.00% to 8.50% without regulatory relief Committed to maintaining a fortress balance sheet 27 |
 Comments on Environment Possibly 75% done Hopefully over by year-end Why? Problems resolving: — Mortgage companies, CDOs, SIVs — Losses taken — Capital raised — Significantly de-leveraging, banks, hedge funds, SIVs, etc. Most problems known, but still being recognized No asset generation — CMBS, CDO/CLO, Alt-A — Subprime — Leveraged finance Plenty of liquidity Capital Markets Crisis Just starting Could be deep Could be worse than capital markets crisis Cannot predict outcome Factors Deep, substantial financial pressure More de-leveraging — Investment Banks — Regulatory changes Oil, housing, consumer, etc. Round 2 financial effects Commercial banks’ losses growing — Recognized slower — Need to build loan loss reserves — Need for capital Investment portfolio losses More financial tightening, de-leveraging Recession 28 |
 2Q08 Outlook Investment Bank Lower IB fees and trading revenue Higher comp/revenue ratio anticipated in 2Q08 Credit provisioning likely Bear Stearns will add to risk positions Retail Financial Services Solid underlying growth See home lending credit outlook on page 19 Possible additions to reserves Expect losses of approximately 5.00% in 2Q08; approximately 5.00% + in 2H08; possibly averaging 6% in 2009, likely additions to reserves Sales growth rate continuing to show slowing trend in 2Q08 Revenue growth lower than expected resulting from higher payment rates, lower fees, lower balance growth and fewer customers going 30 days past due Card Services TSS Good underlying growth, which includes benefit of recent market conditions Corporate/Private Equity Private Equity Minimal realized gains QTD Corporate Expect core results to be net loss of greater than $100mm Expect write-downs on auction rate securities of up to several hundred million AM 1Q08 revenue is a good run rate for 2Q08 Bear Stearns BSAM and PCS will be a drag on earnings CB Good underlying growth Strong reserves but credit expected to continue trending toward normalized levels 29 |
 Conclusions Extremely cautious on 2008 environment and impact on business Deterioration in economic environment will likely lead to increase in loan loss reserves However, we see evidence of continued organic growth and benefits of investments across businesses Fortress balance sheet positions us well for uncertain market Bear Stearns merger integration proceeding well, but is challenging in current market environment. Remains an excellent opportunity for shareholder value in long run We are focused on managing well through this downturn and seizing opportunities to position the company well for the future 30 |
 This presentation includes non-GAAP financial measures. 1. TCE as used on slide 1 for purposes of a return on tangible common equity is defined as common stockholders’ equity less identifiable intangible assets (other than MSRs) and goodwill. TCE as used in slide 14 in the TCE/Managed RWA ratio, which is used for purposes of a capital strength calculation, is defined as common stockholders’ equity plus a portion of junior subordinated notes (which have certain equity-like characteristics due to their subordinated and long-term nature) less identifiable intangible assets (other than MSRs) and goodwill. The latter definition of TCE is used by the firm and some analysts and creditors of the firm when analyzing the firm’s capital strength. The TCE measures used in this presentation are not necessarily comparable to similarly titled measures provided by other firms due to differences in calculation methodologies. 2. Financial results are presented on a managed basis, as such basis is described in the firm’s Annual Report on Form 10-K for the year ended December 31, 2007. 3. All non-GAAP financial measures included in this presentation are provided to assist readers in understanding certain trend information. Additional information concerning such non-GAAP financial measures can be found in the above-referenced filings, to which reference is hereby made. Forward-looking statements and notes on non-GAAP financial measures Forward looking statements This presentation contains forward-looking statements within the meaning of the Private Securities Litigation Reform Act of 1995. Such statements are based upon the current beliefs and expectations of JPMorgan Chase’s management and are subject to significant risks and uncertainties. Actual results may differ from those set forth in the forward-looking statements. Factors that could cause JPMorgan Chase’s results to differ materially from those described in the forward-looking statements can be found in the firm’s Annual Report on Form 10-K for the year ended December 31, 2007, its March 24, 2008 Current Report on Form 8-K, and its Quarter Report on Form 10-Q for the quarter ended March 31, 2008, each filed with the United States Securities and Exchange Commission (SEC) and available at the SEC’s Internet site (http://www.sec.gov). Additional Information In connection with the proposed merger with The Bear Stearns Companies Inc (Bear Stearns), JPMorgan Chase has filed with the SEC a Registration Statement on Form S-4 that includes a preliminary proxy statement of Bear Stearns that also constitutes a prospectus of JPMorgan Chase. Bear Stearns will mail the definitive proxy statement/prospectus, when it becomes available, to its stockholders. JPMorgan Chase and Bear Stearns urge investors and security holders to read the definitive proxy statement/prospectus, when it becomes available, because it will contain important information. You may obtain copies of all documents filed with the SEC regarding this transaction, free of charge, at the SEC's website (www.sec.gov). You may also obtain these documents, free of charge, from JPMorgan Chase’s website (www.jpmorganchase.com) under the tab "Investor Relations," then under the heading "Financial Information," then under the item "SEC Filings," and then under the item “Display all of the above SEC filings.” You may also obtain these documents, free of charge, from Bear Stearns's website (www.bearstearns.com) under the heading "Investor Relations" and then under the tab "SEC Filings." JPMorgan Chase, Bear Stearns and their respective directors, executive officers and certain other members of management and employees may solicit proxies from Bear Stearns stockholders in favor of the merger. Information regarding the persons who may, under the rules of the SEC, be deemed participants in the solicitation of the Bear Stearns stockholders in connection with the proposed merger will be set forth in the definitive proxy statement/prospectus filed with the SEC. You can find information about JPMorgan Chase’s executive officers and directors in its proxy statement filed with the SEC on March 31, 2008. You can find information about Bear Stearns’s executive officers and directors in the amendment to its Annual Report on Form 10-K filed with the SEC on March 31, 2008. You can obtain free copies of these documents from JPMorgan Chase and Bear Stearns using the contact information above. 31 |