 S E P T E M B E R 2 5 , 2 0 0 8 I N V E S T O R P R E S E N T A T I O N Acquisition of assets, deposits and certain liabilities of Washington Mutual’s banks by JPMorgan Chase JPMorgan Chase & Co. has filed a registration statement (including a prospectus) with the SEC for the offering to which this communication relates. Before you invest, you should read the prospectus in that registration statement and other documents JPMorgan Chase & Co. has filed with the SEC for more complete information about JPMorgan Chase & Co. and this offering. You may get these documents for free by visiting EDGAR on the SEC web site at www.sec.gov. Alternatively, JPMorgan Chase & Co. or J.P. Morgan Securities Inc. will arrange to send to you the prospectus if you request it by calling toll-free 1-866-430-0686. Exhibit 99.2 |
 Key terms of acquisition of Washington Mutual’s banks from FDIC acting as receiver Transaction JPMorgan Chase to acquire: Substantially all of the assets of Washington Mutual’s banks All of the deposits and certain liabilities of Washington Mutual’s banks Transaction does not include: Assets and liabilities of Washington Mutual Inc. (Holding Company) Unsecured senior debt, subordinated debt and preferred of Washington Mutual’s banks Consideration $1.9bn cash payable to FDIC Expected capital raise $8.0 billion of common equity Divestitures None Approvals All key approvals received Credit rating Expect ratings to be affirmed 1 |
 Strategic Fit Greatly enhances retail banking platform in attractive markets Combined deposits of $911 billion and 5,410 branches at close Expanding into attractive new markets (CA + FL) Increases market share in existing largest fast-growing markets (NY, TX, IL, AZ, CO, UT) Financially Compelling Accretive immediately; should be substantially so in future Asset write-downs reduce risk to volatility in future earnings Allows significant margin for error Opportunity to grow revenue and realize significant cost savings Ability to bring expanded Chase products and services to WaMu branches Drive efficiencies in branch network and back office JPMorgan Chase maintains strong capital and liquidity positions Retail deposits add to stable funding base Ability to execute Proven capabilities with success in Bank One/Chase and Bank of New York transactions Little overlap with Bear Stearns integration WaMu provides unique opportunity to expand retail banking franchise and generate attractive returns for JPMorgan Chase shareholders 2 |
 Leader in retail banking and deposit gathering Branches Deposits ($bn) Source: SNL Financial Note: Branch data as of September 18, 2008; deposit data as of June 30, 2008 Rank Institution Branches (#) 1 Bank of America 6,138 (2) Pro forma JPMorgan Chase 5,410 2 Wells Fargo 3,430 3 Wachovia 3,348 4 JPMorgan Chase 3,203 5 U.S. Bancorp 2,649 Rank Institution Deposits ($bn) (1) Pro forma JPMorgan Chase $911 1 Citi 804 2 Bank of America 785 3 JPMorgan Chase 723 4 Wachovia 448 5 Wells Fargo 339 3 |
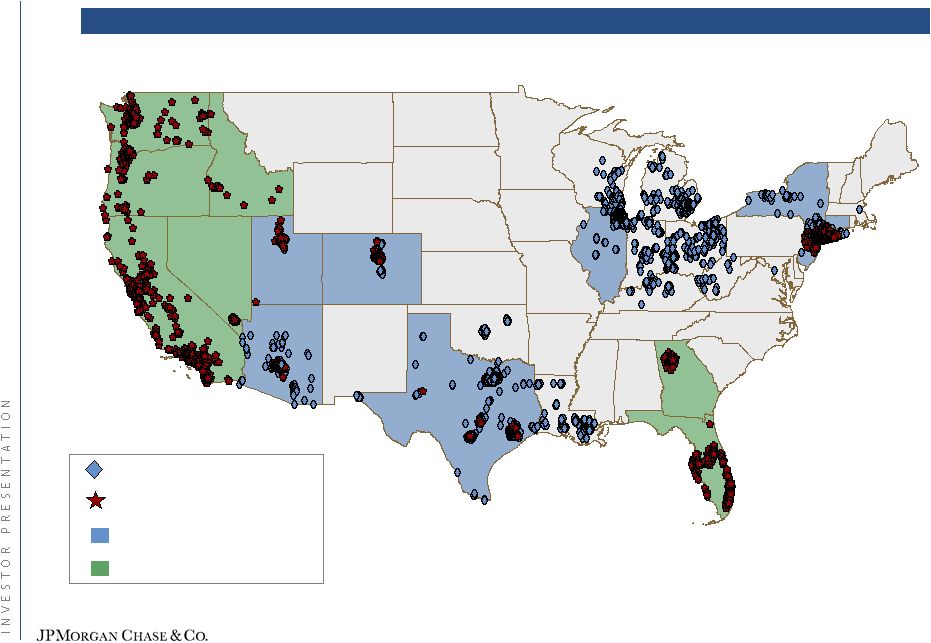 Creates broader branch network Source: SNL Financial Note: Data as of September 18, 2008 Branch map Total JPMorgan Chase–WaMu combined branches — 5,410 at close Chase branches — 3,203 WaMu branches — 2,207 Branch overlap New markets 4 |
 Source: SNL Financial Note: Branch data as of September 18, 2008 Adds branch presence in new markets State Combined JPMorgan Chase Washington Mutual New York 888 651 237 Texas 722 469 253 California 691 3 688 Illinois 463 348 115 Arizona 308 244 64 Michigan 298 298 - Ohio 285 285 - Florida 274 13 261 New Jersey 253 167 86 Washington 188 1 187 Indiana 185 185 - Louisiana 162 162 - Colorado 129 89 40 Oregon 105 - 105 Wisconsin 77 77 - Other 382 211 171 Total 5,410 3,203 2,207 # of branches 5 |
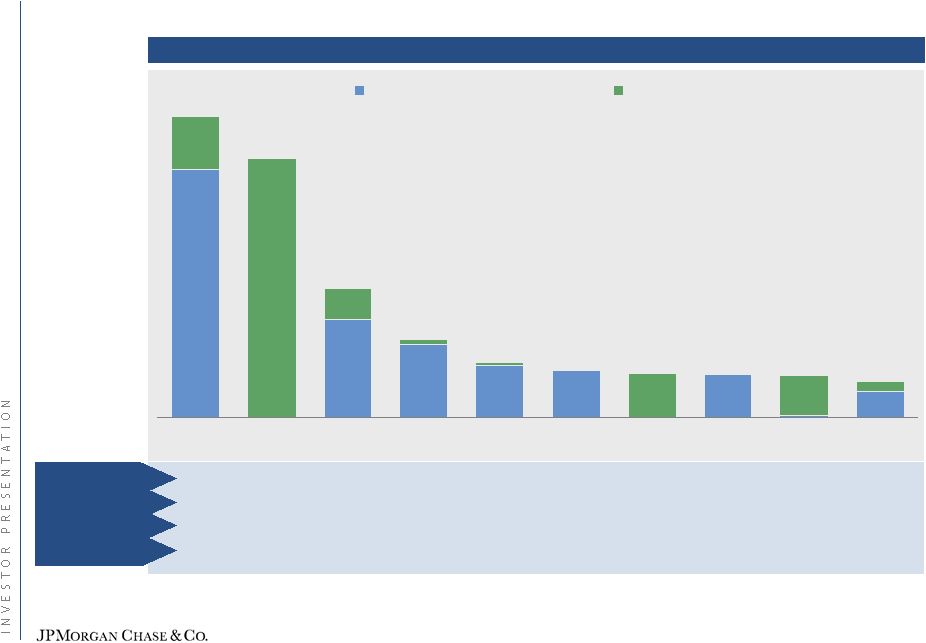 $7.5 $15.7 $75.7 $9.1 $3.3 $12.7 $13.8 $15.2 $21.5 $72.5 $28.7 $0.6 $11.9 $13.0 $0.0 $1.4 $1.1 $0.0 New York California Texas Illinois Arizona Michigan Washington Ohio Florida New Jersey JPMorgan Chase Washington Mutual Adjusted deposits in 10 key states ($bn) Source: SNL Financial Note: Deposit data as of June 30, 2007; excludes deposits greater than $500mm in a single branch; demographic data deposit-weighted by county 1 2007-2012 Combined retail franchise has leading market share in key states 1 3 1 1 1 2 2 4 5 6 21.7% 12.2% 13.0% 9.0% 23.6% 10.8% 14.6% 7.6% 3.9% 8.2% 0.6 4.0 3.6 0.7 1.5 0.4 0.7 0.3 3.4 0.5 2.6% 4.8% 9.8% 3.1% 16.9% 2.1% 6.6% 2.6% 9.7% 2.9% Pop. growth (mm) 1 Market share Rank $88.2 $75.7 $37.7 $22.9 $16.3 $13.8 $13.0 $12.7 $12.4 $10.8 HH growth 1 6 |
 Source: SNL Financial; FDIC data as of June 30, 2007, with $500mm branch exclusion Deposit Growth and CAGR: Claritas 2007, based on CBSA Deposits Top 3 ranking in the country’s largest MSAs Select MSAs by Deposits ($ millions) MSA Deposits in market Combined Market Share Combined Rank Deposit growth ‘07-‘12 CAGR ‘07-‘12 (%) New York, NY $438,371 20.3% 1 $36,209 2.1% Los Angeles, CA $253,285 13.1% 2 $28,970 2.9% Chicago, IL $190,703 11.8% 1 $19,377 2.6% Miami, FL $118,026 7.7% 3 $14,046 3.2% San Francisco, CA $101,911 11.2% 3 $11,803 2.4% Dallas-Fort Worth, TX $75,991 17.1% 1 $15,215 4.1% Houston, TX $71,559 19.9% 1 $13,889 3.9% Detroit, MI $61,034 14.6% 3 $5,685 2.1% Seattle, WA $49,836 17.3% 2 $7,442 3.2% San Diego, CA $45,071 16.2% 2 $7,076 3.5% Phoenix, AZ $42,982 23.2% 1 $11,845 4.9% San Jose, CA $42,903 11.5% 3 $4,263 2.1% 7 |
 Footprint covers 46% of expected population growth – up from 18% Source: SNL Financial branch data, Claritas demographic data and projections Note: Branch data as of September 18, 2008, Demographic data and projections as of 2007 Combined Chase WaMu Network Comparisons U.S. Households 42.3% 25.0% 30.3% Hispanic Households 67.9% 33.9% 58.3% Average Income $72,332 $71,595 $74,747 Businesses 45.6% 26.5% 33.0% Total # of Branches 5,410 3,203 2,207 Population Growth (2007-12) U.S. Population (millions) 129.9 75.0 94.1 5 Year Growth 4.9% 3.3% 5.6% % of Population Growth 46.2% 18.0% 37.9% 5 Year Hispanic Growth 19.3% 18.3% 18.8% % of Hispanic Growth 63.4% 29.9% 52.8% 8 |
 1 Source: IMF Note: Data as of June 30, 2008; branch data as of September 18, 2008 Transaction further strengthens the entire franchise 9 Rank Size and metrics Retail Banking #2 14,300 ATMs 24.5mm checking accounts Credit cards #1 $181bn outstanding Mortgage #3 $1,433bn total mortgage loans serviced 1 Commercial Banking $113bn loans $106bn liabilities |
 Integration plan: invest to improve franchise, realize efficiencies and reduce risk Integrate branch system Close less than 10% of combined branches Optimize staffing in the branches for right balance of sales specialists, bankers and support staff Convert Washington Mutual branches to Chase’s platform; process virtually identical with prior Bank of New York and Bank One conversions Bring best sales and business practices to each Leverage Washington Mutual branch footprint for growth Introduce enhanced product offerings to promote greater cross-sell Build out Business Banking (for small business clients) Build out Middle Market Benefits Private Bank and Private Client Services Consumer lending Run-off existing home lending and sub-prime credit card portfolios Exit all non-bank branch retail lending Future originations to Chase standards Integrate mortgage servicing Integration plan generates top and bottom line growth 10 |
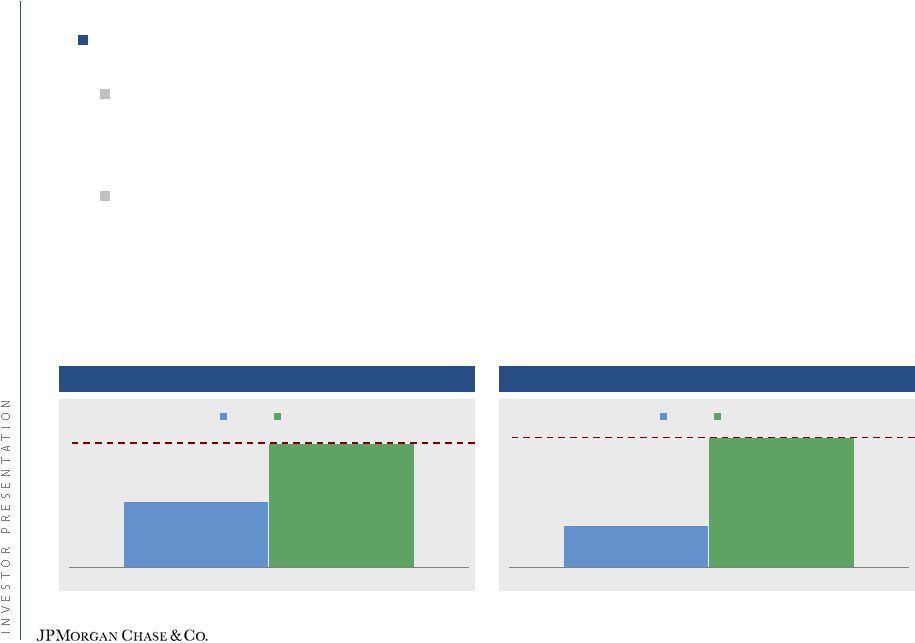 Revenue growth: credit card and investment sales Branch network provides opportunity to cross-sell more products, particularly credit card and investment sales: Credit card — In 2007, Chase produced 2x the per branch credit card production of WaMu — Achieving this productivity from WaMu branches would generate an additional 500,000 credit cards sold annually through the branches Investment sales — Chase’s % of retail bank households that have an investment product is 2x greater than WaMu — Chase’s Financial Advisors produce on average 60% more investment sales per year — Achieving Chase investment sales productivity and increasing number of Financial Advisors could lead to an additional $8-10B in sales annually through the branches WaMu Chase Credit card sales per branch per month - 2007 2x higher WaMu Chase Investment sales per branch per month - 2007 3x higher 11 |
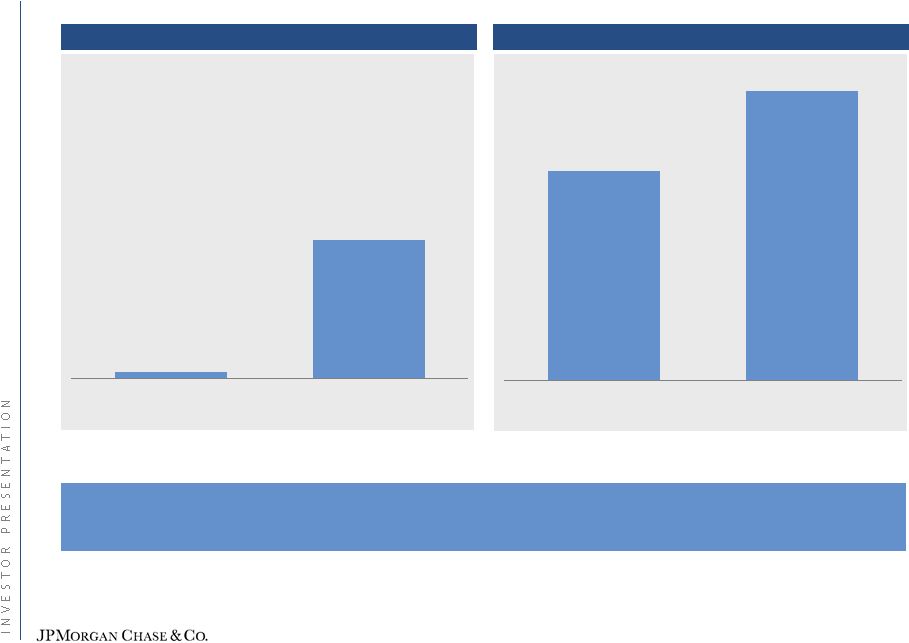 2005 BNY 1H08 2005 BNY 1H08 Note: 1H07 and 1H08 are averages of 1Q and 2Q ¹ Based on average of comparable deposit size Chase branches in NY, NJ and CT Chase has a solid track record in enhancing branch productivity 1.0x 1.0x 1.4x higher 20.0x higher Bank of New York branches - credit cards¹ Bank of New York branches - investment sales¹ Chase successfully increased branch productivity for credit card and investment sales after the Bank of New York branch acquisition 12 |
 Anticipated cost savings and merger costs Cost savings Projected cost savings of approximately $1.5 billion, or approximately 15%-20% of Washington Mutual’s non-interest expense base, net of significant investments in the business Majority of synergies achievable by end of 2010 Majority of branch combinations to be completed by end of 2010 Merger costs Estimated initial transaction-related costs of approximately $1.5 billion pre-tax Severance Technology and systems Real estate and facilities Additional merger costs of $500mm +/- expected to be recognized by 2011, with the majority in 2009 and 2010 13 |
 Branches in new markets create opportunity for Business and Commercial Banking Business Banking Significant opportunity to expand Business Banking as WaMu had limited market penetration Chase has 5x WaMu’s average Business Banking checking balances Chase has 40% more fee income per customer Plans include expanded product offering and build out of business bankers/relationship managers Commercial Banking Retail branch presence provides the basis for a strong middle market franchise Washington Mutual’s retail presence in select attractive markets combined with Chase’s proven leadership provides significant opportunity to enhance Chase’s Middle Market business Over 5,000 Middle Market companies for Chase to pursue as customers in Los Angeles, San Diego, San Francisco, Seattle, and Portland Incremental capabilities from Washington Mutual’s multi-family lending business, a niche product offering with a good risk profile Ability to offer Treasury Services products to new customer base 14 |
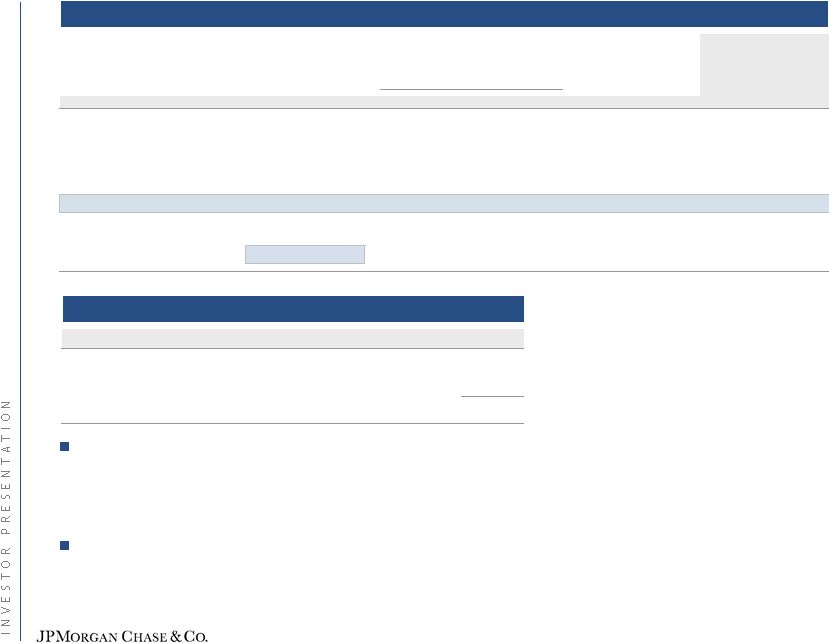  Remaining life loss estimates and marks Allowance for loan losses ($ millions) Washington Mutual Home Loan portfolio ($ millions) WaMu’s credit impaired loans will be recorded at fair value at the acquisition date. Initial adjustments to fair value will be recognized through purchase accounting. Subsequent adjustments to be recognized through income statement. The allowance for loan losses associated with these loans will not be carried over to the combined company. For non-credit impaired loans, the allowance for loan losses is transferred over to the combined company and subject to conforming reserve adjustments. These adjustments will be recognized in the consolidated income statement ¹ Transition adjustment represents: release of allowance on credit impaired loans (PAA) and conforming ALL adjustments (income statement) WaMu Allowance for Loan Losses as of 6/30/08 $8,456 Transition Adjustment¹ (4,877) WaMu pro forma Allowance for Loan Losses $3,579 Total Fair Remaining life loss estimates as of 12/31/2007 Projected remaining life losses as of 09/30/2008 Estimated balances as of Value Marks $ (%) $ 9/30/2008 Option ARMs ($8,189) $11,803 20% $10,346 $50,300 Mortgage (3,376) 2,692 5 2,183 51,100 HE Loans & Lines (12,565) 14,252 23 11,739 59,500 Subprime (5,761) 7,502 40 6,438 15,100 Total home loan portfolio ($29,891) $36,249 19% $30,706 $176,000 Other portfolios ($980) Total marks ($30,871) 15 |
 Home lending loss sensitivities ($ billions) 1 Home price appreciation 16 Current estimates Deeper recession Severe recession Current to trough HPA California (10%) (14%) (24%) Florida (16) (21) (36) US (8) (11) (20) Peak to trough HPA California (44%) (48%) (58%) Florida (44) (49) (64) US (25) (28) (37) Unemployment 7.0% 7.5% 8.0% Remaining life losses from December 31, 2007 $36 $42 $54 1 1 |
 Capital impact from transaction before capital raise Tier 1 capital impact ($ billions) 1 At Washington Mutual carrying values 2 Excludes REIT preferred, subordinated debt and senior debt from Washington Mutual’s banks, and the elimination of the deferred tax assets of Washington Mutual’s banks 3 Other includes restructuring charge, writeoff of PP&E, and other Tier 1 adjustments 17 Tangible assets assumed $296 Liabilities assumed 265 Net assets $31 Loan marks (31) Reversal of loan loss reserve 8 Other PAA 3 (6) Adjusted net asset value $2 Consideration (2) Pro forma capital impact $0 Conforming loan loss reserve (1) Pro forma capital impact after conforming loan loss reserve ($1) 2 1 1 |
 Capital ratio analysis – includes expected $8bn capital raise Source: Company filings, FactSet, I/B/E/S, Equity research, JPMorgan Chase and Washington Mutual estimates Note: JPMorgan pro forma for $1.8bn issuance of DRD Preferred in August 2008 and $8.0bn common raise 6/30/08 Estimated 9/30/2008 JPMorgan Chase JPMorgan Chase pro forma Pro forma assets (reg) Total assets $1,776 $2,050 Tangible assets 1,727 2,000 RWA 1,080 1,300 Average assets for leverage ratio 1,536 1,550 Pro forma capital (reg) Tangible common equity $79 $85 Tier 1 capital 99 107 Total capital 145 156 Pro forma capital ratios +/- TCE/TA 4.6% 4.3% Leverage 6.4 6.9 Tier 1 capital 9.2 8.3 Total capital 13.4 12.0 TCE/MRWA 6.8 6.4 Capital over time 18 |
  Note: Washington Mutual contribution based on JPMorgan Chase management estimates 2009 2010 2011 JPMorgan Chase GAAP earnings - consensus $11.7 $15.8 $16.7 JPMorgan Chase GAAP EPS - consensus $3.29 $4.41 $4.67 Pro forma contribution from Washington Mutual $2.4 $3.0 $3.4 Pro forma GAAP net income $14.2 $18.8 $20.1 Pro forma GAAP EPS $3.79 $5.01 $5.37 EPS accretion/(dilution) ($) $0.50 $0.60 $0.70 EPS accretion/(dilution) (%) 15% 14% 15% Earnings accretion/(dilution) ($bn) $1.9 $2.2 $2.6 $ billions Illustrative income statement impact Substantially improved earnings creates margin of error for additional credit losses 19 |
 Illustrative capital generation from Washington Mutual franchise 2009 2010 2011 Operating income (after-tax) $2.4 $3.0 $3.4 Capital from balance sheet reduction 2.0 1.1 0.5 Washington Mutual total excess capital $4.4 $4.1 $3.9 Washington Mutual total cumulative excess capital $4.4 $8.5 $12.4 Washington Mutual assets $231.2 $211.5 $200.2 $ billions Note: Washington Mutual contribution based on JPMorgan Chase management estimates 20 |
 JPMorgan Chase 3Q08 earnings outlook Note that the below 3Q08 outlook is necessarily preliminary pending completion of the Firm’s third fiscal quarter. Accordingly the information remains subject to trading results for several remaining days, changes in JPM credit spreads, allowance additions based on final credit loss data, quarter-end accounting adjustments, and other factors. In addition, the overall economy and the capital markets remain highly uncertain. For more information, see “Forward-looking disclosures” on page 22 Investment Bank QTD trading results positive despite highly volatile conditions — Includes markdowns of $3.0bn to $3.5bn +/- on mortgage and leveraged loans — Significant reduction in key risk exposure — Benefit of credit spread widening $1bn +/- — Lehman/AIG exposure – risk remaining but minimal cost expected in third quarter Expect APB 23 benefit firmwide of $700mm+ (mostly in Investment Bank) Addition to allowance for credit losses of $400mm +/- Inclusive of all the above, expect Investment Bank to be profitable in the quarter Retail Financial Services net charge-offs continue to trend higher as previously disclosed; likely addition to allowance for loan losses for the subprime and prime mortgage portfolios of $600mm+ (some of which relates to prime mortgage in Corporate) Card Services net charge-offs performing as previously disclosed in range of 5% + Other businesses (CB, TSS, AM) on track versus prior outlook Corporate results include: $1.2bn pretax write-down related to preferred equity interests in FRE and FNM Estimated auction-rate securities buyback charge of approximately $400mm +/- (pretax) Increased credit costs related to prime mortgage portfolio Washington Mutual transaction will have some income statement accounting impact in 3Q08 Expect no extraordinary gain Approximately $2bn addition to allowance for loan losses (conforming accounting booked above the line) 21 |
 Forward-Looking Disclosure: This presentation contains forward-looking statements within the meaning of the Private Securities Litigation Reform Act of 1995. In particular, the earnings information presented on page 21 is necessarily preliminary pending completion of the Firm's third fiscal quarter on September 30, 2008. Such information also does not reflect the impact on the Firm’s earnings or credit information as a result of the acquisition of the assets and liabilities of Washington Mutual’s banks. All forward-looking statements included in this presentation are based upon the current beliefs and expectations of JPMorgan Chase’s management and are subject to significant risks and uncertainties. Actual results may differ from those set forth in the forward-looking statements. Factors that could cause JPMorgan Chase’s actual results to differ materially from those described in the forward-looking statements include: changes in revenue due to volatility in the financial and trading markets; additional reserves to the allowance for credit losses based on final credit loss data; increased expenses due to final accrual information; normal quarter-end accounting adjustments; negative economic conditions that adversely affect housing prices, the job market, consumer confidence and spending habits and the economy in general; changes in interest rates; estimates used in determining the fair value of certain of our assets may be imprecise resulting in significant changes in valuation; changes in the regulation of financial services companies, government-sponsored enterprises, mortgage originators and servicers, hedge funds and credit card lenders; changes in the regulation of the products and services that JPMorgan Chase offers; and changes in the reputation of, or expectations regarding, the financial services industry in general or JPMorgan Chase in particular or with respect to practices of, and products offered by, financial institutions in general or JPMorgan Chase in particular. Additional factors that may cause actual results to differ materially than those set forth in the forward-looking statements can be found in JPMorgan Chase’s Quarterly Reports on Form 10-Q for the quarters ended March 31, 2008 and June 30, 2008, Annual Report on Form 10-K for the year ended December 31, 2007 and Current Reports on Form 8-K for events occurring on or after the date hereof, filed with the Securities and Exchange Commission and available on JPMorgan Chase’s website (www.jpmorganchase.com) and on the Securities and Exchange Commission’s website (www.sec.gov) to which reference is hereby made. JPMorgan Chase does not undertake to update the forward-looking statements to reflect the impact of circumstances or events that may arise after the date of the forward-looking statements. 22 |