 N O V E M B E R 1 2 , 2 0 0 8 Jamie Dimon Chairman and Chief Executive Officer Merrill Lynch Banking & Financial Services Investor Conference Exhibit 99.1 |
 Part I - Firm and line of business update Part II - Key investor topics Bear Stearns and WaMu updates Consumer credit Commercial Banking credit Capital management Revenue growth drivers Comments on environment 4Q08 outlook recap Conclusions Agenda The figures reflected in this presentation refer to heritage-JPMorgan Chase figures only, except where specifically noted as being pro forma combined for the Washington Mutual transaction 1 |
 P A R T I - F I R M A N D L I N E OF B U S I N E S S U P D A T E 2 |
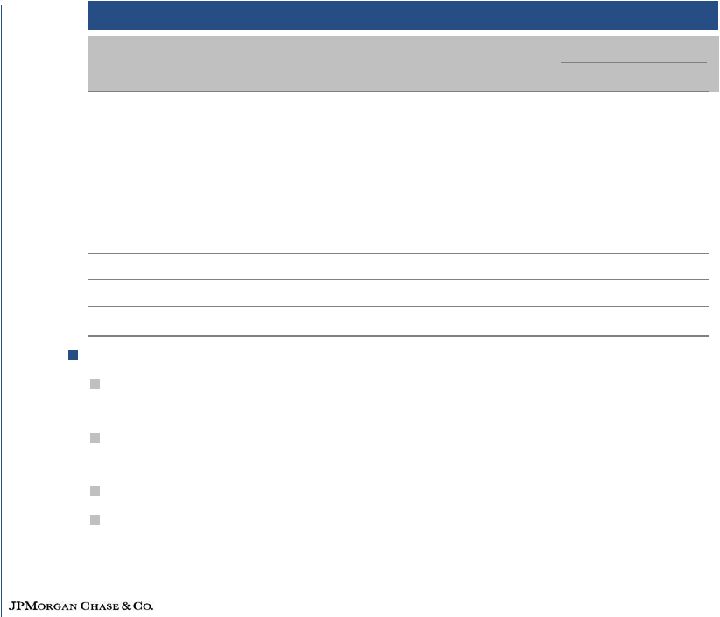
 3Q08 Managed Results $ in millions 1 Managed basis presents revenue and credit costs without the effect of credit card securitizations. Revenue is on a fully taxable-equivalent (FTE) basis. All references to credit costs refer to managed provision for credit losses 2 Includes pretax merger-related costs of $96mm, $155mm, and $61mm in 3Q08, 2Q08, and 3Q07, respectively 3 Actual numbers for all periods, not over/under 4 See note 1 on slide 38 3 3Q08 2Q08 3Q07 2Q08 3Q07 Results excl. WaMu merger-related items Revenue (FTE) $16,088 ($3,590) ($889) (18)% (5)% Credit Costs 4,684 399 2,321 9% 98% Expense 11,137 (1,040) 1,810 (9)% 19% Net Income $1,167 ($836) ($2,206) (42)% (65)% EPS $0.28 ($0.26) ($0.69) (48)% (71)% Estimated WaMu merger-related items (640) (640) (640) NM NM Reported Net Income $527 ($1,476) ($2,846) (74)% (84)% Reported EPS $0.11 ($0.43) ($0.86) (80)% (89)% ROE 1% 6% 11% ROE Net of GW 2% 10% 18% ROTCE 3% 10% 20% $ O/(U) O/(U) % 1 |
 Investment Bank 1 Actual numbers for all periods, not over/under 2 Average loans include the impact of a loan extended to Bear Stearns during April and May. Excluding this facility, the ratio would have been 3.46% for 2Q08 3 Calculated based on average equity. 3Q08 average equity was $26B 4 Average Trading and Credit Portfolio VAR Net income of $882mm on revenue of $4.0B; pretax income of $16mm Reflects benefit from reduced deferred tax liabilities IB fees of $1.6B up 20% YoY Fixed Income Markets revenue of $815mm up 19% YoY reflecting: Net markdowns of $2.6B on mortgage-related positions Net markdowns of $1.0B on leveraged lending funded and unfunded commitments Record results in rates and currencies and strong performance in credit trading, emerging markets and commodities Gain of $343mm due to the widening of the Firm's credit spread on certain structured liabilities Record Equity Markets revenue of $1.7B up $1.1B YoY driven by strong trading results and client revenue. Results also impacted by gain of $429mm due to the widening of the Firm's credit spread on certain structured liabilities Credit Portfolio down from prior year reflecting markdowns due to the widening of counterparty credit spreads Credit costs of $234mm driven by increased allowance, reflecting a weakening credit environment. Total ALL of $2.7B Net charge-offs of $13mm Expense up 60% YoY largely driven by higher compensation expense and additional operating costs relating to the Bear Stearns merger Bear Stearns merger integration progressing well Increased allocated equity to $33B 4 $ in millions 3Q08 2Q08 3Q07 Revenue $4,035 ($1,435) $1,089 Investment Banking Fees 1,593 (142) 263 Fixed Income Markets 815 (1,532) 128 Equity Markets 1,650 571 1,113 Credit Portfolio (23) (332) (415) Credit Costs 234 (164) 7 Expense 3,816 (918) 1,438 Net Income $882 $488 $586 Key Statistics 1 Overhead Ratio 95% 87% 81% Comp/Revenue 54% 57% 40% ALL / average loans 3.85% 3.19% 1.80% NPLs ($mm) $436 $313 $265 ROE 3 13% 7% 6% VAR ($mm) 4 $218 $149 $107 EOP Equity ($B) $33.0 $26.0 $21.0 $ O/(U) 2 |
 Net markdowns of $1.0B for the quarter $12.9B of legacy commitments with gross markdowns of $3.8B, or 29% at 9/30/08; market value at 9/30/08 of $9.1B $16.3B of legacy commitments at 6/30/08 ($3.4B) reduction, or 21% of exposure $12.9B of legacy commitments at 9/30/08 classified as held-for-sale Valuations are deal specific and result in a wide range of pricing levels; markdowns represent best indication of prices at 9/30/08 IB Key Risk Exposures Legacy Leveraged Lending Note: Exposures are stated on a trade date basis. $8.5B total commitments at 9/30/08 classified as held-for-investment 5 |
  Exposure as of 6/30/2008 Exposure reduction Exposure as of 9/30/2008 Prime $8.9 ($6.6) $2.3 Alt-A 10.7 (4.9) 5.8 Subprime 1.8 (0.6) 1.2 Subtotal Residential $21.4 ($12.1) $9.3 CMBS 11.6 (2.3) 9.3 Mortgage Exposure $33.0 ($14.4) $18.6 3Q08 reductions of over 40% on mortgage-related exposures include: $2.6B of net markdowns $11.8B of sales, including $4.3B to Corporate Prime / Alt-A gross exposure of $8.1B, difficult to hedge effectively Prime - securities of $2.3B, mostly AAA-rated Alt-A - securities of $1.9B, mostly AAA-rated and $3.9B of first lien mortgages Subprime gross exposure of $1.2B, actively hedged CMBS gross exposure of $9.3B, actively hedged $3.4B of securities, of which 58% are AAA-rated; 18% fixed-rate / 82% floating-rate $5.9B of first lien mortgages $18.6B of remaining IB positions in two buckets: $12.0B – on-going trading positions $6.6B – separately managed liquidating portfolio in IB IB Key Risk Exposures Mortgage-related $ in billions 6 |
 Retail Financial Services—Drivers Key Statistics¹ - $ in billions 1 Actual numbers for all periods, not over/under 2 Does not include held-for-sale loans 3 Balance reflects predominantly subprime mortgages owned. As of 9/30/08, $34.8B of held-for- investment prime mortgage loans sourced by RFS and $7.2B of prime mortgages sourced by Asset Management are reflected in Corporate for reporting and risk management purposes. The economic benefits of these loans flow to RFS Average deposits up 2% YoY Branch production statistics YoY Checking accounts up 10% Credit card sales up 6% Mortgage originations down 6% Investment sales up 1% Mortgage loan originations down 4% YoY, down 33% QoQ Declines reflect tighter underwriting standards and the overall reduction in liquidity in the financial markets For 3Q08, greater than 90% of mortgage originations fall under agency and government programs Home Equity originations down 77% YoY due to tighter underwriting standards 3rd party mortgage loans serviced up 14% YoY 7 3Q08 2Q08 3Q07 Regional Banking Average Deposits $210.2 $213.9 $205.3 Checking Accts (mm) 11.7 11.3 10.6 # of Branches 3,179 3,157 3,096 # of ATMs 9,308 9,310 8,943 Investment Sales ($mm) $4,389 $5,211 $4,346 Home Equity Originations $2.6 $5.3 $11.2 Avg Home Equity Loans Owned $94.8 $95.1 $91.8 Avg Mortgage Loans Owned 2,3 $14.3 $15.6 $9.9 Mortgage Banking Mortgage Loan Originations $37.7 $56.1 $39.2 3rd Party Mortgage Loans Svc'd $682 $659 $600 Auto Auto Originations $3.8 $5.6 $5.2 Avg Auto Loans and Leases $46.1 $47.0 $42.4 |
 Retail Financial Services 1 Actual numbers for all periods, not over/under 2 The net charge-off rate for 3Q08 and 2Q08 excluded $45mm and $19mm, respectively of charge-offs related to prime mortgage loans held by Treasury in the Corporate segment, respectively 3 Calculated based on average equity. 3Q08 average equity was $17B Net income of $247mm, down 61% YoY driven by increased credit costs and higher noninterest expense offset partially by revenue growth in all businesses Revenue of $4.9B up 16% YoY Credit costs reflect $450mm in additions to the allowance for subprime mortgage and home equity loans, and higher estimated losses for the home lending portfolio Current allowance for loan losses is $5.0B An additional provision for prime mortgage loans of $250mm has been reflected in the Corporate segment. Certain prime mortgage loans are retained in the Corporate segment Regional Banking net income of $218mm, down 64% YoY, reflects significant increases in credit costs Net revenue of $3.7B increased 11% YoY due to higher loan and deposit balances, wider deposit spreads and higher deposit-related fees offset partially by declines in education loan sales Mortgage banking net loss of $50mm due to higher mortgage reinsurance losses offset partially by increased servicing and production revenue Auto Finance net income of $79mm up 4% YoY $ in millions 8 3Q08 2Q08 3Q07 Net Interest Income $3,144 $89 $463 Noninterest Revenue 1,731 (229) 211 Total Revenue $4,875 ($140) $674 Credit Costs 1,678 346 998 Expense 2,772 102 303 Net Income $247 ($359) ($392) Regional Banking $218 ($136) ($393) Consumer and Business Banking 723 49 132 Loan Portfolio/Other (505) (185) (525) Mortgage Banking (50) (219) (2) Auto Finance $79 ($4) $3 Key Statistics 1 Overhead (excl. CDI) 55% 51% 56% Net Charge-off Rate 2 2.44% 1.99% 0.82% Allowance for Loan Losses to EOP Loans 2.64% 2.39% 1.22% ROE 3 6% 14% 16% EOP Equity ($B) $25.0 $17.0 $16.0 $ O/(U) |
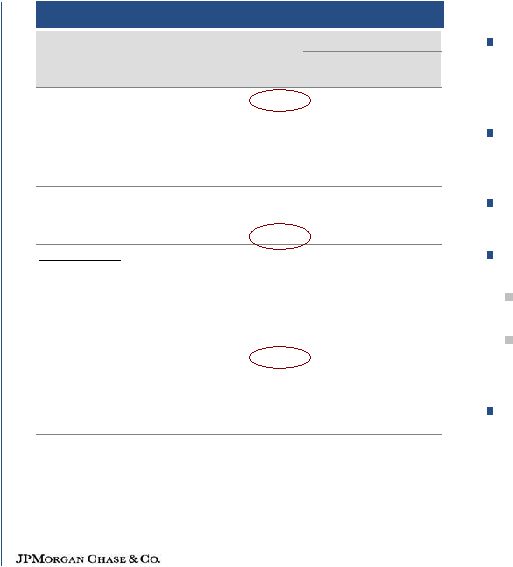
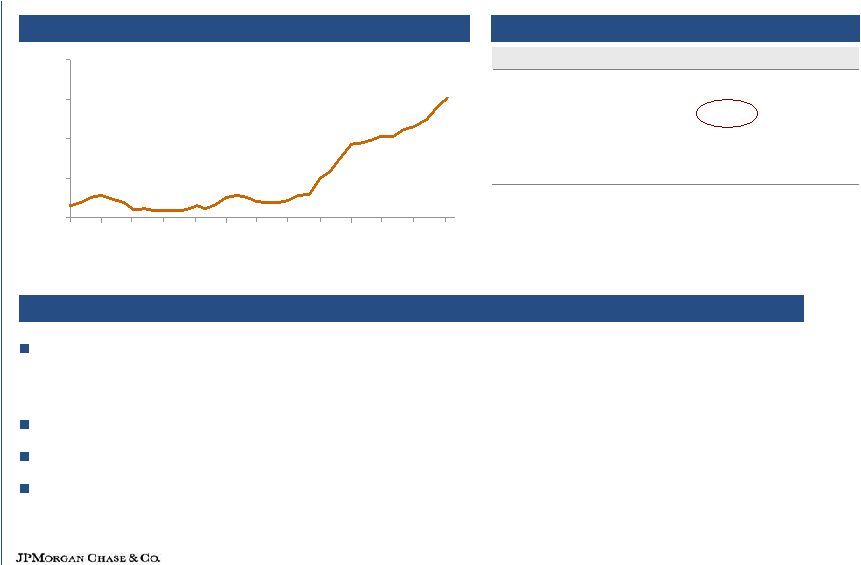 JPM 30-day delinquency trend Comments on home equity portfolio Home Equity Note: CLTV = Combined-Loan-to-Value. This metric represents how much equity the borrower has in the property Key statistics 1.00% 1.50% 2.00% 2.50% 3.00% Sep- 05 Dec- 05 Mar- 06 Jun- 06 Sep- 06 Dec- 06 Mar- 07 Jun- 07 Sep- 07 Dec- 07 Mar- 08 Jun- 08 Sep- 08 3Q08 2Q08 3Q07 EOP owned portfolio ($B) $94.6 $95.1 $93.0 Net charge-offs ($mm) $663 $511 $150 Net charge-off rate 2.78% 2.16% 0.65% Nonperforming loans ($mm) $1,142 $1,008 $556 Significant underwriting changes made over the past year include elimination of stated income loans and state/MSA based reductions in maximum CLTVs based on expected housing price trends. Maximum CLTVs now range from 50% to 80% New originations down significantly in 3Q08 High CLTVs continue to perform poorly, exacerbated by housing price declines in key geographies Continued deterioration — quarterly losses could be as high as $725-$850mm over the next several quarters (net charge-offs of 3.25% to 3.75%) 9 |
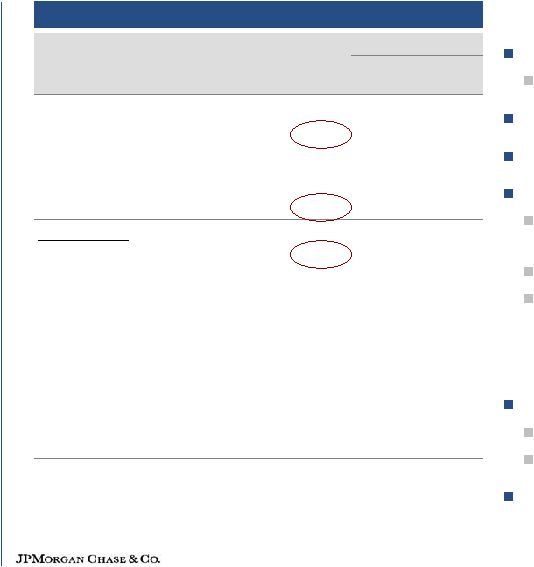
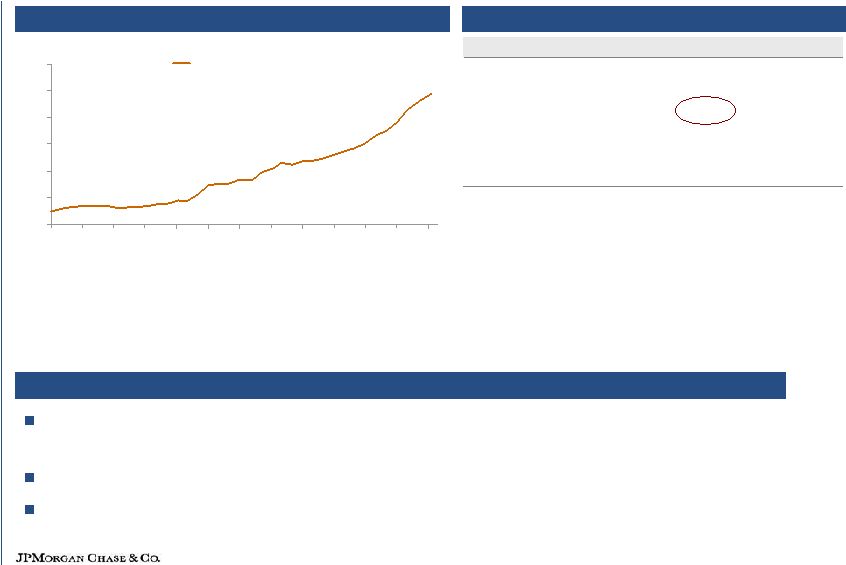 Subprime Mortgage JPM 30-day delinquency trend Comments on subprime mortgage portfolio 1 Excludes mortgage loans held in the Community Development loan portfolio Key statistics 0% 5% 10% 15% 20% 25% 30% Sep- 05 Dec- 05 Mar- 06 Jun- 06 Sep- 06 Dec- 06 Mar- 07 Jun- 07 Sep- 07 Dec- 07 Mar- 08 Jun- 08 Sep- 08 Subprime Portfolio experiencing credit deterioration as a result of risk layering and housing price declines Eliminated new production and portfolio is in run-off Continued deterioration — quarterly losses could be as high as $375-$425mm in early 2009 10 EOP owned portfolio ($B) 1 $13.4 $14.8 $12.1 3 Q08 2 Q08 3 Q07 Net charge -offs ($mm) $273 $192 $40 Net charge -off rate 7.65% 4.98 % 1.62% Nonperforming loans ($mm) $2,384 $1,715 $790 |
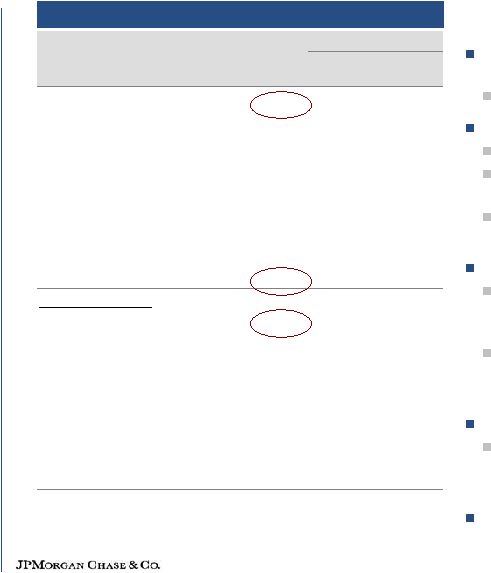
 Comments on prime mortgage portfolio Note: CLTV = Combined-Loan-to-Value. This metric represents how much equity the borrower has in the property Key statistics JPM 30-day Delinquency Trend 0.00% 0.50% 1.00% 1.50% 2.00% 2.50% 3.00% 3.50% 4.00% 4.50% 5.00% 5.50% Sep- 05 Dec- 05 Mar- 06 Jun- 06 Sep- 06 Dec- 06 Mar- 07 Jun- 07 Sep- 07 Dec- 07 Mar- 08 Jun- 08 Sep- 08 Prime CA/ FL exhibit the highest charge-off rates and account for 80% of 3Q08 losses while only 37% of the outstanding portfolio The loss contribution is greatest from the 2006 and 2007 vintages Recent underwriting changes for non-conforming loans include: Eliminated stated income Reduced allowable CLTVs (all markets); set even tighter CLTV limits in markets with declining HPAs Exited broker business Tightened underwriting standards even further for Florida Quarterly losses could be as high as $300mm in early 2009 (net charge-offs of 2.25% to 2.50%) 1 Includes Construction Loans and Loans eligible for repurchase as well as loans repurchased from GNMA pools that are insured by US government agencies Prime Mortgage 11 3Q08 2Q08 3Q07 EOP balances in Corporate ($B) $42.0 $42.6 $32.8 EOP balances in RFS 1 ($B) $4.9 $4.6 $2.8 Total EOP balances ($B) $46.9 $47.2 $35.6 Corporate net charge-offs ($mm) $130 $84 $4 RFS net charge -offs ($mm) $47 $20 $5 Total net charge -offs ($mm) $177 $104 $9 Net charge -off rate (%) 1. 51% 0.91% 0.11 % Nonperforming loans ($mm) $1,496 $1,232 $282 |
 Card Services (Managed) ¹ Actual numbers for all periods, not over/under 2 Calculated based on average equity. 3Q08 average equity was $14.1B $ in millions 12 3Q08 2Q08 3Q07 Revenue $3,887 $112 $20 Credit Costs 2,229 35 866 Expense 1,194 9 (68) Net Income $292 $42 ($494) Key Statistics ($B) Avg Outstandings $157.6 $152.8 $148.7 EOP Outstandings $159.3 $155.4 $149.1 Charge Volume $93.9 $93.6 $89.8 Net Accts Opened (mm) 3.6 3.6 4.0 Managed Margin 8.18% 7.92% 8.29% Net Charge-Off Rate 5.00% 4.98% 3.64% 30-Day Delinquency Rate 3.69% 3.46% 3.25% ROO (pretax) 1.17% 1.04% 3.31% ROE 2 8% 7% 22% EOP Equity ($B) $15.0 $14.1 $14.1 $ O/(U) Net income of $292mm down 63% YoY; decline in results driven by increase in credit costs, partially offset by lower noninterest expense Credit costs up $866mm or 64% YoY due to higher net charge-offs and an increase of $250mm in the allowance for loan losses Net charge-off rate of 5.00% was up from 3.64% YoY and 4.98% QoQ Average outstandings of $157.6B up 6% YoY and 3% QoQ Charge volume growth of 5% YoY and flat QoQ Revenue of $3.9B up 1% YoY and 3% QoQ Managed margin of 8.18% was down from 8.29% YoY and up from 7.92% QoQ Expense of $1.2B down 5% YoY driven by lower marketing expense and was flat QoQ 1 |
 Commercial Banking ¹ Actual numbers for all periods, not over/under 2 Includes deposits and deposits swept to on-balance sheet liabilities 3 Calculated based on average equity. 3Q08 average equity was $7B Net income of $312mm up 21% YoY, driven by record revenue, partially offset by higher provision for credit losses and noninterest expense Average loans up 18% YoY with growth in Middle Market and Mid-Corporate. Liability balances up 13% YoY Record revenue of $1.1B up 11% YoY, reflecting higher revenue in all major products Credit costs reflect a weakening credit environment and growth in loan balances Majority of NPLs and NCOs are related to residential real estate Continue to monitor commercial real estate portfolio, which is expected to trend towards normalized levels Expense up 3% YoY with overhead ratio of 43% $ in millions 13 3Q08 2Q08 3Q07 Revenue $1,125 $19 $116 Middle Market Banking 729 21 49 Mid-Corporate Banking 236 1 69 Real Estate Banking 91 (3) (17) Other 69 - 15 Credit Costs 126 79 14 Expense 486 10 13 Net Income $312 ($43) $54 Key Statistics 1 Avg Loans & Leases ($B) $72.3 $71.1 $61.3 Avg Liability Balances ($B) 2 $99.4 $99.4 $88.1 Overhead Ratio 43% 43% 47% Net Charge-Off Rate 0.22% 0.28% 0.13% ALL / average loans 2.65% 2.61% 2.67% NPLs ($mm) $572 $486 $134 ROE 3 18% 20% 15% EOP Equity ($B) $8.0 $7.0 $6.7 $ O/(U) |
 Treasury & Securities Services $ in millions 14 3Q08 2Q08 3Q07 Revenue $1,953 ($66) $205 Treasury Services 897 45 117 Worldwide Securities Svcs 1,056 (111) 88 Expense 1,339 22 205 Net Income $406 ($19) $46 Key Statistics Avg Liability Balances ($B) $260.0 $268.3 $236.4 Assets under Custody ($T) $14.4 $15.5 $15.6 Pretax Margin 29% 33% 33% ROE 46% 49% 48% TSS Firmwide Revenue $2,672 $2,721 $2,412 TS Firmwide Revenue $1,616 $1,554 $1,444 TSS Firmwide Avg Liab Bal ($B) $359.4 $367.7 $324.5 EOP Equity ($B) $4.5 $3.5 $3.0 $ O/(U) 1 Actual numbers for all periods, not over/under 2 Includes deposits and deposits swept to on-balance sheet liabilities 3 Calculated based on average equity. 3Q08 average equity was $3.5B Net income of $406mm up 13% YoY Pretax margin of 29% Liability balances up 10% YoY Assets under custody down 8% YoY Revenue up 12% YoY Higher client volumes across businesses Record revenue in TS WSS benefited from wider spreads on liability products and in securities lending and foreign exchange as a result of recent market conditions Expense up 18% YoY due to: Business and volume growth Investment in new product platforms Results include a benefit from reduced deferred tax liabilities 1 2 3 2 |
 Asset Management $ in millions 1 Actual numbers for all periods, not over/under 2 Reflects $15B for assets under management and $68B for assets under supervision from the Bear Stearns merger on May 30, 2008 3 Reflects the transfer in 2007 of held-for-investment prime mortgage loans from AM to Treasury within the Corporate segment 4 Calculated based on average equity. 3Q08 average equity was $5.5B 15 3Q08 2Q08 3Q07 Revenue $1,961 ($103) ($244) Private Bank 631 (77) 7 Institutional 486 14 (117) Retail 399 (91) (240) Private Wealth Management 352 (4) 13 Bear Stearns Brokerage 93 55 93 Credit Costs 20 3 17 Expense 1,362 (38) (4) Net Income $351 ($44) ($170) Key Statistics ($B) 1 Assets under Management $1,153 $1,185 $1,163 Assets under Supervision $1,562 $1,611 $1,539 Average Loans 3 $39.8 $39.3 $30.9 Average Deposits $65.6 $70.0 $59.9 Pretax Margin 30% 31% 38% ROE 25% 31% 52% EOP Equity $7.0 $5.2 $4.0 $ O/(U) Net income of $351mm down by 33% YoY, largely driven by lower revenue Pretax margin of 30% Assets under management of $1.2T, down 1% YoY Market declines drove AUM down by $133B Net AUM flows of $123B for the past 12 months; $46B for the quarter Growth of 11% in alternative assets and $15B from the Bear Stearns merger Revenue of $2.0B down 11% YoY due to: Lower performance fees and the effect of lower markets, including the impact of lower market valuations of seed capital investments; Offset partially by the benefit of the Bear Stearns merger and increased revenue from higher loan and deposit balances Varied global investment performance 77% of mutual fund AUM ranked in the first or second quartiles over past five years; 67% over past three years; 49% over one year Expense was flat YoY, as the effect of the Bear Stearns merger and increased headcount were offset by lower performance-based compensation 2 2 4 |
 Corporate/Private Equity Private Equity Private Equity losses of $206mm EOP Private Equity portfolio of $7.5B Represents 7.5% of shareholders’ equity less goodwill Corporate Net loss of $1.1B includes after-tax items: $642mm loss on FNM and FRE preferred securities $248mm charge related to offer to repurchase auction-rate securities $234mm for addition to allowance for loan losses and net charge-offs for prime mortgage portfolio Merger-Related Items Washington Mutual (estimated) ($1.2B) conforming loan loss reserve adjustment (after-tax) $581mm extraordinary gain (after-tax) Bear Stearns ($95mm) of merger-related items (after-tax) 1 Includes after-tax merger cost of $38mm in 3Q07 16 Corporate/Private Equity net income - $ in millions 3Q08 2Q08 3Q07 Private Equity ($164) ($263) ($573) Corporate (1,064) (1,083) (1,206) Merger-related items (735) (195) (697) Net Income 1 ($1,963) ($1,541) ($2,476) $ O/(U) |
 P A R T I I - K E Y I N V E S T O R T O P I C S 17 |
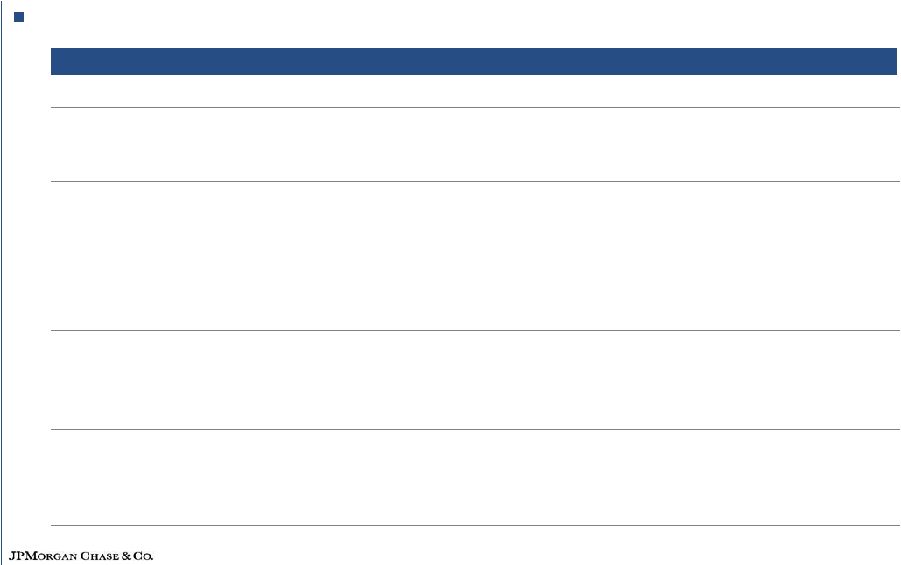
 Bear Stearns merger update Still expect Bear Stearns’ units to contribute $1B +/- annualized net income (after- tax) by year-end 2009 Some businesses are stronger than previously thought (e.g. Equity prime brokerage) Cost to de-risk is higher than previously thought but largely complete Overall merger integration progressing well 18 |
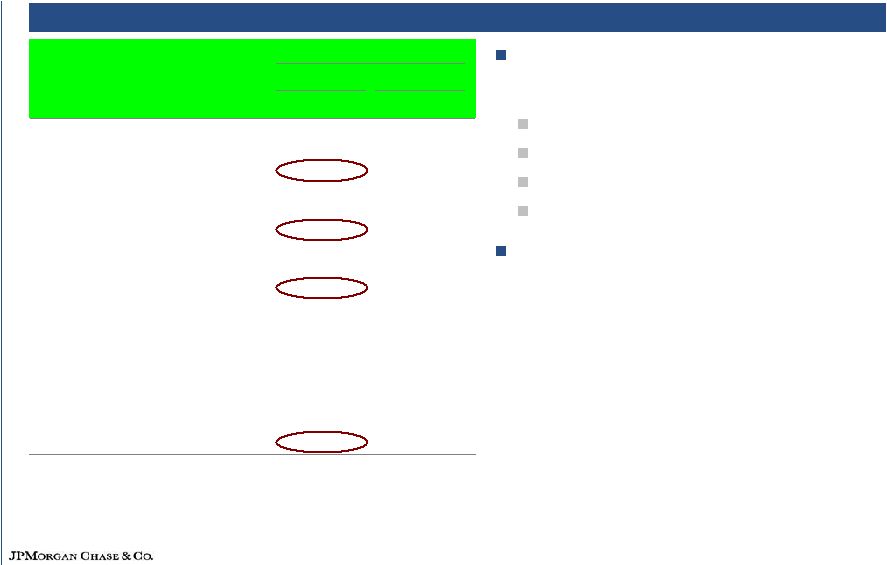
 Strategic Fit Greatly enhances retail banking platform in attractive markets Combined deposits of $911B and 5,410 branches at close Expanding into attractive new markets (CA + FL) Increases market share in existing largest fast-growing markets (NY, TX, IL, AZ, CO, UT) Financially Compelling Accretive immediately. Net income impact of approximately $0.50 per share in 2009, largely in RFS. 4Q08 impact of $0.10 +/-; does not include merger costs of approximately $100mm +/- (after-tax) or purchase accounting adjustments (including any additional extraordinary gain or loss) Asset write-downs reduce risk to volatility in future earnings Allows significant margin for error Opportunity to grow revenue and realize significant cost savings Ability to bring expanded Chase products and services to WaMu branches Drive efficiencies in branch network and back office JPMorgan Chase maintains strong capital and liquidity positions Retail deposits add to stable funding base Ability to execute Proven capabilities with success in Bank One/Chase and Bank of New York transactions Little overlap with Bear Stearns integration WaMu provides unique opportunity to expand retail banking franchise and generate attractive returns for JPMorgan Chase shareholders 1 Source: SNL Financial; branch data as of September 18, 2008; deposit data as of June 30, 2008 19 1 |
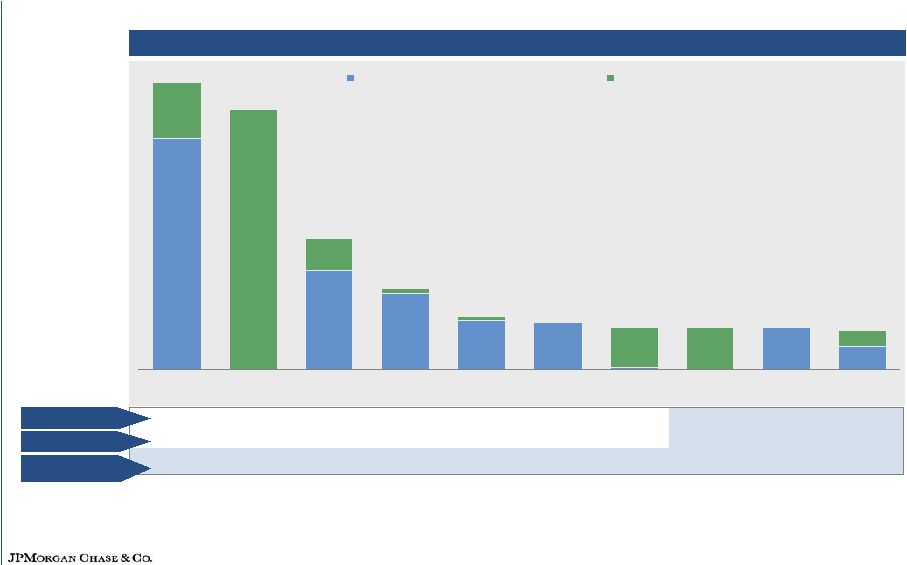  Source: SNL Financial Note: Deposit data as of June 30, 2008; excludes deposits greater than $500mm in a single branch ¹ 2008-2013 projected demographic data Combined retail franchise has leading market share in key states 1 3 2 1 2 2 5 2 5 6 19.7% 11.2% 11.4% 8.8% 21.1% 9.1% 3.7% 11.8% 6.9% 5.2% 1.6% 6.8% 11.3% 4.0% 17.5% 2.0% 11.6% 8.0% 1.5% 2.9% Pop. growth (%)¹ Market share Rank $85.1 $77.3 $39.0 $24.0 $15.6 $13.8 $12.6 $12.4 $12.4 $10.4 20 Adjusted deposits in 10 key states ($B) $68.6 $29.3 $22.4 $14.4 $13.8 $12.4 $7.0 $16.5 $77.3 $9.7 $12.1 $12.4 $0.5 $3.4 $1.5 $1.3 New York California Texas Illinois Arizona Michigan Florida Washington Ohio New Jersey JPMorgan Chase Washington Mutual |
 WaMu integration update Integrate branch system Close fewer than 10% of combined branches Optimize staffing in the branches Convert Washington Mutual branches to Chase’s platform Bring best sales and business practices to each Leverage Washington Mutual branch footprint for growth Introduce enhanced product offerings Build out Business Banking (for small business clients) Build out Middle Market Benefits Private Bank and Private Client Services Consumer lending Run-off existing home lending and sub-prime credit card portfolios Exit all non-bank branch retail lending Future originations to Chase standards Integrate mortgage servicing Integration plan generates top and bottom line growth Current View the Same Cautious 21 |
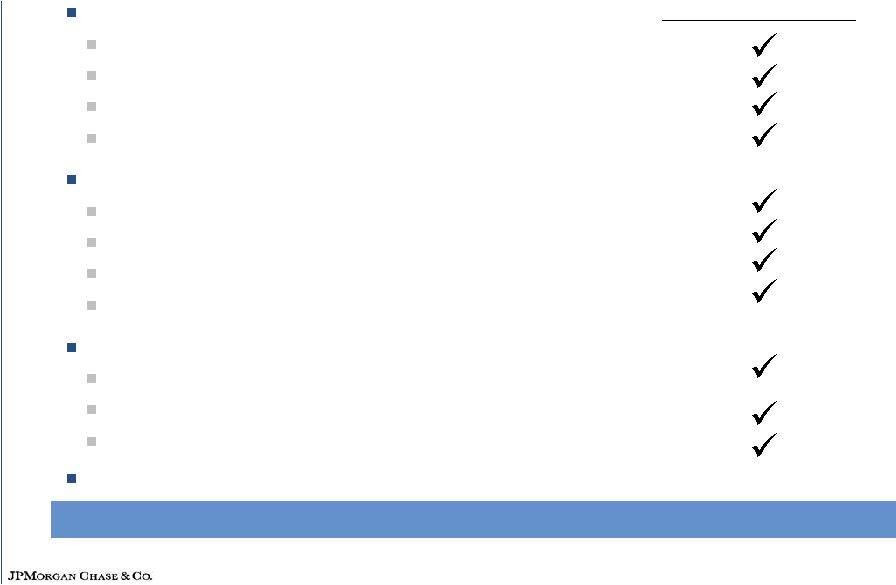
 WaMu integration update — on track People Senior management decisions within first 5 days Management teams announced across all staff and businesses On track for full people decisions by December 1 st Branches Conversion timeline to be complete by December 1 st All major systems converted by end of 2009 – if not sooner Business Deposit outflow reversed in first 5 days Foreclosure prevention effort announced 22 |
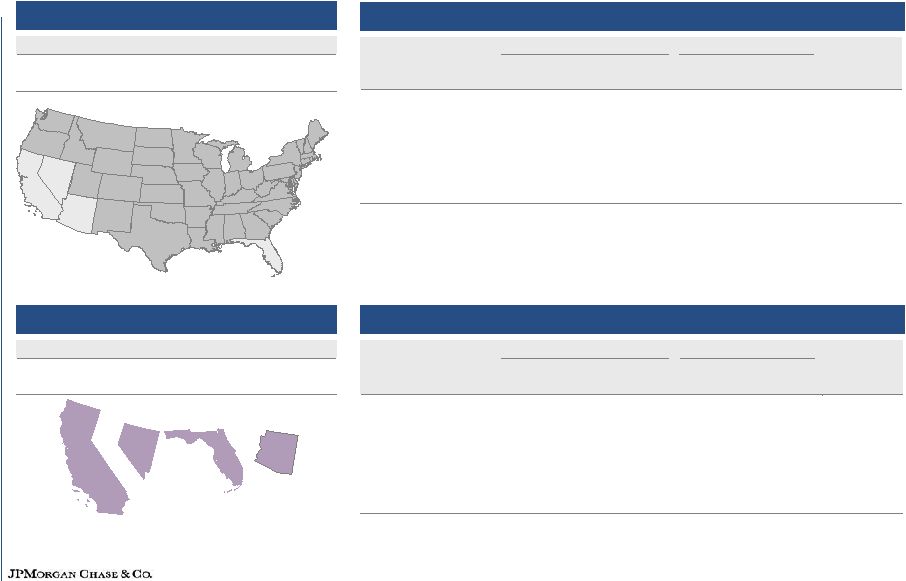    Vermont Alabama Arizona Arkansas California Colorado Connecticut Delaware Florida Georgia Idaho Illinois Indiana Iowa Kansas Kentucky Louisiana Maine Maryland Massachusetts Michigan Minnesota Mississippi Missouri Montana Nebraska Nevada New Hampshire New Jersey New Mexico New York North Carolina North Dakota Ohio Oklahoma Oregon Pennsylvania Rhode Island South Carolina South Dakota Tennessee Texas Utah Virginia Washington West Virginia Wisconsin Wyoming Impact of housing on consumer businesses Florida Arizona Florida Arizona California Nevada California Nevada 1 Source: Fiserv Lending Solutions Case-Shiller Home Price Index; based on latest data available for housing price change (data as of 2Q08) 2 Source: Bureau of Labor Statistics $ in billions $ in billions 30+ Day Delinquency Rate Net Charge-off Rate CA,NV,FL,AZ 9/30/08 9/30/07 3Q08 3Q07 3Q08 EOP Loans Home Equity 4.00% 1.60% 6.70% 1.10% $26.4 Prime Mortgage 10.20% 2.40% 3.10% 0.10% $19.3 Subprime Mortgage 29.80% 10.50% 11.00% 1.40% $4.4 Auto Finance 2.90% 1.32% 2.30% 1.08% $7.5 Business Banking 2.40% 0.60% 1.20% 0.30% $1.4 Card Services 4.90% 3.50% 7.20% 3.90% $34.3 High housing-stress states Moderate housing-stress states 23 U.S. (less CA, NV, FL, AZ) YOY Housing Price Change¹ (11.90)% September 2008 Unemployment Rate 2 5.80% CA, NV, FL, AZ YOY Housing Price Change¹ (27.90)% September 2008 Unemployment Rate 2 7.20% 30+ Day Delinquency Rate Net Charge-off Rate U.S. (less CA,NV,FL,AZ) 9/30/ 08 9/30/ 07 3Q08 3Q0 7 3Q08 EOP Loans Home Equity 2.00% 1.50% 1.30% 0.50% $68.2 Prime Mortgage 8.70% 5.50% 0.40% 0.20% $27.5 Sub prime Mortgage 25.30% 12.30% 6.70% 1.50% $8.9 Auto Finance 2.00% 1.36% 1.10% 0.90% $29.2 Business Banking 1.90% 1.60 % 1.20% 0.80% $15.1 Card Services 3.20% 3.10% 4.20% 3.50% $116.7 |
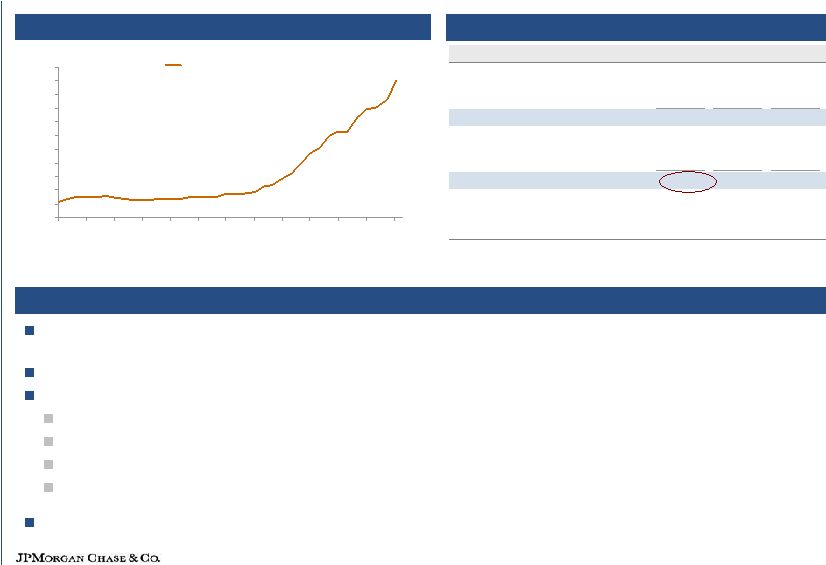
 0.00 1.00 2.00 3.00 4.00 5.00 6.00 7.00 8.00 9.00 1985 1986 1987 1988 1989 1990 1991 1992 1993 1994 1995 1996 1997 1998 1999 2000 2001 2002 2003 2004 2005 2006 2007 2008 Industry credit card NCO rate (%) U.S. unemployment rate (%) Industry credit card NCO rate¹ vs. U.S. unemployment rate² Source: Bureau of Labor Statistics; U.S. Department of Labor; Federal Reserve Note: 3Q08 NCO rate unavailable 1 Seasonally-adjusted NCO rates for U.S. commercial banks 2 Seasonally-adjusted civilian (age 16+) unemployment rates Historical trends in industry credit card net charge-offs and unemployment 24 |
 Comments on consumer credit Home equity experiencing continued deterioration; quarterly losses could be as high as $725-$850mm over the next several quarters (net charge-offs of 3.25% to 3.75%) Subprime mortgage quarterly losses could be as high as $375-$425mm in early 2009 Prime mortgage deterioration within prior range; quarterly losses could be as high as $300mm in early 2009 (net charge-offs of 2.25% to 2.50%) Credit card losses of approximately 5%+ in 4Q08; reasonable expectation that charge-offs will be at 6% at the start of 2009 and at 7%+ by year-end (ex. WaMu) Across all consumer credit lending portfolios, credit could deteriorate further in future depending on home prices, unemployment and the economy Likely additions to reserves in 4Q08 25 |
 Foreclosure prevention efforts – The Way Forward Systematically review the entire mortgage portfolio to determine proactively which homeowners are most likely to require help – and try to provide it before they are unable to make payments Proactively reach out to homeowners to offer pre-qualified modifications Establish 24 new regional counseling centers to provide face-to-face help Add 300 more loan counselors so that delinquent homeowners can work with the same counselor throughout the process. Will add more counselors as needed Create an independent process within Chase to review each mortgage before it is sent into foreclosure – to validate each borrower was offered appropriate modifications Will not add any more Chase owned loans into the foreclosure process while implementing enhancements Disclose and explain in plain and simple terms the refinancing or modification alternatives for each kind of loan, including using in-language communications Expand the range of alternatives offered to modify pay-option ARMs Offer discounts on or donate 500 homes to community groups or government programs Use more flexible eligibility criteria and modification terms Chase Foreclosure Prevention Program 26 |
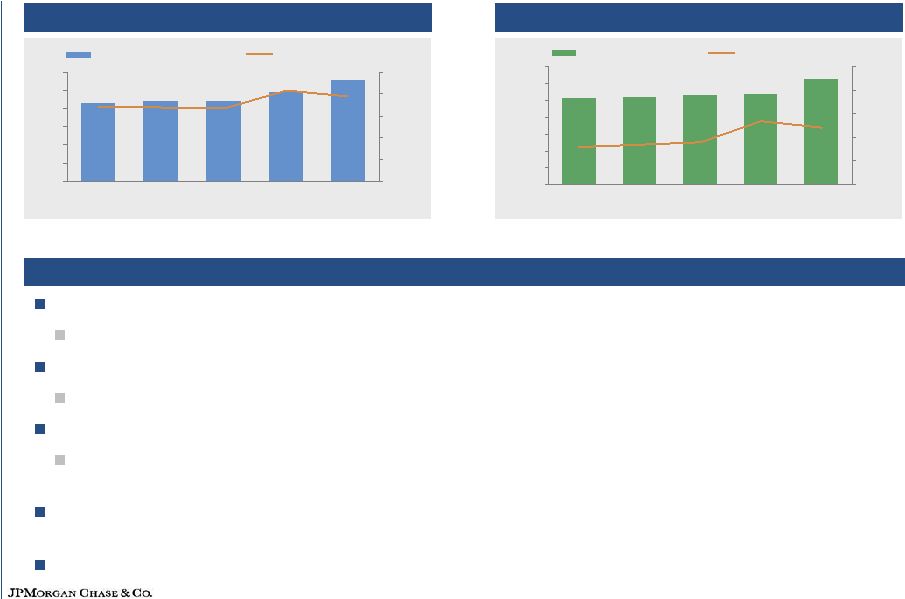
 0.00% 0.22% 0.04% 3.51% 0.22% 0.07% 0.02% 1.28% 0.11% 0.00% 0.08% 1.58% 0.00% 1.00% 2.00% 3.00% 4.00% Middle Market Mid-Corporate WaMu Real Estate Banking 1Q08 2Q08 3Q08 0.44% 0.28% 0.54% 2.44% 0.44% 0.26% 3.18% 0.38% 0.64% 0.61% 3.68% 0.65% 0.00% 1.00% 2.00% 3.00% 4.00% Middle Market Mid-Corporate WaMu Real Estate Banking 1Q08 2Q08 3Q08 3 Commercial Banking credit quality Majority of NPLs and NCOs continue to come from Real Estate Banking For September 2008 YTD in Real Estate Banking, housing comprises 97% of the NPL’s and 95% of NCO’s WaMu Commercial Term Lending credit quality in line with Middle Market and Mid-Corporate ratios Real Estate NPL YTD 9/30 Commercial RE 0.16% Housing 13.80% Real Estate NCO YTD 9/30 Commercial RE 0.12% Housing 5.79% 1, 2 1 Includes Multi-family lending, Commercial Real Estate lending and Commercial Mortgage lending 2 3Q08 data includes impact of fair value marks on purchased credit impaired loans 3 Reflects credit ratios in Real Estate Banking segment of JPMorgan Chase Total 3Q08 avg. loans $43.2B $16.5B $44.5B $7.5B Total 3Q08 avg. loans $43.2B $16.5B $44.5B $7.5B 3 1 27 1 NPL Ratio by business NCO Ratio by business |
 Allowance to loan losses coverage ratios $ in millions 1 Loan balances are on a reported basis and exclude held-for-sale loans Note: Consumer businesses reflect EOP balances, while the Wholesale businesses reflect average balances All figures are JPMorgan Chase only Firmwide total also includes Other RFS, TSS, AM and Corporate wholesale balances There will be an additional 4Q08 Card reserve build related to the WaMu credit card portfolio (already incorporated in WaMu 4Q08 guidance) 28 As of 3Q08 Loan Balances LLR LLR / Loans NCO rate Potential 4Q08 Reserve Build Home Lending (includes prime mortgage balances in Corporate) $ 154,825 $ 4,896 3.16 % 2.85% $1,2 00 +/- Card Services 77,565 3,951 5.09 % 5.00% $750 +/- Commercial Banking 71,901 1,905 2.65 % 0.22% $ 50 +/- Investment Bank 69,022 2,654 3.85 0.07% $400 +/- Total Firmwide $ 534,074 $14,541 2.72% 1.91% 1 % |
 86 89 90 112 99 9.2% 8.9% 8.4% 8.4% 8.3% 0 20 40 60 80 100 120 3Q07 4Q07 1Q08 2Q08 3Q08 5.0% 6.0% 7.0% 8.0% 9.0% 10.0% Tier 1 Capital Tier 1 Capital Ratio Current position 1 See note 1 on slide 38 2 3Q08 capital ratios incorporate the impact of WaMu transaction Capital management / fortress balance sheet Maintained strong capital positions Raised $11.5B of common equity on 9/30/08 Strong liquidity and funding position Well-positioned to support our clients’ needs Capital allocation to businesses updated and increased View toward future implementation of new Basel II capital rules and off-balance sheet accounting standards Funding costs charged by Treasury to businesses are constantly reviewed and updated to reflect market conditions Basel II Tier I ratio would be higher 1,029 1,052 1,076 1,261 1,079 7.7% 7.4% 6.7% 6.6% 6.8% 0 200 400 600 800 1,000 1,200 1,400 3Q07 4Q07 1Q08 2Q08 3Q08 5.0% 6.0% 7.0% 8.0% 9.0% 10.0% RWA TCE/Managed RWA¹ Tier 1 Capital under Basel I - $ in billions Risk Weighted Assets under Basel I - $ in billions 2 2 29 |
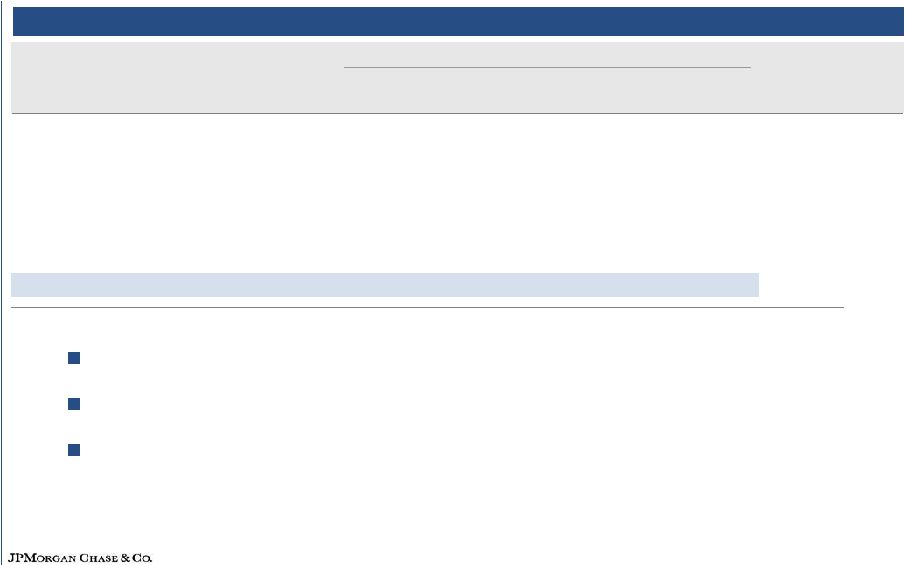
 30 Tier 1 ratio estimated at 10.8% as of 9/30/08 Continued focus on fortress balance sheet as strategic imperative TARP overview Use of TARP capital TARP impact Pro forma capital ratios Received $25B for issuance of 5% preferred shares to Department of Treasury (after 5 years, dividend rate increases to 9%) Issued to Treasury warrants to purchase 88.4mm shares of common stock; exercise price of $42.42 (50% of warrants expire if Firm raises $25B of preferred and/or common equity by 12/31/09) Future dividend increases or share repurchases subject to Treasury approval for 3 years Firm executive compensation and tax deductibility subject to certain limitations No golden parachute. No change in control FDIC guarantee on unsecured senior debt Did not need or ask for capital Asymmetric benefits to recipients Do not believe JPM should stand in the way of what is good for the system Represents excess capital which we hope to proactively put to good use for shareholders and customers (which is good for our country) Must maintain safe and sound lending Will work to be creative around uses for capital and will continue lending Must maintain a healthy and vibrant company |
 Revenue growth drivers – lending 1 Includes Other loans of $5.1B and $4.4B for 3Q08 and 3Q07 respectively 2 Represents retained loans 3 Education loans include loans held-for-sale of $1.2B and $3.2B for 3Q08 and 3Q07 respectively Note: Data reflects heritage JPMorgan Chase balances JPM continues to support client needs: Since 3Q08, Mid-Corporate and IB loans are up approximately $8.0B. Business Banking and Education loan balances have also increased Wholesale unfunded revolving commitments total approximately $300B; large potential draw on liquidity Offered to repurchase about $4B of auction rate securities Continue to originate consumer loans of all types with tightened underwriting standards (must be safe and sound) - home equity, mortgage, education and auto loans Loan balances (period averages) - $ in billions 31 3Q08 3Q07 Commercial Banking Mid-Corporate $16.5 37% Middle Market (Private Sector) 32.6 7% Real Estate 7.5 5% Government, Non-profits, and Hospitals 10.6 45% Total Commercial Banking 1 $72.3 18% Investment Bank - large corporate $69.0 11% Business Banking $16.4 11% Education loans 3 $14.1 44% O / (U) % 2 |
 Other revenue growth drivers Key metrics 1 Includes deposits and deposits swept to on-balance sheet liabilities 2 Reflects the transfer in 2007 of held-for-investment prime mortgage loans from AM to Corporate within the Corporate/Private Equity segment Good underlying momentum in core business drivers propelling organic growth across businesses 32 % Change YoY 3Q08 2Q08 1Q08 4Q07 3Q07 Retail Financial Services Regional Banking Average Deposits 2% 3% 4% 4% 10% Credit Cards Originated in Branches 6% 4% 18% 34% 59% Commercial Banking Liability Balances 1 13% 18% 22% 22% 22% Treasury and Securities Services Liability Balances 1 10% 23% 21% 30% 23% Loans 29% 18% 22% 23% 35% Assets under Custody (8%) 2% 7% 15% 21% Asset Management Assets under Management (1%) 7% 13% 18% 24% Loans 2 29% 37% 43% 13% 16% Deposits 10% 25% 24% 26% 17% Investing for the Future # of ATMs 4% 8% 8% 8% 14% # of Branches 3% 2% 2% 2% 16% # of Branch Bankers & Sales Specialists 5% 9% 21% 23% 23% |
 League table results JPMorgan IB league table performance 1 Source: Thomson Reuters 2 Global M&A market share and ranking for 2007 includes transactions withdrawn since 12/31/07 3 Source: Dealogic Note: Rankings as of 10/03/08; 2007 represents Full Year Continue to rank #1 in the four most important capital raising league tables for YTD 3Q08 Global Debt, Equity & Equity-related Global Debt Global Equity Global Loans Ranked #1 in Global Fees for YTD 3Q08 with 8.8% market share 33 Thomson Volumes 1 YTD 3Q 08 2007 Rank Share Rank Share Global M&A Announced 2 #3 24.0% #4 27.0 % Global Debt, Equity & Equity-related #1 9.7% #2 8.0 % US Debt, Equity & Equity-related #1 15.0% #2 10.0 % Global Equity & Equity-related #1 12.0% #2 9. 0% Global Converts #1 13.4% #1 15.0 % Global Long-term Debt #1 8.8% #3 7.0 % Global Investment Grade Debt #1 7.2% #2 7.2% Global High Yield Debt #1 20.8% #1 14.5% US High Yield Debt #1 21.2% #1 16.3% Global ABS (ex CDOs) #1 15.2% #1 11.5% Global Loan Syndications #1 11.7% #1 13.1% 1 3 |
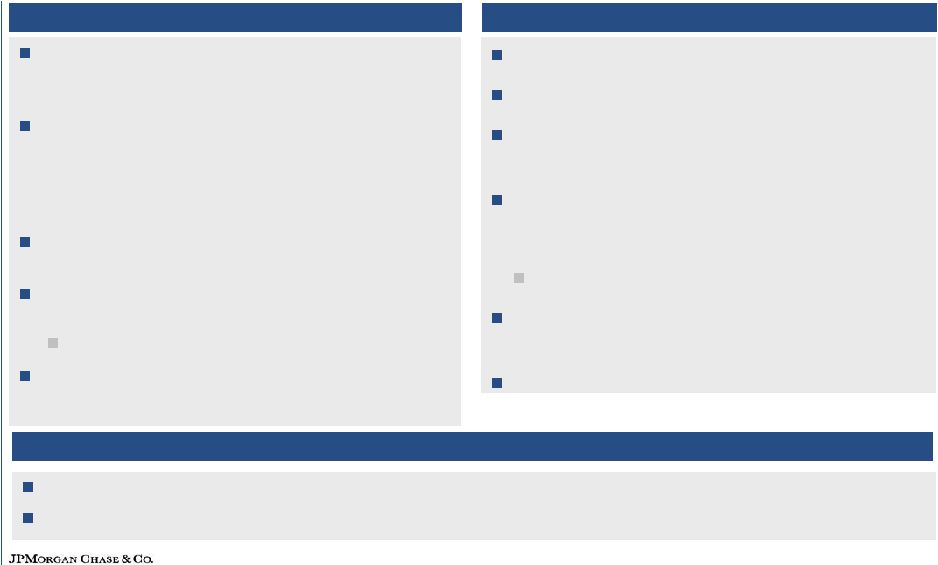
 Maintaining leadership and growing market share positions Retail Financial Services (includes WaMu) Card Services #1 in deposit market share #3 in branch network #2 in ATMs Maintained market share in mortgages and home equity at 15% in 3Q08 2 #3 in home equity originations #3 in mortgage servicing #1 in auto finance (non-captive) 4 Ranked #1 in outstandings 24% of industry outstandings 5 , up from 23% in 2Q08 (includes WaMu) Market share gains in spend volume with 3Q08 YoY sales growth of 5% amidst declines in industry levels Treasury & Securities Services Asset Management #1 in Automated Clearing House Origination 8 , CHIPS and Fedwire 9 #2 securities custodian 10 Largest hedge fund manager 11 Largest international AAA- rated liquidity fund 12 Best Emerging Markets Fund 13 1 Source: 3Q08 company reports & Wells Fargo/Wachovia press release 2 Source: Inside Mortgage Finance as of 3Q08 3 Source: Inside Mortgage Finance as of 2Q08 4 Source: Autocount (franchise), August 2008 10 Source: 3Q08 company reports 11 Absolute Return Magazine, March 2008 issue 12 iMoneyNet, December 2007 13 Investment Week, June 2007 #2 traditional middle market lender in the U.S. 6 #1 originator of multi-family loans in the U.S. 7 #2 asset-based lender in U.S. 6 Commercial Banking (includes WaMu) 5 Domestic GPCC O/S, Source: Carddata, 3Q08 company reports 6 Loan Pricing Corporation, 3Q08 YTD 7 FDIC and OTS as of 6/30/08 8 NACHA, 2008 9 Federal Reserve, 2008 34 1 1 3 3 1 |
 Comments on Environment Capital Markets Crisis Recession Critical steps taken: Central governments have provided powerful medicine to help promote financial stablitiy Problems known and being resolved, however some financial recognition still remaining Little new asset generation De-leveraging continuing Liquidity still in market We are prepared for a difficult environment Could be deep Could be worse than capital markets crisis Factors Rising unemployment: 4.8% at 10/07 to 6.5% at 10/08 Oil, housing, consumer, etc. Deep financial pressure More de-leveraging Round 2 financial effects Commercial banks’ losses growing — Recognized slower — Need to build loan loss reserves — Need for capital Investment portfolio losses More financial tightening, de-leveraging Cannot predict outcome 1 Source: Bureau of Labor Statistics, seasonally-adjusted data 35 1 1 |
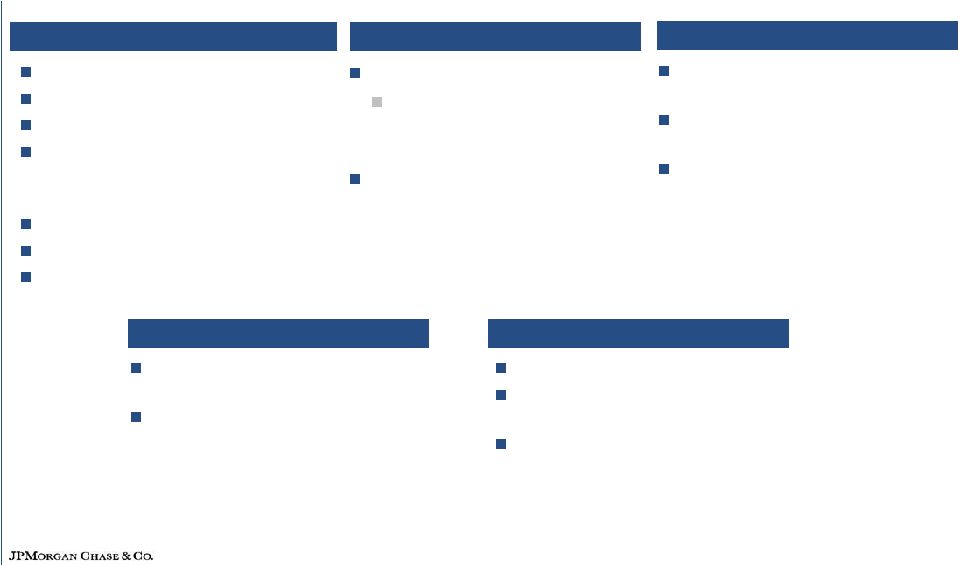
 4Q08 Outlook recap Investment Bank Retail Financial Services Card Services Treasury and Security Services Corporate/Private Equity Asset Management Commercial Banking Private Equity Expect losses of $500mm +/- Corporate Net quarterly loss of $50-$100mm on average is still reasonable except for: — Prime mortgage credit costs are incremental and deteriorating — Investment portfolio volatility Anticipate 4Q08 gain of approximately $600mm (after-tax) on 11/1/08 dissolution of Chase Paymentech JV Potential increased funding costs due to Prime/LIBOR compression Lower charge volume Expect losses of approximately 5%+ in 4Q08; reasonable expectation that charge-offs will be at 6% at the start of 2009 and at 7% + by year-end (ex. WaMu) Additions to reserves likely in 4Q08 Continued lower earnings is a reasonable expectation Higher credit costs expected; reserve additions likely Continued underlying growth, although impacted by market conditions and levels Washington Mutual Net income impact of approximately $0.50 per share in 2009, largely in RFS. 4Q08 impact of $0.10 +/-; does not include merger costs of approximately $100mm +/- (after- tax) or purchase accounting adjustments (including any additional extraordinary gain or loss) More detail to come on earnings expectations and segment disclosure Solid underlying growth See home lending credit outlook on page 25 Additions to reserves likely in 4Q08 WaMu integration well underway Good underlying growth Strong credit reserves but credit is expected to deteriorate Management and performance fees impacted by lower market levels 36 |
 Conclusions Extremely cautious on current environment; expect highly challenging conditions in 2009 Recent government actions should help stabilize the markets and restore economic growth We continue to lend and see evidence of organic growth and increased market share in our businesses; will be creative and proactive in putting TARP capital to work Fortress balance sheet positions us well during uncertain market environment WaMu merger - remain enthusiastic about great strategic fit and a unique opportunity to expand retail banking franchise; Bear Stearns integration progressing well We remain focused on navigating through this downturn by carefully managing risk while investing and growing the franchise for the long term 37 |
 This presentation includes non-GAAP financial measures. 1. TCE as used on slide 3 for purposes of a return on tangible common equity is defined as common stockholders' equity less identifiable intangible assets (other than MSRs) and goodwill. TCE as used in slide 29 in the TCE/Managed RWA ratio, which is used for purposes of a capital strength calculation, is defined as common stockholders' equity plus a portion of preferred stock and junior subordinated notes (which have certain equity-like characteristics due to their subordinated and long-term nature) less identifiable intangible assets (other than MSRs) and goodwill. For 3Q08, the identifiable intangible assets and goodwill are deducted net of deferred tax liabilities related to identifiable intangibles created in non-taxable transactions and deferred tax liabilities related to tax deductible goodwill. The latter definition of TCE is used by the firm and some analysts and creditors of the firm when analyzing the firm's capital strength. The TCE measures used in this presentation are not necessarily comparable to similarly titled measures provided by other firms due to differences in calculation methodologies. 2. Financial results are presented on a managed basis, as such basis is described in the firm’s Quarterly Report on Form 10-Q for the quarter ended September 30, 2008 and in the Annual Report on Form 10-K for the year ended December 31, 2007. 3. All non-GAAP financial measures included in this presentation are provided to assist readers in understanding certain trend information. Additional information concerning such non-GAAP financial measures can be found in the above-referenced filings, to which reference is hereby made. Notes on non-GAAP financial measures and forward-looking statements Forward looking statements This presentation contains forward-looking statements within the meaning of the Private Securities Litigation Reform Act of 1995. Such statements are based upon the current beliefs and expectations of JPMorgan Chase’s management and are subject to significant risks and uncertainties. Actual results may differ from those set forth in the forward- looking statements. Factors that could cause JPMorgan Chase’s actual results to differ materially from those described in the forward-looking statements can be found in JPMorgan Chase’s Quarterly Reports on Form 10-Q for the quarters ended March 31, 2008, June 30, 2008 and September 30, 2008, and its Annual Report on Form 10-K for the year ended December 31, 2007, each of which has been filed with the Securities and Exchange Commission and available on JPMorgan Chase’s website (www.jpmorganchase.com) and on the Securities and Exchange Commission’s website (www.sec.gov). JPMorgan Chase does not undertake to update the forward-looking statements to reflect the impact of circumstances or events that may arise after the date of the forward-looking statements. 38 |