Exhibit 99.1
2009 Investor Day Agenda
| | | | |
Presentation | | Speaker | | Start time |
Opening Remarks | | Jamie Dimon | | 8:30 a.m. |
| | |
Firm Overview | | Mike Cavanagh | | 8:45 a.m. |
| | |
Home Lending | | Charlie Scharf | | 9:00 a.m. |
| | |
Commercial Banking | | Todd Maclin | | 9:45 a.m. |
| | |
| Break | | | | 10:15 a.m. |
| | |
Card Services | | Gordon Smith | | 10:25 a.m. |
| | |
Retail Banking | | Charlie Scharf | | 11:30 a.m. |
| | |
| Lunch | | | | 12:00 p.m. |
| | |
Asset Management | | Jes Staley | | 1:15 p.m. |
| | |
Investment Bank | | Steve Black | | 1:45 p.m. |
| | |
| Break | | | | 2:20 p.m. |
| | |
Derivatives | | Bill Winters | | 2:35 p.m. |
| | |
Closing Remarks and Q&A | | Jamie Dimon | | 4:00 p.m. |
FEBRUARY 26, 2009
FIRM OVERVIEW
Mike Cavanagh, Chief Financial Officer
Overview
FIRM OVERVIEW
| | • | | 2008 net income of $6B on managed revenue of $73B |
| | • | | 1Q09 QTD results are solidly profitable; outlook is roughly in line with Analyst expectations |
| • | | Excellent franchises with great long-term prospects |
| • | | Continuous, consistent investment in growth driving substantial increase in core earnings power |
| • | | Fortress balance sheet – strong capital position, credit reserves and liquidity |
| • | | Comments on Treasury & Securities Services |
| | |
 | | 1 |
Excellent franchises position JPM well for the future
FIRM OVERVIEW
Investment Bank
• | | Continue to rank #1 in four capital raising league tables for 20081 |
| | • | | Global Debt, Equity & Equity-related |
| | • | | Global Equity & Equity-related |
| | • | | Global Loan Syndications |
• | | Ranked #1 in Global Fees for 20082with 8.8% market share |
Retail Financial Services
• | | #3 in deposit market share3 |
• | | #3 in Mortgage Originations4 |
• | | #3 in Mortgage Servicing4 |
• | | #2 in Home Equity Originations5 |
• | | #1 in Auto Finance (non-captive)6 |
Card Services
• | | #1 U.S. Credit Card Issuer (by outstandings)7 |
• | | #2 U.S. Merchant Acquirer (by acquiring volumes)7 |
• | | #1 U.S. Visa Issuer (by # of cards)7 |
• | | #2 U.S. MasterCard Issuer (by # of cards)7 |
Commercial Banking
• | | Top 3 in Large Middle-market, Traditional Middle-market and Asset Based Lending8 |
• | | #1 originator of multi-family loans in the U.S.9 |
• | | #1 ranking in CB market penetration and lead share in 3 of the top 4 MSAs10 |
Treasury & Securities Services
• | | #1 in ACH Originations11 |
• | | #1 in US Dollar Treasury Clearing and Commercial Payments12 |
Asset Management
• | | Largest manager of AAA-rated global liquidity funds13 |
• | | Largest Hedge Fund manager14 |
Businesses operate stronger together than apart
3 | Source: SNL Corporation; market share data as of June 2008, updated for subsequent acquisitions for all banks through January 2009. Includes deposits in domestic offices (50 states and D.C.), Puerto Rico and U.S. Territories only and non-retail branches are not included |
4 | Source: Inside Mortgage Finance, 4Q08 |
5 | Source: Inside Mortgage Finance, 3Q08 |
6 | Source: Autocount (franchise), December 2008 |
7 | Source: Nilson Reports. Merchant Acquirer data adjusted for dissolution of First Data JV |
8 | Loan Pricing Corporation, FY08 |
9 | FDIC and OTS as of 9/30/08 |
10 | TNS Market Study, 3Q08 YTD |
12 | AsianInvestor, Global Pensions, Inter-national Custody and Fund Administration, The Asset |
13 | iMoneyNet, December 2008 |
14 | Absolute Return Magazine, September 2008 issue |
| | |
 | | 2 |
Consistently investing in revenue growth
FIRM OVERVIEW
| • | | Good underlying momentum in core business drivers propelling organic growth across businesses |
Growth Drivers ($ in billions)
| | | | | | | | | | | | | | | | | | | |
| | | 2004 | | 2005 | | 2006 | | 2007 | | 2008 | | | 2004-2008
CAGR | |
Investment Bank | | | | | | | | | | | | | | | | | | | |
IB Fees ($mm) | | $ | 3,671 | | $ | 4,096 | | $ | 5,537 | | $ | 6,616 | | $ | 5,907 | | | 13 | % |
Advisory ($mm) | | | 939 | | | 1,263 | | | 1,659 | | | 2,273 | | | 2,008 | | | 21 | % |
Equity and Debt Underwriting ($mm) | | | 2,732 | | | 2,833 | | | 3,878 | | | 4,343 | | | 3,899 | | | 9 | % |
Equity Markets ($mm) | | | 1,704 | | | 1,998 | | | 3,458 | | | 3,903 | | | 3,611 | | | 21 | % |
International Revenue ($mm) | | | 5,985 | | | 6,648 | | | 9,232 | | | 10,005 | | | 9,684 | | | 13 | % |
Retail Financial Services | | | | | | | | | | | | | | | | | | | |
Retail Banking Average Deposits | | $ | 171.8 | | $ | 175.3 | | $ | 189.9 | | $ | 206.7 | | $ | 244.6 | | | 9 | % |
# of ATMs | | | 6,650 | | | 7,312 | | | 8,506 | | | 9,186 | | | 14,568 | | | 22 | % |
# of Branches | | | 2,508 | | | 2,641 | | | 3,079 | | | 3,152 | | | 5,474 | | | 22 | % |
# of Branch Bankers & Sales Specialists | | | 8,388 | | | 10,281 | | | 11,187 | | | 13,755 | | | 21,486 | | | 27 | % |
Credit Cards Originated in Branches | | | 408,794 | | | 666,387 | | | 1,152,166 | | | 1,420,884 | | | 1,707,072 | | | 43 | % |
Card Services | | | | | | | | | | | | | | | | | | | |
Average Outstandings | | $ | 128.8 | | $ | 136.4 | | $ | 141.1 | | $ | 149.3 | | $ | 162.9 | | | 6 | % |
Charge Volume | | $ | 282.7 | | $ | 301.9 | | $ | 339.6 | | $ | 354.6 | | $ | 368.9 | | | 7 | % |
Sales Volume | | $ | 218.1 | | $ | 233.7 | | $ | 267.6 | | $ | 292.1 | | $ | 309.7 | | | 9 | % |
# of New accts opened (000’s) | | | 9,697 | | | 11,362 | | | 15,870 | | | 16,152 | | | 14,910 | 1 | | 11 | % |
Note: 2004 data is presented on an unaudited pro forma combined basis that represents how the financial information of JPMorgan Chase & Co. and Bank One Corporation may have appeared had the two companies been merged for the full year
1 | Excludes approximately 13 million credit card accounts acquired in the WaMu transaction |
| | |
 | | 3 |
Consistently investing in revenue growth
FIRM OVERVIEW
Growth Drivers ($ in billions)
| | | | | | | | | | | | | | | | | | |
| | | 2004 | | 2005 | | 2006 | | 2007 | | 2008 | | 2004-2008
CAGR | |
Commercial Banking | | | | | | | | | | | | | | | | | | |
IB Revenue, Gross1($mm) | | | NA | | $ | 552 | | $ | 716 | | $ | 888 | | $ | 966 | | 21 | % |
Liability Balances2 | | $ | 62.6 | | $ | 66.1 | | $ | 73.6 | | $ | 87.7 | | $ | 103.1 | | 13 | % |
Loans | | $ | 46.3 | | $ | 48.1 | | $ | 53.6 | | $ | 61.1 | | $ | 82.3 | | 15 | % |
Treasury and Securities Services | | | | | | | | | | | | | | | | | | |
Liability Balances2 | | $ | 135.0 | | $ | 154.7 | | $ | 189.5 | | $ | 228.9 | | $ | 279.8 | | 20 | % |
Assets under Custody ($T) | | $ | 9.3 | | $ | 10.7 | | $ | 13.9 | | $ | 15.9 | | $ | 13.2 | | 9 | % |
Asset Management | | | | | | | | | | | | | | | | | | |
Assets under Management | | $ | 791 | | $ | 847 | | $ | 1,013 | | $ | 1,193 | | $ | 1,133 | | 9 | % |
Loans3 | | $ | 25.1 | | $ | 26.6 | | $ | 26.5 | | $ | 29.5 | | $ | 38.1 | | 11 | % |
Deposits | | $ | 38.6 | | $ | 42.1 | | $ | 50.6 | | $ | 58.9 | | $ | 70.2 | | 16 | % |
Note: 2004 data is presented on an unaudited pro forma combined basis that represents how the financial information of JPMorgan Chase & Co. and Bank One Corporation may have appeared had the two companies been merged for the full year
1 | Represents total revenue related to investment banking products sold to Commercial Banking clients. CAGR is calculated for the period 2005-2008 |
2 | Includes deposits and deposits swept to on-balance sheet liabilities |
3 | Reflects the transfer in 2007 of held-for-investment prime mortgage loans from AM to Corporate within the Corporate/Private Equity segment |
| | |
 | | 4 |
Substantial earnings power continues to grow
FIRM OVERVIEW
Pretax preprovision profit ($ in billions)
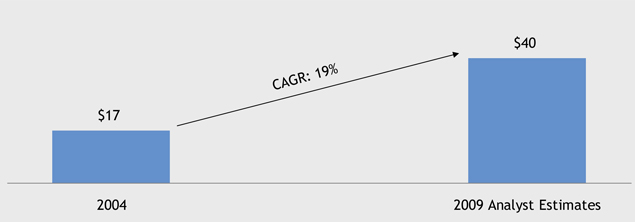
| • | | Solid earnings power helps counter impact of current economic environment |
| • | | Organic earnings growth trajectory will continue; reap benefits when credit costs abate |
| | |
 | | 5 |
Substantially increased loan loss reserves, maintaining strong coverage ratios
FIRM OVERVIEW
Loan Loss Reserves to Total Loans1,2 ($ in millions)

1 | Excluding held-for-sale and loans at fair value |
2 | Excludes the impact of purchased credit impaired loans accounted for under SOP 03-3 that were acquired as part of the Washington Mutual transaction. These loans were accounted for at fair value on the acquisition date, which reflected expected cash flows (including credit losses), over the remaining life of the portfolio. Accordingly no charge-offs and no allowance for loan losses has been recorded for these loans. If these loans were included, the loan loss reserve ratio at 4Q08 and 3Q08 would have been 3.18% and 2.56%, respectively |
Loan Loss Reserves to NPLs3,4 ($ in millions)

3 | Excluding held-for-sale and loans at fair value |
4 | Excludes purchased credit impaired loans accounted for under SOP 03-03 that were acquired as part of the Washington Mutual transaction |
| | |
 | | 6 |
Naturally strong liquidity position across our businesses
FIRM OVERVIEW
| • | | Total deposits of $1.0T across retail and wholesale businesses |
4Q08 Customer deposits versus loans ($ in billions)
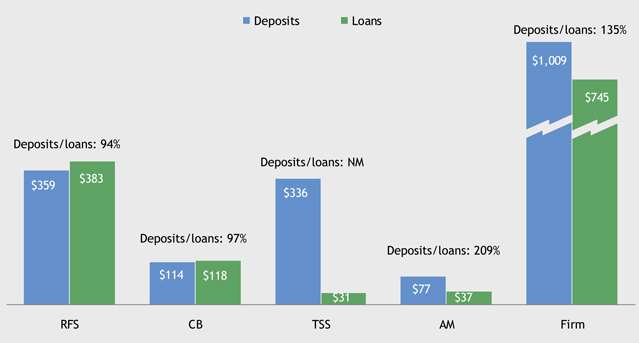
Note: Line of business data reflects average balances. Firm data is end-of-period. The Firm total includes the remaining lines of businesses (IB and Card)
| | |
 | | 7 |
Fortress capital position
FIRM OVERVIEW
($ in billions)
| | | | | | | | | | | | |
| | | 2006 | | | 2007 | | | 2008 | |
Tier 1 Capital1 | | $ | 81 | | | $ | 89 | | | $ | 136 | |
Tangible Common Equity2 | | $ | 63 | | | $ | 72 | | | $ | 81 | |
Tier 1 Capital Ratio1 | | | 8.7 | % | | | 8.4 | % | | | 10.9 | % |
Tangible Common Equity/RWA2 | | | 6.8 | % | | | 6.8 | % | | | 6.5 | % |
Tangible Common Equity/Tangible Assets2 | | | 4.9 | % | | | 4.8 | % | | | 3.8 | % |
Potential Stress Environment Impact
| | | | |
| Extraordinary times call for extraordinary measures. We must necessarily be prepared to handle a highly stressed environment (although we are not predicting this) | | | | • Assumes unemployment reaching 10%+ in 2009/2010 and HPI decline of 40% peak-to-trough • Capital levels maintained while credit reserves further strengthened |
| | |
 | | 8 |
Treasury & Securities Services
FIRM OVERVIEW
($ in millions)
| | | | | | | | | | | |
| | | 2007 | | | 2008 | | | O/(U) | |
Revenue | | $ | 6,945 | | | $ | 8,134 | | | 17 | % |
Treasury Services | | | 3,013 | | | | 3,555 | | | 18 | % |
Worldwide Securities Svcs | | | 3,932 | | | | 4,579 | | | 16 | % |
Expense | | | 4,580 | | | | 5,223 | | | 14 | % |
Net Income | | $ | 1,397 | | | $ | 1,767 | | | 26 | % |
Key Statistics | | | | | | | | | | | |
Avg Liability Balances ($B)1 | | $ | 228.9 | | | $ | 279.8 | | | 22 | % |
Assets under Custody ($T) | | $ | 15.9 | | | $ | 13.2 | | | (17 | )% |
| | | |
Pretax Margin | | | 32 | % | | | 33 | % | | | |
ROE2 | | | 47 | % | | | 47 | % | | | |
| | | |
TSS Firmwide Revenue | | $ | 9,565 | | | $ | 11,081 | | | 16 | % |
TS Firmwide Revenue | | $ | 5,633 | | | $ | 6,502 | | | 15 | % |
TSS Firmwide Avg Liab Bal ($B)1 | | $ | 316.7 | | | $ | 382.9 | | | 21 | % |
EOP Equity ($B) | | $ | 3.0 | | | $ | 4.5 | | | | |
Leadership Positions
• | | #1 in ACH Originations3 |
• | | #1 in US Dollar Treasury Clearing and Commercial Payments4 |
• | | Named top Global Custodian5 |
• | | Received more than 110 best in class recognitions6 |
• | | Named European Cash Management Provider of the Year7 |
• | | Best Cash Management Specialist8 |
1 | Includes deposits and deposits swept to on-balance sheet liabilities |
2 | Calculated based on average equity. Average equity was $3.8B and $3.0B for 2008 and 2007, respectively |
5 | AsianInvestor, Global Pensions, International Custody and Fund Administration, The Asset |
7 | International Custody, Fund Administration |
| | |
 | | 9 |
Strengths of Treasury & Securities Services
FIRM OVERVIEW
| • | | World class market leading franchise |
| • | | Record 2008 net income of $1.8B has more than doubled since 2005 |
| | • | | Approximately 50% of revenue is related to international businesses |
| • | | High return, low capital intensity, scale advantages |
| • | | Stable, annuity-like revenue stream - consistent growth in liability balances strongly linked to core cash and custody operating services |
| • | | Significant client and platform leverage across the entire firm (IB, RFS, Card, CB AM, Corporate) |
| | |
 | | 10 |
APPENDIX
FIRM OVERVIEW
| | |
 | | 11 |
Investment Bank
FIRM OVERVIEW
($ in millions)
| | | | | | | | | | | |
| | | 2007 | | | 2008 | | | O/(U) | |
Revenue | | $ | 18,170 | | | $ | 12,214 | | | (33 | )% |
Investment Banking Fees | | | 6,616 | | | | 5,907 | | | (11 | )% |
Fixed Income Markets | | | 6,339 | | | | 1,957 | | | (69 | )% |
Equity Markets | | | 3,903 | | | | 3,611 | | | (7 | )% |
Credit Portfolio | | | 1,312 | | | | 739 | | | (44 | )% |
Credit Costs | | | 654 | | | | 2,015 | | | 208 | % |
Expense | | | 13,074 | | | | 13,844 | | | 6 | % |
Net Income | | $ | 3,139 | | | $ | (1,175 | ) | | NM | |
Key Statistics | | | | | | | | | | | |
Overhead Ratio | | | 72 | % | | | 113 | % | | | |
Comp/Revenue | | | 44 | % | | | 63 | % | | | |
| | | |
ALL / Total Loans | | | 2.14 | % | | | 4.71 | % | | | |
NPLs ($mm) | | $ | 353 | | | $ | 1,175 | | | 233 | % |
| | | |
ROE1 | | | 15 | % | | | (5 | )% | | | |
VAR ($mm)2 | | $ | 106 | | | $ | 202 | | | | |
EOP Equity ($B) | | $ | 21.0 | | | $ | 33.0 | | | | |
Leadership Positions
| • | | RiskBank Risk Manager of the Year |
• | | Continue to rank #1 in four capital raising league tables for 20083 |
| | • | | Global Debt, Equity & Equity-related |
| | • | | Global Equity & Equity-related |
| | • | | Global Loan Syndications |
• | | Ranked #1 in Global Fees for 20084 with 8.8% market share |
1 | Calculated based on average equity. Average equity was $26.1B and $21.0B for 2008 and 2007, respectively |
2 | Average Trading and Credit Portfolio VAR |
| | |
 | | 12 |
Retail Financial Services — Drivers
FIRM OVERVIEW
($ in millions)
| | | | | | | | | | | |
| | | 2007 | | | 2008 | | | O/(U) | |
Retail Financial Services | | | | | | | | | | | |
Net Income | | $ | 2,925 | | | $ | 880 | | | (70 | )% |
ROE1 | | | 18 | % | | | 5 | % | | | |
EOP Equity ($B) | | $ | 16 | | | $ | 25 | | | | |
Retail Banking | | | | | | | | | | | |
Net Interest Income | | $ | 6,193 | | | $ | 7,659 | | | 24 | % |
Noninterest Revenue | | $ | 3,763 | | | $ | 4,951 | | | 32 | % |
| | | | | | | | | | | |
Total Revenue | | $ | 9,956 | | | $ | 12,610 | | | 27 | % |
Credit Costs | | $ | 79 | | | $ | 449 | | | 468 | % |
Expense | | $ | 6,166 | | | $ | 7,232 | | | 17 | % |
Net Income | | $ | 2,245 | | | $ | 2,982 | | | 33 | % |
Consumer Lending | | | | | | | | | | | |
Net Interest Income | | $ | 4,333 | | | $ | 6,506 | | | 50 | % |
Noninterest Revenue | | $ | 3,016 | | | $ | 4,404 | | | 46 | % |
| | | | | | | | | | | |
Total Revenue | | $ | 7,349 | | | $ | 10,910 | | | 48 | % |
Credit Costs | | $ | 2,531 | | | $ | 9,456 | | | 274 | % |
Expense | | $ | 3,739 | | | $ | 4,845 | | | 30 | % |
Net Income | | $ | 680 | | | $ | (2,102 | ) | | NM | |
Leadership Positions
• | | #3 in deposit market share2 |
• | | #1 in Auto Finance (non-captive)4 |
• | | #2 in Home Equity Originations5 |
• | | #3 in Mortgage Servicing6 |
• | | #3 in Mortgage Originations6 |
• | | 12.0% market share in Mortgage Originations6 |
1 | Calculated based on average equity. Average equity was $19.0B and $16.0B for 2008 and 2007, respectively |
2 | Source: SNL Corporation; market share data as of June 2008, updated for subsequent acquisitions for all banks through January 2009. Includes deposits in domestic offices (50 states and D.C.), Puerto Rico and U.S. Territories only and non-retail branches are not included |
3 | Source: 4Q08 company reports |
4 | Source: Autocount (franchise), December 2008 |
5 | Source: Inside Mortgage Finance, 3Q08 |
6 | Source: Inside Mortgage Finance, 4Q08 |
| | |
 | | 13 |
Card Services (Managed)
FIRM OVERVIEW
($ in millions)
| | | | | | | | | | | |
| | | 2007 | | | 2008 | | | O/(U) | |
Revenue | | $ | 15,235 | | | $ | 16,474 | | | 8 | % |
Credit Costs | | $ | 5,711 | | | $ | 10,059 | | | 76 | % |
Expense | | $ | 4,914 | | | $ | 5,140 | | | 5 | % |
Net Income | | $ | 2,919 | | | $ | 780 | | | (73 | )% |
Key Statistics Incl. WaMu ($B) | | | | | | | | | | | |
ROO (pretax) | | | 3.09 | % | | | 0.78 | % | | | |
ROE1 | | | 21 | % | | | 5 | % | | | |
EOP Equity | | $ | 14.1 | | | $ | 15.0 | | | | |
| | | |
Key Statistics Excl. WaMu ($B) | | | | | | | | | | | |
Avg Outstandings | | $ | 149.3 | | | $ | 155.9 | | | 4 | % |
EOP Outstandings | | $ | 157.1 | | | $ | 162.1 | | | 3 | % |
Charge Volume | | $ | 354.6 | | | $ | 361.1 | | | 2 | % |
Net Accts Opened (mm) | | $ | 16.4 | | | $ | 14.4 | | | (12 | )% |
Managed Margin | | | 8.16 | % | | | 8.16 | % | | | |
Net Charge-Off Rate | | | 3.68 | % | | | 4.92 | % | | | |
30+Day Delinquency Rate | | | 3.48 | % | | | 4.36 | % | | | |
Industry Outstandings2 — 12/31/08

Note: Financial results are presented on a managed basis
1 | Calculated based on average equity. Average equity was $14.3B and $14.1B for 2008 and 2007, respectively |
2 | Domestic GPCC O/S, Source: 4Q08 Company reports. Bank of America data for U.S. consumer and small business card has been estimated since that disclosure was discontinued starting Q3’08; Citi GPCC data has been estimated as it no longer breaks out GPCC receivables; Cap One new US Card segment data includes US Consumer Credit Card, Small Business Card and Installment loans |
3 | Chase market share data includes WaMu receivables |
| | |
 | | 14 |
Commercial Banking
FIRM OVERVIEW
($ in millions)
| | | | | | | | | | | |
| | | 2007 | | | 2008 | | | O/(U) | |
Revenue | | $ | 4,103 | | | $ | 4,777 | | | 16 | % |
Middle Market Banking | | | 2,689 | | | | 2,939 | | | 9 | % |
Commercial Term Lending | | | — | | | | 243 | | | NM | |
Mid-Corporate Banking | | | 815 | | | | 921 | | | 13 | % |
Real Estate Banking | | | 421 | | | | 413 | | | (2 | )% |
Other | | | 178 | | | | 261 | | | 47 | % |
Credit Costs | | | 279 | | | | 464 | | | 66 | % |
Expense | | | 1,958 | | | | 1,946 | | | (1 | )% |
Net Income | | $ | 1,134 | | | $ | 1,439 | | | 27 | % |
Key Statistics | | | | | | | | | | | |
Avg Loans & Leases ($B) | | $ | 61.1 | | | $ | 82.3 | | | 35 | % |
Avg Liability Balances ($B)1 | | $ | 87.7 | | | $ | 103.1 | | | 18 | % |
| | | |
Overhead Ratio | | | 48 | % | | | 41 | % | | | |
Net Charge-Off Rate | | | 0.07 | % | | | 0.35 | % | | | |
| | | |
ALL / Average Loans | | | 2.81 | % | | | 3.04 | % | | | |
| | | |
NPLs ($mm) | | $ | 146 | | | $ | 1,026 | | | NM | |
| | | |
ROE2 | | | 17 | % | | | 20 | % | | | |
EOP Equity ($B) | | $ | 6.7 | | | $ | 8.0 | | | | |
Leadership Positions
• | | Top 3 in Large Middle-market, Traditional Middle-market and Asset Based Lending3 |
• | | #1 originator of multi-family loans in the U.S.4 |
• | | #1 ranking in CB market penetration and lead share in 3 of the top 4 MSAs5 |
1 | Includes deposits and deposits swept to on-balance sheet liabilities |
2 | Calculated based on average equity. Average equity was $7.3B and $6.5B for 2008 and 2007, respectively |
3 | Loan Pricing Corporation, FY08 |
4 | FDIC and OTS as of 9/30/08 |
5 | TNS Market Study, 3Q08 YTD |
| | |
 | | 15 |
Asset Management
FIRM OVERVIEW
($ in millions)
| | | | | | | | | | | |
| | | 2007 | | | 2008 | | | O/(U) | |
Revenue | | $ | 8,635 | | | $ | 7,584 | | | (12 | )% |
Private Bank | | | 2,362 | | | | 2,565 | | | 9 | % |
Institutional | | | 2,525 | | | | 1,775 | | | (30 | )% |
Retail | | | 2,408 | | | | 1,620 | | | (33 | )% |
Private Wealth Management | | | 1,340 | | | | 1,387 | | | 4 | % |
Bear Stearns Brokerage | | | — | | | | 237 | | | NM | |
Credit Costs | | | (18 | ) | | | 85 | | | NM | |
Expense | | | 5,515 | | | | 5,298 | | | (4 | )% |
Net Income | | $ | 1,966 | | | $ | 1,357 | | | (31 | )% |
Key Statistics ($B) | | | | | | | | | | | |
Assets under Management1 | | $ | 1,193 | | | $ | 1,133 | | | (5 | )% |
Assets under Supervision1 | | $ | 1,572 | | | $ | 1,496 | | | (5 | )% |
| | | |
Average Loans2 | | $ | 29.5 | | | $ | 38.1 | | | 29 | % |
Average Deposits | | $ | 58.9 | | | $ | 70.2 | | | 19 | % |
| | | |
Pretax Margin | | | 36 | % | | | 29 | % | | | |
ROE3 | | | 51 | % | | | 24 | % | | | |
EOP Equity | | $ | 4.0 | | | $ | 7.0 | | | | |
Leadership Positions
• | | Largest manager of AAA-rated global liquidity funds4 |
• | | Largest Hedge Fund manager5 |
• | | % of AUM in 1st and 2nd Quartiles6 |
• | | 42% of customer assets in 4 & 5 star funds in 20087 |
1 | Reflects $15B for assets under management and $68B for assets under supervision from the Bear Stearns merger on May 30, 2008 |
2 | Reflects the transfer commencing in 1Q07 of held-for-investment prime mortgage loans from AM to Corporate within the Corporate/Private Equity segment |
3 | Calculated based on average equity. Average equity was $5.6B and $3.9B for 2008 and 2007, respectively |
4 | iMoneyNet, December 2008 |
5 | Absolute Return Magazine, September 2008 issue |
6 | Quartile rankings sourced from Lipper for the U.S. & Taiwan; Micropal for the UK, Luxembourg, & Hong Kong; & Nomura for Japan |
7 | Derived from Morningstar for the U.S.; Micropal for the UK, Luxembourg, Hong Kong, & Taiwan; & Nomura for Japan |
| | |
 | | 16 |
Corporate/Private Equity
FIRM OVERVIEW
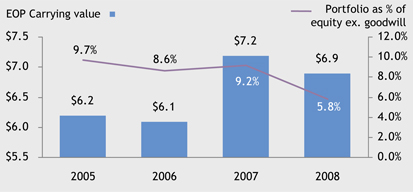
Corporate/Private Equity Net Income ($ millions)
| | | | | | | | | | | |
| | | 2007 | | | 2008 | | | O/(U) | |
Private Equity | | $ | 2,165 | | | $ | (690 | ) | | NM | |
| | | |
Corporate | | | (150 | ) | | | 1,458 | | | NM | |
| | | |
Merger-related items | | | (130 | ) | | | (211 | ) | | NM | |
| | | |
Net Income | | $ | 1,885 | | | $ | 557 | | | (70 | )% |
Private Equity Portfolio ($ in billions)
| | |
 | | 17 |
Notes on non-GAAP financial measures
FIRM OVERVIEW
This presentation includes non-GAAP financial measures
| 1. | Tangible Common Equity(“TCE”) as shown on slide 8, is defined as common stockholders’ equity less identifiable intangible assets (other than MSRs) and goodwill. The TCE measures used in this presentation are not necessarily comparable to similarly titled measures provided by other firms due to differences in calculation methodologies. |
| 2. | Financial results are presented on a managed basis, as such basis is described in the firm’s Quarterly Report on Form 10-Q for the quarter ended September 30, 2008 and in the Annual Report on Form 10-K for the year ended December 31, 2007. |
| 3. | All non-GAAP financial measures included in this presentation are provided to assist readers in understanding certain trend information. Additional information concerning such non-GAAP financial measures can be found in the above-referenced filings, to which reference is hereby made. |
| | |
 | | 18 |
FEBRUARY 26, 2009
HOME LENDING
Charlie Scharf, Retail Financial Services Chief Executive Officer
Agenda
HOME LENDING
| | |
| | | Page |
Home Lending | | 1 |
| |
Home Equity | | 9 |
| |
Prime Mortgage | | 25 |
| |
Subprime Mortgage | | 33 |
| |
Other Items | | 36 |
| | |
 | | 1 |
Home lending portfolio
HOME LENDING
Outstandings as of 12/31/08 ($ in billions)
| | | | | | | | | | | | | | | | | | | |
Portfolio | | Total Loans | | Chase | | + | | WaMu: Non-Credit-
Impaired | | = | | Total: Non-Credit-
Impaired | | WaMu: Credit-
Impaired |
Home Equity | | $ | 154.1 | | $ | 94.0 | | | | $ | 20.3 | | | | $ | 114.3 | | $ | 39.8 |
Option ARM | | | 50.6 | | | — | | | | | 9.0 | | | | | 9.0 | | | 41.6 |
Prime Mortgage | | | 97.3 | | | 47.4 | | | | | 24.9 | | | | | 72.3 | | | 25.0 |
Subprime Mortgage | | | 25.6 | | | 12.7 | | | | | 2.6 | | | | | 15.3 | | | 10.3 |
| | | | | | | | | | | | | | | | | | | |
Total Portfolio | | $ | 327.6 | | $ | 154.1 | | | | $ | 56.8 | | | | $ | 210.9 | | $ | 116.7 |
| • | | Total outstandings ~$328B |
| | • | | Non-Credit-Impaired ~$211B (64%) |
| | • | | Credit-Impaired ~$117B (36%) |
Notes: Credit impaired represents UPB not book value; excludes prime mortgage loans classified as held-for-sale
| | |
 | | 2 |
Home lending portfolio
HOME LENDING
Outstandings as of 12/31/08 ($ in billions)
| | | | | | | | | | | | | | | | | | | | | | | | |
Portfolio | | Total Loans | | | Chase | | | + | | WaMu: Non-Credit-
Impaired | | | = | | Total: Non-Credit-
Impaired | | | WaMu: Credit-
Impaired | |
Total Portfolio | | $ | 327.6 | | | $ | 154.1 | | | | | $ | 56.8 | | | | | $ | 210.9 | | | $ | 116.7 | |
| | | | | | | |
Loan Loss Reserve | | $ | 7.5 | | | $ | 6.6 | | | | | $ | 0.9 | | | | | $ | 7.5 | | | | NA | |
| | | | | | | |
Fair Value Mark Remaining | | $ | 27.9 | | | | NA | | | | | | NA | | | | | | NA | | | $ | 27.9 | |
| | | | | | | |
LLR as % of Loans | | | 2.3 | % | | | 4.3 | % | | | | | 1.6 | % | | | | | 3.6 | % | | | NA | |
Fair Value Mark % of Loans | | | NA | | | | NA | | | | | | NA | | | | | | NA | | | | 24 | % |
| • | | LLR against Non-Credit-Impaired |
| • | | Fair Value Mark against Credit-Impaired - $88.8B net book value |
Notes: Mark remaining as of Dec-08
| | |
 | | 3 |
WaMu home lending portfolio — overview
HOME LENDING
Outstandings as of 12/31/08 ($ in billions)

| • | | 67% of WaMu portfolio Credit-Impaired |
| • | | Fair Value Mark 24% of Credit-Impaired Balances |
1 | Percent markdown of credit impaired UPB at 12/31/08, Outstandings represent UPB not Book Value |
| | |
 | | 4 |
WaMu home lending portfolio — key characteristics
HOME LENDING
Key Credit Statistics
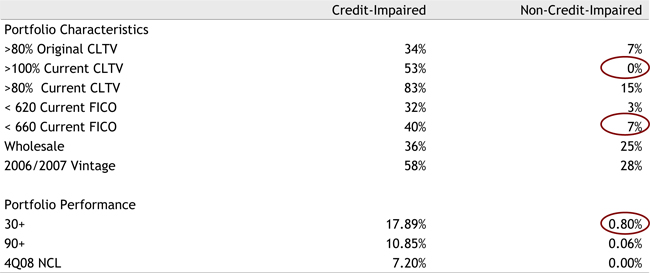
| • | | Credit-Impaired includes majority of high risk assets |
| • | | Non-Credit-Impaired has very low delinquency and no losses in 4Q08 |
| | |
 | | 5 |
WaMu home lending portfolio — loss sensitivities
HOME LENDING
Loss Sensitivities
| | | | | | | | | | | | |
Peak to Trough HPI1 | | | (31 | )% | | | (36 | )% | | | (41 | )% |
| | | |
Remaining Lifetime Losses2From Sept 25, 2008 | | $ | 30-36B | | | $ | 32-38B | | | $ | 34-40B | |
| | | |
% Losses from Credit Impaired | | | 94 | % | | | 93 | % | | | 92 | % |
• | | The initial mark reflects $32.5B2 of remaining life losses beyond September 25, 2008 |
| • | | We have not yet experienced losses beyond initial expectations |
| • | | Additions to loan loss reserves would be required if and when delinquency and loss experience exceeds our initial expectations |
1 | Home Price Index, Moody’s/Economy.com Case-Shiller and JPMC Estimates |
2 | For the entire WaMu portfolio (both credit impaired and non-credit impaired) |
| | |
 | | 6 |
NonCredit impaired portfolio performance
HOME LENDING
Key Credit Statistics
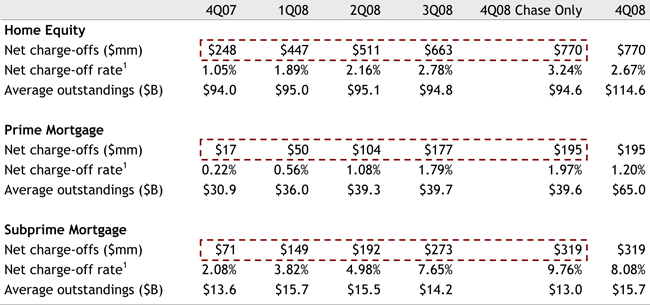
1 | Loans held-for-sale and loans accounted for at fair value under SFAS 159 were excluded when calculating the net charge-off rates |
| | |
 | | 7 |
Agenda
HOME LENDING
| | |
| | | Page |
Home Lending | | 1 |
| |
Home Equity | | 9 |
• Heritage Chase only | | |
| |
Prime Mortgage | | 25 |
| |
Subprime Mortgage | | 33 |
| |
Other Items | | 36 |
In the following pages, primarilyHeritage Chasestatistics are shown to provide a clear picture of portfolio performance
| | |
 | | 8 |
Home equity performance
HOME EQUITY
30+ Delinquency Rate

| • | | Delinquencies continue to grow |
| • | | Very low WaMu Non-Credit-Impaired delinquency - reduces overall rate |
| | |
 | | 9 |
Home equity performance
HOME EQUITY
NCO $ Rate (annualized)
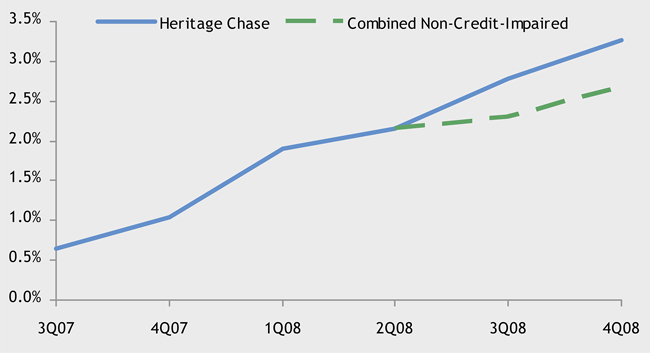
| • | | Losses continue to grow |
| • | | No WaMu Non-Credit-Impaired losses through 4Q08 – reduces overall rate |
| | |
 | | 10 |
Home equity losses — deposit customers by current CLTV
HOME EQUITY
2008 NCL Rate (annualized)
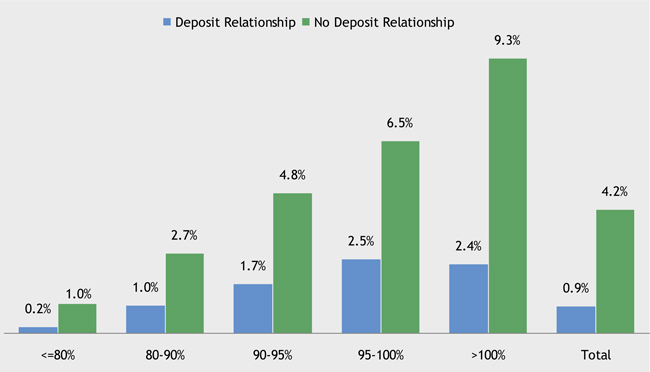
| • | | Deposit customers have significantly lower loss rates across all CLTV segments |
Note: As ECLTV not available on charge off accounts, used ECLTV at Dec-07 to bucket charge off accounts
| | |
 | | 11 |
Home equity portfolio by CLTV & FICO at origination
HOME EQUITY
Outstanding as of 12/31/08 ($ in billions)
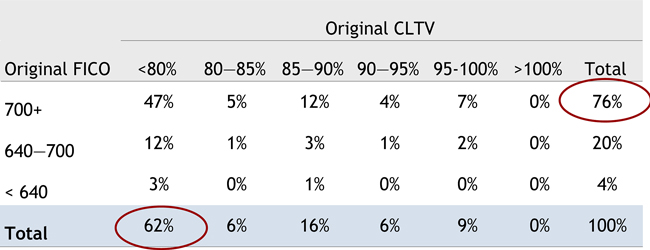
| • | | 15% of portfolio originated at 90-100 CLTV |
| • | | Majority of originations low LTV, high FICO |
| | |
 | | 12 |
Home equity performance by original CLTV
HOME EQUITY
2008 Losses (Rates Annualized) – ($ in billions)

| • | | 90-100% CLTV generating 55% of losses |
| • | | Losses growing across all original CLTV bands |
| • | | High losses even in lower original CLTV segments |
| | |
 | | 13 |
Home equity portfolio estimated CLTV >100%
HOME EQUITY
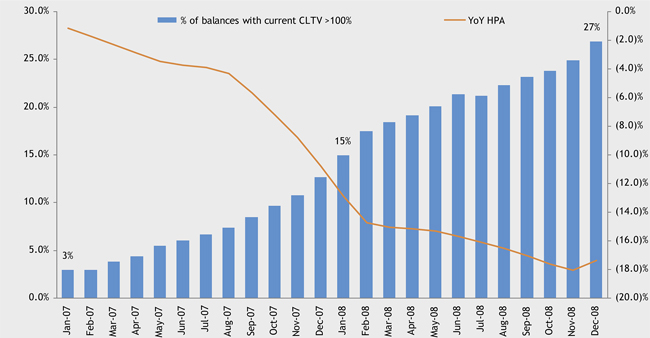
Note: Current CLTV defined as total line balance as a % of current home value estimated by applying Economy.com MSA level HPA estimates as of 12/31/08
Prime Home Equity Only
| | |
 | | 14 |
Home equity losses by current CLTV
HOME EQUITY
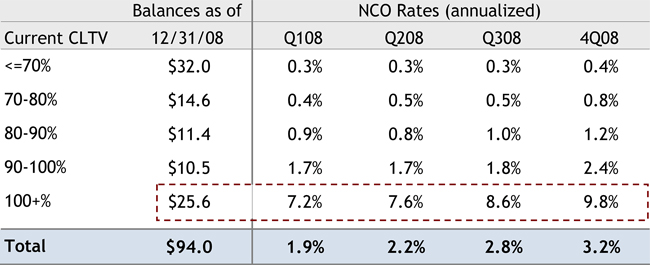
| • | | Highest loss rates for 100%+ Current CLTV |
| • | | Losses in lower Current CLTV bands growing as unemployment rises |
| | |
 | | 15 |
Home equity losses by current CLTV
HOME EQUITY
4Q08 Loss Rates (annualized)
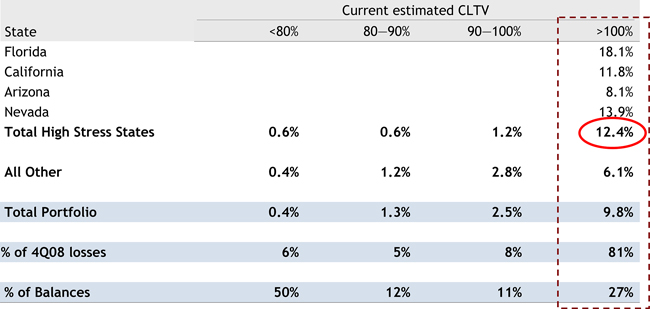
| • | | Losses highest in states with most severe declines in house prices |
Note: Current CLTV defined as total line balance as a % of current home value estimated by applying Economy.com MSA level HPA estimates as of 12/31/08
Loss rates are annualized
| | |
 | | 16 |
Home equity losses by current CLTV
HOME EQUITY
NCO ($ in millions)
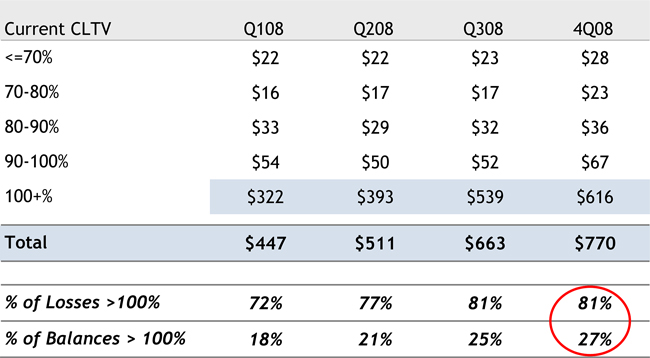
| • | | Majority of losses from 100%+ Current CLTV |
| | |
 | | 17 |
Home equity loss rates following migration to >100% CLTV
HOME EQUITY
Annualized Loss Rates
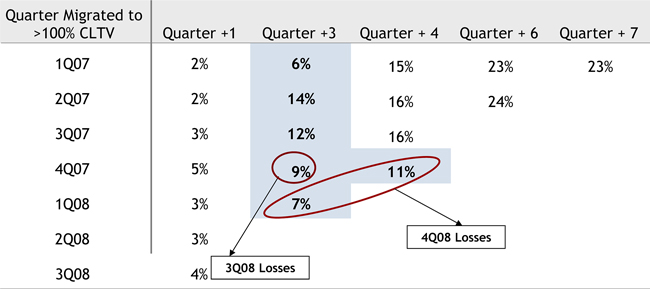
| • | | Relatively consistent credit deterioration in the older vintages |
| • | | Newer vintages could perform better |
| | |
 | | 18 |
Home equity balances migrating to >100% CLTV
HOME EQUITY
($ in billions)
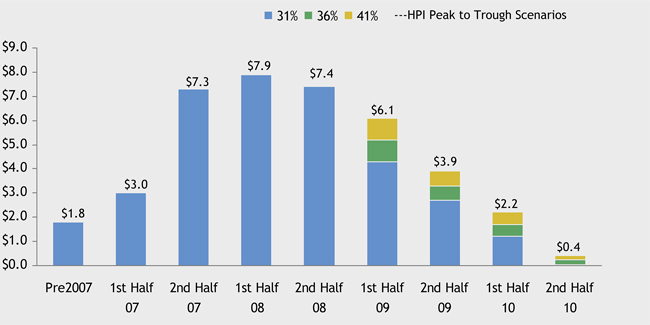
| • | | 27% of the portfolio >100% CLTV as of end of 2008 |
| • | | Based on HPI Peak to Trough range of 31-41% |
| | • | | 35-39% of the portfolio estimated to be >100% CLTV at the end of 2009 |
| | • | | 36-41% of the portfolio estimated to be >100% CLTV at the end of 2010 |
Note: Home Price Index, Moody’s/Economy.com Case-Shiller Forecast and JPM Estimates
| | |
 | | 19 |
Home equity losses when exceed >100% CLTV
HOME EQUITY
($ in millions)
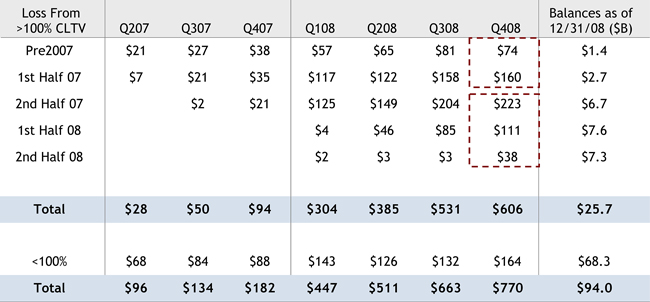
• | | Pre-2007 and 1st Half 2007 appear to have peaked |
• | | 2nd Half 2007 and 2008 will grow |
| | |
 | | 20 |
Home equity unemployment effect
HOME EQUITY
| | | | | | | | | | | |
Current CLTV | | Change in
Unemployment | | Change in
Delinquency | | | Delinquency
Increase per
1pt Increase in
Unemployment | | | Loss
Effect |
<80% | | 1.2pts | | 20 | % | | 17 | % | | $ | 40mm |
80-100% | | 1.0pts | | 47 | % | | 47 | % | | $ | 150mm |
>100% | | 3.3pts | | 36 | % | | 11 | % | | | — |
| • | | Unemployment appears to be driving losses below 100% CLTV |
| • | | Does not appear to be meaningful over 100% CLTV as HPA is the primary driver |
Note: The time period for the changes reflected above are Jan-08 to Dec-08
| | |
 | | 21 |
Prime home equity
HOME EQUITY
Originations Profile
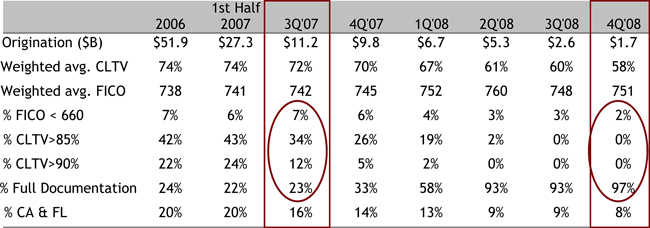
| • | | Significant reduction in risk |
| | • | | Minimal volume in FICO under 700 |
| | • | | No loans > 85% CLTV and only 1% over 80%. 73% are <=70% |
Note: CLTV = Combined-Loan-to-Value. This metric represents how much equity the borrower has in the property
CLTV and FICO at origination
Construction and Private Banking loans are included in Full Documentation
Does not include Bulk Loan Purchases
| | |
 | | 22 |
Home equity portfolio outlook
HOME EQUITY
| • | | Fewer balances will migrate to >100% CLTV going forward |
| • | | Losses are expected to grow for loans that recently migrated to >100% CLTV |
| • | | It is unclear if loss rates for loans that recently migrated to >100% CLTV will grow as high as older vintages |
| • | | Unemployment likely to impact <100 CLTV, but it will be less meaningful than HPA changes |
| • | | Quarterly losses expected to be $1B to $1.4B for Non-Credit-Impaired in 2009 |
| • | | Losses are expected to level off, but remain high in 2010 if current loss rate trends continue |
| | |
 | | 23 |
Agenda
HOME LENDING
| | |
| | | Page |
| |
| Home Lending | | 1 |
| |
| Home Equity | | 9 |
| |
| Prime Mortgage | | 25 |
| |
• Heritage Chase only | | |
| |
| Subprime Mortgage | | 33 |
| |
| Other Items | | 36 |
In the following pages, primarilyHeritage Chasestatistics are shown to provide a clear picture of portfolio performance
| | |
 | | 24 |
2008 prime mortgage performance
PRIME MORTGAGE
30+ Delinquency Rate
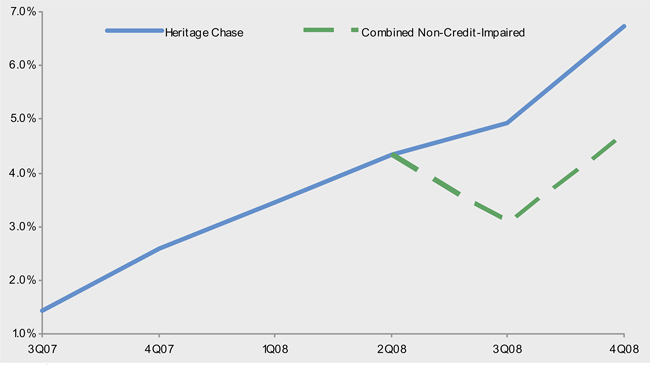
| • | | Delinquencies continue to grow |
| • | | Very low WaMu Non-Credit-Impaired delinquency - reduces overall rate |
| | |
 | | 25 |
2008 prime mortgage performance
PRIME MORTGAGE
NCO $ Rate (Annualized)
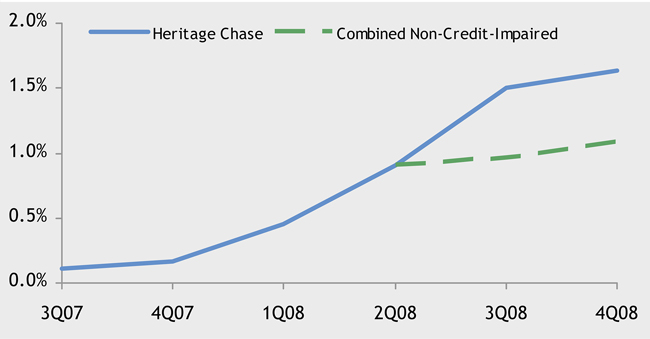
| • | | Losses continue to grow |
| • | | No WaMu Non-Credit-Impaired losses to date – reduces overall rate |
| • | | Quarterly losses could be as high as $375-$475mm over next several quarters |
| | |
 | | 26 |
Prime mortgage losses by vintage
PRIME MORTGAGE
Vintage Breakdown as of 4Q08
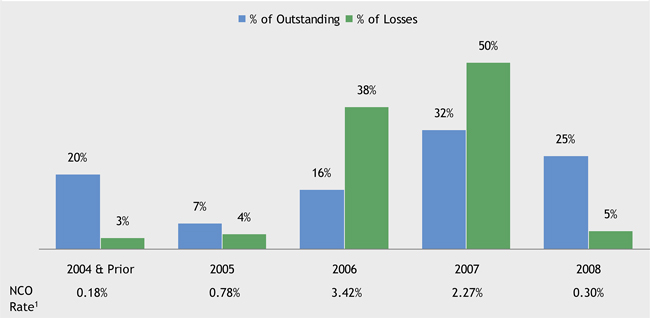
| • | | 2006 and 2007 vintages generate 88% of losses |
1 | Loss rates are annualized |
Note: Does not include $25mm in losses that are GL adjustments and cannot be attributed to a vintage
| | |
 | | 27 |
Prime mortgage losses by geography
PRIME MORTGAGE
Geographic Breakdown as of 4Q08
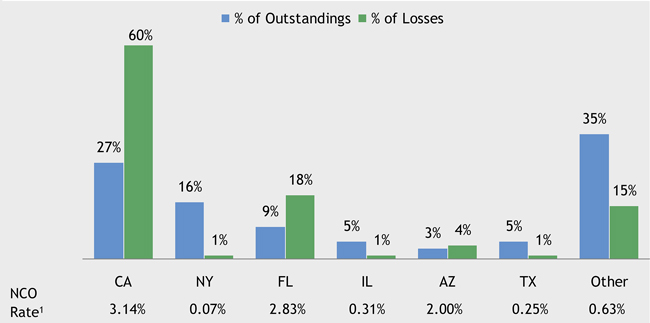
| • | | California and Florida generate 78% of losses |
1 | Loss rates are annualized |
Note: Does not include $25mm in losses that are GL adjustments and cannot be attributed to a state
| | |
 | | 28 |
Prime mortgage losses by channel
PRIME MORTGAGE
Channel Breakdown as of 4Q08
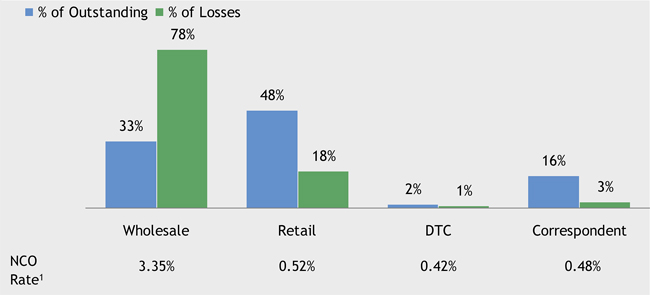
| • | | Wholesale channel generates 78% of losses; exited the entire channel |
Note: Does not include $25mm in losses that are GL adjustments and cannot be attributed to a channel
| | |
 | | 29 |
Prime mortgage losses — deposit customers by geography
PRIME MORTGAGE
2008 NCO Rate (Annualized)
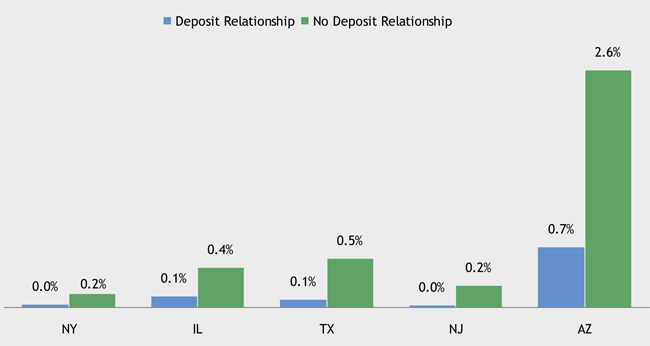
| • | | Deposit customers perform better across all geographies |
| | |
 | | 30 |
Prime mortgage nonagency jumbo
PRIME MORTGAGE
Originations Profile
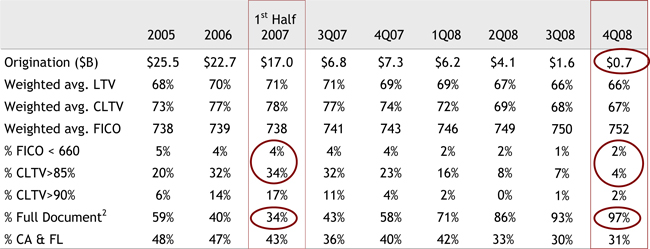
| • | | Migration to higher FICO, Full Documentation and lower LTV / CLTV Loans |
Note:
CLTV = Combined-Loan-to-Value. This metric represents how much equity the borrower has in the property
CLTV and FICO at origination
Construction and Private Banking loans are included in Full Doc
Does not include Bulk Loan Purchases
| | |
 | | 31 |
Agenda
HOME LENDING
| | |
| | | Page |
Home Lending | | 1 |
| |
Home Equity | | 9 |
| |
Prime Mortgage | | 25 |
| |
Subprime Mortgage | | 33 |
• Heritage Chase only | | |
| |
Other Items | | 36 |
In the following pages, primarilyHeritage Chasestatistics are shown to provide a clear picture of portfolio performance
| | |
 | | 32 |
2008 subprime performance
SUBPRIME MORTGAGE
30+ Delinquency Rate
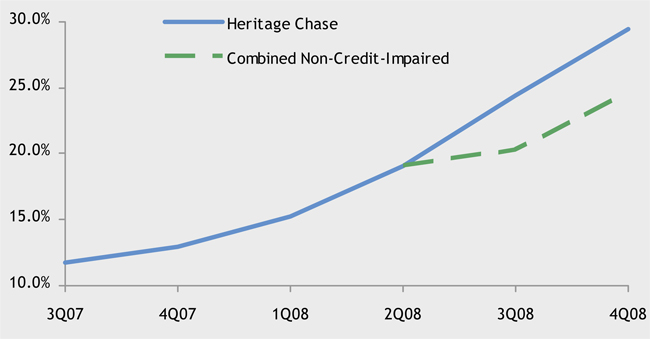
| • | | Delinquencies continue to grow |
| • | | Very low WaMu Non-Credit-Impaired delinquency - reduces overall rate |
| | |
 | | 33 |
2008 subprime performance
SUBPRIME MORTGAGE
NCO $ Rate (Annualized)
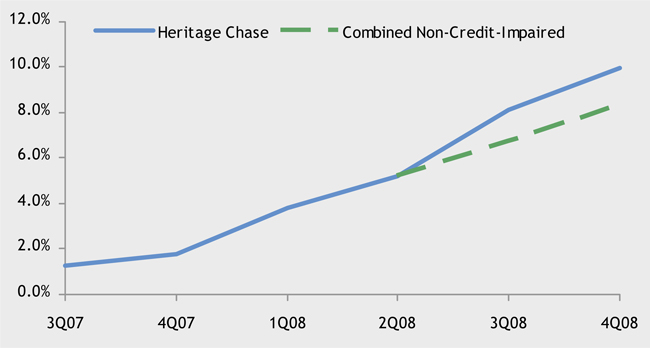
| • | | Losses continue to grow |
| • | | No WaMu Non-Credit-Impaired losses to date - reduces overall rate |
| • | | Quarterly losses could be as high as $375-$475mm over next several quarters |
| | |
 | | 34 |
Agenda
HOME LENDING
| | |
| | | Page |
Home Lending | | 1 |
| |
Home Equity | | 9 |
| |
Prime Mortgage | | 25 |
| |
Subprime Mortgage | | 33 |
| |
Other Items | | 36 |
| | |
 | | 35 |
Chase owned REO sales — California vs Florida
OTHER ITEMS
California

Florida

| • | | Early signs of stabilization in CA |
| • | | No positive trend in FL |
| | |
 | | 36 |
Loan modification re-performance
OTHER ITEMS
90+ Delinquency Performance after 6 Months (Chase+WaMu)
| | | | | | | | | | | | |
| | | 1Q08 | | 2Q08 |
| | | Imminent Default
With Income
Verification | | Loss Mitigation
With Income
Verification | | Loss Mitigation
Without Income
Verification | | Imminent Default
With Income
Verification | | Loss Mitigation
With Income
Verification | | Loss Mitigation
Without Income
Verification |
Owned | | 1.6% | | 15.9% | | 25.7% | | 4.0% | | 15.7% | | 26.4% |
| | | | | | |
Serviced | | 4.6% | | 11.5% | | 24.7% | | 4.4% | | 11.0% | | 26.1% |
| | | | | | |
Total | | 4.3% | | 13.1% | | 24.9% | | 4.3% | | 12.4% | | 26.2% |
Note: Numerator: 90+, REO and charged off accounts by month after modification (excludes pay off)
Denominator: All completed modifications during observation month. Includes all loans where loss mit activities have been completed, except for loans that were not brought current in the 3 months following mod completion due to op issues/timing
| | |
 | | 37 |
Home Lending Point of View
OTHER ITEMS
| • | | Mortgage banking has been and will always be a complex management challenge. |
| • | | Losses will continue to grow as newer vintages mature |
| | • | | Very important relationship product |
| | • | | We have scale in bank branches to distribute — primary focus |
| | • | | Correspondent will add to scale — focus only on retail originations |
| • | | Properly done - expect reasonable Returns |
| | |
 | | 38 |
FEBRUARY 26, 2009
COMMERCIAL BANKING
Todd Maclin, Commercial Banking Chief Executive Officer
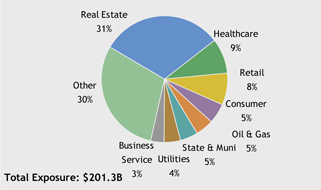
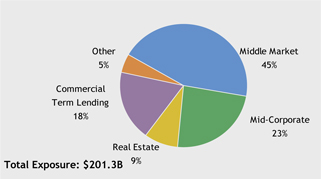
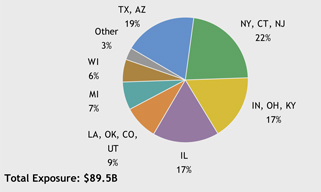
Strategy: lower credit risk/high portfolio diversity
COMMERCIAL BANKING
Highlights
| • | | Geographic and industry diversity- Middle Market & Mid-Corporate (68% of CB portfolio) |
| • | | Limited exposure to leveraged acquisition finance and highly leveraged companies (2% of CB portfolio) |
| • | | Pre-WaMu, Real Estate represented only 12% of CB exposure |
| | • | | Increased to 31% with WaMu, a highly granular, term loan portfolio |
Exposure by Industry (12/31/08)
Exposure by Business (12/31/08)
Middle Market Exposure by Geography (12/31/08)
| | |
 | | 1 |
Strategy: portfolio granularity
COMMERCIAL BANKING
Highlights
| • | | Middle Market loans average $1.8mm (36% of CB portfolio) |
| • | | WaMu Commercial Term Lending loans average $1.1mm (31% of CB portfolio) |
| • | | 81% of all CB loans are < $20mm |
| • | | Of the $85B unused or unfunded commitments: |
| | • | | 25% are backup lines of credit or unused availability for investment grade muni-bond issuance |
| | • | | 40% are subject to borrowing base or other pre-advance funding conditions |
Maturity (12/31/08)
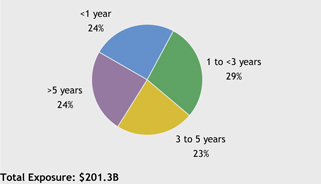
Outstandings by Loan Size (12/31/08)
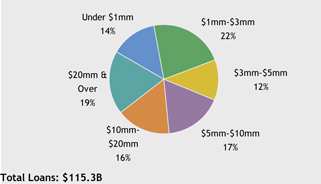
| | |
 | | 2 |
Chase CB performance against peers on key credit metrics
COMMERCIAL BANKING
Commercial NPL Ratio
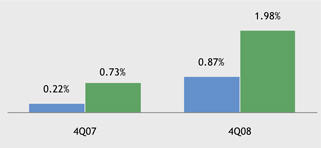
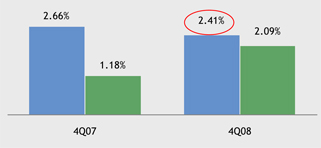
Allowance for Loan Losses to Loans Ratio
Commercial NCO Ratio
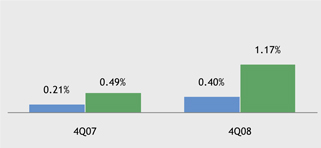

| 1 | Peer median for NPL and NCO ratios reflect commercial equivalent metrics for key competitors (BAC, CMA, FITB, KEY, PNC, STI, USB, WFC, ZION); allowance to loans ratio reflects firmwide metric when the commercial-equivalent metric is not available |
| | |
 | | 3 |
Construction and development lending is driving the problem commercial credit agenda for banks
COMMERCIAL BANKING
4Q08 NPL Ratio by Business

4Q08 NCO Ratio by Business

| | |
 | | 4 |
Chase CB real estate exposure
COMMERCIAL BANKING
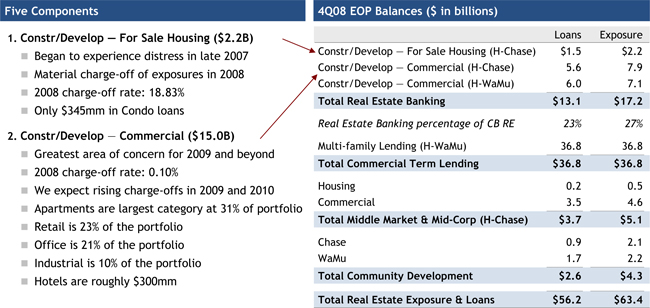
| • | | Underwriting has been adjusted for market realities |
| | • | | Curtailed lending early in 2008 and increased equity requirements and cap rates |
| | • | | Current focus is on refinancing with pay-downs /workout of existing projects |
| | • | | We expect this segment to get much worse based on leasing trends, with retail being the most troubled segment |
| | |
 | | 5 |
Chase CB real estate exposure
COMMERCIAL BANKING
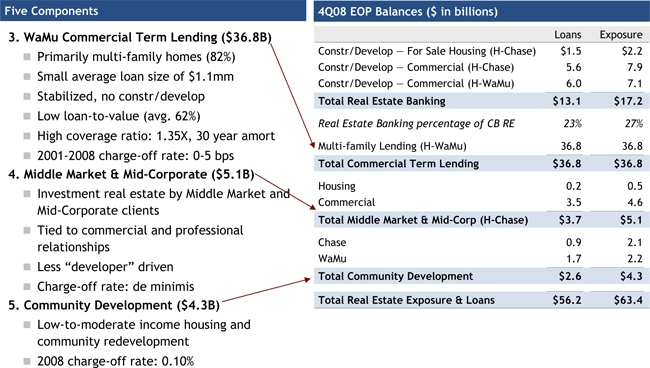
| | |
 | | 6 |
A word on WaMu . . . our Commercial Term Lending business operating model
COMMERCIAL BANKING
Overview
| • | | Borrowers: Small balance, value shoppers, seeking moderate leverage at a fair price |
| • | | Markets: Stable demand and natural supply constraints (zoning, etc.) |
| • | | Properties: Apartment units moderately priced and less volatile; the average age of the property is 53 years with a well-established rent roll |
| • | | Tenants: Renters by necessity – moderately priced housing in a good neighborhood |
Competitive Offering
| • | | Standardized Underwriting: Exclusive in-house appraisers, regimented property evaluations, and cash flow verification |
| • | | Differentiators: No legal or appraisal fees – scale allows for efficiencies |
| • | | Competitive Advantages: Competitive pricing and a fast and simple process |
| • | | Focus: Stabilized cash flows and lower leverage |
| • | | One Identified Weakness: Some limited portfolio issues in Florida and the Northeast when we deviated from this model several years ago – issue addressed prior to acquisition |
| | |
 | | 7 |
A word on WaMu . . . changes made and future opportunities
COMMERCIAL BANKING
Actions We’ve Taken in the WaMu Portfolio
| • | | Added more than $700mm of reserves to the WaMu portfolio since acquisition |
Reserves to total loans ratio up from 0.5% before closing to 2.1%
| • | | Modified WaMu’s underwriting standards to conform with Chase’s existing standards and risk appetite |
| • | | Reduced production growth targets to reduce portfolio concentration |
| • | | Right-sized the organization to reflect the current underwriting and economic realities |
| • | | Consolidated construction and development lending into Chase’s existing platform |
Middle Market Expansion Effort
| • | | Build out a Middle Market business in the expanded WaMu branch network |
| • | | 7 key markets: Los Angeles, Orange County, San Francisco, Seattle, Portland, Atlanta, and Florida |
| • | | Continue to focus on prudent client selection and full product client relationships |
| • | | Strong Chase brand and product capabilities – entering new markets as customers are examining their banking relationships |
| • | | Create a strong business for the long haul |
| | |
 | | 8 |
Other problem areas for commercial banks
CB has less exposure than most peers
COMMERCIAL BANKING
Leveraged Finance
| • | | Leveraged finance exposures $4.3B |
| | • | | 2% of portfolio; loans $2.7B |
| • | | $19mm average hold position |
| • | | No meaningful unsold, underwritten positions since the credit crisis started in mid ‘07 |
| • | | New leveraged finance transactions virtually non-existent since 1Q08 |
Retail & Discretionary Consumer
| • | | Retail exposures of $9.2B |
| | • | | 5% of portfolio; loans $4.4B |
| | • | | Non-discretionary exposure – $2.2B (food retailers, drugstores, discounters) |
| • | | Largest components: specialty stores ($3.1B) and restaurants ($2.3B): ~40% in McDonalds franchisee loans |
| • | | 23% are in asset-based lending |
| | • | | Highly structured and secured |
Highly Cyclical Industries
| • | | Construction/building materials |
| | • | | Exposures $6.7B; loans $3.1B |
| | • | | Additional $0.6B in related sectors |
| | • | | 60% tied to residential |
| | • | | Exposures $2.7B; loans $0.7B |
| | • | | Exposures $1.2B; loans $0.5B |
Automotive
| • | | Direct automotive exposures $2.8B at year-end |
| | • | | Include suppliers, dealers and aftermarket |
| • | | Additional $1.5B exposure indirectly linked (e.g. plastic, steel suppliers to the industry) |
| • | | Loans with high to medium at-risk dependency on domestic manufacturers estimated: <30% of automotive portfolio |
| • | | Actions taken over past few years to improve structure and collateral |
| | |
 | | 9 |
Government, Non-Profit, & Healthcare
A high quality credit growth opportunity
COMMERCIAL BANKING
GNPH Exposure Growth ($ in millions)

| • | | GNPH exposure is up 51% YoY; majority of exposure is A or AA-rated |
| • | | Targeted GNPH customers are state and local municipalities, non-profit and healthcare entities, and educational institutions |
| • | | Underwriting of risk isALWAYSbased upon creditworthiness of the customer — no material value given to third party insurers |
| | |
 | | 10 |
A conservative approach to credit
COMMERCIAL BANKING
Proactive Management
| • | | Took advantage of market liquidity in recent years to exit weak & unprofitable credits |
| | • | | Exited $1.5B annually from 2005-2007 |
| • | | Quarterly deep dive credit reviews with senior management |
| • | | Escalated approval of new exposures over $15mm |
| • | | Proactively discussing renewals and refinancing |
Strong Reserves and Capital
| • | | Building reserves and maintaining high loan loss coverage ratio |
| • | | Loan loss reserves to total loan ratio: 2.41% |
| | • | | Reserve ratio steady and strong through the cycle |
| • | | Loan loss reserves to nonperforming loans: 2.75x |
Stringent Focus on Recession Management
| • | | Reallocate resources (human and financial) to manage problems in existing portfolio |
| • | | Formed Problem Loan Prevention Teams |
| | • | | Led by experienced, top talent |
| • | | Engage senior management in more day-today account management decisions |
| • | | Track portfolio movement weekly and monthly to focus on emerging issues |
| • | | Dramatically cut discretionary spending |
Careful Client Selection
| • | | Continue our careful client selection – not just a reaction to the crisis |
| • | | Drive growth in high quality, low risk relationships; e.g. Government, Non-Profit & Healthcare |
| • | | Strict guidelines for pre-selecting prospects |
| • | | Eschew credit-only and/or unprofitable/risky relationships |
| | |
 | | 11 |
Near-term outlook
COMMERCIAL BANKING
| | |
Loan demand is
waning | | • Lower sales mean clients borrow less for expansion or working capital • Line usage always decreases during recessions |
| |
Strong
capital/reserves for
credit deterioration | | • Always manage the business with the expectation of cyclical credit downturns • This commercial credit cycle is going to get worse for commercial banks before it gets better |
| |
Proactive
management of
problems | | • Reassign people and resources accordingly • Early warning systems • Address problems quickly |
| |
Aggressively
managing Real
Estate concentration | | • Commercial construction and development is the area of greatest concern • Stabilized multi-family lending has lower volatility |
| |
WaMu is a good
addition | | • #1 multi-family originator in the U.S. • Branch platform to expand Commercial Banking franchise |
| | |
 | | 12 |
Why We Love this Business
COMMERCIAL BANKING
| | • | | Mostly privately-owned, multi-generational, family businesses |
| | • | | Loyal and conservative owners |
| | • | | Lots of experience managing in difficult times |
| • | | High demand for JPM’s product platform |
| | • | | Non-credit revenue represents 64% of total revenue |
| | • | | Average annual IB fee revenue growth 2005-2008: 21% |
| | • | | Loans to deposits ratio of 1.03x |
| • | | Prudent segment and client selection |
| | • | | Avoiding commercial real estate: no growth in the portfolio in the past four years |
| | • | | Avoiding leveraged loans to financial sponsors: less than 1% of total exposure |
| | • | | Pursuing GNPH segment: lower risk, improving spreads, profitable segment with high demand for non-credit products and services |
| • | | Mainstream C&I lending is more granular and better structured than large corporate lending |
| | • | | Loans generally collateralized with borrowing base advances |
| | • | | Higher standards for loan terms and financial covenants |
| • | | Significant benefits and economies of scale: |
| | • | | Non-credit expense essentially flat for three years |
| | • | | Reserves for losses maintained at the high end of the range |
| | • | | Capacity to invest in products and systems that produce deposits and non-credit revenue |
| | • | | Customer flight to quality/financial strength provides self-funding and cross-sell |
| | • | | Business that grows over time with United States |
| | |
 | | 13 |
FEBRUARY 26, 2009
CARD SERVICES
Gordon Smith, Card Services Chief Executive Officer
Agenda
CARD SERVICES
| | |
Credit environment | | 2 |
| |
Portfolio positioning | | 12 |
| |
How has Chase reacted to the environment | | 20 |
| |
Core vision and strategy | | 27 |
| |
Overcoming medium-term financial challenges | | 36 |
| |
Managing through the downturn | | 40 |
Note: All data excludes WaMu portfolio performance, unless specifically noted
| | |
 | | 1 |
Tougher credit environment
CREDIT ENVIRONMENT
| • | | We expect credit losses to materially increase in 2009 |
| • | | While we don’t predict unemployment rate, we are prepared for 9% by year-end |
| • | | Increasing deterioration in the labor market has exacerbated consumer stress, which has manifested in the form of lower payment rates |
| • | | Consumer confidence is at record lows and is having an adverse impact on sales volumes |
| • | | Accounts are rolling forward to charge-off at an accelerated pace |
| • | | Bankruptcy filings are normalizing to pre-2005 levels |
| • | | Home price depreciation stressed areas have seen a larger deterioration in credit performance |
| • | | Regions with higher unemployment rates are further impacting credit performance |
| | |
 | | 2 |
Home price depreciation was the largest driver of credit losses until mid-2008 when unemployment became a meaningful factor
CREDIT ENVIRONMENT
Net Charge-Off Rate (NCO) vs. Unemployment Rate
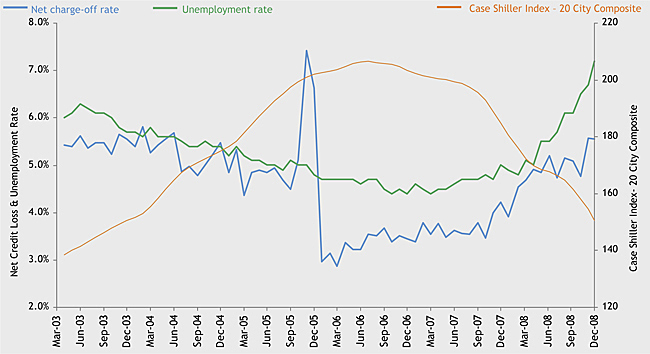
Source: Bureau of Labor Statistics for unemployment rate; S&P for Case Shiller Index data
| | |
 | | 3 |
Unemployment rate will be the primary driver of credit losses in 2009
CREDIT ENVIRONMENT
| • | | In our portfolio, the relationship between losses and unemployment has been less than 1:1 because of our prime/superprime focus, coupled with our co-brand and rewards business model |
| • | | Relationship between unemployment rate and losses has changed in this downturn due to the compounding impact of home price depreciation, equities volatility and consumer confidence |
| • | | Reaffirm our NCO outlook of 7% for 1Q09 |
| | |
4Q09 Unemployment Scenarios | | Projected 4Q09 NCO Rate1 |
8% | | 8% +/- |
9% | | 9.0% - 9.5% |
10% | | 10.0% - 10.5% |
1 | Assumes receivables are flat relative to 1Q09 |
Source: Bureau of Labor Statistics for unemployment rate
| | |
 | | 4 |
Increase in unemployment rates and home price declines has led to a marked slowdown in payment rates
CREDIT ENVIRONMENT
Unemployment vs. Chase Card Services Payment Rates
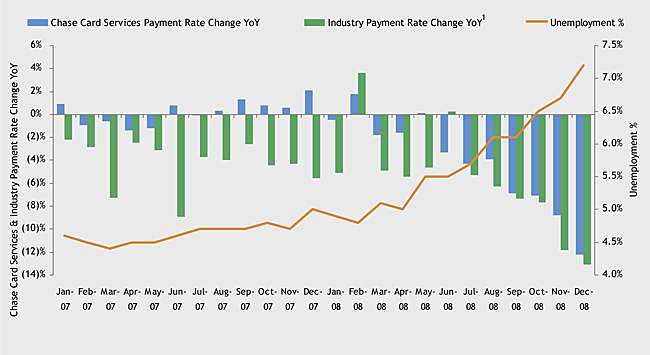
1 | Industry payment rates represent average of Chase, C, COF, BAC, AXP Lending, and DFS trusts |
Source: Bureau of Labor Statistics, Internal Chase data; SEC Trust Filings
| | |
 | | 5 |
Drop in consumer confidence has been accompanied by falling sales volumes
CREDIT ENVIRONMENT
Consumer Confidence Index vs. Sales Volumes1
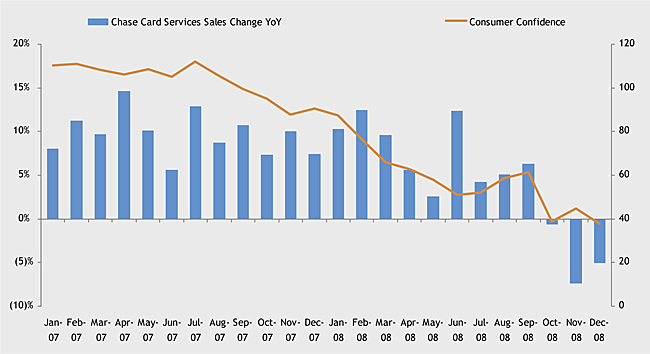
1 | Sales data excludes cash advances and balance transfers |
| Source: | Conference Board, Internal Chase data |
| | |
 | | 6 |
Accounts are rolling forward at a quicker rate with fewer curing in the delinquency buckets
CREDIT ENVIRONMENT
Current to 30 days – YoY % Change
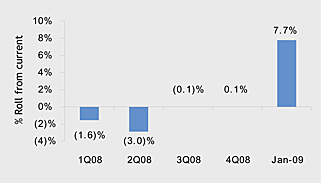
60+ days to 90 days – YoY % Change
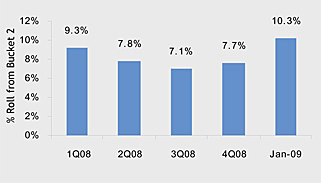
30+ days to 60 days – YoY % Change
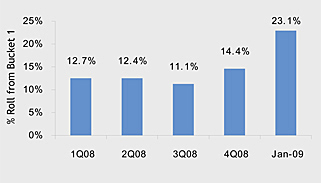
90+ days to Charge- Off – YoY % Change
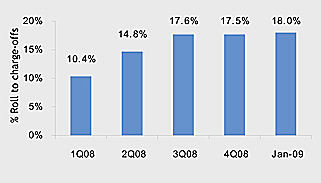
Source: Internal Chase data
| | |
 | | 7 |
Bankruptcy filings are returning to pre-2005 levels
CREDIT ENVIRONMENT
National Bankruptcy Filings ($ in millions)
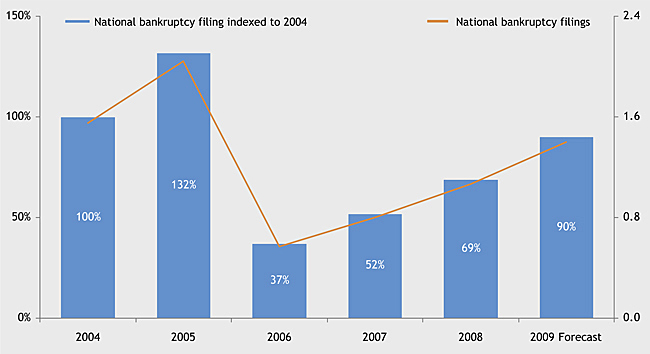
Source: Administrative office of the US Courts; Internal Chase forecast for 2009
| | |
 | | 8 |
Impact of housing on credit performance
CREDIT ENVIRONMENT
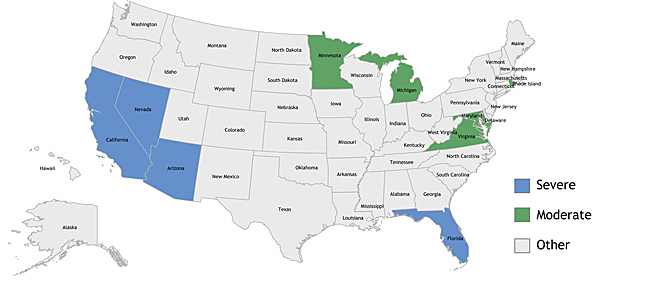
Credit Performance

Source: S&P for Case Shiller Home Price Index; based on latest state level data available for housing price change (data as of 3Q08); Internal Chase data
| | |
 | | 9 |
Impact of unemployment on credit performance
CREDIT ENVIRONMENT
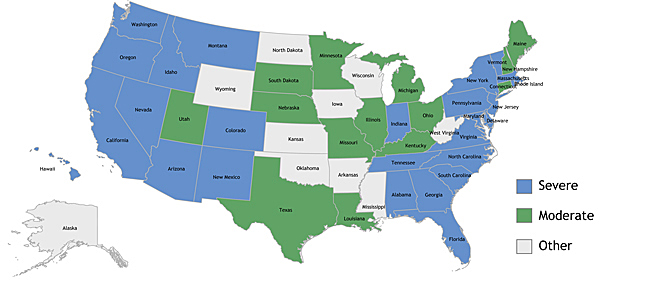
Credit Performance

Source: Bureau of Labor Statistics for Unemployment rate; Internal Chase data
| | |
 | | 10 |
Agenda
CARD SERVICES
| | |
Credit environment | | 2 |
| |
Portfolio positioning | | 12 |
| |
How has Chase reacted to the environment | | 20 |
| |
Core vision and strategy | | 27 |
| |
Overcoming medium-term financial challenges | | 36 |
| |
Managing through the downturn | | 40 |
| | |
 | | 11 |
Portfolio mix and credit capabilities are an asset, but don’t isolate us from current downturn
PORTFOLIO POSITIONING
| • | | Our increased focus on rewards and partner business has driven a positive risk selection |
| • | | Our exposure to the home price depreciation stressed areas of CA and FL is in line with peers |
| • | | We have a better risk profile relative to our peer group |
| • | | Our customers have longer credit histories relative to peer group, which translates into better credit performance |
| • | | Our portfolio has more established credit bureau profile compared to peers |
| • | | We have a higher percentage of homeowners in our portfolio relative to peers and they exhibit superior credit performance |
| | |
 | | 12 |
Increased focus on rewards and partnership business drive a positive risk selection
PORTFOLIO POSITIONING
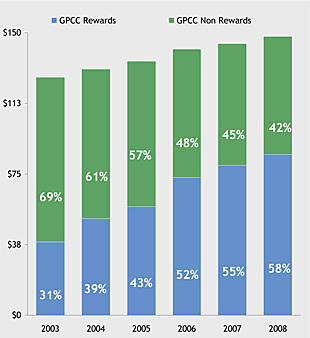
| • | | Cards with rewards have higher level of loyalty, engagement, and superior risk performance |
| • | | Rewards represented 58% of outstandings |
Rewards as % of Outstandings ($ in billions)1
4Q08 Credit Performance1
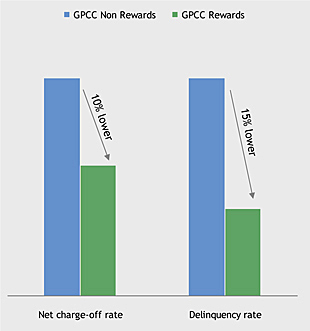
Note: GPCC = General Purpose Credit Cards
Source: Internal Chase data
1 | Excludes Retail Partner GPCC |
| | |
 | | 13 |
Portfolio positioning across peers
PORTFOLIO POSITIONING
| • | | Chase’s exposure to home price depreciation stressed regions of CA and FL is in line with peers |
Distribution of Receivables
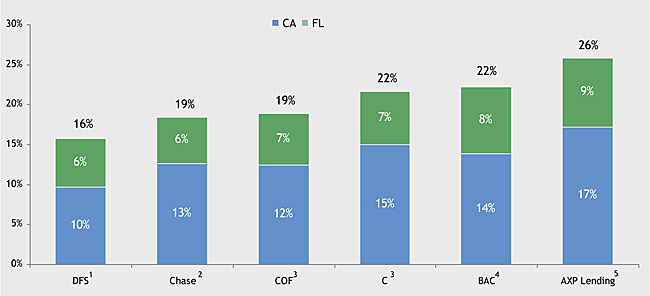
3 | COF and C data as of Mar’08 |
Source: Trust filings
| | |
 | | 14 |
FICO distribution of securitized receivables
PORTFOLIO POSITIONING
| • | | Product mix, targeting and underwriting has led to a better risk profile |
Trust Receivables – FICO< 660 or No FICO Score
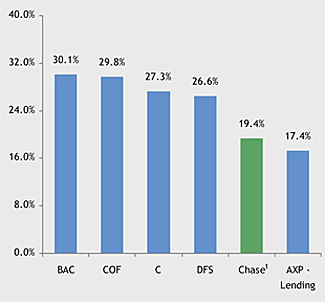
Trust Receivables – FICO>720
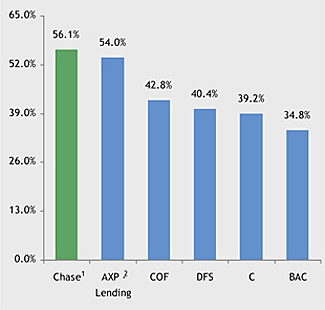
1 | Chase data as of Sep’08 represents Issuance Trust |
2 | AXP FICO>720 is based off disclosure in Fixed Income Investor Presentation |
Source: SEC Filings (C, COF – Mar’08, BAC – Jun’08; DFS – May’08; AXP – Aug’08; Chase – Sep’08); Investor Presentation
| | |
 | | 15 |
Chase profile vs. competitors and industry
PORTFOLIO POSITIONING
| • | | Chase Card Services’ customers have longer credit histories vs. the industry |
Avg. Duration of Customer Credit Profile (in Years)1
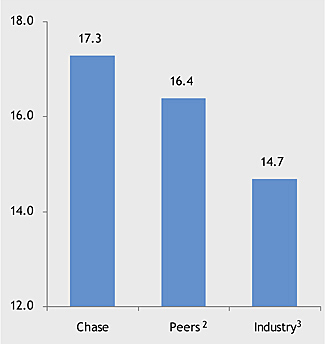
Chase 30+ % by Age of Oldest Credit Account
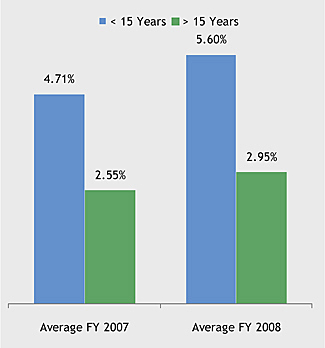
Source: Experian
2 | Peers: BAC, C, AXP, WFC, DFS |
3 | Industry is defined as all General Purpose Credit Card holders at Experian |
| | |
 | | 16 |
Chase profile vs. competitors and industry
PORTFOLIO POSITIONING
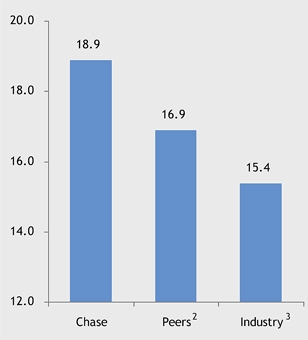
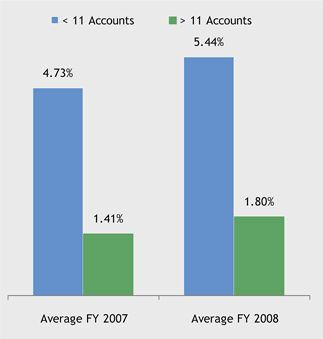
| • | | Customers have more established credit profiles vs. the industry. These customers perform better than less established customers |
Avg. # of Credit Accounts in Good Standing1
Chase 30+ % by # Credit Accounts
Source: Experian
2 | Peers: BAC, C, AXP, WFC, DFS |
3 | Industry is defined as all General Purpose Credit Card holders at Experian |
| | |
 | | 17 |
Chase profile vs. competitors and industry
PORTFOLIO POSITIONING
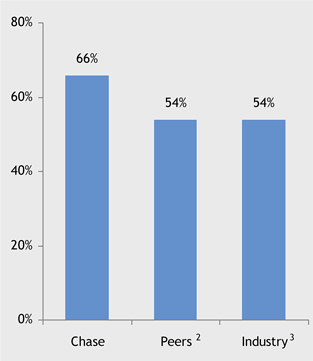
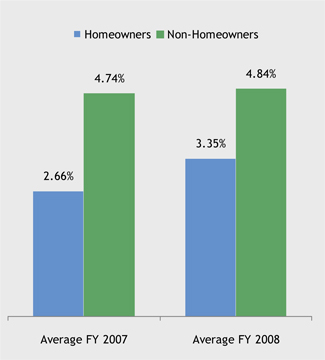
| • | | Homeowners have better risk performance, despite price declines |
Percentage of Customers that are Homeowners1
Chase 30+ Delinquency Rate Performance
Source: Experian
2 | Peers: BAC, C, AXP, WFC, DFS |
3 | Industry is defined as all General Purpose Credit Card holders at Experian |
| | |
 | | 18 |
Agenda
CARD SERVICES
| | |
Credit environment | | 2 |
| |
Portfolio positioning | | 12 |
| |
How has Chase reacted to the environment | | 20 |
| |
Core vision and strategy | | 27 |
| |
Overcoming medium-term financial challenges | | 36 |
| |
Managing through the downturn | | 40 |
| | |
 | | 19 |
How has Chase reacted to the environment. . .
HOW HAS CHASE REACTED TO THE ENVIRONMENT
| • | | We have tightened underwriting based on leading economic indicators, and continue to lend to creditworthy customers |
| • | | We have reduced our contingent liabilities by closing inactive accounts |
| • | | We have increased our collection efforts and intensity |
| | • | | Accelerated the start of calling efforts by 30%, while still staffing at 5-10% above capacity requirements |
| | • | | Added 850 collectors since 3Q07 |
| • | | We have expanded use of flexible payment programs, with 600,000 new enrollments in 2008 |
| | • | | Default performance is in line with expectations |
| | |
 | | 20 |
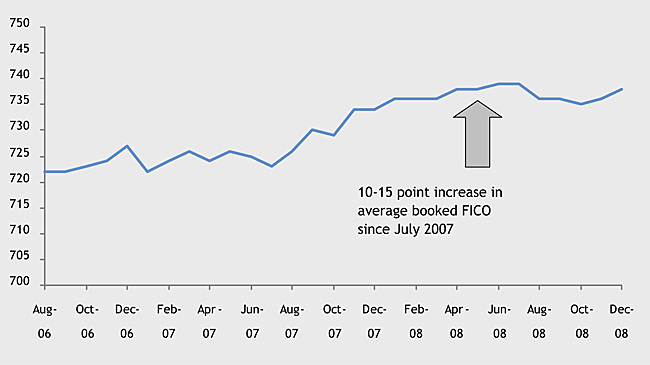
Average FICO score of new accounts has trended upwards
HOW HAS CHASE REACTED TO THE ENVIRONMENT
| • | | Reflects changes in product mix, targeting and tightened underwriting |
Chase Card Services Average Origination FICO
Source: Internal Chase data
| | |
 | | 21 |
Credit Line Management
HOW HAS CHASE REACTED TO THE ENVIRONMENT
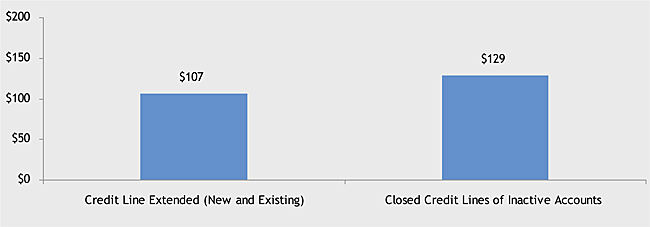
| • | | We have significantly tightened our line management practices, and continue to lend to existing and new customers |
| • | | At the same time, we have been proactive in reducing our contingent liabilities by closing inactive accounts |
Credit Line Management — 2008 ($ in billions)
Source: Internal Chase data
| | |
 | | 22 |
WaMu card portfolio
HOW HAS CHASE REACTED TO THE ENVIRONMENT
| • | | Portfolio overview and recent actions |
| | • | | Conversion to Chase Card Services platform in March 2009 |
| | • | | Suspended all new accounts programs, except for branch applications |
| | • | | Pulled back on balance transfer and check programs |
| | • | | Reduced credit line exposure for consumer and business card programs |
| | • | | Aligned risk management practices with legacy Chase portfolio |
| | • | | Expect losses for WaMu book to approach 15% +/- in 1Q09 |
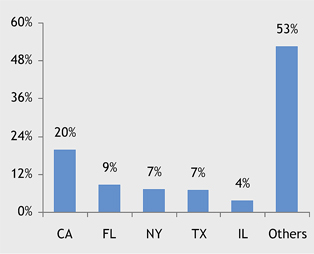
Geographic Distribution of Receivables
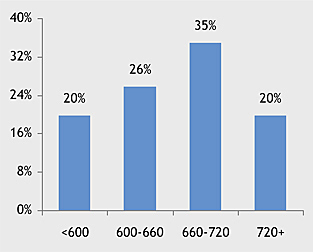
FICO Distribution of Receivables
Source: Internal Chase data
| | |
 | | 23 |
Credit trends — Chase Card Services vs. industry
HOW HAS CHASE REACTED TO THE ENVIRONMENT
Net Charge-Off Rate
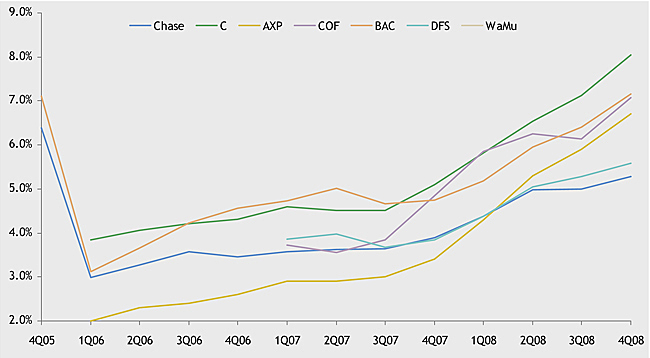
Source: Earnings releases; SEC filings
Notes: BAC US Consumer credit and International Consumer credit segment, reorganized in 3Q08, excludes U.S. Small Business Card; C NA Card segment includes Canada and Puerto Rico but excludes Mexico, and includes sales finance loans formerly reflected in C Financial; COF US Card segment, reorganized in 1Q08, includes Consumer Credit Card, Small Business and Installment Loans and excludes international credit card; DFS data excludes international loans and installment lending; American Express US consumer and small business lending portfolios. WaMu excluded from Chase
| | |
 | | 24 |
Summary
HOW HAS CHASE REACTED TO THE ENVIRONMENT
| • | | The macroeconomic environment has generated significant headwinds for 2009 and likely into 2010 |
| • | | We have been diligent with our risk management practices |
| | • | | Monthly monitoring of high risk geographies at MSA level |
| | • | | High-risk geographies defined by observed and forecasted data points for unemployment rate and home price depreciation |
| | • | | Adjustments to score cutoffs and criteria in high risk geographies |
| | • | | Explicit use of unemployment rate and home price depreciation data in loss forecasting models |
| • | | Our portfolio mix and credit capabilities have been a real advantage |
| • | | We continue to invest for growth |
| | |
 | | 25 |
Agenda
CARD SERVICES
| | |
Credit environment | | 2 |
| |
Portfolio positioning | | 12 |
| |
How has Chase reacted to the environment | | 20 |
| |
Core vision and strategy | | 27 |
| |
Overcoming medium-term financial challenges | | 36 |
| |
Managing through the downturn | | 40 |
| | |
 | | 26 |
We continue to stay focused on our core vision, despite a challenging business environment
CORE VISION AND STRATEGY
Vision
Create lifelong, engaged relationships with our customers by being a trusted provider of financial services
| | | | |
Brand | | Rewards | | Customer experience |
| | |
• Create a differentiated brand • Strong proprietary brand • Partnerships to enhance and extend brand • Distribution channels to raise recognition, reinforce • Build brand equity that delivers high performance • Business strategies are aligned with brand positioning • Consistency across all channels | | • Rationalize existing rewards products • Develop proprietary rewards platform • Develop targeted offers for each customer segment • Redemption to be easy and intuitive | | • Engage the customer early in the lifecycle • Leverage every interaction to enhance the relationship • Create a superior online experience • Improve customer service • POS authorizations • Disputes • Card replacement |
| | |
 | | 27 |

We maintain our focus on the Chase branded business
CORE VISION AND STRATEGY
| • | | Completed business reorganization discussed in 2008 |
| • | | Segmented marketing framework, e.g. acquisition and portfolio marketing |
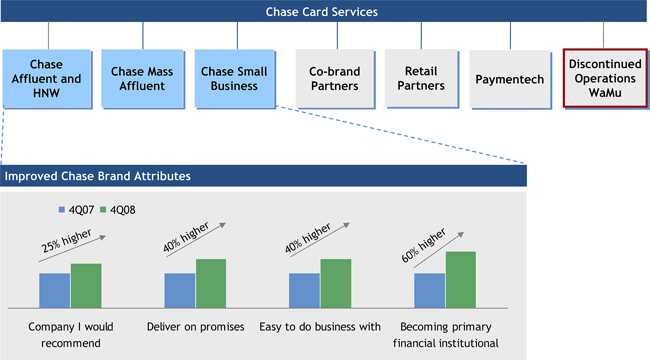
Source: Chase Card Services brand tracker survey
| | |
 | | 28 |

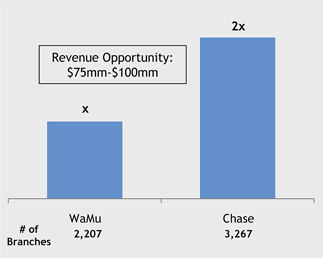
Our large distribution network will enable increase in brand awareness and customer engagement
CORE VISION AND STRATEGY
| • | | With the addition of 2,207 WaMu branches, Chase now has 5,474 branches across a national footprint |
| • | | Expanded retail footprint will create two significant benefits |
| | • | | In general, Chase experiences a 10%+ lift in overall acquisition rates (all channels except direct retail channels) in-footprint markets |
Branch Distribution Advantages
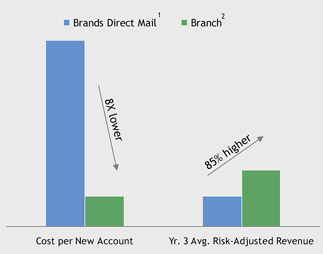
2008 Accounts/Branch/Month
1 | Brands Direct Mail data represents Chase Brands |
2 | Branch data represents Retail Branch Channel |
Source: Internal Chase data
| | |
 | | 29 |

Our co-brand partner business continues to perform very well and we are focused on solidifying key partnerships
CORE VISION AND STRATEGY
| • | | In 2007/2008 we have extended key partner contracts |
| • | | We have also begun to rationalize our existing partner portfolio with a renewed focus on scale and profitability |
Co-brand vs. Chase Brand Performance

Our key co-brand partners provide us access to 80-100mm high-potential, loyal relationships
1 | Sales/active is for 2008, all vintages |
2 | Brands Direct Mail represents Chase Brands Direct Mail Channel |
3 | Cobrand/affinity data represents partner portfolio, excludes retail partner portfolio |
Source: Internal Chase data
| | |
 | | 30 |

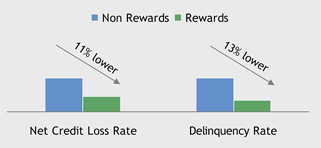
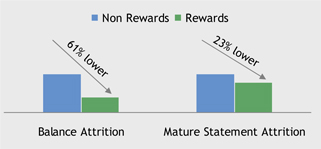
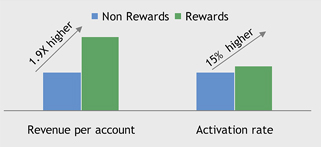
Benefits of rewards-based customer engagement
CORE VISION AND STRATEGY
| • | | Rewards customers have higher level of engagement which drives higher revenue |
| • | | Opportunity exists to increase level of engagement for non-rewards customers |
Increased Spending

Better Credit Performance
Greater Retention
Improved Profit
Source: Internal Chase data for FY 2008
| | |
 | | 31 |

Launching a new proprietary, Chase rewards platform
CORE VISION AND STRATEGY
Vision Plan
| • | | Create a differentiated, points-based rewards offering to drive spend on Chase-branded cards |
| | • | | Strong earning options with ability to earn across multiple Chase product offerings |
| | • | | Exceptional array of redemption options with strong customer value |
| | • | | Simple, user-friendly interface with fully integrated online experience |
| • | | Help drive better risk-adjusted revenue growth for the Chase-branded business |
| | • | | Enhance value proposition of products, pricing power |
| | • | | Drive customer engagement—increased share of customer spend, borrowing needs, and lower attrition |
| • | | Maintain sustainable rewards economics |
| | • | | More favorable redemption category mix |
| | • | | Better utilization of Internet channel |
| | • | | Strategic partnerships and enhanced sourcing |
Graduated launch, starting in mid-2009
| | |
 | | 32 |

We continue to improve our customer experience
CORE VISION AND STRATEGY
The Chase Promise
| | |
POS Authorization | | • Your card will be available to use when and where you want |
| |
Card Replacement | | • If your card is lost or stolen, a new card will be delivered where and when you want it • Act as the customer’s advocate when they are “stranded” |
| |
| Customer Dispute Servicing | | • If a charge on your bill is wrong, a Chase advocate is in your corner |
| | |
 | | 33 |

| | |
| Early benefits from our renewed focus on customer experience is already evident in our performance |
CORE VISION AND STRATEGY
Improved Customer Satisfaction1
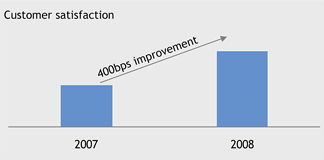
Improved Card Replacement Strategy2
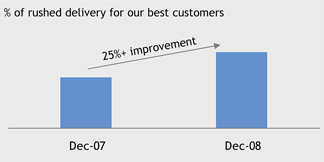
Improved POS Authorization Rates
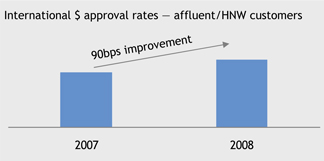
Improved Service Quality
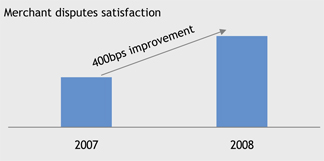
Results in higher wallet share and longer relationships for Chase
1 | Based on Internal Chase Customer Survey |
2 | Reflects December data for 2007 and 2008 as we introduced the metric in 2H’07 |
Source: Internal Chase data
| | |
 | | 34 |
Agenda
CARD SERVICES
| | |
Credit environment | | 2 |
| |
Portfolio positioning | | 12 |
| |
How has Chase reacted to the environment | | 20 |
| |
Core vision and strategy | | 27 |
| |
Overcoming medium-term financial challenges | | 36 |
| |
Managing through the downturn | | 40 |
| | |
 | | 35 |
Chase led the industry in sales growth, coupled with lower credit losses
OVERCOMING MEDIUM - TERM FINANCIAL CHALLENGES
FY 2008 Sales Volume Growth YoY
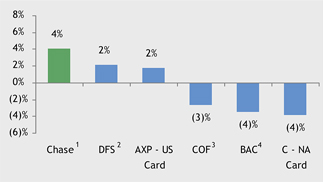
FY 2008 Ending Receivables Growth YoY
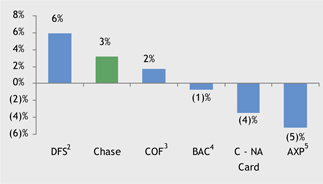
FY 2008 Net Charge-Off Rate
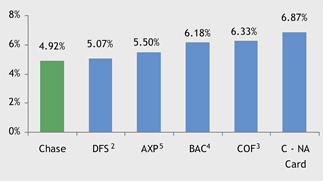
1 | Chase purchase volumes reflect sales volume only and excludes cash advances and BT’s |
2 | DFS data represents fiscal year ending Nov’08; Purchase volume data represents sales volume only; NCO represents credit card loans only and excludes installment loans |
3 | COF data represents US Card segment, which includes consumer credit card, small business credit card and installment loans |
4 | BAC data represents Consumer Credit card portfolio (including international cards); excludes small business credit card portfolio |
5 | AXP US Lending portfolio |
Source: Earnings Releases and Supplements; SEC filings, Investor Presentation
| | |
 | | 36 |
However, we are in the middle of the pack in terms of profitability
OVERCOMING MEDIUM - TERM FINANCIAL CHALLENGES
FY 2008 ROE
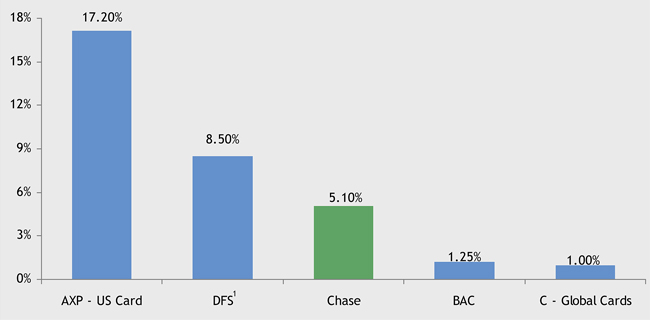
1 | DFS’s profits from continuing operations have been adjusted to exclude after tax impact of $863mm payment from MasterCard related to litigation settlement |
| Source: | SEC Filings; Earnings Releases and Supplements |
| | |
 | | 37 |
We have focused efforts to improve aggregate portfolio returns, over time
OVERCOMING MEDIUM - TERM FINANCIAL CHALLENGES
| • | | Increased emphasis on capturing more of our existing customers’ business |
| | • | | A 100bps increase in share of wallet would generate ~$180mm in pre-tax income |
| • | | Reduce, significantly, small sub-scale partnerships |
| • | | Fewer low-rate promotional offers to customers who do no other business with us |
| • | | Strengthen our Chase Brand Rewards capabilities |
| • | | Selectively reprice customers on a segmented basis |
| | |
 | | 38 |
Agenda
CARD SERVICES
| | |
Credit environment | | 1 |
| |
Portfolio positioning | | 11 |
| |
How has Chase reacted to the environment | | 19 |
| |
Core vision and strategy | | 26 |
| |
Overcoming medium-term financial challenges | | 35 |
| |
Managing through the downturn | | 39 |
| | |
 | | 39 |
Spending from our more affluent customers has experienced the largest decline
MANAGING THROUGH THE DOWNTURN
Sales Growth – YoY
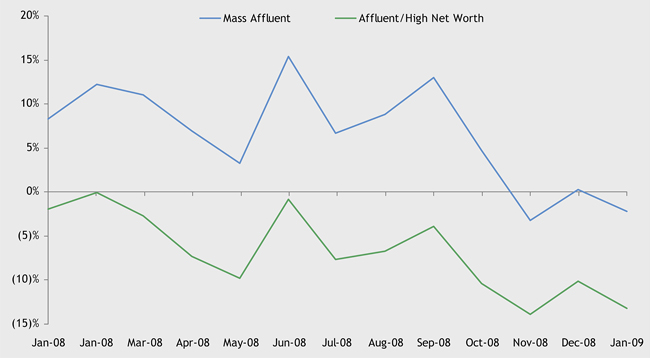
Source: Internal Chase Data
| | |
 | | 40 |
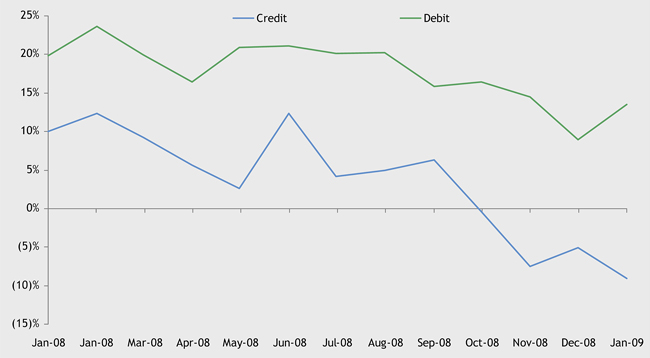
Both credit and debit are experiencing a slowdown in sales
MANAGING THROUGH THE DOWNTURN
Chase Debit vs. Credit Sales Growth – YoY
Source: Internal Chase data
| | |
 | | 41 |
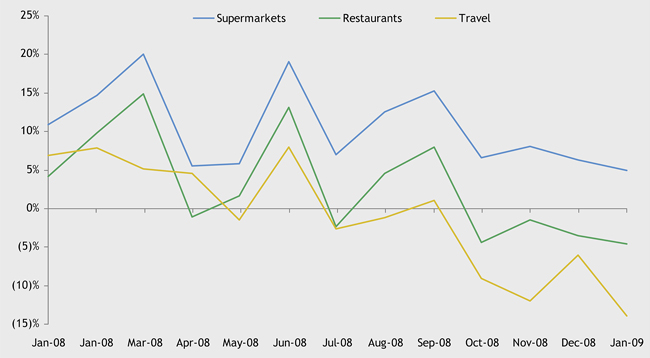
Consumers are spending less on discretionary items
MANAGING THROUGH THE DOWNTURN
Discretionary vs. Nondiscretionary Sales Growth – YoY
Source: Internal Chase data
| | |
 | | 42 |
Consumers are becoming more focused on the simple pleasures in life as well as “finding deals”
MANAGING THROUGH THE DOWNTURN
Change in Sales YoY

Change in Sales YoY

Source: Internal Chase data
| | |
 | | 43 |
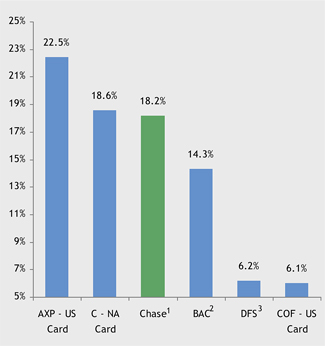
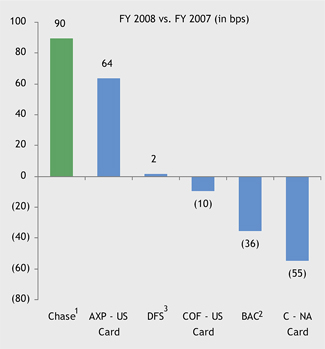
However, Chase continued to gain sales volume market share in 2008
MANAGING THROUGH THE DOWNTURN
Sales Volume Market Share – FY 2008
Change in Sales Volume Market Share
1 | Chase data for computing market share includes cash advances but excludes balance transfers |
2 | BAC data represents consumer credit card portfolio, including international; excludes small business card portfolio |
3 | Discover data for computing market share includes cash advances |
Source: Earnings Releases and Supplements; Nilson Report (Issue # 918)
| | |
 | | 44 |
Unfair and Deceptive Acts or Practices (UDAP) proposal
MANAGING THROUGH THE DOWNTURN
($ in millions)
| | |
| | | Description |
Summary impact | | • No 2009 impact • Effective date July 1, 2010 |
| |
| |
| Rate repricing restrictions | | • Limitations on ability to price existing customer balances for risk; limited to 30+ day delinquency with 45 day notice |
| |
Payment hierarchy / allocation | | • Payments will be allocated in one of two ways: • “Pro rata” to balances with different APRs • Highest APR balance first |
| |
| |
| |
Statement cycle time, payment processing | | • Customers will be given approximately 7 additional days to make a payment • Payment cutoff time defined as 5PM on due date |
| |
| |
Practices NOT used by Card Services | | • Prohibition of double cycle billing • Prohibition of “universal default,” or activity at another lender, to trigger a pricing change |
| |
| | |
 | | 45 |
Potential UDAP mitigation strategies
MANAGING THROUGH THE DOWNTURN
| • | | Short term impact of 70 to 100bps on normalized pre-tax ROO |
| • | | Volatility expected through 2011 as marketplace adjusts to implementation of new rules |
| • | | Returns expected to reach existing levels on a potentially smaller base by late 2011, early 2012 |
| | |
| | | Potential Mitigants |
Pricing Strategy Changes | | • Move all pricing to variable index prior to compliance date • Shorten duration of acquisitions introductory rates • Targeted higher contract APRs at acquisition • Annual/Service Fee for low engagement/low usage customers |
| |
| |
| |
| |
| Policy and Universe Changes | | • Bias balance build programs toward limited duration promotions targeted at customers who actively use card product for purchasing and payments • Reduction in marketing to segments with marginal returns |
| |
| |
| Alternative Product Constructs | | • Evaluate alternative product constructs that maintain low contract APRs, offset with membership fees • Enable customers to restructure borrowing into fixed payment terms |
| |
| | |
 | | 46 |
Key overall messages
MANAGING THROUGH THE DOWNTURN
| • | | Despite the challenging environment we remained focused on our vision to create lifelong, engaged relationships with our customers |
| • | | Our business reorganization is complete which has enabled a more refined focus on our Chase branded business |
| • | | The expanded Chase branch footprint is expected to have a significant benefit on the overall Chase branded business |
| • | | We are rationalizing our existing partnership portfolio and have taken steps to solidify and extend our key, strategic partner contracts |
| • | | Proprietary Chase rewards platform will be launched in 2009 |
| • | | We remain focused on providing a superior customer experience and initial results have confirmed our early progress |
| • | | Finally, we believe that in conjunction with our credit strategies, we have positioned ourselves well to manage through the downturn and emerge well positioned at the end of this cycle |
| | |
 | | 47 |
FEBRUARY 26, 2009
RETAIL BANKING
Charlie Scharf, Retail Financial Services Chief Executive Officer
Agenda
RETAIL BANKING
| | |
| | | Page |
Retail Banking | | 1 |
| |
WaMu Update | | 22 |
| | |
 | | 1 |
Retail Financial Services
RETAIL BANKING
| • | | With acquisition of WaMu, Retail Banking becomes the dominant source of Retail Financial Services profit |
| • | | Evolution of branch footprint has resulted in a national, highly profitable, and consistently growing franchise |
| • | | Strategy and business focus has been consistent since 2000 |
| • | | 8 years of consistent organic growth |
| • | | Acquisition competency has enabled us to opportunistically transform franchise and bring our ability to grow organically to the expanded footprint |
| | |
 | | 2 |
Footprint evolution — JPMorgan Chase before Bank One merger
RETAIL BANKING
Branch map
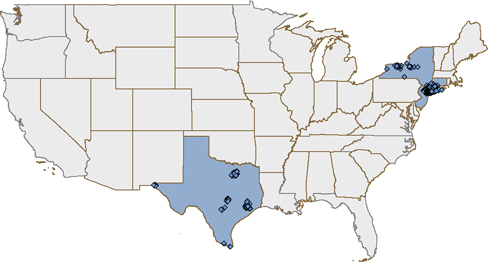
| | | | |
| | | Chase
2003 | |
Branches | | | 539 | |
| |
Checking accts (# ‘000s) | | | 2,331 | |
| |
States | | | 4 | |
| |
Population growth in footprint (2008-2013) | | | 3.3 | % |
| |
Consumer & Business Banking pretax ($mm) | | $ | (12 | ) |
Source: SNL Financial and past acquisition investor presentations; company filings and internal analysis; Claritas demographic data and projections
| | |
 | | 3 |
Footprint evolution — JPMorgan Chase and Bank One
RETAIL BANKING
Branch map
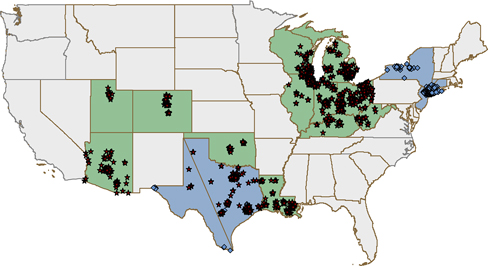
| | | | | | | | |
| | | Chase
2003 | | | Chase/Bank One
2005 | |
Branches | | | 539 | | | | 2,295 | |
| | |
Checking accts (# ‘000s) | | | 2,331 | | | | 8,793 | |
| | |
States | | | 4 | | | | 16 | |
| | |
Population growth in footprint (2008-2013) | | | 3.3 | % | | | 3.2 | % |
| | |
Consumer & Business Banking pretax ($mm) | | $ | (12 | ) | | $ | 2,760 | |
Source: SNL Financial and past acquisition investor presentations; company filings and internal analysis; Claritas demographic data and projections
| | |
 | | 4 |
Footprint evolution — JPMorgan Chase and Bank of New York
RETAIL BANKING
Branch map
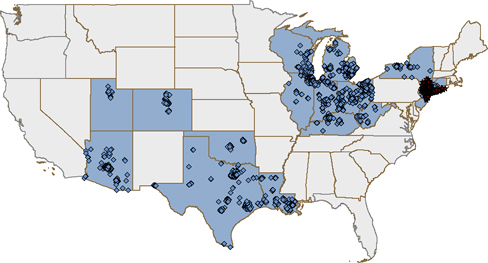
| | | | | | | | | | | | |
| | | Chase
2003 | | | Chase/Bank One
2005 | | | Chase/Bank of NY
2007 | |
Branches | | | 539 | | | | 2,295 | | | | 2,937 | |
| | | |
Checking accts (# ‘000s) | | | 2,331 | | | | 8,793 | | | | 10,839 | |
| | | |
States | | | 4 | | | | 16 | | | | 16 | |
| | | |
Population growth in footprint (2008-2013) | | | 3.3 | % | | | 3.2 | % | | | 3.5 | % |
| | | |
Consumer & Business Banking pretax ($mm) | | $ | (12 | ) | | $ | 2,760 | | | $ | 3,711 | |
| • | | Solidified position in NY market |
Source: SNL Financial and past acquisition investor presentations; company filings and internal analysis; Claritas demographic data and projections
| | |
 | | 5 |
Footprint evolution — JPMorgan Chase and Washington Mutual
RETAIL BANKING
Branch map
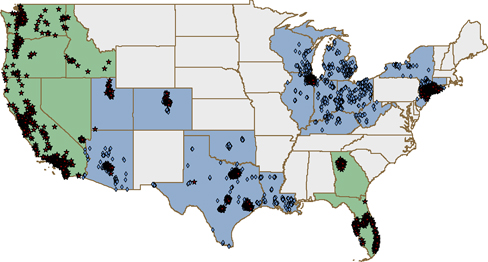
| | | | | | | | | | | | | | | | |
| | | Chase
2003 | | | Chase/Bank One
2005 | | | Chase/Bank of NY
2007 | | | Chase/WaMu
4Q081 | |
Branches | | | 539 | | | | 2,295 | | | | 2,937 | | | | 5,410 | |
| | | | |
Checking accts (# ‘000s) | | | 2,331 | | | | 8,793 | | | | 10,839 | | | | 24,499 | |
| | | | |
States | | | 4 | | | | 16 | | | | 16 | | | | 23 | |
| | | | |
Population growth in footprint (2008-2013) | | | 3.3 | % | | | 3.2 | % | | | 3.5 | % | | | 5.4 | % |
| | | | |
Consumer & Business Banking pretax ($mm) | | $ | (12 | ) | | $ | 2,760 | | | $ | 3,711 | | | $ | 6,880 | |
Source: SNL Financial and past acquisition investor presentations; company filings and internal analysis; Claritas demographic data and projections
| | |
 | | 6 |
Consistent strategy and business focus since 2000
RETAIL BANKING
| • | | Consistent management practices |
| | • | | Monthly business reviews by branch |
| | • | | Create local excitement and recognition |
| | • | | Active customer engagement |
| | • | | Customers at the top of the org. chart |
| | • | | Front line employees next |
| | • | | Management and staff at the bottomg branch support |
| | • | | Simple compensation plans critical |
| | • | | Community banking with the benefits of a global bank |
| | • | | Customer engagement and service |
| | |
 | | 7 |
Consumer and Business Banking consistent profit growth
RETAIL BANKING
Pretax ($ in millions)
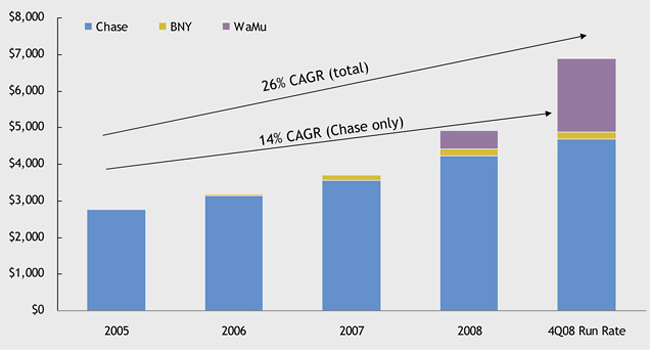
| • | | Similar trend in revenue growth |
| | |
 | | 8 |
Background — branch banking has evolved dramatically
RETAIL BANKING
| • | | Our activities and reporting are built around the changing nature of the business |
Pretax
| | | | | | | | | |
| | | 1975 | | | 2001 | | | 2008 | |
Deposits, loans, and traditional banking fees | | 100 | % | | 90 | % | | 74 | % |
| | | |
Investments, debit and credit cards | | 0 | % | | 10 | % | | 26 | % |
| | |
 | | 9 |
Our activities and determinants of success
RETAIL BANKING
| | |
| What We Talk About | | What We Track |
| |
| Acquire | | • Checking account growth |
| |
| Deepen | | • Deposit growth • Convenience services (e.g. Debit, Chase.com, bill pay) • Additional products (e.g. Credit cards, loans, investments) |
| |
| Customer Engagement | | • Customer service • Mystery shops / surveys |
| |
| Growth | | • Same branch (all of the above) • New builds |
|
 |
|
| Profit Growth |
| | |
 | | 10 |
Consistent growth — acquire new customers
RETAIL BANKING
Net New Checking Accounts by Quarter1 (in thousands)
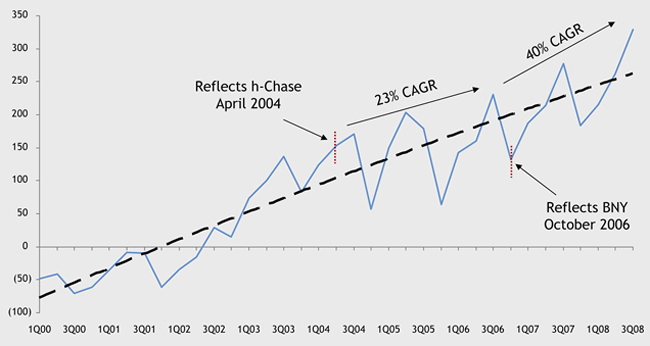
| • | | Acquisition rate has grown from 15% to 25% |
| • | | Net checking growth rate of 8% |
Note: Reflects h-Bank One from January 2000 through March 2004
1 | Net new checking accounts is new checking accounts minus lost checking accounts |
| | |
 | | 11 |
Growth in deposit balances
RETAIL BANKING
Retail Banking End of Period Deposits ($ in billions)
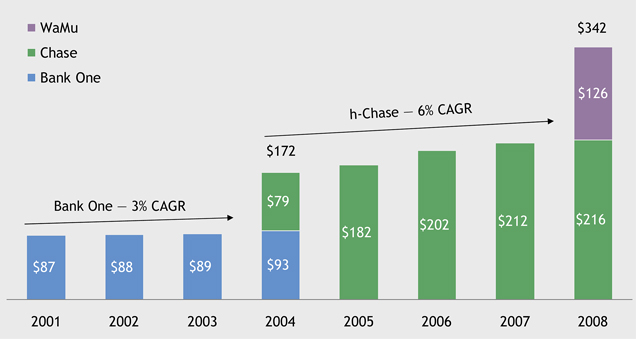
| • | | Goal to grow balances 4-8% (without sacrificing margin) |
| • | | Additional profit growth through enhanced cross-sell |
| | |
 | | 12 |
Consistent and high growth — debit
RETAIL BANKING
Debit Card Revenue ($ in millions)1

Checking Accounts with Debit Card

1 | Debit card revenue includes signature and pin interchange, contra/points cost, annual fees and foreign exchange income for Retail Banking |
Note: Consumer Banking only; includes all enrolled accounts
| | |
 | | 13 |
Consistent growth — convenience services
RETAIL BANKING
Bill Pay — Percentage of Accounts Enrolled
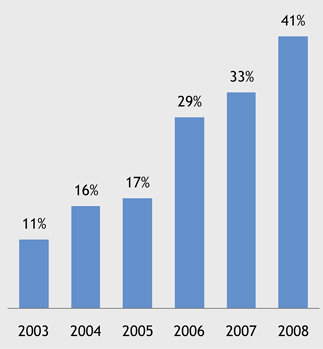
Chase.com — Percentage of Accounts Enrolled
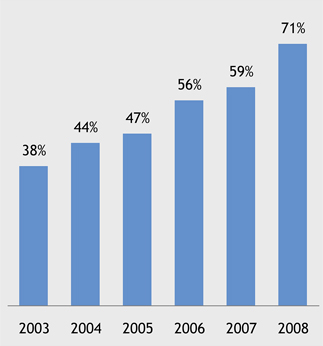
| • | | Expansion of convenience services solidifies customer relationship |
| • | | Growth in convenience services is a core part of strategy |
Note: Consumer Banking only; Percentages are based on total year end Consumer Banking checking accounts
| | |
 | | 14 |
Growth in branch cross-sell
RETAIL BANKING
Credit Cards (in thousands)
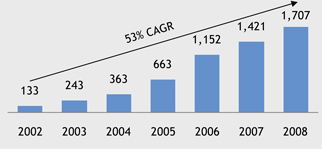
Investment Sales ($ in billions)
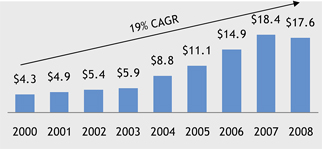
Mortgage Sales ($ in billions)
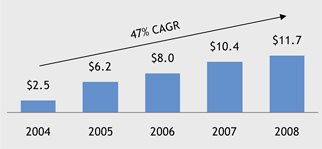
Home Equity Sales ($ in billions)
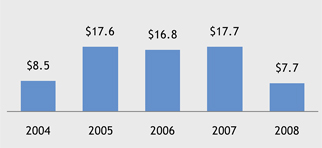
Note: Includes h-Bank One 1/2000-6/2004. Includes h-Chase starting 7/2004, BNY starting 10/2006, and WaMu starting 10/2008
| | |
 | | 15 |
Investment revenue and assets under management
RETAIL BANKING
Revenue ($ in millions)
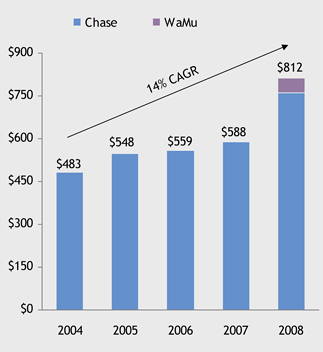
Note: Includes h-Bank One, h-Chase starting 7/2004, BNY starting 10/2006, and WaMu starting 10/2008
Assets under Management ($ in billions)
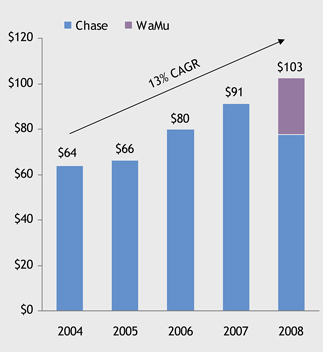
Note: End of year; Includes h-Bank One and h-Chase 2004-2005; Chase and BNY 2006; Chase 2007; and Chase and WaMu 2008
| | |
 | | 16 |
Acquisition competency — Bank One
RETAIL BANKING
Growth in sales in h-Bank One branches
Credit Cards (in thousands)
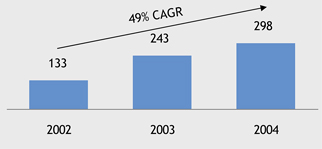
Investment Sales ($ in billions)
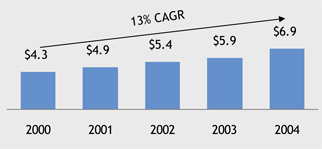
Net New Checking Accounts (in thousands)
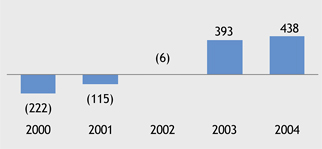
Infrastructure
| • | | 14 major systems converted and over 500 other applications consolidated prior to merger |
| | |
 | | 17 |
Acquisition competency — Chase
RETAIL BANKING
Growth in sales in h-Chase branches
Credit Cards (in thousands)
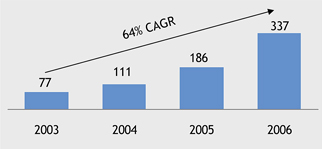
Investment Sales ($ in billions)
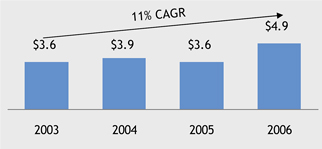
Net New Checking Accounts (in thousands)
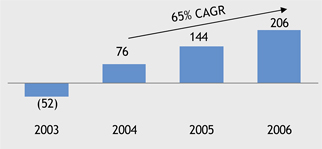
Merger-related expense and infrastructure
| • | | 20 major systems converted and over 2,000 other applications consolidated |
| • | | $3.4B in expense reductions |
| • | | 16K+ headcount reductions |
| | |
 | | 18 |
Acquisition competency — Bank of New York
RETAIL BANKING
Growth in sales in h-BNY branches
Credit Cards (in thousands)
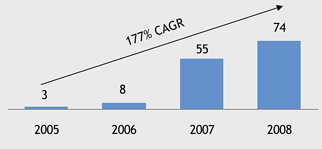
Investment Sales ($ in millions)

Net New Checking Accounts (in thousands)
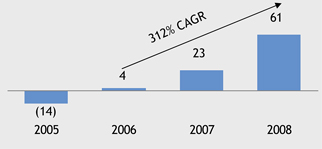
Mortgage and Home Equity ($ in millions)
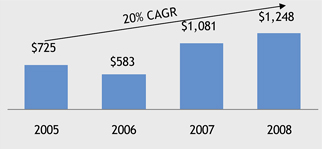
Merger-related expense and infrastructure
| • | | 15 major systems converted; approximately 150 other applications consolidated |
| • | | $50mm expense reductions |
| • | | 480 headcount reductions |
| | |
 | | 19 |
New branches
RETAIL BANKING
New Build Initiative
| | | | | | | | | | | | | | |
| | | 2002 | | 2003 | | 2004 | | 2005 | | 2006 | | 2007 | | 2008 |
| | | | | | | |
Branches opened | | 35 | | 59 | | 124 | | 146 | | 125 | | 127 | | 126 |
Cumulative branches opened | | 35 | | 94 | | 218 | | 364 | | 489 | | 616 | | 742 |
| | | | | | | |
New checking accounts (# 000’s) | | 8 | | 40 | | 122 | | 218 | | 366 | | 530 | | 665 |
Checking accounts (# 000’s) | | 7 | | 40 | | 139 | | 298 | | 537 | | 854 | | 1,226 |
| • | | Targeting 120 new branches in 2009, including 30 WaMu |
| • | | Focused on expansion in major footprint markets |
| • | | New builds generated 21% of overall checking production in 2008 |
| • | | New build checking account portfolio represents 10% of total Chase |
| | |
 | | 20 |
Consumer & Business Banking position
RETAIL BANKING
| | | | |
• Strategy • Sales focus • Service focus • National and community • Product innovation • Execution | |  | | All |
|
• Business practices, culture, management systems, management, etc. consistent for 8 years • Organic growth is clear and consistent • Franchise is enviable • Great and improving brand • National • High growth footprint • Great and consistent culture • JPM product set • JPM strength |
| | |
 | | 21 |
Agenda
RETAIL BANKING
| | |
| | | Page |
| |
Retail Banking | | 1 |
| |
WaMu Updated | | 22 |
| | |
 | | 22 |
A different kind of transaction
WAMU UPDATE
| • | | Transaction announced at 7PM on September 25 |
| • | | Immediate ownership of bank subsidiary |
| • | | WaMu brand tarnished by seizure – need to move quickly |
| | • | | Immediate communication from Jamie |
| | • | | Employee town halls next day |
| | • | | Initial advertising launched first week |
| | • | | Conversion meetings began first week |
| • | | Need to work closely with FDIC as receiver |
| • | | Complication of holding company bankruptcy |
| | |
 | | 23 |
Initial advertising — strength and stability of JPM
WAMU UPDATE

| | |
 | | 24 |
Stabilized deposits immediately
WAMU UPDATE
WaMu Deposit Daily Trend (Total Deposits excluding Official Checks/PAA) — ($ in billions)
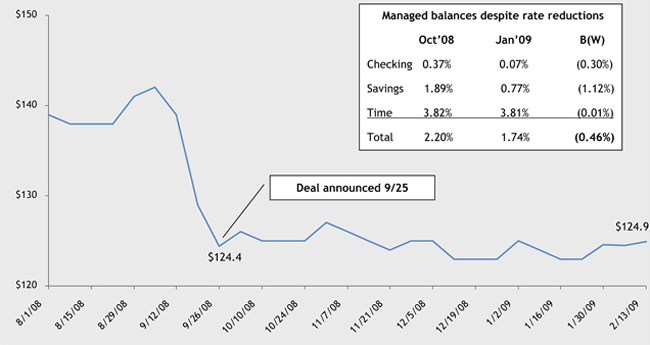
| • | | 9/12 thru 9/26—balance decline of ~$15B |
| • | | 9/26/08 through 2/13/09—balances were up $0.5B, even with the significant reduction in customer rate from Fed cuts and repositioning in the WaMu book |
| | |
 | | 25 |
Reversed checking account loss
WAMU UPDATE
WaMu Net Retail Checking Accounts — Average Daily Change by Week (in thousands)¹
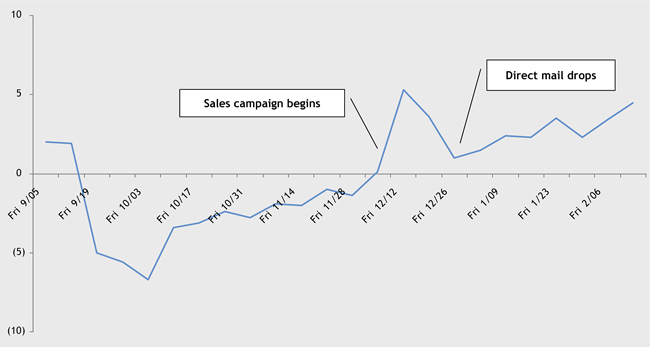
| • | | Significant direct mail drops in December |
| • | | Continued focus in branches on net checking growth |
¹ | Daily average by week of net retail checking accounts excluding transfers; excludes dynamic closures that occur 1st business day of every month and closes accounts that are unfunded, have never been activated, or accounts that have been brought down to $0 balance and has had no customer-initiated activity in the last 60 days |
| | |
 | | 26 |
Integration activities completed to date
WAMU UPDATE
| • | | Deal announced on September 25, 2008 |
| | |
Date | | Activity |
| |
• Oct. 8 | | • No-Fee access to 14,000 ATMs less than 2 weeks after deal |
| |
• Oct. 31 | | • Conform deposit and loan pricing |
| |
• Nov. 5 | | • Conversion dates set |
| |
• Nov. 13 | | • Technology decisions announced |
| |
• Dec. 1 | | • People decisions communicated — all 45,000 people |
| |
• Dec. 15 | | • Sales campaigns |
| |
• Dec. 15 | | • Field reorganization under 4 regions |
| |
• Jan. 7 | | • New compensation plans announced |
| |
| | • Branch Manager |
| |
| | • Assistant Branch Manager |
| |
| | • Personal Banker |
| |
| | • Teller |
| | |
 | | 27 |
Integration activities
WAMU UPDATE
Branch consolidations
• | | 300 by end of 1stquarter |
• | | 92 between 2ndand 4thquarters |
| • | | Need for dual operations in overlap markets |
California rebrand
| • | | 708 branches on 3/30/09 |
Conversion schedule
| • | | Washington, Oregon, Idaho, Utah |
| | • | | 341 branches — 2ndquarter |
| • | | Florida, Georgia, Connecticut, New Jersey, New York, Illinois, Texas |
| | • | | 701 branches — 3rdquarter |
| • | | California, Nevada, Arizona, Colorado |
| | • | | 802 branches — 4thquarter |
| | |
 | | 28 |
Integration activities, continued
WAMU UPDATE
| • | | 672 technology conversions |
| • | | 31,800 new workstations in branches |
| | • | | 45% Teller / 55% Platform |
| • | | 3 data center conversions representing 4,200 servers |
| • | | 1,844 interior refurbishments |
• | | 32,000 new signs1representing 1,844 branches |
| • | | 4,800 ATM sign conversions |
1 | Includes all signage, both exterior and interior |
| | |
 | | 29 |
Cost save detail
WAMU UPDATE
| • | | Gross expense reductions of $2,750mm expected to be achieved across all businesses |
| • | | Approximately 12,000 projected headcount reductions from time of merger announcement |
| • | | Major components of expense saves include the following: |
| | | | |
($ in millions) | | | |
Compensation & employee-related | | $ | 1,350 | |
Marketing, Technology, Real Estate, Other | | | 1,400 | |
| | | | |
Gross savings | | $ | 2,750 | |
Additional investment spend | | | (750 | ) |
| | | | |
Projected net savings | | $ | 2,000 | |
| • | | Majority of savings to be achieved by end of 2009 |
| • | | Additional investment spend of $750mm comprised of: |
| | |
 | | 30 |
Revenue growth potential: credit card and investment sales
WAMU UPDATE
| • | | Branch network provides opportunity to cross-sell more products, particularly credit card and investment sales: |
| | • | | In 2007, Chase produced 2x the per branch credit card production of WaMu |
| | • | | Achieving this productivity from WaMu branches would generate an additional 500,000 credit cards sold annually through the branches |
| | • | | Chase’s % of retail bank households that have an investment product is 2x greater than WaMu |
| | • | | Chase’s Financial Advisors produce on average 60% more investment sales per year |
| | • | | Achieving Chase investment sales productivity and increasing number of Financial Advisors could lead to an additional $8-10B in sales annually through the branches |
Credit Card Sales per Branch per Month — 2007
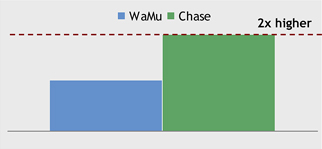
Investment Sales per Branch per Month — 2007
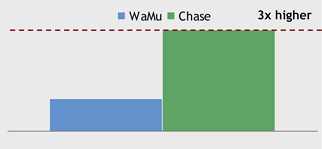
| | |
 | | 31 |
WaMu provides unique opportunity to expand retail banking franchise and generate attractive returns for JPMorgan Chase shareholders
WAMU UPDATE
Strategic Fit
| • | | Greatly enhances retail banking platform in attractive markets |
| | • | | Combined deposits of $911B and 5,410 branches at close |
| | • | | Expanding into attractive new markets (CA + FL) |
| | • | | Increases market share in existing largest fast-growing markets (NY, TX, IL, AZ, CO, UT) |
Financially Compelling
| • | | Accretive immediately; should be substantially so in future |
| | • | | Asset write-downs reduce risk to volatility in future earnings |
| | • | | Allows significant margin for error |
| • | | Opportunity to grow revenue and realize significant cost savings |
| | • | | Ability to bring expanded Chase products and services to WaMu branches |
| | • | | Drive efficiencies in branch network and back office |
| • | | JPMorgan Chase maintains strong capital and liquidity positions |
| | • | | Retail deposits add to stable funding base |
Ability to execute
| • | | Proven capabilities with success in Bank One/Chase and Bank of New York transactions |
| • | | Little overlap with Bear Stearns integration |
| | |
 | | 32 |
FEBRUARY 26, 2009
ASSET MANAGEMENT
Jes Staley, Asset Management Chief Executive Officer
Private Banking is showing strong growth
ASSET MANAGEMENT
2008 Highlights
| • | | Net AUS flows of $75B, up 45% from 2007 |
| • | | Loan-to-deposit ratio at year end - 53% |
| • | | 75% of Private Bank AUM beat client benchmarks |
| • | | 1,400 net new $10mm client accounts & 4,200 net new $500k client accounts |
| • | | The Global Access Portfolios, our flagship multi-asset class investment solution for private clients, generated excess returns over the benchmark of 2.5%+ for balanced strategies and 6%+ for growth strategies |
AUS Flows ($ in billions)
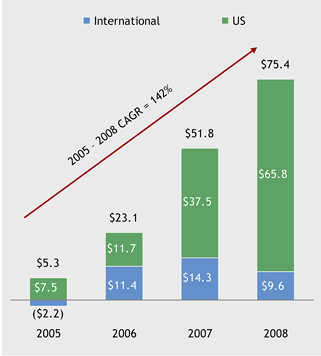
| | |
 | | 1 |
Cash assets grew despite turbulent market for money market funds
ASSET MANAGEMENT
2008 Highlights
| • | | $210B in net flows, AUM up 53% |
| • | | Largest manager of AAA-rated liquidity funds; global market share of 13%; global institutional market share of 17%, almost twice that of the next largest competitor |
| • | | Avoided major setbacks from SIVs, subprime and Lehman |
Global Cash Year-End AUM ($ in billions)
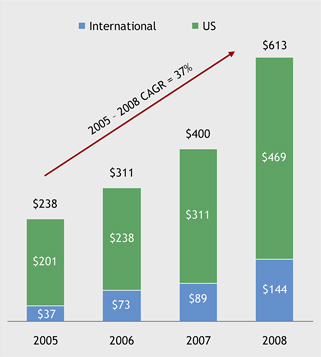
| | |
 | | 2 |
Alternatives saw setbacks during the year
ASSET MANAGEMENT
2008 Highlights
| • | | Unprecedented headwinds with illiquidity and shrinking leverage |
| • | | Asset Management performance fees fell by 79% from 2007 to 2008 |
| | • | | AUM fell 32%, now stabilizing |
| | • | | The Multi-Strategy Fund performance in 2008 was down 27% |
| | • | | Strong 2008 performance for Statistical Opportunities Fund (up 22%) and Market Neutral Mutual Fund (up 10%) |
| | • | | Early 2009 returns are improving |
| • | | Outlook for 2009 is positive with many distressed opportunities |
| | • | | Secondary market opportunities from distressed sellers of private equity stakes |
| | • | | Real Estate Group plans to purchase portfolios and offer sub-advisory services |
Alternatives Year-End AUM ($ in billions)
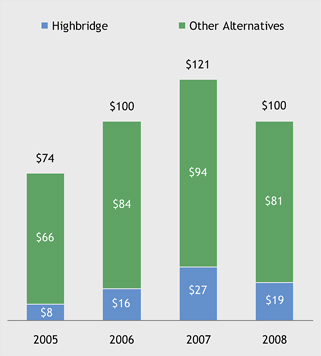
| | |
 | | 3 |
Recent equity and fixed income investment performance is mixed and long-term performance is still strong
ASSET MANAGEMENT
2008 Highlights
| • | | U.S. equity performance improved during the year |
| • | | Global fixed income had difficult time in unprecedented market, but kept good long-term performance |
| • | | Well-positioned for market stabilization |
Performance (% of AUM in Top 2 Lipper Quartiles)
U.S. Platform – Equity
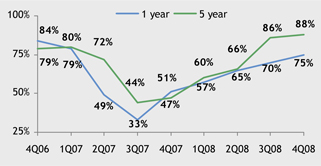
U.S. Platform – Fixed Income
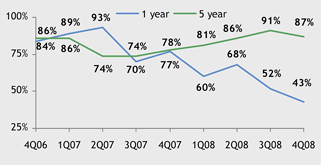
| | |
 | | 4 |
Three principal risks in Asset Management
ASSET MANAGEMENT
Market Risk – Risk of Not Delivering Expected Risk/Return Profile
| • | | This is the fundamental risk of the asset management business - we approach it with a fiduciary mindset |
| • | | Strong due diligence teams |
| • | | Good job of managing leverage & liquidity |
| • | | Limited exposure to structured notes & SIVs |
| • | | Experienced some issues in enhanced cash in 2008 |
Credit Risk – Manage the Credit Book with an Appropriate Degree of Risk
| • | | Rarely lend with only one way out |
| | | |
| | | JPM PB | |
NPA ratio | | 0.35 | % |
NCO ratio | | 0.03 | % |
ALL / total loans | | 0.53 | % |
Operational Risk – Risk of Errors
| • | | Continuous focus on managing errors and managing to client guidelines |
| • | | Number of errors from 2006 to 2008 declined 48% |
| | |
 | | 5 |
Conclusions
ASSET MANAGEMENT
| • | | Despite a very challenging year, the business performed well making strong gains in Private Banking and Cash |
| • | | Our culture of strong risk management and putting our clients first enabled us to avoid many of the issues our competitors faced |
| • | | We are encouraged by how our Investment Teams are positioned for the year |
| • | | 2009 is expected to continue to produce challenges; however, there are signs of stability returning to the credit markets |
| • | | Most important measure in 2009 is whether our clients return to earning positive returns in their portfolios |
| | |
 | | 6 |
FEBRUARY 26, 2009
INVESTMENT BANK
��
Steve Black, Investment Bank Co-Chief Executive Officer
2008 IB financial performance
INVESTMENT BANK
($ in millions)
| | | | | | | | | | | | | | | |
| | | | | | | | | O/(U)2007 | |
| | | 2008 | | | 2007 | | | $ | | | % | |
Revenue | | $ | 12,214 | | | $ | 18,170 | | | $ | (5,956 | ) | | (33 | )% |
Investment banking fees | | | 5,907 | | | | 6,616 | | | | (709 | ) | | (11 | ) |
Fixed income markets | | | 1,957 | | | | 6,339 | | | | (4,382 | ) | | (69 | ) |
Equity markets | | | 3,611 | | | | 3,903 | | | | (292 | ) | | (7 | ) |
Credit portfolio | | | 739 | | | | 1,312 | | | | (573 | ) | | (44 | ) |
Credit costs | | | 2,015 | | | | 654 | | | | 1,361 | | | 208 | |
Expense | | | 13,844 | | | | 13,074 | | | | 770 | | | 6 | % |
Net income | | $ | (1,175 | ) | | $ | 3,139 | | | $ | (4,314 | ) | | NM | |
| | | | |
Key statistics1 | | | | | | | | | | | | | | | |
ROE2 | | | (5 | )% | | | 15 | % | | | | | | | |
Comp/revenue | | | 63 | % | | | 44 | % | | | | | | | |
ALL/total loans | | | 4.71 | % | | | 2.14 | % | | | | | | | |
EOP equity ($B) | | $ | 33 | | | $ | 21 | | | | | | | | |
1 | Actual numbers for all periods, not over/(under) |
2 | Calculated based on average equity |
2008 Summary
| • | | Strength of client franchise |
| | • | | #1 IB fees with substantial market share gains |
| | • | | Record revenue in Rates and Currencies, Credit Trading, Commodities and Emerging Markets |
| • | | ‘Open for business’ with ability to enter into large distressed trades |
| • | | Substantial de-risking achieved in highly illiquid markets |
| • | | Without impact of the Bear Stearns merger, 2008 net income would have been modestly positive |
| • | | Managed multiple, simultaneous credit events and record market volumes |
| • | | Weak trading in Securitized Products, Equity Derivatives, Loan Trading, Principal Investments and Fixed Income Hybrids and Exotics |
| • | | Marks of over ($10B) in mortgages and leveraged lending |
| | |
 | | 1 |
Key questions on your mind
INVESTMENT BANK
| • | | How much worse could it get from here? How prepared are you? |
| • | | How has your revenue mix changed, and what revenue mix do you expect going forward? |
| • | | How flexible is your expense base? What have you done and what can you still do? |
| • | | How do you think about your returns, given lower leverage, higher capital and challenging markets? |
| • | | What lessons have you learned from this crisis? |
| | |
 | | 2 |
J.P. Morgan competitive advantages
INVESTMENT BANK
| • | | Global client franchise |
| • | | “Fortress” balance sheet |
League Table Results
| | | | | | | | | | |
| | | 2008 | | | 20071 | |
| | | Rank | | Share | | | Rank | | Share | |
Global IB fees2 | | #1 | | 8.8 | % | | #1 | | 7.2 | % |
| | | | |
Global M&A announced2 | | #1 | | 24.4 | % | | #4 | | 18.7 | % |
| | | | |
Global debt, equity and equity-related3 | | #1 | | 9.7 | % | | #2 | | 7.6 | % |
| | | | |
Global equity and equity-related3,4 | | #1 | | 11.8 | % | | #2 | | 9.2 | % |
| | | | |
Global debt3 | | #1 | | 9.3 | % | | #2 | | 7.2 | % |
| | | | |
Global loan syndications3 | | #1 | | 11.5 | % | | #1 | | 12.8 | % |
Note: Rankings as of 12/31/08 for full year 2008 and full year 2007
1 | 2007 represents heritage JPM only |
4 | Global Equity and Equity-related includes rights offerings |
Major Awards
| | |
 | | Bank of the Year International Financing Review, December 2008 |
| |
 | | Derivatives House of the Year Bank Risk Manager of the Year Risk, January 2009 |
| |
 | | Best Overall Investment Bank Institutional Investor, December 2007 |
| |
 | | European Investment Bank of the Year Financial News, December 2008 |
| |
 | | Greenwich Quality Leader Greenwich Associates, December 2008 |
| | |
 | | 3 |
Flight to quality
Strong client flows across businesses as JPM becomes counterparty of choice
INVESTMENT BANK
| | |
| Prime Services | | • Equity Prime Brokerage more than doubled the number of $1B+ AUM client relationships from June to December; strong forward-looking pipeline |
| |
| | • On a market-adjusted basis, customer balances back to h-BSC peak levels |
| | • H-BSC contributed ~$500mm in revenue to Prime Services platform in 2008 |
| |
| Markets businesses | | • Markets client revenue increased 40% YoY |
| | • Rates/FX: Client revenue up more than 60%; 170% growth in Asia |
| | • Commodities: Client revenue up over 75% |
| | • Credit trading: Client revenue up over 50% |
| | • Emerging markets: Client revenue up nearly 60% |
| | • FI Exotics and Hybrids: Client revenue up nearly 40%, reflecting client restructuring opportunities |
| |
| | • Equity derivatives: Client revenue up nearly 20% |
| |
Advisory and capital markets | | • #1 global FIG wallet share |
| | • Advised & led elephant acquisition financings in midst of credit crisis |
| | |
 | | 4 |
Radical change in IB business environment
INVESTMENT BANK
| | | | | | |
| Major Events | | | | JPM Action Plan |
| Competition | | • End of broker dealer model • Industry consolidation • Capital bases under pressure; rapid deleveraging | |  | | • Continue to expand in Emerging markets, Commodities, Prime Services • Scale back in securitized products, structured credit and FI prime brokerage • Re-establish and redefine key markets • Invest in flow business technology and e-trading • Participate in centralized clearing for CDS • Opportunistically invest in distressed assets and recovery trades • Continue strong risk management practices • Re-allocate capital across businesses to maximize returns • Continue de-leveraging • Further align incentive structure with long-term returns on capital |
| | | |
| | | |
| | | |
| | • Periods of volatility and illiquidity • Record volumes • Multiple, simultaneous credit events | | |
Market dynamics | | | |
| | | |
| Client | | • Certain businesses experiencing permanent shrinkage • Hedge funds shrinking • Restructuring/risk mgmt focus | | |
| | • Greater government and regulatory oversight • Renewed focus on capital • Pressure on compensation | | |
| | | |
| Regulation | | | |
| | | |
| | | |
| | |
 | | 5 |
Growth, discipline and people remain the core of our 2009 strategy
INVESTMENT BANK
| | | | |
Growth | | Discipline | | People |
• Build and invest in future growth | | • Manage capital and leverage | | • Maintain our culture |
| | |
• Remain client centered | | • Risk management | | • Attract and retain the best people |
| | |
• Maintain market share gains | | • Maintain strong controls | | • Develop our talent |
| | |
• Be a scale player | | • Cut expenses and improve productivity | | • Drive management accountability |
| | |
• Re-establish and redefine key markets | | • Build technology capabilities | | |

Capitalize on our position of relative strength in everything we do
| | |
 | | 6 |
Growth — Fixed Income Markets
INVESTMENT BANK
��
2008 Achievements
| • | | Record revenue in Rates and FX, Emerging Markets and Credit Trading |
| | • | | Rates/FX revenue double the 2007 record |
| | • | | Record Russia and Middle East/North Africa revenue |
| | • | | Record Short-Term Fixed Income revenue |
| • | | Client revenue up more than 50% across products |
| • | | Leading market positions |
| | • | | #1 in Global Rate derivatives e-commerce1 |
| | • | | #1 Emerging Markets - Fixed Income player2 |
| • | | Infrastructure capabilities tested and proven during record volumes |
| • | | Increased client penetration in India, China, Korea, Taiwan and Malaysia markets |
| | • | | Additional product roll-outs |
| • | | Relentless focus on expenses and risk management |
| | |
 | | #1 Rates overall Best Emerging Markets IB |
| |
 | | Best Credit Derivatives House of the Year |
2009 Priorities
| • | | Enhance top 3 Rates/FX house position |
| | • | | Enhance technology and e-trading capabilities |
| • | | Maintain #1 position in Emerging Markets - Fixed Income and our Top 3 position in Emerging Markets - Equities and Corporate Finance |
| | • | | Strengthen local presence in priority markets: China, India, Brazil, Russia, Middle East/North Africa |
| | • | | Expand onshore products across Emerging Asia, including China securities presence |
| • | | Expand principal investment activities |
| • | | Selectively extend balance sheet in Emerging Asia |
| • | | Maintain scale advantage |
| 1. | Source: Bloomberg, Tradeweb |
| | |
 | | 7 |
Growth — Commodities platform expansion
INVESTMENT BANK
2008 Progress
| • | | Record economic revenue in 2008 |
| | • | | Client revenue up more than 75% YoY |
| • | | Emerged as a complete scale player |
| | • | | Significantly expanded physical platform |
| | • | | Broader and deeper client franchise |
| | • | | Greater origination capabilities |
| | • | | Principal investment expertise |
| • | | Integrated Bear Energy and ClimateCare acquisitions |
| • | | Organically built out Global Oil and Environmental markets capabilities |
| • | | Expanded in Europe and Asia |
| | |
 | | Structured Products House of the Year |
2009 Priorities
| • | | Integrate UBS’ Canadian and Agricultural business (closed January 2009) |
| • | | Become Top 3 player globally |
| | • | | Gain market share and attract talent while others divest |
| | • | | Leverage JPM’s firmwide client franchise (Global Sales teams, Commercial Banking and Private Bank) to offer more commodity and structured products to corporate and investor clients |
| • | | Expand principal investing |
| • | | Build out physical capabilities in Asia |
| | |
 | | 8 |
Growth — Prime Services
INVESTMENT BANK
2008 Progress
| • | | Successfully integrated activities across institutions |
| • | | Record growth in clients and revenue |
| | • | | BSC contributed ~$500mm in revenue in 2008 |
| | • | | Doubled the number of $1B+ AUM clients from June to December |
| | • | | Customer balances back up to h-BSC peak levels on a market-adjusted basis |
| | • | | 4thyear of double-digit F&O revenue growth |
Client Equity ($ in billions)
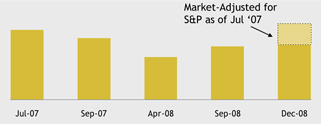
| | |
 | | Best in Class in OTC, Derivatives, Prime Brokerage |
2009 Priorities
| • | | Align Prime Services across 2 themes: |
| | • | | Securities Prime Brokerage & Finance |
| | • | | Futures & Options and OTC Clearing |
| • | | Expand Prime Brokerage internationally |
| • | | Concentrate on $1B+ client relationships |
| • | | Make significant investments in technology across the platform |
| • | | Track regulatory developments in hedge fund industry |
| • | | Maintain focus on risk and balance sheet management |
| | |
 | | 9 |
Growth — capitalizing on the firmwide platform
INVESTMENT BANK
IB Net Revenue Share ($ in millions)
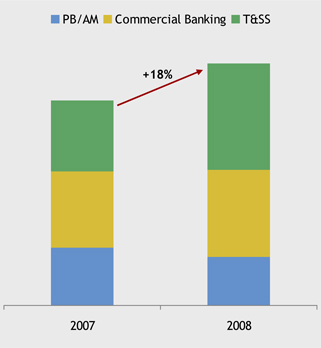
| • | | CB: Gross IB revenue from CB clients of $966mm |
| | • | | Target of $1B now reached |
| • | | T&SS: FX revenue from T&SS cross-sell up 59% YoY |
| • | | Global Corporate Banking JVbetween IB and T&SS posted 15% YoY revenue growth |
| | • | | Double-digit revenue growth |
| • | | Asset Management/Private Bank: Although revenue share marginally down YoY, strong collaboration continues with: |
| | • | | IB Referrals to Private Bank/Private Wealth Management up 18% YoY |
| | • | | Benefit from BSC merger |
| | |
 | | 10 |
Discipline — strong progress since the Bear Stearns merger
INVESTMENT BANK
Gross Assets ($ in billions)
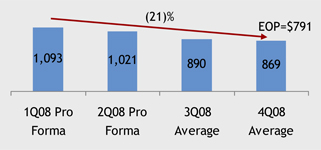
Basel I RWA ($ in billions)
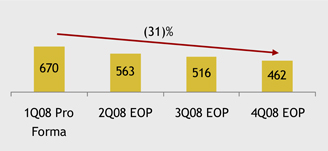
Adjusted Assets ($ in billions)
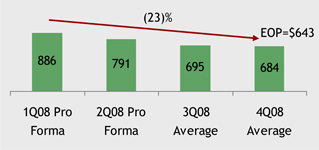
| • | | $33B of allocated capital |
| • | | IB TCE to total assets ratio is at high end of peers’ IB segments |
Note: 1Q08 asset tables represents average h-JPM balances plus March month end balance for h-BSC; 2Q08 pro forma asset tables represents averages for both h-JPM and h-BSC; Basel I RWA includes estimate of BSC at 3/31/08
| | |
 | | 11 |
Discipline — meaningful reduction in exposure
INVESTMENT BANK
2008 Exposure Reduction ($ in billions)
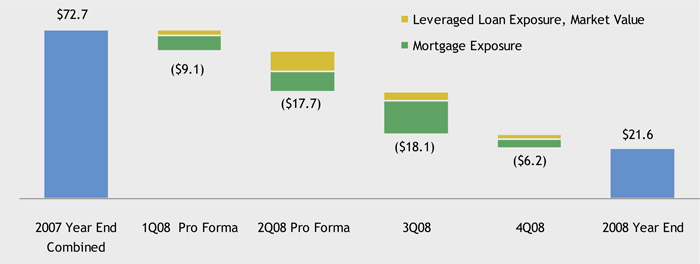
Exposure ($ in billions)
| | | | | | | | | | | | | | | |
| | | Combined | | | | | | |
| | | 12/31/07 | | 3/31/08 | | 6/30/08 | | 9/30/08 | | 12/31/08 |
Leveraged Lending, Market Value | | $ | 24.5 | | $ | 21.9 | | $ | 12.9 | | $ | 9.1 | | $ | 6.9 |
Mortgage-related | | | 48.2 | | | 41.7 | | | 33.0 | | | 18.6 | | | 14.7 |
| | | | | | | | | | | | | | | |
Total | | $ | 72.7 | | $ | 63.6 | | $ | 45.9 | | $ | 27.7 | | $ | 21.6 |
| | | | | | | | | | | | | | | |
Note: 2007 exposure represents h-JPM exposure at 12/31/07 combined with Bear Stearns exposure at merger. Leveraged loan exposure shown represents market value
| | |
 | | 12 |
Credit risk management overview
INVESTMENT BANK
| | | | |
| | | |  |
| | | | Bank Risk Manager of the Year Risk, January 2009 |
Credit Process
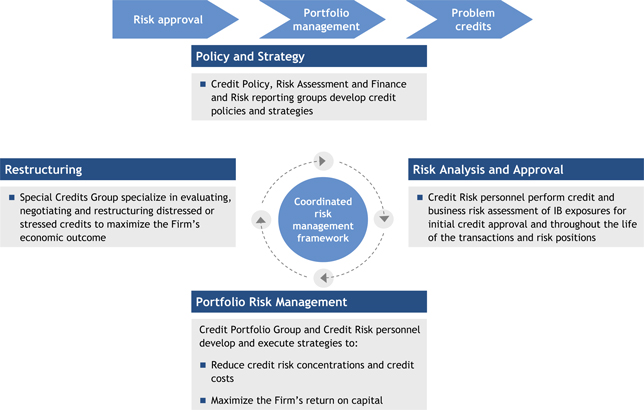
| | |
 | | 13 |
Portfolio is largely investment grade and well-diversified
IB traditional credit exposure of $325B was 26% drawn at year end 2008
INVESTMENT BANK
Credit Rating
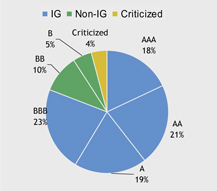
Maturity Profile
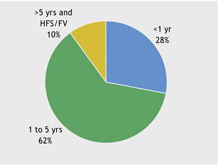
Sector Diversification
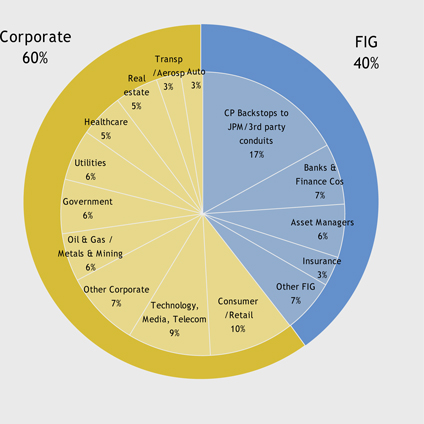
| | |
 | | 14 |
Level-setting 2008 loan portfolio measures
INVESTMENT BANK
| • | | IB credit metrics show some weakening but remain below historical peaks with a strong allowance coverage ratio |
Average IB Loans ($ in billions)
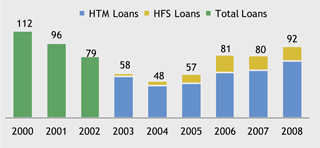
Nonperforming Loans ($ in millions)
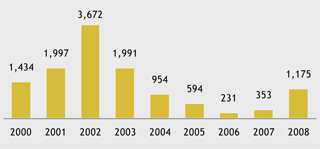
Credit Costs ($ in millions)
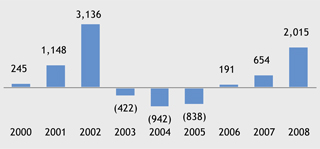
Allowance Coverage Ratio (%)
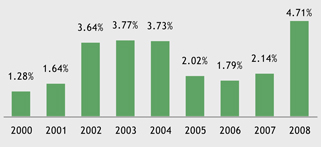
Note: Loan balances for 2000-2002 are presented on a combined basis for JPM IB loans and Bank One Corporate Banking loans ex. Commercial Real Estate loans; prior to 2002, HTM/HFS loan split was not available. 2002 credit costs are pro forma for Bank One. Nonperforming loans and allowance coverage ratio for 2000-2002 and Credit Costs for 2000-2001 represent h-JPM only for commercial loans. Loan balance, Credit Costs, NPLs and allowance ratio for 2003-2004 are pro forma for Bank One.
| | |
 | | 15 |
Financial performance target
INVESTMENT BANK
| • | | Continue to have an industry-leading ROE |
| | • | | Stretch target of 20% ROE through the cycle |
| | • | | Normalized 2008 ROE in the mid-teens |
| • | | Acknowledge difficulty to achieve in near-term; longer-term plan to get there by: |
| | • | | Maintaining market share gains |
| | • | | Investing in top growth initiatives |
| | • | | De-leveraging and reducing capital over time |
| • | | Capital base of $33B driven by current market conditions and convergence of economic and Basel II capital models |
| • | | Reduced ROE volatility would also be valued by shareholders |
| | |
 | | 16 |
What can you expect from J.P. Morgan’s Investment Bank?
INVESTMENT BANK
| • | | Leading market share achieved through client focus |
| • | | Investment in growth — e.g., Commodities, Emerging Markets, Prime Services, and Principal Investments |
| • | | Opportunistic investing driven by market conditions |
| • | | Disciplined approach to capital, expenses and headcount |
| | • | | Ensure we are sized appropriately |
| • | | Conservative approach to risk management, credit reserving and valuation |
| • | | Complete Bear Stearns integration and achieve additional noncomp expense benefits |
| | • | | Technology, infrastructure |
| • | | Strive for industry-leading ROE |
| | |
 | | 17 |
FEBRUARY 26 , 2009
DERIVATIVES
Bill Winters, Investment Bank Co-Chief Executive Officer
Agenda
DERIVATIVES
| • | | Questions we will try to answer |
| • | | How important are derivatives to JPM? |
| • | | How does JPM manage risks associated with our derivative activities? |
| • | | What key themes are emerging in the changing derivatives landscape? |
| | |
| Some detail on current myths and misconceptions | | 27 |
| | |
 | | 1 |
Derivatives are widely used by 90% of large companies
DERIVATIVES AT JPM
| | |
What do we mean when we say derivatives? | | • “A contract whose value is based upon the performance of an underlying financial asset, index, or other investment.” ~ Barron’s Dictionary of Finance and Investment Terms |
| | • Derivatives are commonplace and generally standardized products referencing major markets like USD interest rates, FX rates, corporate credit indexes or commodity prices |
| |
| Who uses derivatives? | | • Large corporations (>$2B in sales) are highly dependent on OTC FX and interest rate derivatives. 66% used FX hedges and 45% used rate hedges1. Mid-size corporations are similarly active |
| | • Extensive use by Governments, Agencies and Supranationals both to manage risk and lower the cost of capital |
| | • Derivative dealers and asset managers use derivatives as risk hedging tools and as part of market making activity |
| |
What are derivatives used for? | | • Allow companies to mitigate volatility in non-core activities, such as changes in FX rates and interest rates |
| | • Allow companies to reduce their cost of capital |
| | • Allow investors to gain specific exposure profiles to suit their investment objectives and risk tolerances |
| | • Client problems range from simple to complex; derivative solutions can come in many forms: flow or exotic in various asset classes |
1 | Per 2009 Greenwich Associates survey |
| | |
 | | 2 |
Derivatives have many uses but we can simplify down to four categories
DERIVATIVES AT JPM
| | | | | | | | |
| | Risk Management | | Defensive Investing | | Leveraged Investing | | Professional / Liquidity |
| | | | |
| Overview | | Derivatives mitigate or transform clients’ exposures to interest rates, currencies, etc. | | Derivatives are used to make investments which provide the opportunity for gains while protecting from loss (e.g., capital protection) | | Derivatives are used to provide leveraged returns on invested capital - both upside and downside | | Trading between dealers and other dealers or other professionals to distribute risk to the market |
| | | | |
Typical clients | | • Clients with specific business need • Corporations • Financial institutions • Governments | | • Investor clients • Asset managers • Pension funds • High Net Worth investors (via distributors) | | • Investor clients • Hedge funds • Asset managers • Prop traders | | • Other broker/dealers |
| | | | |
Example products | | • FX forwards • Interest Rate Swaps • Credit Default Swaps • Deal contingent customized payouts | | • Collars • Principal protected structured notes | | • Options (uncovered) • Swaps • Binary payouts • Correlation trades | | • All flow products • Structured products |
| | | | |
Demand outlook1 | |  | |  | |  | |  |

| | |
 | | 3 |
Derivative products generate a meaningful part of JPM’s revenue and profits
DERIVATIVES AT JPM
2006-2008 JPM Firmwide Revenue
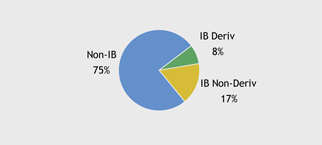
Source: Average revenue 2006-2008
2006-2008 Derivative Revenue by Client Sector

Source: Average client revenue 2006-2008
2006-2008 Derivative Revenue by Asset Class
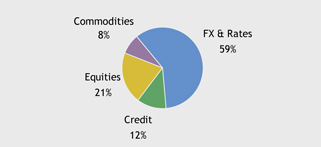
Source: Average revenue 2006-2008:
2006-2008 Derivative Revenue by Client Credit Rating
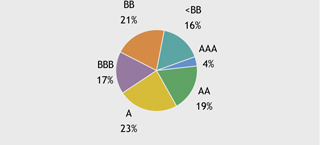
Source: Average client revenue 2006-2008
| | |
 | | 4 |
Derivatives are also a core component of JPM’s RWA, economic capital and balance sheet
DERIVATIVES AT JPM
FY 2008 JPM Firmwide Risk Weighted Assets
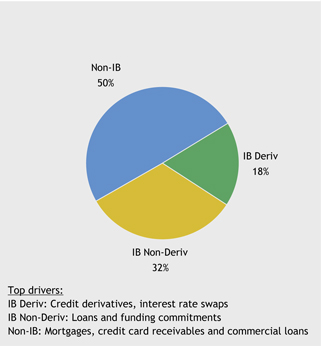
Source: Average quarterly RWA
FY 2008 JPM Firmwide Assets
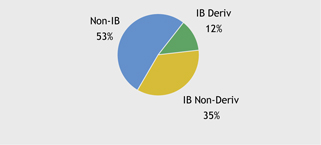
Source: Average daily 3rd party assets
FY 2008 Derivative Receivables by Duration
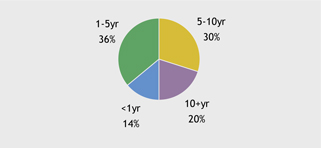
Source: Average quarterly gross receivables
| | |
 | | 5 |
JPM is one of the significant dealers in derivatives
DERIVATIVES AT JPM
Trading Assets - Derivatives Net Receivables ($ in billions)
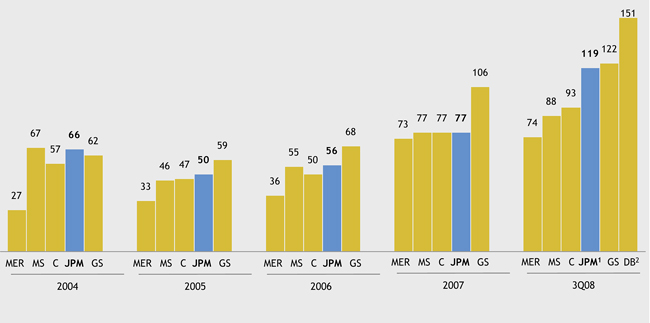

Source: Firms 10-Q/10-K/6-K; DB 4Q Investor presentation US GAAP equivalent
Note: Net of Fin 39 netting and cash collateral; End of period balances
1 | Significant 2008 increase due to impact of BSC, $18B at the end of May 2008 |
2 | DB derivatives net receivables on US GAAP pro forma - €107B for 3Q08 |
| | |
 | | 6 |
JPM manages the risks associated with derivatives along six dimensions
DERIVATIVES AT JPM
| | | | |
| 1 | | Market | | Exposure to an adverse change in the market value of financial instruments caused by a change in market prices or rates |
| | |
| 2 | | Counterparty Credit | | A counterparty’s inability to make payments or otherwise perform under its contracts with JPM leading to direct credit exposure as well as open market risk positions |
| | |
| 3 | | Operational | | Operational errors, omissions and processing backlogs, resulting in financial loss |
| | |
| 4 | | Liquidity | | Liquidity calls arising from a credit downgrade, counterparty defaults or through mismatched cash flows |
| | |
| 5 | | Legal | | Risk that contractual terms will be unenforceable, including due to suitability issues or other claims by the counterparty |
| | |
| 6 | | Reputational | | Risk to JPM’s reputation because of its association with a transaction that is perceived to reflect inappropriate accounting, tax positions or regulatory arbitrage by our counterparty or mis-selling on the part of JPM |
| | |
 | | 7 |
JPM uses six core tools to measure and manage market risk
DERIVATIVES AT JPM
| | |
| Stress testing | | • Large number of stresses across all asset classes • Combined in many ways to search for vulnerabilities • Useful for understanding non-linear exposures |
| |
| VaR | | • Potential loss from simulated historical market moves based on worst days over the last year • Useful for understanding risks within a range |
| |
| Sensitivities to market variables | | • Sensitivities to a wide spectrum of risk parameters • Aggregation of key sensitivities enables early identification of concentrated positions • Useful complement to VaR and stress testing |
| |
| Risk Identification for Large Exposures (RIFLEs) | | • Identification of potential losses arising from idiosyncratic events (e.g. unexpected tax legislation, change in law) • Scenarios developed by independent risk functions as well as business – self assessment |
| |
| P&L drawdown | | • Losses from P&L drawdowns by business and sub-business monitored daily and subjected to limits • Useful in early identification of problems |
| |
| Risk-adjusted return | | • New and existing products or trade opportunities reviewed to understand risk-adjusted returns to ensure they meet appropriate hurdles • Many of the problems we avoided were caught by these analyses |
| | |
 | | 8 |
Stress Testing Deeper Dive: focus on JPM’s dealer exit scenario
DERIVATIVES AT JPM
| • | | We have deliberately constrained our trading books to reduce the potential financial risk identified by our Dealer Exit scenario |
| • | | This estimates the impact on the market price of certain derivatives following the exit of a large market participant (e.g. dealer or hedge fund) |
| • | | Focused historically on the structured and exotic risk books where dealers tend to share position concentrations. Extended to include other less liquid positions thought to be commonly held |
| • | | These market risk scenarios are incorporated within firmwide stress analyses and measured against limits |
| • | | We have an additional process for measuring contingent market risks to potential counterparty failure. Quantifies re-hedging needs by asset class and business, highlighting concentrated exposures that are likely to move against us in the event of a dealer exit (Wrong-Way Risk) |
| • | | Connected process to ensure operational risk from counterparty default is appropriately managed |
| | |
 | | 9 |
JPM’s risk management has proven to be robust and critical to avoiding the largest issues to date
DERIVATIVES AT JPM
| | | | |
| | Structured Investment Vehicles (SIV) | | ABS Super Senior |
| | |
| Issues | | • SIV sponsor banks provided liquidity back-stops to their SIV’s, effectively transferring the risk back to the bank in falling markets • Fees for back-stops were not sufficient to compensate for risks • Sponsoring SIV’s carried reputation risks that induced banks to consolidate and bail out their funds | | • ABS Super Senior structures presented true tail risk • Such risks are difficult to hedge and losses can ramp up very quickly • Market initially under-priced risks inherent in the structures • High volume of deal flow created potential for concentrated risk positions |
| |
| Lessons / Actions | | • Detailed due diligence to avoid transactions with low returns and potential of outsize losses (low return/fat tail) • Appropriate limits set to avoid risk concentrations • Avoided material loss as a result of limits, diligence and return discipline • Treat sponsored funds and products as if they remain on our own balance sheet |
| | |
 | | 10 |
However, smaller losses did occur in specific areas
DERIVATIVES AT JPM
| | | | | | |
| | Worst-Of Basket Options | | Muni/Libor Spreads | | Corporate Currency Hedges |
| | | |
| Issues | | • Options with payout based on the worst performing stock from a pre-selected basket • High exposure to correlation of price movements of stocks within the basket • Crowded trades - many dealers had similar positions, increasing hedge costs and exacerbating market movements | | • Exposure to the ratio of Muni to Libor rates through client-related transactions • Relationship of Muni and Libor spreads changed and unexpectedly traded through natural arbitrage levels • Counterparties to hedges had concentrated positions to Muni/Libor ratio leading to defaults and losses for JPM | | • Corporate clients undertaking sophisticated FX hedging strategies • High volatility in underlying currencies resulting in large P&L swings • Incomplete understanding of client motivation for trading strategy • Incomplete understanding of full size of client positions with other dealers |
| | | |
| Lessons | | • Reset limits to be more in line with risk characteristics of structures • Pricing changed to fully reflect all risks | | • Do not assume that natural price boundaries cannot be breached • Improve scenario analyses to capture potential for counterparty concentration | | • Insist on full understanding of client’s trading motivations and positions • Improve stress testing to capture breakdown of historically stable price relationships |
| | |
 | | 11 |
Some derivatives can be complex to value; these are disclosed as Level 3 assets in our financial statements
DERIVATIVES AT JPM
3Q08 Level 3 Assets as a Percentage of Total Assets

($ in billions)
| | | | | | | | | | | | | | | | | | | | | |
| | | C | | | MS | | | MER | | | JPM | | | GS | | | DB1 | | | BAC | |
Level 3 Assets | | 173 | | | 78 | | | 61 | | | 145 | | | 68 | | | 130 | | | 71 | |
Level 3/TCE | | 3.93 | x | | 2.56 | x | | 2.46 | x | | 1.68 | x | | 1.82 | x | | 3.84 | x | | 1.54 | x |
| • | | Valuations are typically derived using financial models or require illiquid/difficult to observe market data |
| • | | Inherent uncertainties in such processes are managed through the use of Fair Value Adjustments (FVA) |
| • | | Model review is also a key part of the overall risk and control framework for these products |
Source: Company 3Q 10-Q/6-K
1 | Deutsche Bank reports under IFRS, and is not directly comparable to the other US GAAP reporting firm; Level 3 assets are “held at fair value which are measured using valuation techniques with unobservable parameters” |
| | |
 | | 12 |
Measurement and mitigation of counterparty credit risk at JPM
DERIVATIVES AT JPM
Measure
| • | | Notional is a reference amount and not a good gauge of risk exposure |
| • | | Mark-to-market exposure is the current value of a derivative contract and is a key measure |
| • | | Other measures estimate future changes in exposure such as loan equivalent and near-worst-case exposure |
Mitigate
| • | | Establish global counterparty-specific credit lines |
| • | | Transactions with a single counterparty under a Master Netting Agreement are netted in case of default |
| • | | Require counterparties to post collateral in most cases, offsetting losses if a counterparty defaults |
| • | | Mark exposures to market and ‘reserve’ against possible credit losses based on expected exposure (Credit Valuation Adjustment or CVA) |
| • | | Purchase hedges (CDS) from high quality counterparties to reduce risk where appropriate |
| • | | In some cases, JPM has the ability to terminate early or call additional collateral should a counterparty’s credit deteriorate |
| | |
 | | 13 |
Notional outstanding measures gives a misleading picture of counterparty exposure
DERIVATIVES AT JPM
JPM Gross Derivative Counterparty Exposure in 4Q08
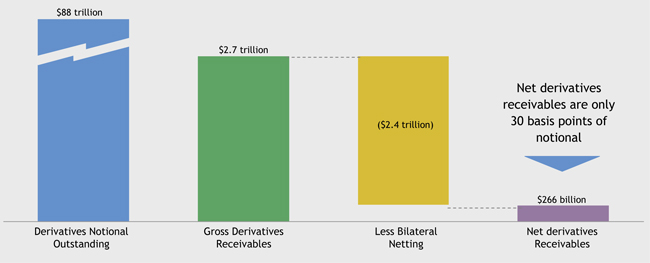
| • | | Gross receivables measures current value of all transactions before taking account of netting |
| • | | JPM can net its derivatives payables and receivables with a given counterparty, reducing the assets on its balance sheet and its counterparty credit exposure. We only assume netting works where we are highly confident based on law and precedent |
| | |
 | | 14 |
Through effective use of collateral, JPM reduces its counterparty exposure by almost half
DERIVATIVES AT JPM
JPM Net Derivative Counterparty Exposure in 4Q08 ($ in billions)
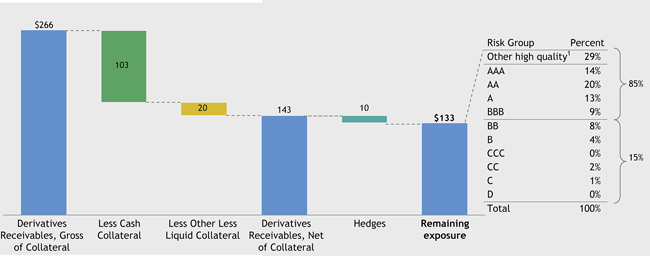
| • | | 85%+ of counterparties (including most financial institutions) are required to post collateral daily, reducing JPM’s credit risk, even in times of market volatility. We remain exposed to “gap risk” (i.e. sudden change in market value without ability to re-hedge) which we monitor and limit |
| • | | Governments, Supranationals and some corporations are not typically collateralized |
1 | Other high quality includes low risk counterparties, including senior or preferred positions in special purpose entities |
| | |
 | | 15 |
Generic example of counterparty netting and collateral
DERIVATIVES AT JPM
Client Trades to Receivables Net of Cash Collateral
| • | | All client trades in this example are covered under an ISDA Master Agreement, allowing receivables and payables to offset |
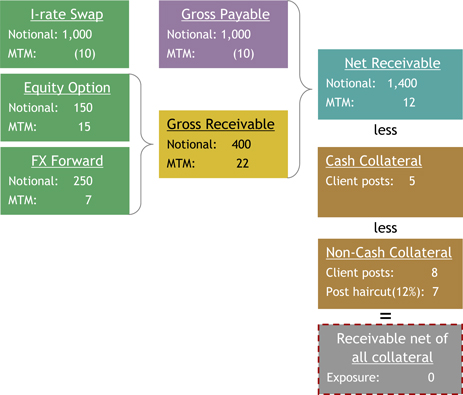
| | • | | Cash balances held at JPM |
| | • | | No haircut applied to cash $100 of cash collateral reduces net receivables by $100 |
| | • | | Highly liquid, marketable securities |
| | • | | Almost exclusively G7 Government securities and Agency securities |
| | • | | Haircut applied (1-25%+) |
| | • | | A 10% haircut means that $100 of collateral reduces net receivables by $90 |
| | |
 | | 16 |
Specific example client netting and collateral
DERIVATIVES AT JPM
Example Client JPM Gross Derivative Counterparty Exposure in 4Q08 ($ in millions)
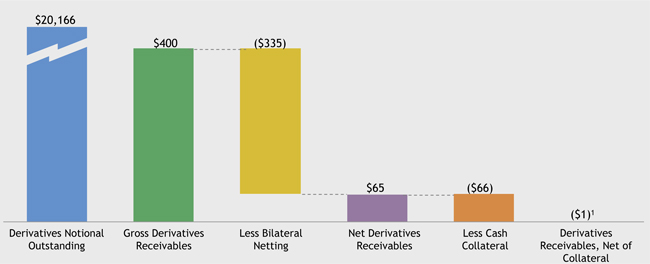
| • | | Large, very high quality counterparty with diverse trade profile |
| • | | Fully collateralized with significant netting benefits |
| • | | Additional CVA reserve $1.3mm (zero current exposure but reserve protects against changes before new collateral is posted) |
1 | Derivatives receivables cannot be less than $0; ($1mm) reflects over collateralization from client |
| | |
 | | 17 |
JPM’s counterparty credit risk is concentrated with investment grade clients and hedge fund exposure is more than fully collateralized
DERIVATIVES AT JPM
JPM Investment Bank Credit Exposure
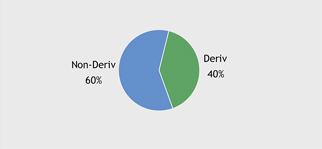
Source: Non Deriv = Total Traditional Credit Product, Deriv = Gross MTM as of Dec 31, 2008
Derivative Exposure by Client Credit Rating
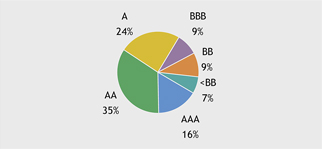
Source: Gross MTM as of Dec 31, 2008
Derivative Exposure by Client Sector
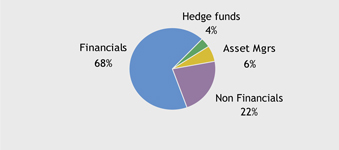
Source: Gross MTM as of Dec 31, 2008
Top Hedge Fund Clients by Derivative Receivables ($mm)
| | | | | | | | | | |
Client | | Net
receivables | | Collateral
posted | | Net
exposure | |
Hedge fund A | | $ | 1,408 | | $ | 2,503 | | $ | (1,095 | ) |
Hedge fund B | | | 245 | | | 333 | | | (88 | ) |
Hedge fund C | | | 180 | | | 251 | | | (71 | ) |
Hedge fund D | | | 155 | | | 221 | | | (66 | ) |
Hedge fund E | | $ | 150 | | $ | 358 | | $ | (208 | ) |
Total | | $ | 2,138 | | $ | 3,666 | | $ | (1,528 | ) |
| | | |
All Hedge funds | | $ | 9,555 | | $ | 15,776 | | $ | (6,221 | ) |
Note: Negative net exposure reflects over-collateralized counterparties
Source: As of Dec 31, 2008
| | |
 | | 18 |
JPM utilizes credit valuation adjustment (CVA) to ‘reserve’ against counterparty credit losses from derivatives, with significant strengthening of ‘reserves’ in 2008
DERIVATIVES AT JPM
Counterparty Risk Reserve ($ in billions)
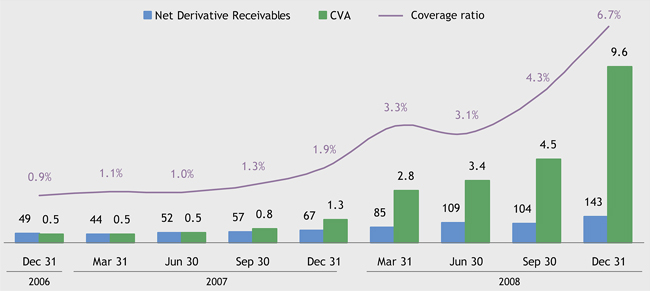
| | • | | Large increases in transaction mark-to-market values resulting in more counterparty credit exposure |
| | • | | Counterparty credit spreads widened |
| | • | | Underlying volatility increased, increasing expected future credit exposure |
| | |
 | | 19 |
CVA sensitivities: CVA increases as deals become more in the money and as counterparty credit spreads widen
DERIVATIVES AT JPM
CVA Example with an A+ Rated Counterparty ($ in millions)
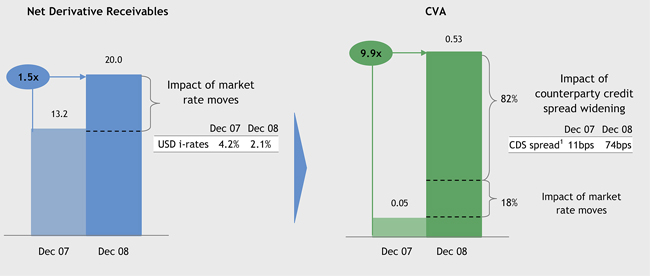
| | • | | Client trades did not change Dec 07 to Dec 08 |
| | • | | 2 USD interest rate swaps, one 5 yr and one 8 yr |
| • | | The large increase in CVA, in this case, is mostly driven by the large credit spread widening |
| | |
 | | 20 |
JPM maintains robust operational risk management to cope with increasing volumes
DERIVATIVES AT JPM
Key Operational Metrics ($ in thousands)
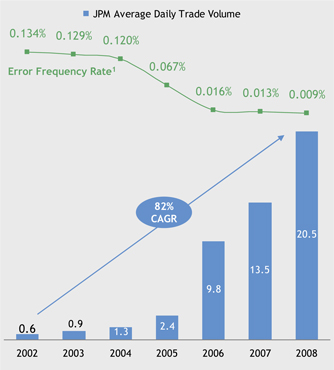
Source: 2002-2006 Zyen survey, 2007-2008 JPM internal reporting
1 | Assumes recorded errors reference trades processed in given year |
Operational Risk Management
| • | | Rapid growth in trade volumes has outpaced industry investment in operational infrastructure, driving: |
| • | | Increased pressure on JPM operational environment |
| | • | | Credit events and bankruptcies |
| | • | | Volatile market conditions |
| | • | | Bear Stearns integration |
| • | | Error levels improved from 2002 to 2008 on a relative basis from 0.13% to 0.009% of total trade volumes |
| • | | Significant number of credit events (12) in 2008 |
| | • | | 221,977 additional cash flows processed through JPM systems |
| | • | | Already 7 credit events in the first two months of 2009, well within JPM’s processing capacity |
| • | | BSC integration added approximately 300k (external) transactions to JPM’s books (30% increase to JPM’s external book) as of March 2008 |
| | |
 | | 21 |
JPM continues to be a leader in processing OTC confirmations
DERIVATIVES AT JPM
Total Industry Monthly Confirmable Trade Volume
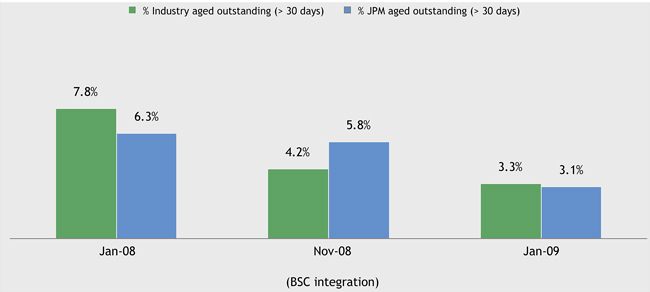
| • | | From Jan 2008 to Jan 2009: |
| | • | �� | Total industry confirmation volume i 7% |
| | • | | JPM confirmation volume h 46% |
| • | | Despite increased market share and the Bear Stearns integration, JPM is again outperforming |
Source: Markit monthly data
| | |
 | | 22 |
Liquidity risk
DERIVATIVES AT JPM
Derivative Liquidity Risk: Two Common Examples
Credit Rating Downgrade
| • | | The impact of a single-notch ratings downgrade to JPMorgan Chase Bank, N.A., from its rating of “AA-” to “A+” at December 31, 2008, would have required $2.2 billion of additional collateral to be posted by the Firm. A downgrade to BBB- would increase the collateral callable to $6.4B |
Mismatched cash flows
| • | | Some contracts have receipts and payments of cash occurring at different points over the life of the trade, with the potential to cause liquidity drains at key times. |
This is tracked
| | |
 | | 23 |
5/6
Legal and reputational risk
DERIVATIVES AT JPM
Legal Risk
In-depth internal legal review of new or non-standard contracts or counterparties
| • | | Due diligence performed on counterparties’ power and authority to enter into the derivative contract |
| • | | Normally governed under New York or English law and submitted to relevant courts for disputes |
Reputational Risk
Robust Reputation Risk Management process
| • | | Transactions may be triggered for further review for several reasons: |
| | • | | Nature of transaction - complex, risky, tax or accounting motivation etc. |
| | • | | Profitability - overly high or low |
| | • | | Unusual legal jurisdiction |
| • | | Such reviews are conducted by our Reputation Risk Committee |
| | • | | Comprised of senior risk and control officers of the firm along with senior business leaders (providing a peer review) |
| | • | | Final approval for such transactions is provided by this group |
| | |
 | | 24 |
The derivatives landscape is changing; several key themes are emerging (1 of 2)
DERIVATIVES AT JPM
| | | | |
Proposition | | Thesis | | JPM View |
| All derivatives should be traded on exchanges | | • Exchanges improve the transparency of prices, open interest and operational ease of processing contracts • Exchanges are more easily regulated and impose mechanisms to ensure orderly trading (e.g. circuit breakers) | | • Most liquid and transparent markets are not on exchanges (FX, US Treasuries, etc.) • OTC markets allow precise transfer of risk tailored to clients’ requirements, unachievable through standardized exchanges • Exchange margin requirements are not appropriate for some clients–set to lowest-quality participant • Existing OTC products on exchanges are rarely used by clients (e.g. interest rates swaps on CME) • OTC markets provide an effective “incubator” function for developing new markets and products • OTC markets often offer lower execution cost |
| | |
| All derivatives should settle though a clearing house | | • A clearing house decreases the systemic risk from a counterparty failure | | • JPM and other key derivative market players strongly support a clearing house for highly standardized and highly liquid derivatives • Automates trade confirmation and current process of netting between largest derivatives dealers • Counterparty risk becomes an extremely unlikely (but possible) event - default of the clearing house • Bilateral clearing works very well for non-standard contracts that clearing houses cannot accommodate |
| | |
 | | 25 |
The derivatives landscape is changing; several key themes are emerging (2 of 2)
DERIVATIVES AT JPM
| | | | |
Proposition / Issue | | Thesis | | JPM View |
| Growing volume of derivatives has become too large to manage and should be limited | | • The OTC Derivatives market has grown rapidly in recent years • Each contract requires bilateral negotiation and confirmation • Greatly increased cash flow processing, particularly on key payment dates (e.g. quarterly settlement of CDS contracts) | | • Continuing efforts to reduce number of outstanding trades: • Industry CDS notional reduced from $60T to $28T in 2008 • Bilateral unwinds or multilateral tear-ups • Industry aged outstanding confirmations down 61% over the last 12 months • Progress towards automation of confirmation process |
| | |
| Credit event processing operationally overwhelmed the derivatives industry | | • Prior to 2008 there had been few significant credit events, while the volumes of CDS contracts grew exponentially • Investment in operational infrastructure did not keep pace with this growth | | • 12 major credit events in 2008; 7 in the first two months of 2009, with more likely • The recent large upswing in credit events has shown that the industry has coped well • ISDA auction mechanism worked in all cases and the industry and regulators are working together to drive down processing times and other backlogs |
| | |
| Short CDS selling should be banned | | • Aggressively shorting certain names through CDS can rapidly increase the funding cost of the underlying borrower and increase the chance of financial distress or bankruptcy | | • ‘Shorting’ in the CDS market is the only way to hedge counterparty credit risk though a liquid financial instrument in an efficiently priced market • CDS market provides valuable price discovery function for the credit markets • Market manipulation should be prevented in every market, including CDS |
| | |
 | | 26 |
Agenda
DERIVATIVES
| | |
| | | Page |
| Derivatives at JPM | | 1 |
| |
| Some detail on current myths and misconceptions | | 27 |
| • | | Could the CDS market withstand a credit event on major dealers?: Case study of the Lehman Brothers Holdings Inc. (“LEH”) default |
| • | | Were credit derivatives responsible for the fate of American International Group, Inc. (“AIG”)? |
| • | | What are the benefits of derivatives? |
| | |
 | | 27 |
Could the CDS market withstand a credit event on a major dealer?
Case study of the LEH default
SOME DETAIL ON CURRENT MYTHS AND MISCONCEPTIONS
Details Around CDS Referencing LEH
| • | | Pre-auction market speculation on the outstanding CDS referencing LEH grossly overestimated net payments by sellers of CDS protection |
| • | | Payments from sellers of CDS protection were a fraction of the estimated $101B in value destruction for LEH bondholders |
| • | | CDS on LEH successfully settled less than 6 weeks after the bankruptcy filing, through the DTCC auction, also helped by the high levels of collateralization in the market |
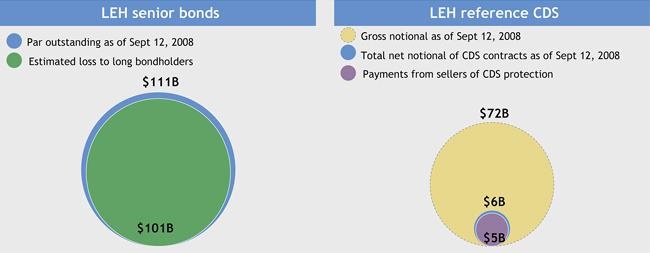
Note: LEH senior bonds assume 8.625% recovery rate; LEH gross CDS notional and CDS losses (91.375% of notional paid) per DTCC summary of CDS auction
| | |
 | | 28 |
Top five recent bankruptcies show that payments from sellers of CDS protection are far less than bondholder losses
SOME DETAIL ON CURRENT MYTHS AND MISCONCEPTIONS
Recent Bankruptcy Bond Loss Versus Payments from Sellers of CDS Protection ($ in billions)
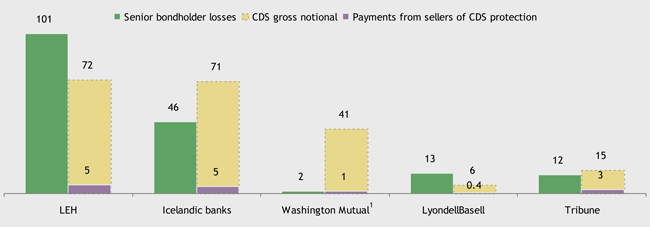
| • | | Recent bankruptcies have illustrated that the payments from sellers of CDS protection are far less than the losses to senior bond holders |
| • | | Notional outstanding grossly overstates the net market position |
Sources: Senior bonds outstanding: J.P. Morgan Research; CDS outstanding: DTCC auction data; Bond/CDS recovery rates: DTCC auction data
Note: Icelandic banks include Landsbanki, Glitnir and Kaupthing; bondholder losses assume recovery rate achieved in CDS auction; LyondellBasell includes bank loan; Tribune includes all senior unsecured debt, including bridge facility
1 | Washington Mutual refers to Washington Mutual Inc. |
| | |
 | | 29 |
Were credit derivatives responsible for the fate of AIG?
SOME DETAIL ON CURRENT MYTHS AND MISCONCEPTIONS
AIG Financial Products Notional and Losses from Credit Derivatives
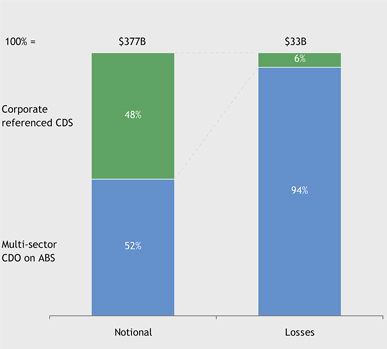
AIG Loss Drivers
| • | | AIG was a significant seller of protection on sub-prime mortgage-related asset- backed securities, including mortgage related CDOs |
| • | | When the mortgage market experienced higher-than-expected losses, these positions experienced significant losses |
| • | | This underestimation of mortgage defaults resulted in similar catastrophic losses in many banks through loans rather than derivatives (e.g. WaMu) |
| • | | Material losses were incurred in an unregulated entity |
| • | | External observers did not note (or were not able to note) increasing exposures |
| • | | As losses emerged, the company faced a credit downgrade, triggering additional collateral calls |
Source: AIG Credit Presentation; AIG Financial Products Super Senior CDS portfolio, data as of September 30, 2008; 10-Q/K
| | |
 | | 30 |
Derivatives play a useful and necessary role in financial markets
SOME DETAIL ON CURRENT MYTHS AND MISCONCEPTIONS
Benefits of Derivatives
Necessary for Risk Management
| • | | The vast majority of large corporations use derivatives to manage non-core business risks (e.g. changes in FX rates, interest rates, changes in commodity prices) |
| | • | | Allows management to focus time on key business objectives |
| | • | | Reduces uncertainty in financial planning, capital management, and borrowing costs |
Efficient and Cost Effective
| • | | Corporate credit derivatives are particularly efficient, as they are the most liquid instruments available to manage exposure to credit risk |
| • | | Corporate credit derivatives enable lenders to hedge corporate credit risk, lowering the cost of capital for borrowers and freeing up greater lending capacity to drive the economy |
| • | | The corporate CDS markets have remained more liquid than bond markets in recent stressed periods, providing a valuable price discovery mechanism for corporate credit |
Necessary for effective investing and asset management
| • | | Derivatives allow investors and asset managers to take exposure to particular companies and markets with the ability to quickly change that exposure in a cost-effective way |
| • | | Retirement and pension funds use derivatives to manage the risk associated with their liabilities |
| | |
 | | 31 |
In conclusion…
SOME DETAIL ON CURRENT MYTHS AND MISCONCEPTIONS
| • | | The derivatives industry continues to play an important role in capital markets and the overall economy for the foreseeable future |
| | • | | Clients will still need to manage risk |
| | • | | J.P. Morgan remains committed to its derivatives franchise |
| • | | J.P. Morgan and the industry will continue their focus on managing the risks from derivatives |
| | • | | Continue to develop leading risk management framework and governance structure |
| | • | | Incorporate the recent lessons and continue to be a leader in managing risk |
| • | | The industry landscape is changing and JPM is committed to help: |
| | • | | Improve operational efficiency |
| | |
 | | 32 |


