 November 5, 2009 2 0 0 9 B A N C A N A L Y S T S A S S O C I A T I O N O F B O S T O N C O N F E R E N C E Charlie Scharf, Chief Executive Officer, Retail Financial Services Exhibit 99.1 |
 Agenda Page 1 Financial Performance 1 Credit Update 3 Foreclosure/REO 10 WaMu / Branch Banking Update 21 |
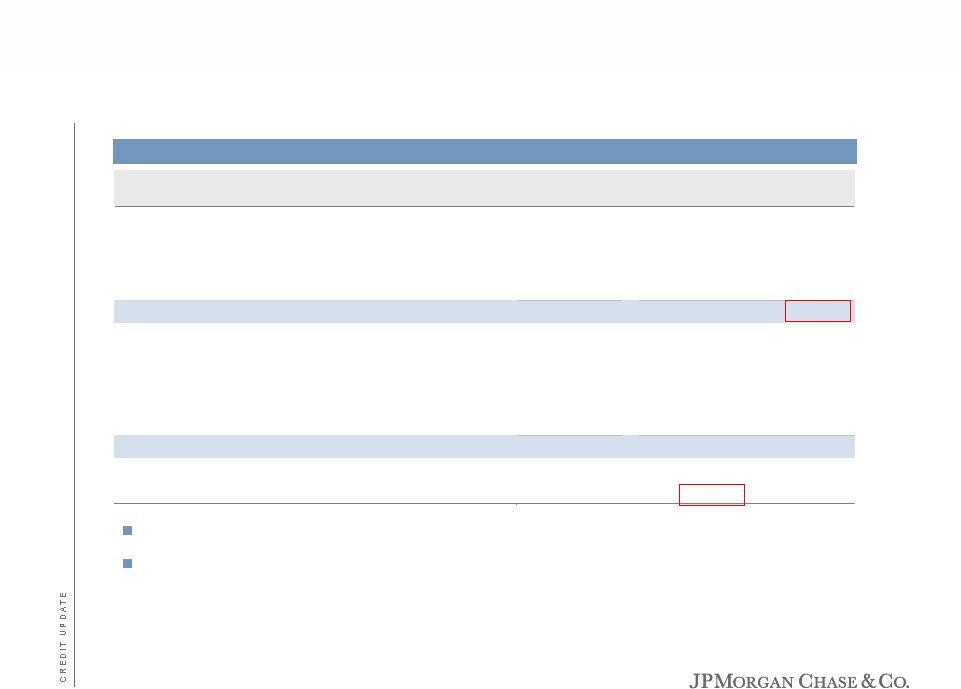
 Strong and consistent performance in Retail Banking Some initial signs of stability in consumer delinquency trends, but we are not certain if this trend will continue Prime and subprime mortgage late stage delinquencies impacted by foreclosure moratorium, extended REO timelines and trial modifications Additions to loan loss reserve of $730mm, $1,197mm, and $1,438mm for 3Q08, 2Q09 and 3Q09, respectively 3Q08 2Q09 3Q09 Retail Banking $723 $970 $1,043 Mortgage Banking (32) 213 280 Auto & Student Loans 93 22 132 Home Lending Portfolio (720) (1,190) (1,448) Consumer Lending ($659) ($955) ($1,036) Retail Financial Services $64 $15 $7 Retail Financial Services — results 2 Net income/(loss) ($ in millions) |
 Agenda Page 3 Credit Update 3 Financial Performance 1 Foreclosure/REO 10 WaMu / Branch Banking Update 21 |
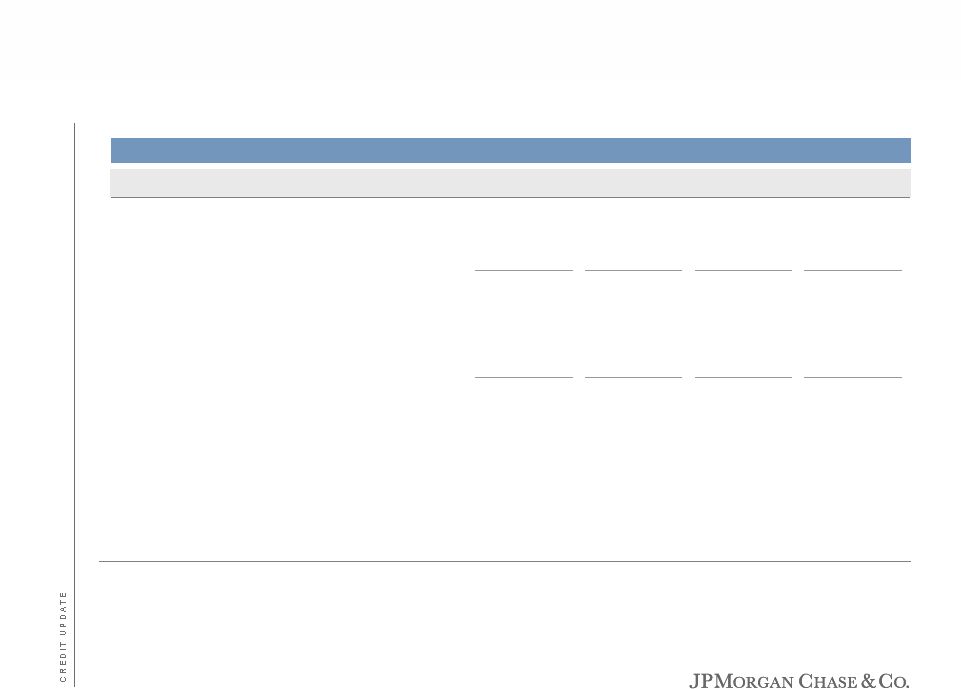
 Portfolio Total Loans Non Credit- Impaired Credit- Impaired Home Equity $139.2 $104.8 $34.4 Option ARM 47.4 8.9 38.5 Prime Mortgage 82.6 22.7 Subprime Mortgage 22.6 13.3 9.3 Total Home Lending Portfolio $291.8 $186.9 $104.9 Fair Value Mark $21.7 NA $21.7 Fair Value Mark % of Loans NA NA 21% Home Lending Carrying Value $270.1 $186.9 $83.2 Auto 44.3 44.3 NA Student and Other 14.9 14.9 NA Total Consumer Lending Portfolio $329.3 $246.1 $83.2 Loan Loss Reserve $12.3 $11.2 $1.1 LLR as % of Loans NA 4.6% NA 36% of total loans or $105B credit-impaired portfolio is marked 4.6% reserve ratio on non-credit impaired portfolio 1 Credit-impaired represents UPB not book value; excludes prime mortgage loans and student loans classified as held-for-sale 2 Non credit-impaired excludes prime mortgage loans classified as held-for-sale Consumer Lending portfolio 4 Outstandings as of 9/30/09 ($ in billions) 1 59.9 2 |
 Total non credit-impaired loans include Retail Banking and Consumer Lending loan balances Excludes the impact of purchased credit-impaired loans that were acquired as part of the Washington Mutual transaction. These loans were accounted for at fair value on the acquisition date, which incorporated management’s estimate, as of that date, of credit losses over the remaining life of the portfolio. An allowance for loan losses of $1.1 billion has been recorded for these loans as of September 30, 2009. No allowance for loan losses was recorded as of June 30, 2009, March 31, 2009, December 31, 2008, and September 30, 2008, respectively Retail Financial Services credit summary 5 ($ in millions) 1 2 4Q08 1Q09 2Q09 3Q09 Net charge-offs $1,701 $2,176 $2,649 $2,550 Change in allowance 1,875 1,701 1,197 1,438 Provision for credit losses $3,576 $3,877 $3,846 $3,988 Non credit- impaired loan balances 1 $282,001 $280,313 $270,468 $265,109 Credit-impaired loan balances 88,813 87,572 85,406 83,202 Total loan balances $370,814 $367,885 $355,874 $348,311 Allowance for loan losses $8,918 $10,619 $11,832 $13,286 Allowance for loan losses to ending loans retained 2 3.19% 3.84% 4.41% 4.63% Net charge-off rate 2 2.41% 3.16% 3.89% 3.81% |
 3Q08 4Q08 1Q09 2Q09 3Q09 Home Equity Net charge-off ($mm) $663 $770 $1,098 $1,265 $1,142 Net charge-off rate 2.78% 2.67% 3.93% 4.61% 4.25% Prime Mortgage Net charge-off ($mm) $177 $195 $312 $481 $525 Net charge-off rate 1.79% 1.20% 1.95% 3.07% 3.45% Subprime Mortgage Net charge-off ($mm) $273 $319 $364 $410 $422 Net charge-off rate 7.65% 8.08% 9.91% 11.50% 12.31% Auto Loans Net charge-off ($mm) $124 $207 $174 $146 $159 Net charge-off rate 1.12% 1.92% 1.66% 1.36% 1.46% 1 Average loans held-for-sale were excluded when calculating the net charge-off rate Portfolio performance Excluding credit-impaired loans 6 Key credit statistics 1 |
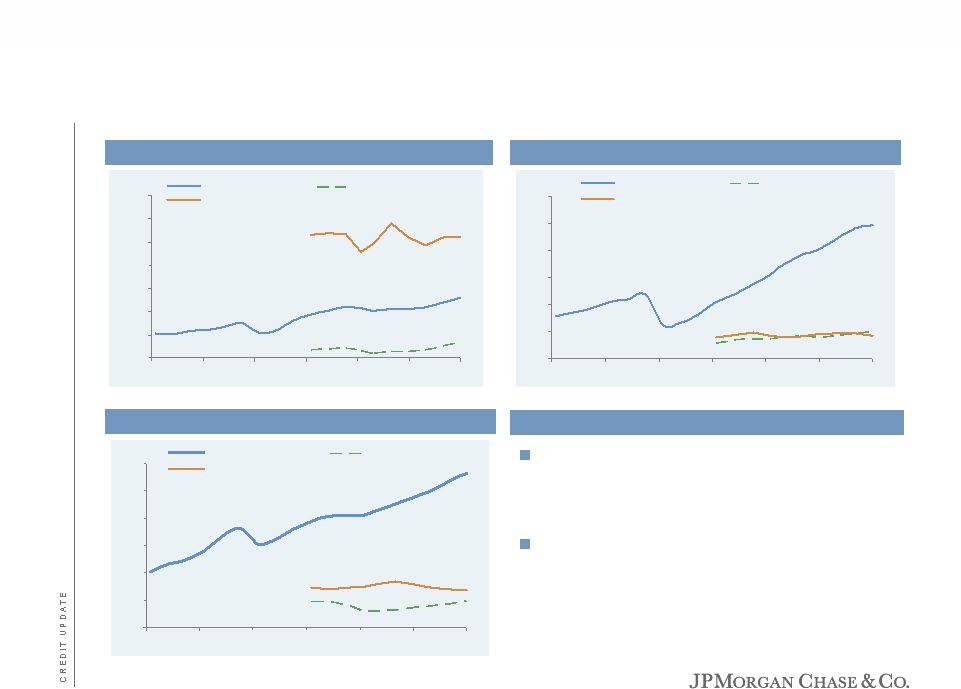 Some initial signs of stability in consumer delinquency trends, but we are not certain if this trend will continue Prime and subprime mortgage later stage delinquencies impacted by foreclosure moratorium, extended REO timelines and trial modifications Note: 30+ day delinquencies prior to September 2008 are heritage Chase Consumer credit—delinquency trends Excluding credit-impaired loans 1.25% 2.00% 2.75% 3.50% 4.25% 5.00% 5.75% 6.50% Mar-08 May-08 Aug-08 Nov-08 Mar-09 Jun-09 Sep-09 30+ day delinquencies 30-89 day delinquencies 1-29 day delinquencies 1% 3% 5% 7% 9% 11% 13% Mar-08 May-08 Aug-08 Nov-08 Mar-09 Jun-09 Sep-09 30+ day delinquencies 30-89 day delinquencies 1-29 day delinquencies 5% 10% 15% 20% 25% 30% 35% Mar-08 May-08 Aug-08 Nov-08 Mar-09 Jun-09 Sep-09 30+ day delinquencies 30-89 day delinquencies 1-29 day delinquencies 7 Subprime Mortgage delinquency trend Commentary Prime Mortgage delinquency trend Home Equity delinquency trend |
 Mortgage write-down policy Loans are written down to net realizable value no later than 180 days past due except for trial modifications where payments are being received Subsequent write-downs are taken throughout the foreclosure process when updated values show additional depreciation in the collateral Although foreclosure timelines have extended due to moratoriums and other factors Initial write-down date is not delayed and takes into account timeline extensions and market factors Additional write-downs have been taken as needed The majority of nonaccrual Residential Mortgage and Home Equity loans are 180+ days past due and have been written down by more than 30% 8 |
 Auto credit — prime and near prime policy actions Ever 30 Days Past Due @ 3 Months on Book² Origination Balances ($ in billions)¹ Net Credit Loss @ 12 Months on Book Lowered Exception Limits Reduced Risk Layering Raised Score Cut-off Initiated HPA High Risk Market Policy Reduced LTV and Extended Terms Raised Score Cut-off Lowered LTV 1 Prime/Near Prime Originations 2 Ever 30 Days Past Due @ 3 months on book represents the percentage of loans in a given vintage that ever went 30 days past due within 3 months of being originated 9 Vintage performance $4.3 $4.7 $5.9 $4.4 $2.7 $2.0 $4.4 $4.0 $4.3 $4.2 0.00% 0.20% 0.40% 0.60% 0.80% 1.00% 1.20% 1.40% 1.60% 1.80% 1Q07 2Q07 3Q07 4Q07 1Q08 2Q08 3Q08 4Q08 1Q09 2Q09 |
 Agenda Page 10 Foreclosure/REO 10 Financial Performance 1 Credit Update 3 WaMu / Branch Banking Update 21 |
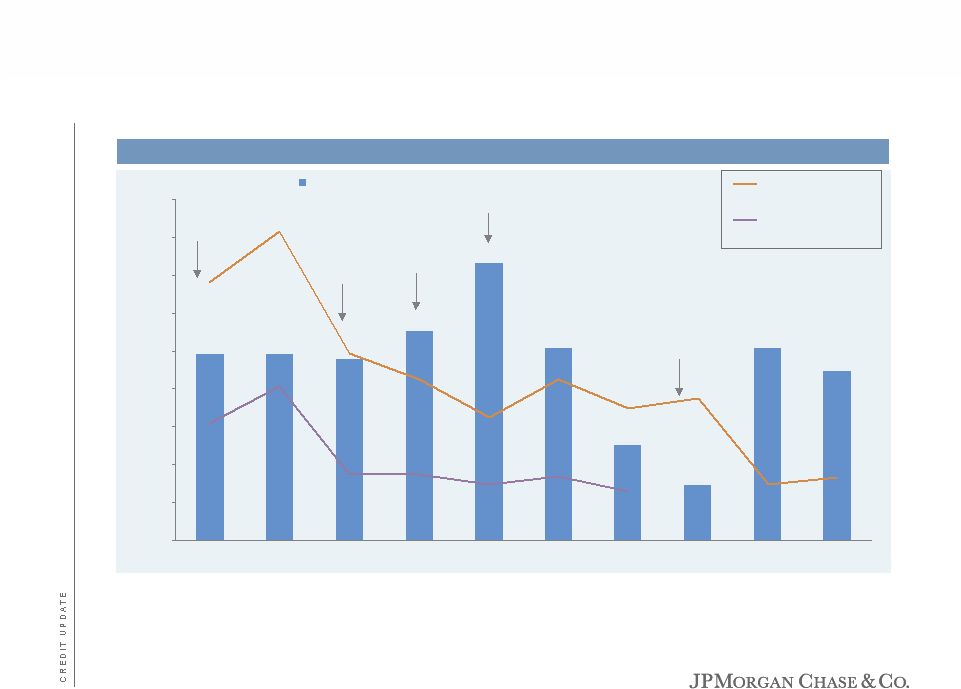
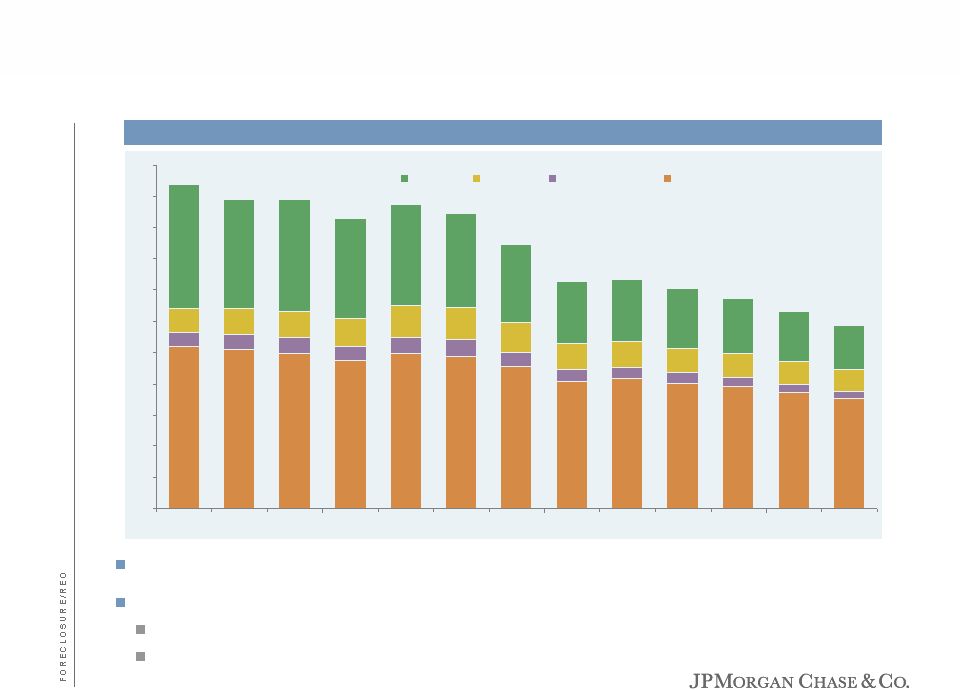 Total serviced portfolio — REO inventory units 0 5 10 15 20 25 30 35 40 45 50 55 Sep-08 Oct-08 Nov-08 Dec-08 Jan-09 Feb-09 Mar-09 Apr-09 May-09 Jun-09 Jul-09 Aug-09 Sep-09 REO has declined California declining more rapidly September 2008: 20k units in California - 38% of inventory September 2009: 7k units in California - 24% of inventory California Florida Arizona Remaining U.S. 11 Units in 000’s |
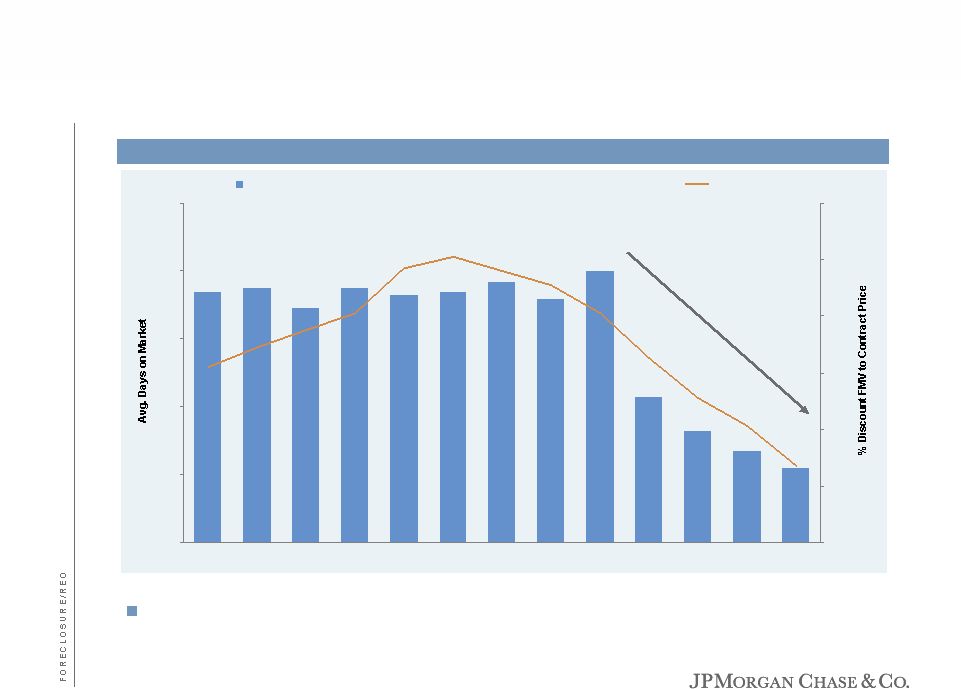 60 80 100 120 140 160 Sep-08 Oct-08 Nov-08 Dec-08 Jan-09 Feb-09 Mar-09 Apr-09 May-09 Jun-09 Jul-09 Aug-09 Sep-09 0% 2% 4% 6% 8% 10% 12% Total serviced portfolio — Average days on market, contract discount to fair market value Faster sales and lower discounts Days on Market % Discount FMV to Contract Price Note: Fair market value (FMV) represents appraised value before original listing. Contract price represents negotiated sales price. 12 |
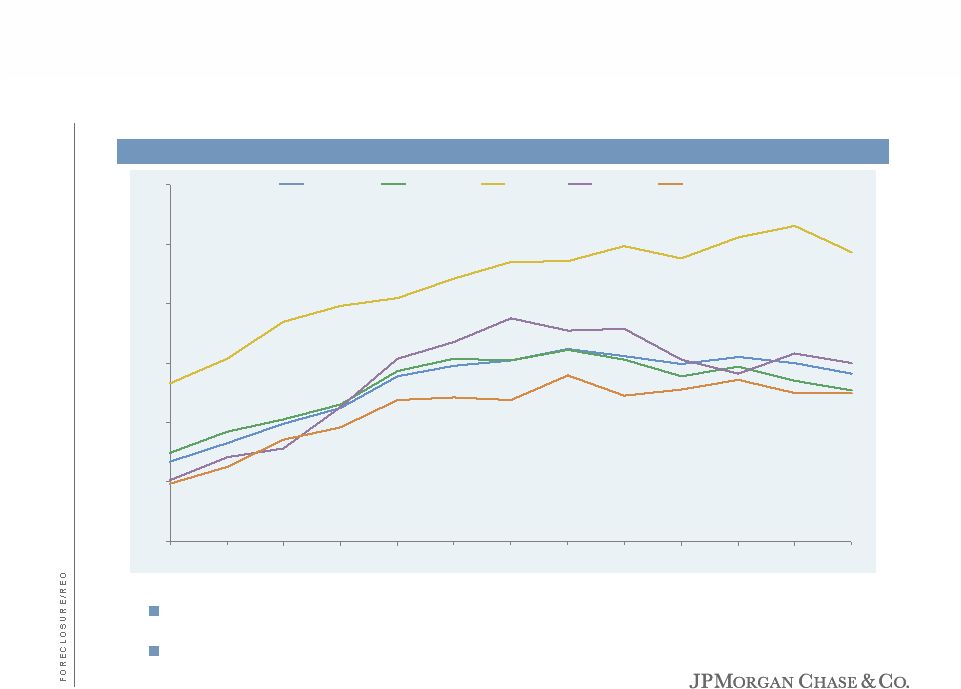 35% 40% 45% 50% 55% 60% 65% Sep-08 Oct-08 Nov-08 Dec-08 Jan-09 Feb-09 Mar-09 Apr-09 May-09 Jun-09 Jul-09 Aug-09 Sep-09 Total serviced portfolio REO loss severity Total U.S. California Florida Arizona Remaining U.S. Severities appear to be stabilizing in California and Arizona Severity in Florida is high and trajectory is unclear – unlikely to improve in near term 13 Loss severity |
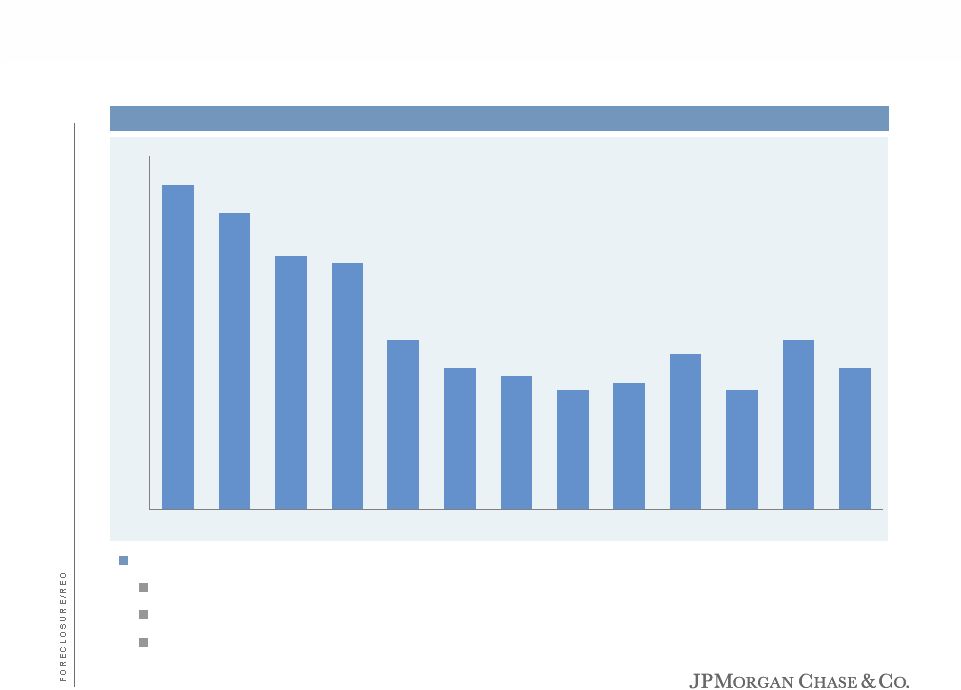 130 135 140 145 150 155 160 165 170 175 180 Sep-08 Oct-08 Nov-08 Dec-08 Jan-09 Feb-09 Mar-09 Apr-09 May-09 Jun-09 Jul-09 Aug-09 Sep-09 REO trends – U.S. Note: Total Serviced Portfolio. Contract price represents negotiated sales price. Can be impacted by factors such as: Seasonality Mix of home types Pricing strategies 14 Average contract price ($ in 000’s) |
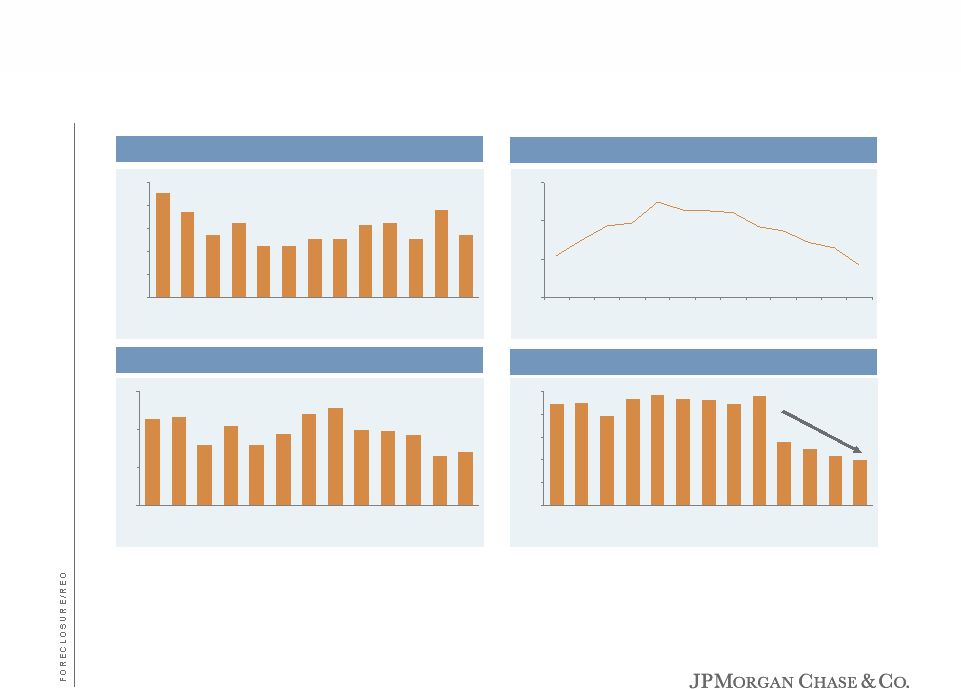
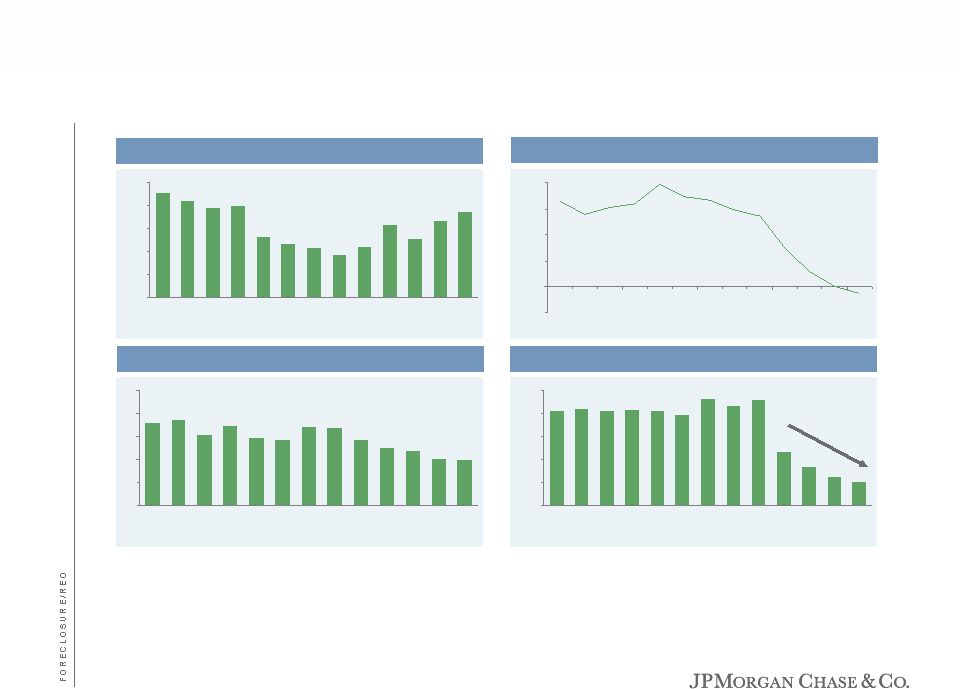 (3)% 0% 3% 6% 9% 12% Sep- 08 Oct- 08 Nov- 08 Dec- 08 Jan- 09 Feb- 09 Mar- 09 Apr- 09 May- 09 Jun- 09 Jul- 09 Aug- 09 Sep- 09 180 192 204 216 228 240 Sep- 08 Oct- 08 Nov- 08 Dec- 08 Jan- 09 Feb- 09 Mar- 09 Apr- 09 May- 09 Jun- 09 Jul- 09 Aug- 09 Sep- 09 REO trends – California 0 1 2 3 4 5 Sep- 08 Oct- 08 Nov- 08 Dec- 08 Jan- 09 Feb- 09 Mar- 09 Apr- 09 May- 09 Jun- 09 Jul- 09 Aug- 09 Sep- 09 50 70 90 110 130 150 Sep- 08 Oct- 08 Nov- 08 Dec- 08 Jan- 09 Feb- 09 Mar- 09 Apr- 09 May- 09 Jun- 09 Jul- 09 Aug- 09 Sep- 09 Note: Total serviced portfolio. Fair market value (FMV) represents appraised value before original listing. Contract price represents negotiated sales price 15 Average contract price ($ in 000’s) % discount FMV to contract price Average days on market REO sales volume (units in 000’s) |
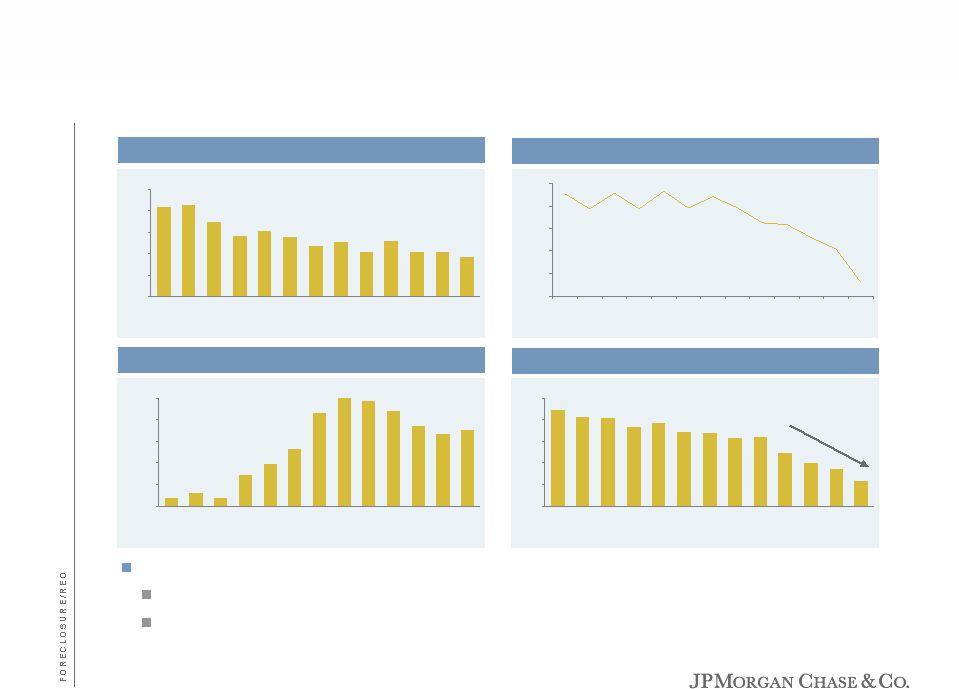 0% 3% 6% 9% 12% 15% Sep- 08 Oct- 08 Nov- 08 Dec- 08 Jan- 09 Feb- 09 Mar- 09 Apr- 09 May- 09 Jun- 09 Jul- 09 Aug- 09 Sep- 09 80 94 108 122 136 150 Sep- 08 Oct- 08 Nov- 08 Dec- 08 Jan- 09 Feb- 09 Mar- 09 Apr- 09 May- 09 Jun- 09 Jul- 09 Aug- 09 Sep- 09 REO trends – Florida 500 640 780 920 1,060 1,200 Sep- 08 Oct- 08 Nov- 08 Dec- 08 Jan- 09 Feb- 09 Mar- 09 Apr- 09 May- 09 Jun- 09 Jul- 09 Aug- 09 Sep- 09 50 70 90 110 130 150 Sep- 08 Oct- 08 Nov- 08 Dec- 08 Jan- 09 Feb- 09 Mar- 09 Apr- 09 May- 09 Jun- 09 Jul- 09 Aug- 09 Sep- 09 Continuing concerns Continued growth in new foreclosures expected More difficult to qualify for loss mitigation programs 16 Note: Total serviced portfolio. Fair market value (FMV) represents appraised value before original listing. Contract price represents negotiated sales price Average contract price ($ in 000’s) % discount FMV to contract price REO sales volume Average days on market |
 0% 3% 6% 9% 12% 15% Sep- 08 Oct- 08 Nov- 08 Dec- 08 Jan- 09 Feb- 09 Mar- 09 Apr- 09 May- 09 Jun- 09 Jul- 09 Aug- 09 Sep- 09 100 116 132 148 164 180 Sep- 08 Oct- 08 Nov- 08 Dec- 08 Jan- 09 Feb- 09 Mar- 09 Apr- 09 May- 09 Jun- 09 Jul- 09 Aug- 09 Sep- 09 REO trends – Arizona 350 420 490 560 630 700 Sep- 08 Oct- 08 Nov- 08 Dec- 08 Jan- 09 Feb- 09 Mar- 09 Apr- 09 May- 09 Jun- 09 Jul- 09 Aug- 09 Sep- 09 50 66 82 98 114 130 Sep- 08 Oct- 08 Nov- 08 Dec- 08 Jan- 09 Feb- 09 Mar- 09 Apr- 09 May- 09 Jun- 09 Jul- 09 Aug- 09 Sep- 09 17 Note: Total serviced portfolio. Fair market value (FMV) represents appraised value before original listing. Contract price represents negotiated sales price Average contract price ($ in 000’s) % discount FMV to contract price Average days on market REO sales volume |
 100 107 114 121 128 135 Sep- 08 Oct- 08 Nov- 08 Dec- 08 Jan- 09 Feb- 09 Mar- 09 Apr- 09 May- 09 Jun- 09 Jul- 09 Aug- 09 Sep- 09 REO trends – Remaining US 2 3 4 5 Sep- 08 Oct- 08 Nov- 08 Dec- 08 Jan- 09 Feb- 09 Mar- 09 Apr- 09 May- 09 Jun- 09 Jul- 09 Aug- 09 Sep- 09 50 70 90 110 130 150 Sep- 08 Oct- 08 Nov- 08 Dec- 08 Jan- 09 Feb- 09 Mar- 09 Apr- 09 May- 09 Jun- 09 Jul- 09 Aug- 09 Sep- 09 4% 8% 12% 16% Sep- 08 Oct- 08 Nov- 08 Dec- 08 Jan- 09 Feb- 09 Mar- 09 Apr- 09 May- 09 Jun- 09 Jul- 09 Aug- 09 Sep- 09 18 Note: Total serviced portfolio. Fair market value (FMV) represents appraised value before original listing. Contract price represents negotiated sales price Average contract price ($ in 000’s) % discount FMV to contract price Average days on market REO sales volume (units in 000’s) |
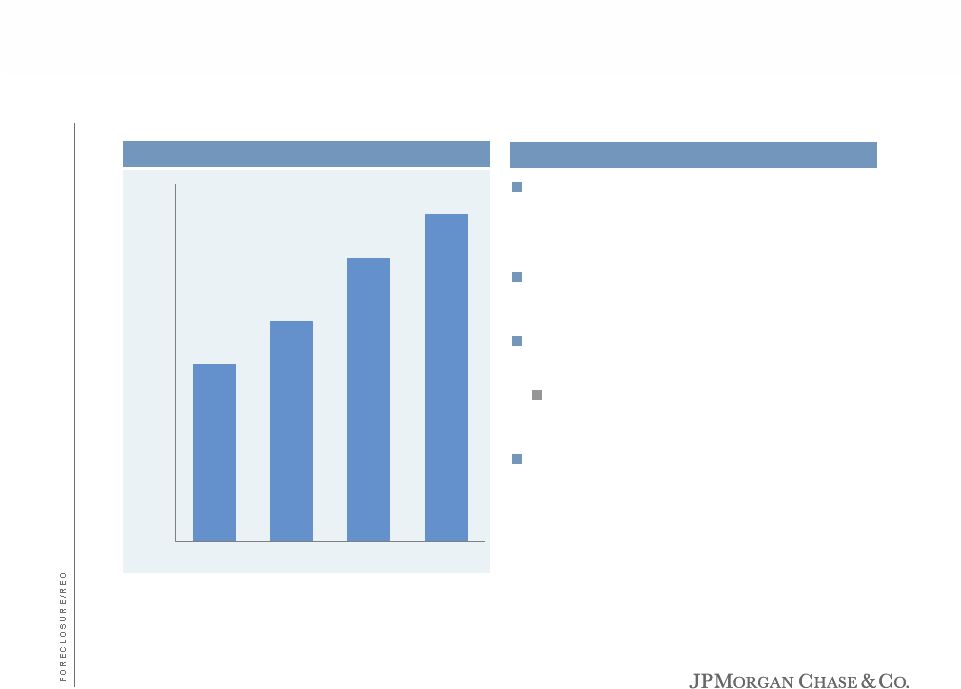 2,000 4,000 6,000 8,000 10,000 12,000 14,000 4Q08 1Q09 2Q09 3Q09 Loss mitigation efforts 12.5 million calls from customers seeking foreclosure prevention assistance vs. 6.8 million - up 84% 4 million outbound loss mitigation and collection calls vs. 400K 1.5 million loan modification packages downloaded online through 3Q09 3.4 million website hits on loan modification website 280K trial modifications offered through 10/24/09 19 Staffing of default services (FTE) 3Q09 YTD results vs. 3Q08 YTD |
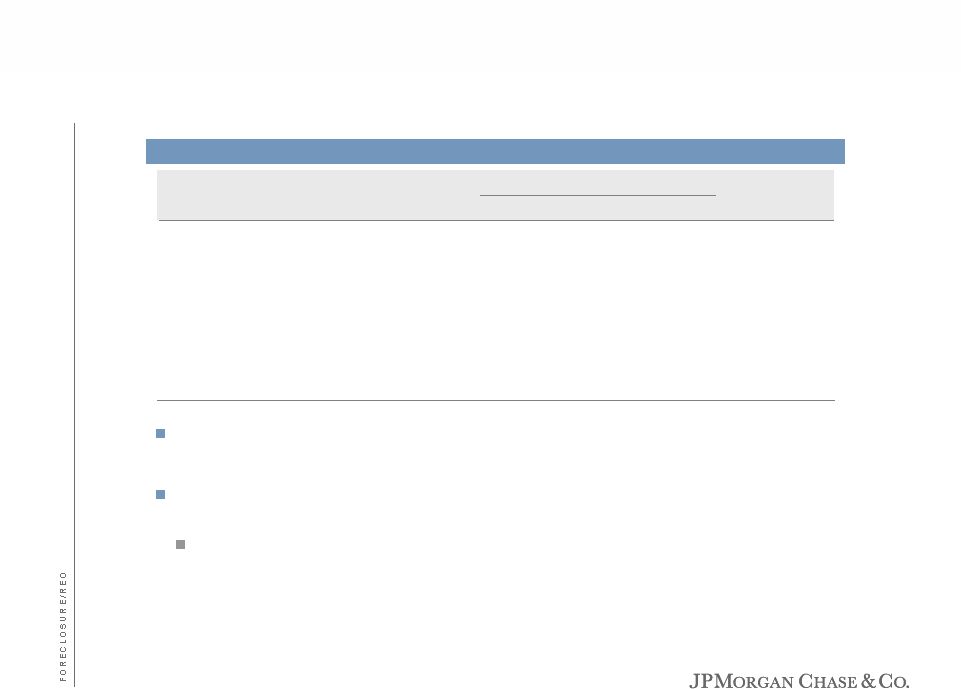 Program HAMP Chase Total Yet to be decisioned 98,344 Total offered 178,006 101,790 279,796 % with payment decrease 96% 83% 94% % of total with 1+ payment received 78% 74% 77% % of total with 3+ payments received 52% 50% 51% Trial modification results to date (total serviced) If payments are made on time and all documents are submitted, customers are underwritten and either approved or declined for a permanent modification To date, 26% of customers who have made 3+ payments have also submitted all of the required documents Collecting documents from customers continues to be a challenge Note: All percentages based on units, not dollars 20 Program to date (as of 10/24/09) |
 Agenda Page 21 WaMu / Branch Banking Update 21 Financial Performance 1 Credit Update 3 Foreclosure/REO 10 |
 WaMu conversions Rebranding and 3 successful conversions April 1 – California rebrand May – Washington, Oregon, Idaho & Utah July – Florida, Georgia, New York, New Jersey, Connecticut, Texas & Illinois October – California, Arizona, Nevada & Colorado Branches ATMs Rebranding Products Deposit systems Teller/Banker systems Loan origination and servicing systems Technology Data centers 33,000 signs Over 670 technology conversions 900 “occasio” style interior retrofit 12 million deposit accounts 1,000 other interior retrofit 5 million mortgages Consolidated 402 branches 12 million debit cards Size Added 155 ATMs 22 Conversion activities |
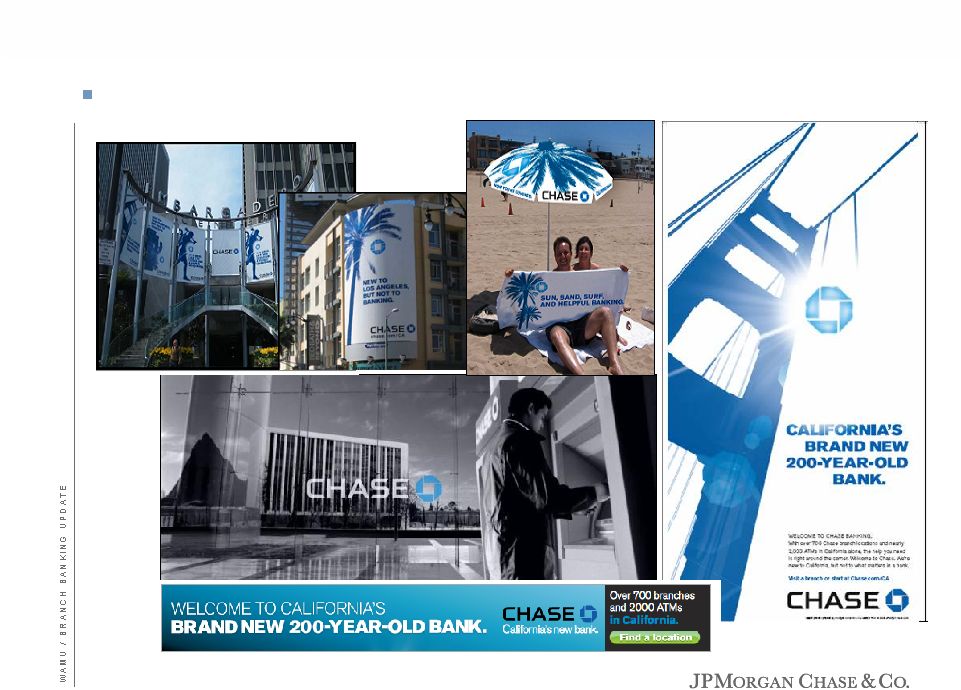 California 2009 rebrand recap… TV: PRINT: OUT OF HOME: ONLINE: CA heavily supported across all media channels during 2009 Rebrand period - achieving notable awareness growth 23 |
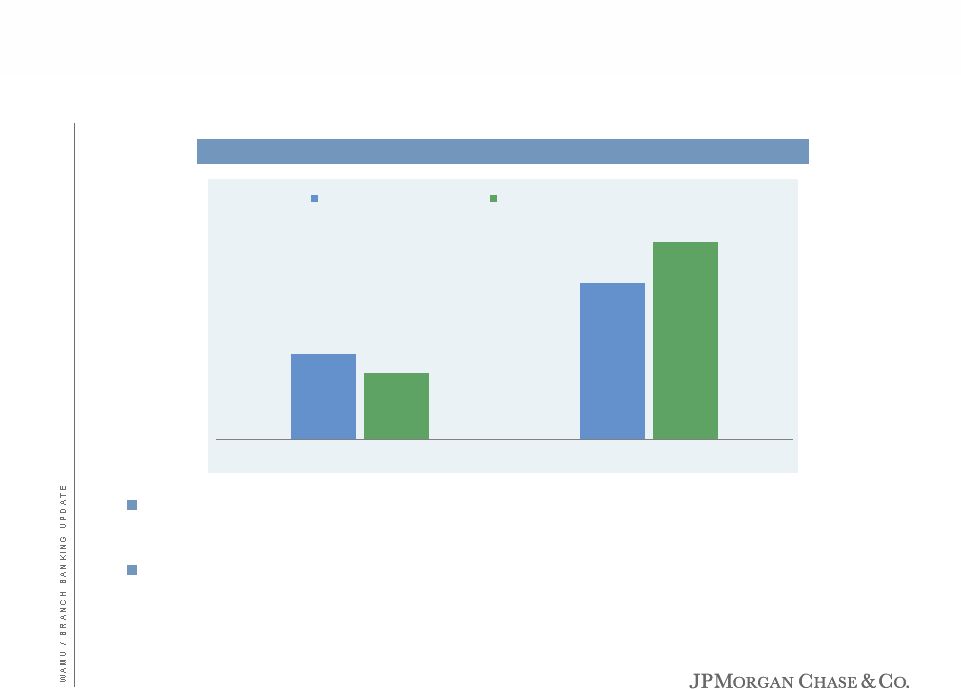 California 2009 rebrand recap California rebranding has significantly improved awareness of Chase as a financial institution and checking account provider In heritage Chase branch footprint, unaided brand awareness is 41% as a financial institution and 60% as a checking account provider 23% 42% 18% 53% Feb-09 Jun-09 As a Financial Institution As a Bank with Checking Accounts 24 Pre vs. Post rebrand – Chase unaided awareness in California |
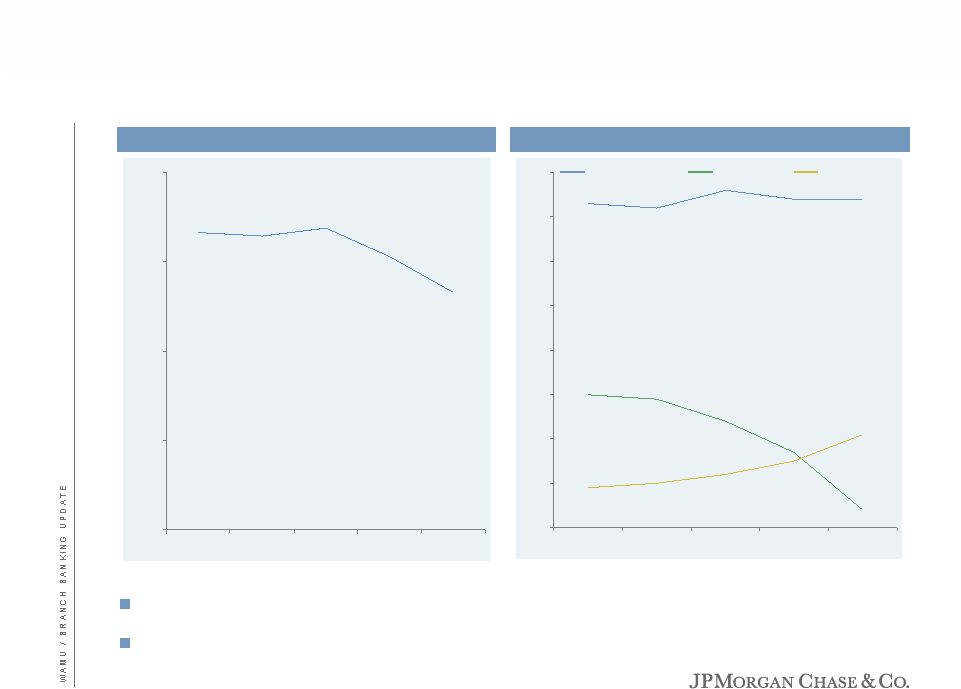 $60 $80 $100 $120 $140 3Q08 4Q08 1Q09 2Q09 3Q09 WaMu balances since September 25, 2008 $5 $15 $25 $35 $45 $55 $65 $75 $85 3Q08 4Q08 1Q09 2Q09 3Q09 Retaining 46% of CD maturities in deposit or investment products Mix shift is improving overall deposit margin Savings & Checking Time High Rate Time Low Rate 25 CDs & Total Savings/Checking balance trend ($ in billions) Total deposits trend ($ in billions) |
 WaMu update Roll out branch P&L in 2010 Common compensation plans Managers Assistant Managers Bankers Common mystery shop Common control reviews Continue high marketing spend in key states Complete Deposit Friendly ATM roll-out Sales force additions Personal Bankers – 1,000+ in 2009 and 750 in 2010 Small Business Bankers – 125 in 2010 Investment Sales Specialists – 100 in 2010 Loan Officers – 200 in 2010 26 |
 How is a WaMu customer different than Chase? 1 Reflects balances for only households that have investment balances Notes: Households must own deposit product w/ heritage bank to be included. Households with products at both banks are split by heritage products. Data as of September 30, 2009 Opportunity to increase penetration to existing WaMu customer base and Opportunity to attract a more affluent customer base 27 Household comparison – heritage Chase vs. heritage WaMu Chase WaMu Chase WaMu Households 9.8mm 9.7mm Balances ($ in 000’s) Product Ownership Average Deposits $15.7 $9.3 Credit Card 49% 16% $73.4 $39.4 Mortgage 7% 5% Home Equity 7% 5% Investments 9% 3% Activity Direct Deposit 62% 45% Bill Pay 19% 9% Average Investments |
 NSF/OD changes Next year, Chase will... Eliminate overdrafts on debit card transactions unless the customer “opts in” Customers may decide whether to participate or not Those that do not will have debit card transactions declined and will not incur a fee Post debit card, ATM and teller transactions in the order in which they occur Debit activity will post more in line with how our customers transact As a result, available balance and overdraft fees will be clearer Eliminate overdraft fees when overdrawn by less than $5 Small balance mistakes made by customers will not incur a fee Reduce the number of overdraft fees per day from 6 to 3 Max of 3 overdraft fees per day - we may honor additional items as a convenience Expected financial impact is ($500mm) +/- after-tax 28 |
 Strength of the combined franchise Great coast to coast franchise 5,126 branches and 15,038 ATMs as of 3Q09 Top deposit shares in: #1 New York #1 Chicago #1 Phoenix #1 Dallas/Ft. Worth Footprint covers: Tri-state Midwest California Complete JPMorgan Chase product set with continuous innovation Great brand and strength of the Firm — a competitive advantage Management team with proven ability to execute mergers, conversions, and growth #2 Seattle #3 Los Angeles #3 Miami Northwest Florida Southwest 29 |
 Forward-looking statements Forward looking statements This presentation contains forward-looking statements within the meaning of the Private Securities Litigation Reform Act of 1995. Such statements are based upon the current beliefs and expectations of JPMorgan Chase’s management and are subject to significant risks and uncertainties. Actual results may differ from those set forth in the forward-looking statements. Factors that could cause JPMorgan Chase’s actual results to differ materially from those described in the forward-looking statements can be found in JPMorgan Chase’s Quarterly Reports on Form 10-Q for the quarters ended March 31, 2009 and June 30, 2009, and its Annual Report on Form 10-K for the year ended December 31, 2008, each of which has been filed with the Securities and Exchange Commission and is available on JPMorgan Chase’s website (www.jpmorganchase.com) and on the Securities and Exchange Commission’s website (www.sec.gov). JPMorgan Chase does not undertake to update the forward-looking statements to reflect the impact of circumstances or events that may arise after the date of the forward-looking statements. 30 |