Exhibit 99.1
Forward-looking statements
This presentation contains forward-looking statements within the meaning of the Private Securities Litigation Reform Act of 1995. These statements are based on the current beliefs and expectations of JPMorgan Chase & Co.’s management and are subject to significant risks and uncertainties. Actual results may differ from those set forth in the forward-looking statements. Factors that could cause JPMorgan Chase & Co.’s actual results to differ materially from those described in the forward-looking statements can be found in JPMorgan Chase & Co.’s Annual Report on Form 10-K for the year ended December 31, 2010 (as revised by a Current Report on Form 8-K dated November 4, 2011), and Quarterly Reports on Form 10-Q for the quarters ended March 31, 2011 (as revised by a Current Report on Form 8-K dated November 4, 2011), June 30, 2011 (as revised by a Current Report on Form 8-K dated November 4, 2011), and September 30, 2011, which have been filed with the Securities and Exchange Commission and are available on JPMorgan Chase & Co.’s website (www.jpmorganchase.com) and on the Securities and Exchange Commission’s website (www.sec.gov). JPMorgan Chase & Co. does not undertake to update the forward-looking statements to reflect the impact of circumstances or events that may arise after the respective dates of the referenced forward-looking statements.

 February 28, 2012 F I R M O V E R V I E W Doug Braunstein, Chief Financial Officer |
 I. JPMorgan Chase overview Performance summary Customer focus Leveraging the franchise Global presence Loan growth and run-off portfolios Credit quality Deposit growth Net interest margin Expense and investments Agenda II. Specific risk questions from investors European exposure Mortgage settlement Private label litigation III. Firmwide capital LOB capital allocation Target returns Capital planning IV.Key firmwide themes V. Appendix 1 |
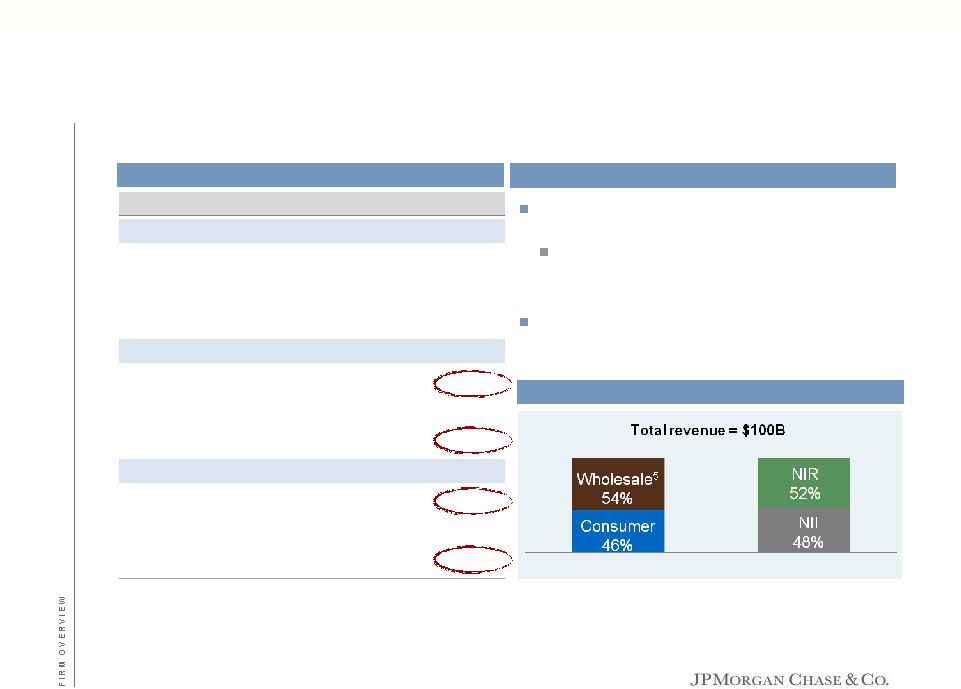
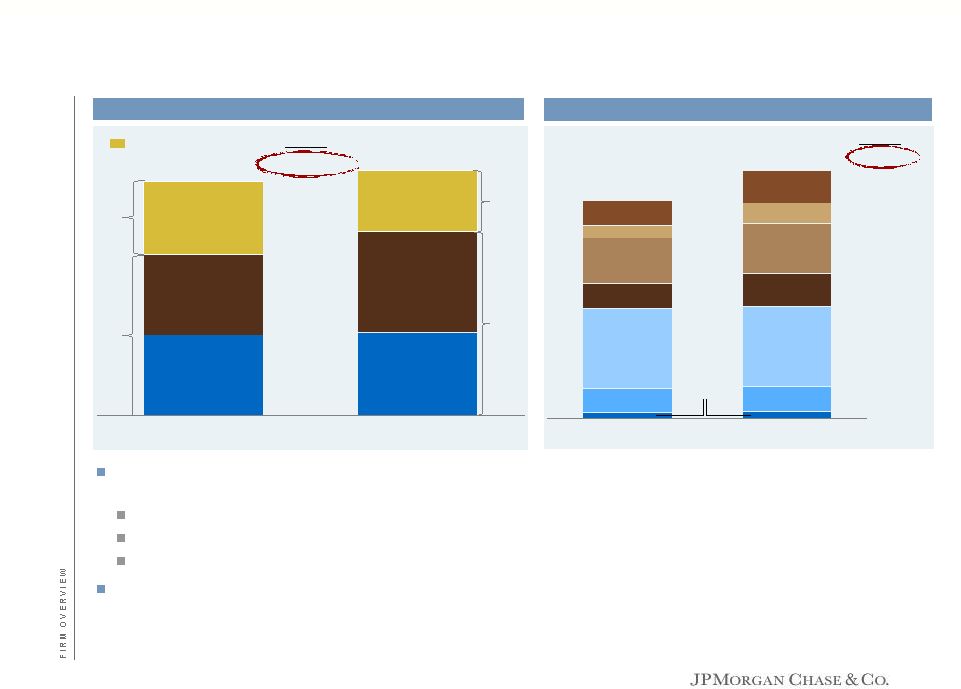
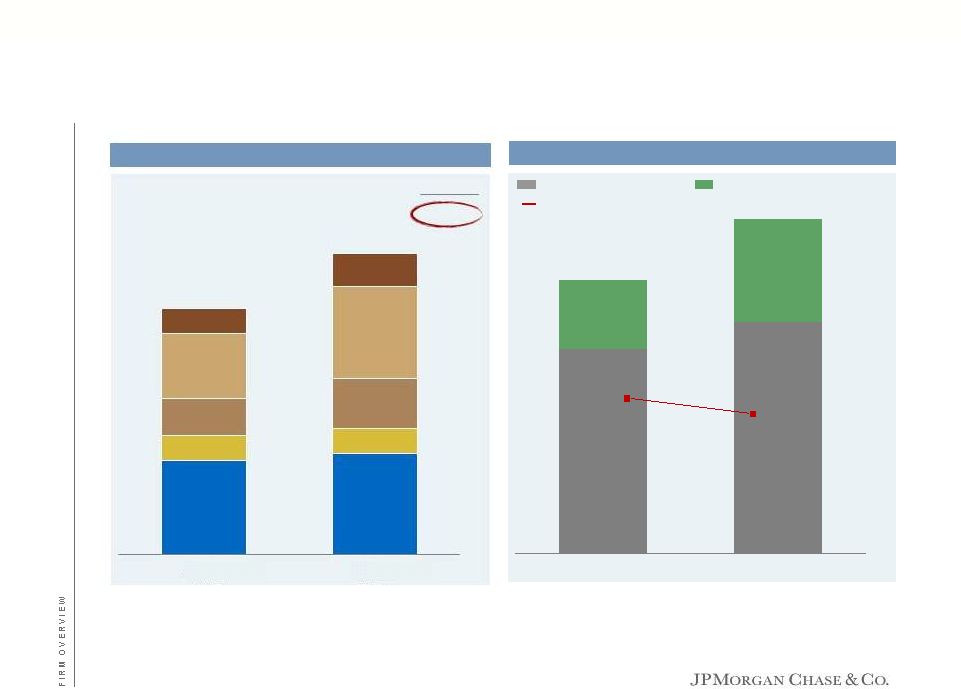
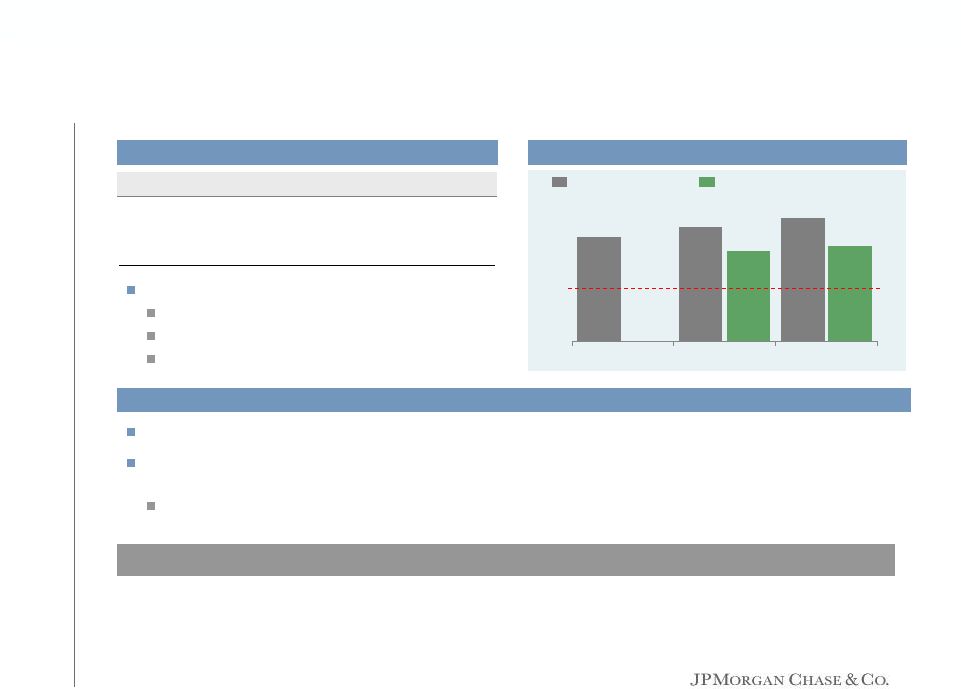
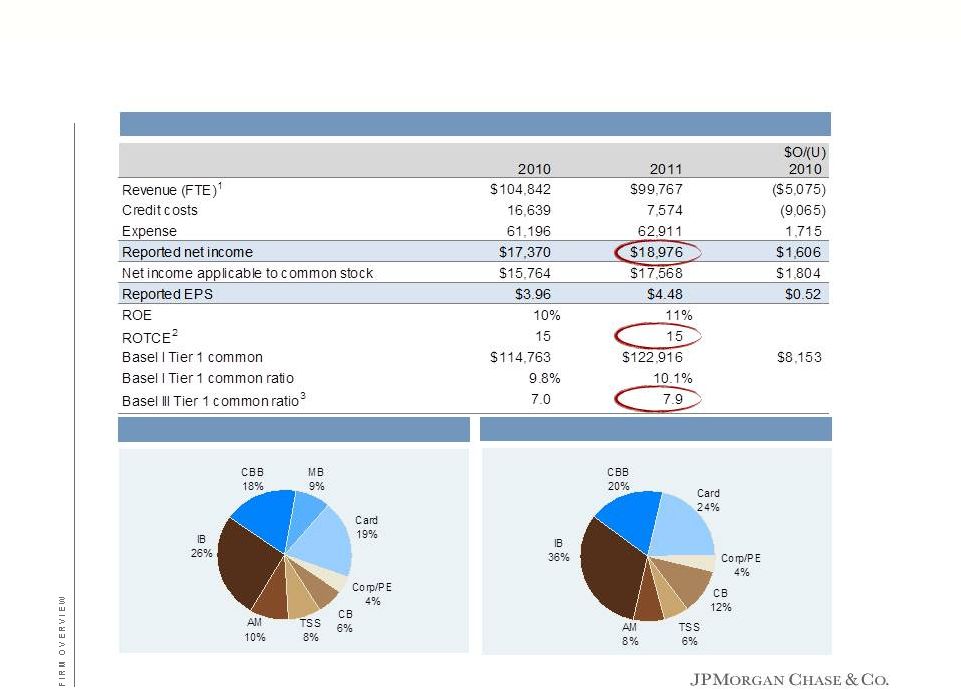 $mm, excluding EPS Performance summary JPMorgan Chase overview 1 See note 1 on slide 43 2 See note 4 on slide 43 3 Estimated 4 Excludes MB FY11 net loss of ($2.1B) or (11)% Total = $19.0B Net income – 2011 4 Total = $99.8B Firmwide revenue – 2011 2 |
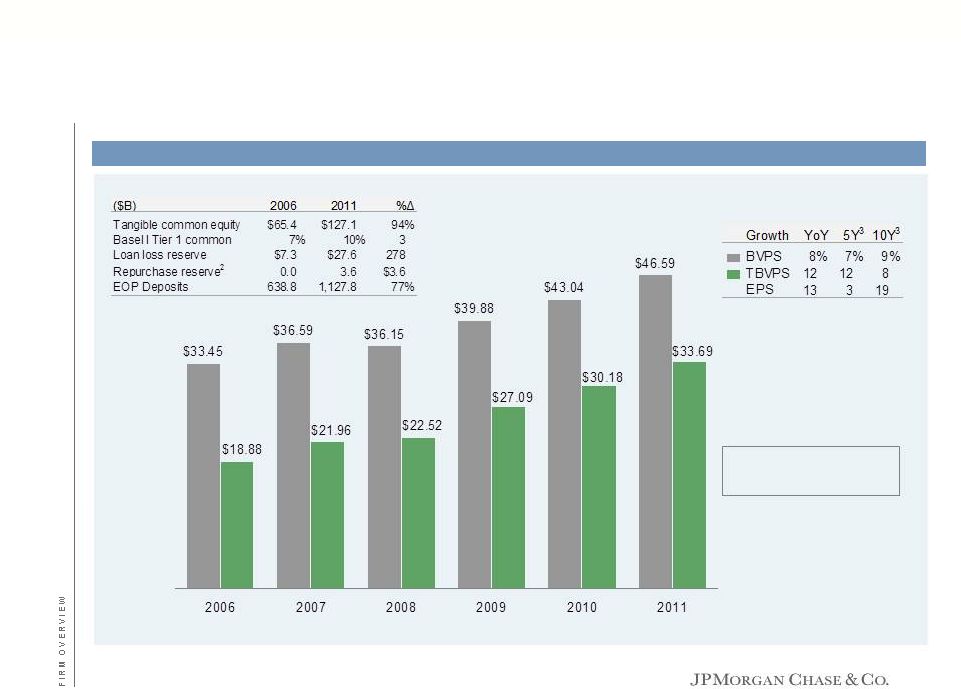 Book value per share: growing our fortress balance sheet JPMorgan Chase overview Shares outstanding (EOP) 3.7B 3.9B 3.9B 3.8B 3.4B 3.5B 1 Actual change 2 Excludes litigation reserve 3 CAGR Key metrics since 2006 3 2011 share repurchases: $9B 1 1 |
 1 Peer group includes BAC, C, WFC, GS and MS 2 Based on Basel I RWA 3 (NII+NIR-NCOs)/Basel I RWA; excludes GS and MS 4 Presented on a managed basis. See note 1 on slide 43 5 Wholesale includes Corporate Note: Totals may not sum due to rounding Business returns JPMorgan Chase overview ROA does not capture the difference in business mix between JPM and its peers For instance, the IB includes large asset classes which have low yield but low risk, including the repo book We consider return on RWA and risk-adjusted return to be more relevant for JPM and comparisons to peers 4 Return analysis Comments 2011 revenue mix 4 2009 2010 2011 Return on assets 1 JPM 0.6% 0.9% 0.9% Peer avg. 0.6 0.6 0.6 Best-in-class 1.5 1.0 1.2 Return on RWA 1,2 JPM 1.0% 1.5% 1.6% Peer avg. 1.0 1.2 1.1 Best-in-class 3.2 1.9 1.6 Risk-adjusted return 1,3 JPM 6.5% 6.8% 7.3% Peer avg. 5.2 5.8 6.1 Best-in-class 6.7 6.8 7.3 |
 Building market leading franchises JPMorgan Chase overview 1 2006 IB financial data represents heritage JPM only. JPM’s Dealogic IB fees rank was #1 in 2011 and # 1 in 2006 for heritage JPM only 2 Includes deposits and deposits swept to on-balance sheet liabilities 3 Source: Inside Mortgage Finance, 4Q06 and 4Q11 for 2006 and 2011, respectively 4 Excludes Commercial Card 5 GPCC stands for General Purpose Credit Card; excludes WaMu and Commercial Card 6 2011 is through November 5 Select key stats ($B, except where noted) 2006 2011 2006-2011 CAGR IB fees ($mm) $5,537 $5,859 1.1% Fixed income markets ($mm) 8,736 15,337 11.9 Equity markets ($mm) 3,458 4,832 6.9 Average liability balances $73.6 $174.7 18.9% Average loans 53.6 104.2 14.2 IB revenue, gross 0.7 1.4 14.7 Overhead ratio 52% 35% Average liability balances $189.5 $318.8 11.0% Assets under custody ($T) 13.9 16.9 3.9 Average trade loan balances 1.5 27.8 79.6 Non-U.S. revenue (%) 40.8% 55.0% Assets under management $1,013.1 $1,336.2 5.7% Long-term flows 45.0 53.0 3.3 Number of Private Banking client advisors 1,506 2,883 13.9 Average total deposits $190.1 $360.7 13.7% Client investment assets, excluding deposits 80.6 137.9 11.3 End-of-period Business Banking loans 14,205 17,652 4.4 Number of branches 3,079 5,508 12.3 Mortgage loans originated $119.2 $145.6 4.1% Retail branch and direct to consumer originations 40.5 87.2 16.6 Number of branch salespeople 1,196 3,125 21.2 Mortgage loan origination market share 5.8% 11.5% Card Services sales volume 4 $256.8 $343.7 6.0% Card Services net revenue rate (% avg. loans) 10.4% 12.3% GPCC sales volume market share 5 15.7 19.3 Auto originations market share 3.1 4.3 Card AM IB CBB TSS CB MB 1 1 1 2 3 4 6 2 |
 88% of the customers surveyed are satisfied with their relationship with Chase Highest client loyalty score – Ahead of WFC, USB, PNC and BAC Customer focus JPMorgan Chase overview 1 Greenwich Associates, 2011 2 2010 Chase Relationship Survey 3 Greenwich Associates, 2011 Twenty Two State Footprint Market Share Study 4 Client surveys conducted by the TS and WSS client service team 5 Survey of retail investors in the 10 largest European countries 6 Cogent Research Investor Brandscape, 2012 7 Cogent Advisor Touchpoints 2011: Trends and Best Practices for Creating a Connection with FAs 8 Chase Relationship Survey 9 Monthly Consumer Bank relationship survey (data from December 2011). Strongly agree equals a 9 or 10 on a 10-point scale 10 JD Power and Associates 2011 Credit Card Satisfaction Trends AM MB Card According to the JD Power overall satisfaction index rankings, Chase moved up to the 4 position, topping the industry average, ahead of WFC, USB, COF, C and BAC 10 Continuing focus on issue identification, elimination and prevention has yielded positive results with significant reduction in OCC/CFPB complaints CB TSS CBB Overall satisfaction with Chase (top 2-box scores) increased from 57% to 67% in 2011 8 For customers with top 2-box scores: 69% of households surveyed strongly agree that they are likely to use Chase to fulfill new financial need 9 81% of households surveyed strongly agree that they are likely to recommend Chase to others 9 Ranked #1 in client-oriented thinking by the 2012 Fund Brand 30 report 5 Significant increase in loyalty score – Ranked #7 in 2011, up from #21 in 2010 6 Ranked #1 for satisfaction with website, investment tools and resources for advisors 7 IB Selected as a Quality and Share Leader for 48 distinctions across 15 programs 1 , including Global Fixed Income, U.S. Large Corporate Finance and U.S. Equities Ranked #5 in the JD Power mortgage origination survey, up from #12 in 2010; topping the industry average and ahead of WFC, C and BAC Customer satisfaction for origination and servicing (top 2-box scores) of ~70% by the end of 2011 Customer complaint inventory declined by more than 60% since May 2011 Overall TS Service Delivery rated at near “best-in-class” levels with 89% of U.S. and 87% of EMEA clients rating service Excellent/Very Good 4 82% of WSS clients in 2011 indicated that they were satisfied with their current level of service WSS moved to #3 in 2011 from #7 in 2010 in Global Custodian Magazine’s 2011 Global Custody Survey 6 Customer satisfaction metrics 2 th 3 4 |
 Major competitive advantage: leveraging the franchise JPMorgan Chase overview JPMorgan Chase & Co. 1 Calculated based on gross domestic IB revenue for SLF, M&A, Equity Underwriting, Bond Underwriting 75% of CB clients use Treasury Services products $2.3B of revenue in 2011 CBB clients use TS services ($215mm in 2011, up 10% YoY) Provide custodial and transfer agency services to AM Significant revenue generated from the CB client base Joint coverage of ~1,800 clients 25% of North American IB revenue in 2011 1 $1.4B of gross total IB revenue from CB clients in 2011 Robust client referral to and from AM 41 new PB clients through IB referrals Manage $90B of AUM for TSS clients $140mm in 2011 firmwide revenue IM products offered to CB clients $370mm in 2011 firmwide revenue Products offered to retail clients through the branch network $510mm in firmwide revenue ~45% of Chase branded cards sold through branches ~40% of Card Services revenue from new merchants is sourced through the branches ~20% of JPM IM U.S. Retail AUM comes from the branches >16mm branch transactions annually by CB clients Treasury & Securities Services Investment Bank Consumer & Business Banking Card Services & Auto Joint coverage of foreign multinational clients Presence in 40+ countries $200B+ of global exposure to GCB clients Mortgage Banking 6.1mm existing eligible Chase banking relationships with no mortgage relationship ~50% of retail mortgages originated through branches Referral source for Private Bank, Private Wealth Management and Chase Private Client CB clients accounting for 66% of total Global Commercial Card clients, driving nearly $15B in Card spend in 2011 Increased signings of new Paymentech accounts through branch referrals by 34% Sourced most new Middle Market Commercial Card customers through CB Generated >40% of Commercial Card revenue from wholesale clients 7 Leveraging the franchise Global Corporate Bank Commercial Bank Asset Management |
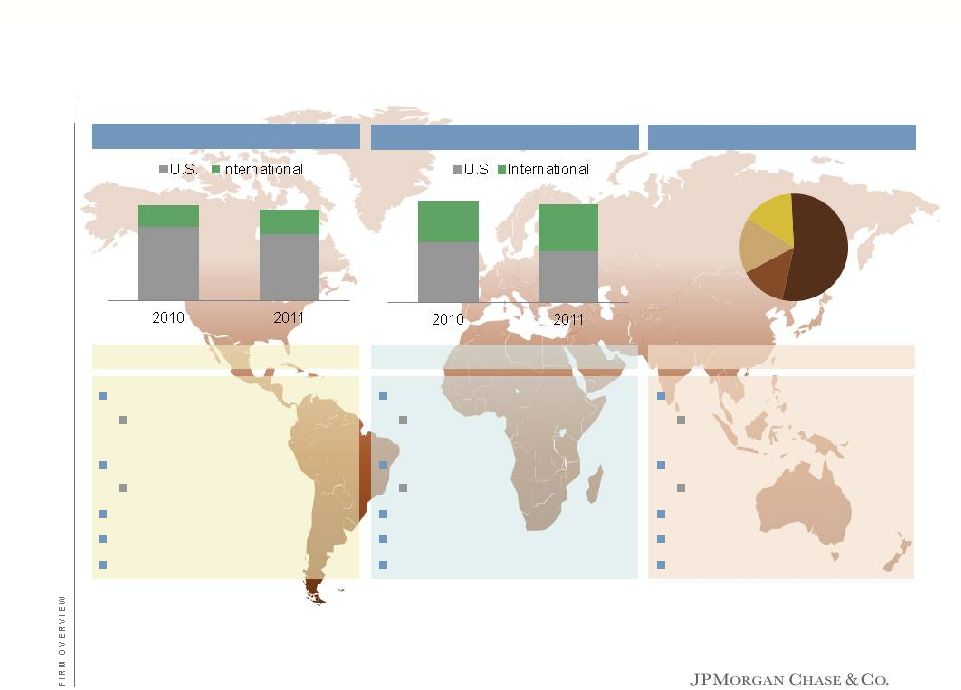 Global footprint and scorecard JPMorgan Chase overview LatAm/Caribbean (9%) 3 2011 revenue of $2.2B 2006 – 2011 CAGR: 11%; up 32% YoY Operate in 9 countries in the region 4 new offices opened in 2011 $5B in deposits 4 , down 15% YoY $25B in loans 5 , up 53% YoY $34B in AUM 2011 revenue of $6.0B 2006 – 2011 CAGR: 13%; down 2% YoY Operate in 16 countries in the region 2 new offices opened in 2011 $58B in deposits 4 , up 8% YoY $31B in loans 5 , up 51% YoY $105B in AUM 2011 revenue of $16.1B 2006 – 2011 CAGR: 7%; up 14% YoY Operate in 33 countries in the region 3 new offices opened in 2011 $169B in deposits 4 , up 18% YoY $37B in loans 5 , up 31% YoY $278B in AUM EMEA (64%) 3 Asia Pacific (24%) 3 22% 78% 26% 74% 41% 59% 48% 52% 1 On a managed basis 2 Primarily composed of CIO net gains 3 % of Wholesale revenue 4 Average deposits are based on the location from which the customer relationship is managed 5 End-of-period loans outstanding are based predominantly on the domicile of the borrower and exclude loans held-for-sale and loans carried at fair value Note: Wholesale international operations comprised of IB, AM, TSS, CB and CIO/Treasury. Totals may not sum due to rounding Wholesale revenue 1 – ($B) Firmwide revenue 1 – ($B) Int’l Wholesale revenue by LOB 1 8 $105 $100 $55 $53 Other 2 TSS IB AM 17% 54% 15% Total = $25B 14% |
 Loan growth JPMorgan Chase overview Total loans increased 4% YoY driven by core loan growth of 14% across all businesses, including Wholesale loan growth of 25% CB achieved six consecutive quarters of loan growth through the end of 2011; Middle Market loans up 17% YoY TSS trade loans up 73% Business Banking loans up 5%; 24% increase in new origination volume in 2011 Run-off portfolios decreased 16% YoY driven by runoff of Mortgage Banking loans Note: Wholesale includes IB, CB, TSS, AM and Corporate; Consumer includes CBB, MB and Card 1 Other includes Card run-off portfolio, including certain legacy WaMu loans, legacy balance transfer programs and terminated partner portfolios (e.g. Kohl’s ), and CBB run-off portfolio, including discontinued products 2 MB run-off portfolio includes WaMu purchased credit-impaired loans, discontinued products, and certain prime loans with estimated current LTVs greater than 80% as of January 2010 3 AM includes loans originated by AM that are held in Corporate and other loans held in Corporate Note: Totals may not sum due to rounding 2010 2011 $693 $724 (16)% 14% Growth Total loans: 4% Consumer Wholesale Run-off (MB and Other) 1,2 Consumer Wholesale Core $477 Core $543 $216 $180 2010 2011 $477 $543 Card MB CB CB IB IB TSS TSS AM 3 AM 3 MB Growth 14% Card 30% 58% 13% 25% 2% 3% 14% Core loans by line of business ($B) Run-off portfolios Run-off (MB and Other) 1,2 CBB 9 Total end-of-period loans ($B) |
 Impact of our run-off portfolios: a simulation JPMorgan Chase overview Simulation assumes provision for credit losses equals net charge-offs; other reserve actions not simulated NII will decline as portfolios run off; reduction of higher yield loans puts pressure on firmwide NIM NII for run-off portfolios expected to decline by $1B +/- in 2012, including $500mm +/- related to MB However, runoff will benefit firmwide ROTCE as expense and credit losses also decline, and approximately $2B of capital per year could be liberated and redeployed, including $1B +/- related to MB Pro-forma impact on ROTCE 6 ($B) Comments 15.3% 16.0% 0.7% NI $19 $0.5 $20 TCE 7 124 (2.0) 122 8 10 2011 2012 2013 2014 MB $173 $152 $128 $110 Other 2 22 16 12 10 Total average loans $196 $167 $140 $120 Total run-off portfolios Net interest income $6.3 $5.1 $4.1 $3.2 Noninterest expense 2.0 1.6 1.3 1.1 NCOs 5.8 4.2 2.8 1.6 Net income 4 ($0.9) ($0.4) ($0.1) $0.3 Capital $12 $10 $8 $7 Net interest margin 3.2% 3.1% 2.9% 2.7% 5 5 5 1 3 Run-off portfolios simulation ($B) 1 2 3 4 5 6 MB run-off portfolio includes WaMu purchased credit-impaired loans, discontinued products, and certain prime loans with estimated current LTVs greater than 80% as of January 2010 Other includes Card run-off portfolio, including certain legacy WaMu loans, legacy balance transfer programs and terminated partner portfolios, and CBB run-off portfolio, including discontinued products Assumes provision for credit losses equals net charge-offs associated with NCI portfolio. Assumes no reserve actions associated with run-off PCI portfolio. All amounts presented in the simulated periods are estimates within a range of possible outcomes. Actual results could differ significantly from these estimates Assumes 38% tax rate Simulated results based on current run-off portfolios trends Run-off portfolios impact represents the incremental ROTCE impact of changes to net income and allocated capital in the first year of the simulation Average tangible common equity Adjusted for difference between 2011 actual and 2012 simulated amounts Note: Totals may not sum due to rounding 7 8 |
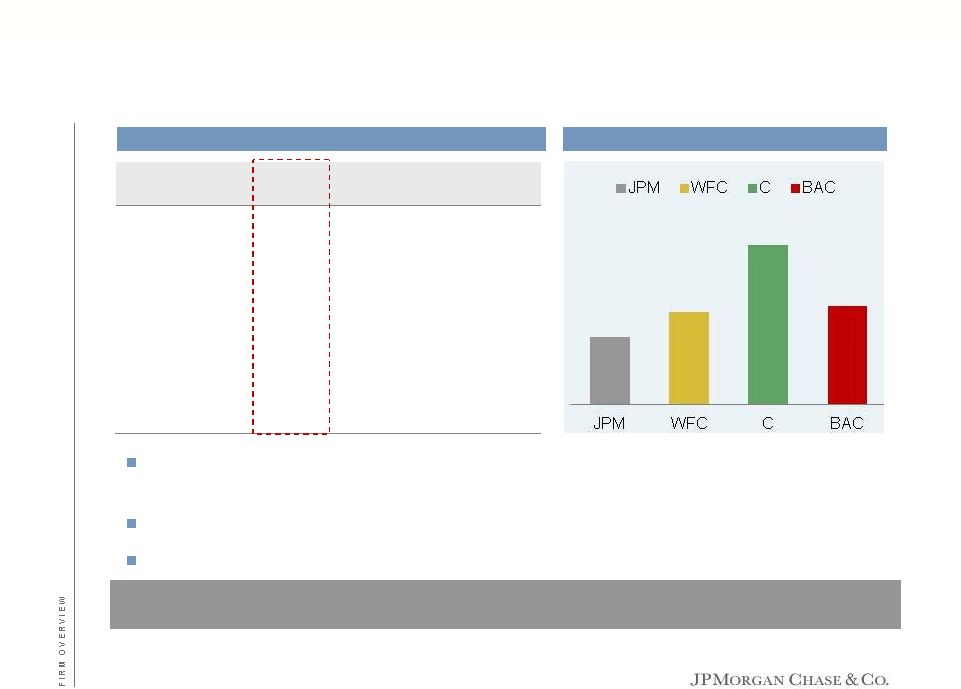 Expect reserve levels to adjust to normalized levels of ~$15B as underlying credit improves and we recognize the impact of certain portfolio runoff Credit quality: strengthened coverage and reserve position JPMorgan Chase overview The Firm’s net charge-offs and nonperforming loans are down 48% and 44% from peak levels, while loan loss reserves decreased 28% from peak and 13% since 2009 LLRs/NPLs ratio is 281%, up from 184% in 2009 1 LLRs/NCOs 2 coverage is 237%, up from 128% in 2009 3 0.6 1.0 0.6 0.4 1 Loan loss reserve includes $5.7B and $1.6B of PCI reserves in 2011 and 2009, respectively 2 Reflects 4Q11 NCOs annualized 3 Reflects 4Q09 NCOs annualized; excludes NCOs for securitized credit card receivables for which there was no associated LLR 1 11 JPM WFC C BAC EOP loans $723.7 $769.6 $647.2 $940.0 NCOs 12.2 11.3 20.0 20.8 NPLs 10.0 21.3 11.2 25.1 LLR 27.6 19.4 30.1 33.8 LLRs/NCOs 2 237% 183% 183% 208% Peer group credit statistics – 2011 ($B) YoY change in LLRs to change in NCOs |
 4Q10 4Q11 Deposit growth JPMorgan Chase overview 40% 39% 7% 0.50% 36% Interest-bearing deposits Noninterest-bearing deposits $895 $1,097 0.50% 0.43% $895 $1,097 1 Other includes IB, MB, Card and Corporate Note: Totals may not sum due to rounding Growth (3)% 23% Avg. yield 12 AM TSS CB Other¹ CBB AM TSS CB Other¹ CBB Avg. deposits by line of business ($B) Avg. interest-bearing vs. noninterest-bearing deposits ($B) 4Q10 4Q11 |
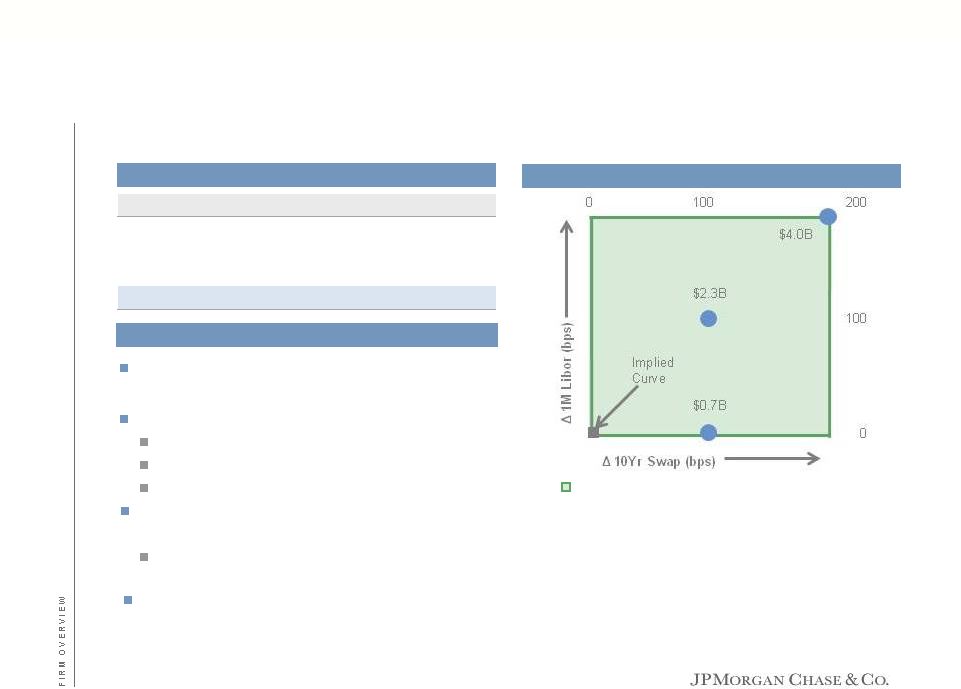 Net interest margin and net interest income rate sensitivity JPMorgan Chase overview Net interest income has been impacted by the runoff of higher yield loan portfolios and portfolio mix Net interest margin decreased by 32bps in 2011 due to Runoff Changes in portfolio mix Impact of lower rates Spread compression will negatively impact CBB net income by $400mm+/- Potential increases in NII relative to the implied curve 2010 2011 Net interest income $51.4 $48.2 Interest-earning assets 3.83% 3.51% Interest-bearing liabilities 0.84 0.86 Net interest margin (NIM %) 3.06% 2.74% 13 YoY net interest margin ($B) Comments Potential net interest income increases 1 Continued pressure on NIM in 2012 as market and mix conditions continue Portfolio runoff will negatively impact NII in REP by $500mm+/- 1 As of 12/31/2011. Reflects risk exposure to pretax NII of the Firm's non-market-based business activities (see 3Q11 form 10-Q disclosure for further discussion on interest rate exposure). Implied curve represents the market expectation of rates over the next 12 months |
 Core net interest margin 1 JPMorgan Chase overview 1 See note 6 on slide 43 2 IB’s market-based activities are defined as total IB net interest income less net interest income earned on IB loans 3 Net interest income presented as an average 2009 quarter (i.e. total year divided by 4); all others are yearly rates Core NIM is a measure that is more comparable to the NIM of financial institutions focused primarily on loan and deposit-related activities Given mark-to-market and P&L geography of hedging in the IB, NIM is not a good indicator of IB profitability Core net interest income walk – 4Q11 ($B) Core net interest income Net interest income trend Avg. earning assets NII Yield Firm reported $1,808 $12 2.7% IB reported 1.5 Less IB loans 1.8 IB market-based activities $502 $2 1.4% Core $1,306 $11 3.2% 14 567 65 2 0.3 |
 1 Excludes Investment Bank compensation expense, Corporate litigation expense, and foreclosure-related matters. Investment Bank compensation expense totaled $9.7B in FY2010 and $8.9B in FY2011. Corporate litigation expense totaled $5.7B in FY2010 and $3.2B in FY2011. Foreclosure-related matters totaled $350mm in FY2010 and $1.7B in FY2011 2 Specific transaction related noninterest expense, which is directly related to generating the associated revenue (e.g., storage and transportation costs) 3 Presented on a managed basis. See note 1 on page 43 Note: Totals may not sum due to rounding Firmwide expense has been trending higher JPMorgan Chase overview $45.4B $49.2B $960mm Mortgage servicing $640mm FDIC $600mm Card marketing $450mm Commodities 2 Significant Drivers Expect total adjusted firmwide noninterest expense to remain relatively flat in 2012 Moderating expense in growth initiatives Targeted branch build GCB build-out almost complete More efficiency in marketing expense Default-related expense likely to decline in 2H12 LOBs continue to focus on efficiencies $1.2B Other Headcount OH ratio 3 239,831 58% 260,157 63% 2010 2011 Primarily headcount growth CPC Branch build Business Banking – WaMu expansion CB expansion GCB International expansion AM banker build-out MB production 15 Adjusted firmwide noninterest expense 1 |
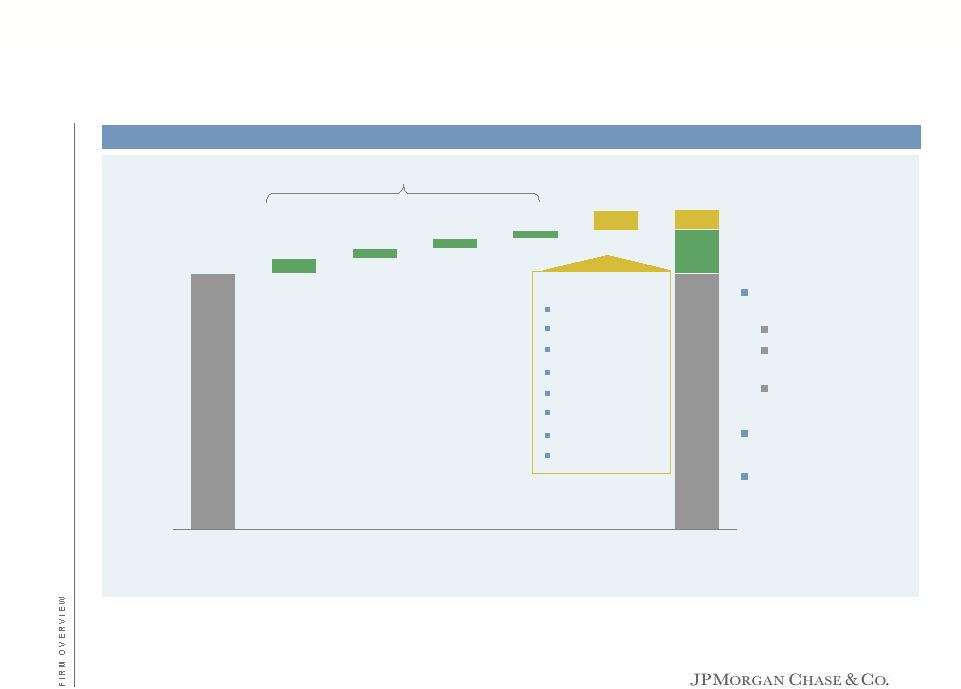
 2011 expense and NI impact of cumulative spend from select investments ($mm, except where noted) Overview of select investments JPMorgan Chase overview Build out branches and product capabilities Uplift primarily from Markets, Credit and TS products ~525 new branches built since 2009 Avg. branch achieves payback & 30% ROE by year 8+/- 1,200 new RMs & business bankers hired since 2009 Significant growth opportunities in h-WaMu markets Build out int’l platform to facilitate clients’ regional strategies Successful launch of int’l platform in 2011; steady state 2014/15 Expand CB coverage into new markets Broke even in 2011; continue to add 200+ clients a year 262 CPC locations as of 2011; plan to add 750 in 2012 22K clients as of 2011; plan to reach 75K clients by 2012 ¹ Reflects NI contribution from 2002-2011 branch builds ² Excl. expense related to existing portfolios and litigation ³ Excl. the impact of deferred loan origination cost (FAS 91) 1 3 16 LOB/Investment 2011 Expense Comments ~$60 Middle Market expansion ~70 ~200 600 ~300 400 ~400 600 ~150 600 ~50 ~175 ~500 350 ~$1,900 NI impact of cumulative spend IB International Prime Brokerage $175 +/- IB/TSS International expansion/ Global Corporate Bank +/- CB 450 +/- CBB Branch builds 2011 expense associated with 2009-2011 branch builds +/- Business Banking 2011 expense associated with 2009-2011 new hires +/- Chase Private Client 600 +/- AM PB banker/ IM expansion +/- MB Mortgage capacity & productivity 2 450 +/- Card Incremental customer acquisition marketing +/- 317 PB bankers hired since 2010; 729 IM sales, investors & support hires since 2009 (expense incl tech & other support) Expect to reach target net income by 2015 Added 700 loan officers in 2011; plan to add 1,000 in 2012 to grow retail capacity Improve productivity through origination & servicing investments Total spend in 2011 expected to generate 9mm+/- accounts and $45B+/- in sales volume in 2012 Run-rate NI by year 3 |
 Agenda Page 17 Specific risk questions from investors 17 Firmwide capital 21 Key firmwide themes 29 Appendix 31 |
 Lending exposure includes both funded loans and undrawn commitments Lending exposure ~72% to corporates AFS securities exposure – 73% government guaranteed Trading exposure ~ 42% to sovereigns Includes $2.4B of debt and equity securities Predominantly client-driven net derivative receivables of $15.3B, offset by collateral of $6.8B (98%+ held in cash) Credit derivatives counterparties primarily outside Euro 5 and are investment-grade or well-supported by collateral arrangements Mark-to-market of large counterparty gross long and short positions largely offset and are all collateralized daily ~ 79% of portfolio hedges are against sovereign exposure Substantially all hedges are with investment grade counterparties outside the Euro 5 and are collateralized Non-sovereign net exposure – 82% to corporate clients and remaining 18% to the banking sector European exposure Specific risk questions from investors As of February 16, 2012 ($B) 18 Exposure 1 Securities & Trading Lending AFS Trading Derivative collateral Portfolio hedging Net exposure Spain $3.4 $0. 8 $5. 3 ($3.3) ($0.5) $5.7 Sovereign - 0.5 (0.3) - (0.1 ) 0.1 Non -sovereign 3.4 0.3 5.6 (3.3 ) (0.4) 5.6 Italy 3.4 0.1 10.3 (2.2 ) ( 4.3) 7.3 Sovereign - - 7.7 (1.1 ) (3.6) 3.0 Non -sovereign 3.4 0.1 2. 6 (1.1 ) (0.7 ) 4.3 Other (Ireland, Portugal & Greece) 1.4 0. 6 2.3 (1.3) (1.0 ) 2.0 Sovereign - 0.6 0.1 - ( 0.8) (0.1) Non-sovereign 1.4 - 2.2 (1.3) (0.2 ) 2.1 Total firmwide exposure $8.2 $1.5 $17.9 ($6 .8) ($5.8 ) $15.0 1 Exposure is a risk management view. Lending is net of liquid collateral. Trading includes net inventory, derivative netting under legally enforceable trading agreements, net CDS underlying exposure from market-making flows, unsecured net derivative receivables and under collateralized securities financing counterparty exposure |
 Department of Justice and Attorneys General mortgage settlement summary Specific risk questions from investors $25B global settlement announced between the five major servicers and the Federal Government including the Department of Justice, Department of Housing and Urban Development, and the State Attorneys General For Chase the settlement amount will be ~$5.3B and will consist of ~$1.1B in cash payments ~$0.5B toward a refinance program – Will offer interest rate reductions for certain homeowners with Chase-owned mortgages Up to ~$3.7B of additional relief for homeowners – Menu of options from which the bank can choose to assist homeowners, including modifications with first and second lien principal reductions New servicing standards, which establish a new level of transparency and clarity for servicer activities Limits the Firm’s liability related to MERS-related conduct, such as recording of assignments and standing in foreclosures Only New York, Delaware and Massachusetts may maintain suits for MERS-related conduct. The settlement limits monetary remedies those states can seek against Chase, and precludes them from seeking to vacate past foreclosures for MERS-related conduct Given our current reserve position, the settlement is not expected to have a material impact on earnings 19 |
 Private label securitization Specific risk questions from investors 1 The Firm believes that WaMu bank-related repurchase liabilities are the responsibility of the FDIC (the FDIC disagrees) and any securities liabilities reside with the WaMu subsidiaries 2 Excludes class action deals with standing defects, deals where the Firm was sued solely as an underwriter (and was not an issuer), monoline claims and trustee claims 3 Certain analysts include estimates for private label litigation in their private label repurchase exposure estimates. Certain analysts exclude WaMu related liabilities from JPM repurchase estimates Original balances in litigation for Chase (excl. WaMu) 1 of ~$50B 2 A group of investors claiming to have a quorum in trusts with an original principal balance (excl. WaMu) of ~$175B asked various trustees to, among other things, investigate servicing and repurchase claims Both securities and repurchase claims are likely to be litigated Substantial impediments to repurchase and servicing claims Trustees generally do not act unless instructed by a quorum and indemnified Many loans were originated or are serviced by others WaMu repurchase liabilities reside with the FDIC 1 We intend to honor our obligations, but claims are fact intensive, generally requiring loan-by-loan analysis – There is no repurchase absent proof that a breach “materially and adversely” affected value of loan Securities litigation claimants also face significant hurdles There is significant overlap between repurchase and securities exposure: we do not intend to pay twice for the same exposure Median analyst estimate of exposure across the entire private label securitization portfolio, including balances not in litigation, is $6.5B 3 Litigation could take years, but we have built significant litigation reserves 20 |
 Agenda Page 21 Firmwide capital 21 Specific risk questions from investors 17 Key firmwide themes 29 Appendix 31 |
 1 TSS and AM pretax margin targets remain unchanged at 35% +/- through the cycle 2 IRR of 20% +/- 3 1/1/12 for illustrative purposes only 4 Reflects capital held against Corporate goodwill Common equity and target ROEs ($B) Common equity and performance targets Firmwide capital $0.5-$1B +/- of net income 22 $0.5-$1B +/- of net income 2011 1/1/2012 Investment Bank $40.0 $40.0 17% 17% +/- 9.5% +/- Consumer & Business Banking 9.5 9.0 40 30 +/- 8.5 +/- Mortgage Banking 15.5 17.5 (14) 15 +/- 8.5 +/- Card Services & Auto 16.0 16.5 28 20 +/- 8.5 +/- Commercial Banking 8.0 9.5 30 20 + 8.5 +/- Treasury & Securities Svcs. 1 7.0 7.5 17 25 +/- 9.0 +/- Asset Management 1 6.5 7.0 25 35 +/- 8.5 +/- Private Equity 3.6 4.8 11 20 +/- 2 9.5 +/- Corporate (CIO/Treasury/Corp) 13.1 18.3 3 Subtotal $119.2 $130.1 Unallocated Capital 3 $14.5 $3.6 Corporate Goodwill 4 42.1 42.1 Total Firm ROE $175.8 $175.8 Total Firm ROTCE Common equity 2011 ROE Targets Through-the- cycle ROE Basel III Tier 1 common 11% 15% 9.5% +/- 16% +/- |
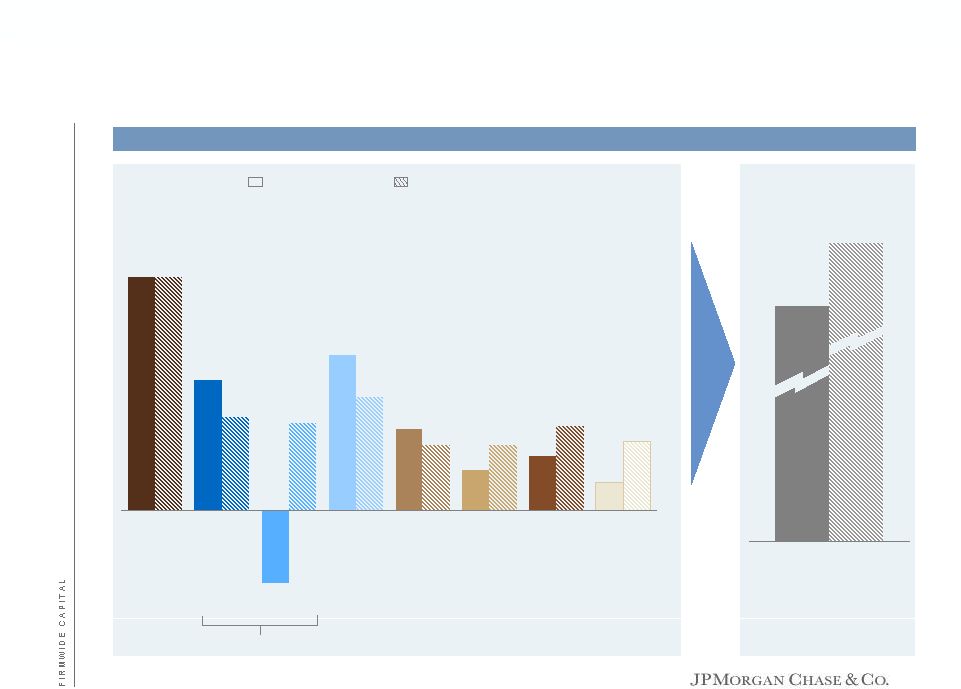 $6.8 $3.8 ($2.1) $4.5 $2.4 $1.2 $1.6 $0.8 LOB performance at targets Firmwide capital $24+/- 1 Net income projections based on performance target and steady state assumptions $19.0 2011 Net income Net income at performance targets 1 IB CBB MB Card CB TSS AM Corporate/PE RFS JPM 23 Net income by LOB ($B) |
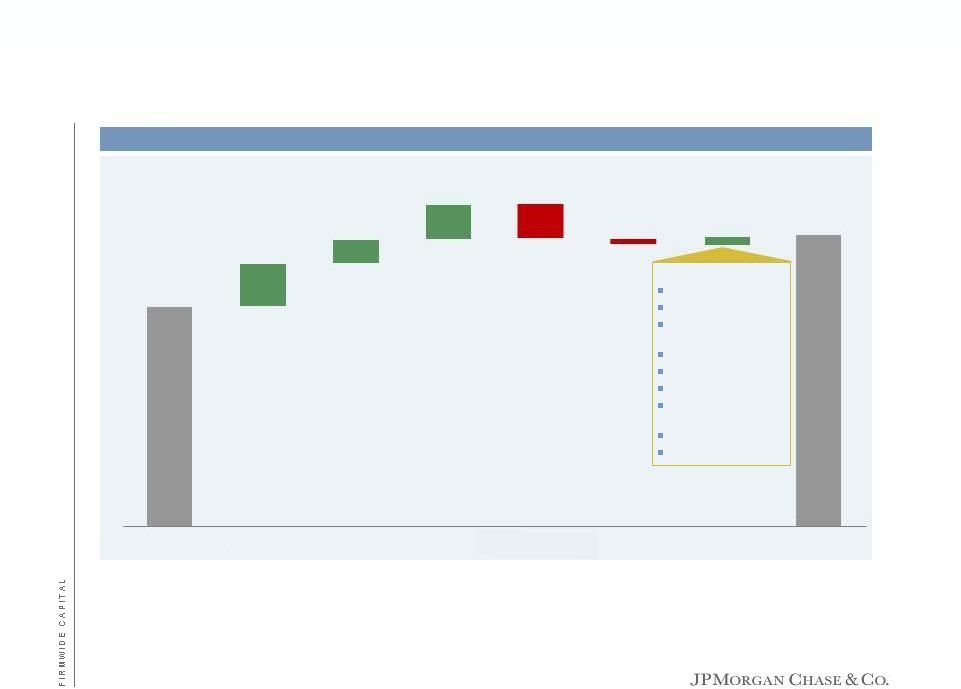 1 Includes servicing and default related costs, foreclosed asset expense, repurchase losses, MSR valuation adjustments offset by normalized production revenue, and normalized repurchases; excludes elevated credit costs 2 Corporate litigation expense for 2011 (after-tax) 3 Based on disclosed through-the-cycle net charge-off rates for IB, Card (excl. WaMu and Commercial Card), CB, Home Equity and Prime excl. Option ARM; applied to 2011 average retained loan balances. Card through-the-cycle charge-off rate applied to Card average balances, excl. WaMu and Commercial Card . Also excludes MB WaMu PCI portfolio and discontinued products 4 Loan loss reserve release for FY 2011 5 Durbin Amendment annualized 2012 net income impact of $600mm+/- less the impact of Durbin included in FY11 results. Excludes the potential incremental impact from Dodd Frank on the IB Note: Assumes tax rate of 38% Earnings walk Firmwide capital 24 Net income build ($B) FY11 NI excl. DVA Mortgage - related Matters 1 Corporate Litigation 2 Normalization of NCOs 3 Reserve Release 4 Durbin 5 Growth NI at performance targets $18.1 $24+/- $3.5 $2.0 ($2.9) ($0.5) $0.8+/- $3.0 Growth initiatives CPC Branch build Business Banking - WaMu expansion CB expansion Commodities GCB International expansion AM banker build-out MB production |
 Capital planning Firmwide capital Submitted Capital Plan on January 9, 2012 Follow-up meetings with Fed currently under way Expect response by March 15, 2012 Severe Fed stress scenario, evaluated under Basel I GDP decline of 8% Peak unemployment of 13% HPI decline of 20% from current level Equity markets decline of 52% from 3Q11 Severe global market shock, including specific European stresses Baseline evaluated under Basel III Capital Plan expected to show steady progress toward the fully phased in requirement of Basel III Tier 1 common ratio of 9.5% by 2019 Hierarchy of capital deployment, after dividends Organic growth Acquisitions Share repurchases Increase dividend to 30% payout ratio of normalized earnings over time 25 Dividends Capital hierarchy CCAR |
 Fed CCAR requires share repurchases to be consistent with baseline distributions Assuming analyst estimated dividends, and share repurchases generally consistent with 2011, Basel I Tier 1 common remains at ~8% in 2012 and 2013 Results in over $35B of excess capital above the 5% minimum Indicative stress analysis – Based on analyst estimates Firmwide capital Key assumptions Analyst estimates for net income and dividends Actual year end 2011 Basel I RWA held constant Repurchases to neutralize employee issuance ($B) 2011 2012 2013 Base net income $19.0 $18.2 $20.3 Stressed net income 1.5 12.8 Actual Basel I RWA ($T) $1.22 1.22 1.22 10.1% 11.1% 8.8% 9.3% 2011 2012 2013 12.2% Basel I Tier 1 common Stressed Basel I Tier 1 common 5% 2012-2013 net income reflects the average of 8 analyst estimates. Stressed net income reflects analyst Baseline NI multiplied by (JPM Fed Stress NI/JPM Baseline NI). 2012 and 2013 RWA levels held constant from year end 2011 Analyses assume analyst average dividend/share of $1.22 in 2012 and $1.51 in 2013 Stressed Basel I Tier 1 common remains well above 5% threshold 26 Key assumptions 1 Indicative stressed capital 2 Comments on stress results 1 2 Note: Fed stress case assumes backward looking market stress, which changes pro-forma Tier 1 common at the end of 2011. 2011 stressed Tier 1 common is used as a starting point for the stressed case in this analysis See note 3 on slide 43 for discussion of Basel estimates |
 Basel III RWA and Tier 1 common Firmwide capital 1 Basel III market risk RWA reflects the new capital requirements related to trading assets and securitizations, which include incremental capital requirements for stress VaR, correlation trading, and re-securitization positions 2 Primarily reflects securitization-related exposures required to be risk weighted at 1250% based on Basel III rules 3 Capital charge for potential mark-to-market losses associated with a deterioration in the credit worthiness of a counterparty 4 Applied to MSR, DTA, and investments in unconsolidated financial institutions 5 Other includes Basel I to II transition, reclassification of trading book positions, and counterparty credit Note: Analysis reflects current interpretation of Basel III guidelines and balance sheet assumptions See note 3 on slide 43 for discussion of Basel estimates 2011 Basel I Tier 1 common $123 AOCI for AFS securities; pension and other postretirement plans 0.9 Deduction for net defined benefit pension asset (1.4) Other (0.5) Basel I to Basel III incremental Tier 1 common (1.0) Estimated Basel III Tier 1 common $122 2011 RWA Basel I $1.22 Market risk impact 1 80 Risk weight 50/50 deductions at 1250% 2 80 CVA 3 65 250% risk weight 4 35 Other 5 65 Basel I to Basel III incremental RWA ($B) $325 Estimated RWA Basel III $1.55 2012 2013 Estimated beginning balance $1.55 $1.48 Data / Model enhancement (30) (30) Portfolio runoff (45) (35) BAU portfolio changes 10 20 Reduction in RWA ($B) (65) (45) Estimated ending balance $1.48 $1.44 27 Basel I to Basel III incremental RWA ($T) Potential Basel III RWA reductions ($T) Basel I to Basel III capital reconciliation ($B) |
 Baseline scenarios – Alternative Basel III trajectories Firmwide capital 1 2012-2013 net income reflects the average of 8 analyst estimates 2 Net of preferred dividends of $629mm, and includes estimated impact of employee issuance. The Firm expects to utilize its repurchase capacity to, at a minimum, essentially repurchase the same amount of shares that it issues for employee stock-based incentive awards 3 Reported estimates 4 Achieve a Tier 1 common ratio of 9.5% by the end of 2018 5 Achieve a Tier 1 common ratio of 9.5% by the end of 2013 Note: See note 3 on slide 43 for discussion of Basel estimates 3 3 2011 2012E 2013E Net income¹ $19.0 $18.2 $20.3 Potential RWA ($T) $1.55 $1.48 $1.44 Tier 1 common - pre-capital distribution 2 $122 $141 $163 Tier 1 common ratio - pre-capital distribution 2 7.9% 9.5% 11.3% 28 Capital adequacy – Based on analyst estimates ($B) Straight line 4 Accelerated 5 2012E 2013E Tier 1 common ratio target 2 8.1% 8.3% Annual capital distribution capacity 2 $21 $22 2012E 2013E Tier 1 common ratio target 2 8.7% 9.5% Annual capital distribution capacity 2 $13 $14 |
 Agenda Page 29 Key firmwide themes 29 Specific risk questions from investors 17 Firmwide capital 21 Appendix 31 |
 Key firmwide themes Consistent focus on customer experience and innovation Continued focus on cross-LOB opportunities GCB at the core of IB/TSS/CB collaboration Organizing Consumer businesses Positioning LOBs for continued growth in market share Significant opportunity for net income growth Enhancing our ongoing focus on expense discipline Adapting to the new regulatory environment and capital rules Fortress balance sheet affords us the opportunity to Serve as a source of strength for our clients Continue to invest in organic growth Return excess capital to our shareholders 30 |
 Agenda Page 31 Appendix 31 Specific risk questions from investors 17 Firmwide capital 21 Key firmwide themes 29 |
 Managed financial results 2009 2010 2011 Investment Bank $6,899 $6,639 $6,789 Retail Financial Services (335) 1,728 1,678 Card Services (1,793) 2,872 4,544 Commercial Banking 1,271 2,084 2,367 Treasury & Securities Services 1,226 1,079 1,204 Asset Management 1,430 1,710 1,592 Corporate/Private Equity 3,030 1,258 802 Total firm net income $11,728 $17,370 $18,976 Firmwide results ($mm) Net income by lines of business ($mm) 1 See note 1 on slide 43 2 Net income used to calculate the ratios for 2009 excludes the one-time, non-cash negative adjustment of $1.1B resulting from the repayment of TARP preferred capital, which is a non-GAAP financial measure. Including this, ROE was 6% 3 See note 4 on slide 43 32 2009 2010 2011 Revenue (FTE) 1 $108,647 $104,842 $ 99,767 Credit Costs 1 38,458 16,639 7,574 Expense 52,352 61,196 62,911 Reported net income $11,728 $17,370 $ 18,976 Reported EPS $2.2 6 $3.96 $4.48 ROE 2 7% 10% 11% ROTCE 2,3 11 15 15 |
 Investment Bank Leadership positions Global IB Fee market leader, #1 ranking for the past three years 5 Ranked #1 in disclosed 2011 Markets revenue among the top 10 competitors, both including and excluding DVA, up from #2 in 2010 Selected by Greenwich Associates as a Quality and Share Leader for 48 distinctions across 15 programs, including Global Fixed Income, U.S. Large Corporate Finance and U.S. Equities, 2011 Named U.S. Municipal Bond House of the Year by IFR, 2011 Ranked #1 2011 Overall, Risk’s Institutional Investor rankings $mm 2009 2010 2011 Revenue $28,109 $26,217 $26,274 IB Fees 7,169 6,186 5,859 Fixed Income Markets 17,564 15,025 15,337 Equity Markets 4,393 4,763 4,832 Credit Portfolio (1,017) 243 246 Expense 15,401 17,265 16,116 Credit Costs 2,279 (1,200) (286) Net Income $6,899 $6,639 $6,789 Key Statistics ($B) Overhead Ratio 55% 66% 61% Comp/Revenue 1 33 37 34 EOP Loans $49.1 $56.9 $71.1 Allow. for Loan Losses 3.8 1.9 1.4 Net Charge-off Rate 3.04% 1.35% 0.28% ALL / EOP Loans 2 8.25 3.51 2.11 ROE 3 21 17 17 VAR ($mm) 4 $164 $87 $76 EOP Equity 33.0 40.0 40.0 33 The compensation expense as a percentage of total net revenue ratio includes the impact of the U.K. Bank Payroll Tax on certain compensation awarded from December 9, 2009 to April 5, 2010 to relevant banking employees. For comparability to prior periods, IB excludes the impact of the U.K. Bank Payroll Tax expense, which results in a compensation expense as a percentage of total net revenue for 2010 of 35%, which is a non-GAAP financial measure Loans held-for-sale and loans at fair value were excluded when calculating the loan loss coverage ratio and net charge-off rate Calculated based on average equity Average Trading and Credit portfolio VAR at 95% confidence level Dealogic based on revenue 1 2 3 4 5 |
 Retail Financial Services $mm 34 % % % % % % 1 Calculated based on average equity; average equity for 2011, 2010 and 2009 was $25.0B $24.6B, and $22.5B, respectively 2 Calculated based on average equity; average equity for 2011, 2010 and 2009 was $14.5B, $14.9B, and $12.7B, respectively 2009 2010 2011 Net Interest Income $18,383 $17,220 $16,133 Noninterest Income 11,414 11,227 10,405 Revenue 29,797 28,447 26,538 Expense 15,512 16,483 19,458 Pre-Provision Pretax $14,285 $11,964 $7,080 Credit Costs 14,754 8,919 3,999 Net Income ($335) $1,728 $1,678 EOP Equity ($B) $22 $25 $25 ROE 1 (1) 7 7 Memo: RFS Net income excl. Real Estate Portfolios $5,114 $4,221 $1,984 ROE excl. Real Estate Portfolios 40 28 14 |
 Retail Financial Services Consumer & Business Banking $mm Leadership positions Attractive footprint Tri-state Midwest California Top deposit shares in #1 New York #1 Chicago #1 Phoenix #1 Dallas/Ft. Worth #1 Houston Northwest Florida Southwest # 1 Columbus, OH #2 Seattle #3 Los Angeles #3 San Francisco #3 Miami 2009 2010 2011 Net Interest Income $10,864 $10,884 $10,809 Noninterest Income 7,204 6,844 7,201 Revenue $18,068 $17,728 $18,010 Expense 10,421 10,717 11,202 Pre-Provision Pretax $7,647 $7,011 $6,808 Credit Costs 1,176 630 419 Net Income $3,915 $3,652 $3,816 Key Drivers ($B) Average Total Deposits $345.0 $340.8 $360.7 Deposit Margin 2.92% 3.00% 2.82% Checking Accounts (mm) 25.7 27.3 26.6 # of Branches 5,154 5,268 5,508 Business Banking Originations $2.3 $4.7 $5.8 Client Investment Assets $120.5 $133.1 $137.9 # of Active Mobile Customers (mm) 1.2 5.3 8.4 35 |
 Retail Financial Services Mortgage Production and Servicing Leadership positions #3 in Mortgage Originations with 11.5% market share² #3 in Mortgage Servicing with 11.4% market share² $mm 1 Headcount for total Mortgage Banking 2 Source: Inside Mortgage Finance, 4Q11 2009 2010 2011 Production Production-related Revenue excl. Repurchase Losses $3,194 $4,309 $4,235 Production Expense 1,575 1,613 1,895 Income excl. repurchase losses $1,619 $2,696 $2,340 Repurchase Losses (1,612) (2,912) (1,347) Income/(loss) before income tax expense/(benefit) $7 ($216) $993 Servicing Servicing-related Revenue $5,182 $5,008 $4,524 MSR Asset Amoritization (3,279) (2,384) (1,904) Servicing Expense 1,684 2,584 4,845 Income/(loss), excl. MSR risk management 219 40 (2,225) MSR Risk Management 1,724 1,151 (1,572) Income/(loss) before income tax expense/(benefit) $1,943 $1,191 ($3,797) Net income/(loss) $1,199 $569 ($1,832) Key Drivers ($B) Mortgage Loan Originations $150.7 $155.6 $145.6 Retail Channel Originations 53.9 68.8 87.2 Mortgage Application Volume 206.6 214.8 204.7 3rd Party Mtg Loans Svc'd (EOP) 1,082.1 967.5 902.2 Headcount 1 32,393 39,440 49,189 36 |
 2009 2010 2011 Revenue $6,520 $5,547 $4,592 Expense 1,847 1,627 1,521 Pre-Provision Pretax 4,673 3,920 3,071 Net Charge-Offs 8,343 6,450 3,805 Change in Allowance 5,220 1,781 (230) Credit Costs 13,563 8,231 3,575 Net Income ($5,449) ($2,493) ($306) Memo: ALL/ EOP Loans 1 6.55% 6.47% 6.58% Key Drivers 1 ($B) Average Home Equity Loans Owned 2 $136.0 $120.3 $106.4 Average Mortgage Loans Owned 2 133.7 117.6 102.8 Retail Financial Services Real Estate Portfolios Excludes the impact of purchased credit-impaired loans acquired as part of the WaMu transaction. An allowance for loan losses of $5.7B, $4.9B and $1.6B was recorded for these loans at year end 2011, 2010 and 2009, respectively Includes purchased credit-impaired loans acquired as part of the WaMu transaction 37 $mm 1 2 |
 Card Services & Auto Leadership positions Chase is #1 Visa credit card issuer 20.8% market share of General Purpose Credit Card outstandings 4 19.3% market share of General Purpose Credit Card sales volume 4 #1 co-brand card issuer in the U.S. 5 #1 merchant acquirer in e-commerce payment processing 5 1 2009 on a managed basis. See note 1 on slide 43 2 Calculated based on average equity; 2011, 2010 and 2009 average equity was $16.0B, $18.4B and $17.5B, respectively 3 Statistics include loans held for sale 4 Excludes WaMu and Commercial Card 5 Based on internal JPM estimates 2009 1 2010 2011 Card Services & Auto Revenue $23,199 $20,472 $19,141 Credit Costs 19,648 8,570 3,621 Expense 6,617 7,178 8,045 Net Income ($1,793) $2,872 $4,544 ROE 2 (10)% 16% 28% EOP Equity ($B) $17.5 $18.4 $16.0 Card Services — Key Drivers excl. Commercial Card 3 ($B) Avg Outstandings $172.4 $144.4 $126.8 Sales volume $294.1 $313.0 $343.7 New Accts Opened (mm) 10.2 11.3 8.8 Net Revenue Rate 11.78% 11.89% 12.31% Net Charge-off Rate 9.33 9.72 5.46 30+ Day Delinquency Rate 6.28 4.07 2.82 Merchant Services — Key Drivers (B) Bank card volume $409.7 $469.3 $553.7 # of total transactions 18.0 20.5 24.4 Auto — Key Drivers ($B) Avg Outstandings - Auto $43.6 $47.6 $47.0 Avg Outstandings - Student 16.1 15.9 $14.0 Auto Originations 23.7 23.0 $21.0 38 $mm |
 Includes deposits and deposits swept to on-balance sheet liabilities Loans held-for-sale and loans at fair value were excluded when calculating the loan loss coverage ratio and net charge-off rate Calculated based on average equity Reflect CB-equivalent segments at BAC, KEY, PNC and USB Based on CB-equivalent segments or wholesale portfolios at BAC, CMA, FITB, KEY, PNC, USB and WFC Thomson Reuters FY11 FDIC 9/30/11 Commercial Banking Leadership positions Highest ROE in peer group 4 Lowest overhead ratio in peer group 5 Continued to outperform peers in credit quality with the lowest net charge-off ratio and nonperforming loan ratio in peer group 5 Top 3 Middle Market syndicated lender in the U.S. 6 #1 multi-family lender in the U.S. 7 2009 2010 2011 Revenue $5,720 $6,040 $6,418 Middle Market 3,055 3,060 3,145 Corp. Client Banking 1,102 1,154 1,261 Comm. Term Lending 875 1,023 1,168 Real Estate 461 460 416 Other 227 343 428 Expense 2,176 2,199 2,278 Credit Costs 1,454 297 208 Net Income $1,271 $2,084 $2,367 Key Statistics ($B) Avg Loans $106.7 $97.0 $104.2 EOP Loans 97.4 98.9 112.0 Avg Liability Balances 1 113.2 138.9 174.7 Gross IB Fees ($mm) 1,163 1,335 1,421 Allow. for Loan Losses 3.0 2.6 2.6 NPLs 2.8 2.0 1.1 Net Charge-Off Rate 2 1.02% 0.94% 0.18% ALL/Loans 2 3.12 2.61 2.34 ROE 3 16 26 30 Overhead Ratio 38 36 35 EOP Equity $8.0 $8.0 $8.0 39 $mm 1 2 3 4 5 6 7 |
 Treasury & Securities Services 2009 2010 2011 Revenue $7,344 $7,381 $7,702 Treasury Services 3,702 3,698 3,841 Worldwide Securities Svcs. 3,642 3,683 3,861 Expense 5,278 5,604 5,863 Credit Costs 55 (47) 1 Net Income $1,226 $1,079 $1,204 Key Statistics Avg Liability Balances ($B) 1 $248.1 $248.5 $318.8 Assets Under Custody ($T) 14.9 16.1 16.9 Pretax Margin 26% 23% 24% ROE 2 25 17 17 TSS Firmwide Revenue $10,231 $10,260 $10,237 TS Firmwide Revenue 6,589 6,577 6,376 TSS Firmwide Avg Liab Bal ($B) 1 361.2 387.3 493.5 EOP Equity ($B) 5.0 6.5 7.0 Includes deposits and deposits swept to on-balance sheet liabilities Calculated based on average equity Source: Federal Reserve, Clearing House for Interbank Payments (CHIPS), and Ernst & Young Source: Greenwich Associates, 2011 Source: JPM and peer 4Q11 company filings Source: Various global exchanges, as of November 2011 Source: Nilson Leadership positions #1 global clearer of U.S. dollars and #1 Automated Clearing House for originations 3 #1 (tied) share leader in U.S. Large Corporate Treasury Management Market Penetration providers 4 #2 provider of custody services leveraging significant scale and global footprint with $16.9T in AUC 5 #2 in number of sponsored American Depository Receipt (ADR) shares 6 #1 Visa / MasterCard Commercial, Purchasing and Prepaid card issuer in the U.S. 7 40 1 2 3 4 5 6 7 $mm |
 Asset Management Leadership positions #1 Institutional Money Market Fund Manager Worldwide 2 #1 Ultra-High-Net-Worth Private Bank Globally 3 #2 in U.S. Total Net Mutual Fund flows 4 2011 Asset Manager of the Year for Asia and Hong Kong 5 Leading Pan-European Fund Management Firm 6 Best brand in Private Banking 7 Best Private Bank for Customer Service 7 1 Calculated based on average equity 2 Source: iMoney, 2011 3 Source: EuroMoney, 2012 4 Source: Strategic Insight, 2011 5 Source: The Asset Magazine, 2011 6 Source: Thomson Reuters, 2011 7 Source: Financial Times, 2011 2009 2010 2011 Revenue $7,965 $8,984 $9,543 Private Banking 4,320 4,860 $5,116 Institutional 2,065 2,180 2,273 Retail 1,580 1,944 2,154 Expense 5,473 6,112 7,002 Credit Costs 188 86 67 Net Income $1,430 $1,710 $1,592 Key Statistics ($B) Assets Under Management $1,249 $1,298 $1,336 Assets Under Supervision 1,701 1,840 1,921 Average Loans 35.0 38.9 50.3 EOP Loans 37.8 44.1 57.6 Average Deposits 77.0 86.1 106.4 Pretax Margin 29% 31% 26% ROE 1 20 26 25 EOP Equity $7.0 $6.5 $6.5 41 $mm |
 Corporate/Private Equity $8.7 $7.7 $7.3 5.7% 6.9% 6.3% $5.0 $6.0 $7.0 $8.0 $9.0 2009 2010 2011 0.0% 2.0% 4.0% 6.0% 8.0% Portfolio as % of equity ex. goodwill EOP carrying value 1 Includes merger-related items 2009 2010 2011 Private Equity ($78) $588 $391 Corporate 1 3,108 670 411 Net Income $3,030 $1,258 $802 42 Net income ($mm) Private Equity portfolio ($B) |
 Notes on non-GAAP & other financial measures 43 Notes on non-GAAP financial measures 1. In addition to analyzing the Firm’s results on a reported basis, management reviews the Firm’s results and the results of the lines of business on a “managed” basis, which is a non-GAAP financial measure. The Firm’s definition of managed basis starts with the reported U.S. GAAP results and includes certain reclassifications to present total net revenue for the Firm (and each of the business segments) on a FTE basis. Accordingly, revenue from tax-exempt securities and investments that receive tax credits is presented in the managed results on a basis comparable to taxable securities and investments. This non-GAAP financial measure allows management to assess the comparability of revenue arising from both taxable and tax-exempt sources. The corresponding income tax impact related to tax-exempt items is recorded within income tax expense. These adjustments have no impact on net income as reported by the Firm as a whole or by the lines of business. Prior to January 1, 2010, the Firm’s managed basis presentation also included certain reclassification adjustments that assumed credit card loans securitized by Card Services & Auto remained on the balance sheet. Effective January 1, 2010 the Firm adopted accounting guidance that required the Firm to consolidate its Firm-sponsored credit card securitization trusts. The income, expense and credit costs associated with these securitization activities are recorded in the 2011 Consolidated Statements of Income in the same classifications that were previously used to report such items on a managed basis. As a result of the consolidation of the credit card securitization trusts, reported and managed basis relating to credit card securitizations are equivalent for periods beginning January 1, 2010. The presentation of Card Services & Auto’s results prior to January 1, 2010 on a managed basis assumed that credit card loans that had been securitized and sold in accordance with U.S. GAAP remained on the Consolidated Balance Sheets, and that the earnings on the securitized loans were classified in the same manner as the earnings on retained loans recorded on the Consolidated Balance Sheets. JPMorgan Chase used the concept of managed basis to evaluate the credit performance and overall financial performance of the entire managed credit card portfolio. Operations were funded and decisions were made about allocating resources, such as employees and capital, based on managed financial information. In addition, the same underwriting standards and ongoing risk monitoring are used for both loans on the Consolidated Balance Sheets and securitized loans. Although securitizations result in the sale of credit card receivables to a trust, JPMorgan Chase retains the ongoing customer relationships, as the customers may continue to use their credit cards; accordingly, the customer’s credit performance affects both the securitized loans and the loans retained on the Consolidated Balance Sheets. JPMorgan Chase believed that this managed-basis information was useful to investors, as it enabled them to understand both the credit risks associated with the loans reported on the Consolidated Balance Sheets and the Firm’s retained interests in securitized loans. 2. The ratio of the allowance for loan losses to end-of-period loans excludes the following: loans accounted for at fair value and loans held-for-sale; purchased credit-impaired (“PCI”) loans; and the allowance for loan losses related to PCI loans. Additionally, Real Estate Portfolios net charge-offs exclude the impact of PCI loans. The allowance for loan losses related to the purchased credit-impaired portfolio totaled $5.7 billion, $4.9 billion and $1.6 billion at December 31, 2011, 2010 and 2009, respectively 3. The Basel I Tier 1 common ratio is Tier 1 common divided by risk-weighted assets. Tier 1 common is defined as Tier 1 capital less elements of Tier 1 capital not in the form of common equity, such as perpetual preferred stock, noncontrolling interests in subsidiaries and trust preferred capital debt securities. Tier 1 common, a non-GAAP financial measure, is used by banking regulators, investors and analysts to assess and compare the quality and composition of the Firm’s capital with the capital of other financial services companies. The Firm uses Tier 1 common along with other capital measures to assess and monitor its capital position. On December 16, 2010, the Basel Committee issued the final version of the Basel Capital Accord, commonly referred to as “Basel III.” The Firm’s estimate of its Tier 1 common ratio under Basel III is a non-GAAP financial measure and reflects the Firm’s current understanding of the Basel III rules and the application of such rules to its businesses as currently conducted, and therefore excludes the impact of any changes the Firm may make in the future to its businesses as a result of implementing the Basel III rules. The Firm’s understanding of the Basel III rules is based on information currently published by the Basel Committee and U.S. federal banking agencies. Management considers this estimate as a key measure to assess the Firm’s capital position in conjunction with its capital ratios under Basel I requirements, in order to enable management, investors and analysts to compare the Firm’s capital under the Basel III capital standards with similar estimates provided by other financial services companies. 4. Tangible common equity (“TCE”), a non-GAAP financial measure, represents common stockholders’ equity (i.e., total stockholders’ equity less preferred stock) less goodwill and identifiable intangible assets (other than MSRs), net of related deferred tax liabilities. ROTCE, a non-GAAP financial ratio, measures the Firm’s earnings as a percentage of TCE. In management’s view, these measures are meaningful to the Firm, as well as analysts and investors in assessing the Firm’s use of equity, and in facilitating comparisons with competitors. 5. In Card Services, supplemental information is provided for Chase, excluding Washington Mutual and Commercial Card portfolios, to provide more meaningful measures that enable comparability with prior periods. The net charge-off rate and 30+ delinquency rate presented include loans held-for-sale. 6 In addition to reviewing JPMorgan Chase's net interest yield on a managed basis, management also reviews core net interest income to assess the performance of its core lending, investing (including asset /liability management), and deposit-raising activities, excluding the impact of IB's market-based activities. IB’s market-based activities is defined as total IB net interest income less net interest income earned on IB loans. The chart presents an analysis of managed core net interest income and core net interest margin. These are non-GAAP financial measures due to the exclusion of IB's market-based net interest income and the related assets. Management believes the exclusion of IB's market-based activities, provides investors and analysts a more meaningful measure to analyze non-market related business trends of the Firm and can be used as a comparable measure to other financial institutions primarily focused on core lending, investing and deposit-raising activities. Additional notes on financial measures 7. Pretax margin represents income before income tax expense divided by total net revenue, which is, in management’s view, a comprehensive measure of pretax performance derived by measuring earnings after all costs are taken into consideration. It is, therefore, another basis that management uses to evaluate the performance of TSS and AM against the performance of their respective competitors. |
 February 28, 2012 M O R T G A G E B A N K I N G Frank Bisignano, Mortgage Banking CEO and Chief Administrative Officer |
 Agenda Page 1 Performance and outlook 1 Mortgage Production 10 Mortgage Servicing 19 Real Estate Portfolios 27 Appendix 32 |
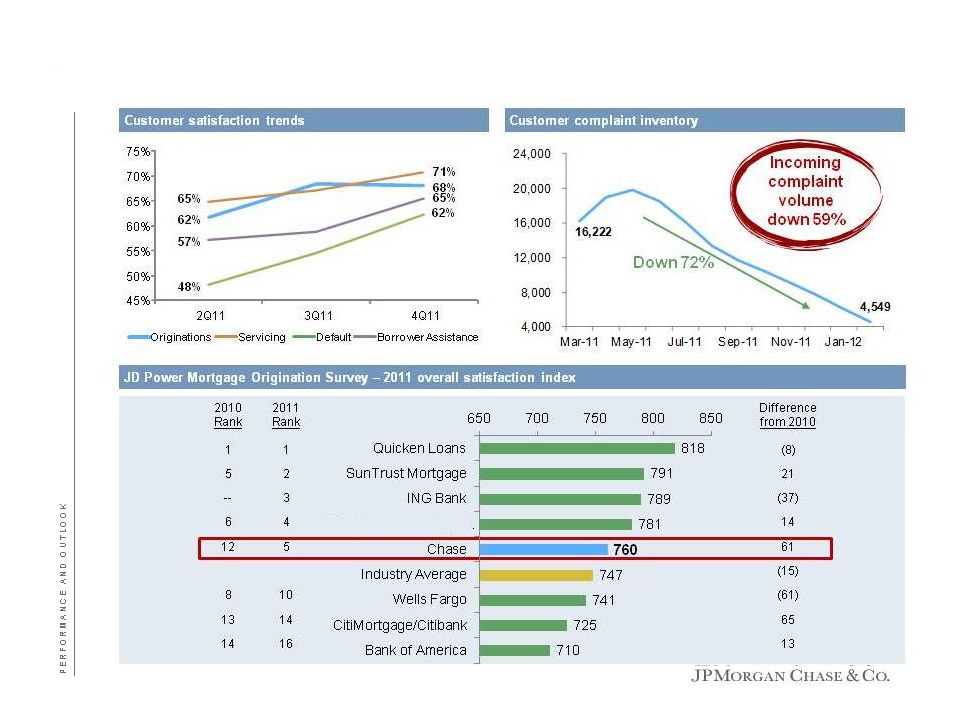
 Uncertainty continues Private label litigation; GSE/FHA/VA/PLS repurchases and other Volume of unsold homes; shadow inventory Role of private capital in mortgage market liquidity The OCC and the Fed issued Consent Orders in April 2011 to large mortgage servicers Servicer plans were approved by the OCC and the Fed Communication with borrowers began in October Modification and refinance programs continue to be expanded Significant proprietary modification and short sale programs exist with each servicer Servicing practices largely remediated 2011 – A year of repositioning $25B settlement covers 5 servicers ~$5B – Cash ~$3B – Refi Program for “underwater” homeowners ~$17B – Additional consumer relief Required to adhere to certain enhanced mortgage servicing standards 1 Ever 30 days delinquent measured 6 months from origination for the JPMC serviced portfolio; excludes HARP Recent underwriting practices have demonstrated strong performance Early delinquency rates 1 peaked in 2005-2008 vintages at 1.5% for Prime/Home Equity loans; over 4% for government insured 2009+ vintages averaging less than 0.5% across product types 2 |
 2011 – Positioning for success at Chase Chase now #2 in originations – 3Q/4Q11 Increased the number of loans originated from the branches by over 40% Enhanced customer experience JD Power Customer Satisfaction rank up to 5 th , from 12 th Community relationships improved Reconstituted management team and organizational structure Recruited key leadership by leveraging talent inside the firm and from strategic external hires Formed Borrower Assistance Increased loan officers 23% in 2011 Leveraged firmwide expertise and best practices across LOBs – Investment Bank, CIO, and other Consumer businesses Consolidated three servicing platforms into one Re-engineered servicing processes to improve efficiency Increased number of modifications per month by 38% and short sales by 43% Charge-offs decreased Repurchase losses lower Strong retail channel volumes and margins Control governance structure revamped; risk management oversight enhanced Consent Orders servicing improvements Brought full power of the firm to fix our mortgage business Delivered on technology and process improvements Improved volumes, market share, and customer satisfaction Improved risk and control environment Improving financial performance 3 |
 2011 – Focused on more profitable Retail channel Overall market share increase driven by Retail originations – Now represent ~2/3 of our volume While growth has been driven by the Retail channel, we continue to believe the Correspondent channel is attractive with the appropriate risk/return profile Note: Retail channel includes branch and direct to consumer originations Source: Inside Mortgage Finance – Originations are firmwide 4 |
 2011 – Positioning for success at Chase 5 BB&T |
 2011 Results Total origination market size $1,840.0 $1,630.0 $1,350.0 Chase mortgage loan originations 150.7 155.6 145.6 Chase Retail channel originations $53.9 $68.8 $87.2 Chase Correspondent channel originations 93.2 85.5 57.9 3rd Party mtg loans svc'd (EOP) 1,082.1 967.5 902.2 MSR net carrying value (EOP) 15.5 13.6 7.2 MSR revenue multiple 3.3x 3.2x 1.8x Headcount 32,393 39,440 49,189 2009 2010 2011 Production pre-tax $7 ($216) $993 Servicing pre-tax 1,943 1,191 (3,797) Real Estate Portfolio pre-tax (8,890) (4,311) (504) Total net income ($4,250) ($1,924) ($2,138) 6 P&L ($mm) Key drivers ($B, unless otherwise noted) |
 Ongoing Legacy Total Normalized Production Pre-tax income $2,270 ($1,277) $993 $1,500 +/- Servicing Servicing operating pre-tax 203 (2,428) (2,225) MSR risk management 154 (1,726) (1,572) Total pre-tax income $357 ($4,154) ($3,797) $1,000 +/- Real Estate Portfolios 1 Pre-tax pre-provision 549 2,522 3,071 Credit costs 109 3,466 3,575 Total pre-tax income $440 ($944) ($504) $500-1,000 Total Mortgage Banking pre-tax income $3,067 ($6,375) ($3,308) $3,000-3,500 Mortgage Banking net income $1,982 ($4,120) ($2,138) $1,800-2,100 Normalized ROE 15% 2011 2011 Ongoing vs. legacy view – Ongoing business profitable Production: legacy repurchase losses will normalize over time Servicing: MSR yield will improve in 2012 based on refinement of MSR valuation model in 4Q11 Weighted average option adjusted spread of 7.8% at year end 2011 vs. 3.9% at year end 2010 Real Estate Portfolios: legacy portfolio will improve with credit and ultimately turn positive Normalized earnings should produce 15% ROE through the cycle 1 Legacy Real Estate Portfolio is defined as WaMu purchased credit-impaired, discontinued products, broker originated loans, limited documentation loans, and certain loans with ECLTVs greater than 80%. Ongoing portfolio end-of-period loan balance is $36B and legacy portfolio end-of-period loan balance is $162B 7 Mortgage Banking ($mm) Key drivers |
 2011 included significant negatives 1 RFS only. Excludes EMC 2 Excludes non-recurring foreclosure-related matters 3 Includes refinements to the valuation model and related inputs comprising updates to the prepayment model, revised fee and cost to service assumptions and an increase in the option adjusted spread (“OAS”) to reflect higher return and capital requirements 2011 servicing and default expense of $3.2B will normalize to $1.25B over time 2011 results include $3.4B of non-recurring costs Significant items - pretax 2010 2011 Normalized Production Repurchase losses 1 (2,912) (1,347) (150) Servicing Servicing and default expense 2 ($2,234) ($3,195) ($1,250) Core servicing expense (837) (1,031) Default servicing expense (1,397) (2,164) Non-recurring ($350) ($3,377) Foreclosure related matters (350) (1,650) MSR valuation updates 3 NM (1,727) Real Estate Portfolios Foreclosed asset expense (896) (649) (200) Subtotal ($6,392) ($8,568) ($1,600) ($mm) 8 |
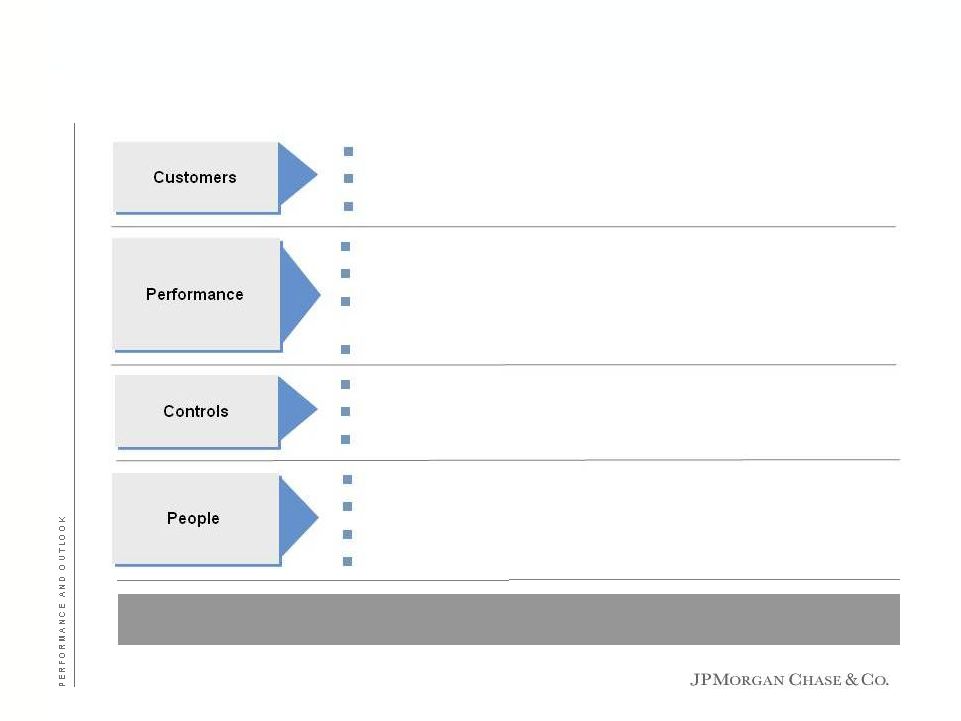 Capitalize on ‘One Chase’ brand Continue to improve customer experience Continue root cause analysis to eliminate customer complaints Strengthen controls, minimize breakages and defects Enhance compliance, risk and control infrastructure Deliver against Consent Orders and DOJ/AG requirements Attract and retain talent to focus on most critical areas Develop and motivate high performers Improve loan officer retention Build a culture of quality and control 2012: business growth and winning Expand and strengthen the production franchise Accelerate growth, particularly in retail channel and purchase lending Re-engineer origination and servicing processes and enhance operating efficiency Price for appropriate returns given increasing capital requirements Leverage technology to enhance customer experience and improve operating efficiencies and controls 9 |
 Agenda Page 10 Mortgage Production 10 Performance and outlook 1 Mortgage Servicing 19 Real Estate Portfolios 27 Appendix 32 |
 Blank slide Best-in-class customer experience – Mortgage Manager video This page is intentionally left blank 11 |
 Blank slide Strengthen the production franchise Retail origination model leverages Chase brand and customer delivery platform Branches, online, and mobile Core product for branch cross-sell opportunities Fee based counter-cyclical earnings stream complements traditional spread businesses Attractive returns over the cycle Why we like the business Improve purchase market share to 10%-12% An increase of ~50% from 2011 Retail sales force growth ~25% in 2012 Best-in-class customer experience Roll out Mortgage Manager New retail origination platform Improve productivity Enhance underwriting and process quality Areas of focus 12 |
 Core product for branch cross-sell opportunities Relationship impact after acquiring a Chase mortgage Excludes any additional value attributed to cross-sell (e.g. credit card, investments) Households with a mortgage are generally more affluent and offer more cross-sell value than those without a mortgage Mortgage increases the value of the overall customer relationship 2 Mass Affluent has a deposit and investment wallet of $100k-$500k, affluent has $500k-$5mm, and high net worth has greater than $5mm 1 Higher share of wallet and lower attrition of balances 13 Incremental value 1 of adding mortgage to a banking relationship % of HH that are high net worth, mass affluent or affluent 2 |
 Blank slide Mortgage production – Purchase market share opportunity Source: Inside Mortgage Finance Lowest rates in history and HARP led to recent robust refinance market We expect market mix to be weighted to purchase in a more normal rate environment Focus on growing share in purchase to capitalize on market growth Well positioned to take share in purchase market 5.7mm existing Chase mortgage households 6.1mm existing eligible Chase banking relationships with no mortgage relationship 75k real estate agent relationships in business banking Strong recruiting of purchase-focused loan officers Increasing lead in customer satisfaction versus top competitors Purchase Refi $2.5T $1.6T Average mortgage market size and purchase/refinance mix Comments Chase mortgage originations market share 14 |
 Blank slide Mortgage production – Retail model differentiation Opportunity to increase sales force to match competitors Added +/- 700 loan officers in 2011 Additional +/- 1,000 loan officers in 2012 is additional run rate annual pretax earnings of $100mm+ Sources: Company filings and investor presentations Chase loan officer productivity exceeds major competitors Loan officers substantially located at branches Marketing investment drives leads to branches and call center 15 2011 Retail fundings / loan officer / month Number of loan officers (EOP) Commentary Commentary |
 Blank slide Mortgage origination economics Business drivers Sales force size/productivity Marketing effectiveness Customer experience Operational efficiency and capacity flexibility Underwriting and process quality Repurchase expense Market risk exposure to MBS rates Competitor capacity/margin positioning Purchase market does not recover Regulatory and GSE changes Risks Market volume $1.5T +/- Market share 15% +/- Chase volume $225B +/- Chase pretax margin / $ volume 65bps +/- Chase pretax income $1.5B +/- Execution of business drivers creates attractive returns over the cycle High returns in peak refinance years Lower returns in “normal” years Normalized target income 16 |
 Repurchase update FY11 realized losses of $1.1B with reserves of $3.2B Realized losses trended higher in 2H11 as GSE demands accelerated GSEs have improved cycle times (reduced time between file request and demand) ~90% of demands continue to come from 2005-2008 vintages While 2012 realized losses are expected to remain elevated, reserves will come down at some point Newly delinquent loans have longer payment history, reducing likelihood of origination defect Outlook of +/- $350mm realized losses per quarter Realized losses and reserve Commentary 4Q10 1Q11 2Q11 3Q11 4Q11 FY10 FY11 Realized losses ($mm) $349 $215 $215 $314 $390 $1,360 $1,134 Reserve ($B, EOP) $3.0 $3.2 $3.2 $3.2 $3.2 $3.0 $3.2 17 |
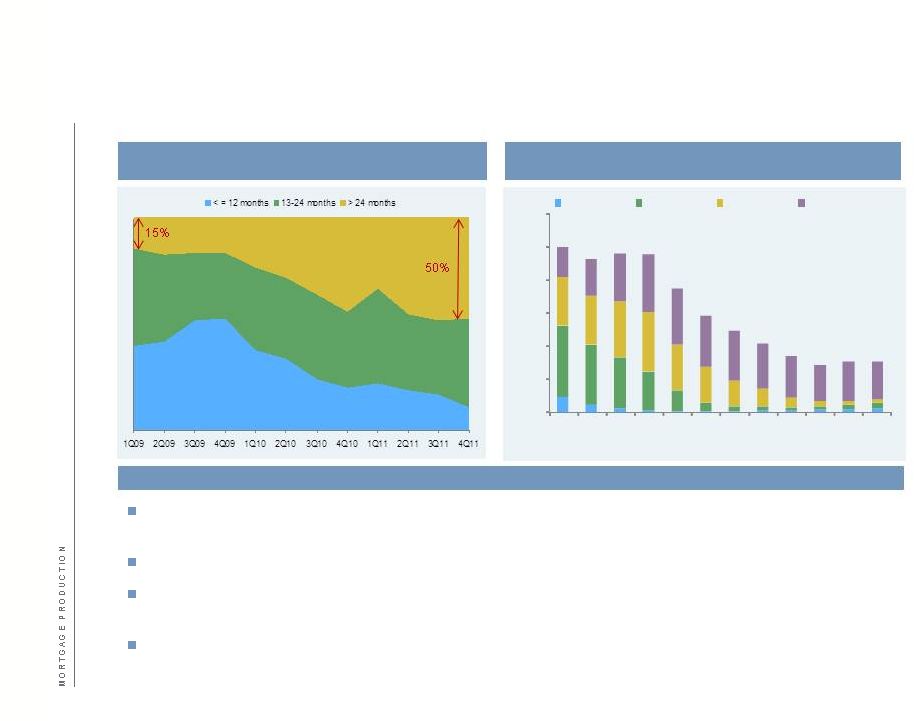 Repurchase update Loans going delinquent after 24 months of payment history are typically at a lower risk of repurchase due to rep and warrant defect ~50% of demands received in 2H11 have made more than 24 months of payments – Up from ~15% in 2009 Cure rates (ability to remedy purported defect) have been 10-15 points higher on loans with greater than 24 months pay history New delinquencies have decreased significantly from 2009 peak; majority of newly delinquent loans in 2011 had more than 36 months of pay history 4,968 4,611 4,786 4,742 3,719 2,909 2,457 2,053 1,694 1,426 1,527 1,520 - 1,000 2,000 3,000 4,000 5,000 6,000 1Q09 2Q09 3Q09 4Q09 1Q10 2Q10 3Q10 4Q10 1Q11 2Q11 3Q11 4Q11 <= 12 months 13 - 24 months 25 - 36 months >36 months 18 GSE new demands by pay history (2005-2008 Vintages, hChase UPB, $mm) GSE new loans to 90 days past due by burnout (2005-2011 vintages, hChase, UPB $mm) Commentary |
 Agenda Page 19 Mortgage Servicing 19 Performance and outlook 1 Mortgage Production 10 Real Estate Portfolios 27 Appendix 32 |
 Blank slide Improving servicing profitability Achieve short term run-rate savings Delinquent accounts decrease Modification inventory reduced through borrower assistance initiatives Normalize servicing expense over time Regulatory environment, including Consent Orders and DOJ/AG related items Improve customer satisfaction Deployment of NICE analytics for early escalation of customer issues Why we like the business Areas of focus Mortgage increases the value of the overall customer relationship Chase, as the 3 rd largest servicer has the advantage of scale Macroeconomic fundamentals are improving, resulting in reduced default rates, and improving cost structure With appropriate operations and risk management, the MSR asset will deliver consistent attractive returns (15% ROE) 20 |
 Prevented twice as many foreclosures as have been acted upon Offered over 1.2 million modifications and completed 452,000 since 2009 Foreclosure alternatives (short sales, Deed in Lieu) increased 22% over the prior year 82 Chase Home Ownership Centers (CHOCs) 15,000 borrower assistance and default servicing support staff Refinanced more than 1 million mortgages since 2010 Met with over 273,000 struggling customers Doing more to prevent foreclosures Foreclosure process update Average delinquency at foreclosure is over 17 months Recent foreclosure sales showed the following customer/loan characteristics: 54% non-owner occupied or vacant – Of which 80% were vacant at time of sale 46% were owner-occupied Key facts about foreclosures 21 |
 22 Short term run-rate savings in 2012 – Driven by both volume declines and efficiency |
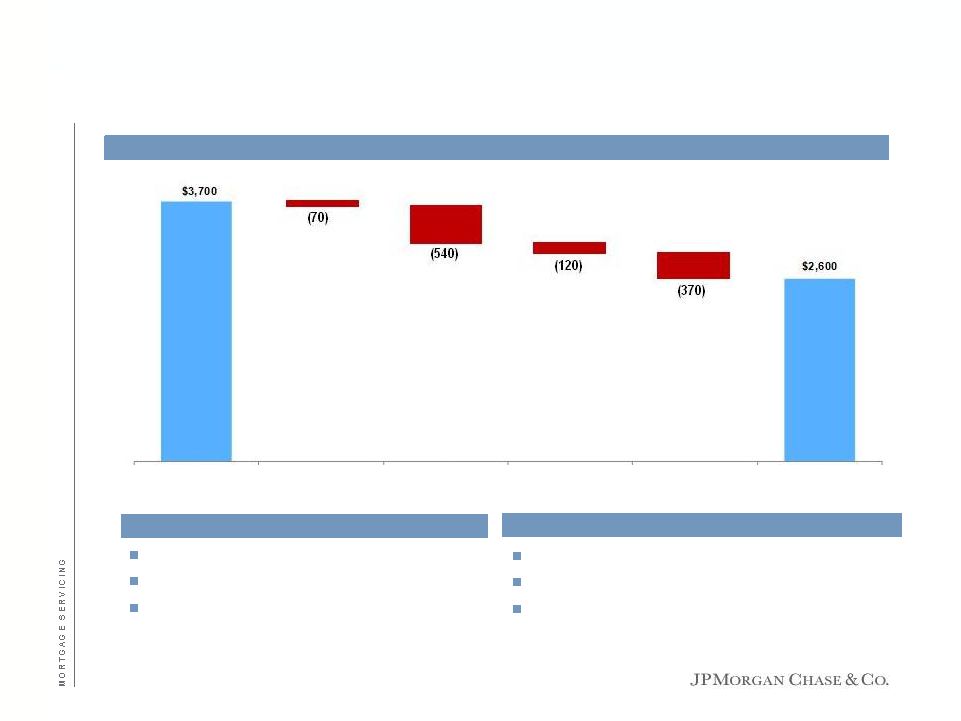 Achieve short term run-rate savings – More than $1B by 4Q12 Consolidated site strategy Improved productivity through employee retention Non-compensation expense improvement primarily due to non-recurring costs and lower operational losses Loan portfolio declines by 5-10% 30+ delinquencies decline approximately 25% Modification pipeline reduced Volume Efficiencies 23 4Q11 Annualized Core servicing volume Default volume Core servicing - efficiencies Default - efficiencies 4Q12 Annualized Servicing and default expense ($mm) |
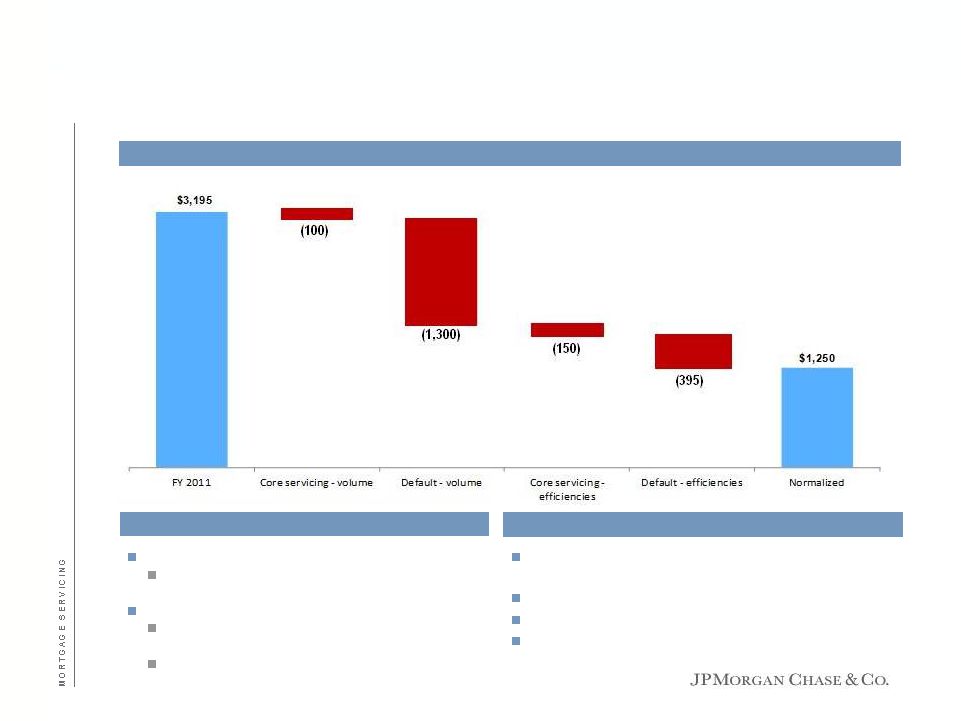 Normalizing servicing expenses over time Volume Efficiencies Process improvements and technology enhancements in core servicing and default Consolidated site strategy Improved productivity through employee retention Lower legal costs and operational losses Core servicing Loan portfolio declines by 10-15% to steady state of ~7.5mm units Default 30+ delinquencies decline by 70-75% to steady state of ~200k units Modification pipeline materially reduced Servicing and default expense ($mm) 24 |
 DOJ and State AG settlement Impact to Chase ~$5.3B: ~$1.1B cash payment, ~$0.5B refinance program and up to ~$3.7B of additional consumer relief (primarily through modification programs) Limits the firm’s liability related to Servicing activities, including past foreclosure, loss mitigation and bankruptcy practices Origination activities, including federal False Claims Act violations and federal consumer statute claims MERS-related conduct, such as recording of assignments and standing in foreclosures Only New York, Delaware, and Massachusetts may maintain suits for MERS-related conduct. The settlement limits monetary remedies those states can seek against Chase, and precludes them from seeking to vacate past foreclosures for MERS-related conduct Does not release the firm from liability related to securitizations and whole loan sales, GSE/FHA/VA/PLS repurchase demands, pension fund claims, fair lending claims, and criminal actions. It also does not preclude suits against MERS as an entity or suits against Chase by county recorders for lost fees Financial impact overview Estimated impact was covered in prior periods Modification programs Modest impact on charge-off timing as a result of principal forgiveness – No change to loss guidance Refinance program Impact of reducing borrower rates is expected to drive an immaterial decrease in net interest margin – Offset in reserves 25 |
 Mortgage servicing economics Average UPB $1.0T +/- Servicing & Other Revenue 45bps +/- Amortization 22bps +/- Servicing & Default Costs 13bps +/- Pretax $1.0B +/- Business drivers Macroeconomics (unemployment, HPI, interest rates) Size and average life of servicing book Management of operational risk and efficiency of platforms Market risk management – MSR hedging Default costs expected to remain high for the medium term to handle modification and foreclosure volumes Market risk management Regulatory and GSE changes Risks Normalized target income With appropriate operations and risk management and market recovery, the size and mix of our serviced portfolio will deliver solid profitability 26 |
 Agenda Page 27 Real Estate Portfolios 27 Performance and outlook 1 Mortgage Production 10 Mortgage Servicing 19 Appendix 32 |
 Real Estate Portfolios simulation Future reserve actions not simulated Although NII will decline as portfolio runs down, expense and credit losses will also decline As a result, the net losses today will become a modest positive contribution to earnings over time As portfolio runs off, ~$1B of capital per year could be freed up and re-deployed – Timing is impacted by pro- cyclicality of capital rules Real Estate Portfolios — simulated ending loan balance run-off and net income ($mm) Commentary 2009 2010 2011 2012 2013 2014 Ending Balances ($B) $252 $223 $198 $178 $158 $144 Ongoing ($B) 37 36 37 $39 42 Legacy ($B) 186 162 141 $119 102 Revenue $6,520 $5,547 $4,592 $4,100 $3,400 $2,900 Net charge-offs 8,343 6,450 3,805 3,000-4,000 2,000-3,500 1,000-1,500 Change in reserves 5,220 1,781 (230) Expense 1,847 1,627 1,521 1,300 1,200 1,000 Pre-tax net income / (loss) ($8,890) ($4,311) ($504) ($1,200)-($200) ($1,300)-$200 $400-$900 28 |
 Non credit-impaired Purchased credit-impaired Total loans Home Equity $78 $25 $103 Prime Mortgage $37 16 53 Option ARM $7 26 33 Subprime Mortgage $10 7 17 Total REP Loans 1 $132 $74 $206 Fair Value Mark 2 NA 9 9 Total Mortgage Banking Portfolio $132 $65 $197 Loan loss reserve (LLR) $8.7 $5.7 $14.4 LLR as % of loans / LLR + FVM as % of UPB PCI 6.6% 19.7% NA Real Estate Portfolios EOP loans as of 12/31/11 ($B) Real Estate Portfolios 6.6% reserve ratio on non credit-impaired portfolio Purchased credit-impaired portfolio is appropriately reserved for best estimate of remaining lifetime losses 1 Credit-impaired represents Unpaid Principal Balance (UPB), not book value 2 Fair Value Mark (FVM) remaining is the original mark reduced by liquidation losses realized Note: Table above excludes prime mortgage loans and student loans classified as held-for-sale Commentary 29 |
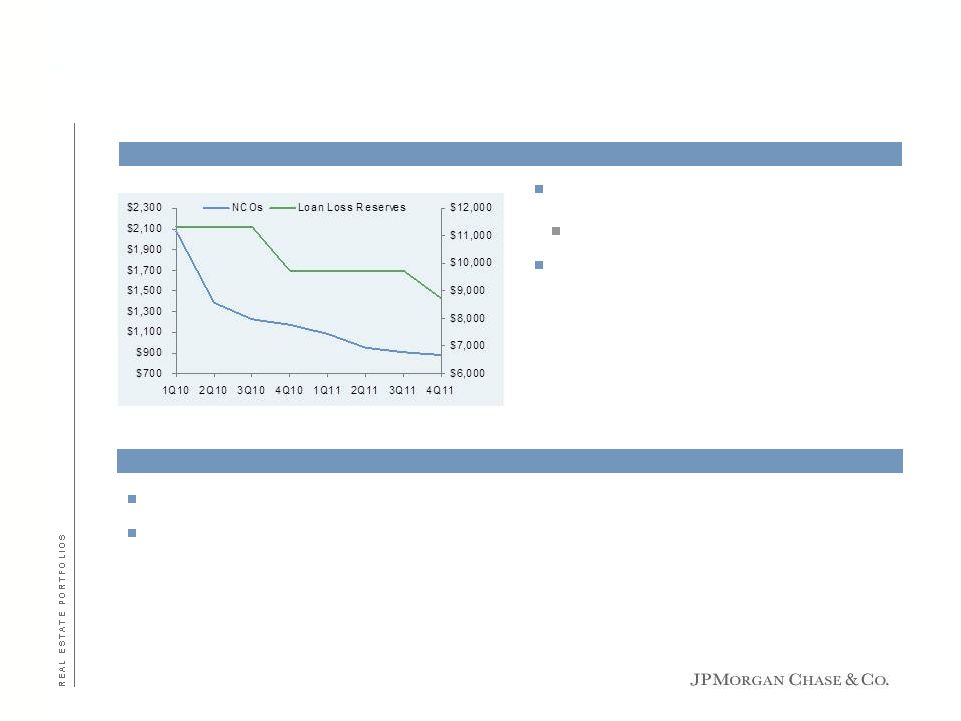 Non-credit-impaired Credit Total Mortgage Banking reserves of $8.7B (excluding WaMu purchased credit-impaired) 4Q11 net charge-offs annualized of $3.5B Loss guidance: Mortgage Banking quarterly net charge-offs expected to be $900mm+/- 1 4Q10 net charge-offs exclude the one-time impact of the $632mm adjustment related to the timing of when the Firm recognizes charge-offs on delinquent loans Current reserve and mark reflect ~$35B of lifetime losses, of which $21B has been realized to-date Further 8% HPI decline from current levels would result in a $1.5B impairment Net charge-offs 1 vs. Loan loss reserve ($mm), excl PCI 30 Purchase credit-impaired |
 Key themes addressed throughout the day Production business positioned for success Continuing to improve the customer experience Servicing – Building efficiencies for the future Real Estate Portfolios – Returning to profitability and returning capital Significant legacy issues behind us: Consent Orders and DOJ/AG Settlement Attractive earnings potential with 15% ROE through the cycle Our goal is to be the most efficient, profitable, and customer-centric mortgage business 31 |
 Agenda Page 32 Appendix 32 Performance and outlook 1 Mortgage Production 10 Mortgage Servicing 19 Real Estate Portfolios 27 |
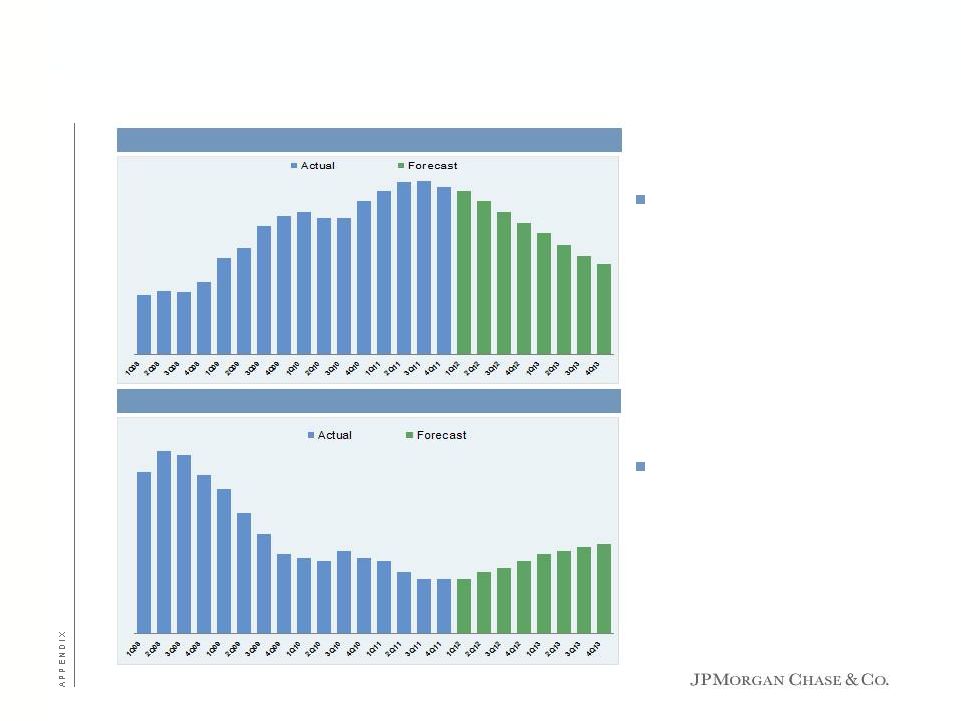 Foreclosure and REO trends – Total serviced Foreclosure inventory will continue to decline as inflows of new delinquencies decline and outflows of foreclosure and short sales increase REO inventory forecast to increase as volume of foreclosure sales increase 33 Units in REO Units in process of foreclosure |
  Home Equity – Performance of 2 nd lien relative to 1 st lien UPB as of 12/31/11 ($B), non-credit-impaired portfolio 2nd Lien status Note: Current Mortgage defined as Current (excludes 1-29), while Current Home Equity is Current or 1-29 bucket to align with OCC definition 1st liens $21.8 2nd liens 56.0 Total $77.8 Delinquent 1st and 2nd 1.1 Current 2nd / delinquent or modified 1st 3.7 Total $56.0 Current 1st / current 2nd $50.8 Current 1st / delinquent 2nd 0.3 34 |
 High Risk 2nd liens 1st Lien status UPB Estimated lifetime loss rates >100+% CLTV Modified $1.8 ~40% 65% <150+ DPD 1.4 ~50% 40% 150+ DPD 0.5 ~95% 53% Total $3.7 55% +/- 53% High risk 2nds – Performing 2nds behind troubled borrowers Excluding purchased credit-impaired loans Performing 1st and 2nd liens CLTV UPB Estimated lifetime loss rates <=80% $24.5 ~ 1% 80-100% 12.2 4-5 % 100+% 14.1 12-15 Total $50.8 6% +/ Performing 1 st and 2 nd Liens Delinquent 2nds High Risk 2nds High Risk 2nds – 1 st < 150+ DPD High Risk 2nds – 1 st 150+ DPD High Risk 2nds – Modified/Trial 1 st Note: grossed up based on 35% match rate 2 nd Lien Home Equity UPB ($B) - Dec11 High Risk 2 nd Liens ($B) - Dec11 We have considered the status of 1st lien and equity position of borrowers in our reserves Note: ECLTV for Home Equity 2 nd Liens and ELTV for 1 st Lien Home Equity (Change made in 3Q11). ECLTV = estimated combined loan to value considering all available lien positions related to the property which we own or service Current ECLTVs are calculated using original appraised value adjusted using the latest HPI published by Moody's Economy.com Missing ECLTV & Missing FICO allocated based on Non Missing Current Mortgage defined as Current (excludes 1-29), while current Home Equity is Current or 1-29 bucket to align with OCC definition Note: grossed up based on 35% match rate 35 |
 February 28, 2012 Todd Maclin, Chief Executive Officer Consumer & Business Banking C O N S U M E R & B U S I N E S S B A N K I N G |
 Consumer & Business Banking is a strong franchise today Great business with a focus on growth 1 Strong profitability, despite the environment – 2011 net income of $3.8B and ROE of 40% Low volatility in earnings Significant opportunities to lower cost to serve and increase revenues – 3-5 year horizon Brand strength, driven by excellent products, services and convenient channels #3 in U.S 1 : over 5,500 branches and over 17,200 ATMs across 23 states serving 23mm households Over 17mm active online customers Over 8mm active online mobile customers, over 50% YoY growth Significant presence and leadership in key deposit markets Competitive position of strength: our customers, our people and our financial capacity Investment consistency: we are growing and deepening relationships Over 27,000 personal and business bankers and 3,200 financial advisors Branch and ATM build-out to capture growth at low risk ROIs Significant mobile and internet investment Technology to lower cost-to-serve and delight customers Across “One Chase,” ~51mm households and ~63mm customers to target more aggressively – Chase.com #1 most visited banking portal in the US 2 Note: all data as of December 31, 2011 1 Based on FDIC data for retail deposits as of June 2011; deposits adjusted to exclude large branches (+$1B) assumed to contain non-retail deposits 2 January 2012 compete.com rankings |
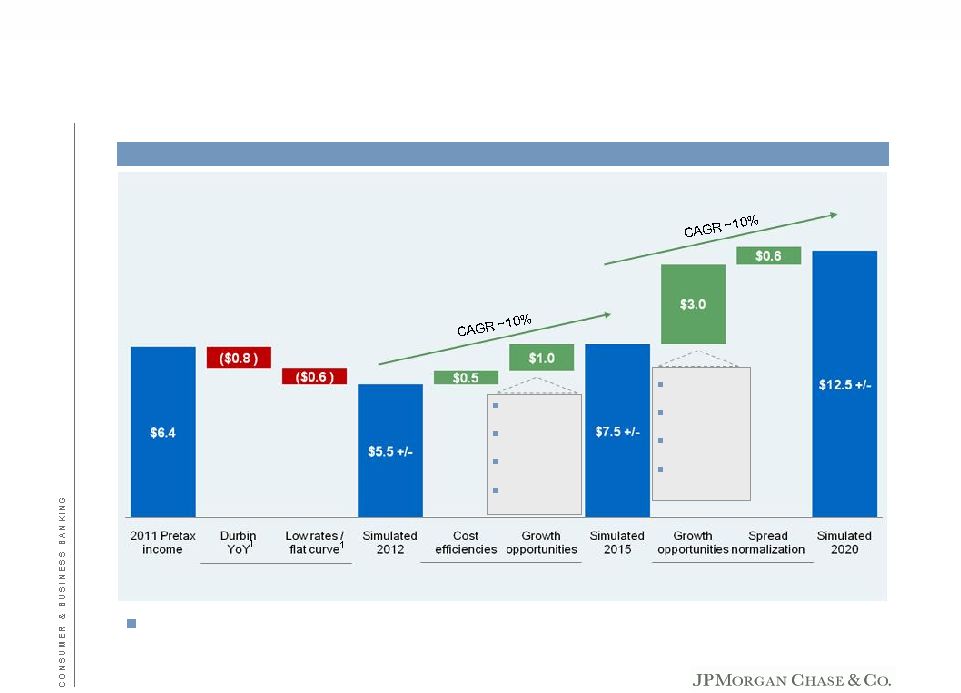 Near-term headwinds will slow – Our focus on strong underlying growth will pay off Near-term headwinds Medium-term uplift Longer-term growth $0.5: ’02-’11 New builds ($0.3): ’12+ New builds $0.3: Business Banking $0.4: Chase Private Client $0.5: ’02-’11 New builds $1.0: ’12+ New builds $0.7: Business Banking $0.6: Chase Private Client 1 Consistent with 2012 outlook provided in 4Q11 earnings materials 4% underlying annual growth (net of investment) assumed 2 Simulated pretax income ($B) |
 h-Chase Chase incl. WaMu Revenue '05-'09 CAGR '09-'11 CAGR YoY '11-12 Net interest income 8% 0% Noninterest revenue 11 0 Debit 23 11 NSF-OD 15 (20) Investment revenue 5 9 Service fees and other 3 14 Total revenue 9% 0% # of checking accounts 12% 2% # of debit transactions 20% 17% Regulatory reform cost the industry ~$20B 1 In addition, low rates cost the industry ~$4B 2 These revenues will not be replaced in the short term Regulatory reform forces industry to significantly change business models Regulatory reform has permanently altered the economics in CBB 3 1 Source: Boston Consulting Group 2 Source: Bernstein and Morgan Stanley research Historical growth |
 Post-regulation, ~70% of the customers in segments 1-3 are unprofitable on a fully loaded basis and ~10-15% are unprofitable on a variable basis There is limited opportunity to deepen relationships with these customers Further regulation will have additional impact Regulatory reform has disproportionately impacted “transaction-only” banking Note: JPM Chase internal data D&I = Deposits & investments 1 Post-implementation of Durbin Amendment and Regulation E 4 Revenue composition by wealth segment post-regulation Percent reduction in per household variable contribution by segment 1 |
 Customer predisposition and the current competitive landscape does not allow banks to be compensated via monthly fee-based accounts Chase has multiple paths to a checking account with no monthly service fee – Over 85% of customers qualify Note: non-banking fees captured represent the low-end product/service per category (e.g., NY Times online subscription, etc.) Monthly service charges for banks are lower than most consumer service charges But in this environment, do not expect them to bridge the revenue gap 5 Average monthly expense for common services |
 Chase delivers significant value to customers at minimal or no cost Over 5,500 branches, many with extended and Saturday hours, staffed by over 57,000 employees 24/7 phone support staffed with almost 6,000 telephone banking employees willing to help with any query Access to over 17,200 ATMs across the United States Innovative transaction options QuickPay SM and QuickDeposit SM Online bill payment E-mail and text alerts Over 10,700 deposit-friendly ATMs Fraud protection FDIC protection on deposits Note: all data as of December 31, 2011 6 Services not explicitly charged for |
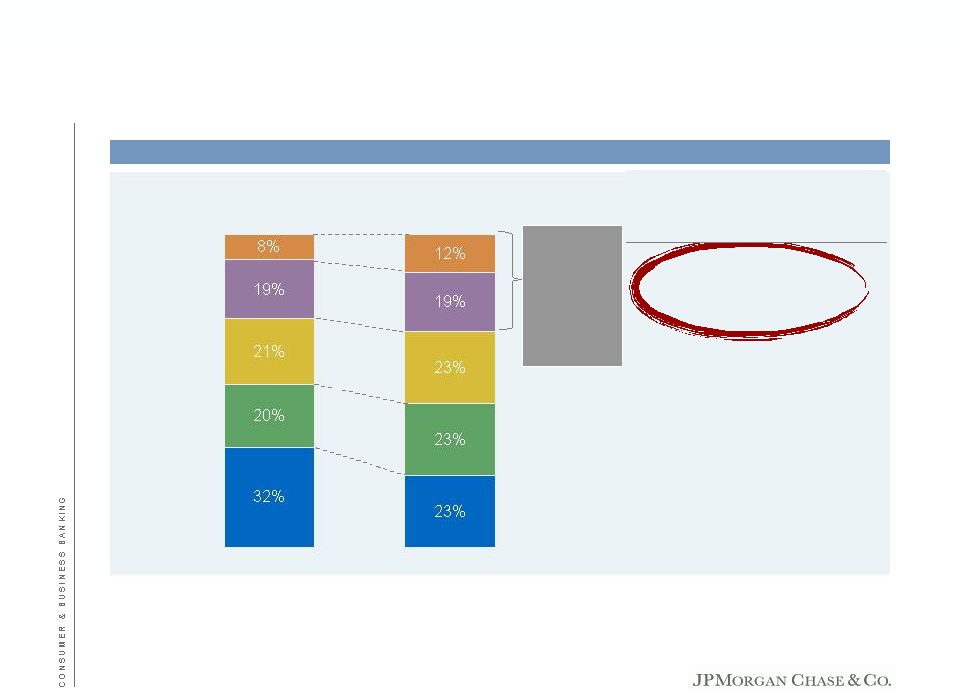 Source: MacroMonitor 2010 Survey of U.S. Households, U.S. Census Bureau Chase data post-implementation of Durbin Amendment and Regulation E 1 Primary business households and primary business card-only households excluded Segment 1 (<$5k D&I) Segment 2 ($5k-$25k D&I) Segment 3 ($25-$100k D&I) Segment 4 ($100-$500k D&I) Segment 5 ($500k+ D&I) >30% of Chase households have >$100k in D&I and make up ~55% of revenue Share of D&I wallet at Chase % of U.S. households with a Chase banking relationship¹ 4% 23% 15% 18% 20% 19% 26% 21% 41% 13% Greatest opportunity is to grow with our highest value customers And we have a larger share of them 7 Distribution of households by wealth segment United States Chase |
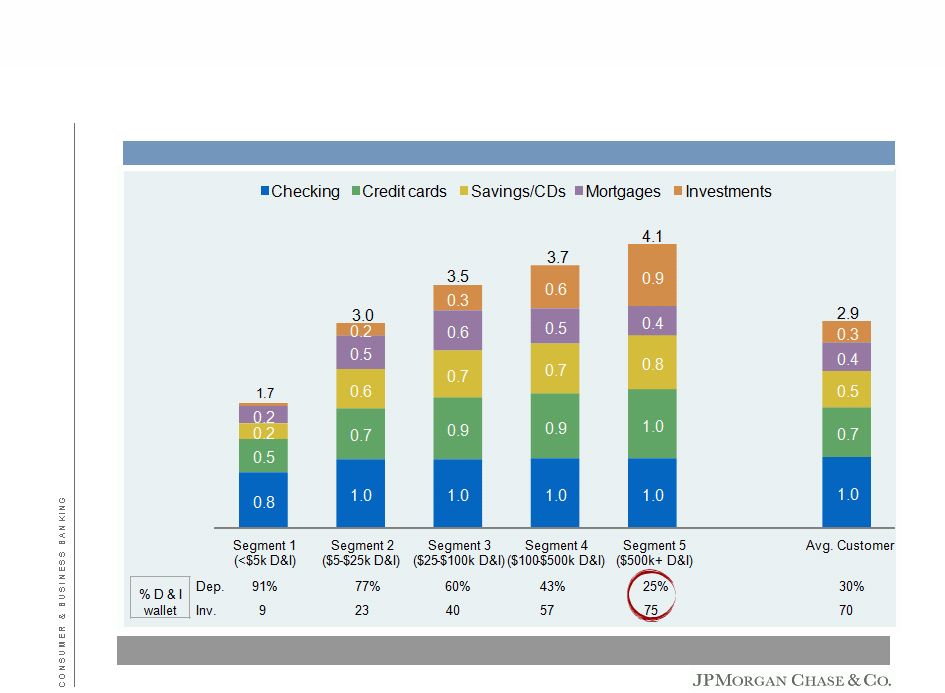 Customer segments require a needs-based approach More affluent customers have a broader set of financial services needs Source: MacroMonitor 2010 Survey of U.S. Households 8 Products per household by wealth segment (industry) |
 Source: JPM Chase internal data Seg.1 (<$5k D&I) Seg.2 ($5k-$25k D&I) Seg.3 ($25-$100k D&I) Seg.4 ($100-$500k D&I) Seg.5 ($500k+ D&I) Historically, we have spent the same amount of time with all our customers 1 Based on data observed during 2011 2 Post-implementation of Durbin Amendment and Regulation E There is an opportunity to align our service models toward highest potential customers Seg.5 ($500k+ D&I) Seg.1 (<$5k D&I) Seg.2 ($5k-$25k D&I) Seg.3 ($25-$100k D&I) Seg.4 ($100-$500k D&I) Seg.5 ($500k+ D&I) Seg.1 (<$5k D&I) Seg.2 ($5k-$25k D&I) Seg.3 ($25-$100k D&I) Seg.4 ($100-$500k D&I) 9 Households visiting branch quarterly by wealth % of personal banker time by customer wealth segment Variable contribution ² by wealth segment (indexed to segment 1) ¹ ¹ |
 Requirements for succeeding in the new environment 10 Strong reputation and customer experience Complete and best-in-class financial services offerings Convenience – Branches and ATMs Capacity to invest and innovate Cost effective service model Ability to adapt Successful banks will be those which can leverage these characteristics into a strong growth proposition |
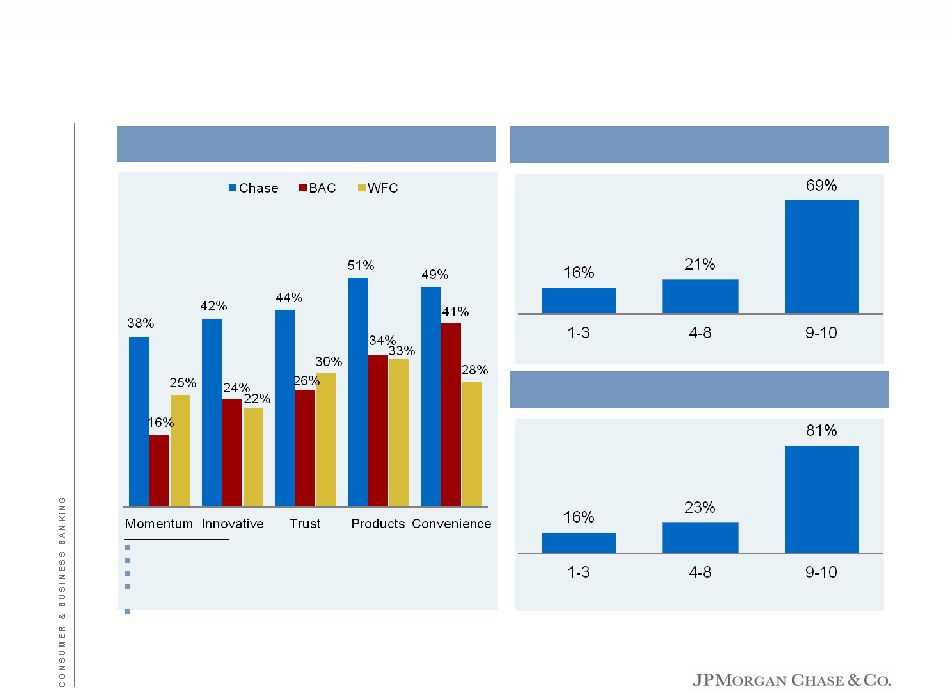 A strong reputation and customer experience are keys to growth Chase scores well relative to competitors Source: 4Q11 Brand Tracker in the retail footprint Source: Monthly Consumer Bank Relationship Survey (data from December 2011) 1 Strongly agree equals a 9 or 10 on a 10-point scale Attribute definitions: Momentum: Is becoming more popular Innovative: Offers innovative products and services Trust: Is a bank I trust Products/Services: Offers products and services that meet my needs Convenience: Offers more convenient branch and ATM locations 11 Likely to recommend Chase to family, friends, co-workers (% of households who strongly agree ¹) Likely to use Chase to fulfill new financial need (% of households who strongly agree ¹) Industry leader in key consumer attributes – 4Q11 Overall Satisfaction with Chase (on a 10-pt scale) Overall Satisfaction with Chase (on a 10-pt scale) |
 Source: Chase Relationship Survey 1 From a scale of 1-10, customers who select a rating of 9 or 10 Satisfaction with branch visits Satisfaction with products We have made measurable customer experience improvements in the last year and continue to have momentum 12 Overall satisfaction with Chase (top 2-box scores ¹) Key areas of overall satisfaction (top 2-box scores ¹) |
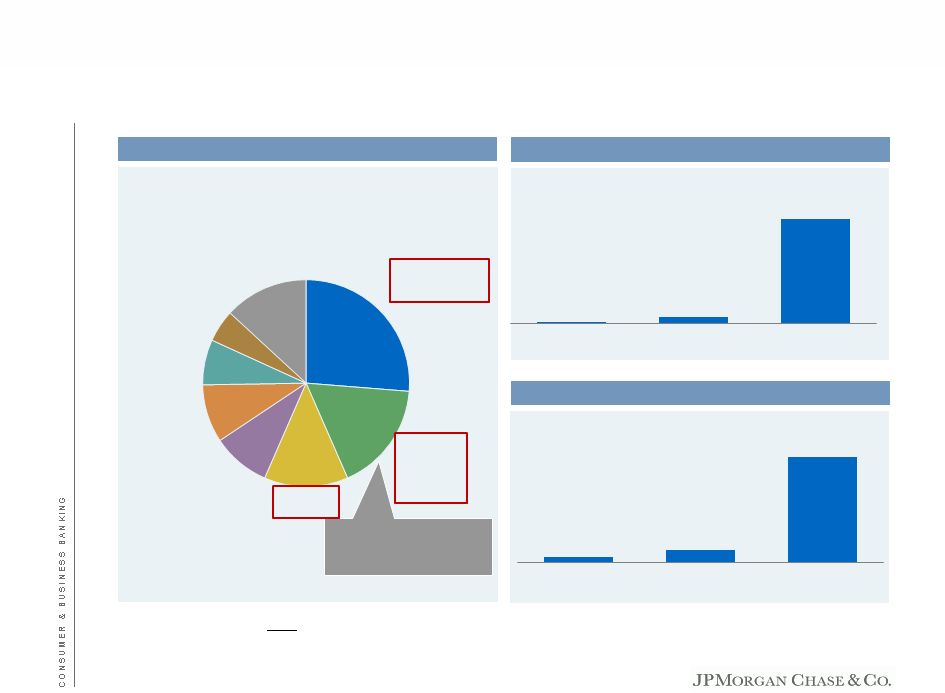 Source: internal customer profitability analysis, September 2010 – August 2011 (as of August) 1 Checking only 2 HH with Chase’s current penetration and size of deposit and lending relationship 3 60% of D&I; an average credit card relationship (~$15k annual spend) with every HH. Source: 2008-2009 Phoenix Survey Note: question asked – What is the primary reason you chose to begin your relationship Customer experience is critical to our affluent customers 13 Convenient locations 5% Strong investment performance 7% Range of Products and services 9% Competitive fees 9% Reputation 13% Service quality/ relationship 27% 57% is driven by reputation and customer experience “Average” relationship “Primary” relationship “Average” relationship “Primary” relationship Affluent share of D&I wallet Reasons why affluent households want to consolidate Variable contribution of affluent households 1% 4% 60% 1x 0.5x 8x Other 13% with your primary investment provider? and with a mortgage in one out of two HH 3 2 3 2 “Transactional” relationship 1 “Transactional” relationship 1 Referral from a trusted source 17% |
 Requirements for succeeding in the new environment 14 Strong reputation and customer experience Complete and best-in-class financial services offerings Capacity to invest and innovate Cost effective service model Ability to adapt Successful banks will be those which can leverage these characteristics into a strong growth proposition Convenience – Branches and ATMs |
 Chase lent $17B to small businesses up 52% YoY #1 SBA lender second year in a row Over 5,300 SBA loans #1 SBA lender to women and minority owned businesses in 2011 Hired over 1,200 business bankers since start of 2009 to serve small business clients Business Banking average deposits of $65B up 11% YoY Ink from Chase – Best Business Rewards Credit Card² 183k cards issued, up 58% YoY 52k mobile online users of Jot – Product unveiled in 2Q11 Paymentech named #1 payment systems provider of the Top 500 internet retailers for 6 th consecutive year by Internet Retailer New sign-ups from branches increased ~34% YoY Chase has best-in-class financial services and proven ability in AM and CB Note: all data as of 2011 1 “Best General Travel Credit Card” by Nerd Wallet (Winter 2012), “Best Airline Miles Credit Card” by Credit.com (December 2011) 2 Nerd Wallet (Winter 2012) Leading investment sales force Over 3,200 financial advisors ~$140B client investment assets World class investment products brought to Chase Industry leading managed account platform Full suite of brokerage and insurance products Access to J.P. Morgan Private Bank products for Chase Private Clients Fully integrated banking product offering Online and mobile banking Award winning Chase Sapphire card¹ Chase mortgage platform Branches are invaluable to affluent customers Affluent households average ~4.5 branch visits per quarter Incremental D&I balances of $100B (3% wallet) at 1% = $1B+/- pretax opportunity WaMu branch productivity at Chase levels is a $1B+/- pretax opportunity 15 Chase Wealth Management Business Banking |
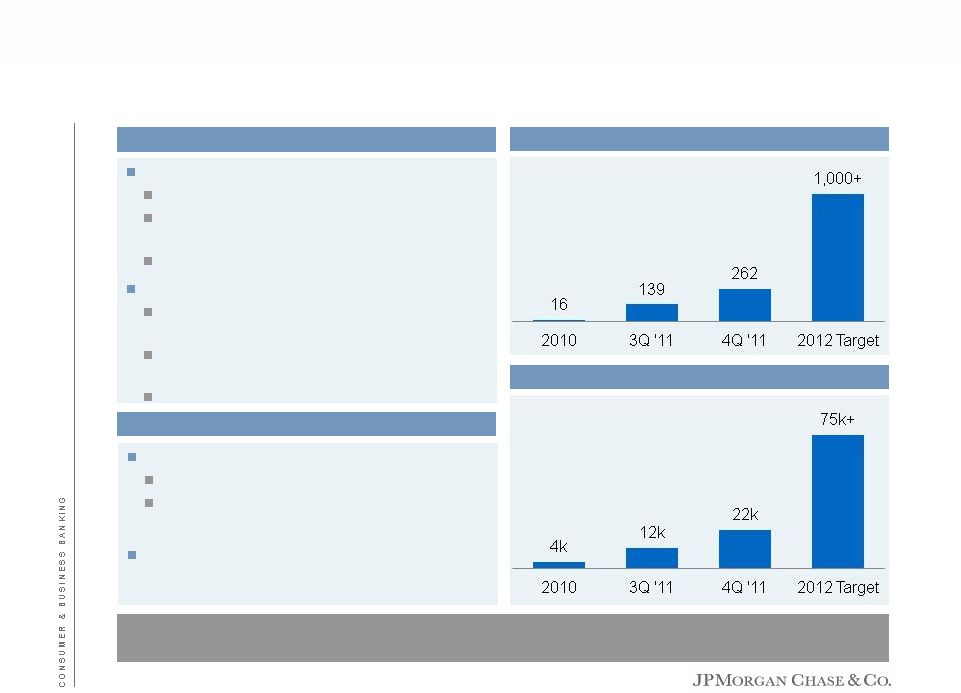 Added locations and bankers Opened 246 CPC locations in 2011; total of 262 New York, Chicago, South Florida, Los Angeles and San Francisco 500+ CPC Bankers and Advisors Growing relationships ~22,000 clients with $70k+ avg. in incremental D&I balance per CPC client $16B in D&I with $1.6B new money (most of the growth where CPC has been open <6 months) Advice/managed money platform 750 additional CPC locations California, Texas, Florida, Arizona and Washington Extending in Tri-state, Midwest, Los Angeles and San Francisco Adding 900 Private Client Bankers and 350 Private Client Advisors Chase Private Client continues to expand at a rapid pace By the end of 2012, CPC will have a presence in markets that cover ~55% of the 2.2mm affluent Chase banking households 16 2011 Expansion # of CPC locations 2012 Plans # of Chase Private Clients |
 Source: JPM Chase internal data CPC – Household balance growth showing early signs of success 17 D&I growth/Affluent HH ($k change July ’11 – Jan ’12) D&I growth/CPC HH ($k change July ’11 – Jan ’12) D&I growth/CPC household ($k change) D&I growth/CPC new investor households ($k change) |
 Average of all relationships Average of top decile 1 (based on deposit balances) Sales revenue $250k-$3mm $3mm+ $250k-$3mm $3mm+ Deposit ADB per relationship ($k) $65 $200 $500 $1,500 Commercial checking ownership 2 9% 19% 26% 65% Payroll Services ownership 4 4 8 12 Treasury Services ownership 3 3 10 13 50 Merchant Services ownership 6 6 8 17 Revenue per relationship 4 1x 3x Business Banking – Growing with larger business customers Source: JPM Chase internal data 1 Average deposit balance, product ownership, and revenue of top 10% of relationships by deposit balance 2 Commercial checking products include all analyzed checking accounts 3 Treasury Services includes lockbox, account transfer service, ACH initiation and block, cash vault, check payable services, payroll cards, etc. 4 Revenue is post-Durbin (at 22 cents per transaction) and Reg. Q Our objective is to provide the primary operating account relationship for Business Banking customers Commercial Banking and Treasury & Securities Services platforms allow us to deliver best-in-class products, services and technology to small businesses 18 Comparison by sales revenue tier 5x 15x |
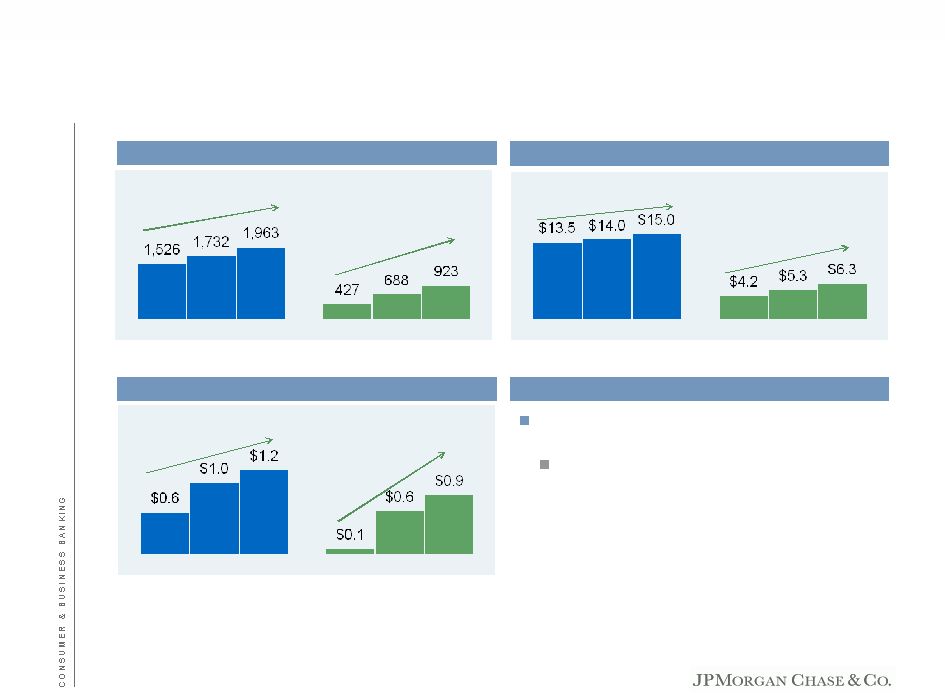 Business Banking is dramatically improving productivity in expansion markets Source: JPM Chase internal data 1 3Q11 vs. 3Q10 CAGR = 13% CAGR = 47% CAGR = 5% CAGR = 22% CAGR = 42% CAGR = 225% 2009 2010 2011 2009 2010 2011 2009 2010 2011 2009 2010 2011 2009 2010 2011 2009 2010 2011 Non-expansion Expansion markets Non-expansion Expansion markets Non-expansion Expansion markets Managed to increase risk-adjusted spreads while gaining market share Industry loan balances contracted 5%, while Chase Business Banking grew 4% 19 Number of Business Bankers Loan originations per branch ($mm) Average deposit ADB per branch ($mm) Comments ¹ |
 Requirements for succeeding in the new environment Strong reputation and customer experience Convenience – Branches and ATMs Capacity to invest and innovate Complete and best-in-class financial services offerings Cost effective service model Ability to adapt Successful banks will be those which can leverage these characteristics into a strong growth proposition 20 |
 Our branch and ATM network provides opportunity to grow 209 branches 410 ATMs 113 branches 217 ATMs 22 branches 27 ATMs 933 branches 3,595 ATMs 47 branches 157 ATMs 298 branches 929 ATMs 69 branches 139 ATMs 123 branches 378 ATMs 676 branches 2,029 ATMs 32 branches 46 ATMs 156 branches 376 ATMs 74 branches 250 ATMs 292 branches 1,234 ATMs 233 branches 454 ATMs 50 branches 79 ATMs 785 branches 2,691 ATMs 196 branches 593 ATMs 307 branches 544 ATMs 292 branches 893 ATMs 82 branches 150 ATMs 419 branches 1,735 ATMs 68 branches 213 ATMs 31 branches 88 ATMs Greater than 10% Between 5% and 10% Less than 5% Deposit market share 1 Branches and ATMs as of December 31, 2011 21 |
 Filling out branch footprint in attractive growth markets Plenty of opportunity to build profitable branches We decision branches one at a time We continue to build the majority of our branches in CA and FL Once optimal network is reached, we will stop building branches We will continue to consolidate branches where it makes sense to do so Once build-out is complete, footprint will be hard to replicate 1 Branches as of December 31, 2011 22 Expansion markets |
 New builds reach $1mm in pre-tax opportunity by year 10+/- Number of years until… % medium and high opportunity Cost to build Seasoned pre-tax opportunity …break-even 1 …payback 2012 new build pipeline ~90% $2.5mm+/- $1.5mm 3 +/- 6 +/- Average branch built in 2002-2011 ~60 2.0+/- 1.0 4 +/- 8 +/- New build economics still support growth strategy We have shifted new build strategy toward higher opportunity branches We will also continue to build branches to meet our responsibilities under the Community Reinvestment Act (“CRA”) 1 Contribution basis which includes all of the direct branch costs (costs within the walls – e.g., occupancy, salaries and benefits, technology/equip), as well as variable product costs 23 Individual branch example using through-the-cycle rates |
 Cumulative new build pretax earnings ($mm) ¹ ~1,250 new builds between 2002 and 2011 contribute $1B+/- in 2018 Future new builds provide a significant long-term opportunity New builds remain a $1B+ pre-tax opportunity 1 Assumes low rates through 2014, normalizing thereafter 2 Including 900 potential new builds 24 |
 Treasury & Securities Services ~30% commercial dollars deposited through the branch channel ~20% of JPM IM US Retail AUM comes from the branches Business unlikely to exist without retail presence (>16mm branch transactions annually by CB clients) $0.4-$0.5B of projected long-term CB target net income opportunity from Middle Market expansion in the WaMu footprint Consumer & Business Banking Mortgage Banking #1 SBA lender #2 ATM network #3 in deposit market share 1 #3 in branches 1 FDIC data as of June 2011 Retail branches are critical to fully integrated client solutions 25 Asset Management ~45% of Chase branded cards sold through branches ~40% of Card Services revenue from new merchants sourced through the branches ~50% of retail mortgages originated through branches Leveraging the retail branch platform |
 Requirements for succeeding in the new environment Strong reputation and customer experience Convenience – Branches and ATMs Capacity to invest and innovate Complete and best-in-class financial services offerings Cost effective service model Ability to adapt Successful banks will be those which can leverage these characteristics into a strong growth proposition 26 |
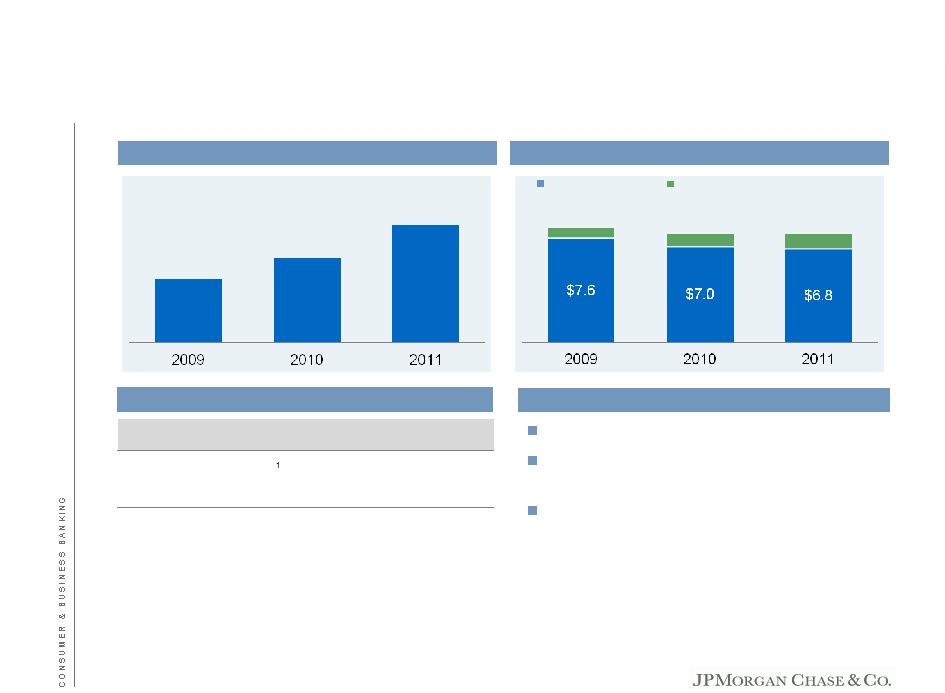 Capacity to invest – Building the foundation for future earnings Continue to invest even in difficult times Even with investment spending, we have strong quality of earnings Peers who have limited capacity or chose not to invest will pay for it in future earnings PTPP as disclosed Incremental PTPP adj. for investment spend 2009 2010 2011 Overhead reported/adjusted 58% / 53% 60% / 53% 62% / 53% ROE reported/adjusted 1 42% / 47% 36% / 41% 40% / 47% 27 Note: investment spend includes new builds, business banking expansion, new CPC locations, advertising and marketing, sales force adds, technology, branch signage / interior upgrades, and ATMs 1 Excludes investment spend Pre-tax pre-provision ($B) $8.5 $8.0 $8.0 $2.8 $1.9 $1.5 Comments Performance metrics Investment cash spend ($B) |
 Requirements for succeeding in the new environment 28 Strong reputation and customer experience Complete and best-in-class financial services offerings Convenience – Branches and ATMs Capacity to invest and innovate Cost effective service model Ability to adapt Successful banks will be those which can leverage these characteristics into a strong growth proposition |
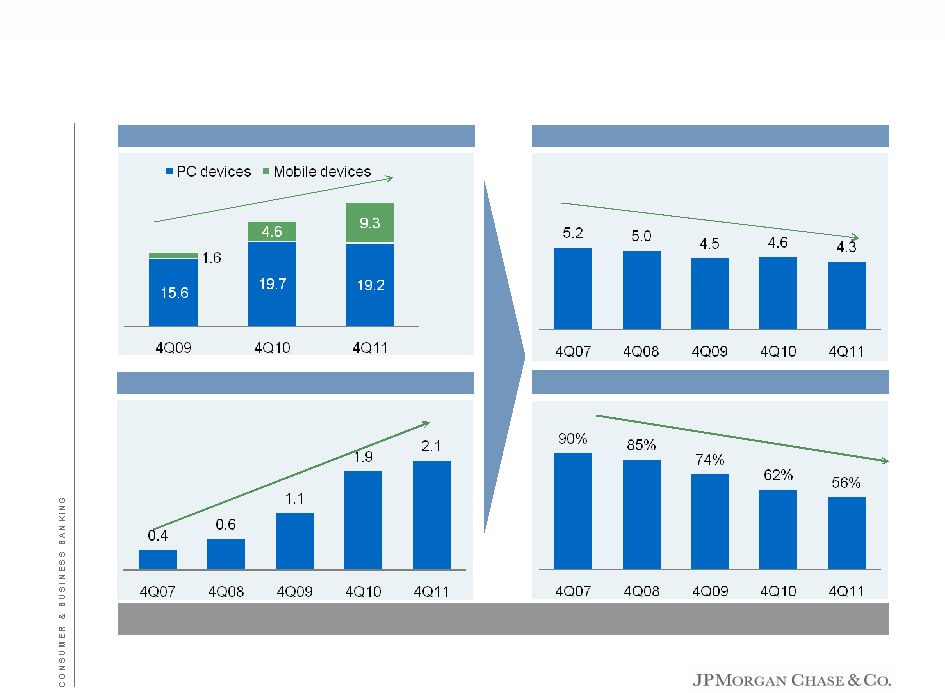 Investments in automation have led to an increase in customer self- service… CAGR = 54% CAGR = (5)% 11% CAGR 140% 29% 28.5 24.3 17.2 Source: JPM Chase Internal Data 1 All interaction (i.e., logins, visits, deposits) per household figures include total Consumer households for the quarter (both channel active and inactive households) 2 Analysis includes only ATM and Teller deposits (excludes Mobile Quick Deposits) Approximately 90% of transactions are now self-service CAGR = (9)% 29 Digital – Avg. quarterly logins per Consumer household Branch – Avg. quarterly visits per Consumer household ATM – Avg. quarterly deposits per Consumer household Teller share of deposit volume 1 1 2 1 |
 …and we are positioned to continue innovating and reducing the cost to serve Pilots in multiple branches Positive customer reaction (similar to airline industry) Self-Serve Teller machine at the teller line Will be able to support check cashing, multi- denomination deposits and withdrawals “The denomination choice for customer withdrawals is a great feature” “The large screen is very engaging and easy to use” Chase customer reactions Note: data reflects 4Q11 30 Testing new Self-Serve Teller (SST) technology in branches Instant issue debit and credit % of Deposit transactions automated Sales tablet interface Telepresence |
 Requirements for succeeding in the new environment 31 Successful banks will be those which can leverage these characteristics into a strong growth proposition Ability to adapt Cost effective service model Capacity to invest and innovate Convenience – Branches and ATMs Complete and best-in-class financial services offerings Strong reputation and customer experience |
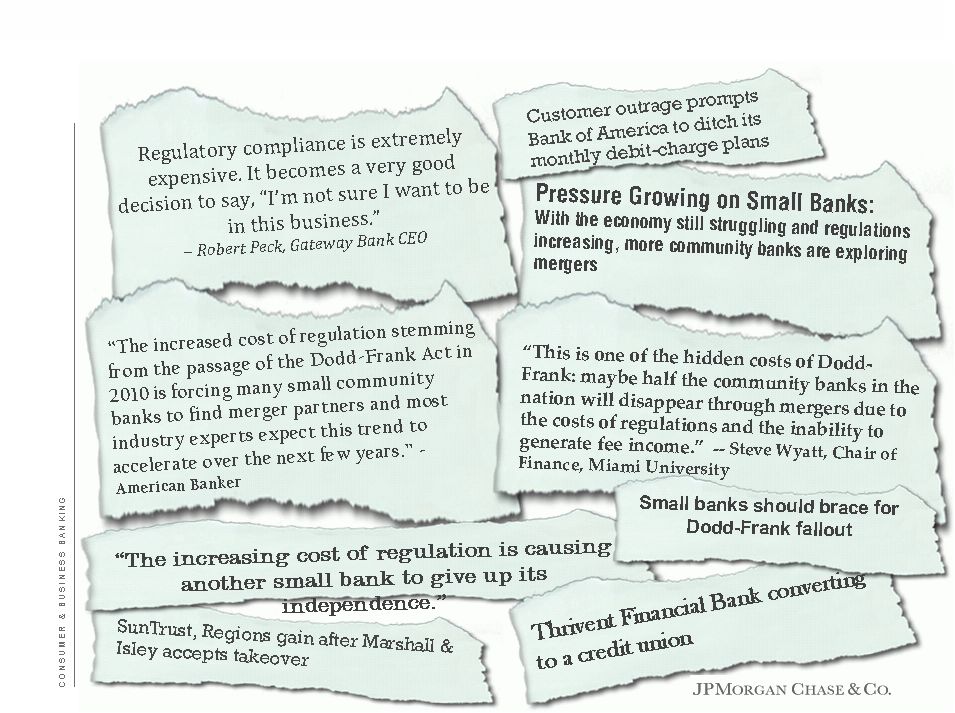 Winners will need to adapt to regulatory change 32 |
 We have made a commitment to “One Chase” and customer experience – Not all banks have capacity to invest in people, systems and processes needed Banking Mortgage Credit Card The customer Banking and Investments Mortgage 360 degree view of customer relationship Differentiated view of customer needs Consistent customer experience by segment Full range of best-in-class products and services One 33 Customers Customers Customers Products Products Products Services Services Services Product-based delivery model “One Chase” customer experience Customers see us as “One Chase” – We should too Credit Card |
 There is significant opportunity to deepen affluent relationships across LOBs Credit card 2.7mm HHs (54%) Banking and Credit card 1.4mm HHs (28%) Consumer Banking 0.8mm HHs (18%) Note: data as of May 2011 Unmet opportunity ($B) D&I at competitors $1,100 $4,100 Credit card spend at competitors 40 65 34 4% of Chase in-footprint households have a Banking, Credit card, and Mortgage relationship Significant opportunity to deepen affluent relationships (in-footprint segment 5 households) $1,650 35 |
 Near-term headwinds will slow – Our focus on strong underlying growth will pay off Near-term headwinds Medium-term uplift Longer-term growth $0.5: ’02-’11 New Builds ($0.3): ’12+ New Builds $0.3: Business Banking $0.4: Chase Private Client $0.5: ’02-’11 New Builds $1.0: ’12+ New Builds $0.7: Business Banking $0.6: Chase Private Client 1 Consistent with 2012 outlook provided in 4Q11 earnings materials 4% underlying annual growth (net of investment) assumed 35 Simulated pretax income ($B) |
 B R A N C H I N N O V A T I O N S February 28, 2012 Ryan McInerney, Consumer Banking Chief Executive Officer |
 Branch innovations – Overview Consumers are increasingly adopting new technologies at a rapid pace – evident by ATM deposits and mobile banking adoption rates We are testing a number of new technology innovations in our branches to improve the customer experience and reduce costs Redesigning the teller line experience via Self-Serve Teller and Paperless Teller Improving card convenience and activation rates via Instant Issue Card Offering specialized service and face-to-face sales through ExpertLink (Telepresence) Testing several other innovations to improve sales and transaction capabilities in branches and ATMs While it is still early, we believe these innovations could meaningfully change how we serve our customers and staff our branches More self-serve options to improve convenience and hours of operation while lowering costs per transaction Paperless branches – Leveraging technology to reduce costs, eliminate errors, and improve sales and service More capabilities in more places – Greater access to service and sales specialists across all branches via Telepresence, combined with ATMs that offer increased functionality 1 |
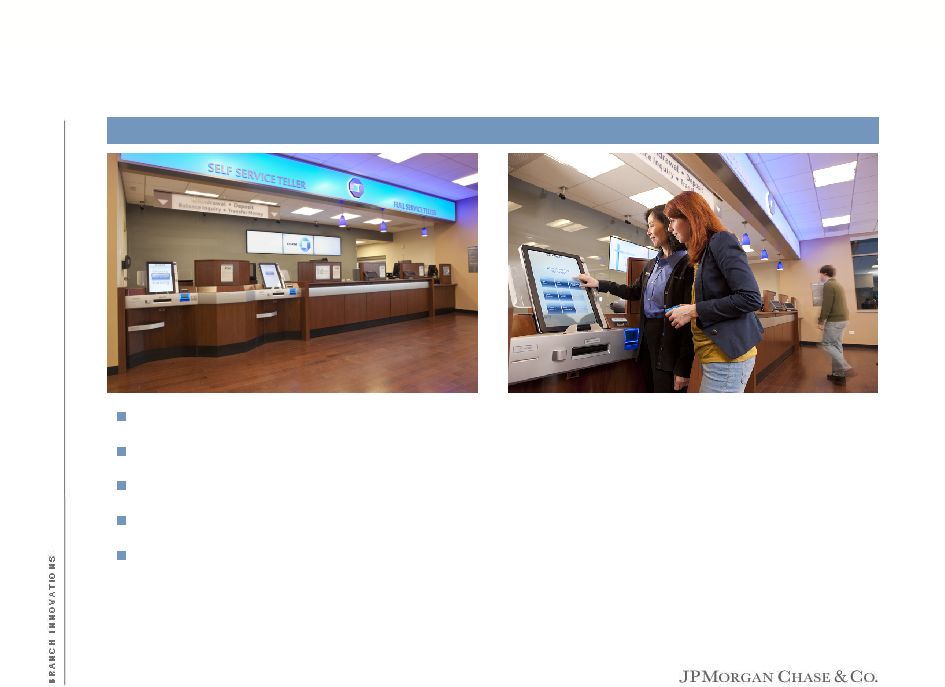 To integrate self-service, we are redesigning our overall teller line Experimenting with best mix of Self-Service Teller machines and full-service teller stations Designing flexible architecture to increase Self-Service Teller lines over time Testing whether customers prefer assistance from behind the line, side by side, or both Designing new Self-Service technologies for drive-up lanes Beginning to integrate Teller and ATM user interface and systems 2 Teller line redesign |
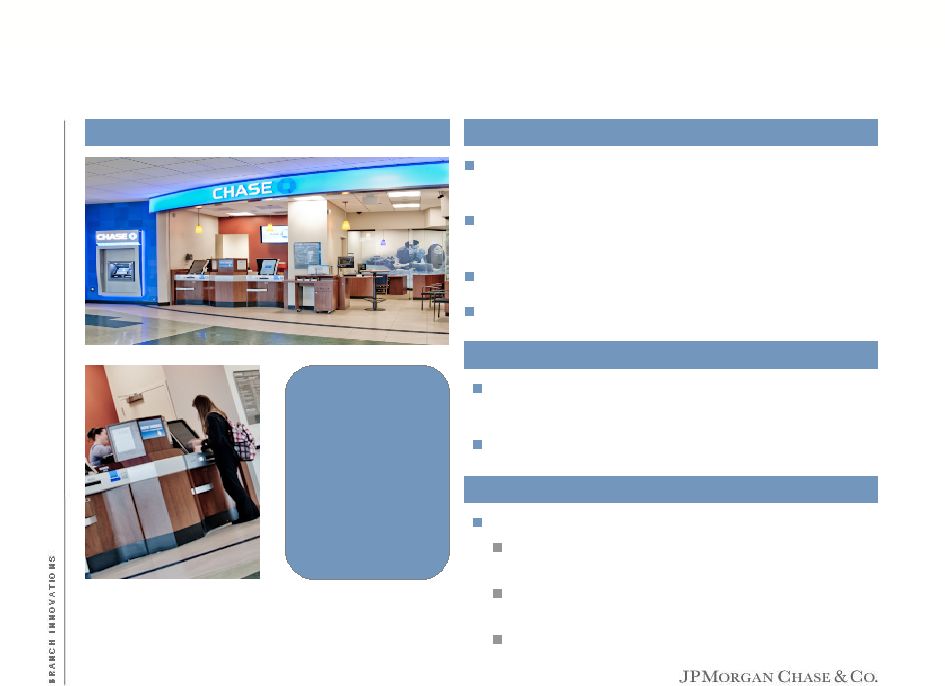 Self-Service Teller Performs all typical ATM functions, plus additional functions such as check cashing Customer can choose multiple denominations (not just $20 bills) Some lessons learned Customers find the large touch screens very attractive and user friendly Supporting tellers easily handle two lines at once, even during peak periods Enables employees to focus on higher impact interactions Check cashing at traditional teller line dropped 40% after Self-Serve Teller capability was introduced Automated platform allows customers to perform 90%+ of current teller transactions via self-service Can support extended hours access (24-hour access in many locations) Make it easier for customers to get in and out quickly Allows more efficient staffing, lowering average costs per transaction 3 Self-Service Teller Purpose Functions Piloting in 6 locations |
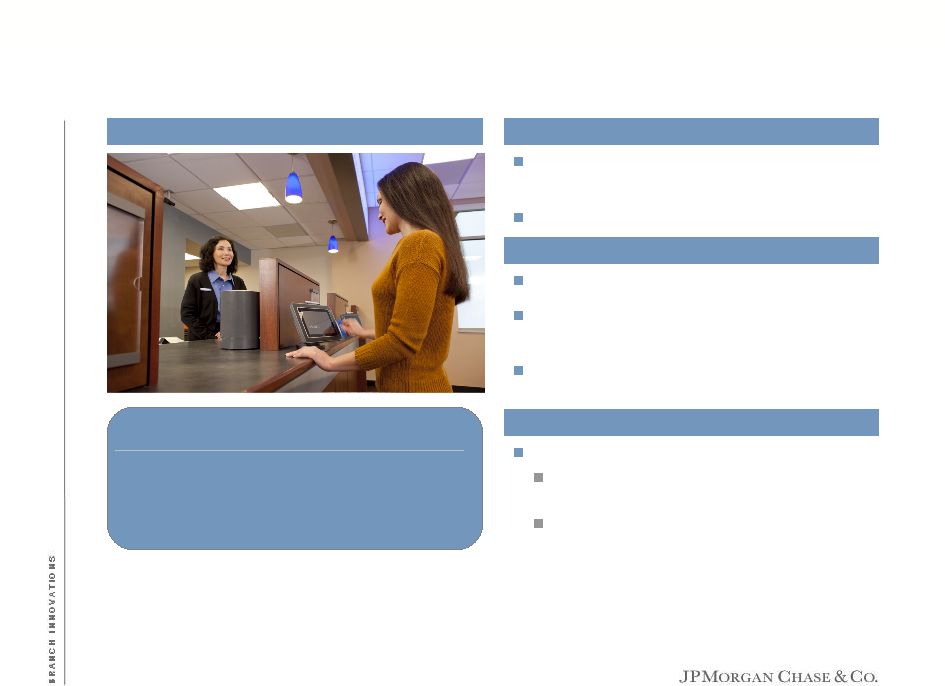 Paperless Teller Brings customer into session more quickly Customer does not have to complete a paper slip Provides enhanced authentication; customer uses card swipe and PIN to authenticate Some lessons learned Some learning curve for customers to use electronic teller versus paper slips Ensure angle and screen protection provide maximum privacy Positive customer reactions in branch tests “I liked how simple it was.” “Makes my transactions easier.” “I’m satisfied, especially with the savings on trees.” Significantly reduce teller transaction slips and receipts (currently almost one billion per year) Increase accuracy and reduce disputes 4 Paperless Teller Purpose Functions Piloting in 5 locations |
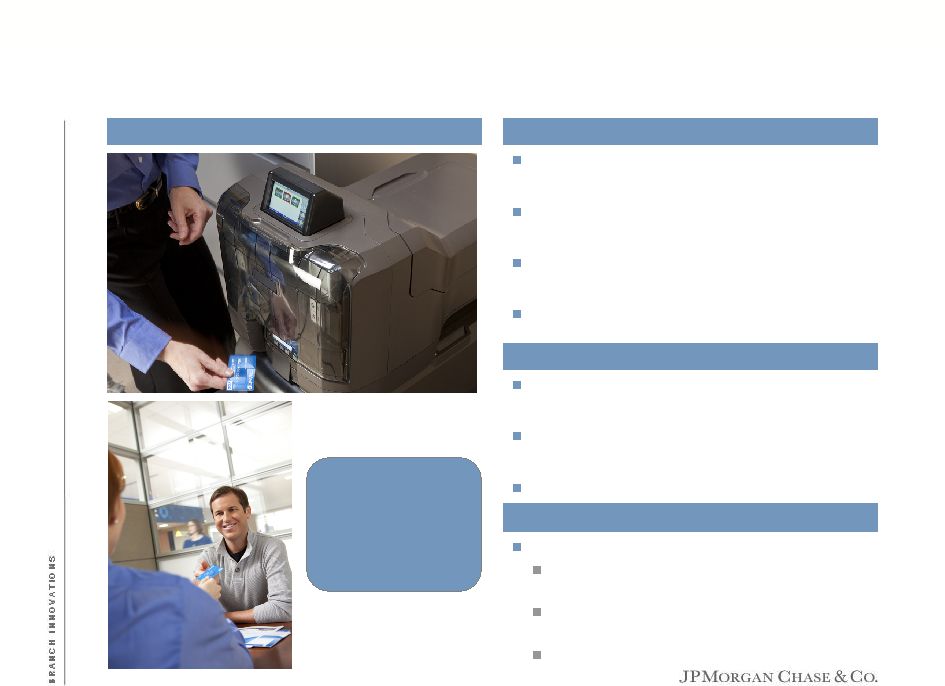 20mm+ Chase credit and debit cards are issued annually for new customers and replacements Improves experience and reduces costs via same day pickup at a branch instead of mailing a card More convenient account opening process and higher activation rates Opportunity to improve credit card cross-sell at the branch in the future Instant Issue Cards New and existing customers can have debit card issued instantly at the branch Debit card immediately active for PIN and signature based transactions Future functionality will include credit cards Nearly 85,000 cards issued during pilots since 2008 Some lessons learned Customers love “on the spot” solution instead of waiting for the mail Instant issue increases sales and customer engagement Servicing model is being refined, as we scale 5 Instant Issue Cards Purpose Functions Piloting in 58 locations |
 ExpertLink (Telepresence) ExpertLink provides a face to face interaction with specialists via telepresence Functions tested in different locations Sales: Mortgage, Investments, and Business Banking Service: Spanish language banking, debit claims, fraud, and banker support Some lessons learned Experience is superior to phone Customers very willing to open accounts via ExpertLink Increase sales in branches by connecting customers with sales and service specialists Improve customer experience by offering multi- lingual support and specialized services 6 ExpertLink (Telepresence) Purpose Functions Piloting in 13 locations |
 Other innovations we are developing and testing Customers fill out their own profile information prior to banker meeting. Customers prefer to share more information via this experience Increase functionality and customer experience Help customers set up their mobile banking in the branch immediately after account opening Touchscreen sales process with paperless account opening and eSignature. Documents are sent to email or online document vault 7 Self-Profiler on an iPad Next Gen ATM Paperless sales Mobile Demonstration Zone |
 C A R D S E R V I C E S & A U T O February 28, 2012 Gordon Smith, Chief Executive Officer Card Services & Auto *********** *********** *********** *********** *********** *********** *********** *** |
 Executive Summary Consumer and Small Business Card performance is consistent with last year’s guidance Outstandings stabilized reaching the target of $120B at year end 1 Net charge-off rate in 4Q11 of 4.33% in line with 4.50% +/- target Revenue margin at 12.3% for FY2011 in line with 12.0%-12.5% target Our focused investments are yielding attractive returns and driving continued market share growth 4Q11 sales growth of 13.6% remains robust 2 Engagement levels continue to increase – 501 bps lift in sales active rate and 38% lift in sales per sales active since 2009 Market share of general purpose credit card sales has now grown by 322 bps since 2007 Paymentech sales volume is up 18% fueled by 34% growth in new merchant accounts through retail branches We are seeing rapid adoption of our digital capabilities Chase.com is the #1 most visited banking portal 3 and our customers spent over $85B online during 2011 We have 15 million registered mobile users and our customers moved $33B in 2011 using mobile channels We have made significant investments in mobile (QuickPay, QuickDeposit, Jot) Note: Consumer and Small Business Card represents Card Services excluding Commercial Card 1 Excludes WaMu 2 Excludes Kohl’s 3 Based on Jan’12 compete.com rankings 1 |
 Agenda Page 2 Financial performance 2 Our investments are yielding attractive returns 11 Digital and mobile growth 18 |
 We have shown consistent progress against our targets Source: internal Chase data Note: Component numbers may not equal total Card Services & Auto due to rounding 1 Mass Affluent includes WaMu (except for sub-prime portion) 2 Paymentech ROE represents return on tangible equity 3 Includes Student and sub-prime portion of WaMu 4 Excludes Commercial Card 3 ($B) Affluent and High Net Worth $40 $169 Revenue m argin 10.8% 10.6% 11.1 % 11% - 13% ROE 23 4 16 > 20 Mass Affluent 1 79 144 Revenue m argin 11.4% 11.3% 11.7 % 10% - 12% ROE (2) (18 ) 12 15 - 18 Small Business 6 27 Revenue m argin 11.8% 12.6% 14.2 % 13% - 15% ROE (32 ) (25 ) 12 > 20 Chase Paymentech 2 N/A N/A ROE 36% 41% 47% > 20% Auto 47 N/A ROE 21% 32% 34% 18% +/- Corporate 3 2 0 4 Card Services 4 Revenue m argin 11.8% 11.9% 12.3 % 12 .0% - 12.5% Card Services 4 & Auto $19 2 $344 ROE (10%) 16% 29% 20% +/ - 2011 EOP outstandings Sales volume 2009 2010 2011 Through -the-cycle targets |
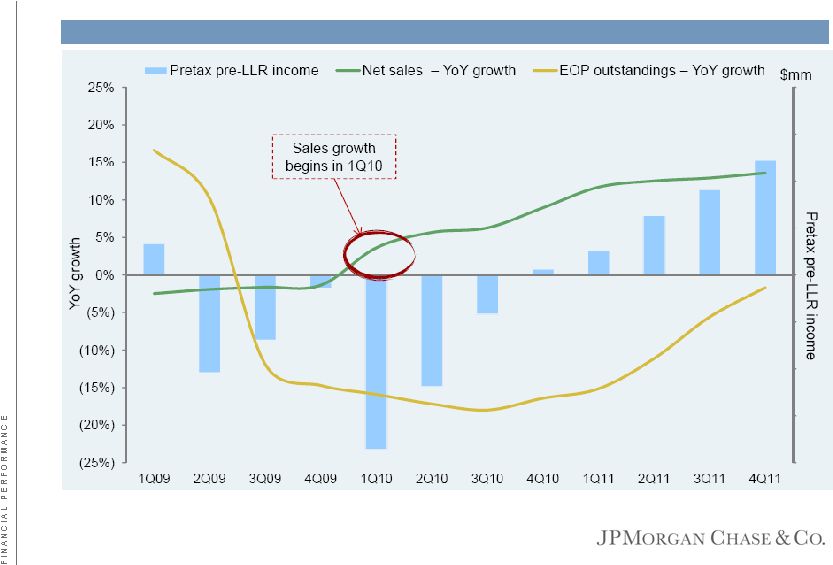 Pretax pre-LLR profit has been steadily increasing since 1Q10 Consumer and Small Business Card 1 trends in sales, outstandings, and pretax pre-LLR income Source: internal Chase data 1 Excludes Kohl’s 4 |
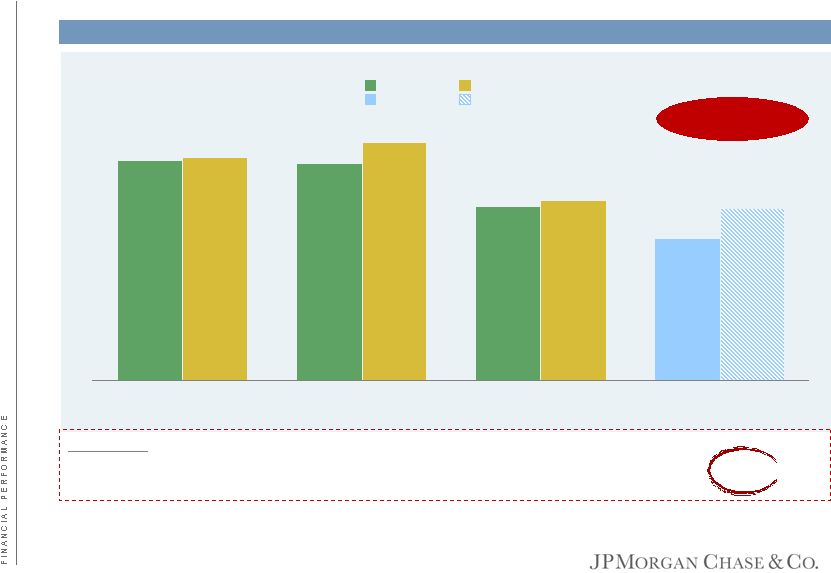 Revenue margin¹ 15.7% 15.5% 12.4% 10.1% 15.9% 17.0% 12.8% 12.3% AXP (US Card) COF (US Card) DFS Revenue margin continues positive trend 1 Revenue margin defined as revenue over average outstandings 2 AXP revenue have been adjusted to exclude estimated rewards costs 3 DFS revenue represents Direct Banking segment fiscal year ending November; 2008 data has been adjusted to exclude $863mm in VISA/MasterCard litigation payments in 4Q08 2 3 Chase Consumer and Small Business Card Steady state 12.0% - 12.5% 2008 2011 5 16 155 38 220 0.4% 3.1% 1.1% 6.8% 2008 – 2011 Growth (in bps) CAGR |
 $131 Source: internal Chase data 1 Run-off balances include certain legacy WaMu loans, legacy balance transfer programs and terminated partner portfolios (e.g. Kohl’s ) Consumer and Small Business Card end-of-period outstandings ($B) Outstandings have stabilized $138 $163 1 6 |
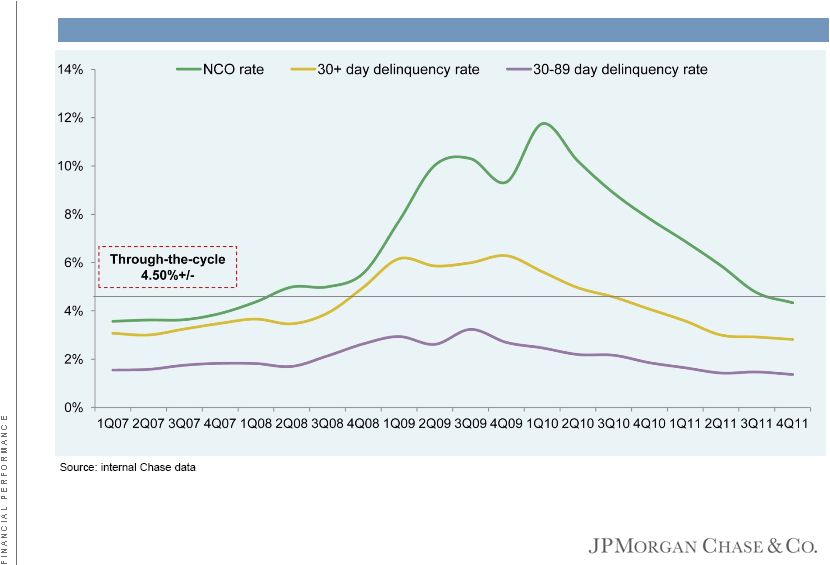 Loan losses show continued improvement Consumer and Small Business Card net charge-off and delinquency rate trends 7 |
 Trends in Consumer and Small Business Card expense (indexed to 2009) Source: internal Chase data 1 Excludes new business initiatives and investments Core operating expense is tightly controlled as we invest in new capabilities and growth Consumer and Small Business Card core operating expense¹ ($B, indexed to 2009) 8 |
 3Q11 3Q09 3Q10 Evaluate over 2,000 acquisition marketing investments per quarter Very granular level Forecast P&L with all metrics Projections based on past experience Adjusted for expected changes Determine how much to invest based on the attractiveness of choices Select investments to maximize the overall return on our marketing spend Ensure each investment meets NPV, undiscounted payback and ROE hurdles Process of selecting marketing investments Vintage Lifetime ROE 1,2 Average payback period (years)2 > 30% > 35% > 40% Return on new account investment will sustain portfolio steady state ROE of 20%+/- < 5 < 5 < 3 1 Based on actuals through 4Q11 and forecasts 2 Excludes fixed operating expense and advertising media expense on existing accounts 9 |
 Through-the-cycle targets 4Q11 Revenue margin 12.0% - 12.5% 12.2% Expense 4.5%+/- 4.8% Net charge-off rate 4.5%+/- 4.3% Equity $13B $13B ROE¹ 20%+/- 18% Through-the-cycle targets for Consumer and Small Business Card 1 Excludes impact of loan loss reserve actions and assumes 39% tax rate 10 Consumer and Small Business Card key metrics |
 Agenda Page 11 Our investments are yielding attractive returns 11 Financial performance 2 Digital and mobile growth 18 |
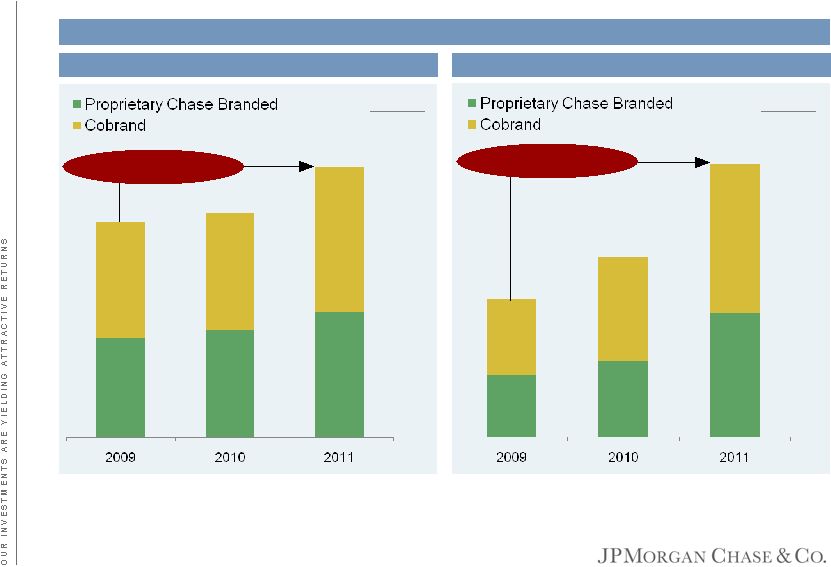 Trend in Consumer and Small Business Card customer acquisitions metrics We are acquiring high quality engaged customers Source: internal Chase data 1 Excludes terminated partners 12% 12% 41% 41% 98% Increase New accounts (‘000s) Sales volume from new accounts ($mm) 25% Increase CAGR 12% 41% CAGR 1 1 12 |
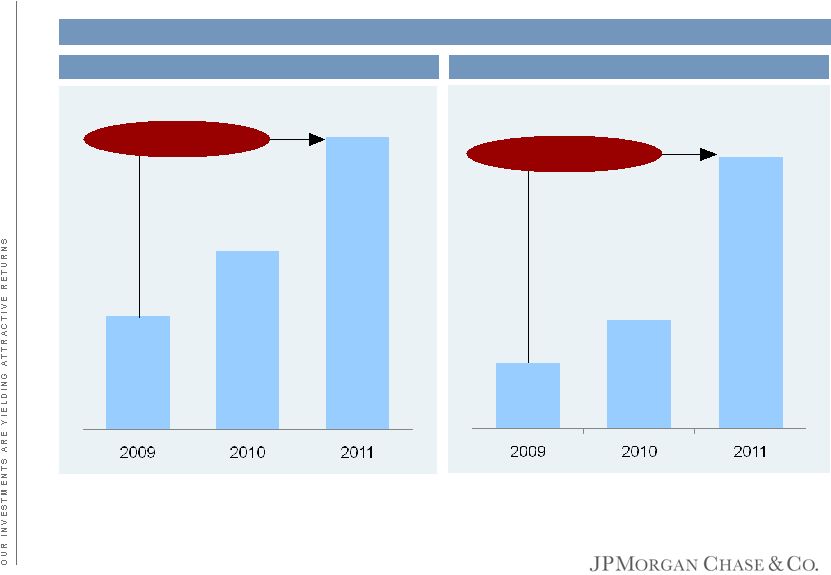 We continue to see improvements in sales activation rates and sales per sales active Source: internal Chase data Note: sales active population excludes accounts with only balance transfers or cash advance activity 38% Increase 501 bps Increase Sales activation rate Sales per sales active Trend in Consumer and Small Business Card portfolio metrics 13 |
 Oil Discretionary Source: internal Chase data; excludes WaMu, International, and Private Label 1 Everyday retail includes supermarket/grocery stores, department stores, discount stores, and wholesale clubs We are continuing to experience growth within all merchant categories Trends in YoY sales growth by merchant category Total Non discretionary excluding oil Everyday Retail¹ Bills Healthcare Gov. Travel Dining B2B Discretionary Retail Non Discretionary excluding oil Discretionary 14 |
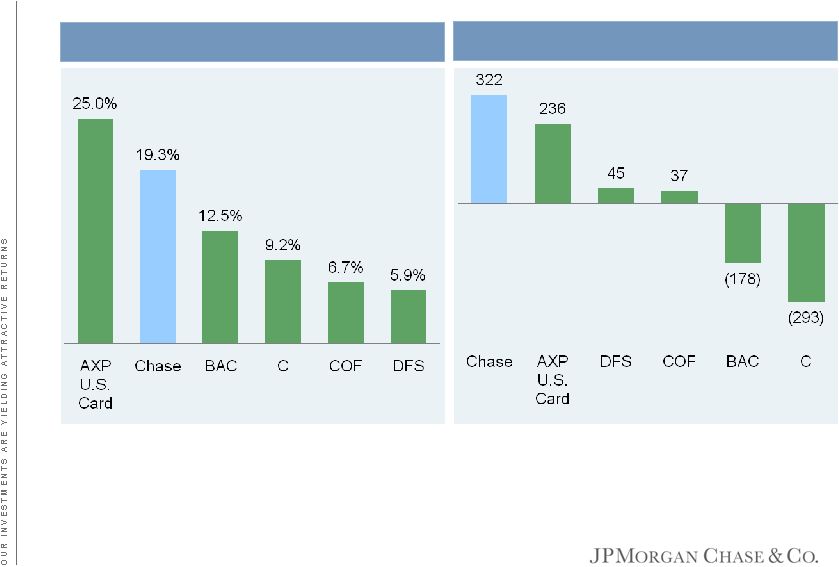 Source: earnings releases; internal Chase data; internal Chase estimates Note: GPCC includes consumer, small business, charge card but excludes commercial 1 AXP includes cash advances, excludes Global Network Services (GNS) volumes 2 Chase sales data excludes WaMu, cash advances, balance transfers and Private Label 3 BAC includes U.S. consumer and small business; 2007 is estimated to exclude international 4 C includes C branded and excludes non-core retail partner portfolios 5 DFS sales data excludes cash advances Chase has gained sales market share vs. competitors over the past 4 years 2011 General Purpose Credit Card (GPCC) sales volume market share 2 5 3 4 Change in GPCC sales volume market share (bps) — 2007 vs. 2011 1 15 |
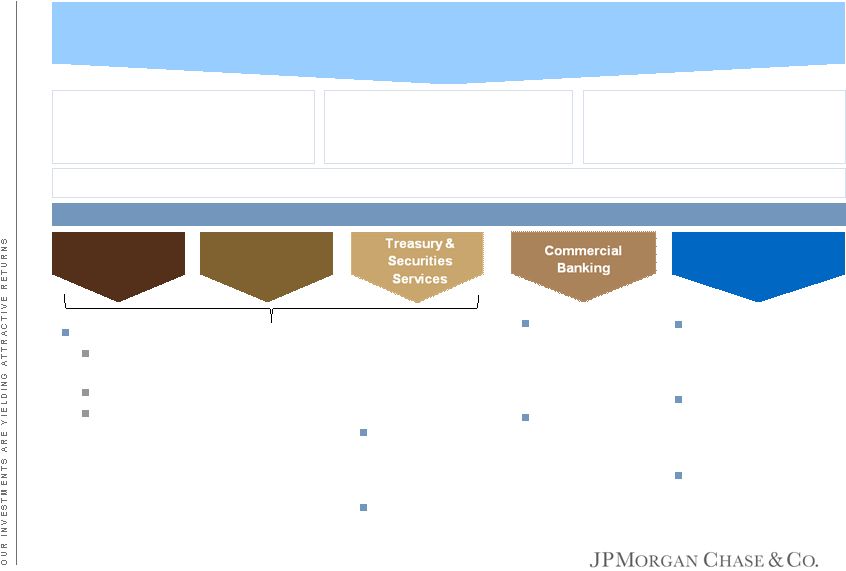 We continue to leverage the JPMC franchise Global Corporate Bank Investment Bank Retail Financial Services Leveraging the JPMorgan Chase franchise $193B in outstandings ~$132B OS in Consumer, Small Business, and Commercial Card ~$61B loan balances in Auto & Student Lending ~65mm credit card open accounts ~$400B in sales ~$379B net sales in Card Services ~$21B loan originations (sales) in Auto Card Services & Auto Card Services is #1 among key issuers in General Purpose Credit Card receivables Sourced Subaru, Mazda, Jaguar, Land Rover and Chrysler Auto financing deals though IB relationship M&A advisory on Card portfolio acquisitions and divestitures Issued 1.3mm new consumer and small business card accounts through branches Increased signings of new Paymentech accounts through branch referrals by 34% Provided in person servicing Sourced most new middle market commercial card customers through Commercial bank Generated >40% of commercial card revenue from JPMC wholesale customers Leveraged existing wholesale relationships and customers Sourced new Paymentech accounts represents a considerable part of Paymentech’s revenue from new customers Sourced most new commercial card customers through referrals These customers generate >50% of commercial card revenue 16 |
 Paymentech continues its strong growth driven by new accounts from retail branches New accounts from retail branches (‘000s) 34% Increase Source: internal Chase data 1 Based on Visa and Mastercard publicly reported credit and debit sales volumes Debit and credit volume 2011 YoY growth 810 bps Higher 1 17 |
 Agenda Page 18 Digital and mobile growth 18 Financial performance 2 Our investments are yielding attractive returns 11 |
 Chase.com and partner websites Branches Mobile applications Email Telephone Text messaging Social media sites ATM Direct mail Customers One Chase Digital strategy Mortgage Banking Consumer & Business Banking Card Services & Auto Consumers Small Businesses Channels 19 |
 Digital and mobile growth Digital is key to our business Chase.com #1 most visited banking portal in the U.S. 1 With $85B + in e-commerce sales volume, we are among the largest players in the U.S. Online channel is used 6x as frequently as the phone and 5x the branch Digital channels drive increased engagement and efficiency Mobile payments investments are gaining traction 15mm registered mobile users growing by 600k per month $33B payments and transfers last year, momentum suggests this will be double in 2012 2 Chase Mobile generates more payments volume than eBay/PayPal, Amazon, and Apple combined Chase Paymentech is among the largest merchant processor of mobile payments 3 1 January 2012 compete.com rankings 2 Includes same customer funds transfers, QuickDeposit, QuickPay, credit card bill pay (Epay), bill pay, and wire 3 Based on analysis of Mobile Commerce Top 300 report 20 |
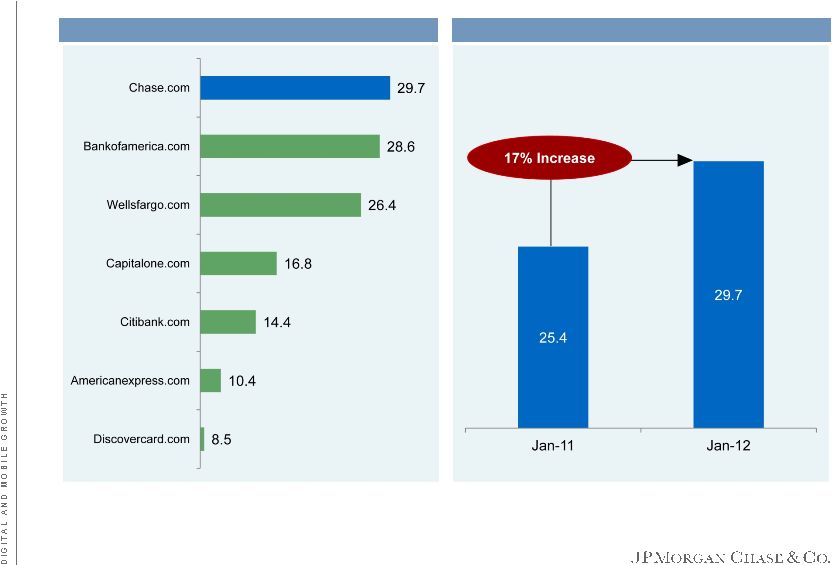 Chase.com is the most visited banking portal in the United States Unique visitors 1 to online banking portal (mm) Unique visitors 1 to chase.com (mm) Source: January 2012 compete.com rankings 1 Based on actual distinct internet users 21 |
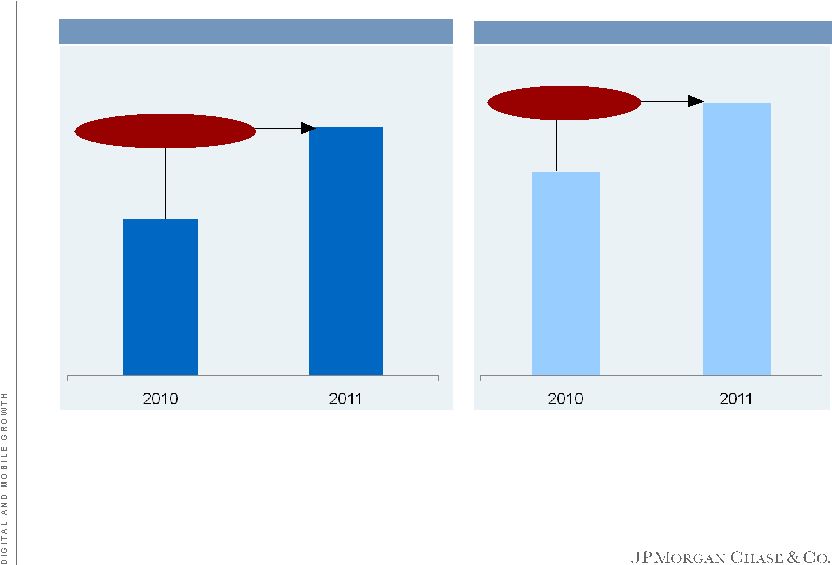 We are already among the largest e-commerce players in the U.S. 25% Increase 20% Increase Chase e-commerce 1 total debit and credit sales volume ($B) Paymentech e-commerce 1 gross dollar volume ($B) Source: internal Chase data 1 Based on network reported transaction code $85 + $185 + 22 |
 Digital channels are the most frequently utilized method of interaction for our customers Average quarterly service interactions per core Retail consumer household by channel type 1 Source: internal Chase data 1 Quarterly figures based on all core Retail consumer households (both channel active and channel inactive); “interactions” include branch visits, agent and IVR calls, and online and mobile logins 2 Does not account for multiple branch visits in one day 3 Excludes dropped calls 4 Excludes opt-out calls transferred to a banker 23 |
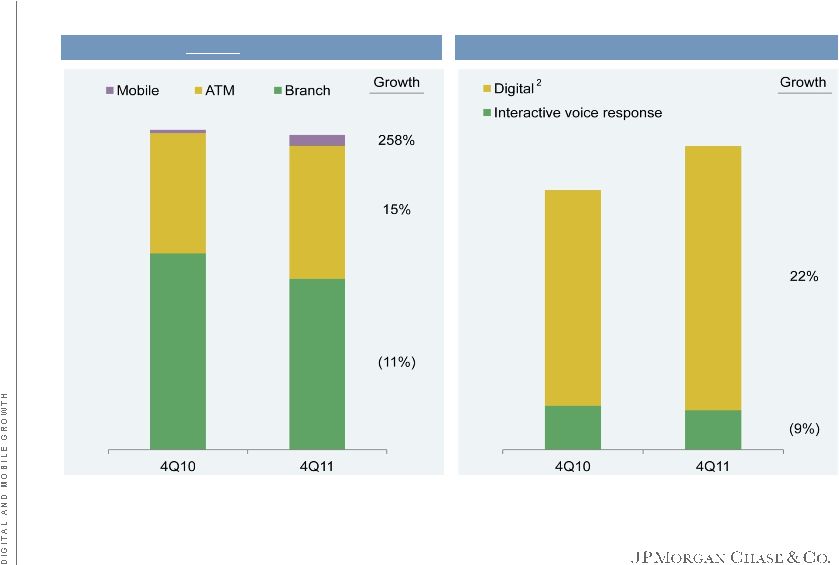 Everyday banking through digital channels has improved efficiency in the retail bank Avg. quarterly # of deposits per consumer household¹ Avg. quarterly inquiries per consumer household¹ Source: internal Chase data 1 Based on total Consumer households (both channel active and channel inactive) 2 Based on online/mobile visits where customer only logged in and did not do other transactions (e.g., same customer funds transfer, QuickDeposit, etc.) 24 |
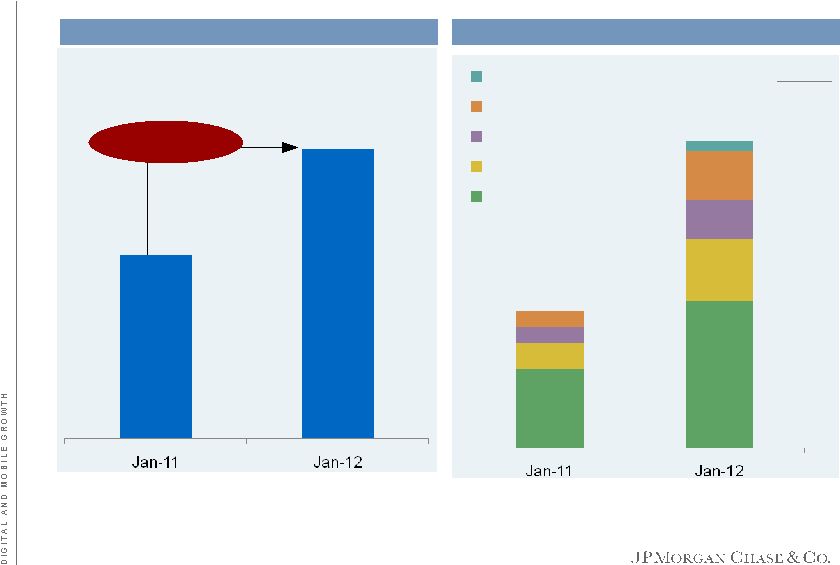 Chase mobile adoption is growing quickly 57% Increase Active Chase mobile users (mm) Source: internal Chase data 1 QuickPay for mobile devices launched in early 2011 88% 138% 140% 200% Mobile payment transactions (mm) Growth 124% Same customer funds transfer QuickPay¹ QuickDeposit Credit card bill pay (Epay) Bill pay 25 |
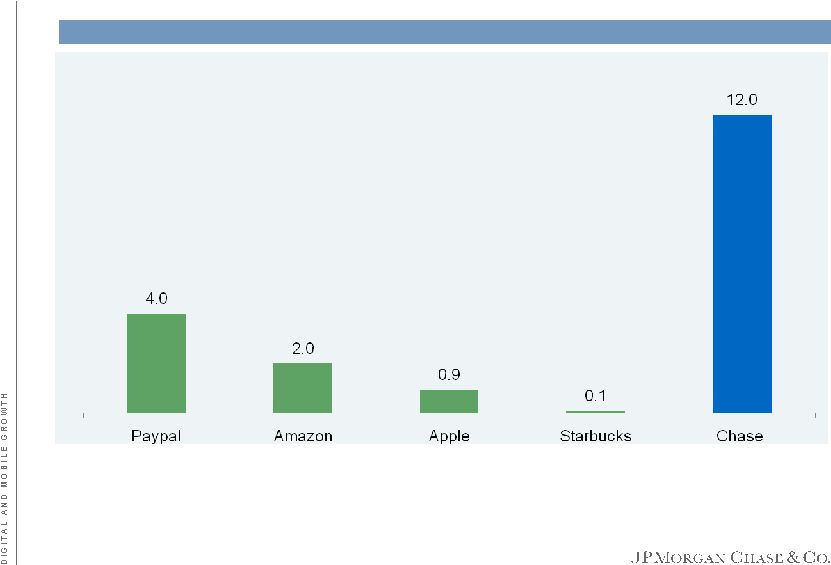 Our 2011 mobile payment volume totaled more than 4 top players combined 1 Based on 2011 eBay SEC 10-K filing; includes U.S. and International 2 Based on Internet Retailer 2012 m-commerce report 3 Based on December 2011 Starbucks press release 4 Includes QuickPay, QuickDeposit, credit card bill pay (Epay), bill pay, and wire from mobile and excludes same customer funds transfers 2011 mobile payment volume ($B) 1 2 2 3 4 26 |
 We are investing in three major opportunity areas in mobile Mobile wallets Mobile merchant solutions Mobile Person to Person and check How it works for customers Use mobile device to shop Use existing payments instruments and prepaid Isis wallet available on new phones Use mobile device to accept debit and credit card payments anytime anywhere in the U.S. Use email or mobile device to send payments to others What it involves We support open wallets, multiple technologies For Isis, mobile network operators will distribute Isis wallet through retail outlets Access to secure Near Field Communication element on the phone Provide a solution for merchants in every size category Offer unique features Market to new and existing clients Expand to enable payments between Chase and other banks Further simplify and streamline user experience Explore new technologies Mobile Network Operator backed open wallet Mobile ordering startup Current partnerships Mobile opportunity areas 27 |
 We are pursuing investments to address both near and medium term digital opportunities Chase Digital Strategy: achievements to-date and 2012 roadmap Near Field Communication wallet partnership m-commerce platform partnership Storefront and wallet pilot Chase terminal with Near Field Communication capabilities Pilot launch in 2 cities Person to Person payments with other banks Ultimate Rewards “Pay with Points” Chase “My Offers” Top 5% of all mobile financial applications Amazon cobrand “Pay with Points” tripled redemptions Chase Community Giving 3.4mm Facebook fans QuickDeposit $2.6B in 2011 QuickPay mobile $340mm in less than a year To-date achievements 2012 - 2013 Mobile POS app and smart phone card acceptance 28 |
 Key themes Performance was consistent with metrics we described this time last year We expect expense to be flat in 2012, as we self-fund innovation Our tried and true investments are yielding attractive returns and driving growth in the business We are deeply engaged in digital channels and we are seeing rapid adoption of our capabilities Digital channels are an important accelerant of our business model – Engagement, efficiency, and customer acquisition Market share gains continue to accelerate Loans outstanding have stabilized Credit losses continue to perform well 29 |
 February 28, 2012 C O M M E R C I A L B A N K I N G Doug Petno, Chief Executive Officer Commercial Banking ********** ********** ********** ********** ********** ********** ********* |
 Opening thoughts Introduction Results are strong, but we are seeking continuous improvement and investing in business Record 2011 performance – Revenue, net income, deposits, and investment banking Continued to invest in franchise – Hired bankers, grew loans, and added clients Market environment, while challenging, favors the Chase franchise Not all commercial banks are created equal; we have a very strong hand Clients – Carefully selected Platform – Local knowledge and delivery, global reach Products – Best in class, competitive advantage Scale – Flight-to-quality by both clients and talent People – Seasoned and focused Opportunity – Tremendous opportunity in high potential markets Our business model is proven and we remain focused on execution excellence 1 |
 Agenda Page 2 Business performance 2 Growth opportunities 14 Outlook 20 |
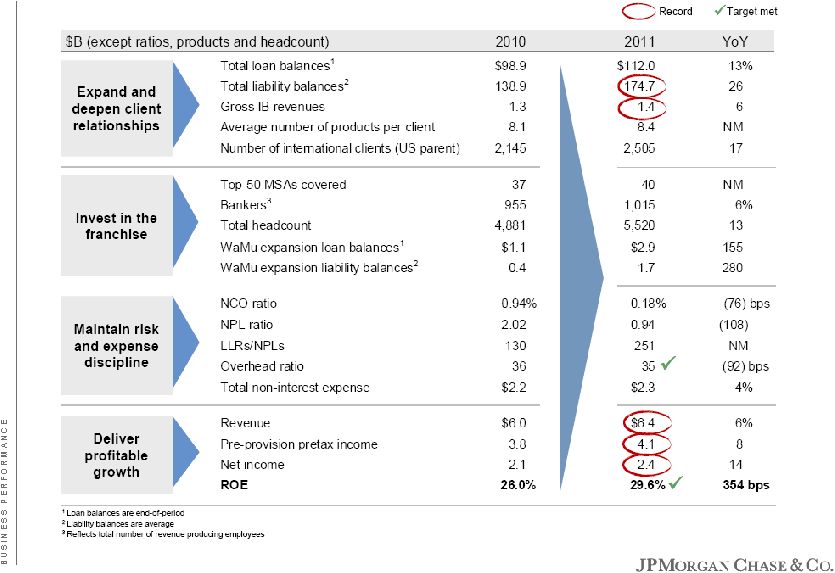 2011: a record year – We continue to focus on executing our strategy Business performance 3 |
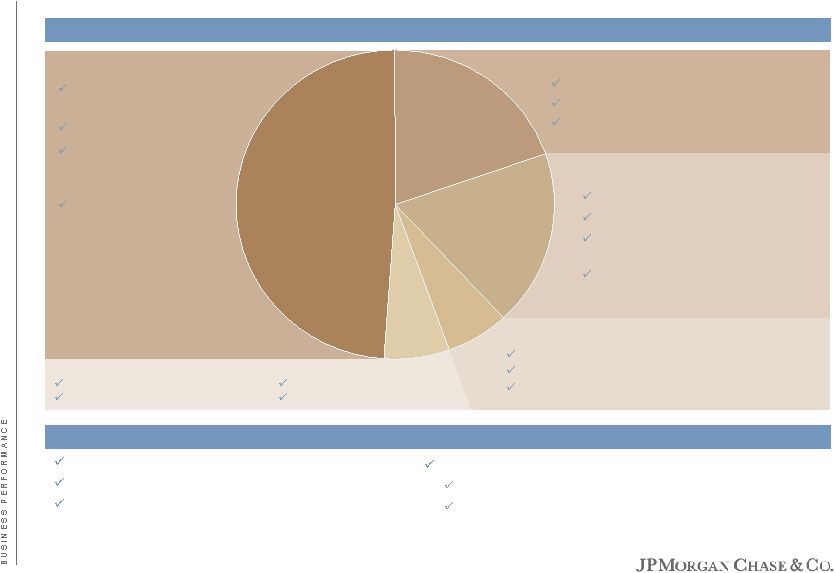 Diversified business model – Strength across all business segments in 2011 Business performance Select highlights Record ABL originations; zero net charge-offs 26% growth in equipment finance portfolio 41% increase in international revenue Record gross IB revenue of $1.4B 57% YoY growth in M&A fees Rates, FX and Commodities revenue increased by 16% YoY 2011 revenue contribution by client segment – Total revenue of $6.4B 1 Source: FDIC industry data as of 9/30/11 2 Full business results of Chase Business Credit and Chase Equipment Finance are included in client segment results ` Corporate Client Banking 9% operating margin growth 43% increase in loans Over 110 uptiers and new bookrunner roles on syndicated lending transactions Middle Market Banking Seven consecutive quarters of loan growth 1,200+ new clients added Geographic expansion on track and profitable in key markets Enhanced industry specialized coverage Commercial Term Lending #1 multifamily lender 1 Four-fold increase in originations Continued improvement in overall credit quality Citi portfolio successfully integrated and exceeding expectations Real Estate Banking Six-fold increase in originations Strong pipeline for 2012 56% improvement in NPLs 49% 20% 18% 6% 7% Other Community Development Banking Chase Capital Corporation Chase Business Credit 2 Chase Equipment Finance 2 4 |
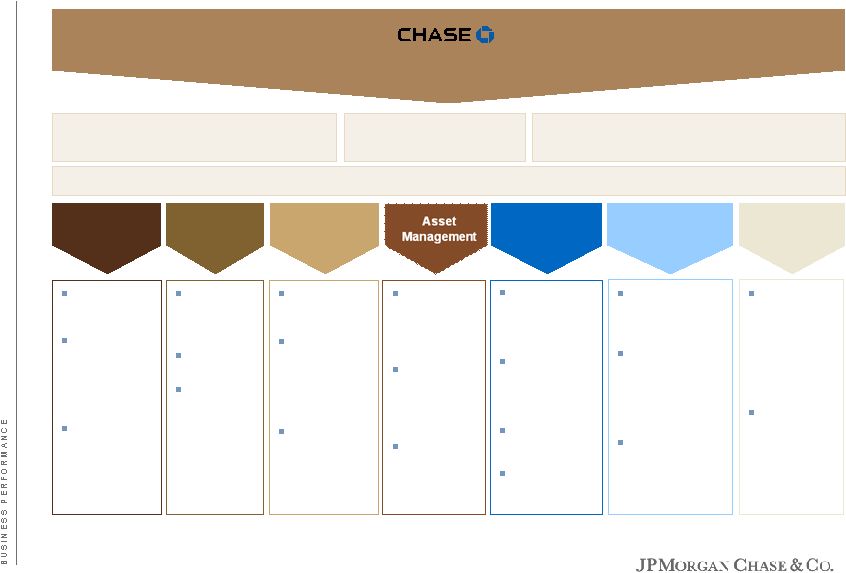 Our local delivery model fully leverages the firm’s global platform and financial solutions Business performance ~23,000 clients Middle Market Banking: ~21,000 Corporate Client Banking: ~1,700 Bankers, underwriters and service teams in 125 locations across 28 states, D.C. and 13 major international cities 1 75% of CB clients use Treasury Services products Leveraging cash management and trade finance platform in CB international expansion $2.3B in revenue in 2011 Joint coverage of foreign multinational clients Presence in 40+ countries CB leveraging GCB footprint and resources Joint coverage of nearly 1,800 CB clients $1.4B gross revenue in 2011, including $415mm in Rates, FX and Commodities CB clients accounted for 25% of North America IB fees in 2011² Referral source for Private Bank and Private Wealth Management CB clients leveraging Investment Management services Opportunity to bring in AUM from CB client M&A/IPO transactions Over 16mm branch transactions annually by CB clients WaMu branch footprint is foundation for Middle Market expansion Referral source for Chase Private Client Referrals from Business Banking to CB 200+ affordable housing and community facilities transactions led by Community Development Banking Key referral source for private equity investments by One Equity Partners Nearly $170mm in Global Commercial Card revenue in 2011 CB clients accounting for 66% of total GCC clients, driving nearly $15B in Card spend in 2011 Opportunity to further leverage Card as wedge product in growth regions Treasury & Securities Services Global Corporate Bank Investment Bank Consumer & Business Banking Corporate/ Private Equity Card Services & Auto Commercial Banking 1 Includes offices in Canada dedicated to Chase Business Credit and Corporate Client Banking only 2 Calculated based on gross domestic IB revenue for SLF, M&A, Equity Underwriting, Bond Underwriting ~36,000 real estate clients, owners & investors Clients: ~1,400 Owners & investors: ~35,000 ~36,000 prospects 5 |
 Total revenue and non-interest expense ($B) Maintaining expense discipline while steadily investing in business Business performance 2005 2006 2007 2008 2009 2010 2011 10.7% Total revenue CAGR 3.5% Total non-interest expense CAGR Overhead ratio 35% 36% 38% 53% 52% 48% 41% $3.5 $1.9 $3.8 $2.0 $4.1 $2.0 $4.8 $1.9 $5.7 $2.2 $6.0 $2.2 $6.4 $2.3 Note: Numbers may not sum due to rounding Total revenue 2005: First full year post Bank One merger 2009: First full year post WaMu transaction $0.7 $0.7 $0.7 $0.7 $0.8 $0.8 $0.9 $1.2 $1.2 $1.3 $1.3 $1.4 $1.4 $1.4 Compensation expense Other non-interest expense 2.5% Other non-interest expense CAGR 6 |
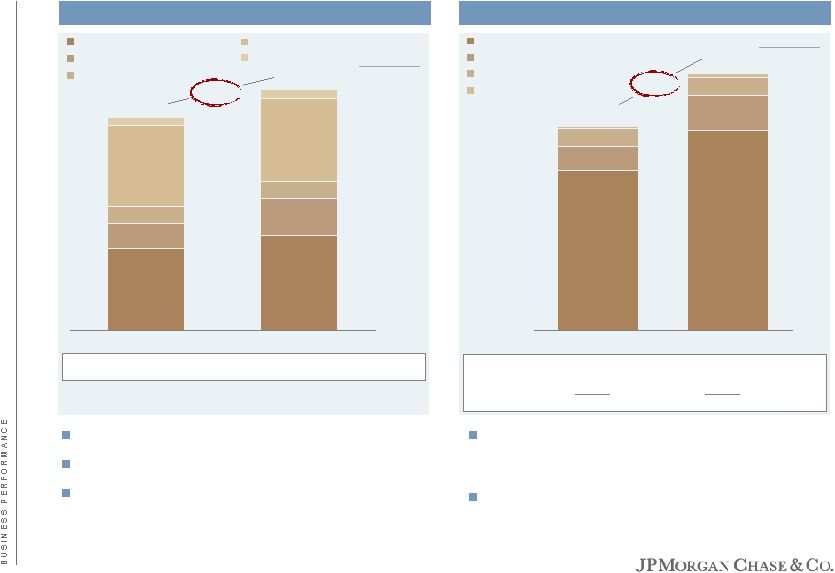 Loan balances (EOP, $B) Steady growth in revenue and profitability driven by increase in loans and deposits Business performance Liability balances (average, $B) Clients continue to generate cash with few alternative investment options and maintain more cash liquidity Spreads under continued pressure from low rate environment Six consecutive quarters of loan growth Maintaining underwriting standards Spread on new loans consistent with spread on overall loan portfolio 34% Savings 27% Sweeps/other $108.8 $135.6 $16.4 $24.1 $2.2 $11.5 $12.2 $2.8 $174.7 $138.9 Middle Market Banking Corporate Client Banking Other Growth 25% 47% 6% 26% +$35.9 2010 2011 Real Estate Banking 28% 39% DDA $37.9 $44.4 $16.7 $8.2 $3.8 $11.7 $7.6 $37.9 $38.6 $4.0 $98.9 $112.0 Middle Market Banking Corporate Client Banking Real Estate Banking Commercial Term Lending Other Growth 17% 43% 2% 8% 6% 13% +$13.1 2010 2011 32% 25% 43% Deposits by type 100% Total 100% Utilization 30.3% 31.4% Note: Numbers may not sum due to rounding 7 |
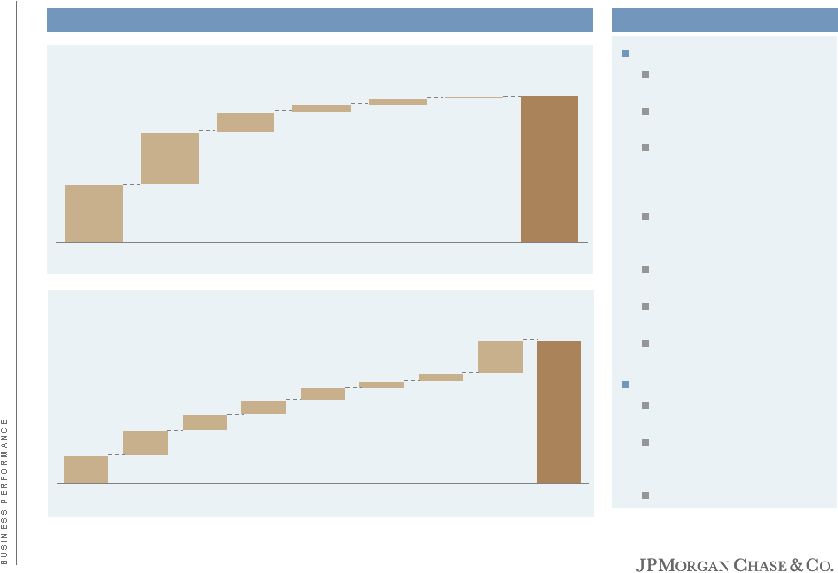 De-mystifying loan growth – Increase driven by multiple sources Business performance Loan growth drivers Taking share among larger corporate clients New client acquisition across WaMu footprint Increased activity across select industries (energy, utilities, machinery and equipment manufacturing) Shift by select clients to direct bank loans in place of issuing bonds Differentiating capabilities (i.e. multicurrency revolvers) Minimal increase in utilization Lease portfolio grew by more than $1B Loan demand drivers Capex (equipment, infrastructure) M&A transactions, fund distributions (dividend recap) Opportunistically acquire real estate/office space $0.6 $0.7 $1.8 $4.7 $5.1 $0.2 CCB GNPH Leg Core MM Exp Core MM CTL REB 2011 Corporate Client Banking Legacy Middle Market WaMu expansion Middle Market Commercial Term Lending Other Total YoY loan growth $13.1 By client segment Real Estate Banking 39% 36% 13% 5% 5% 2% 100% 2011 Commercial Banking YoY loan growth ($B) Highlights Note: Numbers may not sum due to rounding $0.7 $2.6 $2.2 $1.5 $1.3 $1.2 $0.7 Healthcare Oil & gas State & muni gov’ts Machinery & equipment manufacturing Other (24 industries) $13.1 Consumer products Metals & mining $3.0 Total YoY loan growth By industry 20% 10% 5% 9% 23% 17% Real estate 12% 5% 100% 8 |
 C&I – Business optimism is up but caution remains; strong competition for good clients Business performance With certain regional and industry exceptions, clients are in good shape Profitable, liquid, and less leveraged Accessed long-term markets Well-positioned to withstand potential slide in recovery Client confidence and optimism expected to improve gradually as macro-risks subside State of client base Weakened or distracted competitors in many markets Certain European banks retrenching Intense competition for high-quality clients; larger competitors aggressively defending key clients Customers seeking stability and one-stop shopping Likely to see more large portfolios come to market as banks recapitalize Competitive landscape Loan demand drivers in 2012 will be similar to 2011 Expect utilization to stay flat absent material economic uptick Outlook 6.3% 5.3% 3.2% 7.5% (2.0)% 1.3% 1.7% 3.7% 3.3% 2.4% (4.3)% (2.0)% 0.3% 1.5% 0.9% 1Q 2Q 3Q 4Q 1Q 2Q 3Q 4Q QoQ C&I loan growth Total C&I industry loan growth 1 Chase Commercial Banking 1 Source: FRB H.8 Assets and Liabilities of Commercial Banks in the United States for February 10, 2012 (not seasonally adjusted) 4.3% 2010 2011 9 |
 CRE – Multifamily in robust recovery while other asset classes have stabilized Business performance State of client base Spreads holding steady as number of active CRE lenders remain limited Underwriting standards holding steady Select lenders willing to take large hold positions Competitive landscape Outlook 3.7% (1.6)% (1.5)% 1.8% 0.5% (0.7)% 1.4% (3.6)% (0.8)% (2.3)% (2.4)% (2.3)% (2.2)% (1.8)% (1.5)% (1.1)% 1Q 2Q 3Q 4Q 1Q 2Q 3Q 4Q QoQ CRE loan growth Chase Commercial Banking Total CRE industry loan growth 1 2 2 First fiscal quarter end after acquisition of Citi’s $3.5B Commercial Term Lending portfolio 1 Source: FRB H.8 Assets and Liabilities of Commercial Banks in the United States for February 10, 2012 (not seasonally adjusted) 2010 2011 Real estate fundamentals continue to improve and net operating income is rising across many markets and property types Vacancy rates declining but broader economic uncertainty weighed on Office, Retail and Industrial properties in 2011 Core markets such as New York, Washington D.C. and San Francisco are showing stronger signs of recovery Secondary and tertiary markets will likely not recover until we see material improvement in unemployment Increasing rents and declining vacancies expected to continue driven by Increasing demand Lack of supply Continued weakness in the single-family housing market Lack of momentum in CMBS market reinforces need for alternative capital sources 10 |
 Our granular, diversified portfolio reflects our focus on client selection and risk discipline Business performance Average C&I loan size of $2.3mm Average Middle Market relationship tenor of 15+ years 72% of C&I portfolio is secured No industry accounts for more than 6% of total loan portfolio Granular, high-quality state and municipal loan portfolio 94% of outstanding loans to clients rated equivalent of investment grade Middle Market Banking 40% Real Estate Banking 7% Other 4% Corporate Client Banking 15% Commercial Term Lending 34% Total loans: $112B Loan portfolio by business Midwest 20% Total loans: $112B West 37% South 22% Northeast 19% International/other 2% Loan portfolio by geography 1 Healthcare 6% Multifamily CRE 31% Retail 4% State & muni governments – 6% Other CRE 14% Oil & gas 4% Other (24 industries) 26% Total loans: $112B Loan portfolio by industry Consumer products 5% Machinery 4% Commercial & Industrial ~23,000 clients 51% of Real Estate Banking portfolio was originated in 2009 or later Limited construction risk Focused on top-tier real estate companies Commercial Term Lending portfolio has stabilized properties and no construction risk Average loan size of $1.1mm Multifamily accounts for 66% of total CRE portfolio Note: Numbers may not sum due to rounding 1 Based on client domicile 11 Commercial Real Estate ~36,000 real estate clients, owners & investors |
 Continued strong credit performance Business performance Net charge-offs 3 2006-2007 CRE NPLs and NCOs reflect Real Estate Banking only; 2008-2011 CRE NPLs and NCOs also include Community Development Banking; 2009-2011 NPLs and NCOs also include Commercial Term Lending 2 Peer averages include CB-equivalent segments or wholesale portfolios at BAC, CMA, FITB, KEY, PNC, USB, WFC 12 1 2006 Commercial Banking NPL ratios are based on average loans; 2007-2011 Commercial Banking NPL ratios are based on end-of-period loans Non-performing loans 1 0.94% 0.89% 0.22% 0.23% 0.41% 0.89% 2.07% 2.02% 3.07% Peer average 2 Total Commercial Banking Legacy WaMu portfolio only Legacy Chase portfolio only $0.1 $0.1 $1.0 $2.8 $2.0 $1.1 Total CB NPLs ($B) 0.26 0.16 0.6 1.01 0.75 0.36 C&I NPLs (%) 0.03 0.70 2.75 4.67 3.37 1.67 CRE NPLs (%) 3 1,255% 1,161% 275% 109% 130% 251% Total CB LLR/NPLs (%) 2006 2007 2008 2010 2011 2009 4.43% 3.35% 4.21% 1.67% 1.02% 2.02% 2.87% 2.23% 0.07% 0.35% 0.05% 0.18% 0.16% 0.28% 1.35% 0.75% 2.00% $0.0 $0.0 $0.3 $1.1 $0.9 $0.2 0.05% 0.05% 0.17% 0.71% 0.61% 0.09% C&I NCOs (%) 0.06 0.23 1.62 1.36 1.26 0.28 CRE NCOs (%)3 Total CB NCOs ($B) 2006 2007 2008 2009 2010 2011 50 bps through-the-cycle NCO target Peer average 2 Total Commercial Banking Legacy WaMu portfolio only Legacy Chase portfolio only 0.93% 1.16% 1.02% 1.20% 0.74% 0.94% |
 We are well-positioned relative to peers against major market drivers and key trends Business performance Current business model generates high returns (20+% ROE target; ~30% in 2011) Multiple revenue sources to supplement lending returns Loan pricing decisions, and businesses presently modeling and adapting to higher capital requirements Risk appetite will not change Increased capital requirements Client selection - Client base is much better prepared Loan portfolio in excellent shape across all businesses Substantial loan loss reserves Strong base annuity business creates earnings resiliency Fortress balance sheet gives us capacity to bid for select asset opportunities from deleveraging by certain competitors Strong acquisition track record; successfully integrated $3.5B Citi multifamily lending portfolio into CTL Overall CRE is growing; key peers face more significant run-off Sizable greenfield C&I loan growth opportunity in expansion markets Focus on expanding share among larger corporate names Eurozone concerns Threat of double-dip Loan demand Record results in 2011 despite low rates Flight to quality Multiple NIR opportunities through broad product capability Sustained low rates Record deposits; potential earnings benefit from normalized yield curve is substantial Utilization levels will eventually improve Recovery will present IB opportunities across broad and expanded client footprint Investments and focus through the downturn will pay off Eventual economic recovery 13 |
 Agenda Page 14 Growth opportunities 14 Business performance 2 Outlook 20 |
 Expanding into new markets Opportunity Expand into new high-potential markets Create scale in 19 new top-50 MSAs, including 6 of top-10 MSAs Continue to add over 200 new clients a year Long-term net income opportunity of $400-500mm WaMu expansion markets Out of footprint markets Legacy markets Legacy markets Expansion markets Expansion markets Out of footprint markets Out of footprint markets Office location in expansion market Office location in expansion market Incremental prospects: ~15,000 or equivalent to ~70% of total existing Middle Market clients Middle Market expansion Growth opportunities WaMu expansion markets 300+ dedicated resources firm-wide 850+ prospect calls per month 1 200+ new clients in 2011 As of year-end 2011 – $2.9B in loan balances (up 155% YoY) – $1.7B in liability balances (up 280% YoY) Breakeven in 2Q11; expecting full pay-back of start-up investment in 2012 Out-of-footprint markets 40+ new bankers; actively building out coverage teams Export our culture and risk discipline Hire the right people with local expertise Prudent client selection Aggressive patience Track individual market performance Strategy Progress 1 Based on average per month for 4Q11 MSA Los Angeles Miami Atlanta San Francisco Seattle San Diego Tampa Portland Orlando MSA Los Angeles Miami Atlanta San Francisco Seattle San Diego Tampa Portland Orlando MSA Philadelphia Washington D.C. Boston Minneapolis St. Louis Pittsburgh Charlotte Nashville Richmond Birmingham MSA Philadelphia Washington D.C. Boston Minneapolis St. Louis Pittsburgh Charlotte Nashville Richmond Birmingham Rank by size 2 nd 8 th 9 th 13 th 15 th 17 th 19 th 23 th 26 th Rank by size 2 nd 8 th 9 th 13 th 15 th 17 th 19 th 23 th 26 th Rank by size 5 th 7 th 10 th 16 th 18 th 22 nd 33 rd 38 th 43 rd 49 th Rank by size 5 th 7 th 10 th 16 th 18 th 22 nd 33 rd 38 th 43 rd 49 th 15 |
 Improve delivery of the full investment banking product capability to CB clients Growth opportunities CB gross IB revenue grew 6% YoY in 2011 despite market headwinds ($B) 50% of NA M&A deal fees are from transactions of <$1B in size Source: J.P. Morgan; S&P LCD 2012-2013 2014 2015 2016 2017 $144 $224 $201 $248 $311 16 2012–2017 total maturities: $1.1T Continued focus on upcoming debt maturities will drive SLF revenue (US leveraged debt maturities – $B) < $1B 49% $1–5B 34% >$10B 6% $5–10B 11% Total 2011 North America M&A fees: $10.8B Source: Dealogic Syndicated and Leveraged Finance Selectively expand Lead roles in upcoming maturities and new financings Rates & FX Increased Lead roles in credit facilities and international expansion will drive additional revenue opportunities Commodities Deliver commodities risk management solutions to the broader CB client base $2.0 16% 17% 16% 20% 25% 25% CB IB fees as percentage of North America IB fees 1 M&A and Corporate Finance Advisory Dedicate resources to leverage full M&A and Corporate Finance Coverage platforms 1 Calculated based on gross domestic IB revenue for SLF, M&A, Equity Underwriting, Bond Underwriting $0.7 $0.9 $1.0 $1.2 $1.3 $1.4 Revenue target 2006 2007 2008 2009 2010 2011 |
          Delivering international banking solutions locally and differentiating from the competition Growth opportunities (U.S. parent) 2,505 2,145 1,677 1,329 1,080 890 2005 2006 2007 2008 2009 2010 2011 744 Global capabilities delivered locally – Wedge product with Middle Market Well-positioned with global platform and infrastructure Leveraging GCB’s scale and global expansion 41% growth in international revenue in 2011 5-year overseas revenue target of $400-500mm 1 Excludes offices in Canada dedicated to Chase Business Credit and Corporate Client Banking only Americas¹ Regional office locations: US (New York, Chicago, Dallas, Irvine, Atlanta, Grand Rapids) Toronto Mexico City Sao Paulo Regional office locations: Mumbai Hong Kong Shanghai Tokyo Singapore Sydney Regional office locations: London Frankfurt EMEA Asia Pacific International clients International 17 |
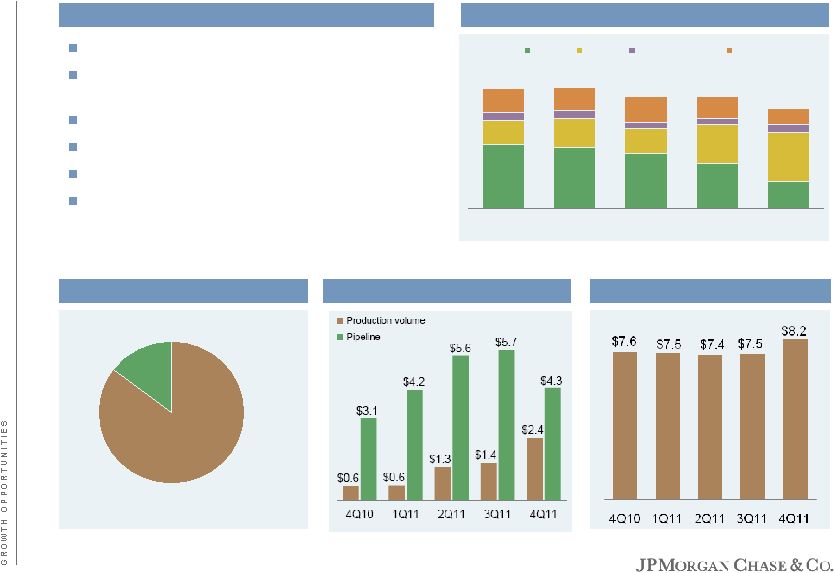 Real Estate Banking is well positioned to take advantage of the CRE recovery Growth opportunities Real Estate Banking Upcoming CRE debt maturities ($B) Grow portfolio opportunistically Portfolio in excellent shape; appetite for high- quality opportunities Favorable competitive landscape Undistracted team Continued focus on risk discipline Focus on top-tier real estate companies with broad product needs Source: Foresight Analytics, July 2010 $255 $285 $285 $305 $310 2012 2013 2014 2015 2016 Banks CMBS Life companies Other REB loan balances ($B) REB production and pipeline ($B) REB portfolio breakout 1 Non- Construction 85% Construction 15% Total commitments: $12.4B 1 Based on commitments as of 12/31/11 18 |
 Commercial Term Lending is capitalizing on strong multifamily market fundamentals Growth opportunities Commercial Term Lending Multi-family market drivers Favorable market environment Historical market participants no longer active Attractive market pricing and terms Strong market fundamentals Opportunistically grow multifamily portfolio Fully underwritten, “cash flow” lending Differentiate through best-in-class efficiency, local presence, competitive pricing and certainty of execution Aggressively manage risk and credit costs “Echo Boomers” entering prime age for renting Decrease in homeownership increasing rental demand Limited new construction in the last several years Decreasing vacancy in existing stock Strong investor demand for emerging multifamily market Premium for newer quality properties versus older assets in non-core locations CTL portfolio breakout Multifamily 81% Retail 8% Office 6% Industrial 4% Other 1% Stabilized properties No construction risk Average loan size of $1.1mm $38.6 $38.5 $38.0 $37.7 $37.9 4Q10 1Q11 2Q11 3Q11 4Q11 CTL loan balances ($B) CTL production and pipeline ($B) Increasing demand Lack of supply Strong investor demand 19 $2.2 $2.2 $3.0 $3.0 $3.2 $0.7 $1.3 $1.9 $2.6 $2.4 |
 Agenda Page 20 Outlook 20 Business performance 2 Growth opportunities 14 |
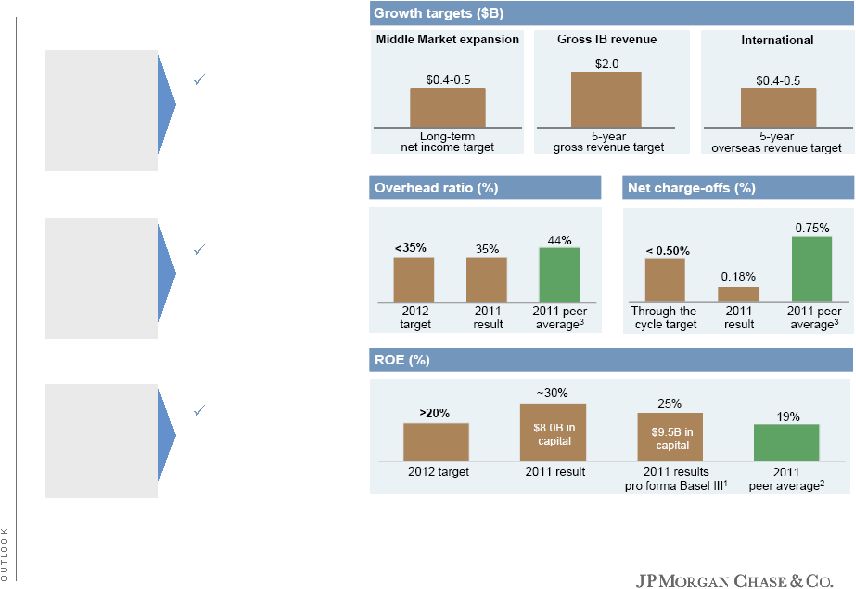 Our financial targets remain the same Outlook Overhead & credit costs Maintain risk and expense discipline 1 Illustrative 2011 ROE calculated based on $9.5B of common equity; CB common equity increased from $8.0B to $9.5B on 1/1/2012 to reach 8.5% Basel III Tier 1 common equity target ratio 2 ROE peer average reflects CB equivalent segments at BAC, KEY, PNC, USB 3 Peer averages for overhead ratio and NCO ratio include CB-equivalent segments or wholesale portfolios at BAC, CMA, FITB, KEY, PNC, USB, WFC Stand by ROE of >20%, even with more capital Growth Making progress towards long- term goals 21 Returns |
 Our core business principles remain the same Outlook Select strong companies in attractive industries with proven management teams Maintain long-term client relationships; average Middle Market relationship tenor is over 15 years Minimize concentrations in any industry or geography; maintain granularity Capitalize on JPMorgan Chase’s extensive and differentiated product suite to meet client needs Actively refer our customers to other LOBs Maintain expense discipline Manage variable expenses in downturns Only underwrite strong principals Stop when the market is irrational; return when market has rationalized Pre-determined market indicators in place Invest in new markets and businesses to expand presence and market share Aggressively cover target markets Client selection Deliver the entire firm Continuous investment in growth Expense management Manage real estate and cyclical exposures through-the-cycle 22 |
 Industry leading franchise with strong earnings and growth potential Takeaways Consistent strong financial performance Strength across all business segments High quality assets Rigorous risk management Expense discipline while steadily investing in the business with long term view Quality of our franchise positions us to grow Organic growth – Expanding footprint and deepening client relationships by differentiating products, solutions and services Synergies from the platform – Strong internal partnerships, product capabilities Quality and stability of people – Continue to deliver locally with confidence and conviction Well-positioned relative to peers against major market drivers and key trends Proven business model 23 |
 February 28, 2012 T R E A S U R Y & S E C U R I T I E S S E R V I C E S Mike Cavanagh, Chief Executive Officer Treasury & Securities Services ****** ****** ****** ****** ****** ****** ***** |
 Treasury & Securities Services is a great business State of the business Strong competitive position Deep and stable client relationships Global presence Worldwide Securities Services (WSS) ~2,600 significant clients 84% of Fortune 500 companies 650 clients with >$1mm in revenue Top 500 clients are ~80% of revenue ~1,500 significant clients 86% of top 50 global asset managers 3 400 clients with >$1mm in revenue Administer over 20,000 funds Treasury Services (TS) #1 global clearer of U.S. dollars #1 (tied) share leader in U.S. Large Corporate Treasury Management Market Penetration providers 2 #2 global custodian by AUC 4 with $16.9T Ranked #1 of the 5 largest providers 5 #2 in number of sponsored ADR shares 6 International revenue grew 22% in 2011 Conduct business in 66 countries; expanded capabilities in more than 20 countries Leveraging GCB expansion (75 bankers hired in 32 countries) Corporate clients with >$1mm in international revenue up 19% 62% of 2011 revenue outside North America Conduct business in 100 markets #1 in Luxembourg and #3 in Dublin offshore fund centers 7 Non-North America AUC up 14% in 2011 1 Federal Reserve, Clearing House for Interbank Payments (CHIPS), and Ernst & Young 2 Greenwich Associates, 2011 3 As ranked by Global AUM by Institutional Investor 4 JPM and competitor 4Q11 financial reports 5 Global Custodian, 2011 6 Various global exchanges, as of November 2011 7 Lipper’s 17th Annual Luxembourg & Ireland Fund Encyclopedias Capital friendly businesses, with scale benefits and high barriers to entry; steady revenue and earnings; strong long-term secular trends 1 1 |
 ($mm) 2010 2011 2011 YoY Growth Worldwide Securities Services $3,683 $3,861 5% Treasury Services 3,698 3,841 4 Revenue $7,381 $7,702 4 Expense 5,604 5,863 5 Pre-Provision Pretax $1,777 $1,839 4% Credit Costs (47) 1 NM Net Income $1,079 $1,204 12% Key Statistics Pretax Margin 23% 24% ROE 17 17 Avg. Liability Balances ($B) $248.5 $318.8 28% Assets under Custody ($T) $16.1 $16.9 5 International Revenue $3,624 $4,222 17% Avg. Liability Balances ($B) $146.4 $180.1 23 AUC ($T) $6.3 $7.1 14 EOP Trade Finance Loans ($B) $21.2 $36.7 73 Performance summary – Stable earnings with upside State of the business Key business drivers trending higher TSS average liability balances up 28% Non-North America AUC up 14%; total AUC at record level Number of funds serviced up 13% Global payment volumes up 4% International clearing volumes up 8% Trade loans (mostly international) up 73% Revenue up 7% YoY, adjusted for Card transfer TS revenue up 10% YoY, adjusted for Card transfer International revenue up 17% – APAC up ~$260mm, 26% YoY – EMEA up ~$270mm, 11% YoY Pre-provision pretax up modestly, including Continued investment, including the international build-out Exit costs taken to reshape business Effective January 1, 2011, the commercial card loan business of approximately $1.2 billion that was previously in TSS was transferred to Card. The prior-year periods were not revised Key financials 2 Comments |
 2011 Target 24% 35% +/- Reaffirming performance targets for the business Pretax margin Margin improvement opportunities International growth Normalization of interest rate levels 2011 Target 17% 25% +/- ROE 3 Margin impact / timing ~5% / 2012-14 ~6% / TBD |
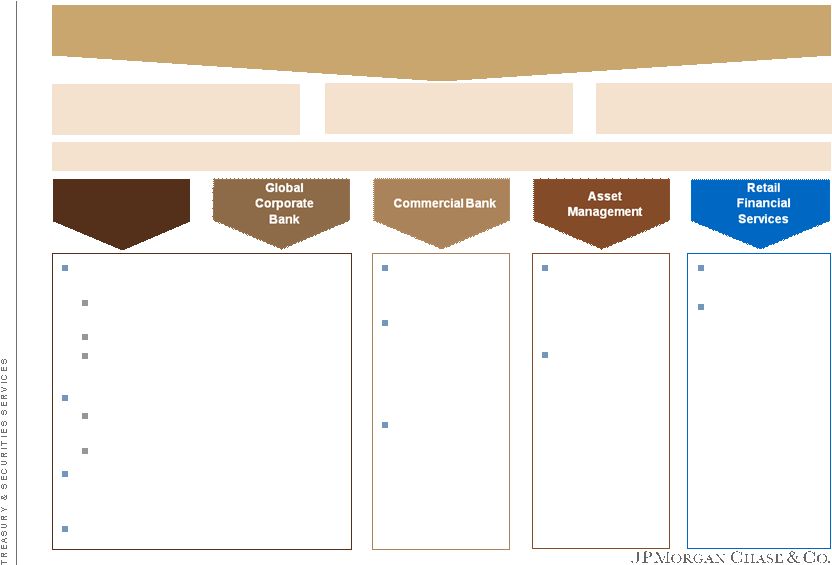 Leveraging firmwide capabilities will help deliver high top-line growth and higher margins Margin improvement initiatives can add 3-5% to TSS’ pretax margin 55% of revenue generated outside North America ~28,000 employees (~55% outside of U.S.) ~3,500 GCB significant clients Clients located in over 170 countries and territories around the world 75% of CB clients use Treasury Services products Leveraging cash management and trade finance platform in CB international expansion $2.3B in revenue in 2011 Strong firmwide relationships: 78% of top clients shared across the IB and TSS Enhanced firmwide strategic planning for largest clients $200B+ of global exposure to GCB clients Over 80% of 2011 TS firmwide revenue growth from GCB covered clients 1 Delivering differentiated solutions to clients Prime Custody; Collateral Management; Supply Chain Finance; Commodities Finance Largest USD clearer worldwide Value for Scale: leveraging platforms across IB/TSS (collectively $1.6B in expense across common areas) $1B+ multi-year investment plan to support expansion outside the U.S. TSS largest distribution channel for AM money market funds: ~ $90B as of 2011 Client referrals to WSS Leverage common DDA platform Consumer Business Banking clients use TS services ($215mm in 2011, up 10% YoY) Treasury & Securities Services 4 Investment Bank 1 Adjusted for Card transfer |
 Efficiency efforts will allow us to improve our margins while continuing to invest Margin improvement initiatives can add 3-5% to TSS’ pretax margin Automation and platform renovation Legacy consolidation/decommission Distributed operating model Virtualization/capacity on demand Redeveloping key platforms Optimize location strategy Less reliance on vendors Agile development methodology Increase technology efficiency Increased business volumes with modest application production support growth of 5% (CAGR ’07 to ’11) Custody volume (+8%) NAVs produced (+14%) OTC derivatives (+30%) Staff located in low cost sites (26% to 40%) 11% improvement in cost per head Improvement in quality of application functionality and time to market International expansion of core capabilities Improved collateral management capability Global asset servicing platform Global trade platform implementation Next generation cash management platform Invest in new development Development as a % of total spend increased from 60% to 73% Total development spend increased 20% (CAGR ‘07 to ‘11) Activities Key metrics Streamline fund accounting processes Receivables workflow automation Global payments process/self-servicing Process re-engineering 9% improvement in cost per NAV 100% improvement in checks processed per head 5 |
 Disciplined management of client profitability and non-core activities Margin improvement initiatives can add 3-5% to TSS’ pretax margin Exiting sub-scale businesses with no linkage to strategy and/or little growth opportunity Majority of financial impact already recognized Reevaluating select markets and client segments to exit those with unattractive risk/return profiles New client management structure with P&L accountability (regional) Historically product-led structure only Greatly enhanced client-level planning for largest TSS clients – Coordinated across the firm Redirecting resources, focusing on clients with good returns and growth potential Directing investment dollars aligned with client strategy and largest revenue opportunities Managing client profitability Focused on our core business 6 |
 We already have very successful global franchises in both TS and WSS International opportunities will help generate revenue growth and attractive margins WSS is our most global business WSS international revenue 2010-2011 ($mm) Over 13,000 employees, with over 9,000 people in 72 locations outside the US 42% of AUC from clients domiciled outside NA; 28% of AUC serviced outside NA Total = $3.9B TS international revenue 2010-2011 ($mm) 47% of TS revenue come outside North America Total = $3.8B Over 13,000 employees, with nearly 6,000 people in 90 locations outside the US 57% of liability balances outside NA; virtually all (96%) of trade assets are international 7 Growth 22% Growth 13% |
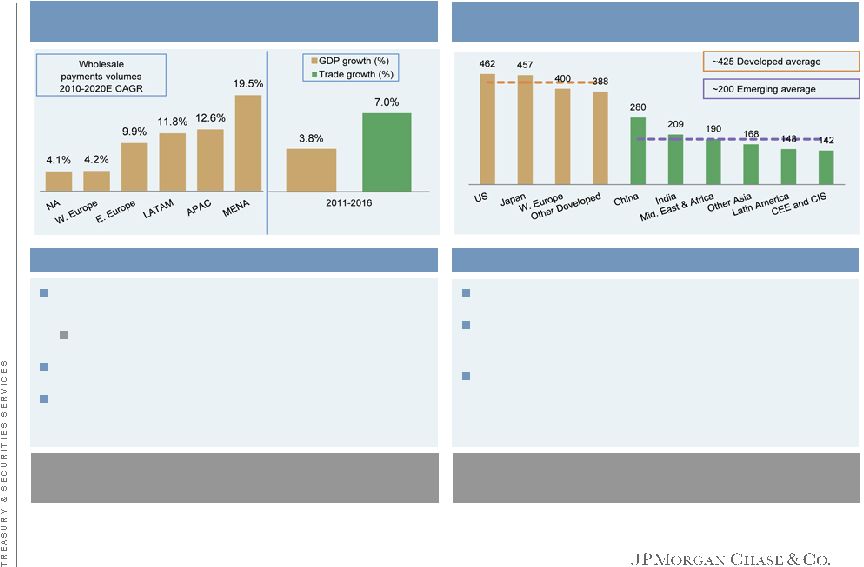 Secular trends will help further accelerate international growth International opportunities will help generate revenue growth and attractive margins Transaction Services and Trade Finance – positive long-term outlook Key drivers of TS growth Financial market depth as % of GDP 4 – Emerging markets are a big long-term opportunity TS will benefit from increasing cross-border economic activity WSS will benefit from deepening Capital Markets and changes in client behavior and needs Global investment flows are growing Need for retirement savings is increasing (e.g., aging population) Complexity is driving clients’ need for partner (asset servicing, margin pressures and regulatory changes) Key drivers of WSS growth Global payments are expected to grow 9% between 2010-2020E 1 Cross-border payments to grow 11% 1 Global trade growing at ~2x rate of GDP growth 2 Emerging markets account for 50+% of GDP growth and are the fastest growing markets for Payments and Trade 3 1 Boston Consulting Group 2 World Trade Organization 3 International Monetary Fund 4 Based on 2010 data. Depth of a country’s financial markets is a function of the aggregate value of outstanding bonds, loans, and equity relative to the country’s GDP. CEE is Central and Eastern Europe. CIS is Commonwealth of Independent States 8 Source: Boston Consulting Group, IMF estimates. MENA is Middle East North Africa Source: McKinsey Global Institute |
 2011 Highlights On-going investments (largely complete by the end of 2013) Largely sufficient capabilities based on client requirements Legend Opened our 6th branch in China (Harbin) and received permission for another one in Suzhou Opened expanded branches in Saudi Arabia and South Africa and rep offices in Qatar and Panama City Hired 75 Corporate Bankers in 32 countries Built Trade Finance capabilities in 9 countries Local capabilities to support GCB strategy will be largely established by 2013 Global Corporate Bank helping drive international growth across IB and TSS Panama City Ghana Kenya South Africa Argentina Chile Suzhou, China Russia Saudi Arabia Qatar Harbin, China Turkey Nigeria Colombia Invested $200mm to expand local lending and payment/deposit capabilities in 20+ countries Holistic effort looking at target client needs against firmwide product capabilities and infrastructure Long-term plan for building Sub-Saharan Africa – Starting from South Africa and Nigeria Branches (2011-2013) 9 |
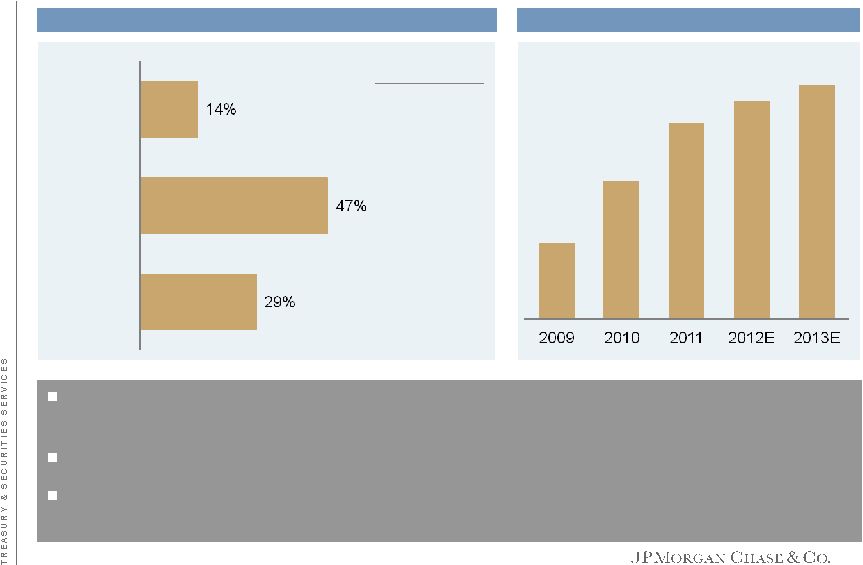 International revenue growing significantly and banker hiring close to completion Global Corporate Bank helping drive international growth across IB and TSS International revenue growth – FY11 vs. FY10 Cash and Liquidity Trade IB Markets with Corporates¹ 5 Year growth vs. FY2010 >100% >150% >100% 1 Markets include Commodities, FX, and Rates for Corporate clients only Bankers 98 177 252 ~285 ~300 Vast majority of revenue growth coming from deeper penetration of existing clients. More than half from cross-selling new products and/or new geographies On track to deliver $1B+ in incremental annual pretax across IB and TS by 2015 Investment spend largely complete by the end of 2013; positive contributor to profit growth and margin (over time) for TSS 10 |
 Client Need Achieve bank account rationalization across 15 countries in Asia Pacific JPM Solution Employed consultative and solutions based approach to propose optimized account structure Provided dedicated regional and in-country technical and implementation resources to manage deployment of the proposed solution over a 7-year period, while minimizing impact to existing operations Client Need Unlock value from its supply chain, manage counterparty risk and improve working capital management JPM Solution Implemented a $350 million structured receivables purchase solution across Europe, North America, Asia Pacific and the Middle East Reduced the client’s Days Sales Outstanding (DSO) from 30 days to between five and seven days Purchased more than $1.3 billion worth of receivables to date Client Need $3 billion financing, global liquidity and cash management JPM Solution Acted as Joint Bookrunner on Vale´s 5-year, $3 billion Revolving Credit Facility. The transaction set a record as the tightest priced Brazilian corporate deal since 2008 and was the first jumbo transaction in the 2011 Latin American syndicated loan market J.P. Morgan was also selected as Vale's global bank for USD liquidity and cash management Significant international wins in 2011 generate good momentum Global Corporate Bank helping drive international growth across IB and TSS Client Need Transition of $12.5bn of custodied assets to a captive asset management entity JPM Solution One of the largest and most complex transitions of its kind -- had to meet legal, regulatory and tax issues across 30 emerging markets Engaged the IB’s trading desk for execution JPMorgan was also retained as global custodian for the assets 11 |
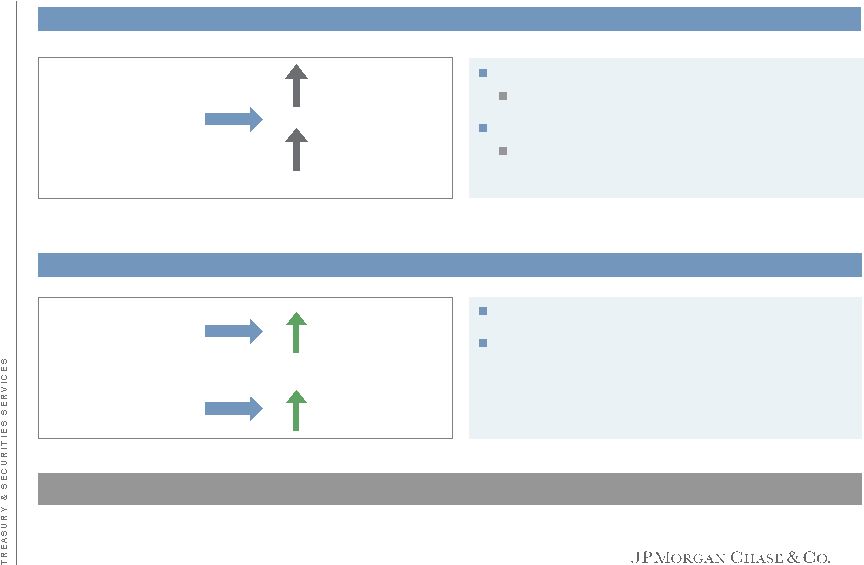 Low rates: limited additional downside (and a lot of upside), partly mitigated by balance growth Annual NII impact of higher rates Spread compression fully recaptured with ~200bp rise NII if rates stay flat over the next 12 months is negative ~$50mm Significant increase in deposit inflow since last year’s Investor Day Flight to safety balances Accommodating clients Franchise balance growth Largely international $40B franchise $60B flight to safety Overall balance growth of ~$100B 1-month rate rise of 100 bps +/- $350mm 10-year rate rise of 100 bps < $50mm Rate normalization alone would bring pretax margin to ~30% 12 |
 Regulation: driving incremental cost, largely in current run-rate Changes will require work Expense up significantly since 2008 Regulatory and compliance costs up ~$100mm FDIC expense up ~$170mm Managing at Basel III capital rules now Capitalized at 9%, with $7.5B in allocated capital New business evaluated using new hurdles and returns remain strong Basel III liquidity rules not final TSS is a positive contributor to liquidity for the firm Product and pricing enhancements likely (particularly for financial institutions) 130+ regulatory changes impacting the business In addition, heightened expectations relative to existing regulation It will increase the cost and affect the service that clients receive from banks Opportunity to distinguish ourselves Impact is largely in run-rate TSS is well positioned to adapt to higher regulatory burden and help clients as they face increasing complexity 13 |
 Closing thoughts: confident about the future Great businesses with good momentum coming out of 2011 Realizing margin improvement Leverage firmwide relationships, capabilities and coordination (client planning; Value for Scale) Focus on business profitability, core activities, and target clients Ongoing cost efficiencies within TSS Capturing significant international growth opportunities Strong global client relationships, but under-penetrated wallet Secular growth of underlying TS and WSS markets Navigating headwinds – Largely in current results, with upside Low interest rates Regulatory expense Reaffirming performance targets for the business 14 |
 February 28, 2012 A S S E T M A N A G E M E N T Mary Erdoes, Chief Executive Officer Asset Management * * * * * * * * * |
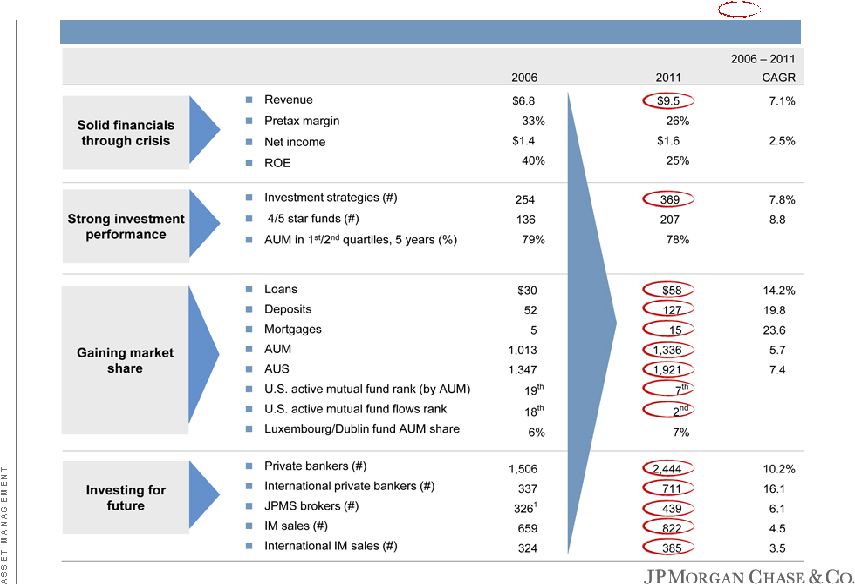 Asset Management: a very strong business even through the crisis 1 Post Bear Stearns merger ($B, unless otherwise noted) Record 1 |
 Global Asset Management Asset Management framework: designed for disciplined management and client focus in a complex and changing environment Global Wealth Management Operating Committee Global Investment Management Operating Committee Highbridge Board Global Private Bank Private Wealth Management JPMorgan Securities Global Institutional Global Retail Investment Products Hedge Funds Principal Strategies Gávea Investimentos Finance Human Resources Risk Audit Legal Assets under supervision $1.92T Global employees 18,000+ Investment professionals ~1,300 Investment strategies 350+ Compliance Technology & Operations Investment Committee Risk Committee 4% 7% 4% 13% 2 |
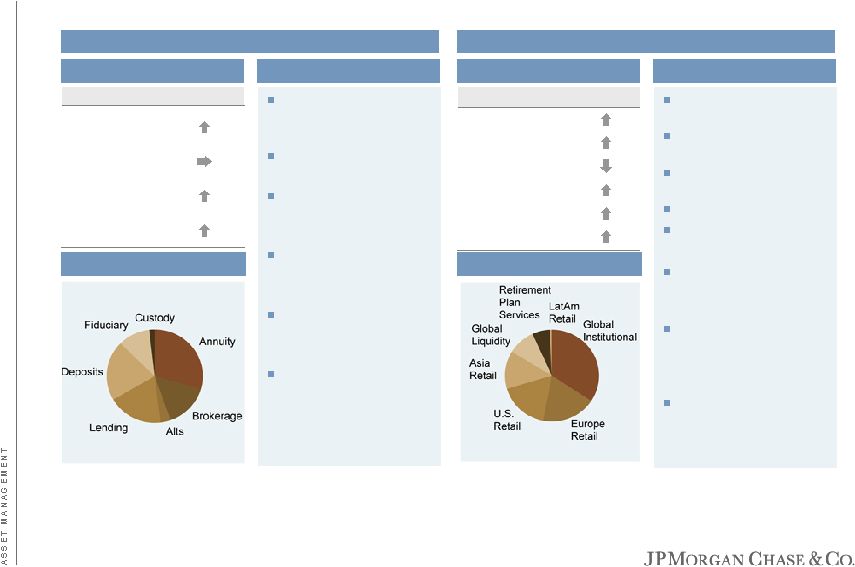 Breakdown by product Channels Revenue PB U.S. PWM PB International JPMS Products Revenue Equity Fixed Income Global Cash Global Real Assets PE / HF HB/Gávea J.P. Morgan Asset Management overview 9 consecutive years of Private Banking revenue growth 8% front office growth (21% internationally) International revenue growth in Private Bank (11%) stronger than the U.S. (3%) Euromoney – #1 Global Private Bank UHNW, #1 U.S. HNW Private Bank Financial Times – Best Global Brand in Private Banking Growth agenda focused on international expansion and high net worth markets globally Global Wealth Management Global Investment Management 15% U.S. active, long-term fund AUM growth Eleven consecutive quarters of positive long-term flows Positive flows into every asset class Alternatives revenue up 21% Largest Brazil focused private equity fund European Pensions – Institutional Hedge Fund Manager of the Year The Asset – Asia and Hong Kong – Best Asset Management Company of the Year Growth agenda focused on channel expansion across global retail, retirement, and insurance Breakdown by channel GWM: revenue up 5% Observations GIM: revenue up 4% Observations Note: Growth rates are year-over-year 3 |
 Power of the platform: our model fully leverages the firm’s global platform and financial solutions Treasury & Securities Services Investment Bank Commercial Bank Retail Financial Services J.P. Morgan Asset Management Corporate/ Private Equity Card Services & Auto Synergies of over $1B across LOBs Leveraging the JPMorgan Chase franchise Synergies account for over 10% of JPM AM revenue Securities offerings, structured products and trade execution offered to Private Banking clients $590mm in 2011 firm revenue IB referrals to AM: $80mm in 2011 revenue AM manages $90B of AUM for TSS clients $140mm in 2011 firm revenue TSS provides custodial and transfer agency services to AM Referrals in both directions $15mm in 2011 firm revenue Investment Management products offered to Commercial Banking clients AM manages $120B of AUA for CB clients $370mm in 2011 firm revenue CB referrals to AM: $70mm in 2011 revenue AM products offered to RFS clients through Chase branches $40B in AUM $510mm in 2011 firm revenue JPM is one of the fastest growing providers of unified managed accounts Banking to CB Credit cards issued to Private Banking clients Corporate provides asset and liability management to AM 4 |
 Drivers of our business: investment performance is first, everything else second Absolute Relative Risk-adjusted Investment performance Market levels/rates Banking/lending Brokerage activities Global markets Actual average flows growth of 5% over 7 years Revenue CAGR of 9% since 2005 Outperformance Innovation Global presence Net flows Portfolio managers Research analysts Traders Investing Risk management T&O/efficiencies Controls Platform Rigorous expense management Continuous reinvestment 6-year CAGR of 10% Metrics based sales coverage New markets/channels Solutions/advice Distribution 7-year average of 31% Margin Target of 35% + + Expense Managed to margin target over cycle Revenue Target flows +5% 5 |
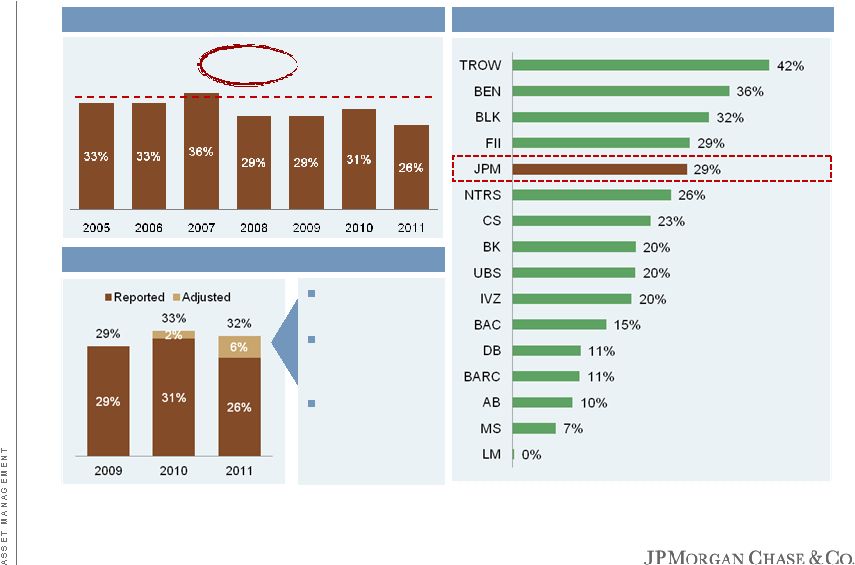 Overall AM: adjusting margin exceeds target in most years; margin is at high end of peers JPM AM pretax margin 3-year average margins Pretax margin: investments in people and technology Net new front office talent Net new technology initiatives Non-client litigation Target: 35% Based on J.P. Morgan estimates 6 |
 Overall AM: solid margin business Global Wealth Management – FY 2011 pretax margin Median: 16% Median: 26% Based on J.P. Morgan estimates 1 Adjusted JPM IM margin includes Highbridge, Gávea and one-time items 36% 1 Global Investment Management – FY 2011 pretax margin 7 |
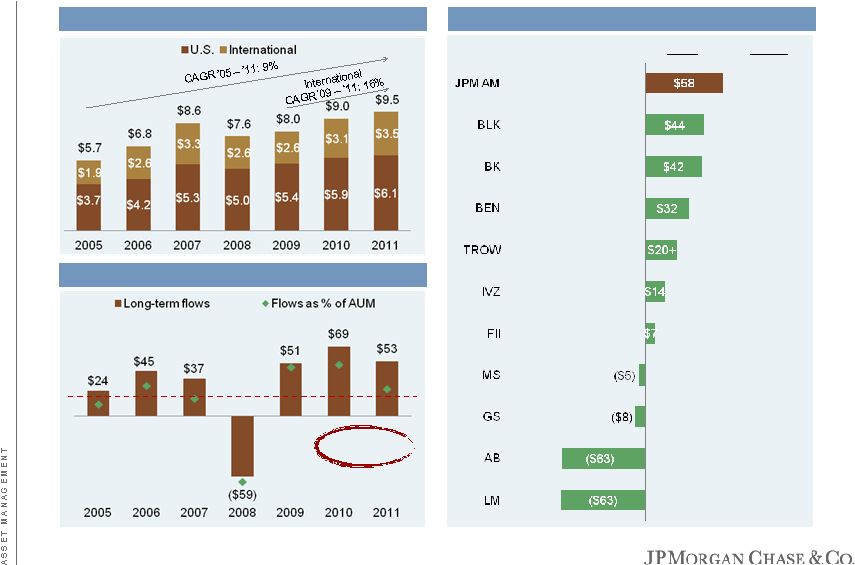 Overall AM: flows very strong, revenue growth in top half of competitors Revenue trend ($B) Long-term flows & flows as % AUM Long-term flows: 3-yr average flows ($B) & growth rate LT AUM flows target: 5% ($B) 10% 4% 7% (2%) 7% 8%+ 5% 12% (2%) (17%) (13%) Flows Growth 7% 7% 4% 5% (7)% 10% 10% Based on J.P. Morgan estimates 8 |
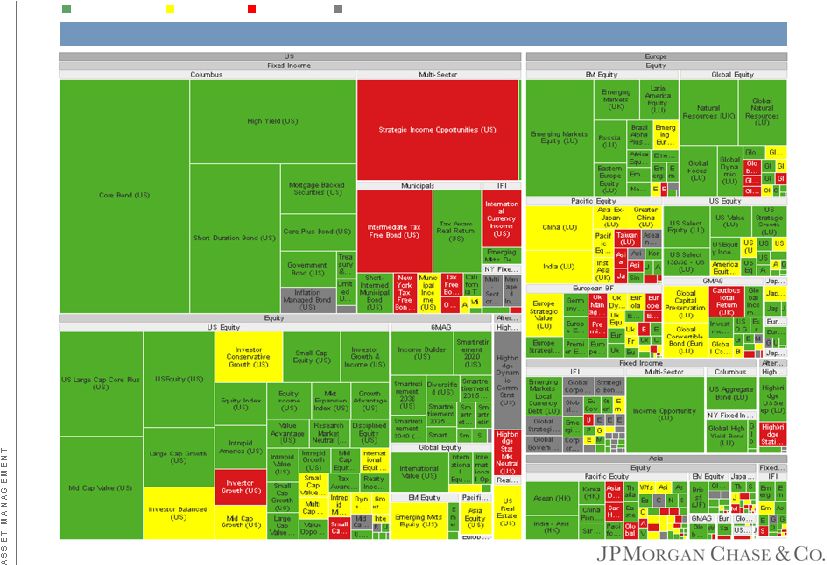 Diverse sources of alpha leads to consistent flows, globally (mutual funds only) Performance: 3-year Top 2 quartiles 3rd quartile 4th quartile No track record 9 |
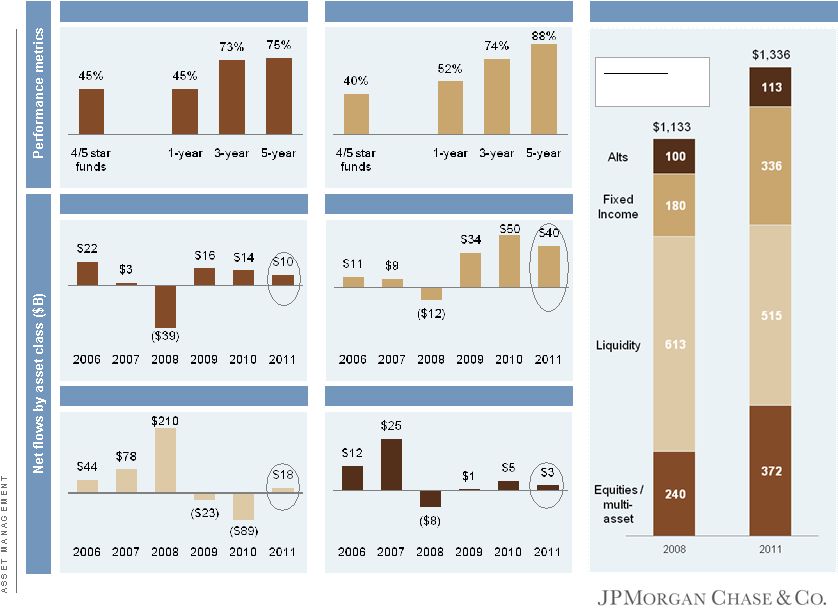 Alternatives Liquidity Over 70% of long-term AUM exceeds median, driving robust flows Fixed Income Equities and multi-asset Equities and multi-asset Fixed Income AUM growth and mix ($B) Total AUM in 1 st /2 nd quartiles AUM growth 2008 – 2011: 18% CAGR: 6% (16)% 55% 13% 87% Total AUM in 1 st /2 nd quartiles 10 |
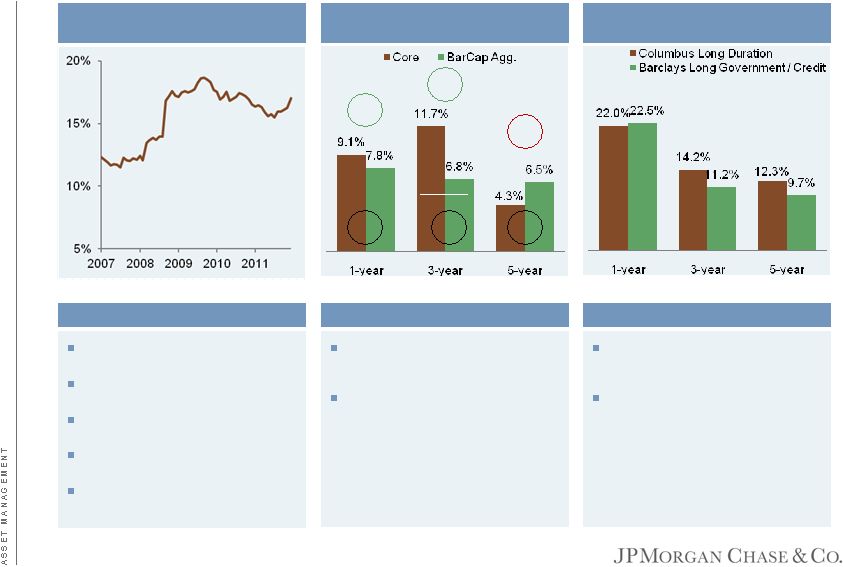 Top quartile eVestment rankings for 1, 2 and 3 years, through risk-on and risk-off environments Growing recognition from global consultant community; critical to securing institutional sales $8.4B in Long Duration AUM ($10.5B counting unfunded commitments), up from $4.9B in 2010, and $1.9B in 2008 Expanding advisory capabilities to position liability driven investing (LDI) in broader asset allocation discussions Meaningful SEC changes since 2008 have reformed the industry Continued debate on regulatory changes unresolved Floating NAV possible, and already part of J.P. Morgan’s suite of products Risk aversion ebbing but heightened focus on credit risk remains Continued demand globally for J.P. Morgan cash products Fixed Income & Liquidity: multiple engine platform Observations Observations Observations New York, London, Asia Fixed Income – Core (NY) Columbus Fixed Income – Long Duration Institutional money fund market share 1.3% 4.9% 3.0% 2.6% (0.5)% (2.2)% Last year 5.1% (2.8)% (2.3)% Performance figures from eVestment Note: Annualized performance results are as of December 31, 2011 and gross of fees Source: iMoneyNet 11 |
 Globally diverse active equity platform Note: Annualized performance results are as of December 31, 2011 and gross of fees 1 Performance net of fees Select Share Class J.P. Morgan Fund Benchmark 12 |
 Solution and product innovation Pre 1970’s 1970’s 1980’s 1990’s 2000’s 2010’s Alternatives Sale-leasebacks Direct real estate Private equity Commodities Highbridge Capital Management Hedge fund of funds Security Capital/REITs Highbridge Principal Strategies Hedge fund customization and advisory Asian/European real estate OECD/Asian infrastructure Gávea Investimentos Digital growth China JV Opportunistic U.S. real estate Maritime Infrastructure debt Equities: from core to alternatives Core equity International equity Japan equities Emerging markets equities Jardine Fleming/Asian equities Dividend discount model Enhanced index Market neutral Long/short equity Behavioral finance European style Thematic portfolios Equity China JV Structured notes Managed volatility Unconstrained equity Fixed Income: from core to alternatives Money market Core fixed income International fixed income Private mortgages Distressed debt High yield Long duration Stable value Currency Muni private placements Insurance Emerging markets LDI Inflation strategies Absolute return Multi-sector Bank loans Unconstrained fixed income Alternative benchmark strategies Asian credit Hedge funds Multi-asset solutions Balanced portfolios Tactical asset allocation Global multi-asset capabilities Target date Glide path advisory Global absolute/total return Global Access Portfolios Opportunistic/ Thematic Advisory Solutions Risk managed portfolio Merger arbitrage Local Investors New York London Hong Kong Tokyo Moscow Melbourne Singapore Seoul Taipei Paris Frankfurt Columbus Los Angeles Houston Luxembourg Rio de Janeiro Sao Paolo Mumbai Boston Cincinnati Indianapolis San Francisco Chicago Shanghai Beijing 13 |
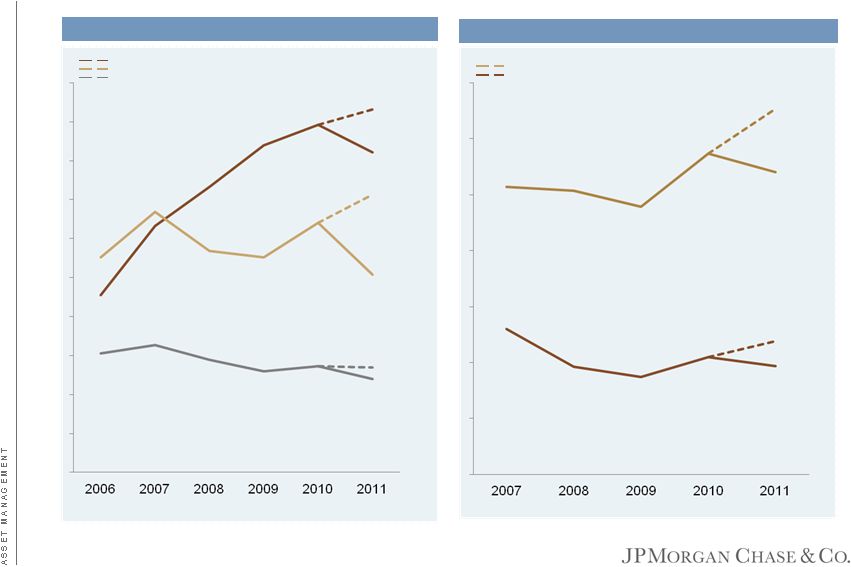 GWM revenue per client advisor Examples of expense measurement and discipline GIM revenue per client advisor PBUS PBI PWMUS Global Retail Without expansion Without expansion Global Institutional 14 |
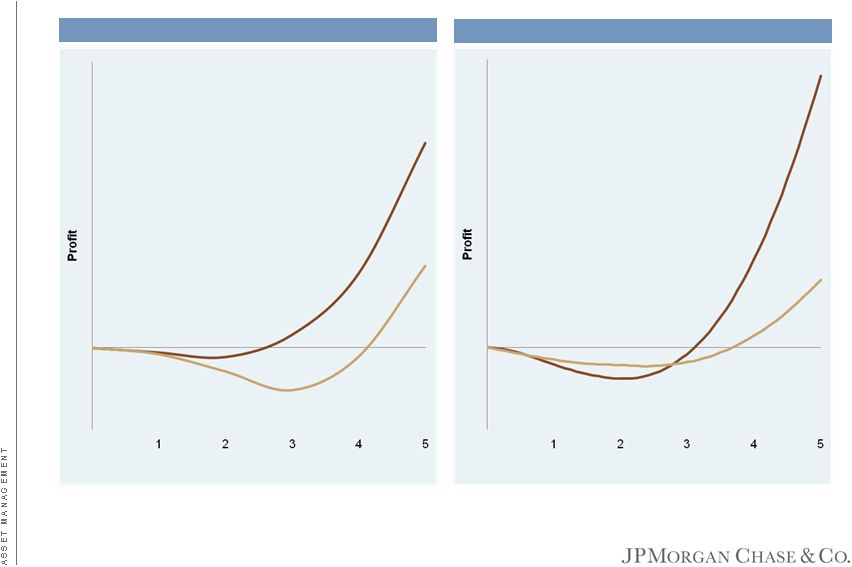 Investment return periods differ by market and channel GIM cumulative expansion payback periods GWM cumulative expansion payback periods Year of investment Year of investment International PB market U.S. PB market U.S. institutional market International institutional market 15 |
 Risk management of loan book Constant monitoring of risk, retention and regulations Risk management of the jumbo mortgage book Regulations Top talent retention rate Dodd Frank Volcker Rule Derivatives Money market funds Floating NAV Capital requirements Form PF Proposed reporting requirements for private funds Target: 95% 16 |
 Closing thoughts J.P. Morgan Asset Management “…at all times the idea of doing only first-class business, and that in a first-class way” – John Pierpont Morgan, Jr.,1933 Strong investment performance Constant innovation Continued investment in the business Disciplined expense management Continued revenue growth High ROE/margin business 17 |
 February 28, 2012 I N V E S T M E N T B A N K Jes Staley, Chief Executive Officer Investment Bank * * * * * * * |
 Agenda Page 1 Performance 1 Markets 4 Business highlights 13 |
 2011: strength amidst volatility Performance Near record performance Revenue: $26.3B Earnings: $6.8B (second highest) ROE of 17% on capital of $40B Further strengthened fortress balance sheet (Tier 1 common ratios) Basel II: 13.7% Basel III: 8.4% Sustained Investment Banking leadership #1 in Global IB Fees (third consecutive year): 8% market share 1 Record loan syndication revenue, advisory fees up 22% Fixed Income: historic high revenue market share, 17% 2 Equities: record results Commodities: complete franchise 1 Dealogic 2 Estimated using public disclosure of top 10 competitors, excluding DVA 2 |
 Strategic initiatives: 2011 progress and 2012 momentum Performance Clients Disciplined, sustained focus Capital/risk management Prudent capital management Continued focus on regulation Efficient capital usage Control during volatility Repositioning ahead of new regulations Technology Strategic Reengineering Program: over 50% complete, on target Doubled electronic equity internalization Further reduced errors and cost per trade Execute Strategic Reengineering Program Rationalize IB/TSS costs and execution (Value for Scale) Deliver cross-asset platforms for innovation International Formed International Steering Committee Expanded Markets footprint in 20 countries Launched EMEA Prime Brokerage TS/IB Markets growth with corporates Add local market capabilities Build Asia Prime Brokerage Commodities Achieved targets, increased client activity Completed Sempra integration Maintain leadership Grow developing markets franchise 2011 2012 3 |
 Agenda Page 4 Markets 4 Performance 1 Business highlights 13 |
 Credit, rates and currencies drive the global financial markets Markets Source: Federal Flow of Funds, Bloomberg, IMF, Bank for International Settlements, CBRC, CSRC, Thomson Reuters, SIFMA, McKinsey Global Institute Note: “Gross U.S. equity and long-term debt issuance” and “Daily average U.S. trading volume” graphs not shown to scale 1 Municipal, Treasury, MBS, Corporate Debt, and Federal Agency securities 2 Daily average value traded by the NASDAQ and NYSE Non-bank financial assets outpacing growth of traditional sources of capital… …and Fixed Income markets continue to dominate Equities Fixed Income¹ Equities² Daily average U.S. trading volume ($B) Banks/Govs. (J.P. Morgan, Fannie Mae, etc.) Non-bank financials (MFs, Insurance, HFs, etc.) Financial assets (% of GDP) Fixed Income¹ Equities Gross U.S. equity and long-term debt issuance ($T) Capital by source (% of GDP) Public Financial Markets Banks/Govs. As countries develop, banks/govs. are replaced by public market growth Global financial assets are expected to nearly double over the next 10 years 5 |
 Our client franchise is large, diversified and global Markets Other Financials 8% Insurance 4% Corporates 13% Broker-dealers 7% Hedge Funds 23% Asset Managers 29% Banks 16% ~16,000 markets clients 1 1 Other Financials includes public sector, pension funds, private equity, and SPVs Latam 2% Asia 10% North America 55% EMEA 33% Latam 4% Asia 9% North America 68% EMEA 19% ~5,000 issuer clients Public Finance 3% Tech, Media, Telecom 18% Real Estate 7% Natural Resources 23% Healthcare 11% FIG 14% Diversified Industrials 13% Consumer & Retail 11% 6 |
 We have unmatched scale, diversification and leadership Markets Source: Dealogic, Coalition Note: Coalition competitor set: BAC, BARC, C, CS, DB, GS, MS, and UBS 1 Fixed Income and Equities ranking as of 3Q YTD 2011 (Coalition – Revenue); Banking rankings are FY 2011 (Dealogic – Volume) 7 Scale Diversity Leadership Primary and secondary issuance Loan syndication Treasuries, agencies, swaps, futures, options Mortgage and asset backed securities Non G-10 rates, credit, FX Corporate bonds, loans, credit swaps, index products Swaps, futures, options, physical transactions Spot foreign exchange swaps, futures, options Rates and credit High touch execution Swaps, options, convertibles Financing, execution, clearing Margin financing, structured notes 2,500 salespeople 2,000 traders 2,000 bankers 800 research analysts 4,000 control and risk professionals 13,000 tech. & ops. professionals 40 countries 110+ trading desks 20 trading centers IB revenue (typical quarter) How we operate Industry rankings Descriptions 100% Rates Securitized Products Emerging Markets Credit Trading Commodities FX Structured Cash Derivatives Prime Services Structured Long-term Debt Equity Underwriting Advisory Syndicated Loans Bond underwriting Low touch execution (electronic) Public Finance Municipal debt trading and issuance M&A, Corporate Finance advisory 3 #2 4 3 1 1 1 3 1 2 1 3 2 8 4 9 1 2 N/A # 1 1 1 2 3 2 2 1 5 2 3 N/A N/A 3 2 N/A # 3 2 2 1 3 1 3 1 5 2 8 4 9 3 2 N/A 2009 2010 2011 1 |
 Flow driven Markets business Markets Rates Securitized Products Emerging Markets Credit Trading Commodities FX Structured Cash Derivatives Prime Services Structured Structured Flow Structured Fixed Income Equities Flow Structured 100% 100% 100% Public Finance 8 |
 High volume Markets business model with standardized products Markets Note: Quantity, average revenue and total revenue are estimates based on typical quarter; revenue per quarter rounded Interest Rate Swaps FX Spot/Forwards Asset Backed Securities Credit Trading Energy Trading F&O and OTC clearing Cash Equities (N.A.) Equity Swaps and Options Examples of major trading products 350 350 300 375 250 150 150 200 Revenue per quarter ($mm) x = Financing 150 Loan Trading 12,000 70 10,000 1,500 5,000 40 cents per lot 1.5 cents per share 30,000 Average revenue ($ per trade) 1,500 10,000 100 30,000 5,000,000 30,000 250,000 50,000 350mm lots 10B shares 6,000 Quantity per quarter (# of trades) 100,000 10,000 FX Options 100 600 150,000 Governments 200 2,500 75,000 Cash Equities (EMEA/Asia) 175 8bps $200B notional Metals Trading 75 600 140,000 Agencies 75 7,000 11,000 9 |
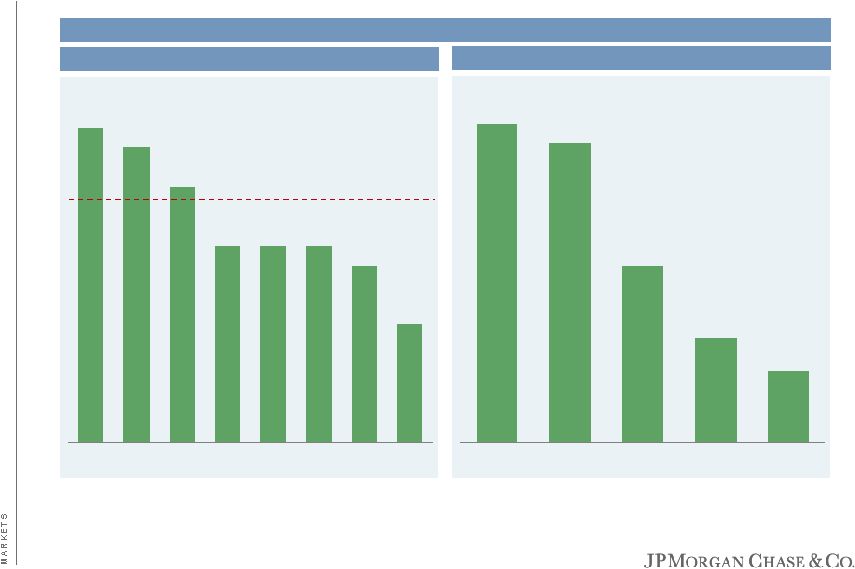 98% 97% 95% 92% 92% 92% 91% 88% Financial Basic materials Tech. Industrial goods Health care Utilities Consumer goods Services Over 90% of the Global Fortune 500 use swaps, futures, and options Markets Total usage across all industries: 94% Source: ISDA 2009 Survey 88% 83% 49% 29% 20% FX Interest rate Commodity Equity Credit Global Fortune 500 Usage by product Usage by industry 10 |
 Scale driven Markets business model Markets 0.08% 0.06% 0.2% 0.6% 1.2% 98% $0-$50K $50K-$100K $100K-$250K $250K-$500K $500K-$1mm $1mm+ Estimated % of total client trades by average revenue per trade (FY 2011) Note: Represents Fixed Income business High volume (~100,000 daily trades) Low spread Low volume (~10 daily trades) High spread % of Total Revenue 75% 25% 11 |
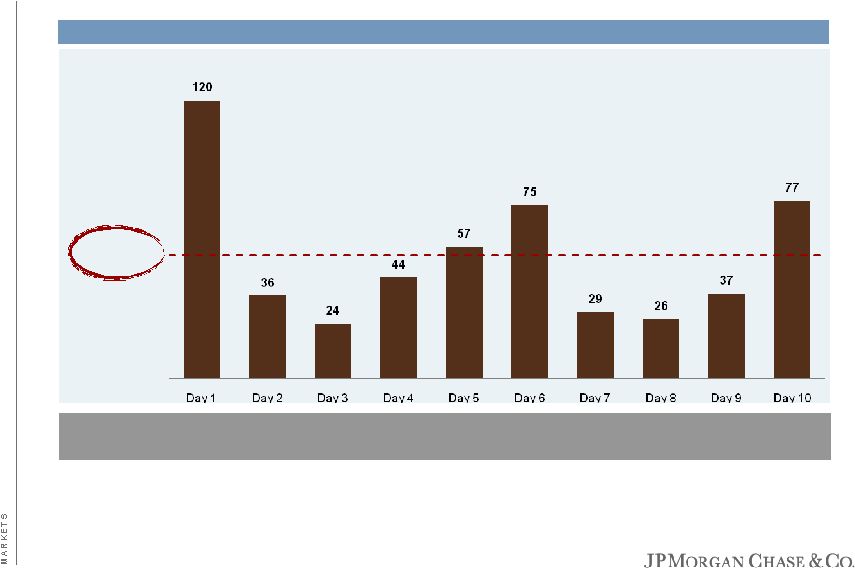 High turnover Markets business model Markets Case study – North America interest rate swaps daily turnover metrics Average daily turnover: 53 Note: Turnover defined as daily DV01 risk traded divided by starting DV01. DV01 is the risk position for a desk (amount of money desk makes or loses on a one basis point move in the yield curve); actual two-week period in 2011 Client businesses carry little risk inventory and turn their positions multiple times a day 12 |
 Agenda Page 13 Business highlights 13 Performance 1 Markets 4 |
 Well positioned to adapt to regulation Business highlights Impact Clearing and Swap Execution Facilities (SEFs) Non-Bank Subsidiary (NBS) swap “push out” Pushing-out portions of below investment grade CDS, equity and commodities derivatives No significant revenue or capital changes expected Volcker Ban on Bright Line proprietary trading Immaterial revenue impact Not a large business Limits market making/hedging ability Mandated clearing Meaningful volumes Lesser revenue impact Concerns Complicates risk management Extraterritoriality: potential impact to scope Could limit liquidity Clients Markets Compliance emphasis may impact costs Unresolved: end-user margin/extraterritoriality Concentration of exposure to central counterparties Strengths Operational excellence: depth of experience managing complex migrations Long-track record of client- focused business model Competitors may need to re-orient their businesses Competitive advantage by being a scale player with existing connectivity and access to SEFs Strong governance programs in place to address regulatory change: 500 people; 65+ projects 14 |
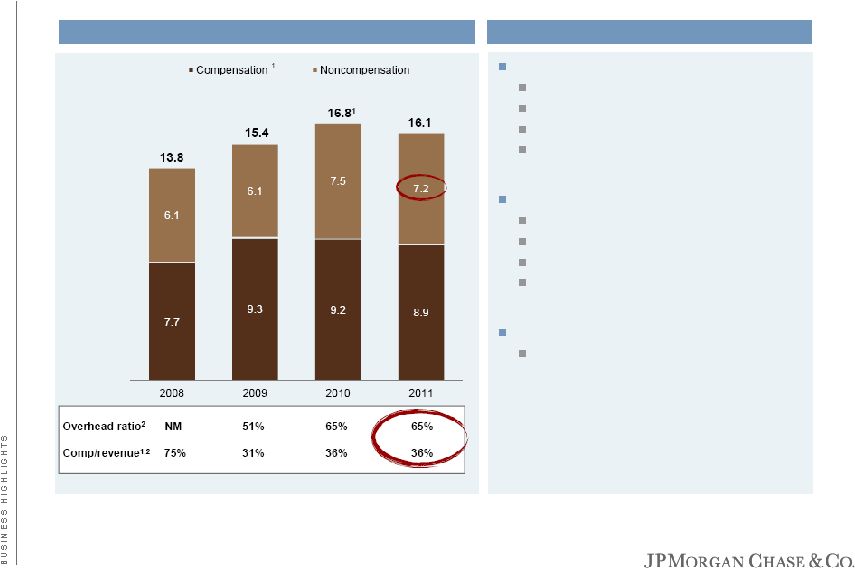 1 2010 compensation expense excludes $0.5B of U.K. payroll tax 2 Overhead and comp/revenue ratios exclude DVA impact Expense discipline enables investment capacity Business highlights Disciplined expense management Total expense down 4% Focus on operating efficiency Best-in-class overhead ratio Lowest comp/revenue ratio Continued investment capacity Strategic Reengineering Project (SRP) International expansion Commodities execution International Prime Brokerage Value for Scale Synergies across wholesale businesses Highlights J.P. Morgan IB expense ($B) 1 15 |
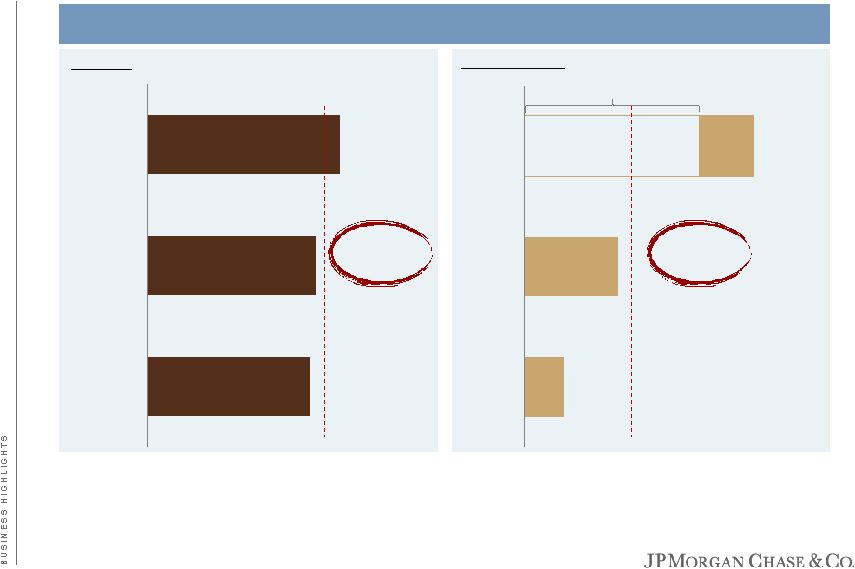 Global Corporate Bank: contributing to IB Markets and Treasury Services Business highlights 1 Excludes non-recurring items 32% 28% 27% Rates FX Commodities¹ 19% 8% 35% Trade Liquidity Core cash Trade loan growth 47% revenue growth ~29% growth YoY ~22% growth YoY 2011 international revenue with corporates IB Markets Treasury Services 16 |
 Leveraging the J.P. Morgan platform Business highlights Expanded client coverage/footprint with Global Corporate Bank Increased credit extension and product penetration IB recognized fees for 147 debt and 77 equity deals for CB clients in 2011 $1.4B gross revenue in 2011 41 new Private Bank clients from IB referrals 71 Private Bank referrals to the IB Expanding international referrals and syndication access Treasury & Securities Services Commercial Banking Investment Bank CB 50% AM 32% TSS 18% IB cross-LOB gross revenue share ($B) J.P. Morgan 2011 total: $2.7B Leveraging the wholesale platform 17 |
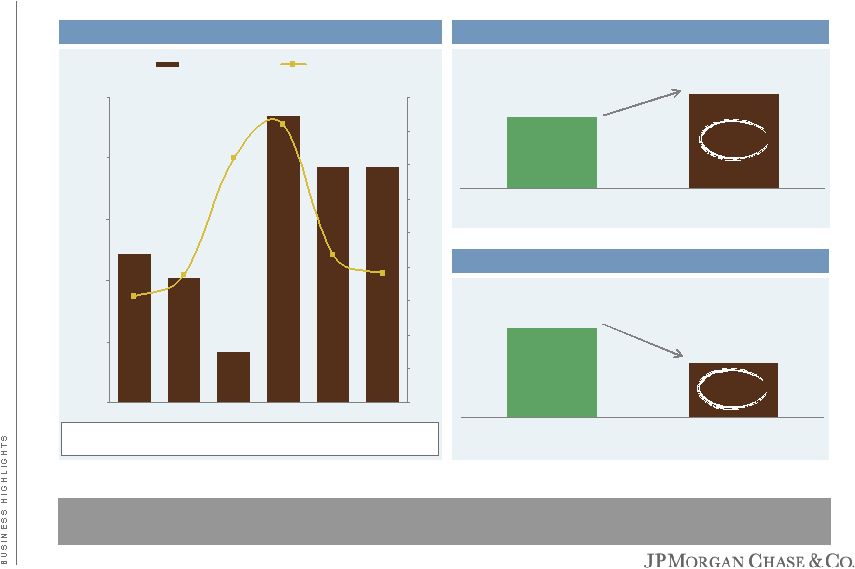 Proven risk management capability Business highlights J.P. Morgan Markets revenue and VaR ~30% higher revenue than peers with ~40% less volatility Note: Revenue excludes DVA; peers: BAC, BARC, C, CS, DB, GS, MS and UBS 1 Estimated using public disclosure of top 10 competitors, including DVA 2 Volatility equals standard deviation as a percentage of the period average 19.3 19.3 23.5 4.2 10.2 12.2 0 5 10 15 20 25 2006 2007 2008 2009 2010 2011 0 20 40 60 80 100 120 140 160 180 JPM Markets revenue JPM VaR $B $mm Average revenue over past 12 quarters 40% 25% Peers J.P.Morgan Markets revenue volatility2 of past 12 quarters $3.9 $5.2 Peers J.P.Morgan JPM ~40% less than peers JPM ~30% greater than peers 8% 9% 10% 13% 12% 14% Market share1 18 |
 Fortress balance sheet and prudent capital management Business highlights Allocated equity ($B) Basel III Tier 1 common ratio 40 8.4% 2012 walk forward ($B) Risk Weighted Assets (based on Basel III) 4Q12 glidepath $413 4Q11 actual $467 4Q10 actual $550 40 7.2% Note: 2012 RWA reduction is a combination of legacy asset roll-off, risk adjustments, and continued RWA management discipline ($54) 40 9.5% 19 |
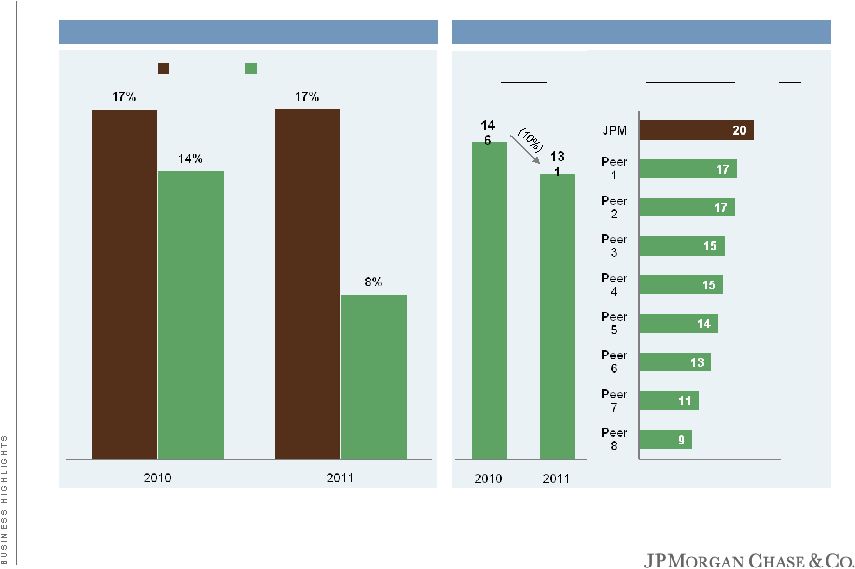 JPM Investment Bank ROE vs. peers Markets revenue (Equities and FICC, $B) Consistency of results Business highlights JPM IB Peer average1 Source: Company filings 1 Peer average ROE excludes firms without sufficient IB segment-level disclosure 2 Adjusted for non-recurring items Industry Individual firms YoY (25%) 36% (16%) (15%) (21%) 2% 1% (30%) (3%) 2 2 20 |
 17% 17% 17% 21% (5%) 15% 18% 18% 2005 2006 2007 2008 2009 2010 2011 Target Performance and outlook Business highlights We are holding 17% target going forward Headwinds to consider Regulatory burden Global market uncertainty Tougher RWA calculations Sustained low interest rate environment Key drivers Scale and diversity of franchise Market leadership Growth initiatives Disciplined expense management Strong capital position Outlook 17% +/- Allocated capital ($B) 20 21 21 26 33 40 40 40 J.P. Morgan IB ROE 21 |