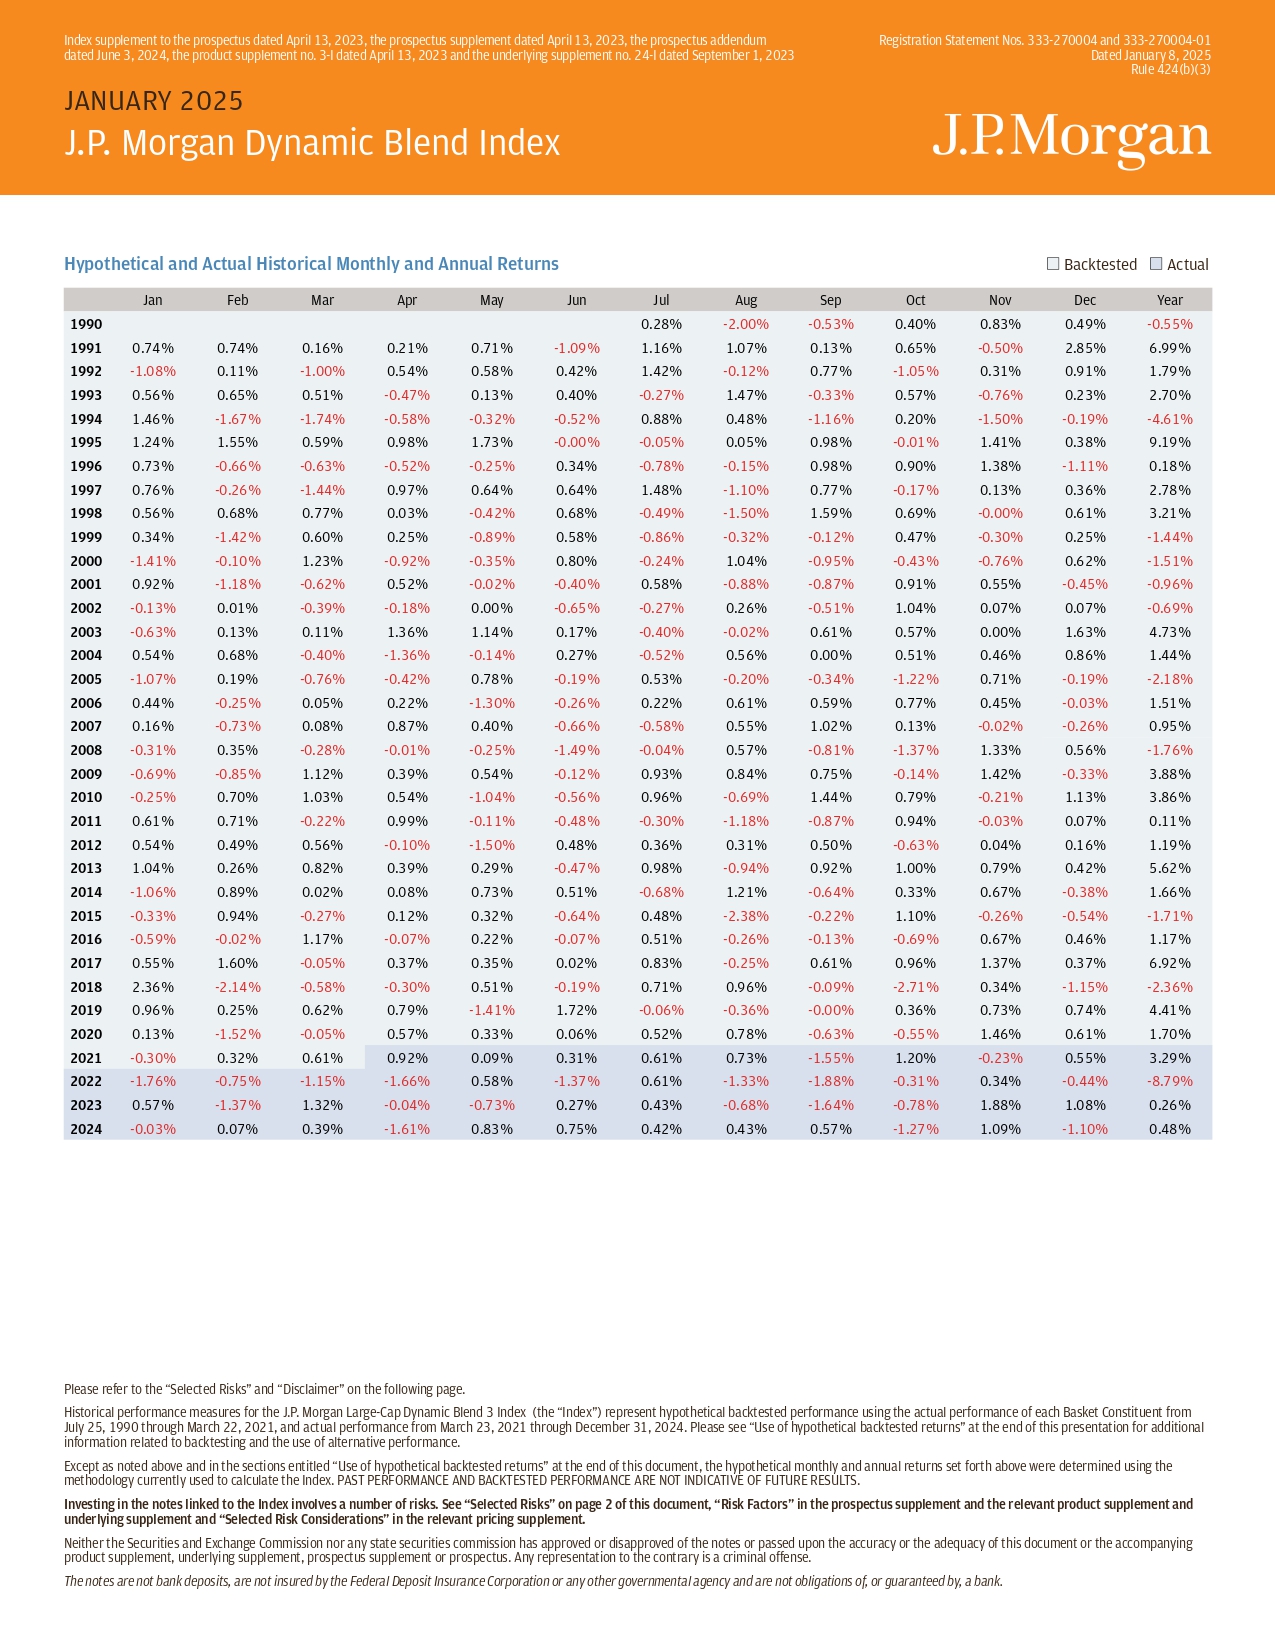
Index supplement to the prospectus dated April 13, 2023, the prospectus supplement dated April 13, 2023, the prospectus addendum dated June 3, 2024, the product supplement no. 3 - I dated April 13, 2023 and the underlying supplement no. 24 - I dated September 1, 2023 Registration Statement Nos. 333 - 270004 and 333 - 270004 - 01 Dated January 8, 2025 Rule 424(b)(3) Hypothetical and Actual Historical Monthly and Annual Returns Backtested Actual Year Dec Nov Oct Sep Aug Jul Jun May Apr Mar Feb Jan - 0.55% 0.49% 0.83% 0.40% - 0.53% - 2.00% 0.28% 1990 6.99% 2.85% - 0.50% 0.65% 0.13% 1.07% 1.16% - 1.09% 0.71% 0.21% 0.16% 0.74% 0.74% 1991 1.79% 0.91% 0.31% - 1.05% 0.77% - 0.12% 1.42% 0.42% 0.58% 0.54% - 1.00% 0.11% - 1.08% 1992 2.70% 0.23% - 0.76% 0.57% - 0.33% 1.47% - 0.27% 0.40% 0.13% - 0.47% 0.51% 0.65% 0.56% 1993 - 4.61% - 0.19% - 1.50% 0.20% - 1.16% 0.48% 0.88% - 0.52% - 0.32% - 0.58% - 1.74% - 1.67% 1.46% 1994 9.19% 0.38% 1.41% - 0.01% 0.98% 0.05% - 0.05% - 0.00% 1.73% 0.98% 0.59% 1.55% 1.24% 1995 0.18% - 1.11% 1.38% 0.90% 0.98% - 0.15% - 0.78% 0.34% - 0.25% - 0.52% - 0.63% - 0.66% 0.73% 1996 2.78% 0.36% 0.13% - 0.17% 0.77% - 1.10% 1.48% 0.64% 0.64% 0.97% - 1.44% - 0.26% 0.76% 1997 3.21% 0.61% - 0.00% 0.69% 1.59% - 1.50% - 0.49% 0.68% - 0.42% 0.03% 0.77% 0.68% 0.56% 1998 - 1.44% 0.25% - 0.30% 0.47% - 0.12% - 0.32% - 0.86% 0.58% - 0.89% 0.25% 0.60% - 1.42% 0.34% 1999 - 1.51% 0.62% - 0.76% - 0.43% - 0.95% 1.04% - 0.24% 0.80% - 0.35% - 0.92% 1.23% - 0.10% - 1.41% 2000 - 0.96% - 0.45% 0.55% 0.91% - 0.87% - 0.88% 0.58% - 0.40% - 0.02% 0.52% - 0.62% - 1.18% 0.92% 2001 - 0.69% 0.07% 0.07% 1.04% - 0.51% 0.26% - 0.27% - 0.65% 0.00% - 0.18% - 0.39% 0.01% - 0.13% 2002 4.73% 1.63% 0.00% 0.57% 0.61% - 0.02% - 0.40% 0.17% 1.14% 1.36% 0.11% 0.13% - 0.63% 2003 1.44% 0.86% 0.46% 0.51% 0.00% 0.56% - 0.52% 0.27% - 0.14% - 1.36% - 0.40% 0.68% 0.54% 2004 - 2.18% - 0.19% 0.71% - 1.22% - 0.34% - 0.20% 0.53% - 0.19% 0.78% - 0.42% - 0.76% 0.19% - 1.07% 2005 1.51% - 0.03% 0.45% 0.77% 0.59% 0.61% 0.22% - 0.26% - 1.30% 0.22% 0.05% - 0.25% 0.44% 2006 0.95% - 0.26% - 0.02% 0.13% 1.02% 0.55% - 0.58% - 0.66% 0.40% 0.87% 0.08% - 0.73% 0.16% 2007 - 1.76% 0.56% 1.33% - 1.37% - 0.81% 0.57% - 0.04% - 1.49% - 0.25% - 0.01% - 0.28% 0.35% - 0.31% 2008 3.88% - 0.33% 1.42% - 0.14% 0.75% 0.84% 0.93% - 0.12% 0.54% 0.39% 1.12% - 0.85% - 0.69% 2009 3.86% 1.13% - 0.21% 0.79% 1.44% - 0.69% 0.96% - 0.56% - 1.04% 0.54% 1.03% 0.70% - 0.25% 2010 0.11% 0.07% - 0.03% 0.94% - 0.87% - 1.18% - 0.30% - 0.48% - 0.11% 0.99% - 0.22% 0.71% 0.61% 2011 1.19% 0.16% 0.04% - 0.63% 0.50% 0.31% 0.36% 0.48% - 1.50% - 0.10% 0.56% 0.49% 0.54% 2012 5.62% 0.42% 0.79% 1.00% 0.92% - 0.94% 0.98% - 0.47% 0.29% 0.39% 0.82% 0.26% 1.04% 2013 1.66% - 0.38% 0.67% 0.33% - 0.64% 1.21% - 0.68% 0.51% 0.73% 0.08% 0.02% 0.89% - 1.06% 2014 - 1.71% - 0.54% - 0.26% 1.10% - 0.22% - 2.38% 0.48% - 0.64% 0.32% 0.12% - 0.27% 0.94% - 0.33% 2015 1.17% 0.46% 0.67% - 0.69% - 0.13% - 0.26% 0.51% - 0.07% 0.22% - 0.07% 1.17% - 0.02% - 0.59% 2016 6.92% 0.37% 1.37% 0.96% 0.61% - 0.25% 0.83% 0.02% 0.35% 0.37% - 0.05% 1.60% 0.55% 2017 - 2.36% - 1.15% 0.34% - 2.71% - 0.09% 0.96% 0.71% - 0.19% 0.51% - 0.30% - 0.58% - 2.14% 2.36% 2018 4.41% 0.74% 0.73% 0.36% - 0.00% - 0.36% - 0.06% 1.72% - 1.41% 0.79% 0.62% 0.25% 0.96% 2019 1.70% 0.61% 1.46% - 0.55% - 0.63% 0.78% 0.52% 0.06% 0.33% 0.57% - 0.05% - 1.52% 0.13% 2020 3.29% 0.55% - 0.23% 1.20% - 1.55% 0.73% 0.61% 0.31% 0.09% 0.92% 0.61% 0.32% - 0.30% 2021 - 8.79% - 0.44% 0.34% - 0.31% - 1.88% - 1.33% 0.61% - 1.37% 0.58% - 1.66% - 1.15% - 0.75% - 1.76% 2022 0.26% 1.08% 1.88% - 0.78% - 1.64% - 0.68% 0.43% 0.27% - 0.73% - 0.04% 1.32% - 1.37% 0.57% 2023 0.48% - 1.10% 1.09% - 1.27% 0.57% 0.43% 0.42% 0.75% 0.83% - 1.61% 0.39% 0.07% - 0.03% 2024 Please refer to the “Selected Risks” and “Disclaimer” on the following page. Historical performance measures for the J.P. Morgan Large - Cap Dynamic Blend 3 Index (the “Index”) represent hypothetical backtested performance using the actual performance of each Basket Constituent from July 25, 1990 through March 22, 2021, and actual performance from March 23, 2021 through December 31, 2024. Please see “Use of hypothetical backtested returns” at the end of this presentation for additional information related to backtesting and the use of alternative performance. Except as noted above and in the sections entitled “Use of hypothetical backtested returns” at the end of this document, the hypothetical monthly and annual returns set forth above were determined using the methodology currently used to calculate the Index. PAST PERFORMANCE AND BACKTESTED PERFORMANCE ARE NOT INDICATIVE OF FUTURE RESULTS. Investing in the notes linked to the Index involves a number of risks. See “Selected Risks” on page 2 of this document, “Risk Factors” in the prospectus supplement and the relevant product supplement and underlying supplement and “Selected Risk Considerations” in the relevant pricing supplement. Neither the Securities and Exchange Commission nor any state securities commission has approved or disapproved of the notes or passed upon the accuracy or the adequacy of this document or the accompanying product supplement, underlying supplement, prospectus supplement or prospectus. Any representation to the contrary is a criminal otfense. The notes are not bank deposits, are not insured by the Federal Deposit Insurance Corporation or any other governmental agency and are not obligations of, or guaranteed by, a bank. JANUARY 2025 J.P. Morgan Dynamic Blend Index
JANUARY 2025 | J.P. Morgan Dynamic Blend Index Selected Risks Our affiliate, J . P . Morgan Securities LLC (“JPMS”), is the Index Sponsor for the Index and each Portfolio Constituent, and may adjust the Index or each Portfolio Constituent in a way that atfects their level . The policies and judgments for which JPMS is responsible could have an impact, positive or negative, on the level of the Index or each of the Portfolio Constituents and the value of your investment . JPMS is under no obligation to consider your interest as an investor with returns linked to the Index . The level of the Index is calculated on an excess return basis and reflects the daily deduction of a fee of 0 . 95 % per annum . Our parent company, JPMorgan Chase & Co. (“JPMC”), is currently one of the companies that make up the S&P 500® Index, the reference index underlying the underlying futures contracts of the Equity Constituent. The Index was established on March 23, 2021, and the Portfolio Constituents were established on December 22, 2020 and each has a limited operating history. The Index comprises notional assets and liabilities. There is no actual portfolio of assets to which any person is entitled or in which any person has any ownership interest. The Index may not be successful, may not outperform any alternative strategy and may not approximate its target volatility of 3.0%. The performance of the Index may be adversely atfected by its target volatility of 3.0%. The investment strategy used to construct the Index involves daily adjustments to its notional exposures to its Portfolio Constituents, which may adversely impact performance. The exposure of the Index to the Bond Constituent may be greater, perhaps significantly greater, than its exposure to the Equity Constituent. The Index will be partially uninvested when every unlevered long - only portfolio of the Portfolio Constituents whose weights sum to 100% have volatility above the target volatility. Any uninvested portion will earn no return. The Index may be more heavily influenced by the performance of the Equity Constituent than the performance of the Bond Constituent in general over time. Changes in the values of the Portfolio Constituents may otfset each other. There are risks associated with correlation between the Portfolio Constituents. If the performances of the Portfolio Constituents become highly correlated during periods of negative performance, Index performance may be adversely impacted. Each Portfolio Constituent composing the Index may be replaced by a substitute Index or futures contract upon the occurrence of certain extraordinary events. Each Portfolio Constituent is subject to significant risks associated with the underlying futures contracts. Suspension or disruptions of market trading in the underlying futures contracts may adversely atfect the value of investments linked to the Index. An increase in the margin requirements for the underlying futures contracts included in the Portfolio Constituents may adversely atfect the level of that Portfolio Constituent. The Index may in the future include underlying futures contracts that are not traded on regulated futures exchanges. Negative roll returns associated with the underlying futures contracts constituting the Portfolio Constituents may adversely atfect the performance of the Portfolio Constituents and the value of investments linked to the Index. The Index should not be compared to any other index or strategy sponsored by any of our affiliates and cannot necessarily be considered a revised, enhanced or modified version of any other J.P. Morgan index. The Index is subject to significant risks associated with fixed - income securities (including interest rate - related risks and credit risk. Investments linked to the Index may be subject to the credit risk of JPMorgan Financial and JPMorgan Chase & Co. The risks identified above are not exhaustive. You should also review carefully the related “Risk Factors” section in the relevant disclosure statement and underlying supplement and the “Selected Risk Considerations” in the relevant term sheet or disclosure supplement. Disclaimer Important Information The information contained in this document is for discussion purposes only . Any information relating to performance contained in these materials is illustrative and no assurance is given that any indicative returns, performance or results, whether historical or hypothetical, will be achieved . All information herein is subject to change without notice, however, J . P . Morgan undertakes no duty to update this information . In the event of any inconsistency between the information presented herein and any otfering documents, the otfering documents shall govern . Use of hypothetical backtested returns Any backtested historical performance information included herein is hypothetical . The constituents and proxy constituents may not have traded together in the manner shown in the hypothetical backtest of the Index included herein, and no representation is being made that the Index will achieve similar performance . There are frequently significant ditferences between hypothetical backtested performance and actual subsequent performance . The use of alternative “proxy” information may create additional ditferences between hypothetical backtested and actual performance and allocations . The results obtained from backtesting information should not be considered indicative of the actual results that might be obtained from an investment or participation in a financial instrument or transaction referencing the Index . J . P . Morgan provides no assurance or guarantee that investments linked to the Index will operate or would have operated in the past in a manner consistent with these materials . The hypothetical historical levels presented herein have not been verified by an independent third party, and such hypothetical historical levels have inherent limitations . Alternative simulations, techniques, modeling or assumptions might produce significantly ditferent results and prove to be more appropriate . Actual results will vary, perhaps materially, from the hypothetical backtested returns and allocations presented in this document . HISTORICAL AND BACKTESTED PERFORMANCE AND ALLOCATIONS ARE NOT INDICATIVE OF FUTURE RESULTS . Investment suitability must be determined individually for each investor, and investments linked to the Index may not be suitable for all investors . This material is not a product of J . P . Morgan Research Departments . Copyright © 2025 JPMorgan Chase & Co . All rights reserved . For additional regulatory disclosures, please consult : www . jpmorgan . com/disclosures . Information contained on this website is not incorporated by reference in, and should not be considered part of, this document . This monthly update document replaces and supersedes all prior written materials of this type previously provided with respect to the Index .