Burke & Herbert Financial Services Corp. (Nasdaq: BHRB) Merger of Equals with Summit Financial Group, Inc. (Nasdaq: SMMF) August 24, 2023
2 Forward-looking Statements This presentation includes "forward-looking statements" within the meaning of the Private Securities Litigation Reform Act of 1995, Section 27A of the Securities Act of 1933, as amended, and Section 21E of the Securities Exchange Act of 1934, as amended, with respect to the beliefs, goals, intentions, and expectations of Burke & Herbert Financial Services Corp. (“BHRB”) and Summit Financial Group, Inc. (“SMMF”) regarding the proposed transaction, revenues, earnings, earnings per share, loan production, asset quality, and capital levels, among other matters; our estimates of future costs and benefits of the actions we may take; our assessments of expected losses on loans; our assessments of interest rate and other market risks; our ability to achieve our financial and other strategic goals; the expected timing of completion of the proposed transaction; the expected cost savings, synergies, returns and other anticipated benefits from the proposed transaction; and other statements that are not historical facts. Forward–looking statements are typically identified by such words as "believe," "expect," "anticipate," "intend," "outlook," "estimate," "forecast," "project," "will," "should," and other similar words and expressions, and are subject to numerous assumptions, risks, and uncertainties, which change over time. These forward-looking statements include, without limitation, those relating to the terms, timing and closing of the proposed transaction. Additionally, forward–looking statements speak only as of the date they are made; BHRB and SMMF do not assume any duty, and do not undertake, to update such forward–looking statements, whether written or oral, that may be made from time to time, whether as a result of new information, future events, or otherwise. Furthermore, because forward–looking statements are subject to assumptions and uncertainties, actual results or future events could differ, possibly materially, from those indicated in or implied by such forward-looking statements as a result of a variety of factors, many of which are beyond the control of BHRB and SMMF. Such statements are based upon the current beliefs and expectations of the management of BHRB and SMMF and are subject to significant risks and uncertainties outside of the control of the parties. Caution should be exercised against placing undue reliance on forward-looking statements. The factors that could cause actual results to differ materially include the following: the occurrence of any event, change or other circumstances that could give rise to the right of one or both of the parties to terminate the definitive merger agreement between BHRB and SMMF; the outcome of any legal proceedings that may be instituted against BHRB or SMMF; the possibility that the proposed transaction will not close when expected or at all because required regulatory, shareholder or other approvals are not received or other conditions to the closing are not satisfied on a timely basis or at all, or are obtained subject to conditions that are not anticipated (and the risk that required regulatory approvals may result in the imposition of conditions that could adversely affect the combined company or the expected benefits of the proposed transaction); the ability of BHRB and SMMF to meet expectations regarding the timing, completion and accounting and tax treatments of the proposed transaction; the risk that any announcements relating to the proposed transaction could have adverse effects on the market price of the common stock of either or both parties to the proposed transaction; the possibility that the anticipated benefits of the proposed transaction will not be realized when expected or at all, including as a result of the impact of, or problems arising from, the integration of the two companies or as a result of the strength of the economy and competitive factors in the areas where BHRB and SMMF do business; certain restrictions during the pendency of the proposed transaction that may impact the parties' ability to pursue certain business opportunities or strategic transactions; the possibility that the transaction may be more expensive to complete than anticipated, including as a result of unexpected factors or events; diversion of management's attention from ongoing business operations and opportunities; the possibility that the parties may be unable to achieve expected synergies and operating efficiencies in the merger within the expected timeframes or at all and to successfully integrate SMMF's operations and those of BHRB; such integration may be more difficult, time-consuming or costly than expected; revenues following the proposed transaction may be lower than expected; BHRB's and SMMF’s success in executing their respective business plans and strategies and managing the risks involved in the foregoing; the dilution caused by BHRB's issuance of additional shares of its capital stock in connection with the proposed transaction; effects of the announcement, pendency or completion of the proposed transaction on the ability of BHRB and SMMF to retain customers and retain and hire key personnel and maintain relationships with their suppliers, and on their operating results and businesses generally; and risks related to the potential impact of general economic, political and market factors on the companies or the proposed transaction and other factors that may affect future results of BHRB and SMMF; and the other factors discussed in the "Risk Factors" section of BHRB's Registration Statement on Form 10, as amended and as ordered effective by the SEC on April 21, 2023, and SMMF's Annual Report on Form 10–K for the year ended December 31, 2022, in the "Risk Factors" and "Management's Discussion and Analysis of Financial Condition and Results of Operations" sections of each of BHRB’s and SMMF’s Quarterly Reports on Form 10–Q for the quarters ended March 31, 2023 and June 30, 2023, and other reports BHRB and SMMF file with the SEC. Disclaimer
3 Additional Information and Where to Find It In connection with the proposed transaction, BHRB will file a registration statement on Form S-4 with the SEC. The registration statement will include a joint proxy statement of BHRB and SMMF, which also constitutes a prospectus of BHRB, that will be sent to shareholders of BHRB and shareholders of SMMF seeking certain approvals related to the proposed transaction. The information contained herein does not constitute an offer to sell or a solicitation of an offer to buy any securities or a solicitation of any vote or approval, nor shall there be any sale of securities in any jurisdiction in which such offer, solicitation or sale would be unlawful prior to registration or qualification under the securities laws of any such jurisdiction. INVESTORS AND SHAREHOLDERS OF BHRB AND SMMF AND THEIR RESPECTIVE AFFILIATES ARE URGED TO READ, WHEN AVAILABLE, THE REGISTRATION STATEMENT ON FORM S-4, THE JOINT PROXY STATEMENT/PROSPECTUS TO BE INCLUDED WITHIN THE REGISTRATION STATEMENT ON FORM S-4 AND ANY OTHER RELEVANT DOCUMENTS FILED OR TO BE FILED WITH THE SEC IN CONNECTION WITH THE PROPOSED TRANSACTION, AS WELL AS ANY AMENDMENTS OR SUPPLEMENTS TO THOSE DOCUMENTS, BECAUSE THEY WILL CONTAIN IMPORTANT INFORMATION ABOUT BHRB, SMMF AND THE PROPOSED TRANSACTION. Investors and shareholders will be able to obtain a free copy of the registration statement, including the joint proxy statement/prospectus, as well as other relevant documents filed with the SEC containing information about BHRB and SMMF, without charge, at the SEC's website www.sec.gov. Copies of documents filed with the SEC by BHRB will be made available free of charge in the "Investor Relations" section of BHRB's website, www.burkeandherbertbank.com. Copies of documents filed with the SEC by SMMF will be made available free of charge in the "News" section of SMMF's website, www.summitfgi.com, under the “News / Presentations and Events” link. Participants in Solicitation BHRB, SMMF, and certain of their respective directors and executive officers may be deemed to be participants in the solicitation of proxies in respect of the proposed transaction under the rules of the SEC. Information regarding BHRB's directors and executive officers is available in its Registration Statement on Form 10, as amended and as ordered effective by the SEC on April 21, 2023. Information regarding SMMF's directors and executive officers is available in its definitive proxy statement, which was filed with the SEC on March 31, 2023, and certain other documents filed by SMMF with the SEC. Other information regarding the participants in the solicitation of proxies in respect of the proposed transaction and a description of their direct and indirect interests, by security holdings or otherwise, will be contained in the joint proxy statement/prospectus and other relevant materials to be filed with the SEC. Free copies of these documents, when available, may be obtained as described in the preceding paragraph. Disclaimer
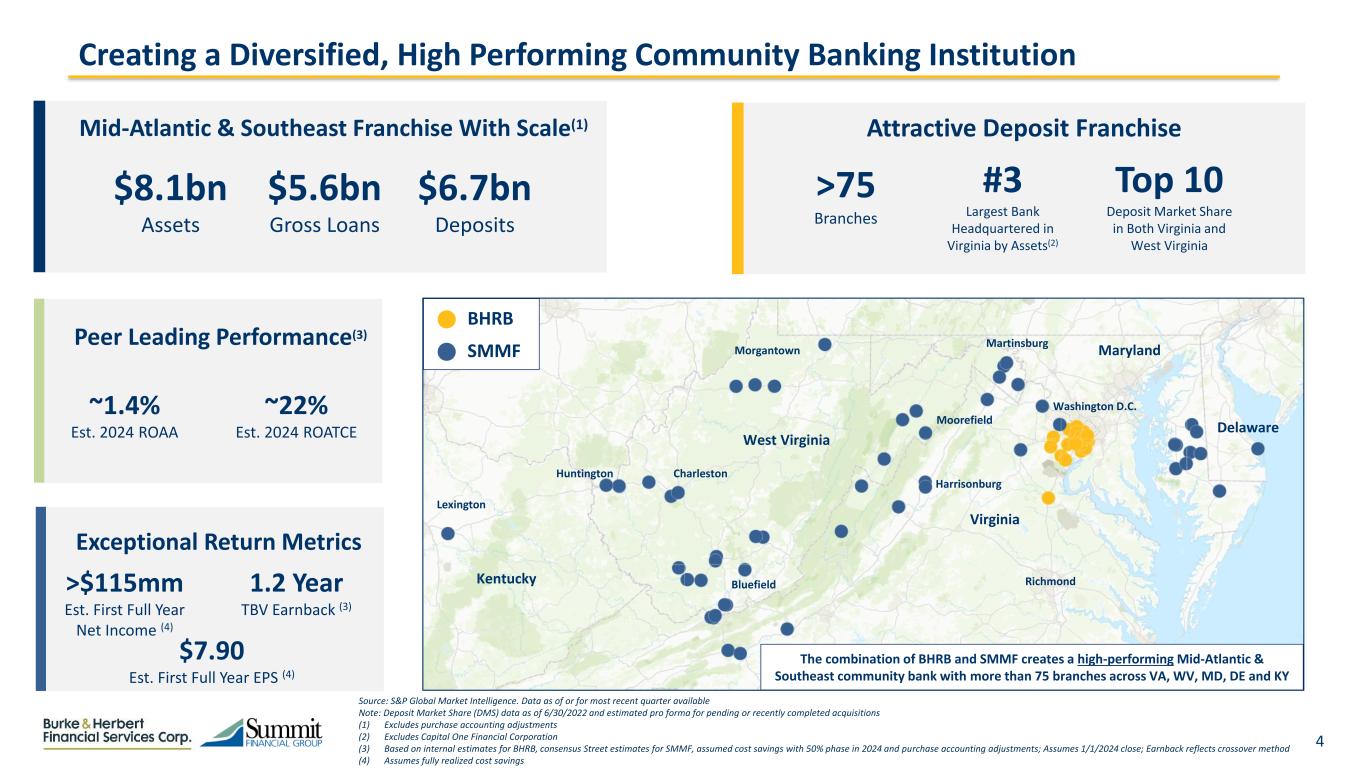
4 Creating a Diversified, High Performing Community Banking Institution BHRB SMMF The combination of BHRB and SMMF creates a high-performing Mid-Atlantic & Southeast community bank with more than 75 branches across VA, WV, MD, DE and KY $8.1bn Assets $5.6bn Gross Loans $6.7bn Deposits Mid-Atlantic & Southeast Franchise With Scale(1) Exceptional Return Metrics >$115mm Est. First Full Year Net Income (4) 1.2 Year TBV Earnback (3) Attractive Deposit Franchise >75 Branches #3 Largest Bank Headquartered in Virginia by Assets(2) Top 10 Deposit Market Share in Both Virginia and West Virginia Peer Leading Performance(3) ~1.4% Est. 2024 ROAA ~22% Est. 2024 ROATCE Source: S&P Global Market Intelligence. Data as of or for most recent quarter available Note: Deposit Market Share (DMS) data as of 6/30/2022 and estimated pro forma for pending or recently completed acquisitions (1) Excludes purchase accounting adjustments (2) Excludes Capital One Financial Corporation (3) Based on internal estimates for BHRB, consensus Street estimates for SMMF, assumed cost savings with 50% phase in 2024 and purchase accounting adjustments; Assumes 1/1/2024 close; Earnback reflects crossover method (4) Assumes fully realized cost savings West Virginia Washington D.C. Delaware Morgantown Bluefield Virginia Lexington Charleston Martinsburg Maryland Kentucky $7.90 Est. First Full Year EPS (4) Richmond Moorefield Huntington Harrisonburg
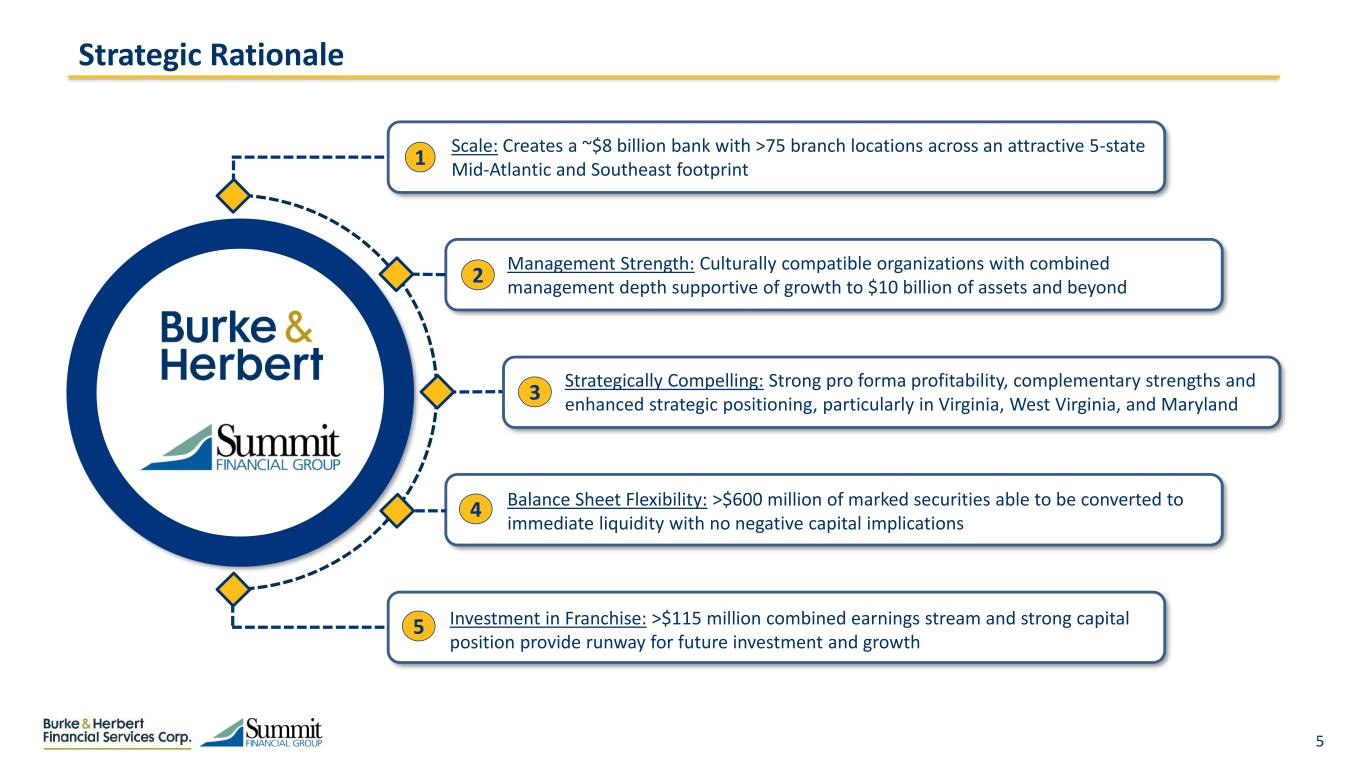
5 1 2 3 4 5 Strategically Compelling: Strong pro forma profitability, complementary strengths and enhanced strategic positioning, particularly in Virginia, West Virginia, and Maryland Scale: Creates a ~$8 billion bank with >75 branch locations across an attractive 5-state Mid-Atlantic and Southeast footprint Management Strength: Culturally compatible organizations with combined management depth supportive of growth to $10 billion of assets and beyond Investment in Franchise: >$115 million combined earnings stream and strong capital position provide runway for future investment and growth Balance Sheet Flexibility: >$600 million of marked securities able to be converted to immediate liquidity with no negative capital implications Strategic Rationale

6 Source: S&P Global Market Intelligence; Financial data per GAAP filings as of YTD 6/30/2023 (1) Nonperforming assets includes nonaccrual loans, nonaccrual debt securities and other assets, and other real estate owned (OREO) as a percent of loans and foreclosed real estate Burke & Herbert Financial Services Corp. (BHRB) Key Financials Branch Footprint Company Highlights CET1 Ratio: 17.6% TRBC Ratio: 18.7% NCO’s / Avg. Loans: 0.01% Loans / Deposits: 67% NPAs/ Loans + OREO(1): 0.15% Liquidity Ratio: 18.2% Company Description Founded in 1852 and headquartered in Alexandria, Virginia Longest continuously operating bank in the Commonwealth of Virginia and operates 23 branches located in Northern Virginia The company has organically grown through its history to more than 400 employees and $3.6 billion in assets Began trading on NASDAQ on April 26, 2023 Washington D.C. Dale City McLean Centerville Alexandria Virginia Fredericksburg (Dollars in Millions) YE 12/31/2022 YTD 6/30/2023 Balance Sheet Total Assets $3,563 $3,569 Total Net Loans 1,866 1,976 Deposits 2,920 3,005 Balance Sheet Ratios TCE / TA (%) 7.68 8.13 CET1 (%) 18.0 17.6 Total Capital Ratio (%) 18.9 18.7 Profitability Ratios ROAA (%) 1.22 0.75 ROAE (%) 14.4 9.5 Net Interest Margin (%) 3.19 2.96 Asset Quality NPAs/ Loans + OREO (%) (1) 0.48 0.15 ACL / Loans (%) 1.11 1.30 BHRB Branch Richmond, VA Office to open in Q4 2023 Richmond

7 (Dollars in Millions) YE 12/31/2022 YTD 6/30/2023 Balance Sheet Total Assets $3,917 $4,552 Total Net Loans 3,044 3,507 Deposits 3,170 3,735 Balance Sheet Ratios TCE / TA (%) 7.20 7.19 CET1 (%) 8.6 8.7 Total Capital Ratio (%) 13.5 13.3 Profitability Ratios Core ROAA (%) 1.46 1.39 Core ROATCE (%) 20.9 18.9 Net Interest Margin (%) 3.73 3.86 Asset Quality NPAs/ Loans + OREO (%) (3) 1.03 0.45 ACL / Loans (%) 1.26 1.29 (2) (2) (1) (1) Summit Financial Group, Inc. (SMMF) Key Financials Branch Footprint Company Highlights SMMF Branch Core ROAA(2): 1.39% TCE / TA: 7.19% NPAs/ Loans + OREO(3): 0.45% NIM: 3.86% Efficiency Ratio: 48.0% Core ROATCE(2): 18.9% Company Description Founded in 1987 and headquartered in Moorefield, West Virginia; Trades on the NASDAQ under the symbol SMMF Top 10 deposit market share in West Virginia Successful M&A track record with 6 acquisitions completed since 2015, including the acquisition of PSB Holding Corp. which closed in April 2023 54 branch locations across a footprint that includes WV, VA, MD, DE and KY West Virginia Washington D.C. Delaware Morgantown Virginia Charleston Martinsburg Bluefield Lexington Source: S&P Global Market Intelligence; Financial data per GAAP filings as of YTD 6/30/2023 unless otherwise specified (1) Core income after taxes and before extraordinary items; Excludes gain on sale of securities, amortization of intangibles, and nonrecurring items as defined by S&P Global Market Intelligence (2) See appendix for non-GAAP reconciliation (3) Nonperforming assets includes nonaccrual loans, nonaccrual debt securities and other assets, and other real estate owned (OREO) as a percent of loans and foreclosed real estate Moorefield Harrisonburg Huntington
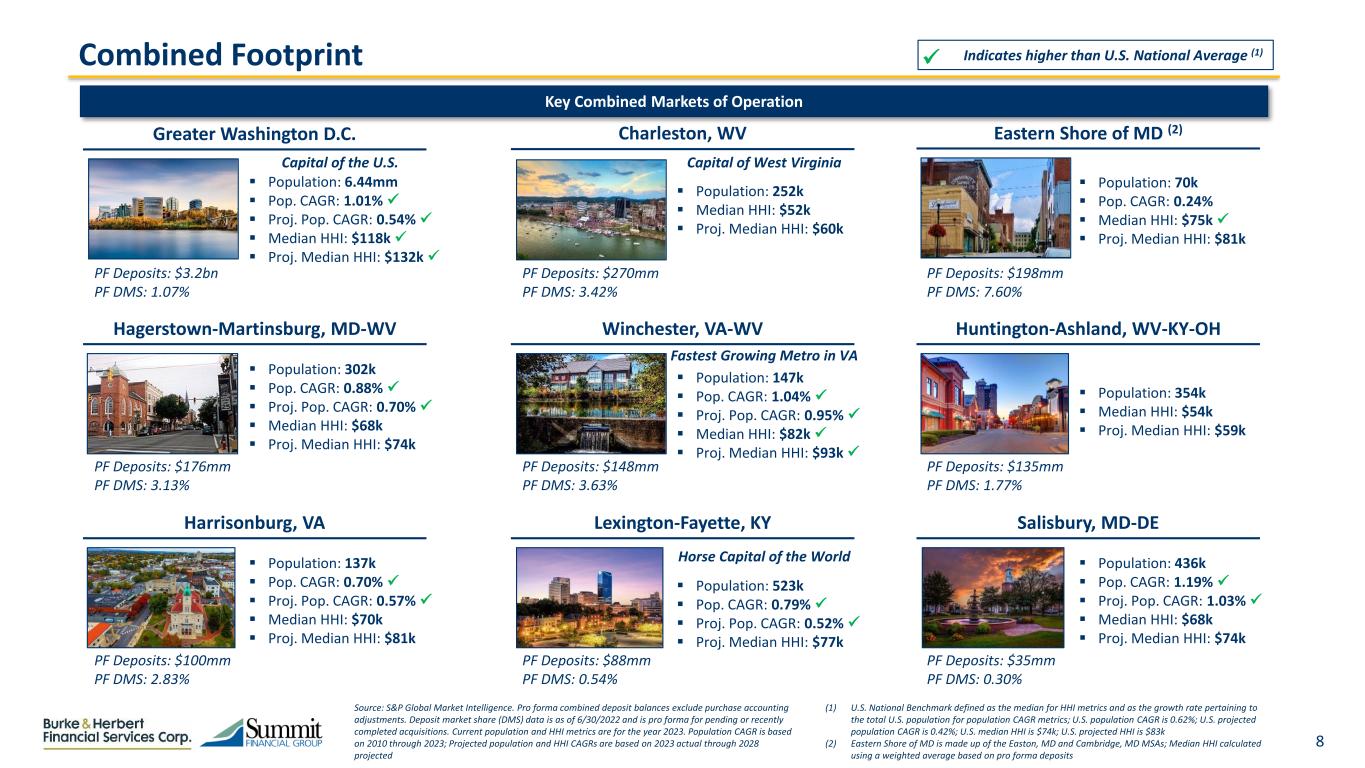
8 Population: 137k Pop. CAGR: 0.70% Proj. Pop. CAGR: 0.57% Median HHI: $70k Proj. Median HHI: $81k PF Deposits: $100mm PF DMS: 2.83% Harrisonburg, VA Combined Footprint Key Combined Markets of Operation Eastern Shore of MD (2) Population: 70k Pop. CAGR: 0.24% Median HHI: $75k Proj. Median HHI: $81k PF Deposits: $198mm PF DMS: 7.60% Charleston, WV Population: 252k Median HHI: $52k Proj. Median HHI: $60k PF Deposits: $270mm PF DMS: 3.42% Source: S&P Global Market Intelligence. Pro forma combined deposit balances exclude purchase accounting adjustments. Deposit market share (DMS) data is as of 6/30/2022 and is pro forma for pending or recently completed acquisitions. Current population and HHI metrics are for the year 2023. Population CAGR is based on 2010 through 2023; Projected population and HHI CAGRs are based on 2023 actual through 2028 projected (1) U.S. National Benchmark defined as the median for HHI metrics and as the growth rate pertaining to the total U.S. population for population CAGR metrics; U.S. population CAGR is 0.62%; U.S. projected population CAGR is 0.42%; U.S. median HHI is $74k; U.S. projected HHI is $83k (2) Eastern Shore of MD is made up of the Easton, MD and Cambridge, MD MSAs; Median HHI calculated using a weighted average based on pro forma deposits Hagerstown-Martinsburg, MD-WV Population: 302k Pop. CAGR: 0.88% Proj. Pop. CAGR: 0.70% Median HHI: $68k Proj. Median HHI: $74k PF Deposits: $176mm PF DMS: 3.13% PF Deposits: $3.2bn PF DMS: 1.07% Population: 6.44mm Pop. CAGR: 1.01% Proj. Pop. CAGR: 0.54% Median HHI: $118k Proj. Median HHI: $132k Greater Washington D.C. Indicates higher than U.S. National Average (1) Lexington-Fayette, KY Population: 523k Pop. CAGR: 0.79% Proj. Pop. CAGR: 0.52% Proj. Median HHI: $77k PF Deposits: $88mm PF DMS: 0.54% Population: 147k Pop. CAGR: 1.04% Proj. Pop. CAGR: 0.95% Median HHI: $82k Proj. Median HHI: $93k Winchester, VA-WV PF Deposits: $148mm PF DMS: 3.63% Huntington-Ashland, WV-KY-OH Population: 354k Median HHI: $54k Proj. Median HHI: $59k PF Deposits: $135mm PF DMS: 1.77% Salisbury, MD-DE Population: 436k Pop. CAGR: 1.19% Proj. Pop. CAGR: 1.03% Median HHI: $68k Proj. Median HHI: $74k PF Deposits: $35mm PF DMS: 0.30% Fastest Growing Metro in VA Horse Capital of the World Capital of the U.S. Capital of West Virginia
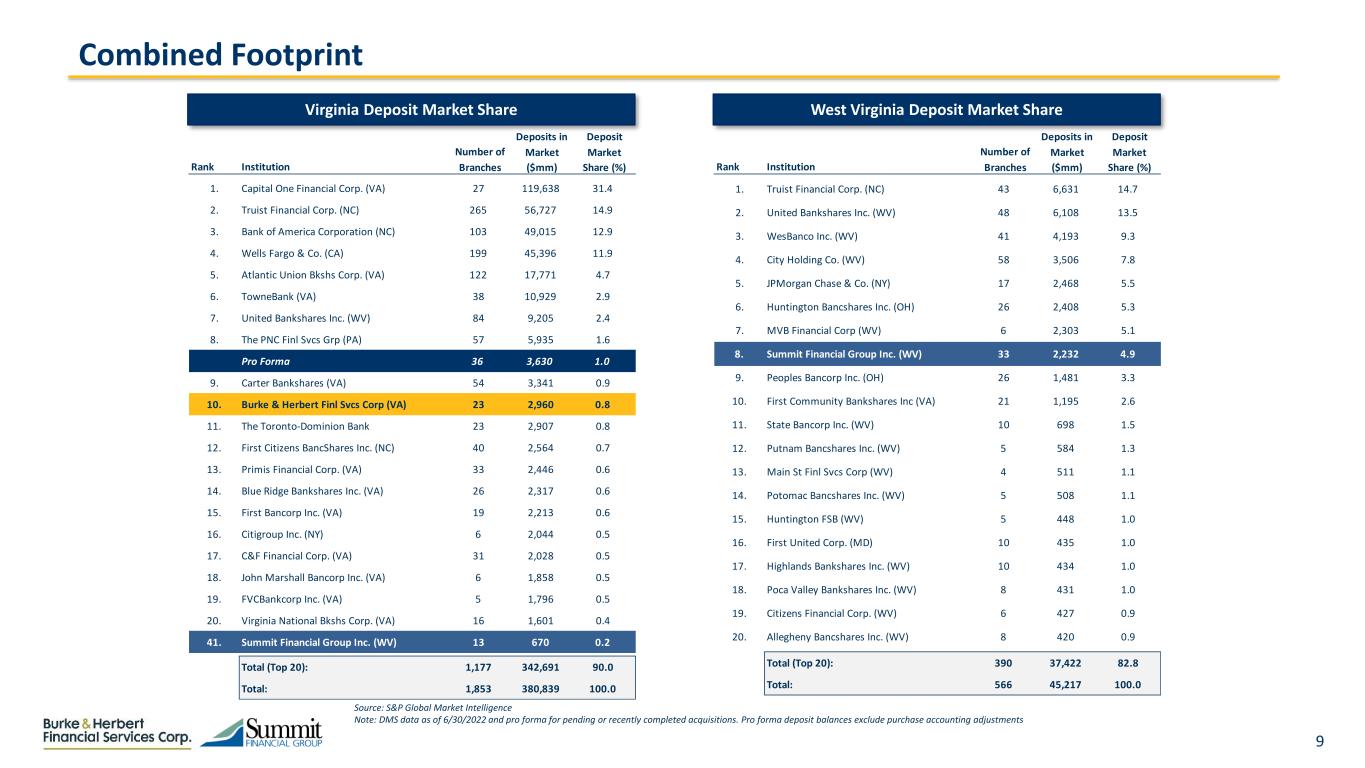
9 Combined Footprint Virginia Deposit Market Share West Virginia Deposit Market Share Source: S&P Global Market Intelligence Note: DMS data as of 6/30/2022 and pro forma for pending or recently completed acquisitions. Pro forma deposit balances exclude purchase accounting adjustments Rank Institution Number of Branches Deposits in Market ($mm) Deposit Market Share (%) 1. Capital One Financial Corp. (VA) 27 119,638 31.4 2. Truist Financial Corp. (NC) 265 56,727 14.9 3. Bank of America Corporation (NC) 103 49,015 12.9 4. Wells Fargo & Co. (CA) 199 45,396 11.9 5. Atlantic Union Bkshs Corp. (VA) 122 17,771 4.7 6. TowneBank (VA) 38 10,929 2.9 7. United Bankshares Inc. (WV) 84 9,205 2.4 8. The PNC Finl Svcs Grp (PA) 57 5,935 1.6 Pro Forma 36 3,630 1.0 9. Carter Bankshares (VA) 54 3,341 0.9 10. Burke & Herbert Finl Svcs Corp (VA) 23 2,960 0.8 11. The Toronto-Dominion Bank 23 2,907 0.8 12. First Citizens BancShares Inc. (NC) 40 2,564 0.7 13. Primis Financial Corp. (VA) 33 2,446 0.6 14. Blue Ridge Bankshares Inc. (VA) 26 2,317 0.6 15. First Bancorp Inc. (VA) 19 2,213 0.6 16. Citigroup Inc. (NY) 6 2,044 0.5 17. C&F Financial Corp. (VA) 31 2,028 0.5 18. John Marshall Bancorp Inc. (VA) 6 1,858 0.5 19. FVCBankcorp Inc. (VA) 5 1,796 0.5 20. Virginia National Bkshs Corp. (VA) 16 1,601 0.4 41. Summit Financial Group Inc. (WV) 13 670 0.2 Total (Top 20): 1,177 342,691 90.0 Total: 1,853 380,839 100.0 Rank Institution Number of Branches Deposits in Market ($mm) Deposit Market Share (%) 1. Truist Financial Corp. (NC) 43 6,631 14.7 2. United Bankshares Inc. (WV) 48 6,108 13.5 3. WesBanco Inc. (WV) 41 4,193 9.3 4. City Holding Co. (WV) 58 3,506 7.8 5. JPMorgan Chase & Co. (NY) 17 2,468 5.5 6. Huntington Bancshares Inc. (OH) 26 2,408 5.3 7. MVB Financial Corp (WV) 6 2,303 5.1 8. Summit Financial Group Inc. (WV) 33 2,232 4.9 9. Peoples Bancorp Inc. (OH) 26 1,481 3.3 10. First Community Bankshares Inc (VA) 21 1,195 2.6 11. State Bancorp Inc. (WV) 10 698 1.5 12. Putnam Bancshares Inc. (WV) 5 584 1.3 13. Main St Finl Svcs Corp (WV) 4 511 1.1 14. Potomac Bancshares Inc. (WV) 5 508 1.1 15. Huntington FSB (WV) 5 448 1.0 16. First United Corp. (MD) 10 435 1.0 17. Highlands Bankshares Inc. (WV) 10 434 1.0 18. Poca Valley Bankshares Inc. (WV) 8 431 1.0 19. Citizens Financial Corp. (WV) 6 427 0.9 20. Allegheny Bancshares Inc. (WV) 8 420 0.9 Total (Top 20): 390 37,422 82.8 Total: 566 45,217 100.0
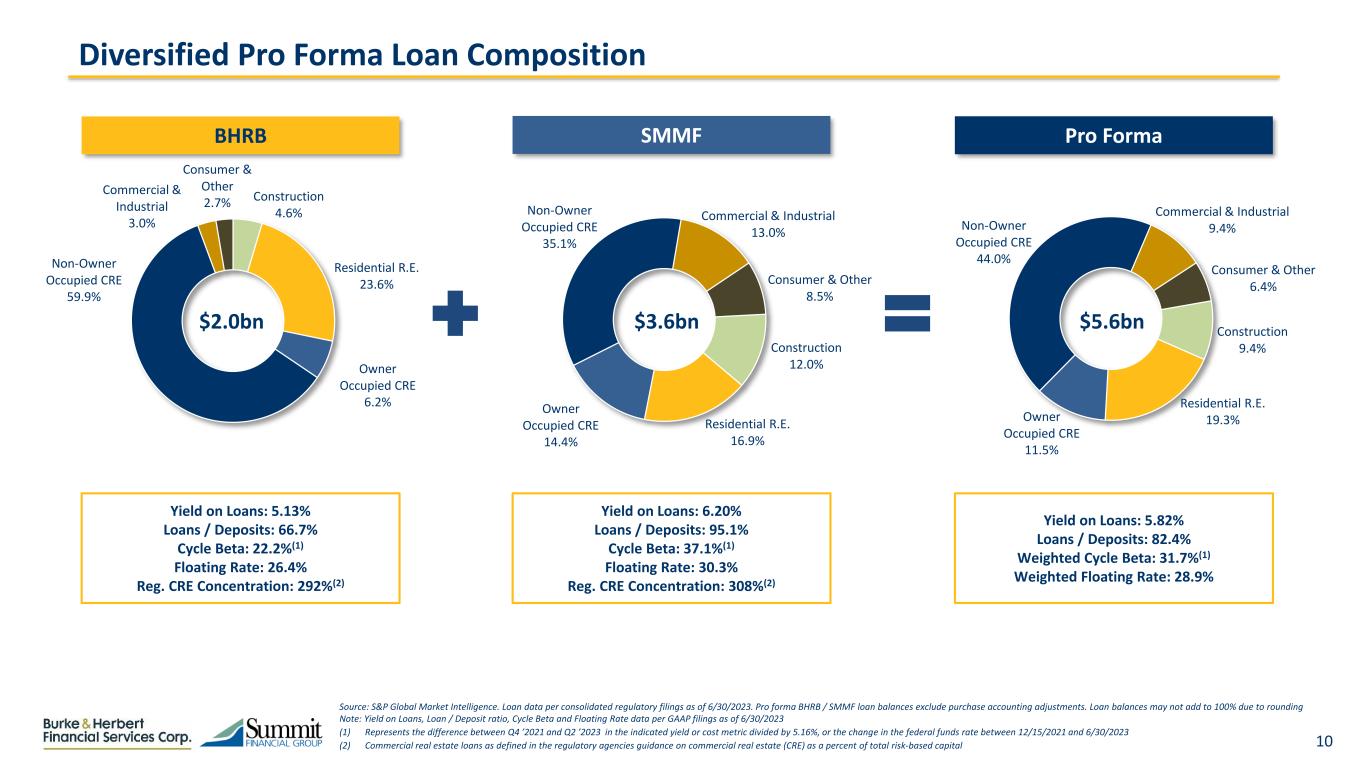
10 Construction 4.6% Residential R.E. 23.6% Owner Occupied CRE 6.2% Non-Owner Occupied CRE 59.9% Commercial & Industrial 3.0% Consumer & Other 2.7% Source: S&P Global Market Intelligence. Loan data per consolidated regulatory filings as of 6/30/2023. Pro forma BHRB / SMMF loan balances exclude purchase accounting adjustments. Loan balances may not add to 100% due to rounding Note: Yield on Loans, Loan / Deposit ratio, Cycle Beta and Floating Rate data per GAAP filings as of 6/30/2023 (1) Represents the difference between Q4 ’2021 and Q2 ’2023 in the indicated yield or cost metric divided by 5.16%, or the change in the federal funds rate between 12/15/2021 and 6/30/2023 (2) Commercial real estate loans as defined in the regulatory agencies guidance on commercial real estate (CRE) as a percent of total risk-based capital Construction 9.4% Residential R.E. 19.3% Owner Occupied CRE 11.5% Non-Owner Occupied CRE 44.0% Commercial & Industrial 9.4% Consumer & Other 6.4% Construction 12.0% Residential R.E. 16.9% Owner Occupied CRE 14.4% Non-Owner Occupied CRE 35.1% Commercial & Industrial 13.0% Consumer & Other 8.5% Diversified Pro Forma Loan Composition Yield on Loans: 5.13% Loans / Deposits: 66.7% Cycle Beta: 22.2%(1) Floating Rate: 26.4% Reg. CRE Concentration: 292%(2) Yield on Loans: 6.20% Loans / Deposits: 95.1% Cycle Beta: 37.1%(1) Floating Rate: 30.3% Reg. CRE Concentration: 308%(2) Yield on Loans: 5.82% Loans / Deposits: 82.4% Weighted Cycle Beta: 31.7%(1) Weighted Floating Rate: 28.9% $2.0bn $3.6bn $5.6bn BHRB SMMF Pro Forma

11 Demand Deposits 18.2% NOW & Other Trans. Accts 21.7% MMDA & Other Savings 46.2% Retail Time Deposits 8.3% Jumbo Time Deposits 5.6% Demand Deposits 23.1% NOW & Other Trans. Accts 20.0% MMDA & Other Savings 39.8% Retail Time Deposits 12.1% Jumbo Time Deposits 5.0% Demand Deposits 29.2% NOW & Other Trans. Accts 17.8% MMDA & Other Savings 32.0% Retail Time Deposits 16.9% Jumbo Time Deposits 4.2% Source: S&P Global Market Intelligence; Deposit data per consolidated regulatory filings as of 6/30/2023. Pro forma BHRB / SMMF deposit balances exclude purchase accounting adjustments. Deposit balances may not add to 100% due to rounding Note: Cost of Deposits, Cycle Beta and Brokered Deposit data per GAAP filings; Uninsured Deposit data per regulatory filings as of 6/30/2023. Retail Time Deposits < $100k and Jumbo Time Deposits >$100k (1) Represents the difference between Q4 ’2021 and Q2 ’2023 in the indicated yield or cost metric divided by 5.16%, or the change in the federal funds rate between 12/15/2021 and 6/30/2023 (2) Estimated uninsured deposit data as of 6/30/2023 Pro Forma Deposit Composition Cost of Deposits: 1.33% Cycle Beta: 25.8%(1) % Uninsured: 22.7%(2) Brokered Deposits: 12.9% Cost of Deposits: 1.92% Cycle Beta: 34.3%(1) % Uninsured: 31.8%(2) Brokered Deposits: 1.5% Cost of Deposits: 1.66% Weighted Cycle Beta: 30.5%(1) % Uninsured: 27.7%(2) Brokered Deposits: 6.6% BHRB SMMF Pro Forma $3.0bn $3.7bn $6.7bn
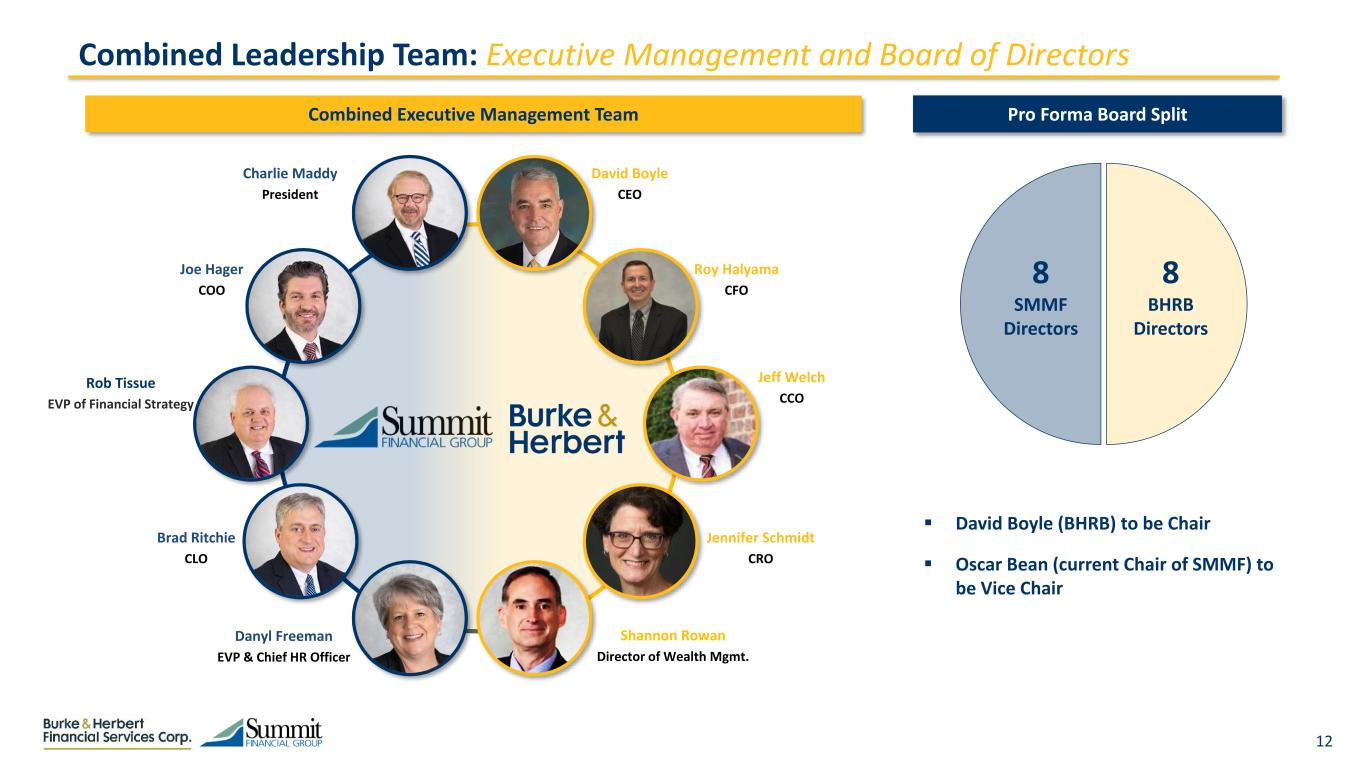
12 Joe Hager COO Combined Leadership Team: Executive Management and Board of Directors Charlie Maddy President Brad Ritchie CLO Rob Tissue EVP of Financial Strategy David Boyle CEO Roy Halyama CFO Jennifer Schmidt CRO Jeff Welch CCO Shannon Rowan Director of Wealth Mgmt. Pro Forma Board Split 8 SMMF Directors 8 BHRB Directors David Boyle (BHRB) to be Chair Oscar Bean (current Chair of SMMF) to be Vice Chair Danyl Freeman EVP & Chief HR Officer Combined Executive Management Team
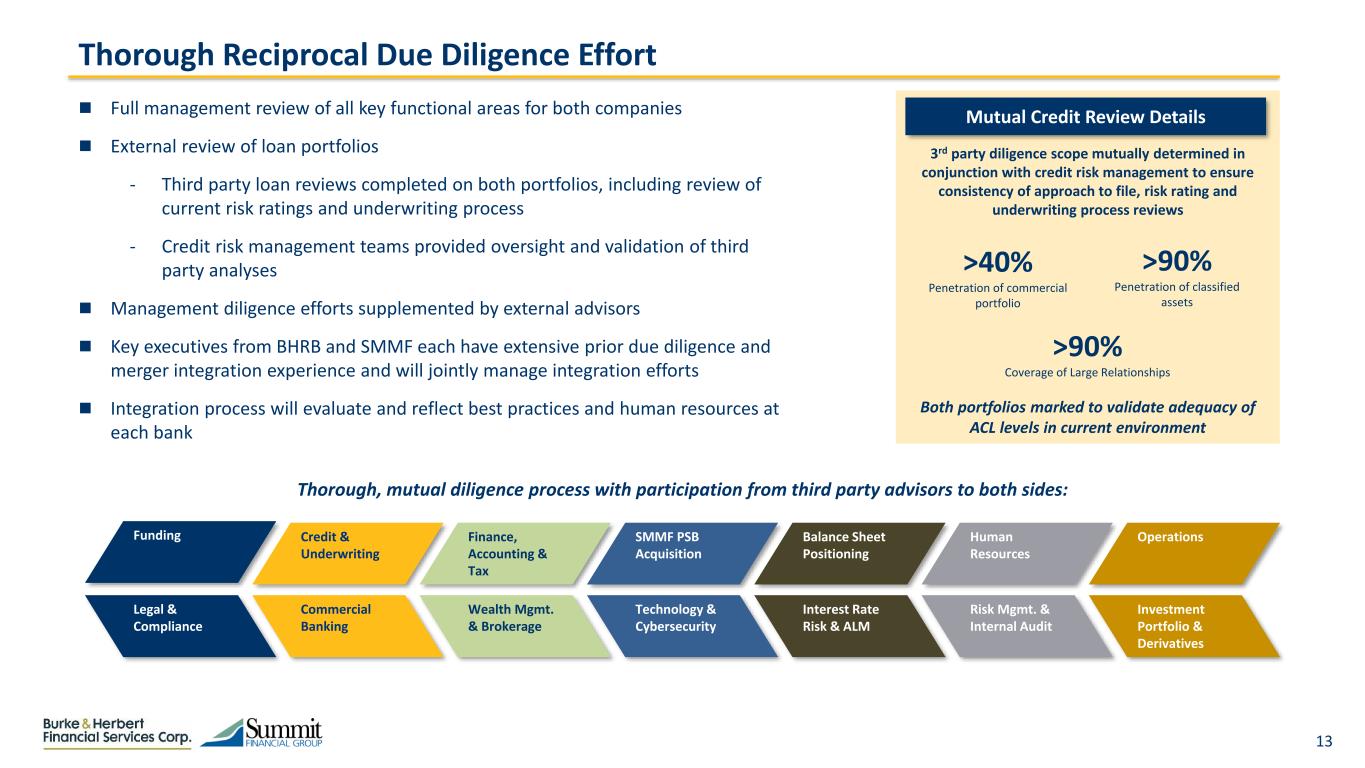
13 Full management review of all key functional areas for both companies External review of loan portfolios ‐ Third party loan reviews completed on both portfolios, including review of current risk ratings and underwriting process ‐ Credit risk management teams provided oversight and validation of third party analyses Management diligence efforts supplemented by external advisors Key executives from BHRB and SMMF each have extensive prior due diligence and merger integration experience and will jointly manage integration efforts Integration process will evaluate and reflect best practices and human resources at each bank Credit & Underwriting Funding Investment Portfolio & Derivatives Interest Rate Risk & ALM SMMF PSB Acquisition Risk Mgmt. & Internal Audit Human Resources Technology & Cybersecurity Balance Sheet Positioning Operations Legal & Compliance Commercial Banking Finance, Accounting & Tax Wealth Mgmt. & Brokerage Thorough Reciprocal Due Diligence Effort Thorough, mutual diligence process with participation from third party advisors to both sides: Mutual Credit Review Details >40% Penetration of commercial portfolio >90% Coverage of Large Relationships Both portfolios marked to validate adequacy of ACL levels in current environment >90% Penetration of classified assets 3rd party diligence scope mutually determined in conjunction with credit risk management to ensure consistency of approach to file, risk rating and underwriting process reviews
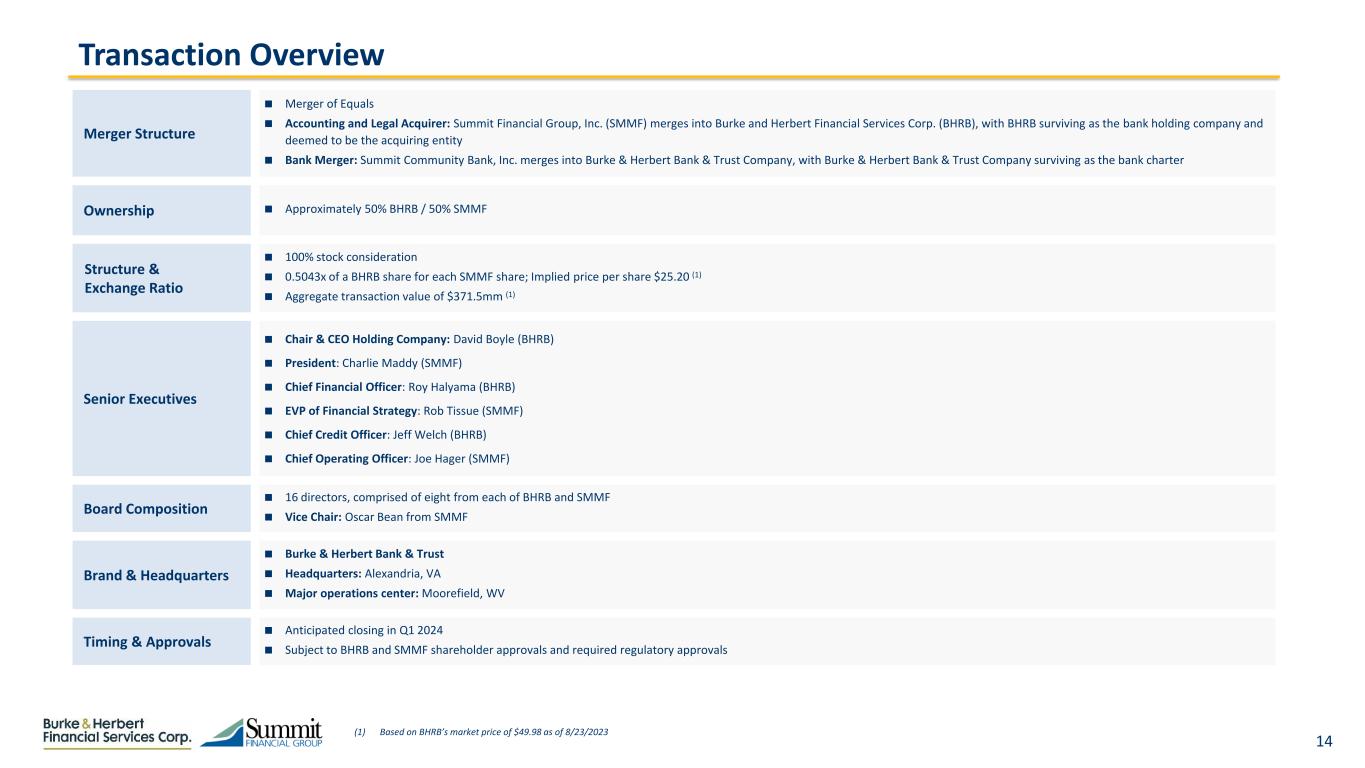
14 (1) Based on BHRB’s market price of $49.98 as of 8/23/2023 Transaction Overview Merger Structure Merger of Equals Accounting and Legal Acquirer: Summit Financial Group, Inc. (SMMF) merges into Burke and Herbert Financial Services Corp. (BHRB), with BHRB surviving as the bank holding company and deemed to be the acquiring entity Bank Merger: Summit Community Bank, Inc. merges into Burke & Herbert Bank & Trust Company, with Burke & Herbert Bank & Trust Company surviving as the bank charter Ownership Approximately 50% BHRB / 50% SMMF Structure & Exchange Ratio 100% stock consideration 0.5043x of a BHRB share for each SMMF share; Implied price per share $25.20 (1) Aggregate transaction value of $371.5mm (1) Senior Executives Chair & CEO Holding Company: David Boyle (BHRB) President: Charlie Maddy (SMMF) Chief Financial Officer: Roy Halyama (BHRB) EVP of Financial Strategy: Rob Tissue (SMMF) Chief Credit Officer: Jeff Welch (BHRB) Chief Operating Officer: Joe Hager (SMMF) Board Composition 16 directors, comprised of eight from each of BHRB and SMMF Vice Chair: Oscar Bean from SMMF Brand & Headquarters Burke & Herbert Bank & Trust Headquarters: Alexandria, VA Major operations center: Moorefield, WV Timing & Approvals Anticipated closing in Q1 2024 Subject to BHRB and SMMF shareholder approvals and required regulatory approvals
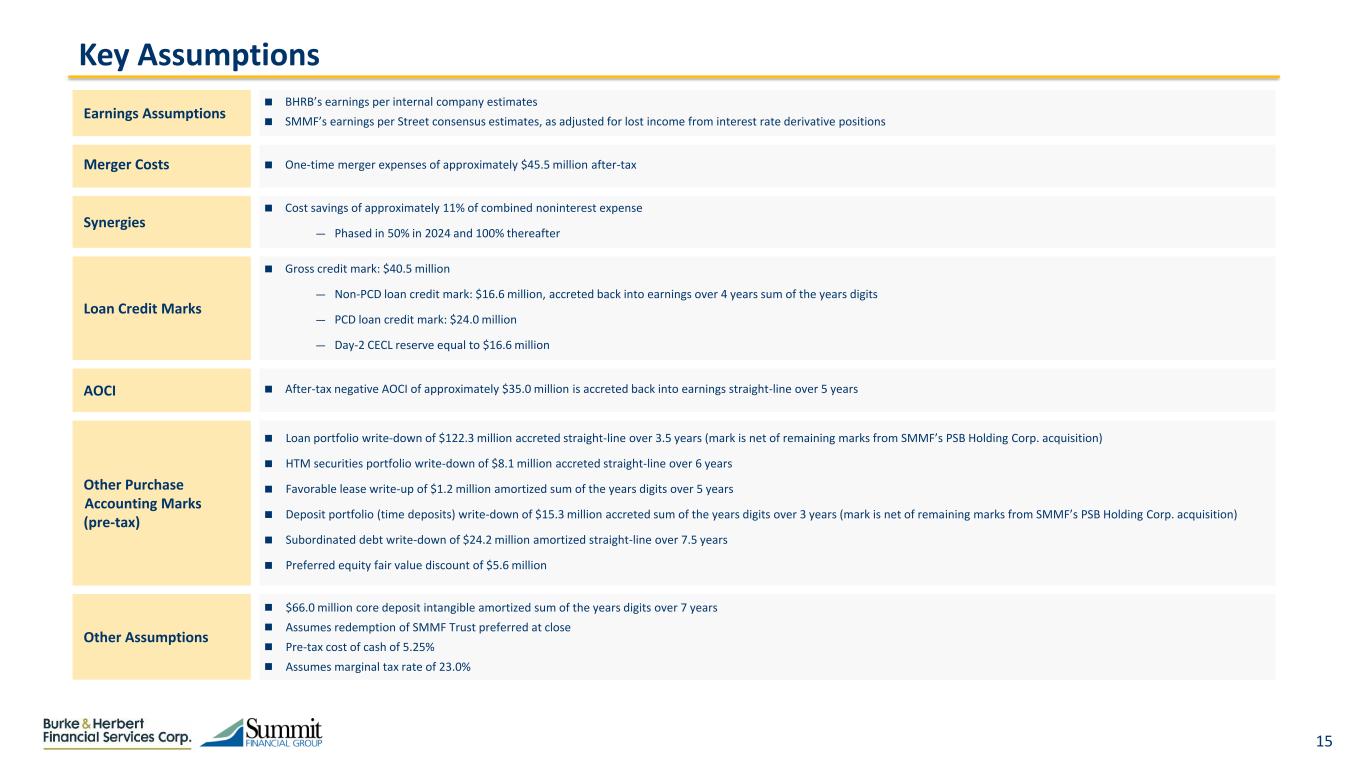
15 Key Assumptions Earnings Assumptions BHRB’s earnings per internal company estimates SMMF’s earnings per Street consensus estimates, as adjusted for lost income from interest rate derivative positions Merger Costs One-time merger expenses of approximately $45.5 million after-tax Synergies Cost savings of approximately 11% of combined noninterest expense — Phased in 50% in 2024 and 100% thereafter Loan Credit Marks Gross credit mark: $40.5 million — Non-PCD loan credit mark: $16.6 million, accreted back into earnings over 4 years sum of the years digits — PCD loan credit mark: $24.0 million — Day-2 CECL reserve equal to $16.6 million AOCI After-tax negative AOCI of approximately $35.0 million is accreted back into earnings straight-line over 5 years Other Purchase Accounting Marks (pre-tax) Loan portfolio write-down of $122.3 million accreted straight-line over 3.5 years (mark is net of remaining marks from SMMF’s PSB Holding Corp. acquisition) HTM securities portfolio write-down of $8.1 million accreted straight-line over 6 years Favorable lease write-up of $1.2 million amortized sum of the years digits over 5 years Deposit portfolio (time deposits) write-down of $15.3 million accreted sum of the years digits over 3 years (mark is net of remaining marks from SMMF’s PSB Holding Corp. acquisition) Subordinated debt write-down of $24.2 million amortized straight-line over 7.5 years Preferred equity fair value discount of $5.6 million Other Assumptions $66.0 million core deposit intangible amortized sum of the years digits over 7 years Assumes redemption of SMMF Trust preferred at close Pre-tax cost of cash of 5.25% Assumes marginal tax rate of 23.0%
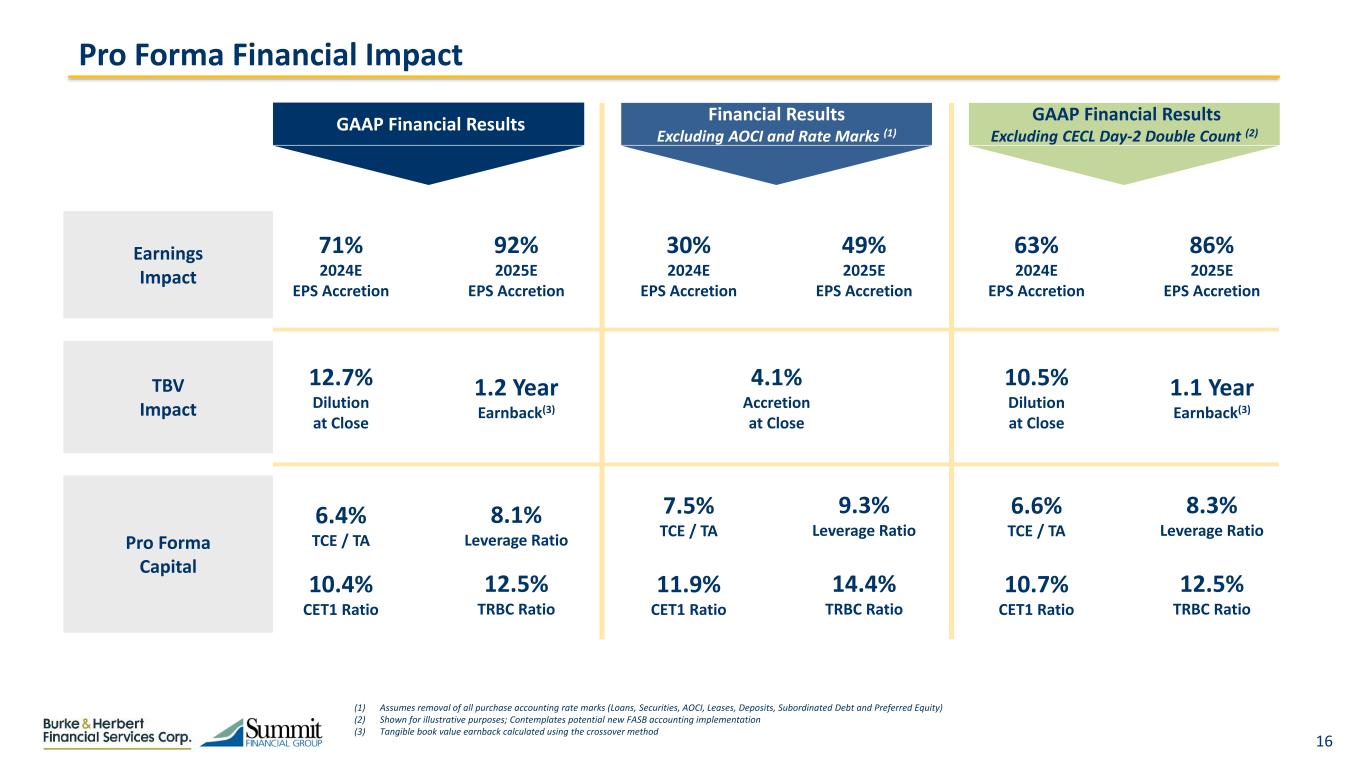
16 (1) Assumes removal of all purchase accounting rate marks (Loans, Securities, AOCI, Leases, Deposits, Subordinated Debt and Preferred Equity) (2) Shown for illustrative purposes; Contemplates potential new FASB accounting implementation (3) Tangible book value earnback calculated using the crossover method Pro Forma Financial Impact Earnings Impact TBV Impact Pro Forma Capital GAAP Financial Results Financial Results Excluding AOCI and Rate Marks (1) 71% 2024E EPS Accretion 92% 2025E EPS Accretion GAAP Financial Results Excluding CECL Day-2 Double Count (2) 12.7% Dilution at Close 1.2 Year Earnback(3) 6.4% TCE / TA 8.1% Leverage Ratio 10.4% CET1 Ratio 12.5% TRBC Ratio 30% 2024E EPS Accretion 49% 2025E EPS Accretion 4.1% Accretion at Close 7.5% TCE / TA 9.3% Leverage Ratio 11.9% CET1 Ratio 14.4% TRBC Ratio 63% 2024E EPS Accretion 86% 2025E EPS Accretion 10.5% Dilution at Close 1.1 Year Earnback(3) 6.6% TCE / TA 8.3% Leverage Ratio 10.7% CET1 Ratio 12.5% TRBC Ratio
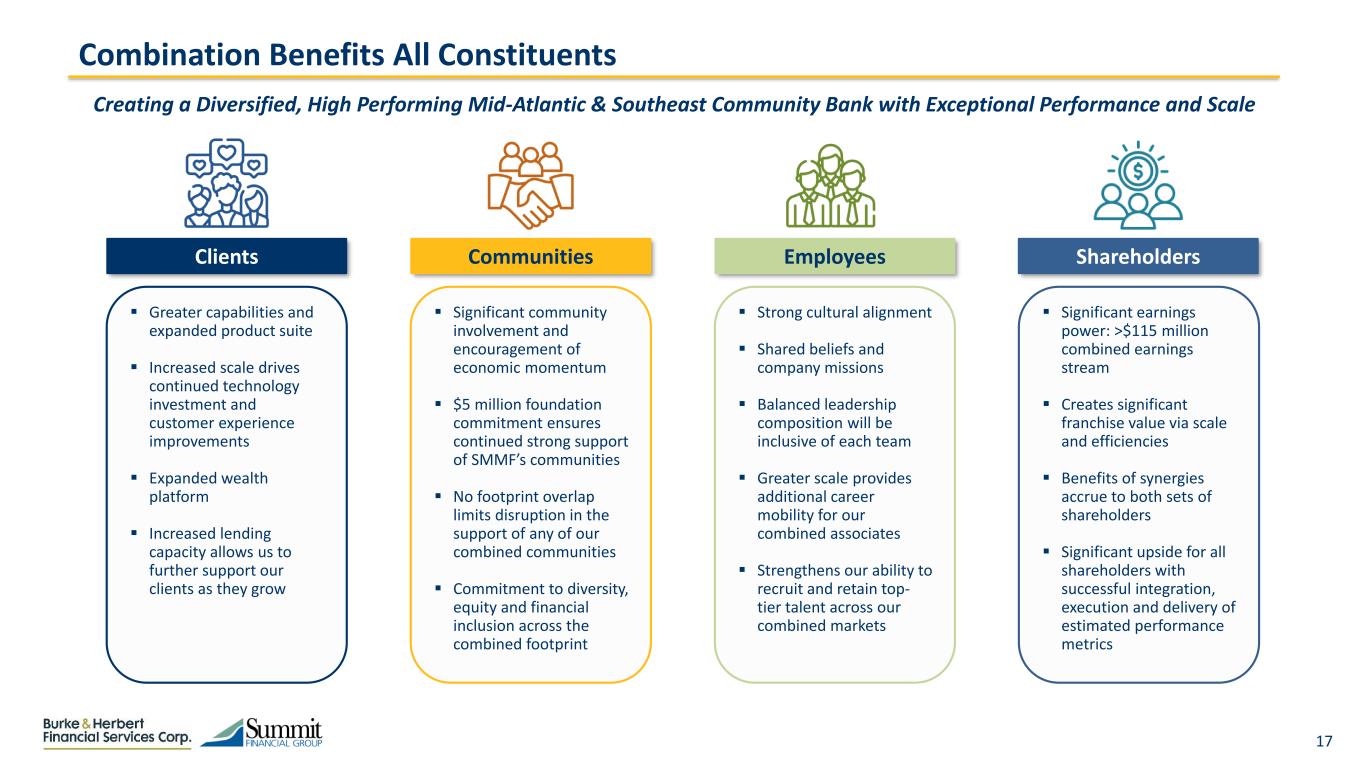
17 Combination Benefits All Constituents Creating a Diversified, High Performing Mid-Atlantic & Southeast Community Bank with Exceptional Performance and Scale Clients Communities Employees Shareholders Greater capabilities and expanded product suite Increased scale drives continued technology investment and customer experience improvements Expanded wealth platform Increased lending capacity allows us to further support our clients as they grow Significant community involvement and encouragement of economic momentum $5 million foundation commitment ensures continued strong support of SMMF’s communities No footprint overlap limits disruption in the support of any of our combined communities Commitment to diversity, equity and financial inclusion across the combined footprint Strong cultural alignment Shared beliefs and company missions Balanced leadership composition will be inclusive of each team Greater scale provides additional career mobility for our combined associates Strengthens our ability to recruit and retain top- tier talent across our combined markets Significant earnings power: >$115 million combined earnings stream Creates significant franchise value via scale and efficiencies Benefits of synergies accrue to both sets of shareholders Significant upside for all shareholders with successful integration, execution and delivery of estimated performance metrics
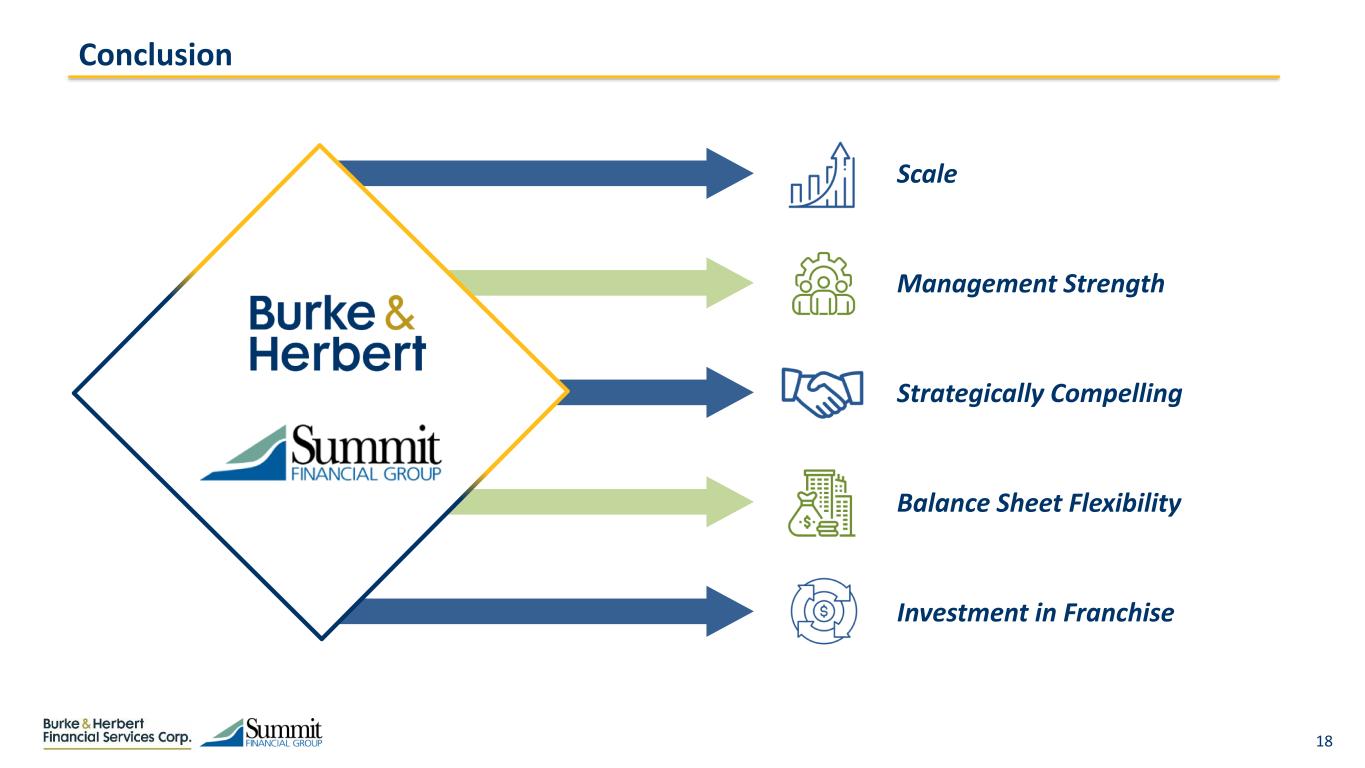
18 Strategically Compelling Scale Management Strength Investment in Franchise Balance Sheet Flexibility Conclusion
19 Appendix
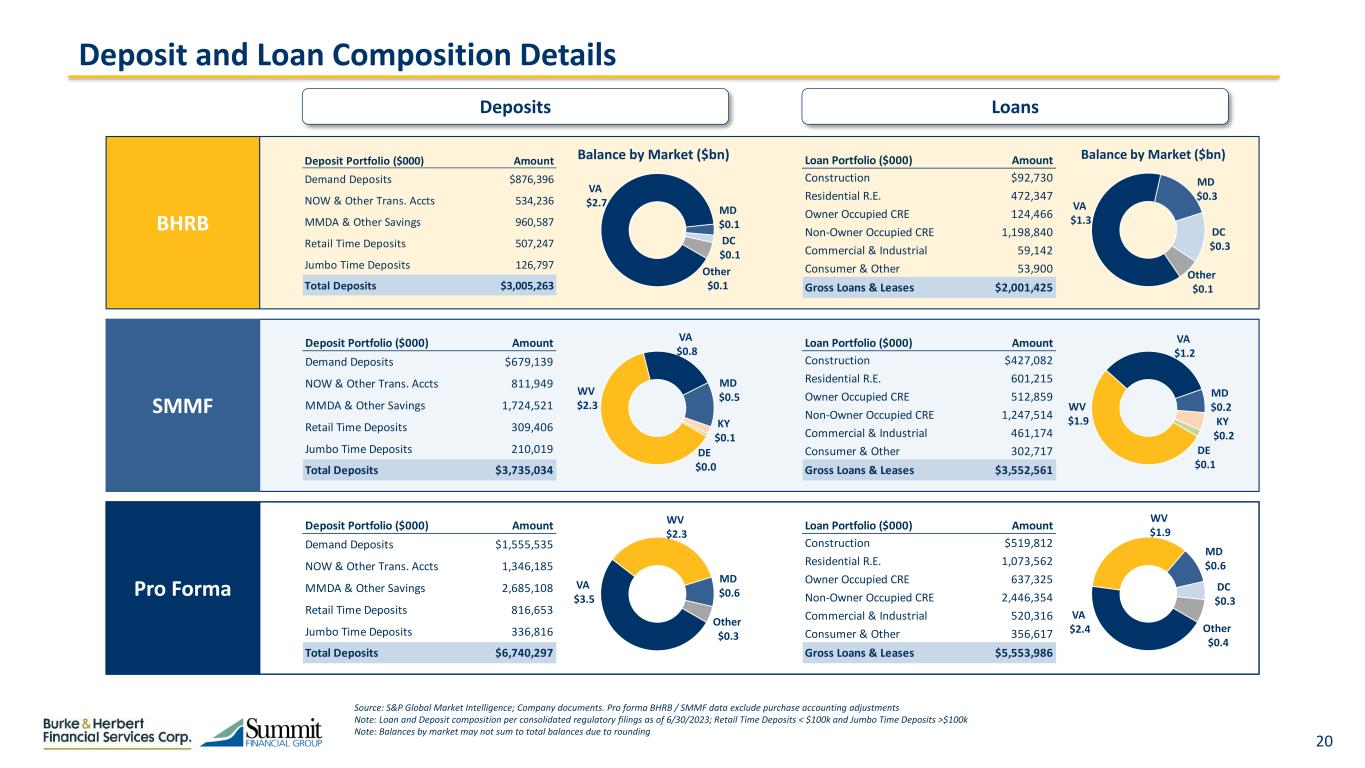
20 Deposit and Loan Composition Details VA $2.7 MD $0.1 DC $0.1 Other $0.1 Source: S&P Global Market Intelligence; Company documents. Pro forma BHRB / SMMF data exclude purchase accounting adjustments Note: Loan and Deposit composition per consolidated regulatory filings as of 6/30/2023; Retail Time Deposits < $100k and Jumbo Time Deposits >$100k Note: Balances by market may not sum to total balances due to rounding Deposits SMMF Pro Forma Deposit Portfolio ($000) Amount Demand Deposits $679,139 NOW & Other Trans. Accts 811,949 MMDA & Other Savings 1,724,521 Retail Time Deposits 309,406 Jumbo Time Deposits 210,019 Total Deposits $3,735,034 BHRB Deposit Portfolio ($000) Amount Demand Deposits $876,396 NOW & Other Trans. Accts 534,236 MMDA & Other Savings 960,587 Retail Time Deposits 507,247 Jumbo Time Deposits 126,797 Total Deposits $3,005,263 Loan Portfolio ($000) Amount Construction $92,730 Residential R.E. 472,347 Owner Occupied CRE 124,466 Non-Owner Occupied CRE 1,198,840 Commercial & Industrial 59,142 Consumer & Other 53,900 Gross Loans & Leases $2,001,425 Loan Portfolio ($000) Amount Construction $427,082 Residential R.E. 601,215 Owner Occupied CRE 512,859 Non-Owner Occupied CRE 1,247,514 Commercial & Industrial 461,174 Consumer & Other 302,717 Gross Loans & Leases $3,552,561 Deposit Portfolio ($000) Amount Demand Deposits $1,555,535 NOW & Other Trans. Accts 1,346,185 MMDA & Other Savings 2,685,108 Retail Time Deposits 816,653 Jumbo Time Deposits 336,816 Total Deposits $6,740,297 Loan Portfolio ($000) Amount Construction $519,812 Residential R.E. 1,073,562 Owner Occupied CRE 637,325 Non-Owner Occupied CRE 2,446,354 Commercial & Industrial 520,316 Consumer & Other 356,617 Gross Loans & Leases $5,553,986 Loans Balance by Market ($bn) Balance by Market ($bn) WV $2.3 VA $0.8 MD $0.5 KY $0.1 DE $0.0 VA $1.3 MD $0.3 DC $0.3 Other $0.1 WV $1.9 VA $1.2 MD $0.2 KY $0.2 DE $0.1 VA $2.4 WV $1.9 MD $0.6 DC $0.3 Other $0.4 VA $3.5 WV $2.3 MD $0.6 Other $0.3
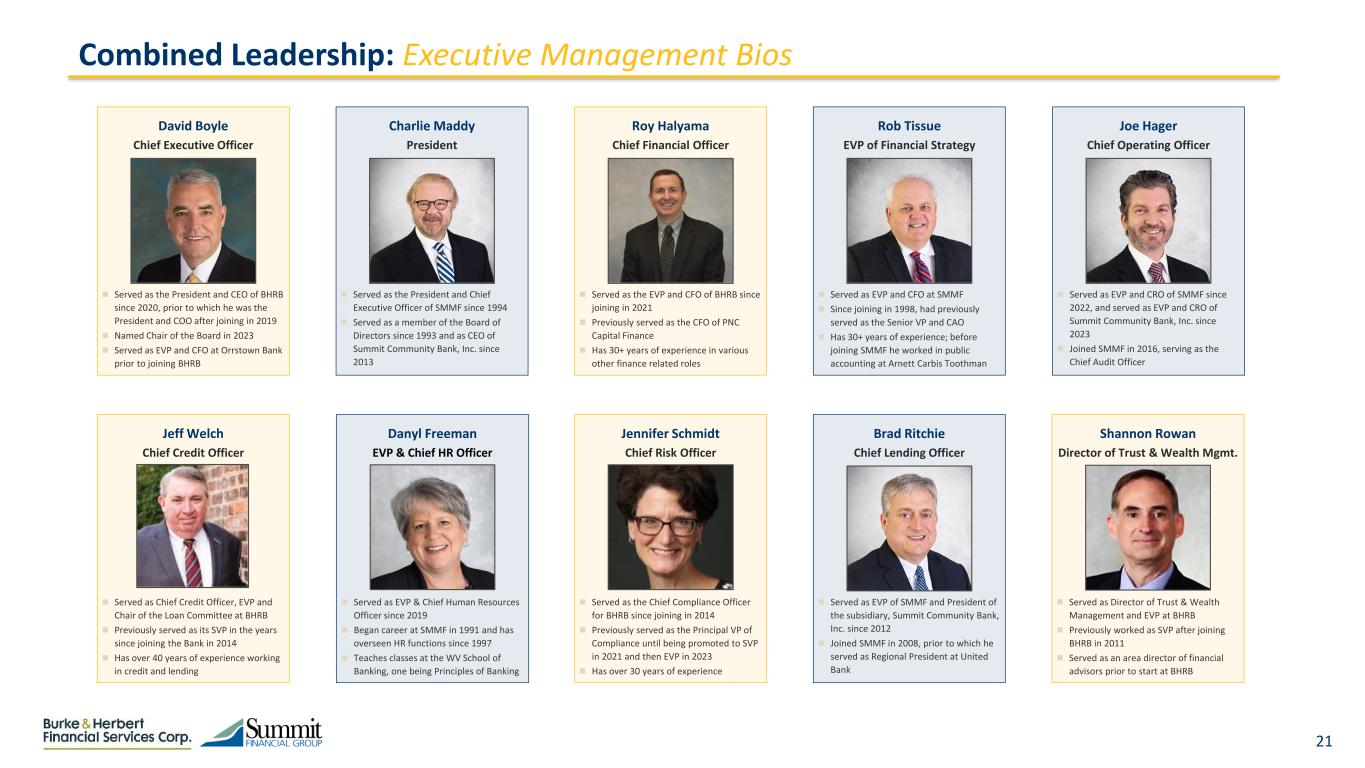
21 Served as the President and CEO of BHRB since 2020, prior to which he was the President and COO after joining in 2019 Named Chair of the Board in 2023 Served as EVP and CFO at Orrstown Bank prior to joining BHRB David Boyle Chief Executive Officer Served as Chief Credit Officer, EVP and Chair of the Loan Committee at BHRB Previously served as its SVP in the years since joining the Bank in 2014 Has over 40 years of experience working in credit and lending Jeff Welch Chief Credit Officer Combined Leadership: Executive Management Bios Served as the President and Chief Executive Officer of SMMF since 1994 Served as a member of the Board of Directors since 1993 and as CEO of Summit Community Bank, Inc. since 2013 Charlie Maddy President Served as EVP and CFO at SMMF Since joining in 1998, had previously served as the Senior VP and CAO Has 30+ years of experience; before joining SMMF he worked in public accounting at Arnett Carbis Toothman Rob Tissue EVP of Financial Strategy Served as EVP of SMMF and President of the subsidiary, Summit Community Bank, Inc. since 2012 Joined SMMF in 2008, prior to which he served as Regional President at United Bank Brad Ritchie Chief Lending Officer Served as EVP and CRO of SMMF since 2022, and served as EVP and CRO of Summit Community Bank, Inc. since 2023 Joined SMMF in 2016, serving as the Chief Audit Officer Joe Hager Chief Operating Officer Served as the EVP and CFO of BHRB since joining in 2021 Previously served as the CFO of PNC Capital Finance Has 30+ years of experience in various other finance related roles Roy Halyama Chief Financial Officer Served as the Chief Compliance Officer for BHRB since joining in 2014 Previously served as the Principal VP of Compliance until being promoted to SVP in 2021 and then EVP in 2023 Has over 30 years of experience Jennifer Schmidt Chief Risk Officer Served as Director of Trust & Wealth Management and EVP at BHRB Previously worked as SVP after joining BHRB in 2011 Served as an area director of financial advisors prior to start at BHRB Shannon Rowan Director of Trust & Wealth Mgmt. Served as EVP & Chief Human Resources Officer since 2019 Began career at SMMF in 1991 and has overseen HR functions since 1997 Teaches classes at the WV School of Banking, one being Principles of Banking Danyl Freeman EVP & Chief HR Officer

22 Pro Forma Net Income Reconciliation Pro Forma Earnings Reconciliation Earnings Buildup ($mm) 2024E Dollars in millions, except per share data Pro Forma Combined Net Income to Common (1) 86.2 After - Tax Transaction Adjustments Cost Savings - Fully Realized 14.6 Opportunity Cost of Cash (1.8) Benefit of Trust Preferred Redemption (2) 0.4 Accretion of HTM Interest Rate Mark and AOCI 8.1 Accretion of Other Interest Rate Marks 18.2 Accretion of Non-PCD Credit Mark 5.1 Core Deposit Amortization from Transaction (12.7) Pro Forma Net Income to Common 118.1$ Pro Forma Average Diluted Shares 14.9 Price / PF EPS Pro Forma EPS - Incl. Rate Accretion $7.90 6.3x (3) $86.2 $21.3 $23.3 ($12.7) $118.1 Combined Net Income to Common Cost Savings, Securities Related Accretion & BS Repositioning Other Accretion & Rate Mark Related Adjustments CDI Impacts Pro Forma Net Income (4) Source: S&P Global Market Intelligence, FactSet Research Systems (1) Based on internal company estimates for BHRB and consensus 2024 estimates for SMMF, as adjusted for loss of income from interest rate derivative positions (2) Assumes redemption of SMMF’s $19.6mm Trust Preferred at close (3) Based on BHRB’s market price of $49.98 as of 8/23/2023 (4) Includes cost savings, opportunity cost of cash, benefit of trust preferred redemption and accretion of HTM securities interest rate mark and AOCI (5) Includes accretion of interest rate marks on loans, leases, time deposits and subordinated debt and non-PCD credit mark (5)

23 48 62 54 22 11 13 1.4 0.8 1.1 Post-Transaction Peers include public banks headquartered in the Mid-Atlantic and Southeast regions with total assets between $5 billion and $10 billion Source: S&P Global Market Intelligence, FactSet Research Systems. Estimate data as of 8/23/2023. Peers exclude merger targets and mutual holding companies; Represents 18 total peers Note: Pro forma 2024 data estimates 50% cost saves phase-in. Peer estimates per Factset consensus 2024 ROAA (%) Pro Forma Peer Median Peer Top Quartile Stacking up vs. Post-Transaction Peers 2024 ROATCE (%) 2024 Efficiency Ratio (%) Ranks 2nd Amongst Post-Transaction Peers Ranks 2nd Amongst Post-Transaction Peers Ranks 3rd Amongst Post-Transaction Peers

24 Source: S&P Global Market Intelligence & Company Documents Non – GAAP Reconciliation: SMMF SMMF Dollar values in thousands YTD 6/30/2023 Unadjusted Earnings Net Income 22,310$ Less: Preferred Stock Dividends 450 Net Income to Common 21,860 Core Adjustments Plus: Realized Loss on AFS Debt Securities 270 Less: Net Gains on Equity Investments 195 Plus: Nonrecurring Acquisition Related Expenses 4,494 Plus: Amortization of Intangibles & Goodwill Impairment 1,342 Plus: CECL Day-2 Provision Related to PSB Acquisition 3,005 Core Income (Pre-Tax) 31,226 Core Income to Common (Pre-Tax) 30,776 Memo: Tax Rate 20.6% Core Net Income (After-Tax) 29,392 Core Net Income to Common (After-Tax) 28,942 Balance Sheet Average Assets 4,235,387 Average Tangible Common Equity 306,454 Core Return Metrics Core ROAA 1.39% Core ROATCE 18.9%


