| FREE WRITING PROSPECTUS | ||
| FILED PURSUANT TO RULE 433 | ||
| REGISTRATION FILE NO.: 333-260277-03 | ||
March 28, 2023
BENCHMARK 2023-B38
Mortgage Trust
Free Writing Prospectus
Structural and Collateral Term Sheet
$656,890,689
(Approximate Total Mortgage Pool Balance)
$562,421,000
(Approximate Offered Certificates)
| Deutsche Mortgage & Asset Receiving Corporation Depositor |
Commercial Mortgage Pass-Through Certificates
Series 2023-B38
| German American Capital Corporation |
| Goldman Sachs Mortgage Company |
| JPMorgan Chase Bank, National Association |
| Citi Real Estate Funding Inc. |
As Sponsors and Mortgage Loan Sellers
| Deutsche Bank Securities | J.P. Morgan | Citigroup | Goldman Sachs & Co. LLC |
Co-Lead Managers and Joint Bookrunners
| AmeriVet Securities | Drexel Hamilton |
Co-Managers
The depositor has filed a registration statement (including the prospectus) with the Securities and Exchange Commission (File No. 333-260277) for the offering to which this communication relates. Before you invest, you should read the prospectus in the registration statement and other documents the depositor has filed with the Securities and Exchange Commission for more complete information about the depositor, the issuing entity and this offering. You may get these documents for free by visiting EDGAR on the Securities and Exchange Commission website at www.sec.gov. Alternatively, the depositor or Deutsche Bank Securities Inc., any other underwriter, or any dealer participating in this offering will arrange to send you the prospectus if you request it by calling toll-free 1-800-503-4611 or by emailing: prospectus.cpdg@db.com. The offered certificates referred to in these materials, and the asset pool backing them, are subject to modification or revision (including the possibility that one or more classes of certificates may be split, combined or eliminated at any time prior to issuance or availability of a final prospectus) and are offered on a “when, as and if issued” basis. You understand that, when you are considering the purchase of these certificates, a contract of sale will come into being no sooner than the date on which the relevant class has been priced and we have verified the allocation of certificates to be made to you; any “indications of interest” expressed by you, and any “soft circles” generated by us, will not create binding contractual obligations for you or us. This free writing prospectus does not contain all information that is required to be included in the prospectus.
Benchmark 2023-B38 Mortgage Trust
Capitalized terms used but not defined herein have the meanings assigned to them in the Preliminary Prospectus expected to be dated March 27, 2023 relating to the offered certificates (hereinafter referred to as the “Preliminary Prospectus”).
| KEY FEATURES OF SECURITIZATION |
| Offering Terms: | |
| Co-Lead Managers and Joint Bookrunners: | Deutsche Bank Securities Inc., Goldman Sachs & Co. LLC, J.P. Morgan Securities LLC and Citigroup Global Markets Inc. |
| Co-Managers: | AmeriVet Securities, Inc. and Drexel Hamilton, LLC |
| Sponsors and Mortgage Loan Sellers: | German American Capital Corporation* (“GACC”) (18.8%), Goldman Sachs Mortgage Company (“GSMC”) (39.4%), JPMorgan Chase Bank, National Association (“JPMCB”) (22.1%) and Citi Real Estate Funding Inc. (“CREFI”) (19.8%) *An indirect wholly owned subsidiary of Deutsche Bank AG |
| Master Servicer: | Midland Loan Services, a Division of PNC Bank, National Association |
| Operating Advisor: | Park Bridge Lender Services LLC |
| Asset Representations Reviewer: | Park Bridge Lender Services LLC |
| General Special Servicer: | LNR Partners, LLC |
| Pacific Design Center Special Servicer: | Argentic Services Company LP |
| Certificate Administrator: | Computershare Trust Company, N.A. |
| Trustee: | Computershare Trust Company, N.A. |
| Rating Agencies: | Fitch Ratings, Inc. (“Fitch”), Kroll Bond Rating Agency, LLC (“KBRA”) and Moody’s Investors Service, Inc. (“Moody’s”). |
| Credit Risk Retention: | For a discussion on the manner in which the U.S. credit risk retention requirements are being satisfied by GACC, as retaining sponsor, see “Credit Risk Retention” in the Preliminary Prospectus. Note that this securitization transaction is not being structured to satisfy EU/UK risk retention and due diligence requirements. |
| Determination Date: | 11th day of each month, or if such 11th day is not a business day, the immediately following business day, commencing in May 2023. |
| Distribution Date: | 4th business day following the Determination Date in each month, commencing in May 2023. |
| Cut-off Date: | With respect to each mortgage loan, the later of the related payment date of such mortgage loan in April 2023 (or, in the case of any mortgage loan that has its first due date subsequent to April 2023, the date that would have been its due date in April 2023 under the terms of that mortgage loan if a monthly payment were scheduled to be due in that month) and the date of origination of such mortgage loan. Unless otherwise noted, all mortgage loan statistics are based on balances as of the Cut-off Date. |
| Closing Date: | On or about April 21, 2023 |
| Settlement Terms: | DTC, Euroclear and Clearstream, same day funds, with accrued interest. |
| ERISA Eligible: | All of the Offered Certificates are expected to be ERISA eligible. |
| SMMEA Eligible: | None of the Offered Certificates will be SMMEA eligible. |
| Day Count: | 30/360 |
| Tax Treatment: | REMIC |
| Rated Final Distribution Date: | April 2056 |
| Minimum Denominations: | $10,000 (for each class of offered principal balance certificates) and $100,000 (for each class of offered interest-only certificates) and in each case in multiples of $1 thereafter. |
| Clean-up Call: | 1% (with certain exceptions described under “Pooling and Servicing Agreement—Termination; Retirement of Certificates” in the Preliminary Prospectus) |
| Distribution of Collateral by Property Type |

| THE INFORMATION IN THIS STRUCTURAL AND COLLATERAL TERM SHEET IS NOT COMPLETE AND MAY BE AMENDED PRIOR TO THE TIME OF SALE. THIS TERM SHEET IS NOT AN OFFER TO SELL THESE SECURITIES AND IT IS NOT A SOLICITATION OF AN OFFER TO BUY THESE SECURITIES IN ANY JURISDICTION WHERE THE OFFER OR SALE IS NOT PERMITTED. | ||
| 2 | ||
Benchmark 2023-B38 Mortgage Trust
| Overview of Mortgage Pool Characteristics | ||||
| Mortgage Loan Sellers | Number of Mortgage Loans | Number of Mortgaged Properties | Aggregate Cut-off Date Balance | % of Initial Outstanding Pool Balance |
| German American Capital Corporation | 5 | 10 | $83,378,471 | 12.7% |
| Goldman Sachs Mortgage Company | 6 | 6 | $198,750,000 | 30.3% |
| JPMorgan Chase Bank, National Association | 4 | 4 | $144,972,500 | 22.1% |
| Citi Real Estate Funding Inc. | 8 | 20 | $129,789,718 | 19.8% |
| Goldman Sachs Mortgage Company / German American Capital Corporation(1)(2) | 2 | 2 | $100,000,000 | 15.2% |
| Total: | 25 | 42 | $656,890,689 | 100.0% |
Collateral Facts | ||||
| Initial Outstanding Pool Balance: | $656,890,689 | |||
| Number of Mortgage Loans: | 25 | |||
| Number of Mortgaged Properties: | 42 | |||
| Average Mortgage Loan Cut-off Date Balance: | $26,275,628 | |||
| Weighted Average Mortgage Rate: | 6.26691% | |||
| Weighted Average Mortgage Loan Original Term to Maturity Date or ARD (months): | 99 | |||
| Weighted Average Mortgage Loan Remaining Term to Maturity Date or ARD (months): | 95 | |||
| Weighted Average Mortgage Loan Seasoning (months): | 4 | |||
| % of Mortgaged Properties Leased to a Single Tenant: | 16.3% | |||
Credit Statistics(3) | ||||
| Weighted Average Mortgage Loan U/W NCF DSCR: | 1.95x | |||
| Weighted Average Mortgage Loan Cut-off Date LTV(4): | 50.1% | |||
| Weighted Average Mortgage Loan Maturity Date or ARD LTV(4): | 49.1% | |||
| Weighted Average U/W NOI Debt Yield: | 13.5% | |||
Amortization Overview | ||||
| % Mortgage Loans with Amortization through Maturity Date or ARD: | 17.4% | |||
| % Mortgage Loans which pay Interest Only through Maturity or ARD Date: | 81.2% | |||
| % Mortgage Loans which pay Interest Only followed by Amortization through Maturity Date or ARD: | 1.5% | |||
| Weighted Average Remaining Amortization Term (months)(5): | 352 | |||
Loan Structural Features | ||||
| % Mortgage Loans with Upfront or Ongoing Tax Reserves: | 50.5% | |||
| % Mortgage Loans with Upfront or Ongoing Insurance Reserves: | 21.8% | |||
| % Mortgage Loans with Upfront or Ongoing Replacement Reserves(6): | 53.7% | |||
| % Mortgage Loans with Upfront or Ongoing TI/LC Reserves(7): | 72.9% | |||
| % Mortgage Loans with In Place Hard Lockboxes: | 91.3% | |||
| % Mortgage Loans with Cash Traps Triggered at DSCR Levels ≥ 1.15x: | 72.0% | |||
| % Mortgage Loans with Cash Traps Triggered at Debt Yield Levels ≥ 8.0%: | 41.7% | |||
| Prepayment Provisions(8) | ||||
| % Mortgage Loans with Defeasance Only After a Lockout Period and Prior to an Open Period: | 61.2% | |||
| % Mortgage Loans with Prepayment Only After a Lockout Period and Prior to an Open Period with Defeasance and/or a Yield Maintenance Charge: | 28.9% | |||
| % Mortgage Loans with Prepayment Only After a Lockout Period and Prior to an Open Period with a Yield Maintenance Charge: | 9.9% | |||
| (1) | Includes a $50.0 million non-control pari passu portion of the Green Acres mortgage loan, as to which GSMC is acting as mortgage loan seller of approximately $32.5 million and GACC is acting as the mortgage loan seller of approximately $17.5 million. |
| (2) | Includes a $50.0 million control pari passu portion of the Great Lakes Crossing Outlets mortgage loan, as to which GSMC is acting as mortgage loan seller of approximately $27.5 million and GACC is acting as the mortgage loan seller of approximately $22.5 million. |
| (3) | The LTV, DSCR and Debt Yield calculations include any related pari passu companion loan(s) and exclude any related subordinate companion loan(s) and/or mezzanine loan(s). |
| (4) | With respect to four mortgage loans (20.8%) (CX – 250 Water Street (8.1%), 100 Jefferson Road (4.6%), 9200 Calumet Industrial (4.5%) and Crowne Plaza Union Station (3.7%)), the Cut-off Date LTV and Maturity Date or ARD LTV have been calculated using a value other than the “As Is” appraised value. For additional information please see the footnotes to Annex A-1 in the Preliminary Prospectus. |
| (5) | Excludes mortgage loans which are interest only for the full loan term. |
| (6) | Includes FF&E reserves. |
| (7) | Represents the percent of the allocated Initial Outstanding Pool Balance of office, retail, industrial and mixed use properties only structured with TI/LC reserves. |
| (8) | Please see Annex A-1 of the Preliminary Prospectus for more information. |
| THE INFORMATION IN THIS STRUCTURAL AND COLLATERAL TERM SHEET IS NOT COMPLETE AND MAY BE AMENDED PRIOR TO THE TIME OF SALE. THIS TERM SHEET IS NOT AN OFFER TO SELL THESE SECURITIES AND IT IS NOT A SOLICITATION OF AN OFFER TO BUY THESE SECURITIES IN ANY JURISDICTION WHERE THE OFFER OR SALE IS NOT PERMITTED. | ||
| 3 | ||
Benchmark 2023-B38 Mortgage Trust
| STRUCTURE SUMMARY |
OFFERED CERTIFICATES
| Class(1) | Ratings (Moody’s/Fitch/KBRA) | Initial Certificate Balance or Notional Amount(2) | Initial Subordination | Weighted Average Life (years)(4) | Principal Window (months)(4) | Certificate Principal to Value Ratio(5) | Certificate Underwritten NOI Debt Yield(6) | |
| Class A-1 | Aaa(sf) / AAAsf / AAA(sf) | $6,484,000 | 30.000%(7) | 2.52 | 1 – 56 | 35.1% | 19.3% | |
| Class A-2 | Aaa(sf) / AAAsf / AAA(sf) | $201,433,000 | 30.000%(7) | 4.86 | 56 – 60 | 35.1% | 19.3% | |
| Class A-3 | Aaa(sf) / AAAsf / AAA(sf) | $50,784,000 | 30.000%(7) | 6.75 | 79 – 84 | 35.1% | 19.3% | |
| Class A-SB | Aaa(sf) / AAAsf / AAA(sf) | $4,164,000 | 30.000%(7) | 6.92 | 60 – 111 | 35.1% | 19.3% | |
| Class A-4 | Aaa(sf) / AAAsf / AAA(sf) | $173,967,000 | 30.000%(7) | 9.64 | 111 – 118 | 35.1% | 19.3% | |
| Class X-A(8) | Aa1(sf) / AAAsf / AAA(sf) | $507,037,000 | (9) | N/A | N/A | N/A | N/A | N/A |
| Class A-M | Aa1(sf) / AAAsf / AAA(sf) | $70,205,000 | 18.750% | 9.82 | 118 – 118 | 40.7% | 16.6% | |
| Class B | Aa3(sf) / AA-sf / AA-(sf) | $31,202,000 | 13.750% | 9.86 | 118 – 119 | 43.2% | 15.7% | |
| Class C | A3(sf) / A-sf / A-(sf) | $24,182,000 | 9.875% | 9.97 | 119 – 120 | 45.2% | 15.0% | |
NON-OFFERED CERTIFICATES
| Class(1) | Ratings (Moody’s/Fitch/KBRA) | Initial Certificate Balance or Notional Amount (2) | Initial Subordination | Weighted Average Life (years)(4) | Principal Window (months)(4) | Certificate Principal to Value Ratio(5) | Certificate Underwritten NOI Debt Yield(6) | |
| Class X-D(8) | Baa3(sf) / BBB-sf / BBB-(sf) | $21,062,000 | (9) | N/A | N/A | N/A | N/A | N/A |
| Class X-F(8) | Ba1(sf) / BB-sf / BB(sf) | $12,481,000 | (9) | N/A | N/A | N/A | N/A | N/A |
| Class X-G(8) | B2(sf) / NR / B-(sf) | $10,140,000 | (9) | N/A | N/A | N/A | N/A | N/A |
| Class X-H(8) | NR / NR / NR | $17,942,153 | (9) | N/A | N/A | N/A | N/A | N/A |
| Class D | Baa2(sf) / BBBsf / BBB(sf) | $14,821,000 | 7.500% | 9.98 | 120 – 120 | 46.3% | 14.6% | |
| Class E | Baa3(sf) / BBB-sf / BBB-(sf) | $6,241,000 | 6.500% | 9.98 | 120 – 120 | 46.8% | 14.4% | |
| Class F | Ba1(sf) / BB-sf / BB(sf) | $12,481,000 | 4.500% | 9.98 | 120 – 120 | 47.8% | 14.1% | |
| Class G | B2(sf) / NR / B-(sf) | $10,140,000 | 2.875% | 9.98 | 120 – 120 | 48.7% | 13.9% | |
| Class H | NR / NR / NR | $17,942,153 | 0.000% | 9.98 | 120 – 120 | 50.1% | 13.5% | |
NON-OFFERED LOAN-SPECIFIC CERTIFICATES
| Class(1) | Ratings (Fitch) | Initial Certificate Balance(2) | Initial Subordination | Weighted Average Life (years)(4) | Principal Window (months)(4) | Certificate Principal to Value Ratio(10) | Certificate Underwritten NOI Debt Yield(11) | |
| Class PDC-A1(12) | BBsf | $10,000,000 | 3.774% | 9.82 | 118 – 118 | 49.8% | 13.2% | |
| Class PDC-A2(12) | BBsf | $9,000,000 | 0.377% | 9.82 | 118 – 118 | 51.5% | 12.8% | |
| Class PDC-HRR(12) | BBsf | $1,000,000 | 0.000% | 9.82 | 118 – 118 | 51.7% | 12.7% | |
NON-OFFERED VERTICAL RISK RETENTION INTEREST
| Non-Offered Vertical Risk Retention Interest | Ratings (Moody’s/Fitch/KBRA) | Initial Certificate Balance or Interest Balance | Initial Subordination | Weighted Average Life (years)(13) | Principal Window (months)(13) | Certificate Principal to Value Ratio | Certificate Underwritten NOI Debt Yield | |
| Class RR(14)(15) | NR / NR / NR | $12,658,410 | N/A | 7.85 | 1 – 120 | N/A | N/A | |
| RR Interest(14)(15) | NR / NR / NR | $20,186,125 | N/A | 7.85 | 1 – 120 | N/A | N/A | |
| (1) | The pass-through rates for the Class A-1, Class A-2, Class A-3, Class A-SB, Class A-4, Class A-M, Class B, Class C, Class D, Class E, Class F, Class G and Class H certificates (collectively, the “Pooled Principal Balance Certificates”) in each case, will be one of: (i) a fixed per annum rate, (ii) the weighted average of the net mortgage rates on the mortgage loans (in each case, adjusted, if necessary, to accrue on the basis of a 360-day year consisting of twelve 30-day months) as of their respective due dates in the month preceding the month in which such Distribution Date occurs (the “WAC Rate”), (iii) a rate equal to the lesser of a specified pass-through rate and the WAC Rate or (iv) the WAC Rate less a specified rate, but in any case not less than 0.000%. The pass-through rates applicable to the Class PDC-A1, Class PDC-A2 and Class PDC-HRR certificates (collectively, the “Loan-Specific Certificates”), in each case, will be a per annum rate equal the net mortgage rate applicable to the trust subordinate companion loan related to the Pacific Design Center whole loan (the “Trust Subordinate Companion Loan”). |
| (2) | Approximate; subject to a variance of plus or minus 5%. The VRR Interest Balance of the VRR Interest is not included in the Certificate Balance or Notional Amount of any Class of Certificates set forth under "Offered Certificates" or "Non-Offered Certificates" in the table above. |
| (3) | The initial subordination levels are calculated based on the initial Certificate Balance. The approximate initial credit support percentage for each class of Pooled Principal Balance Certificates does not include the subordination provided by the Trust Subordinate Companion Loan. None of the Loan-Specific Certificates will provide credit support to any other class of certificates, except to the extent of the subordination of the Trust Subordinate Companion Loan (in which the Loan-Specific Certificates each represent an interest) to the Pacific Design Center mortgage loan. The initial credit support percentages of the Loan-Specific Certificates are based on the Pacific Design Center whole loan. The approximate initial credit support percentages shown in the table above do not take into account the VRR Interest. However, losses incurred on the mortgage loans will be allocated between the VRR Interest and the Pooled Principal Balance Certificates, pro rata in accordance with their respective percentage allocation entitlement. See “Credit Risk Retention” and “Description of the Certificates” in the Preliminary Prospectus. |
| (4) | The weighted average life and principal window during which distributions of principal would be received as set forth in the table with respect to each class of Pooled Principal Balance Certificates and the Loan-Specific Certificates are based on (i) modeling assumptions described in the Preliminary Prospectus and Loan-Specific PPM, as applicable, and (ii) assumptions that there are no prepayments, modifications or losses in respect of the mortgage loans and there are no extensions or forbearances of maturity dates or anticipated repayment dates of the mortgage loans (or, in the case of the Loan-Specific Certificates, the Trust Subordinate Companion Loan). |
| (5) | “Certificate Principal to Value Ratio” for any class of Pooled Principal Balance Certificates is calculated as the product of (a) the weighted average mortgage loan Cut-off Date LTV of the mortgage loans, multiplied by (b) a fraction, the numerator of which is the total initial Certificate Balance of the related class of Pooled Principal Balance Certificates and all other classes of Pooled Principal Balance Certificates, if any, that are senior to such class (and the VRR Interest Balance of any portion of the VRR Interest that is considered to be pari passu or senior to such class), and the denominator of which is the total initial Certificate Balance of all classes of Pooled Principal Balance Certificates and the initial VRR Interest Balance of the VRR Interest. The Certificate Principal to Value Ratios of the Class A-1, Class A-2, Class A-3, Class A-SB and Class A-4 certificates are calculated in the aggregate for those classes as if they were a single class. |
| (6) | “Certificate Underwritten NOI Debt Yield” for any class of Pooled Principal Balance Certificates is calculated as the product of (a) the weighted average Underwritten NOI Debt Yield for the mortgage loans, multiplied by (b) a fraction, the numerator of which is the total initial Certificate Balance of all classes of Pooled Principal Balance Certificates and the initial VRR Interest Balance of the VRR Interest and the denominator of which is the total initial Certificate Balance of such class of Pooled Principal Balance Certificates and all other classes of Pooled Principal Balance Certificates, if any, that are senior to such class (and the VRR Interest Balance of any portion of the VRR Interest that is considered to be pari passu or senior to such class). The Underwritten NOI Debt Yields of the Class A-1, Class A-2, Class A-3, Class A-SB and Class A-4 certificates are calculated in the aggregate for those classes as if they were a single class. |
| (7) | The initial subordination levels for the Class A-1, Class A-2, Class A-3, Class A-SB and Class A-4 certificates are represented in the aggregate. |
| (8) | As further described in the Preliminary Prospectus, the pass-through rate applicable to the Class X-A, Class X-D, Class X-F, Class X-G and Class X-H certificates (collectively, the “Class X Certificates” and, together with the Pooled Principal Balance Certificates and Class S Certificates, the “Non-VRR Certificates” and, together with the Class RR Certificates, the “Pooled Certificates”) for each Distribution Date will generally be equal to the excess of (i) the WAC Rate over (ii)(A) with respect to the Class X-A certificates, the weighted average of the pass-through rates of the Class A-1, Class |
| THE INFORMATION IN THIS STRUCTURAL AND COLLATERAL TERM SHEET IS NOT COMPLETE AND MAY BE AMENDED PRIOR TO THE TIME OF SALE. THIS TERM SHEET IS NOT AN OFFER TO SELL THESE SECURITIES AND IT IS NOT A SOLICITATION OF AN OFFER TO BUY THESE SECURITIES IN ANY JURISDICTION WHERE THE OFFER OR SALE IS NOT PERMITTED. | ||
| 4 | ||
Benchmark 2023-B38 Mortgage Trust
| STRUCTURE SUMMARY |
A-2, Class A-3, Class A-SB, Class A-4 and Class A-M certificates (based on their respective Certificate Balances outstanding immediately prior to such Distribution Date), (B) with respect to the Class X-D certificates, the weighted average of the pass-through rates of the Class D and Class E certificates (based on their respective Certificate Balances outstanding immediately prior to such Distribution Date), (C) with respect to the Class X-F certificates, the pass-through rate of the Class F certificates, (D) with respect to the Class X-G certificates, the pass-through rate of the Class G certificates and (E) with respect to the Class X-H certificates, the pass-through rate of the Class H certificates.
| (9) | The Class X Certificates will not have Certificate Balances. None of the Class X Certificates will be entitled to distributions of principal. The interest accrual amounts on the Class X-A certificates will be calculated by reference to a notional amount equal to the aggregate Certificate Balances of the Class A-1, Class A-2, Class A-3, Class A-SB, Class A-4 and Class A-M certificates. The interest accrual amounts on the Class X-D certificates will be calculated by reference to a notional amount equal to the aggregate Certificate Balances of the Class D and Class E certificates. The interest accrual amounts on the Class X-F certificates will be calculated by reference to a notional amount equal to the Certificate Balance of the Class F certificates. The interest accrual amounts on the Class X-G certificates will be calculated by reference to a notional amount equal to the Certificate Balance of the Class G certificates. The interest accrual amounts on the Class X-H certificates will be calculated by reference to a notional amount equal to the Certificate Balance of the Class H certificates. The notional amount of each class of Class X Certificates is subject to change depending upon the final pricing of the Pooled Principal Balance Certificates, as follows: (1) if as a result of such pricing the pass-through rate of any class of Pooled Principal Balance Certificates whose Certificate Balance comprises such notional amount is equal to the WAC Rate, the Certificate Balance of such class of Pooled Principal Balance Certificates may not be part of, and will reduce accordingly, such notional amount of such class of Class X Certificates (or, if as a result of such pricing the pass-through rate of such class of Class X Certificates is equal to zero, such class of Class X Certificates may not be issued on the Closing Date), and/or (2) if as a result of such pricing the pass-through rate of any class of Pooled Principal Balance Certificates that does not comprise such notional amount of such class of Class X Certificates is less than the WAC Rate, such class of Pooled Principal Balance Certificates may become a part of, and increase accordingly, such notional amount of such class of Class X Certificates. |
| (10) | The “Certificate Principal to Value Ratio” for any class of Loan-Specific Certificates is (x) the sum of (i) the initial Certificate Balance of such class of Loan-Specific Certificates and all other classes of Loan-Specific Certificates, if any, that are senior to such class and (ii) the principal balance as of the Cut-off Date of the Pacific Design Center Senior Notes divided by (y) $512,500,000, which represents the appraised value (based on certain extraordinary assumptions as described under “Description of the Mortgage Pool—Appraised Value” in the Preliminary Prospectus) of the Pacific Design Center Mortgaged Property as of November 17, 2022. |
| (11) | The “Certificate Underwritten NOI Debt Yield” for any class of Loan-Specific Certificates means, (x) the Pacific Design Center Mortgage Loan Underwritten NOI of $33,781,880 divided by (y) the sum of (i) the initial Certificate Balance of such class of Loan-Specific Certificates and all other classes of Loan-Specific Certificates, if any, that are senior to such class and (ii) the principal balance as of the Cut-off Date of the Pacific Design Center Senior Notes. |
| (12) | The Loan-Specific Certificates will only be entitled to receive distributions from, and will only incur losses with respect to, the Trust Subordinate Companion Loan. The Trust Subordinate Companion Loan will be included as an asset of the issuing entity but will not be part of the mortgage pool backing the Pooled Certificates or the RR Interest. No class of Pooled Certificates or the RR Interest will have any interest in the Trust Subordinate Companion Loan. See “Description of the Mortgage Pool—The Whole Loans—The Serviced AB Whole Loan—Pacific Design Center Whole Loan” in the Preliminary Prospectus. |
| (13) | The weighted average life and principal window during which distributions of principal would be received as set forth in the foregoing table with respect to the VRR Interest (as defined below) are based on the assumptions set forth under “Yield and Maturity Considerations—Weighted Average Life” in the Preliminary Prospectus and on the assumptions that there are no prepayments, modifications or losses in respect of the mortgage loans and that there are no extensions or forbearances of maturity dates or anticipated repayment dates of the mortgage loans. |
| (14) | German American Capital Corporation, as the retaining sponsor, is expected to acquire from the depositor, on the Closing Date, an “eligible vertical interest” (as defined in Regulation RR) in the form of a single vertical security comprised of the Class RR certificates and the RR interest (collectively, the “VRR Interest”), representing approximately (but not less than) 5.00% of all amounts collected on the mortgage loans (net of expenses of the issuing entity) that are available for distribution on the Non-VRR Certificates and the VRR Interest. A portion of the VRR Interest will be retained by each of German American Capital Corporation or its “majority-owned affiliate”, JPMCB and Goldman Sachs Bank USA in accordance with the credit risk retention rules applicable to the pooled securitization transaction. See “Credit Risk Retention” in the Preliminary Prospectus. |
| (15) | Although it does not have a specified pass-through rate (other than for tax reporting purposes), the effective interest rate for the Class RR Certificates and the RR Interest will be the WAC rate. |
| Class A-2 Principal Paydown(1) |
| Class | Mortgage Loan Seller | Mortgage Loan | Property Type | Cut-off Date Balance | Remaining Term to Maturity (Mos.) | Cut-off Date LTV Ratio | U/W NCF DSCR | U/W NOI Debt Yield | |
| A-2 | JPMCB | 1201 Third Avenue | Office | $60,000,000 | 59 | 30.5% | 2.76x | 17.7% | |
| A-2 | GSMC, GACC | Green Acres | Retail | $50,000,000 | 57 | 54.5% | 2.10x | 13.0% | |
| A-2 | GSMC | Scottsdale Fashion Square | Retail | $49,000,000 | 59 | 38.4% | 1.92x | 12.3% | |
| A-2 | CREFI | National Warehouse & Distribution Portfolio | Industrial | $35,000,000 | 60 | 56.7% | 1.54x | 13.0% | |
| A-2 | GACC | Sentinel Square II | Office | $10,000,000 | 56 | 62.3% | 1.47x | 9.1% | |
| A-2 | GACC | Centers of High Point | Mixed Use | $9,642,857 | 58 | 67.2% | 2.03x | 16.5% | |
| (1) | This table reflects the mortgage loans whose balloon payments will be applied to pay down the Class A-2 certificates, assuming (i) that none of the mortgage loans experience prepayments, defaults or losses, (ii) there are no extensions of maturity dates and (iii) each mortgage loan is paid in full on its stated maturity date. See “Yield and Maturity Considerations—Yield Considerations” in the Preliminary Prospectus. |
| Class A-3 Principal Paydown(1) |
| Class | Mortgage Loan Seller | Mortgage Loan | Property Type | Cut-off Date Balance | Remaining Term to Maturity (Mos.) | Cut-off Date LTV Ratio(2) | U/W NCF DSCR | U/W NOI Debt Yield | |
| A-3 | CREFI | 9200 Calumet Industrial | Industrial | $29,500,000 | 79 | 47.1% | 1.57x | 11.9% | |
| A-3 | GACC | Naugatuck Valley Shopping Center | Retail | $27,749,936 | 84 | 66.2% | 1.49x | 11.1% | |
| (1) | This table reflects the mortgage loans whose balloon payments will be applied to pay down the Class A-3 certificates, assuming (i) that none of the mortgage loans experience prepayments, defaults or losses, (ii) there are no extensions of maturity dates and (iii) each mortgage loan is paid in full on its stated maturity date. See “Yield and Maturity Considerations—Yield Considerations” in the Preliminary Prospectus. |
| (2) | With respect to the 9200 Calumet Industrial mortgage loan, the Cut-off Date LTV has been calculated using a value other than the “As Is” appraised value. For additional information please see the footnotes to Annex A-1 in the Preliminary Prospectus. |
| THE INFORMATION IN THIS STRUCTURAL AND COLLATERAL TERM SHEET IS NOT COMPLETE AND MAY BE AMENDED PRIOR TO THE TIME OF SALE. THIS TERM SHEET IS NOT AN OFFER TO SELL THESE SECURITIES AND IT IS NOT A SOLICITATION OF AN OFFER TO BUY THESE SECURITIES IN ANY JURISDICTION WHERE THE OFFER OR SALE IS NOT PERMITTED. | ||
| 5 | ||
Benchmark 2023-B38 Mortgage Trust
| OVERVIEW OF MORTGAGE POOL CHARACTERISTICS |
| Ten Largest Mortgage Loans | |||||||||
| Mortgage Loan | Mortgage Loan Seller | City, State | Property Type | Mortgage Loan Cut-off Date | % of Initial Outstanding Pool Balance | Cut-off Date Balance per NRA/Unit(1) | Cut-off Date LTV(1)(2) | U/W NCF DSCR after IO(1) | U/W NOI Debt Yield(1) |
| Pacific Design Center | GSMC | West Hollywood, CA | Mixed Use | $65,600,000 | 9.99% | $233 | 47.8% | 2.17x | 13.8% |
| 1201 Third Avenue | JPMCB | Seattle, WA | Office | $60,000,000 | 9.1% | $150 | 30.5% | 2.76x | 17.7% |
| CX - 250 Water Street | GSMC | Cambridge, MA | Mixed Use | $53,150,000 | 8.1% | $1,110 | 48.8% | 1.66x | 9.3% |
| Green Acres | GSMC, GACC | Valley Stream, NY | Retail | $50,000,000 | 7.6% | $178 | 54.5% | 2.10x | 13.0% |
| Great Lakes Crossing Outlets | GSMC, GACC | Auburn Hills, MI | Retail | $50,000,000 | 7.6% | $160 | 45.0% | 2.50x | 17.5% |
| Scottsdale Fashion Square | GSMC | Scottsdale, AZ | Retail | $49,000,000 | 7.5% | $450 | 38.4% | 1.92x | 12.3% |
| National Warehouse & Distribution Portfolio | CREFI | Various | Industrial | $35,000,000 | 5.3% | $40 | 56.7% | 1.54x | 13.0% |
| 100 Jefferson Road | JPMCB | Parsippany, NJ | Industrial | $30,000,000 | 4.6% | $174 | 56.4% | 1.42x | 10.7% |
| 9200 Calumet Industrial | CREFI | Munster, IN | Industrial | $29,500,000 | 4.5% | $32 | 47.1% | 1.57x | 11.9% |
| Naugatuck Valley Shopping Center | GACC | Waterbury, CT | Retail | $27,749,936 | 4.2% | $72 | 66.2% | 1.49x | 11.1% |
| Total/Weighted Average | $449,999,936 | 68.5% | 47.4% | 2.01x | 13.4% | ||||
| (1) | The Cut-off Date Balance per NRA/Unit, Cut-off Date LTV, U/W NCF DSCR after IO and U/W NOI Debt Yield calculations include any related pari passu companion loan(s) and exclude any related subordinate companion loan(s) and/or mezzanine loan(s). |
| (2) | With respect to the CX – 250 Water Street, 100 Jefferson Road and 9200 Calumet Industrial mortgage loans, the Cut-off Date LTV has been calculated using a value other than the “As Is” appraised value. For additional information please see the footnotes to Annex A-1 in the Preliminary Prospectus. |
| Subordinate Debt Summary | ||||||||||
| Mortgage Loan | Mortgage Loan Cut-off Date Balance |
Pari Passu Companion Loans Cut-off Date Balance | Subordinate Debt Cut-off Date Balance | Mezzanine Debt Cut-off Date Balance | Trust U/W NCF DSCR(1) | Total Debt U/W NCF DSCR(2) | Trust Cut-off Date LTV(1)(3) | Total Debt Cut-off Date LTV(2)(3) | Trust U/W NOI Debt Yield(1) | Total Debt U/W NOI Debt Yield(2) |
| Pacific Design Center | $65,600,000 | $179,400,000 | $20,000,000 | $0 | 2.17x | 1.79x | 47.8% | 51.7% | 13.8% | 12.7% |
| 9200 Calumet Industrial | $29,500,000 | $0 | $0 | $8,500,000 | 1.57x | 1.14x | 47.1% | 60.7% | 11.9% | 9.2% |
| (1) | The Trust U/W NCF DSCR, Trust Cut-off Date LTV and Trust U/W NOI Debt Yield calculations include any related pari passu companion loan(s) and exclude any related subordinate companion loan(s) and/or mezzanine loan(s). |
| (2) | Total Debt U/W NCF DSCR, Total Debt Cut-off Date LTV and Total Debt U/W NOI Debt Yield calculations include any related pari passu companion loan(s), related subordinate companion loan(s) and/or related mezzanine loan(s). |
| (3) | With respect to the 9200 Calumet Industrial mortgage loan, the Trust Cut-off Date LTV and Total Debt Cut-off Date LTV have been calculated using a value other than the “As Is” appraised value. For additional information please see the footnotes to Annex A-1 in the Preliminary Prospectus. |
| THE INFORMATION IN THIS STRUCTURAL AND COLLATERAL TERM SHEET IS NOT COMPLETE AND MAY BE AMENDED PRIOR TO THE TIME OF SALE. THIS TERM SHEET IS NOT AN OFFER TO SELL THESE SECURITIES AND IT IS NOT A SOLICITATION OF AN OFFER TO BUY THESE SECURITIES IN ANY JURISDICTION WHERE THE OFFER OR SALE IS NOT PERMITTED. | ||
| 6 | ||
Benchmark 2023-B38 Mortgage Trust
| OVERVIEW OF MORTGAGE POOL CHARACTERISTICS |
| Companion Loan Summary |
| Loan No. | Mortgage Loan | Note(s) | Original Balance | Cut-off Date Balance | Holder of Note(1) | Lead Servicer for Whole Loan (Y/N) | Master Servicer Under Lead Securitization | Special Servicer Under Lead Securitization |
| 1 | Pacific Design Center | A-1 | $65,600,000 | $65,600,000 | Benchmark 2023-B38 | Yes | ||
| A-2 | $34,400,000 | $34,400,000 | GSBI | No | ||||
| A-3 | $30,000,000 | $30,000,000 | GSBI | No | ||||
| A-4 | $40,000,000 | $40,000,000 | Argentic | No | ||||
| A-5 | $15,000,000 | $15,000,000 | Argentic | No | ||||
| A-6 | $10,000,000 | $10,000,000 | Argentic | No | ||||
| A-7 | $10,000,000 | $10,000,000 | Argentic | No | ||||
| A-8 | $25,000,000 | $25,000,000 | BMO | No | ||||
| A-9 | $15,000,000 | $15,000,000 | BMO | No | ||||
| B | $20,000,000 | $20,000,000 | Benchmark 2023-B38 (Loan Specific Certificates) | Yes | Midland | Argentic | ||
| 2 | 1201 Third Avenue | A-1-1 | $30,000,000 | $30,000,000 | BANK5 2023-5YR1(2) | No(3) | Wells Fargo(3) | CWCapital(3) |
| A-1-2 | $20,000,000 | $20,000,000 | MSBNA | No | ||||
| A-1-3 | $10,000,000 | $10,000,000 | MSBNA | No | ||||
| A-2 | $42,000,000 | $42,000,000 | MSBNA | Yes(3) | ||||
| A-3 | $40,000,000 | $40,000,000 | Benchmark 2023-B38 | No | ||||
| A-4-1 | $20,000,000 | $20,000,000 | Benchmark 2023-B38 | No | ||||
| A-4-2 | $8,000,000 | $8,000,000 | JPMCB | No | ||||
| 3 | CX - 250 Water Street | A-1 | $56,250,000 | $56,250,000 | BOA | Yes(4) | ||
| A-2 | $53,125,000 | $53,125,000 | BOA | No | ||||
| A-3 | $50,000,000 | $50,000,000 | BOA | No | ||||
| A-4 | $34,375,000 | $34,375,000 | BANK 2023-BNK45 | No(4) | Wells Fargo(4) | LNR(4) | ||
| A-5 | $46,875,000 | $46,875,000 | BOA | No | ||||
| A-6 | $6,250,000 | $6,250,000 | BOA | No | ||||
| A-7 | $3,125,000 | $3,125,000 | BOA | No | ||||
| A-8 | $15,750,000 | $15,750,000 | BOA | No | ||||
| A-9 | $33,750,000 | $33,750,000 | WFB | No | ||||
| A-10 | $31,875,000 | $31,875,000 | WFB | No | ||||
| A-11 | $30,000,000 | $30,000,000 | WFB | No | ||||
| A-12 | $20,625,000 | $20,625,000 | BANK 2023-BNK45 | No(4) | Wells Fargo(4) | LNR(4) | ||
| A-13 | $28,125,000 | $28,125,000 | WFB | No | ||||
| A-14 | $3,750,000 | $3,750,000 | WFB | No | ||||
| A-15 | $1,875,000 | $1,875,000 | WFB | No | ||||
| A-16 | $9,450,000 | $9,450,000 | WFB | No | ||||
| A-17 | $30,000,000 | $30,000,000 | Benchmark 2023-B38 | No | ||||
| A-18 | $23,150,000 | $23,150,000 | Benchmark 2023-B38 | No | ||||
| A-19 | $25,000,000 | $25,000,000 | 3650 | No | ||||
| A-20 | $28,150,000 | $28,150,000 | 3650 | No | ||||
| 4 | Green Acres | A-1 | $36,000,000 | $36,000,000 | GSBI | Yes(5) | ||
| A-2 | $31,500,000 | $31,500,000 | FIVE 2023-V1 | No | ||||
| A-3 | $32,500,000 | $32,500,000 | Benchmark 2023-B38 | No | ||||
| A-4 | $24,000,000 | $24,000,000 | BMO | No | ||||
| A-5 | $21,500,000 | $21,500,000 | BMO | No | ||||
| A-6 | $20,000,000 | $20,000,000 | BMO 2023-C4 | No(5) | Midland(5) | LNR(5) | ||
| A-7 | $18,500,000 | $18,500,000 | FIVE 2023-V1 | No | ||||
| A-8 | $6,000,000 | $6,000,000 | BMO 2023-C4 | No(5) | Midland(5) | LNR(5) | ||
| A-9 | $50,000,000 | $50,000,000 | MS | No | ||||
| A-10 | $20,000,000 | $20,000,000 | MS | No | ||||
| A-11 | $10,000,000 | $10,000,000 | MS | No | ||||
| A-12 | $10,000,000 | $10,000,000 | MS | No | ||||
| A-13-1 | $25,000,000 | $25,000,000 | DBRI | No | ||||
| A-13-2 | $5,000,000 | $5,000,000 | DBRI | No | ||||
| A-14 | $25,000,000 | $25,000,000 | FIVE 2023-V1 | No | ||||
| A-15-1 | $17,500,000 | $17,500,000 | Benchmark 2023-B38 | No | ||||
| A-15-2 | $2,500,000 | $2,500,000 | DBRI | No | ||||
| A-16 | $15,000,000 | $15,000,000 | DBRI | No |
| THE INFORMATION IN THIS STRUCTURAL AND COLLATERAL TERM SHEET IS NOT COMPLETE AND MAY BE AMENDED PRIOR TO THE TIME OF SALE. THIS TERM SHEET IS NOT AN OFFER TO SELL THESE SECURITIES AND IT IS NOT A SOLICITATION OF AN OFFER TO BUY THESE SECURITIES IN ANY JURISDICTION WHERE THE OFFER OR SALE IS NOT PERMITTED. | ||
| 7 | ||
Benchmark 2023-B38 Mortgage Trust
| OVERVIEW OF MORTGAGE POOL CHARACTERISTICS |
| Loan No. | Mortgage Loan | Note(s) | Original Balance | Cut-off Date Balance | Holder of Note | Lead Servicer for Whole Loan (Y/N) | Master Servicer Under Lead Securitization | Special Servicer Under Lead Securitization |
| 5 | Great Lakes | A-1-1 | $27,500,000 | $27,500,000 | Benchmark 2023-B38 | Yes | Midland | LNR |
| Crossing Outlets | A-1-2 | $17,500,000 | $17,500,000 | GSBI | No | |||
| A-1-3 | $17,500,000 | $17,500,000 | GSBI | No | ||||
| A-1-4 | $17,500,000 | $17,500,000 | GSBI | No | ||||
| A-2-1-A | $12,500,000 | $12,500,000 | DBRI | No | ||||
| A-2-1-B | $7,500,000 | $7,500,000 | Benchmark 2023-B38 | No | ||||
| A-2-2 | $15,000,000 | $15,000,000 | Benchmark 2023-B38 | No | ||||
| A-2-3 | $15,000,000 | $15,000,000 | DBRI | No | ||||
| A-3-1 | $25,750,000 | $25,750,000 | BMO 2023-C4 | No | ||||
| A-3-2 | $14,250,000 | $14,250,000 | BMO | No | ||||
| A-3-3 | $10,000,000 | $10,000,000 | BMO | No | ||||
| 6 | Scottsdale Fashion | A-1-S1 | $250,000,000 | $250,000,000 | SCOTT 2023-SFS | Yes | Berkadia | KeyBank |
| A-2-S1 | $250,000,000 | $250,000,000 | SCOTT 2023-SFS | No | ||||
| A-1-C1 | $25,000,000 | $25,000,000 | Benchmark 2023-B38 | No | ||||
| A-1-C2 | $24,000,000 | $24,000,000 | Benchmark 2023-B38 | No | ||||
| A-1-C3 | $26,000,000 | $26,000,000 | GSBI | No | ||||
| A-1-C4 | $25,000,000 | $25,000,000 | GSBI | No | ||||
| A-2-C1 | $40,000,000 | $40,000,000 | DBNY | No | ||||
| A-2-C2 | $30,000,000 | $30,000,000 | DBNY | No | ||||
| A-2-C3-1 | $25,000,000 | $25,000,000 | DBNY | No | ||||
| A-2-C3-2 | $5,000,000 | $5,000,000 | DBNY | No | ||||
| 7 | National Warehouse & Distribution Portfolio | A-1 | $50,000,000 | $50,000,000 | BANK5 2023-5YR1 | Yes | Wells Fargo | CWCapital |
| A-2 | $30,000,000 | $30,000,000 | BANK5 2023-5YR1 | No | ||||
| A-3 | $30,000,000 | $30,000,000 | Benchmark 2023-B38 | No | ||||
| A-4-1 | $5,000,000 | $5,000,000 | Benchmark 2023-B38 | No | ||||
| A-4-2 | $22,000,000 | $22,000,000 | CREFI | No | ||||
| A-5 | $20,000,000 | $20,000,000 | BANK5 2023-5YR1 | No | ||||
| 8 | 100 Jefferson Road | A-1 | $30,000,000 | $30,000,000 | Benchmark 2023-B38 | No(6) | Midland(6) | LNR(6) |
| A-2 | $29,500,000 | $29,500,000 | AREF2 or an affiliate | Yes(6) | ||||
| A-3 | $29,500,000 | $29,500,000 | AREF2 or an affiliate | No | ||||
| A-4 | $8,500,000 | $8,500,000 | AREF2 or an affiliate | No | ||||
| 11 | One Campus Martius | A-1 | $50,000,000 | $50,000,000 | Benchmark 2022-B36 | Yes | Midland | Midland |
| A-2 | $30,000,000 | $30,000,000 | Benchmark 2022-B37 | No | ||||
| A-3 | $25,000,000 | $25,000,000 | Benchmark 2023-B38 | No | ||||
| A-4-A | $2,500,000 | $2,500,000 | Benchmark 2023-B38 | No | ||||
| A-4-B | $13,300,000 | $13,300,000 | JPMCB | No | ||||
| A-5 | $10,000,000 | $10,000,000 | JPMCB | No | ||||
| A-6 | $46,200,000 | $46,200,000 | BANK 2022-BNK43 | No | ||||
| A-7 | $25,000,000 | $25,000,000 | BANK 2022-BNK44 | No | ||||
| A-8 | $16,000,000 | $16,000,000 | BANK 2022-BNK44 | No | ||||
| 16 | Riverport Tower | A-1 | $6,600,000 | $6,600,000 | Benchmark 2022-B37 | No | ||
| A-2 | $15,000,000 | $15,000,000 | Benchmark 2023-B38 | Yes | Midland | LNR | ||
| 20 | Sentinel Square II | A-1-1 | $30,000,000 | $30,000,000 | GACC | No | ||
| A-1-2 | $10,000,000 | $10,000,000 | Benchmark 2023-B38 | No | ||||
| A-2 | $25,000,000 | $25,000,000 | FIVE 2023-V1 | Yes | Midland | Greystone | ||
| A-3 | $25,000,000 | $25,000,000 | FIVE 2023-V1 | No | ||||
| A-4 | $14,000,000 | $14,000,000 | FIVE 2023-V1 | No | ||||
| 21 | Centers of High Point | A-1 | $20,000,000 | $20,000,000 | FIVE 2023-V1 | Yes | Midland | Greystone |
| A-2 | $9,642,857 | $9,642,857 | Benchmark 2023-B38 | No |
| (1) | The identification of a securitization trust means we have identified another securitization trust that has closed or as to which a preliminary prospectus (or preliminary offering circular) or final prospectus (or final offering circular) has printed that has or is expected to include the identified Mortgage Note(s). |
| (2) | The BANK5 2023-5YR1 securitization transaction is expected to close on April 19, 2023. |
| (3) | The 1201 Third Avenue Whole Loan is expected to be initially serviced under the BANK5 2023-5YR1 PSA. From and after the securitization of the related controlling note, the 1201 Third Avenue Whole Loan will be serviced under the related pooling and servicing agreement for such securitization. |
| (4) | The CX – 250 Water Street Whole Loan is initially serviced under the BANK 2023-BNK45 PSA. From and after the securitization of the related controlling note, the CX – 250 Water Street Whole Loan will be serviced under the related pooling and servicing agreement for such securitization. |
| (5) | The Green Acres Whole Loan is initially serviced under the BMO 2023-C4 PSA. From and after the securitization of the related controlling note, the Green Acres Whole Loan will be serviced under the related pooling and servicing agreement for such securitization. |
| (6) | Prior to the related servicing shift securitization date, the 100 Jefferson Road whole loan will be serviced under the pooling and servicing agreement for this transaction, provided, however, if one or more non-controlling companion loans is securitized in a transaction before the closing date of the BMARK 2023-B38 transaction, the 100 Jefferson Road whole loan will be a non-serviced whole loan and will be serviced under the servicing agreement for such earlier securitization. From and after the related servicing shift securitization date, the related servicing shift whole loan will be serviced under the related servicing shift pooling and servicing agreement entered into in connection with the securitization of the controlling companion loan. |
| THE INFORMATION IN THIS STRUCTURAL AND COLLATERAL TERM SHEET IS NOT COMPLETE AND MAY BE AMENDED PRIOR TO THE TIME OF SALE. THIS TERM SHEET IS NOT AN OFFER TO SELL THESE SECURITIES AND IT IS NOT A SOLICITATION OF AN OFFER TO BUY THESE SECURITIES IN ANY JURISDICTION WHERE THE OFFER OR SALE IS NOT PERMITTED. | ||
| 8 | ||
Benchmark 2023-B38 Mortgage Trust
| OVERVIEW OF MORTGAGE POOL CHARACTERISTICS |
| Distribution of Cut-off Date Balances(1) | |||||||||||||
| Range of Cut-off Date Balances | Number of Mortgage Loans | Aggregate Cut-off Date Balance | % of Initial Pool | Weighted Averages | |||||||||
| Mortgage Rate | Stated Remaining Term (Mos.) | U/W NCF DSCR | Cut-off Date LTV(2) | Maturity Date or ARD LTV(2) | |||||||||
| $3,888,468 | - | $9,999,999 | 5 | $37,607,575 | 5.7% | 6.6452% | 103 | 1.85x | 58.9% | 56.3% | |||
| $10,000,000 | - | $19,999,999 | 7 | $90,325,000 | 13.8% | 6.5456% | 110 | 1.88x | 52.8% | 51.9% | |||
| $20,000,000 | - | $29,999,999 | 5 | $136,208,114 | 20.7% | 6.4330% | 101 | 1.64x | 57.6% | 54.8% | |||
| $30,000,000 | - | $39,999,999 | 2 | $65,000,000 | 9.9% | 7.0177% | 88 | 1.48x | 56.6% | 54.9% | |||
| $40,000,000 | - | $65,600,000 | 6 | $327,750,000 | 49.9% | 5.9288% | 89 | 2.20x | 44.0% | 44.0% | |||
| Total/Weighted Average | 25 | $656,890,689 | 100.0% | 6.2669% | 95 | 1.95x | 50.1% | 49.1% | |||||
| Distribution of Mortgage Rates(1) | |||||||||||||
| Range of Mortgage Rates | Number of Mortgage Loans | Aggregate Cut-off Date Balance | % of Initial Pool | Weighted Averages | |||||||||
| Mortgage Rate | Stated Remaining Term (Mos.) | U/W NCF DSCR | Cut-off Date LTV(2) | Maturity Date or ARD LTV(2) | |||||||||
| 5.1500% | - | 5.9999% | 6 | $271,499,936 | 41.3% | 5.6829% | 90 | 2.12x | 47.9% | 46.9% | |||
| 6.0000% | - | 6.4999% | 5 | $106,276,250 | 16.2% | 6.1646% | 83 | 1.77x | 48.9% | 48.9% | |||
| 6.5000% | - | 6.9999% | 8 | $164,240,357 | 25.0% | 6.6454% | 102 | 2.00x | 55.3% | 54.2% | |||
| 7.0000% | - | 7.2800% | 6 | $114,874,146 | 17.5% | 7.2007% | 109 | 1.65x | 49.2% | 47.0% | |||
| Total/Weighted Average | 25 | $656,890,689 | 100.0% | 6.2669% | 95 | 1.95x | 50.1% | 49.1% | |||||
| Property Type Distribution(1)(3) | |||||||||||
| Property Type | Number of Mortgaged Properties | Aggregate Cut-off Date Balance | % of Initial Outstanding Pool Balance | Number of NRA/Units/Rooms | Weighted Averages | ||||||
Cut-off Date NRA/Units/Rooms | Mortgage Rate | Stated Remaining Term (Mos.) | Occupancy | U/W NCF DSCR | Cut-off Date LTV(2) | Maturity Date or ARD LTV(2) | |||||
| Retail | 19 | $258,012,154 | 39.3% | 5,792,203 | $206 | 6.2317% | 91 | 95.9% | 1.98x | 51.3% | 50.2% |
| Anchored | 6 | $88,335,904 | 13.4% | 885,000 | $117 | 6.1749% | 107 | 97.8% | 1.67x | 59.9% | 56.7% |
| Regional Mall | 1 | $50,000,000 | 7.6% | 2,081,286 | $178 | 5.8990% | 57 | 97.7% | 2.10x | 54.5% | 54.5% |
| Outlet Center | 1 | $50,000,000 | 7.6% | 1,128,332 | $160 | 6.5210% | 118 | 89.6% | 2.50x | 45.0% | 45.0% |
| Super Regional Mall | 1 | $49,000,000 | 7.5% | 1,555,459 | $450 | 6.2143% | 59 | 96.0% | 1.92x | 38.4% | 38.4% |
| Single Tenant | 8 | $19,213,750 | 2.9% | 110,786 | $199 | 6.6406% | 118 | 100.0% | 1.88x | 52.0% | 52.0% |
| Unanchored | 2 | $1,462,500 | 0.2% | 31,340 | $50 | 6.3600% | 118 | 78.7% | 1.61x | 63.0% | 63.0% |
| Mixed Use | 9 | $143,892,857 | 21.9% | 2,301,437 | $523 | 5.9461% | 114 | 89.5% | 1.94x | 49.1% | 48.4% |
| Office/Showroom/Lab | 1 | $65,600,000 | 9.99% | 1,053,217 | $233 | 5.9411% | 118 | 78.3% | 2.17x | 47.8% | 47.8% |
| Lab/Office | 1 | $53,150,000 | 8.1% | 479,004 | $1,110 | 5.5095% | 118 | 98.7% | 1.66x | 48.8% | 48.8% |
| Parking Garage/Retail | 1 | $15,500,000 | 2.4% | 287,000 | $54 | 7.1200% | 120 | 100.0% | 1.83x | 44.6% | 39.1% |
| Industrial/Retail | 6 | $9,642,857 | 1.5% | 482,216 | $20 | 6.5000% | 58 | 98.1% | 2.03x | 67.2% | 65.4% |
| Office | 4 | $112,500,000 | 17.1% | 3,087,841 | $161 | 5.7647% | 78 | 84.9% | 2.31x | 44.3% | 44.3% |
| CBD | 3 | $97,500,000 | 14.8% | 2,769,950 | $176 | 5.7554% | 73 | 84.0% | 2.34x | 42.1% | 42.1% |
| Suburban | 1 | $15,000,000 | 2.3% | 317,891 | $68 | 5.8250% | 111 | 90.8% | 2.12x | 58.2% | 58.2% |
| Industrial | 7 | $94,500,000 | 14.4% | 5,418,336 | $70 | 7.0996% | 85 | 100.0% | 1.51x | 53.6% | 52.5% |
| Warehouse/Distribution | 6 | $88,900,000 | 13.5% | 5,158,336 | $73 | 7.1178% | 87 | 100.0% | 1.51x | 53.4% | 52.4% |
| Flex | 1 | $5,600,000 | 0.9% | 260,000 | $22 | 6.8100% | 60 | 100.0% | 1.54x | 56.7% | 53.6% |
| Hospitality | 3 | $47,985,678 | 7.3% | 519 | $102,223 | 6.9559% | 120 | 70.3% | 1.84x | 53.8% | 49.7% |
| Full Service | 1 | $23,985,678 | 3.7% | 273 | $87,860 | 7.1520% | 119 | 55.7% | 1.68x | 47.5% | 41.6% |
| Select Service | 1 | $16,000,000 | 2.4% | 110 | $145,455 | 6.7200% | 120 | 85.7% | 2.01x | 64.0% | 64.0% |
| Extended Stay | 1 | $8,000,000 | 1.2% | 136 | $58,824 | 6.8400% | 120 | 83.3% | 1.95x | 52.3% | 45.4% |
| Total/Weighted Average | 42 | $656,890,689 | 100.0% | 6.2669% | 95 | 91.3% | 1.95x | 50.1% | 49.1% | ||
| Geographic Distribution(1)(3) | ||||||||||||
| State/Location | Number of Properties | Aggregate Cut-off Date Balance | % of Initial Outstanding Pool Balance | Weighted Averages | ||||||||
| Mortgage Rate | Stated Remaining Term (Mos.) | U/W NCF DSCR | Cut-off Date LTV(2) | Maturity Date or ARD LTV(2) | ||||||||
| California | 4 | $93,452,707 | 14.2% | 6.1282% | 110 | 1.99x | 48.9% | 48.4% | ||||
| Southern | 4 | $93,452,707 | 14.2% | 6.1282% | 110 | 1.99x | 48.9% | 48.4% | ||||
| Michigan | 4 | $83,805,000 | 12.8% | 6.3445% | 116 | 2.18x | 51.3% | 51.3% | ||||
| Washington | 1 | $60,000,000 | 9.1% | 5.5850% | 59 | 2.76x | 30.5% | 30.5% | ||||
| Indiana | 2 | $53,485,678 | 8.1% | 7.2226% | 97 | 1.62x | 47.3% | 44.6% | ||||
| Massachusetts | 1 | $53,150,000 | 8.1% | 5.5095% | 118 | 1.66x | 48.8% | 48.8% | ||||
| New York | 1 | $50,000,000 | 7.6% | 5.8990% | 57 | 2.10x | 54.5% | 54.5% | ||||
| Arizona | 1 | $49,000,000 | 7.5% | 6.2143% | 59 | 1.92x | 38.4% | 38.4% | ||||
| Missouri | 2 | $42,472,500 | 6.5% | 6.3295% | 115 | 1.86x | 63.7% | 63.7% | ||||
| New Jersey | 3 | $39,650,000 | 6.0% | 7.1085% | 120 | 1.56x | 55.4% | 55.4% | ||||
| Other | 23 | $131,874,804 | 20.1% | 6.4297% | 93 | 1.74x | 57.7% | 53.9% | ||||
| Total/Weighted Average | 42 | $656,890,689 | 100.0% | 6.2669% | 95 | 1.95x | 50.1% | 49.1% | ||||
| THE INFORMATION IN THIS STRUCTURAL AND COLLATERAL TERM SHEET IS NOT COMPLETE AND MAY BE AMENDED PRIOR TO THE TIME OF SALE. THIS TERM SHEET IS NOT AN OFFER TO SELL THESE SECURITIES AND IT IS NOT A SOLICITATION OF AN OFFER TO BUY THESE SECURITIES IN ANY JURISDICTION WHERE THE OFFER OR SALE IS NOT PERMITTED. | ||
| 9 | ||
Benchmark 2023-B38 Mortgage Trust
| OVERVIEW OF MORTGAGE POOL CHARACTERISTICS |
| Distribution of Cut-off Date LTVs(1)(2) | |||||||||||||
| Range of Cut-off Date LTVs | Number of Mortgage Loans | Aggregate Cut-off Date Balance | % of Initial Outstanding Pool Balance |
Weighted Averages | |||||||||
| Mortgage Rate | Stated Remaining Term (Mos.) | U/W NCF DSCR | Cut-off Date LTV | Maturity Date or ARD LTV | |||||||||
| 30.5% | - | 39.9% | 2 | $109,000,000 | 16.6% | 5.8679% | 59 | 2.38x | 34.1% | 34.1% | |||
| 40.0% | - | 49.9% | 8 | $261,435,678 | 39.8% | 6.3615% | 114 | 1.97x | 46.9% | 46.0% | |||
| 50.0% | - | 59.9% | 8 | $160,013,468 | 24.4% | 6.5118% | 86 | 1.80x | 55.3% | 54.1% | |||
| 60.0% | - | 67.2% | 7 | $126,441,543 | 19.2% | 6.1054% | 100 | 1.71x | 64.3% | 62.2% | |||
| Total/Weighted Average | 25 | $656,890,689 | 100.0% | 6.2669% | 95 | 1.95x | 50.1% | 49.1% | |||||
| Distribution of Maturity Date or ARD LTVs(1)(2) | |||||||||||||
| Range of Maturity Date or ARD LTVs | Number of Mortgage Loans | Aggregate Cut-off Date Balance | % of Initial Outstanding Pool Balance | Weighted Averages | |||||||||
| Mortgage Rate | Stated Remaining Term (Mos.)(2) | U/W NCF DSCR | Cut-off Date LTV | Maturity Date or ARD LTV | |||||||||
| 30.5% | - | 39.9% | 3 | $124,500,000 | 19.0% | 6.0238% | 67 | 2.31x | 35.4% | 34.7% | |||
| 40.0% | - | 49.9% | 9 | $257,824,146 | 39.2% | 6.3438% | 114 | 1.97x | 47.3% | 46.4% | |||
| 50.0% | - | 59.9% | 7 | $175,874,936 | 26.8% | 6.2661% | 83 | 1.76x | 57.1% | 55.1% | |||
| 60.0% | - | 66.7% | 6 | $98,691,607 | 15.0% | 6.3741% | 104 | 1.77x | 63.7% | 63.5% | |||
| Total/Weighted Average | 25 | $656,890,689 | 100.0% | 6.2669% | 95 | 1.95x | 50.1% | 49.1% | |||||
| Distribution of Underwritten NCF Debt Service Coverages(1) | |||||||||||||
| Range of Underwritten NCF Debt Service Coverages | Number of Mortgage Loans | Aggregate Cut-off Date Balance | % of Initial Outstanding Pool Balance | Weighted Averages | |||||||||
| Mortgage Rate | Stated Remaining Term (Mos.) | U/W NCF DSCR | Cut-off Date LTV(2) | Maturity Date or ARD LTV(2) | |||||||||
| 1.34x | - | 1.49x | 4 | $71,638,404 | 10.9% | 6.2721% | 97 | 1.45x | 61.0% | 57.2% | |||
| 1.50x | - | 1.99x | 12 | $299,009,428 | 45.5% | 6.4423% | 97 | 1.71x | 50.6% | 49.3% | |||
| 2.00x | - | 2.49x | 7 | $176,242,857 | 26.8% | 6.1273% | 97 | 2.12x | 53.0% | 52.9% | |||
| 2.50x | - | 2.76x | 2 | $110,000,000 | 16.7% | 6.0105% | 86 | 2.64x | 37.1% | 37.1% | |||
| Total/Weighted Average | 25 | $656,890,689 | 100.0% | 6.2669% | 95 | 1.95x | 50.1% | 49.1% | |||||
| Original Terms to Maturity or ARD(1) | |||||||||||||
| Original Terms to Maturity or ARD | Number of Mortgage Loans | Aggregate Cut-off Date Balance | % of Initial Outstanding Pool Balance | Weighted Averages | |||||||||
| Mortgage Rate | Stated Remaining Term (Mos.) | U/W NCF DSCR | Cut-off Date LTV(2) | Maturity Date or ARD LTV(2) | |||||||||
| 60 | - | 60 | 6 | $213,642,857 | 32.5% | 6.0666% | 59 | 2.12x | 45.4% | 44.8% | |||
| 84 | - | 84 | 1 | $29,500,000 | 4.5% | 7.2800% | 79 | 1.57x | 47.1% | 47.1% | |||
| 120 | - | 120 | 18 | $413,747,832 | 63.0% | 6.2981% | 115 | 1.89x | 52.8% | 51.5% | |||
| Total/Weighted Average | 25 | $656,890,689 | 100.0% | 6.2669% | 95 | 1.95x | 50.1% | 49.1% | |||||
| Distribution of Remaining Terms to Maturity or ARD(1) | |||||||||||||
| Range of Remaining Terms to Maturity or ARD | Number of Mortgage Loans | Aggregate Cut-off Date Balance | % of Initial Outstanding Pool Balance | Weighted Averages | |||||||||
| Mortgage Rate | Stated Remaining Term (Mos.) | U/W NCF DSCR | Cut-off Date LTV(2) | Maturity Date or ARD LTV(2) | |||||||||
| 56 | - | 60 | 6 | $213,642,857 | 32.5% | 6.0666% | 59 | 2.12x | 45.4% | 44.8% | |||
| 79 | - | 84 | 2 | $57,249,936 | 8.7% | 6.2476% | 81 | 1.53x | 56.4% | 52.0% | |||
| 111 | - | 120 | 17 | $385,997,896 | 58.8% | 6.3807% | 118 | 1.91x | 51.8% | 51.0% | |||
| Total/Weighted Average | 25 | $656,890,689 | 100.0% | 6.2669% | 95 | 1.95x | 50.1% | 49.1% | |||||
Distribution of Underwritten NOI Debt Yields(1) | |||||||||||||
| Range of Underwritten NOI Debt Yields | Number of Mortgage Loans | Aggregate Cut-off Date Balance | % of Initial Outstanding Pool Balance | Weighted Averages | |||||||||
| Mortgage Rate | Stated Remaining Term (Mos.) | U/W NCF DSCR | Cut-off Date LTV(2) | Maturity Date or ARD LTV(2) | |||||||||
| 9.1% | - | 10.4% | 2 | $63,150,000 | 9.6% | 5.5951% | 108 | 1.63x | 50.9% | 50.9% | |||
| 10.5% | - | 12.4% | 10 | $225,012,154 | 34.3% | 6.4322% | 95 | 1.66x | 53.6% | 52.3% | |||
| 12.5% | - | 14.4% | 4 | $158,600,000 | 24.1% | 6.1543% | 86 | 2.00x | 52.1% | 51.4% | |||
| 14.5% | - | 17.7% | 9 | $210,128,535 | 32.0% | 6.3768% | 98 | 2.31x | 44.7% | 43.3% | |||
| Total/Weighted Average | 25 | $656,890,689 | 100.0% | 6.2669% | 95 | 1.95x | 50.1% | 49.1% | |||||
| THE INFORMATION IN THIS STRUCTURAL AND COLLATERAL TERM SHEET IS NOT COMPLETE AND MAY BE AMENDED PRIOR TO THE TIME OF SALE. THIS TERM SHEET IS NOT AN OFFER TO SELL THESE SECURITIES AND IT IS NOT A SOLICITATION OF AN OFFER TO BUY THESE SECURITIES IN ANY JURISDICTION WHERE THE OFFER OR SALE IS NOT PERMITTED. | ||
| 10 | ||
Benchmark 2023-B38 Mortgage Trust
| OVERVIEW OF MORTGAGE POOL CHARACTERISTICS |
| Amortization Types(1) | |||||||||||
| Amortization Type | Number of Mortgage Loans | Aggregate Cut-off Date Balance | % of Initial Outstanding Pool Balance | Weighted Averages | |||||||
| Mortgage Rate | Stated Remaining Term (Mos.) | U/W NCF DSCR | Cut-off Date LTV(2) | Maturity Date or ARD LTV(2) | |||||||
| Interest Only | 17 | $479,973,750 | 73.1% | 6.2819% | 94 | 2.06x | 48.8% | 48.8% | |||
| Amortizing Balloon | 6 | $114,124,082 | 17.4% | 6.5368% | 92 | 1.62x | 55.1% | 49.3% | |||
| Interest Only - ARD | 1 | $53,150,000 | 8.1% | 5.5095% | 118 | 1.66x | 48.8% | 48.8% | |||
| Interest Only, Amortizing Balloon | 1 | $9,642,857 | 1.5% | 6.5000% | 58 | 2.03x | 67.2% | 65.4% | |||
| Total/Weighted Average | 25 | $656,890,689 | 100.0% | 6.2669% | 95 | 1.95x | 50.1% | 49.1% | |||
| (1) | The U/W NCF DSCR, Cut-off Date LTV, Maturity Date or ARD LTV, Underwritten NOI Debt Yield and Cut-off Date Balance per # of NRA/Units/Rooms calculations include any related pari passu companion loan(s) and exclude any related subordinate companion loan(s) and/or mezzanine loan(s). |
| (2) | With respect to four mortgage loans (20.8%) (CX – 250 Water Street (8.1%), 100 Jefferson Road (4.6%), 9200 Calumet Industrial (4.5%) and Crowne Plaza Union Station (3.7%)), the Cut-off Date LTV and Maturity Date or ARD LTV have been calculated using a value other than the “As Is” appraised value. For additional information please see the footnotes to Annex A-1 in the Preliminary Prospectus. |
| (3) | Reflects allocated loan amount for properties securing multi-property Mortgage Loans. |
| Previously Securitized Mortgaged Properties(1) | ||||||
| Mortgaged Property | Cut-off Date Balance | % of Initial Outstanding Pool Balance | City, State | Property Type | Previous Securitization | |
| Pacific Design Center | $65,600,000 | 9.99% | West Hollywood, CA | Mixed Use | WFCMT 2014-LC16, COMM 2014-CCRE18 | |
| Green Acres | $50,000,000 | 7.6% | Valley Stream, NY | Retail | COMM 2013-GAM | |
| Great Lakes Crossing Outlets | $50,000,000 | 7.6% | Auburn Hills, MI | Retail | GSMS 2013-G1 | |
| 100 Jefferson Road | $30,000,000 | 4.6% | Parsippany, NJ | Industrial | GPMT 2019-FL2 | |
| Naugatuck Valley Shopping Center | $27,749,936 | 4.2% | Waterbury, CT | Retail | WFCG 2015-BXRP | |
| One Campus Martius | $27,500,000 | 4.2% | Detroit, MI | Office | TRTX 2022-FL5 | |
| Crowne Plaza Union Station | $23,985,678 | 3.7% | Indianapolis, IN | Hospitality | COMM 2012-CR5 | |
| Sentinel Square II | $10,000,000 | 1.5% | Washington, DC | Office | BMARK 2018-B1, BMARK 2018-B2 | |
| TownePlace Suites BWI Airport | $8,000,000 | 1.2% | Linthicum, MD | Hospitality | JPMBB 2013-C12 | |
| 68-78 River Road | $8,000,000 | 1.2% | Summit, NJ | Retail | UBSBB 2013-C6 | |
| Sylvan Heights | $3,888,468 | 0.6% | Arlington, TX | Retail | WFRBS 2012-C10 | |
| (1) | The table above includes mortgaged properties securing mortgage loans for which the most recent prior financing of all or a significant portion of each such mortgaged property was included in a securitization. Information under “Previous Securitization” represents the most recent such securitization with respect to each of those mortgaged properties. The information in the above table is based solely on information provided by the related borrower or obtained through searches of a third-party database and has not otherwise been confirmed by the related mortgage loan seller. |
| THE INFORMATION IN THIS STRUCTURAL AND COLLATERAL TERM SHEET IS NOT COMPLETE AND MAY BE AMENDED PRIOR TO THE TIME OF SALE. THIS TERM SHEET IS NOT AN OFFER TO SELL THESE SECURITIES AND IT IS NOT A SOLICITATION OF AN OFFER TO BUY THESE SECURITIES IN ANY JURISDICTION WHERE THE OFFER OR SALE IS NOT PERMITTED. | ||
| 11 | ||
Benchmark 2023-B38 Mortgage Trust
| STRUCTURE OVERVIEW |
| Allocation between VRR Interest and the Non-VRR Certificates: | The aggregate amount available for distribution to holders of the Non-VRR Certificates and the VRR Interest on each Distribution Date will be: (i) the gross amount of interest, principal, yield maintenance charges and prepayment premiums collected with respect to the Mortgage Loans in the applicable one-month collection period (other than any excess interest accrued after the related anticipated repayment date on any mortgage loan with an anticipated repayment date), net of specified expenses of the issuing entity, including fees payable therefrom to, and losses, liabilities, costs and expenses reimbursable or indemnifiable therefrom to, the Master Servicer, the Special Servicer, the Certificate Administrator, the Trustee, the Operating Advisor, the Asset Representations Reviewer and CREFC®; and (ii) allocated to amounts available for distribution to the owners of the VRR Interest, on the one hand, and amounts available for distribution to the holders of the Non-VRR Certificates, on the other hand. On each Distribution Date, the portion of such pooled aggregate available funds allocable to: (a) the VRR Interest will be the product of such pooled aggregate available funds multiplied by a fraction, expressed as a percentage, the numerator of which is the initial VRR Interest Balance of the VRR Interest, and the denominator of which is the sum of the aggregate initial Certificate Balance of all classes of Pooled Principal Balance Certificates and the initial VRR Interest Balance of the VRR Interest (the “VRR Percentage”); and (b) the Non-VRR Certificates will at all times be the product of such pooled aggregate available funds multiplied by the difference between 100% and the VRR Percentage (such difference, the “Non-VRR Percentage”). See “Credit Risk Retention” and “Description of the Certificates” in the Preliminary Prospectus. |
| Principal Payments: | Payments in respect of the Non-VRR Percentage of principal on the Non-VRR Certificates will be distributed, first, to the Class A-SB certificates, until the Certificate Balance of such class is reduced to the planned principal balance for the related Distribution Date set forth on Annex G to the Preliminary Prospectus, then, to the Class A-1, Class A-2, Class A-3, Class A-4, Class A-SB, Class A-M, Class B, Class C, Class D, Class E, Class F, Class G and Class H certificates, in that order, until the Certificate Balance of each such class is reduced to zero. Notwithstanding the foregoing, if the total Certificate Balance of the Class A-M, Class B, Class C, Class D, Class E, Class F, Class G and Class H certificates have been reduced to zero as a result of loss allocation, payments in respect of principal of the certificates will be distributed, first, to the Class A-1, Class A-2, Class A-3, Class A-SB and Class A-4 certificates, on a pro rata basis, based on the Certificate Balance of each such class, then, to the extent of any recoveries on realized losses, to the Class A-M, Class B, Class C, Class D, Class E, Class F, Class G and Class H certificates, in that order, in each case until the Certificate Balance of each such class is reduced to zero (or previously allocated realized losses have been fully reimbursed). Each class of Class X Certificates will not be entitled to receive distributions of principal; however, (i) the notional amount of the Class X-A certificates will be reduced by the aggregate amount of principal distributions and realized losses allocated to the Class A-1, Class A-2, Class A-3, Class A-SB, Class A-4 and Class A-M certificates; (ii) the notional amount of the Class X-D certificates will be reduced by the aggregate amount of principal distributions and realized losses allocated to the Class D and Class E certificates; (iii) the notional amount of the Class X-F certificates will be reduced by the amount of principal distributions and realized losses allocated to the Class F certificates; (iv) the notional amount of the Class X-G certificates will be reduced by the amount of principal distributions and realized losses allocated to the Class G certificates; and (v) the notional amount of the Class X-H certificates will be reduced by the amount of principal distributions and realized losses allocated to the Class H certificates. The holders of the Loan-Specific Certificates will only be entitled to distributions from amounts paid or advanced on and allocated to the Trust Subordinate Companion Loan in accordance with the PSA and co-lender agreement relating to the Pacific Design Center Whole Loan and no class of Pooled Certificates or the RR Interest will be entitled to distributions paid or advanced on and allocable to the Trust Subordinate Companion Loan. |
Interest Payments: | On each Distribution Date, interest accrued for each class of Non-VRR Certificates at the applicable pass-through rate will be distributed in the following order of priority, to the extent of the Non-VRR Percentage of the pooled aggregate available funds (exclusive of any portion thereof that represents the Non-VRR Percentage of any yield maintenance charges and prepayment premiums): first, to the Class A-1, Class A-2, Class A-3, Class A-SB, Class A-4, Class X-A, Class X-D, Class X-F, Class X-G and Class X-H certificates, on a pro rata basis, based on the accrued and unpaid interest on each such class and then, to the Class A-M, Class B, Class C, Class D, Class E, Class F, Class G and Class H certificates, in that order, in each case until the interest payable to each such class is paid in full.
|
| THE INFORMATION IN THIS STRUCTURAL AND COLLATERAL TERM SHEET IS NOT COMPLETE AND MAY BE AMENDED PRIOR TO THE TIME OF SALE. THIS TERM SHEET IS NOT AN OFFER TO SELL THESE SECURITIES AND IT IS NOT A SOLICITATION OF AN OFFER TO BUY THESE SECURITIES IN ANY JURISDICTION WHERE THE OFFER OR SALE IS NOT PERMITTED. | ||
| 12 | ||
Benchmark 2023-B38 Mortgage Trust
| STRUCTURE OVERVIEW |
The pass-through rates applicable to the Class A-1, Class A-2, Class A-3, Class A-SB, Class A-4, Class A-M, Class B, Class C, Class D, Class E, Class F, Class G and Class H certificates for each Distribution Date will equal one of: (i) a fixed per annum rate, (ii) the WAC Rate, (iii) a rate equal to the lesser of a specified pass-through rate and the WAC Rate or (iv) the WAC Rate less a specified rate, but in any case not less than 0.000%. As further described in the Preliminary Prospectus, the pass-through rates applicable to the Class X Certificates for each Distribution Date will generally be equal to the excess of (i) the WAC Rate over (ii) (A) with respect to the Class X-A certificates, the weighted average of the pass-through rates of the Class A-1, Class A-2, Class A-3, Class A-SB, Class A-4, and Class A-M certificates (weighted based on their respective Certificate Balances outstanding immediately prior to that Distribution Date), (B) with respect to the Class X-D certificates, the weighted average of the pass-through rates of the Class D and Class E certificates (weighted based on their respective Certificate Balances outstanding immediately prior to that Distribution Date), (C) with respect to the Class X-F certificates, the pass-through rate of the Class F certificates, (D) with respect to the Class X-G certificates, the pass-through rate of the Class G certificates and (E) with respect to the Class X-H certificates, the pass-through rate of the Class H certificates. No class of Pooled Certificates or the RR Interest will be entitled to distributions paid or advanced on and allocable to the Trust Subordinate Companion Loan. The holders of the Loan-Specific Certificates will only be entitled to distributions from amounts paid or advanced on and allocated to the Trust Subordinate Companion Loan in accordance with the PSA and co-lender agreement relating to the Pacific Design Center Whole Loan. | |
| Prepayment Interest Shortfalls: | Prepayment interest shortfalls will be allocated pro rata based on interest entitlements, in reduction of the interest otherwise payable with respect to each of the interest-bearing classes of certificates. |
| Loss Allocation: | The Non-VRR Percentage of losses on the Mortgage Loans will be allocated to each class of Non-VRR Certificates entitled to principal in reverse alphabetical order starting with the Class H certificates through and including the Class A-M certificates and then to the Class A-1, Class A-2, Class A-3, Class A-SB and Class A-4 certificates on a pro rata basis based on the Certificate Balance of each such class. The notional amount of any class of Class X Certificates will be reduced by the aggregate amount of realized losses allocated to the class(es) of certificates that are component(s) of the notional amount of such class of Class X Certificates. Losses realized on the Trust Subordinate Companion Loan will be allocated each class of Loan-Specific Certificates in the following order, in each case until the related certificate balance is reduced to zero: first, to the Class PDC-HRR certificates, then to the Class PDC-A2 certificates, and then, to the Class PDC-A1 certificates. |
Prepayment Premiums:
| A percentage of the Non-VRR Percentage of all prepayment premiums (either fixed prepayment premiums or yield maintenance amounts) collected on the Mortgage Loans will be allocated to each of the Class A-1, Class A-2, Class A-3, Class A-SB, Class A-4, Class A-M, Class B, Class C, Class D and Class E certificates (the “YM P&I Certificates”) then entitled to principal distributions, which percentage will be equal to the product of (a) a fraction, not greater than one, the numerator of which is the amount of principal distributed to such class on such Distribution Date and the denominator of which is the total amount of principal distributed to the holders of each class of Principal Balance Certificates on such Distribution Date and (b) the Base Interest Fraction for the related principal prepayment and such class of certificates. The VRR Percentage of all prepayment premiums (either fixed prepayment premiums or yield maintenance amounts) will be distributed to the VRR Interest. The “Base Interest Fraction” for any principal prepayment on any Mortgage Loan and for: (A) any of the Class A-1 through Class E certificates with a Pass-Through Rate equal to either the WAC Rate or the WAC Rate less a specified rate, will be a fraction (not greater than one) (a) whose numerator is the greater of zero and the amount, if any, by which (i) the Pass-Through Rate on such class of certificates exceeds (ii) the yield rate (as provided by the master servicer) used in calculating the prepayment premium or yield maintenance charge, as applicable, with respect to such principal prepayment and (b) whose denominator is the amount, if any, by which (i) the Net Mortgage Rate on such Mortgage Loan during the related interest accrual period exceeds (ii) the yield rate (as provided by the master servicer) used in calculating the prepayment premium or yield maintenance charge, as applicable, with respect to such principal prepayment; provided, however, that if such yield rate is greater than or equal to the |
| THE INFORMATION IN THIS STRUCTURAL AND COLLATERAL TERM SHEET IS NOT COMPLETE AND MAY BE AMENDED PRIOR TO THE TIME OF SALE. THIS TERM SHEET IS NOT AN OFFER TO SELL THESE SECURITIES AND IT IS NOT A SOLICITATION OF AN OFFER TO BUY THESE SECURITIES IN ANY JURISDICTION WHERE THE OFFER OR SALE IS NOT PERMITTED. | ||
| 13 | ||
Benchmark 2023-B38 Mortgage Trust
| STRUCTURE OVERVIEW |
| Net Mortgage Rate on such Mortgage Loan during the related interest accrual period, then the respective Base Interest Fraction will be zero; provided, further, that if such yield rate is greater than or equal to the Net Mortgage Rate on such Mortgage Loan during the related interest accrual period, but less than the Pass-Through Rate described in clause (a)(i) above, then the respective Base Interest Fraction will be one; and (B) any of the Class A-1 through Class E certificates with a Pass-Through Rate equal to a fixed per annum rate, will be a fraction (not greater than one) (a) whose numerator is the greater of zero and the amount, if any, by which (i) the Pass-Through Rate on such class of certificates exceeds (ii) the yield rate (as provided by the master servicer) used in calculating the prepayment premium or yield maintenance charge, as applicable, with respect to such principal prepayment and (b) whose denominator is the amount, if any, by which (i) the Mortgage Rate on such Mortgage Loan (without regard to any increase in the interest rate of any ARD Loan after the related Anticipated Repayment Date, and net of the Administrative Cost Rate) during the related interest accrual period multiplied by 365/360 exceeds (ii) the yield rate (as provided by the master servicer) used in calculating the prepayment premium or yield maintenance charge, as applicable, with respect to such principal prepayment; provided, however, that if such yield rate is greater than or equal to the amount set forth in clause (b)(i) above, then the respective Base Interest Fraction will be zero; provided, further, that if such yield rate is greater than or equal to the amount set forth in clause (b)(i) above, but less than the Pass-Through Rate described in clause (a)(i) above, then the respective Base Interest Fraction will be one. The remaining percentage of the Non-VRR Percentage of prepayment premiums will be allocated to the Class X-A and Class X-D certificates. In general, this formula provides for an increase in the percentage of prepayment premiums allocated to the YM P&I Certificates then entitled to principal distributions relative to the Class X-A and Class X-D certificates as Discount Rates decrease and a decrease in the percentage allocated to such classes as Discount Rates rise. |
| Whole Loans: | The mortgaged properties identified on Annex A-1 to the Preliminary Prospectus as Pacific Design Center, 1201 Third Avenue, CX – 250 Water Street, Green Acres, Great Lakes Crossing Outlets, Scottsdale Fashion Square, National Warehouse & Distribution Portfolio, 100 Jefferson Road, One Campus Martius, Riverport Tower, Sentinel Square II and Centers of High Point each secure both a mortgage loan to be included in the trust fund and one or more other companion loans that will not be included in the trust fund, each of which will be pari passu or subordinate in right of payment with the mortgage loan included in the trust fund. We refer to each such group of related loans as a “whole loan”. As of the Closing Date, the pari passu companion loans and the subordinate companion loans are expected to be held by the party identified in “—Companion Loan Summary” above and the table titled “Whole Loan Control Notes and Non-Control Notes” in “Description of the Mortgage Pool—The Whole Loans—General” in the Preliminary Prospectus. |
| Control Rights and Directing Holder: | With respect to any Serviced Mortgage Loan and any related Serviced Companion Loan, the Directing Holder will generally be entitled to direct the Special Servicer to take, or refrain from taking certain actions with respect to each Serviced Mortgage Loan and any related Serviced Companion Loans. Furthermore, the Directing Holder will also have the right to receive notice and consent to certain material actions that the Master Servicer and the Special Servicer proposes to take with respect to each Serviced Mortgage Loan and any related Serviced Companion Loans. The “Directing Holder” means, (i) with respect to each Serviced Mortgage Loan (other than the Pacific Design Center Mortgage Loan and any Servicing Shift Mortgage Loan) or Serviced Whole Loan (other than the Pacific Design Center Whole Loan and any Servicing Shift Whole Loan), the certificateholder (or its representative) selected by more than 50% of the Controlling Class, by Certificate Balance, as determined by the certificate registrar from time to time (the “Trust Directing Holder”); (ii) with respect to the Pacific Design Center Whole Loan, (a) for so long as no Pacific Design Center control appraisal period exists, the certificateholder (or its representative) selected by more than 50% of the controlling class of the Loan-Specific Certificates by Certificate Balance, as determined by the certificate registrar from time to time (the “Pacific Design Center Controlling Class Representative”) and (b) for so long as an Pacific Design Center control appraisal period exists, the Trust Directing Holder and (iii) with respect to any Servicing Shift Mortgage Loan or Servicing Shift Whole Loan, the related Loan-Specific Directing Holder identified in the Preliminary Prospectus (which is expected to be the holder of the related controlling pari passu companion loan) prior to the related Servicing Shift Securitization Date. |
| THE INFORMATION IN THIS STRUCTURAL AND COLLATERAL TERM SHEET IS NOT COMPLETE AND MAY BE AMENDED PRIOR TO THE TIME OF SALE. THIS TERM SHEET IS NOT AN OFFER TO SELL THESE SECURITIES AND IT IS NOT A SOLICITATION OF AN OFFER TO BUY THESE SECURITIES IN ANY JURISDICTION WHERE THE OFFER OR SALE IS NOT PERMITTED. | ||
| 14 | ||
Benchmark 2023-B38 Mortgage Trust
| STRUCTURE OVERVIEW |
A direct or indirect subsidiary of Eightfold Real Estate Capital Fund V, L.P. or its affiliate is expected to appoint itself or its affiliate as the initial Trust Directing Holder. The initial Pacific Design Center Controlling Class Representative is expected to be ES Ventures Holding, Inc. a Delaware corporation, an affiliate of Steamboat CMBS LLC, which is expected to purchase the Class PDC-HRR Certificates, and Argentic Services Company LP, the special servicer with respect to the Pacific Design Center whole loan. For a description of the directing holder (or equivalent party) for each Non-Serviced Whole Loan, see “Description of the Mortgage Pool—The Whole Loans” and “Pooling and Servicing Agreement—The Directing Holder” in the Preliminary Prospectus. | |
| Control Eligible Certificates: | Class G and Class H certificates. |
| Controlling Class: | The Controlling Class will be, as of any time of determination, the most subordinate class of Control Eligible Certificates then-outstanding that has an aggregate Certificate Balance (as notionally reduced by any cumulative appraisal reduction amounts allocable to such class) equal to at least 25% of the initial Certificate Balance of such class; provided that if at any time the Certificate Balances of all Control Eligible Certificates, as notionally reduced by any appraisal reduction amounts (but without regard to any collateral deficiency amounts) allocable to such classes, have been reduced to zero, then the “Controlling Class” will be the most subordinate class of Control Eligible Certificates that has an aggregate principal balance greater than zero; provided, further, that if at any time the Certificate Balances of the Class A-1, Class A-2, Class A-3, Class A-SB, Class A-4, Class A-M, Class B, Class C, Class D, Class E and Class F certificates have been reduced to zero as a result of the allocation of principal payments on the Mortgage Loans, then the “Controlling Class” will be the most subordinate class of Control Eligible Certificates that has an aggregate Certificate Balance greater than zero without regard to the application of appraisal reduction amounts (or any collateral deficiency amounts) to notionally reduce the Certificate Balance of such class. The Controlling Class as of the Closing Date will be the Class H certificates. |
| Appraised-Out Class: | Any class of Control Eligible Certificates that has been determined, as a result of appraisal reduction amounts and collateral deficiency amounts allocable to such class, to no longer be the Controlling Class (an “Appraised-Out Class”). |
| Remedies Available to Holders of an Appraised-Out Class: | Holders of the majority (by Certificate Balance) of an Appraised-Out Class will have the right, at their sole expense, to require the Special Servicer to order a supplemental appraisal of any Mortgage Loan (or Serviced Whole Loan) for which an appraisal reduction event has occurred or as to which there exists a collateral deficiency amount. Upon receipt of such supplemental appraisal, the Special Servicer will be required to send the appraisal to the Master Servicer, who will be required to recalculate the appraisal reduction amount or collateral deficiency amount, as applicable, based on such supplemental appraisal, and if required by such recalculation, the applicable Appraised-Out Class as the Controlling Class. Any Appraised-Out Class requesting a supplemental appraisal will not be entitled to exercise any rights of the Controlling Class until such time, if any, as the class is reinstated as the Controlling Class. |
Control Termination Event: | Will occur and be continuing (a) with respect to any Mortgage Loan (other than the Pacific Design Center Mortgage Loan and any Servicing Shift Mortgage Loan or Serviced Whole Loan (other than the Pacific Design Center Whole Loan and any Servicing Shift Whole Loan), when one or more of the following is true: (i) the Class G certificates have a Certificate Balance (taking into account the application of any cumulative appraisal reduction amounts and collateral deficiency amounts to notionally reduce the Certificate Balance of such class) being reduced to less than 25% of the initial Certificate Balance of that class or (ii) such Mortgage Loan or Whole Loan is an applicable excluded loan; provided, further, that a Control Termination Event will not be deemed to be continuing in the event the Certificate Balances of all Classes of Pooled Principal Balance Certificates other than the Control Eligible Certificates have been reduced to zero; provided, further, that no Control Termination Event may occur with respect to the Loan-Specific Directing Holder related to any Servicing Shift Whole Loan and the term “Control Termination Event” will not be applicable to the Loan-Specific Directing Holder related to such Servicing Shift Whole Loan; and (b) with respect to the Pacific Design Center Whole Loan, when both a Pacific Design Center control appraisal period has occurred and is continuing, and the events described in clause (a) above are occurring. |
| THE INFORMATION IN THIS STRUCTURAL AND COLLATERAL TERM SHEET IS NOT COMPLETE AND MAY BE AMENDED PRIOR TO THE TIME OF SALE. THIS TERM SHEET IS NOT AN OFFER TO SELL THESE SECURITIES AND IT IS NOT A SOLICITATION OF AN OFFER TO BUY THESE SECURITIES IN ANY JURISDICTION WHERE THE OFFER OR SALE IS NOT PERMITTED. | ||
| 15 | ||
Benchmark 2023-B38 Mortgage Trust
| STRUCTURE OVERVIEW |
With respect to an excluded loan related to the Directing Holder, a Control Termination Event will be deemed to exist. During the continuance of a Control Termination Event, the Directing Holder will no longer have any control rights. The Directing Holder will no longer have the right to direct certain actions of the Special Servicer and will no longer have consent rights with respect to certain material actions that the Master Servicer or Special Servicer proposes to take with respect to a Serviced Mortgage Loan and any related Serviced Companion Loans. During the continuance of a Control Termination Event, the Directing Holder will retain non-binding consultation rights with respect to certain material actions that the Special Servicer proposes to take with respect to a Serviced Mortgage Loan and any related Serviced Companion Loans. Such consultation rights will continue until the occurrence of a Consultation Termination Event. | |
| Consultation Termination Event: | Will occur and be continuing (a) with respect to any Mortgage Loan (other than the Pacific Design Center Mortgage Loan and any Servicing Shift Mortgage Loan) or Serviced Whole Loan (other than the Pacific Design Center Whole Loan and any Servicing Shift Whole Loan), when one or more of the following is true: (i) there is no class of Control Eligible Certificates that has a then-outstanding Certificate Balance (without regard to the application of any cumulative appraisal reduction amounts) equal to at least 25% of the initial Certificate Balance of that class or (ii) such Mortgage Loan or Whole Loan is an applicable excluded loan; provided, further, that a Consultation Termination Event will not be deemed to be continuing in the event the Certificate Balances of all Classes of Pooled Principal Balance Certificates other than the Control Eligible Certificates have been reduced to zero; provided, further, that no Consultation Termination Event may occur with respect to the Loan-Specific Directing Holder related to any Servicing Shift Whole Loan and the term “Consultation Termination Event” will not be applicable to the Loan-Specific Directing Holder related to such Servicing Shift Whole Loan; and (b) with respect to the Pacific Design Center Whole Loan, when both a Pacific Design Center control appraisal period has occurred and is continuing, and the events in clause (a) above are occurring. With respect to an excluded loan related to the Directing Holder, a Consultation Termination Event will be deemed to exist. During the continuance of a Consultation Termination Event, the Directing Holder will have no rights under the PSA other than those rights that all Certificateholders have. |
| Risk Retention Consultation Parties: | The risk retention consultation parties will have certain non-binding consultation rights with respect to certain material servicing actions. Each owner of the VRR Interest will be entitled to appoint a risk retention consultation party. Deutsche Bank AG, New York Branch (a majority-owned affiliate of GACC), Goldman Sachs Mortgage Company and JPMCB are expected to be appointed as the initial risk retention consultation parties. |
| Appointment and Replacement of Special Servicer: | The Directing Holder will appoint the initial Special Servicer with respect to each Serviced Mortgage Loan and any related Serviced Companion Loans as of the Closing Date. For so long as no Control Termination Event is continuing, the Directing Holder generally may replace the Special Servicer with respect to each Serviced Mortgage Loan and any related Serviced Companion Loans with or without cause at any time. During the continuance of a Control Termination Event, the Directing Holder will no longer have the right to replace the Special Servicer and such replacement (other than with respect to the Non-Serviced Whole Loans) will occur based on a vote of holders of all voting eligible classes of certificates as described below. See “Description of the Mortgage Pool—The Whole Loans” and “Pooling and Servicing Agreement” in the Preliminary Prospectus for a description of the special servicer appointment and replacement rights with respect to Non-Serviced Whole Loans. |
| Replacement of Special Servicer by Vote of Certificateholders: | Other than with respect to Non-Serviced Whole Loans and the Pacific Design Center Whole Loan, if a Control Termination Event is continuing, upon (i) the written direction of holders of certificates evidencing not less than 25% of the voting rights (taking into account the application of any appraisal reduction amounts to notionally reduce the Certificate Balances) of the Pooled Principal Balance Certificates and the Class RR Certificates requesting a vote to replace the |
| THE INFORMATION IN THIS STRUCTURAL AND COLLATERAL TERM SHEET IS NOT COMPLETE AND MAY BE AMENDED PRIOR TO THE TIME OF SALE. THIS TERM SHEET IS NOT AN OFFER TO SELL THESE SECURITIES AND IT IS NOT A SOLICITATION OF AN OFFER TO BUY THESE SECURITIES IN ANY JURISDICTION WHERE THE OFFER OR SALE IS NOT PERMITTED. | ||
| 16 | ||
Benchmark 2023-B38 Mortgage Trust
| STRUCTURE OVERVIEW |
Special Servicer (other than with respect to any Servicing Shift Whole Loan) with a new special servicer, (ii) payment by such requesting holders to the Certificate Administrator of all reasonable fees and expenses to be incurred by the Certificate Administrator in connection with administering such vote and (iii) delivery by such holders to the Certificate Administrator and Trustee of written confirmations from each Rating Agency that the appointment of the replacement Special Servicer will not result in a downgrade of the certificates, the Certificate Administrator will be required to promptly post notice of such request on the Certificate Administrator’s website and concurrently provide written notice of such request by mail to all Certificateholders of such request and conduct the solicitation of votes of all certificates in such regard, which such vote must occur within 180 days of the posting of such notice. Upon the written direction of (i) holders of Pooled Principal Balance Certificates and the Class RR Certificates evidencing at least 66-2/3% of a Pooled Certificateholder Quorum or (ii) holders of Pooled Principal Balance Certificates and the Class RR Certificates evidencing more than 50% of the aggregate voting rights of Pooled Principal Balance Certificates and the Class RR Certificates outstanding that has not been reduced to less than 25% of its initial Certificate Balance through the application of appraisal reduction amounts and realized losses), the Trustee will immediately replace the Special Servicer with the replacement Special Servicer (other than with respect to Non-Serviced Whole Loans). “Pooled Certificateholder Quorum” means, in connection with any solicitation of votes in connection with the replacement of the Special Servicer as described above or the Asset Representations Reviewer as described below, the holders of certificates evidencing at least 50% of the aggregate voting rights (taking into account the application of any appraisal reduction amounts to notionally reduce the Certificate Balance of the certificates, except in the case of the termination of the Asset Representations Reviewer) of all Pooled Principal Balance Certificates and the Class RR Certificates, on an aggregate basis. At no time will holders of the Pooled Certificates be permitted to replace the special servicer without cause with respect to the Pacific Design Center Whole Loan for so long as the Pacific Design Center Controlling Class Representative is the Directing Holder of the Pacific Design Center Whole Loan. If at any time a Control Termination Event and a Pacific Design Center control appraisal period have occurred and are continuing, the holders of Pooled Principal Balance Certificates, Loan-Specific Certificates and the Class RR certificates may vote to replace the Pacific Design Center special servicer without cause as described under “Pooling and Servicing Agreement—Replacement of the Special Servicer Without Cause” in the Preliminary Prospectus. If, during the continuance of a Control Termination Event, the Operating Advisor determines, in its sole discretion exercised in good faith, that (1) the Special Servicer is not performing its duties as required under the PSA or is otherwise not acting in accordance with the Servicing Standard and (2) the replacement of the Special Servicer would be in the best interest of the Certificateholders as a collective whole, then the Operating Advisor will have the right to recommend the replacement of the Special Servicer. The Operating Advisor’s recommendation to replace the Special Servicer (other than with respect Non-Serviced Whole Loans and the Pacific Design Center Whole Loan) must be confirmed by a majority of a quorum of Certificateholders (which, for this purpose, is the Certificateholders that (i) evidence at least 20% of the Voting Rights (taking into account the application of any appraisal reduction amounts to notionally reduce the respective Certificate Balances) of all Pooled Principal Balance Certificates and the Class RR Certificates on an aggregate basis and (ii) consist of at least three Certificateholders or Certificate Owners that are not affiliated with each other within 180 days from the time such recommendation is posted to the Certificate Administrator website and is subject to the receipt of written confirmations from each Rating Agency that the appointment of the replacement Special Servicer will not result in a downgrade of the certificates. With respect to the Pacific Design Center Whole Loan, the Operating Advisor will have the right to recommend the replacement of the Special Servicer at any time, which right will be generally subject to requirements that are substantially similar to those set forth above, provided that holders of the Loan-Specific Certificates will be entitled to vote on the Operating Advisor’s recommendation. See “Pooling and Servicing Agreement—Replacement of the Special Servicer After Operating Advisor Recommendation and Certificateholder Vote” in the Preliminary Prospectus. See “Description of the Mortgage Pool—The Whole Loans” and “Pooling and Servicing Agreement” in the Preliminary Prospectus for a description of the special servicer appointment and replacement rights with respect to Non-Serviced Whole Loans.
|
| THE INFORMATION IN THIS STRUCTURAL AND COLLATERAL TERM SHEET IS NOT COMPLETE AND MAY BE AMENDED PRIOR TO THE TIME OF SALE. THIS TERM SHEET IS NOT AN OFFER TO SELL THESE SECURITIES AND IT IS NOT A SOLICITATION OF AN OFFER TO BUY THESE SECURITIES IN ANY JURISDICTION WHERE THE OFFER OR SALE IS NOT PERMITTED. | ||
| 17 | ||
Benchmark 2023-B38 Mortgage Trust
| STRUCTURE OVERVIEW |
| Cap on Workout and Liquidation Fees: | The workout fees and liquidation fees payable to a Special Servicer under the PSA will be an amount equal to the lesser of: (1) 1.0% of each collection of interest and principal following a workout or liquidation, subject to a minimum of $25,000 and (2) $1,000,000 (or $2,000,000 with respect to the Pacific Design Center Mortgage Loan) per workout or liquidation. All Modification Fees actually paid to the Special Servicer in connection with a workout or liquidation or in connection with any prior workout or partial liquidation that occurred within the prior 18 months will be deducted from the total workout fee (only after receipt by the Special Servicer of workout fees of $25,000) and/or liquidation fees payable (other than Modification Fees earned while the Mortgage Loan was not in special servicing). In addition, the total amount of workout and liquidation fees actually payable by the Issuing Entity under the PSA will be capped in the aggregate at $1,000,000 for each related Mortgage Loan (or $2,000,000 with respect to the Pacific Design Center Mortgage Loan). If a new special servicer begins servicing the related Mortgage Loan, all amounts paid to the prior special servicer will be disregarded for purposes of calculating the cap.. |
Special Servicer Compensation: | The special servicing fee will equal 0.25% per annum of the stated principal balance of the related specially serviced loan or REO property, as applicable with a minimum monthly fee of $5,000. The Special Servicer and its affiliates will be prohibited from receiving or retaining any compensation or any other remuneration under the PSA (including, without limitation, in the form of commissions, brokerage fees, rebates, or as a result of any other fee-sharing arrangement) from any person (including, without limitation, the issuing entity, any borrower, any manager, any guarantor or indemnitor in respect of a Serviced Mortgage Loan and any related Serviced Companion Loans, and any purchaser of any Serviced Mortgage Loan and any related Serviced Companion Loan or REO Property) in connection with the disposition, workout or foreclosure of any Mortgage Loan (or Serviced Whole Loan, if applicable), the management or disposition of any REO Property, or the performance of any other special servicing duties under the PSA, other than as expressly permitted in the PSA and other than commercially reasonable treasury management fees, banking fees, property condition report fees, customary title agent fees and insurance commissions or fees received or retained by the Special Servicer or any of its Affiliates in connection with any services performed by such party with respect to any Mortgage Loan, Serviced Whole Loan or REO Property. Subject to certain limited exceptions, the Special Servicer will also be required to report any compensation or other remuneration the Special Servicer or its affiliates have received from any person and such information will be disclosed in the Certificateholders’ monthly distribution date statement. |
Operating Advisor: | With respect to the Serviced Mortgage Loans and any related Serviced Companion Loans the Operating Advisor will have access to any final asset status report and all information available with respect to the transaction on the Certificate Administrator’s website and will have certain monitoring responsibilities on behalf of the entire trust. After the occurrence and during the continuance of a Control Termination Event (or an Operating Advisor Consultation Event (as defined in the Preliminary Prospectus) with respect to the Pacific Design Center Whole Loan), the Operating Advisor will have consultation rights with respect to certain major decisions. The Operating Advisor will be subject to termination with respect to any Serviced Mortgage Loan and Serviced Whole Loan, if holders of at least 15% of the aggregate voting rights of the certificates (in connection with termination and replacement relating to the Mortgage Loans) vote to terminate and replace the Operating Advisor and such vote is approved by holders of more than 50% of the applicable voting rights that exercise their right to vote (in the case of each of such vote and approval, taking into account realized losses and the application of any appraisal reduction amounts to notionally reduce the Certificate Balance of the certificates), provided that holders of at least 50% of the applicable voting rights have exercised their right to vote. The holders initiating such vote will be responsible for the fees and expenses in connection with the vote and replacement. The Operating Advisor will not have consultation rights in respect of Non-Serviced Mortgage Loans. |
| Asset Representations Reviewer: | The Asset Representations Reviewer will be required to review certain delinquent Mortgage Loans after a specified delinquency threshold has been exceeded and the required percentage of Certificateholders vote to direct a review of such delinquent Mortgage Loans. An asset review will occur when either (1) Mortgage Loans with an aggregate outstanding principal balance of 25% or more of the aggregate outstanding principal balance of all of the Mortgage Loans (including any REO loans (or a portion of any REO loan in the case of a whole loan)) held by the issuing entity as of the end of the applicable collection period are delinquent loans or (2)(A) prior to and including the second anniversary of the Closing Date, at least 10 Mortgage Loans are |
| THE INFORMATION IN THIS STRUCTURAL AND COLLATERAL TERM SHEET IS NOT COMPLETE AND MAY BE AMENDED PRIOR TO THE TIME OF SALE. THIS TERM SHEET IS NOT AN OFFER TO SELL THESE SECURITIES AND IT IS NOT A SOLICITATION OF AN OFFER TO BUY THESE SECURITIES IN ANY JURISDICTION WHERE THE OFFER OR SALE IS NOT PERMITTED. | ||
| 18 | ||
Benchmark 2023-B38 Mortgage Trust
| STRUCTURE OVERVIEW |
delinquent loans as of the end of the applicable collection period and the outstanding principal balance of such delinquent loans in the aggregate constitutes at least 15% of the aggregate outstanding principal balance of all of the Mortgage Loans (including any REO loans (or a portion of any REO loan in the case of a whole loan)) held by the issuing entity as of the end of the applicable collection period, or (B) after the second anniversary of the Closing Date, at least 15 Mortgage Loans are delinquent loans as of the end of the applicable collection period and the outstanding principal balance of such delinquent loans in the aggregate constitutes at least 20% of the aggregate outstanding principal balance of all of the Mortgage Loans (including any REO loans (or a portion of any REO loan in the case of a whole loan)) held by the issuing entity as of the end of the applicable collection period. The Asset Representations Reviewer may be terminated and replaced without cause. Upon (i) the written direction of Pooled Certificateholders evidencing not less than 25% of the voting rights (taking into account realized losses, but without regard to the application of any appraisal reduction amounts to notionally reduce the Certificate Balance of the certificates) requesting a vote to terminate and replace the Asset Representations Reviewer with a proposed successor asset representations reviewer that is an eligible asset representations reviewer, and (ii) payment by such holders to the Certificate Administrator of the reasonable fees and expenses to be incurred by the Certificate Administrator in connection with administering such vote, the Certificate Administrator will promptly provide notice to all Certificateholders and the Asset Representations Reviewer of such request by posting such notice on its internet website, and by mailing such notice to all Certificateholders and the Asset Representations Reviewer. Upon the written direction of Pooled Certificateholders evidencing at least 75% of a Pooled Certificateholder Quorum, the Trustee will terminate all of the rights and obligations of the Asset Representations Reviewer under the PSA by written notice to the Asset Representations Reviewer, and the proposed successor Asset Representations Reviewer will be appointed. See “Pooling and Servicing Agreement—The Asset Representations Reviewer” in the Preliminary Prospectus. | |
| Dispute Resolution Provisions: | Each Mortgage Loan Seller will be subject to the dispute resolution provisions set forth in the PSA to the extent those provisions are triggered with respect to any Mortgage Loan sold to the depositor by such Mortgage Loan Seller and such Mortgage Loan Seller will be obligated under the related mortgage loan purchase agreement to comply with all applicable provisions and to take part in any mediation or arbitration proceedings that may result. Generally, in the event that a repurchase request as described in the Preliminary Prospectus is not “Resolved” within 180 days after the related Mortgage Loan Seller receives such Repurchase Request, then the enforcing servicer will be required to send a notice to the initial requesting Certificateholder (if any) indicating the enforcing servicer’s intended course of action with respect to the Repurchase Request. If (a) the enforcing servicer’s intended course of action with respect to the Repurchase Request does not involve pursuing further action to exercise rights against the related Mortgage Loan Seller with respect to the Repurchase Request and the initial requesting Certificateholder, if any, or any other Certificateholder or Certificate Owner wishes to exercise its right to refer the matter to mediation (including nonbinding arbitration) or arbitration, or (b) the enforcing servicer’s intended course of action is to pursue further action to exercise rights against the related Mortgage Loan Seller with respect to the Repurchase Request but the initial requesting Certificateholder, if any, or any other Certificateholder or Certificate Owner does not agree with the dispute resolution method selected by the enforcing servicer, then the initial requesting Certificateholder, if any, or such other Certificateholder or Certificate Owner may deliver a written notice to the enforcing servicer indicating its intent to exercise its right to refer the matter to either mediation or arbitration. “Resolved” means, with respect to a Repurchase Request, (i) that the related material defect or material breach has been cured, (ii) the related Mortgage Loan has been repurchased in accordance with the related mortgage loan purchase agreement, (iii) a mortgage loan has been substituted for the related Mortgage Loan in accordance with the related mortgage loan purchase agreement, (iv) the applicable Mortgage Loan Seller made the loss of value payment, (v) a contractually binding agreement is entered into between the enforcing servicer, on behalf of the issuing entity, and the related Mortgage Loan Seller that settles the related Mortgage Loan Seller’s obligations under the related mortgage loan purchase agreement, or (vi) the related Mortgage Loan is no longer property of the issuing entity as a result of a sale or other disposition in accordance with the PSA. See “Pooling and Servicing Agreement—Dispute Resolution Provisions” in the Preliminary Prospectus. |
| THE INFORMATION IN THIS STRUCTURAL AND COLLATERAL TERM SHEET IS NOT COMPLETE AND MAY BE AMENDED PRIOR TO THE TIME OF SALE. THIS TERM SHEET IS NOT AN OFFER TO SELL THESE SECURITIES AND IT IS NOT A SOLICITATION OF AN OFFER TO BUY THESE SECURITIES IN ANY JURISDICTION WHERE THE OFFER OR SALE IS NOT PERMITTED. | ||
| 19 | ||
Benchmark 2023-B38 Mortgage Trust
| STRUCTURE OVERVIEW |
| Liquidated Loan Waterfall: | On liquidation of any Mortgage Loan, all net liquidation proceeds will be applied according to the PSA, so that amounts allocated as a recovery of accrued and unpaid interest will not, in the first instance, include (a) any amount by which the interest portion of P&I Advances previously made was reduced as a result of appraisal reduction amounts and (b) Accrued AB Loan Interest. After the adjusted interest amount is so allocated, any remaining net liquidation proceeds will be allocated to pay principal on the Mortgage Loan until the unpaid principal amount of the Mortgage Loan has been reduced to zero. Any remaining liquidation proceeds would then be allocated as a recovery of (a) accrued and unpaid interest corresponding to the amount by which the interest portion of P&I Advances previously made was reduced as a result of appraisal reduction amounts and (b) any Accrued AB Loan Interest. |
| THE INFORMATION IN THIS STRUCTURAL AND COLLATERAL TERM SHEET IS NOT COMPLETE AND MAY BE AMENDED PRIOR TO THE TIME OF SALE. THIS TERM SHEET IS NOT AN OFFER TO SELL THESE SECURITIES AND IT IS NOT A SOLICITATION OF AN OFFER TO BUY THESE SECURITIES IN ANY JURISDICTION WHERE THE OFFER OR SALE IS NOT PERMITTED. | ||
| 20 | ||
8687 and 8661 Melrose Avenue and 700 | Collateral Asset Summary – Loan No. 1 Pacific Design Center | Cut-off Date Balance: Cut-off Date LTV: U/W NCF DSCR: U/W NOI Debt Yield: | $65,600,000 47.8% 2.17x 13.8% |

| THE INFORMATION IN THIS STRUCTURAL AND COLLATERAL TERM SHEET IS NOT COMPLETE AND MAY BE AMENDED PRIOR TO THE TIME OF SALE. THIS TERM SHEET IS NOT AN OFFER TO SELL THESE SECURITIES AND IT IS NOT A SOLICITATION OF AN OFFER TO BUY THESE SECURITIES IN ANY JURISDICTION WHERE THE OFFER OR SALE IS NOT PERMITTED. | ||
| 21 | ||
8687 and 8661 Melrose Avenue and 700 | Collateral Asset Summary – Loan No. 1 Pacific Design Center | Cut-off Date Balance: Cut-off Date LTV: U/W NCF DSCR: U/W NOI Debt Yield: | $65,600,000 47.8% 2.17x 13.8% |

| THE INFORMATION IN THIS STRUCTURAL AND COLLATERAL TERM SHEET IS NOT COMPLETE AND MAY BE AMENDED PRIOR TO THE TIME OF SALE. THIS TERM SHEET IS NOT AN OFFER TO SELL THESE SECURITIES AND IT IS NOT A SOLICITATION OF AN OFFER TO BUY THESE SECURITIES IN ANY JURISDICTION WHERE THE OFFER OR SALE IS NOT PERMITTED. | ||
| 22 | ||
8687 and 8661 Melrose Avenue and 700 | Collateral Asset Summary – Loan No. 1 Pacific Design Center | Cut-off Date Balance: Cut-off Date LTV: U/W NCF DSCR: U/W NOI Debt Yield: | $65,600,000 47.8% 2.17x 13.8% |
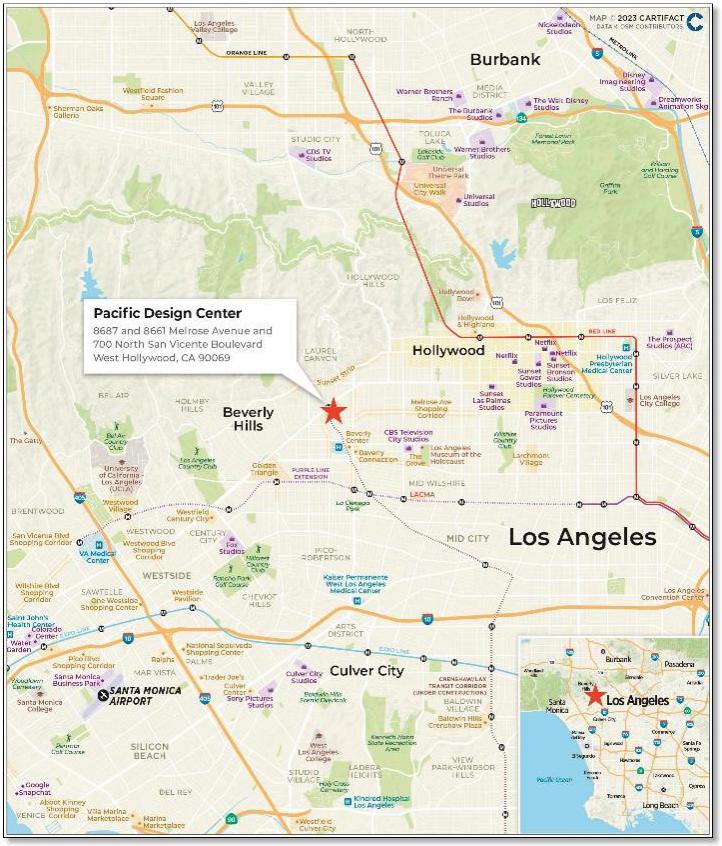
| THE INFORMATION IN THIS STRUCTURAL AND COLLATERAL TERM SHEET IS NOT COMPLETE AND MAY BE AMENDED PRIOR TO THE TIME OF SALE. THIS TERM SHEET IS NOT AN OFFER TO SELL THESE SECURITIES AND IT IS NOT A SOLICITATION OF AN OFFER TO BUY THESE SECURITIES IN ANY JURISDICTION WHERE THE OFFER OR SALE IS NOT PERMITTED. | ||
| 23 | ||
8687 and 8661 Melrose Avenue and 700 | Collateral Asset Summary – Loan No. 1 Pacific Design Center | Cut-off Date Balance: Cut-off Date LTV: U/W NCF DSCR: U/W NOI Debt Yield: | $65,600,000 47.8% 2.17x 13.8% |
| Mortgage Loan Information | |
| Loan Seller: | GSMC |
| Loan Purpose: | Refinance |
Credit Assessment (Fitch/KBRA/Moody’s)(9): | BBB-(sf) / BBB(sf) / NR |
| Borrower Sponsor: | Charles Steven Cohen |
| Borrower: | Pacific Design Center 1, LLC |
| Original Balance(1): | $65,600,000 |
| Cut-off Date Balance(1): | $65,600,000 |
| % by Initial UPB: | 9.99% |
| Interest Rate: | 5.94107142857143% |
| Payment Date: | 6th of each month |
| First Payment Date: | March 6, 2023 |
| Maturity Date: | February 6, 2033 |
| Amortization: | Interest Only |
| Additional Debt(1): | $179,400,000 Pari Passu Senior Debt, Future Mezzanine Permitted |
| Call Protection(2): | L(26),D(87),O(7) |
| Lockbox / Cash Management: | Hard / Springing |
| Reserves(3) | |||
| Initial | Monthly | Cap | |
| Taxes: | $178,740 | $178,740 | NAP |
| Insurance: | $0 | Springing | NAP |
| Replacement: | $0 | $17,554 | NAP |
| TI/LC(4): | $3,000,000 | Springing | $5,000,000 |
| Other(5): | $13,809,708 | Springing | NAP |
| Property Information | |
| Single Asset / Portfolio: | Single Asset |
| Property Type: | Mixed Use - Office/Showroom/Lab |
| Collateral: | Fee |
| Location: | West Hollywood, CA |
| Year Built / Renovated: | 1975, 1988 / 2004 |
| Total Sq. Ft.: | 1,053,217 |
| Property Management: | Cohen Brothers Realty Corporation of California |
| Underwritten NOI(6): | $33,781,880 |
| Underwritten NCF: | $32,047,188 |
| Appraised Value(7): | $512,500,000 |
| Appraisal Date: | November 17, 2022 |
| Historical NOI | |
| Most Recent NOI(6): | $26,745,060 (T-12 September 30, 2022) |
| 2021 NOI: | $25,784,799 (December 31, 2021) |
| 2020 NOI: | $21,067,343 (December 31, 2020) |
| 2019 NOI: | $20,766,946 (December 31, 2019) |
| Historical Occupancy(8) | |
| Most Recent Occupancy: | 78.3% (December 6, 2022) |
| 2021 Occupancy: | 70.1% (December 31, 2021) |
| 2020 Occupancy: | 70.0% (December 31, 2020) |
| 2019 Occupancy: | 71.0% (December 31, 2019) |
| Financial Information(1) | ||||||
| Tranche | Cut-off Date Balance | Balance per Sq. Ft. Cut-off / Balloon | LTV Cut-off / Balloon | U/W DSCR NOI / NCF | U/W Debt Yield NOI / NCF | U/W Debt Yield at Balloon NOI / NCF |
| Mortgage Loan | $65,600,000 | |||||
| Pari Passu Notes | 179,400,000 | |||||
| Senior Notes | $245,000,000 | $233 / $233 | 47.8% / 47.8% | 2.29x / 2.17x | 13.8% / 13.1% | 13.8% / 13.1% |
| Subordinate Note | 20,000,000 | |||||
| Whole Loan | $265,000,000 | $252 / $252 | 51.7% / 51.7% | 1.89x / 1.79x | 12.7% / 12.1% | 12.7% / 12.1% |
| (1) | The Pacific Design Center Mortgage Loan (as defined below) is part of the Pacific Design Center Whole Loan (as defined below) evidenced by nine senior pari passu notes with an aggregate outstanding principal balance as of the Cut-off Date of $245,000,000 and a subordinate note, with an outstanding principal balance as of the Cut-off Date of $20,000,000. The Financial Information for the Senior Notes is calculated based on the aggregate outstanding principal balance as of the Cut-off Date of the Pacific Design Center Senior Notes and the Financial Information for the Pacific Design Center Whole Loan is calculated based on the aggregate outstanding principal balance as of the Cut-off Date of the Pacific Design Center Whole Loan. See “—The Loan” below. |
| (2) | The defeasance lockout period will be at least 26 payments beginning with and including the first payment date of March 6, 2023. The borrower has the option to defease the entire $265.0 million Pacific Design Center Whole Loan in whole (and not in part) after the earlier to occur of (i) two years after the closing date of the securitization that includes the last note to be securitized and (ii) January 11, 2026. The assumed defeasance lockout period of 26 months is based on the expected closing date of the Benchmark 2023-B38 securitization in April 2023. Prepayment in whole, but not in part, of the Pacific Design Center Whole Loan is permitted on or after the payment date in August 6, 2032 without the payment of a yield maintenance premium. |
| (3) | See “Initial and Ongoing Reserves” herein. |
| (4) | The initial TI/LC reserve was $5,000,000; however, on the origination date of the Pacific Design Center Whole Loan the borrower sponsor immediately drew down $2,000,000. The day after the origination date of the Pacific Design Center Whole Loan, the borrower sponsor used the $2,000,000 TI/LC draw and $307,550 of equity to pay for unfunded obligations associated with Cedars Sinai. |
| (5) | Other Reserves consists of an initial Unfunded Obligations Reserve of approximately $13,809,708 and monthly springing reserves for Major Tenant Downgrade Funds and Major Tenant Non-Renewal Funds. |
| (6) | The increase from Most Recent NOI to Underwritten NOI at the Pacific Design Center Property (as defined below) is primarily driven by rent from additional executed Cedars Sinai leases with start dates after the September 2022 trailing 12 month period as well as the associated credit tenant rent steps. |
| (7) | The Pacific Design Center Property had an “as-is” appraised value of $512,500,000 as of November 17, 2022, which includes the extraordinary assumptions that (i) the net rentable area utilized was accurate since a BOMA report verifying the net rentable area was not provided and (ii) in the event of a sale of the Pacific Design Center Property occurring as of the effective date of value, approximately $8.9 million of outstanding free rent amounts would be a seller credit and a buyer would not be responsible for any costs associated with contractual rent abatements. |
| (8) | Occupancy includes all tenants in place and tenants with signed leases as of the reporting period. Occupancy excludes non-collateral tenants. |
| (9) | Fitch and KBRA provided the listed assessments for the Pacific Design Center Mortage Loan in the context of its inclusion in the mortgage pool. |
The Loan. The mortgage loan (the “Pacific Design Center Mortgage Loan”) is part of a whole loan (the “Pacific Design Center Whole Loan”) evidenced by nine senior pari passu notes (collectively, the “Pacific Design Center Senior Notes”) and a controlling subordinate note B (the “Pacific Design Center Trust Subordinate Companion Note”) that are secured by a first deed of trust encumbering the borrower’s fee simple interest in a 1,053,217 sq. ft. mixed-use property comprised of office, showroom and lab space located in West Hollywood, California (the “Pacific Design Center Property”). The Pacific Design Center Trust Subordinate Companion Note is subordinate to the Pacific Design Center Senior Notes as and to the extent described in “Description of the Mortgage Pool—The Whole Loans—The Serviced Pari Passu AB Whole Loans—Pacific Design Center Whole Loan” in the Preliminary Prospectus. The Pacific Design Center Mortgage Loan, which is evidenced by the non-controlling note A-1, has an aggregate outstanding principal balance as of the Cut-off Date of $65,600,000 and represents approximately 9.99% of the Initial Pool Balance. The Pacific Design Center Trust Subordinate
| THE INFORMATION IN THIS STRUCTURAL AND COLLATERAL TERM SHEET IS NOT COMPLETE AND MAY BE AMENDED PRIOR TO THE TIME OF SALE. THIS TERM SHEET IS NOT AN OFFER TO SELL THESE SECURITIES AND IT IS NOT A SOLICITATION OF AN OFFER TO BUY THESE SECURITIES IN ANY JURISDICTION WHERE THE OFFER OR SALE IS NOT PERMITTED. | ||
| 24 | ||
8687 and 8661 Melrose Avenue and 700 | Collateral Asset Summary – Loan No. 1 Pacific Design Center | Cut-off Date Balance: Cut-off Date LTV: U/W NCF DSCR: U/W NOI Debt Yield: | $65,600,000 47.8% 2.17x 13.8% |
Companion Note has an outstanding principal balance as of the Cut-off Date of $20,000,000. The Pacific Design Center Trust Subordinate Companion Note will also be contributed to the Benchmark 2023-B38 securitization trust but will not be included in the mortgage pool. The Pacific Design Center Whole Loan was originated by Goldman Sachs Bank USA (“GS”) on January 11, 2023, had an aggregate original principal balance of $265,000,000 and has an aggregate outstanding principal balance as of the Cut-off Date of $265,000,000. On February 1, 2023, GS or its affiliate transferred notes A-8 and A-9, in the aggregate original principal balance of $40,000,000 to Bank of Montreal (“BMO”) and on February 8, 2023, GS or its affiliate transferred notes A-4, A-5, A-6 and A-7, in the aggregate original principal balance of $75,000,000 to Argentic Real Estate Finance II LLC (“AREF”). The remaining notes, as well as the notes sold to BMO and AREF, are expected to be contributed to one or more future securitization trusts or may otherwise be transferred at any time. The Pacific Design Center Senior Notes accrue interest at an interest rate of 5.94107142857143% per annum and the Pacific Design Center Trust Subordinate Companion Note accrues interest at an interest rate of 15.50000% per annum. Payments allocated to the Pacific Design Center Trust Subordinate Companion Note will be paid only to the holders of the Pacific Design Center loan-specific certificates as described in “Description of the Mortgage Pool—The Whole Loans—The Serviced Pari Passu AB Whole Loans—Pacific Design Center Whole Loan” in the Preliminary Prospectus. The proceeds of the Pacific Design Center Whole Loan were primarily used to refinance prior debt secured by the Pacific Design Center Property, return equity to the borrower sponsor, pay closing costs and fund upfront reserves.
The table below summarizes the promissory notes that comprise the Pacific Design Center Whole Loan. The relationship between the holders of the Pacific Design Center Whole Loan will be governed by a co-lender agreement. The Pacific Design Center Whole Loan will be serviced under the pooling and servicing agreement for the Benchmark 2023-B38 trust. See “Description of the Mortgage Pool—The Whole Loans— The Serviced Pari Passu AB Whole Loans—Pacific Design Center Whole Loan” and “Pooling and Servicing Agreement” in the Preliminary Prospectus.
Whole Loan Summary | ||||
| Note | Original Balance | Cut-off Date Balance | Note Holder(s) | Controlling Piece |
| A-1 | $65,600,000 | $65,600,000 | Benchmark 2023-B38 | No(2) |
| A-2(1) | $34,400,000 | $34,400,000 | GS | No |
| A-3(1) | $30,000,000 | $30,000,000 | GS | No |
| A-4(1) | $40,000,000 | $40,000,000 | AREF | No |
| A-5 | $15,000,000 | $15,000,000 | AREF | No |
| A-6(1) | $10,000,000 | $10,000,000 | AREF | No |
| A-7(1) | $10,000,000 | $10,000,000 | AREF | No |
| A-8 | $25,000,000 | $25,000,000 | BMO | No |
| A-9(1) | $15,000,000 | $15,000,000 | BMO | No |
| Subordinate Note | $20,000,000 | $20,000,000 | Benchmark 2023-B38 (loan-specific certificates) | Yes(2) |
| Whole Loan | $265,000,000 | $265,000,000 | ||
| (1) | The notes held by the lenders are expected to be contributed to one or more future securitization transactions or may otherwise be transferred at any time. |
| (2) | Pursuant to the related co-lender agreement, the holder of the Pacific Design Center Trust Subordinate Companion Note is the controlling noteholder unless a “control appraisal period” has occurred and is continuing under the co-lender agreement, in which case Note A-1 will become the controlling noteholder. |
The proceeds of the Pacific Design Center Whole Loan were primarily used to refinance the Pacific Design Center Property, pay origination costs, cover defeasance costs and return equity to the borrower sponsor.
| Sources and Uses | ||||||||
| Sources | Proceeds | % of Total | Uses | Proceeds | % of Total | |||
| Senior Notes | $245,000,000 | 92.5 | % | Loan Payoff | $159,759,913 | 60.3 | % | |
| Subordinate Note | 20,000,000 | 7.5 | Return Of Equity | 84,548,786 | 31.9 | |||
| Reserves | 16,988,449 | 6.4 | ||||||
| Closing Costs | 3,702,852 | 1.4 | ||||||
| Total Sources | $265,000,000 | 100.0 | % | Total Uses | $265,000,000 | 100.0 | % | |
The Borrower and the Borrower Sponsor. The borrower is Pacific Design Center 1, LLC, a Delaware limited liability company. Legal counsel to the borrower delivered a non-consolidation opinion in connection with the origination of the Pacific Design Center Whole Loan. The borrower sponsor and non-recourse carveout guarantor is Charles Steven Cohen, the President and CEO of Cohen Brothers Realty Corporation (“CBRC”). CBRC is a private real estate development and management firm that develops, redevelops and operates various commercial property types throughout the United States. The firm has commercial properties in New York, Houston, South Florida and Southern California.
The Property. The Pacific Design Center Property is part of an approximately 11-acre campus consisting of three buildings, which were constructed over five decades – the approximately 640,000 sq. ft. “Blue Whale” (the “Blue Building”) was built in 1975; the approximately 420,000 sq. ft. green building (the “Green Building”) was built in 1988 and the approximately 400,000 sq. ft. red building (the “Red Building”), which is not part of the collateral and which CBRC built in 2012 as a state-of-the-art creative office complex. The Red Building was securitized in 2018 in Benchmark 2018-B2, as it was not yet stabilized at the time of the 2014 securitizations of the Blue Building and Green Building (in COMM 2014-CR18 and WFCM 2014-LC16, respectively). The Pacific Design Center Property totals approximately 1.1 million sq. ft. and primarily caters to design showroom and office users. Designed by the architect César Pelli, the Pacific Design Center Property features numerous showroom areas offering a line-up of commercial lighting, furnishings, textiles, and other products. In
| THE INFORMATION IN THIS STRUCTURAL AND COLLATERAL TERM SHEET IS NOT COMPLETE AND MAY BE AMENDED PRIOR TO THE TIME OF SALE. THIS TERM SHEET IS NOT AN OFFER TO SELL THESE SECURITIES AND IT IS NOT A SOLICITATION OF AN OFFER TO BUY THESE SECURITIES IN ANY JURISDICTION WHERE THE OFFER OR SALE IS NOT PERMITTED. | ||
| 25 | ||
8687 and 8661 Melrose Avenue and 700 | Collateral Asset Summary – Loan No. 1 Pacific Design Center | Cut-off Date Balance: Cut-off Date LTV: U/W NCF DSCR: U/W NOI Debt Yield: | $65,600,000 47.8% 2.17x 13.8% |
addition, the campus includes an approximately 600,000 sq. ft., 3,098-space enclosed parking garage and three restaurants. Amenities at the Pacific Design Center Property consist of the SilverScreen Theater, a 294-seat state-of-the-art luxury film venue and reception facility, the Conference Center, a 200-seat facility fully equipped for conferences and meetings, and a Michael Graves-designed fitness center. The Pacific Design Center Property serves as a year-round event and seminar facility catering to a diverse audience and routinely hosts some of the biggest annual events in Los Angeles.
The three buildings are interconnected and have access to the same amenities; however, the Blue Building and Green Building function together and, along with a portion of a shared parking garage serve as the collateral for the Pacific Design Center Whole Loan. The Pacific Design Center Property has its own separately accessed/functioning parking structure with 1,614 spaces. However, there is an reciprocal easement agreement in place allowing for shared parking (a tenant in the Green Building, can park in the Red Building, and vice versa). Parking revenue/expense for the total campus is allocated to the Pacific Design Center Property (52%) and the Red Building (48%) pro-rata.
The chart below summarizes the various rental streams at the Pacific Design Center Property:
| Space Type | Total Sq. Ft. | % Total Sq. Ft. | Occupancy | U/W Base Rent | % of U/W Base Rent(1) | Base Rent PSF | |
| Design SR(2) | 467,582 | 44.4 % | 65.4% | $14,417,965 | 40.8 | % | $ 30.84 |
| Office(3) | 275,635 | 26.2 | 78.5% | $10,389,460 | 29.4 | $ 37.69 | |
| Cedars Sinai(4) | 259,653 | 24.7 | 100.0% | $10,132,718 | 28.7 | $ 39.02 | |
| Other(5) | 50,347 | 4.8 | 86.1% | $370,339 | 1.0 | $ 7.36 | |
| Total / Wtd. Avg. | 1,053,217 | 100.0% | 78.3% | $35,310,482 | 100.0 | % | $ 33.53 |
| (1) | Based on the underwritten rent roll dated December 6, 2022, with contractual rent steps through January 31, 2024. |
| (2) | In connection with Cedars Sinai's most recent expansion, 138,548 sq. ft. of design showroom (“Design SR”) space is expected to be converted to lab space. The lab space has been turned over to Cedars Sinai; however, the tenant has not yet started its buildout. In connection with such conversion, the City of West Hollywood requires 155,772 sq. ft. of Design SR space to remain vacant as a condition for Cedars Sinai to complete the conversion (the “Design Showroom Space Restriction”) and use the space thereafter as lab space. The borrower represents in the Pacific Design Center Whole Loan documents that it has the amount of requisite vacant showroom space and covenants that it will maintain such vacant space for as long as is necessary. We cannot assure you that the conversion will be completed as expected or at all.. |
| (3) | Excluding 46,151 sq. ft. of office space leased to Cedars Sinai |
| (4) | Cedars Sinai currently occupies 259,653 sq. ft. of space at the Pacific Design Center Property, with 46,151 sq. ft. of office space and 213,502 sq. ft. of lab space (including the 138,548 sq. ft. of lab space described above in footnote (2). The tenant signed a non-binding letter of intent for an additional 19,696 sq. ft. of office space on a lease expected to commence on July 1, 2024, which is currently classified as “Office”. We cannot assure you that the tenant will take occupancy or begin paying rent as expected or at all. |
| (5) | Other represents PDC’s non-revenue space, telecommunications, parking, storage, display and other space which has not been allocated to any space type listed in the chart above. |
Major Tenants. The largest tenant, Cedars Sinai Medical Center (“Cedars Sinai”) (24.7% of sq. ft., 28.7% of underwritten base rent) is a nonprofit academic healthcare organization serving the diverse Los Angeles community and beyond. Cedars Sinai was ranked the #1 hospital in California and the #2 hospital in the nation by U.S. News & World Report for 2022-2023. Moreover, Cedars Sinai serves more than 1 million people each year in over 40 locations, with more than 4,500 physicians and nurses and 1,500 research projects. Cedars Sinai is involved in the clinical care and research of heart disease, cancer and brain disorders, among other areas. Cedars Sinai originally took occupancy in 2017, leasing 59,656 sq. ft. in the Green Building, and subsequently expanded numerous times to presently occupy space across both the Green and Blue Buildings. In June 2022, Cedars Sinai leased an additional 138,548 sq. ft. Cedars Sinai maintains mission-critical office and lab space at the Pacific Design Center Property and has invested more than $50 million into its premises to-date. Cedars Sinai previously spent approximately $38.8 million on Suites B230 and B231 ($1,063 per sq. ft.) and $11.7 million on Suite G271 ($1,300 sq. ft.). Cedars Sinai has 46,151 square feet expiring in May 2030, 9,000 square feet expiring in August 2032, 97,053 square feet expiring in June 2033, and 107,449 square feet expiring in June 2038. With respect to 31,099 square feet expiring in June 2033 and 107,449 square feet expiring in June 2038, the tenant has two, five-year renewal options. Additionally, Cedars Sinai has a termination option as to its expansion space under certain circumstances, as described in the “Tenant Summary” table below.
The second largest tenant, “8687 Melrose GreenTenant LLC” (“WeWork Tenant”) (5.2% of sq. ft., 7.4% of underwritten base rent) is a provider of coworking spaces, including physical and virtual shared spaces Founded in 2010, the parent company of WeWork Tenant, WeWork, leases space in more than 700 locations globally, with more than 682,000 members across 39 countries. At the Pacific Design Center Property, the entire WeWork Tenant space is occupied by an enterprise tenant, FabFitFun and is not a sublease. The borrower sponsor does not have any insight into the terms of the agreement with FabFitFun, however WeWork Tenant remains current on all rent. The lease is guaranteed by WeWork Companies Inc. (the “WeWork Guaranty”), and the borrower has a letter of credit from the tenant ; provided, however, the maximum liability of WeWork Companies Inc. under the WeWork Guaranty for (i) all amounts except Enforcement Costs (as defined below) is $1,720,845, cumulative over the term of the related lease, and (ii) amounts incurred by the landlord in collecting or attempting to collect amounts due under the related lease and/or WeWork Guaranty including, without limitation, attorneys’ fees and costs (the “Enforcement Costs”) is $2,000,000, in each instance subject to the terms and conditions of the WeWork Guaranty. The WeWork Guaranty will terminate on July 23, 2023. WeWork Tenant’s lease expires in February 2034, and it has one, five-year renewal option.
The third largest tenant, Pluto, Inc. (3.4% of sq. ft., 5.3% of underwritten base rent) is a free-to-use video streaming service owned and operated by Paramount Streaming, a division of Paramount Global. With hundreds of media and content partners, the company offers streaming and on-demand content to more than 50 million viewers through digital channels designed to emulate the experience of traditional broadcast programming. The service’s revenue is generated from video advertisements seen during programming within ad breaks structured similar to those found on cable television. Pluto, Inc. leases 350 square feet of storage space on a month-to-month basis and has 35,500 square feet expiring in November 2028. Pluto, Inc. has one, five-year renewal option. Pluto, Inc. has the ongoing
| THE INFORMATION IN THIS STRUCTURAL AND COLLATERAL TERM SHEET IS NOT COMPLETE AND MAY BE AMENDED PRIOR TO THE TIME OF SALE. THIS TERM SHEET IS NOT AN OFFER TO SELL THESE SECURITIES AND IT IS NOT A SOLICITATION OF AN OFFER TO BUY THESE SECURITIES IN ANY JURISDICTION WHERE THE OFFER OR SALE IS NOT PERMITTED. | ||
| 26 | ||
8687 and 8661 Melrose Avenue and 700 | Collateral Asset Summary – Loan No. 1 Pacific Design Center | Cut-off Date Balance: Cut-off Date LTV: U/W NCF DSCR: U/W NOI Debt Yield: | $65,600,000 47.8% 2.17x 13.8% |
right to terminate the lease for its entire space, the G900 suite (35,500 sq. ft. office space), upon providing the landlord written notice effectively on or at any date after August 31, 2026, as described in the Tenant Summary below.
The following table presents certain information relating to the tenants at the Pacific Design Center Property:
| Tenant Summary(1) | |||||||||
| Tenant | Credit Rating | Net Rentable Area (Sq. Ft.) | % of Net Rentable Area | U/W Base Rent Per Sq. Ft. | % of Total U/W Base Rent | Lease Expiration | |||
| Cedars Sinai Medical Center(3) | Aa3/AA-/AA- | 259,653 | 24.7 | % | $39.02 | 28.7 | % | Various(4)(5) | |
| WeWork Tenant(6) | NR/CCC/NR | 54,630 | 5.2 | $47.61 | 7.4 | 2/28/2034 | |||
| Pluto, Inc.(7) | Baa2/BBB/BBB | 35,850 | 3.4 | $51.79 | 5.3 | Various(8) | |||
| InvestCloud, Inc. | NR/NR/NR | 32,128 | 3.1 | $49.19 | 4.5 | 1/31/2027 | |||
| Kneedler Fauchere | NR/NR/NR | 17,762 | 1.7 | $48.35 | 2.4 | Various | |||
| Thomas Lavin, Inc. | NR/NR/NR | 16,983 | 1.6 | $41.39 | 2.0 | Various | |||
| D Sutherland | NR/NR/NR | 16,074 | 1.5 | $30.29 | 1.4 | 12/31/2030 | |||
| Advanced Nutrients US LLC | NR/NR/NR | 13,378 | 1.3 | $49.97 | 1.9 | 5/31/2029 | |||
| Janus ET CIE, Inc | NR/NR/NR | 13,317 | 1.3 | $53.00 | 2.0 | 8/31/2025 | |||
| NVE Inc. | NR/NR/NR | 13,088 | 1.2 | $47.86 | 1.8 | 5/31/2031 | |||
| Ten Largest Tenants / Wtd. Avg. | 472,863 | 44.9 | % | $42.76 | 57.3 | % | |||
| Remaining Occupied | 352,246 | 33.4 | $42.84 | 42.7 | |||||
| Total Occupied / Wtd. Avg. | 825,109 | 78.3 | % | $42.79 | 100.0 | % | |||
| Vacant | 228,108 | 21.7 | |||||||
| Total / Wtd. Avg. | 1,053,217 | 100.0 | % | ||||||
| (1) | Based on the underwritten rent roll dated December 6, 2022, with contractual rent steps through January 31, 2024. |
| (2) | In certain instances, ratings provided are those of the parent company of the entity shown, whether or not the parent company guarantees the lease. |
| (3) | Cedars Sinai currently occupies 259,653 sq. ft. of space at the Pacific Design Center Property, with 46,151 sq. ft. of office space and 213,502 sq. ft. of lab space (inclusive of the 138,548 of Design SR sq. ft. that is expected to be converted to lab space. We cannot assure you that the conversion will be completed as expected or at all.). The tenant signed a non-binding letter of intent for an additional 19,696 sq. ft. of office space on a lease expected to commence on July 1, 2024, which is currently classified as “Office”. We cannot assure you that the tenant will take occupancy or begin paying rent as expected or at all. The tenant has a weighted-average remaining lease term of approximately 11.7 years. |
| (4) | Cedars Sinai Medical Center, the largest tenant at the Pacific Design Center Property, has the right to terminate its lease with respect to approximately 138,548 sq. ft. of expansion space (the “Expansion Space”) in the event that (i) confirmation by the City of West Hollywood (the “City”) that (x) the use of the Expansion Space for, among other things, laboratory purposes (the “Permitted Uses”) is lawful and (y) the Design Showroom Space Restriction is satisfied, is in each instance not issued within the time periods set forth in the related lease, or (ii) there is a negative impact to the tenant’s rights under its various leases, including the permitted uses, its allocated parking or its operating expenses due to any pursuit by the borrower of an amendment to the site plan for the Pacific Design Center Property to, among other things, remove the Design Showroom Space Restriction. |
| (5) | Cedars Sinai Medical Center leases 107,449 sq. ft. expiring on June 30, 2038, 97,053 sq. ft. expiring on June 30, 2033, 46,151 sq. ft. expiring on May 31, 2030, and 9,000 sq. ft. expiring on August 31, 2032. |
| (6) | WeWork Tenant’s leased space is fully occupied by FabFitFun, but is not a sublease. |
| (7) | Pluto, Inc. has the ongoing right to terminate the lease for its entire space, the G900 suite (35,500 sq. ft. office space), upon providing the landlord written notice (the “Early Termination Notice”), effective on or at any date (the “Early Termination Date”) after August 31, 2026 subject to, among other conditions, (ii) the Early Termination Date being no earlier than 180 days following delivery of the Early Termination Notice, and (ii) Pluto, Inc. paying to the landlord a termination fee equaling the sum of (x) the total amount of the base rent abated under the lease, (x) the landlord’s tenant improvement allowance contribution, and (z) the brokerage commissions paid and payable by the landlord in respect of the lease, each amortized over the term of the lease using a straight-line method of calculation. |
| (8) | Pluto, Inc. leases 35,500 sq. ft. expiring on November 30, 2028, and 350 sq. ft. on a month-to-month basis. |
| THE INFORMATION IN THIS STRUCTURAL AND COLLATERAL TERM SHEET IS NOT COMPLETE AND MAY BE AMENDED PRIOR TO THE TIME OF SALE. THIS TERM SHEET IS NOT AN OFFER TO SELL THESE SECURITIES AND IT IS NOT A SOLICITATION OF AN OFFER TO BUY THESE SECURITIES IN ANY JURISDICTION WHERE THE OFFER OR SALE IS NOT PERMITTED. | ||
| 27 | ||
8687 and 8661 Melrose Avenue and 700 | Collateral Asset Summary – Loan No. 1 Pacific Design Center | Cut-off Date Balance: Cut-off Date LTV: U/W NCF DSCR: U/W NOI Debt Yield: | $65,600,000 47.8% 2.17x 13.8% |
| Lease Rollover Schedule(1)(2)(3) | |||||||||||
| Year | # of Leases Expiring(4) | Total Expiring Sq. Ft. | % of Total Sq. Ft. Expiring | Cumulative Sq. Ft. Expiring | Cumulative % of Sq. Ft. Expiring | Annual U/W Base Rent Per Sq. Ft.(5) | % U/W Base Rent Rolling(5) | Cumulative % of U/W Base Rent | |||
| MTM | 10 | 6,458 | 0.6 | % | 6,458 | 0.6 | % | $6.22 | 0.1% | 0.1 % | |
| 2023 | 20 | 46,505 | 4.4 | 52,963 | 5.0 | $47.15 | 6.2% | 6.3 % | |||
| 2024 | 16 | 50,333 | 4.8 | 103,296 | 9.8 | $52.59 | 7.5% | 13.8 % | |||
| 2025 | 10 | 55,358 | 5.3 | 158,654 | 15.1 | $49.43 | 7.7% | 21.6 % | |||
| 2026 | 9 | 47,740 | 4.5 | 206,394 | 19.6 | $51.42 | 7.0% | 28.5 % | |||
| 2027 | 9 | 65,605 | 6.2 | 271,999 | 25.8 | $47.77 | 8.9% | 37.4 % | |||
| 2028 | 8 | 89,328 | 8.5 | 361,327 | 34.3 | $45.95 | 11.6% | 49.0 % | |||
| 2029 | 6 | 43,118 | 4.1 | 404,445 | 38.4 | $50.70 | 6.2% | 55.2 % | |||
| 2030 | 5 | 66,964 | 6.4 | 471,409 | 44.8 | $44.33 | 8.4% | 63.6 % | |||
| 2031 | 4 | 26,502 | 2.5 | 497,911 | 47.3 | $45.93 | 3.4% | 67.1 % | |||
| 2032 | 4 | 27,177 | 2.6 | 525,088 | 49.9 | $38.61 | 3.0% | 70.0 % | |||
| 2033 | 3 | 106,311 | 10.1 | 631,399 | 59.9 | $39.04 | 11.8% | 81.8 % | |||
| 2034 & Thereafter | 18 | 193,710 | 18.4 | 825,109 | 78.3 | $33.19 | 18.2% | 100.0 % | |||
| Vacant(6) | NAP | 228,108 | 21.7 | 1,053,217 | 100.0 | % | NAP | NAP | NAP | ||
| Total / Wtd. Avg. | 122 | 1,053,217 | 100.0 | % | $42.79 | 100.0% | |||||
| (1) | Based on the underwritten rent roll dated December 6, 2022, with contractual rent steps through January 31, 2024. |
| (2) | Lease Rollover Schedule is based on the lease expiration dates of all direct leases in place. |
| (3) | Certain tenants may have termination or contraction options (which may become exercisable prior to the originally stated expiration date of the tenant lease) that are not considered in the above Lease Rollover Schedule. |
| (4) | Certain tenants have more than one lease. |
| (5) | Annual U/W Base Rent Per Sq. Ft. and % U/W Base Rent Rolling are inclusive of contractual rent steps underwritten through the termination option per the tenant’s lease. |
| (6) | Cedars Sinai currently occupies 259,653 sq. ft. of space at the Pacific Design Center Property, with 46,151 sq. ft. of office space and 213,502 sq. ft. of lab space (inclusive of the 138,548 of Design SR sq. ft. that is expected to be converted to lab space. We cannot assure you that the conversion will be completed as expected or at all.). The tenant signed a LOI for an additional 19,696 sq. ft. of office space on a lease expected to commence on July 1, 2024, which is currently classified as “Office”. We cannot assure you that the tenant will take occupancy or begin paying rent as expected or at all. |
Environmental Matters. According to the Phase I environmental report dated November 22, 2022, there are certain recognized environmental conditions (collectively, the “REC”) at the Pacific Design Center Property in connection with potential impacts from prior industrial operations at the Pacific Design Center Property for which insufficient regulatory records exist, including, among other things, potential (i) arsenic and creosote impacts from prior railroad operations, (ii) solvent, heavy metal and commercial grade cleaner impacts from prior plating works, machine shop and furniture manufacturing operations, (iii) heavy metal and solvent impacts from prior printing operations, and (iv) petroleum impacts from prior automotive and bus repair operations. According to the Phase I environmental site assessment, due to the redevelopment of the existing improvements at the Pacific Design Center Property, the absence of such prior site uses on any active or closed regulatory data bases and the time elapsed since such historical operations, the REC is not anticipated to detrimentally affect the continued commercial use or operation of the Pacific Design Center Property. At origination, the related borrower sponsor, Charles Steven Cohen, executed an environmental indemnity agreement covering the environmental covenants and related obligations under the Pacific Design Center Whole Loan documents. See “—Description of the Mortgage Pool—Environmental Considerations” in the Preliminary Prospectus.
The Market. The Pacific Design Center Property is located at the intersection of Melrose Avenue and North San Vicente Boulevard in West Hollywood, California. Melrose Avenue directly connects to Santa Monica Boulevard, a major west-east thoroughfare in Los Angeles County which feeds into the I-405, one of the busiest freeways in the United States. The Pacific Design Center Property is in 1-mile proximity to Bel-Air, Beverly Hills and the Hollywood Hills. According to the appraisal, the 2022 total population with a 1-, 3- and 5-mile radii of the Pacific Design Center Property was 39,220, 255,970 and 787,469, respectively. Moreover, within those same radii the 2022 median household income was $109,817, $103,877 and $84,020, respectively.
West Hollywood is one of the most high-profile retail locations in Greater Los Angeles. It has several districts and streets that are some of the most important fashion and retail corridors in the nation. The retail submarket in West Hollywood, Los Angeles is in high demand with fourth quarter of 2022 market rents of $68.48 per sq. ft., as compared to the Los Angeles market $35.52 per sq. ft. average. The submarket has shown positive net absorption of approximately 32,300 sq. ft. in the past 12 months.
As of the fourth quarter of 2022, the West Hollywood office submarket has a vacancy of 10.4%, which is below the Los Angeles office market average of 14.5%. The submarket has shown positive net absorption of 15,600 sq. ft. in the past 12 months. There are no new buildings under construction in the area. The average rent for office space in West Hollywood is $57.21 per sq. ft., which is greater than the Los Angeles Market average at $42.22 per sq. ft. Rent premiums in the submarket are driven by prime location, high land costs, and limited availability.
| THE INFORMATION IN THIS STRUCTURAL AND COLLATERAL TERM SHEET IS NOT COMPLETE AND MAY BE AMENDED PRIOR TO THE TIME OF SALE. THIS TERM SHEET IS NOT AN OFFER TO SELL THESE SECURITIES AND IT IS NOT A SOLICITATION OF AN OFFER TO BUY THESE SECURITIES IN ANY JURISDICTION WHERE THE OFFER OR SALE IS NOT PERMITTED. | ||
| 28 | ||
8687 and 8661 Melrose Avenue and 700 | Collateral Asset Summary – Loan No. 1 Pacific Design Center | Cut-off Date Balance: Cut-off Date LTV: U/W NCF DSCR: U/W NOI Debt Yield: | $65,600,000 47.8% 2.17x 13.8% |
The following table presents certain information relating to comparable office sales for the Pacific Design Center Property:
| Comparable Office Sales(1) | |||||||||
| Property / Location | Gross Building Area (SF) | Year Built / Renovated | Occupancy | Sale Date | Sale Price | Price PSF | Cap Rate | ||
Pacific Design Center West Hollywood, CA | 1,053,217 | (2) | 1975, 1988 / 2004 | 78.3% | (2) | ||||
6922 Hollywood Los Angeles, CA | 208,088 | 1966 / 2021 | 71% | Oct-22 | $96,000,000 | $461.34 | 7.50% | ||
555 Aviation El Segundo, CA | 259,754 | 1966 / 2017 | 100% | Jun-22 | $205,500,000 | $791.13 | 5.01% | ||
One Culver Culver City, CA | 395,272 | 1986 / NAP | 100% | Mar-22 | $510,000,000 | $1,290.25 | 4.50% | ||
Pacific Vista Lake Forest, CA | 321,381 | 2000 / NAP | 89% | Jan-22 | $96,000,000 | $298.71 | 6.30% | ||
Dreamworks Glendale, CA | 497,403 | 2009 / NAP | 100% | Dec-21 | $326,500,000 | $656.41 | 4.39% | ||
1, 3 and 5 Glen Bell Way Irvine, CA | 273,180 | 2001 / 2009 | 100% | Aug-21 | $159,000,000 | $582.03 | 5.70% | ||
Burbank Empire Center Burbank, CA | 233,909 | 2002 / NAP | 100% | Jul-21 | $106,660,000 | $455.99 | 5.40% | ||
The Park Calabasas Calabasas, CA | 222,524 | 1986 / NAP | 92% | Apr-21 | $79,000,000 | $355.02 | 6.50% | ||
| (1) | Information obtained from the appraisal unless otherwise indicated. |
| (2) | Based on the underwritten rent roll dated December 6, 2022. |
| THE INFORMATION IN THIS STRUCTURAL AND COLLATERAL TERM SHEET IS NOT COMPLETE AND MAY BE AMENDED PRIOR TO THE TIME OF SALE. THIS TERM SHEET IS NOT AN OFFER TO SELL THESE SECURITIES AND IT IS NOT A SOLICITATION OF AN OFFER TO BUY THESE SECURITIES IN ANY JURISDICTION WHERE THE OFFER OR SALE IS NOT PERMITTED. | ||
| 29 | ||
8687 and 8661 Melrose Avenue and 700 | Collateral Asset Summary – Loan No. 1 Pacific Design Center | Cut-off Date Balance: Cut-off Date LTV: U/W NCF DSCR: U/W NOI Debt Yield: | $65,600,000 47.8% 2.17x 13.8% |
The following table presents certain information relating to comparable office leases for the Pacific Design Center Property:
| Comparable Office Rental Summary(1) | |||||||
| Property Address/Location | Year Built / Renovated | Gross Building Area (SF) | Tenant Size (SF) | Tenant Name | Monthly Rent PSF | Commencement | Lease Term (Years) |
Pacific Design Center West Hollywood, CA | 1975, 1988 / 2004 | 1,053,217(2) | 35,500(2) | Pluto, Inc.(2) | $4.32(2) | Jul-20(2) | 8.3(2) |
7083 Hollywood Boulevard Hollywood, CA | 1985 / 2012 | 102,570 | 28,982 | Industrious | $4.95 | May-22 | 10.0 |
9200 Sunset Boulevard West Hollywood, CA | 1971 / NAP | 315,079 | 3,325 | Hedosophia | $7.10 | Jun-22 | 5.0 |
9000 Sunset Boulevard West Hollywood, CA | 1964 / NAP | 145,518 | 10,474 | Carroll Guido & Wiesner | $7.00 | Aug-22 | 5.0 |
926 North Sycamore Avenue Los Angeles, CA | 2021 / NAP | 59,844 | 11,021 | Renewable Resources | $5.85 | Jun-22 | 8.3 |
9090 Wilshire Boulevard Beverly Hills, CA | 1986 / NAP | 48,915 | 34,000 | Outfront Media | $4.00 | Jul-22 | 10.0 |
| (1) | Information obtained from the appraisal unless otherwise indicated. |
| (2) | Based on the underwritten rent roll dated December 6, 2022. Monthly Rent PSF includes contractual rent steps through January 31, 2024. |
Operating History and Underwritten Net Cash Flow. The following table presents certain information relating to the historical operating performance and the Underwritten Net Cash Flow at the Pacific Design Center Property:
Cash Flow Analysis.
| Cash Flow Analysis(1) | ||||||
| 2019 | 2020 | 2021 | T-12 9/30/2022 | U/W | U/W Per Sq. Ft. | |
| Base Rent(1) | $25,885,561 | $27,044,367 | $31,152,174 | $30,470,003 | $35,310,482 | $33.53 |
| Credit Tenant Rent Steps(2) | 0 | 0 | 0 | 0 | 2,037,510 | $1.93 |
| Other Income(3) | 7,627,262 | 5,201,209 | 6,873,928 | 9,624,566 | 19,293,983 | $18.32 |
| Gross Potential Rent | $33,512,823 | $32,245,576 | $38,026,102 | $40,094,569 | $56,641,975 | $53.78 |
| Less: Vacancy & Credit Loss | 0 | 0 | 0 | 0 | (9,839,079) | ($9.34) |
| Effective Gross Income | $33,512,823 | $32,245,576 | $38,026,102 | $40,094,569 | $46,802,895 | $44.44 |
| Total Operating Expenses | 12,745,877 | 11,178,233 | 12,241,303 | 13,349,509 | 13,021,016 | $12.36 |
| Net Operating Income(4) | $20,766,946 | $21,067,343 | $25,784,799 | $26,745,060 | $33,781,880 | $32.07 |
| Replacement Reserves | 0 | 0 | 0 | 0 | 210,643 | $0.20 |
| TI/LC | 0 | 0 | 0 | 0 | 1,524,048 | $1.45 |
| Net Cash Flow | $20,766,946 | $21,067,343 | $25,784,799 | $26,745,060 | $32,047,188 | $30.43 |
| (1) | Based on the underwritten rent roll dated December 6, 2022, with contractual rent steps through January 31, 2024. |
| (2) | Credit Tenant Rent Steps reflects the present value of contractual rent step increments for investment-grade tenants through January 31, 2024. |
| (3) | Other income includes Total Commercial Reimbursement Revenue, Market Revenue from Vacant Units, Parking Income, as well as Events and Seminars, Electric Submetering, Security Service Income and Cleaning Services Income, based on budget. |
| (4) | The increase from T-12 9/30/2022 Net Operating Income to Underwritten Net Operating Income at the Pacific Design Center Property is primarily driven by rent from additional executed Cedars Sinai leases with start dates after the September T12 period as well as the associated credit tenant rent steps. |
Property Management. The Pacific Design Center Property is managed by Cohen Brothers Realty Corporation of California, an affiliate of the borrower sponsor. The parking at the Pacific Design Center Property and the Red Building is managed by AMB Industry Groups, LLC.
Initial and Ongoing Reserves. On the origination date of the Pacific Design Center Whole Loan, the borrower funded a reserve of approximately $178,740 for real estate taxes, $3,000,000 for tenant improvements and leasing commissions and prebuild costs and approximately $13,809,708 for unfunded obligations in connection with certain outstanding free rent and tenant improvement and leasing commissions obligations, primarily associated with the Cedars Sinai spaces. The initial reserve for tenant improvements and leasing commissions was $5,000,000; however, on the origination date of the Pacific Design Center Whole Loan, the borrower sponsor
| THE INFORMATION IN THIS STRUCTURAL AND COLLATERAL TERM SHEET IS NOT COMPLETE AND MAY BE AMENDED PRIOR TO THE TIME OF SALE. THIS TERM SHEET IS NOT AN OFFER TO SELL THESE SECURITIES AND IT IS NOT A SOLICITATION OF AN OFFER TO BUY THESE SECURITIES IN ANY JURISDICTION WHERE THE OFFER OR SALE IS NOT PERMITTED. | ||
| 30 | ||
8687 and 8661 Melrose Avenue and 700 | Collateral Asset Summary – Loan No. 1 Pacific Design Center | Cut-off Date Balance: Cut-off Date LTV: U/W NCF DSCR: U/W NOI Debt Yield: | $65,600,000 47.8% 2.17x 13.8% |
immediately drew down $2,000,000. In addition, on the day after the origination date of the Pacific Design Center Whole Loan, the borrower sponsor utilized the $2,000,000 drawn for the tenant improvements and leasing commissions along with $307,550 of equity to pay for unfunded obligations associated with Cedars Sinai.
Additionally, on each monthly due date, the borrower is required to fund the following reserves with respect to the Pacific Design Center.
Tax Reserve – on each monthly due date, the borrower is required to fund a tax reserve in an amount equal to one-twelfth of the amount that the lender estimates (initially approximately $178,740) will be necessary to pay taxes over the then succeeding 12-month period.
Insurance Reserve – on each monthly due date, the borrower is required to fund an insurance reserve in an amount equal to one-twelfth of the amount that the lender estimates will be necessary to cover premiums over the then succeeding 12-month period.
Replacement Reserve – on each monthly due date, the borrower is required to fund a replacement reserve in an amount equal to approximately $17,554.
TI/LC Reserve – if the tenant improvements and leasing commissions reserve drops below $3,000,000, on each monthly due date, the borrower is required to fund a reserve equal to $87,768 subject to a cap of $5,000,000.
Major Tenant Downgrade Funds – On each monthly due date occurring during the continuance of a Major Tenant Downgrade (as defined below), the borrower is required to fund a reserve (the “Major Tenant Downgrade Account”) in an amount equal to all amounts remaining in the cash management account after deposits for all other items, except for the excess cash flow reserve account, required by the Pacific Design Center Whole Loan documents until the aggregate amount deposited in the Major Tenant Downgrade Account during the continuance of such Major Tenant Downgrade equals $15.00 per sq. ft. leased by the Major Tenant (as defined below) (or $60.00 per sq. ft. if the Major Tenant is in monetary default) (the “Major Tenant Downgrade Sweep Capped Amount”). If no event of default has occurred and is continuing, the lender is required to disburse such funds to the borrower for approved leasing expenses in respect of the space previously leased by the Major Tenant if there are, as of the date of disbursement, insufficient funds in the leasing reserve account or the excess cash flow reserve account for payment of such expenses in accordance with the Pacific Design Center Whole Loan documents.
Major Tenant Non-Renewal Funds – If, at any time, any lease with the Major Tenant that was in effect on the origination date is scheduled to terminate within the next 12 months with respect to all or any portion of the leased space and the Major Tenant has not exercised its renewal option with respect to such space (or extended the term of the lease with respect to such space by at least three years on then-market rate terms for such space or better) (each such case, a “Major Tenant Non-Renewal”), then, on the monthly due date that is twelve months prior to such scheduled expiration date and on each of the eleven consecutive monthly due dates, the borrower is required to fund a reserve (the “Major Tenant Non-Renewal Account”) in an amount equal to one-twelfth of the unabated annual base rent due under such lease with respect to such leased space as of the origination date (such annual base rent, the “Major Tenant Non-Renewal Annual Rent”; and such monthly deposit, the “Major Tenant Non-Renewal Monthly Deposit”). Notwithstanding the foregoing, if and for so long as the net cash flow debt yield, as calculated in accordance with the Pacific Design Center Whole Loan documents, is 11.6% or higher, the obligation to remit funds into the Major Tenant Non-Renewal Account will be suspended. The borrower is permitted to, in lieu of making the Major Tenant Non-Renewal Monthly Deposits required with respect to any Major Tenant Non-Renewal, deliver to the lender a letter of credit on or before the monthly due date occurring in the calendar month that is 12 months prior to the scheduled expiration applicable to such Major Tenant Non-Renewal in an amount equal to the applicable Major Tenant Non-Renewal Annual Rent. Amounts contained in the Major Tenant Non-Renewal Account are required to be released to the borrower from time to time for the same purposes, and subject to the same conditions, as disbursements from the leasing reserve account.
A “Major Tenant” means Cedars Sinai Medical Center, a California non-profit public benefit corporation, or any successor tenant in all or substantially all of the space currently leased to Cedars Sinai Medical Center at the Pacific Design Center Property.
A “Major Tenant Event” exists if (i) any Major Tenant defaults under one or more of its leases and such default continues beyond any applicable notice and cure period; (ii) any non-investment grade Major Tenant goes dark in a significant portion of its space; (iii) any Major Tenant or any lease guarantor on a lease with a Major Tenant becomes insolvent or files for bankruptcy; or (iv) any tenant that had been rated “BBB-” or better gets downgraded (or newly rated, to the extent such tenant was not previously rated by such rating agency) below “BB+” by S&P Global Ratings or the equivalent by Moody’s Investors Service, Inc. or Fitch, Inc. (a “Major Tenant Downgrade”).
Lockbox / Cash Management. The Pacific Design Center Whole Loan is structured with a hard lockbox and springing cash management. The borrower was required to deliver tenant direction letters to the existing tenants at the Pacific Design Center Property, directing them to remit their rent directly to the lender-controlled lockbox. The borrower is required to cause revenue received by the borrower or the property manager from the Pacific Design Center Property to be deposited into such lockbox immediately. The borrower is required to cause the parking manager to immediately deposit the parking revenue allocated to the Pacific Design Center Property and received by the borrower or parking manager, as the case may be, into the lender-controlled lockbox. All funds deposited into the lockbox are required to be transferred on each business day to or at the direction of the borrower unless a Pacific Design Center Trigger Period (as defined below) exists. Upon the occurrence and during the continuance of a Pacific Design Center Trigger Period, all funds in the lockbox account are required to be swept on each business day to a cash management account under the control of the lender to be applied and disbursed
| THE INFORMATION IN THIS STRUCTURAL AND COLLATERAL TERM SHEET IS NOT COMPLETE AND MAY BE AMENDED PRIOR TO THE TIME OF SALE. THIS TERM SHEET IS NOT AN OFFER TO SELL THESE SECURITIES AND IT IS NOT A SOLICITATION OF AN OFFER TO BUY THESE SECURITIES IN ANY JURISDICTION WHERE THE OFFER OR SALE IS NOT PERMITTED. | ||
| 31 | ||
8687 and 8661 Melrose Avenue and 700 | Collateral Asset Summary – Loan No. 1 Pacific Design Center | Cut-off Date Balance: Cut-off Date LTV: U/W NCF DSCR: U/W NOI Debt Yield: | $65,600,000 47.8% 2.17x 13.8% |
in accordance with the Pacific Design Center Whole Loan documents, and all excess cash flow funds remaining in the cash management account after the application of such funds in accordance with the Pacific Design Center Whole Loan documents are required to be held by the lender in an excess cash flow reserve account as additional collateral for the Pacific Design Center Whole Loan. Upon the cure of the applicable Pacific Design Center Trigger Period, so long as no other Pacific Design Center Trigger Period exists, the lender is required to return any amounts remaining on deposit in the excess cash flow reserve account to the borrower. Upon an event of default under the Pacific Design Center Whole Loan documents, the lender will apply funds to the debt in such priority as it may determine.
A “Pacific Design Center Trigger Period” means a period commencing upon the earliest to occur of (i) an event of default under the Pacific Design Center Whole Loan or, if a mezzanine loan is then in place, an event of default under any related mezzanine loan agreement (a “Mezzanine Loan Event of Default”), (ii) the net cash flow debt yield, as calculated in accordance with the Pacific Design Center Whole Loan documents (based on the full amount of the debt under the Pacific Design Center Whole Loan together with the debt under any related mezzanine loan), being less than 8.0% as of the end of any fiscal quarter, and (iii) the occurrence of a Major Tenant Event, and expiring upon (a) with respect to clause (i) above, when the lender has, in the case of an event of default under the Pacific Design Center Whole Loan, expressly waived such event of default in writing or, in the case of a Mezzanine Loan Event of Default, when the applicable mezzanine lender has expressly waived any such Mezzanine Loan Event of Default in writing, (b) with respect to clause (ii) above, the date that the net cash flow debt yield, as calculated in accordance with the Pacific Design Center Whole Loan documents (based on the full amount of the debt under the Pacific Design Center Whole Loan together with the debt under any related mezzanine loan), is equal to or greater than 8.0% for two consecutive calendar quarters, and (c) with regard to any Pacific Design Center Trigger Period commenced solely as a result of a Major Tenant Downgrade, when the aggregate amounts deposited into the Major Tenant Downgrade Account during the period that a Pacific Design Center Trigger Period exists solely as a result of such Major Tenant Downgrade equal the Major Tenant Downgrade Sweep Capped Amount or the date on which such Major Tenant once again has (x) a rating of at least “BBB-” from at least one of the applicable rating agencies and (y) no rating that is less than “BBB-” from any of the applicable rating agencies. Notwithstanding the foregoing and subject to the terms of the Pacific Design Center Whole Loan documents, no Pacific Design Center Trigger Period will be deemed to exist solely with respect to clause (ii) of the definition of “Pacific Design Center Trigger Period” during any period that the borrower has deposited cash into an account with the lender or has delivered to the lender a letter of credit in an amount reasonably determined by the lender to be sufficient, if the same were to be deducted from the principal balance of the Pacific Design Center Whole Loan, to cause the net cash flow debt yield, as calculated in accordance with the Pacific Design Center Whole Loan documents (based on the full amount of the debt under the Pacific Design Center Whole Loan together with the debt under any related mezzanine loan), to be equal to or greater than 8.0%. Such additional cash deposit or letter of credit, as applicable, will be returned to the borrower, provided no Pacific Design Center Trigger Period is ongoing, upon the net cash flow debt yield, as calculated in accordance with the Pacific Design Center Whole Loan documents (based on the full amount of the debt under the Pacific Design Center Whole Loan together with the debt under any related mezzanine loan), being equal to or greater than 8.0% for two consecutive quarters.
Current Mezzanine or Subordinate Indebtedness. The Pacific Design Center Trust Subordinate Companion Note, with an outstanding principal balance as of the Cut-off Date of $20,000,000, has an interest rate of 15.50000% per annum and is coterminous with the Pacific Design Center Senior Notes. The Pacific Design Center Senior Notes are senior in right of payment to the Pacific Design Center Trust Subordinate Companion Note. For additional information, see “Description of the Mortgage Pool—The Whole Loans—The Serviced Pari Passu-AB Whole Loan—The Pacific Design Center Whole Loan” in the Preliminary Prospectus.
Future Mezzanine or Secured Subordinate Indebtedness Permitted. The Pacific Design Center Whole Loan documents permit future mezzanine debt secured by a pledge of direct or indirect equity interests in the borrower in an amount up to $50,000,000 subject to the satisfaction of certain conditions including, among others, (i) immediately after giving effect to such debt (x) the combined loan-to-value ratio may not exceed 50.7%, (y) the net cash flow debt yield, as calculated in accordance with the Pacific Design Center Whole Loan documents, is at least 11.6% and (z) the combined net cash flow debt service coverage ratio, as calculated in accordance with the Pacific Design Center Whole Loan documents, is at least 1.72x, (ii) execution of a subordination and intercreditor agreement reasonably acceptable to the lender and substantially in the form attached to the Pacific Design Center Whole Loan, and (iii) receipt of a rating agency confirmation from each applicable rating agency.
Partial Release. None.
| THE INFORMATION IN THIS STRUCTURAL AND COLLATERAL TERM SHEET IS NOT COMPLETE AND MAY BE AMENDED PRIOR TO THE TIME OF SALE. THIS TERM SHEET IS NOT AN OFFER TO SELL THESE SECURITIES AND IT IS NOT A SOLICITATION OF AN OFFER TO BUY THESE SECURITIES IN ANY JURISDICTION WHERE THE OFFER OR SALE IS NOT PERMITTED. | ||
| 32 | ||
1201 Third Avenue | Collateral Asset Summary – Loan No. 2 1201 Third Avenue | Cut-off Date Balance: Cut-off Date LTV: U/W NCF DSCR: U/W NOI Debt Yield: | $60,000,000 30.5% 2.76x 17.7% |

| THE INFORMATION IN THIS STRUCTURAL AND COLLATERAL TERM SHEET IS NOT COMPLETE AND MAY BE AMENDED PRIOR TO THE TIME OF SALE. THIS TERM SHEET IS NOT AN OFFER TO SELL THESE SECURITIES AND IT IS NOT A SOLICITATION OF AN OFFER TO BUY THESE SECURITIES IN ANY JURISDICTION WHERE THE OFFER OR SALE IS NOT PERMITTED. | ||
| 33 | ||
1201 Third Avenue | Collateral Asset Summary – Loan No. 2 1201 Third Avenue | Cut-off Date Balance: Cut-off Date LTV: U/W NCF DSCR: U/W NOI Debt Yield: | $60,000,000 30.5% 2.76x 17.7% |
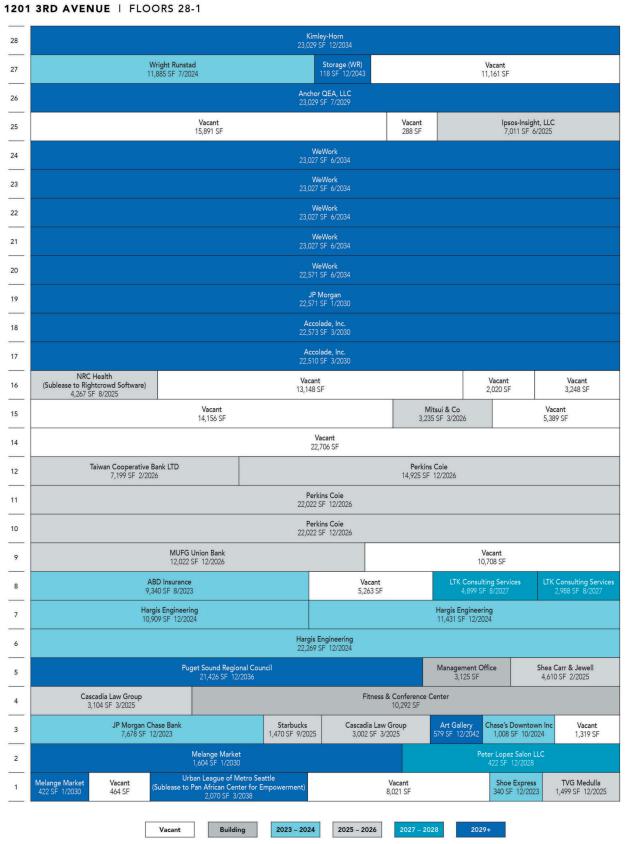
| THE INFORMATION IN THIS STRUCTURAL AND COLLATERAL TERM SHEET IS NOT COMPLETE AND MAY BE AMENDED PRIOR TO THE TIME OF SALE. THIS TERM SHEET IS NOT AN OFFER TO SELL THESE SECURITIES AND IT IS NOT A SOLICITATION OF AN OFFER TO BUY THESE SECURITIES IN ANY JURISDICTION WHERE THE OFFER OR SALE IS NOT PERMITTED. | ||
| 34 | ||
1201 Third Avenue | Collateral Asset Summary – Loan No. 2 1201 Third Avenue | Cut-off Date Balance: Cut-off Date LTV: U/W NCF DSCR: U/W NOI Debt Yield: | $60,000,000 30.5% 2.76x 17.7% |

| THE INFORMATION IN THIS STRUCTURAL AND COLLATERAL TERM SHEET IS NOT COMPLETE AND MAY BE AMENDED PRIOR TO THE TIME OF SALE. THIS TERM SHEET IS NOT AN OFFER TO SELL THESE SECURITIES AND IT IS NOT A SOLICITATION OF AN OFFER TO BUY THESE SECURITIES IN ANY JURISDICTION WHERE THE OFFER OR SALE IS NOT PERMITTED. | ||
| 35 | ||
1201 Third Avenue | Collateral Asset Summary – Loan No. 2 1201 Third Avenue | Cut-off Date Balance: Cut-off Date LTV: U/W NCF DSCR: U/W NOI Debt Yield: | $60,000,000 30.5% 2.76x 17.7% |
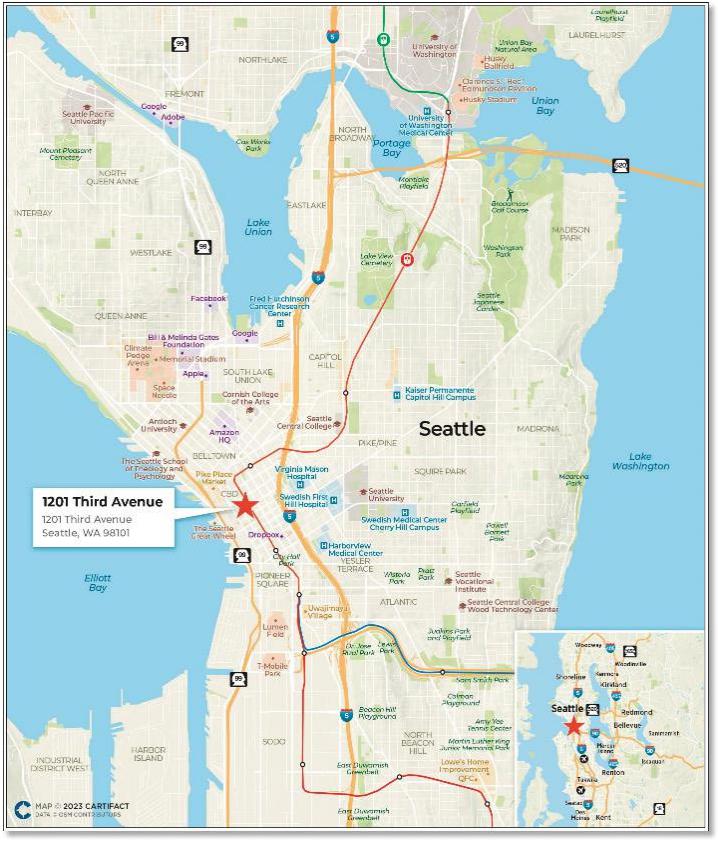
| THE INFORMATION IN THIS STRUCTURAL AND COLLATERAL TERM SHEET IS NOT COMPLETE AND MAY BE AMENDED PRIOR TO THE TIME OF SALE. THIS TERM SHEET IS NOT AN OFFER TO SELL THESE SECURITIES AND IT IS NOT A SOLICITATION OF AN OFFER TO BUY THESE SECURITIES IN ANY JURISDICTION WHERE THE OFFER OR SALE IS NOT PERMITTED. | ||
| 36 | ||
1201 Third Avenue | Collateral Asset Summary – Loan No. 2 1201 Third Avenue | Cut-off Date Balance: Cut-off Date LTV: U/W NCF DSCR: U/W NOI Debt Yield: | $60,000,000 30.5% 2.76x 17.7% |
| Mortgage Loan Information | |
| Loan Seller: | JPMCB |
| Loan Purpose: | Refinance |
Credit Assessment (Fitch/KBRA/Moody’s)(7): | BBB+(sf) / A-(sf) / Aa1(sf) |
| Borrower Sponsors(1): | MetLife, Inc. and New York Common Retirement Fund |
| Borrower: | 1201 Tab Owner, LLC |
| Original Balance(2): | $60,000,000 |
| Cut-off Date Balance(2): | $60,000,000 |
| % by Initial UPB: | 9.1% |
| Interest Rate: | 5.58500% |
| Payment Date: | 9th of each month |
| First Payment Date: | April 9, 2023 |
| Maturity Date: | March 9, 2028 |
| Amortization: | Interest Only |
| Additional Debt(2): | $110,000,000 Pari Passu Debt |
| Call Protection(3): | L(24),YM1(1),DorYM1(28),O(7) |
| Lockbox / Cash Management: | Hard / Springing |
| Reserves(4) | |||
| Initial | Monthly | Cap | |
| Taxes: | $0 | Springing | NAP |
| Insurance: | $0 | Springing | NAP |
| TI/LC Reserve: | $17,567,429 | $0 | NAP |
| Free Rent Reserve: | $3,755,350 | $0 | NAP |
| Other: | $0 | Springing | NAP(5) |
| Property Information | |
| Single Asset / Portfolio: | Single Asset |
| Property Type: | CBD Office |
| Collateral: | Fee |
| Location: | Seattle, WA |
| Year Built / Renovated: | 1988 / NAP |
| Total Sq. Ft.: | 1,129,710 |
| Property Management: | Wright Runstad Associates Limited Partnership |
| Underwritten NOI(6): | $30,065,509 |
| Underwritten NCF(6): | $26,556,863 |
| Appraised Value: | $556,500,000 |
| Appraisal Date: | December 1, 2022 |
| Historical NOI | |
| Most Recent NOI: | $31,394,453 (December 31, 2022) |
| 2021 NOI: | $33,049,379 (December 31, 2021) |
| 2020 NOI: | $36,494,642 (December 31, 2020) |
| 2019 NOI: | $32,067,288 (December 31, 2019) |
| Historical Occupancy | |
| Most Recent Occupancy(6): | 81.1% (January 1, 2023) |
| 2022 Occupancy: | 80.7% (August 31, 2022) |
| 2021 Occupancy: | 87.4% (December 31, 2021) |
| 2020 Occupancy: | 94.4% (December 31, 2020) |
| Financial Information(2) | ||||||
| Tranche | Cut-off Date Balance | Balance per Sq. Ft. Cut-off / Balloon | LTV Cut-off / Balloon | U/W DSCR NOI / NCF | U/W Debt Yield NOI / NCF | U/W Debt Yield at Balloon NOI / NCF |
| Mortgage Loan | $60,000,000 | |||||
| Pari Passu Notes | $110,000,000 | |||||
| Whole Loan | $170,000,000 | $150 / $150 | 30.5% / 30.5% | 3.12x / 2.76x | 17.7% / 15.6% | 17.7% / 15.6% |
| (1) | There is no non-recourse carveout guarantor or separate environmental indemnitor with respect to the 1201 Third Avenue Whole Loan (as defined below). |
| (2) | The 1201 Third Avenue Mortgage Loan (as defined below) is part of the 1201 Third Avenue Whole Loan (as defined below) evidenced by seven pari passu promissory notes with an aggregate original principal balance of $170,000,000. The Financial Information presented above is based on the 1201 Third Avenue Whole Loan. See “—The Loan” below. |
| (3) | The borrower has the option to (a) prepay the 1201 Third Avenue Whole Loan on or after April 9, 2025, with the payment of the greater of (i) a yield maintenance premium or (ii) 1% of the principal balance of the 1201 Third Avenue Whole Loan or (b) defease the 1201 Third Avenue Whole Loan upon the earlier to occur of (i) February 10, 2026, or (ii) the date that is two years from the closing date of the securitization that includes the last note to be securitized. The assumed defeasance lockout period of 25 months is based on the expected closing date of the Benchmark 2023-B38 securitization in April 2023. The actual lockout period may be longer. |
| (4) | See “Initial and Ongoing Reserves” herein. |
| (5) | The Perkins Coie Reserve (as described below) is subject to the Perkins Coie TI Cap (as defined below) pursuant to the 1201 Third Avenue Whole Loan documents. |
| (6) | Underwritten NOI, Underwritten NCF and Most Recent Occupancy are inclusive of Kimley-Horn, among other tenants, which have executed leases but are not yet in occupancy with expected lease commencement dates after the expected closing date of the Benchmark 2023-B38 securitization in April 2023. In total, $3,755,350 of free rent has been escrowed at origination. See “Major Tenants” and “Initial and Ongoing Reserves” herein. |
| (7) | Fitch, KBRA and Moody’s provided the listed assessments for the 1201 Third Avenue Mortgage Loan in the context of its inclusion in the mortgage pool. |
The Loan. The mortgage loan (the “1201 Third Avenue Mortgage Loan”) is part of a whole loan (the “1201 Third Avenue Whole Loan”) with an aggregate original principal balance of $170,000,000. The 1201 Third Avenue Whole Loan is secured by a first priority fee mortgage encumbering a 1,129,710 sq. ft. Class A office property in Seattle, Washington (the “1201 Third Avenue Property”). The 1201 Third Avenue Whole Loan is comprised of seven pari passu senior promissory notes and was co-originated by Morgan Stanley Bank, N.A. (“MSBNA”) and JPMorgan Chase Bank, National Association (“JPMCB”) on February 10, 2023. The non-controlling Notes A-3 and A-4-1, with an aggregate original principal balance of $60,000,000, represent the 1201 Third Avenue Mortgage Loan and will be included in the Benchmark 2023-B38 securitization trust. The remaining pari passu notes are currently expected to be contributed to one or more future securitization transactions or may otherwise be transferred at any time.
| THE INFORMATION IN THIS STRUCTURAL AND COLLATERAL TERM SHEET IS NOT COMPLETE AND MAY BE AMENDED PRIOR TO THE TIME OF SALE. THIS TERM SHEET IS NOT AN OFFER TO SELL THESE SECURITIES AND IT IS NOT A SOLICITATION OF AN OFFER TO BUY THESE SECURITIES IN ANY JURISDICTION WHERE THE OFFER OR SALE IS NOT PERMITTED. | ||
| 37 | ||
1201 Third Avenue | Collateral Asset Summary – Loan No. 2 1201 Third Avenue | Cut-off Date Balance: Cut-off Date LTV: U/W NCF DSCR: U/W NOI Debt Yield: | $60,000,000 30.5% 2.76x 17.7% |
The table below summarizes the promissory notes that comprise the 1201 Third Avenue Whole Loan. The relationship between the holders of the 1201 Third Avenue Whole Loan is governed by a co-lender agreement. The 1201 Third Avenue Whole Loan is expected to be serviced pursuant to the pooling and servicing agreement for the BANK5 2023-5YR1 trust, until the controlling note A-2 is securitized, whereupon the 1201 Third Avenue Whole Loan will be serviced pursuant to the pooling and servicing agreement for such future securitization. See “Description of the Mortgage Pool—The Whole Loans—The Non-Serviced Pari Passu Whole Loans” and “The Pooling and Servicing Agreement—Servicing of the Non-Serviced Mortgage Loans” in the Preliminary Prospectus.
| Whole Loan Summary | |||||
| Note | Original Balance | Cut-off Date Balance | Note Holder | Controlling Piece | |
| A-1-1 | $30,000,000 | $30,000,000 | BANK5 2023-5YR1(1)(2) | No | |
| A-1-2 | $20,000,000 | $20,000,000 | MSBNA(3) | No | |
| A-1-3 | $10,000,000 | $10,000,000 | MSBNA(3) | No | |
| A-2 | $42,000,000 | $42,000,000 | MSBNA(2)(3) | Yes | |
| A-3 | $40,000,000 | $40,000,000 | Benchmark 2023-B38 | No | |
| A-4-1 | $20,000,000 | $20,000,000 | Benchmark 2023-B38 | No | |
| A-4-2 | $8,000,000 | $8,000,000 | JPMCB(3) | No | |
| Whole Loan | $170,000,000 | $170,000,000 | |||
| (1) | The BANK5 2023-5YR1 securitization is expected to close April 19, 2023. |
| (2) | The 1201 Third Avenue Whole Loan is expected to be serviced pursuant to the pooling and servicing agreement for the BANK5 2023-5YR1 trust until the controlling note A-2 is securitized, whereupon the 1201 Third Avenue Whole Loan will be serviced pursuant to the pooling and servicing agreement for such future securitization. |
| (3) | The related notes are expected to be contributed to one or more future securitizations or otherwise transferred at any time. |
| Sources and Uses | ||||||||
| Sources | Proceeds | % of Total | Uses | Proceeds | % of Total | |||
| Whole Loan | $170,000,000 | 65.4 | % | Loan Payoff | $236,517,648 | 91.0 | % | |
| Borrower Equity | 89,973,080 | 34.6 | Upfront Reserves | 21,322,779 | 8.2 | |||
| Closing Costs | 2,132,653 | 0.8 | ||||||
| Total Sources | $259,973,080 | 100.0 | % | Total Uses | $259,973,080 | 100.0 | % | |
The Borrower and the Borrower Sponsors. The borrower is 1201 Tab Owner, LLC, a single-purpose Delaware limited liability company with two independent directors in its organizational structure. The borrower is indirectly owned and controlled 50% by MetLife, Inc. (“MetLife”) and 50% by New York Common Retirement Fund (the borrower sponsors), with MetLife acting as managing partner. Legal counsel to the borrower delivered a non-consolidation opinion in connection with the origination of the 1201 Third Avenue Whole Loan. MetLife’s real estate platform invests in real estate products including commercial mortgages and equities. MetLife has over 200 senior real estate professionals across seven regional offices. New York Common Retirement Fund is one of the largest public pension plans in the United States, with over one million New York and local retirement system members, retirees and beneficiaries. There is no non-recourse carveout guarantor or separate environmental indemnitor with respect to the 1201 Third Avenue Whole Loan.
The Property. The 1201 Third Avenue Property is a Class A, 55-story office property totaling 1,129,710 sq. ft. located in Seattle, Washington. The 1201 Third Avenue Property is the third tallest building in the city, the eighth tallest on the West Coast of the United States, and the 97th-tallest in the United States. Construction began in 1986 and finished in 1988. The 1201 Third Avenue Property was designed by Kohn Pedersen Fox Associates and The McKinley Architects. The building was the world headquarters of the financial company, Washington Mutual, from the building's opening until 2006, when the company moved across the street to the WaMu Center. MetLife Real Estate Investments and Clarion Partners bought the building in 2012 for approximately $548.8 million. The 1201 Third Avenue Property features an on-site amenity package, including a fitness center, yoga room, locker room with showers, bike storage, electric vehicle charging, multiple outdoor seating areas, conference rooms and on-site management. Since 2013, approximately $26.5 million was spent on common area improvements and repair and maintenance at the 1201 Third Avenue Property including main lobby renovations, restroom renovations, atrium renovations, a new tenant bike commuting center, lighting, elevator and escalator upgrades and more. In addition, the 1201 Third Avenue Property is undergoing a $12.0 million renovation targeted towards upgrading the common areas. The building has received two LEED Certifications - Gold and Platinum in 2011 and 2010, as well as earning the Energy Star in 2007, 2010 and 2011. The 1201 Third Avenue Property is 81.1% occupied by 48 tenants as of January 1, 2023.
Major Tenants. Major tenants at the 1201 Third Avenue Property include Perkins Coie, WeWork and Accolade, among others.
Perkins Coie (296,843 sq. ft; 26.3% of NRA, 32.9% of underwritten base rent). With more than 1,200 lawyers in offices across the United States and Asia, Perkins Coie is an international law firm that provides corporate, commercial litigation, intellectual property and regulatory legal advice to a broad range of clients ranging from industry leaders to public and not-for-profit organizations. In 2022, Perkins Coie ranked #42 in a legal industry publication’s rankings of law firms by gross revenue and #29 in the United States. Perkins Coie has been a tenant at the 1201 Third Avenue Property since 1985, has a lease expiration date of December 31, 2026, and has five 5-year renewal options remaining. Perkins Coie may terminate its lease at any time within the last two years of its term with 15 months’ prior notice.
| THE INFORMATION IN THIS STRUCTURAL AND COLLATERAL TERM SHEET IS NOT COMPLETE AND MAY BE AMENDED PRIOR TO THE TIME OF SALE. THIS TERM SHEET IS NOT AN OFFER TO SELL THESE SECURITIES AND IT IS NOT A SOLICITATION OF AN OFFER TO BUY THESE SECURITIES IN ANY JURISDICTION WHERE THE OFFER OR SALE IS NOT PERMITTED. | ||
| 38 | ||
1201 Third Avenue | Collateral Asset Summary – Loan No. 2 1201 Third Avenue | Cut-off Date Balance: Cut-off Date LTV: U/W NCF DSCR: U/W NOI Debt Yield: | $60,000,000 30.5% 2.76x 17.7% |
WeWork (114,679 sq. ft.; 10.2% of NRA, 12.9% of underwritten base rent). Founded in 2010, WeWork provides companies and individual people alike shared access to flexible workspaces across the globe through its membership-based business model. WeWork’s consolidated real estate portfolio in the third quarter of 2022 consisted of 647 locations, which supported approximately 756,000 workstations and 536,000 physical memberships. The location at 1201 Third Avenue is one of eight in Seattle. The tenant remained current on rent with no concessions or delayed payments throughout the COVID-19 pandemic. WeWork has been a tenant at the 1201 Third Avenue Property since 2019, has a lease expiration date of June 30, 2034, and has two 5-year renewal options remaining so long as WeWork is in occupancy of at least three floors. The tenant on the lease is 1201 3rd Avenue Tenant LLC, a subsidiary of WeWork and a parent guaranty has been provided by WeWork Companies Inc. subject to a maximum guarantee amount of $4,375,000 and a $700,000 annual reduction to the maximum guarantee amount commencing in July 2024.
Accolade, Inc. (45,083 sq. ft.; 4.0% of NRA, 5.6% of underwritten base rent). Accolade, Inc. (“Accolade”) provides care delivery, navigation and advocacy services. Since its foundation in 2009, Accolade has provided its services by using a personalized healthcare approach that provides technology-enabled solutions that help people better understand, navigate, and utilize the healthcare system and their workplace benefits. Accolade has six offices across the United States and one office in Prague, Czech Republic. Accolade has been a tenant at the 1201 Third Avenue Property since 2019, has a lease expiration date of March 31, 2030, and has one 7-year renewal option remaining. Accolade may terminate its lease as of October 31, 2027, with notice by July 31, 2026.
The following table presents certain information relating to the tenants (of which, certain tenants may have cotenancy provisions) at the 1201 Third Avenue Property:
| Tenant Summary(1) | |||||||||||
| Tenant | Credit Rating (Moody’s/Fitch/S&P)(2) | Net Rentable Area (Sq. Ft.) | % of Net Rentable Area | U/W Base Rent Per Sq. Ft. | % of Total U/W Base Rent | Lease Expiration | |||||
| Perkins Coie(3) | NR/NR/NR | 296,843 | 26.3% | $49.88 | 32.9% | 12/31/2026 | |||||
| WeWork(4) | NR/CC/NR | 114,679 | 10.2% | $50.50 | 12.9% | 6/30/2034 | |||||
| Kimley-Horn(5)(6) | NR/NR/NR | 46,058 | 4.1% | $49.00 | 5.0% | 12/31/2034 | |||||
| Accolade, Inc.(7) | NR/NR/NR | 45,083 | 4.0% | $56.29 | 5.6% | 3/31/2030 | |||||
| Hargis Engineering(8) | NR/NR/NR | 44,609 | 3.9% | $38.61 | 3.8% | 12/31/2024 | |||||
| Boston Consulting Group(9)(10) | NR/NR/NR | 42,644 | 3.8% | $55.69 | 5.3% | Various | |||||
| Christensen O'Connor(11) | NR/NR/NR | 31,591 | 2.8% | $49.30 | 3.5% | 8/31/2028 | |||||
| JP Morgan(12) | A1/NR/A- | 30,249 | 2.7% | $53.74 | 3.6% | Various | |||||
| P2S Inc.(13)(14) | NR/NR/NR | 23,650 | 2.1% | $54.00 | 2.8% | 1/31/2036 | |||||
| Anchor QEA, LLC | NR/NR/NR | 23,029 | 2.0% | $50.50 | 2.6% | 7/31/2029 | |||||
| Largest Tenants | 698,435 | 61.8% | $50.27 | 78.0% | |||||||
| Remaining Occupied(15) | 218,107 | 19.3% | $45.33 | 22.0% | |||||||
| Total Occupied | 916,542 | 81.1% | $49.10 | 100.0% | |||||||
| Vacant Space | 213,168 | 18.9% | |||||||||
| Total | 1,129,710 | 100.0% | |||||||||
| (1) | Information is based on the underwritten rent roll dated January 1, 2023 inclusive of contractual rent steps through February 1, 2024. |
| (2) | Certain ratings are those of the parent entity, whether or not the parent entity guarantees the lease. |
| (3) | Perkins Coie has five 5-year extension options and may terminate its lease at any time within the last two years of its term with 15 months’ prior notice and the payment of a termination fee. |
| (4) | The tenant on the lease is 1201 3rd Avenue Tenant LLC, a subsidiary of WeWork. WeWork has two 5-year extension options. |
| (5) | Kimley-Horn’s lease is expected to commence on January 1, 2024 and $1,396,142 of free rent has been escrowed at origination. |
| (6) | Kimley-Horn has three 5-year extension options and may terminate its lease as of December 31, 2031, with notice by December 31, 2030, and the payment of a termination fee. |
| (7) | Accolade has one 7-year extension option and may terminate its lease as of October 31, 2027, with notice by July 31, 2026 , and the payment of a termination fee. |
| (8) | Hargis Engineering has two 5-year extension options. |
| (9) | Boston Consulting Group leases 25,239 sq. ft. expiring on December 31, 2026 and 17,405 sq. ft. expiring on January 31, 2027. |
| (10) | Boston Consulting Group has two 5-year extension options. |
| (11) | Christensen O'Connor has two 5-year extension options. |
| (12) | JP Morgan has three 5-year extension options on 7,678 sq. ft. of retail space expiring on December 31, 2023 and one 5-year extension option on 22,571 sq. ft. of office space expiring on January 31, 2030. JP Morgan may terminate its lease as of December 31, 2026 with notice by September 31, 2025, and the payment of a termination fee. |
| (13) | The P2S Inc. lease is expected to commence on June 1, 2023 and $851,400 of free rent has been escrowed at origination. |
| (14) | P2S Inc. has two 5-year extension option. |
| (15) | Certain Remaining Occupied tenants have executed leases but are not yet in occupancy with expected lease commencement dates after the expected closing date of the Benchmark 2023-B38 securitization in April 2023. In total, $3,755,350 of free rent has been escrowed at origination. See “Initial and Ongoing Reserves” herein. |
| THE INFORMATION IN THIS STRUCTURAL AND COLLATERAL TERM SHEET IS NOT COMPLETE AND MAY BE AMENDED PRIOR TO THE TIME OF SALE. THIS TERM SHEET IS NOT AN OFFER TO SELL THESE SECURITIES AND IT IS NOT A SOLICITATION OF AN OFFER TO BUY THESE SECURITIES IN ANY JURISDICTION WHERE THE OFFER OR SALE IS NOT PERMITTED. | ||
| 39 | ||
1201 Third Avenue | Collateral Asset Summary – Loan No. 2 1201 Third Avenue | Cut-off Date Balance: Cut-off Date LTV: U/W NCF DSCR: U/W NOI Debt Yield: | $60,000,000 30.5% 2.76x 17.7% |
| Lease Rollover Schedule(1)(2) | |||||||||||||||
| Year | # of Leases Expiring | Total Expiring Sq. Ft. | % of Total Sq. Ft. Expiring | Cumulative Sq. Ft. Expiring | Cumulative % of Sq. Ft. Expiring | Annual U/W Gross Rent | % U/W Base Rent Rolling | Annual U/W Base Rent per Sq. Ft. | |||||||
| MTM & 2023 | 6 | 27,360 | 2.4% | 27,360 | 2.4% | $1,427,210 | 3.2% | $52.16 | |||||||
| 2024 | 4 | 64,319 | 5.7% | 91,679 | 8.1% | $2,828,492 | 6.3% | $43.98 | |||||||
| 2025 | 7 | 36,594 | 3.2% | 128,273 | 11.4% | $1,784,818 | 4.0% | $48.77 | |||||||
| 2026 | 7 | 349,409 | 30.9% | 477,682 | 42.3% | $17,644,879 | 39.2% | $50.50 | |||||||
| 2027 | 3 | 30,332 | 2.7% | 508,014 | 45.0% | $1,502,573 | 3.3% | $49.54 | |||||||
| 2028 | 6 | 44,695 | 4.0% | 552,709 | 48.9% | $2,321,506 | 5.2% | $51.94 | |||||||
| 2029 | 2 | 25,734 | 2.3% | 578,443 | 51.2% | $1,312,416 | 2.9% | $51.00 | |||||||
| 2030 | 4 | 89,714 | 7.9% | 668,157 | 59.1% | $4,824,897 | 10.7% | $53.78 | |||||||
| 2031 | 0 | 0 | 0.0% | 668,157 | 59.1% | $0 | 0.0% | $0.00 | |||||||
| 2032 | 0 | 0 | 0.0% | 668,157 | 59.1% | $0 | 0.0% | $0.00 | |||||||
| 2033 & Thereafter | 11 | 248,385 | 22.0% | 916,542 | 81.1% | $11,354,402 | 25.2% | $45.71 | |||||||
| Vacant | NAP | 213,168 | 18.9% | 1,129,710 | 100.0% | NAP | NAP | NAP | |||||||
| Total / Wtd. Avg. | 50 | 1,129,710 | 100.0% | $45,001,191 | 100.0% | $49.10 | |||||||||
| (1) | Information is based on the underwritten rent roll dated January 1, 2023 inclusive of contractual rent steps through February 1, 2024. |
| (2) | Certain tenants may have lease termination options that are exercisable prior to the stated expiration date of the subject lease or leases that are not considered in the lease expiration schedule. |
The following table presents historical occupancy percentages at the 1201 Third Avenue Property:
Historical Occupancy(1) | |||||
| 2019(2) | 2020(2) | 2021 (2) | 8/31/2022(2) | 1/1/2023(3) | |
| 95.7% | 94.4% | 87.4% | 80.7% | 81.1% | |
| (1) | As of December 31 of each respective year unless otherwise indicated. |
| (2) | Provided by the borrower sponsors. |
| (3) | Based on the underwritten rent roll dated January 1, 2023. |
Environmental Matters. According to the Phase I environmental site assessment dated December 8, 2022, there was no evidence of any recognized environmental conditions at the 1201 Third Avenue Property.
The Market. The 1201 Third Avenue Property is located in Seattle, Washington, within the Seattle central business district (“CBD”) submarket of the Seattle Metro office market. The 1201 Third Avenue Property is located in the Financial District of Seattle’s CBD. Situated on Elliott Bay, on the eastern shoreline of Puget Sound, the Seattle CBD is the commercial and financial center of western Washington. The Seattle CBD’s largest area by property size is the Financial District. This district, which is generally bordered by Interstate 5, Yesler Way, Western Avenue and Pike Street, is the heart of Seattle’s CBD and is the location of Seattle’s City Hall and Municipal Building; King County’s Administration Building and Superior Court; the Henry M. Jackson Federal Office Building; and the Nakamura Federal Courthouse, home of the 9th U.S. Circuit Court of Appeals. The local area is served by King County Metro bus transit, Link Light Rail, Sounder Commuter Rail, and two streetcar lines (South Lake Union and First Hill). Fortune 500 companies headquartered in the Puget Sound region include Amazon.com, Costco, Microsoft, Starbucks, PACCAR, Nordstrom, Expedia, Weyerhaeuser, Expeditors International, and Alaska Air Group. Other large companies with major operations include Boeing, T-Mobile, Facebook, Google, and Nintendo. According to the appraisal, as of the third quarter of 2022, the vacancy rate in the Seattle Metro office market was approximately 10.5%, with average asking rents of $34.21 per sq. ft. and inventory of approximately 226.4 million sq. ft. According to the appraisal, as of the third quarter of 2022, the vacancy rate in the Seattle CBD submarket was approximately 19.0%, with average asking rents of $39.88 per sq. ft. and inventory of approximately 37.6 million sq. ft. According to the appraisal, the 2022 population within a one-, three- and five-mile radius was 75,990, 242,223 and 491,031, respectively. The 2022 average household income within the same one-, three- and five-mile radius was $147,672, $167,216 and $168,482, respectively.
| THE INFORMATION IN THIS STRUCTURAL AND COLLATERAL TERM SHEET IS NOT COMPLETE AND MAY BE AMENDED PRIOR TO THE TIME OF SALE. THIS TERM SHEET IS NOT AN OFFER TO SELL THESE SECURITIES AND IT IS NOT A SOLICITATION OF AN OFFER TO BUY THESE SECURITIES IN ANY JURISDICTION WHERE THE OFFER OR SALE IS NOT PERMITTED. | ||
| 40 | ||
1201 Third Avenue | Collateral Asset Summary – Loan No. 2 1201 Third Avenue | Cut-off Date Balance: Cut-off Date LTV: U/W NCF DSCR: U/W NOI Debt Yield: | $60,000,000 30.5% 2.76x 17.7% |
The following table presents certain information relating to the appraisal’s market rent conclusion for the 1201 Third Avenue Property:
| Market Rent Summary(1) | ||||
| Market Rent (PSF) | Lease Term (Months) | Lease Type (Reimbursements) | Rent Increase Projection | |
| LO 1-14 Space: | $50.00 | 60 | FSG w/BYS | $1/SF/Yr |
| MO 15-29 Space: | $53.00 | 60 | FSG w/BYS | $1/SF/Yr |
| HO 30-49 Space: | $55.00 | 60 | FSG w/BYS | $1/SF/Yr |
| Retail Space: | $37.00 | 60 | NNN | 3.0% Annual |
| HO 50+ Space: | $65.00 | 60 | FSG w/BYS | $1/SF/Yr |
| (1) | Source: Appraisal. |
The following table presents certain information relating to comparable office properties with respect to the 1201 Third Avenue Property:
| Lease Comparables(1) | |||||||
| Property Name |
Location | Year Built/Renovated | Rentable Area (SF) | Tenant Name | Tenant Size (SF) | Lease Date | Rent PSF |
| 1201 Third Avenue(2) | Seattle, WA | 1988/NAP | 1,129,710 | Perkins Coie | 296,843 | Jan. 2012 | $49.88 |
| Two Union Square | Seattle, WA | 1989/NAP | 1,164,046 | Indena USA Copperpoint Insurance | 812 7,568 | May 2022 Feb. 2022 | $51.00 $59.50 |
| One Convention Place | Seattle, WA | 2000/NAP | 311,052 | Brewe Layman | 1,697 | June 2022 | $53.00 |
| Columbia Center | Seattle, WA | 1985/NAP | 1,526,621 | Chicago Title Company Edge Delta Inc | 24,081 11,427 | June 2022 May 2022 | $50.00 $54.00 |
| 901 5th Avenue | Seattle, WA | 1973/2017 | 541,190 | Cambridge Mobile | 2,824 | May 2022 | $59.00 |
| U.S. Bank Centre | Seattle, WA | 1989/2023 | 943,575 | Heritage Bank | 10,540 | April 2022 | $48.00 |
| 400 University at Rainier | Seattle, WA | 2021/NAP | 121,618 | Industrious | 34,559 | June 2022 | $50.00 |
| Russell Investments | Seattle, WA | 2006/NAP | 900,000 | Zillow | 114,543 | Oct. 2021 | $52.00 |
| (1) | Source: Appraisal. |
| (2) | Information obtained from the underwritten rent roll other than year built/renovated and lease type. |
Cash Flow Analysis.
| Cash Flow Analysis(1) | ||||||
| 2019 | 2020 | 2021 | 2022 | U/W | U/W PSF | |
| Base Rent(1) | $42,360,410 | $48,375,162 | $46,567,269 | $44,698,404 | $43,817,168 | $38.79 |
| Rent Steps(1) | 0 | 0 | 0 | 0 | 1,184,024 | 1.05 |
| Free Rent | 0 | 0 | 0 | (253,395) | 0 | 0.00 |
| Straight Line Rent(2) | 0 | 0 | 0 | 0 | 92,088 | 0.08 |
| Gross Potential Rent | $42,360,410 | $48,375,162 | $46,567,269 | $44,445,009 | $45,093,280 | $39.92 |
| Other Income(3) | 4,616,529 | 3,462,362 | 1,895,109 | 2,865,093 | 2,472,899 | 2.19 |
| Expense Reimbursements | 2,501,140 | 3,336,098 | 4,404,048 | 4,486,110 | 3,783,328 | 3.35 |
| Net Rental Income | $49,478,079 | $55,173,622 | $52,866,426 | $51,796,212 | $51,349,507 | $45.45 |
| (Vacancy & Credit Loss) | 0 | 0 | 0 | 0 | 0 | 0.00 |
| Effective Gross Income | $49,478,079 | $55,173,622 | $52,866,426 | $51,796,212 | $51,349,507 | $45.45 |
| Real Estate Taxes | 5,645,797 | 6,456,028 | 6,777,567 | 6,252,373 | 6,484,839 | 5.74 |
| Insurance | 969,083 | 1,398,611 | 1,502,386 | 1,442,334 | 1,310,976 | 1.16 |
| Management Fee | 779,031 | 870,596 | 889,437 | 862,320 | 1,000,000 | 0.89 |
| Other Operating Expenses | 10,016,880 | 9,953,745 | 10,647,657 | 11,844,731 | 12,488,183 | 11.05 |
| Total Operating Expenses | $17,410,791 | $18,678,980 | $19,817,047 | $20,401,758 | $21,283,998 | $18.84 |
| Net Operating Income | $32,067,288 | $36,494,642 | $33,049,379 | $31,394,453 | $30,065,509 | $26.61 |
| Replacement Reserves | 0 | 0 | 0 | 0 | 225,942 | 0.20 |
| TI/LC | 0 | 0 | 0 | 0 | 3,282,704 | 2.91 |
| Net Cash Flow | $32,067,288 | $36,494,642 | $33,049,379 | $31,394,453 | $26,556,863 | $23.51 |
| (1) | Underwritten Base Rent is based on the underwritten rent roll dated January 1, 2023 inclusive of contractual rent steps through February 1, 2024. |
| (2) | Includes rent steps for JP Morgan, JP Morgan Chase Bank, Raymond James & Associates Inc, MUFG Union Bank, BNY Mellon Wealth Management, Mitsui & Co and Taiwan Cooperative Bank LTD. |
| (3) | Other Income mostly consists of garage and parking revenue. |
Property Management. The 1201 Third Avenue Property is managed by Wright Runstad Associates Limited Partnership, a third-party property manager.
Lockbox / Cash Management. The 1201 Third Avenue Whole Loan is structured with a hard lockbox and springing cash management. The 1201 Third Avenue Whole Loan requires that the borrower deliver tenant direction letters directing tenants to pay all rents into the lockbox account, and if the borrower or any of its affiliates receives rents from the 1201 Third Avenue Property despite such direction, deposit such rents into the lockbox account within three business days of receipt. If no Cash Management Sweep Period (as defined
| THE INFORMATION IN THIS STRUCTURAL AND COLLATERAL TERM SHEET IS NOT COMPLETE AND MAY BE AMENDED PRIOR TO THE TIME OF SALE. THIS TERM SHEET IS NOT AN OFFER TO SELL THESE SECURITIES AND IT IS NOT A SOLICITATION OF AN OFFER TO BUY THESE SECURITIES IN ANY JURISDICTION WHERE THE OFFER OR SALE IS NOT PERMITTED. | ||
| 41 | ||
1201 Third Avenue | Collateral Asset Summary – Loan No. 2 1201 Third Avenue | Cut-off Date Balance: Cut-off Date LTV: U/W NCF DSCR: U/W NOI Debt Yield: | $60,000,000 30.5% 2.76x 17.7% |
below) exists, all funds in the lockbox account are required to be swept on each business day into the borrower’s operating account. Upon the occurrence of a Cash Management Sweep Period, the borrower is required to establish a lender-controlled cash management account, and during the continuance of a Cash Management Sweep Period, all funds in the lockbox account are required to be swept on each business day to the cash management account. During the continuance of a Cash Management Sweep Period, all excess cash flow funds remaining in the cash management account after the application of all funds on deposit in the cash management account after payment of debt service, required reserves, and budgeted operating expenses are required to be deposited, during a Cash Management Sweep Period caused by a Perkins Coie Event (as defined below), into the Perkins Coie Reserve (as described below), subject to a cap of $90 per sq. ft. of vacated space (the “Perkins Coie TI Cap”), and any funds then remaining will be required to be deposited into an excess cash flow reserve to be held as additional collateral for the 1201 Third Avenue Whole Loan. To the extent that no Cash Management Sweep Period is continuing, all funds in the excess cash flow reserve are required to be applied to any shortfalls in the Perkins Coie Reserve and the TI/LC Reserve, and then to be disbursed to the borrower.
A “Cash Management Sweep Period” will commence upon the earliest of the following: (i) the occurrence and continuance of an event of default, (ii) as of the origination date, or the last day of any calendar quarter following the origination date, the debt yield on the 1201 Third Avenue Whole Loan is less than 10.00%, (iii) as of the origination date, or the last day of any calendar quarter following the origination date, the debt service coverage ratio on the 1201 Third Avenue Whole Loan is less than 1.25x and (iv) the occurrence of a Perkins Coie Event. For purposes of determining whether a Cash Management Sweep Period has occurred under clauses (ii) and (iii) above, Perkins Coie rent will be included in net operating income used to calculate the debt yield or debt service coverage ratio, as applicable, if Perkins Coie has renewed its lease.
A Cash Management Sweep Period will end upon the occurrence of the following: (w) with regard to clause (i) above, the cure of such event of default; (x) with regard to clause (ii) above, when the debt yield on the 1201 Third Avenue Whole Loan is at least 10.00% for one calendar quarter; (y) with regard to clause (iii) above, when the debt service coverage ratio of the 1201 Third Avenue Whole Loan is at least 1.25x for at least one quarter; and (z) with regard to clause (iv) above, when a Perkins Coie Cash Management Sweep Cure (as defined below) occurs.
“Perkins Coie Event” means the earlier to occur of (a) Perkins Coie giving written notice of its intention to terminate its lease; and (b) September 30, 2025; provided, however, a Perkins Coie Event will not be deemed to have occurred if on or before the earlier of clauses (a) and (b): (i) Perkins Coie has renewed or extended its lease for at least 75% of the leased space for a term of not less than five years immediately following the Perkins Coie lease expiration date of December 31, 2026, or (ii) (A) Perkins Coie has renewed or extended its lease for at least 60% of the demised premises for a term of not less than five years immediately following such lease expiration date and (B) the debt yield of the 1201 Third Avenue Whole Loan after giving effect to such extension or renewal is at least 13.00%.
“Perkins Coie Cash Management Sweep Cure” means with respect to a Perkins Coie Event either (A) no less than an amount equal to the Perkins Coie TI Cap has been reserved in the Perkins Coie Reserve or (B) the debt yield (including, to the extent applicable, after giving effect to an extension or renewal of the Perkins Coie lease and the rent payable thereunder), is at least 13%; provided, however, for the purposes of this clause (B) the lender must test debt yield upon receipt of satisfactory evidence of Perkins Coie’s extension or renewal of its lease.
The borrower has the right to avoid or terminate a Cash Management Sweep Period caused by a decline in debt yield or debt service coverage ratio by delivering to the lender either (i) cash or (ii) a letter of credit, in each case, in an amount that, if applied to the reduction of the principal amount of the 1201 Third Avenue Whole Loan, would cause the debt yield of the 1201 Third Avenue Whole Loan to be equal to or greater than 10.00% or cause the debt service coverage ratio of the 1201 Third Avenue Whole Loan to be equal to or greater than 1.25x, as applicable. Such cash or letter of credit is required to be bifurcated into (i) after a Perkins Coie Event an amount equal to the rent payable under the Perkins Coie lease, not to exceed the Perkins Coie TI Cap, and (ii) the remaining portion of such cash or letter of credit after deducting the amount in clause (i). The amount in clause (ii) is required to be released to the borrower if the debt yield of the 1201 Third Avenue Whole Loan is equal to or greater than 10.00% or the debt service coverage ratio of the 1201 Third Avenue Whole Loan is equal to or greater than 1.25x, as applicable, for one calendar quarter (without giving effect to any cash or letter of credit). The amount in clause (i) is required to be deposited in the Perkins Coie TI/LC Reserve and released only in accordance with the provisions applicable to such reserve.
Initial and Ongoing Reserves. At loan origination, the borrower deposited (i) $17,567,429 into a TI/LC reserve and (ii) $3,755,350 into a free rent reserve.
Tax Reserve - During the continuance of a Cash Management Sweep Period, the borrower is required to make ongoing monthly deposits into a reserve for real estate taxes in an amount equal to 1/12 of the real estate taxes that the lender estimates will be payable during the next twelve months for the 1201 Third Avenue Property.
Insurance Reserve - During the continuance of a Cash Management Sweep Period, the borrower is required to make ongoing monthly deposits into a reserve for insurance premiums in an amount equal to 1/12 of the insurance premiums that the lender estimates will be payable for the renewal of coverage upon the expiration of the insurance policies. Notwithstanding the foregoing, the borrower is not required to reserve for insurance premiums, provided that no event of default is continuing under the 1201 Third Avenue Whole Loan, and the borrower provides the lender with satisfactory evidence that the insurance coverage for the 1201 Third Avenue Property is
| THE INFORMATION IN THIS STRUCTURAL AND COLLATERAL TERM SHEET IS NOT COMPLETE AND MAY BE AMENDED PRIOR TO THE TIME OF SALE. THIS TERM SHEET IS NOT AN OFFER TO SELL THESE SECURITIES AND IT IS NOT A SOLICITATION OF AN OFFER TO BUY THESE SECURITIES IN ANY JURISDICTION WHERE THE OFFER OR SALE IS NOT PERMITTED. | ||
| 42 | ||
1201 Third Avenue | Collateral Asset Summary – Loan No. 2 1201 Third Avenue | Cut-off Date Balance: Cut-off Date LTV: U/W NCF DSCR: U/W NOI Debt Yield: | $60,000,000 30.5% 2.76x 17.7% |
included in blanket policies approved by the lender, and the insurance premiums have been prepaid for not less than one year in advance (or for the period of coverage for which insurance certificates were delivered at origination, if less than one year).
Perkins Coie Reserve – During a Perkins Coie Event, (i) excess cash flow funds are required to be deposited into a reserve for tenant improvements and leasing commissions in connection with vacated Perkins Coie space as described above under “Lockbox / Cash Management” and (ii) the borrower must also deposit into such reserve any compensation it receives from Perkins Coie relating to the termination of the Perkins Coie lease.
Perkins Coie Prepaid Rent Reserve – If Perkins Coie elects to exercise its rights under its lease to prepay rent, the borrower is required to deposit such prepaid rent into a reserve and, on each monthly payment date for which rent has been prepaid, apply the related prepaid rent for such month, either (i) if a Cash Management Sweep Period exists, to be deposited into the cash management account, or (ii) otherwise, to be returned to the borrower.
Current Mezzanine or Subordinate Indebtedness. None.
Future Mezzanine or Subordinate Indebtedness Permitted. None.
Partial Release. None.
Letter of Credit. None. However, the borrower has the right to provide a letter of credit to avoid or terminate a Cash Management Sweep Period caused by a decline in debt yield or debt service coverage ratio as described above under “Lockbox / Cash Management.”
| THE INFORMATION IN THIS STRUCTURAL AND COLLATERAL TERM SHEET IS NOT COMPLETE AND MAY BE AMENDED PRIOR TO THE TIME OF SALE. THIS TERM SHEET IS NOT AN OFFER TO SELL THESE SECURITIES AND IT IS NOT A SOLICITATION OF AN OFFER TO BUY THESE SECURITIES IN ANY JURISDICTION WHERE THE OFFER OR SALE IS NOT PERMITTED. | ||
| 43 | ||
250 Water Street | Collateral Asset Summary – Loan No. 3 CX - 250 Water Street | Cut-off Date Balance: Cut-off Date LTV: U/W NCF DSCR: U/W NOI Debt Yield: | $53,150,000 48.8% 1.66x 9.3% |
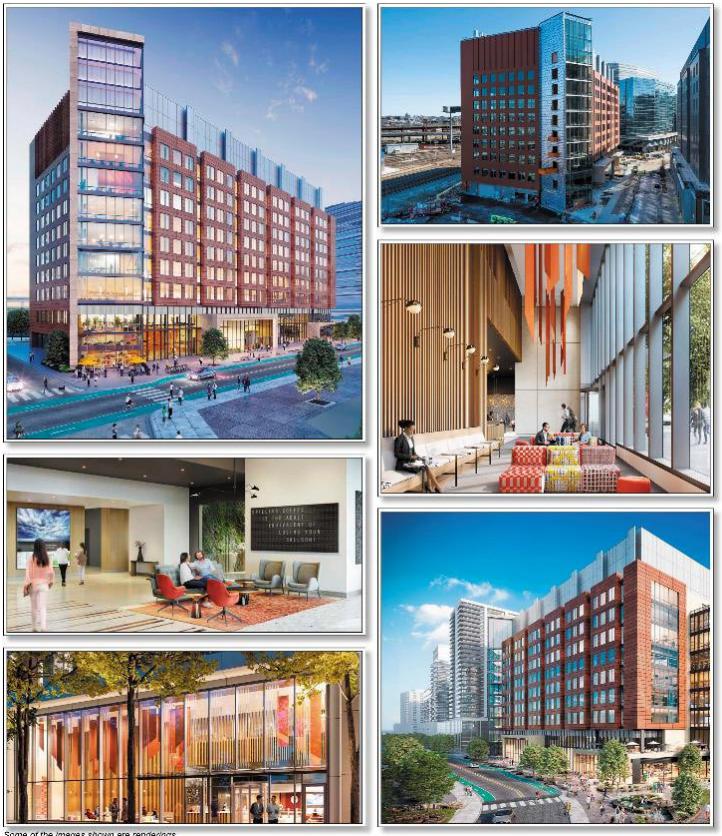
| THE INFORMATION IN THIS STRUCTURAL AND COLLATERAL TERM SHEET IS NOT COMPLETE AND MAY BE AMENDED PRIOR TO THE TIME OF SALE. THIS TERM SHEET IS NOT AN OFFER TO SELL THESE SECURITIES AND IT IS NOT A SOLICITATION OF AN OFFER TO BUY THESE SECURITIES IN ANY JURISDICTION WHERE THE OFFER OR SALE IS NOT PERMITTED. | ||
| 44 | ||
250 Water Street | Collateral Asset Summary – Loan No. 3 CX - 250 Water Street | Cut-off Date Balance: Cut-off Date LTV: U/W NCF DSCR: U/W NOI Debt Yield: | $53,150,000 48.8% 1.66x 9.3% |
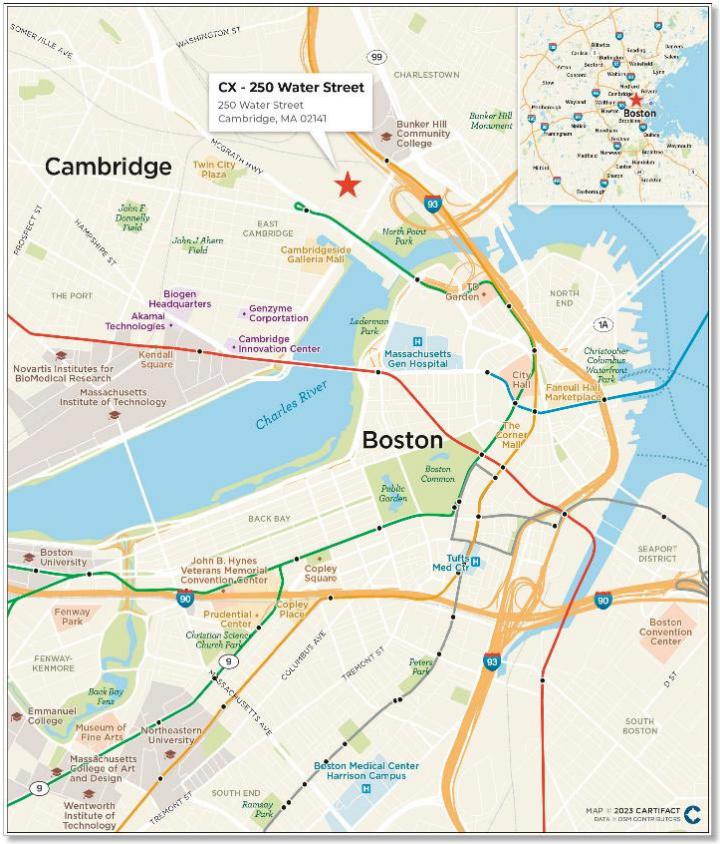
| THE INFORMATION IN THIS STRUCTURAL AND COLLATERAL TERM SHEET IS NOT COMPLETE AND MAY BE AMENDED PRIOR TO THE TIME OF SALE. THIS TERM SHEET IS NOT AN OFFER TO SELL THESE SECURITIES AND IT IS NOT A SOLICITATION OF AN OFFER TO BUY THESE SECURITIES IN ANY JURISDICTION WHERE THE OFFER OR SALE IS NOT PERMITTED. | ||
| 45 | ||
250 Water Street | Collateral Asset Summary – Loan No. 3 CX - 250 Water Street | Cut-off Date Balance: Cut-off Date LTV: U/W NCF DSCR: U/W NOI Debt Yield: | $53,150,000 48.8% 1.66x 9.3% |
| Mortgage Loan Information | |
| Loan Seller: | GSMC |
| Loan Purpose: | Refinance |
Credit Assessment (Fitch/KBRA/Moody’s)(9): | BBB(sf) / BBB(sf) / Baa2(sf) |
| Borrower Sponsors: | Divco West Real Estate Services, LLC, California State Teachers' Retirement System and Teacher Retirement System of Texas |
| Borrower(1): | DW PropCo EF, LLC |
| Original Balance(2): | $53,150,000 |
| Cut-off Date Balance(2): | $53,150,000 |
| % by Initial UPB: | 8.1% |
| Interest Rate(3): | 5.50950% |
| Payment Date: | 10th of each month |
| First Payment Date: | March 10, 2023 |
| Anticipated Repayment Date(3): | February 10, 2033 |
| Final Maturity Date(3): | February 10, 2038 |
| Amortization: | Interest Only - ARD |
| Additional Debt(2): | $478,350,000 Pari Passu Debt |
| Call Protection(3)(4): | L(24),YM1(2),DorYM1(87),O(7) |
| Lockbox / Cash Management: | Hard / Springing |
| Reserves(5) | |||
| Initial | Monthly. | Cap | |
| Taxes: | $0 | Springing | NAP |
| Insurance: | $0 | Springing | NAP |
| Replacement: | $0 | $0 | NAP |
| TI/LC: | $0 | Springing | NAP |
| Other(6): | $17,593,844 | $0 | NAP |
| Property Information | |
| Single Asset / Portfolio: | Single Asset |
| Property Type: | Lab/Office – Mixed Use |
| Collateral: | Fee |
| Location: | Cambridge, MA |
| Year Built / Renovated: | 2022 / NAP |
| Total Sq. Ft.: | 479,004 |
| Property Management: | Divco West Real Estate Services, Inc. |
| Underwritten NOI: | $49,283,802 |
| Underwritten NCF: | $49,164,051 |
| Appraised Value(7): | $1,090,000,000 |
| Appraisal Date(7): | January 1, 2023 |
| Historical NOI | |
| Most Recent NOI(8): | NAV |
| 2021 NOI(8): | NAV |
| 2020 NOI(8): | NAV |
| 2019 NOI(8): | NAV |
| Historical Occupancy | |
| Most Recent Occupancy: | 98.7% (March 10, 2023) |
| 2021 Occupancy(8): | NAV |
| 2020 Occupancy(8): | NAV |
| 2019 Occupancy(8): | NAV |
| Financial Information(2) | ||||||
| Tranche | Cut-off Date Balance | Balance per Sq. Ft. Cut-off / Balloon(3) | LTV Cut-off / Balloon(3) | U/W DSCR NOI / NCF | U/W Debt Yield NOI / NCF | U/W Debt Yield at Balloon NOI / NCF(3) |
| Mortgage Loan | $53,150,000 | |||||
| Pari Passu Notes | 478,350,000 | |||||
| Whole Loan | $531,500,000 | $1,110 / $1,110 | 48.8% / 48.8%(7) | 1.66x / 1.66x | 9.3% / 9.3% | 9.3% / 9.3% |
| (1) | There is no non-recourse carveout guarantor or environmental indemnitor for the CX - 250 Water Street Whole Loan (as defined below) separate from the borrower. |
| (2) | The CX - 250 Water Street Mortgage Loan (as defined below) is part of the CX - 250 Water Street Whole Loan (as defined below) which is evidenced by 20 pari passu promissory notes with an aggregate original principal balance of $531,500,000. The Financial Information presented above is based on the CX - 250 Water Street Whole Loan. See “—The Loan” below. |
| (3) | The CX - 250 Water Street Whole Loan is structured with an Anticipated Repayment Date (the “ARD”) of February 10, 2033 and a Final Maturity Date of February 10, 2038. The initial interest rate for the CX - 250 Water Street Whole Loan is 5.50950% per annum. On and after the ARD, the interest rate will increase to the greater of (i) 7.50950%, and (ii) the sum of the swap rate in effect on the ARD plus 4.2800%. The metrics presented above are calculated based on the ARD. |
| (4) | The CX - 250 Water Street Whole Loan may be voluntarily prepaid in whole beginning on the payment date in March 2025 with the payment of the greater of (i) a yield maintenance premium or (ii) 1% of the principal balance if such prepayment occurs prior to the payment date in August 2032. In addition, the CX – 250 Water Street Whole Loan may be defeased in whole at any time after the earlier to occur of (i) January 27, 2026 or (ii) the date that is two years from the closing date of the securitization that includes the last pari passu note to be securitized. The assumed defeasance lockout period of 26 payments is based on the expected closing date of this transaction in April 2023. The actual defeasance lockout period may be longer. |
| (5) | See “Initial and Ongoing Reserves” section below for further discussion of reserve requirements. |
| (6) | Other Reserves represents an Outstanding TI/LC Reserve ($7,160,274.31), Base Building Work Reserve ($5,932,952) and Outstanding Linkage Fees Reserve ($4,500,617.42). |
| (7) | Appraised Value represents the Prospective Market Value Upon Completion & Stabilization, which assumes that, as of January 1, 2023, remaining construction balances are paid, outstanding tenant improvements are paid to the tenant, the tenant has commenced rent payments, and retail space leasing costs are paid, all of which have occurred other than payment of $5,932,952 for base building work, $7,160,274 for tenant improvements and future retail leasing costs. Such amounts for base building work and tenant improvements were fully reserved by the lender at loan origination. The appraisal concluded to an “as-is” appraised value of $960,000,000 as of May 4, 2022. The “as-is” appraised value results in a Cut-off Date LTV Ratio and Maturity Date LTV Ratio of 55.4% for the CX - 250 Water Street Whole Loan. The appraisal concluded to an “as dark” appraised value of $920,000,000 as of May 4, 2022. The “as dark” appraised value results in a Cut-off Date LTV Ratio and Maturity Date LTV Ratio of 57.8% for the CX - 250 Water Street Whole Loan. |
| (8) | Historical financial information and occupancy are not applicable because the CX - 250 Water Street Property (as defined below) was built in 2022. |
| (9) | Fitch, KBRA and Moody’s provided the listed assessments for the CX - 250 Water Street Mortgage Loan in the context of its inclusion in the mortgage pool. |
The Loan. The mortgage loan (the “CX - 250 Water Street Mortgage Loan”) is part of a whole loan (the “CX - 250 Water Street Whole Loan”) that is evidenced by 20 pari passu promissory notes in the aggregate original principal amount of $531,500,000 and secured by a first priority fee mortgage encumbering an approximately 479,004 net rentable sq. ft. office and life sciences laboratory property, with ground floor retail space, with an address in Cambridge, Massachusetts (the “CX - 250 Water Street Property”). The CX - 250 Water Street Whole Loan was co-originated by Bank of America, N.A. (“BANA”), Wells Fargo Bank, National Association, Goldman Sachs Bank USA (“GS”) and 3650 Real Estate Investment Trust 2 LLC (“3650 REIT”) on January 27, 2023. The CX - 250 Water Street Mortgage Loan, with an aggregate original principal amount of $53,150,000, is evidenced by the non-controlling Notes A-17 and A-18, held by GS.
The CX - 250 Water Street Whole Loan has a 10-year interest-only term through the ARD of February 10, 2033 and a final maturity date of February 10, 2038. On and after the ARD, the interest rate will increase to the greater of (i) 7.50950%, and (ii) the sum of the swap rate in effect on the ARD plus 4.28000%, (“Adjusted Interest Rate”), however, interest accrued at the excess of the Adjusted Interest Rate over the initial interest rate will be deferred as described below under “Lockbox / Cash Management.” From the origination date through the ARD, the CX - 250 Water Street Whole Loan accrues interest at the rate of 5.5095% per annum.
| THE INFORMATION IN THIS STRUCTURAL AND COLLATERAL TERM SHEET IS NOT COMPLETE AND MAY BE AMENDED PRIOR TO THE TIME OF SALE. THIS TERM SHEET IS NOT AN OFFER TO SELL THESE SECURITIES AND IT IS NOT A SOLICITATION OF AN OFFER TO BUY THESE SECURITIES IN ANY JURISDICTION WHERE THE OFFER OR SALE IS NOT PERMITTED. | ||
| 46 | ||
250 Water Street | Collateral Asset Summary – Loan No. 3 CX - 250 Water Street | Cut-off Date Balance: Cut-off Date LTV: U/W NCF DSCR: U/W NOI Debt Yield: | $53,150,000 48.8% 1.66x 9.3% |
The promissory notes comprising the CX - 250 Water Street Whole Loan are summarized in the below table. The relationship among the holders of the CX – 250 Water Street Whole Loan is governed by a co-lender agreement. The CX - 250 Water Street Whole Loan is being serviced under the pooling and servicing agreement for the BANK 2023-BNK45 trust until the controlling Note A-1 is securitized, whereupon the CX - 250 Water Street Whole Loan will be serviced pursuant to the pooling and servicing agreement for such future securitization. See “Description of the Mortgage Pool—The Whole Loans——The Non-Serviced Pari Passu Whole Loans” and “Pooling and Servicing Agreement—Servicing of the Non-Serviced Mortgage Loans” in the Preliminary Prospectus.
Whole Loan Summary | ||||
| Note | Original Balance | Cut-off Date Balance | Note Holder(s) | Controlling Piece |
| A-1(1) | $56,250,000 | $56,250,000 | BANA | Yes |
| A-2, A-3, A-5, A-6, A-7, A-8(1) | 175,125,000 | 175,125,000 | BANA | No |
| A-4, A-12 | 55,000,000 | 55,000,000 | BANK 2023-BNK45 | No |
| A-9, A-10, A-11, A-13, A-14, A-15, A-16(1) | 138,825,000 | 138,825,000 | WFB | No |
| A-17, A-18 | 53,150,000 | 53,150,000 | Benchmark 2023-B38 | No |
| A-19, A-20 | 53,150,000 | 53,150,000 | 3650 REIT or an affiliate | No |
| Whole Loan | $531,500,000 | $531,500,000 | ||
| (1) | Expected to be contributed to one or more future securitization trusts. |
The proceeds of the CX - 250 Water Street Whole Loan along with borrower sponsor equity were primarily used to refinance the CX - 250 Water Street Property, pay origination costs and fund upfront reserves.
| Sources and Uses | ||||||||
| Sources | Proceeds | % of Total | Uses | Proceeds | % of Total | |||
| Whole Loan | $531,500,000 | 98.6 | % | Loan Payoff | $473,876,626 | 87.9 | % | |
| Principal Contribution | 7,497,903 | 1.4 | Closing Costs(1) | 47,527,433 | 8.8 | |||
| Reserves | 17,593,844 | 3.3 | ||||||
| Total Sources | $538,997,903 | 100.0 | % | Total Uses | $538,997,903 | 100.0 | % | |
| (1) | Closing Costs include outstanding tenant improvements paid directly to E.R. Squibb & Sons LLC by the borrower sponsors at loan origination. |
The Borrower and the Borrower Sponsors. The borrower is DW PropCo EF, LLC, a Delaware limited liability company and single purpose entity with two independent directors. Legal counsel to the borrower delivered a non-consolidation opinion in connection with the origination of the 250 Water Street Whole Loan. There is no non-recourse carveout guarantor or environmental indemnitor for the CX - 250 Water Street Whole Loan. The borrower sponsors are a joint venture between Divco West Real Estate Services, LLC (“Divco”), California State Teachers’ Retirement System (“CalSTRS”) and Teacher Retirement System of Texas (“TRS”).
Founded in 1993, Divco is a multidisciplinary investment firm headquartered in San Francisco, California, with over 190 employees across seven investment offices. Divco is a developer, owner and operator of real estate throughout the United States, with expertise in Boston, having invested in and managed over 22 commercial properties in the area, including offices in the Seaport, Financial District, and East Cambridge submarkets. Most notably, Divco owned and operated One Kendall Square, a life sciences office campus in the Kendall Square submarket. As of September 30, 2022, Divco reported it had over $17.3 billion in assets under management. Since inception, Divco has acquired approximately 59.7 million sq. ft.
CalSTRS is reported to be the nation’s second largest public pension fund, with reported assets totaling approximately $306 billion as of February 28, 2023. CalSTRS’ investment portfolio is diversified into nine asset categories, including nearly 16.89% (approximately $51.7 billion as of February 28, 2023) allocated to real estate investments in institutional Class A commercial assets across the United States.
Established in 1937, TRS provides retirement and related benefits for those employed by the public schools, colleges and universities supported by the State of Texas. As of August 31, 2022, the agency was serving approximately 1.9 million participants and reported it had assets under management of nearly $184 billion. TRS is the largest public retirement system in Texas in both membership and assets.
The Property. The CX - 250 Water Street Property consists of a Class A, office and life sciences laboratory building with ground floor retail space, with an address in Cambridge, Massachusetts that was recently developed by the borrower sponsors. The CX - 250 Water Street Property is a part of Cambridge Crossing, a 43-acre, mixed-use, master-planned area located primarily in East Cambridge, with portions in Boston and Somerville, which is being developed by Divco. Divco broke ground at Cambridge Crossing in 2017 and upon completion, Cambridge Crossing is expected to include over seventeen buildings, over 2.1 million sq. ft. of science and technology space, 2.4 million sq. ft. of residential space, 100,000 sq. ft. of dining and retail space and approximately 11 acres of green and open space. Over 2.1 million sq. ft. of space has already started construction or been completed and major tenants include Philips, Sanofi and Bristol Myers Squibb. Cambridge Crossing is at the intersection of Cambridge, Somerville and Boston, and is accessible to all parts of the greater Boston area via two MBTA stations (Green and Orange lines), nearby commuter and Amtrak trains, an on-site shuttle, and dedicated bike lanes throughout. Cambridge Crossing is approximately 3.5 miles from Boston Logan International Airport.
The approximately 479,004 net rentable sq. ft. CX – 250 Water Street Property was designed by Jacobs and Ennead and completed construction in 2022. The CX - 250 Water Street Property is a 9-story building with post-COVID design features and includes laboratory
| THE INFORMATION IN THIS STRUCTURAL AND COLLATERAL TERM SHEET IS NOT COMPLETE AND MAY BE AMENDED PRIOR TO THE TIME OF SALE. THIS TERM SHEET IS NOT AN OFFER TO SELL THESE SECURITIES AND IT IS NOT A SOLICITATION OF AN OFFER TO BUY THESE SECURITIES IN ANY JURISDICTION WHERE THE OFFER OR SALE IS NOT PERMITTED. | ||
| 47 | ||
250 Water Street | Collateral Asset Summary – Loan No. 3 CX - 250 Water Street | Cut-off Date Balance: Cut-off Date LTV: U/W NCF DSCR: U/W NOI Debt Yield: | $53,150,000 48.8% 1.66x 9.3% |
space (approx. 60.0% NRA), office space (approx. 40.0% NRA), ground floor retail (6,424 sq. ft.), two penthouse mechanical levels, three below-grade parking levels with 355 parking spaces, and bike storage. The CX - 250 Water Street Property has 15’ - 20’ ceiling heights and six passenger elevators. Adjacent to the building is open green space with a playing field, a fitness center and a plaza to host food trucks. The CX - 250 Water Street Property is 98.7% leased to E.R. Squibb & Sons LLC (which is directly or indirectly wholly owned by Bristol Myers Squibb (“BMY”)).
Sole Tenant. E.R. Squibb & Sons LLC (472,580 sq. ft., 98.7% of NRA, 100.0% of underwritten base rent). E.R. Squibb & Sons LLC is directly or indirectly wholly owned by BMY (rated A+/A2 by S&P/ Moody’s), which is the guarantor under the E.R. Squibb & Sons LLC leases. Founded in 1887, BMY is a global biopharmaceutical company headquartered in New York, New York. BMY focuses on oncology, hematology, immunology, and cardiovascular disease among other fields. BMY has had several drugs successfully receive approval, with notable recent releases and current pipeline drugs including Abecma (approved: multiple myeloma), Zeposia (approved: multiple sclerosis) and Breyanzi (approved: lymphoma). BMY (NYSE: BMY) is publicly traded and reported revenues of $46.2 billion and net earnings of $6.3 billion in 2022. As of March 21, 2023, BMY had a market capitalization of approximately $141.69 billion.
The CX - 250 Water Street Property is expected to serve as BMY’s research and early development center, where it is expected to consolidate approximately 550 employees from multiple locations in the Boston area. BMY was entitled to receive an approximately $106.3 million ($225 per sq. ft.) tenant improvement allowance, of which approximately $7.2 million remained outstanding as of the loan origination date and was fully reserved by the lender. In addition to such tenant improvement allowance, BMY reportedly is investing an additional $169.0 million ($358 per sq. ft.) toward the buildout of its space. The tenant is currently completing its work and is anticipated to take occupancy in the third quarter of 2023. We cannot assure you the tenant will complete its work and take occupancy as expected or at all.
E.R. Squibb & Sons LLC leases all of the laboratory and office space at the CX – 250 Water Street Property through October 31, 2037, with two ten-year renewal options (subject to the right to renew on less than the entire premises as long as tenant retains at least 50% of the laboratory and office space in the building), and with a termination option for the 9th floor office space. E.R. Squibb & Sons LLC’s original lease was for 358,812 sq. ft. (floors 1-7 together with certain ancillary spaces) before expanding to lease the remaining 113,768 sq. ft. on floors 8-9 together with associated ancillary spaces. The rent commencement dates of the BMY lease at the CX - 250 Water Street Property were July 1, 2022 (for floor 9) and November 1, 2022 (for all other floors). The blended starting base rent for the E.R. Squibb & Sons LLC leases is $90.48 per sq. ft. (NNN). Base rent for floors 1-8 is $88.50 per sq. ft. and base rent for floor 9 is $105.00 per sq. ft., with both leases including approximately 2.5% and 2.75% annual rent steps, respectively. E.R. Squibb & Sons LLC did not receive any free rent as part of its lease. E.R. Squibb & Sons LLC is expected to take occupancy in the third quarter of 2023. There is no assurance that the tenant will take occupancy as expected, or at all.
E.R. Squibb & Sons LLC has a termination option for its 9th floor space which, if exercised, would be effective October 31, 2032, upon 18-30 months’ notice and payment of a termination fee equal to the borrower’s transaction costs amortized at 8% over the 60 months in the remainder of the term. E.R. Squibb & Sons LLC has subleased a portion of the floor 9 space (approximately 45,500 sq. ft., 9.6% of E.R. Squibb & Sons LLC’s leased NRA or 9.5% of the total building NRA) to Eterna Therapeutics Inc. (NASDAQ: ERNA) for a ten-year term at a sublease rent of $120 per sq. ft. with 3.0% annual increases. Eterna Therapeutics Inc. received a tenant improvement allowance of $190 per sq. ft. from E.R. Squibb & Sons LLC to build out its space. Eterna Therapeutics Inc. has the right to extend the sublease term through September 1, 3027, and E.R Squibb & Sons LLC has a right to take back the space through a termination option in year 7 of the sublease term.
The following table presents certain information relating to the tenancy at the CX - 250 Water Street Property:
| Tenant Summary(1) | ||||||||||
| Tenant | Credit Rating (Moody’s/Fitch/S&P) (2) | Net Rentable Area (Sq. Ft.) | % of Net Rentable Area | U/W Base Rent Per Sq. Ft.(4) | % of Total U/W Base Rent | Lease Expiration | ||||
| E.R. Squibb & Sons LLC | A2 / NR / A+ | 415,900 | 86.8 | % | $88.50 | 86.1% | 10/31/2037 | |||
| E.R. Squibb & Sons LLC(3) | A2 / NR / A+ | 56,680 | 11.8 | % | $105.00 | 13.9% | 10/31/2037 | |||
| Total Occupied | 472,580 | 98.7 | % | $90.48 | 100.0% | |||||
| Vacant (Ground Floor Retail) | 6,424 | 1.3 | ||||||||
| Total / Wtd. Avg. | 479,004 | 100.0 | % | |||||||
| (1) | Based on the underwritten rent roll dated March 10, 2023. |
| (2) | The credit ratings are those of the direct parent company, BMY, which is the guarantor under the leases. |
| (3) | E.R. Squibb & Sons LLC has an option to terminate its 9th floor lease on the last day of the 10th lease year (October 31, 2032) with 18-30 months’ notice and a termination fee. E.R. Squibb & Sons LLC has subleased a portion of the 9th floor space (45,500 sq. ft.) to Eterna Therapeutics Inc. through October 31, 2032. Eterna Therapeutics Inc. has the right to extend the sublease term through September 1, 2037, and E.R. Squibb & Sons LLC has a termination option in year 7 of the sublease term. |
| (4) | Total Occupied U/W Base Rent Per Sq. Ft. excludes vacant space. |
| THE INFORMATION IN THIS STRUCTURAL AND COLLATERAL TERM SHEET IS NOT COMPLETE AND MAY BE AMENDED PRIOR TO THE TIME OF SALE. THIS TERM SHEET IS NOT AN OFFER TO SELL THESE SECURITIES AND IT IS NOT A SOLICITATION OF AN OFFER TO BUY THESE SECURITIES IN ANY JURISDICTION WHERE THE OFFER OR SALE IS NOT PERMITTED. | ||
| 48 | ||
250 Water Street | Collateral Asset Summary – Loan No. 3 CX - 250 Water Street | Cut-off Date Balance: Cut-off Date LTV: U/W NCF DSCR: U/W NOI Debt Yield: | $53,150,000 48.8% 1.66x 9.3% |
| Lease Rollover Schedule(1)(2)(3) | |||||||||||
| Year | # of Leases Expiring | Total Expiring Sq. Ft. | % of Total Sq. Ft. Expiring | Cumulative Sq. Ft. Expiring | Cumulative % of Sq. Ft. Expiring | Annual U/W Base Rent Per Sq. Ft. (4) | % U/W Base Rent Rolling(4) | Cumulative % of U/W Base Rent(3) | |||
| MTM | 0 | 0 | 0.0 | % | 0 | 0.0% | $0 | 0.0% | 0.0% | ||
| 2023 | 0 | 0 | 0.0 | 0 | 0.0% | $0 | 0.0% | 0.0% | |||
| 2024 | 0 | 0 | 0.0 | 0 | 0.0% | $0 | 0.0% | 0.0% | |||
| 2025 | 0 | 0 | 0.0 | 0 | 0.0% | $0 | 0.0% | 0.0% | |||
| 2026 | 0 | 0 | 0.0 | 0 | 0.0% | $0 | 0.0% | 0.0% | |||
| 2027 | 0 | 0 | 0.0 | 0 | 0.0% | $0 | 0.0% | 0.0% | |||
| 2028 | 0 | 0 | 0.0 | 0 | 0.0% | $0 | 0.0% | 0.0% | |||
| 2029 | 0 | 0 | 0.0 | 0 | 0.0% | $0 | 0.0% | 0.0% | |||
| 2030 | 0 | 0 | 0.0 | 0 | 0.0% | $0 | 0.0% | 0.0% | |||
| 2031 | 0 | 0 | 0.0 | 0 | 0.0% | $0 | 0.0% | 0.0% | |||
| 2032 | 0 | 0 | 0.0 | 0 | 0.0% | $0 | 0.0% | 0.0% | |||
| 2033 | 0 | 0 | 0.0 | 0 | 0.0% | $0 | 0.0% | 0.0% | |||
| 2034 & Thereafter | 2 | 472,580 | 98.7 | 472,580 | 98.7% | $90.48 | 100.0% | 100.0% | |||
| Vacant | NAP | 6,424 | 1.3 | 479,004 | 100.0% | NAP | NAP. | NAP | |||
| Total / Wtd. Avg. | 2 | 479,004 | 100.0 | % | $90.48 | 100.0% | |||||
| (1) | Based on the underwritten rent roll dated March 10, 2023. |
| (2) | Certain tenants may have termination or contraction options (which may become exercisable prior to the originally stated expiration date of the tenant lease) that are not considered in the above Lease Rollover Schedule. |
| (3) | Total/Wtd. Avg. Annual U/W Base Rent Per Sq. Ft. excludes vacant space. |
Environmental Matters. A Phase I environmental report dated May 24, 2022, stated there were no current recognized environmental conditions (RECs), and no further investigation was recommended at the CX – 250 Water Street Property. There was one controlled REC, which impacted the soil from former industrial and rail yard use, which was removed or capped with landscape/hardscape and maintained with activity and use limitations See “–Description of the Mortgage Pool – Environmental Considerations” in the Preliminary Prospectus.
The Market. The CX – 250 Water Street Property has an address in Cambridge, Massachusetts, within the Boston core-based statistical area, directly north of the City of Boston and separated from Boston’s central business district (“CBD”) by the Charles River. Cambridge is bordered by Somerville to the north and Watertown to the west. Cambridge is acclaimed for its mix of venture capital, National Institutes of Health (“NIH”) funding and state investments. In recent years, Cambridge has become a life sciences and biotechnology hub not only for the Northeast, but for the entire United States. 18 of the top 20 life sciences companies are in East Cambridge. Cambridge is home to over 5,000 private business establishments, including Watson Health, Amgen, Facebook and Apple, among others.
The Cambridge market is best known for its innovation and high concentration of research and development operations. Cambridge has one of the highest densities of college educated people in the world, with three major NIH hospitals and 42 colleges, universities and community colleges in the Boston/Cambridge area, including Harvard University and Massachusetts Institute of Technology (MIT). There are over 11,000 undergraduate students and over 11,000 graduate students living in Cambridge.
The following table presents the submarket statistics for the laboratory space in the Cambridge market:
| Submarket Metrics(1) | ||||||
| Submarket | Inventory (SF) | Overall Vacancy Rate | YTD Overall Absorptions (SF) | Under Construction (SF) | Total Asking Rent | Direct Avg. Rent (Class A) |
| East Cambridge | 8,159,000 | 3.5% | 0 | 2,169,000 | $102.78 | $110.00 |
| Mid Cambridge | 2,951,620 | 1.0% | (29,562) | 0 | $115.00 | $115.00 |
| West Cambridge | 1,406,102 | 0.0% | 1,589 | 326,616 | $96.18 | $100.00 |
| Total/Wtd. Avg. | 12,516,722 | 2.5% | (27,973) | 2,495,616 | $104.92 | $110.06 |
| (1) | Source: Appraisal. |
| THE INFORMATION IN THIS STRUCTURAL AND COLLATERAL TERM SHEET IS NOT COMPLETE AND MAY BE AMENDED PRIOR TO THE TIME OF SALE. THIS TERM SHEET IS NOT AN OFFER TO SELL THESE SECURITIES AND IT IS NOT A SOLICITATION OF AN OFFER TO BUY THESE SECURITIES IN ANY JURISDICTION WHERE THE OFFER OR SALE IS NOT PERMITTED. | ||
| 49 | ||
250 Water Street | Collateral Asset Summary – Loan No. 3 CX - 250 Water Street | Cut-off Date Balance: Cut-off Date LTV: U/W NCF DSCR: U/W NOI Debt Yield: | $53,150,000 48.8% 1.66x 9.3% |
The following table summarizes the comparable leases in the surrounding market:
| Summary of Comparable Leases(1) | |||||||||
| Property | Year Built |
Tenant Name | Lease Start Date | Term (yrs.) | Lease Type | Tenant Size (SF) | Base Rent PSF | Rent Steps/yr | TI PSF |
CX – 250 Water Street(2)(3) Cambridge, MA | 2022 | E.R. Squibb & Sons LLC | Jul/Nov-22 | 15.0 | NNN | 472,580 | $90.48 | 2.53% | $225.00 |
325 Binney Cambridge, MA | 2024 | Moderna Therapeutics | Jan-24 | 15.0 | NNN | 462,000 | $117.00 | 3.00% | $225.00 |
Lab Building Somerville, MA | 2021 | Generate Biomedicines, Inc. | Apr-22 | 10.1 | NNN | 71,330 | $82.30 | 2.75% | $250.00 |
One Rogers/Charles Park Cambridge, MA | 1984 | Flagship Entities | Nov-23 | 10.0 | NNN | 388,000 | $115.00 | 3.00% | $200.00 |
The Richards Building Cambridge, MA | 1989 | Vericel Corporation | Mar-22 | 10.0 | NNN | 57,159 | $102.00 | 3.00% | $75.00 |
University Park Cambridge, MA | 2000 | Brigham and Women’s | Feb-21 | 5.0 | NNN | 112,410 | $100.00 | 3.00% | $0.00 |
| Average.(4) | 10.0 | 218,180 | $103.26 | $150.00 | |||||
| (1) | Source: Appraisal. |
| (2) | Information is based on the underwritten rent roll dated March 10, 2023. |
| (3) | The information is based on the weighted average of the E.R. Squibb & Sons LLC leases and includes both office and lab spaces. The lease to E.R. Squibb & Sons LLC for floors 1-8 started on November 1, 2022 for 415,900 SF at a base rent PSF of $88.50 with 2.5% annual increases. The lease to E.R. Squibb & Sons LLC for floor 9 started on July 1, 2022 for 56,680 SF at a base rent PSF of $105.00 with 2.75% annual increases. |
| (4) | Average excludes the CX – 250 Water Street Property. |
The lease comparables range in size from 57,159 sq. ft. to 462,000 sq. ft. and have lease terms ranging from 5 to 15 years. The lease comparables exhibit a range in rents from $82.30 to $117.00 per sq. ft., with an average of $103.26 per sq. ft. on a net basis. Lease comparables offer no free rent concessions, but offer tenant improvement allowances ranging from $0.00 to $250.00 per sq. ft., with an average of $150.00 per sq. ft. The appraiser concluded to a market rent for laboratory of $115.00 per sq. ft., which is 27.1% over the weighted average in-place rent at the CX – 250 Water Street Property of $90.48 per sq. ft.
The following table presents certain information relating to the appraisal’s market rent conclusion for laboratory space for the CX – 250 Water Street Property:
| Market Rent Summary(1) | ||
| Laboratory | Retail | |
| Market Rent PSF (NNN) | $115.00 | $50.00 |
| Lease Term (Years) | 10.1 | 10.1 |
| Rent Increase Projection | 3% per annum | 3% per annum |
| (1) | Source: Appraisal. |
| THE INFORMATION IN THIS STRUCTURAL AND COLLATERAL TERM SHEET IS NOT COMPLETE AND MAY BE AMENDED PRIOR TO THE TIME OF SALE. THIS TERM SHEET IS NOT AN OFFER TO SELL THESE SECURITIES AND IT IS NOT A SOLICITATION OF AN OFFER TO BUY THESE SECURITIES IN ANY JURISDICTION WHERE THE OFFER OR SALE IS NOT PERMITTED. | ||
| 50 | ||
250 Water Street | Collateral Asset Summary – Loan No. 3 CX - 250 Water Street | Cut-off Date Balance: Cut-off Date LTV: U/W NCF DSCR: U/W NOI Debt Yield: | $53,150,000 48.8% 1.66x 9.3% |
Cash Flow Analysis.
| Cash Flow Analysis(1) | ||
| U/W | U/W Per Sq. Ft. | |
| Base Rent(2) | $43,079,750 | $89.94 |
| Straight Line Rent(3) | 5,689,409 | $11.88 |
| Gross Potential Rent | $48,769,159 | $101.81 |
| Total Reimbursements | 12,827,911 | $26.78 |
| Parking Income | 1,596,600 | $3.33 |
| Gross Potential Income | $63,193,670 | $131.93 |
| Less: Vacancy & Credit Loss | (631,937) | ($1.32) |
| Effective Gross Income | $62,561,733 | $130.61 |
| Total Operating Expenses | 13,277,931 | $27.72 |
| Net Operating Income | $49,283,802 | $102.89 |
| TI/LC | $0 | $0.00 |
| Capital Expenditures | $119,751 | $0.25 |
| Net Cash Flow | $49,164,051 | $102.64 |
| (1) | Historical financial information is not available because the CX – 250 Water Street Property was built in 2022. |
| (2) | Based on the underwritten rent roll dated March 10, 2023 for contractual leases. The rent commencement date for the floors 1-8 and related ancillary spaces (415,900 SF) was in November 2022; the rent commencement date for floor 9 and related ancillary spaces (56,680 SF) was in July 2022. |
| (3) | Straight-line average rent credit was taken for the E.R. Squibb & Sons LLC leases (BMY is the investment grade rated parent company) through the loan term. |
Property Management. The CX – 250 Water Street Property is managed by Divco West Real Estate Services, Inc., a Delaware corporation and an affiliate of the borrower sponsor.
Lockbox / Cash Management. The CX – 250 Water Street Whole Loan is structured with a hard lockbox and springing cash management. All rents are required to be deposited directly into a lender-controlled lockbox account. During a Trigger Period (as defined below), funds on deposit in the lockbox account are required to be swept on a daily basis into a lender-controlled cash management account. Prior to the ARD (except during the continuance of an event of default under the CX – 250 Water Street Whole Loan), all excess cash is required to be transferred to a lender-controlled account as additional collateral for the CX – 250 Water Street Whole Loan, subject to certain permitted uses by the borrower described in the loan documents, and except as described with respect to a Lease Sweep Period (as defined below). If the CX – 250 Water Street Whole Loan is not paid by the ARD, on and after the ARD, the CX – 250 Water Street Whole Loan will accrue interest at the Adjusted Interest Rate; however, interest accrued at the excess of the Adjusted Interest Rate over the initial interest rate (“Excess Interest”) will be deferred.
On and after the ARD (except during the continuance of an event of default under the CX – 250 Water Street Whole Loan), all amounts on deposit in the cash management account after payment of debt service (other than Excess Interest), required reserves and budgeted operating expenses will be required to be applied to the prepayment of the outstanding principal balance of the CX – 250 Water Street Whole Loan until the outstanding principal balance has been reduced to zero and then to any Excess Interest until the Excess Interest has been reduced to zero.
Initial and Ongoing Reserves.
At loan origination, the borrower deposited (i) $5,932,952 into a base building reserve for the completion of certain base building work at the CX – 250 Water Street Property, (ii) approximately $7,160,274 into a reserve for certain outstanding tenant improvements and leasing commissions, and (iii) approximately $4,500,617 into a reserve for outstanding linkage fees, which the borrower is required to pay to the Somerville Affordable Housing Trust Fund in the amount of approximately $2,250,309 on August 18, 2023 and August 18, 2024, pursuant to a Project Mitigation Agreement, by and between the City of Somerville and the borrower.
Real Estate Taxes – During a Trigger Period, the borrower is required to deposit into a real estate tax reserve, on a monthly basis, 1/12 of the reasonably estimated annual real estate taxes.
Insurance – During a Trigger Period, or if the borrower fails to maintain a blanket insurance policy, the borrower is required to deposit into an insurance reserve, on a monthly basis, 1/12 of the reasonably estimated insurance premiums.
TI/LC Reserve – During a Lease Sweep Period, all excess cash will be swept into the rollover reserve.
| THE INFORMATION IN THIS STRUCTURAL AND COLLATERAL TERM SHEET IS NOT COMPLETE AND MAY BE AMENDED PRIOR TO THE TIME OF SALE. THIS TERM SHEET IS NOT AN OFFER TO SELL THESE SECURITIES AND IT IS NOT A SOLICITATION OF AN OFFER TO BUY THESE SECURITIES IN ANY JURISDICTION WHERE THE OFFER OR SALE IS NOT PERMITTED. | ||
| 51 | ||
250 Water Street | Collateral Asset Summary – Loan No. 3 CX - 250 Water Street | Cut-off Date Balance: Cut-off Date LTV: U/W NCF DSCR: U/W NOI Debt Yield: | $53,150,000 48.8% 1.66x 9.3% |
A “Trigger Period” will occur if (i) commencing upon the ARD (with no cure or end date), (ii) commencing upon the occurrence of an event of default under the CX - 250 Water Street Whole Loan until waived or cured, (iii) on any date from and after June 30, 2023, commencing when the debt service coverage ratio is less than 1.45x based on the CX – 250 Water Street Whole Loan for two consecutive calendar quarters, and ending upon the earlier to occur of (x) the debt service coverage ratio based on the CX – 250 Water Street Whole Loan being equal to or greater than 1.45x for two consecutive calendar quarters and (y) funds on deposit in the cash collateral account (without regard to prior disbursements from such account) equaling or exceeding $23,950,200, or (iv) during a Lease Sweep Period.
A “Lease Sweep Period” will commence (prior to the ARD) upon (i) the earliest to occur of: (a) the date that is 12 months prior to the earliest stated expiration of the Lease Sweep Lease (as defined below); (b) the last date under such Lease Sweep Lease that the tenant has the right to give notice of its exercise of a renewal option; or (c) with respect to any Lease Sweep Lease that is a Short Term Qualifying Lease (as defined below), the date that is 12 months prior to the ARD or the date that the lender reasonably determines that a Lease Sweep Period should commence in order for the aggregate amount of projected deposits into the rollover account for the period commencing on such date through the ARD to equal the Lease Sweep Deposit Amount (as defined below), (ii) the date of the early termination, early cancellation or early surrender of a Lease Sweep Lease (or any material portion thereof) prior to its then current expiration date or the receipt by the borrower or manager of written notice from the tenant under a Lease Sweep Lease of its intent to effect an early termination, early cancellation or early surrender of such Lease Sweep Lease prior to its then current expiration date, (iii) solely with respect to any Lease Sweep Lease under which neither the applicable tenant, nor any lease guarantor is an investment grade entity, if such tenant has ceased operating its business (i.e., “goes dark”) in a majority of its leased space at the CX – 250 Water Street Property and the same has not been subleased in accordance with the terms of the loan agreement, pursuant to a sublease on the same or substantially similar or better terms as the applicable Lease Sweep Lease, (iv) a monetary or material non-monetary default under a Lease Sweep Lease by the tenant thereunder, or (v) the occurrence of an insolvency proceeding with respect to the tenant under a Lease Sweep Lease, its direct or indirect parent company or any lease guarantor of such tenant’s obligations under such Lease Sweep Lease.
A Lease Sweep Period will end upon (a) if triggered in the case of clause (i), (ii), (iii) and (iv) above, the entirety of the Lease Sweep Lease space is leased pursuant to one or more qualified leases and in the lender’s reasonable judgment, sufficient funds have been accumulated in the rollover account, (b) if triggered in the case of clause (i) above, the date on which the tenant under the Lease Sweep Lease irrevocably exercises its renewal or extension option or otherwise extends its Lease Sweep Lease in accordance with the terms of the loan agreement with respect to all of its Lease Sweep Lease space, and, in the lender’s reasonable judgment, sufficient funds have been accumulated in the rollover account, (c) if triggered in the case of clause (ii) above, if the tenant under the applicable Lease Sweep Lease rescinds in writing the exercise of its notice exercising its early termination, cancellation or surrender right or option, (d) if triggered in the case of clause (iii) above, the circumstances giving rise to a Lease Sweep Period under clause (iii) no longer exist, (e) if triggered in the case of clause (iv) above, the date on which the subject default has been cured, (f) if triggered in the case of clause (v) above, either (1) the applicable insolvency proceeding has terminated and the applicable Lease Sweep Lease has been affirmed, assumed or assigned in a manner reasonably satisfactory to the lender or (2) the applicable Lease Sweep Lease has been assumed or assumed and assigned to a third party in a manner reasonably satisfactory to the lender, (g) if triggered in the case of clauses (i), (ii), (iii), (iv) and/or (v) above, the CX – 250 Water Street Property has achieved a debt yield of not less than 7.5% and, in the lender’s reasonable judgment, sufficient funds have been accumulated in the rollover account, or (h) if triggered in in the case of clauses (i), (ii), (iii), (iv) and/or (v) above, the date on which funds in the rollover account collected with respect to the Lease Sweep Lease space in question is equal to the Lease Sweep Deposit Amount applicable to such Lease Sweep Lease space.
A “Lease Sweep Lease” means (i) the E.R. Squibb & Sons, LLC leases at the CX – 250 Water Street Property and (ii) any replacement lease that, either individually or when taken together with any other lease with the same tenant or its affiliates, and assuming the exercise of all expansion rights and all preferential rights to lease additional space contained in such lease, covers the majority of the Lease Sweep Lease space.
A “Lease Sweep Tenant” means any tenant under a Lease Sweep Lease.
A “Lease Sweep Deposit Amount” means an amount equal to the total rentable sq. ft. of the applicable Lease Sweep Lease space that is the subject of a Lease Sweep Period multiplied by $50.00.
A “Short Term Qualifying Lease” means any “qualified lease” that has an initial term which does not extend at least two years beyond the ARD.
Current Mezzanine or Subordinate Indebtedness. None.
Future Mezzanine or Subordinate Indebtedness Permitted. None.
Partial Release. None.
| THE INFORMATION IN THIS STRUCTURAL AND COLLATERAL TERM SHEET IS NOT COMPLETE AND MAY BE AMENDED PRIOR TO THE TIME OF SALE. THIS TERM SHEET IS NOT AN OFFER TO SELL THESE SECURITIES AND IT IS NOT A SOLICITATION OF AN OFFER TO BUY THESE SECURITIES IN ANY JURISDICTION WHERE THE OFFER OR SALE IS NOT PERMITTED. | ||
| 52 | ||
2034 Green Acres Road Valley Stream, NY 11581
| Collateral Asset Summary – Loan No. 4 Green Acres | Cut-off Date Balance: Cut-off Date LTV: U/W NCF DSCR: U/W NOI Debt Yield: | $50,000,000 54.5% 2.10x 13.0% |
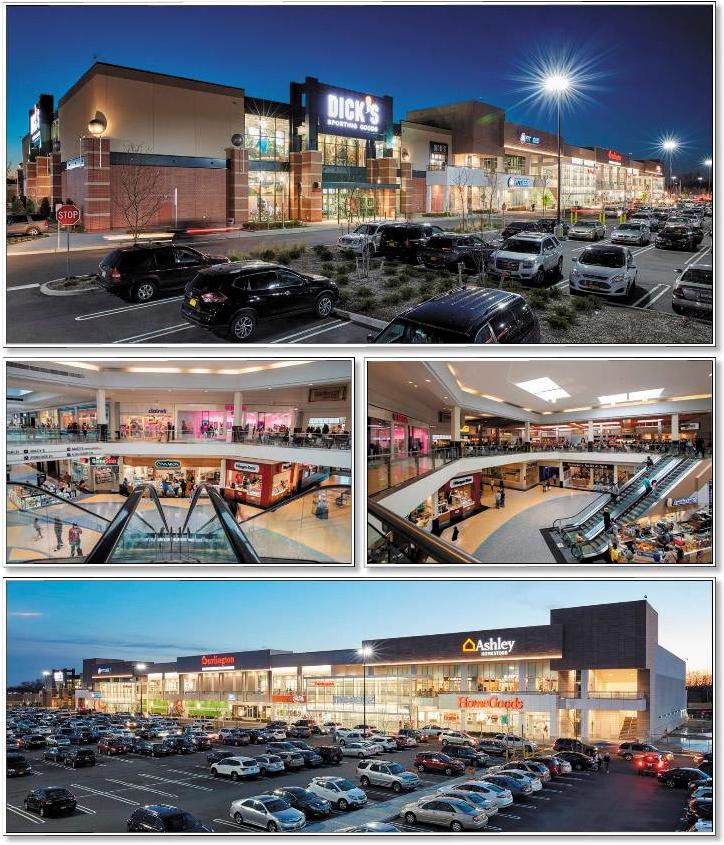
| THE INFORMATION IN THIS STRUCTURAL AND COLLATERAL TERM SHEET IS NOT COMPLETE AND MAY BE AMENDED PRIOR TO THE TIME OF SALE. THIS TERM SHEET IS NOT AN OFFER TO SELL THESE SECURITIES AND IT IS NOT A SOLICITATION OF AN OFFER TO BUY THESE SECURITIES IN ANY JURISDICTION WHERE THE OFFER OR SALE IS NOT PERMITTED. | ||
| 53 | ||
2034 Green Acres Road Valley Stream, NY 11581
| Collateral Asset Summary – Loan No. 4 Green Acres | Cut-off Date Balance: Cut-off Date LTV: U/W NCF DSCR: U/W NOI Debt Yield: | $50,000,000 54.5% 2.10x 13.0% |
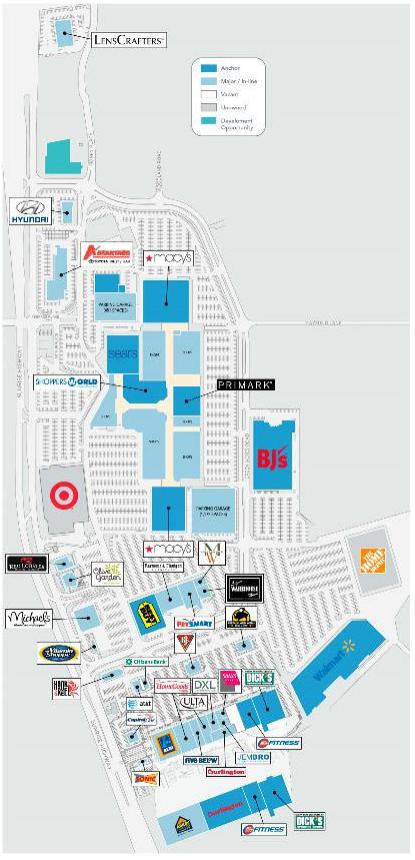
| THE INFORMATION IN THIS STRUCTURAL AND COLLATERAL TERM SHEET IS NOT COMPLETE AND MAY BE AMENDED PRIOR TO THE TIME OF SALE. THIS TERM SHEET IS NOT AN OFFER TO SELL THESE SECURITIES AND IT IS NOT A SOLICITATION OF AN OFFER TO BUY THESE SECURITIES IN ANY JURISDICTION WHERE THE OFFER OR SALE IS NOT PERMITTED. | ||
| 54 | ||
2034 Green Acres Road Valley Stream, NY 11581
| Collateral Asset Summary – Loan No. 4 Green Acres | Cut-off Date Balance: Cut-off Date LTV: U/W NCF DSCR: U/W NOI Debt Yield: | $50,000,000 54.5% 2.10x 13.0% |
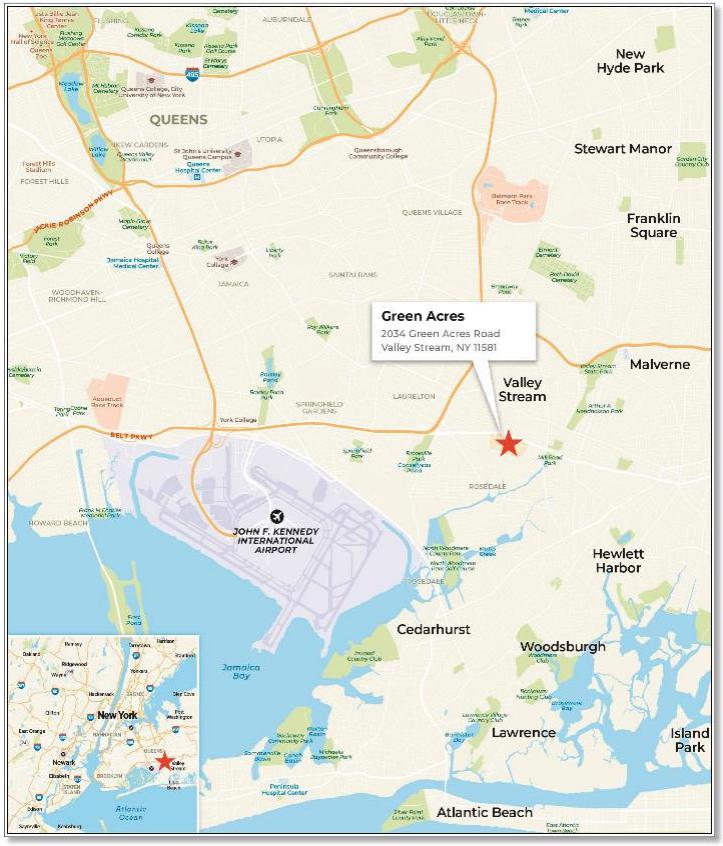
| THE INFORMATION IN THIS STRUCTURAL AND COLLATERAL TERM SHEET IS NOT COMPLETE AND MAY BE AMENDED PRIOR TO THE TIME OF SALE. THIS TERM SHEET IS NOT AN OFFER TO SELL THESE SECURITIES AND IT IS NOT A SOLICITATION OF AN OFFER TO BUY THESE SECURITIES IN ANY JURISDICTION WHERE THE OFFER OR SALE IS NOT PERMITTED. | ||
| 55 | ||
2034 Green Acres Road Valley Stream, NY 11581
| Collateral Asset Summary – Loan No. 4 Green Acres | Cut-off Date Balance: Cut-off Date LTV: U/W NCF DSCR: U/W NOI Debt Yield: | $50,000,000 54.5% 2.10x 13.0% |
| Mortgage Loan Information | |
| Loan Sellers: | GSMC, GACC |
| Loan Purpose: | Refinance |
Credit Assessment (Fitch/KBRA/Moody’s)(6): | NR / NR / Baa2(sf) |
Borrower Sponsor:
| The Macerich Partnership, L.P. |
| Borrowers: | Valley Stream Green Acres LLC and Green Acres Adjacent LLC |
| Original Balance(1): | $50,000,000 |
| Cut-off Date Balance(1): | $50,000,000 |
| % by Initial UPB: | 7.6% |
| Interest Rate: | 5.89900% |
| Payment Date: | 6th of each month |
| First Payment Date: | February 6, 2023 |
| Maturity Date: | January 6, 2028 |
| Amortization: | Interest Only |
| Additional Debt(1): | $320,000,000 Pari Passu Debt |
| Call Protection(2): | L(27),YM1(28),O(5) |
| Lockbox / Cash Management: | Hard / Springing |
| Reserves(3) | |||
| Initial | Monthly | Cap | |
| Taxes: | $0 | Springing | NAP |
| Insurance: | $0 | Springing | NAP |
| Replacement: | $0 | Springing | $619,992 |
| TI/LC: | $4,068,135 | $0 | NAP |
| Other(4): | $743,644 | Springing | $2,094,342 |
| Property Information | |
| Single Asset / Portfolio: | Single Asset |
| Property Type: | Regional Mall Retail |
| Collateral: | Fee / Leasehold |
| Location: | Valley Stream, NY |
| Year Built / Renovated: | 1956, 2016 / 1982, 2006, 2007 |
| Total Sq. Ft.: | 2,081,286 |
| Property Management: | Macerich Property Management Company, LLC |
| Underwritten NOI: | $47,934,528 |
| Underwritten NCF: | $46,364,767 |
| Appraised Value(5): | $679,000,000 |
| Appraisal Date: | October 30, 2022 |
| Historical NOI | |
| Most Recent NOI: | $45,174,388 (T-12 September 30, 2022) |
| 2021 NOI: | $46,618,790 (December 31, 2021) |
| 2020 NOI: | $41,001,586 (December 31, 2020) |
| 2019 NOI: | $53,314,510 (December 31, 2019) |
| Historical Occupancy | |
| Most Recent Occupancy: | 97.7% (December 12, 2022) |
| 2021 Occupancy: | 93.2% (December 31, 2021) |
| 2020 Occupancy: | 89.8% (December 31, 2020) |
| 2019 Occupancy: | 96.4% (December 31, 2019) |
| Financial Information(1) | ||||||
| Tranche | Cut-off Date Balance | Balance per Sq. Ft. Cut-off / Balloon | LTV Cut-off / Balloon | U/W DSCR NOI / NCF | U/W Debt Yield NOI / NCF | U/W Debt Yield at Balloon NOI / NCF |
| Mortgage Loan | $50,000,000 | |||||
| Pari Passu Notes | 320,000,000 | |||||
| Whole Loan | $370,000,000 | $178 / $178 | 54.5% / 54.5% | 2.17x / 2.10x | 13.0% / 12.5% | 13.0% / 12.5% |
| (1) | The Green Acres Loan (as defined below) is part of the Green Acres Whole Loan (as defined below) evidenced by 18 pari passu notes with an aggregate original principal balance of $370,000,000. Financial information in the chart above reflects the Green Acres Whole Loan. See “The Loan” herein. |
| (2) | The lockout period will be at least 27 payment dates beginning with and including the first payment date in February 2023. Prepayment of the Green Acres Whole Loan in full is permitted at any time on or after the earlier to occur of (i) the monthly payment date occurring in January 2026 and (ii) the date that is two years from the closing date of the securitization that includes the last pari passu note to be securitized. The assumed lockout period of 27 payments is based on the expected Benchmark 2023-B38 closing date in April 2023. The actual lockout period may be longer. |
| (3) | See “Initial and Ongoing Reserves” herein. |
| (4) | The Other Reserves consists of an upfront approximately $743,644 Gap Rent Reserve and a monthly springing Rollover Reserve. |
| (5) | The “as-is” appraised value is based on an extraordinary assumption made by the appraiser that the PILOT documents will be extended an additional 5-years to 2031. In the absence of the PILOT tax benefits beyond 2026, the as-is value of the Green Acres Property would otherwise be reduced by approximately $58.0 million resulting in an estimated appraised value of $621.0 million and in a Cut-off Date LTV and Maturity Date LTV of 59.6%. |
| (6) | Moody’s provided the listed assessment for the Green Acres Loan in the context of its inclusion in the mortgage pool. |
| THE INFORMATION IN THIS STRUCTURAL AND COLLATERAL TERM SHEET IS NOT COMPLETE AND MAY BE AMENDED PRIOR TO THE TIME OF SALE. THIS TERM SHEET IS NOT AN OFFER TO SELL THESE SECURITIES AND IT IS NOT A SOLICITATION OF AN OFFER TO BUY THESE SECURITIES IN ANY JURISDICTION WHERE THE OFFER OR SALE IS NOT PERMITTED. | ||
| 56 | ||
2034 Green Acres Road Valley Stream, NY 11581
| Collateral Asset Summary – Loan No. 4 Green Acres | Cut-off Date Balance: Cut-off Date LTV: U/W NCF DSCR: U/W NOI Debt Yield: | $50,000,000 54.5% 2.10x 13.0% |
The Loan. The mortgage loan (the “Green Acres Loan”) is part of a whole loan (the “Green Acres Whole Loan”) evidenced by 18 pari passu promissory notes in the aggregate original principal amount of $370,000,000, which is secured by (i) the applicable borrower’s fee interest in a retail mega-campus comprised of Green Acres (as defined below) and Green Acres Commons (as defined below) that are adjacent with each other and located in Valley Stream, New York (other than a 9.08-acre portion of such regional mall (representing approximately 8.3% of the net rentable area of the Green Acres Property (as defined below)), the fee interest in which is owned by Walmart, an anchor tenant (such portion of the regional mall owned by Walmart, the “Walmart Parcel”)) and (ii) the applicable borrower’s ground leasehold interest in the Walmart Parcel that is leased back to Walmart (the “Green Acres Property”). The Green Acres Loan is evidenced by the non-controlling notes A-1 and A-15-1, which have an aggregate outstanding principal balance as of the Cut-off Date of $50,000,000. The Green Acres Whole Loan was co-originated on January 3, 2023 by Bank of Montreal (“BMO”), Goldman Sachs Bank USA (“GS”), Morgan Stanley Bank, N.A. (“MS”), and DBR Investments Co. Limited (“DBRI”). The “Green Acres Property” is comprised of the regional enclosed mall and the retail power center (including the Walmart Parcel) but does not include any portion of the regional mall that is occupied by Home Depot and Target (which own their own parcels), except as otherwise expressly indicated herein. The Green Acres Whole Loan proceeds were used to refinance the existing debt on the Green Acres Property, fund upfront reserves and pay origination costs. The Green Acres Whole Loan accrues interest at a fixed rate of 5.89900% per annum.
The table below summarizes the promissory notes that comprise the Green Acres Whole Loan. The relationship between the holders of the Green Acres Whole Loan is governed by a co-lender agreement. The Green Acres Whole Loan is initially being serviced under the pooling and servicing agreement for the BMO 2023-C4 trust until the controlling note A-1 is securitized, whereupon the Green Acres Whole Loan will be serviced pursuant to the pooling and servicing agreement for such future securitization. See “Description of the Mortgage Pool—The Whole Loans—The Non-Serviced Pari Passu Whole Loans” and “Pooling and Servicing Agreement—Servicing of the Non-Serviced Mortgage Loans” in the Preliminary Prospectus.
| Whole Loan Summary | |||||
| Note | Original Balance | Cut-off Date Balance | Note Holder | Controlling Piece | |
| A-1(1) | $36,000,000 | $36,000,000 | GS | Yes | |
| A-2 | 31,500,000 | 31,500,000 | FIVE 2023-V1 | No | |
| A-3(2) | 32,500,000 | 32,500,000 | Benchmark 2023-B38 | No | |
| A-4(1) | 24,000,000 | 24,000,000 | BMO | No | |
| A-5(1) | 21,500,000 | 21,500,000 | BMO | No | |
| A-6 | 20,000,000 | 20,000,000 | BMO 2023-C4 | No | |
| A-7 | 18,500,000 | 18,500,000 | FIVE 2023-V1 | No | |
| A-8 | 6,000,000 | 6,000,000 | BMO 2023-C4 | No | |
| A-9(1) | 50,000,000 | 50,000,000 | MS | No | |
| A-10(1) | 20,000,000 | 20,000,000 | MS | No | |
| A-11(1) | 10,000,000 | 10,000,000 | MS | No | |
| A-12(1) | 10,000,000 | 10,000,000 | MS | No | |
| A-13-1(1) | 25,000,000 | 25,000,000 | DBRI | No | |
| A-13-2(1) | 5,000,000 | 5,000,000 | DBRI | No | |
| A-14 | 25,000,000 | 25,000,000 | FIVE 2023-V1 | No | |
| A-15-1(2) | $17,500,000 | $17,500,000 | Benchmark 2023-B38 | No | |
| A-15-2(1) | 2,500,000 | 2,500,000 | DBRI | No | |
| A-16(1) | 15,000,000 | 15,000,000 | DBRI | No | |
| Whole Loan | $370,000,000 | $370,000,000 | |||
| (1) | The Notes held by the lenders are expected to be contributed to one or more future securitization transactions or may otherwise be transferred at any time. |
| (2) | GSMC is contributing Note A-3 and GACC is contributing Note A-15-1. |
| Sources and Uses | ||||||||
| Sources | Proceeds | % of Total | Uses | Proceeds | % of Total | |||
| Whole Loan | $370,000,000 | 96.9 | % | Loan Payoff | $364,192,834 | 95.4 | % | |
| Borrower Sponsor Equity | 11,744,495 | 3.1 | Closing Costs | 12,739,883 | 3.3 | |||
| Upfront Reserves | 4,811,779 | 1.3 | ||||||
| Total Sources | $381,744,495 | 100.0 | % | Total Uses | $381,744,495 | 100.0 | % | |
| THE INFORMATION IN THIS STRUCTURAL AND COLLATERAL TERM SHEET IS NOT COMPLETE AND MAY BE AMENDED PRIOR TO THE TIME OF SALE. THIS TERM SHEET IS NOT AN OFFER TO SELL THESE SECURITIES AND IT IS NOT A SOLICITATION OF AN OFFER TO BUY THESE SECURITIES IN ANY JURISDICTION WHERE THE OFFER OR SALE IS NOT PERMITTED. | ||
| 57 | ||
2034 Green Acres Road Valley Stream, NY 11581
| Collateral Asset Summary – Loan No. 4 Green Acres | Cut-off Date Balance: Cut-off Date LTV: U/W NCF DSCR: U/W NOI Debt Yield: | $50,000,000 54.5% 2.10x 13.0% |
The Borrowers and the Borrower Sponsor. The borrowers for the Green Acres Whole Loan are Valley Stream Green Acres LLC and Green Acres Adjacent LLC, each a single purpose entity with two independent directors. Legal counsel to the borrowers delivered a non-consolidation opinion in connection with the origination of the Green Acres Whole Loan. The borrower sponsor and non-recourse carveout guarantor is The Macerich Partnership, L.P., a Delaware limited partnership headquartered in Santa Monica, California and a provider of real estate investment services. The Macerich Partnership, L.P. acquires, leases, manages, develops, and redevelops malls and community centers. The Macerich Partnership, L.P. also serves as one of the borrower sponsors of the Scottsdale Fashion Square Mortgage Loan, which is being contributed to the Benchmark 2023-B38 transaction.
The Property. The Green Acres Property is a retail mega-campus comprised of a two-level regional mall known as “Green Acres” and an adjacent two-story retail power center known as “Green Acres Commons”, totaling 2,081,286 sq. ft. on an approximately 120.8-acre site in Valley Stream, New York. Green Acres was built in 1956 and most recently renovated in 2007. Green Acres Commons was built in 2016. The Green Acres Property provides parking via 9,092 surface parking and parking garage spaces, resulting in a parking ratio of approximately 4.4 spaces per 1,000 sq. ft. of net rentable area. As of December 12, 2022, the Green Acres Property was 97.7% leased by approximately 150 tenants (including temporary tenants, which make up approximately 1.7% of net rentable area), of which 62.1% of net rentable area is occupied by the 11 largest tenants by sq. ft. A portion of the Green Acres Property is currently occupied by certain temporary tenants and no underwritten base rent is attributable to those temporary tenants. Green Acres Adjacent LLC owns Green Acres Commons and Valley Stream Green Acres LLC owns Green Acres and the leasehold interest in the Walmart Parcel. The fee interests in the Green Acres Property owned by the applicable borrower represents approximately 91.7% of the net rentable area, and the leasehold interest in the Walmart Parcel owned by the applicable borrower represents approximately 8.3% of the net rentable area. The fee interest in the Walmart Parcel is owned by Walmart, an anchor tenant and is ground leased to the applicable borrower. See “Ground Lease” below. The Green Acres Property is shadow anchored by Home Depot and Target, and the space occupied by Home Depot and Target is not part of the collateral securing the Green Acres Whole Loan. The information relating to the Green Acres Property provided does not include any space occupied by Home Depot or Target, unless otherwise expressly stated.
Major Tenants. The three largest tenants based on sq. ft. are Macy’s and Macy’s Men’s and Furniture, Walmart and SEARS, each of which is an anchor tenant.
Macy’s and Macy’s Men’s and Furniture (390,503 sq. ft.; 18.8% of NRA, 1.9% of underwritten base rent, Moody’s/S&P/Fitch: Ba2/BB+/BBB-): Founded in 1858 and headquartered in New York, New York, Macy’s (“Macy’s and Macy’s Men’s and Furniture”) is a department store chain with 510 locations as of the third-quarter of 2023. Macy’s occupies two separate anchor boxes at the Green Acres Property, a Macy’s and Macy’s Men’s and Furniture. Macy’s occupies 266,676 sq. ft. of the Green Acres Property (representing approximately $549,993 in underwritten base rent) and has an original commencement date of August 19, 1986 and a lease expiration date of August 18, 2026. Macy’s Men’s and Furniture occupies 123,827 sq. ft. of the Green Acres Property (representing approximately $475,000 in underwritten base rent) under a lease that has an original commencement date of July 1, 2004 and a lease expiration date of July 31, 2034.
Walmart (173,450 sq. ft.; 8.3% of NRA, 6.3% of underwritten base rent, Moody’s/S&P/Fitch: Aa2/AA/AA): Founded in 1962 and headquartered in Bentonville, Arkansas, Walmart is an international supermarket chain operating approximately 10,500 stores under 46 different banners in 24 countries. Walmart employs approximately 2.3 million people worldwide. Walmart has been a tenant at the Walmart Parcel since 2003 under a lease (representing approximately $3,463,189 in underwritten base rent) expiring on August 31, 2028. Walmart has two 5-year extension options remaining. Walmart is also temporarily occupying certain temporary space under a lease with an original commencement date of February 1, 2022 and a lease expiration date of January 31, 2023. No underwritten base rent or net rentable area is attributable to such temporary lease. Walmart owns the fee interest in the Walmart Parcel and ground leases such interest to the applicable borrower, which in turn leases the Walmart Parcel to Walmart as described above. See “Ground Lease” below.
SEARS (144,537 sq. ft.; 6.9% of NRA, 0.2% of underwritten base rent, Moody’s/S&P/Fitch: NR/NR/NR): The SEARS location at the Green Acres Property closed in April 2021. However, SEARS remains in control of its leased space and is obligated to pay full rent under the terms of the lease, which runs through October 31, 2028. Sears remains current on its rent.
| THE INFORMATION IN THIS STRUCTURAL AND COLLATERAL TERM SHEET IS NOT COMPLETE AND MAY BE AMENDED PRIOR TO THE TIME OF SALE. THIS TERM SHEET IS NOT AN OFFER TO SELL THESE SECURITIES AND IT IS NOT A SOLICITATION OF AN OFFER TO BUY THESE SECURITIES IN ANY JURISDICTION WHERE THE OFFER OR SALE IS NOT PERMITTED. | ||
| 58 | ||
2034 Green Acres Road Valley Stream, NY 11581
| Collateral Asset Summary – Loan No. 4 Green Acres | Cut-off Date Balance: Cut-off Date LTV: U/W NCF DSCR: U/W NOI Debt Yield: | $50,000,000 54.5% 2.10x 13.0% |
The following table presents certain information relating to the tenants (of which, certain tenants may have cotenancy provisions) at the Green Acres Property:
| Tenant Summary(1) | ||||||||||
Tenant | Credit Rating (Moody’s/S&P/Fitch)(2) | Net Rentable Area (Sq. Ft.) | % of Net Rentable Area | U/W Base Rent Per Sq. Ft.(3) | % of Total U/W Base Rent(3) |
Occupancy Cost(4) |
Lease Expiration | |||
| Macy’s and Macy’s Men’s and Furniture(5)(6) | Ba2/BB+/BBB- | 390,503 | 18.8 | % | $2.62 | 1.9 | % | 7.6% | Various(6) | |
| Walmart(5) | Aa2/AA/AA | 173,450 | 8.3 | $19.97 | 6.3 | NAV | 8/31/2028 | |||
| SEARS(5)(7) | NR/NR/NR | 144,537 | 6.9 | $0.86 | 0.2 | NAV | 10/31/2028 | |||
| BJ’s Wholesale Club(5)(8) | NR/BB+/NR | 127,750 | 6.1 | $30.38 | 7.1 | 5.1% | 1/31/2027 | |||
| KOHL’S(5)(7) | Ba2/BB+/BBB- | 116,392 | 5.6 | $17.61 | 3.8 | NAV | 1/31/2031 | |||
| Shopper’s World(5) | NR/NR/NR | 72,795 | 3.5 | $8.41 | 1.1 | 15.5% | 7/31/2026 | |||
| DICK’S Sporting Goods(5) | Baa3/BBB/NR | 70,714 | 3.4 | $34.65 | 4.5 | 29.4% | 1/31/2027 | |||
| Burlington(5) | NR/BB+/NR | 61,837 | 3.0 | $24.25 | 2.7 | 9.9% | 1/31/2032 | |||
| Primark(5)(9) | NR/NR/NR | 49,069 | 2.4 | $16.30 | 1.5 | NAV | 1/31/2034 | |||
| Best Buy(5) | A3/BBB+/NR | 44,400 | 2.1 | $45.81 | 3.7 | NAV | 1/31/2027 | |||
| Largest Tenants | 1,251,447 | 60.1 | % | $14.34 | 32.9 | % | ||||
| Remaining Occupied | 781,377 | 37.5 | % | $46.90 | 67.1 | % | ||||
| Total Occupied | 2,032,824 | 97.7 | % | $26.85 | 100.0 | % | ||||
| Vacant | 48,462 | 2.3 | % | |||||||
| Total | 2,081,286 | 100.0 | % | |||||||
| (1) | Based on the underwritten rent roll dated December 12, 2022. |
| (2) | In certain instances, ratings provided are those of the parent company of the entity shown, whether or not the parent company guarantees the lease. |
| (3) | % of Total U/W Base Rent and U/W Base Rent Per Sq. Ft. include contractual rent steps through February 2024. |
| (4) | Occupancy Cost is as of the trailing 12-month period ending September 30, 2022 as provided by the tenants to the borrowers or estimated based on anecdotal information provided by the tenants to the borrowers. |
| (5) | The Green Acres Property has 11 anchor and major tenants (10 of which are shown in the table above). The 11 anchor and major tenants (including 24 Hour Fitness which is not shown in the table above) represent approximately 62.1% of net rentable area and approximately 35.3% of total U/W Base Rent. |
| (6) | Macy’s Men’s and Furniture occupies 123,827 sq. ft. of the Green Acres Property (representing approximately $475,000 in underwritten base rent) under a lease that has an original commencement date of July 1, 2004 and a lease expiration date of July 31, 2034, and Macy’s occupies 266,676 sq. ft. of the Green Acres Property (representing approximately $549,993 in underwritten base rent) and has an original commencement date of August 19, 1986 and a lease expiration date of August 18, 2026. Macy’s has one eight-year and eleven-month extension option remaining. Macy’s and Macy’s Men’s & Furniture are treated as a single tenant for the purposes of the number of tenants shown at the Green Acres Property. |
| (7) | KOHL’S and SEARS have vacated the leased premises. Each tenant remains in control of the leased space and is obligated to pay full rent under the terms of their respective lease. |
| (8) | Information in this table includes recently executed lease for a 5,000 sq. ft. fueling station that has an expected rent commencement date of September 1, 2023. We cannot assure you that the tenant will begin paying rent as expected or at all. $227,767 in gap rent was reserved for BJ’s Wholesale Club at origination. |
| (9) | The Primark tenant is expected to take occupancy in May 2023. |
| THE INFORMATION IN THIS STRUCTURAL AND COLLATERAL TERM SHEET IS NOT COMPLETE AND MAY BE AMENDED PRIOR TO THE TIME OF SALE. THIS TERM SHEET IS NOT AN OFFER TO SELL THESE SECURITIES AND IT IS NOT A SOLICITATION OF AN OFFER TO BUY THESE SECURITIES IN ANY JURISDICTION WHERE THE OFFER OR SALE IS NOT PERMITTED. | ||
| 59 | ||
2034 Green Acres Road Valley Stream, NY 11581
| Collateral Asset Summary – Loan No. 4 Green Acres | Cut-off Date Balance: Cut-off Date LTV: U/W NCF DSCR: U/W NOI Debt Yield: | $50,000,000 54.5% 2.10x 13.0% |
| Lease Rollover Schedule(1)(2) | |||||||||||||
| Year | # of Leases Expiring(3)(4) | Total Expiring Sq. Ft. | % of Total Sq. Ft. Expiring | Cumulative Sq. Ft. Expiring | Cumulative % of Sq. Ft. Expiring | Annual U/W Base Rent Per Sq. Ft. (5)(6) | % U/W Base Rent Rolling(5)(6) | Cumulative % of U/W Base Rent(5)(6) | |||||
| 2023 & MTM | 25 | 132,183 | 6.4 | % | 132,183 | 6.4% | $40.71 | 9.9 | % | 9.9% | |||
| 2024 | 16 | 59,279 | 2.8 | 191,462 | 9.2% | $55.74 | 6.1 | 15.9% | |||||
| 2025 | 23 | 103,199 | 5.0 | 294,661 | 14.2% | $42.69 | 8.1 | 24.0% | |||||
| 2026 | 18 | 474,521 | 22.8 | 769,182 | 37.0% | $18.62 | 16.2 | 40.2% | |||||
| 2027 | 21 | 317,183 | 15.2 | 1,086,365 | 52.2% | $45.01 | 26.2 | 66.3% | |||||
| 2028 | 6 | 329,772 | 15.8 | 1,416,137 | 68.0% | $13.68 | 8.3 | 74.6% | |||||
| 2029 | 7 | 18,831 | 0.9 | 1,434,968 | 68.9% | $49.78 | 1.7 | 76.3% | |||||
| 2030 | 5 | 14,437 | 0.7 | 1,449,405 | 69.6% | $87.14 | 2.3 | 78.6% | |||||
| 2031 | 6 | 165,348 | 7.9 | 1,614,753 | 77.6% | $24.20 | 7.3 | 85.9% | |||||
| 2032 | 3 | 94,565 | 4.5 | 1,709,318 | 82.1% | $24.37 | 4.2 | 90.2% | |||||
| 2033 | 3 | 24,165 | 1.2 | 1,733,483 | 83.3% | $21.05 | 0.9 | 91.1% | |||||
| 2034 & Thereafter | 7 | 264,497 | 12.7 | 1,997,980 | 96.0% | $16.66 | 8.1 | 99.2% | |||||
| Storage / Other(4) | 98 | 34,844 | 1.7 | 2,032,824 | 97.7% | $13.07 | 0.8 | 100.0% | |||||
| Vacant | NAP | 48,462 | 2.3 | 2,081,286 | 100.0% | NAP | NAP | NAP | |||||
| Total / Wtd. Avg. | 238 | 2,081,286 | 100.0 | % | $26.85 | 100.0 | % | ||||||
| (1) | Based on the underwritten rent roll dated December 12, 2022. |
| (2) | Certain leases may have termination options that are exercisable prior to the originally stated expiration date of the lease and that are not considered in this Lease Rollover Schedule. |
| (3) | Macy’s Men’s & Furniture occupies 123,827 sq. ft. of the Green Acres Property (representing approximately $475,000 in underwritten base rent) under a lease that has an original commencement date of July 1, 2004 and a lease expiration date of July 31, 2034, and Macy’s occupies 266,676 sq. ft. of the Green Acres Property (representing approximately $549,993 underwritten base rent) and has an original commencement date of August 19, 1986 and a lease expiration date of August 18, 2026. Macy’s has one eight year and eleven-month extension option remaining. |
| (4) | The number of leases shown above include two leases delivered by Macy’s and Macy’s Men’s & Furniture and 98 storage and specialty, business development, or temporary leases that are not typical tenant leases and are short term in nature. The U/W Base Rent attributable to the storage leases is $455,564 and income attributable to the specialty, business development, or temporary leases is included in Other Commercial Income. |
| (5) | Annual U/W Base Rent Per Sq. Ft., % U/W Base Rent Rolling and Cumulative % of U/W Base Rent include contractual rent steps through February 2024 and percent in lieu revenue for Charlotte Russe, Famous Footwear, Forever 21 and H&M. |
| (6) | KOHL’S and SEARS have vacated the leased premises. Each tenant remains in control of the leased space and is obligated to pay full rent under the terms of their respective lease. |
Environmental Matters. The Phase I environmental assessment at the Green Acres Property dated December 20, 2022 identified six recognized environmental conditions related to the following: (i) historical auto repair operations and an associated oil/water separator used at the Green Acres Property and reportedly removed, but for which no closure documentation is available, (ii) free product observed in a monitoring well at an adjacent property, (iii) three cases of petroleum impacts to soil and groundwater at adjacent properties, and (iv) a vapor migration concern identified in connection with the Green Acres Property’s long-term historic use of hazardous chemicals. See “Preliminary Prospectus—Description of the Mortgage Pool—Environmental Considerations” in the Preliminary Prospectus.
The Market. The Green Acres Property is located in Valley Stream, New York, within the Nassau-Suffolk metropolitan division (the “Nassau-Suffolk MSA”). Main economic sectors within the Nassau-Suffolk MSA include the education and health services, transportation and utilities, trade and government sectors. The Nassau-Suffolk MSA’s largest employers include Northwell Health, Inc., Catholic Health System of Long Island, Inc., the County of Nassau, the United States Federal Government and the County of Suffolk.
The Green Acres Property is located in a densely populated commercial area on the border of Queens, New York along the major arterial Sunrise Highway, and approximately 5 miles from John F. Kennedy airport. The local area is comprised of retail and commercial buildings to the north, south and east, with industrial uses located to the west. Outside of local commercial districts, the area is developed with multifamily residential uses. The local area is accessed by Sunrise Highway, the Belt Parkway, and the Cross Island Parkway, all of which are arterials leading east to west. The Long Island Railroad has two stations within walking distance: the Rosedale and Valley Stream stations, which can be reached via the Jamaica, Far Rockaway, Long Beach, West Hempstead, and Babylon branches. According to the appraisal, approximately 60,000 cars pass the Green Acres Property daily.
According to the appraisal, the trade area for a retail center is between 5.0-25.0 miles in radius and consists of its top competitors, of which the primary trade area makes up between 55.0-65.0% of its sales and the secondary trade area makes up between 20.0-25.0%. According to the appraisal, the 2021 population in the primary-, secondary- and total trade area of the Green Acres Property was 438,195, 480,549 and 918,745, respectively. Additionally, for the same period, the average household income within the same areas was $108,258, $104,108 and $106,034, respectively.
According to the appraisal, the Green Acres Property is located within the Long Island retail market and the Hempstead retail submarket. As of the second quarter of 2022, the Long Island retail market contained approximately 24.1 million sq. ft. of retail space inventory with a vacancy rate of 8.6% and an average asking rental rate of $28.70 per sq. ft. The Hempstead retail submarket contained approximately 4.8 million sq. ft. of retail space with a vacancy rate of 6.2% and an average asking rental rate of $32.43 per sq. ft. as of the second quarter of 2022.
| THE INFORMATION IN THIS STRUCTURAL AND COLLATERAL TERM SHEET IS NOT COMPLETE AND MAY BE AMENDED PRIOR TO THE TIME OF SALE. THIS TERM SHEET IS NOT AN OFFER TO SELL THESE SECURITIES AND IT IS NOT A SOLICITATION OF AN OFFER TO BUY THESE SECURITIES IN ANY JURISDICTION WHERE THE OFFER OR SALE IS NOT PERMITTED. | ||
| 60 | ||
2034 Green Acres Road Valley Stream, NY 11581
| Collateral Asset Summary – Loan No. 4 Green Acres | Cut-off Date Balance: Cut-off Date LTV: U/W NCF DSCR: U/W NOI Debt Yield: | $50,000,000 54.5% 2.10x 13.0% |
The following table presents certain information relating to comparable retail centers for the Green Acres Property:
| Comparable Anchor Retail Leases(1) | ||||||
| Property Name | Year Built / Renovated or Expanded | Total NRA (Sq. Ft.) | Total Occupancy | Distance to Subject | Sales Per Sq. Ft. | Anchor Tenants |
Green Acres 2034 Green Acres Road Valley Stream, NY | 1956, 2016 / 1982, 2006, 2007 | 2,081,286(2) | 97.7% | NAP | $727.00(2) | Macy’s Walmart Dick’s Sporting Goods BJ’s Wholesale Club Primark 24 Hour Fitness Burlington Best Buy Shopper’s World Target (non-collateral) Home Depot (non-collateral) |
Roosevelt Field Mall 630 Old Country Road Garden City, NY | 1956 / 1993, 1997 | 2,372,053 | 98.0% | 7.7 miles | $1,165.00 | Bloomingdale’s Bloomingdale’s Furniture Dick’s Sporting Goods JC Penney Macy’s Neiman Marcus Nordstrom Primark |
Queens Center Mall(3) 90-15 Queens Boulevard Queens, NY | 1973 / 2004 | 962,798 | 98.0% | 9.1 miles | $1,721.00 | H&M J.C. Penney Macy’s XXI Forever |
Kings Plaza Shopping Center(3) 5100 Kings Plaza Brooklyn, NY | 1969 / 2000 | 1,212,000 | 99.0% | 11.1 miles | $804.00 | Best Buy Burlington H&M Lowe’s Macy’s Primark Target XXI Forever Zara |
Broadway Commons 358 Broadway Mall Hicksville, NY | 1956 / 1995, 1999 | 1,234,450 | 89.0% | 12.4 miles | $436.00 | H&M IKEA Round One Target Showcase |
| (1) | Source: Appraisal, unless stated otherwise. |
| (2) | Represents sales per sq. ft. as of September 30, 2022. Sales per sq. ft. inclusive of tenants that have been open for 12 months or more and excludes tenants >10,000 sq. ft., arcades and non-retail stores. |
| (3) | The Queens Center Mall and Kings Plaza Shopping Center properties are both owned by the borrower sponsor of the Green Acres Whole Loan. |
| THE INFORMATION IN THIS STRUCTURAL AND COLLATERAL TERM SHEET IS NOT COMPLETE AND MAY BE AMENDED PRIOR TO THE TIME OF SALE. THIS TERM SHEET IS NOT AN OFFER TO SELL THESE SECURITIES AND IT IS NOT A SOLICITATION OF AN OFFER TO BUY THESE SECURITIES IN ANY JURISDICTION WHERE THE OFFER OR SALE IS NOT PERMITTED. | ||
| 61 | ||
2034 Green Acres Road Valley Stream, NY 11581
| Collateral Asset Summary – Loan No. 4 Green Acres | Cut-off Date Balance: Cut-off Date LTV: U/W NCF DSCR: U/W NOI Debt Yield: | $50,000,000 54.5% 2.10x 13.0% |
Cash Flow Analysis.
| Cash Flow Analysis | ||||||
| 2019 | 2020 | 2021 | T-12 9/30/2022(1) | U/W(1) | U/W Per Sq. Ft. | |
| Rents in Place(2) | $54,088,539 | $49,202,740 | $49,588,493 | $49,664,599 | $54,583,783 | $26.23 |
| Vacant Income(3) | 0 | 0 | 0 | 0 | 3,360,780 | 1.61 |
| Gross Potential Rent | $54,088,539 | $49,202,740 | $49,588,493 | $49,664,599 | $57,944,563 | $27.84 |
| Other Commercial Income(4) | 3,268,004 | 2,784,950 | 3,769,123 | 4,016,903 | 4,039,298 | 1.94 |
| Total Reimbursements | 22,054,115 | 21,108,945 | 22,240,864 | 23,011,578 | 25,461,533 | 12.23 |
| U/W Adjustments | 0 | 0 | 0 | 0 | 339,465 | 0.16 |
| Other Revenue(5) | 769,425 | 102,602 | 95,907 | 180,781 | 23,686 | 0.01 |
| Net Rental Income | $80,180,083 | $73,199,237 | $75,694,387 | $76,873,861 | $87,808,544 | $42.19 |
| Vacancy/Credit Loss(6) | (233,163) | (4,190,515) | 1,209,488 | 112,688 | (4,293,661) | (2.06) |
| Effective Gross Income | $79,946,920 | $69,008,722 | $76,903,875 | $76,986,549 | $83,514,884 | $40.13 |
| Total Expenses(7) | 26,632,410 | 28,007,136 | 30,285,085 | 31,812,161 | 35,580,356 | 17.10 |
| Net Operating Income | $53,314,510 | $41,001,586 | $46,618,790 | $45,174,388 | $47,934,528 | $23.03 |
| Capital Expenditures | 0 | 0 | 0 | 0 | 455,855 | 0.22 |
| TI/LC | 0 | 0 | 0 | 0 | 1,113,906 | 0.54 |
| Net Cash Flow(8) | $53,314,510 | $41,001,586 | $46,618,790 | $45,174,388 | $46,364,767 | $22.28 |
| (1) | Underwritten Rents in Place are higher than T-12 9/30/2022 rents due to the inclusion of rent steps underwritten to the maximum increase per the tenants’ contractual lease terms. Contractual rent steps are through February 2024. |
| (2) | Based on the underwritten rent roll dated December 12, 2022. |
| (3) | Vacant Income reflects the gross up of vacancy at average in-place rents. |
| (4) | Other Commercial Income includes overage / percentage rent, kiosk revenue, temporary revenue, specialty revenue and business development income. |
| (5) | Other Revenue reflects the borrowers’ in-place miscellaneous income. |
| (6) | The underwritten economic occupancy is 96.2%. The Green Acres Property was 97.7% leased based on the December 12, 2022 rent roll, including leases executed by the origination date of January 3, 2023. |
| (7) | The management fee is underwritten to reflect 3.0% of Effective Gross Income. Real estate taxes were underwritten based on the actual tax bills for all of the property tax parcels at the Green Acres Property (including the Walmart Parcel), inclusive of any tax reimbursements or expenses payable by the tenants and payment-in-lieu of taxes (“PILOT”) payable by the borrowers for 2022 under the related PILOT documents that are scheduled to expire on December 31, 2026, with one five-year extension period that requires Hempstead IDA (as defined below) approval. According to the appraisal, the tax benefits for 2023 under the PILOT documents are expected to be $15,365,892, and if the PILOT documents are not renewed in 2027, the total amount of real estate taxes payable by the borrowers is expected to increase by approximately $17.1 million in 2027. See “Payment in Lieu of Taxes” below. |
| (8) | The historical financial statements for years 2019-2022 do not include the borrowers’ actual income and expense for the following: lease termination income, bankruptcy settlements, GAAP adjustments for non-cash items, including the straight lining of rents, mark to market rent adjustments under SFAS 141, tenant interest and penalties, bad debt reserves and capitalized development costs (taxes, insurance, interest). Historical capital expenditures and leasing capital which includes tenant allowances, the borrowers’ construction cost for build-out of tenant spaces and leasing commissions, are also excluded. |
Property Management. The Green Acres Property is managed by Macerich Property Management Company, LLC, an affiliate of the borrower sponsor.
Lockbox / Cash Management. The Green Acres Whole Loan is structured with a hard lockbox and springing cash management. The borrowers and property manager are required to direct the tenants to pay rent directly into the lockbox account, and to deposit any rents otherwise received in such account within three business days after receipt. During the continuance of a Trigger Period (as defined below), all funds in the lockbox account are required to be swept on a weekly basis and on the second business day before each payment date to a lender-controlled cash management account. Funds in the cash management account are required to be applied to debt service and the reserves and escrows described below, with any excess funds (i) to be deposited into the TI/LC Reserve, if the Trigger Period is caused by a Tenant Trigger Event (as defined below), or into an excess cash flow reserve account held by the lender as cash collateral for the Green Acres Whole Loan, if the Trigger Period is not solely caused by a Tenant Trigger Event, or if (ii) no Trigger Period is continuing, disbursed to borrowers.
A “Trigger Period” means the period commencing upon the occurrence of (i) an event of default, (ii) a Low Debt Service Period (as defined below), or (iii) a Tenant Trigger Event. A Trigger Period will end (a) with respect to the matters described in clause (i) above, if the event of default has been waived by the lender, (b) with respect to the matters described in clause (ii) above, if a cure of the Low Debt Service Period occurs or the borrowers deliver additional collateral causing the debt service coverage ratio to equal 1.55x, or (c) with respect to matters described in clause (iii) above, a cure of the Tenant Trigger Event occurs.
A “Low Debt Service Period” will commence on any calculation date when the Green Acres Whole Loan debt service coverage ratio is less than 1.50x and end when the Green Acres Whole Loan debt service coverage ratio is at least 1.55x for two consecutive calendar quarters.
| THE INFORMATION IN THIS STRUCTURAL AND COLLATERAL TERM SHEET IS NOT COMPLETE AND MAY BE AMENDED PRIOR TO THE TIME OF SALE. THIS TERM SHEET IS NOT AN OFFER TO SELL THESE SECURITIES AND IT IS NOT A SOLICITATION OF AN OFFER TO BUY THESE SECURITIES IN ANY JURISDICTION WHERE THE OFFER OR SALE IS NOT PERMITTED. | ||
| 62 | ||
2034 Green Acres Road Valley Stream, NY 11581
| Collateral Asset Summary – Loan No. 4 Green Acres | Cut-off Date Balance: Cut-off Date LTV: U/W NCF DSCR: U/W NOI Debt Yield: | $50,000,000 54.5% 2.10x 13.0% |
A “Tenant Trigger Event” will occur if (i) two or more of BJ’s Wholesale Club, Dick’s Sporting Goods and Best Buy are subject to any Tenant Trigger Condition (as defined below), and/or (ii) Walmart is subject to any Tenant Trigger Condition. For purposes of determining whether a Tenant Trigger Event has occurred, (i) a tenant has not “gone dark”, where the subject tenant has ceased business in the subject space but has subleased all or a material portion of its premises to another operator that does not operate the premises for certain prohibited uses, (ii) pronouncements, press releases and similar “corporate statements” by a tenant of its intention with respect to operations at a particular store will not constitute a basis for asserting that a Tenant Trigger Event has occurred, and (iii) a change in use, the days or hours of operation, or the configuration of its store by a tenant will not, in and of itself, constitute “going dark” or ceasing to operate.
A “Tenant Trigger Condition” is if any applicable tenant (i) does not maintain an investment grade rating and “goes dark” for a period in excess of 120 consecutive days (excluding temporary vacancies for the purpose of repair, restoration or permitted alteration), (ii) provides written notice of its intent to not renew its lease, or (iii) does not provide notice of renewal prior to the required date.
Initial and Ongoing Reserves. At origination, the borrowers were required to deposit into escrow (i) $4,068,135 for a reserve (the “TI/LC Reserve”) with respect to outstanding tenant improvement allowances and leasing commissions identified in a schedule to the related loan agreement and (ii) approximately $743,644 for a gap rent reserve (of which $227,767 is earmarked for the fourth largest tenant, BJ’s Wholesale Club).
Tax Escrows – During the continuance of a Trigger Period, or if the borrowers fail to deliver evidence taxes have been timely paid, the borrowers are required to escrow 1/12th of the annual estimated tax payments and, without duplication, PILOT payments on a monthly basis.
Insurance Escrows – During the continuance of a Trigger Period, the borrowers are required to escrow 1/12th of the annual estimated insurance payments on a monthly basis, except if the Green Acres Property is insured under a blanket policy meeting the requirements set forth in the related loan agreement (in which case, no insurance escrows will be required, notwithstanding the occurrence of a Trigger Period).
Replacement Reserves – During the continuance of a Trigger Period, the borrowers are required to escrow an amount equal to the gross leasable area (excluding the Non-Collateral Square Footage (as defined below), any other tenant that is required to pay for all repairs and maintenance costs for its entire leased premises, roof and structural components, and the following tenants: (i) Advantage Toyota, (ii) Aldi, (iii) BJ’s Restaurant, (iv) BJ’s Wholesale Club, (v) Buffalo Wild Wings, (vi) Capital One, (vii) Citizen’s Bank, (viii) Hook & Reel, (ix) Olive Garden, (x) Red Lobster, (xi) SEARS, (xii) Sonic Drive-In, (xiii) South Shore Hyundai, (xiv) Vitamin Shoppe, (xv) Macy’s and (xvi) Walmart) multiplied by $0.25 and divided by 12 months. The monthly replacement reserve amount is estimated to be approximately $25,833. The borrowers are permitted to cease monthly deposits when the replacement reserve balance is equal to the sum of 24 monthly deposits, currently estimated to be $619,992. The tenants listed in clause (i) through (xvi) above collectively represent 40.4% of the NRA and 24.5% of U/W Base Rent.
Rollover Reserve – During the continuance of a Trigger Period, the borrowers are required to escrow an amount equal to the gross leasable area (excluding the Non-Collateral Square Footage and, to the extent not causing or contributing to the cause of the applicable Trigger Period (including by way of paying reduced rent), Macy’s, Macy’s Men’s & Furniture, Burlington, BJ’s Wholesale, Primark, Walmart, Kohl’s, Dick’s and Best Buy) multiplied by $1.00 and divided by 12 months. The monthly rollover reserve amount is estimated to be approximately $87,264. The borrowers are not required to make any monthly deposits when the rollover reserve balance is equal to the sum of 24 monthly deposits, currently estimated to be $2,094,342. The borrowers’ upfront deposit of approximately $743,644 with respect to gap rent is not included in the calculation of the rollover reserve balance for purposes of calculating the rollover reserve cap.
TI/LC Reserve– On each monthly payment date during the continuance of a Tenant Trigger Event, all excess cash flow after payment of debt service, operating expenses and other required escrows is required to be deposited in the TI/LC reserve until the amount in the reserve is equal to 12 months of the base rent payable under any applicable leases causing such Tenant Trigger Event. The borrowers have the right to deliver a letter of credit meeting the requirements of the Green Acres Whole Loan documents in lieu of depositing funds into the TI/LC Reserve.
“Non-Collateral Square Footage” means the square footage occupied by Target and Home Depot.
Current Mezzanine or Subordinate Indebtedness. None.
Future Mezzanine or Subordinate Indebtedness Permitted. None. However, the borrowers are permitted to obtain property assessed clean energy (PACE) or similar loans in an aggregate amount up to $10 million without the consent of the lender.
| THE INFORMATION IN THIS STRUCTURAL AND COLLATERAL TERM SHEET IS NOT COMPLETE AND MAY BE AMENDED PRIOR TO THE TIME OF SALE. THIS TERM SHEET IS NOT AN OFFER TO SELL THESE SECURITIES AND IT IS NOT A SOLICITATION OF AN OFFER TO BUY THESE SECURITIES IN ANY JURISDICTION WHERE THE OFFER OR SALE IS NOT PERMITTED. | ||
| 63 | ||
2034 Green Acres Road Valley Stream, NY 11581
| Collateral Asset Summary – Loan No. 4 Green Acres | Cut-off Date Balance: Cut-off Date LTV: U/W NCF DSCR: U/W NOI Debt Yield: | $50,000,000 54.5% 2.10x 13.0% |
Partial Release. The borrowers may obtain a release of one or more Release Parcels (as defined below), subject to satisfaction of certain conditions including, but not limited to, (i) no event of default has occurred and is continuing, (ii) regardless of whether such release of the Release Parcel is successfully consummated, the borrowers pay to the lender a processing fee in the amount of $15,000, (iii) the remaining property constitutes a separate tax lot (or the borrowers have filed an application for a separate tax lot and the borrower sponsor guarantees the payment of taxes on the Release Parcel pending the final issuance of such separate tax lot), (iv) the borrowers certify to the lender that the remaining property with all easements appurtenant and other permitted encumbrances thereto will not, strictly as a result of such transfer, be in violation of certain reciprocal easement agreements, the Walmart Ground Lease (as defined below), the PILOT leases or any then applicable law, statute, rule or regulation and (v) satisfaction of any REMIC release conditions.
A ”Release Parcel” is a parcel on the Green Acres Property that is (a) non-income producing and unimproved for tenant occupancy and (b) the release of which does not have any adverse material effect.
Ground Lease. The fee interest in the Walmart Parcel is owned by Walmart, an anchor tenant at the Walmart Parcel. Valley Stream Green Acres LLC (“Valley Stream”), a borrower, owns the leasehold interest in the Walmart Parcel pursuant to a 36-year ground lease, dated as of February 22, 1989 (the “Walmart Ground Lease”), between Walmart, as ground lessor, and Valley Stream, as ground lessee. Valley Stream leased the Walmart Parcel back to Walmart. The term of the Walmart Ground Lease commenced on August 13, 1990 and expires August 12, 2026, with two additional six-year extension options. According to the estoppel delivered by Walmart (the “Ground Lease Estoppel”) and Valley Stream, the base rent under the Walmart Ground Lease is a fixed amount equal to $1,080,000 per annum ($90,000 per month) during the initial term of the Walmart Ground Lease as determined in accordance with the terms of the Walmart Ground Lease and $1,500,000 per annum ($125,000 per month) during the extension terms. In addition, Valley Stream is required to return to Walmart a certain amount of any percentage rents paid by Walmart under the space lease as part of the percentage ground lease rent. The Walmart Ground Lease contains standard leasehold mortgagee protections including notice and cure rights and the right to enter into a new ground lease in the event of termination of the Walmart Ground Lease (including rejection of the Walmart Ground Lease in bankruptcy). Pursuant to the Ground Lease Estoppel, Walmart agreed not to amend or modify the ground lease without the lender’s consent.
Payment in Lieu of Taxes. Both Green Acres (excluding the Walmart Parcel) and Green Acres Commons benefit from 10-year tax abatements pursuant to respective payment-in-lieu of taxes agreements dated May 1, 2015 (the “PILOT Agreements”), between the borrowers and the Town of Hempstead Industrial Development Agency (the “Hempstead IDA”), which expire on December 31, 2026, with one five-year extension period that requires Hempstead IDA approval. In connection with the PILOT Agreements, the borrowers lease portions of the Green Acres Property (excluding the Walmart Parcel) to the Hempstead IDA pursuant to the master leases, and the Hempstead IDA subleases such portions of the Green Acres Property (excluding the Walmart Parcel) back to the borrowers. Such leases will be terminated upon the termination of the PILOT Agreements. Pursuant to the terms of the PILOT Agreements and the related leases, the borrowers are obligated to, among other things, (i) comply with certain full-time employment commitments and (ii) in exchange for certain exemptions from property taxes on real and personal property, make annual payment-in-lieu of taxes payments for the 2016 through the 2026 tax years. A failure of the borrowers to comply with the PILOT Agreements may result in an early termination of the PILOT Agreements or a return of certain tax benefits received by the borrowers to the Hempstead IDA. Total annual payment-in-lieu of taxes payments payable by the borrowers commenced at $14,140,000 and increased to $15,400,000 during the fourth and fifth tax abatement years, and are equal to $16,300,000 during the second five tax abatement years. According to the appraisal, the borrowers are expected to receive a tax benefit of approximately $15,365,892 in total under the PILOT Agreements in 2023 assuming that the borrowers comply with the terms of the PILOT Agreements and the leases. Taxes were underwritten to the 2022 actual tax bills for the Green Acres Property, inclusive of the annual payment-in-lieu of taxes payments for 2022. According to the appraisal, if the PILOT documents are not renewed in 2027, the total amount of real estate taxes payable by the borrowers is expected to increase by approximately $17.1 million in 2027.
| THE INFORMATION IN THIS STRUCTURAL AND COLLATERAL TERM SHEET IS NOT COMPLETE AND MAY BE AMENDED PRIOR TO THE TIME OF SALE. THIS TERM SHEET IS NOT AN OFFER TO SELL THESE SECURITIES AND IT IS NOT A SOLICITATION OF AN OFFER TO BUY THESE SECURITIES IN ANY JURISDICTION WHERE THE OFFER OR SALE IS NOT PERMITTED. | ||
| 64 | ||
4000 Baldwin Road Auburn Hills, MI 48326
| Collateral Asset Summary – Loan No. 5 Great Lakes Crossing Outlets | Cut-off Date Balance: Cut-off Date LTV: U/W NCF DSCR: U/W NOI Debt Yield: | $50,000,000 45.0% 2.50x 17.5% |
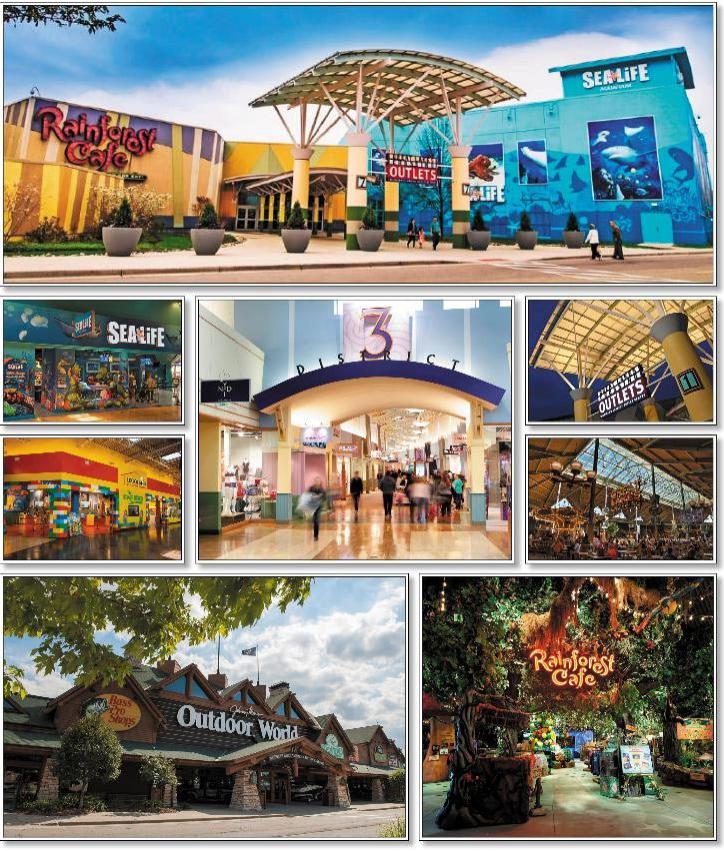
| THE INFORMATION IN THIS STRUCTURAL AND COLLATERAL TERM SHEET IS NOT COMPLETE AND MAY BE AMENDED PRIOR TO THE TIME OF SALE. THIS TERM SHEET IS NOT AN OFFER TO SELL THESE SECURITIES AND IT IS NOT A SOLICITATION OF AN OFFER TO BUY THESE SECURITIES IN ANY JURISDICTION WHERE THE OFFER OR SALE IS NOT PERMITTED. | ||
| 65 | ||
4000 Baldwin Road Auburn Hills, MI 48326
| Collateral Asset Summary – Loan No. 5 Great Lakes Crossing Outlets | Cut-off Date Balance: Cut-off Date LTV: U/W NCF DSCR: U/W NOI Debt Yield: | $50,000,000 45.0% 2.50x 17.5% |
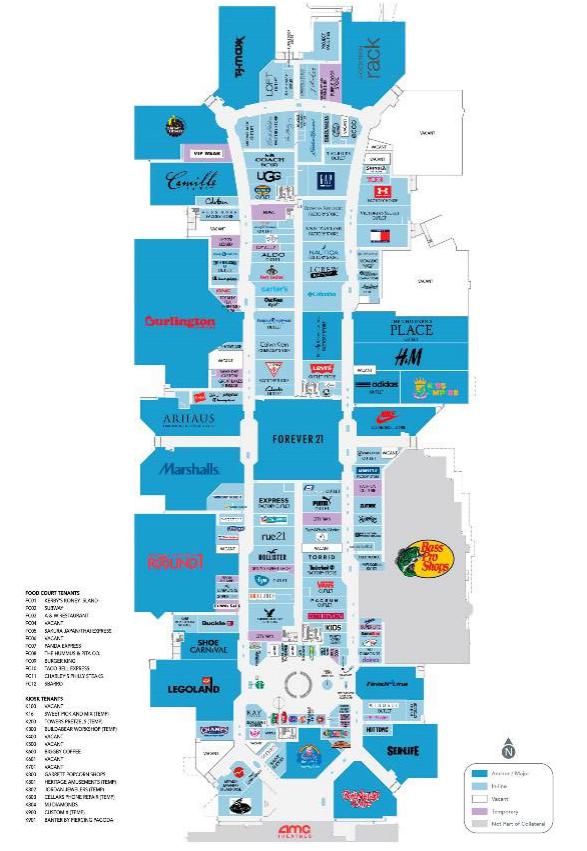
| THE INFORMATION IN THIS STRUCTURAL AND COLLATERAL TERM SHEET IS NOT COMPLETE AND MAY BE AMENDED PRIOR TO THE TIME OF SALE. THIS TERM SHEET IS NOT AN OFFER TO SELL THESE SECURITIES AND IT IS NOT A SOLICITATION OF AN OFFER TO BUY THESE SECURITIES IN ANY JURISDICTION WHERE THE OFFER OR SALE IS NOT PERMITTED. | ||
| 66 | ||
4000 Baldwin Road Auburn Hills, MI 48326
| Collateral Asset Summary – Loan No. 5 Great Lakes Crossing Outlets | Cut-off Date Balance: Cut-off Date LTV: U/W NCF DSCR: U/W NOI Debt Yield: | $50,000,000 45.0% 2.50x 17.5% |

| THE INFORMATION IN THIS STRUCTURAL AND COLLATERAL TERM SHEET IS NOT COMPLETE AND MAY BE AMENDED PRIOR TO THE TIME OF SALE. THIS TERM SHEET IS NOT AN OFFER TO SELL THESE SECURITIES AND IT IS NOT A SOLICITATION OF AN OFFER TO BUY THESE SECURITIES IN ANY JURISDICTION WHERE THE OFFER OR SALE IS NOT PERMITTED. | ||
| 67 | ||
4000 Baldwin Road Auburn Hills, MI 48326
| Collateral Asset Summary – Loan No. 5 Great Lakes Crossing Outlets | Cut-off Date Balance: Cut-off Date LTV: U/W NCF DSCR: U/W NOI Debt Yield: | $50,000,000 45.0% 2.50x 17.5% |
| Mortgage Loan Information | |
| Loan Sellers: | GSMC, GACC |
| Loan Purpose: | Refinance |
Credit Assessment (Fitch/KBRA/Moody’s)(6): | NR / BBB-(sf) / Baa1(sf) |
Borrower Sponsor:
| The Taubman Realty Group LLC |
| Borrower: | Taubman Auburn Hills Associates Limited Partnership |
| Original Balance(1): | $50,000,000 |
| Cut-off Date Balance(1): | $50,000,000 |
| % by Initial UPB: | 7.6% |
| Interest Rate: | 6.52100% |
| Payment Date: | 1st of each month |
| First Payment Date: | March 1, 2023 |
| Maturity Date: | February 1, 2033 |
| Amortization: | Interest Only |
| Additional Debt(1): | $130,000,000 Pari Passu Debt |
| Call Protection(2): | L(26),D(88),O(6) |
| Lockbox / Cash Management: | Hard / Springing |
| Reserves(3) | |||
| Initial | Monthly | Cap | |
| Taxes: | $0 | Springing | N/A |
| Insurance: | $0 | Springing | N/A |
| Replacement Reserves: | $0 | Springing | $519,033 |
| TI/LC: | $0 | $94,028 | $2,256,664 |
| Other(4): | $1,805,623 | $0 | N/A |
| Property Information | |
| Single Asset / Portfolio: | Single Asset |
| Property Type: | Retail – Outlet Center |
| Collateral: | Fee |
| Location: | Auburn Hills, MI |
| Year Built / Renovated: | 1998 / 2010 |
| Total Sq. Ft.: | 1,128,332 |
| Property Management: | The Taubman Company LLC |
| Underwritten NOI: | $31,561,767 |
| Underwritten NCF: | $29,734,689 |
| Appraised Value: | $400,000,000 |
| Appraisal Date: | November 10, 2022 |
| Historical NOI | |
| Most Recent NOI: | $31,655,635 (T-12 November 30, 2022) |
| 2021 NOI: | $32,911,337 (December 31, 2021) |
| 2020 NOI: | $27,851,384 (December 31, 2020) |
| 2019 NOI: | $34,244,744 (December 31, 2019) |
| Historical Occupancy(5) | |
| Most Recent Occupancy: | 89.6% (November 30, 2022) |
| 2021 Occupancy: | 91.9% (December 31, 2021) |
| 2020 Occupancy: | 91.0% (December 31, 2020) |
| 2019 Occupancy: | 92.9% (December 31, 2019) |
| Financial Information(1) | ||||||
| Tranche | Cut-off Date Balance | Balance per Sq. Ft. Cut-off / Balloon | LTV Cut-off / Balloon | U/W DSCR NOI / NCF | U/W Debt Yield NOI / NCF | U/W Debt Yield at Balloon NOI / NCF |
| Mortgage Loan | $50,000,000 | |||||
| Pari Passu Notes | 130,000,000 | |||||
| Whole Loan | $180,000,000 | $160 / $160 | 45.0% / 45.0% | 2.65x / 2.50x | 17.5% / 16.5% | 17.5% / 16.5% |
| (1) | The Great Lakes Crossing Outlets Mortgage Loan (as defined below) is part of the Great Lakes Crossing Outlets Whole Loan (as defined below) evidenced by 11 pari passu notes with an aggregate original principal balance of $180,000,000. Financial Information in the chart above reflects the Cut-off Date Balance of the Great Lakes Crossing Outlets Whole Loan. See “The Loan” herein. |
| (2) | The defeasance lockout period will be at least 26 payments beginning with and including the first payment date of March 1, 2023. The borrower sponsor has the option to defease the entire $180.0 million Great Lakes Crossing Outlets Whole Loan in whole (and not in part) after the earlier to occur of (i) two years after the closing date of the securitization that includes the last note to be securitized and (ii) March 1, 2026. The assumed defeasance lockout period of 26 months is based on the expected closing date of the Benchmark 2023-B38 securitization in April 2023. The actual lockout period may be longer. Prepayment in whole, but not in part, of the Great Lakes Crossing Outlets Whole Loan is permitted after August 1, 2032 without the payment of a yield maintenance premium. |
| (3) | See “Initial and Ongoing Reserves” herein. |
| (4) | Other reserves include the Initial Outstanding TI/LC reserve (approximately $1,581,204) and the initial Gap Rent Reserve (approximately $224,418). |
| (5) | Occupancy includes all tenants in place and tenants with signed leases as of the reporting period. Occupancy excludes non-collateral tenants. |
| (6) | KBRA and Moody’s provided the listed assessments for the Great Lakes Crossing Outlets Mortgage Loan in the context of its inclusion in the mortgage pool. |
The Loan. The mortgage loan (the “Great Lakes Crossing Outlets Mortgage Loan”) is part of a whole loan consisting of 11 pari passu notes with an aggregate outstanding principal balance as of the Cut-off Date of $180,000,000 (the “Great Lakes Crossing Outlets Whole Loan”) secured by a first mortgage encumbering the borrower’s fee interest in a retail outlet center located in Auburn Hills, Michigan (the “Great Lakes Crossing Outlets Property”), but does not include 229,299 of sq. ft. owned by Bass Pro Shops Outdoor World (“Bass Pro Shops”) and AMC Theatre “AMC”. The Great Lakes Crossing Outlets Whole Loan was co-originated by Goldman Sachs Bank USA (“GS”), DBR Investments Co. Limited (“DBRI”) and Bank of Montreal (“BMO”) on January 5, 2023. The Great Lakes Crossing Outlets Mortgage Loan is evidenced by the controlling note A-1-1 and the non-controlling notes A-2-1-B and A-2-2, which had an original balance and have an outstanding balance as of the Cut-off Date of $27,500,000, $7,500,000 and $15,000,000 respectively.
| THE INFORMATION IN THIS STRUCTURAL AND COLLATERAL TERM SHEET IS NOT COMPLETE AND MAY BE AMENDED PRIOR TO THE TIME OF SALE. THIS TERM SHEET IS NOT AN OFFER TO SELL THESE SECURITIES AND IT IS NOT A SOLICITATION OF AN OFFER TO BUY THESE SECURITIES IN ANY JURISDICTION WHERE THE OFFER OR SALE IS NOT PERMITTED. | ||
| 68 | ||
4000 Baldwin Road Auburn Hills, MI 48326
| Collateral Asset Summary – Loan No. 5 Great Lakes Crossing Outlets | Cut-off Date Balance: Cut-off Date LTV: U/W NCF DSCR: U/W NOI Debt Yield: | $50,000,000 45.0% 2.50x 17.5% |
The Great Lakes Crossing Outlets Whole Loan has a 10-year interest only term and accrues interest at a fixed rate of 6.5210% per annum. The Great Lakes Crossing Outlets Whole Loan proceeds were used to refinance the Great Lakes Crossing Outlets Property, fund upfront reserves and pay origination costs.
The table below summarizes the promissory notes that comprise the Great Lakes Crossing Outlets Whole Loan. The relationship between the holders of the Great Lakes Crossing Outlets Whole Loan will be governed by a co-lender agreement. The Great Lakes Crossing Outlets Whole Loan will be serviced under the pooling and servicing agreement for the Benchmark 2023-B38 trust. See “Description of the Mortgage Pool—The Whole Loans— The Serviced Pari Passu Whole Loans—Great Lakes Crossing Outlets Whole Loan” and “Pooling and Servicing Agreement” in the Preliminary Prospectus.
| Whole Loan Summary | |||||
| Note | Original Balance | Cut-off Date Balance | Note Holder | Controlling Piece | |
| A-1-1(1) | $27,500,000 | $27,500,000 | Benchmark 2023-B38 | Yes | |
| A-1-2(2) | $17,500,000 | $17,500,000 | GS | No | |
| A-1-3(2) | $17,500,000 | $17,500,000 | GS | No | |
| A-1-4(2) | $17,500,000 | $17,500,000 | GS | No | |
| A-2-1-A(2) | $12,500,000 | $12,500,000 | DBRI | No | |
| A-2-1-B(1) | $7,500,000 | $7,500,000 | Benchmark 2023-B38 | No | |
| A-2-2(1) | $15,000,000 | $15,000,000 | Benchmark 2023-B38 | No | |
| A-2-3(2) | $15,000,000 | $15,000,000 | DBRI | No | |
| A-3-1 | $25,750,000 | $25,750,000 | BMO 2023-C4 | No | |
| A-3-2(2) | $14,250,000 | $14,250,000 | BMO | No | |
| A-3-3(2) | $10,000,000 | $10,000,000 | BMO | No | |
| Whole Loan | $180,000,000 | $180,000,000 | |||
| (1) | GSMC is contributing note A-1-1 with an outstanding principal balance of $27.5 million as of the Cut-off Date and GACC is contributing notes A-2-1-B and A-2-2 with an aggregate outstanding principal balance of $22.5 million as of the Cut-off Date. |
| (2) | The Notes held by the lenders are expected to be contributed to one or more future securitization transactions or may otherwise be transferred at any time. |
The proceeds of the Great Lakes Crossing Outlets Whole Loan were primarily used to refinance the Great Lakes Crossing Outlets Property, fund upfront reserves and pay closing costs.
| Sources and Uses | ||||||||
| Sources | Proceeds | % of Total | Uses | Proceeds | % of Total | |||
| Whole Loan | $180,000,000 | 99.5 | % | Loan Payoff | $177,589,210 | 98.1 | % | |
| Borrower Sponsor Equity | 962,977 | 0.5 | Upfront Reserves | 1,805,623 | 1.0 | |||
| Origination Costs | 1,568,144 | 0.9 | ||||||
| Total Sources | $180,962,977 | 100.0 | % | Total Uses | $180,962,977 | 100.0 | % | |
The Borrower and the Borrower Sponsor. The borrower is Taubman Auburn Hills Associates Limited Partnership, a Delaware limited partnership. The borrower is a single purpose bankruptcy-remote entity with two independent managers in its organizational structure. Legal counsel to the borrower delivered a non-consolidation opinion in connection with the origination of the Great Lakes Crossing Outlets Whole Loan.
The borrower sponsor and non-recourse carveout guarantor is The Taubman Realty Group LLC (“Taubman”). Founded in 1950, Taubman develops and manages regional, super-regional and outlet shopping centers. In its over 70 years of operations, Taubman has developed more than 80 million sq. ft. of retail and mixed-use projects. Including Great Lakes Crossing Outlets, Taubman owns and operates 24 regional, super-regional and outlet malls across 11 states, Puerto Rico, China, and South Korea.
Pursuant to the Great Lakes Crossing Outlets Whole Loan documents, so long as one or more of Taubman, Simon Property Group, Inc., Simon Property Group, L.P. or an affiliate of any of the foregoing is the non-recourse carveout guarantor, the non-recourse carveout guarantor’s liability is limited to 20% of the outstanding principal balance at such time, in the aggregate, plus all of the reasonable out-of-pocket costs and expenses (including court costs and reasonable attorneys’ fees) incurred by the lender in the enforcement of the related guaranty or the preservation of the lender’s rights under such guaranty.
The Property. The Great Lakes Crossing Outlets Property is a retail outlet center comprised of a single-story shopping center, totaling 1,357,631 sq. ft., of which 229,299 sq. ft. is not included in the collateral, on an approximately 163.76-acre site in Auburn Hills, Michigan. The Great Lakes Crossing Outlets Property was built in 1998 and renovated in 2010. The Great Lakes Crossing Outlets Property has a total of 7,797 parking spaces, resulting in a ratio of approximately 6.91 spaces per 1,000 sq. ft. of collateral. As of November 30, 2022,
| THE INFORMATION IN THIS STRUCTURAL AND COLLATERAL TERM SHEET IS NOT COMPLETE AND MAY BE AMENDED PRIOR TO THE TIME OF SALE. THIS TERM SHEET IS NOT AN OFFER TO SELL THESE SECURITIES AND IT IS NOT A SOLICITATION OF AN OFFER TO BUY THESE SECURITIES IN ANY JURISDICTION WHERE THE OFFER OR SALE IS NOT PERMITTED. | ||
| 69 | ||
4000 Baldwin Road Auburn Hills, MI 48326
| Collateral Asset Summary – Loan No. 5 Great Lakes Crossing Outlets | Cut-off Date Balance: Cut-off Date LTV: U/W NCF DSCR: U/W NOI Debt Yield: | $50,000,000 45.0% 2.50x 17.5% |
the Great Lakes Crossing Outlets Property was 89.6% occupied by 169 tenants. The collateral does not include 229,299 of sq. ft. owned by Bass Pro Shops Outdoor World and AMC Theatre.
The following table presents certain information relating to the tenants (of which, certain tenants may have co-tenancy provisions) at the Great Lakes Crossing Outlets Property:
| Tenant Summary(1) | ||||||||||
Tenant | Credit Rating (Moody’s/S&P/Fitch)(2) | Net Rentable Area (Sq. Ft.) | % of Net Rentable Area | U/W Rent Per Sq. Ft.(3) | % of Total U/W Rent(3)(4) |
Occupancy Cost(5) |
Lease Expiration | |||
| Burlington Coat Factory(4) | NR/BB+/NR | 81,082 | 7.2 | % | $12.67 | 2.5 | % | 9.5% | 1/31/2030 | |
| Round 1 Bowling Amusement(4) | NR/NR/NR | 59,071 | 5.2 | $22.13 | 3.2 | 17.2% | 9/30/2027 | |||
| Forever 21(4)(6) | NR/NR/NR | 47,203 | 4.2 | $14.26 | 1.6 | 12.0% | 1/31/2023 | |||
| Marshalls(4) | NR/NR/NR | 35,191 | 3.1 | $21.16 | 1.8 | NAV | 1/31/2027 | |||
| TJ Maxx(4) | A2/A/NR | 34,766 | 3.1 | $21.16 | 1.8 | NAV | 1/31/2027 | |||
| Nordstrom Rack(4) | Ba1/BB+/BBB- | 34,613 | 3.1 | $17.00 | 1.4 | NAV | 6/30/2030 | |||
| Legoland Discovery Center(4) | B2/B-/NR | 32,543 | 2.9 | $10.82 | 0.9 | 5.9% | 12/31/2031 | |||
| Planet Fitness | NR/NR/NR | 27,710 | 2.5 | $14.48 | 1.0 | NAV | 12/31/2028 | |||
| Camille La Vie | NR/NR/NR | 22,963 | 2.0 | $16.72 | 0.9 | 17.1% | 1/31/2028 | |||
| Arhaus The Loft | NR/NR/NR | 22,726 | 2.0 | $22.66 | 1.3 | 8.6% | 1/31/2030 | |||
| Largest Tenants | 397,868 | 35.3 | % | $16.91 | 16.5 | % | ||||
| Remaining Occupied | 612,876 | 54.3 | % | $55.70 | 83.5 | % | ||||
| Total Occupied | 1,010,744 | 89.6 | % | $40.43 | 100.0 | % | ||||
| Vacant | 117,588 | 10.4 | % | |||||||
| Total Collateral | 1,128,332 | 100.0 | % | |||||||
| (1) | Based on underwritten rent roll dated November 30, 2022. |
| (2) | Ratings provided are for the parent company of the entity listed in the “Tenant” field whether or not the parent company guarantees the lease. |
| (3) | U/W Rent is comprised of underwritten base rent inclusive of contractual rent steps through January 2024, percentage rent in lieu, total recoveries (excluding utilities) at step and overage rent. |
| (4) | Anchor tenants for the Great Lakes Crossing Outlets Property represent approximately 28.8% of Net Rentable Area and approximately 13.3% of Total U/W Base Rent. |
| (5) | Occupancy Cost is based on U/W Rent and sales data as of the trailing 12-month period ending October 31, 2022. |
| (6) | Forever 21’s lease expired in January 2023; however, the tenant is in occupancy and current on rent. Renewal discussions are ongoing with the borrower sponsor and if a new lease is executed, rent will be applied retroactively. We cannot assure you that the Forever 21 lease will be renewed. |
| Lease Rollover Schedule(1)(2) | ||||||||||||
| Year | # of Leases Expiring | Total Expiring Sq. Ft. | % of Total Sq. Ft. Expiring | Cumulative Sq. Ft. Expiring | Cumulative % of Sq. Ft. Expiring | Annual U/W Rent Per Sq. Ft.(3) | % U/W Rent Rolling(3) | Cumulative % of U/W Base Rent | ||||
| 2023 & MTM | 33 | 149,599 | 13.3% | 149,599 | 13.3% | $37.28 | 13.6 | % | 13.6% | |||
| 2024 | 38 | 88,679 | 7.9 | 238,278 | 21.1% | $54.67 | 11.9 | 25.5% | ||||
| 2025 | 34 | 141,288 | 12.5 | 379,566 | 33.6% | $62.07 | 21.5 | 47.0% | ||||
| 2026 | 16 | 43,108 | 3.8 | 422,674 | 37.5% | $85.03 | 9.0 | 55.9% | ||||
| 2027 | 20 | 187,481 | 16.6 | 610,155 | 54.1% | $36.82 | 16.9 | 72.8% | ||||
| 2028 | 14 | 124,499 | 11.0 | 734,654 | 65.1% | $33.58 | 10.2 | 83.1% | ||||
| 2029 | 8 | 34,775 | 3.1 | 769,429 | 68.2% | $39.60 | 3.4 | 86.4% | ||||
| 2030 | 9 | 183,219 | 16.2 | 952,648 | 84.4% | $21.20 | 9.5 | 95.9% | ||||
| 2031 | 3 | 38,939 | 3.5 | 991,587 | 87.9% | $21.94 | 2.1 | 98.0% | ||||
| 2032 | 4 | 3,576 | 0.3 | 995,163 | 88.2% | $124.79 | 1.1 | 99.1% | ||||
| 2033 | 1 | 15,581 | 1.4 | 1,010,744 | 89.6% | $23.00 | 0.9 | 100.0% | ||||
| 2034 & Thereafter | 0 | 0 | 0.0 | 1,010,744 | 89.6% | $0.00 | 0.0 | 100.0% | ||||
| Vacant | NAP | 117,588 | 10.4 | 1,128,332 | 100.0% | NAP | NAP | NAP | ||||
| Total / Wtd. Avg. | 180 | 1,128,332 | 100.0% | $40.43 | 100.0 | % | ||||||
| (1) | Based on the underwritten rent roll dated November 30, 2022. |
| (2) | Certain leases may have termination options that are exercisable prior to the originally stated expiration date of the lease and that are not considered in this Lease Rollover Schedule. |
| (3) | U/W Rent is comprised of underwritten base rent inclusive of contractual rent steps through January 2024, percentage rent in lieu, total recoveries (excluding utilities) at step and overage rent. |
| THE INFORMATION IN THIS STRUCTURAL AND COLLATERAL TERM SHEET IS NOT COMPLETE AND MAY BE AMENDED PRIOR TO THE TIME OF SALE. THIS TERM SHEET IS NOT AN OFFER TO SELL THESE SECURITIES AND IT IS NOT A SOLICITATION OF AN OFFER TO BUY THESE SECURITIES IN ANY JURISDICTION WHERE THE OFFER OR SALE IS NOT PERMITTED. | ||
| 70 | ||
4000 Baldwin Road Auburn Hills, MI 48326
| Collateral Asset Summary – Loan No. 5 Great Lakes Crossing Outlets | Cut-off Date Balance: Cut-off Date LTV: U/W NCF DSCR: U/W NOI Debt Yield: | $50,000,000 45.0% 2.50x 17.5% |
Major Tenants. Burlington Coat Factory, (81,082 sq. ft.; 7.2% of NRA; 2.5% of U/W base Rent) is owned by Burlington Stores, Inc. (“Burlington”), a nationally recognized off-price retailer headquartered in New Jersey. As of the fiscal year ending in 2022, Burlington operates 927 stores in 46 states and Puerto Rico. The firm is a Fortune 500 company and its common stock trades on the New York Stock Exchange under the ticker symbol “BURL”. Burlington’s stores offer an extensive selection of in-season, fashion-focused merchandise at up to 60% off other retailers’ prices, including women’s ready-to-wear apparel, menswear, youth apparel, baby, beauty, footwear, accessories, home, toys, gifts and coats. Burlington’s lease expires in January 2030 and has two 5-year renewal options remaining.
Round 1 Bowling Amusement, (59,071 sq. ft.; 5.2% of NRA; 3.2% of U/W base Rent) (“Round 1”) is a multi-entertainment complex offering an array of activities including bowling, arcade games, billiards, ping pong, darts, food and drinks. Round 1’s parent company was founded in Japan in 1993 and quickly expanded across the country due to its growing demand. In 2008, the firm began exploring opportunities overseas, and in 2010 it opened its first United States location in Los Angeles. Round 1’s lease expires in September 2027 and has two 5-year renewal options remaining.
Forever 21, (47,203 sq. ft.; 4.2% of NRA; 1.6% of U/W base Rent) is a global fashion retailer headquartered in Los Angeles, California. With more than 540 locations worldwide and online, Forever 21 operates to make high style designs and fashion basics accessible to all consumers. Forever 21’s lease expired in January of 2023; however, the tenant is still in occupancy and current on rent. Renewal conversations are ongoing and rent will be applied retroactively if a new lease is signed. We cannot assure you that the Forever 21 lease will be renewed.
Environmental Matters. According to a Phase I environmental report dated November 16, 2022, there was no evidence of any recognized environmental conditions at the Great Lakes Crossing Outlets Property. However, the Phase I report identified an environmental issue at the Great Lakes Crossing Outlets Property in connection with a wetlands conservation easement agreement between the borrower and the Michigan Department of Environment, Great Lakes and Energy. The assessor recommended maintenance of the onsite regulated wetlands in accordance with the conservation easement agreement.
The Market. The Great Lakes Crossing Outlets Property is located in Auburn Hills, Michigan, within the Detroit metropolitan statistical area (the “Detroit MSA”). According to the appraisal, the Detroit MSA has grown to be the second largest metropolitan area in the Midwest, having a strategic regional location, a good transportation system, and a large manufacturing base. The presence of Ford, General Motors and Chrysler has historically supported much of the economic growth and employment in the Detroit MSA, and as of the past few decades is beginning to rely on the health care industry for long-term growth. According to the appraisal, as of August 2022, the unemployment rate in the Detroit MSA was 3.5%, representing a 2.65% increase in employment from the year prior.
The Great Lakes Crossing Outlets Property is located alongside I-75, which according to the appraisal has a daily traffic count of 71,265 vehicles. According to the appraisal, the Great Lakes Crossing Outlets Property is conveniently accessible to the 2.1 million residents that live within the trade area, providing a strong local customer base. Further, given its proximate location to Canada, the Great Lakes Crossing Outlets Property benefits from cross-border commerce. According to the appraisal, as of 2022, the estimated population within a one-mile, three-mile and five-mile radius totaled 2,140, 42,016 and 135,040 people, respectively, and average household income for the same radii was $89,356, $90,320 and $99,774, respectively.
According to the appraisal, the Great Lakes Crossing Outlets Property is situated within the Detroit retail market and the Pontiac submarket. As of the third quarter of 2022, the Detroit retail market contained total inventory of approximately 260.5 million sq. ft. with an approximate 5.0% vacancy rate and average annual rental rates of $17.80 per sq. ft., and the Pontiac submarket contained a total inventory of approximately 8.2 million sq. ft. with an approximate 2.7% vacancy rate and average annual rental rates of $17.93 per sq. ft.
| THE INFORMATION IN THIS STRUCTURAL AND COLLATERAL TERM SHEET IS NOT COMPLETE AND MAY BE AMENDED PRIOR TO THE TIME OF SALE. THIS TERM SHEET IS NOT AN OFFER TO SELL THESE SECURITIES AND IT IS NOT A SOLICITATION OF AN OFFER TO BUY THESE SECURITIES IN ANY JURISDICTION WHERE THE OFFER OR SALE IS NOT PERMITTED. | ||
| 71 | ||
4000 Baldwin Road Auburn Hills, MI 48326
| Collateral Asset Summary – Loan No. 5 Great Lakes Crossing Outlets | Cut-off Date Balance: Cut-off Date LTV: U/W NCF DSCR: U/W NOI Debt Yield: | $50,000,000 45.0% 2.50x 17.5% |
The appraiser identified five comparable retail properties to the Great Lakes Crossing Outlets Property:
| Competitive Retail Center Summary(1) | ||||||
| Property Name/Location | Year Built / Renovated or Expanded | Total NRA (SF) | Total Occupancy | Distance to Subject | Sales PSF | Anchor Tenants |
Great Lakes Crossing Outlets 4000 Baldwin Road Auburn Hills, MI | 1998 / 2010 | 1,128,332(2) | 89.6%(2) | NAP | $503.40(2)(3 | Burlington Coat Factory Round 1 Bowling Amusement Forever 21 Marshalls TJ Maxx Nordstrom Rack Legoland Discovery Center |
Westfield Santa Anita Arcadia, CA | 1973 / 2014, 2021 | 1,480,000 | 89.0% | 2,287 miles | $608.00 | JCPenney Nordstrom Macy’s |
Biltmore Fashion Park Scottsdale, AZ
| 1963 / 2021 | 384,342 | 87.0% | 2,024 miles | $830.00 | Sak’s Fifth Avenue Macy’s |
Westfield Brandon Brandon, FL
| 1995 / 2007 | 1,149,543 | 93.0% | 1,213 miles | $711.00(4) | Dillard’s Macy’s JCPenney |
Galleria Edina Edina, MN
| 1974 / 2006 | 398,585 | 99.0% | 720 miles | $891.00 | Rypen Furniture |
University Mall South Burlington, VT
| 1979 / 2018 | 613,915 | 95.0% | 637 miles | $325.00 | Target JCPenney Kohl’s |
| (1) | Source: Appraisal unless otherwise indicated. |
| (2) | Based on the underwritten rent roll dated November 30, 2022, including four tenants that have signed leases but have not taken physical occupancy. The total sq. ft. and sales per sq. ft. information represented in the above table for the Great Lakes Crossing Outlets Property is only for the collateral for the Great Lakes Crossing Outlets Whole Loan. |
| (3) | Based on October 2022 trailing twelve month reported sales figures. |
| (4) | Includes Apple sales figures. Sales excluding Apple are approximately $550. |
Cash Flow Analysis.
| Cash Flow Analysis(1) | ||||||
| 2019 | 2020 | 2021 | T-12 11/30/2022 | U/W | U/W Per Sq. Ft. | |
| Rents in Place | $27,351,881 | $24,157,616 | $25,715,947 | $27,665,175 | $28,969,473 | $25.67 |
| Other Revenue/Rents(2) | 21,677,084 | 19,516,740 | 19,612,241 | 19,003,929 | 21,777,155 | $19.30 |
| Gross Potential Rent | $49,028,964 | $43,674,356 | $45,328,188 | $46,669,104 | $50,746,628 | $44.97 |
| Vacancy/Credit Loss | (479,579) | (2,965,788) | 1,933,578 | (244,977) | (3,745,989) | ($3.32) |
| Effective Gross Income | $48,549,386 | $40,708,568 | $47,261,766 | $46,424,127 | $47,000,639 | $41.65 |
| Total Expenses(3) | $14,304,642 | $12,857,184 | $14,350,428 | $14,768,491 | $15,438,872 | $13.68 |
| Net Operating Income | $34,244,744 | $27,851,384 | $32,911,337 | $31,655,635 | $31,561,767 | $27.97 |
| Replacement Reserves | 0 | 0 | 0 | 0 | 259,516 | $0.23 |
| TI/LC | 0 | 0 | 0 | 0 | 1,567,562 | $1.39 |
| Net Cash Flow | $34,244,744 | $27,851,384 | $32,911,337 | $31,655,635 | $29,734,689 | $26.35 |
| (1) | Based on the underwritten rent roll dated November 30, 2022. |
| (2) | Other Revenue/Rents consists of overage rent, short term temporary tenant rent, RMU/center ops rents, market revenue from vacant units total commercial reimbursement revenue and other revenue. |
| (3) | Total U/W Expenses include a management fee equal to 4.0% of Effective Gross Income. |
| THE INFORMATION IN THIS STRUCTURAL AND COLLATERAL TERM SHEET IS NOT COMPLETE AND MAY BE AMENDED PRIOR TO THE TIME OF SALE. THIS TERM SHEET IS NOT AN OFFER TO SELL THESE SECURITIES AND IT IS NOT A SOLICITATION OF AN OFFER TO BUY THESE SECURITIES IN ANY JURISDICTION WHERE THE OFFER OR SALE IS NOT PERMITTED. | ||
| 72 | ||
4000 Baldwin Road Auburn Hills, MI 48326
| Collateral Asset Summary – Loan No. 5 Great Lakes Crossing Outlets | Cut-off Date Balance: Cut-off Date LTV: U/W NCF DSCR: U/W NOI Debt Yield: | $50,000,000 45.0% 2.50x 17.5% |
Property Management. The Great Lakes Crossing Outlets Property is managed by The Taubman Company LLC, which is an affiliate of the borrower sponsor.
Lockbox / Cash Management. The Great Lakes Crossing Outlets Whole Loan is structured with a hard lockbox and springing cash management. At origination of the Great Lakes Crossing Outlets Whole Loan, the borrower was required to direct each tenant to remit all rents directly to a lender-controlled lockbox account. In addition, the borrower is required to, and is required to cause the property manager to, cause all amounts constituting rents received by the borrower or the property manager with respect to the Great Lakes Crossing Outlets Property to be deposited into the lockbox account or a lender-controlled cash management account by the end of the second business day following receipt. In addition, the borrower is required to, and is required to cause the property manager to, instruct all persons that maintain open accounts with the borrower or property manager with respect to the Great Lakes Crossing Outlets Property or with whom the borrower or property manager does business on an “accounts receivable” basis with respect to the Great Lakes Crossing Outlets Property to deliver all payments due under such accounts to the lockbox account. On a weekly basis during the continuance of a Great Lakes Crossing Outlets Lockbox Event Period (as defined below) under the Great Lakes Crossing Outlets Whole Loan documents, all amounts in the lockbox are required to be remitted to the cash management account. On a daily basis at any time no Great Lakes Crossing Outlets Lockbox Event Period is in effect, all amounts in the lockbox account are required to be remitted to a borrower-controlled operating account.
Notwithstanding anything to the contrary in the foregoing, the borrower may maintain an account in its name into which it may deposit or cause to be deposited rents from persons who are parties to a Great Lakes Crossing Outlets License Agreement (as defined below) and miscellaneous amounts received by the borrower that are not rents, payments, reimbursements or other amounts paid under leases, provided that if a Great Lakes Crossing Outlets Lockbox Event Period exists, at the lender’s direction, the borrower is required to direct all persons who are parties to a Great Lakes Crossing Outlets License Agreement to deliver all sums due under such Great Lakes Crossing Outlets License Agreements directly to the lockbox account. To the extent any such sums are collected directly by the borrower or property manager, the borrower is required to, and is required to cause the property manager to, cause all such sums received by the borrower or property manager to be deposited into the lockbox account by the end of the second business day following receipt.
On each due date during the continuance of a Great Lakes Crossing Outlets Lockbox Event Period, all funds on deposit in the cash management account after payment of debt service on the Great Lakes Crossing Outlets Whole Loan, required reserves and budgeted operating expenses are required to be deposited into an excess cash flow reserve account as additional collateral for the Great Lakes Crossing Outlets Whole Loan.
A “Great Lakes Crossing Outlets License Agreement” means any license or occupancy agreement granted by the borrower (or a predecessor-in-interest) to (i) an operator of a cart, kiosk or similar merchandising facilities located in the common areas of the Great Lakes Crossing Outlets Property or (ii) a licensee or occupant of an in-line space for a term of one year or less.
A “Great Lakes Crossing Outlets Lockbox Event” means the occurrence of: (i) an event of default; (ii) any bankruptcy action of the borrower; (iii) a bankruptcy action of the property manager if the property manager is an affiliate of the borrower, provided that the property manager is not replaced within 60 days with a qualified property manager; or (iv) a Great Lakes Crossing Outlets Debt Yield Trigger Event (as defined below).
A “Great Lakes Crossing Outlets Lockbox Event Period” means the period commencing on the occurrence of a Great Lakes Crossing Outlets Lockbox Event and continuing until the occurrence of the applicable Great Lakes Crossing Outlets Lockbox Termination Event (as defined below).
A “Great Lakes Crossing Outlets Debt Yield Trigger Event” means, as of any date of determination, the debt yield based on the trailing four calendar quarter period immediately preceding such date of determination is less than 12.00% for two consecutive calendar quarters.
A “Great Lakes Crossing Outlets Lockbox Termination Event” means (a) if the Great Lakes Crossing Outlets Lockbox Event is caused solely by the occurrence of a Great Lakes Crossing Outlets Debt Yield Trigger Event, the achievement of a debt yield for the Great Lakes Crossing Outlets Whole Loan of 12.00% or greater for two consecutive calendar quarters, (b) if the Great Lakes Crossing Outlets Lockbox Event is caused solely by an event of default, the acceptance by the lender of a cure of such event of default (which cure the lender is not obligated to accept and may reject or accept in its sole and absolute discretion) provided that the lender has not accelerated the Great Lakes Crossing Outlets Whole Loan, moved for a receiver or commenced foreclosure proceedings or (c) if the Great Lakes Crossing Outlets Lockbox Event is caused solely by a bankruptcy action of the property manager, if the borrower replaces the property manager with a qualified property manager under a replacement property management agreement within 60 days or such bankruptcy action of the property manager is discharged or dismissed within 90 days without any adverse consequences to the Great Lakes Crossing Outlets Property or the Great Lakes Crossing Outlets Whole Loan; provided, however, that, each such Great Lakes Crossing Outlets Lockbox Termination Event is subject to the following conditions: (i) no other Great Lakes Crossing Outlets Lockbox Event has occurred and is continuing, (ii) no other event of default has occurred and is continuing under the Great Lakes Crossing Outlets Whole Loan documents, (iii) the borrower may not cure a Great Lakes Crossing Outlets Lockbox Event (x) more than a total of five times in the aggregate during the term of the Great Lakes Crossing Outlets Whole Loan or (y) triggered by a bankruptcy action of the borrower at any time during the term of the Great Lakes Crossing Outlets Whole Loan and (iv) the borrower has paid all of the lender’s reasonable out-of-pocket expenses
| THE INFORMATION IN THIS STRUCTURAL AND COLLATERAL TERM SHEET IS NOT COMPLETE AND MAY BE AMENDED PRIOR TO THE TIME OF SALE. THIS TERM SHEET IS NOT AN OFFER TO SELL THESE SECURITIES AND IT IS NOT A SOLICITATION OF AN OFFER TO BUY THESE SECURITIES IN ANY JURISDICTION WHERE THE OFFER OR SALE IS NOT PERMITTED. | ||
| 73 | ||
4000 Baldwin Road Auburn Hills, MI 48326
| Collateral Asset Summary – Loan No. 5 Great Lakes Crossing Outlets | Cut-off Date Balance: Cut-off Date LTV: U/W NCF DSCR: U/W NOI Debt Yield: | $50,000,000 45.0% 2.50x 17.5% |
incurred in connection with such Great Lakes Crossing Outlets Lockbox Termination Event, including reasonable attorney’s fees and expenses.
Initial and Ongoing Reserves. At origination of the Great Lakes Crossing Outlets Whole Loan, the borrower was required to deposit into escrow (i) $1,581,204.38 for a reserve with respect to outstanding tenant improvement allowances, leasing commissions and unfunded obligations under leases for the tenants Kids Empire, Nordstrom Rack, Showcase, Tumi, UGG and Vineyard Vines (the “Outstanding TI/LC Reserve”) and (ii) $224,418.36 for a reserve with respect to gap rent under leases for the tenants Savvy Sliders, Cotton On Kids, Cotton On and Kids Empire (the “Gap Rent Reserve”). In lieu of remitting such amounts for deposit, provided that no event of default is continuing the borrower may fund the Outstanding TI/LC Reserve or the Gap Rent Reserve by delivering to the lender (i) upon at least 10 days written notice to the lender, a qualifying letter of credit in the applicable amount or (ii) a qualifying guaranty in the applicable amount, in each case in accordance with the Great Lakes Crossing Outlets Whole Loan documents.
Tax Reserve – During a Great Lakes Crossing Outlets Lockbox Event Period or at any time (x) any taxes are not paid by the borrower prior to the assessment of any penalty for late payment and prior to the date that such taxes become delinquent (unless the borrower is contesting such taxes in accordance with the terms of the Great Lakes Crossing Outlets Whole Loan documents), or (y) upon request of the lender, the borrower fails to promptly provide evidence reasonably satisfactory to the lender that such taxes have been paid prior to the assessment of any penalty for late payment and prior to the date that such taxes become delinquent (unless the borrower is contesting such taxes in accordance with the terms of the Great Lakes Crossing Outlets Whole Loan documents), the borrower is required to deposit into a real estate tax reserve, on a monthly basis, 1/12 of the reasonably estimated annual real estate taxes; in lieu of remitting such amounts for deposit, the borrower may fund the tax reserve by delivering to the lender (i) upon at least 10 days written notice to the lender, a qualifying letter of credit in such amount or (ii) provided that no event of default is continuing, a qualifying guaranty in such amount, in each case in accordance with the Great Lakes Crossing Outlets Whole Loan documents.
Insurance Reserve – In the event that during a Great Lakes Crossing Outlets Lockbox Event Period the borrower has not provided satisfactory evidence to the lender that the Great Lakes Crossing Outlets Property is covered by policies that are being maintained as part of a reasonably acceptable blanket insurance policy in accordance with the Great Lakes Crossing Outlets Whole Loan documents, the borrower is required to deposit into an insurance reserve, 1/12 of reasonably estimated insurance premiums; in lieu of remitting such amounts for deposit, the borrower may fund the insurance reserve by delivering to the lender (i) upon at least 10 days written notice to the lender, a qualifying letter of credit in such amount or (ii) provided that no event of default is continuing, a qualifying guaranty in such amount, in each case in accordance with the Great Lakes Crossing Outlets Whole Loan documents.
Replacement Reserve – On each monthly payment date during a Great Lakes Crossing Outlets Lockbox Event Period, the borrower is required to deposit into a replacement reserve, an amount equal to $21,626.36 if the balance on deposit in the replacement reserve account is less than $519,032.72 for reasonably estimated replacements and repairs required to be made to the Great Lakes Crossing Outlets Property during each calendar year; provided, however, that in lieu of remitting such amounts for deposit, the borrower may fund the replacement reserve by delivering to the lender (i) upon at least 10 days written notice to the lender, a qualifying letter of credit in such amount or (ii) provided that no Great Lakes Crossing Outlets Control Event (as defined below) or event of default is continuing, a qualifying guaranty in such amount, in each case in accordance with the Great Lakes Crossing Outlets Whole Loan documents.
TI/LC Reserve – The borrower is required to deposit into a rollover reserve, on a monthly basis, an amount equal to $94,027.67 if the balance of the rollover reserve falls below $2,256,664; in lieu of remitting such amounts for deposit, the borrower may fund the rollover reserve by delivering to the lender (i) upon at least 10 days written notice to the lender, a qualifying letter of credit in such amount or (ii) provided that no Great Lakes Crossing Outlets Control Event or event of default is continuing, a qualifying guaranty in such amount, in each case in accordance with the Great Lakes Crossing Outlets Whole Loan documents.
A “Great Lakes Crossing Outlets Control Event” means that any combination of Taubman, Simon Property Group, Inc. or Simon Property Group, L.P. does not own, in the aggregate, at least 30% of the direct or indirect interests in the borrower or does not control the borrower.
Current Mezzanine or Secured Subordinate Indebtedness. None.
Permitted Future Mezzanine or Secured Subordinate Indebtedness. None.
Partial Release. None.
| THE INFORMATION IN THIS STRUCTURAL AND COLLATERAL TERM SHEET IS NOT COMPLETE AND MAY BE AMENDED PRIOR TO THE TIME OF SALE. THIS TERM SHEET IS NOT AN OFFER TO SELL THESE SECURITIES AND IT IS NOT A SOLICITATION OF AN OFFER TO BUY THESE SECURITIES IN ANY JURISDICTION WHERE THE OFFER OR SALE IS NOT PERMITTED. | ||
| 74 | ||
7014 East Camelback Road Scottsdale, AZ 85251
| Collateral Asset Summary – Loan No. 6 Scottsdale Fashion Square | Cut-off Date Balance: Cut-off Date LTV: U/W NCF DSCR: U/W NOI Debt Yield: | $49,000,000 38.4% 1.92x 12.3% |

| THE INFORMATION IN THIS STRUCTURAL AND COLLATERAL TERM SHEET IS NOT COMPLETE AND MAY BE AMENDED PRIOR TO THE TIME OF SALE. THIS TERM SHEET IS NOT AN OFFER TO SELL THESE SECURITIES AND IT IS NOT A SOLICITATION OF AN OFFER TO BUY THESE SECURITIES IN ANY JURISDICTION WHERE THE OFFER OR SALE IS NOT PERMITTED. | ||
| 75 | ||
7014 East Camelback Road Scottsdale, AZ 85251
| Collateral Asset Summary – Loan No. 6 Scottsdale Fashion Square | Cut-off Date Balance: Cut-off Date LTV: U/W NCF DSCR: U/W NOI Debt Yield: | $49,000,000 38.4% 1.92x 12.3% |
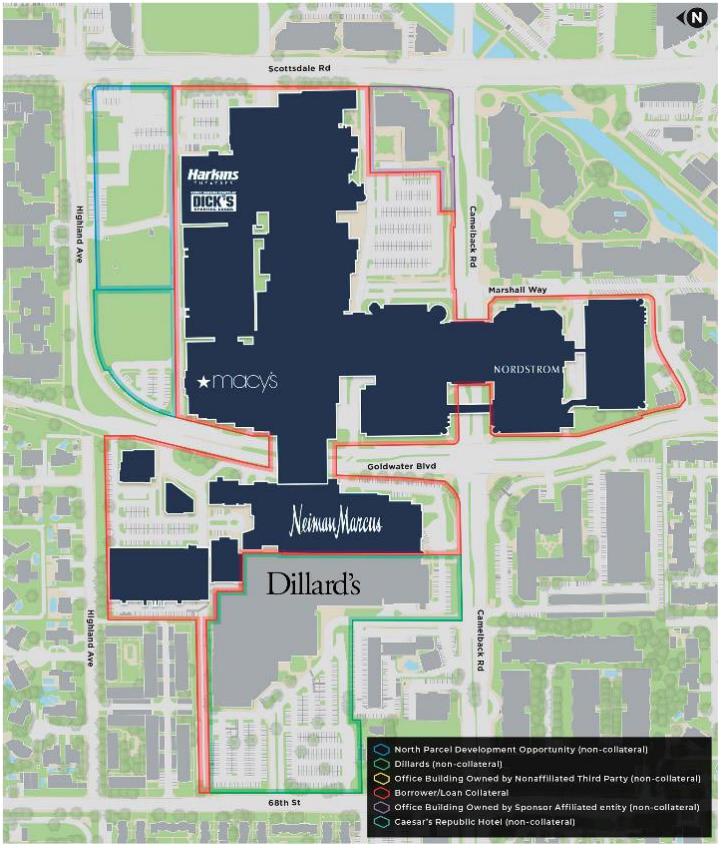
| THE INFORMATION IN THIS STRUCTURAL AND COLLATERAL TERM SHEET IS NOT COMPLETE AND MAY BE AMENDED PRIOR TO THE TIME OF SALE. THIS TERM SHEET IS NOT AN OFFER TO SELL THESE SECURITIES AND IT IS NOT A SOLICITATION OF AN OFFER TO BUY THESE SECURITIES IN ANY JURISDICTION WHERE THE OFFER OR SALE IS NOT PERMITTED. | ||
| 76 | ||
7014 East Camelback Road Scottsdale, AZ 85251
| Collateral Asset Summary – Loan No. 6 Scottsdale Fashion Square | Cut-off Date Balance: Cut-off Date LTV: U/W NCF DSCR: U/W NOI Debt Yield: | $49,000,000 38.4% 1.92x 12.3% |

| THE INFORMATION IN THIS STRUCTURAL AND COLLATERAL TERM SHEET IS NOT COMPLETE AND MAY BE AMENDED PRIOR TO THE TIME OF SALE. THIS TERM SHEET IS NOT AN OFFER TO SELL THESE SECURITIES AND IT IS NOT A SOLICITATION OF AN OFFER TO BUY THESE SECURITIES IN ANY JURISDICTION WHERE THE OFFER OR SALE IS NOT PERMITTED. | ||
| 77 | ||
7014 East Camelback Road Scottsdale, AZ 85251
| Collateral Asset Summary – Loan No. 6 Scottsdale Fashion Square | Cut-off Date Balance: Cut-off Date LTV: U/W NCF DSCR: U/W NOI Debt Yield: | $49,000,000 38.4% 1.92x 12.3% |
| Mortgage Loan Information | |
| Loan Sellers: | GSMC |
| Loan Purpose: | Refinance |
Credit Assessment (Fitch/KBRA/Moody’s)(9): | AAsf / BBB+(sf) / Aa2(sf) |
Borrower Sponsors:
| The Macerich Partnership, L.P.; Institutional Mall Investors LLC |
| Borrower: | Scottsdale Fashion Square LLC |
| Original Balance(1): | $49,000,000 |
| Cut-off Date Balance(1): | $49,000,000 |
| % by Initial UPB: | 7.5% |
| Interest Rate(2): | 6.21425% |
| Payment Date: | 6th of each month |
| First Payment Date: | April 6, 2023 |
| Maturity Date: | March 6, 2028 |
| Amortization: | Interest Only |
| Additional Debt(1): | $651,000,000 Pari Passu Debt |
| Call Protection(3): | L(25),DorYM1(28),O(7) |
| Lockbox / Cash Management: | Hard / Springing |
| Reserves(4) | |||
| Initial | Monthly | Cap | |
| Taxes: | $0 | Springing | NAP |
| Insurance: | $0 | Springing | NAP |
| Replacement: | $0 | Springing | $402,666 |
| TI/LC: | $0 | Springing | $1,651,332 |
| Other(5): | $14,539,077 | $0 | NAP |
| Property Information | |
| Single Asset / Portfolio: | Single Asset |
| Property Type: | Super Regional Mall Retail |
| Collateral: | Fee |
| Location: | Scottsdale, AZ |
| Year Built / Renovated: | 1961, 1977, 1982, 1992, 1996, 2006, 2015 / 1991, 2017-2020, 2023-2024 |
| Total Sq. Ft.: | 1,555,459 |
| Property Management: | Macerich Arizona Partners LLC |
| Underwritten NOI(6): | $86,147,743 |
| Underwritten NCF: | $84,810,375 |
| Appraised Value: | $1,825,000,000 |
| Appraisal Date: | January 4, 2023 |
| Historical NOI | |
| Most Recent NOI(6): | $79,960,983 (December 31, 2022) |
| 2021 NOI: | $67,572,171 (December 31, 2021) |
| 2020 NOI: | $56,039,123 (December 31, 2020) |
| 2019 NOI: | $62,502,214 (December 31, 2019) |
| Historical Occupancy | |
| Most Recent Occupancy(7): | 96.0% (December 2, 2022) |
| 2021 Occupancy(8): | 95.2% (December 31, 2021) |
| 2020 Occupancy(8): | 92.3% (December 31, 2020) |
| 2019 Occupancy(8): | 93.2% (December 31, 2019) |
| Financial Information(1) | ||||||
| Tranche | Cut-off Date Balance | Balance per Sq. Ft. Cut-off / Balloon | LTV Cut-off / Balloon | U/W DSCR NOI / NCF(7) | U/W Debt Yield NOI / NCF | U/W Debt Yield at Balloon NOI / NCF |
| Mortgage Loan | $49,000,000 | |||||
| Pari Passu Notes | 651,000,000 | |||||
| Whole Loan | $700,000,000 | $450 / $450 | 38.4% / 38.4% | 1.95x / 1.92x | 12.3% / 12.1% | 12.3% / 12.1% |
| (1) | The Scottsdale Fashion Square Mortgage Loan (as defined below) is part of the Scottsdale Fashion Square Whole Loan (as defined below) evidenced by 10 pari passu notes with an aggregate original principal balance of $700,000,000. Financial information in the chart above reflects the Scottsdale Fashion Square Whole Loan. See “The Loan” herein. |
| (2) | For purposes of calculating interest and other amounts payable on the Scottsdale Fashion Square Whole Loan, each note was divided into multiple components with varying interest rates. The interest rate of the Scottsdale Fashion Square Mortgage Loan represents the weighted average interest rate of three components. Prepayments of the Scottsdale Fashion Square Mortgage Loan will be applied to the components in sequential order. As a result of the components having different interest rates and the allocation of prepayments to sequentially reduce the components, the per annum weighted average interest rate of the components (and, therefore, the interest rate of the Scottsdale Fashion Square Mortgage Loan) may increase over time. |
| (3) | The lockout period will be at least 25 payments beginning with and including the first payment date of April 6, 2023. The borrower has the option to defease or prepay (together with, in the case of a prepayment, any applicable yield maintenance premium prior to September 6, 2027), the entire $700.0 million Scottsdale Fashion Square Whole Loan in whole (but not in part) after the earlier to occur of (i) two years after the closing date of the securitization that includes the last note to be securitized and (ii) the payment date in March 2026. The assumed lockout period of 25 months is based on the expected closing date of the Benchmark 2023-B38 securitization in April 2023. The actual lockout period may be longer. Prepayment in whole, but not in part, of the Scottsdale Fashion Square Whole Loan is permitted on or after the payment date in September 2027 without the payment of a yield maintenance premium. |
| (4) | See “Initial and Ongoing Reserves” herein. |
| (5) | The Other Reserves consists of a $10,222,200 upfront Outstanding TI/LC Reserve (the “Outstanding TI/LC Reserve”) and a $4,316,877 upfront Gap Rent Reserve (the “Gap Rent Reserve”). |
| (6) | The increase from Most Recent NOI to Underwritten NOI at the Scottsdale Fashion Square Property (as defined below) is primarily driven by rent steps and recently executed new and renewal leases. |
| (7) | Most Recent Occupancy includes all tenants in place, temporary tenants with leases greater than six months, and tenants with signed leases as of the reporting period and excludes all collateral and non-collateral anchor tenants. Occupancy per the underwritten rent roll as of December 2, 2022 was 96.0%. Excluding signed but not yet open tenants, occupancy per the underwritten rent roll is 94.0%. |
| (8) | Occupancy includes all tenants in place, temporary tenants with leases greater than six months, and tenants with signed leases as of the reporting period. Occupancy excludes all collateral and non-collateral anchor tenants. |
| (9) | Fitch, KBRA and Moody’s provided the listed assessments for the Scottsdale Fashion Square Mortgage Loan in the context of its inclusion in the mortgage pool. |
| THE INFORMATION IN THIS STRUCTURAL AND COLLATERAL TERM SHEET IS NOT COMPLETE AND MAY BE AMENDED PRIOR TO THE TIME OF SALE. THIS TERM SHEET IS NOT AN OFFER TO SELL THESE SECURITIES AND IT IS NOT A SOLICITATION OF AN OFFER TO BUY THESE SECURITIES IN ANY JURISDICTION WHERE THE OFFER OR SALE IS NOT PERMITTED. | ||
| 78 | ||
7014 East Camelback Road Scottsdale, AZ 85251
| Collateral Asset Summary – Loan No. 6 Scottsdale Fashion Square | Cut-off Date Balance: Cut-off Date LTV: U/W NCF DSCR: U/W NOI Debt Yield: | $49,000,000 38.4% 1.92x 12.3% |
The Loan. The mortgage loan (the “Scottsdale Fashion Square Mortgage Loan”) is part of a whole loan (the “Scottsdale Fashion Square Whole Loan”) evidenced by 10 pari passu promissory notes in the aggregate original principal amount of $700,000,000, which is secured by a first deed of trust encumbering the borrower’s fee interest in a super regional mall located in Scottsdale, Arizona (the “Scottsdale Fashion Square Property”). The Scottsdale Fashion Square Mortgage Loan is evidenced by the non-controlling notes A-1-C1 and A-1-C2 , which have an aggregate outstanding principal balance as of the Cut-off Date of $49,000,000. The Scottsdale Fashion Square Whole Loan was co-originated on March 3, 2023 by Goldman Sachs Bank USA (“GS”) and Deutsche Bank AG, New York Branch (“DBNY”). The Scottsdale Fashion Square Property is comprised of a super regional mall, but does not include any portion of the super regional mall that is covered by Dillard’s, a 3-story office building on Camelback Road and the land under development as a Caesar’s Republic Hotel, except as otherwise expressly indicated herein. The Scottsdale Fashion Square Whole Loan proceeds were used to refinance the existing debt on the Scottsdale Fashion Square Property, provide a return of equity to the borrower sponsors, fund upfront reserves and pay origination costs. The Scottsdale Fashion Square Whole Loan has an initial term of 60 months and has a remaining term of 59 months as of the Cut-off Date. The Scottsdale Fashion Square Whole Loan requires interest-only payments during its entire term and accrues interest at a fixed rate of 6.21425% per annum.
The table below summarizes the promissory notes that comprise the Scottsdale Fashion Square Whole Loan. The relationship between the holders of the Scottsdale Fashion Square Whole Loan will be governed by a co-lender agreement. The Scottsdale Fashion Square Whole Loan will be serviced under the trust and servicing agreement for the Scott 2023-SFS trust. See “Description of the Mortgage Pool—The Whole Loans—The Non-Serviced Pari Passu Whole Loans” and “Pooling and Servicing Agreement—Servicing of the Non-Serviced Mortgage Loans” in the Preliminary Prospectus.
| Whole Loan Summary | |||||
| Note | Original Balance | Cut-off Date Balance | Note Holder | Controlling Piece | |
| A-1-S1 | $250,000,000 | $250,000,000 | SCOTT 2023-SFS | Yes | |
| A-2-S1 | 250,000,000 | 250,000,000 | SCOTT 2023-SFS | No | |
| A-1-C1 | 25,000,000 | 25,000,000 | Benchmark 2023-B38 | No | |
| A-1-C2 | 24,000,000 | 24,000,000 | Benchmark 2023-B38 | No | |
| A-1-C3(1) | 26,000,000 | 26,000,000 | GS | No | |
| A-1-C4(1) | 25,000,000 | 25,000,000 | GS | No | |
| A-2-C1(1) | 40,000,000 | 40,000,000 | DBNY | No | |
| A-2-C2(1) | 30,000,000 | 30,000,000 | DBNY | No | |
| A-2-C3-1(1) | 25,000,000 | 25,000,000 | DBNY | No | |
| A-2-C3-2(1) | 5,000,000 | 5,000,000 | DBNY | No | |
| Whole Loan | $700,000,000 | $700,000,000 | |||
| (1) | The Notes held by the lenders are expected to be contributed to one or more future securitization transactions or may otherwise be transferred at any time. |
| Sources and Uses | |||||||
| Sources | Proceeds | % of Total | Uses | Proceeds | % of Total | ||
| Whole Loan | $700,000,000 | 100.0% | Loan Payoff | $404,875,080 | 57.8 | % | |
| Return of Equity(1) | 278,653,540 | 39.8 | |||||
| Reserves(2)(3) | 14,539,077 | 2.1 | |||||
| Closing Costs | 1,932,303 | 0.3 | |||||
| Total Sources | $700,000,000 | 100.0% | Total Uses | $700,000,000 | 100.0 | % | |
| (1) | The borrower sponsors have a current cost basis in the Scottsdale Fashion Square Property of $861 million, of which $377 million has been invested in the redevelopment and renovation of the Scottsdale Fashion Square Property. |
| (2) | Unfunded obligations based on outstanding tenant allowances and broker commissions are $10,222,200 as of February 17, 2023. |
| (3) | Gap Rent Reserve of $4,316,877 is calculated by pro-rating total rent for Elephante, Zimmerman, and Hermes, which have rent commencement dates beyond the origination date. |
The Borrower and the Borrower Sponsors. The borrower for the Scottsdale Fashion Square Whole Loan is Scottsdale Fashion Square LLC, a single purpose entity with two independent directors. Legal counsel to the borrower delivered a non-consolidation opinion in connection with the origination of the Scottsdale Fashion Square Whole Loan. The borrower sponsors and non-recourse carveout guarantors are (i) The Macerich Partnership, L.P., a Delaware limited partnership headquartered in Santa Monica, California and a provider of real estate investment services, and (ii) Institutional Mall Investors LLC, a Delaware limited liability company having a principal place of business in Skokie, Illinois. The Macerich Partnership, L.P. acquires, leases, manages, develops, and redevelops malls and community centers. Institutional Mall Investors is a co-investment venture owned by an affiliate of Miller Capital Advisory and The California Public Employees’ Retirement System (CalPERS). CalPERS is the nation’s largest public pension fund and provides retirement and health benefits to more than 1.5 million California public employees, retirees and their families. As of December 31, 2022, CalPERS reported assets totaling $442.2 billion with $73.7 billion of real estate assets along with various other investments that span domestic and international markets. Miller Capital is an Investment Advisor with headquarters in Skokie, IL, a suburb of Chicago.
| THE INFORMATION IN THIS STRUCTURAL AND COLLATERAL TERM SHEET IS NOT COMPLETE AND MAY BE AMENDED PRIOR TO THE TIME OF SALE. THIS TERM SHEET IS NOT AN OFFER TO SELL THESE SECURITIES AND IT IS NOT A SOLICITATION OF AN OFFER TO BUY THESE SECURITIES IN ANY JURISDICTION WHERE THE OFFER OR SALE IS NOT PERMITTED. | ||
| 79 | ||
7014 East Camelback Road Scottsdale, AZ 85251
| Collateral Asset Summary – Loan No. 6 Scottsdale Fashion Square | Cut-off Date Balance: Cut-off Date LTV: U/W NCF DSCR: U/W NOI Debt Yield: | $49,000,000 38.4% 1.92x 12.3% |
The firm manages property investments throughout the entire United States, totaling approximately $8.9 billion as of September 30, 2022. Miller Capital specializes in fashion-oriented retail and mixed use properties. The Macerich Partnership, L.P. also serves as the borrower sponsor of the Green Acres Mortgage Loan, which is being contributed to the Benchmark 2023-B38 transaction.
The Property. The Scottsdale Fashion Square Property was originally constructed as an open-air center in 1961 with one department store, a supermarket and 15 small stores. The Scottsdale Fashion Square Property was enclosed in the 1970s and over the next 50 years, continually expanded to meet the growing population and retail demand of the Scottsdale/Phoenix trade area. The shopping center is currently home to four department stores, a wing dedicated to luxury retailers, a broad retail tenant mix, a flagship Apple Store, coworking space, high-end fitness (opened March 2023), entertainment options including a 14-screen movie theater, several upscale restaurants, and a 3-story, 130,000 square foot office building (non-collateral). The borrower sponsors deployed significant capital over the last 20 years (since its acquisition in 2002) to position the Scottsdale Fashion Square Property as a top retail destination in the country. The borrower sponsors’ current cost basis in the asset is $861.0 million, and since acquisition, the borrower sponsors have invested approximately $377.0 million in major projects to renovate and expand the shopping center. The borrower sponsors expect to invest an additional $80.0 to $90.0 million over the next two years in a second luxury renovation, however, such renovation is not required or reserved for under the Scottsdale Fashion Square Whole Loan documents, and we cannot assure you the borrower sponsors will invest such additional funds as expected or at all.
In 2017, the borrower sponsors began Phase I of the luxury redevelopment at the Scottsdale Fashion Square Property. The project began in 2017, debuted in 2018, and was completed as of the origination date of the Scottsdale Fashion Square Whole Loan, with the opening of a 37,000 sq. ft. Life Time Fitness. The borrower sponsors’ investment in the project totaled $175.0 million including $58.0 million of leasing capital. The Phase I development brought new luxury amenities to Scottsdale Fashion Square Property such as a dedicated car valet at the revamped front entrance, a personal car service, and a platinum-level concierge. Notable luxury tenancy includes a flagship Dior, Dolce & Gabbana, Versace, Breitling, IWC, Hublot, Brunello Cucinelli, Saint Laurent, GUCCI Men, LOUIS VUITTON MEN’S, Hyde Park Jewelers / Rolex, Cartier, GUCCI, PRADA, LOUIS VUITTON, Bottega Veneta, Christian Louboutin, and Jimmy Choo. Additionally, the exterior expansion resulted in a 40,811 sq. ft. collection of upscale restaurants including Nobu, Ocean 44, Toca Madera, Francine, Zinque, and Tocaya Organica. The new restaurants generated a combined total of approximately $65.7 million in annual sales in 2022.
In 2017, the borrower sponsors spent $35.0 million to transform the former Barney’s New York store into a wing anchored by a 15,365 sq. ft. Apple Store, which opened in 2018, and Industrious, a two-level, 32,898 SF coworking space. The Apple Store reported annual sales of approximately $44.4 million in 2022, which is approximately 4.5x the sales volumes reported by Barney’s New York in the same space in 2016. Industrious pays approximately $1.4 million in annual rent and generated coworking rents in excess of $1.7 million in 2022. The tech wing, which extends through the end of the Scottsdale Fashion Square Property, includes other tenants such as UNTUCKit, Rothy’s, Lucid Motors, Peloton, Blue Nile, Warby Parker, Tommy John, Psycho Bunny, Buck Mason, Scotch & Soda, and Indochino.
In January 2023, the borrower sponsors commenced Phase II of the luxury redevelopment, which is expected to entail extensive renovation and re-tenanting. The existing porte cochere is expected to be renovated into the primary entrance for the Scottsdale Fashion Square Property, featuring flagship stores and high-end restaurants such as Elephante (the Elephante lease was recently executed and the tenant has not taken occupancy). In August 2022, the borrower sponsors executed a lease with Hermes to replace approximately 11,000 SF of Crate & Barrel’s upper and lower level with a flagship luxury presentation, although the tenant has not opened. The expected grand opening of Phase II is the fourth quarter of 2024 with the anticipated first stabilized year in 2025. We cannot assure you that the Phase II redevelopment will be completed as anticipated or at all.
Major Tenants. The three largest tenants based on sq. ft. are Macy's, Nordstrom and Neiman Marcus, each of which is an anchor tenant.
Macy's (235,899 sq. ft.; 15.2% of NRA, 3.0% of underwritten base rent, Moody’s/S&P/Fitch: Ba2/BB+/BBB-): Founded in 1858 and headquartered in New York, New York, Macy’s is a department store chain with 507 locations as of the fourth-quarter of 2022. The Macy’s store at the Scottsdale Fashion Square Property, has an original commencement date of June 20, 1990 and lease expiration date of January 31, 2030.
Nordstrom (225,000 sq. ft.; 14.5% of NRA, 0.0% of underwritten base rent, Total percentage Rent: $291,250, Moody’s/S&P/Fitch: Ba1/BB+/BB+): Founded in 1901 as a retail shoe business in Seattle, Washington, Nordstrom offers an extensive selection of brand-name and private label merchandise for women, men, young adults and children focused on apparel, shoes, beauty, accessories and home goods. The Nordstrom store at the Scottsdale Fashion Square Property, has an original commencement date of September 18, 1998 and lease expiration date of February 28, 2029. Total Percentage rent is based on annual sales and a formula based on varying rates and breakpoints and was underwritten based on such formula applied to annual 2022 sales.
Neiman Marcus (100,071 sq. ft.; 6.4% of NRA, 0.0% of underwritten base rent, Total percentage Rent: $847,048, Moody’s/S&P/Fitch: NR/NR/NR): Founded in 1907 in Dallas, Texas, Neiman Marcus caters to luxury customers. Today, Neiman Marcus supports one of the nation’s leading specialty integrated retail organizations with more than 5.1 million gross square feet of store operations in the United States, including 37 Neiman Marcus stores, two Bergdorf Goodman stores and five Last Call stores. Neiman Marcus online offers customers the leading assortment of luxury merchandise for women, men, kids and home. The Neiman Marcus store at the Scottsdale Fashion Square Property, has an original lease commencement date of September 1, 1986 and lease expiration date of October 18,
| THE INFORMATION IN THIS STRUCTURAL AND COLLATERAL TERM SHEET IS NOT COMPLETE AND MAY BE AMENDED PRIOR TO THE TIME OF SALE. THIS TERM SHEET IS NOT AN OFFER TO SELL THESE SECURITIES AND IT IS NOT A SOLICITATION OF AN OFFER TO BUY THESE SECURITIES IN ANY JURISDICTION WHERE THE OFFER OR SALE IS NOT PERMITTED. | ||
| 80 | ||
7014 East Camelback Road Scottsdale, AZ 85251
| Collateral Asset Summary – Loan No. 6 Scottsdale Fashion Square | Cut-off Date Balance: Cut-off Date LTV: U/W NCF DSCR: U/W NOI Debt Yield: | $49,000,000 38.4% 1.92x 12.3% |
2031. Total Percentage rent is based on annual sales and a formula based on varying rates and breakpoints and was underwritten based on such formula applied to annual 2022 sales.
The following table presents certain information relating to the tenants (of which, certain tenants may have cotenancy provisions) at the Scottsdale Fashion Square Property:
| Tenant Summary(1) | ||||||||||
Tenant | Credit Rating (Moody’s/S&P/Fitch)(2) | Net Rentable Area (Sq. Ft.) | % of Net Rentable Area | U/W Base Rent Per Sq. Ft.(3) | % of Total U/W Base Rent(3) |
Occupancy Cost(4) |
Lease Expiration | |||
| Macy’s | Ba2/BB+/BBB- | 235,899 | 15.2 | % | $7.63 | 3.0 | % | 6.2% | 1/31/2030 | |
| Nordstrom(5) | Ba1/BB+/BB+ | 225,000 | 14.5 | $0.00 | 0.0 | 0.6% | 2/28/2029 | |||
| Neiman Marcus(5) | NR/NR/NR | 100,071 | 6.4 | $0.18 | 0.0 | 1.1% | 10/18/2031 | |||
| Harkins Theatres | NR/NR/NR | 81,177 | 5.2 | $21.50 | 2.9 | 23.9% | 1/31/2031 | |||
| DICK'S Sporting Goods | Baa3/BBB/NR | 50,646 | 3.3 | $24.20 | 2.0 | 8.6% | 1/31/2026 | |||
| Life Time Fitness | NR/NR/NR | 37,000 | 2.4 | $24.32 | 1.5 | NAV | 1/31/2043 | |||
| Industrious | NR/NR/NR | 32,898 | 2.1 | $41.67 | 2.2 | 95.0% | 12/31/2033 | |||
| ZARA | NR/NR/NR | 23,424 | 1.5 | $83.54 | 3.2 | 11.8% | 9/30/2028 | |||
| H&M(6) | NR/NR/NR | 23,387 | 1.5 | $48.34 | 1.9 | 14.0% | 4/30/2032 | |||
| Wonderspaces | NR/NR/NR | 15,987 | 1.0 | $27.21 | 0.7 | NAV | 4/30/2029 | |||
| Largest Tenants | 825,489 | 53.1 | % | $12.82 | 17.4 | % | ||||
| Remaining Occupied | 668,375 | 43.0 | % | $75.33 | 82.6 | % | ||||
| Total Occupied | 1,493,864 | 96.0 | % | $40.79 | 100.0 | % | ||||
| Vacant | 61,595 | 4.0 | % | |||||||
| Total | 1,555,459 | 100.0 | % | |||||||
| (1) | Based on the underwritten rent roll dated December 2, 2022, with recently executed leases as of February 2023 and with rent steps through March 2024. |
| (2) | In certain instances, ratings provided are those of the parent company of the entity shown, whether or not the parent company guarantees the lease. |
| (3) | % of Total U/W Base Rent and U/W Base Rent Per Sq. Ft. include contractual rent steps through March 2024. |
| (4) | Occupancy Cost is as of the trailing 12-month period ending December 31, 2022, based upon sales figures as provided by the tenants to the borrower or estimated based on anecdotal information provided by the tenants to the borrower. The Occupancy Cost for the Zara and H&M tenants is exclusive of the storage unit in place rental income. |
| (5) | The Nordstrom and Neiman Marcus tenants both pay percentage rent. Breakpoints and corresponding breakpoint percentages are based off of in-place terms as of December 2022. Percentage rents for such tenants were calculated based on the applicable formula applied to the applicable tenant’s annual sales for 2022. |
| (6) | H&M occupies 23,387 sq. ft. of the Scottsdale Fashion Square Property (representing approximately $1,130,000 in underwritten base rent) under a lease that has an original commencement date of July 22, 2010 and a lease expiration date of April 30, 2032, and allows for the tenant to terminate its lease with 120 days’ notice if its sales do not exceed $8,700,000 for the period between May 1, 2025 and April 30, 2026, or if sales do not exceed $8,900,000 for the period between May 30, 2027 and April 30, 2028. |
| Tenant Sales Per Sq. Ft.(1) | ||||
| 2018 | 2019 | 2021 | 2022 | |
| Tenants < 10,000 SF and Open > 12 months(1) | ||||
| Occupancy Cost(2) | 10.5% | 9.1% | N/A | 9.3% |
| Sales PSF(4) | $1,159 | $1,437 | $1,511 | $1,684 |
| Apple Store (APPL)(3) | ||||
| Occupancy Cost(2) | N/A | 2.3% | N/A | 2.9% |
| Sales PSF(4) | N/A | $7,713 | $4,562 | $6,359 |
| TESLA (TSLA) | ||||
| Occupancy Cost(2) | 0.3% | 0.2% | N/A | 1.2% |
| Sales PSF(4) | $47,193 | $57,275 | $14,127 | $12,765 |
| Tenants < 10,000 SF and open > 12 months excl. APPL & TSLA | ||||
| Occupancy Cost(2) | 14.8% | 14.1% | N/A | 10.2% |
| Sales PSF(4) | $793 | $875 | $1,338 | $1,511 |
| (1) | Inclusive of tenants that have been open for 12 months or more and excludes tenants >10,000 SF and non-retail stores. |
| (2) | Cost of occupancy is calculated by the sum of rent, percentage rent, CAM and taxes divided by annual sales. |
| (3) | Apple Store Sales PSF is based on tenant’s 6,989 SF sales floor area. |
| (4) | All sales information presented herein with respect to the Scottsdale Fashion Square Property is based upon information provided by the borrower. In certain instances, sales figures represent estimates because the tenants are not required to report, or otherwise may not have reported sales information on a timely basis. Further, because sales are self-reported, such information is not independently verified by the borrower. |
| THE INFORMATION IN THIS STRUCTURAL AND COLLATERAL TERM SHEET IS NOT COMPLETE AND MAY BE AMENDED PRIOR TO THE TIME OF SALE. THIS TERM SHEET IS NOT AN OFFER TO SELL THESE SECURITIES AND IT IS NOT A SOLICITATION OF AN OFFER TO BUY THESE SECURITIES IN ANY JURISDICTION WHERE THE OFFER OR SALE IS NOT PERMITTED. | ||
| 81 | ||
7014 East Camelback Road Scottsdale, AZ 85251
| Collateral Asset Summary – Loan No. 6 Scottsdale Fashion Square | Cut-off Date Balance: Cut-off Date LTV: U/W NCF DSCR: U/W NOI Debt Yield: | $49,000,000 38.4% 1.92x 12.3% |
| Lease Rollover Schedule(1)(2) | |||||||||||||
| Year | # of Leases Expiring(3) | Total Expiring Sq. Ft. | % of Total Sq. Ft. Expiring | Cumulative Sq. Ft. Expiring | Cumulative % of Sq. Ft. Expiring | Annual U/W Base Rent Per Sq. Ft. | % U/W Base Rent Rolling | Cumulative % of U/W Base Rent | |||||
| MTM(2) | 7 | 18,625 | 1.2 | % | 18,625 | 1.2% | $89.94 | 2.7 | % | 2.7% | |||
| 2023 | 54 | 157,014 | 10.1 | 175,639 | 11.3% | $35.49 | 9.1 | 11.9% | |||||
| 2024 | 19 | 50,808 | 3.3 | 226,447 | 14.6% | $78.62 | 6.6 | 18.5% | |||||
| 2025 | 22 | 53,919 | 3.5 | 280,366 | 18.0% | $104.63 | 9.3 | 27.7% | |||||
| 2026 | 21 | 99,325 | 6.4 | 379,691 | 24.4% | $51.61 | 8.4 | 36.1% | |||||
| 2027 | 20 | 48,264 | 3.1 | 427,955 | 27.5% | $74.94 | 5.9 | 42.1% | |||||
| 2028 | 14 | 79,051 | 5.1 | 507,006 | 32.6% | $82.03 | 10.6 | 52.7% | |||||
| 2029 | 24 | 296,958 | 19.1 | 803,964 | 51.7% | $16.99 | 8.3 | 61.0% | |||||
| 2030 | 17 | 277,999 | 17.9 | 1,081,963 | 69.6% | $21.16 | 9.7 | 70.6% | |||||
| 2031 | 12 | 225,019 | 14.5 | 1,306,982 | 84.0% | $25.89 | 9.6 | 80.2% | |||||
| 2032 | 14 | 66,753 | 4.3 | 1,373,735 | 88.3% | $79.59 | 8.7 | 88.9% | |||||
| 2033 | 7 | 53,135 | 3.4 | 1,426,870 | 91.7% | $51.72 | 4.5 | 93.4% | |||||
| 2034 & Thereafter | 4 | 66,994 | 4.3 | 1,493,864 | 96.0% | $59.81 | 6.6 | 100.0% | |||||
| Vacant | NAP | 61,595 | 4.0 | 1,555,459 | 100.0% | NAP | NAP | 100.0% | |||||
| Total / Wtd. Avg. | 235 | 1,555,459 | 100.0% | $40.79 | 100.0% | ||||||||
| (1) | Based on underwritten rent roll. Excludes income from non-collateral Dillard’s. |
| (2) | Reflects leases with tenants that have passed the natural lease expiration date where tenant remains in occupancy on a month to month basis under the term of the existing lease. |
| (3) | Expiring suites excludes specialty, business development, temporary leases or other space with no associated SF. |
Environmental Matters. The Phase I environmental assessment at the Scottsdale Fashion Square Property dated February 13, 2023 identified a recognized environmental condition (“REC”) at the Scottsdale Fashion Square Property in connection with stained soil of unknown depth located in an area leased by Arcadia Water Company (“AWC”) on which certain pumps and a 55-gallon drum of oil are located. The borrower has delivered a demand to AWC to remediate the REC (the “Demand”). Pursuant to the related environmental indemnity agreement, the environmental indemnitor is required to (i) exercise commercially reasonable efforts to cause AWC to remediate the REC pursuant to the Demand and (ii) indemnify the lender from any losses arising out of or in any way relating to the REC, provided that the indemnitor’s maximum liability will not exceed $25,000. See “Description of the Mortgage Pool—Environmental Considerations” in the Preliminary Prospectus.
The Market. The Scottsdale Fashion Square Property is situated at the intersection of North Scottsdale Road and East Camelback Road in Scottsdale, Arizona within the Phoenix-Mesa-Scottsdale (“Phoenix”) CBSA. Phoenix experienced population migration during the COVID-19 pandemic and the CBSA’s population is projected to grow from approximately 5.1 million in 2021 to approximately 5.5 million by 2026, an increase of 7.7%. Similarly, the local two-mile radius has a current population of 50,296 residents. Current average household income within a two-mile radius is estimated at $107,104, and has grown 2.33% per year since 2000. With over 12,700 hotel rooms as of December 2021, Scottsdale had an estimated 4.3 million domestic overnight visitors in 2021 plus another 4.4 million domestic day trip visitors, creating an annual economic impact of $2.5 billion in the city through local spending.
| THE INFORMATION IN THIS STRUCTURAL AND COLLATERAL TERM SHEET IS NOT COMPLETE AND MAY BE AMENDED PRIOR TO THE TIME OF SALE. THIS TERM SHEET IS NOT AN OFFER TO SELL THESE SECURITIES AND IT IS NOT A SOLICITATION OF AN OFFER TO BUY THESE SECURITIES IN ANY JURISDICTION WHERE THE OFFER OR SALE IS NOT PERMITTED. | ||
| 82 | ||
7014 East Camelback Road Scottsdale, AZ 85251
| Collateral Asset Summary – Loan No. 6 Scottsdale Fashion Square | Cut-off Date Balance: Cut-off Date LTV: U/W NCF DSCR: U/W NOI Debt Yield: | $49,000,000 38.4% 1.92x 12.3% |
Cash Flow Analysis.
| Cash Flow Analysis(1) | ||||||
| 2019 | 2020 | 2021 | T-12 12/31/2022(2) | U/W(1)(3) | U/W Per Sq. Ft. | |
| Base Rent | $47,352,410 | $45,611,073 | $43,906,038 | $48,947,244 | $56,335,143 | $36.22 |
| Gross Up Vacancy | 0 | 0 | 0 | 0 | 3,801,865 | 2.44 |
| Gross Potential Rent | $47,352,410 | $45,611,073 | $43,906,038 | $48,947,244 | $60,137,008 | $38.66 |
| Other Commercial Income(4) | 8,519,514 | 6,436,146 | 18,842,269 | 25,773,828 | 23,328,393 | 15.00 |
| Total Reimbursements | 22,935,941 | 22,329,039 | 20,953,611 | 22,258,403 | 26,509,396 | 17.04 |
| Other Revenue(5) | 846,945 | 1,219,096 | 1,018,418 | 1,155,165 | 679,436 | 0.44 |
| Net Rental Income | $79,654,810 | $75,595,354 | $84,720,336 | $98,134,640 | $110,654,234 | $71.14 |
| Vacancy/Credit Loss | (230,159) | (2,416,963) | 386,751 | (185,023) | (5,532,712) | (3.56) |
| Effective Gross Income | $79,424,651 | $73,178,391 | $85,107,087 | $97,949,617 | $105,121,522 | $67.58 |
| Total Expenses | 16,922,437 | 17,139,268 | 17,534,916 | 17,988,634 | 18,973,779 | 12.20 |
| Net Operating Income | $62,502,214 | $56,039,123 | $67,572,171 | $79,960,983 | $86,147,743 | $55.38 |
| Capital Expenditures | 0 | 0 | 0 | 0 | 327,531 | 0.21 |
| TI/LC | 0 | 0 | 0 | 0 | 1,009,838 | 0.65 |
| Net Cash Flow | $62,502,214 | $56,039,123 | $67,572,171 | $79,960,983 | $84,810,375 | $54.52 |
| (1) | Based on the underwritten rent roll dated December 2, 2022, with recently executed leases as of February 2023 and with rent steps through March 2024. |
| (2) | T-12 12/31/2022 reflects the trailing 12-month period ending December 31, 2022. |
| (3) | The increase from Most Recent NOI ($) to Underwritten Net Operating Income ($) at the Scottsdale Fashion Square Property is primarily driven by rent steps and recently executed new and renewal leases. |
| (4) | Other Commercial Income includes overage / percentage rent, kiosk revenue, temporary revenue, specialty revenue and other rent income. |
| (5) | Other Revenue reflects the borrower’s miscellaneous income and parking income. |
Property Management. The Scottsdale Fashion Square Property is managed by Macerich Arizona Partners LLC, an affiliate of Macerich, one of the borrower sponsors.
Initial and Ongoing Reserves. At origination, the borrower was required to deposit into escrow (i) $10,222,200 for the Outstanding TI/LC Reserve with respect to outstanding tenant improvement allowances, leasing commissions and free or abated rent identified in a schedule to the related loan agreement and (ii) $4,316,877 for the Gap Rent Reserve with respect to gap rent earmarked for the tenants Elephante, Zimmerman and Hermes.
Tax Escrows – During the continuance of a Trigger Period (as defined below), the borrower is required to escrow 1/12th of the annual estimated tax payments payable during the next ensuing 12 months on a monthly basis.
Insurance Escrows – During the continuance of a Trigger Period, the borrower is required to escrow 1/12th of the annual estimated insurance payments on a monthly basis, except if the Scottsdale Fashion Square Property is insured under a blanket policy meeting the requirements set forth in the related loan agreement (in which case, no insurance escrows will be required, notwithstanding the occurrence of a Trigger Period).
Replacement Reserves – On a monthly basis during the continuance of a Trigger Period, the borrower is required to escrow an amount equal to the gross leasable area (excluding the Non-Collateral Square Footage (as defined below), the sq. ft. of any tenant that is required to pay for all repairs and maintenance costs for its entire leased premises, roof and structural components, and the sq. ft. of the following tenants: (i) Macy’s, (ii) Nordstrom, (iii) Neiman Marcus, (iv) Dick’s Sporting Goods, (v) Harkins Theatre, (vi) Life Time Fitness, (vii) Toca Madera, (viii) Ocean 44 and (vii) any replacement tenant that leases all or substantially all of any such premises, provided that such replacement tenant occupies such premises pursuant to a lease that contains maintenance obligations for such premises (and liability therefor) similar to the lease being replaced) multiplied by $0.25 and divided by 12 months. The monthly replacement reserve amount is estimated to be approximately $16,778. The borrower is permitted to cease monthly deposits when the replacement reserve balance is equal to the sum of 24 monthly deposits, currently estimated to be approximately $402,666. The tenants listed in clause (i) through (vi) above collectively represent 48.2% of the NRA and 12.2% of UW Base Rent.
Rollover Reserve – On a monthly basis during the continuance of a Trigger Period, the borrower is required to escrow an amount equal to the gross leasable area (excluding the Non-Collateral Square Footage and the premises leased to the following tenants: (i) Macy’s, (ii) Nordstrom, (iii) Neiman Marcus, (iv) Dick’s Sporting Goods, (v) Harkins Theatre, (vi) Life Time Fitness, (vii) Dillard’s and (viii) any replacement tenant that leases all or substantially all of any such premises as defined in the related loan agreement, multiplied by $1.00 and divided by 12 months. The monthly rollover reserve amount is estimated to be approximately $68,806. The borrower is not required to make any monthly deposits when the rollover reserve balance is equal to the sum of 24 monthly deposits, currently estimated to be $1,651,332. The borrower’s upfront deposit of $4,316,877 with respect to gap rent is not included in the calculation of the rollover reserve balance for purposes of calculating the rollover reserve cap.
| THE INFORMATION IN THIS STRUCTURAL AND COLLATERAL TERM SHEET IS NOT COMPLETE AND MAY BE AMENDED PRIOR TO THE TIME OF SALE. THIS TERM SHEET IS NOT AN OFFER TO SELL THESE SECURITIES AND IT IS NOT A SOLICITATION OF AN OFFER TO BUY THESE SECURITIES IN ANY JURISDICTION WHERE THE OFFER OR SALE IS NOT PERMITTED. | ||
| 83 | ||
7014 East Camelback Road Scottsdale, AZ 85251
| Collateral Asset Summary – Loan No. 6 Scottsdale Fashion Square | Cut-off Date Balance: Cut-off Date LTV: U/W NCF DSCR: U/W NOI Debt Yield: | $49,000,000 38.4% 1.92x 12.3% |
“Non-Collateral Square Footage” means the square footage covered by Dillard’s, the 3-story office building on Camelback Road and the land under development as a Caesar’s Republic Hotel (and the adjacent undeveloped land) on the north end of the site fronting Highland Avenue.
Lockbox / Cash Management. The Scottsdale Fashion Square Whole Loan is structured with a hard lockbox and springing cash management. The borrower and property manager are required to direct the tenants to pay rent directly into the lockbox account, and to deposit any rents otherwise received in such account within three business days after receipt. During the continuance of a Trigger Period (as defined below), all funds in the lockbox account are required to be swept on a weekly basis and on the second business day before each payment date to a lender-controlled cash management account. Funds in the cash management account are required to be applied to debt service and the reserves and escrows described above, with any excess funds (i) to be deposited into an excess cash flow reserve account held by the lender as cash collateral for the Scottsdale Fashion Square Whole Loan, or (ii) if no Trigger Period is continuing, disbursed to the borrower.
A “Trigger Period” means the period commencing upon the occurrence of (i) an event of default or (ii) a Low Debt Service Period (as defined below). A Trigger Period will end (a) with respect to the matters described in clause (i) above, if the event of default has been waived by the lender (and no other event of default is then continuing) and (b) with respect to the matters described in clause (ii) above, if a cure of the Low Debt Service Period occurs or the borrower (1) after the earlier to occur of (i) March 6, 2026 and (ii) the second anniversary of the closing date of the securitization that includes the last note of the Scottsdale Fashion Square Whole Loan to be securitized, prepays the Scottsdale Fashion Square Whole Loan in an amount that would result in a debt service coverage ratio of 1.50x in accordance with the related loan agreement, together with any applicable yield maintenance premium, or (2) delivers Credit Support (as defined below) as additional collateral causing the debt service coverage ratio to equal 1.50x.
“Credit Support” means any one or a combination of (A) cash, (B) U.S. Obligations, (C) other securities having a rating reasonably acceptable to the lender and for which a rating agency confirmation has been received or (D) a letter of credit that meets the requirements provided in the loan agreement.
A “Low Debt Service Period” will commence on any calculation date when the Scottsdale Fashion Square Whole Loan debt service coverage ratio is less than 1.50x for two consecutive calendar quarters and end when the Scottsdale Fashion Square Whole Loan debt service coverage ratio is at least 1.50x for two consecutive calendar quarters.
Current Mezzanine or Secured Subordinate Indebtedness. None. However, the borrower is permitted to obtain property assessed clean energy (PACE) or similar loans in an aggregate amount up to $10 million without the consent of the lender.
Permitted Future Mezzanine or Secured Subordinate Indebtedness. None.
Release of Collateral. The borrower may obtain a release of one or more Release Parcels (as defined below), subject to satisfaction of certain conditions including, but not limited to, (i) no event of default has occurred and is continuing, (ii) regardless of whether such release of the Release Parcel is successfully consummated, the borrower pays to the lender a processing fee in the amount of $15,000 reimburses the lender for reasonable costs and expense, and pays all title insurance and survey, (iii) the borrower delivers to the lender evidence reasonably satisfactory to a prudent lender that the Release Parcel has been (or will be upon recordation of the applicable transfer documentation which will occur contemporaneously with the release of the Release Parcel) legally subdivided from the remainder of the Scottsdale Fashion Square Property and constitutes a separate tax lot (or, if not a separate tax lot, the Release Parcel owner is contractually obligated to pay its share of all taxes and other charges with respect to the Release Parcel until the Release Parcel has been designated as a separate tax lot), and the borrower certifies to the lender that after giving effect to such transfer, each of the Release Parcel and the remaining portion of the Scottsdale Fashion Square Property conforms to and is in compliance in all material respects with applicable law, (iv) the borrower certifies to the lender that the remaining property with all easements appurtenant and other permitted encumbrances thereto will not, strictly as a result of such transfer and release of the Release Parcel, be in violation of certain reciprocal easement agreements or any then applicable law, statute, rule or regulation and (v) satisfaction of any REMIC-related release conditions.
A ”Release Parcel” is (x) a parcel on the Scottsdale Fashion Square Property that is (a) non-income producing and unimproved for tenant occupancy and (b) the release of which does not have any adverse material effect on (i) the value of the Scottsdale Fashion Square Property or the use or operation of the Scottsdale Fashion Square Property as a first-class regional shopping center (with related entertainment, dining and other compatible, commercial uses), (ii) the business, profits, operations or financial condition of the borrower, (iii) the ability of the borrower to perform its material obligations under the Scottsdale Fashion Square Whole Loan documents or (iv) the ongoing operations of the remaining Scottsdale Fashion Square Property; and/or (y) a parcel on the Scottsdale Fashion Square Property that is, as of the date of any potential release, non-income producing and improved by structures that (A) were vacant as of the origination date and (B) have been vacant and non-income producing continuously since the origination date and for at least three years prior to the date of any potential release. Improvements that are not material to the use and operation of the Scottsdale Fashion Square Property as a retail shopping center or which may be relocated without material and permanent adverse effects on the operation of the Scottsdale Fashion Square Property (as evidenced by a certification from the borrower) do not render the subject property “improved”.
| THE INFORMATION IN THIS STRUCTURAL AND COLLATERAL TERM SHEET IS NOT COMPLETE AND MAY BE AMENDED PRIOR TO THE TIME OF SALE. THIS TERM SHEET IS NOT AN OFFER TO SELL THESE SECURITIES AND IT IS NOT A SOLICITATION OF AN OFFER TO BUY THESE SECURITIES IN ANY JURISDICTION WHERE THE OFFER OR SALE IS NOT PERMITTED. | ||
| 84 | ||
| Various | Collateral Asset Summary – Loan No. 7 National Warehouse & Distribution Portfolio | Cut-off Date Balance: Cut-off Date LTV: U/W NCF DSCR: U/W NOI Debt Yield: | $35,000,000 56.7% 1.54x 13.0% |
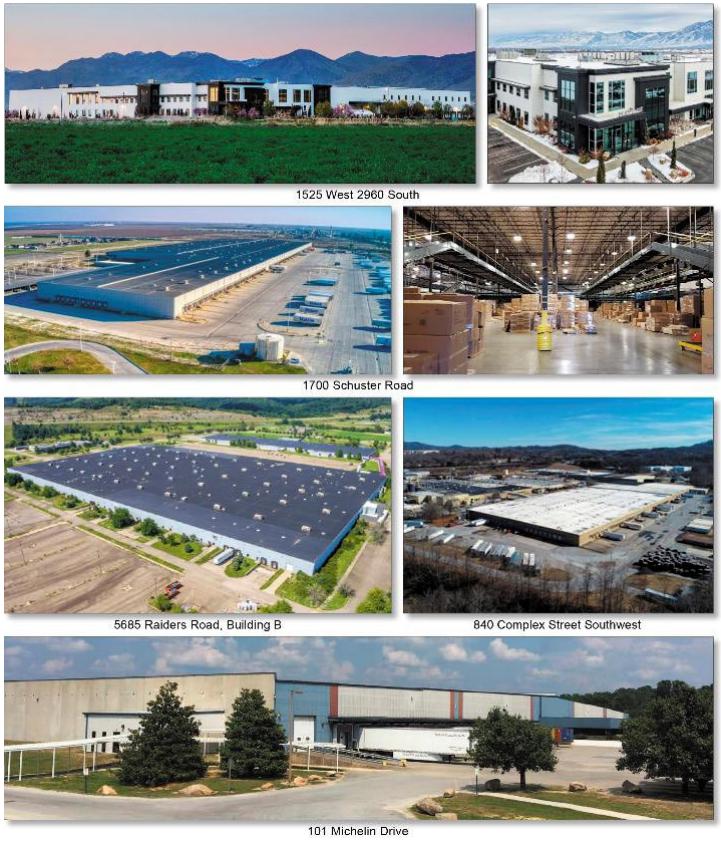
| THE INFORMATION IN THIS STRUCTURAL AND COLLATERAL TERM SHEET IS NOT COMPLETE AND MAY BE AMENDED PRIOR TO THE TIME OF SALE. THIS TERM SHEET IS NOT AN OFFER TO SELL THESE SECURITIES AND IT IS NOT A SOLICITATION OF AN OFFER TO BUY THESE SECURITIES IN ANY JURISDICTION WHERE THE OFFER OR SALE IS NOT PERMITTED. | ||
| 85 | ||
| Various | Collateral Asset Summary – Loan No. 7 National Warehouse & Distribution Portfolio | Cut-off Date Balance: Cut-off Date LTV: U/W NCF DSCR: U/W NOI Debt Yield: | $35,000,000 56.7% 1.54x 13.0% |
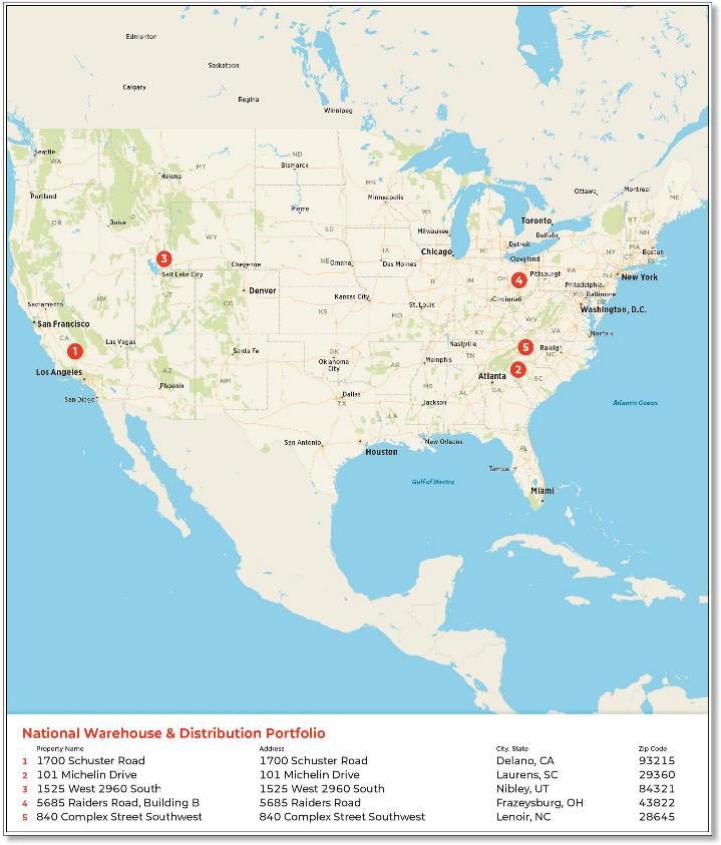
| THE INFORMATION IN THIS STRUCTURAL AND COLLATERAL TERM SHEET IS NOT COMPLETE AND MAY BE AMENDED PRIOR TO THE TIME OF SALE. THIS TERM SHEET IS NOT AN OFFER TO SELL THESE SECURITIES AND IT IS NOT A SOLICITATION OF AN OFFER TO BUY THESE SECURITIES IN ANY JURISDICTION WHERE THE OFFER OR SALE IS NOT PERMITTED. | ||
| 86 | ||
| Various | Collateral Asset Summary – Loan No. 7 National Warehouse & Distribution Portfolio | Cut-off Date Balance: Cut-off Date LTV: U/W NCF DSCR: U/W NOI Debt Yield: | $35,000,000 56.7% 1.54x 13.0% |
| Mortgage Loan Information | |
| Loan Seller: | CREFI |
| Loan Purpose: | Refinance |
| Borrower Sponsor: | Samuel Bert Malouf |
| Borrowers: | MPI Delano SPE, LLC, MPI Frazeysburg |
| SPE, LLC, MPI Laurens SPE, LLC, MPI | |
| Lenoir Complex SPE, LLC and MPI Nibley | |
| SPE, LLC | |
| Original Balance(1): | $35,000,000 |
| Cut-off Date Balance(1): | $35,000,000 |
| % by Initial UPB: | 5.3% |
| Interest Rate: | 6.81000% |
| Payment Date: | 6th of each month |
| First Payment Date: | May 6, 2023 |
| Maturity Date: | April 6, 2028 |
| Amortization: | Amortizing Balloon |
| Additional Debt(1): | $122,000,000 Pari Passu Debt |
| Call Protection(2): | L(24),D(29),O(7) |
| Lockbox / Cash Management: | Hard / Springing |
| Reserves(3) | |||
| Initial | Monthly | Cap | |
| Taxes: | $0 | Springing | NAP |
| Insurance: | $0 | Springing | NAP |
| Replacement: | $0 | $32,928 | $790,268 |
| TI/LC: | $0 | Springing | NAP |
| Immediate Repairs: | $227,688 | $0 | NAP |
| Cash Collateral Reserve: | $6,147,412 | $0 | NAP |
| Property Information | |
| Single Asset / Portfolio: | Portfolio with 5 properties |
| Property Type: | Industrial |
| Collateral: | Fee |
| Location(4): | Various |
| Year Built / Renovated(4): | Various |
| Total Sq. Ft.: | 3,951,338 |
| Property Management: | Self-Managed |
| Underwritten NOI: | $20,347,822 |
| Underwritten NCF: | $18,964,854 |
| Appraised Value: | $276,700,000 |
| Appraisal Date(5): | Various |
| Historical NOI | |
| Most Recent NOI(6): | NAV |
| 2022 NOI(6): | NAV |
| 2021 NOI(6): | NAV |
| 2020 NOI(6): | NAV |
| Historical Occupancy | |
| Most Recent Occupancy: | 100.0% (April 6, 2023) |
| 2022 Occupancy(6): | NAV |
| 2021 Occupancy(6): | NAV |
| 2020 Occupancy(6): | NAV |
| Financial Information(1) | ||||||
| Tranche | Cut-off Date Balance | Balance per Sq. Ft. Cut-off / Balloon | LTV Cut-off / Balloon(5) | U/W DSCR NOI / NCF | U/W Debt Yield NOI / NCF | U/W Debt Yield at Balloon NOI / NCF |
| Mortgage Loan | $35,000,000 | |||||
| Pari Passu Notes | $122,000,000 | |||||
| Whole Loan | $157,000,000 | $40 / $38 | 56.7% / 53.6% | 1.65x / 1.54x | 13.0% / 12.1% | 13.7% / 12.8% |
| (1) | The National Warehouse & Distribution Portfolio Mortgage Loan (as defined below) is part of the National Warehouse & Distribution Portfolio Whole Loan (as defined below) evidenced by six pari passu notes with an original aggregate principal balance of $157,000,000. The financial information in the chart above reflects the Cut-off Date Balance of the National Warehouse & Distribution Portfolio Whole Loan. See “The Loan” herein. |
| (2) | Defeasance of the National Warehouse & Distribution Portfolio Whole Loan is permitted at any time after the earlier to occur of (i) March 10, 2026 and (ii) two years from the closing date of the securitization that includes the last pari passu note of the National Warehouse & Distribution Portfolio Whole Loan to be securitized. The assumed defeasance lockout period of 24 payments is based on the expected closing date of this transaction in April 2023. The actual lockout period may be longer. The borrowers have the right to defease the National Warehouse & Distribution Portfolio Whole Loan in part or in full. See also “Partial Release” below. |
| (3) | See “Initial and Ongoing Reserves” below. |
| (4) | See “Portfolio Summary” below. |
| (5) | The Appraisals concluded to an aggregate “As-is” value of $276,700,000 as of various dates between January 23, 2023 and January 31, 2023. The Appraisals also concluded to an aggregate “go dark” value of $215,400,000 as of various dates between January 23, 2023 and January 31, 2023. The Cut-off Date LTV Ratio and the Maturity Date LTV Ratio based on the “go dark” value are 72.9% and 68.9%, respectively. |
| (6) | The borrower sponsor acquired four of the five National Warehouse & Distribution Portfolio Properties (as defined below) between 2017 and 2022. As such, historical occupancies and cash flows are not available. |
| Sources and Uses | |||||||
| Sources | Proceeds | % of Total | Uses | Proceeds | % of Total | ||
| Whole Loan | $157,000,000 | 100.0% | Loan Payoff | $125,610,988 | 80.0 | % | |
| Return of Equity | 20,133,780 | 12.8 | |||||
| Upfront Reserves | 6,375,099 | 4.1 | |||||
| Closing Costs | 4,880,133 | 3.1 | |||||
| Total Sources | $157,000,000 | 100.0% | Total Uses | $157,000,000 | 100.0 | % | |
The Loan. The National Warehouse & Distribution Portfolio mortgage loan (the “National Warehouse & Distribution Portfolio Mortgage Loan”) is part of a whole loan (the “National Warehouse & Distribution Portfolio Whole Loan”) that is evidenced by six pari passu promissory notes in the aggregate original principal amount of $157,000,000. The National Warehouse & Distribution Portfolio Whole Loan is secured by a first priority fee mortgage encumbering five industrial properties totaling 3,951,338 sq. ft., located across five states (the “National Warehouse & Distribution Portfolio Properties”). The National Warehouse & Distribution Portfolio Mortgage Loan, with an original principal amount of $35,000,000, is evidenced by the non-controlling note A-3 and note A-4-1. The National Warehouse & Distribution Portfolio Whole Loan was originated on March 10, 2023 by Citi Real Estate Funding Inc. (“CREFI”), has a five-year term that
| THE INFORMATION IN THIS STRUCTURAL AND COLLATERAL TERM SHEET IS NOT COMPLETE AND MAY BE AMENDED PRIOR TO THE TIME OF SALE. THIS TERM SHEET IS NOT AN OFFER TO SELL THESE SECURITIES AND IT IS NOT A SOLICITATION OF AN OFFER TO BUY THESE SECURITIES IN ANY JURISDICTION WHERE THE OFFER OR SALE IS NOT PERMITTED. | ||
| 87 | ||
| Various | Collateral Asset Summary – Loan No. 7 National Warehouse & Distribution Portfolio | Cut-off Date Balance: Cut-off Date LTV: U/W NCF DSCR: U/W NOI Debt Yield: | $35,000,000 56.7% 1.54x 13.0% |
amortizes on a 30-year amortization schedule and accrues interest at a fixed rate of 6.81000% per annum. The scheduled maturity date of the National Warehouse & Distribution Portfolio Whole Loan is the due date occurring in April 2028.
The below table summarizes the promissory notes that comprise the National Warehouse & Distribution Portfolio Whole Loan. The relationship between the holders of the National Warehouse & Distribution Portfolio Whole Loan is governed by a co-lender agreement. The National Warehouse & Distribution Portfolio Whole Loan will be serviced under the pooling and servicing agreement for the BANK5 2023-5YR1 securitization trust. See “Description of the Mortgage Pool—The Whole Loans—The Non-Serviced Pari Passu Whole Loans” and “Pooling and Servicing Agreement—Servicing of the Non-Serviced Mortgage Loans” in the Preliminary Prospectus.
| Whole Loan Summary | |||||||
| Note | Original Balance | Cut-off Date Balance | Note Holder | Controlling Piece | |||
| Note A-1 | $50,000,000 | $50,000,000 | BANK5 2023-5YR1(1) | Yes | |||
| Note A-2 | 30,000,000 | 30,000,000 | BANK5 2023-5YR1(1) | No | |||
| Note A-3 | 30,000,000 | 30,000,000 | Benchmark 2023-B38 | No | |||
| Note A-4-1 | 5,000,000 | 5,000,000 | Benchmark 2023-B38 | No | |||
| Note A-4-2 | 22,000,000 | 22,000,000 | CREFI(2) | No | |||
| Note A-5 | 20,000,000 | 20,000,000 | BANK5 2023-5YR1(1) | No | |||
| Total | $157,000,000 | $157,000,000 | |||||
| (1) | The BANK5 2023-5YR1 securitization transaction is expected to close on April 19, 2023. |
| (2) | Expected to be contributed to one or more future securitization transactions. |
The Borrowers / Borrower Sponsor. The borrowers comprise five single purpose entities: MPI Delano SPE, LLC, MPI Frazeysburg SPE, LLC, MPI Laurens SPE, LLC, MPI Lenoir Complex SPE, LLC and MPI Nibley SPE, LLC, each a Delaware limited liability company, and each wholly owned by MPI Group LLC, a Utah limited liability company (“MPI Group”). The borrowers have one independent director. Legal counsel to the borrowers delivered a non-consolidation opinion in connection with the origination of the National Warehouse & Distribution Portfolio Whole Loan.
The borrower sponsor and nonrecourse carve-out guarantor of the National Warehouse & Distribution Portfolio Whole Loan is Samuel Bert Malouf (“Sam Malouf”). Sam Malouf together with his wife Kacie co-founded the Malouf Companies (as further defined and described below) in 2003. Sam Malouf is currently the chief executive officer of the Malouf Companies. Sam Malouf is also a partner at Tamarak Capital, a venture capital firm headquartered in Springville, Utah which has invested in multiple industries, including B2B software, consumer goods, consumer software, home technology, industrial, fintech, automotive, and real estate. Over the course of Sam Malouf’s career, he has received the Ernst and Young Entrepreneur of the Year Award in the Utah Region, Walmart Supplier of the Year, and was named to Home Furnishings Business’s Forty under 40 list.
Each of MPI Group, the 100% owner of the borrowers, and CVB, Inc., a Utah benefit corporation (“CVB, Inc.”), that is or will be, as applicable, the sole tenant of each of the National Warehouse & Distribution Portfolio Properties (each of MPI Group and CVB, Inc., a “Malouf Company”, and collectively the “Malouf Companies”) are directly or indirectly 100% owned by Sam Malouf and his wife Kacie.
The Properties. The National Warehouse & Distribution Portfolio Properties comprise five one- and two-story, single-tenant industrial buildings located in California (39.9% of allocated loan amount), South Carolina (20.0% of allocated loan amount), Utah (16.0% of allocated loan amount), Ohio (13.4% of allocated loan amount), and North Carolina (10.6% of allocated loan amount). The National Warehouse & Distribution Portfolio Properties were built between 1970 and 2015 and range in size from 260,000 sq. ft. to 1,213,366 sq. ft., totaling 3,951,338 sq. ft. The 1525 West 2960 South property serves as Malouf Companies corporate headquarters and includes 140,000 sq. ft. of office space. As of April 6, 2023 all five properties were 100.0% leased to CVB, Inc. running through February 28, 2038 with no termination options.
1700 Schuster Road
The 1700 Schuster Road property is a 1,213,366 sq. ft., single-story warehouse/distribution center located in Delano, California. The property was built in 1993 and expanded in 1996. The property is situated on approximately 80.4 acres and is located approximately 140 miles north of Los Angeles, California. The building contains 32-foot clear heights, 185 dock-high doors, and 4 drive-in doors.
101 Michelin Drive
The 101 Michelin Drive property is a 1,170,972 sq. ft., single-story warehouse/distribution center located in Laurens, South Carolina, approximately 104 miles southwest of Charlotte, North Carolina. The property was built in 1993 and is situated on approximately 118.1 acres. The building contains 35-foot clear heights, 118 dock-high doors, and 2 drive-in doors.
1525 West 2960 South
The 1525 West 2960 South property is a 260,000 sq. ft., two-story industrial flex building located in Nibley, Utah. The property serves as Malouf Companies’ corporate headquarters and includes 140,000 sq. ft. of office space spread across two floors. The corporate headquarters space features a full-service restaurant, onsite gym with a basketball court and studio space to showcase Malouf
| THE INFORMATION IN THIS STRUCTURAL AND COLLATERAL TERM SHEET IS NOT COMPLETE AND MAY BE AMENDED PRIOR TO THE TIME OF SALE. THIS TERM SHEET IS NOT AN OFFER TO SELL THESE SECURITIES AND IT IS NOT A SOLICITATION OF AN OFFER TO BUY THESE SECURITIES IN ANY JURISDICTION WHERE THE OFFER OR SALE IS NOT PERMITTED. | ||
| 88 | ||
| Various | Collateral Asset Summary – Loan No. 7 National Warehouse & Distribution Portfolio | Cut-off Date Balance: Cut-off Date LTV: U/W NCF DSCR: U/W NOI Debt Yield: | $35,000,000 56.7% 1.54x 13.0% |
Companies’ products. The property was built in 2015 and is situated on 20.9 acres located approximately 78 miles north of Salt Lake City, Utah. The building contains 34-foot clear heights, 13 dock-high doors, and 4 drive-in doors.
5685 Raiders Road, Building B
The 5685 Raiders Road, Building B property is an 812,000 sq. ft., single-story warehouse/distribution center located in Frazeysburg, Ohio, approximately 59 miles east of Columbus, Ohio. The property was built in 1994 and most recently renovated in 2022. The property is situated on approximately 60.7 acres and contains 24-foot clear heights, 59 dock-high doors, and 3 drive-in doors.
840 Complex Street Southwest
The 840 Complex Street Southwest property is a 495,000 sq. ft., single-story warehouse/distribution center located in Lenoir, North Carolina, approximately 75 miles northwest of Charlotte, North Carolina. The property was built in 1970 and most recently renovated in 2022. The property is situated on approximately 25.5 acres and contains 20-foot clear heights, 91 dock-high doors, and 3 drive-in doors.
The following table presents certain information with respect to each of the National Warehouse & Distribution Portfolio Properties.
| Portfolio Summary(1) | ||||||||
| Property Name – Location | Net Rentable Area (SQ. FT.)(2) | Year Built / Renovated | Allocated Whole Loan Cut-off Date Balance (“ALA”) | % of ALA | As-Is Appraised Value | Clear Heights (ft.) | Dock Doors | Drive-In Doors |
| 1700 Schuster Road | 1,213,366 | 1993; 1996 / NAP | $62,700,000 | 39.9% | $100,200,000 | 32 | 185 | 4 |
| Delano, CA | ||||||||
| 101 Michelin Drive | 1,170,972 | 1993 / NAP | $31,460,000 | 20.0% | $61,300,000 | 35 | 118 | 2 |
| Laurens, SC | ||||||||
| 1525 West 2960 South | 260,000 | 2015 / NAP | $25,120,000 | 16.0% | $45,300,000 | 34 | 13 | 4 |
| Nibley, UT | ||||||||
| 5685 Raiders Road, Building B | 812,000 | 1994 / 2022 | $21,000,000 | 13.4% | $37,700,000 | 24 | 59 | 3 |
| Frazeysburg, OH | ||||||||
| 840 Complex Street Southwest | 495,000 | 1970 / 2022 | $16,720,000 | 10.6% | $32,200,000 | 20 | 91 | 3 |
| Lenoir, NC | ||||||||
| Total/Weighted Average | 3,951,338 | $157,000,000 | 100.0% | $276,700,000 | 31 | 117 | 3 | |
| (1) | Source: Appraisals. |
| (2) | Based on the underwritten rent roll. |
Sole Tenant.
CVB, Inc. (3,951,338 sq. ft.; 100.0% of NRA; 100.0% of UW Base Rent; February 28, 2038 lease expiration) – CVB, Inc. is part of the Malouf Companies. Malouf Companies was founded by Sam and Kacie Malouf in 2003 and is a consumer goods company that specializes in home furnishings and bedding products. Malouf Companies products are available in over 15,000 retail locations across 58 countries, through partnerships with major retailers such as Amazon, Walmart, Wayfair, Overstock, Target, Home Depot, Mattress Firm, and Lowes. Malouf Companies is a Certified B Corporation and currently employs over 1,200 people. CVB, Inc.’s lease expires on February 28, 2038.
| Tenant Summary(1) | |||||||
| Tenant | Ratings (Moody’s/Fitch/S&P) | Net Rentable Area (Sq. Ft.) | % of Net Rentable Area | U/W Base Rent | U/W Base Rent Per Sq. Ft. | % of Total U/W Base Rent | Lease Expiration |
| CVB, Inc.(2) | NR/NR/NR | 3,951,338 | 100.0% | $21,616,432 | $5.47 | 100.0% | 2/28/2038 |
| Total / Wtd. Avg. Occupied Collateral | 3,951,338 | 100.0% | $21,616,432 | $5.47 | 100.0% | ||
| Vacant | 0 | 0.0% | |||||
| Total | 3,951,338 | 100.00% | |||||
| (1) | Based on the underwritten rent roll. |
| (2) | With respect to the 101 Michelin Drive property, CVB, Inc. currently leases approximately 818,486 sq. ft. representing approximately 69.9% of net rentable area, and Michelin leases the remaining approximately 352,486 sq. ft., representing approximately 30.1% of net rentable area. The lease for the current tenant, Michelin, expires on July 31, 2023. Upon such expiration, CVB, Inc. will lease such space. The table above, and certain other numerical information herein, assumes that CVB, Inc. is leasing 100% of the 101 Michelin Drive property. |
| THE INFORMATION IN THIS STRUCTURAL AND COLLATERAL TERM SHEET IS NOT COMPLETE AND MAY BE AMENDED PRIOR TO THE TIME OF SALE. THIS TERM SHEET IS NOT AN OFFER TO SELL THESE SECURITIES AND IT IS NOT A SOLICITATION OF AN OFFER TO BUY THESE SECURITIES IN ANY JURISDICTION WHERE THE OFFER OR SALE IS NOT PERMITTED. | ||
| 89 | ||
| Various | Collateral Asset Summary – Loan No. 7 National Warehouse & Distribution Portfolio | Cut-off Date Balance: Cut-off Date LTV: U/W NCF DSCR: U/W NOI Debt Yield: | $35,000,000 56.7% 1.54x 13.0% |
| Lease Rollover Schedule(1) | ||||||||
| Year | # of Leases Expiring | Total Expiring Sq. Ft. | % of Total Sq. Ft. Expiring | Cumulative Sq. Ft. Expiring | Cumulative % of Sq. Ft. Expiring | Annual U/W Base Rent Per Sq. Ft. | % U/W Base Rent Rolling | Cumulative % of U/W Base Rent |
| MTM | 0 | 0 | 0.0% | 0 | 0.0% | $0.00 | 0.0% | 0.0% |
| 2023 | 0 | 0 | 0.0% | 0 | 0.0% | $0.00 | 0.0% | 0.0% |
| 2024 | 0 | 0 | 0.0% | 0 | 0.0% | $0.00 | 0.0% | 0.0% |
| 2025 | 0 | 0 | 0.0% | 0 | 0.0% | $0.00 | 0.0% | 0.0% |
| 2026 | 0 | 0 | 0.0% | 0 | 0.0% | $0.00 | 0.0% | 0.0% |
| 2027 | 0 | 0 | 0.0% | 0 | 0.0% | $0.00 | 0.0% | 0.0% |
| 2028 | 0 | 0 | 0.0% | 0 | 0.0% | $0.00 | 0.0% | 0.0% |
| 2029 | 0 | 0 | 0.0% | 0 | 0.0% | $0.00 | 0.0% | 0.0% |
| 2030 | 0 | 0 | 0.0% | 0 | 0.0% | $0.00 | 0.0% | 0.0% |
| 2031 | 0 | 0 | 0.0% | 0 | 0.0% | $0.00 | 0.0% | 0.0% |
| 2032 | 0 | 0 | 0.0% | 0 | 0.0% | $0.00 | 0.0% | 0.0% |
| 2033 | 0 | 0 | 0.0% | 0 | 0.0% | $0.00 | 0.0% | 0.0% |
| 2034 & Thereafter | 1 | 3,951,338 | 100.0% | 3,951,338 | 100.0% | $5.47 | 100.0% | 100.0% |
| Vacant | NAP | 0 | 0.0% | 3,951,338 | 100.0% | NAP | NAP | NAP |
| Total / Wtd. Avg. | 1 | 3,951,338 | 100.0% | $5.47 | 100.0% | |||
| (1) | Based on the underwritten rent roll. |
Environmental Matters. According to the Phase I environmental reports dated February 9, 2023, there was no evidence of any recognized environmental conditions at any of the National Warehouse & Distribution Portfolio Properties.
The Market. The National Warehouse & Distribution Portfolio Properties are located within the core-based statistical areas of Bakersfield, California (one property, 39.9% of the allocated loan amount), Greenville-Anderson-Mauldin, South Carolina (one property, 20.0% of the allocated loan amount), Logan, Utah-Idaho (one property, 16.0% of the allocated loan amount), Zanesville, Ohio (one property, 13.4% of the allocated loan amount) and Hickory-Lenoir-Morganton, North Carolina (one property, 10.6% of the allocated loan amount).
Market Analysis(1)
| Property Name | Market | Industrial Submarket | Submarket Inventory (Sq. Ft.) | Submarket Vacancy | Market Rent Per Sq. Ft. | UW Base Rent Per Sq. Ft.(2) |
| 1700 Schuster Road – Delano, CA | Bakersfield, CA | North Outlying Kern County | 2,418,648 | 0.4% | $8.23 | $6.10 |
| 101 Michelin Drive – Laurens, SC | Greenville-Anderson Mauldin, SC | Laurens County | 9,334,611 | 0.3% | $4.01 | $4.20 |
| 1525 West 2960 South – Nibley, UT | Logan, UT-ID | Cache County | 556,803 | 6.0% | $11.61 | $13.71 |
| 5685 Raiders Road, Building B – Frazeysburg, OH(3) | Zanesville, OH | NAV | 4,452,505 | 3.0% | $5.59 | $4.20 |
| 840 Complex Street Southwest – Lenoir, NC | Hickory-Lenoir-Morganton, NC | Caldwell County | 7,381,886 | 14.6% | $4.29 | $4.70 |
| (1) | Information obtained from third party market research reports |
| (2) | Based on the underwritten rent roll. |
| (3) | Submarket statistics at the 5685 Raiders Road, Building B property represent the Zanesville, OH industrial market. |
| THE INFORMATION IN THIS STRUCTURAL AND COLLATERAL TERM SHEET IS NOT COMPLETE AND MAY BE AMENDED PRIOR TO THE TIME OF SALE. THIS TERM SHEET IS NOT AN OFFER TO SELL THESE SECURITIES AND IT IS NOT A SOLICITATION OF AN OFFER TO BUY THESE SECURITIES IN ANY JURISDICTION WHERE THE OFFER OR SALE IS NOT PERMITTED. | ||
| 90 | ||
| Various | Collateral Asset Summary – Loan No. 7 National Warehouse & Distribution Portfolio | Cut-off Date Balance: Cut-off Date LTV: U/W NCF DSCR: U/W NOI Debt Yield: | $35,000,000 56.7% 1.54x 13.0% |
Cash Flow Analysis.
| Cash Flow Analysis(1)(2) | ||||
| U/W | U/W Per Sq. Ft. | |||
| Base Rent | $21,616,432 | $5.47 | ||
| Reimbursements | 3,755,768 | 0.95 | ||
| Gross Potential Rent | $25,372,200 | $6.42 | ||
| Less: Vacancy | (1,268,610 | ) | (0.32 | ) |
| Effective Gross Income | $24,103,590 | $6.10 | ||
| Real Estate Taxes | 1,480,594 | 0.37 | ||
| Management Fee | 723,108 | 0.18 | ||
| Insurance | 577,482 | 0.15 | ||
| Other Operating Expenses | 974,584 | 0.25 | ||
| Total Operating Expenses | $3,755,768 | $0.95 | ||
| Net Operating Income | $20,347,822 | $5.15 | ||
| Replacement Reserves | 395,134 | 0.10 | ||
| TI/LC | 987,835 | $0.25 | ||
| Net Cash Flow | $18,964,854 | $4.80 | ||
| (1) | Based on the underwritten rent roll. |
| (2) | The borrower sponsor acquired four of the five National Warehouse & Distribution Portfolio Properties between 2017 and 2022. As such, historical cash flows are not available. |
Property Management. The National Warehouse & Distribution Portfolio Properties are self-managed.
Lockbox / Cash Management. The National Warehouse & Distribution Portfolio Whole Loan is structured with a hard lockbox and springing cash management. The borrowers are required to, and are required to cause the property manager to, immediately deposit all revenue directly into a lender approved lockbox account. At origination of the National Warehouse & Distribution Portfolio Whole Loan, the borrowers delivered a tenant direction letter to each tenant at the National Warehouse & Distribution Portfolio Properties, which is an affiliate of the borrowers, directing them to pay all rent and other sums due under the applicable lease directly into the lender-controlled lockbox. All funds deposited into the lockbox are required to be transferred on each business day to or at the direction of the borrowers unless a Trigger Period (as defined below) exists. Upon the occurrence and during the continuance of a Trigger Period, all funds in the lockbox account are required to be swept on each business day to a cash management account under the control of the lender to be applied and disbursed in accordance with the National Warehouse & Distribution Portfolio Whole Loan documents, and all excess cash flow funds remaining in the cash management account after the application of such funds in accordance with the National Warehouse & Distribution Portfolio Whole Loan documents are required to be deposited in an excess cash flow account. Upon the cure of the applicable Trigger Period, so long as no other Trigger Period exists, the lender is required to return any amounts remaining on deposit in the excess cash flow account to the borrowers. Upon an event of default under the National Warehouse & Distribution Portfolio Whole Loan documents, the lender may apply funds to the debt in such priority as it may determine.
A “Trigger Period” means a period (A) commencing upon the earliest of (i) the occurrence and continuance of an event of default, (ii) the debt service coverage ratio being less than 1.30x, or (iii) the occurrence of a Specified Tenant Trigger Period (as defined below), and (B) expiring upon (x) with regard to any Trigger Period commenced in connection with clause (i) above, the cure (if applicable) of such event of default, (y) with regard to any Trigger Period commenced in connection with clause (ii) above, the date that the debt service coverage ratio is equal to or greater than 1.35x for two consecutive calendar quarters, or (z) with regard to any Trigger Period commenced in connection with clause (iii) above, a Specified Tenant Trigger Period ceasing to exist.
A “Specified Tenant” means (i) CVB, Inc., together with any successor and/or assignee, (ii) any replacement tenant that accounts for either (A) 20% or more of the total rental income for all individual National Warehouse & Distribution Portfolio Properties, or (B) demises 20% or more of the total sq. ft. for all individual National Warehouse & Distribution Portfolio Properties, (iii) any parent company of any such Specified Tenant, and any affiliate providing credit support for, or a guarantor of, any such Specified Tenant lease, and (iv) any replacement tenant that Sam Malouf and/or Malouf Companies owns a direct or indirect interest therein.
A “Specified Tenant Trigger Period” means a period (A) commencing upon the first to occur of (i) Specified Tenant being in monetary default or material non-monetary default under the applicable Specified Tenant lease beyond any applicable notice and cure periods, (ii) Specified Tenant failing to be in actual, physical possession of the Specified Tenant space (or applicable portion thereof), (iii) Specified Tenant failing to be open for business during customary hours and/or “going dark” in the Specified Tenant space (or applicable portion thereof), (iv) Specified Tenant giving notice that it is terminating its lease for all or any portion of the Specified Tenant space (or applicable portion thereof), (v) any termination or cancellation of any Specified Tenant lease (including, without limitation, rejection in any bankruptcy or similar insolvency proceeding) and/or any Specified Tenant lease failing to otherwise be in full force and effect, (vi) any bankruptcy or similar insolvency of Specified Tenant, (vii) on or after January 1, 2024, Malouf Companies, in the aggregate, fail to have and/or maintain
| THE INFORMATION IN THIS STRUCTURAL AND COLLATERAL TERM SHEET IS NOT COMPLETE AND MAY BE AMENDED PRIOR TO THE TIME OF SALE. THIS TERM SHEET IS NOT AN OFFER TO SELL THESE SECURITIES AND IT IS NOT A SOLICITATION OF AN OFFER TO BUY THESE SECURITIES IN ANY JURISDICTION WHERE THE OFFER OR SALE IS NOT PERMITTED. | ||
| 91 | ||
| Various | Collateral Asset Summary – Loan No. 7 National Warehouse & Distribution Portfolio | Cut-off Date Balance: Cut-off Date LTV: U/W NCF DSCR: U/W NOI Debt Yield: | $35,000,000 56.7% 1.54x 13.0% |
a liquidity of $18,000,000 or more, and (viii) on or after January 1, 2024, either Malouf Company being in default under any loan agreement, letter of credit, or other credit facility, as applicable, and (B) expiring upon the first to occur of the lender’s receipt of evidence reasonably acceptable to the lender of (1) the satisfaction of the applicable Specified Tenant Cure Conditions (as defined below), or (2) the borrowers leasing the entire Specified Tenant space (or applicable portion thereof) pursuant to one or more leases in accordance with the applicable terms and conditions of the National Warehouse & Distribution Portfolio Whole Loan documents for a term of at least five years, the applicable tenant(s) under such lease(s) being in actual, physical occupancy of the space demised under its lease, all contingencies to effectiveness of such lease have expired or been satisfied, each such lease has commenced and a rent commencement date has been established.
“Specified Tenant Cure Conditions” means each of the following, as applicable (i) the Specified Tenant has cured all defaults under the applicable Specified Tenant lease, (ii) the applicable Specified Tenant is in actual, physical possession of the Specified Tenant space (or applicable portion thereof) and open for business during customary hours and not “dark” in the Specified Tenant space (or applicable portion thereof), (iii) the applicable Specified Tenant has revoked or rescinded all termination or cancellation notices with respect to the applicable Specified Tenant lease and has re-affirmed the applicable Specified Tenant lease as being in full force and effect, (iv) with respect to any applicable bankruptcy or insolvency proceedings, the applicable Specified Tenant is no longer insolvent or subject to any bankruptcy or insolvency proceedings and has affirmed the applicable Specified Tenant lease pursuant to final, non-appealable order of a court of competent jurisdiction, (v) the applicable Specified Tenant is paying full, unabated rent under the applicable Specified Tenant lease, (vi) Malouf Companies have and maintain a liquidity of not less than $18,000,000, and (vii) Malouf Companies have cured any default under any applicable loan agreement, letter of credit, or other credit facility, as applicable.
Initial and Ongoing Reserves. At origination of the National Warehouse & Distribution Portfolio Whole Loan, the borrowers deposited approximately (i) $227,688 into an immediate repairs reserve, and (ii) $6,147,412 into a cash collateral reserve account to be held as additional collateral for the National Warehouse & Distribution Portfolio Whole Loan.
Real Estate Tax Reserve – The borrowers are required to deposit into a real estate tax reserve, on a monthly basis, 1/12th of the real estate taxes that the lender estimates will be payable during the next ensuing 12 months; provided, however, the borrowers have no obligation to make such monthly deposits if the Reserve Waiver Conditions (as defined below) are satisfied on such monthly payment date.
Insurance Reserve – The borrowers are required to deposit into an insurance reserve, on a monthly basis, 1/12th of an amount which would be sufficient to pay insurance premiums due for the renewal of coverage, unless an acceptable blanket policy is in place. An acceptable blanket policy was in place at origination of the National Warehouse & Distribution Portfolio Whole Loan.
Replacement Reserve – The borrowers are required to deposit into a replacement reserve, on a monthly basis, approximately $32,928, subject to a cap of approximately $790,268.
TI/LC Reserve – On each monthly payment date on and after the occurrence and continuance of a Trigger Period, the borrowers are required to deposit approximately $82,320 into a TI/LC reserve.
Cash Collateral Reserve –If the amount in the cash collateral reserve falls below $6,147,412, at any time during the term of the National Warehouse & Distribution Portfolio Whole Loan, the borrowers are required to make a true up payment with respect to such insufficiency.
“Reserve Waiver Conditions” means each of the following: (i) no event of default has occurred and is continuing, (ii) the Specified Tenant lease is in full force and effect with no defaults beyond any notice and cure periods, and (iii) the Specified Tenant continues to make the payments and perform the obligations required under the applicable lease relating to the obligations for which the tax reserve was established (directly to the applicable taxing authority) and the borrowers deliver to lender evidence of the same (including, without limitation, paid invoices) by no later than the dates required under the National Warehouse & Distribution Portfolio Whole Loan documents.
Current Mezzanine or Subordinate Indebtedness. None.
Future Mezzanine or Subordinate Indebtedness Permitted. None.
Partial Release. Provided that no event of default is continuing under the National Warehouse & Distribution Portfolio Whole Loan documents (except with respect to a partial defeasance, which is permitted even if an event of default exists), at any time after the earlier of (a) the third anniversary of the origination date of the National Warehouse & Distribution Portfolio Whole Loan, and (b) the date that is two years after the closing date of the securitization that includes the last note to be securitized, the borrowers may either deliver defeasance collateral or partially prepay the National Warehouse & Distribution Portfolio Whole Loan and obtain release of one or more individual National Warehouse & Distribution Portfolio Properties, in each case, provided that, among other conditions, (i) the defeasance collateral or partial prepayment, as applicable, is in an amount equal to the Release Price (as defined below) (and in the case of a partial prepayment prior to October 6, 2027, payment of the yield maintenance premium), (ii) the borrowers deliver a REMIC opinion, (iii) the borrowers deliver (in the case of a partial prepayment, if requested by the lender) a rating agency confirmation, (iv) as of the date of notice of the partial release and the consummation of the partial release (whether by partial prepayment or partial defeasance), after giving
| THE INFORMATION IN THIS STRUCTURAL AND COLLATERAL TERM SHEET IS NOT COMPLETE AND MAY BE AMENDED PRIOR TO THE TIME OF SALE. THIS TERM SHEET IS NOT AN OFFER TO SELL THESE SECURITIES AND IT IS NOT A SOLICITATION OF AN OFFER TO BUY THESE SECURITIES IN ANY JURISDICTION WHERE THE OFFER OR SALE IS NOT PERMITTED. | ||
| 92 | ||
| Various | Collateral Asset Summary – Loan No. 7 National Warehouse & Distribution Portfolio | Cut-off Date Balance: Cut-off Date LTV: U/W NCF DSCR: U/W NOI Debt Yield: | $35,000,000 56.7% 1.54x 13.0% |
effect to the release, the debt service coverage ratio with respect to the remaining National Warehouse & Distribution Portfolio Properties is greater than the greater of (a) 1.54x, and (b) the debt service coverage ratio for all of the National Warehouse & Distribution Portfolio Properties immediately prior to the date of notice of the partial release or the consummation of the partial release, as applicable, (v) as of the date of notice of the partial release and the consummation of the partial release (whether by partial prepayment or partial defeasance), after giving effect to the release, the loan-to-value ratio with respect to the remaining National Warehouse & Distribution Portfolio Properties is no greater than the lesser of (a) 56.7% and (b) the loan-to-value ratio for all of the National Warehouse & Distribution Portfolio Properties immediately prior to the date of notice of the partial release or the consummation of the partial release, as applicable, (vi) as of the date of notice of the partial release and the consummation of the partial release (whether by partial prepayment or partial defeasance), after giving effect to the release, the debt yield with respect to the remaining National Warehouse & Distribution Portfolio Properties is greater than the greater of (a) 12.08%, and (b) the debt yield for all of the National Warehouse & Distribution Portfolio Properties immediately prior to the date of notice of the partial release or the consummation of the partial release, as applicable, and (vii) the 1525 West 2960 South property shall be the first or second individual property to be partially released or defeased, as applicable.
“Release Price” means, as applicable, (i) with respect to any individual National Warehouse & Distribution Portfolio Property (other than the 1525 West 2960 South property and the 1700 Schuster Road property), an amount equal to the greater of (a) 130% of the allocated loan amount with respect to such individual National Warehouse & Distribution Portfolio Property and (b) 95% of the net sales proceeds applicable to such individual National Warehouse & Distribution Portfolio Property, (ii) with respect to the 1525 West 2960 South property, an amount equal to the greater of (a) 125% of the allocated loan amount with respect to the 1525 West 2960 South property and (b) 95% of the net sales proceeds applicable to the 1525 West 2960 South property, and (iii) with respect to the 1700 Schuster Road property, an amount equal to the greater of (a) $100,000,000 and (b) 95% of the net sales proceeds applicable to the 1700 Schuster Road property.
| THE INFORMATION IN THIS STRUCTURAL AND COLLATERAL TERM SHEET IS NOT COMPLETE AND MAY BE AMENDED PRIOR TO THE TIME OF SALE. THIS TERM SHEET IS NOT AN OFFER TO SELL THESE SECURITIES AND IT IS NOT A SOLICITATION OF AN OFFER TO BUY THESE SECURITIES IN ANY JURISDICTION WHERE THE OFFER OR SALE IS NOT PERMITTED. | ||
| 93 | ||
100 Jefferson Road Parsippany, NJ 07054 | Collateral Asset Summary – Loan No. 8 100 Jefferson Road | Cut-off Date Balance: Cut-off Date LTV: U/W NCF DSCR: U/W NOI Debt Yield: | $30,000,000 56.4% 1.42x 10.7% |
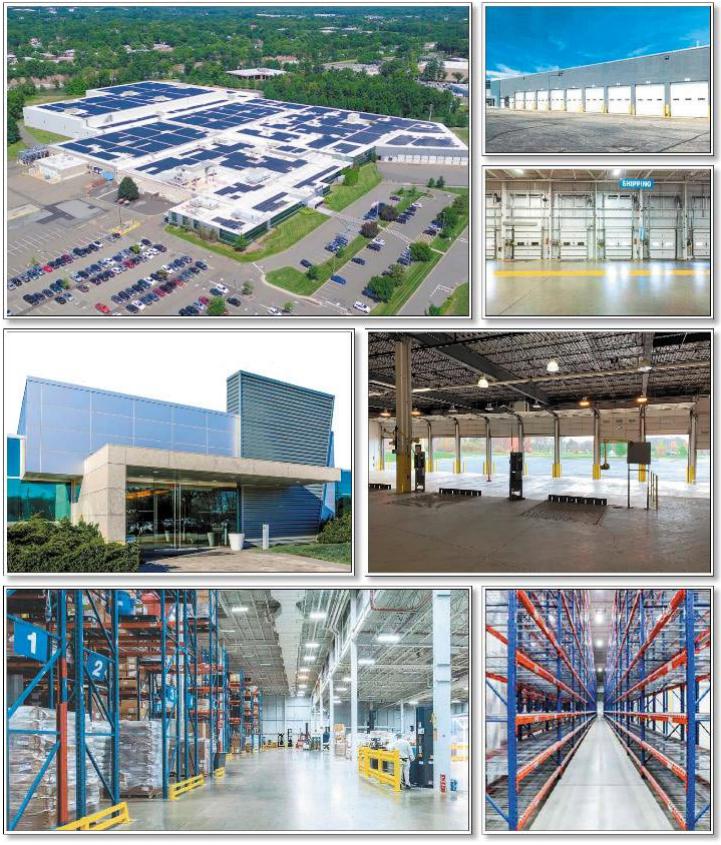
| THE INFORMATION IN THIS STRUCTURAL AND COLLATERAL TERM SHEET IS NOT COMPLETE AND MAY BE AMENDED PRIOR TO THE TIME OF SALE. THIS TERM SHEET IS NOT AN OFFER TO SELL THESE SECURITIES AND IT IS NOT A SOLICITATION OF AN OFFER TO BUY THESE SECURITIES IN ANY JURISDICTION WHERE THE OFFER OR SALE IS NOT PERMITTED. | ||
| 94 | ||
100 Jefferson Road Parsippany, NJ 07054 | Collateral Asset Summary – Loan No. 8 100 Jefferson Road | Cut-off Date Balance: Cut-off Date LTV: U/W NCF DSCR: U/W NOI Debt Yield: | $30,000,000 56.4% 1.42x 10.7% |
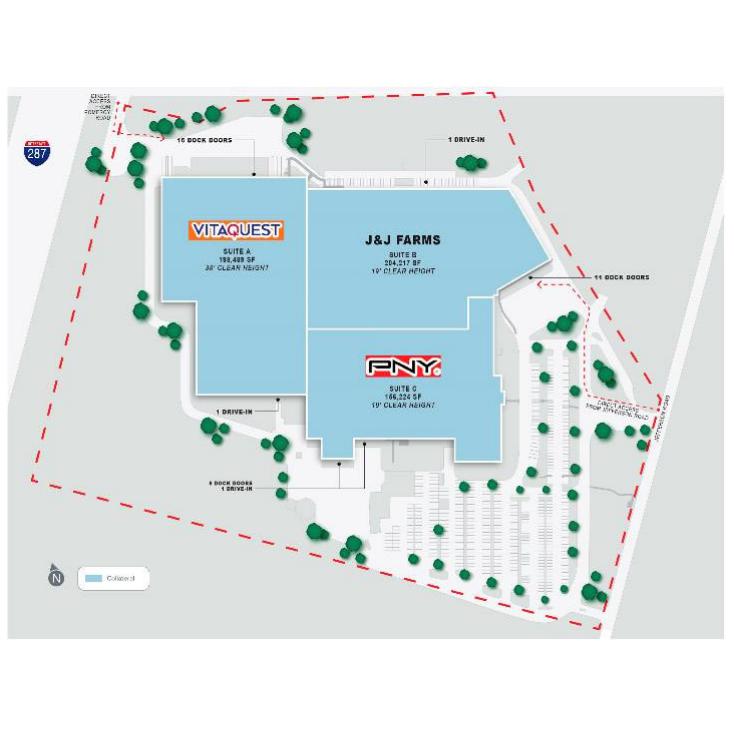
| THE INFORMATION IN THIS STRUCTURAL AND COLLATERAL TERM SHEET IS NOT COMPLETE AND MAY BE AMENDED PRIOR TO THE TIME OF SALE. THIS TERM SHEET IS NOT AN OFFER TO SELL THESE SECURITIES AND IT IS NOT A SOLICITATION OF AN OFFER TO BUY THESE SECURITIES IN ANY JURISDICTION WHERE THE OFFER OR SALE IS NOT PERMITTED. | ||
| 95 | ||
100 Jefferson Road Parsippany, NJ 07054 | Collateral Asset Summary – Loan No. 8 100 Jefferson Road | Cut-off Date Balance: Cut-off Date LTV: U/W NCF DSCR: U/W NOI Debt Yield: | $30,000,000 56.4% 1.42x 10.7% |

| THE INFORMATION IN THIS STRUCTURAL AND COLLATERAL TERM SHEET IS NOT COMPLETE AND MAY BE AMENDED PRIOR TO THE TIME OF SALE. THIS TERM SHEET IS NOT AN OFFER TO SELL THESE SECURITIES AND IT IS NOT A SOLICITATION OF AN OFFER TO BUY THESE SECURITIES IN ANY JURISDICTION WHERE THE OFFER OR SALE IS NOT PERMITTED. | ||
| 96 | ||
100 Jefferson Road Parsippany, NJ 07054 | Collateral Asset Summary – Loan No. 8 100 Jefferson Road | Cut-off Date Balance: Cut-off Date LTV: U/W NCF DSCR: U/W NOI Debt Yield: | $30,000,000 56.4% 1.42x 10.7% |
| Mortgage Loan Information | |
| Loan Seller: | JPMCB |
| Loan Purpose: | Acquisition |
| Borrower Sponsors: | Simcha Friedman and Moris Schlager |
| Borrower: | 100 Jefferson F&S LLC |
| Original Balance(1): | $30,000,000 |
| Cut-off Date Balance(1): | $30,000,000 |
| % by Initial UPB: | 4.6% |
| Interest Rate: | 7.26000% |
| Payment Date: | 6th of each month |
| First Payment Date: | May 6, 2023 |
| Maturity Date: | April 6, 2033 |
| Amortization: | Interest Only |
| Additional Debt(1): | $67,500,000 Pari Passu Debt |
| Call Protection(2): | L(24),D(92),O(4) |
| Lockbox / Cash Management(3): | Hard / Springing |
| Reserves(4) | |||
| Initial | Monthly | Cap | |
| Taxes: | $109,030 | $109,030 | N/A |
| Insurance: | $86,237 | $28,746 | N/A |
| Replacement Reserves: | $0 | $4,658 | N/A |
| Rollover Reserve: | $0 | $14,780 | $886,783 |
| J&J Farms TI Reserve: | $11,598,000 | $0 | N/A |
| Property Information | |
| Single Asset / Portfolio: | Single Asset |
| Property Type: | Warehouse / Distribution Industrial |
| Collateral: | Fee |
| Location: | Parsippany, NJ |
| Year Built / Renovated: | 1957, 1998 / 2020-2023 |
| Total Sq. Ft.: | 558,930 |
| Property Management: | Madison Properties USA LLC |
| Underwritten NOI(5): | $10,429,647 |
| Underwritten NCF: | $10,196,397 |
| Appraised Value(6): | $173,000,000 |
| Appraisal Date: | August 1, 2023 |
| Historical NOI | |
| Most Recent NOI(5): | $5,241,184 (December 31, 2022) |
| 2021 NOI: | $4,460,076 (December 31, 2021) |
| 2020 NOI(7): | NAV |
| 2019 NOI(7): | NAV |
| Historical Occupancy | |
| Most Recent Occupancy: | 100.0% (February 28, 2023) |
| 2022 Occupancy: | 74.4% (December 31, 2022) |
| 2021 Occupancy: | 68.0% (December 31, 2021) |
| 2020 Occupancy: | 63.5% (December 31, 2020) |
| Financial Information(1) | ||||||
| Tranche | Cut-off Date Balance | Balance per Sq. Ft. Cut-off / Balloon | LTV Cut-off / Balloon(6) | U/W DSCR NOI / NCF | U/W Debt Yield NOI / NCF | U/W Debt Yield at Balloon NOI / NCF |
| Mortgage Loan | $30,000,000 | |||||
| Pari Passu Notes | $67,500,000 | |||||
| Whole Loan | $97,500,000 | $174 / $174 | 56.4% / 56.4% | 1.45x / 1.42x | 10.7% / 10.5% | 10.7% / 10.5% |
| (1) | The 100 Jefferson Road Mortgage Loan (as defined below) is part of the 100 Jefferson Road Whole Loan (as defined below), evidenced by four pari passu notes with an aggregate outstanding principal balance as of the Cut-off Date of $97,500,000. Financial Information presented in the chart above reflects the 100 Jefferson Road Whole Loan. See “The Loan” herein. |
| (2) | The lockout period will be at least 24 months beginning with and including the first payment date on May 6, 2023. Defeasance of the 100 Jefferson Road Whole Loan is permitted after the date that is the earlier of (i) two years from the closing date of the securitization that includes the last note to be securitized and (ii) March 10, 2026. The assumed lockout period of 24 payments is based on the anticipated closing date of the Benchmark 2023-B38 securitization trust in April 2023. The actual lockout period may be longer. |
| (3) | The lockbox account for the 100 Jefferson Road Whole Loan was held at Signature Bank at loan origination. Subsequently, the lenders instructed the borrower not to deliver the letters to tenants directing the tenants to remit rents into the lockbox account, and the borrower is expected to open a new lockbox with another institution meeting the financial and ratings requirements. The borrower and the lenders have executed an amendment to the 100 Jefferson Road Whole Loan documents on March 24, 2023, requiring the borrower, within 60 days following such amendment, to establish a lockbox and, commencing within five business days subsequent thereto, to cause all rents to be transmitted directly by tenants at the 100 Jefferson Road Property into a lender-controlled lockbox account. Please see “Risks Relating to the Mortgage Loans—Cash Management Operations Entail Certain Risks That Could Adversely Affect Distributions on Your Certificates” in the Preliminary Prospectus for additional information. |
| (4) | See “Initial and Ongoing Reserves” herein. |
| (5) | The increase from Most Recent NOI to Underwritten NOI at the 100 Jefferson Road Property (as defined below) is primarily driven the J&J Farms Creamery lease executed with a commencement date in March 2023. J&J Farms Creamery is an affiliate of the borrower sponsors. |
| (6) | The Appraised Value represents the “prospective value upon completion/stabilization” as of August 1, 2023, based on the extraordinary assumption that J&J Farms Creamery will complete the buildout of its space. The borrower sponsors have provided a completion guaranty and the estimated cost of the buildout (in the amount of $11.598 million) was reserved for at origination. The Cut-off Date LTV and Balloon LTV are calculated based on the value upon completion/stabilization. The “As Is” appraised value is $163,600,000 which results in an LTV as of the Cut-off date of 59.6%. |
| (7) | Historical cash flow prior to 2021 is not available as the transaction represents acquisition financing and borrower sponsor was not provided such historical financial information. |
The Loan. The 100 Jefferson Road mortgage loan (the “100 Jefferson Road Mortgage Loan”) is part of a whole loan (the “100 Jefferson Road Whole Loan”) evidenced by four pari passu notes in the aggregate outstanding principal balance as of the Cut-off Date of $97,500,000 and secured by the borrower’s fee interest in an industrial warehouse/distribution facility in Parsippany, New Jersey (the “100 Jefferson Road Property”). The 100 Jefferson Road Whole Loan was originated by Argentic Real Estate Finance 2 LLC (“AREF2”) and JPMCB, on March 10, 2023. The non-controlling Note A-1 with an original principal balance of $30,000,000 will be included in the Benchmark 2023-B38 securitization trust.
| THE INFORMATION IN THIS STRUCTURAL AND COLLATERAL TERM SHEET IS NOT COMPLETE AND MAY BE AMENDED PRIOR TO THE TIME OF SALE. THIS TERM SHEET IS NOT AN OFFER TO SELL THESE SECURITIES AND IT IS NOT A SOLICITATION OF AN OFFER TO BUY THESE SECURITIES IN ANY JURISDICTION WHERE THE OFFER OR SALE IS NOT PERMITTED. | ||
| 97 | ||
100 Jefferson Road Parsippany, NJ 07054 | Collateral Asset Summary – Loan No. 8 100 Jefferson Road | Cut-off Date Balance: Cut-off Date LTV: U/W NCF DSCR: U/W NOI Debt Yield: | $30,000,000 56.4% 1.42x 10.7% |
The table below summarizes the promissory notes that comprise the 100 Jefferson Road Whole Loan. The relationship between the holders of the 100 Jefferson Road Whole Loan is governed by a co-lender agreement. The 100 Jefferson Road Whole Loan is expected to initially be serviced pursuant to the pooling and servicing agreement for the Benchmark 2023-B38 securitization until the controlling Note A-2 is securitized, whereupon the 100 Jefferson Road Whole Loan will be serviced pursuant to a pooling and servicing agreement for such future securitization; provided, that if a related non-controlling companion loan is securitized in a transaction that closes prior to Benchmark 2023-B38, the 100 Jefferson Whole Loan will initially be serviced under such earlier transaction. See “Description of the Mortgage Pool— The Whole Loans—The Serviced Pari Passu Whole Loans”, “—The Non-Serviced Pari Passu Whole Loans” and “Pooling and Servicing Agreement—Servicing of the Non-Serviced Mortgage Loans” in the Preliminary Prospectus.
| Whole Loan Summary | |||||
| Note | Original Balance | Cut-off Date Balance | Note Holder | Controlling Piece | |
| A-1 | $30,000,000 | $30,000,000 | Benchmark 2023-B38 | No | |
| A-2 | $29,500,000 | $29,500,000 | AREF2 or an affiliate(1) | Yes | |
| A-3 | $29,500,000 | $29,500,000 | AREF2 or an affiliate(1) | No | |
| A-4 | $8,500,000 | $8,500,000 | AREF2 or an affiliate(1) | No | |
| Whole Loan | $97,500,000 | $97,500,000 | |||
| (1) | The related notes are expected to be contributed to one or more future securitizations or otherwise transferred at any time. |
| Sources and Uses | ||||||||
| Sources | Proceeds | % of Total | Uses | Proceeds | % of Total | |||
| Whole Loan | $97,500,000 | 67.7 | % | Purchase Price(1) | $130,500,000 | 90.6 | % | |
| Sponsor Equity | 31,613,758 | 21.9 | Upfront Reserves | 11,793,267 | 8.2 | |||
| Seller TI Credit(1) | 15,000,000 | 10.4 | Closing Costs | 1,820,491 | 1.3 | |||
| Total Sources | $144,113,758 | 100.0 | % | Total Uses | $144,113,758 | 100.0 | % | |
| (1) | The 100 Jefferson Road Property was 63.5% occupied prior to acquisition and origination of the 100 Jefferson Road Whole Loan. The seller provided the borrower with $15.0 million in credits to cover tenant improvements and closing costs. A reserve in the amount of $11.598 million, which represents the anticipated cost of renovations for the J&J Farms Creamery space, was established at origination. |
The Borrower and the Borrower Sponsors. The borrower is 100 Jefferson F&S LLC, a single purpose entity with two independent directors. Legal counsel to the 100 Jefferson Road Whole Loan borrower delivered a non-consolidation opinion in connection with the origination of the 100 Jefferson Road Whole Loan. The 100 Jefferson Road Whole Loan will be fully recourse to the non-recourse carveout guarantors until the buildout is completed in accordance with the terms of the 100 Jefferson Road Whole Loan documents.
The borrower sponsors and non-recourse carveout guarantors are Simcha Friedman and Moris Schlager. Simcha Friedman and Moris Schlager are the principals of J&J Farms Creamery, a wholesale distributor of refrigerated goods established in the 1950’s that services the New York and New Jersey region.
The Property. The 100 Jefferson Road Property is a multi-tenanted industrial warehouse and distribution complex containing 558,930 sq. ft. located in Parsippany, Morris County, New Jersey. The 100 Jefferson Road Property is divided among three suites (A, B and C). Suite A contains 198,489 sq. ft., was built in 1998 and renovated in 2020, Suite B contains 204,217 sq. ft., was built in 1957 and is currently being built out to accommodate 157,547 sq. ft. of cold storage space and Suite C contains 156,224 sq. ft. and was built in 1957. The 100 Jefferson Road Property is situated on a 35.9-acre site and features approximately 10% office space, clear heights ranging from 19 to 38 feet, three drive-in doors and 35 dock-high doors. The 100 Jefferson Road Property also features a 10-acre solar panel on the building’s roof which was installed in 2011. Parking is provided by 514 surface parking spaces (0.92 spaces per 1,000 sq. ft.). The 100 Jefferson Road Property is currently 100.0% occupied by three tenants. Suite A is occupied by Vitaquest International LLC, Suite B is occupied by J&J Farms Creamery (an affiliate of the borrower sponsor) and Suite C is occupied by PNY Technologies Inc.
Pfizer owned and occupied the 100 Jefferson Road Property until 2010 when it was sold to PNY Technologies Inc., the third largest tenant. Between 2010 and 2011, PNY Technologies Inc. invested approximately $12 million into the 100 Jefferson Road Property building out manufacturing/distribution space, a new roof and solar panel equipment. In 2018, PNY Technologies Inc. sold the 100 Jefferson Road Property via a sale leaseback transaction to a joint venture between the Harbor Group and Turnbridge Equities (“Harbor Group”) and downsized to its current square footage (156,224 sq. ft.; 28.0% of NRA). The Harbor Group completed a $4.5 million renovation and white boxed Suite B. In the second quarter of 2019, Vitaquest International LLC signed a lease for 198,489 sq. ft. (35.5% of NRA) and completed a $15.0 million renovation between 2020 and 2021. The seller purchased the 100 Jefferson Road Property in October 2020 at 63.5% occupancy and signed a temporary lease with Walmart while negotiating longer term permanent leases. At the time, the seller also invested $1.0 million for installation of LED lights throughout Suite B. In conjunction with the current acquisition of the 100 Jefferson Road Property, J&J Farms Creamery, an affiliate of the borrower sponsors, executed a lease for Suite B bringing occupancy to 100.0%.
| THE INFORMATION IN THIS STRUCTURAL AND COLLATERAL TERM SHEET IS NOT COMPLETE AND MAY BE AMENDED PRIOR TO THE TIME OF SALE. THIS TERM SHEET IS NOT AN OFFER TO SELL THESE SECURITIES AND IT IS NOT A SOLICITATION OF AN OFFER TO BUY THESE SECURITIES IN ANY JURISDICTION WHERE THE OFFER OR SALE IS NOT PERMITTED. | ||
| 98 | ||
100 Jefferson Road Parsippany, NJ 07054 | Collateral Asset Summary – Loan No. 8 100 Jefferson Road | Cut-off Date Balance: Cut-off Date LTV: U/W NCF DSCR: U/W NOI Debt Yield: | $30,000,000 56.4% 1.42x 10.7% |
Major Tenants. The three largest tenants based on sq. ft. are J&J Farms Creamery, Vitaquest International LLC, and PNY Technologies Inc.
J&J Farms Creamery (204,217 sq. ft.; 36.5% of NRA; 61.2% of underwritten base rent): J&J Farms Creamery is a wholesale distributor with various national brand refrigerated products and a complete line of Kosher refrigerated dairy products. J&J Farms Creamery was founded in 1951 and is now one of the larger independently owned Kosher refrigerated product providers in New York and New Jersey with approximately 100 employees. The company’s top three customer accounts by annual sales include independently owned grocery store chains Key Foods ($37.2 million, 13.8% of 2022 revenue), Associated Supermarket Group ($37.0 million, 13.7% of 2022 revenue), and C-Town Supermarkets ($17.6 million, 6.5% of 2022 revenue) each of which has 200 to 275 stores in the tri-state area.
J&J Farms Creamery reported gross profit of approximately $25.6 million for 2022, an approximately 42% increase over the prior year. J&J Farms Creamery also reported earnings before income, taxes, depreciation, amortization and rent costs (“EBITDAR”) of approximately $10.5 million in 2022, over two times reported EBITDAR for 2021. J&J Farms Creamery does not have any major financial debt obligations other than $200,000 of total notes payable to shareholders. According to the borrower sponsor, the increase in revenue was primarily attributable to increases in sales volume and price inflation. Based on 2022 financials adjusted for proforma rent expenses, EBITDAR to current gross rent ratio would be approximately 1.37x. J&J Farms Creamery is an affiliate of the borrower sponsor and is expected to relocate its operations from an approximately 70,000 sq. ft. warehouse in Queens, New York. The 100 Jefferson Road Property provides close to three times the square footage as compared to its Queens, New York warehouse.
Furthermore, J&J Farms Creamery is currently renovating its space with an anticipated cost of completion in the amount of approximately $11.6 million which was escrowed at origination (“J&J Farms Creamery TIs”). Upon completion, the space is expected to consist of 157,547 sq. ft. of refrigerated storage, 13,595 sq. ft. of dry storage, 12,870 sq. ft. of office space, and the approximately 20,205 sq. ft. to be comprised of refrigerated loading/distribution areas, loading docks and drive-in bays. In the event the buildout is not completed within 12 months of origination, a Lease Sweep Period (as defined below) commences. However, such 12-month period can be extended by 60 days if the lender determines J&J Farms Creamery is using commercially reasonable and diligent efforts to complete the J&J Farms Creamery TIs and the J&J Farms Creamery TIs can reasonably be completed within such additional 60-day time period. Furthermore, the 100 Jefferson Road Whole Loan will be fully recourse to the non-recourse carveout guarantors until the buildout is completed in accordance with the terms of the 100 Jefferson Road Whole Loan documents. We cannot assure you that the renovations described above will be completed as expected or at all.
At origination of the 100 Jefferson Road Whole Loan, J&J Farms Creamery executed a 15-year lease expiring in February 2038 at $30.00 per sq. ft. with 2.0% escalations and no termination options. Typically, cold storage space commands a premium to traditional warehouse/distribution space, largely accounting for J&J Farms Creamery’s rent relative to the two remaining traditional industrial warehouse tenants. The borrower sponsors provided a 50% lease guaranty during the first five years of the lease term that reduces to 25% starting in year six of the lease term, provided, however if there is a Lease Guaranty Period (as defined below) then continuing, the guarantors’ liability will not be reduced to 25% until such Lease Guaranty Period terminates.
“Lease Guaranty Period” means a period which will (x) commence upon the occurrence of a Cash Management Period (as defined below), except that for the purposes of the lease guaranty, a Cash Management Period will not be deemed to have occurred if such Cash Management Period results solely from the occurrence of a Lease Sweep Period attributable to any Lease Sweep Lease (as defined below) other than the J&J Farms Creamery lease and end upon the termination of such Cash Management Period.
Vitaquest International LLC (198,489 sq. ft.; 35.5% of NRA; 19.4% of underwritten base rent): Vitaquest International LLC (“Vitaquest”) is a development and commercialization partner for consumer products such as nutraceuticals, functional foods, and probiotics. Vitaquest was founded in 1977, and currently has approximately 630 employees. Vitaquest reported 2022 revenue and net income of $270.8 million and $23.2 million, respectively. Vitaquest commenced a 130-month lease in May 2019, has three, five-year renewal options remaining and no termination options. In 2020-2021, Vitaquest completed a $15 million renovation of its space with the prior owner contributing approximately $500,000. Vitaquest’s current rent of $9.76 per sq. ft. is 34.9% below the appraiser’s concluded market rent of $15.00 per sq. ft.
PNY Technologies Inc. (156,224 sq.ft.; 28.0% of NRA; 19.4% of underwritten base rent): PNY Technologies Inc. is a manufacturer of OEM, consumer, and channel electronics markets. Founded in 1985, PNY Technologies Inc. has over 1,000 employees. PNY Technologies Inc. reported 2021 revenue and net income of $937.0 million and $61.5 million, respectively. The 100 Jefferson Road Property serves as the company’s headquarters. PNY Technologies Inc. owned 100 Jefferson Road Property from 2010 to 2018. In 2018, PNY Technologies Inc. sold the 100 Jefferson Road Property via a sale leaseback transaction and signed a 10-year lease expiring in October 2028. PNY Technologies Inc’s. current rent of $12.45 per sq. ft. is 17.0% below the appraiser’s concluded market rent of $15.00 per sq. ft.
| THE INFORMATION IN THIS STRUCTURAL AND COLLATERAL TERM SHEET IS NOT COMPLETE AND MAY BE AMENDED PRIOR TO THE TIME OF SALE. THIS TERM SHEET IS NOT AN OFFER TO SELL THESE SECURITIES AND IT IS NOT A SOLICITATION OF AN OFFER TO BUY THESE SECURITIES IN ANY JURISDICTION WHERE THE OFFER OR SALE IS NOT PERMITTED. | ||
| 99 | ||
100 Jefferson Road Parsippany, NJ 07054 | Collateral Asset Summary – Loan No. 8 100 Jefferson Road | Cut-off Date Balance: Cut-off Date LTV: U/W NCF DSCR: U/W NOI Debt Yield: | $30,000,000 56.4% 1.42x 10.7% |
The following table presents certain information relating to the tenants at the 100 Jefferson Property:
| Tenant Summary(1) | ||||||||
| Tenant | Credit Rating (Moody’s/Fitch/S&P) | Net Rentable Area (Sq. Ft.) | % of Net Rentable Area | U/W Base Rent Per Sq. Ft | UW Base Rent | % of Total U/W Base Rent | Lease Expiration | |
| J&J Farms Creamery(2)(3) | NR/NR/NR | 204,217 | 36.5% | $30.00 | (2) | $6,126,510 | 61.2% | 2/28/2038 |
| Vitaquest International LLC | NR/NR/NR | 198,489 | 35.5% | $9.76 | $1,937,869 | 19.4% | 2/28/2030 | |
| PNY Technologies Inc. | NR/NR/NR | 156,224 | 28.0% | $12.45 | $1,944,284 | 19.4% | 10/4/2028 | |
| Total Occupied | 558,930 | 100.0% | $17.91 | $10,008,663 | 100.0% | |||
| Vacant Space | 0 | 0.0% | ||||||
| Collateral Total | 558,930 | 100.0% | ||||||
| (1) | Based on the underwritten rent roll dated February 28, 2023 inclusive of contractual rent steps through October 2023. |
| (2) | J&J Farms Creamery’s leased space is largely to be comprised of cold storage which commands a premium in rental rate as compared to traditional warehouse space (including Vitaquest International LLC and PNY Technologies, Inc.) |
| (3) | J&J Farms Creamery is an affiliate of the borrower sponsor. |
| Lease Rollover Schedule(1) | |||||||||||
| Year | # of Leases Expiring | Total Expiring Sq. Ft. | % of Total Sq. Ft. Expiring | U/W Base Rent Expiring | % U/W Base Rent Expiring | Cumulative Sq. Ft. Expiring | Cumulative % of Sq. Ft. Expiring | Cumulative U/W Base Rent Expiring | Cumulative % of U/W Base Rent Expiring | ||
| MTM & 2023 | 0 | 0 | 0.0 | $0 | 0.0 | % | 0 | 0.0% | $0 | 0.0% | |
| 2024 | 0 | 0 | 0.0 | 0 | 0.0 | 0 | 0.0% | $0 | 0.0% | ||
| 2025 | 0 | 0 | 0.0 | 0 | 0.0 | 0 | 0.0% | $0 | 0.0% | ||
| 2026 | 0 | 0 | 0.0 | 0 | 0.0 | 0 | 0.0% | $0 | 0.0% | ||
| 2027 | 0 | 0 | 0.0 | 0 | 0.0 | 0 | 0.0% | $0 | 0.0% | ||
| 2028 | 1 | 156,224 | 28.0 | 1,944,284 | 19.4 | 156,224 | 28.0% | $1,944,284 | 19.4% | ||
| 2029 | 0 | 0 | 0.0 | 0 | 0.0 | 156,224 | 28.0% | $1,944,284 | 19.4% | ||
| 2030 | 1 | 198,489 | 35.5 | 1,937,869 | 19.4 | 354,713 | 63.5% | $3,882,153 | 38.8% | ||
| 2031 | 0 | 0 | 0.0 | 0 | 0.0 | 354,713 | 63.5% | $3,882,153 | 38.8% | ||
| 2032 | 0 | 0 | 0.0 | 0 | 0.0 | 354,713 | 63.5% | $3,882,153 | 38.8% | ||
| 2033 | 0 | 0 | 0.0 | 0 | 0.0 | 354,713 | 63.5% | $3,882,153 | 38.8% | ||
| 2034 & Thereafter | 1 | 204,217 | 36.5 | 6,126,510 | 61.2 | 558,930 | 100.0% | $10,008,663 | 100.0% | ||
| Vacant | NAP | 0 | 0.0 | % | NAP | NA | P | 0 | 0.0% | NAP | NAP |
| Total / Wtd. Avg. | 3 | 558,930 | 100.0 | % | $10,008,663 | 100.0 | % | ||||
| (1) | Based on the underwritten rent roll dated February 28, 2023 inclusive of contractual rent steps through October 2023. |
The following table presents certain information relating to the historical and current occupancy of the 100 Jefferson Road Property:
| Historical Occupancy | |||
| 2020(1) | 2021(1) | 2022(1) | 2/28/2023(2) |
| 63.5% | 68.0% | 74.4% | 100.0% |
| (1) | Historical occupancy is as of December 31 for each respective year. Please see “The Property” for information on historical occupancy. |
| (2) | Based on the underwritten rent roll dated February 28, 2023. |
Environmental Matters. According to the Phase I environmental assessment dated December 9, 2022, there is no evidence of any recognized environmental conditions at the 100 Jefferson Road Property. However, the environmental consultant identified (i) a controlled recognized environmental condition in connection with (A) controls being in place in the form of a deed notice for residual pesticide impacts and total petroleum hydrocarbon impacts to the 100 Jefferson Road Property and (B) the issuance of regulatory closure through a restricted use response action outcome and (ii) historical recognized environmental conditions in connection with closed release incidents, removed underground storage tanks and other areas of concern that have been issued no further action status. See “Description of the Mortgage Pool—Environmental Considerations” in the Preliminary Prospectus.
The Market. The 100 Jefferson Road Property is located in Parsippany, New Jersey, approximately 27 miles west of New York City and forms part of the Newark, NJ-PA Metropolitan Statistical Area (“MSA”). The top three industries within New Jersey are Services, Finance/Insurance/Real Estate, and Manufacturing. Primary access to the 100 Jefferson Road Property is provided by Interstate 287 and Interstate 80, which provide direct access to New York City and New York State. The 100 Jefferson Road Property is located in Parsippany Township, which serves as one of the major employment centers in Northern New Jersey as it encompasses over 14 million sq. ft. of office space and 4.8 million sq. ft. of industrial space.
| THE INFORMATION IN THIS STRUCTURAL AND COLLATERAL TERM SHEET IS NOT COMPLETE AND MAY BE AMENDED PRIOR TO THE TIME OF SALE. THIS TERM SHEET IS NOT AN OFFER TO SELL THESE SECURITIES AND IT IS NOT A SOLICITATION OF AN OFFER TO BUY THESE SECURITIES IN ANY JURISDICTION WHERE THE OFFER OR SALE IS NOT PERMITTED. | ||
| 100 | ||
100 Jefferson Road Parsippany, NJ 07054 | Collateral Asset Summary – Loan No. 8 100 Jefferson Road | Cut-off Date Balance: Cut-off Date LTV: U/W NCF DSCR: U/W NOI Debt Yield: | $30,000,000 56.4% 1.42x 10.7% |
According to the appraisal, the 2022 population within a one-, three- and five-mile radius was 3,495, 66,206, and 152,460, respectively. Additionally, for the same period, the median household income within a one-, three- and five-mile radius was $134,049, $124,048, and $128,571, respectively.
According to the appraisal, the 100 Jefferson Road Property is located within the Eastern Morris Industrial Submarket. As of the first quarter of 2023, the Eastern Morris Industrial Submarket has an inventory of approximately 23.0 million sq. ft., with 8,000 sq. ft. under construction. The submarket has a vacancy rate of 4.8%. The overall rental rate in the submarket for industrial space (non-cold storage) is $15.56 per sq. ft., an increase of 14.8% over the fourth quarter of 2021. According to a third-party report, Northern New Jersey refrigerated warehouse occupancy is 99%. The appraiser concluded to a market rent of $15.00 per sq. ft. for the warehouse space (Suites A and C) and $28.50 per sq. ft. for the cold storage space (Suite B) for the 100 Jefferson Road Property.
The following table presents certain information relating to comparable industrial sales for the 100 Jefferson Road Property:
| Comparable Industrial Sales(1) | |||||||
| Property / Location | Gross Building Area (SF) | Year Built / Renovated | Occupancy | Sale Date | Sale Price | Price PSF | Cap Rate |
| 100 Jefferson Road | 558,930(2) | 1957, 1998 / 2020-2023 | 100.0%(2) | Mar-23 | $130,500,000(3) | $233.48 | N/A |
| Parsippany, NJ | |||||||
| 20-30 Continental Drive | 567,066 | 1980 | 100.0% | Jun-22 | $138,530,000 | $244.29 | 4.14% |
| Wayne, NJ | |||||||
| 241 Oraton Street | 131,205 | 1995 | 100.0% | Dec-21 | $32,000,000 | $243.89 | 3.76% |
| Newark, NJ | |||||||
| 65 Baekeland Avenue | 400,000 | 2021 | 100.0% | Oct-21 | $131,100,000 | $327.75 | 2.90% |
| Middlesex, NJ | |||||||
| FedEx Ground | 269,204 | 2010 | 100.0% | Jul-21 | $91,000,000 | $338.03 | 4.50% |
| South Brunswick, NJ | |||||||
| 66-96 East Union Avenue | 102,224 | 1960 | 100.0% | Jan-21 | $24,500,000 | $239.67 | 5.15% |
| East Rutherford, NJ | |||||||
| (1) | Source: Appraisal. |
| (2) | Based on the underwritten rent roll dated February 28, 2023. |
| (3) | The 100 Jefferson Road Property was 63.5% occupied at the time of acquisition. The seller provided the borrower with $15.0 million in credits to cover tenant improvements and closing costs. A reserve in the amount of $11.598 million was established at origination which represents the anticipated cost of renovations for the J&J Farms Creamery space. |
The following table presents certain information relating to comparable industrial leases for the 100 Jefferson Road Property:
| Comparable Industrial Rental Summary(1) | ||||||||
| Property Name/Location | Year Built | Gross Building Area (SF) | Tenant Size (SF) | Tenant Name | Clear Height | Rent PSF | Commencement | Lease Term (Months) |
| 100 Jefferson Road | 1957, 1998 | 558,930(2) | 198,489(2) | Vitaquest International LLC | 38’ | $9.76(2) | May-19(2) | 130(2) |
| Parsippany, NJ | ||||||||
| 340 Kaplan Drive | 1901 | 30,494 | 30,494 | Dish Network | 18’ | $15.00 | Sep-22 | 61 |
| Fairfield, NJ | ||||||||
1100 Randolph Road
Somerset, NJ | 1968 | 207,192 | 103,246 | ELM | 27’ | $14.50 | Jul-22 | 121 |
| 1 Truman Drive South | 1978 | 369,313 | 142,365 | Menasha Packaging | 24’ | $15.00 | May-22 | 60 |
| Edison, NJ | ||||||||
| 140-142 Clinton Road | 1968 | 77,983 | 41,458 | All-State Floor | 21’ | $13.90 | Apr-22 | 60 |
| Fairfield Township, NJ | ||||||||
| 220 Mill Road | 1991 | 467,000 | 112,000 | Impex | 36’ | $15.00 | Mar-22 | 60 |
| Edison, NJ | ||||||||
| (1) | Source: Appraisal. |
| (2) | Based on the underwritten rent roll dated February 28, 2023. |
| THE INFORMATION IN THIS STRUCTURAL AND COLLATERAL TERM SHEET IS NOT COMPLETE AND MAY BE AMENDED PRIOR TO THE TIME OF SALE. THIS TERM SHEET IS NOT AN OFFER TO SELL THESE SECURITIES AND IT IS NOT A SOLICITATION OF AN OFFER TO BUY THESE SECURITIES IN ANY JURISDICTION WHERE THE OFFER OR SALE IS NOT PERMITTED. | ||
| 101 | ||
100 Jefferson Road Parsippany, NJ 07054 | Collateral Asset Summary – Loan No. 8 100 Jefferson Road | Cut-off Date Balance: Cut-off Date LTV: U/W NCF DSCR: U/W NOI Debt Yield: | $30,000,000 56.4% 1.42x 10.7% |
The following table presents certain information relating to comparable cold storage leases for the 100 Jefferson Road Property:
| Comparable Cold Storage Rental Summary(1) | ||||||||
| Property / Location | Year Built | Gross Building Area (SF) | Tenant Size (SF) | Tenant Name | Clear Height | Rent PSF | Commencement | Lease Term (Months) |
| 100 Jefferson Road | 1957, 1998 | 558,930(2) | 204,217(2) | J&J Farms Creamery | 19’ | $30.00(2) | Mar-23(2) | 180(2) |
| Parsippany, NJ | ||||||||
| Confidential | 2003 | 75,000 | 75,000 | Confidential Cold Storage | 36’ | $28.00 | Jan-23 | 60 |
| Carlstadt, NJ | ||||||||
| 408 Fairfield Road | 2023 | 368,050 | 33,000 | Quality Frozen Foods | 38’ | $25.00 | Jan-23 | 120 |
| Freehold, NJ | ||||||||
| 205 Jackson Street | 1977 | 32,000 | 32,000 | Rivera Produce Corporation | 21’ | $25.00 | Jun-22 | 60 |
| Englewood, NJ | ||||||||
| 120 Frontage Road | 2021 | 75,900 | 75,900 | Alliance Ground International | 36’ | $28.00 | Dec-21 | 123 |
| Newark, NJ | ||||||||
| 200 Polar Way | 2003 | 49,500 | 46,900 | Lineage Logistics | 24’ – 33’ | $24.00 | Nov-21 | 60 |
| Jersey City, NJ | ||||||||
| FreezPak Logistics | 2023 | 268,000 | 268,000 | FreezPak Logistics | 36’ | $25.00 | Nov-21 | 300 |
| Avenel, NJ | ||||||||
| (1) | Source: Appraisal. |
| (2) | Based on the underwritten rent roll dated February 28, 2023. |
Cash Flow Analysis.
| Cash Flow Analysis(1) | ||||
| 2021 | 2022 | U/W(2) | U/W PSF | |
| Rents in Place(2) | $4,254,197 | $4,771,174 | $9,909,377 | $17.73 |
| Vacant Income | 0 | 0 | 0 | 0.0 |
| Contractual Rent Steps(3) | 0 | 0 | 99,287 | 0.18 |
| Gross Potential Rent | $4,254,197 | $4,771,174 | $10,008,663 | $17.91 |
| Total Reimbursements | 1,787,756 | 1,814,588 | 3,160,805 | 5.66 |
| Electric Reimbursement(4) | 811,626 | 1,151,036 | 1,185,587 | 2.12 |
| Net Rental Income | $6,853,579 | $7,736,798 | $14,355,055 | $25.68 |
| Other Income | 588,082 | 695,998 | 695,998 | 1.25 |
| (Vacancy/Credit Loss) | 0 | 0 | (717,753) | (1.28) |
| Effective Gross Income | $7,441,661 | $8,432,796 | $14,333,301 | $25.64 |
| Total Expenses | 2,981,585 | 3,191,612 | 3,903,654 | 6.98 |
| Net Operating Income | $4,460,076 | $5,241,184 | $10,429,647 | $18.66 |
| Capital Expenditures | 0 | 0 | 55,893 | 0.10 |
| TI/LC | 0 | 0 | 177,357 | 0.32 |
| Net Cash Flow | $4,460,076 | $5,241,184 | $10,196,397 | $18.24 |
| (1) | Historical NOI prior to 2021 is not available as the transaction represents acquisition financing and the borrower sponsor was not provided such historical financial information. |
| (2) | The increase from 2022 Rents in Place to U/W Rents in Place at the 100 Jefferson Road Property is primarily driven by the execution of the J&J Farms Creamery lease commencing in March 2023. |
| (3) | Based on the underwritten rent roll dated February 28, 2023. Contractual Rent Steps are taken through October 2023. |
| (4) | Tenants are responsible for market rate electrical expenses while the actual electric expenses due to the rooftop solar array resulting in Electrical Reimbursements greater than 100%. |
| THE INFORMATION IN THIS STRUCTURAL AND COLLATERAL TERM SHEET IS NOT COMPLETE AND MAY BE AMENDED PRIOR TO THE TIME OF SALE. THIS TERM SHEET IS NOT AN OFFER TO SELL THESE SECURITIES AND IT IS NOT A SOLICITATION OF AN OFFER TO BUY THESE SECURITIES IN ANY JURISDICTION WHERE THE OFFER OR SALE IS NOT PERMITTED. | ||
| 102 | ||
100 Jefferson Road Parsippany, NJ 07054 | Collateral Asset Summary – Loan No. 8 100 Jefferson Road | Cut-off Date Balance: Cut-off Date LTV: U/W NCF DSCR: U/W NOI Debt Yield: | $30,000,000 56.4% 1.42x 10.7% |
Property Management. The 100 Jefferson Road Property is managed by Madison Properties USA LLC, a third party property manager.
Lockbox / Cash Management The 100 Jefferson Road Whole Loan is structured with a hard lockbox and springing cash management. The borrower is required, within 60 days following March 24, 2023, to establish a lockbox and, commencing within five business days subsequent thereto, to cause all rents to be transmitted directly by tenants at the 100 Jefferson Road Property into a lender-controlled lockbox account. In addition, the borrower is required to cause all rents received by the borrower or the property manager with respect to the 100 Jefferson Road Property to be deposited into such lockbox account within one business day of receipt. All amounts in the lockbox account are required to be remitted on a daily basis to the borrower unless a Cash Management Period is continuing. Upon the occurrence and during the continuance of a Cash Management Period, all amounts are required to be remitted to a lender-controlled cash management account on a daily basis to be applied and disbursed in accordance with the 100 Jefferson Road Whole Loan documents. During the continuance of a Cash Management Period, all excess cash flow funds remaining in the cash management account after the application of all funds on deposit in the cash management account after payment of debt service for the 100 Jefferson Road Whole Loan, required reserves and budgeted operating expenses are required to be deposited into a cash collateral subaccount as additional collateral for the 100 Jefferson Road Whole Loan. Notwithstanding the foregoing, during the continuance of a Cash Management Period continuing solely as a result of a Lease Sweep Period, the lender will have the right to allocate any funds in the cash collateral subaccount to a special rollover subaccount. Please see “Risks Relating to the Mortgage Loans—Cash Management Operations Entail Certain Risks That Could Adversely Affect Distributions on Your Certificates” in the Preliminary Prospectus for additional information.
“Cash Management Period” means a period which will commence upon the occurrence of any of the following: (i) the maturity date, (ii) an event of default, (iii) if the debt service coverage ratio is less than 1.20x, (iv) if the debt yield is less than 8.00% or (v) the commencement of a Lease Sweep Period; and will end if (1) the 100 Jefferson Road Whole Loan and all other obligations under the 100 Jefferson Road Whole Loan documents have been repaid in full or (2) the maturity date has not occurred and (A) with respect to clause (ii) above, such event of default has been cured and no other default or event of default has occurred and is continuing, (B) with respect to clause (iii) above, the 100 Jefferson Road Property has achieved a debt service coverage ratio of at least 1.30x for two consecutive calendar quarters, (C) with respect to clause (iv) above, the 100 Jefferson Road Property has achieved a debt yield of at least 8.50% for two consecutive calendar quarters, or (D) with respect to clause (v) above, upon the termination of such Lease Sweep Period.
A “Lease Sweep Period” will commence upon the occurrence of any of the following: (i) the date that is 12 months prior to the end of the term (including any renewal terms) of any Lease Sweep Lease; (ii) the earlier of (a) the Lease Sweep Tenant (as defined below) failing to give a renewal notice by the notice date required under the Lease Sweep Lease, or (b) the date the applicable Lease Sweep Tenant actually gives notice of its intention not to renew or extend; (iii) any portion of any Lease Sweep Lease is surrendered, cancelled or terminated prior to its then current expiration date or any Lease Sweep Tenant gives notice of its intention to terminate, surrender or cancel any portion of its Lease Sweep Lease; (iv) any Lease Sweep Tenant goes dark or gives notice that it intends to do the same (not to be applicable to J&J Farms Creamery until after the date that is 12 months after the loan origination date in accordance with the 100 Jefferson Road Whole Loan documents); (v) the occurrence and continuance of a default under any Lease Sweep Lease by the applicable Lease Sweep Tenant thereunder; (vi) the occurrence of a Lease Sweep Tenant insolvency proceeding; (vii) the occurrence of a J&J Farms Revenue Sweep Period (as defined below), to be tested annually starting on January 30, 2024 through the term of the 100 Jefferson Road Whole Loan; (viii) the occurrence of a J&J Farms EBITDAR Sweep Period (as defined below), to be tested annually starting on January 30, 2024 through the term of the 100 Jefferson Road Whole Loan; or (ix) J&J Farms Creamery failing to complete the J&J Farms Creamery Tenant Improvements within 12 months from the loan origination date in accordance with the 100 Jefferson Road Whole Loan documents, subject to a 60 day extension, as described above.
A “Lease Sweep Period” will end upon the occurrence of any of the following: (1) with respect to clauses (i), (ii), (iii) or (iv) above, upon the earliest to occur of (x) accumulation of sufficient funds in the special rollover reserve subaccount to pay for all anticipated leasing commissions, any down-time or free rent periods and tenant improvement expenses in connection with the re-leasing of the space under the applicable lease(s) that gave rise to the subject Lease Sweep Period; (y) the date on which the subject Lease Sweep Tenant irrevocably exercises its renewal or extension option (or otherwise enters into an extension agreement with the borrower and acceptable to the lender) with respect to all of the space demised under its Lease Sweep Lease, and in the lender’s reasonable judgment, sufficient funds have been accumulated in the special rollover reserve subaccount (during the continuance of the subject Lease Sweep Period) to pay for all anticipated approved leasing expenses for such Lease Sweep Lease and any other anticipated expenses in connection with such renewal or extension; or (z) the date on which all of the space demised under any portion of the subject Lease Sweep Lease that gave rise to the subject Lease Sweep Period has been fully leased pursuant to a replacement lease(s) and all approved Lease Sweep Lease leasing expenses (and any other expenses in connection with the re-tenanting of such space) have been paid in full; (2) with respect to clause (v) above, if the subject Lease Sweep Tenant default has been cured, and no other Lease Sweep Tenant default has occurred for a period of six consecutive months following such cure; (3) with respect to clause (vi) above, if the applicable Lease Sweep Tenant insolvency proceeding has terminated and the applicable Lease Sweep Lease has been affirmed, assumed or assigned pursuant to the terms of the 100 Jefferson Road Whole Loan documents; (4) with respect to clause (vii) above, upon the expiration of such J&J Farms Revenue Sweep Period in accordance with the terms of the definition of the applicable J&J Farms Revenue Sweep Period; (5) with respect to clause (viii) above, upon the expiration of such J&J Farms EBITDAR Sweep Period in accordance with the terms of the definition of the applicable J&J Farms EBITDAR Sweep Period; or (6) with respect to clause (ix) above, the date on which the J&J Farm Creamery TIs are completed.
| THE INFORMATION IN THIS STRUCTURAL AND COLLATERAL TERM SHEET IS NOT COMPLETE AND MAY BE AMENDED PRIOR TO THE TIME OF SALE. THIS TERM SHEET IS NOT AN OFFER TO SELL THESE SECURITIES AND IT IS NOT A SOLICITATION OF AN OFFER TO BUY THESE SECURITIES IN ANY JURISDICTION WHERE THE OFFER OR SALE IS NOT PERMITTED. | ||
| 103 | ||
100 Jefferson Road Parsippany, NJ 07054 | Collateral Asset Summary – Loan No. 8 100 Jefferson Road | Cut-off Date Balance: Cut-off Date LTV: U/W NCF DSCR: U/W NOI Debt Yield: | $30,000,000 56.4% 1.42x 10.7% |
“J&J Farms Revenue Sweep Period” means a period (i) commencing as of the lender’s determination that the J&J Farms Creamery annualized gross revenue decreased by 25% or more compared to $270,390,464; and (ii) expiring upon the lender’s determination that the J&J Farms Creamery annualized gross revenue is at least 90% of $270,390,464.
“J&J Farms EBITDAR Sweep Period” means a period (i) commencing as of the lender’s determination that the annualized J&J Farms EBITDAR ratio is less than 1.25x; and (ii) expiring upon the lender’s determination that the annualized J&J Farms EBITDAR ratio is equal to or greater than 1.30x.
“Lease Sweep Tenant” means any tenant under a Lease Sweep Lease.
“Lease Sweep Lease” means (a) any lease which covers 20% or more of the rentable sq. ft. of the 100 Jefferson Road Property and (b) the J&J Farms Creamery lease.
Initial and Ongoing Reserves. At origination, the borrower deposited into escrow $11,598,000 for a J&J Farms TI Reserve, approximately $109,030 for real estate taxes, and approximately $86,237 for insurance reserves.
Tax Reserve – On a monthly basis, the borrower is required to escrow 1/12th of the annual estimated tax payments, which currently equates to approximately $109,030.
Insurance Reserve – On a monthly basis, the borrower is required to escrow 1/12th of the estimated insurance payments, which currently equates to approximately $28,746.
Replacement Reserves – On a monthly basis, the borrower is required to escrow approximately $4,658 for replacement reserves ($0.10 per sq. ft. annually).
Rollover Reserve – On a monthly basis, the borrower is required to escrow approximately $14,780 for rollover reserves ($0.50 per sq. ft. annually, exclusive of J&J Farms Creamery sq. ft.) subject to a cap of $886,783.
Current Mezzanine or Subordinate Indebtedness. None.
Future Mezzanine or Subordinate Indebtedness Permitted. None.
Partial Release. None.
| THE INFORMATION IN THIS STRUCTURAL AND COLLATERAL TERM SHEET IS NOT COMPLETE AND MAY BE AMENDED PRIOR TO THE TIME OF SALE. THIS TERM SHEET IS NOT AN OFFER TO SELL THESE SECURITIES AND IT IS NOT A SOLICITATION OF AN OFFER TO BUY THESE SECURITIES IN ANY JURISDICTION WHERE THE OFFER OR SALE IS NOT PERMITTED. | ||
| 104 | ||
9200 Calumet Avenue Munster, IN 46321 | Collateral Asset Summary – Loan No. 9 9200 Calumet Industrial | Cut-off Date Balance: Cut-off Date LTV: U/W NCF DSCR: U/W NOI Debt Yield: | $29,500,000 47.1% 1.57x 11.9% |
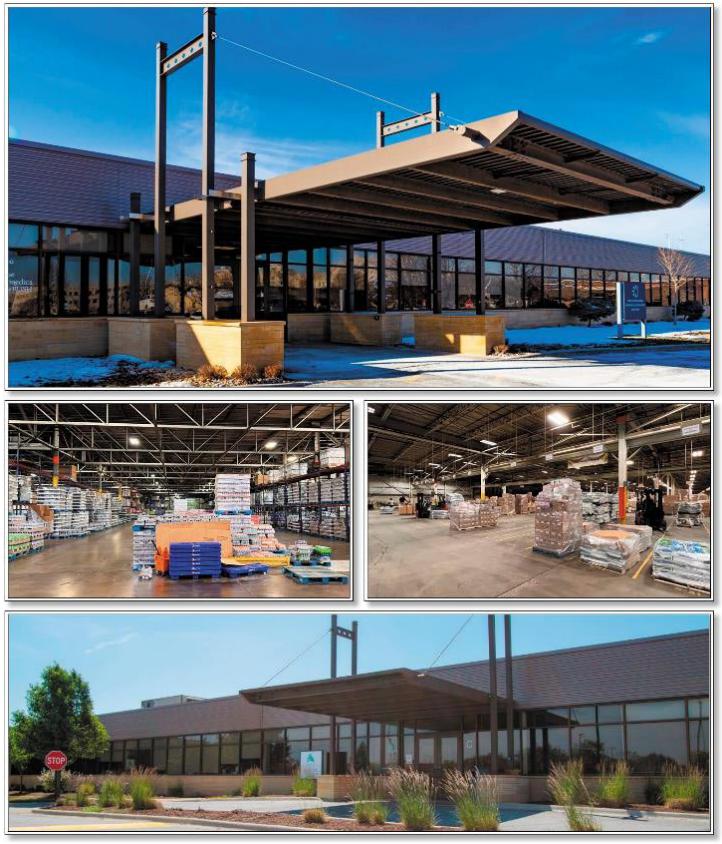
| THE INFORMATION IN THIS STRUCTURAL AND COLLATERAL TERM SHEET IS NOT COMPLETE AND MAY BE AMENDED PRIOR TO THE TIME OF SALE. THIS TERM SHEET IS NOT AN OFFER TO SELL THESE SECURITIES AND IT IS NOT A SOLICITATION OF AN OFFER TO BUY THESE SECURITIES IN ANY JURISDICTION WHERE THE OFFER OR SALE IS NOT PERMITTED. | ||
| 105 | ||
9200 Calumet Avenue Munster, IN 46321 | Collateral Asset Summary – Loan No. 9 9200 Calumet Industrial | Cut-off Date Balance: Cut-off Date LTV: U/W NCF DSCR: U/W NOI Debt Yield: | $29,500,000 47.1% 1.57x 11.9% |
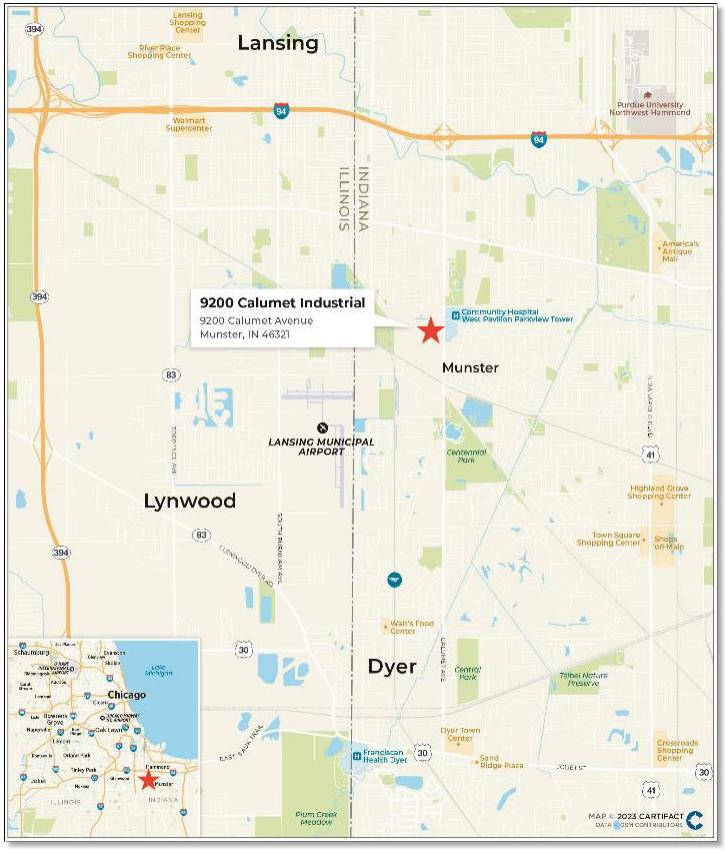
| THE INFORMATION IN THIS STRUCTURAL AND COLLATERAL TERM SHEET IS NOT COMPLETE AND MAY BE AMENDED PRIOR TO THE TIME OF SALE. THIS TERM SHEET IS NOT AN OFFER TO SELL THESE SECURITIES AND IT IS NOT A SOLICITATION OF AN OFFER TO BUY THESE SECURITIES IN ANY JURISDICTION WHERE THE OFFER OR SALE IS NOT PERMITTED. | ||
| 106 | ||
9200 Calumet Avenue Munster, IN 46321 | Collateral Asset Summary – Loan No. 9 9200 Calumet Industrial | Cut-off Date Balance: Cut-off Date LTV: U/W NCF DSCR: U/W NOI Debt Yield: | $29,500,000 47.1% 1.57x 11.9% |
| Mortgage Loan Information | |
| Loan Seller: | CREFI |
| Loan Purpose: | Refinance |
| Borrower Sponsors: | Philip Goldberg and Mitchell Simborg |
| Borrower: | LBCOI Owner LLC |
| Original Balance: | $29,500,000 |
| Cut-off Date Balance: | $29,500,000 |
| % by Initial UPB: | 4.5% |
| Interest Rate: | 7.28000% |
| Payment Date: | 6th of each month |
| First Payment Date: | December 6, 2022 |
| Maturity Date: | November 6, 2029 |
| Amortization: | Interest Only |
| Additional Debt(1): | $8,500,000 Mezzanine Loan |
| Call Protection: | L(29),D(52),O(3) |
| Lockbox / Cash Management: | Springing / Springing |
| Reserves(2) | |||
| Initial | Monthly | Cap | |
| Taxes: | $62,761 | $62,761 | NAP |
| Insurance: | $52,292 | $26,146 | NAP |
| Replacement: | $0 | $7,567 | NAP |
| TI/LC: | $1,625,000 | Springing | $1,250,000 |
| Deferred Maintenance | $219,579 | $0 | NAP |
| Other(3): | $4,735,235 | Springing | NAP |
| Property Information | |
| Single Asset / Portfolio: | Single Asset |
| Property Type: | Warehouse/Distribution Industrial |
| Collateral: | Fee |
| Location: | Munster, IN |
| Year Built / Renovated: | 1958 / 2022 |
| Total Sq. Ft.: | 908,068 |
| Property Management: | Simborg Industrial Real Estate, Inc. |
| Underwritten NOI(4): | $3,508,077 |
| Underwritten NCF: | $3,417,270 |
| Appraised Value(5): | $62,600,000 |
| Appraisal Date: | June 1, 2023 |
| Historical NOI | |
| Most Recent NOI(4): | $2,168,827 (T-12 July 31, 2022) |
| 2021 NOI: | $2,033,563 (December 31, 2021) |
| 2020 NOI(6): | NAV |
| 2019 NOI(6): | NAV |
| Historical Occupancy | |
| Most Recent Occupancy: | 100.0% (August 29, 2022) |
| 2021 Occupancy(6): | NAV |
| 2020 Occupancy(6): | NAV |
| 2019 Occupancy(6): | NAV |
| Financial Information(1) | ||||||
| Tranche | Cut-off Date Balance | Balance per Sq. Ft. | LTV | U/W DSCR | U/W Debt Yield | U/W Debt Yield at Balloon |
| Cut-off / Balloon | Cut-off / Balloon(5) | NOI / NCF | NOI / NCF | NOI / NCF | ||
| Mortgage Loan | $29,500,000 | |||||
| Mortgage Loan | $29,500,000 | $32 / $32 | 47.1% / 47.1% | 1.61x / 1.57x | 11.9% / 11.6% | 11.9% / 11.6% |
| Mezzanine Loan | 8,500,000 | |||||
| Total Debt | $38,000,000 | $42 / $42 | 60.7% / 60.7% | 1.17x / 1.14x | 9.2% / 9.0% | 9.2% / 9.0% |
| (1) | Concurrently with the funding of the 9200 Calumet Industrial Mortgage Loan (as defined below), Equitrust Life Insurance Company funded a mezzanine loan in the amount of $8,500,000 (the “9200 Calumet Industrial Mezzanine Loan”, and together with the 9200 Calumet Industrial Mortgage Loan, the “9200 Calumet Industrial Total Debt”). The 9200 Calumet Industrial Mezzanine Loan accrues interest at a rate of 9.50000% and is interest only for its entire term. The 9200 Calumet Industrial Mezzanine Loan has a final maturity date of November 6, 2029. An intercreditor agreement has been entered into between the lender under the 9200 Calumet Industrial Mortgage Loan and the lender under the 9200 Calumet Industrial Mezzanine Loan. See “Current Mezzanine or Subordinate Indebtedness” herein. |
| (2) | See “Initial and Ongoing Reserves” herein. |
| (3) | Other Initial reserves consists of approximately (i) $4,005,124 for an unfunded obligations reserve, (ii) $605,111 for a Pepsi rent reserve, and (iii) $125,000 for a Pepsi tax reimbursement reserve. |
| (4) | The increase from Most Recent NOI to Underwritten NOI is primarily attributable to Pepsi recently expanding their space at the property by 147,588 sq. ft. The Pepsi expansion lease commenced February 1, 2023 and runs through May 31, 2033. |
| (5) | Calculated using the Prospective Market Value “Upon Stabilization” appraised value of $62,600,000. The Prospective Market Value “Upon Stabilization” reflects completion of the Pepsi expansion space and Pepsi paying contractual rent. The 9200 Calumet Industrial Mortgage Loan requires full reserves for all unfunded obligations and Pepsi’s free and gap rent. The appraisal also concluded an “as-is” appraised value of $55,800,000. The Cut-off LTV and Balloon LTV ratios based on such appraised value are 52.9% and 68.1% for the 9200 Calumet Industrial Mortgage Loan and the 9200 Calumet Industrial Total Debt, respectively |
| (6) | Historical financial information and occupancy is not available because the 9200 Calumet Industrial Property (as defined below) was recently renovated in 2022 in connection with Pepsi executing an expansion lease in July 2022. |
The Loan. The 9200 Calumet Industrial mortgage loan (the “9200 Calumet Industrial Mortgage Loan”) has an original principal balance and an outstanding principal balance as of the Cut-off Date of $29,500,000 and is secured by a first priority mortgage encumbering the borrower’s fee simple interest in an industrial warehouse/distribution center located in Munster, Indiana (the “9200 Calumet Industrial Property”). The 9200 Calumet Industrial Mortgage Loan was originated by CREFI on November 3, 2022.
The 9200 Calumet Industrial Mortgage Loan has an initial term of 84 months and has a remaining term of 79 months as of the Cut-off Date. The 9200 Calumet Industrial Mortgage Loan requires interest-only payments during the full term and accrues interest at the rate of 7.28000% per annum.
The borrower sponsors utilized the proceeds of the 9200 Calumet Industrial Mortgage Loan to refinance existing debt, fund upfront reserves, pay origination costs and return equity to the borrower sponsors.
| THE INFORMATION IN THIS STRUCTURAL AND COLLATERAL TERM SHEET IS NOT COMPLETE AND MAY BE AMENDED PRIOR TO THE TIME OF SALE. THIS TERM SHEET IS NOT AN OFFER TO SELL THESE SECURITIES AND IT IS NOT A SOLICITATION OF AN OFFER TO BUY THESE SECURITIES IN ANY JURISDICTION WHERE THE OFFER OR SALE IS NOT PERMITTED. | ||
| 107 | ||
9200 Calumet Avenue Munster, IN 46321 | Collateral Asset Summary – Loan No. 9 9200 Calumet Industrial | Cut-off Date Balance: Cut-off Date LTV: U/W NCF DSCR: U/W NOI Debt Yield: | $29,500,000 47.1% 1.57x 11.9% |
| Sources and Uses | |||||||
| Sources | Proceeds | % of Total | Uses | Proceeds | % of Total | ||
| Mortgage Loan | $29,500,000 | 77.6 | % | Loan Payoff | $25,026,792 | 65.9 | % |
| Mezzanine Loan | 8,500,000 | 22.4 | Upfront Reserves | 6,694,867 | 17.6 | ||
| Closing Costs | 3,438,051 | 9.0 | |||||
| Return of Equity | 2,840,290 | 7.5 | |||||
| Total Sources | $38,000,000 | 100.0 | % | Total Uses | $38,000,000 | 100.0 | % |
The Borrower and the Borrower Sponsors. The borrower is LBCOI Owner LLC, a Delaware limited liability company. The borrower is a single purpose bankruptcy-remote entity with one independent director in its organizational structure. Legal counsel to the borrower delivered a non-consolidation opinion in connection with the origination of the 9200 Calumet Industrial Mortgage Loan.
The borrower sponsors and non-recourse carveout guarantors are Philip Goldberg and Mitchell Simborg. Philip Goldberg is the President of Team Real Estate Development and has over 30 years of real estate development and legal experience. Philip Goldberg also served as vice president and in-house counsel for Simborg Development, Inc. for over 17 years. Mitchell Simborg is the President of Simborg Development. The Simborg Companies have built or redeveloped over 30,000,000 sq. ft. of space and currently manage more than 6,000,000 sq. ft. of properties in the Northwest Indiana/Chicago area.
The Property. The 9200 Calumet Industrial Property is a two-building 908,068 sq. ft. warehouse/distribution center located at 9200 Calumet Avenue in Munster, Indiana. The 9200 Calumet Industrial Property is located approximately 29 miles south of Chicago, Illinois with primary access via Interstate-94. The 9200 Calumet Industrial Property was built in 1958 and recently renovated in 2022. The 9200 Calumet Industrial Property features 25’-foot clear heights, 45 dock-high doors, and five drive-in doors. The property is situated on an approximately 37.7-acre site and is leased to six tenants. As of August 29, 2022, the 9200 Calumet Industrial Property was 100.0% occupied. The largest tenant at the 9200 Calumet Industrial Property is Pepsi who has been at the 9200 Calumet Industrial Property since May of 2003 and recently executed a new lease for an additional 147,588 sq. ft. of space. In connection with Pepsi expanding their space the borrower invested $3,684,192 into the space which includes adding new 480-volt electric service, 10 loading doors and 2 drive-in doors.
Major Tenants. The largest tenant, Pepsi-Cola General Bottlers, Inc. (“Pepsi”) (399,588 sq. ft.; 44.0% of net rentable area; 50.6% of underwritten base rent) is a subsidiary of PepsiCo, Inc and is a manufacturer of soft drinks and carbonated water which it distributes to retailers within Chicago, Illinois. Pepsi has occupied 252,000 sq. ft. at the 9200 Calumet Industrial Property since May 1, 2003 with a lease expiration of October 31, 2031. Pepsi executed a new lease in July 2022 for an additional 147,588 sq. ft. of expansion space at the property with a lease expiration of May 31, 2033 and no termination options. Such new lease will commence following completion of certain tenant improvements required by such tenant’s lease. See “Description of the Mortgage Pool—Tenant Issues—Lease Expirations and Terminations” in the Preliminary Prospectus.
The second largest tenant, VG Supply Company Inc. (“VG Supply”) (180,000 sq. ft.; 19.8% of net rentable area; 17.0% of underwritten base rent) is a wholesale lawn and garden distributor founded in Morton Grove, Illinois. VG Supply carries 131 brands and provides lawn care, weed control, plant care, and pest control services. VG Supply has been at the 9200 Calumet Industrial Property since January 1, 2004 and utilizes the property as its warehouse and distribution center. VG Supply’s current lease is for 180,000 sq. ft. with a lease expiration of December 31, 2024 and no termination options.
The third largest tenant, Tec-Air, Inc. (“Tec-Air”) (127,600 sq. ft.; 14.1% of net rentable area; 11.5% of underwritten base rent) is an engineering plastic solutions firm servicing various industries including HVAC, appliances, automotive, power equipment, and medical. Tec-Air has been at the 9200 Calumet Industrial Property since May 1, 2014 and uses the facility as its business headquarters and warehouse / distribution center. Tec-Air currently leases 127,600 sq. ft. at the 9200 Calumet Industrial Property with a lease expiration of October 31, 2029 and no termination options.
| THE INFORMATION IN THIS STRUCTURAL AND COLLATERAL TERM SHEET IS NOT COMPLETE AND MAY BE AMENDED PRIOR TO THE TIME OF SALE. THIS TERM SHEET IS NOT AN OFFER TO SELL THESE SECURITIES AND IT IS NOT A SOLICITATION OF AN OFFER TO BUY THESE SECURITIES IN ANY JURISDICTION WHERE THE OFFER OR SALE IS NOT PERMITTED. | ||
| 108 | ||
9200 Calumet Avenue Munster, IN 46321 | Collateral Asset Summary – Loan No. 9 9200 Calumet Industrial | Cut-off Date Balance: Cut-off Date LTV: U/W NCF DSCR: U/W NOI Debt Yield: | $29,500,000 47.1% 1.57x 11.9% |
The following table presents certain information relating to the tenants (of which, certain tenants may have co-tenancy provisions) at the 9200 Calumet Industrial Property:
| Tenant Summary(1) | ||||||||||
| Tenant | Ratings (Moody’s/Fitch/S&P)(2) | Net Rentable Area (Sq. Ft.) | % of Net Rentable Area | U/W Base Rent per Sq. Ft. | % of Total U/W Base Rent | Lease Expiration | ||||
| Pepsi(3) | A1 / NR / A+ | 399,588 | 44.0 | % | $5.05 | 50.6 | % | Various(3) | ||
| VG Supply Company Inc. | NR / NR / NR | 180,000 | 19.8 | 3.76 | 17.0 | 12/31/2024 | ||||
| Tec-Air, Inc. | NR / NR / NR | 127,600 | 14.1 | 3.58 | 11.5 | 10/31/2029 | ||||
| AM Manufacturing Company | NR / NR / NR | 74,800 | 8.2 | 3.55 | 6.7 | 11/30/2024 | ||||
| Mac Medical Supply Company | NR / NR / NR | 67,680 | 7.5 | 4.70 | 8.0 | 1/31/2024 | ||||
| International Paper Company | Baa2 / NR / BBB | 58,400 | 6.4 | 4.30 | 6.3 | 2/28/2025 | ||||
| Total/Wtd. Avg. Occupied | 908,068 | 100.0 | % | $4.39 | 100.0 | % | ||||
| Vacant | 0.0 | % | ||||||||
| Total | 908,068 | 100.0 | % | |||||||
| (1) | Based on the underwritten rent roll dated August 29, 2022. |
| (2) | Certain ratings are those of the parent company whether or not the parent guarantees the lease. |
| (3) | Pepsi occupies 252,000 sq. ft. expiring October 31, 2031 and 147,588 sq. ft. expiring May 31, 2033 |
| Lease Rollover Schedule(1)(2) | ||||||||
| Year | # of Leases Expiring | Total Expiring Sq. Ft. | % of Total Sq. Ft. Expiring | Cumulative Sq. Ft. Expiring | Cumulative % of Sq. Ft. Expiring | Annual U/W Gross Rent per Sq. Ft. | % U/W Base Rent Rolling | Cumulative % of U/W Gross Rent |
| MTM | 0 | 0 | 0.0% | 0 | 0.0% | $0.00 | 0.0% | 0.0% |
| 2023 | 0 | 0 | 0.0% | 0 | 0.0% | $0.00 | 0.0% | 0.0% |
| 2024 | 3 | 322,480 | 35.5% | 322,480 | 35.5% | $3.91 | 31.6% | 31.6% |
| 2025 | 1 | 58,400 | 6.4% | 380,880 | 41.9% | $4.30 | 6.3% | 37.9% |
| 2026 | 0 | 0 | 0.0% | 380,880 | 41.9% | $0.00 | 0.0% | 37.9% |
| 2027 | 0 | 0 | 0.0% | 380,880 | 41.9% | $0.00 | 0.0% | 37.9% |
| 2028 | 0 | 0 | 0.0% | 380,880 | 41.9% | $0.00 | 0.0% | 37.9% |
| 2029 | 1 | 127,600 | 14.1% | 508,480 | 56.0% | $3.58 | 11.5% | 49.4% |
| 2030 | 0 | 0 | 0.0% | 508,480 | 56.0% | $0.00 | 0.0% | 49.4% |
| 2031 | 1 | 252,000 | 27.8% | 760,480 | 83.7% | $4.25 | 26.8% | 76.2% |
| 2032 | 0 | 0 | 0.0% | 760,480 | 83.7% | $0.00 | 0.0% | 76.2% |
| 2033 | 1 | 147,588 | 16.3% | 908,068 | 100.0% | $6.42 | 23.8% | 100.0% |
| 2034 & Thereafter | 0 | 0 | 0.0% | 908,068 | 100.0% | $0.00 | 0.0% | 100.0% |
| Vacant | NAP | 0 | 0.0% | 908,068 | 100.0% | NAP | NAP | NAP |
| Total / Wtd. Avg. | 7 | 908,068 | 100.0% | $4.39 | 100.0% | |||
| (1) | Based on the underwritten rent roll dated August 29, 2022. |
| (2) | Includes contractual rent steps through May 1, 2023. |
Environmental Matters. According to a Phase I report dated October 7, 2022 there was no evidence of any recognized environmental conditions at the 9200 Calumet Industrial Property.
The Market. The 9200 Calumet Industrial Property is located in Munster, Indiana, approximately 29 miles south of Chicago, Illinois and is part of the Chicago-Naperville-Elgin metro area (“Chicago MSA”). Primary access to the 9200 Calumet Industrial Property is provided by Interstate 65, which runs north to south and connects Louisville to Chicago, and Interstate 94 which provides access to the Chicago metro area and surrounding northwestern Indiana communities.
According to a third-party market research report, the 9200 Calumet Industrial Property is located in the Indiana Industrial submarket. As of March 24, 2023 the Indiana Industrial submarket had inventory of 46,725,879 sq. ft., a vacancy rate of 5.70% and average asking rent per sq. ft. of $7.87. Additionally, over the preceding 12 months the submarket has experienced rent growth of approximately 8.9% and has shown positive net absorption of approximately 977,000 sq. ft.
| THE INFORMATION IN THIS STRUCTURAL AND COLLATERAL TERM SHEET IS NOT COMPLETE AND MAY BE AMENDED PRIOR TO THE TIME OF SALE. THIS TERM SHEET IS NOT AN OFFER TO SELL THESE SECURITIES AND IT IS NOT A SOLICITATION OF AN OFFER TO BUY THESE SECURITIES IN ANY JURISDICTION WHERE THE OFFER OR SALE IS NOT PERMITTED. | ||
| 109 | ||
9200 Calumet Avenue Munster, IN 46321 | Collateral Asset Summary – Loan No. 9 9200 Calumet Industrial | Cut-off Date Balance: Cut-off Date LTV: U/W NCF DSCR: U/W NOI Debt Yield: | $29,500,000 47.1% 1.57x 11.9% |
Cash Flow Analysis.
| Cash Flow Analysis(1)(2) | ||||
| 2021 | T-12 7/31/2022 | U/W | U/W Per Sq. Ft. | |
| Base Rent | $2,776,614 | $2,913,224 | $3,904,618 | $4.30 |
| Contractual Rent Steps(3) | 0 | 0 | 81,488 | 0.09 |
| Total Reimbursements | 1,072,286 | 1,185,601 | 1,852,484 | 2.04 |
| Vacancy & Credit Loss | 0 | 0 | (218,136) | (0.24) |
| Effective Gross Revenue | $3,848,901 | $4,098,825 | $5,620,455 | $6.19 |
| Real Estate Taxes | 699,259 | 661,319 | 753,137 | 0.83 |
| Insurance | 230,890 | 271,293 | 298,813 | 0.33 |
| Management Fee | 115,467 | 122,965 | 168,614 | 0.19 |
| Other Expenses(4) | 769,721 | 874,421 | 891,814 | 0.98 |
| Total Expenses | $1,815,337 | $1,929,998 | $2,112,378 | $2.33 |
| Net Operating Income(5) | $2,033,563 | $2,168,827 | $3,508,077 | $3.86 |
| Replacement Reserves | 0 | 0 | 90,807 | 0.10 |
| Net Cash Flow | $2,033,563 | $2,168,827 | $3,417,270 | $3.76 |
| (1) | Based on the underwritten rent roll dated August 29, 2022. |
| (2) | Historical financial information and occupancy is not available because the 9200 Calumet Industrial Property (as defined below) was recently renovated in 2022 in connection with Pepsi executing an expansion lease in July 2022. |
| (3) | Includes contractual rent steps of approximately $8,062 through May 1, 2023 and straight-line average rent over the lease term for investment grade rated tenants totaling approximately $73,427. |
| (4) | Other Expenses are primarily attributable to utilities and are underwritten at $0.66 per sq. ft. Utility charges including water, sewer, gas, and electricity expenses. |
| (5) | The increase from T-12 7/31/2022 Net Operating Income to U/W Net Operating Income is primarily attributable to Pepsi recently expanding their space at the property by 147,588 sq. ft. pursuant to a lease that runs through May 31, 2033. |
Property Management. The 9200 Calumet Industrial Property is managed by Simborg Industrial Real Estate, Inc., an affiliate of the borrower sponsors.
Lockbox / Cash Management. The 9200 Calumet Industrial Mortgage Loan is structured with a springing lockbox and springing cash management. The borrower is required, from and after the first occurrence of a Trigger Period (as defined below), to immediately deposit, or cause the property manager to immediately deposit, all revenue derived from the 9200 Calumet Industrial Property and received by the borrower or the property manager directly into a lender approved lockbox account. All funds deposited into the lockbox are required to be transferred on each business day to or at the direction of the borrower unless a Trigger Period exists. Upon the occurrence and during the continuance of a Trigger Period, all funds in the lockbox account are required to be swept on each business day to a cash management account under the control of the lender to be applied and disbursed in accordance with the 9200 Calumet Industrial Mortgage Loan documents (which includes, without limitation, depositing funds sufficient to pay the mezzanine debt service due on the applicable monthly payment date into a mezzanine debt service account), and all excess cash flow funds remaining in the cash management account after the application of such funds in accordance with the 9200 Calumet Industrial Mortgage Loan documents will (i) to the extent that a Trigger Period exists (other than due solely to the existence of a Mezzanine Loan Trigger Period), be deposited into an excess cash flow account, then (ii) be deposited into a mezzanine debt service account in an amount sufficient to pay any other amounts due and owing to the mezzanine lender, and then (iii) (a) to the extent that a Mezzanine Loan Trigger Period has occurred and is continuing, be deposited into the mezzanine debt service account or (b) to the extent that no Trigger Period exists, be disbursed to the borrower.
A “Trigger Period” means a period (A) commencing upon the earliest of (i) the occurrence and continuance of an event of default, (ii) the debt yield falling below 8.35% (taking into account the aggregate outstanding principal balance of the 9200 Calumet Industrial Mortgage Loan and the 9200 Calumet Industrial Mezzanine Loan), (iii) the occurrence of a Specified Tenant Trigger Period (as defined below), and (iv) the occurrence of a Mezzanine Loan Trigger Period (as defined below); and (B) expiring upon (a) with regard to any Trigger Period commenced in connection with clause (i) above, the cure (if applicable) of such event of default, (b) with regard to any Trigger Period commenced in connection with clause (ii) above, the date that the debt yield is equal to or greater than 8.50% for two consecutive calendar quarters (taking into account the aggregate outstanding principal balance of both the 9200 Calumet Industrial Mortgage Loan and the 9200 Calumet Industrial Mezzanine Loan), (c) with regard to any Trigger Period commenced in connection with clause (iii) above, a Specified Tenant Trigger Period ceasing to exist, and (d) with regard to any Trigger Period commenced in connection with clause (iv) above, the cessation of all Mezzanine Loan Trigger Periods.
A “Specified Tenant Trigger Period” means a period (A) commencing upon the first to occur of (i) Specified Tenant (as defined below) being in default under the applicable Specified Tenant lease beyond the applicable notice and cure periods, (ii) Specified Tenant failing to be in actual, physical possession of the Specified Tenant space (or applicable portion thereof), and/or “going dark” in the Specified Tenant space (or applicable portion thereof) and/or “going dark” in the Specified Tenant space (or applicable portion thereof); provided, however, the foregoing clause (ii) will not be deemed a Specified Tenant Trigger Period for so long as either (x) the applicable Specified Tenant meets the Credit Rating Condition (as defined below) or (y) for any Specified Tenant other than Pepsi, such Specified Tenant is “dark” in less than 50% of the applicable Specified Tenant space, (iii) Specified Tenant giving notice that it is terminating its lease for all or any portion of the Specified Tenant space (or applicable portion thereof), (iv) any termination or cancellation of any Specified Tenant
| THE INFORMATION IN THIS STRUCTURAL AND COLLATERAL TERM SHEET IS NOT COMPLETE AND MAY BE AMENDED PRIOR TO THE TIME OF SALE. THIS TERM SHEET IS NOT AN OFFER TO SELL THESE SECURITIES AND IT IS NOT A SOLICITATION OF AN OFFER TO BUY THESE SECURITIES IN ANY JURISDICTION WHERE THE OFFER OR SALE IS NOT PERMITTED. | ||
| 110 | ||
9200 Calumet Avenue Munster, IN 46321 | Collateral Asset Summary – Loan No. 9 9200 Calumet Industrial | Cut-off Date Balance: Cut-off Date LTV: U/W NCF DSCR: U/W NOI Debt Yield: | $29,500,000 47.1% 1.57x 11.9% |
lease (including, without limitation, rejection in any bankruptcy or similar insolvency proceeding) and/or any Specified Tenant lease failing to otherwise be in full force and effect, (v) any bankruptcy or similar insolvency of Specified Tenant, (vi) Specified Tenant failing to extend or renew the Specified Tenant lease on or prior to the Specified Tenant Extension Deadline (as defined below) in accordance with the applicable terms of the Specified Tenant lease and the 9200 Calumet Industrial Mortgage Loan documents for the Specified Tenant Renewal Term (as defined below), and (vii) VG Supply and/or International Paper Company (“International Paper”) failing to extend or renew the VG Supply lease and/or International Paper lease, as applicable, on or prior to the applicable Specified Tenant Extension Deadline in accordance with the applicable terms and conditions of such lease and the 9200 Calumet Industrial Mortgage Loan documents for the applicable Specified Tenant Renewal Term; and (B) expiring upon the first to occur of lender’s receipt of evidence reasonably acceptable to lender (which such evidence will include, without limitation, a duly executed estoppel certificate from the applicable Specified Tenant in form and substance acceptable to lender) of (1) the satisfaction of the Specified Tenant Cure Conditions (as defined below) or (2) borrower leasing the entire applicable Specified Tenant space (or applicable portion thereof, if the effective annual rent (inclusive of estimated recoverables) required to be paid pursuant to the applicable replacement lease(s) equals or exceeds the effective annual rent (inclusive of estimated recoverables) that had been most recently in effect pursuant to the applicable Specified Tenant Lease, VG Supply lease and/or International Paper lease, as applicable) in accordance with the applicable terms and conditions of the 9200 Calumet Industrial Mortgage Loan documents for a minimum term in the case of each applicable replacement lease equal to the Specified Tenant Renewal Term, each applicable tenant under such replacement lease being in actual, physical occupancy of, and open to the public for business in, the space demised under its lease and paying the full monthly amount of the rent due under its lease.
A “Specified Tenant” means, as applicable, (i) Pepsi, (ii) any other lessee(s) of the Specified Tenant space (or any portion thereof), (iii) any tenant which, individually or when aggregated with all other leases at the 9200 Calumet Industrial Property with the same tenant or its affiliate, either (A) accounts for 25% or more of the total rental income for the 9200 Calumet Industrial Property, or (B) demises 25% or more of the 9200 Calumet Industrial Property’s gross leasable area, and (iv) any parent company of such Specified Tenant, and any affiliate providing credit support for, or guarantor of, any such Specified Tenant lease.
“Specified Tenant Extension Deadline” means (a) in the case of any Specified Tenant, the earlier of (x) the date occurring three months prior to the expiration of the then applicable term of the applicable Specified Tenant lease and (y) the renewal notice period required under the applicable Specified Tenant lease, or (b) in the case of VG Supply or International Paper, the date occurring twelve months prior to the expiration of the then applicable term of the VG Supply lease or the International Paper lease, as applicable.
“Specified Tenant Renewal Term” shall mean a minimum term of five years (or in the case of VG Supply or a replacement tenant for the space occupied by VG Supply as of the origination of the 9200 Calumet Industrial Mortgage Loan, two years).
“Specified Tenant Cure Conditions” means each of the following, as applicable (i) the applicable Specified Tenant has cured all defaults under the applicable Specified Tenant lease, (ii) the applicable Specified Tenant is in actual, physical possession of the Specified Tenant space (or applicable portion thereof), operating its business therein and not “dark” in the Specified Tenant space (or applicable portion thereof), (iii) the applicable Specified Tenant has revoked or rescinded all termination or cancellation notices with respect to the applicable Specified Tenant lease, VG Supply lease and/or International Paper lease, as applicable, and has re-affirmed such lease as being in full force and effect, (iv) in case of a Trigger Period solely caused pursuant to clause (vi) of the definition of Specified Tenant Trigger Period, lender’s receipt of satisfactory evidence that (A) the applicable Specified Tenant has renewed its lease prior to the applicable lease expiration, for the applicable Specified Tenant Renewal Term and otherwise in accordance with the terms of such lease and the 9200 Calumet Industrial Mortgage Loan documents or (B) the applicable space is leased, in whole or in part, to one or more replacement tenants pursuant to one or more replacement leases that collectively require annual rental equal to or greater than the effective base rent that had been most recently in effect pursuant to the applicable Specified Tenant lease, each such replacement lease provides for a minimum term equal to the Specified Tenant Renewal Term, and each such replacement tenant is operating its business in its leased space and is paying full, unabated rent, (v) with respect to any applicable bankruptcy or insolvency proceedings involving the applicable Specified Tenant and/or the applicable Specified Tenant lease, the applicable Specified Tenant is no longer insolvent or subject to any bankruptcy or insolvency proceedings and has affirmed the applicable Specified Tenant lease pursuant to final, non-appealable order of a court of competent jurisdiction, (vi) in the case of a Trigger Period solely caused by International Paper pursuant to clause (vii) of the definition of Specified Tenant Trigger Period (and only if no other Trigger Period then exists, besides a Mezzanine Loan Trigger Period), the balance of funds on deposit in the excess cash flow reserve is equal to or greater than $750,000, (vii) the applicable Specified Tenant is paying full, unabated rent under the applicable Specified Tenant lease, and (viii) in the case of a Trigger Period solely caused by clause (vii) of the definition of Specified Tenant Trigger Period, the lender’s receipt of satisfactory evidence that (A) the applicable tenant has renewed its lease prior to the applicable lease expiration, for the Specified Tenant Renewal Term and otherwise in accordance with the terms and conditions thereof and hereof, (B) the applicable space is leased, in whole or in part, to one or more replacement tenants pursuant to one or more replacement leases that collectively require effective annual rent (inclusive of estimated recoverables) equal to or greater than the effective annual rent (inclusive of estimated recoverables) that had been most recently in effect pursuant to the VG Supply lease and/or International Paper lease, as applicable, and each such replacement lease either (1) provides for a minimum term equal to the Specified Tenant Renewal Term, and each such replacement tenant is operating its business in its leased space and is paying full, unabated rent, or (2) solely in the case of the space leased as of the origination of the 9200 Calumet Industrial Mortgage Loan to VG Supply, is with Pepsi, provides for a minimum term equal to or longer than the term of the existing Pepsi lease, contains no rights to terminate, cancel, rescind or any other similar “outs” for Pepsi prior to the commencement date thereof, and all gap rent and free rent under such replacement lease with Pepsi is deposited with the lender into a reserve account, (C) the debt yield (calculated without including rental income from any tenant then causing a Trigger Period solely caused pursuant to clause (vii) of the definition of Specified
| THE INFORMATION IN THIS STRUCTURAL AND COLLATERAL TERM SHEET IS NOT COMPLETE AND MAY BE AMENDED PRIOR TO THE TIME OF SALE. THIS TERM SHEET IS NOT AN OFFER TO SELL THESE SECURITIES AND IT IS NOT A SOLICITATION OF AN OFFER TO BUY THESE SECURITIES IN ANY JURISDICTION WHERE THE OFFER OR SALE IS NOT PERMITTED. | ||
| 111 | ||
9200 Calumet Avenue Munster, IN 46321 | Collateral Asset Summary – Loan No. 9 9200 Calumet Industrial | Cut-off Date Balance: Cut-off Date LTV: U/W NCF DSCR: U/W NOI Debt Yield: | $29,500,000 47.1% 1.57x 11.9% |
Tenant Trigger Period) equals or exceeds 8.50% for two consecutive calendar quarters, or (D) if such Specified Tenant Trigger Period is solely caused by International Paper (and only if no other Trigger Period then exists, besides a Mezzanine Loan Trigger Period), the balance of funds on deposit in the excess cash flow reserve is equal to or greater than $750,000.
A ”Mezzanine Loan Trigger Period” means any period (i) commencing on the date that the mezzanine lender delivers written notice to the lender that a mezzanine loan event of default exists and (ii) ending on the date that mezzanine lender delivers written notice that a mezzanine loan event of default no longer exists.
“Credit Rating Condition” means, as to any entity, a condition which will be satisfied to the extent that, as of the applicable date of determination, such entity then maintains a long-term unsecured debt rating of at least “BBB-” from S&P and an equivalent rating from each of Moody’s, Fitch, and any other nationally recognized statistical rating agency designated by the lender which rate such entity.
Initial and Ongoing Reserves. At origination of the 9200 Calumet Industrial Mortgage Loan, the borrower deposited approximately (i) $62,761 into a real estate tax reserve, (ii) $52,292 into an insurance reserve, (iii) $219,579 into a deferred maintenance reserve, (iv) $1,625,000 into a tenant improvement and leasing commissions reserve, (iv) $4,005,124 into an unfunded obligations reserve for tenant improvement costs related to the Pepsi expansion lease, (v) $605,111 into a Pepsi rent reserve account representing (a) free rent in the amount of approximately $378,194 (“Pepsi Free Rent Funds”) and (b) gap rent in the amount of approximately $226,917 (“Pepsi Initial Gap Rent Funds”), in each case related to the Pepsi expansion lease, and (vi) $125,000 into a Pepsi tax reimbursement reserve representing amounts owed by Pepsi for taxes related to the Pepsi leases as of origination of the 9200 Calumet Industrial Mortgage Loan.
Tax Reserve. The borrower is required to deposit into a real estate tax reserve, on a monthly basis, 1/12 of the taxes that the lender estimates will be payable over the next-ensuing 12-month period (initially estimated to be approximately $62,761).
Insurance Reserve. The borrower is required to deposit into an insurance reserve, on a monthly basis, 1/12 of the amount which would be sufficient to pay the insurance premiums due for the renewal of coverage afforded by such policies (initially estimated to be approximately $26,146).
Replacement Reserve. The borrower is required to deposit into a replacement reserve, on a monthly basis, an amount equal to approximately $7,567 for replacement reserves.
TI/LC Reserve. To the extent that the balance of the tenant improvements and leasing commissions reserve falls below $500,000, the borrower is required to deposit into the tenant improvement and leasing commission reserve, on a monthly basis, an amount equal to approximately $15,134 for tenant improvements and leasing commissions, subject to a cap of $1,250,0000.
Pepsi Rent Reserve. So long as the lender has not received evidence, in form and substance acceptable to the lender, that the Pepsi expansion lease has commenced ( “Pepsi Expansion Lease Rent Commencement Event”), on (i) March 1, 2023 and (ii) every third month thereafter, the borrower is required to deposit a true up payment equal to approximately $453,833 (such amount, the “Pepsi Gap True Up Funds”, and, together with the Pepsi Initial Gap Rent Funds, the “Pepsi Gap Rent Funds”).
Prior to the occurrence of a Pepsi Expansion Lease Rent Commencement Event, on each monthly payment date (commencing with the monthly payment date occurring in December 2022), the lender must disburse approximately $75,640 of the Pepsi Gap Rent Funds (or such lesser amount of Pepsi Gap Rent Funds as then remain on deposit) either (i) so long as no Trigger Period then exists, to the borrower or (ii) if a Trigger Period then exists, into the cash management account to be applied in accordance with the 9200 Calumet Industrial Mortgage Loan documents. Upon the occurrence of a Pepsi Expansion Lease Rent Commencement Event, the lender will disburse all remaining Pepsi Gap Rent Funds either (A) to borrower, so long as no Trigger Period then exists or (B) if a Trigger Period then exists, into the cash management account to be applied in accordance with the 9200 Calumet Industrial Mortgage Loan documents.
On each monthly payment date occurring from and after a Pepsi Expansion Lease Rent Commencement Event, the lender must disburse approximately $75,640 (or such lesser amount of the Pepsi Free Rent Funds as then remain on deposit) of the Pepsi Free Rent Funds either (i) so long as no Trigger Period then exists, to the borrower or (ii) if a Trigger Period Exists, into the cash management account to be applied in accordance with the 9200 Calumet Industrial Mortgage Loan documents.
Current Mezzanine or Subordinate Indebtedness. Concurrently with the origination of the 9200 Calumet Industrial Mortgage Loan, Equitrust Life Insurance Company funded a mezzanine loan in the amount of $8,500,000 to LBCOII Mezz LLC (“9200 Calumet Industrial Mezzanine Borrower”), the sole member of the borrower, which is secured by 9200 Calumet Industrial Mezzanine Borrower’s ownership interest in the borrower. The 9200 Calumet Industrial Mezzanine Loan accrues interest at a rate of 9.50000%, is interest only for its entire term, and is coterminous with the 9200 Calumet Industrial Mortgage Loan. An intercreditor agreement has been entered into between the lender under the 9200 Calumet Industrial Mortgage Loan and the lender under the 9200 Calumet Industrial Mezzanine Loan. See “Description of the Mortgage Pool—Additional Indebtedness—Mezzanine Indebtedness” in the Preliminary Prospectus.
Future Mezzanine or Subordinate Indebtedness Permitted. None.
Partial Release. None.
| THE INFORMATION IN THIS STRUCTURAL AND COLLATERAL TERM SHEET IS NOT COMPLETE AND MAY BE AMENDED PRIOR TO THE TIME OF SALE. THIS TERM SHEET IS NOT AN OFFER TO SELL THESE SECURITIES AND IT IS NOT A SOLICITATION OF AN OFFER TO BUY THESE SECURITIES IN ANY JURISDICTION WHERE THE OFFER OR SALE IS NOT PERMITTED. | ||
| 112 | ||
950 Wolcott Street Waterbury, CT 06705 | Collateral Asset Summary – Loan No. 10 Naugatuck Valley Shopping Center | Cut-off Date Balance: Cut-off Date LTV: U/W NCF DSCR: U/W NOI Debt Yield: | $27,749,936 66.2% 1.49x 11.1% |

| THE INFORMATION IN THIS STRUCTURAL AND COLLATERAL TERM SHEET IS NOT COMPLETE AND MAY BE AMENDED PRIOR TO THE TIME OF SALE. THIS TERM SHEET IS NOT AN OFFER TO SELL THESE SECURITIES AND IT IS NOT A SOLICITATION OF AN OFFER TO BUY THESE SECURITIES IN ANY JURISDICTION WHERE THE OFFER OR SALE IS NOT PERMITTED. | ||
| 113 | ||
950 Wolcott Street Waterbury, CT 06705 | Collateral Asset Summary – Loan No. 10 Naugatuck Valley Shopping Center | Cut-off Date Balance: Cut-off Date LTV: U/W NCF DSCR: U/W NOI Debt Yield: | $27,749,936 66.2% 1.49x 11.1% |

| THE INFORMATION IN THIS STRUCTURAL AND COLLATERAL TERM SHEET IS NOT COMPLETE AND MAY BE AMENDED PRIOR TO THE TIME OF SALE. THIS TERM SHEET IS NOT AN OFFER TO SELL THESE SECURITIES AND IT IS NOT A SOLICITATION OF AN OFFER TO BUY THESE SECURITIES IN ANY JURISDICTION WHERE THE OFFER OR SALE IS NOT PERMITTED. | ||
| 114 | ||
950 Wolcott Street Waterbury, CT 06705 | Collateral Asset Summary – Loan No. 10 Naugatuck Valley Shopping Center | Cut-off Date Balance: Cut-off Date LTV: U/W NCF DSCR: U/W NOI Debt Yield: | $27,749,936 66.2% 1.49x 11.1% |
| Mortgage Loan Information | |
| Loan Seller: | GACC |
| Loan Purpose: | Refinance |
| Borrower Sponsor: | Shimshon Klugman |
| Borrower: | BH Premium Quality Waterbury LLC |
| Original Balance: | $29,000,000 |
| Cut-off Date Balance: | $27,749,936 |
| % by Initial UPB: | 4.2% |
| Interest Rate: | 5.15000% |
| Payment Date: | 6th of each month |
| First Payment Date: | May 6, 2020 |
| Maturity Date: | April 6, 2030 |
| Amortization: | Amortizing Balloon |
| Additional Debt: | None |
| Call Protection(1): | L(36),YM1(24),D(53),O(7) |
| Lockbox / Cash Management(2): | Hard / Springing |
| Reserves(3) | |||
| Current | Monthly | Cap | |
| Taxes: | $318,631 | $150,465 | NAP |
| Insurance: | $21,981 | $8,722 | NAP |
| Replacement: | $105,387 | $3,011 | NAP |
| TI/LC: | $305,318 | Springing | $500,000 |
| Other(4): | $168,846 | $0 | NAP |
| Property Information | |
| Single Asset / Portfolio: | Single Asset |
| Property Type: | Anchored Retail |
| Collateral: | Fee |
| Location: | Waterbury, CT |
| Year Built / Renovated: | 2001 - 2004 / NAP |
| Total Sq. Ft.: | 382,884 |
| Property Management: | Lexington Realty International LLC |
| Underwritten NOI(2): | $3,069,202 |
| Underwritten NCF(2): | $2,835,754 |
| Appraised Value(5): | $41,900,000 |
| Appraisal Date: | January 6, 2020 |
| Historical NOI | |
| Most Recent NOI: | $2,822,418 (T-12 January 31, 2023) |
| 2022 NOI: | $2,746,808 (December 31, 2022) |
| 2021 NOI: | $2,901,779 (December 31, 2021) |
| 2020 NOI: | $2,307,151 (December 31, 2020) |
| Historical Occupancy | |
| Most Recent Occupancy: | 97.8% (January 31, 2023) |
| 2022 Occupancy: | 97.8% (December 31, 2022) |
| 2021 Occupancy: | 92.6% (December 31, 2021) |
| 2020 Occupancy: | 92.0% (December 31, 2020) |
| Financial Information | ||||||
| Tranche | Cut-off Date Balance | Balance per Sq. Ft. Cut-off / Balloon | LTV Cut-off / Balloon(5) | U/W DSCR NOI / NCF(2) | U/W Debt Yield NOI / NCF | U/W Debt Yield at Balloon NOI / NCF |
| Mortgage Loan | $27,749,936 | $72 / $63 | 66.2% / 57.2% | 1.62x / 1.49x | 11.1% / 10.2% | 12.8% / 11.8% |
| (1) | If the defeasance lockout expiration date has not occurred by May 6, 2023, the borrower has the right, until the defeasance lockout expiration date (which is the date that is two years from the Closing Date of the Benchmark 2023-B38 securitization transaction) occurs, to prepay the Naugatuck Valley Shopping Center Mortgage Loan (as defined below) with the payment of the greater of a yield maintenance charge and a prepayment premium of 1%, as applicable, of the prepaid amount. |
| (2) | A Cash Management Trigger Event (as defined below) (due to debt service coverage ratio declining below 1.25x) and a Cash Sweep Trigger Event (as defined below) (due to debt service coverage ratio declining below 1.20x) took effect in or about April 2020 and are still in effect. As of the most recent determination date in December 2022, the debt service coverage ratio calculated in accordance with the Naugatuck Valley Shopping Center Mortgage Loan documents was 1.14x. Such debt service coverage ratio calculation excludes rents from the third largest tenant, Bob’s Store, which posted “store closing” and “moving” signs at the end of 2022, and Red Crab Juicy Seafood, which is paying only partial rent payments and is in default. See “Major Tenants—Bob’s Store” below. Underwritten NOI, Underwritten NCF, U/W DSCR NOI/NCF, U/W Debt Yield NOI/NCF and U/W Debt Yield at Balloon NOI/NCF above include rents from Bob’s Store and Red Crab Juicy Seafood. Excluding rents from Bob’s Store and Red Crab Juicy Seafood, Underwritten NOI and Underwritten NCF are $2,776,308 and $2,552,763, respectively; U/W DSCR NOI / NCF are 1.46x and 1.34x, respectively; U/W Debt Yield NOI / NCF are 10.0% and 9.2%, respectively and U/W Debt Yield at Balloon NOI/NCF are 11.6% and 10.7% respectively. |
| (3) | The reserves below reflect the current balance of the reserve accounts rather than the upfront. See “Initial and Ongoing Reserves” herein for further detail. |
| (4) | Other Reserves includes an unfunded obligations reserve of $99,846.34 for free rent relating to Fun Z Trampoline Park and $69,000.00 for free rent for Ashley Furniture (which vacated the property however, funds remain in reserve). |
| (5) | In addition to the “as-is” appraised value shown above, the appraisal also determined a “Hypothetical Value” of $43,100,000 as of January 6, 2020, which assumes a successful real estate tax appeal. The borrower has since been successful in its real estate tax appeal via a court stipulation dated April 23, 2021 that is retroactive to 2017. Based on the “Hypothetical Value” the Cut-off Date LTV and Balloon LTV is equal to 64.4% and 55.6%, respectively. |
The Loan. The mortgage loan (the “Naugatuck Valley Shopping Center Mortgage Loan”) has an original principal balance of $29,000,000 and an outstanding principal balance as of the Cut-off Date of $27,749,936, and is secured by a first mortgage encumbering the borrower’s fee interest in a 382,884 sq. ft. anchored retail center located in Waterbury, Connecticut (the “Naugatuck Valley Shopping Center Property”). The Naugatuck Valley Shopping Center Mortgage Loan was originated by UBS AG, by and through its branch office at 1285 Avenue of the Americas, New York, New York on March 16, 2020, and will be purchased by GACC on or prior to the Closing Date.
The Naugatuck Valley Shopping Center Mortgage Loan has a remaining term of 84 months, amortizes on a 30-year amortization schedule and accrues interest at a rate of 5.15000% per annum.
The proceeds of the Naugatuck Valley Shopping Center Mortgage Loan were used to pay off existing debt, fund upfront reserves, pay closing costs and return equity to the borrower sponsor.
| Sources and Uses | |||||||
| Sources | Proceeds | % of Total | Uses | Proceeds | % of Total | ||
| Mortgage Loan | $29,000,000 | 100.0% | Loan Payoff | $20,207,735 | 69.7 | % | |
| Return of Equity | 6,672,474 | 23.0 | |||||
| Upfront Reserves | 1,880,497 | 6.5 | |||||
| Closing Costs | 239,295 | 0.8 | |||||
| Total Sources | $29,000,000 | 100.0% | Total Uses | $29,000,000 | 100.0 | % | |
| THE INFORMATION IN THIS STRUCTURAL AND COLLATERAL TERM SHEET IS NOT COMPLETE AND MAY BE AMENDED PRIOR TO THE TIME OF SALE. THIS TERM SHEET IS NOT AN OFFER TO SELL THESE SECURITIES AND IT IS NOT A SOLICITATION OF AN OFFER TO BUY THESE SECURITIES IN ANY JURISDICTION WHERE THE OFFER OR SALE IS NOT PERMITTED. | ||
| 115 | ||
950 Wolcott Street Waterbury, CT 06705 | Collateral Asset Summary – Loan No. 10 Naugatuck Valley Shopping Center | Cut-off Date Balance: Cut-off Date LTV: U/W NCF DSCR: U/W NOI Debt Yield: | $27,749,936 66.2% 1.49x 11.1% |
The Borrower and the Borrower Sponsor. The borrower is BH Premium Quality Waterbury LLC, a New York limited liability company and special purpose entity with one independent director. Legal counsel to the borrower delivered a non-consolidation opinion in connection with the origination of the Naugatuck Valley Shopping Center Mortgage Loan.
The borrower sponsor and non-recourse carveout guarantor is Shimshon Klugman. Shimshon Klugman is the founder of Quality Capital USA, a real estate investment company focused on the acquisition of commercial real estate assets. Since 2012, Quality Capital USA has successfully purchased and partnered in the acquisition of over 1.0 million sq. ft. of commercial real estate.
The Property. The Naugatuck Valley Shopping Center Property is a grocery-anchored community shopping center totaling 382,884 sq. ft. across 50.5 acres located in Waterbury, Connecticut. Built between 2001 and 2004, the Naugatuck Valley Shopping Center Property is anchored by Walmart and Stop & Shop and consists of six freestanding retail buildings with 2,155 parking spaces (5.6 spaces per 1,000 sq. ft.). The Naugatuck Valley Shopping Center Property is located in an in-fill location on Wolcott Street, or State Route 69, with direct access north and south to nearby cities such as Bristol and New Haven. Direct access to the Naugatuck Valley Shopping Center Property is provided by Wolcott Street, which has an average daily traffic count of 23,363 vehicles per day at its intersection with Stillson Road, and 25,003 vehicles per day at its intersection with Lakewood Road.
As of January 31, 2023, the Naugatuck Valley Shopping Center Property was 97.8% leased to 17 national, regional and local tenants. Nine of the 17 tenants, comprising approximately 75.9% of the NRA and 63.7% of the underwritten base rent, have been in occupancy for over a decade. All of the tenants collectively have occupied the Naugatuck Valley Shopping Center Property for a weighted average period of over 16.8 years. The Naugatuck Valley Shopping Center Property is anchored by Walmart (37.1% NRA; 18.0% U/W Base Rent), Stop & Shop (17.9% NRA; 29.5% U/W Base Rent) and Bob's Store (10.5% NRA; 4.3% U/W Base Rent), and includes other major tenants such as Staples and Party City. Other notable tenants include Panera Bread, Comcast, Physician One Urgent Care and Sally Beauty Supply. Walmart (rated AA/Aa2/AA by Fitch/Moody’s/S&P), Stop & Shop (rated Baa1/BBB by Moody’s/S&P), and Comcast (rated A-/A3/A- by Fitch/Moody’s/S&P) (collectively 56.1% NRA; 50.6% U/W Base Rent) have investment grade credit ratings.
The borrower sponsor acquired the Naugatuck Valley Shopping Center Property in March 2018 for a purchase price of $24.5 million ($63.99 per sq. ft.). Since the acquisition, the borrower sponsor has spent $2,650,624 ($6.92 per sq. ft.) in capital expenditures and leasing costs for a total cost basis of approximately $27.2 million ($70.91 per sq. ft.). The borrower sponsor has signed five new leases at the Naugatuck Valley Shopping Center Property since acquisition that are still in tenancy: Fun Z Trampoline Park (9.1% NRA; 11.0% U/W Base Rent) signed a ten-year lease expiring September 2029, Red Crab Juicy Seafood (1.6% NRA; 4.0% U/W Base Rent) signed a 10.3-year lease expiring February 2030, Sally Beauty Supply (0.4% NRA; 1.2% U/W Base Rent) signed a 7-year lease expiring July 2028, 365 Tag Sale LLC (5.2% NRA; 8.0% U/W Base Rent) signed a 5-year lease expiring August 2027, and Snipes USA (1.2% NRA; 2.2% of UW Base Rent) signed a 7.5-year lease expiring January 2030. Combined, the five tenants account for $1,096,388 of underwritten base rental income and helped increase physical occupancy to 97.8% from 82.4% at the time of the borrower sponsor's acquisition in March 2018. Bob's Store, Comcast, Party City, Panera Bread, Physician One Urgent Care, Stop & Shop, Staples, Supercuts, Wendy's, and ION Bank have either renewed or extended their leases. In aggregate, these tenants represent 41.1% of NRA and 51.7% of U/W base rent. Additionally, there have been new leases from Sally Beauty Supply, 365 Tag Sale LLC (former Ashley Furniture space), and Snipes USA (former Payless space).
During the COVID-19 pandemic and government mandated business closures, the Naugatuck Valley Shopping Center Property experienced collection delays and rent relief requests from certain tenants. During the height of the pandemic, the following tenants were closed (collectively, 10.8% of NRA): Fun Z Trampoline Park and Red Crab Juicy Seafood. Fun Z Trampoline Park was not open nor was required to pay rent until May 2021. Funds were reserved ($479,014) at origination to cover its remaining free rent period. Red Crab Juicy Seafood was not open as its space was still being built out and construction stopped. Both Fun Z Trampoline Park and Red Crab Juicy Seafood are now open. Red Crab is currently paying only partial rent and is in default under its lease.
As a result of the decline in collections, the debt service coverage ratio of the Naugatuck Valley Shopping Center Mortgage Loan declined, triggering cash management (1.25x trigger) and cash sweep (1.20x trigger) requirements in the Naugatuck Valley Shopping Center Mortgage Loan documents. In April 2020 , the lender sent a reservation of rights letter regarding cash management and cash sweep. In August 2022, the borrower and the lender entered into a Forbearance and Modification Agreement (the “Modification Agreement”). In the Modification Agreement, the borrower acknowledged that events of default existed, because (i) the borrower had failed to deposit all rents into the lockbox account, and (ii) cash management and cash trap triggers based on a decline in debt service coverage ratio had occurred, but the borrower had failed to deposit excess cash flow into the excess cash flow reserve. Among other amendments, the Modification Agreement allowed the borrower to forbear the deposit of excess cash flow that had previously accrued until the end of the forbearance period, which expired in December, 2022. The Modification Agreement also updated the definition of gross income from operations used in the calculation of debt service coverage ratio to allow real estate taxes, which are not reimbursed monthly, to be accounted for based on a trailing twelve month basis instead of annualizing a current month. See “Description of the Mortgage Pool—Loan Purpose; Default History, Bankruptcy Issues and Other Proceedings” in the Preliminary Prospectus.
| THE INFORMATION IN THIS STRUCTURAL AND COLLATERAL TERM SHEET IS NOT COMPLETE AND MAY BE AMENDED PRIOR TO THE TIME OF SALE. THIS TERM SHEET IS NOT AN OFFER TO SELL THESE SECURITIES AND IT IS NOT A SOLICITATION OF AN OFFER TO BUY THESE SECURITIES IN ANY JURISDICTION WHERE THE OFFER OR SALE IS NOT PERMITTED. | ||
| 116 | ||
950 Wolcott Street Waterbury, CT 06705 | Collateral Asset Summary – Loan No. 10 Naugatuck Valley Shopping Center | Cut-off Date Balance: Cut-off Date LTV: U/W NCF DSCR: U/W NOI Debt Yield: | $27,749,936 66.2% 1.49x 11.1% |
Major Tenants.
Walmart (142,000 sq. ft., 37.1% of total NRA; 18.0% of U/W base rent; rated AA/Aa2/AA by Fitch/Moody’s/S&P) is a subsidiary of Walmart Inc., an American multinational retail corporation that operates a chain of supercenters, discount department stores and grocery stores in the United States. As of year-end 2022, Walmart Inc. (NYSE: WMT) had more than 10,500 stores with $572.8 billion in total revenue and $24.2 billion in operating cash flow.
Walmart’s lease commenced in September 2002 and expires in September 2027, with seven, 10-year and one, 46-month renewal options remaining. Walmart has a base rent of $5.26 per sq. ft. NNN with no termination options, co-tenancy provisions or kick out clauses. Walmart, which owns its improvements and leases the underlying land parcel, invested approximately $2.0 million ($14.08 per sq. ft.) in an extensive renovation and remodeling of its space, which was completed in the fall of 2018, to upgrade the physical characteristics of the store and improve the shopper experience.
Stop & Shop (68,366 sq. ft.; 17.9% of total NRA; 29.5% of U/W base rent; rated Baa1/BBB by Moody’s/S&P) is a regional chain of supermarkets located in the northeastern United States with 400 stores and 375 pick-up points. Stop & Shop was founded in 1914 and is a subsidiary of Ahold Delhaize, a world-leading food retailer with 7,659 stores worldwide and 414,000 people, serving 60 million customers a week. The company also owns brands such as Peapod, Food Lion, and Hannaford in the United States. Stop & Shop occupies 68,366 sq. ft. at the Naugatuck Valley Shopping Center Property. Stop & Shop’s lease commenced in August 2001 and expires in August 2026, with ten, 5-year renewal options remaining. Stop & Shop recently renewed its lease early through August 2026 at a reduced rental rate. Stop & Shop has a base rent of $17.91 per sq. ft. Stop & Shop has no termination options, co-tenancy provisions or kick out clauses. Stop & Shop's lease is guaranteed by its parent company, Ahold Delhaize (rated Baa1 by Moody’s). The Stop & Shop grocery store and gas station underwent a $2.0 million renovation ($29.25 per sq. ft.) at the Naugatuck Valley Shopping Center Property, which was completed in 2017.
Bob’s Store (40,080 sq. ft.; 10.5% of NRA; 4.3% of U/W base rent) is a chain of 27 retail stores primarily located in the northeastern United States. Bob’s Store was founded in 1954 in Middletown, Connecticut and targets moderate-income to upper-income consumers with a selection of footwear, workwear, team wear, and active wear. Bob’s Store’s lease commenced in September 2001 and expires in January 2024, with two, 5-year renewal options remaining. Bob’s Store changed to percentage rent starting in August 2020, but recently signed a lease amendment that switched back to gross rent with percentage rent breakpoints. Its recent amendment extended its term by 18 months. Bob’s Store has no kick out clauses. Bob’s Store has previously exercised a renewal option at the Naugatuck Valley Shopping Center Property. Bob’s Store reported trailing 12-month sales of approximately $4.2 million as of January 2023. Bob’s Store posted “store closing” and “moving” signs at the end of 2022, and the borrower has received other indications of a possible store closure. However, Bob’s Store is current on rent, has not provided any notice to vacate and recently advised the borrower that it intended to convert to an outlet store format, rather than close. However, there is no assurance that Bob’s Store will not close.
Tenant Summary.
| Tenant Summary(1) | ||||||||
Tenant | Ratings (Fitch/Moody’s/S&P)(2) | Net Rentable Area (Sq. Ft.) | % of Net Rentable Area | U/W Base Rent per Sq. Ft. | % of Total U/W Base Rent | Lease Expiration | Sales per Sq.Ft. | Occupancy Cost |
| Walmart | AA/Aa2/AA | 142,000 | 37.1% | $5.26 | 18.0% | 9/17/2027 | NAV | NAV |
| Stop & Shop | NR/Baa1/BBB | 68,366 | 17.9% | $17.91 | 29.5% | 8/31/2026 | NAV | NAV |
| Bob’s Store(3)(4) | NR/NR/NR | 40,080 | 10.5% | $4.49 | 4.3% | 1/31/2024 | $103.95 | 4.3% |
| Fun Z Trampoline Park | NR/NR/NR | 35,000 | 9.1% | $13.00 | 11.0% | 9/30/2029 | NAV | NAV |
| Staples(5) | NR/B3/B | 20,388 | 5.3% | $3.00 | 1.5% | 10/31/2026 | NAV | NAV |
| 365 Tag Sale LLC | NR/NR/NR | 20,020 | 5.2% | $16.67 | 8.0% | 8/31/2027 | NAV | NAV |
| $1 Zone | NR/NR/NR | 8,000 | 2.1% | $20.25 | 3.9% | 6/30/2023 | $142.66 | 14.2% |
| Party City | B/NR/NR | 7,933 | 2.1% | $11.70 | 2.2% | 11/30/2023 | $207.67 | 9.3% |
| Red Crab Juicy Seafood(4) | NR/NR/NR | 6,247 | 1.6% | $26.50 | 4.0% | 2/28/2030 | NAV | NAV |
| Panera Bread | A-/A3/A- | 4,600 | 1.2% | $26.62 | 3.0% | 12/31/2026 | NAV | NAV |
| Largest Tenants | 352,634 | 92.1% | $10.05 | 85.4% | ||||
| Other Tenants | 21,979 | 5.7% | $27.53 | 14.6% | ||||
| Total/Wtd. Avg. Occupied | 374,613 | 97.8% | $11.07 | 100.0% | ||||
| Vacant | 8,271 | 2.2% | ||||||
| Total | 382,884 | 100.0% | ||||||
| (1) | Based on the underwritten rent roll dated as of January 31, 2023. |
| (2) | Certain ratings are those of the parent entity whether or not the parent entity guarantees the lease. |
| (3) | Bob's Store changed to percentage rent starting in August 2020 but recently signed a lease amendment that switched back to gross rent with percentage rent breakpoints. The percentage rent breakpoint for the first year of the extended term is $3.6 million and $1.8 million for the second year of the extended term. The tenant has two options to renew for 5-years each. |
| (4) | The borrower sponsor indicated that Bob’s Store had posted “store closing” and “moving” signs in its store window at the end of 2022. However, Bob’s Store is current on rent, has not provided any notice to vacate and recently advised the borrower that it intended to convert to an outlet store format, rather than close. However, there is no assurance that Bob’s Store will not close. Additionally, Red Crab Juicy Seafood is currently paying partial rent payments and is in default under its lease. Excluding rental income from Bob’s Store and Red Crab Juicy Seafood, Underwritten NOI and Underwritten NCF are $2,776,308 and $2,552,763, respectively; U/W DSCR NOI / NCF are 1.46x and 1.34x, respectively; U/W Debt Yield NOI / NCF are 10.0% and 9.2%, respectively. |
| (5) | Both the tenant and the landlord have an ongoing option to terminate the Staples lease. |
| THE INFORMATION IN THIS STRUCTURAL AND COLLATERAL TERM SHEET IS NOT COMPLETE AND MAY BE AMENDED PRIOR TO THE TIME OF SALE. THIS TERM SHEET IS NOT AN OFFER TO SELL THESE SECURITIES AND IT IS NOT A SOLICITATION OF AN OFFER TO BUY THESE SECURITIES IN ANY JURISDICTION WHERE THE OFFER OR SALE IS NOT PERMITTED. | ||
| 117 | ||
950 Wolcott Street Waterbury, CT 06705 | Collateral Asset Summary – Loan No. 10 Naugatuck Valley Shopping Center | Cut-off Date Balance: Cut-off Date LTV: U/W NCF DSCR: U/W NOI Debt Yield: | $27,749,936 66.2% 1.49x 11.1% |
| Lease Rollover Schedule(1)(2) | ||||||||
| Year | # of Leases Expiring | Total Expiring Sq. Ft. | % of Total Sq. Ft. Expiring | Cumulative Sq. Ft. Expiring | Cumulative % of Sq. Ft. Expiring | Annual U/W Base Rent per Sq. Ft. | % U/W Base Rent Rolling | Cumulative % of U/W Base Rent |
| MTM | 0 | 0 | 0.0% | 0 | 0.0% | $0.00 | 0.0% | 0.0% |
| 2023 | 2 | 15,933 | 4.2% | 15,933 | 4.2% | $15.99 | 6.1% | 6.1% |
| 2024 | 1 | 40,080 | 10.5% | 56,013 | 14.6% | $4.49 | 4.3% | 10.5% |
| 2025 | 0 | 0 | 0.0% | 56,013 | 14.6% | $0.00 | 0.0% | 10.5% |
| 2026 | 4 | 97,874 | 25.6% | 153,887 | 40.2% | $15.72 | 37.1% | 47.6% |
| 2027 | 4 | 167,365 | 43.7% | 321,252 | 83.9% | $7.40 | 29.8% | 77.4% |
| 2028 | 1 | 1583 | 0.4% | 322,835 | 84.3% | $32.50 | 1.2% | 78.6% |
| 2029 | 2 | 38,000 | 9.9% | 360,835 | 94.2% | $13.88 | 12.7% | 91.4% |
| 2030 | 2 | 10747 | 2.8% | 371,582 | 97.0% | $23.84 | 6.2% | 97.5% |
| 2031 | 0 | 0 | 0.0% | 371,582 | 97.0% | $0.00 | 0.0% | 97.5% |
| 2032 | 1 | 3,031 | 0.8% | 374,613 | 97.8% | $33.81 | 2.5% | 100.0% |
| 2033 | 0 | 0 | 0.0% | 374,613 | 97.8% | $0.00 | 0.0% | 100.0% |
| 2034 & Beyond | 0 | 0 | 0.0% | 374,613 | 97.8% | $0.00 | 0.0% | 100.0% |
| Vacant | NAP | 8,271 | 2.2% | 382,884 | 100.0% | NAP | NAP | NAP |
| Total / Wtd. Avg. | 17 | 382,884 | 100.0% | $11.07 | 100.0% | |||
| (1) | Based on the underwritten rent roll dated as of January 31, 2023. |
| (2) | Certain tenants may have termination or contraction options (which may become exercisable prior to the originally stated expiration date of the tenant lease) that are not considered in the above Lease Rollover Schedule. |
Environmental Matters. According to the Phase I environmental reports dated May 31, 2019, there was no evidence of any recognized environmental conditions at the Naugatuck Valley Shopping Center Property. However, Stop & Shop operates a fueling station at the Naugatuck Valley Shopping Center Property. See “Description of the Mortgage Pool—Environmental Considerations” in the Preliminary Prospectus.
The Market. The Naugatuck Valley Shopping Center Property is located in an in-fill location in Waterbury, Connecticut. Located on Wolcott Street, or State Route 69, the Naugatuck Valley Shopping Center Property has direct access north and south to nearby cities such as Bristol and New Haven. Additionally, the Naugatuck Valley Shopping Center Property is approximately 2.5 miles north and 4.0 miles east of on-ramps to Interstate 84 (“I-84”) and State Route 8 (“SR-8”), respectively. State Route 69 is a popular retail destination, particularly in Waterbury, with several strip centers near the Naugatuck Valley Shopping Center Property. Geographically, much of the retail and industrial land use is along thoroughfares and arterials, such as I-84, SR-8, Wolcott Street, and Homer Street. Nearby major retail centers include Mattatuck Plaza (0.1 mile west), Waterbury Plaza (1.8 miles northwest), Brass Mill Commons (3.1 miles southwest), Waterbury Crossing (4.0 miles southwest), and Colonial Plaza (4.1 miles west).
In addition to the Naugatuck Valley Shopping Center Property, the neighborhood has several strip centers with a mix of national retailers and services including Target, Dollar Tree, Goodwill, Planet Fitness, Rite Aid, Dunkin Donuts, Starbucks, and Ollie’s Bargain Outlet, as well as regional and local retailers. The Naugatuck Valley Shopping Center Property is located 2.3 miles northeast of Brass Mill Center, a 122-store-shopping mall anchored by Burlington, JCPenney, Macy’s, and Shopper’s World.
The Naugatuck Valley Shopping Center Property is located in the Waterbury retail submarket, which reported an overall vacancy rate of 5.0% as of the first quarter of 2023, according to a third party market report. The vacancy rate has ranged from 4.4% to 6.0% from 2010 through 2021, with an average of 4.9% annually. The Waterbury retail submarket’s average asking rental rate was $14.82 per sq. ft. NNN as of the first quarter of 2023.
The appraisal identified five lease comparables for grocery anchor tenants. The appraisal observed rents ranging from $10.79 to $19.00 per sq. ft., and concluded a market rent of $17.50 per sq. ft.
| Comparable Leases(1) | ||||||
| Location | Tenant Name | Square Feet | Lease Start Date | Term | Annual Rent PSF | Lease Type |
| 950 Wolcott Street, Waterbury CT(2) | Stop & Shop | 68,366 | 8/2001 | 25 Years | $17.91 | NNN |
| 410 Reidville Drive, Waterbury CT | Stop & Shop | 66,663 | 11/2018 | 5 Years | $18.50 | NNN |
| 215 East Main Street, Clinton CT | Stop & Shop | 60,694 | 1/2017 | 10 Years | $10.79 | NNN |
| 75 Lowrey Place, Newington CT | Best Market | 59,778 | 12/2016 | 15 Years | $15.00 | NNN |
| 126 Medway Road, Milford MA | Stop & Shop | 68,125 | 1/2017 | 15 Years | $14.00 | NNN |
| 300 Oxford Road, Oxford CT | Price Chopper | 54,275 | 10/2016 | 20 Years | $19.00 | NNN |
| (1) | Source: Appraisal. |
| (2) | Based on the underwritten rent roll dated as of January 31, 2023. |
The appraisal identified six lease comparables for junior anchor tenants. The appraisal observed rents ranging from $12.00 to $23.50 per sq. ft., and concluded a market rent of $12.00 per sq. ft.
| THE INFORMATION IN THIS STRUCTURAL AND COLLATERAL TERM SHEET IS NOT COMPLETE AND MAY BE AMENDED PRIOR TO THE TIME OF SALE. THIS TERM SHEET IS NOT AN OFFER TO SELL THESE SECURITIES AND IT IS NOT A SOLICITATION OF AN OFFER TO BUY THESE SECURITIES IN ANY JURISDICTION WHERE THE OFFER OR SALE IS NOT PERMITTED. | ||
| 118 | ||
950 Wolcott Street Waterbury, CT 06705 | Collateral Asset Summary – Loan No. 10 Naugatuck Valley Shopping Center | Cut-off Date Balance: Cut-off Date LTV: U/W NCF DSCR: U/W NOI Debt Yield: | $27,749,936 66.2% 1.49x 11.1% |
| Comparable Leases(1) | ||||||
| Location | Tenant Name | Square Feet | Lease Start Date | Term | Annual Rent PSF | Scheduled Increases |
| 100 Main Street, Southbury CT | Ulta Beauty | 12,290 | 10/2019 | 10 Years | $23.50 | NNN |
| 271 Cottage Grove Road, Bloomfield CT | Planet Fitness | 22,000 | 1/2019 | 15 Years | $16.00 | NNN |
| 1045 Kennedy Road, Bloomfield CT | Homegoods | 20,000 | 9/2018 | 10 Years | $12.00 | NNN |
| 1459 New Britain Avenue, West Hartford CT | Edge Fitness | 36,950 | 12/2019 | 10 Years | $14.00 | NNN |
| 1445 New Britain Avenue, West Hartford CT | Bed Bath & Beyond | 19,053 | 9/2018 | 10 Years | $17.29 | NNN |
| 410 Reidville Drive, Waterbury CT | Raymour & Flanigan | 69,490 | 11/2017 | 10 Years | $8.77 | NNN |
| (1) | Source: Appraisal. |
Cash Flow Analysis.
| Cash Flow Analysis(1) | |||||||
| 2019 | 2020 | 2021 | 2022 | T-12 1/31/2023 | U/W | U/W PSF | |
| Base Rent | $3,407,734 | $3,449,620 | $3,751,968 | $3,627,898 | $3,698,350 | $4,125,848 | $10.78 |
| Contractual Rent Steps | 0 | 0 | 0 | 0 | 0 | 22,720 | $0.06 |
| Percentage Rent | 0 | 0 | 203,338 | 131,251 | 116,525 | 22,653 | $0.06 |
| Value of Vacant Space | 0 | 0 | 0 | 0 | 0 | 186,098 | $0.49 |
| Gross Potential Rent | $3,407,734 | $3,449,620 | $3,955,306 | $3,759,149 | $3,814,875 | $4,357,319 | $11.38 |
| Total Recoveries | 2,388,251 | 1,600,793 | 1,497,696 | 1,248,703 | 1,556,730 | 1,579,937 | $4.13 |
| Vacancy & Credit Loss | 0 | 0 | 0 | 0 | 0 | (296,863) | ($0.78) |
| Net Rental Income | $5,795,985 | $5,050,413 | $5,453,002 | $5,007,852 | $5,371,605 | $5,640,394 | $14.73 |
| Other Income | 24,589 | 38,266 | 35,689 | 30,576 | 29,625 | 29,625 | $0.08 |
| Effective Gross Income | $5,820,574 | $5,088,679 | $5,488,691 | $5,038,428 | $5,401,230 | $5,670,019 | $14.81 |
| Total Expenses | 2,829,653 | 2,781,528 | 2,586,912 | 2,291,620 | 2,578,812 | 2,600,816 | $6.79 |
| Net Operating Income | $2,990,920 | $2,307,151 | $2,901,779 | $2,746,808 | $2,822,418 | $3,069,202 | $8.02 |
| TI/LC | 0 | 0 | 0 | 0 | 0 | 176,016 | $0.46 |
| Replacement Reserves | 0 | 0 | 0 | 0 | 0 | 57,433 | $0.15 |
| Net Cash Flow | $2,990,920 | $2,307,151 | $2,901,779 | $2,746,808 | $2,822,418 | $2,835,754 | $7.41 |
| (1) | Based on the underwritten rent roll dated as January 31, 2023. |
| (2) | The borrower sponsor indicated that Bob’s Store had posted “store closing” and “moving” signs in its store window at the end of 2022. However, Bob’s Store is current on rent, has not provided any notice to vacate and recently advised the borrower that it intended to convert to an outlet store format, rather than close. However, there is no assurance that Bob’s Store will not close. Additionally, Red Crab Juicy Seafood is currently paying partial rent payments and is in default under its lease. Excluding rental income from Bob’s Store and Red Crab Juicy Seafood, Underwritten NOI and Underwritten NCF are $2,776,308 and $2,552,763, respectively; U/W DSCR NOI / NCF are 1.46x and 1.34x, respectively; U/W Debt Yield NOI / NCF are 10.0% and 9.2%, respectively. |
Property Management. The Naugatuck Valley Shopping Center Property is managed by Lexington Realty International LLC, a third party property manager.
Lockbox / Cash Management. The Naugatuck Valley Shopping Center Mortgage Loan is structured with a hard lockbox and springing cash management. The borrower is required to cause all revenue to be deposited directly into a clearing account (the "Clearing Account") at a bank acceptable to the lender. If no Cash Management Trigger Event (as defined below) exists, funds in the Clearing Account are required to be released to the borrower. As described below, a Cash Management Trigger Event is currently in effect and has been in existence since August 2020. During the existence of a Cash Management Trigger Event, funds in the Clearing Account are required to be swept daily into a cash management account controlled by the lender. All funds in the cash management account are required to be applied by the lender, provided no event of default exists, to payments of debt service, required reserves, approved operating expenses and other items required under the Naugatuck Valley Shopping Center Mortgage Loan documents and the remaining cash flow is required (x) if a Material Tenant Trigger Event (as defined below) exists, into a rollover reserve for the related tenant, (y) if any other Cash Sweep Trigger Event (as defined below) exists, to a reserve account to be held by the lender as additional collateral for the Naugatuck Valley Shopping Center Mortgage Loan during the existence of such Cash Sweep Trigger Event, and (z) if no Cash Sweep Trigger Event exists, to be released to the borrower. If an event of default exists, funds in the cash management account may, in the lender’s discretion, be held as additional collateral for, or applied to any obligations under, the Naugatuck Valley Shopping Center Mortgage Loan.
Notwithstanding the foregoing, pursuant to the Modification Agreement, during the period commencing on the business day following the forbearance period (which ended December 23, 2022) until the earlier of the first anniversary of such day and the termination of the DSCR Cash Sweep Trigger Event existing on the date of the Modification Agreement, if a DSCR Cash Sweep Trigger Event or Material Tenant Trigger Event (as defined below) is in effect, and no other Cash Sweep Trigger Event is in effect, the lender is required to release excess cash flow funds to the borrower up to $50,000 a month if such funds are needed to pay shortfalls in debt service, required reserves, or budgeted or extraordinary expenses. As described below, a DSCR Cash Sweep Trigger Event is currently in effect and has been in existence since April 2020.
| THE INFORMATION IN THIS STRUCTURAL AND COLLATERAL TERM SHEET IS NOT COMPLETE AND MAY BE AMENDED PRIOR TO THE TIME OF SALE. THIS TERM SHEET IS NOT AN OFFER TO SELL THESE SECURITIES AND IT IS NOT A SOLICITATION OF AN OFFER TO BUY THESE SECURITIES IN ANY JURISDICTION WHERE THE OFFER OR SALE IS NOT PERMITTED. | ||
| 119 | ||
950 Wolcott Street Waterbury, CT 06705 | Collateral Asset Summary – Loan No. 10 Naugatuck Valley Shopping Center | Cut-off Date Balance: Cut-off Date LTV: U/W NCF DSCR: U/W NOI Debt Yield: | $27,749,936 66.2% 1.49x 11.1% |
A "Cash Management Trigger Event" means (a) an event of default and is cured if the lender accepts a cure of or waives such event of default, (b) the bankruptcy or insolvency of the borrower, the non-recourse carveout guarantor, or the property manager, and is cured, in the case of an involuntary bankruptcy of the borrower, guarantor or property manager, if the same is discharged, stayed or dismissed within 90 days of filing, and certain other conditions are satisfied, or, in the case of the property manager, if it is replaced with a qualified property manager in accordance with the terms of the Naugatuck Valley Shopping Center Mortgage Loan documents, (c) if the debt service coverage ratio (based on underwritten net cash flow and a 30 year amortization schedule) falls below 1.25x, as determined by the lender (a "DSCR Cash Management Trigger Event"), and is cured if the debt service coverage ratio (calculated on the same basis), is at least 1.30x for two consecutive calendar quarters, (d) a Material Tenant Trigger Event exists, and is cured if a Material Tenant Trigger Event no longer exists, or (e)(1) an indictment for fraud or misappropriation of funds by the borrower, guarantor, borrower sponsor or an affiliated property manager or any director or officer of the foregoing, and is cured if the indictment is dismissed, each applicable person is acquitted, or an affiliated property manager is replaced with an unaffiliated qualified property manager in accordance with the terms of the Naugatuck Valley Shopping Center Mortgage Loan documents or (2) an indictment for fraud or misappropriation of funds by a third party property manager or any director or officer thereof; provided that, with respect to this clause (e)(2), such fraud or misappropriation of funds is related to the Naugatuck Valley Shopping Center Property, and is cured if the indictment is dismissed, each applicable person is acquitted, or the property manager is replaced with a qualified property manager in accordance with the terms of the Naugatuck Valley Shopping Center Mortgage Loan documents; (ii) a "Cash Sweep Trigger Event" means (a) an event of default and is cured if the lender accepts a cure of or waives such event of default, (b) the bankruptcy or insolvency of the borrower, the guarantor, or the property manager and is cured in a similar manner to the similar Cash Management Trigger Event, or (c) if the debt service coverage ratio (based on underwritten net cash flow and a 30 year amortization schedule) falls below 1.20x, as determined by the lender (a "DSCR Cash Sweep Trigger Event"), and is cured if the debt service coverage ratio (calculated on the same basis), is at least 1.25x for two consecutive calendar quarters.
The Naugatuck Valley Shopping Center Mortgage Loan entered into a DSCR Cash Management Trigger Event and a DSCR Cash Sweep Trigger Event in August of 2020, and such DSCR Cash Management Trigger Event and DSCR Cash Sweep Trigger Event have not been cured since such date. As of the most recent determination date in December 2022, the debt service coverage ratio calculated in accordance with the Naugatuck Valley Shopping Center Mortgage Loan documents was 1.14x. Such debt service coverage ratio calculation excludes rents from Red Crab Juicy Seafood, which is paying only partial rent and is in default, and Bob’s Store, which did not provide written notice of its intent to vacate, but posted “store closing” and “moving” signs at the end of 2022. See “Major Tenants—Bob’s Store” above. For the purposes of determining whether a DSCR Cash Management Trigger Event and DSCR Cash Management Sweep Event, the Naugatuck Valley Shopping Center Mortgage Loan documents exclude from the calculation of income, “tenants that have given notice of their intention to terminate or not extend or renew their leases and the term of such leases is set to expire within the next succeeding calendar quarter (unless, subsequent to such notice, the applicable tenant has extended or renewed its lease or entered into a new lease or unconditionally rescinded such notice in writing).The debt service coverage ratio for the most recent determination date in February 2023 calculated in accordance with the Naugatuck Valley Shopping Center Mortgage Loan documents would be 1.23x if Bob’s Store is included. See “Major Tenants” above.
A "Material Tenant Trigger Event" occurs (i) if a Material Tenant (as defined below) gives notice of its intention to terminate or cancel or not extend or renew its lease, (ii) if, on or prior to 18 months prior to the then applicable expiration date under its lease, a Material Tenant does not extend or renew its lease upon terms and conditions reasonably acceptable to the lender, (iii) if, on or prior to the date by which a Material Tenant is required under its lease to notify the landlord of its election to extend or renew its lease, such Material Tenant fails to give such notice, (iv) if an event of default under a Material Tenant lease occurs, (v) if the bankruptcy or insolvency of a Material Tenant (or, if applicable, any lease guarantor) occurs, (vi) if a Material Tenant lease terminates (in whole or in part, including in connection with the exercise of any contraction option); provided that, with respect to any partial termination of a Material Tenant lease, such partial termination relates to a portion of the Material Tenant's space constituting no less than 15% of the total rentable square footage at the Naugatuck Valley Shopping Center Property leased by that tenant immediately prior to the partial termination (or initial partial termination, if applicable), or (vii) if a Material Tenant "goes dark", vacates, ceases to occupy or discontinues its operations at the Naugatuck Valley Shopping Center Property or a portion thereof constituting no less than 15% of the total rentable square footage at the Naugatuck Valley Shopping Center Property leased by that tenant provided, however, that a Material Tenant Trigger Event Period will not commence pursuant to this clause (vii) so long as (A) the long term unsecured debt rating of such Material Tenant satisfies the Required Ratings (as defined below), (B) the applicable lease expressly requires continued payment of rent during the entirety of any period that such Material Tenant has “gone dark”, vacated, ceased to occupy or discontinued its operations at the Naugatuck Valley Shopping Center Property and (C) such Material Tenant continues to pay full rent as the same shall become due and payable under the applicable lease, (viii) if a Material Tenant (or, if applicable, any lease guarantor) is downgraded below "BBB-" (or the equivalent) by any rating agency and (ix) if the borrower fails to deliver evidence reasonably satisfactory to lender that it has completed certain work for Stop & Shop that was required upon origination (which evidence was subsequently delivered by the borrower).
A “Material Tenant Trigger Event” will be cured, (a) in the case of clause (i) above, upon revocation of all termination or cancellation notices, (b) in the case of clause (iv) above, upon a cure of the applicable event of default, (c) in the case of clause (v) above, upon the affirmation of the applicable Material Tenant lease in the applicable bankruptcy proceeding, provided that the applicable Material Tenant is actually paying all rents and other amounts due (or, if applicable, the discharge or dismissal of the applicable lease guarantor from the applicable bankruptcy proceeding, (d) in the case of clause (vii) above, upon the applicable tenant recommencing the conduct of its business at its space or applicable portion thereof, (e) in the case of clause (viii) above, upon the long term unsecured debt rating of the applicable Material Tenant or guarantor being subsequently raised or modified such that it satisfies the Required Ratings, (f) in the case
| THE INFORMATION IN THIS STRUCTURAL AND COLLATERAL TERM SHEET IS NOT COMPLETE AND MAY BE AMENDED PRIOR TO THE TIME OF SALE. THIS TERM SHEET IS NOT AN OFFER TO SELL THESE SECURITIES AND IT IS NOT A SOLICITATION OF AN OFFER TO BUY THESE SECURITIES IN ANY JURISDICTION WHERE THE OFFER OR SALE IS NOT PERMITTED. | ||
| 120 | ||
950 Wolcott Street Waterbury, CT 06705 | Collateral Asset Summary – Loan No. 10 Naugatuck Valley Shopping Center | Cut-off Date Balance: Cut-off Date LTV: U/W NCF DSCR: U/W NOI Debt Yield: | $27,749,936 66.2% 1.49x 11.1% |
of each of clause (i), (ii), and (iii) above, upon the applicable Material Tenant lease being extended in accordance with the terms of the Naugatuck Valley Shopping Center Mortgage Loan documents, and (g) in the case of each of clause (i), (ii), (iii), and (vi) above, upon the applicable Major Tenant space being re-tenanted in accordance with the terms of the Naugatuck Valley Shopping Center Mortgage Loan documents.
A “Material Tenant” means (i) Walmart, (ii) Stop & Shop, or (iii) any tenant or replacement tenant that, together with its affiliates, leases space comprising 15% or more of either (a) the total rentable square footage at the Naugatuck Valley Shopping Center Property or (b) the total in-place base rent at the Naugatuck Valley Shopping Center Property.
“Required Ratings” means a long term unsecured debt rating of at least “BBB-” by S&P, “Baa3” by Moody’s and “BBB-” by Fitch (or their equivalents by the other rating agencies), in each case, to the extent that the long term unsecured debt obligations of the applicable person or entity are rated by such rating agency.
Initial and Ongoing Reserves. At origination, the borrower deposited (i) $640,870 into a tax reserve, (ii) $21,028 into an insurance reserve, (iii) $500,000 into a TI/LC reserve, (iv) $548,013 into a rent concession reserve for unfunded obligations and (v) $170,585 into a reserve for current tenant allowances, tenant improvements and leasing commissions (“TATILC reserve”). As of March 13, 2023, the current balances of the reserves are the following: (i) $318,631 in the tax reserve, (ii) $21,981 in the insurance reserve, (iii) $305,318 in the TI/LC reserve, (iv) $168,846 in unfunded obligations reserve (vi) $105,387 in the replacement reserve described below and (vii) $2,643,785 in the excess cash flow reserve account.
Tax Reserve – On each monthly payment date, the borrower is required to deposit into a real estate tax reserve, 1/12 of the estimated annual real estate taxes (currently, approximately $150,465).
Insurance Reserve – On each monthly payment date, the borrower is required to deposit into an insurance reserve 1/12 of estimated annual insurance premiums (currently, approximately $8,722).
Replacement Reserve – On each monthly payment date, the borrower is required to deposit into a replacement reserve the amount of $3,011. Notwithstanding the foregoing, such monthly escrow for replacements will be determined excluding (i.e., ignoring) the leasable square footage of the improvements situated on (or constituting) the Walmart leased premises for so long as (i) the Walmart lease remains in full force and effect, (ii) no Material Tenant Trigger Event relating to Walmart (or its lease or, if applicable, its lease guarantor) exists and no event of default is continuing under the Naugatuck Valley Shopping Center Mortgage Loan documents, (iii) Walmart is obligated pursuant to its lease to maintain the Walmart leased premises in a condition acceptable to the lender, and (iv) Walmart performs such obligations in a timely manner and the borrower provides evidence of such performance by Walmart to the lender in a timely manner.
TI/LC Reserve – On each monthly payment date, the borrower is required to deposit into a TI/LC reserve the amount of $20,740. However, such monthly escrow for tenant improvements and leasing commissions are waived until the balance of the TI/LC reserve falls below $200,000, and at that point the reserve will be subject to a cap of $500,000.
Current Mezzanine or Subordinate Indebtedness. None.
Future Mezzanine or Subordinate Indebtedness Permitted. None.
Partial Release. None.
| THE INFORMATION IN THIS STRUCTURAL AND COLLATERAL TERM SHEET IS NOT COMPLETE AND MAY BE AMENDED PRIOR TO THE TIME OF SALE. THIS TERM SHEET IS NOT AN OFFER TO SELL THESE SECURITIES AND IT IS NOT A SOLICITATION OF AN OFFER TO BUY THESE SECURITIES IN ANY JURISDICTION WHERE THE OFFER OR SALE IS NOT PERMITTED. | ||
| 121 | ||
1000 Woodward Avenue Detroit, MI 48226 | Collateral Asset Summary – Loan No. 11 One Campus Martius | Cut-off Date Balance: Cut-off Date LTV: U/W NCF DSCR: U/W NOI Debt Yield: | $27,500,000 60.1% 1.74x 11.5% |
| Mortgage Loan Information | |
| Loan Seller: | JPMCB |
| Loan Purpose: | Refinance |
| Borrower Sponsor: | Bedrock Detroit |
| Borrower: | 1000 Webward LLC |
| Original Balance(1): | $27,500,000 |
| Cut-off Date Balance(1): | $27,500,000 |
| % by Initial UPB: | 4.2% |
| Interest Rate: | 6.02000% |
| Payment Date: | 1st of each month |
| First Payment Date: | August 1, 2022 |
| Maturity Date: | July 1, 2032 |
| Amortization: | Interest Only |
| Additional Debt(1): | $190,500,000 Pari Passu Debt |
| Call Protection(2): | L(33),D(83),O(4) |
| Lockbox / Cash Management: | Hard / Springing |
| Reserves | |||
| Initial | Monthly | Cap | |
| Taxes: | $3,926,163 | $560,880 | NAP |
| Insurance(3): | $0 | Springing | NAP |
| Replacement Reserves: | $28,230 | $28,230 | $677,530 |
| TI/LC: | $1,500,000 | $169,541 | $4,000,000 |
| Other(4)(5): | $3,851,373 | Springing | NAP |
| Property Information | |
| Single Asset / Portfolio: | Single Asset |
| Property Type: | CBD Office |
| Collateral: | Fee |
| Location: | Detroit, MI |
| Year Built / Renovated: | 2003 / 2019-2020 |
| Total Sq. Ft.(6): | 1,356,325 |
| Property Management: | Bedrock Management Services LLC and Ultimate Parking Management LLC |
| Underwritten NOI: | $25,078,685 |
| Underwritten NCF: | $23,186,453 |
| Appraised Value: | $362,500,000 |
| Appraisal Date: | May 4, 2022 |
| Historical NOI | |
| Most Recent NOI: | $28,399,663 (T-12 November 30, 2022) |
| 2021 NOI(6): | $25,025,321 (December 31, 2021) |
| 2020 NOI(6): | $18,537,846 (December 31, 2020) |
| 2019 NOI: | $19,338,306 (December 31, 2019) |
| Historical Occupancy(7) | |
| Most Recent Occupancy: | 86.8% (June 27, 2022) |
| 2021 Occupancy: | 86.1% (December 31, 2021) |
| 2020 Occupancy(6): | 76.5%( December 31, 2020) |
| 2019 Occupancy: | 97.4% (December 31, 2019) |
| Financial Information(1) | ||||||
| Tranche | Cut-off Date Balance | Balance per Sq. Ft. Cut-off / Balloon | LTV Cut-off / Balloon | U/W DSCR NOI / NCF | U/W Debt Yield NOI / NCF | U/W Debt Yield at Balloon NOI / NCF |
| Mortgage Loan | $27,500,000 | |||||
| Pari Passu Notes | $190,500,000 | |||||
| Whole Loan | $218,000,000 | $161 / $161 | 60.1% / 60.1% | 1.88x / 1.74x | 11.5% / 10.6% | 11.5% / 10.6% |
| (1) | The One Campus Martius loan is part of a whole loan evidenced by nine pari passu notes with an aggregate outstanding principal balance as of the Cut-off Date of $218.0 million (the “One Campus Martius Whole Loan”). The financial information in the chart above reflects the One Campus Martius Whole Loan. |
| (2) | The lockout period for the One Campus Martius Whole Loan will be at least 33 payment dates beginning with and including the first payment date on August 1, 2022. The One Campus Martius Whole Loan may be (a) defeased in whole after the date that is two years from the closing date of the securitization that includes the last note to be securitized (the “Permitted Defeasance Date”) or (b) if the Permitted Defeasance Date has not occurred by August 1, 2025, prepaid in whole with the payment of a yield maintenance premium. The assumed lockout period of 33 months is based on the expected closing date of the Benchmark 2023-B38 securitization in April 2023. The actual lockout period may be longer. |
| (3) | On each monthly due date, the borrower is required to deposit into an insurance reserve an amount equal to 1/12 of estimated insurance premiums, unless the borrower maintains a blanket insurance policy in accordance with the One Campus Martius Whole Loan documents. |
| (4) | Upfront Other Reserves are comprised of a $3,851,373 outstanding TI/LC reserve. |
| (5) | On each monthly due date during the continuance of a Cash Sweep Event (as defined below) caused by a Meridian Health Trigger Event (as defined below) and/or a Rocket Mortgage Trigger Event (as defined below), all sums remaining in the cash management account after payment of debt service on the One Campus Martius Whole Loan, required reserves, budgeted operating expenses and approved non-budgeted operating expenses must be deposited with and held by the lender for tenant improvement and leasing commission obligations that may be incurred following the loan origination date with respect to the applicable leases at the One Campus Martius property pursuant to the One Campus Martius Whole Loan documents. “Cash Sweep Event” means the occurrence of: (a) an event of default; (b) any bankruptcy action of the borrower, (c) any bankruptcy action of the property manager, (d) the debt coverage ratio based on the trailing three-month period immediately preceding the date of determination being less than 1.15x, (e) certain trigger events related to Centene Management (successor-in-interest of Meridian Health) in accordance with the One Campus Martius Whole Loan documents, including, without limitation, Centene Management’s bankruptcy action or failure to enter into a new lease at least seven months prior to the then-current expiration of such lease or going dark (a “Meridian Health Trigger Event”), or (f) certain trigger events related to Rocket Mortgage in accordance with the One Campus Martius Whole Loan documents, including, without limitation, Rocket Mortgage’s bankruptcy action or failure to enter into a new lease at least 12 months prior to the then-current expiration of such lease or going dark (a “Rocket Mortgage Trigger Event”). |
| (6) | 351,338 sq. ft of expansion space was delivered in 2020, artificially inflating vacancy and upon subsequent lease up driving the increase from 2020 NOI to 2021 NOI. |
| (7) | Historical occupancies are as of December 31 of each respective year unless otherwise indicated. See “The Property” herein. |
| Whole Loan Summary | |||||
| Note | Original Balance | Cut-off Date Balance | Note Holder | Controlling Piece | |
| A-1 | $50,000,000 | $50,000,000 | Benchmark 2022-B36 | Yes | |
| A-2 | $30,000,000 | $30,000,000 | Benchmark 2022-B37 | No | |
| A-3 | $25,000,000 | $25,000,000 | Benchmark 2023-B38 | No | |
| A-4-A | $2,500,000 | $2,500,000 | Benchmark 2023-B38 | No | |
| A-4-B | $13,300,000 | $13,300,000 | JPMCB(1) | No | |
| A-5 | $10,000,000 | $10,000,000 | JPMCB(1) | No | |
| A-6 | $46,200,000 | $46,200,000 | BANK 2022-BNK43 | No | |
| A-7 | $25,000,000 | $25,000,000 | BANK 2022-BNK44 | No | |
| A-8 | $16,000,000 | $16,000,000 | BANK 2022-BNK44 | No | |
| Whole Loan | $218,000,000 | $218,000,000 | |||
| (1) | The related notes are expected to be contributed to one or more future securitizations or otherwise transferred at any time. |
| THE INFORMATION IN THIS STRUCTURAL AND COLLATERAL TERM SHEET IS NOT COMPLETE AND MAY BE AMENDED PRIOR TO THE TIME OF SALE. THIS TERM SHEET IS NOT AN OFFER TO SELL THESE SECURITIES AND IT IS NOT A SOLICITATION OF AN OFFER TO BUY THESE SECURITIES IN ANY JURISDICTION WHERE THE OFFER OR SALE IS NOT PERMITTED. | ||
| 122 | ||
1000 Woodward Avenue Detroit, MI 48226 | Collateral Asset Summary – Loan No. 11 One Campus Martius | Cut-off Date Balance: Cut-off Date LTV: U/W NCF DSCR: U/W NOI Debt Yield: | $27,500,000 60.1% 1.74x 11.5% |
| Sources and Uses | |||||||
| Sources | Proceeds | % of Total | Uses | Proceeds | % of Total | ||
| Whole Loan | $218,000,000 | 100.0% | Loan Payoff | $187,609,949 | 86.1 | % | |
| Return of Equity | 19,720,871 | 9.0 | |||||
| Upfront Reserves | 9,305,766 | 4.3 | |||||
| Closing Costs | 1,363,413 | 0.6 | |||||
| Total Sources | $218,000,000 | 100.0% | Total Uses | $218,000,000 | 100.0 | % | |
The Borrower and the Borrower Sponsor. The borrower for the One Campus Martius Whole Loan is 1000 Webward LLC, a Delaware limited liability company and a single purpose bankruptcy-remote entity with two independent directors in its organizational structure. Legal counsel to the borrower delivered a non-consolidation opinion in connection with the origination of the One Campus Martius Whole Loan.
The borrower sponsor is Bedrock Detroit, which is owned and controlled by Dan Gilbert and affiliated entities, and the non-recourse carveout guarantor is Rock Backer LLC. Founded in 2011, Bedrock Detroit is a full service commercial real estate firm based in downtown Detroit, specializing in the strategic development of urban cores. With a portfolio of more than 100 properties totaling over 18 million sq. ft., Bedrock Detroit is one of the largest real estate partners in downtown Detroit. Since its founding, Bedrock Detroit and its affiliates have invested and committed more than $5.6 billion to acquiring and developing more than 100 properties, including new construction of ground up developments in downtown Detroit and Cleveland totaling more than 20 million sq. ft. Bedrock Detroit’s real estate personnel provide a full range of services with in-house teams for each area of expertise, including leasing, acquisition, finance, construction, architecture, historic rehab and property management. Bedrock Detroit’s tenants include leading technology companies and startups, world-renowned restaurants and national retailers, as well as Detroit locals. Bedrock Detroit also leases mixed-income residential properties to individuals, and acquires and renovates properties for new development. Bedrock Detroit and Dan Gilbert’s family of companies have been critical in the urban revival of Detroit and have demonstrated a strong commitment to the continued growth and stability of the market.
The Property. The One Campus Martius property is a Class A, 16-story, 1,356,325 sq. ft. trophy office building located in Detroit’s financial district. Built in 2003 and further expanded between 2019 and 2020, the One Campus Martius property contains a full height atrium with a dramatic water feature, onsite retail and restaurants, a fitness and wellness center, a second-floor cafeteria and a day care facility led by Bright Horizons, along with a 12-story parking garage with 2,667 parking spaces, resulting in a parking ratio of approximately 2.0 spaces per 1,000 sq. ft. of net rentable area. The One Campus Martius property includes 40,538 sq. ft. of ground floor retail (approximately 3.0% of net rentable area and 2.8% of underwritten base rent), featuring tenants including Sugar Factory, Jimmy Johns and Detroit Water Ice Factory, Inc. The borrower sponsor acquired the One Campus Martius property in 2014 for approximately $142.0 million and has since invested approximately $120.5 million in capital improvements. More recently, between 2019 and 2020, the One Campus Martius property completed an approximately 351,338 sq. ft. expansion at an estimated cost of approximately $93.0 million. The recent expansion added modern office space, expansive event space and new amenity space to the One Campus Martius property. From 2015 through 2019, prior to the expansion, average occupancy at the One Campus Martius property was approximately 97.5%. As of June 27, 2022, the One Campus Martius property was 86.8% leased, with the continuing lease up following the addition of approximately 351,338 sq. ft. (approximately 25.9% of net rentable area) in 2020.
The One Campus Martius property is subject to a condominium structure which is wholly owned and controlled by the borrower. Under the One Campus Martius Whole Loan documents, at all times during the term of the One Campus Martius Whole Loan, the condominium is required to be owned and controlled by the borrower.
As of June 27, 2022, the One Campus Martius property was 86.8% leased to 27 tenants, comprised largely of institutional quality and investment grade rated tenants. Approximately 22.9% of net rentable area and 27.2% of underwritten rent are attributable to investment grade rated tenants including Microsoft Corporation, Centene Management and Huntington National Bank. The tenant roster at the One Campus Martius property is predominantly comprised of tenants in the financial and healthcare sectors. Borrower sponsor affiliated tenants including Rocket Mortgage, Rock Ventures, StockX LLC., Toast Entertainment (event space floor) and building amenities account for approximately 58.2% of net rentable area and 65.8% of underwritten base rent.
| THE INFORMATION IN THIS STRUCTURAL AND COLLATERAL TERM SHEET IS NOT COMPLETE AND MAY BE AMENDED PRIOR TO THE TIME OF SALE. THIS TERM SHEET IS NOT AN OFFER TO SELL THESE SECURITIES AND IT IS NOT A SOLICITATION OF AN OFFER TO BUY THESE SECURITIES IN ANY JURISDICTION WHERE THE OFFER OR SALE IS NOT PERMITTED. | ||
| 123 | ||
1000 Woodward Avenue Detroit, MI 48226 | Collateral Asset Summary – Loan No. 11 One Campus Martius | Cut-off Date Balance: Cut-off Date LTV: U/W NCF DSCR: U/W NOI Debt Yield: | $27,500,000 60.1% 1.74x 11.5% |
The following table presents certain information relating to the tenants at the One Campus Martius Property.
| Tenant Summary(1) | |||||||
| Tenant | Tenant Type | Credit Rating (Moody’s/Fitch/S&P)(2) | Net Rentable Area (Sq. Ft.) | % of Net Rentable Area | U/W Base Rent Per Sq. Ft. | % of Total U/W Base Rent | Lease Expiration |
| Rocket Mortgage(3) | Office | Ba1/BB+/BB+ | 570,214 | 42.0% | $28.81 | 47.4% | 12/31/2028 |
| Centene Management(4)(5) | Office | Baa1/NR/BBB+ | 266,001 | 19.6% | $30.62 | 23.5% | 12/31/2024 |
| Rock Ventures(3) | Office | NR/NR/NR | 66,059 | 4.9% | $31.50 | 6.0% | 12/31/2028 |
| Building Amenities Wellness Center LLC(3)(6) | Amenity | NR/NR/NR | 50,116 | 3.7% | $28.00 | 4.0% | 12/31/2035 |
| Microsoft Corporation | Office | Aaa/AAA/AAA | 43,795 | 3.2% | $28.56 | 3.6% | 7/31/2025 |
| Building Amenities Day Care LLC | Amenity | NR/NR/NR | 43,297 | 3.2% | $28.00 | 3.5% | 12/31/2035 |
| Toast Entertainment (Event Space Floor) (3)(6) | Amenity | NR/NR/NR | 32,980 | 2.4% | $28.00 | 2.7% | 12/31/2035 |
| Plante & Moran, PLLC | Office | NR/NR/NR | 29,295 | 2.2% | $36.33 | 3.1% | 11/30/2023 |
| Building Amenities Cafeteria LLC(3)(6) | Amenity | NR/NR/NR | 22,019 | 1.6% | $28.00 | 1.8% | 12/31/2035 |
| Downtown Detroit Partnership | Office | NR/NR/NR | 7,773 | 0.6% | $25.75 | 0.6% | 1/31/2026 |
| Largest Tenants | 1,131,549 | 83.4% | $29.45 | 96.1% | |||
| Remaining Occupied Office Tenants | 5,709 | 0.4% | $29.18 | 0.5% | |||
| Remaining Occupied Retail Tenants | 40,538 | 3.0% | $23.82 | 2.8% | |||
| Remaining Occupied Other Tenants(7) | 0 | 0.0% | NAP | 0.6% | |||
| Total Occupied | 1,177,796 | 86.8% | $29.43 | 100.0% | |||
| Vacant | 178,529 | 13.2% | |||||
| Total. | 1,356,325 | 100.0% | |||||
| (1) | Based on the underwritten rent roll dated June 27, 2022, inclusive of contractual rent steps through June 1, 2023 and straight-line average rent over the lease term for Microsoft due to its investment grade rating. |
| (2) | In certain instances, ratings provided are those of the parent company of the entity shown, whether or not the parent company guarantees the lease. |
| (3) | Tenant is a borrower affiliate. |
| (4) | Centene Management’s U/W Base Rent Per Sq. Ft. is inclusive of an approximately $700,000 per year data rack usage fee. |
| (5) | Centene Management is a successor-in-interest to Meridian Health, which had been at the One Campus Martius property since December 2014 and assigned its entire interest in its lease to Centene Management on June 29, 2022, shortly after loan origination. According to the borrower sponsor, Centene Management has listed its entire leased space at the One Campus Martius property on the market for sublease, though no prospective subtenant has been identified as of the Cut-off Date. As of the Cut-off Date, Centene Management is in occupancy and paying rent. |
| (6) | Amenity spaces are generally leased by affiliates of the borrower sponsor pursuant to license agreements with third party management. |
| (7) | Remaining Occupied Other Tenants includes signage space leased to StockX and a data rack leased to BMC Software, Inc. with no attributable net rentable area. |
| Lease Rollover Schedule(1)(2) | ||||||||
| Year | # of Leases Expiring | Total Expiring Sq. Ft. | % of Total Sq. Ft. Expiring | Cumulative Sq. Ft. Expiring | Cumulative % ofSq. Ft. Expiring | Annual U/W Base Rent per Sq. Ft. | % U/W Base Rent Rolling | Cumulative % of U/W Base Rent |
| MTM & 2023 | 8 | 39,844 | 2.9% | 39,844 | 2.9% | $32.49 | 3.7% | 3.7% |
| 2024 | 4 | 272,016 | 20.1% | 311,860 | 23.0% | $30.40 | 23.9% | 27.6% |
| 2025 | 1 | 43,795 | 3.2% | 355,655 | 26.2% | $28.56 | 3.6% | 31.2% |
| 2026 | 7 | 25,650 | 1.9% | 381,305 | 28.1% | $32.43 | 2.4% | 33.6% |
| 2027 | 1 | 4,189 | 0.3% | 385,494 | 28.4% | $28.56 | 0.3% | 33.9% |
| 2028 | 2 | 636,273 | 46.9% | 1,021,767 | 75.3% | $29.09 | 53.4% | 87.3% |
| 2029 | 0 | 0 | 0.0% | 1,021,767 | 75.3% | $0.00 | 0.0% | 87.3% |
| 2030 | 0 | 0 | 0.0% | 1,021,767 | 75.3% | $0.00 | 0.0% | 87.3% |
| 2031 | 0 | 0 | 0.0% | 1,021,767 | 75.3% | $0.00 | 0.0% | 87.3% |
| 2032 | 1 | 7,617 | 0.6% | 1,029,384 | 75.9% | $30.60 | 0.7% | 88.0% |
| 2033 & Thereafter(3) | 4 | 148,412 | 10.9% | 1,177,796 | 86.8% | $28.00 | 12.0% | 100.0% |
| Vacant | NAP | 178,529 | 13.2% | 1,356,325 | 100.0% | NAP | NAP | NAP |
| Total / Wtd. Avg. | 28 | 1,356,325 | 100.0% | $29.43 | 100.0% | |||
| (1) | Based on the underwritten rent roll dated June 27, 2022, inclusive of contractual rent steps through June 1, 2023 and straight-line average rent over the lease term for Microsoft due to its investment grade rating. |
| (2) | Certain tenants may have termination or contraction options (which may become exercisable prior to the originally stated expiration date of the tenant lease) that are not considered in the above Lease Expiration Schedule. |
| (3) | 2033 & Thereafter is inclusive of 148,412 sq. ft. of cafeteria, wellness, day care and event amenity space that is leased by affiliates of the borrower sponsor. All amenity spaces are subject to leases through December 2035. |
| THE INFORMATION IN THIS STRUCTURAL AND COLLATERAL TERM SHEET IS NOT COMPLETE AND MAY BE AMENDED PRIOR TO THE TIME OF SALE. THIS TERM SHEET IS NOT AN OFFER TO SELL THESE SECURITIES AND IT IS NOT A SOLICITATION OF AN OFFER TO BUY THESE SECURITIES IN ANY JURISDICTION WHERE THE OFFER OR SALE IS NOT PERMITTED. | ||
| 124 | ||
1000 Woodward Avenue Detroit, MI 48226 | Collateral Asset Summary – Loan No. 11 One Campus Martius | Cut-off Date Balance: Cut-off Date LTV: U/W NCF DSCR: U/W NOI Debt Yield: | $27,500,000 60.1% 1.74x 11.5% |
Historical Occupancy(1)
| |||||||
| 2015 | 2016 | 2017 | 2018 | 2019 | 2020(2) | 2021(2)(3) | Current(4) |
| 99.0% | 95.0% | 98.0% | 98.0% | 97.4% | 76.5% | 86.1% | 86.8% |
| (1) | Historical occupancies are as of December 31 of each respective year unless otherwise indicated. |
| (2) | Expansion space was delivered in 2020, artificially inflating vacancy. |
| (3) | The historical occupancy for 2021 is representative of the average occupancy across the entire year. |
| (4) | Current occupancy is based on the June 27, 2022 rent roll. |
Cash Flow Analysis.
| Cash Flow Analysis | ||||||
| 2019 | 2020(1) | 2021(1) | T-12 11/30/2022 | U/W | U/W PSF | |
| Rents in Place(2) | $26,180,074 | $25,935,421 | $33,372,181 | $37,755,813 | $34,662,802 | $25.56 |
| Vacant Income | 0 | 0 | 0 | 0 | 5,355,870 | 3.95 |
| Gross Potential Rent | $26,180,074 | $25,935,421 | $33,372,181 | $37,755,813 | $40,018,672 | $29.51 |
| Total Reimbursements | 5,028,329 | 3,377,400 | 2,912,952 | 3,045,803 | 3,992,858 | 2.94 |
| Parking Income | 8,218,268 | 7,604,926 | 7,790,884 | 8,617,066 | 9,296,981 | 6.85 |
| Rental Storage Income | 23,255 | 33,057 | 33,297 | 28,848 | 39,680 | 0.03 |
| Gross Potential Income | $39,449,927 | $36,950,803 | $44,109,314 | $49,447,531 | $53,348,190 | $39.33 |
| Vacancy/Credit Loss(3) | (141,202) | (111,036) | 82,000 | (105,385) | (7,139,816) | (5.26) |
| Other Income(4) | 80,135 | 6,164 | 7,646 | 503,029 | 16,200 | 0.01 |
| Effective Gross Income | $39,388,859 | $36,845,931 | $44,198,961 | $49,845,174 | $46,224,574 | $34.08 |
| Total Expenses | 20,050,553 | 18,308,085 | 19,173,640 | 21,445,511 | 21,145,889 | 15.59 |
| Net Operating Income | $19,338,306 | $18,537,846 | $25,025,321 | $28,399,663 | $25,078,685 | $18.49 |
| TI/LC | 0 | 0 | 0 | 0 | 1,703,467 | 1.26 |
| Capital Expenditures | 0 | 0 | 0 | 0 | 188,765 | 0.14 |
| Net Cash Flow | $19,338,306 | $18,537,846 | $25,025,321 | $28,399,663 | $23,186,453 | $17.10 |
| (1) | 351,338 sq. ft of expansion space was delivered in 2020, artificially inflating vacancy and upon subsequent lease up driving the increase from 2020 NOI to 2021 NOI. |
| (2) | Underwritten Rents In Place is inclusive of contractual rent steps through June 1, 2023 and straight-line average rent over the lease term for Microsoft due to its investment grade rating. |
| (3) | 2021 Vacancy/Credit Loss reflect adjustments relating to historically written off bad debt expenses which have since been recovered. |
| (4) | Other income is inclusive of miscellaneous income, tenant extras and late fees among other items. |
| THE INFORMATION IN THIS STRUCTURAL AND COLLATERAL TERM SHEET IS NOT COMPLETE AND MAY BE AMENDED PRIOR TO THE TIME OF SALE. THIS TERM SHEET IS NOT AN OFFER TO SELL THESE SECURITIES AND IT IS NOT A SOLICITATION OF AN OFFER TO BUY THESE SECURITIES IN ANY JURISDICTION WHERE THE OFFER OR SALE IS NOT PERMITTED. | ||
| 125 | ||
5232 North Service Road Saint Peters, MO 63376 | Collateral Asset Summary – Loan No. 12 Shoppes at Mid Rivers | Cut-off Date Balance: Cut-off Date LTV: U/W NCF DSCR: U/W NOI Debt Yield: | $27,472,500 66.7% 1.72x 12.0% |
| Mortgage Loan Information | |
| Loan Seller: | JPMCB |
| Loan Purpose: | Acquisition |
| Borrower Sponsor: | Jenel Management |
| Borrowers: | Mid Rivers Partners LLC and Midriver Emerald TIC LLC |
| Original Balance: | $27,472,500 |
| Cut-off Date Balance: | $27,472,500 |
| % by Initial UPB: | 4.2% |
| Interest Rate: | 6.60500% |
| Payment Date: | 5th of each month |
| First Payment Date: | February 5, 2023 |
| Maturity Date: | January 5, 2033 |
| Amortization: | Interest Only |
| Additional Debt: | None |
| Call Protection: | L(27),D(87),O(6) |
| Lockbox / Cash Management: | Hard / Springing |
| Reserves | |||
| Initial | Monthly | Cap | |
| Taxes: | $50,278 | $50,278 | NAP |
| Insurance: | $0 | Springing | NAP |
| Replacement Reserves: | $73,615 | Springing | $73,615 |
| TI/LC: | $300,000 | Springing | $300,000 |
| Other(1): | $710,273 | $0 | NAP |
| Property Information | |
| Single Asset / Portfolio: | Single Asset |
| Property Type: | Anchored Retail |
| Collateral: | Fee |
| Location: | Saint Peters, MO |
| Year Built / Renovated: | 2017 / NAP |
| Total Sq. Ft.: | 245,383 |
| Property Management: | Jenel Management Corp. |
| Underwritten NOI(2): | $3,310,319 |
| Underwritten NCF(2): | $3,156,281 |
| Appraised Value: | $41,200,000 |
| Appraisal Date: | November 23, 2022 |
| Historical NOI | |
| Most Recent NOI(2): | $2,866,080 (T-12 September 30, 2022) |
| 2021 NOI: | $2,767,494 (December 31, 2021) |
| 2020 NOI: | $2,760,991 (December 31, 2020) |
| 2019 NOI: | NAV |
| Historical Occupancy | |
| Most Recent Occupancy(2): | 98.0% (November 7, 2022) |
| 2021 Occupancy: | 96.2% (December 31,2021) |
| 2020 Occupancy: | 97.2% (December 31,2020) |
| 2019 Occupancy: | 97.2% (December 31,2019) |
| Financial Information | ||||||
| Tranche | Cut-off Date Balance | Balance per Sq. Ft. Cut-off / Balloon | LTV Cut-off / Balloon | U/W DSCR NOI / NCF | U/W Debt Yield NOI / NCF | U/W Debt Yield at Balloon NOI / NCF |
| Mortgage Loan | $27,472,500 | $112 / $112 | 66.7% / 66.7% | 1.80x / 1.72x | 12.0% / 11.5% | 12.0% / 11.5% |
| (1) | Upfront Other Reserves are comprised of (i) an outstanding TI reserve in the amount of approximately $410,273 to cover $334,425 in outstanding tenant improvements and approximately $75,847 in outstanding leasing commissions for Old Navy and (ii) an additional rent reserve in the amount of $300,000 to be held by the lender as additional rent (as described below) and to cover leasing items. Provided no event of default has occurred and is continuing, on each payment date the lender is required to disburse $12,500 to the borrower as additional rent, or at the request of the borrower the lender is required to disburse 100% of the actual costs related to leasing items pursuant to leases being approved by the lender in accordance with the Shoppes at Mid Rivers loan documents. |
| (2) | Underwritten NOI, Underwritten NCF and Most Recent Occupancy are inclusive of Old Navy which is currently building out its space and is anticipated to take occupancy in the second quarter of 2023. The increase from Most Recent NOI to Underwritten NOI is primarily attributable to Old Navy. |
| Sources and Uses | ||||||||
| Sources | Proceeds | % of Total | Uses | Proceeds | % of Total | |||
| Mortgage Loan | $27,472,500 | 65.2 | % | Purchase Price | $40,700,000 | 96.6 | % | |
| Sponsor Equity | 14,676,259 | 34.8 | Upfront Reserves | 1,134,165 | 2.7 | |||
| Closing Costs | 314,593 | 0.7 | ||||||
| Total Sources | $42,148,759 | 100.0 | % | Total Uses | $42,148,759 | 100.0 | % | |
The Borrowers and the Borrower Sponsor. The borrowers are Mid Rivers Partners LLC and Midriver Emerald TIC LLC, each a Delaware limited liability company and a single purpose entity with one independent director in its organizational structure. The borrowers own the Shoppes at Mid Rivers Property (as defined below) as tenants-in-common. Legal counsel to the borrower delivered a non-consolidation opinion in connection with the origination of the Shoppes at Mid Rivers mortgage loan.
The borrower sponsor is Jenel Management, a New York-based private real estate investment company with over 30 years of experience. Jenel Management owns and manages 95 properties totaling more than three million sq. ft. The borrower sponsor reports that it has approximately $2.0 billion in assets under management, which include urban high-street retail, hotel and other mixed-use properties. David Dushey, Vice President at Jenel Management, serves as the non-recourse carveout guarantor for the Shoppes at Mid Rivers loan.
The Property. The Shoppes at Mid Rivers property (the “Shoppes at Mid Rivers Property”) is a 245,383 sq. ft. open-air anchored retail center located in Saint Peters, Missouri. The Shoppes at Mid Rivers Property was constructed in 2017 and is comprised of four single story buildings, situated on an approximately 24.0 acre parcel. The Shoppes at Mid Rivers Property is anchored by Academy Sports + Outdoors (62,950 sq. ft.; 25.7% of NRA, 19.9% of underwritten base rent, Moody’s/Fitch/S&P: NR/NR/BB), Marshalls/Home Goods (43,997 sq. ft.; 17.9% of NRA, 13.9% of underwritten base rent, Moody’s/Fitch/S&P: A2/NR/A) and Burlington (40,726 sq. ft.; 16.6% of NRA, 13.1% of underwritten base rent, Moody’s/Fitch/S&P: NR/NR/BB+). The Shoppes at Mid Rivers Property also features junior anchor tenants including Ross Dress for Less (22,000 sq. ft.; 9.0% of NRA, 7.2% of underwritten base rent, Moody’s/Fitch/S&P: A2/NR/BBB+), Old Navy (13,377 sq. ft.; 5.5% of NRA, 6.7% of underwritten base rent, Moody’s/Fitch/S&P: Ba2/NR/BB) and Ulta Beauty (10,003 sq. ft.; 4.1% of NRA, 6.3% of underwritten base rent). Old Navy is currently building out its space and is anticipated to take occupancy in the second quarter of 2023. The anchor tenants, which comprise of at least 40,000 sq. ft. each and junior anchor tenants which comprise of at least 10,000 sq. ft. each have a weighted average lease term of 11.98 years and no other tenant contributes for more than 3.5% of
| THE INFORMATION IN THIS STRUCTURAL AND COLLATERAL TERM SHEET IS NOT COMPLETE AND MAY BE AMENDED PRIOR TO THE TIME OF SALE. THIS TERM SHEET IS NOT AN OFFER TO SELL THESE SECURITIES AND IT IS NOT A SOLICITATION OF AN OFFER TO BUY THESE SECURITIES IN ANY JURISDICTION WHERE THE OFFER OR SALE IS NOT PERMITTED. | ||
| 126 | ||
5232 North Service Road Saint Peters, MO 63376 | Collateral Asset Summary – Loan No. 12 Shoppes at Mid Rivers | Cut-off Date Balance: Cut-off Date LTV: U/W NCF DSCR: U/W NOI Debt Yield: | $27,472,500 66.7% 1.72x 12.0% |
NRA and 4.8% of underwritten base rent. The in-line tenants consist of a blend of local, regional and national tenants such as Carter’s, Famous Footwear and Gulf Shores Grill.
As of November 7, 2022, the Shoppes at Mid Rivers Property was 98.0% leased to 19 tenants. Approximately 28.1% of NRA and 22.7% of underwritten base rent at the Shoppes at Mid Rivers Property are attributable to investment grade rated tenants including Marshalls/Home Goods, Ross Dress for Less and Oshkosh B'gosh. The Shoppes at Mid Rivers Property contains 1,226 parking spaces resulting in a parking ratio of 5.00 spaces per 1,000 sq. ft. The broader retail center that encompasses the Shoppes at Mid Rivers Property also contains three additional non-collateral parcels, including Outback Steakhouse, Discount Tire and Cooper’s Hawk restaurant.
According to a third-party data source, approximately 2.6 million people visited the Shoppes at Mid Rivers Property in the 12-month period ending March 15, 2023, which represents an approximately 40.2% increase above the 12-month period ending March 15, 2021. Additionally, Marshalls/HomeGoods and Ulta Beauty ranked #2 and #4 respectively in the state of Missouri based on number of visits to each store.
The Shoppes at Mid Rivers Property is located approximately 28 miles southwest of the St. Louis central business district and 15 miles east/southwest of the St. Louis Lambert International Airport. The Shoppes at Mid Rivers Property features signage and visibility along Interstate 70 which is an east/west highway providing access to metropolitan areas including Denver, Kansas City, Indianapolis, Columbus and Baltimore.
The following table presents certain information relating to the tenants at the Shoppes at Mid Rivers Property.
| Tenant Summary(1) | ||||||||
| Tenant | Credit Rating (Moody’s/Fitch /S&P)(2) | Net Rentable Area (Sq. Ft.) | % of Net Rentable Area | U/W Base Rent Per Sq. Ft. | % of Total U/W Base Rent | Sales Per Sq. Ft.(3) | Occupancy Cost(3) | Lease Expiration |
| Academy Sports + Outdoors | NR/NR/BB | 62,950 | 25.7% | $11.30 | 19.9% | NAV | NAV | 2/28/2033 |
| Marshalls/HomeGoods | A2/NR/A | 43,997 | 17.9% | $11.28 | 13.9% | NAV | NAV | 10/31/2027 |
| Burlington | NR/NR/BB+ | 40,726 | 16.6% | $11.50 | 13.1% | NAV | NAV | 2/29/2028 |
| Ross Dress for Less | A2/NR/BBB+ | 22,000 | 9.0% | $11.75 | 7.2% | NAV | NAV | 1/31/2028 |
| Old Navy(4)(5) | Ba2/NR/BB | 13,377 | 5.5% | $18.00 | 6.7% | NAV | NAV | 6/30/2033 |
| Ulta Beauty | NR/NR/NR | 10,003 | 4.1% | $22.55 | 6.3% | NAV | NAV | 4/30/2028 |
| Five Below | NR/NR/NR | 8,478 | 3.5% | $20.25 | 4.8% | NAV | NAV | 1/31/2028 |
| Gulf Shores Grill | NR/NR/NR | 5,203 | 2.1% | $26.00 | 3.8% | NAV | NAV | 12/31/2031 |
| Famous Footwear | NR/NR/NR | 5,112 | 2.1% | $21.73 | 3.1% | $154 | 14.1% | 10/31/2027 |
| Uptown Cheapskate | NR/NR/NR | 4,991 | 2.0% | $18.53 | 2.6% | $238 | 7.8% | 10/31/2023 |
| Ten Largest Tenants | 216,837 | 88.4% | $13.43 | 81.3% | ||||
| Other | 23,620 | 9.6% | $28.34 | 18.7% | ||||
| Total Occupied | 240,457 | 98.0% | $14.89 | 100.0% | ||||
| Vacant | 4,926 | 2.0% | ||||||
| Total | 245,383 | 100.0% | ||||||
| (1) | Based on the underwritten rent roll dated November 7, 2022, inclusive of contractual rent steps through April 1, 2023. |
| (2) | In certain instances, ratings provided are those of the parent company of the entity shown, whether or not the parent company guarantees the lease. |
| (3) | Based on data provided by the borrower sponsor. Sales data is as of October 2022. In many instances, underlying leases do not require ongoing tenants sales reporting. |
| (4) | Old Navy is currently building out its space and is anticipated to take occupancy in the second quarter of 2023. |
| (5) | Old Navy has the right to unilaterally terminate its lease with 30 days’ written notice and the payment of a termination fee if Old Navy’s gross sales between the 72nd full calendar month and the 84th full calendar month of its lease term (the “Termination Measuring Period”) do not equal or exceed $3,500,000 and such required notice is provided at any time during the first three full calendar months after the Termination Measuring Period. |
| THE INFORMATION IN THIS STRUCTURAL AND COLLATERAL TERM SHEET IS NOT COMPLETE AND MAY BE AMENDED PRIOR TO THE TIME OF SALE. THIS TERM SHEET IS NOT AN OFFER TO SELL THESE SECURITIES AND IT IS NOT A SOLICITATION OF AN OFFER TO BUY THESE SECURITIES IN ANY JURISDICTION WHERE THE OFFER OR SALE IS NOT PERMITTED. | ||
| 127 | ||
5232 North Service Road Saint Peters, MO 63376 | Collateral Asset Summary – Loan No. 12 Shoppes at Mid Rivers | Cut-off Date Balance: Cut-off Date LTV: U/W NCF DSCR: U/W NOI Debt Yield: | $27,472,500 66.7% 1.72x 12.0% |
Lease Rollover Schedule(1)(2) | ||||||||||
| Year | # of Leases Expiring | Total Expiring Sq. Ft. | % of Total Sq. Ft. Expiring | Cumulative Sq. Ft. Expiring | Cumulative % of Sq. Ft. Expiring | Annual U/W Base Rent per Sq. Ft. | % U/W Base Rent Rolling | Cumulative % of U/W Base Rent | ||
| MTM & 2023 | 2 | 6,547 | 2.7% | 6,547 | 2.7% | $21.62 | 4.0% | 4.0% | ||
| 2024 | 0 | 0 | 0.0% | 6,547 | 2.7% | $0.00 | 0.0% | 4.0% | ||
| 2025 | 1 | 2,914 | 1.2% | 9,461 | 3.9% | $28.83 | 2.3% | 6.3% | ||
| 2026 | 1 | 1,600 | 0.7% | 11,061 | 4.5% | $27.50 | 1.2% | 7.5% | ||
| 2027 | 5 | 59,459 | 24.2% | 70,520 | 28.7% | $14.84 | 24.6% | 32.2% | ||
| 2028 | 5 | 84,407 | 34.4% | 154,927 | 63.1% | $14.84 | 35.0% | 67.2% | ||
| 2029 | 1 | 2,400 | 1.0% | 157,327 | 64.1% | $23.00 | 1.5% | 68.7% | ||
| 2030 | 0 | 0 | 0.0% | 157,327 | 64.1% | $0.00 | 0.0% | 68.7% | ||
| 2031 | 1 | 5,203 | 2.1% | 162,530 | 66.2% | $26.00 | 3.8% | 72.5% | ||
| 2032 | 1 | 1,600 | 0.7% | 164,130 | 66.9% | $21.00 | 0.9% | 73.4% | ||
| 2033 & Thereafter(3) | 2 | 76,327 | 31.1% | 240,457 | 98.0% | $12.47 | 26.6% | 100.0% | ||
| Vacant | NAP | 4,926 | 2.0% | 245,383 | 100.0% | NAP | NAP | NAP | ||
| Total / Wtd. Avg. | 19 | 245,383 | 100.00% | $14.89 | 100% | |||||
| (1) | Based on the underwritten rent roll dated November 7, 2022, inclusive of contractual rent steps through April 1, 2023. |
| (2) | Certain tenants may have termination or contraction options (which may become exercisable prior to the originally stated expiration date of the tenant lease) that are not considered in the above Lease Expiration Schedule. |
| (3) | 2033 & Thereafter is inclusive of Old Navy which is currently building out its space and is anticipated to take occupancy in the second quarter of 2023. |
Cash Flow Analysis.
| Cash Flow Analysis | |||||
| 2020 | 2021 | T-12 09/30/2022(1) | U/W(1) | U/W PSF | |
| Rents in Place(2) | $3,086,132 | $3,113,842 | $3,180,725 | $3,580,831 | $14.59 |
| Vacant Income(3) | 0 | 0 | 0 | 108,372 | 0.44 |
| Gross Potential Rent | $3,086,132 | $3,113,842 | $3,180,725 | $3,689,203 | $15.03 |
| Total Reimbursements(4) | 843,837 | 843,324 | 818,696 | 1,018,249 | 4.15 |
| Parking Income | 0 | 0 | 0 | 0 | 0.00 |
| Rental Storage Income | 0 | 0 | 0 | 0 | 0.00 |
| Gross Potential Income | $3,929,969 | $3,957,166 | $3,999,422 | $4,707,452 | $19.18 |
| Vacancy/Credit Loss | 0 | 0 | 0 | (235,373) | (0.96) |
| Other Income(5) | 20,386 | 21,364 | 26,912 | 26,912 | 0.11 |
| Effective Gross Income | $3,950,355 | $3,978,530 | $4,026,334 | $4,498,992 | $18.33 |
| Total Expenses(4) | 1,189,364 | 1,211,036 | 1,160,254 | 1,188,673 | 4.84 |
| Net Operating Income | $2,760,991 | $2,767,494 | $2,866,080 | $3,310,319 | $13.49 |
| TI/LC(6) | 0 | 0 | 0 | 117,230 | 0.48 |
| Capital Expenditures | 0 | 0 | 0 | 36,807 | 0.15 |
| Net Cash Flow | $2,760,991 | $2,767,494 | $2,866,080 | $3,156,281 | $12.86 |
| (1) | The increase from the T-12 09/30/2022 NOI to U/W NOI is primarily attributable to Old Navy which is currently building out its space and is anticipated to take occupancy in the second quarter of 2023. |
| (2) | U/W Rents In Place is based on the underwritten rent roll dated November 7, 2022, inclusive of contractual rent steps through April 1, 2023. |
| (3) | Vacant Income is based on the appraisers concluded market rent of $22.00 PSF. |
| (4) | Total Reimbursements and Total Expenses are adjusted to exclude Academy Sports + Outdoors pro-rata share of real estate taxes as they are paid directly to the tax authority by Academy Sports + Outdoors. |
| (5) | Other Income, inclusive of miscellaneous income and lease termination income among other things is normalized to exclude one-time items. |
| (6) | TI/LC is underwritten net of a $30,000 credit due to the $300,000 upfront TI/LC reserve. |
| THE INFORMATION IN THIS STRUCTURAL AND COLLATERAL TERM SHEET IS NOT COMPLETE AND MAY BE AMENDED PRIOR TO THE TIME OF SALE. THIS TERM SHEET IS NOT AN OFFER TO SELL THESE SECURITIES AND IT IS NOT A SOLICITATION OF AN OFFER TO BUY THESE SECURITIES IN ANY JURISDICTION WHERE THE OFFER OR SALE IS NOT PERMITTED. | ||
| 128 | ||
123 West Louisiana Street Indianapolis, IN 46225 | Collateral Asset Summary – Loan No. 13 Crowne Plaza Union Station | Cut-off Date Balance: Cut-off Date LTV: U/W NCF DSCR: U/W NOI Debt Yield: | $23,985,678 47.5% 1.68x 16.4% |
| Mortgage Loan Information | |
| Loan Seller: | GACC |
| Loan Purpose: | Refinance |
| Borrower Sponsor: | James E. Dora, Jr. |
| Borrower: | B&D Associates, LLC |
| Original Balance: | $24,000,000 |
| Cut-off Date Balance: | $23,985,678 |
| % by Initial UPB: | 3.7% |
| Interest Rate: | 7.15200% |
| Payment Date: | 6th of each month |
| First Payment Date: | April 6, 2023 |
| Maturity Date: | March 6, 2033 |
| Amortization: | Amortizing Balloon |
| Additional Debt(1): | None |
| Call Protection: | L(25),D(90),O(5) |
| Lockbox / Cash Management: | Hard / Springing |
| Reserves | |||
| Initial | Monthly | Cap | |
| Taxes: | $305,117 | $61,023 | NAP |
| Insurance: | $0 | Springing | NAP |
| Replacement: | $0 | $0 | NAP |
| Immediate Repairs: | $0 | $0 | NAP |
| Other(2): | $11,756,614 | Springing | $364,500 |
| Property Information | ||
| Single Asset / Portfolio: | Single Asset | |
| Property Type: | Full Service Hospitality | |
| Collateral: | Leasehold | |
| Location: | Indianapolis, IN | |
| Year Built / Renovated: | 1880, 1986 / 2014 | |
| Total Rooms: | 273 | |
| Property Management: | General Hotels Corporation | |
| Underwritten NOI: | $3,931,619 | |
| Underwritten NCF: | $3,271,916 | |
| Appraised Value(3): | $50,500,000 | |
| Appraisal Date: | December 15, 2023 | |
| Historical NOI | ||
| Most Recent NOI: | $3,893,448 (T-12 November 30, 2022) | |
| 2021 NOI: | $2,182,922 (December 31, 2021) | |
| 2020 NOI: | ($1,570,758) (December 31, 2020) | |
| 2019 NOI: | $4,092,217 (December 31, 2019) | |
| Historical Occupancy | ||
| Most Recent Occupancy: | 55.7% (November 30, 2022) | |
| 2021 Occupancy: | 46.2% (December 31, 2021) | |
| 2020 Occupancy: | 21.6% (December 31, 2020) | |
| 2019 Occupancy: | 71.3% (December 31, 2019) | |
| Financial Information(1) | ||||||
| Tranche | Cut-off Date Balance | Balance per Room | LTV | U/W DSCR | U/W Debt Yield | U/W Debt Yield at Balloon |
| Cut-off / Balloon | Cut-off / Balloon | NOI / NCF | NOI / NCF | NOI / NCF | ||
| Mortgage Loan | $23,985,678 | $87,860 / $77,012 | 47.5% / 41.6% | 2.02x / 1.68x | 16.4% / 13.6% | 18.7% / 15.6% |
| (1) | The borrower is entitled to receive a $3,600,000 key money loan from the franchisor in connection with the performance of a property improvement plan (“PIP”) at the Crowne Plaza Union Station Property (as defined below), subject to compliance with certain conditions. See “Description of the Mortgage Pool—Additional Indebtedness—Other Unsecured Indebtedness” in the Preliminary Prospectus. |
| (2) | Other reserves consist of an upfront PIP reserve, an upfront seasonality reserve, a ground rent reserve and monthly springing seasonality reserve and monthly ground rent reserve and springing PIP reserve as well as a future PIP and FF&E reserve . |
| (3) | The Appraised Value represents the “Prospective Market Value Upon Completion,” which is based on the extraordinary assumption that the Crowne Plaza Union Station Property would complete a renovation at a total budgeted cost of $10,000,000 during the first year of the projection period (2023). The borrower is required to complete a franchisor required PIP by the dates specified in such PIP, which generally range from March 2025 through March 2027. At origination, the borrower deposited approximately $11,262,114 into a reserve for such PIP. The “As-Is” appraised value of the Crowne Plaza Union Station Property as of December 15, 2022 is $37,500,000, which results in a Cut-off LTV and Balloon LTV of 64.0% and 56.1%, respectively. |
| Sources and Uses | ||||||||
| Sources | Proceeds | % of Total | Uses | Proceeds | % of Total | |||
| Mortgage Loan | $24,000,000 | 99.5 | % | Loan Payoff | $10,024,098 | 41.6 | % | |
| Sponsor Equity | 125,000 | 0.5 | Upfront Reserves | 12,061,731 | 50.0 | |||
| Closing Costs | 2,039,171 | 8.5 | ||||||
| Total Sources | $24,125,000 | 100.0 | % | Total Uses | $24,125,000 | 100.0 | % | |
The Borrower and the Borrower Sponsor. The borrower is B&D Associates, LLC, a Delaware limited liability company. The borrower is a single purpose bankruptcy-remote entity with one independent director in its organizational structure. Legal counsel to the borrower delivered a non-consolidation opinion in connection with the origination of the Crowne Plaza Union Station loan.
The borrower sponsor and non-recourse carveout guarantor is James E. Dora, Jr. Mr. Dora oversees the General Hotels Corporation’s (“GHC”) overall operation and is responsible for GHC’s long-term strategic planning. Headquartered in Indianapolis, Indiana, GHC was founded in 1962 by James E. Dora, Sr., who opened Holiday Inn Terre Haute, Indiana as the first of many Indiana Holiday Inn franchises and continued to develop and operate hotels under IHG, Hilton and Marriott brands. The hotels garnered design and service awards. Today, GHC is one of the largest Midwest hotel management and development companies with a portfolio of over 50 properties representing approximately 5,000 guest rooms. Along with managing capital construction projects, Mr. Dora is actively involved in the InterContinental Hotels and Resorts International Association of Holiday Inn owner's organization and serves in numerous volunteer capacities within the greater Indianapolis community.
| THE INFORMATION IN THIS STRUCTURAL AND COLLATERAL TERM SHEET IS NOT COMPLETE AND MAY BE AMENDED PRIOR TO THE TIME OF SALE. THIS TERM SHEET IS NOT AN OFFER TO SELL THESE SECURITIES AND IT IS NOT A SOLICITATION OF AN OFFER TO BUY THESE SECURITIES IN ANY JURISDICTION WHERE THE OFFER OR SALE IS NOT PERMITTED. | ||
| 129 | ||
123 West Louisiana Street Indianapolis, IN 46225 | Collateral Asset Summary – Loan No. 13 Crowne Plaza Union Station | Cut-off Date Balance: Cut-off Date LTV: U/W NCF DSCR: U/W NOI Debt Yield: | $23,985,678 47.5% 1.68x 16.4% |
The Property. The Crowne Plaza Union Station property (the “Crowne Plaza Union Station Property”) is a 273-room, full-service hotel located in downtown Indianapolis, Indiana. The Crowne Plaza Union Station hotel opened in 1986 as a Holiday Inn in connection with the conversion of the Indianapolis Union Station into a Festival Marketplace. The Indianapolis Union Station building was originally built in 1880 and is recognized as one of the finest Romanesque Revival styled structures in America. In 1986, Union Station was reopened as a Festival Marketplace, which included nearly 100 restaurants, nightclubs, and retail stores. The hotel was built as a Holiday Inn in the west section of the train shed attached to Union Station. The 273-room hotel maintained the historic train theme associated with Union Station, including 26 authentic Pullman train car guestrooms named and decorated after famous personalities from the early 1900s that have been converted from 13 vintage Pullman train cars resting on original tracks. The Crowne Plaza Union Station Property is located in an area designated as the Indianapolis Union Railway Station Historic Area. The area is subject to design restrictions, requirements and approval from the Indianapolis Historic Preservation Commission.
In 1993, the hotel was converted to a Crowne Plaza, and the Festival Marketplace closed four years later. In 2001, an 8,000 sq. ft. ballroom was added to the Grand Hall and Conference Center. Today, the hotel offers 55,000 sq. ft. of meeting, functional exhibit, and ballroom space. The Crowne Plaza Union Station Property operates under a franchise agreement with Holiday Hospitality Franchising, LLC which expires May 1, 2049. The hotel is currently required to perform a PIP, which is anticipated to cost approximately $10,000,000. The first phase includes renovations to, among other things, common areas, Taggart’s Bar & Restaurant, exterior, swimming pool, kitchen, elevators and guest rooms, with completion required by March 1, 2025. The second phase includes renovations to, among other things, 123 West Restaurant, meeting rooms, fitness center and life safety and accessibility upgrades, with completion required by March 1, 2027. At origination, $11,262.114.12 was reserved for the PIP.
Amenities include a 24-hour front desk and concierge with private and express check-in and check-out options, baggage storage, Wi-Fi throughout the property, air conditioning/heating, smoke-free property, pet-friendly rooms, daily housekeeping, a same-day dry cleaning and laundry service, fitness center, indoor pool, meeting/banquet facilities, business center, an on-site restaurant, valet services, and nearby paid self-parking. The hotel also features an on-site gift shop and a convenience store.
The Crowne Plaza Union Station Property consists of (i) a leasehold interest under a ground lease with the City of Indianapolis Department of Metropolitan Development (the “Indianapolis DMD”) that is in place through December 2046 relating to the 273 room hotel and the related land (the “Hotel Ground Lease”), (ii) a leasehold interest under a lease with the Indianapolis DMD that is in place through September 2026 relating to approximately 42,256 square feet of banquet and meeting room space within a building known as the Union Station Building (the “Grand Hall Lease”), and (iii) a leasehold interest under a lease with the Indiana Stadium and Convention Center that is in place through December 2046 relating to a 120 space parking lot (the “Parking Lease”). The Hotel Ground Lease can be renewed at the borrower’s option for up to 99 years to 2145 with 180 days’ notice. The Grand Hall Lease can be renewed at the borrower’s option for three additional periods of five years each, extending to September 2041 if fully extended. The Parking Lease can be renewed at the borrower’s option for 99 years to 2145.
The following table presents certain information relating to the 2022 demand analysis with respect to the Crowne Plaza Union Station Property based on market segmentation, as provided in the appraisal for the Crowne Plaza Union Station Property:
| Demand Segmentation(1) | ||||
| Property | Rooms | Leisure | Meeting & Group | Commercial |
| Crowne Plaza Union Station | 273 | 40.0% | 45.0% | 15.0% |
| (1) | Source: Appraisal |
The following table presents certain information relating to the primary competition for the Crowne Plaza Union Station Property:
| Primary Competitive Set(1) | ||||||
| Property | Location | Rooms | Year Built | Estimated 2022 Occupancy | Estimated 2022 ADR | Estimated 2022 RevPAR |
| Crowne Plaza Union Station | Indianapolis, IN | 273 | 1880, 1986 | 56.6% | $182.23 | $103.17 |
| Hyatt Regency Indianapolis | Indianapolis, IN | 499 | 1977 | 65-70% | $165 - $175 | $105 - $115 |
| Sheraton Hotel Indianapolis City Centre | Indianapolis, IN | 378 | 1975 | 55-60% | $170 - $180 | $90 - $100 |
| Westin Indianapolis | Indianapolis, IN | 574 | 1989 | 55-60% | $190 - $200 | $105 - $115 |
| Hilton Indianapolis | Indianapolis, IN | 352 | 1971 | 65-70% | $185 - $195 | $120 - $130 |
| The Alexander, a Dolce Hotel | Indianapolis, IN | 209 | 2013 | 60-65% | $165 - $175 | $95 - $105 |
| (1) | Source: Appraisal. |
| THE INFORMATION IN THIS STRUCTURAL AND COLLATERAL TERM SHEET IS NOT COMPLETE AND MAY BE AMENDED PRIOR TO THE TIME OF SALE. THIS TERM SHEET IS NOT AN OFFER TO SELL THESE SECURITIES AND IT IS NOT A SOLICITATION OF AN OFFER TO BUY THESE SECURITIES IN ANY JURISDICTION WHERE THE OFFER OR SALE IS NOT PERMITTED. | ||
| 130 | ||
123 West Louisiana Street Indianapolis, IN 46225 | Collateral Asset Summary – Loan No. 13 Crowne Plaza Union Station | Cut-off Date Balance: Cut-off Date LTV: U/W NCF DSCR: U/W NOI Debt Yield: | $23,985,678 47.5% 1.68x 16.4% |
The following table presents certain information relating to the occupancy, ADR and RevPAR at the Crowne Plaza Union Station Property and its competitors:
| Historical Occupancy, ADR, RevPAR | |||||||||
| Crowne Plaza Union Station(1) | Competitive Set(2) | Penetration Factor(3) | |||||||
| Year | Occupancy | ADR | RevPAR | Occupancy | ADR | RevPAR | Occupancy | ADR | RevPAR |
| 2019 | 71.3% | $150.26 | $107.08 | 72.9% | $159.71 | $116.40 | 97.8% | 94.1% | 92.0% |
| 2020 | 21.5% | $131.30 | $28.29 | 27.6% | $127.54 | $35.25 | 78.0% | 102.9% | 80.3% |
| 2021 | 46.2% | $145.14 | $67.08 | 46.5% | $144.51 | $67.13 | 99.5% | 100.4% | 99.9% |
| T-12 November 2022 | 55.7% | $179.43 | $99.99 | 58.8% | $173.78 | $102.13 | 94.8% | 103.3% | 97.9% |
| Underwritten | 55.7% | $179.43 | $99.99 | ||||||
| (1) | Occupancy, ADR and RevPAR for the Crowne Plaza Union Station Property are based on the underwritten cash flow dated November 30, 2022. |
| (2) | Occupancy, ADR and RevPAR for the Competitive Set are based on data provided by a third-party hospitality research report. |
| (3) | Penetration Factor is calculated based on operating statements provided by the borrower and competitive set data provided by a third-party hospitality research report. |
Cash Flow Analysis.
| Cash Flow Analysis | ||||||
| 2019 | 2020 | 2021 | T-12 11/30/2022 | U/W(1) | U/W Per Room | |
| Rooms Revenue | $10,669,997 | $2,826,849 | $6,684,532 | $9,963,987 | $9,963,987 | $36,498 |
| Food & Beverage Revenue | 7,132,816 | 1,651,135 | 3,884,876 | 5,498,226 | 5,498,226 | 20,140 |
| Other Revenue(1) | 553,849 | 459,737 | 690,868 | 1,030,368 | 1,030,368 | 3,774 |
| Total Revenue | 18,356,662 | $4,937,721 | $11,260,276 | $16,492,581 | $16,492,581 | $60,412 |
| Rooms Expense | $3,133,400 | $1,234,041 | $1,870,583 | $2,754,215 | $2,754,215 | 10,089 |
| Food & Beverage Expense | 4,441,720 | 1,522,277 | 2,584,548 | 3,615,861 | 3,615,861 | 13,245 |
| Other Departmental Expense | 80,204 | 51,326 | 261,528 | 462,872 | 462,872 | 1,696 |
| Total Departmental Expense | $7,655,324 | $2,807,644 | $4,716,659 | $6,832,948 | $6,832,948 | $25,029 |
| Total General/Unallocated Expense | 6,609,121 | 3,700,835 | 4,360,695 | 5,766,185 | 5,728,014 | 20,982 |
| Total Operating Expenses | $14,264,445 | $6,508,479 | $9,077,354 | $12,599,133 | $12,560,962 | $46,011 |
| Net Operating Income | $4,092,217 | ($1,570,758) | $2,182,922 | $3,893,448 | $3,931,619 | $14,402 |
| FF&E(2) | 734,266 | 197,509 | 450,411 | 659,703 | 659,703 | 2,416 |
| Net Cash Flow | $3,357,950 | ($1,768,267) | $1,732,511 | $3,233,745 | $3,271,916 | $11,985 |
| (1) | Other Revenue includes parking revenue, gift shop revenue and miscellaneous income. |
| (2) | FF&E contributions are approximately 4% of Total Revenue. |
| THE INFORMATION IN THIS STRUCTURAL AND COLLATERAL TERM SHEET IS NOT COMPLETE AND MAY BE AMENDED PRIOR TO THE TIME OF SALE. THIS TERM SHEET IS NOT AN OFFER TO SELL THESE SECURITIES AND IT IS NOT A SOLICITATION OF AN OFFER TO BUY THESE SECURITIES IN ANY JURISDICTION WHERE THE OFFER OR SALE IS NOT PERMITTED. | ||
| 131 | ||
2020 Crocker Road Westlake, OH 44145 | Collateral Asset Summary – Loan No. 14 Hyatt Place Crocker Park | Cut-off Date Balance: Cut-off Date LTV: U/W NCF DSCR: U/W NOI Debt Yield: | $16,000,000 64.0% 2.01x 15.6% |
| Mortgage Loan Information | |
| Loan Seller: | CREFI |
| Loan Purpose: | Refinance |
| Borrower Sponsors: | Robert L. Stark and/or Ezra Stark |
| Borrower: | CD Block K Hotel, LLC |
| Original Balance: | $16,000,000 |
| Cut-off Date Balance: | $16,000,000 |
| % by Initial UPB: | 2.4% |
| Interest Rate: | 6.72000% |
| Payment Date: | 6th of each month |
| First Payment Date: | May 6, 2023 |
| Maturity Date: | April 6, 2033 |
| Amortization: | Interest Only |
| Additional Debt: | None |
| Call Protection: | L(24),D(93),O(3) |
| Lockbox / Cash Management: | Hard / Springing |
| Reserves | |||
| Initial | Monthly | Cap | |
| Taxes: | $85,798 | $21,449 | NAP |
| Insurance: | $0 | Springing | NAP |
| Replacement: | $0 | $24,798 | $1,400,000 |
| TI/LC: | $0 | $0 | NAP |
| Other(1): | $0 | $39,000 | $780,000 |
| Property Information | |
| Single Asset / Portfolio: | Single Asset |
| Property Type: | Select Service Hospitality |
| Collateral: | Fee |
| Location: | Westlake, OH |
| Year Built / Renovated: | 2015 / NAP |
| Total Rooms: | 110 |
| Property Management: | Olympia Hotel Management LLC |
| Underwritten NOI(2): | $2,490,804 |
| Underwritten NCF: | $2,193,224 |
| Appraised Value: | $25,000,000 |
| Appraisal Date: | January 23, 2023 |
| Historical NOI(2) | |
| Most Recent NOI: | $2,555,825 (T-12 January 31, 2023) |
| 2022 NOI: | $2,493,461 (December 31, 2022) |
| 2021 NOI: | $1,616,831 (December 31, 2021) |
| 2020 NOI: | $403,466 (December 31, 2020) |
| Historical Occupancy | |
| Most Recent Occupancy: | 85.7% (January 31, 2023) |
| 2022 Occupancy: | 84.9% (December 31, 2022) |
| 2021 Occupancy: | 76.2% (December 31, 2021) |
| 2020 Occupancy: | 59.0% (December 31, 2020) |
| Financial Information | ||||||
| Tranche | Cut-off Date Balance | Balance per Room | LTV | U/W DSCR | U/W Debt Yield | U/W Debt Yield at Balloon |
| Cut-off / Balloon | Cut-off / Balloon | NOI / NCF | NOI / NCF | NOI / NCF | ||
| Mortgage Loan | $16,000,000 | $145,455 / $145,455 | 64.0% / 64.0% | 2.28x / 2.01x | 15.6% / 13.7% | 15.6% / 13.7% |
| (1) | Other Reserves consists of a renovation cycle reserve. The Hyatt Place Crocker Park property (the “Hyatt Place Crocker Park Property”) is subject to a renovation cycle requirement under the Hyatt franchise agreement with an outside completion date of November 2025. |
| (2) | The increase from 2020 to Underwritten NOI primarily reflects recovery from the COVID-19 pandemic as stay-at-home orders were lifted and travel began to rebound. |
| Sources and Uses | |||||||
| Sources | Proceeds | % of Total | Uses | Proceeds | % of Total | ||
| Mortgage Loan | $16,000,000 | 81.9 | % | Loan Payoff | $19,057,260 | 97.5 | % |
| Borrower Sponsor Equity | 3,547,647 | 18.1 | Closing Costs | 404,589 | 2.1 | ||
| Upfront Reserves | 85,798 | 0.4 | |||||
| Total Sources | $19,547,647 | 100.0 | % | Total Uses | $19,547,647 | 100.0 | % |
The Borrower and the Borrower Sponsors. The borrower is CD Block K Hotel, LLC, a Delaware limited liability company. The borrower is a single purpose bankruptcy-remote entity with one independent director in its organizational structure.
The borrower sponsors are Robert L. Stark and/or Ezra Stark and the non-recourse carveout guarantor is Robert L. Stark (“Robert Stark”). Robert Stark founded Stark Enterprises in 1978. Stark Enterprises is a full-service real estate development company focused on the acquisition, development, leasing, property management and construction spanning over eight states. Stark Enterprises has developed over 45 commercial and residential properties, including the development of the Crocker Park Lifestyle Center (as further described below) which encompasses 75 landscaped acres and 12 city blocks surrounding the Hyatt Place Crocker Park Property.
| THE INFORMATION IN THIS STRUCTURAL AND COLLATERAL TERM SHEET IS NOT COMPLETE AND MAY BE AMENDED PRIOR TO THE TIME OF SALE. THIS TERM SHEET IS NOT AN OFFER TO SELL THESE SECURITIES AND IT IS NOT A SOLICITATION OF AN OFFER TO BUY THESE SECURITIES IN ANY JURISDICTION WHERE THE OFFER OR SALE IS NOT PERMITTED. | ||
| 132 | ||
2020 Crocker Road Westlake, OH 44145 | Collateral Asset Summary – Loan No. 14 Hyatt Place Crocker Park | Cut-off Date Balance: Cut-off Date LTV: U/W NCF DSCR: U/W NOI Debt Yield: | $16,000,000 64.0% 2.01x 15.6% |
The Property. The Hyatt Place Crocker Park Property is a six-story, 110-room, select-service hotel located in Westlake, Ohio, approximately 15 miles northeast of Cleveland, Ohio. Built in 2015, the 110 guestrooms are comprised of 49 double queen rooms, 42 king rooms, 13 queen rooms and six double king/queen rooms. The Hyatt Place Crocker Park Property features a restaurant and lounge, inclusive of a 24-hour market. Additional amenities at the Hyatt Place Crocker Park Property include an indoor pool, fitness center, and complimentary parking for guests.
The Hyatt Place Crocker Park Property is the only hotel situated within the Crocker Park Lifestyle Center. The Crocker Park Lifestyle Center is made up of approximately 100 stores and 35 restaurants (more than 1,000,000 sq. ft. of retail space), 725,000 sq. ft. of office space, 534 apartment units and hosts over 200 events per year, including concerts, art shows, farmer’s markets and various other community affairs. Additionally, the Hyatt Place Crocker Park Property is adjacent to the Promenade at Crocker Park which is a 300,000 sq. ft. retail center and includes a mix of national retailers and restaurants.
The following table presents certain information relating to the 2022 demand analysis with respect to the Hyatt Place Crocker Park Property based on market segmentation, as provided in a third party market research report for the Hyatt Place Crocker Park Property:
| Demand Segmentation(1) | |||
| Property | Rooms | Transient | Meeting & Group |
| Hyatt Place Crocker Park | 110 | 86.2% | 13.8% |
| (1) | Source: December 2022 third party market research report |
The following table presents certain information relating to the current occupancy, ADR and RevPAR at the Hyatt Place Crocker Park Property and its competitors:
| Historical Occupancy, ADR, RevPAR | |||||||||
| Hyatt Place Crocker Park(1) | Competitive Set(2) | Penetration Factor(3) | |||||||
| Year | Occupancy | ADR | RevPAR | Occupancy | ADR | RevPAR | Occupancy | ADR | RevPAR |
| 2020 | 59.0% | $116.94 | $69.05 | 40.0% | $77.07 | $30.80 | 147.8% | 151.7% | 224.2% |
| 2021 | 76.2% | $141.31 | $107.63 | 51.6% | $99.15 | $51.15 | 147.6% | 142.5% | 210.4% |
| 2022 | 84.9% | $172.03 | $146.02 | 59.7% | $112.11 | $66.90 | 142.3% | 153.4% | 218.3% |
| (1) | Occupancy, ADR and RevPAR for the Hyatt Place Crocker Property are based on the underwritten cash flow dated January 31, 2023. |
| (2) | Occupancy, ADR and RevPAR for the Competitive Set are based on data provided by a third-party hospitality research report. The Competitive Set includes DoubleTree by Hilton Hotel Cleveland - Westlake, Hampton by Hilton Inn Cleveland-Westlake, Courtyard Cleveland Westlake, TownePlace Suites Cleveland Westlake, Wyndham Cleveland Avon, Residence Inn Cleveland Avon @ The Emerald Event Center and Holiday Inn Express & Suites Cleveland West – Westlake. |
| (3) | Penetration Factor is calculated based on the underwritten cash flow dated January 31, 2023 for the Hyatt Place Crocker Park Property and competitive set data provided by a third-party hospitality research report. |
| THE INFORMATION IN THIS STRUCTURAL AND COLLATERAL TERM SHEET IS NOT COMPLETE AND MAY BE AMENDED PRIOR TO THE TIME OF SALE. THIS TERM SHEET IS NOT AN OFFER TO SELL THESE SECURITIES AND IT IS NOT A SOLICITATION OF AN OFFER TO BUY THESE SECURITIES IN ANY JURISDICTION WHERE THE OFFER OR SALE IS NOT PERMITTED. | ||
| 133 | ||
2020 Crocker Road Westlake, OH 44145 | Collateral Asset Summary – Loan No. 14 Hyatt Place Crocker Park | Cut-off Date Balance: Cut-off Date LTV: U/W NCF DSCR: U/W NOI Debt Yield: | $16,000,000 64.0% 2.01x 15.6% |
Cash Flow Analysis.
| Cash Flow Analysis(1) | ||||||
| 2020 | 2021 | 2022 | January 2023 TTM | U/W | U/W Per Room | |
| Occupancy | 59.0% | 76.2% | 84.9% | 85.7% | 85.7% | |
| ADR | $116.94 | $141.31 | $172.03 | $172.99 | $172.99 | |
| RevPAR | $69.05 | $107.63 | $146.02 | $148.23 | $148.23 | |
| Room Revenue | $2,354,528 | $4,321,174 | $5,862,667 | $5,951,604 | $5,951,604 | $54,105 |
| Other Revenue(2) | 145,793 | 244,799 | 283,580 | 292,649 | 292,649 | 2,660 |
| Total Revenue | $2,500,321 | $4,565,973 | $6,146,247 | $6,244,253 | $6,244,253 | $56,766 |
| Room Expense | 558,261 | 951,102 | 1,213,923 | 1,189,423 | 1,253,662 | 11,397 |
| Other Departmental Expenses | 69,469 | 119,432 | 160,664 | 163,224 | 163,224 | 1,484 |
| Total Departmental Expenses | $627,730 | $1,070,534 | $1,374,587 | $1,352,647 | $1,416,886 | $12,881 |
| Management Fee | 87,570 | 159,802 | 215,120 | 218,354 | 218,549 | 1,987 |
| Marketing and Franchise Fee | 200,163 | 366,751 | 498,508 | 507,804 | 505,886 | 4,599 |
| Other Undistributed Expenses | 831,038 | 1,042,963 | 1,228,718 | 1,274,610 | 1,274,610 | 11,587 |
| Total Undistributed Expenses | $1,118,770 | $1,569,516 | $1,942,346 | $2,000,768 | $1,999,045 | $18,173 |
| Real Estate Taxes | 299,901 | 247,638 | 245,136 | 244,928 | 247,432 | 2,249 |
| Property Insurance | 50,453 | 61,454 | 90,717 | 90,085 | 90,085 | 819 |
| Net Operating Income(3) | $403,466 | $1,616,831 | $2,493,461 | $2,555,825 | $2,490,804 | $22,644 |
| FF&E(4) | 117,726 | 216,059 | 293,133 | 297,580 | 297,580 | 2,705 |
| Net Cash Flow | $285,740 | $1,400,772 | $2,200,328 | $2,258,245 | $2,193,224 | $19,938 |
| (1) | Based on the underwritten cash flow dated January 31, 2023. |
| (2) | Other Revenue includes food & beverage income generated by the restaurant, lounge and hotel meeting space as well as revenue generated from all other operated departments in the hotel including guest laundry, guest communications, in-room movies, and gift shop. |
| (3) | The increase from 2020 to U/W Net Operating Income primarily reflects recovery from the COVID-19 pandemic as stay-at-home orders were lifted and travel began to rebound. |
| (4) | FF&E contributions are 4.8% of total revenue. |
| THE INFORMATION IN THIS STRUCTURAL AND COLLATERAL TERM SHEET IS NOT COMPLETE AND MAY BE AMENDED PRIOR TO THE TIME OF SALE. THIS TERM SHEET IS NOT AN OFFER TO SELL THESE SECURITIES AND IT IS NOT A SOLICITATION OF AN OFFER TO BUY THESE SECURITIES IN ANY JURISDICTION WHERE THE OFFER OR SALE IS NOT PERMITTED. | ||
| 134 | ||
1027 Filbert Street Philadelphia, PA 19107 | Collateral Asset Summary – Loan No. 15 1027 Filbert Street | Cut-off Date Balance: Cut-off Date LTV: U/W NCF DSCR: U/W NOI Debt Yield: | $15,500,000 44.6% 1.83x 15.2% |
| Mortgage Loan Information | |
| Loan Seller: | CREFI |
| Loan Purpose: | Refinance |
| Borrower Sponsor: | Samuel M. Switzenbaum |
| Borrower: | Parametric Garage Associates |
| Original Balance: | $15,500,000 |
| Cut-off Date Balance: | $15,500,000 |
| % by Initial UPB: | 2.4% |
| Interest Rate: | 7.12000% |
| Payment Date: | 1st of each month |
| First Payment Date: | May 1, 2023 |
| Maturity Date: | April 1, 2033 |
| Amortization: | Amortizing Balloon |
| Additional Debt(1): | $9,600,000 (Subordinate Note A) $34,189,883 (Subordinate Note B) |
| Call Protection: | L(24),D(93),O(3) |
| Lockbox / Cash Management: | Soft / In Place |
| Reserves | |||
| Initial | Monthly | Cap | |
| Taxes: | $76,081 | $38,040 | NAP |
| Insurance: | $63,048 | $5,254 | NAP |
| Replacement: | $0 | $3,335 | NAP |
| TI/LC: | $0 | $2,094 | $50,256 |
| Deferred Maintenance | $4,750 | $0 | NAP |
| Other(2): | $50,000 | $25,000 | NAP |
| Property Information | |
| Single Asset / Portfolio: | Single Asset |
| Property Type: | Parking Garage/Retail Mixed Use |
| Collateral: | Leasehold |
| Location: | Philadelphia, PA |
| Year Built / Renovated: | 1982 / 2000 |
| Total Sq. Ft.(3): | 287,000 |
| Property Management: | Central Parking System, Inc. and Switzenbaum & Associates |
| Underwritten NOI: | $2,356,227 |
| Underwritten NCF: | $2,294,357 |
| Appraised Value: | $34,725,000 |
| Appraisal Date: | December 1, 2022 |
| Historical NOI | |
| Most Recent NOI: | $2,466,372 (T-12 February 28, 2023) |
| 2021 NOI: | $1,474,653 (December 31, 2021) |
| 2020 NOI: | $663,087 (December 31, 2020) |
| 2019 NOI: | $1,619,760 (December 31, 2019) |
| Historical Occupancy(4) | |
| Most Recent Occupancy(4): | 100.0% (May 12, 2022) |
| 2022 Occupancy(4): | NAV |
| 2021 Occupancy(4): | NAV |
| 2020 Occupancy(4): | NAV |
| Financial Information | ||||||
| Tranche | Cut-off Date Balance | Balance per Sq. Ft. | LTV | U/W DSCR | U/W Debt Yield | U/W Debt Yield at Balloon |
| Cut-off / Balloon | Cut-off / Balloon | NOI / NCF | NOI / NCF | NOI / NCF | ||
| Mortgage Loan | $15,500,000 | $54 / $47 | 44.6% / 39.1% | 1.88x / 1.83x | 15.2% / 14.8% | 17.4% / 16.9% |
| (1) | Additional Debt consists of two subordinate notes issued to Philadelphia Authority for Industrial Development (“PAID”) in connection with the original development of the 1027 Filbert Street Property (the “1027 Filbert Street Property”). The notes were later converted to promissory notes from the borrower to PAID. The notes are fully subordinate to the senior mortgage and provide no rights against the 1027 Filbert Street Property or the borrower until the 1027 Filbert Street mortgage loan has been repaid in full. See “Description of the Mortgage Loan-Additional Indebtedness-Other Secured Indebtedness” in this Preliminary Prospectus. |
| (2) | Other Reserves consist of (i) ground rent reserve (Upfront: $50,000; Monthly: $25,000), (ii) parking tax reserve (Monthly: Springing) upon the occurrence and continuance of a trigger period in which borrower will deposit 1/12th the amount sufficient to pay annual parking taxes, and (iii) additional ground rent reserve (Monthly: Springing) upon lender’s receipt of the additional ground rent notice in which borrower will deposit an amount equal to the additional ground rent requested. |
| (3) | The 1027 Filbert Street Property contains 287,000 sq. ft., that is comprised of 750 parking stalls and 12,569 sq. ft. of street level retail space that is leased to eight tenants. |
| (4) | Historical Occupancy is not available at the 1027 Filbert Street Property as the 1027 Filbert Street Property is primarily comprised of parking stalls of which occupancy changes daily. The retail component which represents 12.9% of underwritten EGI is currently 100% occupied as of the underwritten rent roll dated May 12, 2022. |
| Sources and Uses | |||||||
| Sources | Proceeds | % of Total | Uses | Proceeds | % of Total | ||
| Mortgage Loan | $15,500,000 | 86.3 | % | Loan Payoff | $15,633,678 | 87.1 | % |
| Other Sources(1) | 2,342,539 | 13.0 | Closing Costs | 2,129,982 | 11.9 | ||
| Principal’s New Cash Contribution | 115,000 | 0.6 | Upfront Reserves | 193,879 | 1.1 | ||
| Total Sources | $17,957,539 | 100.0 | % | Total Uses | $17,957,539 | 100.0 | % |
| (1) | Other Sources consists of operating funds from the borrower, Parametric Garage Associates, and a release of existing escrows. |
The Borrower and the Borrower Sponsor. The borrower is Parametric Garage Associates, a Pennsylvania limited partnership and a single purpose bankruptcy-remote entity.
The borrower owns the leasehold improvements of the 1027 Filbert Street Property under a ground lease with the Philadelphia Redevelopment Authority as landlord. The ground lease has an expiration date of December 31, 2062 with annual ground lease payments of $300,000 and no fair market value resets.
The borrower sponsor and non-recourse carveout guarantor is Samuel M. Switzenbaum. Samuel M. Switzenbaum is the founder of Switzenbaum & Associates, a fully integrated real estate investment, development and management company. He formerly served as the president and CEO of Strouse Greenberg & Co., a privately held full-service real estate company headquartered in Philadelphia, Pennsylvania where he managed a one-billion-dollar portfolio of investment grade assets. Samuel M. Switzenbaum has over 40 years of experience in commercial and residential real estate.
The Property. The 1027 Filbert Street Property consists of a six-story 750-stall mixed use parking garage with 12,569 sq. ft. of street-level retail space. The property is located between Arch and Filbert Street in the Center City neighborhood of Philadelphia and is directly
| THE INFORMATION IN THIS STRUCTURAL AND COLLATERAL TERM SHEET IS NOT COMPLETE AND MAY BE AMENDED PRIOR TO THE TIME OF SALE. THIS TERM SHEET IS NOT AN OFFER TO SELL THESE SECURITIES AND IT IS NOT A SOLICITATION OF AN OFFER TO BUY THESE SECURITIES IN ANY JURISDICTION WHERE THE OFFER OR SALE IS NOT PERMITTED. | ||
| 135 | ||
1027 Filbert Street Philadelphia, PA 19107 | Collateral Asset Summary – Loan No. 15 1027 Filbert Street | Cut-off Date Balance: Cut-off Date LTV: U/W NCF DSCR: U/W NOI Debt Yield: | $15,500,000 44.6% 1.83x 15.2% |
adjacent to the Philadelphia Convention Center and Reading Terminal Market. The Philadelphia Convention Center has over 750,000 annual attendees and contains approximately 1,000,000 sq. ft. of space. The Reading Terminal Market has over six million visitors each year and contains over 80 locally owned merchants. Above the 1027 Filbert Street Property is a Hilton Garden Inn that pays an annual base rent of $92,575 for 13 parking spaces in the garage component of the 1027 Filbert Street Property.
The parking garage component is managed by Central Parking System, Inc. which is a subsidiary of SP Plus Corporation (“Standard Parking”). Standard Parking provides parking management, ground transportation and other services to commercial clients throughout the United States and manages over 4,200 parking garages with 2.1 million parking spaces located across North America. As of October, 2022, the parking garage component at the 1027 Filbert Street Property was 158.9% occupied based on the total average number of parkers per day divided by the 750 available parking spaces at the 1027 Filbert Street Property. Of the 750 parking spaces at the 1027 Filbert Street Property 450 are designated for transient parking, 287 are designated as monthly parking spaces, and 13 are leased by Hilton Garden Inn. Standard Parking has been the parking operator at the 1027 Filbert Street Property since 2007 and has executed a parking management agreement through December 31, 2028.
The retail component of the 1027 Filbert Street Property accounts for 12,569 sq. ft. and is 100% leased to eight tenants consisting of a Dunkin Donuts and local eateries. According to the appraiser, comparable tenants within Philadelphia, Pennsylvania reported annual rental rates ranging from $41.54 per square foot to $75.00 per sq. ft., with a weighted average rental rate of $54.46 per sq. ft. The average underwritten base rent for the tenants at the 1027 Filbert Street Property is $51.42 per sq. ft. Income attributable to retail tenants accounts for 12.9% of total underwritten EGI at the 1027 Filbert Street Property with the remaining income attributable to parking revenue.
The table below represents the historical parking garage revenue breakdown at the 1027 Filbert Street Property:
| Parking Garage Revenue Breakdown(1) | ||||||||
| 2020 | % | 2021 | % | T-12 2/28/2023 | % | UW | % | |
| Transient Parking | $1,362,067 | 63% | $2,378,064 | 71% | $3,468,650 | 76% | $3,468,650 | 76% |
| Monthly Parking | 0 | 0 | 795,884 | 24 | 874,057 | 19 | 874,057 | 19 |
| Validation | 72,442 | 3 | 71,668 | 2 | 100,806 | 2 | 100,806 | 2 |
| Hotel Guest Parking | 49,256 | 2 | 50,632 | 2 | 47,340 | 1 | 47,340 | 1 |
| Aggregator | 594,900 | 28 | 40,432 | 1 | 47,057 | 1 | 47,057 | 1 |
| Other Revenue | 70,086 | 3 | 0 | 0 | 0 | 0 | $0 | 0 |
| Total Parking Revenue | $2,148,751 | 100% | $3,336,680 | 100% | $4,537,910 | 100% | $4,537,910 | 100% |
| (1) | Source. Borrower historical operating statements. |
Cash Flow Analysis
| Cash Flow Analysis(1) | ||||||
| 2019 | 2020 | 2021 | T-12 2/28/2023 | UW | UW Per Sq. Ft. | |
| Base Rent | $590,450 | $494,123 | $637,903 | $631,339 | $678,142 | $2.36 |
| Contractual Rent Steps(1) | 0 | 0 | 0 | 0 | 12,770 | $0.04 |
| Total Reimbursements | 180,652 | 135,246 | 173,327 | 173,295 | 130,551 | $0.45 |
| Vacancy & Credit Loss | 0 | 0 | 0 | 0 | (41,073) | ($0.14) |
| Parking Income | 4,036,027 | 2,148,751 | 3,336,681 | 4,537,910 | 4,537,910 | $15.81 |
| Other Income | 14,680 | 53,125 | 37,316 | 22,309 | 18,540 | $0.06 |
| Effective Gross Revenue | $4,821,810 | $2,831,245 | $4,185,227 | $5,364,853 | $5,336,839 | $18.60 |
| Real Estate Taxes | 500,781 | 491,345 | 493,997 | 324,832 | 485,321 | $1.69 |
| Insurance | 116,734 | 101,555 | 127,477 | 119,037 | 60,046 | $0.21 |
| Management Fee | 179,598 | 123,584 | 145,527 | 213,284 | 213,474 | $0.74 |
| Ground Rent | 300,000 | 300,000 | 300,000 | 300,000 | 300,000 | $1.05 |
| Other Expenses(2) | 2,104,937 | 1,151,673 | 1,643,574 | 1,941,328 | 1,921,771 | $6.70 |
| Total Expenses | $3,202,050 | $2,168,158 | $2,710,574 | $2,898,480 | $2,980,612 | $10.39 |
| Net Operating Income | $1,619,760 | $663,087 | $1,474,653 | $2,466,372 | $2,356,227 | $8.21 |
| Replacement Reserves | 0 | 0 | 0 | 0 | 32,538 | $0.11 |
| TI / LC | 0 | 0 | 0 | 0 | 29,332 | $0.10 |
| Net Cash Flow | $1,619,760 | $663,087 | $1,474,653 | $2,466,372 | $2,294,357 | $7.99 |
| (1) | Based on the underwritten rent roll dated May 12, 2022 with contractual rent steps through November 1, 2023. |
| (2) | Other Expenses are comprised of (i) parking and sales tax which is based on the City of Philadelphia Parking Revenue Tax applied to all parking facilities within city limits, (ii) Occupancy Tax which is required by the City of Philadelphia (iii) payroll and benefits, (iv) repairs and maintenance, (v) utilities and (vi) general and administrative |
| THE INFORMATION IN THIS STRUCTURAL AND COLLATERAL TERM SHEET IS NOT COMPLETE AND MAY BE AMENDED PRIOR TO THE TIME OF SALE. THIS TERM SHEET IS NOT AN OFFER TO SELL THESE SECURITIES AND IT IS NOT A SOLICITATION OF AN OFFER TO BUY THESE SECURITIES IN ANY JURISDICTION WHERE THE OFFER OR SALE IS NOT PERMITTED. | ||
| 136 | ||
STATEMENT REGARDING ASSUMPTIONS AS TO SECURITIES, PRICING ESTIMATES AND
OTHER INFORMATION
This material is for your information, and none of Deutsche Bank Securities Inc., Goldman Sachs & Co. LLC, J.P. Morgan Securities LLC, Citigroup Global Markets Inc., AmeriVet Securities, Inc. and Drexel Hamilton, LLC or any other underwriter (the “Underwriters”) are soliciting any action based upon it. This material is not to be construed as an offer to sell or the solicitation of any offer to buy any security in any jurisdiction where such an offer or solicitation would be illegal.
Neither this document nor anything contained herein shall form the basis for any contract or commitment whatsoever. The information contained herein is preliminary as of the date hereof. These materials are subject to change, completion or amendment from time to time. The information contained herein will be superseded by similar information delivered to you as part of the preliminary prospectus relating to the Benchmark 2023-B38 Mortgage Trust Commercial Mortgage Pass-Through Certificates, Series 2023-B38 (the "Offering Document"). The information contained herein supersedes any such information previously delivered and should be reviewed only in conjunction with the entire Offering Document. All of the information contained herein is subject to the same limitations and qualifications contained in the Offering Document. The information contained herein does not contain all relevant information relating to the underlying mortgage loans or mortgaged properties. Such information is described elsewhere in the Offering Document. The information contained herein will be more fully described elsewhere in the Offering Document. The information contained herein should not be viewed as projections, forecasts, predictions or opinions with respect to value. Prior to making any investment decision, prospective investors are strongly urged to read the Offering Document its entirety. Neither the Securities and Exchange Commission nor any state securities commission has approved or disapproved of these securities or determined if this free writing prospectus is truthful or complete. Any representation to the contrary is a criminal offense.
The attached information contains certain tables and other statistical analyses (the “Computational Materials”) which have been prepared in reliance upon information furnished by the Mortgage Loan Sellers. Numerous assumptions were used in preparing the Computational Materials, which may or may not be reflected herein. As such, no assurance can be given as to the Computational Materials’ accuracy, appropriateness or completeness in any particular context; or as to whether the Computational Materials and/or the assumptions upon which they are based reflect present market conditions or future market performance. The Computational Materials should not be construed as either projections or predictions or as legal, tax, financial or accounting advice. You should consult your own counsel, accountant and other advisors as to the legal, tax, business, financial and related aspects of a purchase of these securities. Any weighted average lives, yields and principal payment periods shown in the Computational Materials are based on prepayment and/or loss assumptions, and changes in such prepayment and/or loss assumptions may dramatically affect such weighted average lives, yields and principal payment periods. In addition, it is possible that prepayments or losses on the underlying assets will occur at rates higher or lower than the rates shown in the attached Computational Materials. The specific characteristics of the securities may differ from those shown in the Computational Materials due to differences between the final underlying assets and the preliminary underlying assets used in preparing the Computational Materials. The principal amount and designation of any security described in the Computational Materials are subject to change prior to issuance. None of Underwriters or any of their respective affiliates makes any representation or warranty as to the actual rate or timing of payments or losses on any of the underlying assets or the payments or yield on the securities.
This document contains forward-looking statements. Those statements are subject to certain risks and uncertainties that could cause the success of collections and the actual cash flow generated to differ materially from the information set forth herein. While such information reflects projections prepared in good faith based upon methods and data that are believed to be reasonable and accurate as of the dates thereof, the depositor undertakes no obligation to revise these forward-looking statements to reflect subsequent events or circumstances. Individuals should not place undue reliance on forward-looking statements and are advised to make their own independent analysis and determination with respect to the forecasted periods, which reflect the issuer’s view only as of the date hereof.
IMPORTANT NOTICE RELATING TO AUTOMATICALLY GENERATED EMAIL DISCLAIMERS
Any legends, disclaimers or other notices that may appear at the bottom of the email communication to which this free writing prospectus is attached relating to (1) these materials not constituting an offer (or a solicitation of an offer), (2) no representation being made that these materials are accurate or complete and may not be updated or (3) these materials possibly being confidential, are not applicable to these materials and should be disregarded. Such legends, disclaimers or other notices have been automatically generated as a result of these materials having been sent via Bloomberg or another system.
| THE INFORMATION IN THIS STRUCTURAL AND COLLATERAL TERM SHEET IS NOT COMPLETE AND MAY BE AMENDED PRIOR TO THE TIME OF SALE. THIS TERM SHEET IS NOT AN OFFER TO SELL THESE SECURITIES AND IT IS NOT A SOLICITATION OF AN OFFER TO BUY THESE SECURITIES IN ANY JURISDICTION WHERE THE OFFER OR SALE IS NOT PERMITTED. | ||
| 137 | ||