Exhibit 99.6
| Conversion Valuation Appraisal Report | Page 1 |
Table of Contents
Mercer Savings Bank
| Table of Contents | 1 |
| | |
| Introduction | 2 |
| | |
| 1. Comparisons with Publicly Traded Thrifts | 5 |
| | |
| Valuation Adjustments | 6 |
| | |
| 2. Valuation | 7 |
| | |
| Discussion of Weight Given to Valuation Multiples | 7 |
| Offering Value in Relation to Comparables | 10 |
| Comparison to Recent Standard Conversions | 12 |
| Valuation Conclusion | 13 |
| | |
| 7. Exhibits | 22 |
| Conversion Valuation Appraisal Report | Page 2 |
Introduction
April 7, 2023
Board of Directors
Mercer Savings Bank
1100 Irmscher Blvd.
Celina, OH 45822
Members of the Board Directors:
Due to changes in current market conditions, FinPro Capital Advisors, Inc. (“FinPro” or “FCA”) has completed and hereby provides an updated independent appraisal ("Appraisal") of the estimated pro forma market value of the common stock which is to be issued in connection with the mutual-to-stock conversion transaction described below.
An updated appraisal was conducted due to recent volatility and shifts in the equity markets along with banking industry. Primary drivers of volatility were related to the events associated with the failure of Silicon Valley Bank, failure of Signature Bank, self-liquidation of Silvergate Bank and other market events. Therefore, the valuations of the peer group were updated for Thursday April 6, 2023 (markets closed Friday April 7, 2023). The appraisal has also been updated for more current expense estimations (now $1.5 million, prior $1.8 million).
This Appraisal is furnished pursuant to the requirements stipulated in the Code of Federal Regulations and has been prepared in accordance with the “Guidelines for Appraisal Reports for the Valuation of Savings and Loan Associations Converting from Mutual to Stock Form of Organization” (the “Valuation Guidelines”) of originally issued by the Office of Thrift Supervision (“OTS”) and accepted by the Federal Reserve Board (“FRB”), the Office of the Comptroller of the Currency (“OCC”), the Federal Deposit Insurance Corporation (“FDIC”), The Ohio Division of Financial Institutions (the “ODFI”) and other state banking regulatory agencies, and applicable regulatory interpretations thereof.
Description of Plan of Conversion
The Board of Directors of Mercer Savings Bank (“Mercer” or the “Bank”) has adopted the plan of conversion (the “Plan”); whereby the Bank will convert to stock form. As a result of the conversion, the Bank will convert to the stock form of ownership and issue all of its common stock to a to-be-formed holding company called Mercer Bancorp, a newly formed Maryland corporation, (“the Company”). It is our understanding that the Bank will offer its stock in a subscription and community offering to Eligible Account Holders, to the Employee Plans and to Supplemental Eligible Account Holders of the Bank. To the extent that shares remain available for purchase after satisfaction of all subscriptions received in the subscription offering, the shares may be offered for sale to members of the general public in a direct community offering and/or a syndicated community offering. A portion of the net proceeds received from the sale of the common stock will be used to purchase all of the then to be issued and outstanding capital stock of Mercer and the balance of the net proceeds will be retained by the Company.
| Conversion Valuation Appraisal Report | Page 3 |
At this time, no other activities are contemplated for the Company other than the ownership of the Bank, a loan to the newly formed ESOP and reinvestment of the proceeds that are retained by the Bank. In the future, the Company may acquire or organize other operating subsidiaries, diversify into other banking-related activities, pay dividends, or repurchase its stock, although there are no specific plans to undertake such activities at the present time. The plan of conversion will provide for the establishment of a new charitable foundation (the “Foundation”). On a preliminary basis, the Foundation contribution is expected to consist of $100 thousand of cash and 50 thousand shares of Company common stock.
In compiling the pro formas, FinPro relied upon the assumptions provided by the Bank and its agents. The pro forma assumptions are as follows:
| • | 100.0% of the total shares will be sold to the depositors and public, |
| • | the stock will be issued at $10.00 per share, |
| • | the fixed conversion expenses will be $1.545 million at the midpoint, including the placement agent fee, |
| • | there will be an ESOP equal to 8.0% of the shares sold, funded internally, and amortized over 15 years straight-line, |
| • | there will be an MRP equal to 4.0% of the shares sold, amortized over 5 years straight-line, |
| • | there will be a Stock Option Plan equal to 10% of the shares sold, expensed at $3.72 per option over 5 years straight-line, |
| • | the tax rate is assumed at 21.0%, and |
| • | the net proceeds will be invested at the one-year treasury rate of 4.6%, pre-tax. |
In the course of preparing our report, we reviewed the Bank’s financials for the years ended December 31, 2022, and December 31, 2021. We also reviewed the registration statement as filed with the Securities and Exchange Commission (“SEC”). We have conducted due diligence analysis of the Bank and held due diligence related discussions with the Bank’s Management and Board and Luse Gorman, PC (the Bank’s counsel). The valuation parameters set forth in the appraisal were predicated on these discussions, but all conclusions related to the valuation were reached and made independent of such discussions.
Where appropriate, we considered information based upon other publicly available sources, which we believe to be reliable; however, we cannot guarantee the accuracy or completeness of such information. We reviewed the Bank’s primary market area and reviewed the market area’s economic condition. We also reviewed the competitive environment in which the Bank operates and its relative strengths and weaknesses. We compared the Bank’s performance with selected publicly traded institutions. We reviewed conditions in the securities markets in general and in the market for similar institutions in particular. Our analysis included a review of the estimated effects of the Conversion of the Bank on the operations and expected financial performance as they related to the Bank’s estimated pro forma value.
In preparing our valuation, we relied upon and assumed the accuracy and completeness of financial and other information provided to us by the Bank and its independent accountants. We did not independently verify the financial statements and other information provided by the Bank and its independent accountants, nor did we independently value any of the Bank’s assets or liabilities. This estimated valuation considers the Bank only as a going concern and should not be considered as an indication of its liquidation value.
| Conversion Valuation Appraisal Report | Page 4 |
Our valuation is not intended, and must not be construed, to be a recommendation of any kind as the advisability of purchasing shares of Common Stock in the stock issuance. Moreover, because such valuation is necessarily based upon estimates and projections of a number of matters, all of which are subject to change from time to time, no assurance can be given that persons who purchase shares of Common Stock in the stock issuance will thereafter be able to sell such shares at prices related to the foregoing valuation of the pro forma market value thereof. FinPro is not a seller of securities within the meaning of any federal or state securities laws. Any report prepared by FinPro shall not be used as an offer or solicitation with respect to the purchase or sale of any securities.
The estimated valuation herein will be updated as appropriate. These updates will consider, among other factors, any developments or changes in the Bank’s financial condition, operating performance, management policies and procedures and current conditions in the securities market for thrift institution common stock. Should any such developments or changes, in our opinion, be material to the estimated pro forma market value of the Bank, appropriate adjustments to the estimated pro forma market value will be made. The reasons for any such adjustments will be explained at that time.
Valuation Conclusion
It is, FinPro’s opinion that as of February 23, 2023, the estimated aggregate pro forma market value of the Bank was $10,750,000 at the midpoint of a range (excluding foundation shares) with a minimum of $9,137,500 to a maximum of $12,362,500 at 15% below and 15% above the midpoint of the range respectively. Assuming an adjusted maximum value of 15% above the maximum value, the adjusted maximum value or super maximum value is $14,216,880. The stock will be issued at $10.00 per share.
FinPro Capital Advisors
FinPro Capital Advisors, Inc. (“FCA” or “FinPro”) is a registered broker dealer and is a wholly owned subsidiary of FinPro, Inc. FCA addresses numerous areas of capital markets in the heavily regulated financial institution industry including M&A advisory, capital raising, strategic advice, valuation, due diligence, accounting, mark-to-market, enterprise risk management, business planning and regulatory advice. FCA further specializes in financial valuations and analyses of business enterprises and securities, including the pro forma valuation for savings institutions converting from mutual-to-stock form. We believe that, except for the fee we will receive for the Appraisal to assist in the stock conversion process, we are independent of the Bank, Mercer Savings Bank and the other parties engaged by Mercer Savings Bank.
| Conversion Valuation Appraisal Report | Page 5 |
1. Comparisons with Publicly Traded Thrifts
For this update no change was made to the comparable group form the prior analysis.
Figure– Comparable Group
| Corporate |
| | | | | | | | | | | | | | |
| Company Name | | Ticker | | Exchange | | IPO Date | | | Number of Offices | | | City | | State |
| 1895 Bancorp of Wisconsin, Inc. (NASDAQCM:BCOW) | | BCOW | | NASDAQCM | | 1/8/2019 | | | 6 | | | Greenfield | | WI |
| Blue Foundry Bancorp (NASDAQGS:BLFY) | | BLFY | | NASDAQGS | | 7/15/2021 | | | 20 | | | Rutherford | | NJ |
| Finward Bancorp (NASDAQCM:FNWD) | | FNWD | | NASDAQCM | | | | | 30 | | | Munster | | IN |
| First Seacoast Bancorp, Inc. (NASDAQCM:FSEA) | | FSEA | | NASDAQCM | | 7/16/2019 | | | 5 | | | Dover | | NH |
| Generations Bancorp NY, Inc. (NASDAQCM:GBNY) | | GBNY | | NASDAQCM | | 7/10/2006 | | | 10 | | | Seneca Falls | | NY |
| HMN Financial, Inc. (NASDAQGM:HMNF) | | HMNF | | NASDAQGM | | 6/30/1994 | | | 14 | | | Rochester | | MN |
| Mid-Southern Bancorp, Inc. (NASDAQCM:MSVB) | | MSVB | | NASDAQCM | | 4/8/1998 | | | 3 | | | Salem | | IN |
| Northeast Community Bancorp, Inc. (NASDAQCM:NECB) | | NECB | | NASDAQCM | | 7/5/2006 | | | 12 | | | White Plains | | NY |
| PB Bankshares, Inc. (NASDAQCM:PBBK) | | PBBK | | NASDAQCM | | 7/14/2021 | | | 4 | | | Coatesville | | PA |
| Provident Bancorp, Inc. (NASDAQCM:PVBC) | | PVBC | | NASDAQCM | | 7/15/2015 | | | 7 | | | Amesbury | | MA |
| Waterstone Financial, Inc. (NASDAQGS:WSBF) | | WSBF | | NASDAQGS | | 10/4/2005 | | | 16 | | | Wauwatosa | | WI |
| William Penn Bancorporation (NASDAQCM:WMPN) | | WMPN | | NASDAQCM | | 4/15/2008 | | | 13 | | | Bristol | | PA |
| | | | | | | | | | | | | | | |
| 25% Percentile: | | | | | | | | | 6 | | | | | |
| Median: | | | | | | | | | 11 | | | | | |
| 75% Percentile: | | | | | | | | | 15 | | | | | |
Source: S&P Global
| Conversion Valuation Appraisal Report | Page 6 |
Relative to the Comparables the following adjustments need to be made to the Bank’s pro forma market value. Please see full Valuation Appraisal document for full discussion of adjustments.
| Valuation Factor | Valuation Adjustment |
| Financial Condition | Downward |
| Balance Sheet Growth | Strong Downward |
| Earnings Quality, Predictability and Growth | No Adjustment |
| Market Area | Moderate Downward |
| Dividends | No Adjustment |
| Liquidity of the Issue | Downward |
| Recent Regulatory Matters | No Adjustment |
Additionally, the following adjustments should be made to the Bank’s market value.
| Valuation Factor | Valuation Adjustment |
| Management | No Adjustment |
| Marketing of the Issuance | Downward Adjustment |
| Conversion Valuation Appraisal Report | Page 7 |
2. Valuation
In applying the accepted valuation methodology promulgated by the regulators, i.e., the pro forma market value approach, three key pricing multiples were considered. The three multiples include:
Price to core earnings (“P/E”)
Price to book value (“P/B”) / Price to tangible book value (“P/TB”)
Price to assets (“P/A”)
All of the approaches were calculated on a pro forma basis including the effects of the conversion proceeds. All of the assumptions utilized are presented.
Discussion of Weight Given to Valuation Multiples |
To ascertain the pro forma estimated market value of the Bank, the market multiples for the Comparable Group were utilized. As a secondary check, all publicly traded thrifts, Mid-west regional thrifts and recent (2017 to date) conversions along with historical standard conversions were assessed. The data for the Comparable Group, all publicly traded thrifts, and historical offerings are showing on the following pages.
Figure–Comparable Group Market Pricing and Valuation

| | Market Pricing and Valuation |
| | | Company Name | | Date of Closing Price ($) | | Market Cap. ($mil) | | Price/ MRQ Core EPS (x) | | Price/ LTM Core EPS (x) | | Price/ Book (%) | | Price/ Tangible Book (%) | | Dividend Yield (%) | | Price/ Assets (%) (%) | | Avg Daily Volume (Three Month) | | Avg Daily Volume (One Year) | |
| 1 | | 1895 Bancorp of Wisconsin, Inc. (NASDAQCM:BCOW) | | 4/6/2023 | | 48.5 | | NM | | 93.0 | | 64.6 | | 64.6 | | NA | | 11.4 | | 3,890 | | 7,473 | |
| 2 | | Blue Foundry Bancorp (NASDAQGS:BLFY) | | 4/6/2023 | | 245.8 | | 120.9 | | 107.9 | | 67.6 | | 67.7 | | NA | | 17.3 | | 116,270 | | 84,813 | |
| 3 | | Finward Bancorp (NASDAQCM:FNWD) | | 4/6/2023 | | 124.3 | | 5.8 | | 6.3 | | 91.0 | | 113.7 | | 4.3 | | 7.5 | | 3,043 | | 4,075 | |
| 4 | | First Seacoast Bancorp, Inc. (NASDAQCM:FSEA) | | 4/6/2023 | | 44.3 | | NM | | NM | | 89.6 | | 90.1 | | NA | | 10.8 | | 34,404 | | 12,087 | |
| 5 | | Generations Bancorp NY, Inc. (NASDAQCM:GBNY) | | 4/6/2023 | | 24.1 | | 140.8 | | 20.1 | | 64.7 | | 67.5 | | NA | | 6.6 | | 1,112 | | 1,999 | |
| 6 | | HMN Financial, Inc. (NASDAQGM:HMNF) | | 4/6/2023 | | 81.1 | | 8.4 | | 10.2 | | 85.8 | | 86.5 | | 1.3 | | 8.7 | | 2,849 | | 3,385 | |
| 7 | | Mid-Southern Bancorp, Inc. (NASDAQCM:MSVB) | | 4/6/2023 | | 31.5 | | 20.6 | | 16.9 | | 99.7 | | 99.7 | | 2.1 | | 13.9 | | 2,093 | | 1,975 | |
| 8 | | Northeast Community Bancorp, Inc. (NASDAQCM:NECB) | | 4/6/2023 | | 196.1 | | 5.9 | | 7.9 | | 81.4 | | 81.5 | | 1.8 | | 16.8 | | 93,626 | | 52,065 | |
| 9 | | PB Bankshares, Inc. (NASDAQCM:PBBK) | | 4/6/2023 | | 34.6 | | 18.6 | | 22.1 | | 82.0 | | 82.0 | | NA | | 10.0 | | 4,049 | | 3,844 | |
| 10 | | Provident Bancorp, Inc. (NASDAQCM:PVBC) | | 4/6/2023 | | 116.6 | | 10.5 | | NM | | 57.2 | | 57.2 | | 0.0 | | 7.9 | | 143,615 | | 83,632 | |
| 11 | | Waterstone Financial, Inc. (NASDAQGS:WSBF) | | 4/6/2023 | | 323.2 | | 92.1 | | 16.8 | | 88.2 | | 88.4 | | 5.4 | | 18.8 | | 71,987 | | 79,807 | |
| 12 | | William Penn Bancorporation (NASDAQCM:WMPN) | | 4/6/2023 | | 136.4 | | 42.2 | | 32.2 | | 82.3 | | 84.9 | | 1.2 | | 19.7 | | 36,230 | | 28,478 | |
| | | | | | | | | | | | | | | | | | | | | | | | |
| | | 25% Percentile: | | | | 41.9 | | 8.9 | | 11.8 | | 66.9 | | 67.7 | | 1.2 | | 8.5 | | 2,995 | | 3,729 | |
| | | Median: | | | | 98.9 | | 19.6 | | 18.5 | | 82.1 | | 83.4 | | 1.8 | | 11.1 | | 19,227 | | 9,780 | |
| | | 75% Percentile: | | | | 151.4 | | 79.6 | | 29.7 | | 88.6 | | 88.8 | | 3.2 | | 16.9 | | 77,397 | | 59,001 | |
| Conversion Valuation Appraisal Report | Page 8 |
Figure–All Publicly Traded Thrifts Market Pricing and Valuation
| | | | | Market Pricing and Valuation |
| | | | | | | | | | | | | | | | | | | | | | | | |
| | | | | Date of
Closing Price | | Market
Cap. | | Price/
MRQ EPS | | Price/ LTM
EPS | | Price/
Tangible
Book | | Price/ Assets
(%) | | Avg Weekly
Volume/
Shares Out | | Avg Weekly
Volume/
Shares Out | | Avg Daily
Volume | | Avg Daily
Volume | |
| | | Company Name | | ($) | | ($mil) | | (x) | | (x) | | (%) | | (%) | | (Three Month) | | (One Year) | | (Three Month) | | (One Year) | |
| 1 | | 1895 Bancorp of Wisconsin, Inc. (NASDAQCM:BCOW) | | 4/6/2023 | | 48.5 | | NM | | NM | | 64.6 | | 11.4 | | 0.31 | | 0.60 | | 3,890 | | 7,473 | |
| 2 | | Axos Financial, Inc. (NYSE:AX) | | 4/6/2023 | | 2225.4 | | 6.9 | | 8.6 | | 136.5 | | 12.2 | | 4.37 | | 3.18 | | 524,391 | | 381,683 | |
| 3 | | Blue Foundry Bancorp (NASDAQGS:BLFY) | | 4/6/2023 | | 245.8 | | 120.9 | | 107.4 | | 67.7 | | 17.3 | | 2.29 | | 1.67 | | 116,270 | | 84,813 | |
| 4 | | Broadway Financial Corporation (NASDAQCM:BYFC) | | 4/6/2023 | | 79.3 | | 13.0 | | 13.0 | | 75.7 | | NA | | 1.31 | | 1.84 | | 126,024 | | 177,695 | |
| 5 | | Capitol Federal Financial, Inc. (NASDAQGS:CFFN) | | 4/6/2023 | | 895.6 | | 14.0 | | 11.6 | | 87.8 | | 11.9 | | 3.76 | | 2.76 | | 999,679 | | 735,677 | |
| 6 | | Carver Bancorp, Inc. (NASDAQCM:CARV) | | 4/6/2023 | | 17.0 | | NM | | NM | | 87.4 | | 2.6 | | 1.98 | | 9.53 | | 16,731 | | 80,591 | |
| 7 | | Cullman Bancorp, Inc. (NASDAQCM:CULL) | | 4/6/2023 | | 79.0 | | 20.6 | | 18.1 | | 79.0 | | 20.1 | | 0.13 | | 0.28 | | 1,935 | | 4,160 | |
| 8 | | Finward Bancorp (NASDAQCM:FNWD) | | 4/6/2023 | | 124.3 | | 7.8 | | 8.0 | | 113.7 | | 7.5 | | 0.35 | | 0.47 | | 3,043 | | 4,075 | |
| 9 | | First Northwest Bancorp (NASDAQGM:FNWB) | | 4/6/2023 | | 108.0 | | 4.6 | | 7.1 | | 73.6 | | 7.3 | | 1.01 | | 0.74 | | 17,911 | | 13,139 | |
| 10 | | First Seacoast Bancorp, Inc. (NASDAQCM:FSEA) | | 4/6/2023 | | 44.3 | | NM | | NM | | 90.1 | | 10.8 | | 3.50 | | 1.23 | | 34,404 | | 12,087 | |
| 11 | | FS Bancorp, Inc. (NASDAQCM:FSBW) | | 4/6/2023 | | 221.0 | | 7.5 | | 7.8 | | 99.3 | | 9.8 | | 1.74 | | 1.96 | | 26,570 | | 29,905 | |
| 12 | | Generations Bancorp NY, Inc. (NASDAQCM:GBNY) | | 4/6/2023 | | 24.1 | | 128.6 | | 21.9 | | 67.5 | | 6.6 | | 0.24 | | 0.43 | | 1,112 | | 1,999 | |
| 13 | | Hingham Institution for Savings (NASDAQGM:HIFS) | | 4/6/2023 | | 466.0 | | 10.0 | | 12.7 | | 120.7 | | 14.1 | | 2.74 | | 1.48 | | 11,768 | | 6,351 | |
| 14 | | HMN Financial, Inc. (NASDAQGM:HMNF) | | 4/6/2023 | | 81.1 | | 8.3 | | 10.2 | | 86.5 | | 8.7 | | 0.33 | | 0.39 | | 2,849 | | 3,385 | |
| 15 | | Home Federal Bancorp, Inc. of Louisiana (NASDAQCM:HFBL) | | 4/6/2023 | | 51.2 | | 7.8 | | 9.8 | | 109.5 | | 9.3 | | 0.20 | | 0.37 | | 1,224 | | 2,211 | |
| 16 | | Kearny Financial Corp. (NASDAQGS:KRNY) | | 4/6/2023 | | 525.2 | | 67.4 | | 11.6 | | 82.7 | | 8.3 | | 2.09 | | 2.25 | | 271,905 | | 292,763 | |
| 17 | | Mid-Southern Bancorp, Inc. (NASDAQCM:MSVB) | | 4/6/2023 | | 31.5 | | 20.6 | | 16.7 | | 99.7 | | 13.9 | | 0.38 | | 0.36 | | 2,093 | | 1,975 | |
| 18 | | New York Community Bancorp, Inc. (NYSE:NYCB) | | 4/6/2023 | | 6016.4 | | 7.3 | | 7.0 | | 107.0 | | 6.5 | | 10.88 | | 7.56 | | 14,860,535 | | 10,322,080 | |
| 19 | | Northeast Community Bancorp, Inc. (NASDAQCM:NECB) | | 4/6/2023 | | 196.1 | | 6.2 | | 8.4 | | 81.5 | | 16.8 | | 3.17 | | 1.76 | | 93,626 | | 52,065 | |
| 20 | | Northfield Bancorp, Inc. (Staten Island, NY) (NASDAQGS:NFBK) | | 4/6/2023 | | 537.3 | | 9.3 | | 8.7 | | 82.4 | | 13.3 | | 1.91 | | 1.51 | | 178,684 | | 141,251 | |
| 21 | | NSTS Bancorp, Inc. (NASDAQCM:NSTS) | | 4/6/2023 | | 47.0 | | 217.5 | | NM | | 58.3 | | 20.7 | | 0.53 | | 0.54 | | 5,774 | | 5,815 | |
| 22 | | OP Bancorp (NASDAQGM:OPBK) | | 4/6/2023 | | 133.2 | | 4.3 | | 4.1 | | 75.1 | | 8.1 | | 0.93 | | 1.15 | | 28,415 | | 35,428 | |
| 23 | | PB Bankshares, Inc. (NASDAQCM:PBBK) | | 4/6/2023 | | 34.6 | | 7.7 | | 16.2 | | 82.0 | | 10.0 | | 0.78 | | 0.74 | | 4,049 | | 3,844 | |
| 24 | | Ponce Financial Group, Inc. (NASDAQGM:PDLB) | | 4/6/2023 | | 177.7 | | NM | | NM | | 70.9 | | 11.1 | | 2.27 | | 1.40 | | 105,881 | | 65,309 | |
| 25 | | Provident Bancorp, Inc. (NASDAQCM:PVBC) | | 4/6/2023 | | 116.6 | | 10.5 | | NM | | 57.2 | | 7.9 | | 4.14 | | 2.41 | | 143,615 | | 83,632 | |
| 26 | | Provident Financial Services, Inc. (NYSE:PFS) | | 4/6/2023 | | 1373.5 | | 7.0 | | 7.8 | | 121.5 | | 11.6 | | 3.50 | | 2.67 | | 522,589 | | 399,660 | |
| 27 | | Riverview Bancorp, Inc. (NASDAQGS:RVSB) | | 4/6/2023 | | 115.0 | | 5.6 | | 6.1 | | 92.3 | | 10.3 | | 0.76 | | 0.56 | | 32,621 | | 23,997 | |
| 28 | | Southern Missouri Bancorp, Inc. (NASDAQGM:SMBC) | | 4/6/2023 | | 413.5 | | 7.3 | | 7.7 | | 110.7 | | 12.3 | | 1.96 | | 1.33 | | 44,238 | | 30,120 | |
| 29 | | Sterling Bancorp, Inc. (Southfield, MI) (NASDAQCM:SBT) | | 4/6/2023 | | 282.6 | | NM | | NM | | 90.3 | | 12.7 | | 0.40 | | 0.58 | | 40,672 | | 58,696 | |
| 30 | | TC Bancshares, Inc. (NASDAQCM:TCBC) | | 4/6/2023 | | 64.8 | | NM | | 38.9 | | 81.8 | | 17.3 | | 0.42 | | 0.48 | | 3,913 | | 4,438 | |
| 31 | | Territorial Bancorp Inc. (NASDAQGS:TBNK) | | 4/6/2023 | | 174.5 | | 12.7 | | 11.0 | | 70.3 | | 10.0 | | 1.05 | | 0.80 | | 18,456 | | 14,111 | |
| 32 | | Third Coast Bancshares, Inc. (NASDAQGS:TCBX) | | 4/6/2023 | | 203.8 | | 8.5 | | 12.0 | | 68.5 | | 6.7 | | 1.01 | | 1.81 | | 27,481 | | 49,108 | |
| 33 | | Timberland Bancorp, Inc. (NASDAQGM:TSBK) | | 4/6/2023 | | 220.8 | | 7.5 | | 8.7 | | 106.5 | | 15.3 | | 1.35 | | 0.79 | | 22,188 | | 13,046 | |
| 34 | | TrustCo Bank Corp NY (NASDAQGS:TRST) | | 4/6/2023 | | 588.0 | | 7.0 | | 7.9 | | 98.1 | | 11.9 | | 2.65 | | 2.09 | | 100,875 | | 79,545 | |
| 35 | | Waterstone Financial, Inc. (NASDAQGS:WSBF) | | 4/6/2023 | | 323.2 | | 92.1 | | 16.6 | | 88.4 | | 18.8 | | 1.56 | | 1.73 | | 71,987 | | 79,807 | |
| 36 | | Western New England Bancorp, Inc. (NASDAQGS:WNEB) | | 4/6/2023 | | 174.1 | | 4.8 | | 6.8 | | 83.9 | | 8.2 | | 1.19 | | 0.78 | | 51,333 | | 33,818 | |
| 37 | | William Penn Bancorporation (NASDAQCM:WMPN) | | 4/6/2023 | | 136.4 | | 32.6 | | 34.8 | | 84.9 | | 19.7 | | 1.36 | | 1.07 | | 36,230 | | 28,478 | |
| 38 | | WSFS Financial Corporation (NASDAQGS:WSFS) | | 4/6/2023 | | 2267.6 | | 6.7 | | 10.6 | | 189.8 | | 14.0 | | 2.33 | | 2.51 | | 286,086 | | 308,420 | |
| | | | | | | | | | | | | | | | | | | | | | | | |
| | | 25% Percentile: | | 4/6/2023 | | 79.1 | | 7.0 | | 7.9 | | 75.2 | | 8.3 | | 0.59 | | 0.59 | | 7,273 | | 6,632 | |
| | | Median: | | 4/6/2023 | | 174.3 | | 8.0 | | 10.2 | | 85.7 | | 11.4 | | 1.35 | | 1.28 | | 33,513 | | 31,969 | |
| | | 75% Percentile: | | 4/6/2023 | | 390.9 | | 15.7 | | 14.6 | | 99.6 | | 14.0 | | 2.32 | | 1.93 | | 113,673 | | 82,872 | |
Price to Earnings – According to the Appraisal Guidelines: “When both the converting institution and the comparable companies are recording “normal” earnings, a P/E approach may be the simplest and most direct method of valuation. When earnings are low or negative, however, this approach may not be appropriate and the greater consideration should be given to the P/BV approach.” In this particular case, the Bank’s earnings are “normal”. As a basis for comparison, the price to core earnings was utilized for both the Bank and the Comparable Group to eliminate any nonrecurring items. As such, this approach was considered in this appraisal.
In the pro forma figures for the Bank, FinPro incorporated the impact of SFAS 123, which requires the expensing of stock options. In preparing the fully converted pro forma figures for the Comparable Group, FinPro also incorporated the impact of SFAS 123.
| Conversion Valuation Appraisal Report | Page 9 |
Price to Book/Price to Tangible Book - According to the Appraisal Guidelines: “The P/BV approach works best when the converting institution and the Comparables have a normal amount of book value. The P/BV approach could seriously understate the value of an institution that has almost no book value but has an outstanding future earnings potential. For converting institutions with high net worth, the appraiser may have difficulty in arriving at a pro forma market value because of pressure placed on the P/E multiple as higher P/BV levels are required to reflect a similar P/BV ratio as the peer group average. The P/BV approach also suffers from the use of historical cost accounting data.”
Since thrift earnings in general have had a high degree of volatility over the past decade, the P/B is utilized frequently as the benchmark for market value. A better approach is the P/TB approach. In general, investors tend to price financial institutions on a tangible book basis, because it incorporates the P/B approach adjusted for intangibles. Initially following conversion, FinPro believes that thrifts often trade on a price to tangible book basis.
Price to Assets - According to the Appraisal Guidelines: “This approach remedies the problems of a small base that can occur with the P/BV approach, but the approach has many of the other limitations of the latter approach (the P/BV approach).” FinPro places little weight on this valuation approach due to the lack of consideration of asset and funding mixes and the resulting earnings impact.
| Conversion Valuation Appraisal Report | Page 10 |
| Offering Value in Relation to Comparables |
Based upon the premiums and discounts defined in the section above, the Bank’s aggregate pro forma market value (excluding the stock foundation) at the midpoint is estimated to be $10,750,000. Based upon a range below and above the midpoint value, the relative values are $9,137,500 at the minimum and $12,362,500 at the maximum, respectively. At the super maximum of the estimated value range, the offering value would be $14,216,880.
At the various levels of the estimated value range, the full offering would result in the following offering data:
Figure - Value Range - Full Offering
| | | Total Shares | | | Price | | | Total | |
| Conclusion | | Shares | | | Per Share | | | Value | |
| Appraised Value - Midpoint | | | 1,075,000 | | | $ | 10.00 | | | $ | 10,750,000 | |
| Range: | | | | | | | | | | | | |
| - Minimum | | | 913,750 | | | $ | 10.00 | | | | 9,137,500 | |
| - Maximum | | | 1,236,250 | | | | 10.00 | | | | 12,362,500 | |
| - Super Maximum | | | 1,421,688 | | | | 10.00 | | | | 14,216,880 | |
Source: FinPro Inc. Pro Forma Model
This equates to the following multiples:
Figure - Value Range Pricing Multiples
| | | | | Bank | | | Comparables | | | Region | | | National | |
| | | | | | | | Mean | | | Median | | | Mean | | | Median | | | Mean | | Median | |
| | | Min | | 6.5 | | | | | | | | | | | | | | | | | | | |
| Price-Core Earnings Ratio P/E | | Mid | | 7.5 | | | 46.6 | | | 19.6 | | | 11.5 | | | 11.5 | | | 17.9 | | | 8.7 | |
| | | Max | | 8.4 | | | | | | | | | | | | | | | | | | | |
| | | Smax | | 9.4 | | | | | | | | | | | | | | | | | | | |
| | | | | | | | | | | | | | | | | | | | | | | | |
| | | Min | | 45.9 | % | | | | | | | | | | | | | | | | | | |
| Price-to-Book Ratio P/B | | Mid | | 50.2 | % | | 79.5 | % | | 82.1 | % | | 87.6 | % | | 88.2 | % | | 83.0 | % | | 81.9 | % |
| | | Max | | 54.0 | % | | | | | | | | | | | | | | | | | | |
| | | Smax | | 57.8 | % | | | | | | | | | | | | | | | | | | |
| | | | | | | | | | | | | | | | | | | | | | | | |
| | | Min | | 45.9 | % | | | | | | | | | | | | | | | | | | |
| Price-to-Tangible Book Ratio P/TB | | Mid | | 50.2 | % | | 82.0 | % | | 83.4 | % | | 91.9 | % | | 88.4 | % | | 90.6 | % | | 85.7 | % |
| | | Max | | 54.0 | % | | | | | | | | | | | | | | | | | | |
| | | Smax | | 57.8 | % | | | | | | | | | | | | | | | | | | |
| | | | | | | | | | | | | | | | | | | | | | | | |
| | | Min | | 6.3 | % | | | | | | | | | | | | | | | | | | |
| Price-to-Assets Ratio P/A | | Mid | | 7.3 | % | | 12.5 | % | | 11.1 | % | | 13.3 | % | | 12.3 | % | | 11.8 | % | | 11.4 | % |
| | | Max | | 8.3 | % | | | | | | | | | | | | | | | | | | |
| | | Smax | | 9.4 | % | | | | | | | | | | | | | | | | | | |
Source: FinPro Inc. Pro Forma Model
| Conversion Valuation Appraisal Report | Page 11 |
Figure - Comparable Pricing Multiples to the Bank’s Pro Forma Midpoint
| | | Price Relative to | |
| | | Core Earnings | | | Book | | | Tangible Book | | | Assets | |
| The Bank (at midpoint) Full Conversion | | | 7.5 | | | | 50.2 | % | | | 50.2 | % | | | 7.3 | % |
| Comparable Group Median | | | 19.6 | | | | 82.1 | % | | | 83.4 | % | | | 11.1 | % |
| (Discount) Premium | | | -61.9 | % | | | -38.9 | % | | | -39.8 | % | | | -34.2 | % |
Source: FinPro Calculations
Figure above illustrates that at the midpoint of the estimated valuation range the Bank is priced at a 61.9% discount to the Comparable median price to core earnings multiple. On a tangible book basis, the Bank is priced at a 39.8% discount.
Figure - Comparable Pricing Multiples to the Bank’s Pro Forma Super maximum
| | | Price Relative to | |
| | | Core Earnings | | | Book | | | Tangible Book | | | Assets | |
| The Bank (at the supermax) Full Conversion | | | 9.4 | | | | 57.8 | % | | | 57.8 | % | | | 9.4 | % |
| Comparable Group Median | | | 19.6 | | | | 82.1 | % | | | 83.4 | % | | | 11.1 | % |
| (Discount) Premium | | | -51.9 | % | | | -29.6 | % | | | -30.7 | % | | | -15.6 | % |
Source: FinPro Calculations
Figure above illustrates that at the super maximum of the estimated valuation range the Bank is priced at a 51.9% discount to the Comparable median price to core earnings multiple. On a tangible book basis, the Bank is priced at a 30.7% discount.
| Conversion Valuation Appraisal Report | Page 12 |
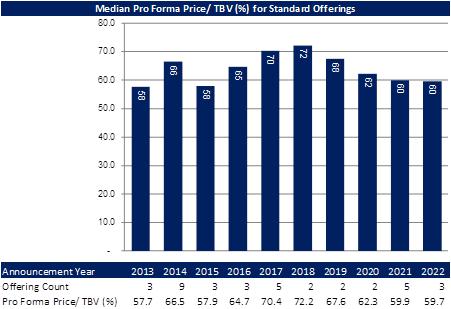
Comparison to Recent Standard Conversions |
As a secondary check FinPro reviewed the pro forma pricing multiples of the Bank relative to the other recent standard conversion pro forma pricing multiples.
Figure–Recent Standard Conversion Offerings
| | | | | | | | Offering Data | | Financial Performance At Offering | |
| | | | | | | | | | | | | | | | | | | | | | | |
| | | | | | | Trading
| | Offering
Completion
| | Offering
Announcement
| | | Net
Proceeds
| | | | Pro Forma
Price/
Earnings | | | | Pro Forma Price/ Book | | | Pro Forma
Price/
Tangible
Book | | | | Total
Assets | | | | ROAE | | | | Core ROAE | | | Tangible
Equity/
Tangible
Assets | | | NPAs/
Assets | |
| Institution Name | | | State | | | Symbol | | Date | | Date | | | $000s | | | | (x) | | | | (%) | | | (%) | | | | $000s | | | | (%) | | | | (%) | | | (%) | | | (%) | |
| ECB Bancorp, Inc. | | | MA | | | ECBK | | 7/27/2022 | | 3/10/2022 | | | 75,794 | | | | 25.9 | | | | 59.8 | | | 59.8 | | | | 688,639 | | | | 5.40 | | | | 7.11 | | | 11.42 | | | NA | |
| VWF Bancorp, Inc. | | | OH | | | VWFB | | 7/13/2022 | | 3/3/2022 | | | 15,422 | | | | 250.0 | | | | 50.2 | | | 50.2 | | | | 137,048 | | | | 0.11 | | | | 1.02 | | | 17.62 | | | NA | |
| NSTS Bancorp, Inc. | | | IL | | | NSTS | | 1/18/2022 | | 7/19/2021 | | | 44,494 | | | | NM | | | | 59.7 | | | 59.7 | | | | 259,881 | | | | 0.19 | | | | (0.03 | ) | | 17.68 | | | 0.68 | |
| PB Bankshares, Inc. | | | PA | | | PBBK | | 7/14/2021 | | 3/8/2021 | | | 23,083 | | | | NM | | | | 61.7 | | | 61.7 | | | | 281,066 | | | | (1.66 | ) | | | (0.68 | ) | | 7.76 | | | 1.04 | |
| TC Bancshares, Inc. | | | GA | | | TCBC | | 7/20/2021 | | 3/5/2021 | | | 41,777 | | | | NM | | | | 59.9 | | | 59.9 | | | | 363,624 | | | | 2.02 | | | | 4.22 | | | 11.14 | | | NA | |
| Texas Community Bancshares, Inc. | | | TX | | | TCBS | | 7/14/2021 | | 3/3/2021 | | | 26,776 | | | | 86.3 | | | | 53.2 | | | 56.0 | | | | 316,501 | | | | 2.27 | | | | 2.27 | | | 9.85 | | | 0.53 | |
| Catalyst Bancorp, Inc. | | | LA | | | | | 10/12/2021 | | 3/12/2021 | | | 44,958 | | | | NM | | | | 55.5 | | | 55.5 | | | | 238,329 | | | | (1.38 | ) | | | NA | | | 21.29 | | | 1.92 | |
| Systematic Savings Bank | | | MO | | | | | 10/13/2020 | | 3/18/2020 | | | 5,101 | | | | 62.5 | | | | 58.7 | | | 58.7 | | | | 39,995 | | | | 2.18 | | | | 2.18 | | | 12.64 | | | 0.08 | |
| Eureka Homestead Bancorp, Inc. | | | LA | | | ERKH | | 7/9/2019 | | 3/1/2019 | | | 11,311 | | | | 44.7 | | | | 60.6 | | | 60.6 | | | | 98,403 | | | | 2.32 | | | | NA | | | 12.52 | | | 0.00 | |
| Richmond Mutual Bancorporation, Inc. | | | IN | | | RMBI | | 7/1/2019 | | 2/6/2019 | | | 111,240 | | | | 18.9 | | | | 74.5 | | | 74.5 | | | | 882,800 | | | | 6.98 | | | | 6.94 | | | 10.10 | | | 0.26 | |
| CBM Bancorp, Inc. | | | MD | | | | | 9/27/2018 | | 5/23/2018 | | | 35,785 | | | | 41.7 | | | | 73.5 | | | 73.5 | | | | 184,177 | | | | 0.95 | | | | NA | | | 11.95 | | | 0.86 | |
| Sidney Federal Savings and Loan Association | | | NE | | | | | 7/26/2018 | | 10/17/2017 | | | 816 | | | | NM | | | | 71.0 | | | 71.0 | | | | 16,660 | | | | (26.09 | ) | | | (26.09 | ) | | 5.66 | | | 0.14 | |
| Heritage NOLA Bancorp, Inc. | | | LA | | | HRGG | | 7/12/2017 | | 3/7/2017 | | | 13,347 | | | | NM | | | | 72.5 | | | 72.5 | | | | 104,063 | | | | NA | | | | NA | | | 9.19 | | | NA | |
| Eagle Financial Bancorp, Inc. | | | OH | | | EFBI | | 7/20/2017 | | 3/3/2017 | | | 12,543 | | | | 10.2 | | | | 61.7 | | | 61.7 | | | | 119,296 | | | | 7.68 | | | | 7.68 | | | 11.49 | | | 0.96 | |
| Community Savings Bancorp, Inc. | | | OH | | | | | 1/10/2017 | | 8/25/2016 | | | 2,684 | | | | 6.1 | | | | 57.3 | | | 57.3 | | | | 53,606 | | | | NA | | | | NA | | | 12.43 | | | NA | |
| HV Bancorp, Inc. | | | PA | | | HVBC | | 1/11/2017 | | 7/20/2016 | | | 17,899 | | | | 22.7 | | | | 70.7 | | | 70.7 | | | | 177,115 | | | | 8.43 | | | | 8.29 | | | 7.45 | | | 0.93 | |
| | | | | | | | | | | | | | | | | | | | | | | | | | | | | | | | | | | | | | | | | | | | |
| | | | | | | | | | | | | | | | | | | | | | | | | | | | | | | | | | | | | | | | | | | | |
| 25th Percentile: | | | | | | | | | | | | | 12,235 | | | | 19.8 | | | | 58.3 | | | 58.3 | | | | 102,648 | | | | 0.13 | | | | 0.49 | | | 9.69 | | | 0.20 | |
| Median | | | | | | | | | | | | | 20,491 | | | | 33.8 | | | | 60.3 | | | 60.3 | | | | 180,646 | | | | 2.10 | | | | 2.27 | | | 11.46 | | | 0.68 | |
| Average | | | | | | | | | | | | | 30,189 | | | | 56.9 | | | | 62.5 | | | 62.7 | | | | 247,575 | | | | 0.67 | | | | 1.17 | | | 11.89 | | | 0.67 | |
| 75th Percentile: | | | | | | | | | | | | | 42,456 | | | | 58.0 | | | | 70.8 | | | 70.8 | | | | 289,925 | | | | 4.63 | | | | 7.02 | | | 12.55 | | | 0.94 | |
Figure–Median Pro Forma Price/ TBV Trend
| Conversion Valuation Appraisal Report | Page 13 |
It is, FinPro’s opinion that as of February 23, 2023, the estimated aggregate pro forma market value of the Bank was $10,750,000 at the midpoint of a range (excluding foundation shares) with a minimum of $9,137,500 to a maximum of $12,362,500 at 15% below and 15% above the midpoint of the range respectively. Assuming an adjusted maximum value of 15% above the maximum value, the adjusted maximum value or super maximum value is $14,216,880. The stock will be issued at $10.00 per share. Note that the valuation was floored at approximately 50% due to recent conversion, coupled with the decline in comparable valuations.
| | | Pre Foundation | |
| | | Appraised Value | |
| Conclusion | | Minimum | | | Midpoint | | | Maximum | | | SuperMaximum * | |
| Total Shares | | | 913,750 | | | | 1,075,000 | | | | 1,236,250 | | | | 1,421,688 | |
| Price per Share | | $ | 10 | | | $ | 10 | | | $ | 10 | | | $ | 10 | |
| Full Conversion Value | | $ | 9,137,500 | | | $ | 10,750,000 | | | $ | 12,362,500 | | | $ | 14,216,880 | |
| Conversion Shares | | | 913,750 | | | | 1,075,000 | | | | 1,236,250 | | | | 1,421,688 | |
| Conversion Percent | | | 100.00 | % | | | 100.00 | % | | | 100.00 | % | | | 100.00 | % |
| Gross Proceeds | | $ | 9,137,500 | | | $ | 10,750,000 | | | $ | 12,362,500 | | | $ | 14,216,880 | |
* SuperMaximum is an overallotment option that is 15% above the maximum amount.
The document represents an initial valuation for the Bank. Due to the duration of time that passes between the time this document is compiled and the time the offering closes, numerous factors could lead FinPro to update or revised the appraised value of the Bank. Some factors that could lead FinPro to adjust the appraised value include: (1) changes in the Bank’s operations and financial condition; (2) changes in the market valuation or financial condition of the Comparable Group; (3) changes in the broader market; and (4) changes in the market for thrift conversions. Should there be material changes to any of these factors, FinPro will prepare an appraisal update to appropriately adjust the value of the Bank. At the time of closing, FinPro will prepare a final appraisal to determine if the valuation range is still appropriate and determine the exact valuation amount appropriate for the Bank.
| Conversion Valuation Appraisal Report | Page 14 |
3. Exhibits
Exhibit 1. Pro Forma Regulatory Capital Ratios
| | | Historical | | | Minimum | | | Midpoint | | | Maximum | | | Adj. Maximum | |
| | | | | | | | 913,750 | | | 1,075,000 | | | 1,236,250 | | | 1,421,688 | |
| | | $ | | % | | | $ | | % | | | $ | | % | | | $ | | % | | | $ | | % | |
| GAAP Capital | | $ | 14,526 | | 9.9 | % | | $ | 17,166 | | 11.5 | % | | $ | 17,779 | | 11.9 | % | | $ | 18,391 | | 12.3 | % | | $ | 19,096 | | | 12.7 | % |
| | | | | | | | | | | | | | | | | | | | | | | | | | | | | | | | |
| Tier 1 Leverage Capital | | $ | 15,181 | | 10.2 | % | | $ | 17,821 | | 11.7 | % | | $ | 18,434 | | 12.1 | % | | $ | 19,046 | | 12.4 | % | | $ | 19,751 | | | 12.8 | % |
| Tier 1 Leverage Requirement | | $ | 7,473 | | 5.0 | % | | $ | 7,605 | | 5.0 | % | | $ | 7,636 | | 5.0 | % | | $ | 7,667 | | 5.0 | % | | $ | 7,702 | | | 5.0 | % |
| Excess | | $ | 7,708 | | 5.2 | % | | $ | 10,216 | | 6.7 | % | | $ | 10,798 | | 7.1 | % | | $ | 11,379 | | 7.4 | % | | $ | 12,049 | | | 7.8 | % |
| | | | | | | | | | | | | | | | | | | | | | | | | | | | | | | | |
| Tier 1 Risk based | | $ | 15,181 | | 15.8 | % | | $ | 17,821 | | 18.5 | % | | $ | 18,434 | | 19.1 | % | | $ | 19,046 | | 19.7 | % | | $ | 19,751 | | | 20.4 | % |
| Risk-Based Capital Requirement | | $ | 7,673 | | 8.0 | % | | $ | 7,715 | | 8.0 | % | | $ | 7,725 | | 8.0 | % | | $ | 7,735 | | 8.0 | % | | $ | 7,746 | | | 8.0 | % |
| Excess | | $ | 7,508 | | 7.8 | % | | $ | 10,106 | | 10.5 | % | | $ | 10,709 | | 11.1 | % | | $ | 11,311 | | 11.7 | % | | $ | 12,005 | | | 12.4 | % |
| | | | | | | | | | | | | | | | | | | | | | | | | | | | | | | | |
| Total Risk-Based Capital | | $ | 16,142 | | 16.8 | % | | $ | 18,782 | | 19.5 | % | | $ | 19,395 | | 20.1 | % | | $ | 20,007 | | 20.7 | % | | $ | 20,712 | | | 21.4 | % |
| Risk-Based Capital Requirement | | $ | 9,591 | | 10.0 | % | | $ | 9,644 | | 10.0 | % | | $ | 9,656 | | 10.0 | % | | $ | 9,668 | | 10.0 | % | | $ | 9,683 | | | 10.0 | % |
| Excess | | $ | 6,551 | | 6.8 | % | | $ | 9,138 | | 9.5 | % | | $ | 9,739 | | 10.1 | % | | $ | 10,339 | | 10.7 | % | | $ | 11,030 | | | 11.4 | % |
| | | | | | | | | | | | | | | | | | | | | | | | | | | | | | | | |
| Common Equity Tier 1 Risk-Based | | $ | 15,181 | | 15.8 | % | | $ | 17,821 | | 18.5 | % | | $ | 18,434 | | 19.1 | % | | $ | 19,046 | | 19.7 | % | | $ | 19,751 | | | 20.4 | % |
| Common Equity Tier 1 Risk-Based Requirement | | $ | 6,234 | | 6.5 | % | | $ | 6,269 | | 6.5 | % | | $ | 6,277 | | 6.5 | % | | $ | 6,284 | | 6.5 | % | | $ | 6,294 | | | 6.5 | % |
| Excess | | $ | 8,947 | | 9.3 | % | | $ | 11,552 | | 12.0 | % | | $ | 12,157 | | 12.6 | % | | $ | 12,762 | | 13.2 | % | | $ | 13,457 | | | 13.9 | % |
| | | | | | | | | | | | | | | | | | | | | | | | | | | | | | | | |
| Reconcilation of Capital Infused in Mercer Savings Bank: | | | | | | | | | | | | | | | | | | | | | | | | | | | | | | | |
| 50% of Net Proceeds | | | | | | | | $ | 3,797 | | | | | $ | 4,603 | | | | | $ | 5,409 | | | | | $ | 6,336 | | | | |
| Less: ESOP | | | | | | | | -$ | 771 | | | | | -$ | 900 | | | | | -$ | 1,029 | | | | | -$ | 1,177 | | | | |
| Less: MRP | | | | | | | | -$ | 386 | | | | | -$ | 450 | | | | | -$ | 515 | | | | | -$ | 589 | | | | |
| Pro Forma Increase | | | | | | | | $ | 2,640 | | | | | $ | 3,253 | | | | | $ | 3,865 | | | | | $ | 4,570 | | | | |
| Conversion Valuation Appraisal Report | Page 15 |
Exhibit 2. Pro Forma Analysis Sheet
| | | | | | Company Pro Forma Based Upon Sale at $10.00 Per Share | |
| | | | | | 913,750 | | | 1,075,000 | | | 1,236,250 | | | 1,421,688 | |
| | | | | | Shares | | | Shares | | | Shares | | | Shares | |
| | | | | | (Minimum of | | | (Midpoint of | | | (Maximum of | | | (15% above Max of | |
| | | Bank | | | Estimated | | | Estimated | | | Estimated | | | Estimated | |
| | | Historical | | | Price Range) | | | Price Range) | | | Price Range) | | | Price Range) | |
| | | | | | | | | | | | | | | | |
| | | (In thousands) | |
| Deposits | | $ | 127,699 | | | $ | 127,699 | | | $ | 127,699 | | | $ | 127,699 | | | $ | 127,699 | |
| Borrowings | | | 3,000 | | | | 3,000 | | | | 3,000 | | | | 3,000 | | | | 3,000 | |
| Total Deposits and Borrowings | | $ | 130,699 | | | $ | 130,699 | | | $ | 130,699 | | | $ | 130,699 | | | $ | 130,699 | |
| | | | | | | | | | | | | | | | | | | | | |
| Stockholders' equity: | | | | | | | | | | | | | | | | | | | | |
| Preferred | | $ | - | | | $ | - | | | $ | - | | | $ | - | | | $ | - | |
| Common | | | - | | | | 10 | | | | 11 | | | | 13 | | | | 15 | |
| APIC | | | - | | | | 8,083 | | | | 9,694 | | | | 11,305 | | | | 13,157 | |
| Retained Earnings | | | 15,288 | | | | 15,288 | | | | 15,288 | | | | 15,288 | | | | 15,288 | |
| Net unrealized g/(l) on AFS, net | | | (763 | ) | | | (763 | ) | | | (763 | ) | | | (763 | ) | | | (763 | ) |
| Less: | | | | | | | | | | | | | | | | | | | | |
| After Tax Expense of foundation | | | - | | | | (474 | ) | | | (474 | ) | | | (474 | ) | | | (474 | ) |
| Less: | | | | | | | | | | | | | | | | | | | | |
| CS acquired by old ESOP | | | - | | | | - | | | | - | | | | - | | | | - | |
| CS acquired by old MRP | | | - | | | | - | | | | - | | | | - | | | | - | |
| CS to be acquired by ESOP | | | - | | | | (771 | ) | | | (900 | ) | | | (1,029 | ) | | | (1,177 | ) |
| CS to be acquired by MRP | | | - | | | | (386 | ) | | | (450 | ) | | | (515 | ) | | | (589 | ) |
| Total Stockholder's equity | | $ | 14,526 | | | $ | 20,988 | | | $ | 22,407 | | | $ | 23,826 | | | $ | 25,458 | |
| | | | | | | | | | | | | | | | | | | | | |
| Total Shares Outstanding | | | | | | | 913,750 | | | | 1,075,000 | | | | 1,236,250 | | | | 1,421,688 | |
| Foundation Shares | | | | | | | 50,000 | | | | 50,000 | | | | 50,000 | | | | 50,000 | |
| | | | | | | | | | | | | | | | | | | | | |
| Equity to Assets | | | 9.94 | % | | | 13.7 | % | | | 14.5 | % | | | 15.3 | % | | | 16.2 | % |
| Equity to Tangiable Assets | | | 9.94 | % | | | 13.7 | % | | | 14.5 | % | | | 15.3 | % | | | 16.2 | % |
| Conversion Valuation Appraisal Report | Page 16 |
Exhibit 3. Pro Forma Analysis Sheet
| Valuation Parameters | | | | | | |
| Prior Three Mos. Earning Base Annualized | | Y | | | | | |
| Period Ended December 31, 2022 | | | | $ | 1,314 | | (1) |
| Pre-Conversion Book Value | | B | | | | | |
| As of December 31, 2022 | | | | $ | 14,526 | | |
| Pre-Conversion Assets | | A | | | | | |
| As of December 31, 2022 | | | | $ | 146,190 | | |
| Return on Money | | R | | | 3.67 | % | (2) |
| Conversion Expenses | | | | $ | 1,545 | | |
| | | X | | | 14.37 | % | (3) |
| Proceeds Not Invested | | | | $ | 1,350 | | (4) |
| Estimated ESOP Borrowings | | | | $ | 900 | | |
| ESOP Purchases | | E | | | 8.00 | % | (5) |
| Cost of ESOP Borrowings | | | | $ | 60 | | (5) |
| Cost of ESOP Borrowings | | S | | | 0.00 | % | (5) |
| Amort of ESOP Borrowings | | T | | | 15 | | Years |
| Amort of MRP Amount | | N | | | 5 | | Years |
| Estimated MRP Amount | | | | $ | 450 | | (6) |
| MRP Purchases | | M | | | 4.00 | % | |
| MRP Expense | | | | $ | 90 | | |
| Stock Foundation Amount | | | | $ | 500 | | (7) |
| Stock Foundation Amount | | F | | | 4.65 | % | 0.00% |
| Foundation Opportunity Cost | | | | $ | 18 | | |
| Tax Benefit | | Z | | $ | 105 | | (8) |
| Tax Rate | | TAX | | | 21.00 | % | |
| Percentage Sold | | PCT | | | 100.00 | % | |
| Amount to be issued to Public | | | | $ | 10,750 | | (9) |
| Earnings Multiple | | | | | 12 | | |
(1) Net income for the twelve months ended December 31, 2022.
(2) Net Return assumes a reinvestment rate of 5.00 percent (the 1 year Treasury at December 31, 2022), and a tax rate of 21%.
(3) Conversion expenses reflect estimated expenses as presented in the offering document.
(4) Includes Stock from ESOP and MRP.
(5) Assumes ESOP is amortized straight line over 15 years.
(6) Assumes MRP is amortized straight line over 5 years.
(7) The Foundation is assumed to be 5% of the gross proceeds.
(8) The after-tax benefit of the Foundation is assumed to be 21% of Foundation.
(9) The amount to be offered to public.
Calculation of Estimated Value (V) at Midpoint Value
| | | Pro Forma Calculation |
| | | |
| 3. | V= P/E*Y | = | $10,750,000 |
| | 1-P/E*PCT*((1-X-E-M-F)*R-(1-TAX)*E/T-(1-TAX)*M/N) | | |
| | | | |
| 2. | V= P/B*(B+Z) | = | $10,750,000 |
| | 1-P/B*PCT*(1-X-E-M-F) | | |
| | | | |
| 1. | V= P/A*A | = | $10,750,000 |
| | 1-P/A*PCT*(1-X-E-M-F) | | |
The appraisal was performed on a market basis and not on the above formulas.
| Conclusion | | | Total Shares
Shares | | | | Price
Per Share | | | | Total Value | |
| Appraised Value - Midpoint | | | 1,075,000 | | | $ | 10.00 | | | $ | 10,750,000 | |
| | | | | | | | | | | | | |
| Range: | | | | | | | | | | | | |
| - Minimum | | | 913,750 | | | $ | 10.00 | | | | 9,137,500 | |
| - Maximum | | | 1,236,250 | | | | 10.00 | | | | 12,362,500 | |
| - Super Maximum | | | 1,421,688 | | | | 10.00 | | | | 14,216,880 | |
| Conversion Valuation Appraisal Report | Page 17 |
Exhibit 4. Pro Forma Effect of Conversion
| | | | | Pro Forma Effect of Conversion Proceeds | |
| | | | | As of December 31, 2022 | |
| | | | | (Dollars in Thousands) | |
| Conversion Proceeds | | | | Minimum | | | Midpoint | | | Maximum | | | SuperMax | |
| Total Shares Offered | | | | | | 913,750 | | | | 1,075,000 | | | | 1,236,250 | | | | 1,421,688 | |
| Conversion Shares Offered | | | | | | 913,750 | | | | 1,075,000 | | | | 1,236,250 | | | | 1,421,688 | |
| Price Per Share | | | | | $ | 10 | | | $ | 10 | | | $ | 10 | | | $ | 10 | |
| Gross Proceeds | | | | | $ | 9,138 | | | $ | 10,750 | | | $ | 12,363 | | | $ | 14,217 | |
| Plus: Value issued to Foundation | | | (9) | | | 500 | | | | 500 | | | | 500 | | | | 500 | |
| Pro Forma Market Capitalization | | | | | | 9,638 | | | | 11,250 | | | | 12,863 | | | | 14,717 | |
| Gross Proceeds | | | | | | 9,138 | | | | 10,750 | | | | 12,363 | | | | 14,217 | |
| Less: Est. Conversion Expenses | | | | | | (1,545 | ) | | | (1,545 | ) | | | (1,545 | ) | | | (1,545 | ) |
| Net Proceeds | | | | | | 7,593 | | | | 9,205 | | | | 10,818 | | | | 12,672 | |
| Less: Cash issued to Foundation | | | | | | (100 | ) | | | (100 | ) | | | (100 | ) | | | (100 | ) |
| Less: ESOP Adjustment | | | (3) | | | (771 | ) | | | (900 | ) | | | (1,029 | ) | | | (1,177 | ) |
| Less: MRP Adjustment | | | (3) | | | (386 | ) | | | (450 | ) | | | (515 | ) | | | (589 | ) |
| Net Proceeds Reinvested | | | | | $ | 6,336 | | | $ | 7,755 | | | $ | 9,174 | | | $ | 10,806 | |
| Estimated Incremental Rate of Return | | | | | | 3.67 | % | | | 3.67 | % | | | 3.67 | % | | | 3.67 | % |
| Estimated Incremental Return | | | | | $ | 233 | | | $ | 285 | | | $ | 337 | | | $ | 397 | |
| Less: Cost of ESOP | | | (4) | | | - | | | | - | | | | - | | | | - | |
| Less: Amortization of ESOP | | | (7) | | | (41 | ) | | | (47 | ) | | | (54 | ) | | | (62 | ) |
| Less: Option Expense | | | (10) | | | (72 | ) | | | (84 | ) | | | (96 | ) | | | (109 | ) |
| Less: MRP Adjustment | | | (7) | | | (61 | ) | | | (71 | ) | | | (81 | ) | | | (93 | ) |
| Pro Forma Net Income | | | | | | 59 | | | | 83 | | | | 106 | | | | 133 | |
| Earnings Before Conversion | | | | | | 1,314 | | | | 1,314 | | | | 1,314 | | | | 1,314 | |
| Earnings Excluding Adjustment | | | | | | 1,373 | | | | 1,397 | | | | 1,420 | | | | 1,447 | |
| Earnings Adjustment | | | (6) | | | - | | | | - | | | | - | | | | - | |
| Earnings After Conversion | | | | | $ | 1,373 | | | $ | 1,397 | | | $ | 1,420 | | | $ | 1,447 | |
| Conversion Valuation Appraisal Report | Page 18 |
| | | | | Pro Forma Effect of Conversion Proceeds | |
| | | | | As of December 31, 2022 | |
| | | | | (Dollars in Thousands) | |
| | | | | Minimum | | | Midpoint | | | Maximum | | | SuperMax | |
| Pro Forma Equity | | | | | | | | | | | | | | |
| Equity at December 31, 2022 | | | | | $ | 14,526 | | | $ | 14,526 | | | $ | 14,526 | | | $ | 14,526 | |
| Net Conversion Proceeds | | | | | | 7,593 | | | | 9,205 | | | | 10,818 | | | | 12,672 | |
| Plus: Value issued to Foundation | | | | | | 500 | | | | 500 | | | | 500 | | | | 500 | |
| Less: After Tax Expense of Foundation | | | | | | (474 | ) | | | (474 | ) | | | (474 | ) | | | (474 | ) |
| Less: ESOP Adjustment | | | (1) | | | (771 | ) | | | (900 | ) | | | (1,029 | ) | | | (1,177 | ) |
| Less: MRP Adjustment | | | (2) | | | (386 | ) | | | (450 | ) | | | (515 | ) | | | (589 | ) |
| Pro Forma Equity | | | | | $ | 20,988 | | | $ | 22,407 | | | $ | 23,826 | | | $ | 25,458 | |
| Less: Intangible | | | (5) | | | - | | | | - | | | | - | | | | - | |
| Pro Forma Tangible Equity | | | | | $ | 20,988 | | | $ | 22,407 | | | $ | 23,826 | | | $ | 25,458 | |
| Pro Forma Assets | | | | | | | | | | | | | | | | | | | |
| Total Assets at December 31, 2022 | | | | | $ | 146,190 | | | $ | 146,190 | | | $ | 146,190 | | | $ | 146,190 | |
| Net Conversion Proceeds | | | | | | 7,593 | | | | 9,205 | | | | 10,818 | | | | 12,672 | |
| Plus: Value issued to Foundation | | | | | | 500 | | | | 500 | | | | 500 | | | | 500 | |
| Less: After Tax Expense of Foundation | | | | | | (474 | ) | | | (474 | ) | | | (474 | ) | | | (474 | ) |
| Less: ESOP Adjustment | | | (1) | | | (771 | ) | | | (900 | ) | | | (1,029 | ) | | | (1,177 | ) |
| Less: MRP Adjustment | | | (2) | | | (386 | ) | | | (450 | ) | | | (515 | ) | | | (589 | ) |
| Pro-forma Total Assets | | | | | | 152,652 | | | | 154,071 | | | | 155,490 | | | | 157,122 | |
| Stockholder's Equity Per Share * | | | | | | | | | | | | | | | | | | | |
| Equity at December 31, 2022 | | | | | $ | 15.07 | | | $ | 12.91 | | | $ | 11.29 | | | $ | 9.87 | |
| Estimated Net Proceeds | | | | | | 7.88 | | | | 8.18 | | | | 8.41 | | | | 8.61 | |
| Plus: Value issued to Foundation | | | | | | 0.52 | | | | 0.44 | | | | 0.39 | | | | 0.34 | |
| Less: After Tax Expense of Foundation | | | | | | (0.49 | ) | | | (0.42 | ) | | | (0.37 | ) | | | (0.32 | ) |
| Less: ESOP Stock | | | | | | (0.80 | ) | | | (0.80 | ) | | | (0.80 | ) | | | (0.80 | ) |
| Less: MRP Stock | | | | | | (0.40 | ) | | | (0.40 | ) | | | (0.40 | ) | | | (0.40 | ) |
| Pro Forma Equity Per Share * | | | | | | 21.78 | | | | 19.92 | | | | 18.52 | | | | 17.30 | |
| Less: Intangible | | | | | | - | | | | - | | | | - | | | | - | |
| Pro Forma Tangible Equity Per Share * | | | | | $ | 21.78 | | | $ | 19.92 | | | $ | 18.52 | | | $ | 17.30 | |
| Conversion Valuation Appraisal Report | Page 19 |
| | | | | Pro Forma Effect of Conversion Proceeds | |
| | | | | As of December 31, 2022 | |
| | | | | (Dollars in Thousands) | |
| | | | | Minimum | | | Midpoint | | | Maximum | | | SuperMax | |
| Net Earnings Per Share * | | | | | | | | | | | | | | |
| Historical Earnings Per Share | | | (8) | | $ | 1.47 | | | $ | 1.26 | | | $ | 1.10 | | | $ | 0.96 | |
| Incremental return Per Share | | | (8) | | | 0.26 | | | | 0.27 | | | | 0.28 | | | | 0.29 | |
| ESOP Adjustment Per Share | | | (8) | | | (0.05 | ) | | | (0.05 | ) | | | (0.05 | ) | | | (0.05 | ) |
| Option Expense Per Share | | | (10) | | | (0.08 | ) | | | (0.08 | ) | | | (0.08 | ) | | | (0.08 | ) |
| MRP Adjustment Per Share | | | (8) | | | (0.07 | ) | | | (0.07 | ) | | | (0.07 | ) | | | (0.07 | ) |
| Normalizing Adjustment Per Share | | | | | | - | | | | - | | | | - | | | | - | |
| Pro Forma Earnings Per Share * | | | (8) | | $ | 1.54 | | | $ | 1.34 | | | $ | 1.19 | | | $ | 1.06 | |
| | | | | | | | | | | | | | | | | | | | |
| Shares Utilized for EPS | | | | | | 891,790 | | | | 1,041,000 | | | | 1,190,210 | | | | 1,361,802 | |
| Pro Forma Ratios | | | | | | | | | | | | | | | | | | | |
| Price/EPS without Adjustment | | | | | | 6.49 | | | | 7.46 | | | | 8.40 | | | | 9.43 | |
| Price/EPS with Adjustment | | | | | | 6.49 | | | | 7.46 | | | | 8.40 | | | | 9.43 | |
| Price/Book Value per Share | | | | | | 45.91 | % | | | 50.20 | % | | | 54.00 | % | | | 57.80 | % |
| Price/Tangible Book Value | | | | | | 45.91 | % | | | 50.20 | % | | | 54.00 | % | | | 57.80 | % |
| Market Value/Assets | | | | | | 6.31 | % | | | 7.30 | % | | | 8.27 | % | | | 9.37 | % |
* The totals for the per share data are actual figures rounded to two decimals. The component parts may not add to the total due to rounding.
(1) ESOP Borrowings are deducted from net worth and assets, and amortized over 15 years.
(2) MRP Borrowings are omitted from net worth and assets, and amortized over 5 years.
(3) Consists of ESOP and MRP amortization.
(4) The ESOP loan is from the Holding Company and therefore, there are no costs.
(5) Not applicable.
(6) Not applicable.
(7) ESOP and MRP are amortized over 15 and 5 years respectively, and tax impacted at 21%.
(8) All EPS computations are done in accordance with SOP 93-6.
(9) The Foundation is assumed to be 5% of the gross proceeds.
(10) Assumed option expense in accordance with SFAS No. 123.
| Conversion Valuation Appraisal Report | Page 20 |
Exhibit 5. Comparison of Valuation with and without Foundation
| | | At the minimum | | | At the midpoint | | | At the maximum | | | At the maximum, as adjusted | |
| | | With Foundation | | | No Foundation | | | W/Found (1) | | | No Foundation | | | With Foundation | | | No Foundation | | | With Foundation | | | No Foundation | |
| Estimated Offering Amount | | $ | 9,138 | | | $ | 9,138 | | | $ | 10,750 | | | $ | 10,750 | | | $ | 12,363 | | | $ | 12,363 | | | $ | 14,217 | | | $ | 14,217 | |
| Pro forma Market Capitalization | | $ | 9,638 | | | $ | 9,138 | | | $ | 11,250 | | | $ | 10,750 | | | $ | 12,863 | | | $ | 12,363 | | | $ | 14,717 | | | $ | 14,217 | |
| Total Assets | | $ | 152,652 | | | $ | 152,252 | | | $ | 154,071 | | | $ | 153,630 | | | $ | 155,490 | | | $ | 155,009 | | | $ | 157,122 | | | $ | 156,594 | |
| Total Liabilities | | $ | 131,664 | | | $ | 131,664 | | | $ | 131,664 | | | $ | 131,664 | | | $ | 131,664 | | | $ | 131,664 | | | $ | 131,664 | | | $ | 131,664 | |
| Pro forma stockholders Equity | | $ | 20,988 | | | $ | 20,588 | | | $ | 22,407 | | | $ | 21,966 | | | $ | 23,826 | | | $ | 23,345 | | | $ | 25,458 | | | $ | 24,930 | |
| Pro forma consolidated net earnings | | $ | 1,373 | | | $ | 1,337 | | | $ | 1,397 | | | $ | 1,353 | | | $ | 1,420 | | | $ | 1,370 | | | $ | 1,447 | | | $ | 1,387 | |
| Pro forma stockholders equity per share | | $ | 21.78 | | | $ | 22.53 | | | $ | 19.92 | | | $ | 20.43 | | | $ | 18.52 | | | $ | 18.88 | | | $ | 17.30 | | | $ | 17.54 | |
| Pro forma consolidated net earnings per share | | $ | 1.54 | | | $ | 1.61 | | | $ | 1.34 | | | $ | 1.38 | | | $ | 1.19 | | | $ | 1.22 | | | $ | 1.06 | | | $ | 1.07 | |
| Pro forma pricing ratios | | | | | | | | | | | | | | | | | | | | | | | | | | | | | | | | |
| Offering price as a % of pro forma | | | | | | | | | | | | | | | | | | | | | | | | | | | | | | | | |
| stockholders equity per share | | | 45.91 | % | | | 44.39 | % | | | 50.20 | % | | | 48.95 | % | | | 54.00 | % | | | 52.97 | % | | | 57.80 | % | | | 57.01 | % |
| Offering price to pro forma | | | | | | | | | | | | | | | | | | | | | | | | | | | | | | | | |
| net earnings per share | | | 6.49 | | | | 6.21 | | | | 7.46 | | | | 7.25 | | | | 8.40 | | | | 8.20 | | | | 9.43 | | | | 9.35 | |
| Offering price to assets | | | 6.31 | % | | | 6.00 | % | | | 7.30 | % | | | 7.00 | % | | | 8.27 | % | | | 7.98 | % | | | 9.37 | % | | | 9.08 | % |
| Pro forma Financial Ratios | | | | | | | | | | | | | | | | | | | | | | | | | | | | | | | | |
| ROA | | | 0.90 | % | | | 0.88 | % | | | 0.91 | % | | | 0.88 | % | | | 0.91 | % | | | 0.88 | % | | | 0.92 | % | | | 0.89 | % |
| ROE | | | 6.54 | % | | | 6.49 | % | | | 6.23 | % | | | 6.16 | % | | | 5.96 | % | | | 5.87 | % | | | 5.68 | % | | | 5.56 | % |
| Equity to Assets | | | 13.75 | % | | | 13.52 | % | | | 14.54 | % | | | 14.30 | % | | | 15.32 | % | | | 15.06 | % | | | 16.20 | % | | | 15.92 | % |
| Conversion Valuation Appraisal Report | Page 21 |
Exhibit 6. Use of Proceeds
| Use of Proceeds | | | | | | | | | | | | | | | | | | | | | | | | |
| | | | | | | | | | | | | | | | | | | | | | | | | |
| | | 913,750 | | | % of Gross | | | 1,075,000 | | | Gross | | | 1,236,250 | | | Gross | | | 1,421,688 | | | Gross | |
| | | | Shares | | | | Proceeds | | | | Shares | | | | Proceeds | | | | Shares | | | | Proceeds | | | | Shares | | | | Proceeds | |
| Gross Offering Proceeds | | $ | 9,138 | | | | | | | $ | 10,750 | | | | | | | $ | 12,363 | | | | | | | $ | 14,217 | | | | | |
| Less: Expense | | | (1,545 | ) | | | | | | | (1,545 | ) | | | | | | | (1,545 | ) | | | | | | | (1,545 | ) | | | | |
| Net Proceeds | | | 7,593 | | | | 100.0 | % | | | 9,205 | | | | 100.0 | % | | | 10,818 | | | | 100.0 | % | | | 12,672 | | | | 100.0 | % |
| | | | | | | | | | | | | | | | | | | | | | | | | | | | | | | | | |
| Less: | | | | | | | | | | | | | | | | | | | | | | | | | | | | | | | | |
| Proceeds to Bank | | | (3,797 | ) | | | -50.0 | % | | | (4,603 | ) | | | -50.0 | % | | | (5,409 | ) | | | -50.0 | % | | | (6,336 | ) | | | -50.0 | % |
| ESOP | | | (771 | ) | | | -10.2 | % | | | (900 | ) | | | -9.8 | % | | | (1,029 | ) | | | -9.5 | % | | | (1,177 | ) | | | -9.3 | % |
| Cash to Foundation | | | (100 | ) | | | -1.3 | % | | | (100 | ) | | | -1.1 | % | | | (100 | ) | | | -0.9 | % | | | (100 | ) | | | -0.8 | % |
| Proceeds for HC | | | 2,925 | | | | 38.5 | % | | | 3,602 | | | | 39.1 | % | | | 4,280 | | | | 39.6 | % | | | 5,059 | | | | 39.9 | % |
| Conversion Valuation Appraisal Report | Page 22 |
Exhibit 7. Pro-forma As of September 2022
| Valuation Parameters | | | | | | |
| Prior Three Mos. Earning Base Annualized | | Y | | | | | |
| Period Ended September 30, 2022 | | | | $ | 944 | | (1) |
| Pre-Conversion Book Value | | B | | | | | |
| As of September 30, 2022 | | | | $ | 14,056 | | |
| Pre-Conversion Assets | | A | | | | | |
| As of September 30, 2022 | | | | $ | 152,883 | | |
| Return on Money | | R | | | 3.67 | % | (2) |
| Conversion Expenses | | | | $ | 1,545 | | |
| | | X | | | 14.37 | % | (3) |
| Proceeds Not Invested | | | | $ | 1,350 | | (4) |
| Estimated ESOP Borrowings | | | | $ | 900 | | |
| ESOP Purchases | | E | | | 8.00 | % | (5) |
| Cost of ESOP Borrowings | | | | $ | 60 | | (5) |
| Cost of ESOP Borrowings | | S | | | 0.00 | % | (5) |
| Amort of ESOP Borrowings | | T | | | 15 | | Years |
| Amort of MRP Amount | | N | | | 5 | | Years |
| Estimated MRP Amount | | | | $ | 450 | | (6) |
| MRP Purchases | | M | | | 4.00 | % | |
| MRP Expense | | | | $ | 90 | | |
| Stock Foundation Amount | | | | $ | 500 | | (7) |
| Stock Foundation Amount | | F | | | 4.65 | % | 0.00% |
| Foundation Opportunity Cost | | | | $ | 18 | | |
| Tax Benefit | | Z | | $ | 105 | | (8) |
| Tax Rate | | TAX | | | 21.00 | % | |
| Percentage Sold | | PCT | | | 100.00 | % | |
| Amount to be issued to Public | | | | $ | 10,750 | | (9) |
| Earnings Multiple | | | | | 12 | | |
(1) Net income for the twelve months ended September 30, 2022.
(2) Net Return assumes a reinvestment rate of 5.00 percent (the 1 year Treasury at September 30, 2022), and a tax rate of 21%.
(3) Conversion expenses reflect estimated expenses as presented in the offering document.
(4) Includes Stock from ESOP and MRP.
(5) Assumes ESOP is amortized straight line over 15 years.
(6) Assumes MRP is amortized straight line over 5 years.
(7) The Foundation is assumed to be 5% of the gross proceeds.
(8) The after-tax benefit of the Foundation is assumed to be 21% of Foundation.
(9) The amount to be offered to public.
| Pro Forma Calculation |
| | | | | | |
| Calculation of Estimated Value (V) at Midpoint Value | | | |
| | | | | | |
| 3. V= P/E*Y | | = | | $10,750,000 | |
| 1-P/E*PCT*((1-X-E-M-F)*R-(1-TAX)*E/T-(1-TAX)*M/N) | | | |
| | | | | | |
| 2. V= P/B*(B+Z) | | = | | $10,750,000 | |
| 1-P/B*PCT*(1-X-E-M-F) | | | | | |
| | | | | | |
| 1. V= P/A*A | | = | | $10,750,000 | |
| 1-P/A*PCT*(1-X-E-M-F) | | | | | |
The appraisal was performed on a market basis and not on the above formulas.
| | | | Total Shares | | | Price | | | Total | |
| Conclusion | | | Shares | | | Per Share | | | Value | |
| Appraised Value - Midpoint | | | | 1,075,000 | | | $ | 10.00 | | | $ | 10,750,000 | |
| | | | | | | | | | | | | | |
| Range: | | | | | | | | | | | | | |
| - Minimum | | | | 913,750 | | | $ | 10.00 | | | | 9,137,500 | |
| - Maximum | | | | 1,236,250 | | | | 10.00 | | | | 12,362,500 | |
| -Super Maximum | | | | 1,421,688 | | | | 10.00 | | | | 14,216,880 | |
| Conversion Valuation Appraisal Report | Page 23 |
| | | Pre Foundation | |
| | | Appraised Value | |
| Conclusion | | Minimum | | | Midpoint | | | Maximum | | | SuperMaximum * | |
| Total Shares | | | 913,750 | | | | 1,075,000 | | | | 1,236,250 | | | | 1,421,688 | |
| Price per Share | | $ | 10 | | | $ | 10 | | | $ | 10 | | | $ | 10 | |
| Full Conversion Value | | $ | 9,137,500 | | | $ | 10,750,000 | | | $ | 12,362,500 | | | $ | 14,216,880 | |
| Conversion Shares | | | 913,750 | | | | 1,075,000 | | | | 1,236,250 | | | | 1,421,688 | |
| Conversion Percent | | | 100.00 | % | | | 100.00 | % | | | 100.00 | % | | | 100.00 | % |
| Gross Proceeds | | $ | 9,137,500 | | | $ | 10,750,000 | | | $ | 12,362,500 | | | $ | 14,216,880 | |
* SuperMaximum is an overallotment option that is 15% above the maximum amount.
| | | | | Pro Forma Effect of Conversion Proceeds | |
| | | | | As of September 30, 2022 | |
| | | | | (Dollars in Thousands) | |
| Conversion Proceeds | | | | Minimum | | | Midpoint | | | Maximum | | | SuperMax | |
| Total Shares Offered | | | | | | 913,750 | | | | 1,075,000 | | | | 1,236,250 | | | | 1,421,688 | |
| Conversion Shares Offered | | | | | | 913,750 | | | | 1,075,000 | | | | 1,236,250 | | | | 1,421,688 | |
| Price Per Share | | | | | $ | 10 | | | $ | 10 | | | $ | 10 | | | $ | 10 | |
| Gross Proceeds | | | | | $ | 9,138 | | | $ | 10,750 | | | $ | 12,363 | | | $ | 14,217 | |
| Plus: Value issued to Foundation | | | (9) | | | 500 | | | | 500 | | | | 500 | | | | 500 | |
| Pro Forma Market Capitalization | | | | | | 9,638 | | | | 11,250 | | | | 12,863 | | | | 14,717 | |
| Gross Proceeds | | | | | | 9,138 | | | | 10,750 | | | | 12,363 | | | | 14,217 | |
| Less: Est. Conversion Expenses | | | | | | (1,545 | ) | | | (1,545 | ) | | | (1,545 | ) | | | (1,545 | ) |
| Net Proceeds | | | | | | 7,593 | | | | 9,205 | | | | 10,818 | | | | 12,672 | |
| Less: Cash issued to Foundation | | | | | | (100 | ) | | | (100 | ) | | | (100 | ) | | | (100 | ) |
| Less: ESOP Adjustment | | | (3) | | | (771 | ) | | | (900 | ) | | | (1,029 | ) | | | (1,177 | ) |
| Less: MRP Adjustment | | | (3) | | | (386 | ) | | | (450 | ) | | | (515 | ) | | | (589 | ) |
| Net Proceeds Reinvested | | | | | $ | 6,336 | | | $ | 7,755 | | | $ | 9,174 | | | $ | 10,806 | |
| Estimated Incremental Rate of Return | | | | | | 3.67 | % | | | 3.67 | % | | | 3.67 | % | | | 3.67 | % |
| Estimated Incremental Return | | | | | $ | 233 | | | $ | 285 | | | $ | 337 | | | $ | 397 | |
| Less: Cost of ESOP | | | (4) | | | - | | | | - | | | | - | | | | - | |
| Less: Amortization of ESOP | | | (7) | | | (41 | ) | | | (47 | ) | | | (54 | ) | | | (62 | ) |
| Less: Option Expense | | | (10) | | | (72 | ) | | | (84 | ) | | | (96 | ) | | | (109 | ) |
| Less: MRP Adjustment | | | (7) | | | (61 | ) | | | (71 | ) | | | (81 | ) | | | (93 | ) |
| Pro Forma Net Income | | | | | | 59 | | | | 83 | | | | 106 | | | | 133 | |
| Earnings Before Conversion | | | | | | 944 | | | | 944 | | | | 944 | | | | 944 | |
| Earnings Excluding Adjustment | | | | | | 1,003 | | | | 1,027 | | | | 1,050 | | | | 1,077 | |
| Earnings Adjustment | | | (6) | | | - | | | | - | | | | - | | | | - | |
| Earnings After Conversion | | | | | $ | 1,003 | | | $ | 1,027 | | | $ | 1,050 | | | $ | 1,077 | |
| Conversion Valuation Appraisal Report | Page 24 |
| | | | | Pro Forma Effect of Conversion Proceeds | |
| | | | | As of September 30, 2022 | |
| | | | | (Dollars in Thousands) | |
| | | | | Minimum | | | Midpoint | | | Maximum | | | SuperMax | |
| Pro Forma Equity | | | | | | | | | | | | | | |
| Equity at September 30, 2022 | | | | | $ | 14,056 | | | $ | 14,056 | | | $ | 14,056 | | | $ | 14,056 | |
| Net Conversion Proceeds | | | | | | 7,593 | | | | 9,205 | | | | 10,818 | | | | 12,672 | |
| Plus: Value issued to Foundation | | | | | | 500 | | | | 500 | | | | 500 | | | | 500 | |
| Less: After Tax Expense of Foundation | | | | | | (474 | ) | | | (474 | ) | | | (474 | ) | | | (474 | ) |
| Less: ESOP Adjustment | | | (1) | | | (771 | ) | | | (900 | ) | | | (1,029 | ) | | | (1,177 | ) |
| Less: MRP Adjustment | | | (2) | | | (386 | ) | | | (450 | ) | | | (515 | ) | | | (589 | ) |
| Pro Forma Equity | | | | | $ | 20,518 | | | $ | 21,937 | | | $ | 23,356 | | | $ | 24,988 | |
| Less: Intangible | | | (5) | | | - | | | | - | | | | - | | | | - | |
| Pro Forma Tangible Equity | | | | | $ | 20,518 | | | $ | 21,937 | | | $ | 23,356 | | | $ | 24,988 | |
| Pro Forma Assets | | | | | | | | | | | | | | | | | | | |
| Total Assets at September 30, 2022 | | | | | $ | 152,883 | | | $ | 152,883 | | | $ | 152,883 | | | $ | 152,883 | |
| Net Conversion Proceeds | | | | | | 7,593 | | | | 9,205 | | | | 10,818 | | | | 12,672 | |
| Plus: Value issued to Foundation | | | | | | 500 | | | | 500 | | | | 500 | | | | 500 | |
| Less: After Tax Expense of Foundation | | | | | | (474 | ) | | | (474 | ) | | | (474 | ) | | | (474 | ) |
| Less: ESOP Adjustment | | | (1) | | | (771 | ) | | | (900 | ) | | | (1,029 | ) | | | (1,177 | ) |
| Less: MRP Adjustment | | | (2) | | | (386 | ) | | | (450 | ) | | | (515 | ) | | | (589 | ) |
| Pro-forma Total Assets | | | | | | 159,345 | | | | 160,764 | | | | 162,183 | | | | 163,815 | |
| Stockholder's Equity Per Share * | | | | | | | | | | | | | | | | | | | |
| Equity at September 30, 2022 | | | | | $ | 14.58 | | | $ | 12.49 | | | $ | 10.93 | | | $ | 9.55 | |
| Estimated Net Proceeds | | | | | | 7.88 | | | | 8.18 | | | | 8.41 | | | | 8.61 | |
| Plus: Value issued to Foundation | | | | | | 0.52 | | | | 0.44 | | | | 0.39 | | | | 0.34 | |
| Less: After Tax Expense of Foundation | | | | | | (0.49 | ) | | | (0.42 | ) | | | (0.37 | ) | | | (0.32 | ) |
| Less: ESOP Stock | | | | | | (0.80 | ) | | | (0.80 | ) | | | (0.80 | ) | | | (0.80 | ) |
| Less: MRP Stock | | | | | | (0.40 | ) | | | (0.40 | ) | | | (0.40 | ) | | | (0.40 | ) |
| Pro Forma Equity Per Share * | | | | | | 21.29 | | | | 19.50 | | | | 18.16 | | | | 16.98 | |
| Less: Intangible | | | | | | - | | | | - | | | | - | | | | - | |
| Pro Forma Tangible Equity Per Share * | | | | | $ | 21.29 | | | $ | 19.50 | | | $ | 18.16 | | | $ | 16.98 | |
| | | | | Pro Forma Effect of Conversion Proceeds | |
| | | | | As of September 30, 2022 | |
| | | | | (Dollars in Thousands) | |
| | | | | Minimum | | | Midpoint | | | Maximum | | | SuperMax | |
| Net Earnings Per Share * | | | | | | | | | | | | | | |
| Historical Earnings Per Share | | | (8) | | $ | 1.06 | | | $ | 0.91 | | | $ | 0.79 | | | $ | 0.69 | |
| Incremental return Per Share | | | (8) | | | 0.26 | | | | 0.27 | | | | 0.28 | | | | 0.29 | |
| ESOP Adjustment Per Share | | | (8) | | | (0.05 | ) | | | (0.05 | ) | | | (0.05 | ) | | | (0.05 | ) |
| Option Expense Per Share | | | (10) | | | (0.08 | ) | | | (0.08 | ) | | | (0.08 | ) | | | (0.08 | ) |
| MRP Adjustment Per Share | | | (8) | | | (0.07 | ) | | | (0.07 | ) | | | (0.07 | ) | | | (0.07 | ) |
| Normalizing Adjustment Per Share | | | | | | - | | | | - | | | | - | | | | - | |
| Pro Forma Earnings Per Share * | | | (8) | | $ | 1.12 | | | $ | 0.99 | | | $ | 0.88 | | | $ | 0.79 | |
| | | | | | | | | | | | | | | | | | | | |
| Shares Utilized for EPS | | | | | | 891,790 | | | | 1,041,000 | | | | 1,190,210 | | | | 1,361,802 | |
| Pro Forma Ratios | | | | | | | | | | | | | | | | | | | |
| Price/EPS without Adjustment | | | | | | 8.93 | | | | 10.10 | | | | 11.36 | | | | 12.66 | |
| Price/EPS with Adjustment | | | | | | 8.93 | | | | 10.10 | | | | 11.36 | | | | 12.66 | |
| Price/Book Value per Share | | | | | | 46.97 | % | | | 51.28 | % | | | 55.07 | % | | | 58.89 | % |
| Price/Tangible Book Value | | | | | | 46.97 | % | | | 51.28 | % | | | 55.07 | % | | | 58.89 | % |
| Market Value/Assets | | | | | | 6.05 | % | | | 7.00 | % | | | 7.93 | % | | | 8.98 | % |
* The totals for the per share data are actual figures rounded to two decimals. The component parts may not add to the total due to rounding.
(1) ESOP Borrowings are deducted from net worth and assets, and amortized over 15 years.
(2) MRP Borrowings are omitted from net worth and assets, and amortized over 5 years.
(3) Consists of ESOP and MRP amortization.
(4) The ESOP loan is from the Holding Company and therefore, there are no costs.
(5) Not applicable.
(6) Not applicable.
(7) ESOP and MRP are amortized over 15 and 5 years respectively, and tax impacted at 21%.
(8) All EPS computations are done in accordance with SOP 93-6.
(9) The Foundation is assumed to be 5% of the gross proceeds.
(10) Assumed option expense in accordance with SFAS No. 123.