Eaton Vance Floating-Rate Opportunities Fund
Filed: 25 Jan 24, 4:25pm
UNITED STATES
SECURITIES AND EXCHANGE COMMISSION
Washington, D.C. 20549
Form N-CSR
CERTIFIED SHAREHOLDER REPORT OF REGISTERED
MANAGEMENT INVESTMENT COMPANIES
Investment Company Act File Number: 811-23855
Eaton Vance Floating-Rate Opportunities Fund
(Exact Name of Registrant as Specified in Charter)
Two International Place, Boston, Massachusetts 02110
(Address of Principal Executive Offices)
Deidre E. Walsh
Two International Place, Boston, Massachusetts 02110
(Name and Address of Agent for Services)
(617) 482-8260
(Registrant’s Telephone Number)
May 31
Date of Fiscal Year End
November 30, 2023
Date of Reporting Period
| Item 1. | Reports to Stockholders |


| % Cumulative Total Returns1,2 | Class Inception Date | Performance Inception Date | One Year | Five Years | Since Inception |
| Class I at NAV | 09/29/2023 | 09/29/2023 | —% | —% | 1.86% |
| Morningstar® LSTA® US Leveraged Loan IndexSM | — | — | —% | —% | 1.23% |
| Top 10 Issuers (% of total investments)1 | |
| Carlyle Global Market Strategies CLO, Ltd. | 5.9% |
| Benefit Street Partners CLO XXXII, Ltd. | 5.9 |
| Octagon 68, Ltd. | 5.8 |
| Elmwood CLO XI, Ltd. | 4.7 |
| OCP Aegis CLO, Ltd. | 3.8 |
| Basswood Park CLO, Ltd. | 3.7 |
| TCW CLO, Ltd. | 3.7 |
| Crown City CLO I | 3.5 |
| Jamestown CLO XV, Ltd. | 2.5 |
| GoldenTree Loan Opportunities XII, Ltd. | 2.3 |
| Total | 41.8% |
| Top 10 Industries (% of total investments)1 | |
| Software | 8.0% |
| Hotels, Restaurants & Leisure | 5.0 |
| Insurance | 3.4 |
| Chemicals | 3.3 |
| Auto Components | 3.0 |
| Professional Services | 2.6 |
| Machinery | 2.3 |
| Aerospace and Defense | 1.9 |
| Road & Rail | 1.9 |
| Gas Utilities | 1.5 |
| Total | 32.9% |
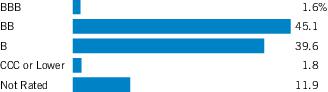
| Credit Quality (% of total investments)1,2 |
| 1 | Excludes cash and cash equivalents. |
| 2 | Credit ratings are categorized using S&P Global Ratings (“S&P”). Ratings, which are subject to change, apply to the creditworthiness of the issuers of the underlying securities and not to the Fund or its shares. Credit ratings measure the quality of a bond based on the issuer’s creditworthiness, with ratings ranging from AAA, being the highest, to D, being the lowest based on S&P’s measures. Ratings of BBB or higher by S&P are considered to be investment-grade quality. Credit ratings are based largely on the ratings agency’s analysis at the time of rating. The rating assigned to any particular security is not necessarily a reflection of the issuer’s current financial condition and does not necessarily reflect its assessment of the volatility of a security’s market value or of the liquidity of an investment in the security. Holdings designated as “Not Rated” (if any) are not rated by S&P. |
| 1 | Morningstar® LSTA® US Leveraged Loan IndexSM is an unmanaged index of the institutional leveraged loan market. Morningstar® LSTA® Leveraged Loan indices are a product of Morningstar, Inc. (“Morningstar”) and have been licensed for use. Morningstar® is a registered trademark of Morningstar licensed for certain use. Loan Syndications and Trading Association® and LSTA® are trademarks of the LSTA licensed for certain use by Morningstar, and further sublicensed by Morningstar for certain use. Neither Morningstar nor LSTA guarantees the accuracy and/or completeness of the Morningstar® LSTA® US Leveraged Loan IndexSM or any data included therein, and shall have no liability for any errors, omissions, or interruptions therein. Unless otherwise stated, index returns do not reflect the effect of any applicable sales charges, commissions, expenses, taxes or leverage, as applicable. It is not possible to invest directly in an index. |
| 2 | Unless otherwise stated, performance does not reflect the deduction of taxes on Fund distributions or redemptions of Fund shares. Performance since inception for an index, if presented, is the performance since the Fund’s or oldest share class’s inception, as applicable. |
| Fund profile subject to change due to active management. |
| Asset-Backed Securities — 46.3% |
| Security | Principal Amount (000's omitted) | Value | |
| Basswood Park CLO, Ltd., Series 2021-1A, Class E, 11.827%, (3 mo. SOFR + 6.412%), 4/20/34(1)(2) | $ | 2,000 | $ 1,916,182 |
| Benefit Street Partners CLO XXXII, Ltd., Series 2023-32A, Class E, 12.715%, (3 mo. SOFR + 7.35%), 10/25/36(1)(2) | 3,000 | 3,027,876 | |
| Canyon Capital CLO, Ltd., Series 2019-1A, Class ER, 12.806%, (3 mo. SOFR + 7.412%), 4/15/32(1)(2) | 1,000 | 968,487 | |
| Carlyle Global Market Strategies CLO, Ltd., Series 2022-6A, Class ER, 13.278%, (3 mo. SOFR + 7.90%), 10/25/36(1)(2) | 3,000 | 3,029,193 | |
| Crown City CLO I, Series 2020-1A, Class DR, 12.677%, (3 mo. SOFR + 7.262%), 7/20/34(1)(2) | 2,000 | 1,809,282 | |
| Elmwood CLO XI, Ltd., Series 2021-4A, Class E, 11.677%, (3 mo. SOFR + 6.262%), 10/20/34(1)(2) | 2,500 | 2,439,222 | |
| GoldenTree Loan Opportunities XII, Ltd., Series 2016-12A, Class ER, 11.074%, (3 mo. SOFR + 5.662%), 7/21/30(1)(2) | 1,250 | 1,196,823 | |
| Golub Capital Partners CLO 53B, Ltd., Series 2021-53A, Class E, 12.377%, (3 mo. SOFR + 6.962%), 7/20/34(1)(2) | 1,070 | 1,022,227 | |
| Jamestown CLO XV, Ltd., Series 2020-15A, Class E, 12.656%, (3 mo. SOFR + 7.262%), 4/15/33(1)(2) | 1,310 | 1,291,145 | |
| OCP Aegis CLO, Ltd., Series 2023-29A, Class E, (3 mo. SOFR + 7.72%), 1/20/35(1)(3) | 2,000 | 1,950,000 | |
| Octagon 68, Ltd., Series 2023-1A, Class E, 12.591%, (3 mo. SOFR + 7.24%), 10/20/36(1)(2) | 3,000 | 3,002,937 | |
| TCW CLO, Ltd., Series 2019-2A, Class ER, 12.066%, (3 mo. SOFR + 6.65%), 10/20/32(1)(2) | 2,000 | 1,886,686 | |
| Total Asset-Backed Securities (identified cost $23,067,857) | $23,540,060 | ||
| Senior Floating-Rate Loans — 47.8%(4) |
| Borrower/Description | Principal Amount (000's omitted) | Value | |
| Aerospace and Defense — 2.0% | |||
| TransDigm, Inc., Term Loan, 8.64%, (SOFR + 3.25%), 8/24/28 | $ | 997 | $ 999,077 |
| $ 999,077 | |||
| Auto Components — 2.9% | |||
| Autokiniton US Holdings, Inc., Term Loan, 9.963%, (SOFR + 4.50%), 4/6/28 | $ | 748 | $ 750,035 |
| Clarios Global, L.P., Term Loan, 9.098%, (SOFR + 3.75%), 5/6/30 | 750 | 752,062 | |
| $ 1,502,097 | |||
| Borrower/Description | Principal Amount (000's omitted) | Value | |
| Automobiles — 1.0% | |||
| MajorDrive Holdings IV, LLC, Term Loan, 6/1/29(5) | $ | 500 | $ 497,500 |
| $ 497,500 | |||
| Beverages — 1.0% | |||
| Triton Water Holdings, Inc., Term Loan, 8.902%, (SOFR + 3.25%), 3/31/28 | $ | 499 | $ 491,127 |
| $ 491,127 | |||
| Capital Markets — 1.0% | |||
| Focus Financial Partners, LLC, Term Loan, 8.598%, (SOFR + 3.25%), 6/30/28 | $ | 499 | $ 499,364 |
| $ 499,364 | |||
| Chemicals — 3.3% | |||
| Charter NEX US, Inc., Term Loan, 9.213%, (SOFR + 3.75%), 12/1/27 | $ | 499 | $ 497,338 |
| INEOS US Finance, LLC, Term Loan, 9.198%, (SOFR + 3.75%), 11/8/27 | 748 | 748,120 | |
| Rohm Holding GmbH, Term Loan, 10.881%, (SOFR + 5.00%), 7/31/26 | 499 | 447,584 | |
| $ 1,693,042 | |||
| Consumer Staples Distribution & Retail — 1.0% | |||
| Cardenas Markets, Inc., Term Loan, 12.24%, (SOFR + 6.75%), 8/1/29 | $ | 499 | $ 499,468 |
| $ 499,468 | |||
| Containers & Packaging — 1.5% | |||
| Clydesdale Acquisition Holdings, Inc., Term Loan, 9.623%, (SOFR + 4.18%), 4/13/29 | $ | 748 | $ 743,106 |
| $ 743,106 | |||
| Diversified Consumer Services — 1.0% | |||
| Sotheby's, Term Loan, 10.156%, (SOFR + 4.50%), 1/15/27 | $ | 499 | $ 487,035 |
| $ 487,035 | |||
| Electronic Equipment, Instruments & Components — 0.9% | |||
| Creation Technologies, Inc., Term Loan, 11.176%, (SOFR + 5.50%), 10/5/28 | $ | 499 | $ 476,291 |
| $ 476,291 | |||
| Borrower/Description | Principal Amount (000's omitted) | Value | |
| Engineering & Construction — 1.0% | |||
| Aegion Corporation, Term Loan, 10.395%, (SOFR + 4.75%), 5/17/28 | $ | 499 | $ 494,719 |
| $ 494,719 | |||
| Gas Utilities — 1.5% | |||
| CQP Holdco, L.P., Term Loan, 8.99%, (SOFR + 3.50%), 6/5/28 | $ | 748 | $ 750,471 |
| $ 750,471 | |||
| Health Care Equipment & Supplies — 0.9% | |||
| Journey Personal Care Corp., Term Loan, 3/1/28(5) | $ | 500 | $ 483,750 |
| $ 483,750 | |||
| Health Care Technology — 0.9% | |||
| Symplr Software, Inc., Term Loan, 9.983%, (SOFR + 4.50%), 12/22/27 | $ | 499 | $ 435,010 |
| $ 435,010 | |||
| Hotels, Restaurants & Leisure — 5.0% | |||
| Carnival Corporation, Term Loan, 8.713%, (SOFR + 3.25%), 10/18/28 | $ | 997 | $ 994,137 |
| Ontario Gaming GTA L.P., Term Loan, 9.64%, (SOFR + 4.25%), 8/1/30 | 500 | 501,641 | |
| Playa Resorts Holding B.V., Term Loan, 9.58%, (SOFR + 4.25%), 1/5/29 | 748 | 749,852 | |
| Stars Group Holdings B.V. (The), Term Loan, 8.902%, (SOFR + 3.25%), 7/22/28 | 314 | 314,820 | |
| $ 2,560,450 | |||
| Insurance — 3.4% | |||
| AssuredPartners, Inc., Term Loan, 8.963%, (SOFR + 3.50%), 2/12/27 | $ | 748 | $ 748,324 |
| USI, Inc., Term Loan, 9.14%, (SOFR + 3.75%), 11/22/29 | 997 | 999,585 | |
| $ 1,747,909 | |||
| IT Services — 1.4% | |||
| Asurion, LLC, Term Loan, 9.698%, (SOFR + 4.25%), 8/19/28 | $ | 748 | $ 736,899 |
| $ 736,899 | |||
| Machinery — 2.4% | |||
| Conair Holdings, LLC, Term Loan, 9.213%, (SOFR + 3.75%), 5/17/28 | $ | 499 | $ 478,934 |
| Borrower/Description | Principal Amount (000's omitted) | Value | |
| Machinery (continued) | |||
| Engineered Machinery Holdings, Inc., Term Loan, 9.152%, (SOFR + 3.50%), 5/19/28 | $ | 748 | $ 727,057 |
| $ 1,205,991 | |||
| Metals/Mining — 0.9% | |||
| PMHC II, Inc., Term Loan, 9.807%, (SOFR + 4.25%), 4/23/29 | $ | 499 | $ 447,464 |
| $ 447,464 | |||
| Professional Services — 2.6% | |||
| CoreLogic, Inc., Term Loan, 8.963%, (SOFR + 3.50%), 6/2/28 | $ | 499 | $ 470,394 |
| Employbridge Holding Company, Term Loan, 10.407%, (SOFR + 4.75%), 7/19/28 | 499 | 409,112 | |
| Neptune Bidco US, Inc., Term Loan, 10.507%, (SOFR + 5.00%), 4/11/29 | 499 | 448,352 | |
| $ 1,327,858 | |||
| Real Estate Management & Development — 1.0% | |||
| Greystar Real Estate Partners, LLC, Term Loan, 9.147%, (SOFR + 3.75%), 8/21/30 | $ | 500 | $ 501,250 |
| $ 501,250 | |||
| Road & Rail — 1.9% | |||
| Hertz Corporation (The): | |||
| Term Loan, 8.713%, (SOFR + 3.25%), 6/30/28 | $ | 837 | $ 827,681 |
| Term Loan, 8.713%, (SOFR + 3.25%), 6/30/28 | 161 | 159,577 | |
| $ 987,258 | |||
| Software — 8.3% | |||
| Central Parent, Inc., Term Loan, 9.406%, (SOFR + 4.00%), 7/6/29 | $ | 1,000 | $ 1,001,797 |
| CentralSquare Technologies, LLC, Term Loan, 9.29%, (SOFR + 3.75%), 8/29/25 | 499 | 475,237 | |
| Cloud Software Group, Inc., Term Loan, 9.99%, (SOFR + 4.50%), 3/30/29 | 499 | 478,794 | |
| Fiserv Investment Solutions, Inc., Term Loan, 9.372%, (SOFR + 4.00%), 2/18/27 | 499 | 473,776 | |
| Sabre GLBL, Inc., Term Loan, 10.448%, (SOFR + 5.00%), 6/30/28 | 500 | 430,625 | |
| Skillsoft Corporation, Term Loan, 10.694%, (SOFR + 5.25%), 7/14/28 | 499 | 465,001 | |
| Borrower/Description | Principal Amount (000's omitted) | Value | |
| Software (continued) | |||
| Veritas US, Inc., Term Loan, 10.463%, (SOFR + 5.00%), 9/1/25 | $ | 499 | $ 393,987 |
| Vision Solutions, Inc., Term Loan, 9.64%, (SOFR + 4.00%), 4/24/28 | 499 | 488,650 | |
| $ 4,207,867 | |||
| Specialty Retail — 1.0% | |||
| Mattress Firm, Inc., Term Loan, 9.95%, (6 mo. USD LIBOR + 4.25%), 9/25/28 | $ | 499 | $ 496,187 |
| $ 496,187 | |||
| Total Senior Floating-Rate Loans (identified cost $24,475,211) | $24,271,190 | ||
| Short-Term Investments — 7.6% |
| Security | Shares | Value | |
| Morgan Stanley Institutional Liquidity Funds - Government Portfolio, Institutional Class, 5.26%(6) | 3,878,550 | $ 3,878,550 | |
| Total Short-Term Investments (identified cost $3,878,550) | $ 3,878,550 | ||
| Total Investments — 101.7% (identified cost $51,421,618) | $51,689,800 | ||
| Other Assets, Less Liabilities — (1.7)% | $ (851,453) | ||
| Net Assets — 100.0% | $50,838,347 | ||
| The percentage shown for each investment category in the Portfolio of Investments is based on net assets. | |
| (1) | Security exempt from registration under Rule 144A of the Securities Act of 1933, as amended. These securities may be sold in certain transactions in reliance on an exemption from registration (normally to qualified institutional buyers). At November 30, 2023, the aggregate value of these securities is $23,540,060 or 46.3% of the Fund's net assets. |
| (2) | Variable rate security. The stated interest rate represents the rate in effect at November 30, 2023. |
| (3) | When-issued, variable rate security whose interest rate will be determined after November 30, 2023 |
| (4) | Senior floating-rate loans (Senior Loans) often require prepayments from excess cash flows or permit the borrowers to repay at their election. The degree to which borrowers repay, whether as a contractual requirement or at their election, cannot be predicted with accuracy. As a result, the actual remaining maturity may be substantially less than the stated maturities shown. However, Senior Loans will typically have an expected average life of approximately two to four years. Senior Loans typically have rates of interest which are redetermined periodically by reference to a base lending rate, plus a spread. These base lending rates are primarily the Secured Overnight Financing Rate (“SOFR”) (or the London Interbank Offered Rate (“LIBOR”) for those loans whose rates reset prior to the discontinuance of LIBOR on June 30, 2023) and secondarily, the prime rate offered by one or more major United States banks (the “Prime Rate”). Base lending rates may be subject to a floor, or minimum rate. Rates for SOFR are generally 1 or 3-month tenors and may also be subject to a credit spread adjustment. Senior Loans are generally subject to contractual restrictions that must be satisfied before they can be bought or sold. |
| (5) | This Senior Loan will settle after November 30, 2023, at which time the interest rate will be determined. |
| (6) | May be deemed to be an affiliated investment company. The rate shown is the annualized seven-day yield as of November 30, 2023. |
| Abbreviations: | |
| LIBOR | – London Interbank Offered Rate |
| SOFR | – Secured Overnight Financing Rate |
| Currency Abbreviations: | |
| USD | – United States Dollar |
| November 30, 2023 | |
| Assets | |
| Unaffiliated investments, at value (identified cost $47,543,068) | $ 47,811,250 |
| Affiliated investments, at value (identified cost $3,878,550) | 3,878,550 |
| Cash | 1,006,328 |
| Interest receivable | 401,809 |
| Dividends receivable from affiliated investments | 42,917 |
| Receivable from affiliates | 85,026 |
| Deferred offering costs | 681,133 |
| Prepaid expenses | 100,000 |
| Total assets | $54,007,013 |
| Liabilities | |
| Payable for investments purchased | $ 972,500 |
| Payable for when-issued securities | 1,960,000 |
| Payable to affiliates: | |
| Investment adviser and administration fee | 39,803 |
| Trustees' fees | 1,518 |
| Accrued expenses | 194,845 |
| Total liabilities | $ 3,168,666 |
| Net Assets | $50,838,347 |
| Sources of Net Assets | |
| Paid-in capital | $ 50,574,215 |
| Distributable earnings | 264,132 |
| Net Assets | $50,838,347 |
| Class I Shares | |
| Net Assets | $ 50,838,347 |
| Shares Outstanding | 5,057,383 |
| Net Asset Value, Offering Price and Redemption Price Per Share (net assets ÷ shares of beneficial interest outstanding) | $ 10.05 |
| Period Ended | |
| November 30, 2023(1) | |
| Investment Income | |
| Dividend income from affiliated investments | $ 185,663 |
| Interest income | 581,891 |
| Total investment income | $767,554 |
| Expenses | |
| Investment adviser and administration fee | $ 81,944 |
| Trustees’ fees and expenses | 1,518 |
| Custodian fee | 5,400 |
| Transfer and dividend disbursing agent fees | 5,940 |
| Legal and accounting services | 25,260 |
| Printing and postage | 3,060 |
| Amortization of deferred offering costs | 141,660 |
| Registration fees | 1,200 |
| Miscellaneous | 5,079 |
| Total expenses | $271,061 |
| Deduct: | |
| Waiver and/or reimbursement of expenses by affiliates | $ 173,507 |
| Total expense reductions | $173,507 |
| Net expenses | $ 97,554 |
| Net investment income | $670,000 |
| Realized and Unrealized Gain (Loss) | |
| Net realized gain (loss): | |
| Investment transactions | $ 165 |
| Net realized gain | $ 165 |
| Change in unrealized appreciation (depreciation): | |
| Investments | $ 268,182 |
| Net change in unrealized appreciation (depreciation) | $268,182 |
| Net realized and unrealized gain | $268,347 |
| Net increase in net assets from operations | $938,347 |
| (1) | For the period from the commencement of operations, September 29, 2023, to November 30, 2023. |
| Period Ended November 30, 2023(1) | |
| Increase (Decrease) in Net Assets | |
| From operations: | |
| Net investment income | $ 670,000 |
| Net realized gain | 165 |
| Net change in unrealized appreciation (depreciation) | 268,182 |
| Net increase in net assets from operations | $ 938,347 |
| Distributions to shareholders: | |
| Class I | $ (674,215) |
| Total distributions to shareholders | $ (674,215) |
| Transactions in shares of beneficial interest: | |
| Class I | $ 50,574,215 |
| Net increase in net assets from Fund share transactions | $50,574,215 |
| Net increase in net assets | $50,838,347 |
| Net Assets | |
| At beginning of period | $ — |
| At end of period | $50,838,347 |
| (1) | For the period from the commencement of operations, September 29, 2023, to November 30, 2023. |
| Class I | |
| Period Ended November 30, 2023(1) (Unaudited) | |
| Net asset value — Beginning of period | $ 10.000 |
| Income (Loss) From Operations | |
| Net investment income(2) | $ 0.134 |
| Net realized and unrealized gain | 0.051 |
| Total income from operations | $ 0.185 |
| Less Distributions | |
| From net investment income | $ (0.135) |
| Total distributions | $ (0.135) |
| Net asset value — End of period | $10.050 |
| Total Return(3) | 1.86% (4) |
| Ratios/Supplemental Data | |
| Net assets, end of period (000’s omitted) | $ 50,838 |
| Ratios (as a percentage of average daily net assets): | |
| Expenses | 1.15% (5)(6)(7) |
| Net investment income | 7.78% (6) |
| Portfolio Turnover | 2% (4) |
| (1) | For the period from the commencement of operations, September 29, 2023, to November 30, 2023. |
| (2) | Computed using average shares outstanding. |
| (3) | Returns are historical and are calculated by determining the percentage change in net asset value with all distributions reinvested and do not reflect the effect of sales charges, if any. |
| (4) | Not annualized. |
| (5) | Includes a reduction by the investment adviser of a portion of its adviser and administration fee due to the Fund’s investment in the Liquidity Fund (equal to 0.05% of average daily net assets for the period ended November 30, 2023). |
| (6) | Annualized. |
| (7) | The investment adviser reimbursed certain operating expenses (equal to 2.02% of average daily net assets for the period ended November 30, 2023). Absent this reimbursement, total return would be lower. |
| Aggregate cost | $51,426,313 |
| Gross unrealized appreciation | $ 523,698 |
| Gross unrealized depreciation | (260,211) |
| Net unrealized appreciation | $ 263,487 |
| Average Daily Managed Assets | Annual Fee Rate |
| Up to $500 million | 1.000% |
| $500 million but less than $1 billion | 0.950% |
| $1 billion but less than $2.5 billion | 0.925% |
| $2.5 billion but less than $5 billion | 0.900% |
| $5 billion and over | 0.880% |
| Period Ended November 30, 2023 | ||
| Shares | Amount | |
| Class I | ||
| Sales | 4,990,000 | $ 49,900,000 |
| Issued to shareholders electing to receive payments of distributions in Fund shares | 67,383 | 674,215 |
| Net increase | 5,057,383 | $50,574,215 |
| Name | Value, beginning of period | Purchases | Sales proceeds | Net realized gain (loss) | Change in unrealized appreciation (depreciation) | Value, end of period | Dividend income | Shares, end of period |
| Short-Term Investments | ||||||||
| Liquidity Fund | $ — | $52,680,833 | $(48,802,283) | $ — | $ — | $3,878,550 | $185,663 | 3,878,550 |
| • | Level 1 – quoted prices in active markets for identical investments |
| • | Level 2 – other significant observable inputs (including quoted prices for similar investments, interest rates, prepayment speeds, credit risk, etc.) |
| • | Level 3 – significant unobservable inputs (including a fund's own assumptions in determining the fair value of investments) |
| Asset Description | Level 1 | Level 2 | Level 3 | Total |
| Asset-Backed Securities | $ — | $ 23,540,060 | $ — | $ 23,540,060 |
| Senior Floating-Rate Loans | — | 24,271,190 | — | 24,271,190 |
| Short-Term Investments | 3,878,550 | — | — | 3,878,550 |
| Total Investments | $ 3,878,550 | $ 47,811,250 | $ — | $51,689,800 |
| Officers | |
| Kenneth A. Topping President | Nicholas S. Di Lorenzo Secretary |
| Deidre E. Walsh Vice President and Chief Legal Officer | Laura T. Donovan Chief Compliance Officer |
| James F. Kirchner Treasurer | |
| Trustees |
| George J. Gorman Chairperson | |
| Alan C. Bowser | |
| Mark R. Fetting | |
| Cynthia E. Frost | |
| Valerie A. Mosley | |
| Anchal Pachnanda* |
| Keith Quinton | |
| Marcus L. Smith | |
| Susan J. Sutherland | |
| Scott E. Wennerholm | |
| Nancy A. Wiser |
| * | Interested Trustee |
| Privacy Notice | April 2021 |
| FACTS | WHAT DOES EATON VANCE DO WITH YOUR PERSONAL INFORMATION? |
| Why? | Financial companies choose how they share your personal information. Federal law gives consumers the right to limit some but not all sharing. Federal law also requires us to tell you how we collect, share, and protect your personal information. Please read this notice carefully to understand what we do. |
| What? | The types of personal information we collect and share depend on the product or service you have with us. This information can include:■ Social Security number and income ■ investment experience and risk tolerance ■ checking account number and wire transfer instructions |
| How? | All financial companies need to share customers’ personal information to run their everyday business. In the section below, we list the reasons financial companies can share their customers’ personal information; the reasons Eaton Vance chooses to share; and whether you can limit this sharing. |
| Reasons we can share your personal information | Does Eaton Vance share? | Can you limit this sharing? |
| For our everyday business purposes — such as to process your transactions, maintain your account(s), respond to court orders and legal investigations, or report to credit bureaus | Yes | No |
| For our marketing purposes — to offer our products and services to you | Yes | No |
| For joint marketing with other financial companies | No | We don’t share |
| For our investment management affiliates’ everyday business purposes — information about your transactions, experiences, and creditworthiness | Yes | Yes |
| For our affiliates’ everyday business purposes — information about your transactions and experiences | Yes | No |
| For our affiliates’ everyday business purposes — information about your creditworthiness | No | We don’t share |
| For our investment management affiliates to market to you | Yes | Yes |
| For our affiliates to market to you | No | We don’t share |
| For nonaffiliates to market to you | No | We don’t share |
| To limit our sharing | Call toll-free 1-800-262-1122 or email: EVPrivacy@eatonvance.comPlease note:If you are a new customer, we can begin sharing your information 30 days from the date we sent this notice. When you are no longer our customer, we continue to share your information as described in this notice. However, you can contact us at any time to limit our sharing. |
| Questions? | Call toll-free 1-800-262-1122 or email: EVPrivacy@eatonvance.com |
| Privacy Notice — continued | April 2021 |
| Who we are | |
| Who is providing this notice? | Eaton Vance Management, Eaton Vance Distributors, Inc., Eaton Vance Trust Company, Eaton Vance Management (International) Limited, Eaton Vance Advisers International Ltd., Eaton Vance Global Advisors Limited, Eaton Vance Management’s Real Estate Investment Group, Boston Management and Research, Calvert Research and Management, Eaton Vance and Calvert Fund Families and our investment advisory affiliates (“Eaton Vance”) (see Investment Management Affiliates definition below) |
| What we do | |
| How does Eaton Vance protect my personal information? | To protect your personal information from unauthorized access and use, we use security measures that comply with federal law. These measures include computer safeguards and secured files and buildings. We have policies governing the proper handling of customer information by personnel and requiring third parties that provide support to adhere to appropriate security standards with respect to such information. |
| How does Eaton Vance collect my personal information? | We collect your personal information, for example, when you■ open an account or make deposits or withdrawals from your account ■ buy securities from us or make a wire transfer ■ give us your contact informationWe also collect your personal information from others, such as credit bureaus, affiliates, or other companies. |
| Why can’t I limit all sharing? | Federal law gives you the right to limit only■ sharing for affiliates’ everyday business purposes — information about your creditworthiness ■ affiliates from using your information to market to you ■ sharing for nonaffiliates to market to youState laws and individual companies may give you additional rights to limit sharing. See below for more on your rights under state law. |
| Definitions | |
| Investment Management Affiliates | Eaton Vance Investment Management Affiliates include registered investment advisers, registered broker- dealers, and registered and unregistered funds. Investment Management Affiliates does not include entities associated with Morgan Stanley Wealth Management, such as Morgan Stanley Smith Barney LLC and Morgan Stanley & Co. |
| Affiliates | Companies related by common ownership or control. They can be financial and nonfinancial companies.■ Our affiliates include companies with a Morgan Stanley name and financial companies such as Morgan Stanley Smith Barney LLC and Morgan Stanley & Co. |
| Nonaffiliates | Companies not related by common ownership or control. They can be financial and nonfinancial companies.■ Eaton Vance does not share with nonaffiliates so they can market to you. |
| Joint marketing | A formal agreement between nonaffiliated financial companies that together market financial products or services to you.■ Eaton Vance doesn’t jointly market. |
| Other important information | |
| Vermont: Except as permitted by law, we will not share personal information we collect about Vermont residents with Nonaffiliates unless you provide us with your written consent to share such information.California: Except as permitted by law, we will not share personal information we collect about California residents with Nonaffiliates and we will limit sharing such personal information with our Affiliates to comply with California privacy laws that apply to us. | |
| Item 2. | Code of Ethics |
Not required in this filing.
| Item 3. | Audit Committee Financial Expert |
Not required in this filing.
| Item 4. | Principal Accountant Fees and Services |
Not required in this filing.
| Item 5. | Audit Committee of Listed Registrants |
Not required in this filing.
| Item 6. | Schedule of Investments |
Please see schedule of investments contained in the Report to Stockholders included under Item 1 of this Form N-CSR.
| Item 7. | Disclosure of Proxy Voting Policies and Procedures for Closed-End Management Investment Companies |
Not required in this filing.
| Item 8. | Portfolio Managers of Closed-End Management Investment Companies |
Not required in this filing.
| Item 9. | Purchases of Equity Securities by Closed-End Management Investment Company and Affiliated Purchasers |
Not applicable.
| Item 10. | Submission of Matters to a Vote of Security Holders |
No material changes.
| Item 11. | Controls and Procedures |
(a) It is the conclusion of the registrant’s principal executive officer and principal financial officer that the effectiveness of the registrant’s current disclosure controls and procedures (such disclosure controls and procedures having been evaluated within 90 days of the date of this filing) provide reasonable assurance that the information required to be disclosed by the registrant has been recorded, processed, summarized and reported within the time period specified in the Commission’s rules and forms and that the information required to be disclosed by the registrant has been accumulated and communicated to the registrant’s principal executive officer and principal financial officer in order to allow timely decisions regarding required disclosure.
(b) There have been no changes in the registrant’s internal controls over financial reporting during the period covered by this report that has materially affected, or is reasonably likely to materially affect, the registrant’s internal control over financial reporting.
| Item 12. | Disclosure of Securities Lending Activities for Closed-End Management Investment Companies |
No activity to report for the registrant’s most recent fiscal year end.
| Item 13. | Exhibits |
(a)(1) | Registrant’s Code of Ethics – Not applicable (please see Item 2). | |
(a)(2)(i) | Treasurer’s Section 302 certification. | |
(a)(2)(ii) | President’s Section 302 certification. | |
(b) | Combined Section 906 certification. | |
Signatures
Pursuant to the requirements of the Securities Exchange Act of 1934 and the Investment Company Act of 1940, the registrant has duly caused this report to be signed on its behalf by the undersigned, thereunto duly authorized.
| Eaton Vance Floating-Rate Opportunities Fund | ||
| By: | /s/ Kenneth A. Topping | |
| Kenneth A. Topping | ||
| President | ||
| Date: | January 23, 2024 | |
Pursuant to the requirements of the Securities Exchange Act of 1934 and the Investment Company Act of 1940, this report has been signed below by the following persons on behalf of the registrant and in the capacities and on the dates indicated.
| By: | /s/ James F. Kirchner | |
| James F. Kirchner | ||
| Treasurer | ||
| Date: | January 23, 2024 | |
| By: | /s/ Kenneth A. Topping | |
| Kenneth A. Topping | ||
| President | ||
| Date: | January 23, 2024 | |