Eaton Vance Floating-Rate Opportunities Fund
Filed: 25 Jul 24, 4:12pm
UNITED STATES
SECURITIES AND EXCHANGE COMMISSION
Washington, D.C. 20549
Form N-CSR
CERTIFIED SHAREHOLDER REPORT OF REGISTERED
MANAGEMENT INVESTMENT COMPANIES
Investment Company Act File Number: 811-23855
Eaton Vance Floating-Rate Opportunities Fund
(Exact Name of Registrant as Specified in Charter)
One Post Office Square, Boston, Massachusetts 02109
(Address of Principal Executive Offices)
Deidre E. Walsh
One Post Office Square, Boston, Massachusetts 02109
(Name and Address of Agent for Services)
(617) 482-8260
(Registrant’s Telephone Number)
May 31
Date of Fiscal Year End
May 31, 2024
Date of Reporting Period
Item 1. Reports to Stockholders
| (a) |

| % Cumulative Total Returns1,2 | Class Inception Date | Performance Inception Date | One Year | Five Years | Since Inception |
| Class A at NAV | 12/15/2023 | 09/29/2023 | —% | —% | 8.96% |
| Class A with 3.25% Maximum Sales Charge | — | — | — | — | 5.38 |
| Class I at NAV | 09/29/2023 | 09/29/2023 | — | — | 9.49 |
| Class U at NAV | 12/15/2023 | 09/29/2023 | — | — | 8.71 |
| Morningstar® LSTA® US Leveraged Loan IndexSM | — | — | —% | —% | 7.05% |

| Growth of Investment | Amount Invested | Period Beginning | At NAV | With Maximum Sales Charge |
| Class A | $10,000 | 09/29/2023 | $10,896 | $10,538 |
| Class U | $10,000 | 09/29/2023 | $10,871 | N.A. |
| Top 10 Issuers (% of total investments)1 | |
| Benefit Street Partners CLO XXXII Ltd. | 5.2% |
| Carlyle U.S. CLO Ltd. | 5.2 |
| Octagon 68 Ltd. | 5.2 |
| Elmwood CLO XI Ltd. | 4.2 |
| Golub Capital Partners CLO 52B Ltd. | 3.4 |
| Basswood Park CLO Ltd. | 3.4 |
| TCW CLO Ltd. | 3.4 |
| OCP Aegis CLO Ltd. | 3.3 |
| Crown City CLO I | 3.3 |
| Crown Point CLO 10 Ltd. | 2.8 |
| Total | 39.4% |
| Top 10 Industries (% of total investments)1 | |
| Software | 8.1% |
| Hotels, Restaurants & Leisure | 2.9 |
| Chemicals | 2.9 |
| Professional Services | 2.2 |
| Machinery | 2.1 |
| Aerospace and Defense | 1.7 |
| Specialty Retail | 1.7 |
| Insurance | 1.7 |
| Diversified Consumer Services | 1.7 |
| IT Services | 1.6 |
| Total | 26.6% |
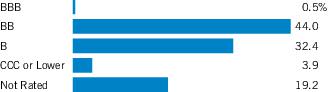
| Credit Quality (% of total investments)1,2 |
| 1 | Excludes cash and cash equivalents. |
| 2 | Credit ratings are categorized using S&P Global Ratings (“S&P”). Ratings, which are subject to change, apply to the creditworthiness of the issuers of the underlying securities and not to the Fund or its shares. Credit ratings measure the quality of a bond based on the issuer’s creditworthiness, with ratings ranging from AAA, being the highest, to D, being the lowest based on S&P’s measures. Ratings of BBB or higher by S&P are considered to be investment-grade quality. Credit ratings are based largely on the ratings agency’s analysis at the time of rating. The rating assigned to any particular security is not necessarily a reflection of the issuer’s current financial condition and does not necessarily reflect its assessment of the volatility of a security’s market value or of the liquidity of an investment in the security. Holdings designated as “Not Rated” (if any) are not rated by S&P. |
| † | The views expressed in this report are those of the Fund’s investment adviser and are subject to change at any time based upon market or other conditions, and Eaton Vance and the Fund(s) disclaim any responsibility to update such views. These views may not be relied upon as investment advice and, because investment decisions are based on many factors, may not be relied upon as an indication of trading intent on behalf of any Eaton Vance fund. This commentary may contain statements that are not historical facts, referred to as “forward-looking statements.” The Fund’s actual future results may differ significantly from those stated in any forward-looking statement, depending on factors such as changes in securities or financial markets or general economic conditions, the volume of sales and purchases of Fund shares, the continuation of investment advisory, administrative and service contracts, and other risks discussed from time to time in the Fund’s filings with the Securities and Exchange Commission. |
| 1 | Morningstar® LSTA® US Leveraged Loan IndexSM is an unmanaged index of the institutional leveraged loan market. Morningstar® LSTA® Leveraged Loan indices are a product of Morningstar, Inc. (“Morningstar”) and have been licensed for use. Morningstar® is a registered trademark of Morningstar licensed for certain use. Loan Syndications and Trading Association® and LSTA® are trademarks of the LSTA licensed for certain use by Morningstar, and further sublicensed by Morningstar for certain use. Neither Morningstar nor LSTA guarantees the accuracy and/or completeness of the Morningstar® LSTA® US Leveraged Loan IndexSM or any data included therein, and shall have no liability for any errors, omissions, or interruptions therein. Unless otherwise stated, index returns do not reflect the effect of any applicable sales charges, commissions, expenses, taxes or leverage, as applicable. It is not possible to invest directly in an index. |
| 2 | Total Returns at NAV do not include applicable sales charges. If sales charges were deducted, the returns would be lower. Total Returns shown with maximum sales charge reflect the stated maximum sales charge. Unless otherwise stated, performance does not reflect the deduction of taxes on Fund distributions or redemptions of Fund shares. Performance since inception for an index, if presented, is the performance since the Fund’s or oldest share class’s inception, as applicable.Performance prior to the inception date of a class may be linked to the performance of an older class of the Fund. This linked performance is adjusted for any applicable sales charge, but is not adjusted for class expense differences. If adjusted for such differences, the performance would be different. The performance of Class A and Class U are linked to Class I. Performance presented in the Financial Highlights included in the financial statements is not linked. |
| Fund profile subject to change due to active management. |
| Asset-Backed Securities — 62.6% |
| Security | Principal Amount (000's omitted) | Value | |
| Basswood Park CLO Ltd., Series 2021-1A, Class E, 11.736%, (3 mo. SOFR + 6.412%), 4/20/34(1)(2) | $ | 2,000 | $ 2,014,334 |
| Benefit Street Partners CLO XXXII Ltd., Series 2023-32A, Class E, 12.715%, (3 mo. SOFR + 7.35%), 10/25/36(1)(2) | 3,000 | 3,147,216 | |
| Bryant Park Funding Ltd., Series 2024-23A, Class E, 12.057%, (3 mo. SOFR + 6.73%), 5/15/37(1)(2) | 1,500 | 1,513,271 | |
| Canyon Capital CLO Ltd.: | |||
| Series 2019-1A, Class ER, 12.74%, (3 mo. SOFR + 7.412%), 4/15/32(1)(2) | 1,000 | 999,995 | |
| Series 2020-2A, Class ER, 12.12%, (3 mo. SOFR + 6.792%), 10/15/34(1)(2) | 1,650 | 1,654,950 | |
| Carlyle U.S. CLO Ltd., Series 2022-6A, Class ER, 13.224%, (3 mo. SOFR + 7.90%), 10/25/36(1)(2) | 3,000 | 3,139,395 | |
| Crown City CLO I, Series 2020-1A, Class DR, 12.586%, (3 mo. SOFR + 7.262%), 7/20/34(1)(2) | 2,000 | 1,986,298 | |
| Crown Point CLO 10 Ltd., Series 2021-10A, Class E, 12.436%, (3 mo. SOFR + 7.112%), 7/20/34(1)(2) | 1,700 | 1,704,836 | |
| Elmwood CLO XI Ltd., Series 2021-4A, Class E, 11.586%, (3 mo. SOFR + 6.262%), 10/20/34(1)(2) | 2,500 | 2,510,670 | |
| GoldenTree Loan Opportunities XII Ltd., Series 2016-12A, Class ER, 10.986%, (3 mo. SOFR + 5.662%), 7/21/30(1)(2) | 1,250 | 1,255,171 | |
| Golub Capital Partners CLO 52B Ltd., Series 2020-52A, Class ER, 12.075%, (3 mo. SOFR + 6.75%), 4/20/37(1)(2) | 2,000 | 2,017,468 | |
| Golub Capital Partners CLO 53B Ltd., Series 2021-53A, Class E, 12.286%, (3 mo. SOFR + 6.962%), 7/20/34(1)(2) | 1,070 | 1,074,329 | |
| Jamestown CLO XV Ltd.: | |||
| Series 2020-15A, Class E, 12.59%, (3 mo. SOFR + 7.262%), 4/15/33(1)(2) | 1,310 | 1,313,827 | |
| Series 2020-15A, Class ER, (3 mo. SOFR + 7.06%), 7/15/35(1)(3) | 1,310 | 1,304,440 | |
| Oaktree CLO Ltd., Series 2019-4A, Class ERR, (3 mo. SOFR + 6.59%), 7/20/37(1)(3) | 1,500 | 1,496,498 | |
| OCP Aegis CLO Ltd., Series 2023-29A, Class E, 13.05%, (3 mo. SOFR + 7.72%), 1/20/35(1)(2) | 2,000 | 2,011,160 | |
| Octagon 68 Ltd., Series 2023-1A, Class E, 12.565%, (3 mo. SOFR + 7.24%), 10/20/36(1)(2) | 3,000 | 3,134,388 | |
| TCW CLO Ltd., Series 2019-2A, Class ER, 11.975%, (3 mo. SOFR + 6.65%), 10/20/32(1)(2) | 2,000 | 2,011,816 | |
| Total Asset-Backed Securities (identified cost $32,719,351) | $34,290,062 | ||
| Senior Floating-Rate Loans — 47.0%(4) |
| Borrower/Description | Principal Amount (000's omitted) | Value | |
| Aerospace and Defense — 1.8% | |||
| TransDigm, Inc., Term Loan, 8.059%, (SOFR + 2.75%), 8/24/28 | $ | 995 | $ 1,000,728 |
| $ 1,000,728 | |||
| Auto Components — 1.4% | |||
| Autokiniton U.S. Holdings, Inc., Term Loan, 9.444%, (SOFR + 4.00%), 4/6/28 | $ | 744 | $ 751,419 |
| $ 751,419 | |||
| Automobiles — 0.9% | |||
| MajorDrive Holdings IV LLC, Term Loan, 10.959%, (SOFR + 5.50%), 6/1/29 | $ | 497 | $ 500,888 |
| $ 500,888 | |||
| Beverages — 0.9% | |||
| Triton Water Holdings, Inc., Term Loan, 8.814%, (SOFR + 3.25%), 3/31/28 | $ | 496 | $ 495,967 |
| $ 495,967 | |||
| Capital Markets — 0.9% | |||
| Focus Financial Partners LLC, Term Loan, 8.079%, (SOFR + 2.75%), 6/30/28 | $ | 496 | $ 497,616 |
| $ 497,616 | |||
| Chemicals — 3.1% | |||
| Charter NEX U.S., Inc., Term Loan, 8.829%, (SOFR + 3.50%), 12/1/27 | $ | 496 | $ 499,001 |
| INEOS U.S. Finance LLC, Term Loan, 9.179%, (SOFR + 3.75%), 11/8/27 | 744 | 748,017 | |
| Rohm Holding GmbH, Term Loan, 10.581%, (SOFR + 5.00%), 7/31/26 | 496 | 476,053 | |
| $ 1,723,071 | |||
| Consumer Staples Distribution & Retail — 0.9% | |||
| Cardenas Markets, Inc., Term Loan, 12.159%, (SOFR + 6.75%), 8/1/29 | $ | 496 | $ 500,032 |
| $ 500,032 | |||
| Containers & Packaging — 1.4% | |||
| Clydesdale Acquisition Holdings, Inc., Term Loan, 9.104%, (SOFR + 3.68%), 4/13/29 | $ | 744 | $ 749,110 |
| $ 749,110 | |||
| Borrower/Description | Principal Amount (000's omitted) | Value | |
| Diversified Consumer Services — 1.8% | |||
| Sotheby's, Term Loan, 10.09%, (SOFR + 4.50%), 1/15/27 | $ | 496 | $ 468,471 |
| Wand NewCo 3, Inc., Term Loan, 9.079%, (SOFR + 3.75%), 1/30/31 | 500 | 504,772 | |
| $ 973,243 | |||
| Electronic Equipment, Instruments & Components — 0.8% | |||
| Creation Technologies, Inc., Term Loan, 11.068%, (SOFR + 5.50%), 10/5/28 | $ | 496 | $ 467,671 |
| $ 467,671 | |||
| Engineering & Construction — 0.9% | |||
| Aegion Corp., Term Loan, 9.579%, (SOFR + 4.25%), 5/17/28 | $ | 497 | $ 500,594 |
| $ 500,594 | |||
| Entertainment — 0.9% | |||
| Renaissance Holding Corp., Term Loan, 9.597%, (SOFR + 4.25%), 4/5/30 | $ | 500 | $ 500,703 |
| $ 500,703 | |||
| Gas Utilities — 1.2% | |||
| CQP Holdco LP, Term Loan, 8.302%, (SOFR + 3.00%), 12/31/30 | $ | 677 | $ 679,307 |
| $ 679,307 | |||
| Health Care Equipment & Supplies — 0.9% | |||
| Journey Personal Care Corp., Term Loan, 9.694%, (SOFR + 4.25%), 3/1/28 | $ | 496 | $ 495,553 |
| $ 495,553 | |||
| Health Care Providers & Services — 0.8% | |||
| BW NHHC Holdco, Inc., Term Loan - Second Lien, 13.302%, (SOFR + 8.00%), 1/15/26 | $ | 501 | $ 433,163 |
| $ 433,163 | |||
| Health Care Technology — 0.9% | |||
| Symplr Software, Inc., Term Loan, 9.93%, (SOFR + 4.50%), 12/22/27 | $ | 496 | $ 472,472 |
| $ 472,472 | |||
| Hotels, Restaurants & Leisure — 3.3% | |||
| Carnival Corp., Term Loan, 8.075%, (SOFR + 2.75%), 10/18/28 | $ | 772 | $ 778,436 |
| Fertitta Entertainment LLC, Term Loan, 9.071%, (SOFR + 3.75%), 1/27/29 | 199 | 200,320 | |
| Borrower/Description | Principal Amount (000's omitted) | Value | |
| Hotels, Restaurants & Leisure (continued) | |||
| Flutter Financing BV, Term Loan, 7.559%, (SOFR + 2.25%), 11/25/30 | $ | 309 | $ 310,771 |
| Ontario Gaming GTA LP, Term Loan, 9.559%, (SOFR + 4.25%), 8/1/30 | 499 | 502,803 | |
| $ 1,792,330 | |||
| Household Durables — 0.8% | |||
| ACProducts, Inc., Term Loan, 5/17/28(5) | $ | 500 | $ 425,893 |
| $ 425,893 | |||
| Insurance — 1.8% | |||
| USI, Inc., Term Loan, 8.081%, (SOFR + 2.75%), 11/22/29 | $ | 992 | $ 995,595 |
| $ 995,595 | |||
| IT Services — 1.8% | |||
| Asurion LLC, Term Loan, 9.679%, (SOFR + 4.25%), 8/19/28 | $ | 744 | $ 740,081 |
| Rackspace Technology Global, Inc., Term Loan, 11.686%, (SOFR + 6.25%), 5/15/28 | 250 | 252,969 | |
| $ 993,050 | |||
| Life Sciences Tools & Services — 0.9% | |||
| Curia Global, Inc., Term Loan, 9.18%, (SOFR + 3.75%), 8/30/26(6) | $ | 500 | $ 472,578 |
| $ 472,578 | |||
| Machinery — 2.3% | |||
| Conair Holdings LLC, Term Loan, 9.194%, (SOFR + 3.75%), 5/17/28 | $ | 496 | $ 493,495 |
| Engineered Machinery Holdings, Inc., Term Loan, 9.321%, (SOFR + 3.75%), 5/19/28 | 744 | 749,938 | |
| $ 1,243,433 | |||
| Metals/Mining — 0.9% | |||
| PMHC II, Inc., Term Loan, 9.706%, (SOFR + 4.25%), 4/23/29 | $ | 496 | $ 490,975 |
| $ 490,975 | |||
| Professional Services — 2.4% | |||
| CoreLogic, Inc., Term Loan, 8.944%, (SOFR + 3.50%), 6/2/28 | $ | 496 | $ 490,158 |
| Borrower/Description | Principal Amount (000's omitted) | Value | |
| Professional Services (continued) | |||
| Employbridge Holding Co., Term Loan, 10.314%, (SOFR + 4.75%), 7/19/28 | $ | 496 | $ 361,461 |
| Neptune Bidco U.S., Inc., Term Loan, 10.406%, (SOFR + 5.00%), 4/11/29 | 496 | 477,321 | |
| $ 1,328,940 | |||
| Real Estate Management & Development — 0.9% | |||
| Greystar Real Estate Partners LLC, Term Loan, 8.577%, (SOFR + 3.25%), 8/21/30 | $ | 498 | $ 501,234 |
| $ 501,234 | |||
| Road & Rail — 1.7% | |||
| Hertz Corp.: | |||
| Term Loan, 8.859%, (SOFR + 3.25%), 6/30/28 | $ | 832 | $ 766,748 |
| Term Loan, 8.859%, (SOFR + 3.25%), 6/30/28 | 161 | 148,387 | |
| $ 915,135 | |||
| Software — 8.9% | |||
| Central Parent, Inc., Term Loan, 8.577%, (SOFR + 3.25%), 7/6/29 | $ | 1,000 | $ 1,009,375 |
| Cloud Software Group, Inc., Term Loan, 9.331%, (SOFR + 4.00%), 3/30/29 | 497 | 498,929 | |
| Epicor Software Corp.: | |||
| Term Loan, 7/30/27(5) | 59 | 58,664 | |
| Term Loan, 7/30/27(5) | 500 | 500,703 | |
| Fiserv Investment Solutions, Inc., Term Loan, 9.326%, (SOFR + 4.00%), 2/18/27 | 496 | 477,777 | |
| Sabre GLBL, Inc., Term Loan, 10.429%, (SOFR + 5.00%), 6/30/28 | 500 | 462,031 | |
| Skillsoft Corp., Term Loan, 10.685%, (SOFR + 5.25%), 7/14/28 | 496 | 405,156 | |
| UKG, Inc., Term Loan, 2/10/31(5) | 500 | 504,323 | |
| Veritas U.S., Inc., Term Loan, 10.444%, (SOFR + 5.00%), 9/1/25 | 496 | 455,664 | |
| Vision Solutions, Inc., Term Loan, 9.841%, (SOFR + 4.25%), 4/24/28 | 496 | 493,826 | |
| $ 4,866,448 | |||
| Specialty Retail — 1.8% | |||
| Mattress Firm, Inc., Term Loan, 9.814%, (SOFR + 4.25%), 9/25/28 | $ | 496 | $ 497,156 |
| Borrower/Description | Principal Amount (000's omitted) | Value | |
| Specialty Retail (continued) | |||
| PetSmart, Inc., Term Loan, 9.179%, (SOFR + 3.75%), 2/11/28 | $ | 500 | $ 499,286 |
| $ 996,442 | |||
| Total Senior Floating-Rate Loans (identified cost $25,841,921) | $25,763,590 | ||
| Total Investments — 109.6% (identified cost $58,561,272) | $60,053,652 | ||
| Other Assets, Less Liabilities — (9.6)% | $ (5,263,316) | ||
| Net Assets — 100.0% | $54,790,336 | ||
| The percentage shown for each investment category in the Portfolio of Investments is based on net assets. | |
| (1) | Security exempt from registration under Rule 144A of the Securities Act of 1933, as amended. These securities may be sold in certain transactions in reliance on an exemption from registration (normally to qualified institutional buyers). At May 31, 2024, the aggregate value of these securities is $34,290,062 or 62.6% of the Fund's net assets. |
| (2) | Variable rate security. The stated interest rate represents the rate in effect at May 31, 2024. |
| (3) | When-issued, variable rate security whose interest rate will be determined after May 31, 2024 |
| (4) | Senior floating-rate loans (Senior Loans) often require prepayments from excess cash flows or permit the borrowers to repay at their election. The degree to which borrowers repay, whether as a contractual requirement or at their election, cannot be predicted with accuracy. As a result, the actual remaining maturity may be substantially less than the stated maturities shown. However, Senior Loans will typically have an expected average life of approximately two to four years. Senior Loans typically have rates of interest which are redetermined periodically by reference to a base lending rate, plus a spread. These base lending rates are primarily the Secured Overnight Financing Rate (“SOFR”) and secondarily, the prime rate offered by one or more major United States banks (the “Prime Rate”). Base lending rates may be subject to a floor, or minimum rate. Rates for SOFR are generally 1 or 3-month tenors and may also be subject to a credit spread adjustment. Senior Loans are generally subject to contractual restrictions that must be satisfied before they can be bought or sold. |
| (5) | This Senior Loan will settle after May 31, 2024, at which time the interest rate will be determined. |
| (6) | The stated interest rate represents the weighted average interest rate at May 31, 2024 of contracts within the senior loan facility. Interest rates on contracts are primarily redetermined either monthly or quarterly by reference to the indicated base lending rate and spread and the reset period. |
| Abbreviations: | |
| SOFR | – Secured Overnight Financing Rate |
| Currency Abbreviations: | |
| USD | – United States Dollar |
| May 31, 2024 | |
| Assets | |
| Investments, at value (identified cost $58,561,272) | $ 60,053,652 |
| Interest receivable | 920,200 |
| Dividends receivable from affiliated investments | 6,675 |
| Receivable for investments sold | 71,318 |
| Receivable from affiliates | 78,908 |
| Trustees' deferred compensation plan | 14 |
| Deferred offering costs | 245,766 |
| Prepaid upfront fees on notes payable | 72,737 |
| Total assets | $61,449,270 |
| Liabilities | |
| Payable for investments purchased | $ 3,225,942 |
| Payable for when-issued securities | 2,816,954 |
| Due to custodian | 389,518 |
| Payable to affiliates: | |
| Investment adviser and administration fee | 45,521 |
| Distribution fees | 44 |
| Trustees' fees | 622 |
| Trustees' deferred compensation plan | 14 |
| Accrued expenses | 180,319 |
| Total liabilities | $ 6,658,934 |
| Net Assets | $54,790,336 |
| Sources of Net Assets | |
| Paid-in capital | $ 53,078,067 |
| Distributable earnings | 1,712,269 |
| Net Assets | $54,790,336 |
| Class A Shares | |
| Net Assets | $ 53,014 |
| Shares Outstanding | 5,147 |
| Net Asset Value and Redemption Price Per Share* (net assets ÷ shares of beneficial interest outstanding) | $ 10.30 |
| Maximum Offering Price Per Share (100 ÷ 96.75 of net asset value per share) | $ 10.65 |
| Class I Shares | |
| Net Assets | $ 54,684,428 |
| Shares Outstanding | 5,314,758 |
| Net Asset Value, Offering Price and Redemption Price Per Share (net assets ÷ shares of beneficial interest outstanding) | $ 10.29 |
| Class U Shares | |
| Net Assets | $ 52,894 |
| Shares Outstanding | 5,135 |
| Net Asset Value, Offering Price and Redemption Price Per Share (net assets ÷ shares of beneficial interest outstanding) | $ 10.30 |
| On sales of $100,000 or more, the offering price of Class A shares is reduced. | |
| * | Redemption price per share is equal to the net asset value less any applicable early withdrawal charge. |
| Period Ended | |
| May 31, 2024(1) | |
| Investment Income | |
| Dividend income from affiliated investments | $ 282,456 |
| Interest income | 3,350,839 |
| Other income | 66,502 |
| Total investment income | $3,699,797 |
| Expenses | |
| Investment adviser and administration fee | $ 345,270 |
| Distribution and service fees: | |
| Class A | 58 |
| Class U | 174 |
| Trustees’ fees and expenses | 2,509 |
| Custodian fee | 21,870 |
| Transfer and dividend disbursing agent fees | 717 |
| Legal and accounting services | 136,911 |
| Printing and postage | 4,021 |
| Amortization of deferred offering costs | 566,019 |
| Registration fees | 5,460 |
| Interest expense and fees | 33,846 |
| Miscellaneous | 15,849 |
| Total expenses | $1,132,704 |
| Deduct: | |
| Waiver and/or reimbursement of expenses by affiliates | $ 674,735 |
| Total expense reductions | $ 674,735 |
| Net expenses | $ 457,969 |
| Net investment income | $3,241,828 |
| Realized and Unrealized Gain (Loss) | |
| Net realized gain (loss): | |
| Investment transactions | $ 56,128 |
| Net realized gain | $ 56,128 |
| Change in unrealized appreciation (depreciation): | |
| Investments | $ 1,492,380 |
| Net change in unrealized appreciation (depreciation) | $1,492,380 |
| Net realized and unrealized gain | $1,548,508 |
| Net increase in net assets from operations | $4,790,336 |
| (1) | For the period from the commencement of operations, September 29, 2023, to May 31, 2024. |
| Period Ended May 31, 2024(1) | |
| Increase (Decrease) in Net Assets | |
| From operations: | |
| Net investment income | $ 3,241,828 |
| Net realized gain | 56,128 |
| Net change in unrealized appreciation (depreciation) | 1,492,380 |
| Net increase in net assets from operations | $ 4,790,336 |
| Distributions to shareholders: | |
| Class A | $ (2,204) |
| Class I | (3,299,939) |
| Class U | (2,085) |
| Total distributions to shareholders | $ (3,304,228) |
| Transactions in shares of beneficial interest: | |
| Class A | $ 52,204 |
| Class I | 53,199,939 |
| Class U | 52,085 |
| Net increase in net assets from Fund share transactions | $53,304,228 |
| Net increase in net assets | $54,790,336 |
| Net Assets | |
| At beginning of period | $ — |
| At end of period | $54,790,336 |
| (1) | For the period from the commencement of operations, September 29, 2023, to May 31, 2024. |
| Class A | |
| Period Ended May 31, 2024(1) | |
| Net asset value — Beginning of period | $ 10.14 |
| Income (Loss) From Operations | |
| Net investment income(2) | $ 0.44 |
| Net realized and unrealized gain | 0.16 |
| Total income from operations | $ 0.60 |
| Less Distributions | |
| From net investment income | $ (0.44) |
| Total distributions | $ (0.44) |
| Net asset value — End of period | $10.30 |
| Total Return(3) | 6.02% (4) |
| Ratios/Supplemental Data | |
| Net assets, end of period (000’s omitted) | $ 53 |
| Ratios (as a percentage of average daily net assets):(5) | |
| Total expenses (6) | 3.57% (7) |
| Net expenses(6) | 1.63% (7)(8) |
| Net investment income | 9.30% (7) |
| Portfolio Turnover | 9% (4) |
| (1) | For the period from the commencement of operations, December 15, 2023, to May 31, 2024. |
| (2) | Computed using average shares outstanding. |
| (3) | Returns are historical and are calculated by determining the percentage change in net asset value with all distributions reinvested. |
| (4) | Not annualized. |
| (5) | Total expenses do not reflect amounts reimbursed and/or waived by the adviser and certain of its affiliates, if applicable. Net expenses are net of all reductions and represent the net expenses paid by the Fund. |
| (6) | Includes interest and fee expense of 0.14% of average daily net assets for the period ended May 31, 2024. |
| (7) | Annualized. |
| (8) | Includes a reduction by the investment adviser of a portion of its adviser and administration fee due to the Fund’s investment in the Liquidity Fund (equal to 0.01% of average daily net assets for the period ended May 31, 2024). |
| Class I | |
| Period Ended May 31, 2024(1) | |
| Net asset value — Beginning of period | $ 10.00 |
| Income (Loss) From Operations | |
| Net investment income(2) | $ 0.63 |
| Net realized and unrealized gain | 0.30 |
| Total income from operations | $ 0.93 |
| Less Distributions | |
| From net investment income | $ (0.64) |
| Total distributions | $ (0.64) |
| Net asset value — End of period | $ 10.29 |
| Total Return(3) | 9.49% (4) |
| Ratios/Supplemental Data | |
| Net assets, end of period (000’s omitted) | $54,684 |
| Ratios (as a percentage of average daily net assets):(5) | |
| Total expenses(6) | 3.28% (7) |
| Net expenses(6) | 1.33% (7)(8) |
| Net investment income | 9.39% (7) |
| Portfolio Turnover | 9% (4) |
| (1) | For the period from the commencement of operations, September 29, 2023, to May 31, 2024. |
| (2) | Computed using average shares outstanding. |
| (3) | Returns are historical and are calculated by determining the percentage change in net asset value with all distributions reinvested. |
| (4) | Not annualized. |
| (5) | Total expenses do not reflect amounts reimbursed and/or waived by the adviser and certain of its affiliates, if applicable. Net expenses are net of all reductions and represent the net expenses paid by the Fund. |
| (6) | Includes interest and fee expense of 0.10% of average daily net assets for the period ended May 31, 2024. |
| (7) | Annualized. |
| (8) | Includes a reduction by the investment adviser of a portion of its adviser and administration fee due to the Fund’s investment in the Liquidity Fund (equal to 0.02% of average daily net assets for the period ended May 31, 2024). |
| Class U | |
| Period Ended May 31, 2024(1) | |
| Net Asset Value, Beginning of period | $ 10.14 |
| Income (Loss) From Operations | |
| Net investment income(2) | $ 0.41 |
| Net realized and unrealized gain | 0.17 |
| Total income from operations | $ 0.58 |
| Less Distributions | |
| Net Investment Income | $ (0.42) |
| Total distributions | $ (0.42) |
| Net asset value — End of period | $10.30 |
| Total Return(3) | 5.78% (4) |
| Ratios/Supplemental Data | |
| Net assets, end of period (000’s omitted) | $ 53 |
| Ratios (as a percentage of average daily net assets):(5) | |
| Total expenses(6) | 4.06% (7) |
| Net expenses(6) | 2.13% (7),(8) |
| Net Investment income | 8.80% (7) |
| Portfolio Turnover | 9% (4) |
| (1) | For the period from the commencement of operations, December 15, 2023, to May 31, 2024. |
| (2) | Computed using average shares outstanding. |
| (3) | Returns are historical and are calculated by determining the percentage change in net asset value with all distributions reinvested. |
| (4) | Not annualized. |
| (5) | Total expenses do not reflect amounts reimbursed and/or waived by the adviser and certain of its affiliates, if applicable. Net expenses are net of all reductions and represent the net expenses paid by the Fund. |
| (6) | Includes interest and fee expense of 0.14% of average daily net assets for the period ended May 31, 2024. |
| (7) | Annualized. |
| (8) | Includes a reduction by the investment adviser of a portion of its adviser and administration fee due to the Fund’s investment in the Liquidity Fund (equal to 0.01% of average daily net assets for the period ended May 31, 2024). |
| Period Ended May 31, 2024 | |
| Ordinary income | $3,304,228 |
| Undistributed ordinary income | $ 244,007 |
| Net unrealized appreciation | 1,468,262 |
| Distributable earnings | $1,712,269 |
| Aggregate cost | $58,585,390 |
| Gross unrealized appreciation | $ 1,771,954 |
| Gross unrealized depreciation | (303,692) |
| Net unrealized appreciation | $ 1,468,262 |
| Average Daily Managed Assets | Annual Fee Rate |
| Up to $500 million | 1.000% |
| $500 million but less than $1 billion | 0.950% |
| $1 billion but less than $2.5 billion | 0.925% |
| $2.5 billion but less than $5 billion | 0.900% |
| $5 billion and over | 0.880% |
| Period Ended May 31, 2024(1) | ||
| Shares | Amount | |
| Class A | ||
| Sales | 4,931 | $ 50,000 |
| Issued to shareholders electing to receive payments of distributions in Fund shares | 216 | 2,204 |
| Net increase | 5,147 | $ 52,204 |
| Class I | ||
| Sales | 4,990,000 | $ 49,900,000 |
| Issued to shareholders electing to receive payments of distributions in Fund shares | 324,758 | 3,299,939 |
| Net increase | 5,314,758 | $53,199,939 |
| Class U | ||
| Sales | 4,931 | $ 50,000 |
| Issued to shareholders electing to receive payments of distributions in Fund shares | 204 | 2,085 |
| Net increase | 5,135 | $ 52,085 |
| (1) | For the period from the commencement of operations, September 29, 2023, to May 31, 2024 for Class I and from December 15, 2023 to May 31, 2024 for Class A and Class U. |
| Name | Value, beginning of period | Purchases | Sales proceeds | Net realized gain (loss) | Change in unrealized appreciation (depreciation) | Value, end of period | Dividend income | Shares, end of period |
| Short-Term Investments | ||||||||
| Liquidity Fund | $ — | $62,359,427 | $(62,359,427) | $ — | $ — | $ — | $282,456 | — |
| • | Level 1 – quoted prices in active markets for identical investments |
| • | Level 2 – other significant observable inputs (including quoted prices for similar investments, interest rates, prepayment speeds, credit risk, etc.) |
| • | Level 3 – significant unobservable inputs (including a fund's own assumptions in determining the fair value of investments) |
| Asset Description | Level 1 | Level 2 | Level 3 | Total |
| Asset-Backed Securities | $ — | $ 34,290,062 | $ — | $ 34,290,062 |
| Senior Floating-Rate Loans | — | 25,763,590 | — | 25,763,590 |
| Total Investments | $ — | $60,053,652 | $ — | $60,053,652 |
| Name and Year of Birth | Fund Position(s) | Length of Service | Principal Occupation(s) and Other Directorships During Past Five Years and Other Relevant Experience |
| Noninterested Trustees | |||
| Alan C. Bowser 1962 | Trustee | Since 2023. | Private investor. Formerly, Chief Diversity Officer, Partner and a member of the Operating Committee, and formerly served as Senior Advisor on Diversity and Inclusion for the firm’s chief executive officer, Co-Head of the Americas Region, and Senior Client Advisor of Bridgewater Associates, an asset management firm (2011- 2023). Other Directorships. Independent Director of Stout Risius Ross (a middle market professional services advisory firm) (since 2021). |
| Mark R. Fetting 1954 | Trustee | Since 2023. | Private investor. Formerly held various positions at Legg Mason, Inc. (investment management firm) (2000-2012), including President, Chief Executive Officer, Director and Chairman (2008-2012), Senior Executive Vice President (2004-2008) and Executive Vice President (2001-2004). Formerly, President of Legg Mason family of funds (2001-2008). Formerly, Division President and Senior Officer of Prudential Financial Group, Inc. and related companies (investment management firm) (1991-2000). Other Directorships. None. |
| Cynthia E. Frost 1961 | Trustee | Since 2023. | Private investor. Formerly, Chief Investment Officer of Brown University (university endowment) (2000-2012). Formerly, Portfolio Strategist for Duke Management Company (university endowment manager) (1995-2000). Formerly, Managing Director, Cambridge Associates (investment consulting company) (1989-1995). Formerly, Consultant, Bain and Company (management consulting firm) (1987-1989). Formerly, Senior Equity Analyst, BA Investment Management Company (1983-1985). Other Directorships. None. |
| George J. Gorman 1952 | Chairperson of the Board and Trustee | Since 2023 (Chairperson) and 2023 (Trustee) | Principal at George J. Gorman LLC (consulting firm). Formerly, Senior Partner at Ernst & Young LLP (a registered public accounting firm) (1974-2009). Other Directorships. None. |
| Valerie A. Mosley 1960 | Trustee | Since 2023 | Chairwoman and Chief Executive Officer of Valmo Ventures (a consulting and investment firm). Founder of Upward Wealth, Inc., dba BrightUp, a fintech platform. Formerly, Partner and Senior Vice President, Portfolio Manager and Investment Strategist at Wellington Management Company, LLP (investment management firm) (1992-2012). Formerly, Chief Investment Officer, PG Corbin Asset Management (1990-1992). Formerly worked in institutional corporate bond sales at Kidder Peabody (1986-1990). Other Directorships. Director of DraftKings, Inc. (digital sports entertainment and gaming company) (since September 2020). Director of Envestnet, Inc. (provider of intelligent systems for wealth management and financial wellness) (since 2018). Formerly, Director of Dynex Capital, Inc. (mortgage REIT) (2013-2020) and Director of Groupon, Inc. (e-commerce provider) (2020-2022). |
| Name and Year of Birth | Fund Position(s) | Length of Service | Principal Occupation(s) and Other Directorships During Past Five Years and Other Relevant Experience |
| Noninterested Trustees (continued) | |||
| Keith Quinton 1958 | Trustee | Since 2023 | Private investor, researcher and lecturer. Formerly, Independent Investment Committee Member at New Hampshire Retirement System (2017-2021). Formerly, Portfolio Manager and Senior Quantitative Analyst at Fidelity Investments (investment management firm) (2001-2014). Other Directorships. Formerly, Director (2016-2021) and Chairman (2019-2021) of New Hampshire Municipal Bond Bank. |
| Marcus L. Smith 1966 | Trustee | Since 2023 | Private investor and independent corporate director. Formerly, Chief Investment Officer, Canada (2012-2017), Chief Investment Officer, Asia (2010-2012), Director of Asian Research (2004-2010) and portfolio manager (2001-2017) at MFS Investment Management (investment management firm). Other Directorships. Director of First Industrial Realty Trust, Inc. (an industrial REIT) (since 2021). Director of MSCI Inc. (global provider of investment decision support tools) (since 2017). Formerly, Director of DCT Industrial Trust Inc. (logistics real estate company) (2017-2018). |
| Susan J. Sutherland 1957 | Trustee | Since 2023 | Private investor. Director of Ascot Group Limited and certain of its subsidiaries (insurance and reinsurance) (since 2017). Formerly, Director of Hagerty Holding Corp. (insurance) (2015-2018) and Montpelier Re Holdings Ltd. (insurance and reinsurance) (2013-2015). Formerly, Associate, Counsel and Partner at Skadden, Arps, Slate, Meagher & Flom LLP (law firm) (1982-2013). Other Directorships. Formerly, Director of Kairos Acquisition Corp. (insurance/InsurTech acquisition company) (2021-2023). |
| Scott E. Wennerholm 1959 | Trustee | Since 2023 | Private investor. Formerly, Trustee at Wheelock College (postsecondary institution) (2012-2018). Formerly, Consultant at GF Parish Group (executive recruiting firm) (2016-2017). Formerly, Chief Operating Officer and Executive Vice President at BNY Mellon Asset Management (investment management firm) (2005-2011). Formerly, Chief Operating Officer and Chief Financial Officer at Natixis Global Asset Management (investment management firm) (1997-2004). Formerly, Vice President at Fidelity Investments Institutional Services (investment management firm) (1994-1997). Other Directorships. None. |
| Nancy A. Wiser 1967 | Trustee | Since 2023 | Formerly, Executive Vice President and the Global Head of Operations at Wells Fargo Asset Management (2011-2021). Other Directorships. None. |
| Name and Year of Birth | Fund Position(s) | Length of Service | Principal Occupation(s) During Past Five Years |
| Principal Officers who are not Trustees | |||
| Kenneth A. Topping 1966 | President | Since 2023 | Vice President and Chief Administrative Officer of EVM and BMR and Chief Operating Officer for Public Markets at MSIM. Also Vice President of Calvert Research and Management (“CRM”) since 2021. Formerly, Chief Operating Officer for Goldman Sachs Asset Management `Classic' (2009-2020). |
| Deidre E. Walsh 1971 | Vice President and Chief Legal Officer | Since 2023 | Vice President of EVM and BMR. Also Vice President of CRM. |
| James F. Kirchner 1967 | Treasurer | Since 2023 | Vice President of EVM and BMR. Also Vice President of CRM. |
| Nicholas S. Di Lorenzo 1987 | Secretary | Since 2023 | Formerly, associate (2012-2021) and counsel (2022) at Dechert LLP. |
| Laura T. Donovan 1976 | Chief Compliance Officer | Since 2023 | Vice President of EVM and BMR. |
| U.S. Customer Privacy Notice | March 2024 |
| FACTS | WHAT DOES EATON VANCE DO WITH YOUR PERSONAL INFORMATION? |
| Why? | Financial companies choose how they share your personal information. Federal law gives consumers the right to limit some but not all sharing. Federal law also requires us to tell you how we collect, share, and protect your personal information. Please read this notice carefully to understand what we do. |
| What? | The types of personal information we collect and share depend on the product or service you have with us. This information can include:■ Social Security number and income ■ investment experience and risk tolerance ■ checking account information and wire transfer instructions |
| How? | All financial companies need to share customers’ personal information to run their everyday business. In the section below, we list the reasons financial companies can share their customers’ personal information; the reasons Eaton Vance chooses to share; and whether you can limit this sharing. |
| Reasons we can share your personal information | Does Eaton Vance share? | Can you limit this sharing? |
| For our everyday business purposes — such as to process your transactions, maintain your account(s), respond to court orders and legal investigations, or report to credit bureaus | Yes | No |
| For our marketing purposes — to offer our products and services to you | Yes | No |
| For joint marketing with other financial companies | No | We don’t share |
| For our affiliates’ everyday business purposes — information about your transactions and experiences | Yes | No* |
| For our affiliates’ everyday business purposes — information about your creditworthiness | Yes | Yes* |
| For our affiliates to market to you | Yes | Yes* |
| For nonaffiliates to market to you | No | We don’t share |
| To limit our sharing | Call toll-free 1-800-262-1122 or email: EVPrivacy@eatonvance.comPlease note:If you are a new customer, we can begin sharing your information 30 days from the date we sent this notice. When you are no longer our customer, we continue to share your information as described in this notice. However, you can contact us at any time to limit our sharing. |
| Questions? | Call toll-free 1-800-262-1122 or email: EVPrivacy@eatonvance.com |
| U.S. Customer Privacy Notice — continued | March 2024 |
| Who we are | |
| Who is providing this notice? | Eaton Vance Management and our investment management affiliates (“Eaton Vance”) (see Affiliates definition below.) |
| What we do | |
| How does Eaton Vance protect my personal information? | To protect your personal information from unauthorized access and use, we use security measures that comply with federal law. These measures include computer safeguards and secured files and buildings. We have policies governing the proper handling of customer information by personnel and requiring third parties that provide support to adhere to appropriate security standards with respect to such information. |
| How does Eaton Vance collect my personal information? | We collect your personal information, for example, when you■ open an account or make deposits or withdrawals from your account ■ buy securities from us or make a wire transfer ■ give us your contact informationWe also collect your personal information from others, such as credit bureaus, affiliates, or other companies. |
| Why can’t I limit all sharing? | Federal law gives you the right to limit only■ sharing for affiliates’ everyday business purposes — information about your creditworthiness ■ affiliates from using your information to market to you ■ sharing for nonaffiliates to market to youState laws and individual companies may give you additional rights to limit sharing. (See below for more on your rights under state law.) |
| What happens when I limit sharing for an account I hold jointly with someone else? | Your choices will apply to everyone on your account. |
| Definitions | |
| Affiliates | Companies related by common ownership or control. They can be financial and nonfinancial companies.■ Our affiliates include registered investment advisers such as Eaton Vance Management, Eaton Vance Advisers International Ltd., Boston Management and Research, Calvert Research and Management, Parametric Portfolio Associates LLC, Atlanta Capital Management Company LLC, Morgan Stanley Investment Management Inc., Morgan Stanley Investment Management Co.; registered broker-dealers such as Morgan Stanley Distributors Inc. and Eaton Vance Distributors, Inc. (together, the “Investment Management Affiliates”); and companies with a Morgan Stanley name and financial companies such as Morgan Stanley Smith Barney LLC and Morgan Stanley & Co. (the “Morgan Stanley Affiliates”). |
| Nonaffiliates | Companies not related by common ownership or control. They can be financial and nonfinancial companies.■ Eaton Vance does not share with nonaffiliates so they can market to you. |
| Joint marketing | A formal agreement between nonaffiliated financial companies that together market financial products or services to you.■ Eaton Vance does not jointly market. |
| U.S. Customer Privacy Notice — continued | March 2024 |
| Other important information | |
| *PLEASE NOTE: Eaton Vance does not share your creditworthiness information or your transactions and experiences information with the Morgan Stanley Affiliates, nor does Eaton Vance enable the Morgan Stanley Affiliates to market to you. Your opt outs will prevent Eaton Vance from sharing your creditworthiness information with the Investment Management Affiliates and will prevent the Investment Management Affiliates from marketing their products to you.Vermont: Except as permitted by law, we will not share personal information we collect about Vermont residents with Nonaffiliates unless you provide us with your written consent to share such information.California: Except as permitted by law, we will not share personal information we collect about California residents with Nonaffiliates and we will limit sharing such personal information with our Affiliates to comply with California privacy laws that apply to us. |
| (b) | Not applicable. |
Item 2. Code of Ethics
The registrant (sometimes referred to as the “Fund”) has adopted a code of ethics applicable to its Principal Executive Officer, Principal Financial Officer and Principal Accounting Officer. The registrant undertakes to provide a copy of such code of ethics to any person upon request, without charge, by calling 1-800-262-1122. The registrant has not amended the code of ethics as described in Form N-CSR during the period covered by this report. The registrant has not granted any waiver, including an implicit waiver, from a provision of the code of ethics as described in Form N-CSR during the period covered by this report.
Item 3. Audit Committee Financial Expert
The registrant’s Board of Trustees (the “Board”) has designated George J. Gorman and Scott E. Wennerholm, each an independent trustee, as audit committee financial experts. Mr. Gorman is a certified public accountant who is the Principal at George J. Gorman LLC (a consulting firm). Previously, Mr. Gorman served in various capacities at Ernst & Young LLP (a registered public accounting firm), including as Senior Partner. Mr. Gorman also has experience serving as an independent trustee and audit committee financial expert of other mutual fund complexes. Mr. Wennerholm is a private investor. Previously, Mr. Wennerholm served as a Trustee at Wheelock College (postsecondary institution), as a Consultant at GF Parish Group (executive recruiting firm), Chief Operating Officer and Executive Vice President at BNY Mellon Asset Management (investment management firm), Chief Operating Officer and Chief Financial Officer at Natixis Global Asset Management (investment management firm), and Vice President at Fidelity Investments Institutional Services (investment management firm).
Item 4. Principal Accountant Fees and Services
(a) –(d)
The following table presents the aggregate fees billed to the registrant for the registrant’s initial fiscal period ended May 31, 2024 by the registrant’s principal accountant, Deloitte & Touche LLP (“D&T”), for professional services rendered for the audit of the registrant’s annual financial statements and fees billed for other services rendered by D&T during such periods.
Fiscal Year Ended * | 5/31/24 | |||
Audit Fees | $ | 71,500 | ||
Audit-Related Fees(1) | $ | 0 | ||
Tax Fees(2) | $ | 0 | ||
All Other Fees(3) | $ | 0 | ||
|
| |||
Total | $ | 71,500 | ||
|
| |||
| * | Fund commenced operations on September 29, 2023. |
| (1) | Audit-related fees consist of the aggregate fees billed for assurance and related services that are reasonably related to the performance of the audit of financial statements and are not reported under the category of audit fees. |
| (2) | Tax fees consist of the aggregate fees billed for professional services rendered by the principal accountant relating to tax compliance, tax advice, and tax planning and specifically include fees for tax return preparation and other related tax compliance/planning matters. |
| (3) | All other fees consist of the aggregate fees billed for products and services provided by the principal accountant other than audit, audit-related, and tax services. |
(e)(1) The registrant’s audit committee has adopted policies and procedures relating to the pre-approval of services provided by the registrant’s principal accountant (the “Pre-Approval Policies”). The Pre-Approval Policies establish a framework intended to assist the audit committee in the proper discharge of its pre-approval responsibilities. As a general matter, the Pre-Approval Policies (i) specify certain types of audit, audit-related, tax, and other services determined to be pre-approved by the audit committee; and (ii) delineate specific procedures governing the mechanics of the pre-approval process, including the approval and monitoring of audit and non-audit service fees. Unless a service is specifically pre-approved under the Pre-Approval Policies, it must be separately pre-approved by the audit committee.
The Pre-Approval Policies and the types of audit and non-audit services pre-approved therein must be reviewed and ratified by the registrant’s audit committee at least annually. The registrant’s audit committee maintains full responsibility for the appointment, compensation, and oversight of the work of the registrant’s principal accountant.
(e)(2) No services described in paragraphs (b)-(d) above were approved by the registrant’s audit committee pursuant to the “de minimis exception” set forth in Rule 2-01(c)(7)(i)(C) of Regulation S-X.
(f) Not applicable.
(g) The following table presents (i) the aggregate non-audit fees (i.e., fees for audit-related, tax, and other services) billed to the registrant by D&T for the registrant’s initial fiscal period ended May 31, 2024; and (ii) the aggregate non-audit fees (i.e., fees for audit-related, tax, and other services) billed to the Eaton Vance organization by D&T for the same time periods.
Fiscal Year Ended* | 5/31/24 | |||
Registrant | $ | 0 | ||
Eaton Vance(1) | $ | 18,490 | ||
| * | Fund commenced operations on September 29, 2023. |
| (1) | The investment adviser to the registrant, as well as any of its affiliates that provide ongoing services to the registrant, are subsidiaries of Morgan Stanley. |
(h) The registrant’s audit committee has considered whether the provision by the registrant’s principal accountant of non-audit services to the registrant’s investment adviser and any entity controlling, controlled by, or under common control with the adviser that provides ongoing services to the registrant that were not pre-approved pursuant to Rule 2-01(c)(7)(ii) of Regulation S-X is compatible with maintaining the principal accountant’s independence.
Item 5. Audit Committee of Listed Registrants
The registrant has a separately-designated standing audit committee established in accordance with Section 3(a)(58)(A) of the Securities and Exchange Act of 1934, as amended. George J. Gorman, Keith Quinton, Scott E. Wennerholm (Chair), and Nancy A. Wiser are the members of the registrant’s audit committee.
Item 6. Schedule of Investments
| (a) | Please see schedule of investments contained in the Report to Stockholders included under Item 1 of this Form N-CSR. |
| (b) | Not applicable. |
Item 7. Financial Statements and Financial Highlights for Open-End Management Investment Companies
Not applicable.
Item 8. Changes in and Disagreements with Accountants for Open-End Management Investment Companies
Not applicable.
Item 9. Proxy Disclosures for Open-End Management Investment Companies
Not applicable.
Item 10. Remuneration Paid to Directors, Officers, and Others of Open-End Management Investment Companies
Not applicable.
Item 11. Statement Regarding Basis for Approval of Investment Advisory Contract
Not applicable.
Item 12. Disclosure of Proxy Voting Policies and Procedures for Closed-End Management Investment Companies
The Board of the Fund has adopted a proxy voting policy and procedure (the “Fund Policy”), pursuant to which the trustees have delegated proxy voting responsibility to the Fund’s investment adviser and adopted the investment adviser’s proxy voting policies and procedures (the “Policies”) which are described below. The trustees will review the Policies annually. In the event that a conflict of interest arises between the Fund’s shareholders and the investment adviser, the administrator, or any of their affiliates or any affiliate of the Fund, the investment adviser will generally refrain from voting the proxies related to the companies giving rise to such conflict until it consults with the Board, or any committee, sub-committee or group of independent trustees identified by the Board, which will instruct the investment adviser on the appropriate course of action. If the Board Members are unable to meet and the failure to vote a proxy would have a material adverse impact on the Fund, the investment adviser may vote such proxy, provided that it discloses the existence of the material conflict to the Chairperson of the Fund’s Board as soon as practicable and to the Board at its next meeting.
The Policies are designed to promote accountability of a company’s management to its shareholders and to align the interests of management with those shareholders. An independent proxy voting service (“Agent”), currently Institutional Shareholder Services, Inc., has been retained to assist in the voting of proxies through the provision of vote analysis, implementation and recordkeeping and disclosure services. The investment adviser will generally vote proxies through the Agent. The Agent is required to vote all proxies in accordance with customized proxy voting guidelines (the “Guidelines”) and/or refer them back to the investment adviser pursuant to the Policies.
The Agent is required to establish and maintain adequate internal controls and policies in connection with the provision of proxy voting services, including methods to reasonably ensure that its analysis and recommendations are not influenced by a conflict of interest. The Guidelines include voting guidelines for matters relating to, among other things, the election of directors, approval of independent auditors, executive compensation, corporate structure and anti-takeover defenses. The investment adviser may cause the Fund to abstain from voting from time to time where it determines that the costs associated with voting a proxy outweigh the benefits derived from exercising the right to vote or it is unable to access or access timely ballots or other proxy information, among other stated reasons. The Agent will refer Fund proxies to the investment adviser for instructions under circumstances where, among others: (1) the application of the Guidelines is unclear; (2) a particular proxy question is not covered by the Guidelines; or (3) the Guidelines require input from the investment adviser. When a proxy voting issue has been referred to the investment adviser, the analyst (or portfolio manager if applicable) covering the company subject to the proxy proposal determines the final vote (or decision not to vote) and the investment adviser’s Proxy Administrator (described below) instructs the Agent to vote accordingly for securities held by the Fund. Where more than one analyst covers a particular company and the recommendations of such analysts voting a proposal conflict, the investment adviser’s Global Proxy Group (described below) will review such recommendations and any other available information related to the proposal and determine the manner in which it should be voted, which may result in different recommendations for the Fund that may differ from other clients of the investment adviser.
The investment adviser has appointed a Proxy Administrator to assist in the coordination of the voting of client proxies (including the Fund’s) in accordance with the Guidelines and the Policies. The investment adviser and its affiliates have also established a Global Proxy Group. The Global Proxy Group develops the investment adviser’s positions on all major corporate issues, creates the Guidelines and oversees the proxy voting process. The Proxy Administrator maintains a record of all proxy questions that have been referred by the Agent, all applicable recommendations, analysis and research received and any resolution of the matter. Before instructing the Agent to vote contrary to the Guidelines or the recommendation of the Agent, the Proxy Administrator will provide the Global Proxy Group with the Agent’s recommendation for the proposal along with any other relevant materials, including the basis for the analyst’s recommendation. The Proxy Administrator will then instruct the Agent to vote the proxy in the manner determined by the Global Proxy Group. A similar process will be followed if the Agent has a conflict of interest with respect to a proxy. The investment adviser will report to the Fund’s Board any votes cast contrary to the Guidelines or Agent recommendations, as applicable, no less than annually.
The investment adviser’s Global Proxy Group is responsible for monitoring and resolving possible material conflicts with respect to proxy voting. Because the Guidelines are predetermined and designed to be in the best interests of shareholders, application of the Guidelines to vote client proxies should, in most cases, adequately address any possible conflict of interest. The investment adviser will monitor situations that may result in a conflict of interest between any of its clients and the investment adviser or any of its affiliates by maintaining a list of significant existing and prospective corporate clients. The Proxy Administrator will compare such list with the names of companies of which he or she has been referred a proxy statement (the “Proxy Companies”). If a company on the list is also a Proxy Company, the Proxy Administrator will report that fact to the Global Proxy Group. If the Proxy Administrator intends to instruct the Agent to vote in a manner inconsistent with the Guidelines, the Global Proxy Group will first determine, in consultation with legal counsel if necessary, whether a material conflict exists. If it is determined that a material conflict exists, the investment adviser will seek instruction on how the proxy should be voted from the Fund’s Board, or any committee or subcommittee identified by the Board. If a matter is referred to the Global Proxy Group, the decision made and basis for the decision will be documented by the Proxy Administrator and/or Global Proxy Group.
Information on how the Fund voted proxies relating to portfolio securities during the most recent 12 month period ended June 30 is available (1) without charge, upon request, by calling 1-800-262-1122, and (2) on the Securities and Exchange Commission’s website at http://www.sec.gov.
Item 13. Portfolio Managers of Closed-End Management Investment Companies
Eaton Vance Management (“EVM” or “Eaton Vance”) is the investment adviser of the Fund. Edward J. Greenaway, Ralph H. Hinckley, Jr., Steve Sebo and Andrew N. Sveen comprise the investment team responsible for the overall and day-to-day management of the Fund’s investments.
Messrs. Sveen, Hinckley, Greenaway, and Sebo are Vice Presidents of EVM and have been portfolio managers of the Fund since the Fund’s inception. Messrs. Sveen, Hinckley and Greenaway have been employed by the Eaton Vance organization for more than five years. Mr. Sebo joined Eaton Vance in August 2022. Before joining Eaton Vance, he worked at Wells Fargo as a senior member of the firm’s CLO and Private Credit banking team. Prior to joining Wells Fargo, Mr. Sebo began his career in 2008 at Bank of America as a financial analyst. This information is provided as of the date of filing this report.
The following table shows, as of the Fund’s most recent fiscal year end, the number of accounts each portfolio manager managed in each of the listed categories and the total assets (in millions of dollars) in the accounts managed within each category. The table also shows the number of accounts with respect to which the advisory fee is based on the performance of the account, if any, and the total assets (in millions of dollars) in those accounts.
| Number of All Accounts | Total Assets of All Accounts | Number of Accounts Paying a Performance Fee | Total Assets of Accounts Paying a Performance Fee | |||||||||||||
Edward J. Greenaway, CFA | ||||||||||||||||
Registered Investment Companies | 2 | $ | 859.5 | 0 | $ | 0 | ||||||||||
Other Pooled Investment Vehicles | 0 | $ | 0 | 0 | $ | 0 | ||||||||||
Other Accounts | 0 | $ | 0 | 0 | $ | 0 | ||||||||||
Ralph H. Hinckley, CFA(1) | ||||||||||||||||
Registered Investment Companies | 6 | $ | 25,602.5 | 0 | $ | 0 | ||||||||||
Other Pooled Investment Vehicles | 3 | $ | 4,241.3 | 0 | $ | 0 | ||||||||||
Other Accounts | 2 | $ | 534.5 | 0 | $ | 0 | ||||||||||
Steve Sebo | ||||||||||||||||
Registered Investment Companies | 2 | $ | 859.5 | 0 | $ | 0 | ||||||||||
Other Pooled Investment Vehicles | 0 | $ | 0 | 0 | $ | 0 | ||||||||||
Other Accounts | 0 | $ | 0 | 0 | $ | 0 | ||||||||||
Andrew N. Sveen, CFA(1) | ||||||||||||||||
Registered Investment Companies | 11 | $ | 27,666.8 | 0 | $ | 0 | ||||||||||
Other Pooled Investment Vehicles | 0 | $ | 0 | 0 | $ | 0 | ||||||||||
Other Accounts | 0 | $ | 0 | 0 | $ | 0 | ||||||||||
| (1) | This portfolio manager serves as portfolio manager of one or more registered investment companies that invests or may invest in one or more underlying registered investment companies in the Eaton Vance family of funds or other pooled investment vehicles sponsored by Eaton Vance. The underlying investment companies may be managed by this portfolio manager or another portfolio manager. |
The following table shows the dollar range of Fund shares beneficially owned by the portfolio manager as of the Fund’s most recent fiscal year end.
Portfolio Manager | Dollar Range of Equity Securities Beneficially Owned in the Fund | |
| Edward J. Greenaway, CFA | None | |
| Ralph H. Hinckley, CFA | None | |
| Steve Sebi | None | |
| Andrew N. Sveen, CFA | None |
Potential for Conflicts of Interest. It is possible that conflicts of interest may arise in connection with a portfolio manager’s management of the Fund’s investments on the one hand and the investments of other accounts for which a portfolio manager is responsible on the other. For example, a portfolio manager may have conflicts of interest in allocating management time, resources and investment opportunities among the Fund and other accounts he or she advises. In addition, due to differences in the investment strategies or restrictions between the Fund and the other accounts, the portfolio manager may take action with respect to another account that differs from the action taken with respect to the Fund. In some cases, another account managed by a portfolio manager may compensate the investment adviser based on the performance of the securities held by that account. The existence of such a performance based fee may create additional conflicts of interest for the portfolio manager in the allocation of management time, resources and investment opportunities. Whenever conflicts of interest arise, the portfolio manager will endeavor to exercise his or her discretion in a manner that he or she believes is equitable to all interested persons. EVM has adopted several policies and procedures designed to address these potential conflicts including a code of ethics and policies that govern the investment adviser’s trading practices, including among other things the aggregation and allocation of trades among clients, brokerage allocations, cross trades and best execution.
Compensation Structure for EVM
The compensation structure of Eaton Vance and its affiliates that are investment advisers (for purposes of this section “Eaton Vance”) is based on a total reward system of base salary and incentive compensation, which is paid either in the form of cash bonus, or for employees meeting the specified deferred compensation eligibility threshold, partially as a cash bonus and partially as mandatory deferred compensation. Deferred compensation granted to Eaton Vance employees is generally granted as a mix of deferred cash awards under the Investment Management Alignment Plan (IMAP) and equity-based awards in the form of stock units. The portion of incentive compensation granted in the form of a deferred compensation award and the terms of such awards are determined annually by the Compensation, Management Development and Succession Committee of the Board of Directors of Eaton Vance’s parent company, Morgan Stanley.
Base salary compensation. Generally, portfolio managers and research analysts receive base salary compensation based on the level of their position with the adviser.
Incentive compensation. In addition to base compensation, portfolio managers and research analysts may receive discretionary year-end compensation. Incentive compensation may include:
| • | Cash bonus |
| • | Deferred compensation: |
| • | A mandatory program that defers a portion of incentive compensation into restricted stock units or other awards based on Morgan Stanley common stock or other plans that are subject to vesting and other conditions. |
| • | IMAP is a cash-based deferred compensation plan designed to increase the alignment of participants’ interests with the interests of clients. For eligible employees, a portion of their deferred compensation is mandatorily deferred into IMAP on an annual basis. Awards granted under IMAP are notionally invested in referenced funds available pursuant to the plan, which are funds advised by MSIM and its affiliates including Eaton Vance. Portfolio managers are required to notionally invest a minimum of 40% of their account balance in the designated funds that they manage and are included in the IMAP notional investment fund menu. |
| • | Deferred compensation awards are typically subject to vesting over a multi-year period and are subject to cancellation through the payment date for competition, cause (i.e., any act or omission that constitutes a breach of obligation to the Funds, including failure to comply with internal compliance, ethics or risk management standards, and failure or refusal to perform duties satisfactorily, including supervisory and management duties), disclosure of proprietary information, and solicitation of employees or clients. Awards are also subject to clawback through the payment date if an employee’s act or omission (including with respect to direct supervisory responsibilities) causes a restatement of the firm’s consolidated financial results, constitutes a violation of the firm’s global risk management principles, policies and standards, or causes a loss of revenue associated with a position on which the employee was paid and the employee operated outside of internal control policies. |
Eaton Vance compensates employees based on principles of pay-for-performance, market competitiveness and risk management. Eligibility for, and the amount of any, discretionary compensation is subject to a multi-dimensional process. Specifically, consideration is given to one or more of the following factors, which can vary by portfolio management team and circumstances:
| • | Revenue and profitability of the business and/or each fund/account managed by the portfolio manager |
| • | Individual contribution and performance |
| • | Contribution to client objectives |
| • | Revenue and profitability of the firm |
| • | Return on equity and risk factors of both the business units and Morgan Stanley |
| • | Assets managed by the portfolio manager |
| • | External market conditions |
| • | New business development and business sustainability |
| • | Team, product and/or Eaton Vance performance |
| • | The pre-tax investment performance of the funds/accounts managed by the portfolio manager(1) (which may, in certain cases, be measured against the applicable benchmark(s) and/or peer group(s) over one, three and five-year periods),(2) provided that for funds that are tax-managed or otherwise have an objective of after-tax returns, performance net of taxes will be considered |
Further, the firm’s Global Incentive Compensation Discretion Policy requires compensation managers to consider only legitimate, business related factors when exercising discretion in determining variable incentive compensation, including adherence to Morgan Stanley’s core values, conduct, disciplinary actions in the current performance year, risk management and risk outcomes.
| (1) | Generally, this is total return performance, provided that consideration may also be given to relative risk-adjusted performance. |
| (2) | When a fund’s peer group as determined by Lipper or Morningstar is deemed by the relevant Eaton Vance Chief Investment Officer, or in the case of the sub-advised Funds, the Director of Product Development and Sub-Advised Funds, not to provide a fair comparison, performance may instead be evaluated primarily against a custom peer group or market index. |
Item 14. Purchases of Equity Securities by Closed-End Management Investment Company and Affiliated Purchasers
No such purchases this period.
Item 15. Submission of Matters to a Vote of Security Holders
There have been no material changes to the procedures by which shareholders may recommend nominee to the Fund’s Board of Trustees.
Item 16. Controls and Procedures
| (a) | It is the conclusion of the registrant’s principal executive officer and principal financial officer that the effectiveness of the registrant’s current disclosure controls and procedures (such disclosure controls and procedures having been evaluated within 90 days of the date of this filing) provide reasonable assurance that the information required to be disclosed by the registrant has been recorded, processed, summarized and reported within the time period specified in the Commission’s rules and forms and that the information required to be disclosed by the registrant has been accumulated and communicated to the registrant’s principal executive officer and principal financial officer in order to allow timely decisions regarding required disclosure. |
| (b) | There have been no changes in the registrant’s internal controls over financial reporting during the period covered by this report that has materially affected, or is reasonably likely to materially affect, the registrant’s internal control over financial reporting. |
Item 17. Disclosure of Securities Lending Activities for Closed-End Management Investment Companies
No activity to report for the registrant’s most recent fiscal year end.
Item 18. Recovery of Erroneously Awarded Compensation
Not applicable.
Item 19. Exhibits
| (a)(1) | Registrant’s Code of Ethics – Not applicable (please see Item 2). | |
| (a)(2)(i) | Principal Financial Officer’s Section 302 certification. | |
| (a)(2)(ii) | Principal Executive Officer’s Section 302 certification. | |
| (b) | Combined Section 906 certification. | |
Signatures
Pursuant to the requirements of the Securities Exchange Act of 1934 and the Investment Company Act of 1940, the registrant has duly caused this report to be signed on its behalf by the undersigned, thereunto duly authorized.
Eaton Vance Floating-Rate Opportunities Fund
| By: | /s/ Kenneth A. Topping | |
| Kenneth A. Topping | ||
| Principal Executive Officer | ||
| Date: | July 22, 2024 | |
Pursuant to the requirements of the Securities Exchange Act of 1934 and the Investment Company Act of 1940, this report has been signed below by the following persons on behalf of the registrant and in the capacities and on the dates indicated.
| By: | /s/ James F. Kirchner | |
| James F. Kirchner | ||
| Principal Financial Officer | ||
| Date: | July 22, 2024 | |
| By: | /s/ Kenneth A. Topping | |
| Kenneth A. Topping | ||
| Principal Executive Officer | ||
| Date: | July 22, 2024 | |