UNITED STATES
SECURITIES AND EXCHANGE COMMISSION
Washington, D.C. 20549
FORM N-CSR
CERTIFIED SHAREHOLDER REPORT OF REGISTERED
MANAGEMENT INVESTMENT COMPANIES
Investment Company Act file number : 811-23862
Texas Capital Funds Trust
(Exact name of registrant as specified in charter)
2000 McKinney Avenue, Suite 700
Dallas, TX 75201
(Address of principal executive offices) (Zip code)
Neil Rajan, Secretary
Texas Capital Funds Trust
2000 McKinney Avenue, Suite 700
Dallas, TX 75201
(Name and address of agent for service)
Registrant’s telephone number, including area code: 1-945-229-5947
Date of fiscal year end: December 31
Date of reporting period: December 31, 2023
Form N-CSR is to be used by management investment companies to file reports with the Commission not later than 10 days after the transmission to stockholders of any report that is required to be transmitted to stockholders under Rule 30e-1 under the Investment Company Act of 1940 (17 CFR 270.30e-1). The Commission may use the information provided on Form N-CSR in its regulatory, disclosure review, inspection and policymaking roles.
A registrant is required to disclose the information specified by Form N-CSR, and the Commission will make this information public. A registrant is not required to respond to the collection of information contained in Form N-CSR unless the Form displays a currently valid Office of Management and Budget ("OMB") control number. Please direct comments concerning the accuracy of the information collection burden estimate and any suggestions for reducing the burden to Secretary, Securities and Exchange Commission, 450 Fifth Street, NW, Washington, DC 20549-0609. The OMB has reviewed this collection of information under the clearance requirements of 44 U.S.C. § 3507.
Item 1. Reports to Stockholders.
| (a) |

Texas Capital Texas Equity Index ETF (TXS)
NYSE Arca, Inc.
Texas Capital Texas Oil Index ETF (OILT)
NYSE Arca, Inc.
Texas Capital Texas Small Cap Equity Index ETF (TXSS)
NASDAQ Stock Market LLC
Annual Report
December 31, 2023
Fund Adviser:
Texas Capital Bank Wealth Management Services, Inc.,
doing business as Texas Capital Bank Private Wealth Advisors
2000 McKinney Avenue, Suite 1800
Dallas, TX 75201
Investment Results (Unaudited)
Total Returns* as of December 31, 2023
| Since | |
| Inception | |
| (7/12/2023) | |
| Texas Capital Texas Equity Index ETF - NAV | 6.18% |
| Texas Capital Texas Equity Index ETF - Market Price | 6.14% |
| Texas Capital Texas Equity Index(a) | 6.43% |
| Syntax US 800 MidCap Index(b) | 4.91% |
Total annual operating expenses, as disclosed in the Texas Capital Texas Equity Index ETF’s (the “Fund”) prospectus dated July 7, 2023, as amended July 14, 2023, were 0.49% of average daily net assets. Pursuant to its Advisory Agreement, Texas Capital Bank Private Wealth Advisors (the “Adviser”) pays all other expenses of the Fund other than the fee payment under the Advisory Agreement, payments under the Fund’s 12b-1 plan (if any), interest expenses, taxes, acquired fund fees and expenses, brokers’ commissions and any other transaction-related expenses and fees arising out of transactions effected on behalf of the Fund, costs of holding shareholder meetings and litigation and indemnification expenses and other extraordinary expenses not incurred in the ordinary course of the Fund’s business. Additional information pertaining to the Fund’s expense ratio as of December 31, 2023 can be found in the financial highlights.
The performance quoted represents past performance, which does not guarantee future results. The investment return and principal value of an investment will fluctuate so that an investor’s shares may be worth more or less than their original cost. The returns shown do not reflect the deduction of taxes that a shareholder would pay on the Fund distributions or the redemption of the Fund shares. Current performance of the Fund may be lower or higher than the performance quoted. Performance data current to the most recent month end may be obtained by calling (844) 822-3837. The Fund’s per share net asset value (“NAV”) is the value of one share of the Fund as calculated in accordance with the standard formula for valuing shares. The NAV return is based on the NAV of the Fund and the market return is based on the market price per share of the Fund. The price used to calculate market return (“Market Price”) is determined by using the midpoint between the highest bid and the lowest offer on the primary stock exchange on which the shares of the Fund are listed for trading, as of the time that the Fund’s NAV is calculated. Market Price and NAV returns assume that dividends and capital gain distributions have been reinvested in the Fund at Market Price and NAV, respectively. Since exchange-traded funds are bought and sold at prices set by the market, which can result in a premium or discount to NAV, the returns calculated using Market Price can differ from those calculated using NAV. For more information about current performance, holdings or historical premiums/discounts, please visit the Fund’s website at https://www.texascapitalbank.com.
| * | Return figures reflect any change in price per share and assume the reinvestment of all distributions. Total returns for less than one year are not annualized. |
| (a) | The Texas Capital Texas Equity Index (the “Index”) is a diversified, float-adjusted sector and market-capitalization weighted index designed to reflect the performance of stocks in companies that are headquartered in Texas, as reflected in relevant federal and state regulatory filings. The Index will exclude companies whose market capitalization, float, trading volume, transferability restrictions or other impediments could diminish portfolio performance. The Index is the intellectual property of the Adviser. The creation, construction and maintenance of the Index is provided by Syntax (“Index Provider”), a separate company with separate personnel that is unaffiliated with the Adviser. |
1
Investment Results (Unaudited) (continued)
| (b) | The Syntax US MidCap 800 Index (SY800) measures the float-adjusted market capitalization-weighted performance of the 201st- through 1000th-largest and sufficiently liquid publicly traded entities in the United States as defined according to Syntax’s proprietary country classification methodology, which considers regulatory filings, currencies of accounting and distribution, and use of tax havens. |
The Fund’s investment objectives, strategies, risks, charges and expenses must be considered carefully before investing. The prospectus contains this and other important information about the Fund and may be obtained by calling (844) 822-3837. Please read it carefully before investing.
The Fund is distributed by Northern Lights Distributors, LLC, Member FINRA/SIPC.
2
Investment Results (Unaudited) (continued)
Total Returns* as of December 31, 2023
| Since | |
| Inception | |
| (12/20/2023) | |
| Texas Capital Texas Oil Index ETF - NAV | 0.08% |
| Texas Capital Texas Oil Index ETF - Market Price | 0.69% |
| Alerian Texas Weighted Oil & Gas Index(a) | 0.08% |
Total annual operating expenses, as disclosed in the Texas Capital Texas Oil Index ETF’s (the “Fund”) prospectus dated December 18, 2023, as amended December 22, 2023, were 0.35% of average daily net assets. Pursuant to its Advisory Agreement, Texas Capital Bank Private Wealth Advisors (the “Adviser”) pays all other expenses of the Fund other than the fee payment under the Advisory Agreement, payments under the Fund’s 12b-1 plan (if any), interest expenses, taxes, acquired fund fees and expenses, brokers’ commissions and any other transaction-related expenses and fees arising out of transactions effected on behalf of the Fund, costs of holding shareholder meetings and litigation and indemnification expenses and other extraordinary expenses not incurred in the ordinary course of the Fund’s business. Additional information pertaining to the Fund’s expense ratio as of December 31, 2023 can be found in the financial highlights.
The performance quoted represents past performance, which does not guarantee future results. The investment return and principal value of an investment will fluctuate so that an investor’s shares may be worth more or less than their original cost. The returns shown do not reflect the deduction of taxes that a shareholder would pay on the Fund distributions or the redemption of the Fund shares. Current performance of the Fund may be lower or higher than the performance quoted. Performance data current to the most recent month end may be obtained by calling (844) 822-3837. The Fund’s per share net asset value (“NAV”) is the value of one share of the Fund as calculated in accordance with the standard formula for valuing shares. The NAV return is based on the NAV of the Fund and the market return is based on the market price per share of the Fund. The price used to calculate market return (“Market Price”) is determined by using the midpoint between the highest bid and the lowest offer on the primary stock exchange on which the shares of the Fund are listed for trading, as of the time that the Fund’s NAV is calculated. Market Price and NAV returns assume that dividends and capital gain distributions have been reinvested in the Fund at Market Price and NAV, respectively. Since exchange-traded funds are bought and sold at prices set by the market, which can result in a premium or discount to NAV, the returns calculated using Market Price can differ from those calculated using NAV. For more information about current performance, holdings or historical premiums/discounts, please visit the Fund’s website at https://www.texascapitalbank.com.
| * | Return figures reflect any change in price per share and assume the reinvestment of all distributions. Total returns for less than one year are not annualized. |
| (a) | The Alerian Texas Weighted Oil & Gas Index (the “Index”) is an economic-value weighted index providing exposure to companies that extract oil and gas within Texas. Each company in the Index must be a publicly traded constituent of the VettaFi Global Developed 5000 Index and responsible for more than 0.1% of the annual state oil and gas production of Texas over the past 10 years based on data published by the Texas Railroad Commission. The creation, construction and maintenance of the Index is provided by VettaFi, LLC (“Index Provider”), a separate company with separate personnel that is unaffiliated with the Adviser. |
The Fund’s investment objectives, strategies, risks, charges and expenses must be considered carefully before investing. The prospectus contains this and other important information about the Fund and may be obtained by calling (844) 822-3837. Please read it carefully before investing.
The Fund is distributed by Northern Lights Distributors, LLC, Member FINRA/SIPC.
3
Investment Results (Unaudited) (continued)
Total Returns* as of December 31, 2023
| Since | |
| Inception | |
| (12/20/2023) | |
| Texas Capital Texas Small Cap Equity Index ETF - NAV | 1.99% |
| Texas Capital Texas Small Cap Equity Index ETF - Market Price | 2.07% |
| Texas Capital Texas Small Cap Equity Index(a) | 2.00% |
| Syntax US SmallCap 2000 Total Return Index(b) | 2.84% |
Total annual operating expenses, as disclosed in the Texas Capital Texas Small Cap Equity Index ETF’s (the “Fund”) prospectus dated December 18, 2023, as amended December 22, 2023, were 0.49% of average daily net assets. Pursuant to its Advisory Agreement, Texas Capital Bank Private Wealth Advisors (the “Adviser”) pays all other expenses of the Fund other than the fee payment under the Advisory Agreement, payments under the Fund’s 12b-1 plan (if any), interest expenses, taxes, acquired fund fees and expenses, brokers’ commissions and any other transaction-related expenses and fees arising out of transactions effected on behalf of the Fund, costs of holding shareholder meetings and litigation and indemnification expenses and other extraordinary expenses not incurred in the ordinary course of the Fund’s business. Additional information pertaining to the Fund’s expense ratio as of December 31, 2023 can be found in the financial highlights.
The performance quoted represents past performance, which does not guarantee future results. The investment return and principal value of an investment will fluctuate so that an investor’s shares when redeemed, may be worth more or less than their original cost. The returns shown do not reflect the deduction of taxes that a shareholder would pay on the Fund distributions or the redemption of the Fund shares. Current performance of the Fund may be lower or higher than the performance quoted. Performance data current to the most recent month end may be obtained by calling (844) 822-3837. The Fund’s per share net asset value (“NAV”) is the value of one share of the Fund as calculated in accordance with the standard formula for valuing shares. The NAV return is based on the NAV of the Fund and the market return is based on the market price per share of the Fund. The price used to calculate market return (“Market Price”) is determined by using the midpoint between the highest bid and the lowest offer on the primary stock exchange on which the shares of the Fund are listed for trading, as of the time that the Fund’s NAV is calculated. Market Price and NAV returns assume that dividends and capital gain distributions have been reinvested in the Fund at Market Price and NAV, respectively. Since exchange-traded funds are bought and sold at prices set by the market, which can result in a premium or discount to NAV, the returns calculated using Market Price can differ from those calculated using NAV. For more information about current performance, holdings or historical premiums/discounts, please visit the Fund’s website at https://www.texascapitalbank.com.
| * | Return figures reflect any change in price per share and assume the reinvestment of all distributions. Total returns for less than one year are not annualized. |
| (a) | The Texas Capital Texas Small Cap Equity Index (the “Index”) is a diversified, float-adjusted sector and market-capitalization weighted index designed to reflect the performance primarily of stocks in small-capitalization companies that that are headquartered in Texas, as reflected in relevant federal and state regulatory filings. Small-capitalization companies for purposes of the Index are those that have a capitalization smaller than the 800th largest company in the Index universe by market capitalization. The Index is the intellectual property of the Adviser. The creation, construction and maintenance of the Index is provided by Syntax (“Index Provider”), a separate company with separate personnel that is unaffiliated with the Adviser. |
| (b) | The Syntax US SmallCap 2000 Index float market cap-weights the 1001 st-3000th largest public US companies as ranked by their float market caps, subject to rank buffers and liquidity screens. |
4
Investment Results (Unaudited) (continued)
Companies are defined as US according to Syntax’s proprietary country classification methodology considering regulatory filings, currencies of accounting and distribution, and tax havens.
The Fund’s investment objectives, strategies, risks, charges and expenses must be considered carefully before investing. The prospectus contains this and other important information about the Fund and may be obtained by calling (844) 822-3837. Please read it carefully before investing.
The Fund is distributed by Northern Lights Distributors, LLC, Member FINRA/SIPC
5
Fund Holdings (Unaudited)
Texas Capital Texas Equity Index ETF Holdings as of December 31, 2023*
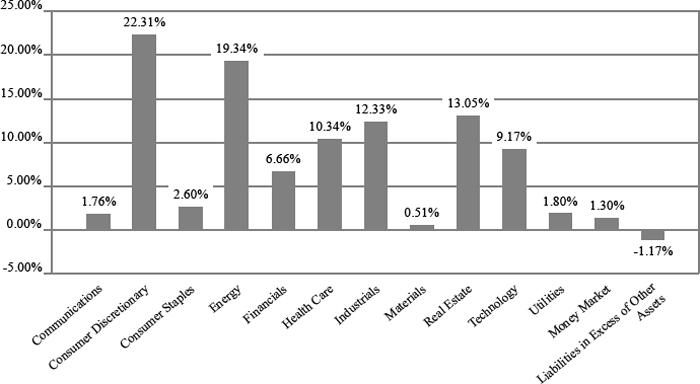
| * | As a percentage of net assets. |
The investment objective of the Texas Capital Texas Equity Index ETF is to seek to provide investment results that, before fees and expenses, correspond generally to the total return performance of the Texas Capital Texas Equity Index.
Texas Capital Texas Oil Index ETF Holdings as of December 31, 2023*
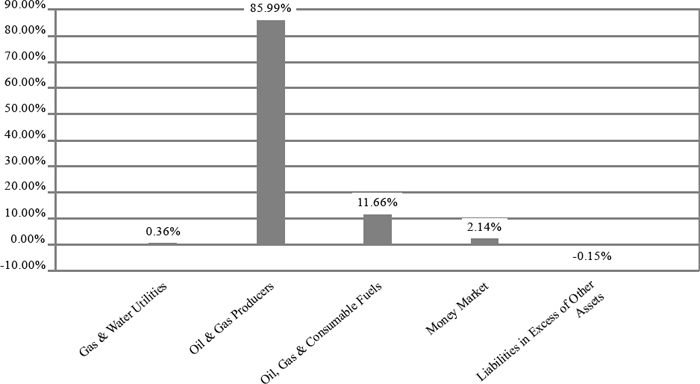
| * | As a percentage of net assets. |
6
Fund Holdings (Unaudited)
The investment objective of the Texas Capital Texas Oil Index ETF is to seek to provide investment results that, before fees and expenses, correspond generally to the total return performance of the Alerian Texas Weighted Oil and Gas Index.
Texas Capital Texas Small Cap Equity Index ETF Holdings as of December 31, 2023*
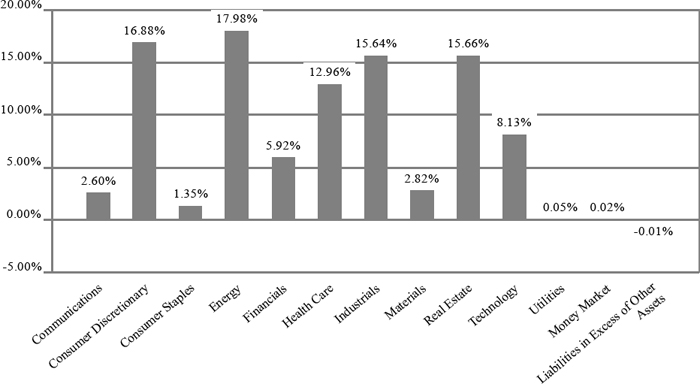
| * | As a percentage of net assets. |
The investment objective of the Texas Capital Texas Small Cap Equity Index ETF is to seek to provide investment results that, before fees and expenses, correspond generally to the total return performance of the Texas Capital Texas Small Cap Equity Index.
Availability of Portfolio Schedule (Unaudited)
The Funds file a complete schedule of portfolio holdings with the Securities and Exchange Commission (the “SEC”) for the first and third quarters of each fiscal year as an exhibit to their reports on Form N-PORT. The Funds’ Form N-PORT reports are available on the SEC’s website at http://www.sec.gov or on the Funds’ website at https://www.texascapitalbank.com.
7
| Texas Capital Texas Equity Index ETF |
| Schedule of Investments |
| December 31, 2023 |
| COMMON STOCKS — 99.87% | Shares | Fair Value | ||||||
| Communications — 1.76% | ||||||||
| AST SpaceMobile, Inc., Class A(a) | 1,961 | $ | 11,825 | |||||
| AT&T, Inc. | 15,194 | 254,955 | ||||||
| Clear Channel Outdoor Holdings, Inc.(a) | 6,210 | 11,302 | ||||||
| Frontier Communications Parent, Inc.(a) | 510 | 12,924 | ||||||
| Match Group, Inc.(a) | 580 | 21,170 | ||||||
| Nexstar Media Group, Inc. | 71 | 11,129 | ||||||
| Thryv Holdings, Inc.(a) | 436 | 8,873 | ||||||
| 332,178 | ||||||||
| Consumer Discretionary — 22.31% | ||||||||
| Academy Sports & Outdoors, Inc. | 5,676 | 374,616 | ||||||
| Brinker International, Inc.(a) | 2,340 | 101,041 | ||||||
| Builders FirstSource, Inc.(a) | 165 | 27,545 | ||||||
| Chuy’s Holdings, Inc.(a) | 914 | 34,942 | ||||||
| Cinemark Holdings, Inc.(a) | 628 | 8,849 | ||||||
| Copart, Inc.(a) | 1,791 | 87,759 | ||||||
| D.R. Horton, Inc. | 3,124 | 474,786 | ||||||
| Dave & Buster’s Entertainment, Inc.(a) | 1,281 | 68,982 | ||||||
| European Wax Center, Inc., Class A(a) | 999 | 13,576 | ||||||
| Forestar Group, Inc.(a) | 304 | 10,053 | ||||||
| GameStop Corp., Class A(a) | 20,953 | 367,306 | ||||||
| Green Brick Partners, Inc.(a) | 417 | 21,659 | ||||||
| Group 1 Automotive, Inc. | 1,048 | 319,368 | ||||||
| LGI Homes, Inc.(a) | 206 | 27,431 | ||||||
| Microvast Holdings, Inc.(a) | 7,347 | 10,286 | ||||||
| RCI Hospitality Holdings, Inc. | 439 | 29,088 | ||||||
| Rush Enterprises, Inc., Class A | 5,590 | 281,177 | ||||||
| Sally Beauty Holdings, Inc.(a) | 8,193 | 108,803 | ||||||
| Service Corp. International | 5,215 | 356,967 | ||||||
| Six Flags Entertainment Corp.(a) | 2,273 | 57,007 | ||||||
| Target Hospitality Corp.(a) | 1,959 | 19,061 | ||||||
| Tesla, Inc.(a) | 3,737 | 928,569 | ||||||
| Upbound Group, Inc. | 372 | 12,637 | ||||||
| Wingstop, Inc. | 1,607 | 412,324 | ||||||
| XPEL, Inc.(a) | 759 | 40,872 | ||||||
| YETI Holdings, Inc.(a) | 191 | 9,890 | ||||||
| 4,204,594 | ||||||||
| Consumer Staples — 2.60% | ||||||||
| Darling Ingredients, Inc.(a) | 201 | 10,018 | ||||||
| Kimberly-Clark Corp. | 457 | 55,530 | ||||||
| Quanex Building Products Corp. | 299 | 9,140 | ||||||
| Sysco Corp. | 5,524 | 403,970 | ||||||
| Vital Farms, Inc.(a) | 698 | 10,952 | ||||||
| 489,610 | ||||||||
| Energy — 19.34% | ||||||||
| APA Corp. | 816 | 29,278 | ||||||
| Archrock, Inc. | 705 | 10,857 | ||||||
See accompanying notes which are an integral part of these financial statements.
8
| Texas Capital Texas Equity Index ETF |
| Schedule of Investments (continued) |
| December 31, 2023 |
| COMMON STOCKS — 99.87% - continued | Shares | Fair Value | ||||||
| Energy — 19.34% - continued | ||||||||
| Atlas Energy Solutions, Inc. | 521 | $ | 8,972 | |||||
| Baker Hughes Co., Class A | 2,682 | 91,671 | ||||||
| Berry Corp. | 1,308 | 9,195 | ||||||
| Callon Petroleum Co.(a) | 300 | 9,720 | ||||||
| ChampionX Corp. | 315 | 9,201 | ||||||
| Cheniere Energy, Inc. | 2,610 | 445,553 | ||||||
| Chord Energy Corp. | 115 | 19,117 | ||||||
| Comstock Resources, Inc. | 984 | 8,708 | ||||||
| ConocoPhillips | 2,956 | 343,103 | ||||||
| Coterra Energy, Inc. | 1,955 | 49,892 | ||||||
| Crescent Energy Co., Class A | 814 | 10,753 | ||||||
| CVR Energy, Inc. | 255 | 7,727 | ||||||
| Diamond Offshore Drilling, Inc. (a) | 757 | 9,841 | ||||||
| Diamondback Energy, Inc. | 452 | 70,096 | ||||||
| Dril-Quip, Inc.(a) | 427 | 9,936 | ||||||
| EOG Resources, Inc. | 1,550 | 187,473 | ||||||
| Expro Group Holdings N.V.(a) | 1,147 | 18,260 | ||||||
| Exxon Mobil Corp. | 5,393 | 539,192 | ||||||
| Granite Ridge Resources, Inc. | 1,494 | 8,994 | ||||||
| Halliburton Co. | 2,337 | 84,483 | ||||||
| Helix Energy Solutions Group, Inc.(a) | 1,010 | 10,383 | ||||||
| Hess Midstream, L.P., Class A | 291 | 9,204 | ||||||
| HF Sinclair Corp. | 197 | 10,947 | ||||||
| Kinder Morgan, Inc. | 18,398 | 324,541 | ||||||
| Kinetik Holdings, Inc., Class A | 269 | 8,985 | ||||||
| Kodiak Gas Services, Inc. | 484 | 9,719 | ||||||
| Magnolia Oil & Gas Corp., Class A | 470 | 10,006 | ||||||
| Marathon Oil Corp. | 1,509 | 36,457 | ||||||
| Matador Resources Co. | 281 | 15,978 | ||||||
| MRC Global, Inc.(a) | 1,005 | 11,065 | ||||||
| Murphy Oil Corp. | 361 | 15,400 | ||||||
| Newpark Resources, Inc.(a) | 1,422 | 9,442 | ||||||
| Noble Corp. plc | 290 | 13,967 | ||||||
| NOV, Inc. | 493 | 9,998 | ||||||
| NOW, Inc.(a) | 1,127 | 12,758 | ||||||
| Occidental Petroleum Corp. | 1,707 | 101,925 | ||||||
| Oceaneering International, Inc.(a) | �� | 465 | 9,895 | |||||
| Oil States International, Inc.(a) | 1,361 | 9,241 | ||||||
| Par Pacific Holdings, Inc. (a) | 239 | 8,692 | ||||||
| Patterson-UTI Energy, Inc. | 1,079 | 11,653 | ||||||
| Permian Resources Corp., Class A | 1,024 | 13,926 | ||||||
| Phillips 66 | 565 | 75,224 | ||||||
| Pioneer Natural Resources Co. | 618 | 138,976 | ||||||
| ProPetro Holding Corp.(a) | 904 | 7,576 | ||||||
| Range Resources Corp. | 618 | 18,812 | ||||||
| Schlumberger Ltd. | 3,768 | 196,087 | ||||||
| Select Water Solutions, Inc., Class A | 1,248 | 9,472 | ||||||
See accompanying notes which are an integral part of these financial statements
9
| Texas Capital Texas Equity Index ETF |
| Schedule of Investments (continued) |
| December 31, 2023 |
| COMMON STOCKS — 99.87% - continued | Shares | Fair Value | ||||||
| Energy — 19.34% - continued | ||||||||
| SilverBow Resources, Inc.(a) | 304 | $ | 8,840 | |||||
| Southwestern Energy Co.(a) | 2,661 | 17,430 | ||||||
| Sunnova Energy International, Inc.(a) | 736 | 11,224 | ||||||
| Talos Energy, Inc.(a) | 727 | 10,345 | ||||||
| Targa Resources Corp. | 1,972 | 171,308 | ||||||
| TETRA Technologies, Inc.(a) | 1,846 | 8,344 | ||||||
| Texas Pacific Land Corp. | 117 | 183,976 | ||||||
| Thermon Group Holdings, Inc.(a) | 341 | 11,106 | ||||||
| Tidewater, Inc.(a) | 139 | 10,023 | ||||||
| U.S. Silica Holdings, Inc.(a) | 830 | 9,387 | ||||||
| VAALCO Energy, Inc. | 1,963 | 8,814 | ||||||
| Valero Energy Corp. | 441 | 57,330 | ||||||
| Vertex Energy, Inc.(a) | 2,757 | 9,346 | ||||||
| Viper Energy, Inc. | 300 | 9,414 | ||||||
| W&T Offshore, Inc. | 2,734 | 8,913 | ||||||
| Weatherford International PLC(a) | 182 | 17,805 | ||||||
| 3,645,956 | ||||||||
| Financials — 6.66% | ||||||||
| Applied Digital Corp.(a) | 1,585 | 10,683 | ||||||
| Charles Schwab Corp. (The) | 9,520 | 654,976 | ||||||
| Comerica, Inc. | 852 | 47,550 | ||||||
| Corebridge Financial, Inc. | 1,766 | 38,252 | ||||||
| Cullen/Frost Bankers, Inc. | 381 | 41,335 | ||||||
| EZCORP, Inc., Class A(a) | 1,025 | 8,958 | ||||||
| First Financial Bankshares, Inc. | 895 | 27,118 | ||||||
| First Foundation, Inc. | 1,330 | 12,874 | ||||||
| FirstCash Holdings, Inc. | 249 | 26,989 | ||||||
| Globe Life, Inc. | 614 | 74,736 | ||||||
| Goosehead Insurance, Inc., Class A(a) | 161 | 12,204 | ||||||
| Hilltop Holdings, Inc. | 355 | 12,500 | ||||||
| Independent Bank Group, Inc. | 279 | 14,195 | ||||||
| International Bancshares Corp. | 408 | 22,163 | ||||||
| Mr. Cooper Group, Inc.(a) | 413 | 26,895 | ||||||
| National Western Life Group, Inc., Class A | 18 | 8,694 | ||||||
| Prosperity Bancshares, Inc. | 564 | 38,200 | ||||||
| Skyward Specialty Insurance Group, Inc.(a) | 357 | 12,095 | ||||||
| Southside Bancshares, Inc. | 289 | 9,051 | ||||||
| Stellar Bancorp, Inc. | 381 | 10,607 | ||||||
| Stewart Information Services Corp. | 209 | 12,279 | ||||||
| TPG, Inc., Class A | 2,322 | 100,241 | ||||||
| Triumph Financial, Inc.(a) | 160 | 12,829 | ||||||
| Veritex Holdings, Inc. | 451 | 10,495 | ||||||
| Victory Capital Holdings, Inc., Class A | 287 | 9,884 | ||||||
| 1,255,803 | ||||||||
| Health Care — 10.34% | ||||||||
| Addus HomeCare Corp.(a) | 1,334 | 123,862 | ||||||
| Agilon Health, Inc.(a) | 25,494 | 319,950 | ||||||
See accompanying notes which are an integral part of these financial statements
10
| Texas Capital Texas Equity Index ETF |
| Schedule of Investments (continued) |
| December 31, 2023 |
| COMMON STOCKS — 99.87% - continued | Shares | Fair Value | ||||||
| Health Care — 10.34% - continued | ||||||||
| AMN Healthcare Services, Inc.(a) | 340 | $ | 25,459 | |||||
| Cassava Sciences, Inc.(a) | 550 | 12,381 | ||||||
| Castle Biosciences, Inc.(a) | 479 | 10,337 | ||||||
| Enhabit, Inc.(a) | 4,104 | 42,476 | ||||||
| Integer Holdings Corp.(a) | 95 | 9,412 | ||||||
| McKesson Corp. | 1,385 | 641,227 | ||||||
| Natera, Inc.(a) | 148 | 9,271 | ||||||
| Tenet Healthcare Corp.(a) | 8,444 | 638,113 | ||||||
| U.S. Physical Therapy, Inc. | 1,247 | 116,146 | ||||||
| 1,948,634 | ||||||||
| Industrials — 12.33% | ||||||||
| AECOM | 1,684 | 155,652 | ||||||
| Alamo Group, Inc. | 56 | 11,771 | ||||||
| American Airlines Group, Inc.(a) | 5,691 | 78,194 | ||||||
| Arcosa, Inc. | 504 | 41,651 | ||||||
| AZZ, Inc. | 193 | 11,212 | ||||||
| Cactus, Inc., Class A | 221 | 10,034 | ||||||
| Caterpillar, Inc. | 693 | 204,899 | ||||||
| CECO Environmental Corp.(a) | 630 | 12,776 | ||||||
| Comfort Systems USA, Inc. | 367 | 75,481 | ||||||
| CSW Industrials, Inc. | 54 | 11,200 | ||||||
| Evolv Technologies Holdings, Inc., Class A(a) | 1,759 | 8,303 | ||||||
| Flowserve Corp. | 214 | 8,821 | ||||||
| Fluor Corp.(a) | 2,075 | 81,278 | ||||||
| Insperity, Inc. | 427 | 50,053 | ||||||
| Jacobs Solutions, Inc. | 1,463 | 189,897 | ||||||
| KBR, Inc. | 1,632 | 90,429 | ||||||
| Kirby Corp.(a) | 547 | 42,929 | ||||||
| Lennox International, Inc. | 47 | 21,033 | ||||||
| Powell Industries, Inc. | 116 | 10,254 | ||||||
| Primoris Services Corp. | 491 | 16,306 | ||||||
| Quanta Services, Inc. | 1,531 | 330,390 | ||||||
| Southwest Airlines Co. | 5,607 | 161,930 | ||||||
| Sterling Infrastructure, Inc.(a) | 302 | 26,555 | ||||||
| Trinity Industries, Inc. | 358 | 9,519 | ||||||
| Waste Management, Inc. | 3,702 | 663,028 | ||||||
| 2,323,595 | ||||||||
| Materials — 0.51% | ||||||||
| ATI, Inc.(a) | 202 | 9,185 | ||||||
| Celanese Corp. | 149 | 23,150 | ||||||
| Commercial Metals Co. | 196 | 9,808 | ||||||
| Eagle Materials, Inc. | 53 | 10,750 | ||||||
| Encore Wire Corp. | 56 | 11,962 | ||||||
| Huntsman Corp. | 338 | 8,494 | ||||||
| Uranium Energy Corp.(a) | 1,925 | 12,320 | ||||||
| Westlake Corp. | 70 | 9,797 | ||||||
| 95,466 | ||||||||
See accompanying notes which are an integral part of these financial statements.
11
| Texas Capital Texas Equity Index ETF |
| Schedule of Investments (continued) |
| December 31, 2023 |
| COMMON STOCKS — 99.87% - continued | Shares | Fair Value | ||||||
| Real Estate — 13.05% | ||||||||
| Camden Property Trust | 1,605 | $ | 159,360 | |||||
| CBRE Group, Inc., Class A(a) | 4,349 | 404,849 | ||||||
| Crown Castle International Corp. | 6,582 | 758,181 | ||||||
| Digital Realty Trust, Inc. | 4,597 | 618,664 | ||||||
| Howard Hughes Holdings, Inc.(a) | 717 | 61,339 | ||||||
| Invitation Homes, Inc. | 9,288 | 316,814 | ||||||
| NETSTREIT Corp. | 1,043 | 18,618 | ||||||
| NexPoint Residential Trust, Inc. | 303 | 10,432 | ||||||
| Spirit Realty Capital, Inc. | 2,123 | 92,754 | ||||||
| Summit Hotel Properties, Inc. | 1,446 | 9,717 | ||||||
| Whitestone REIT | 780 | 9,586 | ||||||
| 2,460,314 | ||||||||
| Technology — 9.17% | ||||||||
| Alkami Technology, Inc.(a) | 506 | 12,271 | ||||||
| Applied Optoelectronics, Inc.(a) | 518 | 10,008 | ||||||
| BigCommerce Holdings, Inc.(a) | 829 | 8,066 | ||||||
| Bumble, Inc., Class A(a) | 640 | 9,434 | ||||||
| Cirrus Logic, Inc.(a) | 120 | 9,983 | ||||||
| Crowdstrike Holdings, Inc., Class A(a) | 2,820 | 720,002 | ||||||
| Dell Technologies, Inc., Class C | 329 | 25,168 | ||||||
| Digital Turbine, Inc.(a) | 1,493 | 10,242 | ||||||
| Diodes, Inc.(a) | 131 | 10,548 | ||||||
| E2open Parent Holdings, Inc., Class A(a) | 2,364 | 10,378 | ||||||
| Green Dot Corp., Class A(a) | 972 | 9,623 | ||||||
| Hewlett Packard Enterprise Co. | 1,746 | 29,647 | ||||||
| Omnicell, Inc.(a) | 587 | 22,089 | ||||||
| Open Lending Corp.(a) | 1,340 | 11,403 | ||||||
| Oracle Corp. | 3,331 | 351,187 | ||||||
| PROS Holdings, Inc.(a) | 262 | 10,163 | ||||||
| Q2 Holdings, Inc.(a) | 267 | 11,591 | ||||||
| Sabre Corp.(a) | 2,539 | 11,172 | ||||||
| Silicon Laboratories, Inc.(a) | 80 | 10,582 | ||||||
| SolarWinds Corp.(a) | 829 | 10,354 | ||||||
| TaskUs, Inc., Class A(a) | 831 | 10,861 | ||||||
| Texas Instruments, Inc. | 1,236 | 210,688 | ||||||
| Tyler Technologies, Inc.(a) | 487 | 203,624 | ||||||
| 1,729,084 | ||||||||
| Utilities — 1.80% | ||||||||
| Atmos Energy Corp. | 819 | 94,922 | ||||||
| CenterPoint Energy, Inc. | 3,494 | 99,823 | ||||||
| NRG Energy, Inc. | 1,324 | 68,451 | ||||||
| Vistra Corp. | 1,957 | 75,384 | ||||||
| 338,580 | ||||||||
| Total Common Stocks— 99.87% (Cost $17,795,411) | 18,823,814 | |||||||
See accompanying notes which are an integral part of these financial statements.
12
| Texas Capital Texas Equity Index ETF |
| Schedule of Investments (continued) |
| December 31, 2023 |
| WARRANT - 0.00%(b) | Shares | Fair Value | ||||||
| Health Care — 0.00%(b) | ||||||||
| Cassava Sciences, Inc. Expiration Date 11/15/24(c) | 220 | $ | — | |||||
| Total Warrant Cost ($–) | — | |||||||
| MONEY MARKET FUNDS - 1.30% | ||||||||
| State Street Institutional U.S. Government Money Market Fund, | ||||||||
| Opportunity Class, 5.29%(d) | 245,307 | 245,307 | ||||||
| Total Money Market Funds (Cost $245,307) | 245,307 | |||||||
| Total Investments — 101.17% (Cost $18,040,718) | 19,069,121 | |||||||
| Liabilities in Excess of Other Assets — (1.17)% | (221,268 | ) | ||||||
| NET ASSETS — 100.00% | $ | 18,847,853 | ||||||
| (a) | Non-income producing security. |
| (b) | Less than 0.005%. |
| (c) | Security is currently being valued according to the fair value procedures of the Adviser, as the Fund’s “Valuation Designee”, under oversight of the Board. |
| (d) | Rate disclosed is the seven day effective yield as of December 31, 2023. |
REIT - Real Estate Investment Trust
See accompanying notes which are an integral part of these financial statements.
13
| Texas Capital Texas Oil Index ETF |
| Schedule of Investments |
| December 31, 2023 |
| COMMON STOCKS — 98.01% | Shares | Fair Value | ||||||
| Gas & Water Utilities — 0.36% | ||||||||
| Tokyo Gas Company Ltd. - ADR | 78 | $ | 892 | |||||
| Oil & Gas Producers — 85.99% | ||||||||
| APA Corp. | 287 | 10,298 | ||||||
| BP PLC - ADR | 204 | 7,222 | ||||||
| Callon Petroleum Co.(a) | 308 | 9,979 | ||||||
| Chesapeake Energy Corp. | 143 | 11,002 | ||||||
| Comstock Resources, Inc. | 372 | �� | 3,292 | |||||
| ConocoPhillips | 150 | 17,411 | ||||||
| Coterra Energy, Inc. | 219 | 5,589 | ||||||
| Crescent Energy Co. | 132 | 1,744 | ||||||
| Devon Energy Corp. | 268 | 12,140 | ||||||
| Diamondback Energy, Inc. | 112 | 17,369 | ||||||
| EOG Resources, Inc. | 120 | 14,514 | ||||||
| Exxon Mobil Corp. | 152 | 15,197 | ||||||
| Kinder Morgan, Inc. | 296 | 5,221 | ||||||
| Magnolia Oil & Gas Corp., Class A | 149 | 3,172 | ||||||
| Marathon Oil Corp. | 488 | 11,790 | ||||||
| Matador Resources Co. | 18 | 1,024 | ||||||
| Murphy Oil Corp. | 95 | 4,053 | ||||||
| Occidental Petroleum Corp. | 282 | 16,838 | ||||||
| Ovintiv, Inc. | 203 | 8,916 | ||||||
| Permian Resources Corp. | 404 | 5,494 | ||||||
| Repsol S.A. - ADR | 134 | 1,990 | ||||||
| Riley Exploration Permian, Inc. | 54 | 1,471 | ||||||
| Ring Energy, Inc.(a) | 988 | 1,442 | ||||||
| SilverBow Resources, Inc.(a) | 84 | 2,443 | ||||||
| SM Energy Co. | 334 | 12,932 | ||||||
| Total S.A. - ADR | 46 | 3,100 | ||||||
| Vital Energy, Inc.(a) | 161 | 7,324 | ||||||
| 212,967 | ||||||||
| Oil, Gas & Consumable Fuels — 11.66% | ||||||||
| Chevron Corp. | 82 | 12,231 | ||||||
| Pioneer Natural Resources Co. | 74 | 16,641 | ||||||
| 28,872 | ||||||||
| Total Common Stocks— 98.01% (Cost $242,595) | 242,731 | |||||||
| MONEY MARKET FUNDS — 2.14% | ||||||||
| State Street Institutional U.S. Government Money Market Fund, Opportunity Class, 5.29%(b) | 5,309 | 5,309 | ||||||
| Total Money Market Funds (Cost $5,309) | 5,309 | |||||||
| Total Investments — 100.15% (Cost $247,904) | 248,040 | |||||||
| Liabilities in Excess of Other Assets — (0.15)% | (371 | ) | ||||||
| NET ASSETS — 100.00% | $ | 247,669 | ||||||
| (a) | Non-income producing security. |
| (b) | Rate disclosed is the seven day effective yield as of December 31, 2023. |
ADR - American Depositary Receipt.
See accompanying notes which are an integral part of these financial statements.
14
| Texas Capital Texas Small Cap Equity Index ETF |
| Schedule of Investments |
| December 31, 2023 |
| COMMON STOCKS — 99.99% | Shares | Fair Value | ||||||
| Communications — 2.60% | ||||||||
| AST SpaceMobile, Inc.(a) | 106 | $ | 639 | |||||
| Clear Channel Outdoor Holdings, Inc.(a) | 2,184 | 3,975 | ||||||
| iHeartMedia, Inc., Class A(a) | 124 | 331 | ||||||
| Nexstar Media Group, Inc. | 30 | 4,702 | ||||||
| Thryv Holdings, Inc.(a) | 168 | 3,419 | ||||||
| 13,066 | ||||||||
| Consumer Discretionary — 16.88% | ||||||||
| Academy Sports & Outdoors, Inc. | 126 | 8,316 | ||||||
| Brinker International, Inc.(a) | 218 | 9,413 | ||||||
| Carriage Services, Inc. | 82 | 2,051 | ||||||
| Chuy’s Holdings, Inc.(a) | 86 | 3,288 | ||||||
| Cinemark Holdings, Inc.(a) | 136 | 1,916 | ||||||
| Dave & Buster’s Entertainment, Inc.(a) | 36 | 1,939 | ||||||
| European Wax Center, Inc.(a) | 192 | 2,609 | ||||||
| Forestar Group, Inc.(a) | 30 | 992 | ||||||
| GameStop Corp., Class A(a) | 466 | 8,169 | ||||||
| Green Brick Partners, Inc.(a) | 70 | 3,636 | ||||||
| Group 1 Automotive, Inc. | 24 | 7,314 | ||||||
| Landesa Home Corp.(a) | 26 | 342 | ||||||
| LGI Homes, Inc.(a) | 34 | 4,527 | ||||||
| Microvast Holdings, Inc.(a) | 240 | 336 | ||||||
| RCI Hospitality Holdings, Inc. | 42 | 2,783 | ||||||
| Rent-A-Center, Inc. | 46 | 1,563 | ||||||
| Rush Enterprises, Inc., Class A | 158 | 7,947 | ||||||
| Sally Beauty Holdings, Inc.(a) | 236 | 3,134 | ||||||
| Six Flags Entertainment Corp.(a) | 66 | 1,655 | ||||||
| Solo Brands, Inc., Class A(a) | 46 | 283 | ||||||
| Target Hospitality Corp.(a) | 184 | 1,790 | ||||||
| XPEL, Inc.(a) | 134 | 7,216 | ||||||
| YETI Holdings, Inc.(a) | 70 | 3,625 | ||||||
| 84,844 | ||||||||
| Consumer Staples — 1.35% | ||||||||
| Quanex Building Products Corp. | 34 | 1,039 | ||||||
| Vital Farms, Inc.(a) | 366 | 5,743 | ||||||
| 6,782 | ||||||||
| Energy — 17.98% | ||||||||
| Amplify Energy Corp.(a) | 46 | 273 | ||||||
| Archrock, Inc. | 168 | 2,587 | ||||||
| Atlas Energy Solutions, Inc. | 66 | 1,136 | ||||||
| Berry Corp. | 70 | 492 | ||||||
| Callon Petroleum Co.(a) | 76 | 2,462 | ||||||
| Comstock Resources, Inc. | 120 | 1,062 | ||||||
| Crescent Energy Co. | 90 | 1,189 | ||||||
| CVR Energy, Inc. | 104 | 3,151 | ||||||
| Diamond Offshore Drilling, Inc. (a) 126 | 1,638 | |||||||
| Dril-Quip, Inc.(a) | 34 | 791 | ||||||
See accompanying notes which are an integral part of these financial statements
15
| Texas Capital Texas Small Cap Equity Index ETF |
| Schedule of Investments (continued) |
| December 31, 2023 |
| COMMON STOCKS — 99.99% - continued | Shares | Fair Value | ||||||
| Energy — 17.98% - continued | ||||||||
| Evolution Petroleum Corp. | 2 | $ | 11 | |||||
| Excelerate Energy, Inc., Class A | 56 | 866 | ||||||
| Expro Group Holdings N.V.(a) | 182 | 2,897 | ||||||
| Granite Ridge Resources, Inc. | 72 | 433 | ||||||
| Helix Energy Solutions Group, Inc.(a) | 176 | 1,809 | ||||||
| Hess Midstream, L.P., Class A | 80 | 2,530 | ||||||
| Kinetik Holdings, Inc. | 88 | 2,939 | ||||||
| KLX Energy Services Holdings, Inc.(a) | 26 | 293 | ||||||
| Kodiak Gas Services, Inc. | 22 | 442 | ||||||
| Magnolia Oil & Gas Corp., Class A | 168 | 3,577 | ||||||
| MRC Global, Inc.(a) | 1,192 | 13,124 | ||||||
| Newpark Resources, Inc.(a) | 84 | 558 | ||||||
| NOW, Inc.(a) | 1,502 | 17,003 | ||||||
| Oceaneering International, Inc.(a) | 102 | 2,171 | ||||||
| Oil States International, Inc.(a) | 64 | 435 | ||||||
| Par Pacific Holdings, Inc. (a) | 56 | 2,037 | ||||||
| Patterson-UTI Energy, Inc. | 396 | 4,277 | ||||||
| ProPetro Holding Corp.(a) | 102 | 855 | ||||||
| Ranger Energy Services, Inc. | 188 | 1,923 | ||||||
| Ring Energy, Inc.(a) | 174 | 254 | ||||||
| Select Energy Services, Inc., Class A | 106 | 805 | ||||||
| SilverBow Resources, Inc.(a) | 26 | 756 | ||||||
| Solaris Oilfield Infrastructure, Inc., Class A | 36 | 287 | ||||||
| Sunnova Energy International, Inc.(a) | 118 | 1,799 | ||||||
| Talos Energy, Inc.(a) | 116 | 1,651 | ||||||
| TETRA Technologies, Inc.(a) | 144 | 651 | ||||||
| Thermon Group Holdings, Inc.(a) | 34 | 1,107 | ||||||
| Tidewater, Inc.(a) | 64 | 4,615 | ||||||
| U.S. Silica Holdings, Inc.(a) | 92 | 1,040 | ||||||
| VAALCO Energy, Inc. | 120 | 539 | ||||||
| Vertex Energy, Inc.(a) | 90 | 305 | ||||||
| Viper Energy, Inc. | 102 | 3,201 | ||||||
| W&T Offshore, Inc. | 122 | 398 | ||||||
| 90,369 | ||||||||
| Financials — 5.92% | ||||||||
| Applied Blockchain, Inc.(a) | 88 | 593 | ||||||
| EZCORP, Inc., Class A(a) | 48 | 420 | ||||||
| First Financial Bankshares, Inc. | 104 | 3,151 | ||||||
| First Foundation, Inc. | 52 | 503 | ||||||
| FirstCash Holdings, Inc. | 28 | 3,035 | ||||||
| Goosehead Insurance, Inc., Class A(a) | 22 | 1,667 | ||||||
| Hilltop Holdings, Inc. | 44 | 1,549 | ||||||
| Independent Bank Group, Inc. | 34 | 1,730 | ||||||
| International Bancshares Corp. | 48 | 2,607 | ||||||
| Mr. Cooper Group, Inc.(a) | 48 | 3,126 | ||||||
| National Western Life Group, Inc., Class A | 4 | 1,932 | ||||||
| P10, Inc. | 44 | 450 | ||||||
See accompanying notes which are an integral part of these financial statements.
16
| Texas Capital Texas Small Cap Equity Index ETF |
| Schedule of Investments (continued) |
| December 31, 2023 |
| COMMON STOCKS — 99.99% - continued | Shares | Fair Value | ||||||
| Financials — 5.92% - continued | ||||||||
| Skyward Specialty Insurance Group, Inc.(a) | 28 | $ | 949 | |||||
| Southside Bancshares, Inc. | 28 | 877 | ||||||
| Stellar Bancorp, Inc. | 46 | 1,281 | ||||||
| Stewart Information Services Corp. | 26 | 1,527 | ||||||
| Triumph Bancorp, Inc.(a) | 22 | 1,764 | ||||||
| Veritex Holdings, Inc. | 50 | 1,164 | ||||||
| Victory Capital Holdings, Inc., Class A | 42 | 1,446 | ||||||
| 29,771 | ||||||||
| Health Care — 12.96% | ||||||||
| Addus HomeCare Corp.(a) | 78 | 7,242 | ||||||
| agilon health, inc.(a) | 1,480 | 18,574 | ||||||
| AMN Healthcare Services, Inc.(a) | 256 | 19,169 | ||||||
| Atrion Corp. | 2 | 758 | ||||||
| Cassava Sciences, Inc.(a) | 204 | 4,592 | ||||||
| Castle Biosciences, Inc.(a) | 26 | 561 | ||||||
| Enhabit, Inc.(a) | 242 | 2,505 | ||||||
| Integer Holdings Corp.(a) | 34 | 3,369 | ||||||
| Lexicon Pharmaceuticals, Inc.(a) | 2 | 3 | ||||||
| Savara, Inc.(a) | 138 | 649 | ||||||
| Taysha Gene Therapies, Inc.(a) | 586 | 1,037 | ||||||
| U.S. Physical Therapy, Inc. | 72 | 6,706 | ||||||
| 65,165 | ||||||||
| Industrials — 15.64% | ||||||||
| Alamo Group, Inc. | 10 | 2,102 | ||||||
| Arcosa, Inc. | 62 | 5,124 | ||||||
| AZZ, Inc. | 26 | 1,510 | ||||||
| Bristow Group, Inc.(a) | 92 | 2,601 | ||||||
| Cactus, Inc., Class A | 64 | 2,906 | ||||||
| CECO Environmental Corp.(a) | 32 | 649 | ||||||
| CSW Industrials, Inc. | 16 | 3,318 | ||||||
| Daseke, Inc.(a) | 126 | 1,020 | ||||||
| Distribution Solutions Group, Inc.(a) | 148 | 4,671 | ||||||
| DXP Enterprises, Inc.(a) | 186 | 6,268 | ||||||
| Ennis, Inc. | 26 | 570 | ||||||
| Evolv Technologies Holdings, Inc.(a) | 108 | 510 | ||||||
| Flowserve Corp. | 108 | 4,452 | ||||||
| Great Lakes Dredge & Dock Corp.(a) | 108 | 829 | ||||||
| IES Holdings, Inc.(a) | 32 | 2,535 | ||||||
| Insperity, Inc. | 142 | 16,645 | ||||||
| Kirby Corp.(a) | 152 | 11,929 | ||||||
| Powell Industries, Inc. | 10 | 884 | ||||||
| Primoris Services Corp. | 82 | 2,723 | ||||||
| SEACOR Marine Holdings, Inc.(a) | 74 | 932 | ||||||
| Sterling Construction Co., Inc.(a) | 48 | 4,221 | ||||||
| Trinity Industries, Inc. | 84 | 2,234 | ||||||
| 78,633 | ||||||||
See accompanying notes which are an integral part of these financial statements.
17
| Texas Capital Texas Small Cap Equity Index ETF |
| Schedule of Investments (continued) |
| December 31, 2023 |
| COMMON STOCKS — 99.99% - continued | Shares | Fair Value | ||||||
| Materials — 2.82% | ||||||||
| Encore Wire Corp. | 16 | $ | 3,418 | |||||
| Huntsman Corp. | 134 | 3,367 | ||||||
| United States Lime & Minerals, Inc. | 2 | 461 | ||||||
| Uranium Energy Corp.(a) | 468 | 2,995 | ||||||
| Westlake Chemical Corp. | 28 | 3,919 | ||||||
| 14,160 | ||||||||
| Real Estate — 15.66% | ||||||||
| Howard Hughes Holdings, Inc.(a) | 510 | 43,630 | ||||||
| NETSTREIT Corp. | 736 | 13,138 | ||||||
| NexPoint Residential Trust, Inc. | 244 | 8,401 | ||||||
| Summit Hotel Properties, Inc. | 1,118 | 7,513 | ||||||
| Whitestone REIT | 494 | 6,071 | ||||||
| 78,753 | ||||||||
| Technology — 8.13% | ||||||||
| Alkami Technology, Inc.(a) | 56 | 1,358 | ||||||
| Applied Optoelectronics, Inc.(a) | 38 | 734 | ||||||
| Asure Software, Inc.(a) | 28 | 267 | ||||||
| Aviat Networks, Inc.(a) | 12 | 392 | ||||||
| BigCommerce Holdings, Inc.(a) | 84 | 817 | ||||||
| Bumble, Inc., Class A(a) | 162 | 2,388 | ||||||
| Cirrus Logic, Inc.(a) | 44 | 3,660 | ||||||
| CS Disco, Inc.(a) | 38 | 288 | ||||||
| Digital Turbine, Inc.(a) | 122 | 837 | ||||||
| Diodes, Inc.(a) | 46 | 3,704 | ||||||
| E2open Parent Holdings, Inc.(a) | 234 | 1,027 | ||||||
| Green Dot Corp., Class A(a) | 42 | 416 | ||||||
| Omnicell, Inc.(a) | 228 | 8,580 | ||||||
| Open Lending Corp.(a) | 96 | 817 | ||||||
| PROS Holdings, Inc.(a) | 52 | 2,017 | ||||||
| Q2 Holdings, Inc.(a) | 70 | 3,039 | ||||||
| Rackspace Technology, Inc.(a) | 990 | 1,980 | ||||||
| Sabre Corp.(a) | 464 | 2,042 | ||||||
| Silicon Laboratories, Inc.(a) | 32 | 4,233 | ||||||
| SolarWinds Corp.(a) | 56 | 699 | ||||||
| TaskUs, Inc.(a) | 120 | 1,568 | ||||||
| Upland Software, Inc.(a) | 2 | 9 | ||||||
| 40,872 | ||||||||
| Utilities — 0.05% | ||||||||
| Aris Water Solution, Inc., Class A | 32 | 269 | ||||||
| Total Common Stocks— 99.99% (Cost $492,905) | 502,684 | |||||||
| WARRANT - 0.00%(b) | Shares | Fair Value | ||||||
| Health Care — 0.00%(b) | ||||||||
| Cassava Sciences, Inc. Expiration Date 11/15/24(c) | 81 | $ | — | |||||
| Total Warrant Cost ($–) | — | |||||||
See accompanying notes which are an integral part of these financial statements.
18
| Texas Capital Texas Small Cap Equity Index ETF |
| Schedule of Investments (continued) |
| December 31, 2023 |
| MONEY MARKET FUNDS - 0.02% | Shares | Fair Value | ||||||
| State Street Institutional U.S. Government Money Market Fund, Opportunity Class, 5.29%(d) | 120 | $ | 120 | |||||
| Total Money Market Funds (Cost $120) | 120 | |||||||
| Total Investments — 100.01% (Cost $493,025) | 502,804 | |||||||
| Liabilities in Excess of Other Assets — (0.01)% | (48 | ) | ||||||
| NET ASSETS — 100.00% | $ | 502,756 | ||||||
| (a) | Non-income producing security. |
| (b) | Less than 0.005%. |
| (c) | Security is currently being valued according to the fair value procedures of the Adviser, as the Fund’s “Valuation Designee”, under oversight of the Board. |
| (d) | Rate disclosed is the seven day effective yield as of December 31, 2023. |
REIT - Real Estate Investment Trust
See accompanying notes which are an integral part of these financial statements.
19
| Texas Capital Funds Trust |
| Statements of Assets and Liabilities |
| December 31, 2023 |
| Texas | Texas | |||||||||||
| Capital | Texas | Capital | ||||||||||
| Texas | Capital | Texas Small | ||||||||||
| Equity | Texas Oil | Cap Equity | ||||||||||
| Index ETF | Index ETF | Index ETF | ||||||||||
| Assets | ||||||||||||
| Investments in securities, at fair value (cost $18,040,718, $247,904 and $493,025) | $ | 19,069,121 | $ | 248,040 | $ | 502,804 | ||||||
| Dividends and interest receivable | 17,495 | 32 | 26 | |||||||||
| Tax reclaims receivable | — | 3 | — | |||||||||
| Total Assets | 19,086,616 | 248,075 | 502,830 | |||||||||
| Liabilities | ||||||||||||
| Payable for investments purchased | 231,126 | 379 | — | |||||||||
| Payable to Adviser | 7,637 | 27 | 74 | |||||||||
| Total Liabilities | 238,763 | 406 | 74 | |||||||||
| Net Assets | $ | 18,847,853 | $ | 247,669 | $ | 502,756 | ||||||
| Net Assets consist of: | ||||||||||||
| Paid-in capital | 17,841,355 | 247,525 | 492,977 | |||||||||
| Accumulated earnings | 1,006,498 | 144 | 9,779 | |||||||||
| Net Assets | $ | 18,847,853 | $ | 247,669 | $ | 502,756 | ||||||
| Shares outstanding (unlimited number of shares authorized, no par value) | 714,000 | 10,000 | 20,000 | |||||||||
| Net asset value per share | $ | 26.40 | $ | 24.77 | $ | 25.14 | ||||||
See accompanying notes which are an integral part of these financial statements.
20
| Texas Capital Funds Trust |
| Statements of Operations |
| For the Period Ended December 31, 2023 |
| Texas | Texas | |||||||||||
| Capital | Texas | Capital | ||||||||||
| Texas | Capital | Texas Small | ||||||||||
| Equity | Texas Oil | Cap Equity | ||||||||||
| Index ETF(a) | Index ETF(b) | Index ETF(b) | ||||||||||
| Investment Income | ||||||||||||
| Dividend income (net of foreign taxes withheld of $–, $6 and $–) | $ | 118,820 | $ | 31 | $ | 26 | ||||||
| Interest income | 1,062 | 4 | — | |||||||||
| Total investment income | 119,882 | 35 | 26 | |||||||||
| Expenses | ||||||||||||
| Advisory fees | 33,999 | 27 | 74 | |||||||||
| Total operating expenses | 33,999 | 27 | 74 | |||||||||
| Net investment income (loss) | 85,883 | 8 | (48 | ) | ||||||||
| Net Realized and Change in Unrealized Gain (Loss) on Investments | ||||||||||||
| Net realized loss on investment securities | (29,176 | ) | — | — | ||||||||
| Net realized gain from in-kind redemptions | 218,651 | — | — | |||||||||
| Change in unrealized appreciation on investment securities | 1,028,403 | 136 | 9,779 | |||||||||
| Net realized and change in unrealized gain (loss) on investment securities | 1,217,878 | 136 | 9,779 | |||||||||
| Net increase in net assets resulting from operations | $ | 1,303,761 | $ | 144 | $ | 9,731 | ||||||
| (a) | For the period July 12, 2023 (commencement of operations) to December 31, 2023. |
| (b) | For the period December 20, 2023 (commencement of operations) to December 31, 2023. |
See accompanying notes which are an integral part of these financial statements.
21
| Texas Capital Funds Trust |
| Statements of Changes in Net Assets |
| Texas Capital | ||||||||||||
| Texas Capital | Texas Capital | Texas Small | ||||||||||
| Texas Equity | Texas Oil | Cap Equity | ||||||||||
| Index ETF | Index ETF | Index ETF | ||||||||||
| For the | For the | For the | ||||||||||
| Period Ended | Period Ended | Period Ended | ||||||||||
| December 31, | December 31, | December 31, | ||||||||||
| 2023(a) | 2023(b) | 2023(b) | ||||||||||
| Increase (Decrease) in Net Assets due to: | ||||||||||||
| Operations | ||||||||||||
| Net investment income (loss) | $ | 85,883 | $ | 8 | $ | (48 | ) | |||||
| Net realized loss on investment securities | (29,176 | ) | — | — | ||||||||
| Net realized gain from in-kind redemptions | 218,651 | — | — | |||||||||
| Change in unrealized appreciation on investment securities | 1,028,403 | 136 | 9,779 | |||||||||
| Net increase in net assets resulting from operations | 1,303,761 | 144 | 9,731 | |||||||||
| Distributions to Shareholders from Earnings | (87,885 | ) | — | — | ||||||||
| Capital Transactions | ||||||||||||
| Proceeds from shares sold | 18,797,389 | 247,525 | 493,025 | |||||||||
| Amount paid for shares redeemed | (1,265,412 | ) | — | — | ||||||||
| Net increase in net assets resulting from capital transactions | 17,531,977 | 247,525 | 493,025 | |||||||||
| Total Increase in Net Assets | 18,747,853 | 247,669 | 502,756 | |||||||||
| Net Assets | ||||||||||||
| Beginning of period | $ | 100,000 | $ | — | $ | — | ||||||
| End of period | $ | 18,847,853 | $ | 247,669 | $ | 502,756 | ||||||
| Share Transactions | ||||||||||||
| Shares sold | 764,000 | 10,000 | 20,000 | |||||||||
| Shares redeemed | (50,000 | ) | — | — | ||||||||
| Net increase in shares outstanding | 714,000 | 10,000 | 20,000 | |||||||||
| (a) | For the period July 12, 2023 (commencement of operations) to December 31, 2023. |
| (b) | For the period December 20, 2023 (commencement of operations) to December 31, 2023. |
See accompanying notes which are an integral part of these financial statements.
22
| Texas Capital Texas Equity Index ETF |
| Financial Highlights |
| (For a share outstanding during the period) |
| For the | ||||
| Period | ||||
| Ended | ||||
| December | ||||
| 31, 2023(a) | ||||
| Selected Per Share Data: | ||||
| Net asset value, beginning of period | $ | 25.00 | ||
| Investment operations: | ||||
| Net investment income | 0.14 | |||
| Net realized and unrealized gain on investments | 1.40 | |||
| Total from investment operations | 1.54 | |||
| Less distributions to shareholders from: | ||||
| Net investment income | (0.14 | ) | ||
| Total distributions | (0.14 | ) | ||
| Net asset value, end of period | $ | 26.40 | ||
| Market price, end of period | $ | 26.39 | ||
| Total Return(b) | 6.18 | % (c) | ||
| Ratios and Supplemental Data: | ||||
| Net assets, end of period (000 omitted) | $ | 18,848 | ||
| Ratio of expenses to average net assets | 0.49 | % (d) | ||
| Ratio of net investment income to average net assets | 1.24 | % (d) | ||
| Portfolio turnover rate(e) | 3 | % (c) | ||
| (a) | For the period July 12, 2023 (commencement of operations) to December 31, 2023. |
| (b) | Total return is calculated assuming a purchase of shares at net asset value on the first day and a sale at net asset value on the last day of the period. Distributions are assumed, for the purpose of this calculation, to be reinvested at the ex-dividend date net asset value per share on their respective payment dates. |
| (c) | Not annualized. |
| (d) | Annualized. |
| (e) | Portfolio turnover rate excludes securities received or delivered from in-kind processing of creations or redemptions. |
See accompanying notes which are an integral part of these financial statements.
23
| Texas Capital Texas Oil Index ETF |
| Financial Highlights |
| (For a share outstanding during the period) |
| For the | ||||
| Period | ||||
| Ended | ||||
| December | ||||
| 31, 2023(a) | ||||
| Selected Per Share Data: | ||||
| Net asset value, beginning of period | $ | 24.75 | ||
| Investment operations: | ||||
| Net investment income | —(b) | |||
| Net realized and unrealized gain on investments | 0.02 | |||
| Total from investment operations | 0.02 | |||
| Net asset value, end of period | $ | 24.77 | ||
| Market price, end of period | $ | 24.92 | ||
| Total Return(c) | 0.08 | % (d) | ||
| Ratios and Supplemental Data: | ||||
| Net assets, end of period (000 omitted) | $ | 248 | ||
| Ratio of expenses to average net assets | 0.35 | % (e) | ||
| Ratio of net investment income to average net assets | 0.11 | % (e) | ||
| Portfolio turnover rate(f) | — | % (d) | ||
| (a) | For the period December 20, 2023 (commencement of operations) to December 31, 2023. |
| (b) | Rounds to less than $0.005. |
| (c) | Total return is calculated assuming a purchase of shares at net asset value on the first day and a sale at net asset value on the last day of the period. Distributions are assumed, for the purpose of this calculation, to be reinvested at the ex-dividend date net asset value per share on their respective payment dates. |
| (d) | Not annualized. |
| (e) | Annualized. |
| (f) | Portfolio turnover rate excludes securities received or delivered from in-kind processing of creations or redemptions. |
See accompanying notes which are an integral part of these financial statements.
24
| Texas Capital Texas Small Cap Equity Index ETF |
| Financial Highlights |
| (For a share outstanding during the period) |
| For the | ||||
| Period | ||||
| Ended | ||||
| December | ||||
| 31, 2023(a) | ||||
| Selected Per Share Data: | ||||
| Net asset value, beginning of period | $ | 24.65 | ||
| Investment operations: | ||||
| Net investment income | —(b) | |||
| Net realized and unrealized gain on investments | 0.49 | |||
| Total from investment operations | 0.49 | |||
| Net asset value, end of period | $ | 25.14 | ||
| Market price, end of period | $ | 25.16 | ||
| Total Return(c) | 1.99 | % (d) | ||
| Ratios and Supplemental Data: | ||||
| Net assets, end of period (000 omitted) | $ | 503 | ||
| Ratio of expenses to average net assets | 0.49 | % (e) | ||
| Ratio of net investment loss to average net assets | (0.32 | )% (e) | ||
| Portfolio turnover rate(f) | — | % (d) | ||
| (a) | For the period December 20, 2023 (commencement of operations) to December 31, 2023. |
| (b) | Rounds to less than $0.005. |
| (c) | Total return is calculated assuming a purchase of shares at net asset value on the first day and a sale at net asset value on the last day of the period. Distributions are assumed, for the purpose of this calculation, to be reinvested at the ex-dividend date net asset value per share on their respective payment dates. |
| (d) | Not annualized. |
| (e) | Annualized. |
| (f) | Portfolio turnover rate excludes securities received or delivered from in-kind processing of creations or redemptions. |
See accompanying notes which are an integral part of these financial statements.
25
| Texas Capital Funds Trust |
| Notes to the Financial Statements |
| December 31, 2023 |
NOTE 1. ORGANIZATION
Texas Capital Texas Equity Index ETF, Texas Capital Texas Oil Index ETF and Texas Capital Texas Small Cap Equity Index ETF (each a “Fund” and collectively, the “Funds”) are each registered under the Investment Company Act of 1940, as amended (the “1940 Act”) as a diversified series of Texas Capital Funds Trust (the “Trust”), except for the Texas Capital Texas Oil Index ETF, which is non-diversified. The Texas Capital Texas Equity Index ETF commenced operations on July 12, 2023. The Texas Capital Texas Oil Index ETF and the Texas Capital Texas Small Cap Equity Index ETF commenced operations on December 20, 2023. The Trust is an open-end investment management company established under the laws of Delaware by an Agreement and Declaration of Trust dated March 21, 2023, as amended (the “Trust Agreement”). The Trust Agreement permits the Board of Trustees of the Trust (the “Board”) to issue an unlimited number of shares of beneficial interest of separate series. The Funds’ investment adviser is Texas Capital Bank Wealth Management Services, Inc., doing business as Texas Capital Bank Private Wealth Advisors (the “Adviser”). The investment objective of the Texas Capital Texas Equity Index ETF is to seek to provide investment results that, before fees and expenses, correspond generally to the total return performance of the Texas Capital Texas Equity Index. The investment objective of the Texas Capital Texas Oil Index ETF is to seek to provide investment results that, before fees and expenses, correspond generally to the total return performance of the Alerian Texas Weighted Oil and Gas Index. The investment objective of the Texas Capital Texas Small Cap Equity Index ETF is to seek to provide investment results that, before fees and expenses, correspond generally to the total return performance of the Texas Capital Texas Small Cap Equity Index.
NOTE 2. SIGNIFICANT ACCOUNTING POLICIES
The Funds are investment companies and follow accounting and reporting guidance under Financial Accounting Standards Board Accounting Standards Codification (“ASC”) Topic 946, “Financial Services-Investment Companies”. The following is a summary of significant accounting policies followed by the Funds in the preparation of their financial statements. These policies are in conformity with generally accepted accounting principles in the United States of America (“GAAP”).
Regulatory Update – Tailored Shareholder Reports for Mutual Funds and Exchange-Traded Funds (“ETFs”) – Effective January 24, 2023, the SEC adopted rule and form amendments that will result in changes to the design and delivery of shareholder reports of mutual funds and ETFs, requiring them to transmit concise and visually engaging streamlined annual and semiannual reports to shareholders that highlight key information. Other information, including financial statements, will no longer appear in a streamlined shareholder report but must be available online, delivered free of charge upon request,
26
| Texas Capital Funds Trust |
| Notes to the Financial Statements (continued) |
| December 31, 2023 |
and filed on a semi-annual basis on Form N-CSR. The rule and form amendments have a compliance date of July 24, 2024.
Estimates – The preparation of financial statements in conformity with GAAP requires management to make estimates and assumptions that affect the reported amounts of assets and liabilities and disclosure of contingent assets and liabilities at the date of the financial statements and the reported amounts of increases and decreases in net assets from operations during the reporting period. Actual results could differ from those estimates.
Federal Income Taxes – The Funds make no provision for federal income or excise tax. Each Fund has qualified and intends to qualify each year as a regulated investment company (“RIC”) under subchapter M of the Internal Revenue Code of 1986, as amended, by complying with the requirements applicable to RICs and by distributing substantially all of its taxable income. Each Fund also intends to distribute sufficient net investment income and net capital gains, if any, so that it will not be subject to excise tax on undistributed income and gains. If the required amount of net investment income or gains is not distributed, the Funds could incur a tax expense.
As of and during the fiscal period ended December 31, 2023, the Funds did not have any liabilities for any unrecognized tax benefits. The Funds recognize interest and penalties, if any, related to unrecognized tax benefits as income tax expense in the Statements of Operations when incurred. During the fiscal period ended December 31, 2023, the Funds did not incur any interest or penalties. Management of the Funds has reviewed tax positions taken in tax years that remain subject to examination by all major tax jurisdictions, including federal (i.e., the interim tax period since inception, as applicable) and has concluded that no provision for unrecognized tax benefits or expenses is required in these financial statements and does not expect this to change over the next twelve months. The Funds’ federal tax returns for the current fiscal year remain subject to examination by the Internal Revenue Service.
Security Transactions and Related Income – The Funds follow industry practice and record security transactions on the trade date for financial reporting purposes. The specific identification method is used for determining gains or losses for financial statement and income tax purposes. Dividend income is recorded on the ex-dividend date and interest income is recorded on an accrual basis. Non-cash income, if any, is recorded at the fair market value of the securities received. Withholding taxes on foreign dividends, if any, have been provided for in accordance with the Funds’ understanding of the applicable country’s tax rules and rates.
Dividends and Distributions – The Texas Capital Texas Equity Index ETF and the Texas Capital Texas Small Cap Equity Index ETF each typically distribute net investment
27
| Texas Capital Funds Trust |
| Notes to the Financial Statements (continued) |
| December 31, 2023 |
income and any realized net capital gains annually. The Texas Capital Texas Oil Index ETF typically distributes net investment income quarterly and any realized net capital gains annually. Distributions to shareholders, which are determined in accordance with income tax regulations, are recorded on the ex-dividend date. The treatment for financial reporting purposes of distributions made to shareholders during the year from net investment income or net realized capital gains may differ from their ultimate treatment for federal income tax purposes. Where such differences are permanent in nature; they are reclassified in the components of net assets based on their ultimate characterization for federal income tax purposes. Any such reclassifications will have no effect on net assets, results of operations, or net asset values (“NAV”) per share of the Funds.
For the fiscal period ended of December 31, 2023, the Funds made the following reclassifications to increase (decrease) the components of net assets:
| Accumulated | ||||||||
| Earnings | ||||||||
| Paid-In Capital | (Deficit) | |||||||
| Texas Capital Texas Equity Index ETF | $ | 209,378 | $ | (209,378 | ) | |||
| Texas Capital Texas Oil Index ETF | — | — | ||||||
| Texas Capital Texas Small Cap Equity Index ETF | (48 | ) | 48 | |||||
NOTE 3. SECURITIES VALUATION AND FAIR VALUE MEASUREMENTS
Each Fund values its portfolio securities at fair value as of the close of regular trading on the New York Stock Exchange (“NYSE”) (normally 4:00 p.m. Eastern Time) on each business day the NYSE is open for business. Fair value is defined as the price that a Fund would receive upon selling an investment or transferring a liability in a timely transaction to an independent buyer in the principal or most advantageous market of the investment. GAAP establishes a three-tier hierarchy to maximize the use of observable market data and minimize the use of unobservable inputs and to establish classification of fair value measurements for disclosure purposes.
Inputs refer broadly to the assumptions that market participants would use in pricing the asset or liability, including assumptions about risk (the risk inherent in a particular valuation technique used to measure fair value including a pricing model and/or the risk inherent in the inputs to the valuation technique). Inputs may be observable or unobservable. Observable inputs are inputs that reflect the assumptions market participants would use in pricing the asset or liability developed based on market data obtained and available from sources independent of the reporting entity. Unobservable inputs are inputs that reflect the reporting entity’s own assumptions about the assumptions market participants would use in pricing the asset or liability developed based on the best information available in the
28
| Texas Capital Funds Trust |
| Notes to the Financial Statements (continued) |
| December 31, 2023 |
circumstances. A financial instrument’s level within the fair value hierarchy is based upon the lowest level of any input that is significant to the fair value measurement.
Various inputs are used in determining the value of each Fund’s investments. These inputs are summarized in the three broad levels listed below.
| ● | Level 1 – unadjusted quoted prices in active markets for identical investments and/or registered investment companies where the value per share is determined and published and is the basis for current transactions for identical assets or liabilities at the valuation date |
| ● | Level 2 – other significant observable inputs (including, but not limited to, quoted prices for an identical security in an inactive market, quoted prices for similar securities, interest rates, prepayment speeds, credit risk, etc.) |
| ● | Level 3 – significant unobservable inputs (including the Funds’ own assumptions in determining fair value of investments based on the best information available) |
The inputs used to measure fair value may fall into different levels of the fair value hierarchy. In such cases, for disclosure purposes, the level in the fair value hierarchy which is reported is determined based on the lowest level input that is significant to the fair value measurement in its entirety.
In computing the NAV of the Funds, fair value is based on market valuations with respect to portfolio securities for which market quotations are readily available. Pursuant to Board approved policies, the Funds rely on independent third-party pricing services to provide the current market value of securities. Those pricing services value equity securities, including ETFs, exchange-traded notes, closed-end funds and preferred stocks, traded on a securities exchange at the last reported sales price on the principal exchange. Equity securities quoted by Nasdaq are valued at the Nasdaq Official Closing Price. If there is no reported sale on the principal exchange, equity securities are valued at the mean between the most recent quoted bid and asked price. When using market quotations or close prices provided by the pricing service and when the market is considered active, the security will be classified as a Level 1 security. Investments in open-end mutual funds, including money market mutual funds, are generally priced at the ending NAV provided by the pricing service of the funds and are generally categorized as Level 1 securities.
In the event that market quotations are not readily available or are considered unreliable due to market or other events, securities are valued in good faith by the Adviser as “valuation designee” under the oversight of the Board. The Adviser has adopted written policies and procedures for valuing securities and other assets in circumstances where market quotes are not readily available or are deemed not to reflect market value. In the
29
| Texas Capital Funds Trust |
| Notes to the Financial Statements (continued) |
| December 31, 2023 |
event that market quotes are not readily available or are deemed not to reflect market value, and the security or asset cannot be valued pursuant to one of the valuation methods, the value of the security or asset will be determined in good faith by the Adviser pursuant to its policies and procedures. Under these policies, the securities will be classified as Level 2 or 3 within the fair value hierarchy, depending on the inputs used.
The following is a summary of the inputs used to value the Funds’ investments as of December 31, 2023:
| Valuation Inputs | ||||||||||||||||
| Assets | Level 1 | Level 2 | Level 3 | Total | ||||||||||||
| Texas Capital Texas Equity Index ETF | ||||||||||||||||
| Common Stocks (a) | $ | 18,823,814 | $ | — | $ | — | $ | 18,823,814 | ||||||||
| Money Market Funds | 245,307 | — | — | 245,307 | ||||||||||||
| Warrant | — | — | — | (b) | — | |||||||||||
| Total | $ | 19,069,121 | $ | — | $ | — | $ | 19,069,121 | ||||||||
| Valuation Inputs | ||||||||||||||||
| Assets | Level 1 | Level 2 | Level 3 | Total | ||||||||||||
| Texas Capital Texas Oil Index ETF | ||||||||||||||||
| Common Stocks (a) | $ | 242,731 | $ | — | $ | — | $ | 242,731 | ||||||||
| Money Market Funds | 5,309 | — | — | 5,309 | ||||||||||||
| Total | $ | 248,040 | $ | — | $ | — | $ | 248,040 | ||||||||
| Valuation Inputs | ||||||||||||||||
| Assets | Level 1 | Level 2 | Level 3 | Total | ||||||||||||
| Texas Capital Texas Small Cap Equity Index ETF | ||||||||||||||||
| Common Stocks (a) | $ | 502,684 | $ | — | $ | — | $ | 502,684 | ||||||||
| Money Market Funds | 120 | — | — | 120 | ||||||||||||
| Warrant | — | — | — | (b) | — | |||||||||||
| Total | $ | 502,804 | $ | — | $ | — | $ | 502,804 | ||||||||
| (a) | Refer to Schedule of Investments for sector classifications. |
| (b) | Cassava Sciences, Inc. is currently being fair valued according to the fair value procedures of the Adviser, as “Valuation Designee”, under oversight of the Board. |
30
| Texas Capital Funds Trust |
| Notes to the Financial Statements (continued) |
| December 31, 2023 |
NOTE 4. FEES AND OTHER TRANSACTIONS WITH AFFILIATES AND OTHER SERVICE PROVIDERS
The Adviser, under the terms of the Advisory Agreement with the Trust with respect to each Fund (the “Agreement”), manages the Funds’ investments. As compensation for its management services, each Fund pays the Adviser a unitary management fee based on each Fund’s average daily net assets as follows:
| Texas Capital Texas | ||||||
| Texas Capital Texas | Texas Capital Texas | Small Cap Equity | ||||
| Equity Index ETF | Oil Index ETF | Index ETF | ||||
| Advisory fees rate | 0.49% | 0.35% | 0.49% | |||
| Advisory fees earned | $33,999 | $27 | $74 | |||
| Payable to Adviser | $7,637 | $27 | $74 |
Under the Agreement, the Adviser has agreed to pay all expenses of the Funds, except for the fee payment under the Agreement, payments under the Funds’ 12b-1 plan (if any), interest expenses, taxes, acquired fund fees and expenses, brokers’ commissions and any other transaction-related expenses and fees arising out of transactions effected on behalf of each Fund, costs of holding shareholder meetings and litigation and indemnification expenses and other extraordinary expenses not incurred in the ordinary course of the Funds’ business.
State Street Bank and Trust Company (“State Street”) serves as Funds’ custodian and transfer agent. The Adviser pays State Street fees in accordance with the agreements for such services.
Ultimus Fund Solutions, LLC (“Ultimus”) provides administration and fund accounting services to the Funds. The Adviser pays Ultimus fees in accordance with the Master Services Agreement for such services.
Northern Lights Compliance Services, LLC (“NLCS”), an affiliate of Ultimus, provides a Chief Compliance Officer to the Trust, as well as related compliance services, pursuant to a consulting agreement between NLCS and the Trust. Under the terms of such agreement, NLCS receives fees from the Adviser, which are approved annually by the Board.
Under the terms of a Distribution Agreement with the Trust, Northern Lights Distributors, LLC (the “Distributor”) serves as principal underwriter to the Funds. The Distributor is a wholly-owned subsidiary of Ultimus. The Distributor is compensated by the Adviser (not the Funds) for acting as principal underwriter.
Certain officers of the Trust are also employees of Ultimus and such persons are not paid by the Funds for serving in such capacities.
31
| Texas Capital Funds Trust |
| Notes to the Financial Statements (continued) |
| December 31, 2023 |
NOTE 5. PURCHASES AND SALES OF SECURITIES
For the fiscal period ended December 31, 2023, purchases and sales of investment securities, other than in-kind transactions and short-term investments, were as follows:
| Purchases | Sales | |||||||
| Texas Capital Texas Equity Index ETF | $ | 1,584,054 | $ | 515,954 | ||||
| Texas Capital Texas Oil Index ETF | 379 | — | ||||||
| Texas Capital Texas Small Cap Equity Index ETF | — | — | ||||||
For the fiscal period ended December 31, 2023, purchases and sales for in-kind transactions were as follows:
| Purchases | Sales | |||||||
| Texas Capital Texas Equity Index ETF | $ | 17,825,098 | $ | 1,273,007 | ||||
| Texas Capital Texas Oil Index ETF | 242,216 | — | ||||||
| Texas Capital Texas Small Cap Equity Index ETF | 492,905 | — | ||||||
For the fiscal period ended December 31, 2023, the Texas Capital Texas Equity Index ETF, Texas Capital Texas Oil Index ETF and Texas Capital Texas Small Cap Equity Index ETF had in-kind net realized gains of $218,651, $0 and $0, respectively.
There were no purchases or sales of long-term U.S. government obligations during the fiscal period ended December 31, 2023.
Transaction Fees – Shares are not individually redeemable and may be redeemed by each Fund at NAV only in large blocks known as “Creation Units.” Shares are created and redeemed by the Texas Capital Texas Equity Index ETF and Texas Capital Texas Small Cap Equity Index ETF only in Creation Unit size aggregations of 10,000 shares. Shares are created and redeemed by the Texas Capital Texas Oil Index ETF only in Creation Unit size aggregations of 5,000 shares. Only certain financial institutions (each an “Authorized Participant”) or transactions done through an Authorized Participant are permitted to purchase or redeem Creation Units from the Funds. An Authorized Participant is either (i) a broker-dealer or other participant in the clearing process through the Continuous Net Settlement System of the National Securities Clearing Corporation or (ii) a Depository Trust Company participant and, in each case, must have executed a Participant Agreement with the Distributor. Such transactions are generally permitted on an in-kind basis, with a balancing cash component to equate the transaction to the NAV per share of the Funds on the transaction date. Cash may be substituted equivalent to the value of certain securities generally when they are not available in sufficient quantity for delivery, not eligible for trading by the Authorized Participant or as a result of other market circumstances. In addition, the Funds may impose transaction fees on purchases and redemptions of Funds shares to cover the custodial and other costs incurred by the Funds in effecting trades.
32
| Texas Capital Funds Trust |
| Notes to the Financial Statements (continued) |
| December 31, 2023 |
A fixed fee payable to the custodian may be imposed on each creation and redemption transaction regardless of the number of Creation Units involved in the transaction (“Standard Transaction Fee”). Purchases and redemptions of Creation Units for cash or involving cash-in-lieu are required to pay an additional variable charge to compensate the Funds and that ongoing shareholders for brokerage and market impact expenses relating to Creation Unit transactions (“Variable Charge,” and together with the Standard Transaction Fee, the “Transaction Fees”). For the fiscal period ended December 31, 2023, the Funds received $0 and $0 in Standard Transaction Fees and variable fees, respectively. The Transaction Fees for the Funds are listed in the table below:
| In-kind | Cash | |||||
| Transaction | Transaction | Variable | ||||
| Fee | Fee | Charge | ||||
| Texas Capital Texas Equity Index ETF | $250 | $100 | 2.00%* | |||
| Texas Capital Texas Oil Index ETF | $150 | $100 | 2.00%* | |||
| Texas Capital Texas Small Cap Equity Index ETF | $250 | $100 | 2.00%* |
| * | The maximum Transaction Fee may be up to 2.00% of the amount invested. |
NOTE 6. FEDERAL TAX INFORMATION
At December 31, 2023, the net unrealized appreciation (depreciation) and tax cost of investments for tax purposes were as follows:
| Texas Capital | ||||||||||||
| Texas Capital | Texas Capital | Texas Small Cap | ||||||||||
| Texas Equity | Texas Oil Index | Equity Index | ||||||||||
| Index ETF | ETF | ETF | ||||||||||
| Gross unrealized appreciation | $ | 1,553,049 | $ | 1,551 | $ | 12,599 | ||||||
| Gross unrealized depreciation | (521,281 | ) | (1,415 | ) | (2,820 | ) | ||||||
| Net unrealized appreciation on investments | $ | 1,031,768 | $ | 136 | $ | 9,779 | ||||||
| Tax cost of investments | $ | 18,037,353 | $ | 247,904 | $ | 493,025 | ||||||
The differences between book-basis and tax-basis unrealized appreciation (depreciation) are attributable primarily to: tax deferral of losses on wash sales, differences related to passive foreign investment companies and the return of capital adjustments from underlying investments.
33
| Texas Capital Funds Trust |
| Notes to the Financial Statements (continued) |
| December 31, 2023 |
The tax character of distributions paid for the fiscal period ended December 31, 2023, were as follows:
| Texas Capital | ||||||||||||
| Texas Capital | Texas Capital | Texas Small Cap | ||||||||||
| Texas Equity | Texas Oil Index | Equity Index | ||||||||||
| Index ETF | ETF | ETF | ||||||||||
| 2023 | 2023 | 2023 | ||||||||||
| Distributions paid from: | ||||||||||||
| Ordinary income(a) | $ | 87,885 | $ | — | $ | — | ||||||
| Total distributions paid | $ | 87,885 | $ | — | $ | — | ||||||
| (a) | Short-term capital gain distributions are treated as ordinary income for tax purposes. |
At December 31, 2023, the components of accumulated earnings (deficit) on a tax basis were as follows:
| Texas Capital Texas Equity Index ETF | Texas Capital Texas Oil Index ETF | Texas Capital Texas Small Cap Equity Index ETF | ||||||||||
| Undistributed ordinary income | $ | — | $ | 8 | $ | — | ||||||
| Accumulated capital and other losses | (25,270 | ) | — | — | ||||||||
| Unrealized appreciation on investments | 1,031,768 | 136 | 9,779 | |||||||||
| Total accumulated earnings | $ | 1,006,498 | $ | 144 | $ | 9,779 | ||||||
As of December 31, 2023, the Texas Capital Texas Equity Index ETF had short-term capital loss carryforwards available to offset future gains and not subject to expiration in the amount of $25,270.
NOTE 7. PRINCIPAL RISKS
Sector Risk: If a Fund has significant investments in the securities of issuers within a particular sector, any development affecting that sector will have a greater impact on the value of the net assets of a Fund than would be the case if a Fund did not have significant investments in that sector. In addition, this may increase the risk of loss in a Fund and increase the volatility of a Fund’s NAV per share. For instance, economic or market factors, regulatory changes or other developments may negatively impact all companies in a particular sector, and therefore the value of the Fund’s portfolio will be adversely affected. As of December 31, 2023, the Texas Capital Texas Oil Index ETF had 97.65% of the value of its net assets invested in stocks within the Energy sector.
Texas Risk: Texas’ economy relies to a significant extent on certain key industries, such as the oil and gas industry (including drilling, production and refining), chemicals production,
34
| Texas Capital Funds Trust |
| Notes to the Financial Statements (continued) |
| December 31, 2023 |
technology and telecommunications equipment manufacturing and international trade. Each of these industries has from time to time suffered from economic downturns, and adverse conditions in one or more of these industries could impair the ability of issuers of Texas municipal securities to pay principal or interest on their obligations.
Investment and Market Risk: As with all investments, an investment in the Funds is subject to investment risk. Investors in the Funds could lose money, including the possible loss of the entire principal amount of an investment, over short or prolonged periods of time. Markets can decline in value sharply and unpredictably. The increasing interconnectivity between global economies and financial markets increases the likelihood that events or conditions in one region or financial market may adversely impact issuers in a different country, region, or financial market.
Index Tracking Risk: There is no guarantee that the Funds will achieve a high degree of correlation to their respective index and therefore achieve their investment objective. The Funds may have difficulty achieving their investment objective due to fees, expenses (including rebalancing expenses), and other transaction costs related to the normal operation of the Funds. These costs that may be incurred by the Funds are not incurred by the Index, which may make it more difficult for the Funds to track the index.
Passive Investment Risk: The Funds are not actively managed, and the Adviser will not sell a security due to current or projected under performance of a security, industry, or sector, unless that security is removed from the index by the index provider, who is unaffiliated with the Adviser. The Funds invest in securities included in the index regardless of the Adviser’s independent analysis of the investment decision.
The Funds’ prospectus contains more information regarding these risks and other risks related to the Funds as well as other information about the Funds and should be read carefully before investing.
NOTE 8. COMMITMENTS AND CONTINGENCIES
The Trust indemnifies its officers and Trustees for certain liabilities that may arise from their performance of their duties to the Trust or the Funds. Additionally, in the normal course of business, the Trust enters into contracts that contain a variety of representations and warranties which provide general indemnifications. The Trust’s maximum exposure under these arrangements is unknown, as this would involve future claims that may be made against the Trust that have not yet occurred.
35
| Texas Capital Funds Trust |
| Notes to the Financial Statements (continued) |
| December 31, 2023 |
NOTE 9. SUBSEQUENT EVENTS
Management of the Funds has evaluated the need for disclosures and/or adjustments resulting from subsequent events through the date at which these financial statements were issued. Based upon this evaluation, management has determined there were no items requiring adjustment of the financial statements or additional disclosure.
36
| Report of Independent Registered Public Accounting Firm |
To the Shareholders and the Board of Trustees of
Texas Capital Funds Trust
Opinion on the Financial Statements
We have audited the accompanying statements of assets and liabilities of Texas Capital Funds Trust (the “Trust”) (comprising Texas Capital Texas Equity Index ETF, Texas Capital Texas Small Cap Equity Index ETF, and Texas Capital Texas Oil Index ETF (collectively referred to as the “Funds”)), including the schedules of investments, as of December 31, 2023, and the related statements of operations, changes in net assets, and the financial highlights for each of the periods indicated in the table below and the related notes (collectively referred to as the “financial statements”). In our opinion, the financial statements present fairly, in all material respects, the financial position of each of the Funds comprising Texas Capital Funds Trust at December 31, 2023, the results of their operations, changes in net assets and financial highlights for each of the periods indicated in the table below, in conformity with U.S. generally accepted accounting principles.
| Funds comprising the Texas Capital Funds Trust | Statements of operations | Statements of changes in net assets | Financial highlights |
| Texas Capital Texas Equity Index ETF | For the period from July 12, 2023 (commencement of operations) through December 31, 2023. | ||
| Texas Capital Texas Small Cap Equity Index ETF | For the period from December 20, 2023 (commencement of operations) through December 31, 2023. | ||
| Texas Capital Texas Oil Index ETF | For the period from December 20, 2023 (commencement of operations) through December 31, 2023. | ||
Basis for Opinion
These financial statements are the responsibility of the Trust’s management. Our responsibility is to express an opinion on each of the Fund’s financial statements based on our audits. We are a public accounting firm registered with the Public Company Accounting Oversight Board (United States) (“PCAOB”) and are required to be independent with respect to the Trust in accordance with the U.S. federal securities laws and the applicable rules and regulations of the Securities and Exchange Commission and the PCAOB.
We conducted our audits in accordance with the standards of the PCAOB. Those standards require that we plan and perform the audit to obtain reasonable assurance about whether the financial statements are free of material misstatement, whether due to error or fraud. The Trust is not required to have, nor were we engaged to perform, an audit of the Trust’s internal control over financial reporting. As part of our audits, we are required to obtain an understanding of internal control over financial reporting but not for the purpose of expressing an opinion on the effectiveness of the Trust’s internal control over financial reporting. Accordingly, we express no such opinion.
Our audits included performing procedures to assess the risks of material misstatement of the financial statements, whether due to error or fraud, and performing procedures that respond to those risks. Such procedures included examining, on a test basis, evidence regarding the amounts and disclosures in the financial statements. Our procedures included confirmation of securities owned as of December 31, 2023, by correspondence with the custodian and brokers. Our audits also included
37
| Report of Independent Registered Public Accounting Firm (continued) |
evaluating the accounting principles used and significant estimates made by management, as well as evaluating the overall presentation of the financial statements. We believe that our audits provide a reasonable basis for our opinion.
We have served as the auditor of Texas Capital Funds Trust since 2023.
Dallas, Texas
February 26, 2024
38
| Summary of Fund Expenses (Unaudited) |
As a shareholder of a Fund, you incur two types of costs: (1) transaction costs, including brokerage commissions on your purchase and sales of Fund shares and (2) ongoing costs, including management fees, distribution (12b-1) fees and other Fund expenses. These examples are intended to help you understand your ongoing costs (in dollars) of investing in each Fund and to compare these costs with the ongoing costs of investing in other funds. Each Fund’s example is based on an investment of $1,000 invested at the beginning of the period and held for the entire period from commencement of operations (July 12, 2023, for the Texas Capital Texas Equity Index ETF and December 20, 2023, for the Texas Capital Texas Oil Index ETF and the Texas Capital Texas Small Cap Equity Index ETF) through December 31, 2023.
Actual Expenses
The first line of the table below provides information about actual account values and actual expenses. You may use the information in this line, together with the amount you invested, to estimate the expenses that you paid over the period. Simply divide your account value by $1,000 (for example, an $8,600 account value divided by $1,000 = 8.6), then multiply the result by the number in the first line under the heading “Expenses Paid During Period” to estimate the expenses you paid on your account during this period.
Hypothetical Example for Comparison Purposes
The second line of the table below provides information about hypothetical account values and hypothetical expenses based on each Fund’s actual expense ratio and an assumed rate of return of 5% per year before expenses, which is not the Fund’s actual return. The hypothetical account values and expenses may not be used to estimate the actual ending account balance or expenses you paid for the period. You may use this information to compare the ongoing costs of investing in the Funds and other funds. To do so, compare this 5% hypothetical example with the 5% hypothetical examples that appear in the shareholder reports of other funds. The examples do not take into account brokerage commissions that you pay when purchasing or selling shares of a Fund.
Expenses shown in the table are meant to highlight your ongoing costs only and do not reflect any transactional costs. Therefore, the second line of the table below is useful in comparing ongoing costs only and will not help you determine the relative total costs of owning different funds. In addition, if transaction costs were included, your costs would have been higher.
39
| Summary of Fund Expenses (Unaudited) (continued) |
| Ending | |||||||||||||||
| Beginning | Account | Expenses | |||||||||||||
| Account | Value | Paid | Annualized | ||||||||||||
| Value | December | During | Expense | ||||||||||||
| July 1, 2023 | 31, 2023 | Period(a) | Ratio | ||||||||||||
| Texas Capital Texas Equity Index ETF | |||||||||||||||
| Actual | $ | 1,000.00 | $ | 1,061.80 | $ | 2.38 | (a) | 0.49% | |||||||
| Hypothetical(b) | $ | 1,000.00 | $ | 1,022.74 | $ | 2.49 | (a) | 0.49% | |||||||
| Texas Capital Texas Oil Index ETF | |||||||||||||||
| Actual | $ | 1,000.00 | $ | 1,000.80 | $ | 0.10 | (c) | 0.35% | |||||||
| Hypothetical(b) | $ | 1,000.00 | $ | 1,023.47 | $ | 1.76 | (c) | 0.35% | |||||||
| Texas Capital Texas Small Cap Equity Index ETF | |||||||||||||||
| Actual | $ | 1,000.00 | $ | 1,019.90 | $ | 0.15 | (c) | 0.49% | |||||||
| Hypothetical(b) | $ | 1,000.00 | $ | 1,022.75 | $ | 2.49 | (c) | 0.49% | |||||||
| (a) | Expenses are equal to the Fund’s annualized expense ratios, multiplied by 172/365 (to reflect the period since commencement of operations on July 12, 2023). Hypothetical expenses are equal to the Fund’s annualized expense ratio, multiplied by the average account value over the period, multiplied by 184/365 (to reflect the one-half year period). |
| (b) | Hypothetical assumes 5% annual return before expenses. |
| (c) | Expenses are equal to the Fund’s annualized expense ratios, multiplied by 11/365 (to reflect the period since commencement of operations on December 20, 2023). Hypothetical expenses are equal to the Fund’s annualized expense ratio, multiplied by the average account value over the period, multiplied by 184/365 (to reflect the one-half year period). |
40
| Trustees and Officers (Unaudited) |
| Name, Address and Year of Birth | Position (s) Held with Trust | Term of Office and Length of Time Served | Principal Occupation During Past 5 Years | Number of Funds in Fund Complex Overseen by Trustee | Other Directorship Held by Trustee During Past 5 Years | |||||
| Independent Trustees | ||||||||||
| J. Kyle Bass (1969) | Trustee | Since 2023 | Founder and Chief Investment Officer, Hayman Capital Management, LP. | 3 | None | |||||
| Avery Johnson (1965) | Trustee | Since 2023 | Chief Executive Officer, Avery Capital (June 2020-Present); Partner, Allan Bailey Johnson Group (March 2020-Present); CBS Sports Network Analyst, CBS Sports HQ Analyst (June 2019-Present). | 3 | None | |||||
| Eduardo Margain (1978) | Trustee | Since 2023 | Founder and Chief Executive Officer, PIXIU Investments (June 2009-Present). | 3 | None | |||||
| Interested Trustees* | ||||||||||
Daniel S. Hoverman
| Trustee | Since 2023 | Executive Vice President, Head of Corporate & Investment Banking, Texas Capital Bancshares, Inc. & Texas Capital Bank; Managing Partner and President Texas Capital Securities (2021-Present); Managing Director, Head of Corporate Advisory and Financial Sponsors, Regions Securities LLC, (2016-2021). | 3 | None | |||||
Jocelyn E. Kukulka | Trustee | Since 2023 | Executive Director, Head of Investor Relations and Corporate Development, Texas Capital Bank (2022-Present); Vice President, Western Alliance Bancorporation (2017-2022). | 3 | None | |||||
| * | Daniel S. Hoverman and Jocelyn E. Kukulka are each an “interested person,” as defined by the 1940 Act, because of his or her employment with the Adviser. |
41
Trustees and Officers (Unaudited) (continued)
| Name and Year of Birth | Position(s) Held with Fund/Trust | Term of Office and Length of Time Served | Principal Occupation During Past 5 Years | Number of Portfolios in Fund Complex Overseen by Trustee | Other Directorships Held by Trustee During Past 5 Years | |||||
| Officers of the Trust: | ||||||||||
| Edward Rosenberg (1973) | President and Chief Executive Officer | Since 2023 | Managing Director, Head of ETF and Funds Management (2023-Present); Independent Consultant, Torre Blanc (2022-2023); Senior Vice President, Head of ETFs, American Century Investments (2017-2022). | N/A | N/A | |||||
| Joel Colpitts (1968) | Treasurer and Principal Financial Officer | Since 2023 | Executive Director, Financial and Operations Principal for TCBI Securities, Inc. (2021-Present); Chief Financial Officer, PursheKaplan Sterling Investments (2021); Assistant Vice President, Finance, Avantax(2013–2021). | N/A | N/A | |||||
| Neil Rajan (1979) | Secretary | Since 2023 | Director, Legal Head of Investment Banking Coverage and Associate General Counsel for Texas Capital Bank (Feb. 2023-Present); General Counsel, Global Tracking/Search & Rescue and Assistant General Counsel, Sensing & Safety Technologies – Honeywell International Inc. (2020-2023); Partner, Locke Lord LLP (2017-2019). | N/A | N/A | |||||
| Paul Leone (1963) | Assistant Secretary | Since 2023 | Vice President and Senior Counsel, UltimusFund Solutions, LLC (2020-Present); Managing Director, Leone Law Office, P.C. (2019-2020); Senior Counsel, Empower Retirement/Great-West Life & Annuity Insurance Company (2015-2019). | N/A | N/A | |||||
| Kevin Patton (1970) | Chief Compliance Officer | Since 2023 | Vice President – Compliance Officer, UltimusFund Solutions – June 2023 – present; Outsourced Chief Compliance Officer, DinsmoreCompliance Services (Jan 2023- June 2023); Senior Principal Consultant, ACA Group (2022-2023); Assistant Vice President and Compliance Officer, UltimusFund Solutions, LLC (2020-2022); Partner and Chief Compliance Officer, Renaissance Investment Management (Aug. 2005-Jan 2020). | N/A | N/A | |||||
42
| Other Information (Unaudited) |
The Funds’ Statement of Additional Information (“SAI”) includes additional information about the trustees and is available without charge, upon request. You may call toll-free at (844) 822-3837 to request a copy of the SAI or to make shareholder inquiries.
43
| Advisory Agreement Approval (Unaudited) |
Texas Capital Texas Equity Index ETF
The Board of Trustees (the “Board”), including those Trustees who were determined to not be “interested persons” of the Trust (the “Independent Trustees”), as such term is defined under Section 2(a)(19) of the Investment Company Act of 1940, as amended (the “1940 Act”) voting separately, has reviewed and approved the Texas Capital Texas Equity Index ETF’s (the “Fund”) advisory agreement (the “Advisory Agreement”) with Texas Capital Bank Wealth Management Services, Inc. doing business as Texas Capital Bank Private Wealth Advisors (the “Adviser”) for an initial two-year term. The Board unanimously approved the Advisory Agreement at a meeting held on June 30, 2023, at which all of the Trustees were present (the “Meeting”).
In deciding whether to approve the Advisory Agreement, the Board requested and evaluated all information that the Trustees deemed reasonably necessary under the circumstances. The conclusions reached by the Board were based on a comprehensive evaluation of all of the information provided in the Board materials and at the Meeting and were not the result of any one factor. Moreover, the Board did not identify any particular information or consideration that was all-important or controlling, and each Trustee may have afforded different weight to the various factors and information in reaching his or her conclusions with respect to the Advisory Agreement. In considering the approval of the Advisory Agreement, the Board reviewed and analyzed various factors that they determined were relevant, including, but not limited to, the factors enumerated below.
Nature, Extent, and Quality of Services. The Trustees reviewed materials provided by the Adviser regarding the nature, extent, and quality of the services proposed to be provided to the Fund by the Adviser, including an overview of the Adviser and the personnel that would perform services for the Fund. The Trustees considered the qualifications, background and responsibilities of the members of the Adviser’s portfolio management team who would oversee the day-to-day investment management and operations of the Fund. The Trustees also considered the Adviser’s support resources available for investment research, compliance and operations.
The Trustees considered that, while the Adviser has not previously served as an investment adviser to a registered mutual fund or ETF, the Adviser is staffed by experienced personnel who have extensive portfolio management experience. The Trustees also considered the Fund’s primary investment objective and concluded that the operation of such a mandate appears to be within the capabilities of the investment personnel employed by the Adviser.
The Trustees discussed the capitalization of the Adviser and the Adviser’s representation that it and/or its affiliates have sufficient resources to financially support the Fund and execute on the business plan related to the Fund. The Trustees evaluated information about the nature and extent of responsibilities retained and risks assumed by the Adviser in connection with its services to the Fund, including the Adviser’s assumption of business, entrepreneurial, overall managerial and other risks by sponsoring and advising the Fund. Based on these considerations, the Trustees concluded, within the context of its full deliberations, that the nature, overall quality and extent of the services proposed to be provided by the Adviser to the Fund are expected to be satisfactory and adequate.
Performance. The Trustees considered that the Fund is newly formed and as such does not have a record of prior performance to submit at the Meeting. The Trustees also noted that the Adviser does not currently advise any other U.S. registered investment companies. Consequently, there was currently
44
| Advisory Agreement Approval (Unaudited) (continued) |
no performance data available for the Fund or an investment vehicle managed by the Adviser using a similar investment strategy. Based on these considerations and on the Fund’s investment strategy and the Adviser’s written and oral presentation, the Trustees concluded, within the context of its full deliberations, that it was satisfied that the Adviser has the capability of providing satisfactory investment performance for the Fund.
Fees and Expenses. As to the costs of the services to be provided and profits to be realized by the Adviser, the Trustees considered the proposed unitary fee. The Trustees noted that the Adviser provided industry data with respect to the total expense ratios of a peer group of investment companies (“Peer Group”) as compared to the proposed unitary fee and estimated total expense ratio of the Fund. The Trustees further noted that, based on the data provided by the Adviser, the expense ratio of the Fund, a passively-managed index fund, was lower than other state-focused passive ETFs (both of which have ceased operations in 2009), but in the mid-range of mid-cap value and niche/thematic ETFs in the Peer Group. Based on these considerations and other factors, the Trustees concluded, within the context of its full deliberations, that the unitary fee of 0.49% of the Fund’s average daily net assets proposed to be charged by the Adviser appeared reasonable in light of the nature, extent and quality of the services proposed to be provided under the proposed Advisory Agreement.
Profitability. The Trustees considered that the Fund is not yet operational, and no record of Adviser profitability exists. The Trustees also took into account the Adviser’s estimated costs of managing the Fund and information provided by the Adviser regarding its financial condition. The Trustees did not make any conclusions regarding the Adviser’s profitability, but will do so during future considerations of the Advisory Agreement.
Economies of Scale. The Trustees considered whether the Adviser would realize economies of scale with respect to its management of the Fund, recognizing that economies of scale are difficult to identify and quantify. The Trustees noted that economies of scale were not a relevant consideration at this time and they would revisit whether economies of scale exist in the future once the Fund has achieved sufficient scale.
Fall-out Benefits. The Trustees discussed direct or indirect “fall-out benefits,” noting that the Adviser did not anticipate any fall-out benefits at this stage other than that the Adviser may derive a benefit to its reputation and standing in the investment community from its relationship with the Fund.
Conclusion. Based on the Board’s deliberations and its evaluation of the information described above and other factors and information it believed relevant in the exercise of its reasonable business judgment, the Board, with the Independent Trustees having met in an executive session and having been advised by independent legal counsel throughout the process, determined that approval of the Advisory Agreement for an initial two-year term is in the best interests of the Fund and its future shareholders. In its deliberations, the Board did not identify any absence of information as material to its decision, or any particular factor (or conclusion with respect thereto) or single piece of information that was all-important, controlling or determinative of its decision, but considered all of the factors together, and each Trustee may have attributed different weights to the various factors (and conclusions with respect thereto) and information.
45
| Advisory Agreement Approval (Unaudited) (continued) |
Texas Capital Texas Oil Index ETF
Texas Capital Texas Small Cap Equity Index ETF
The Board of Trustees (the “Board”), including those Trustees who were determined to not be “interested persons” of Texas Capital Funds Trust (the “Trust”) (the “Independent Trustees”), as such term is defined under Section 2(a)(19) of the Investment Company Act of 1940, as amended (the “1940 Act”) voting separately, has reviewed and approved the advisory agreements (the “Advisory Agreements”) between the Trust and Texas Capital Bank Wealth Management Services, Inc., doing business as Texas Capital Bank Private Wealth Advisors (the “Adviser”) on behalf of the Texas Capital Texas Oil Index ETF (the “Oil ETF”) and the Texas Capital Texas Small Cap Equity Index ETF (the “Small Cap ETF”) (collectively, the “Funds”), each for an initial two-year term. The Board unanimously approved the Advisory Agreements at a meeting held on September 28, 2023, at which all of the Trustees were present (the “Meeting”).
In deciding whether to approve the Advisory Agreements, the Board requested and evaluated all information that the Trustees deemed reasonably necessary under the circumstances. The conclusions reached by the Board were based on a comprehensive evaluation of all of the information provided in the Board materials and at the Meeting and were not the result of any one factor. Moreover, the Board did not identify any particular information or consideration that was all-important or controlling, and each Trustee may have afforded different weight to the various factors and information in reaching his or her conclusions with respect to the Advisory Agreements. In considering the approval of the Advisory Agreements, the Board reviewed and analyzed various factors that they determined were relevant, including, but not limited to, the factors enumerated below.
Nature, Extent, and Quality of Services. The Trustees reviewed materials provided by the Adviser regarding the nature, extent, and quality of the services proposed to be provided to the Funds by the Adviser, including an overview of the Adviser and the personnel that would perform services for the Funds. The Trustees considered the qualifications, background and responsibilities of the members of the Adviser’s portfolio management team who would oversee the day-to-day investment management and operations of the Funds. The Trustees also considered the Adviser’s support resources available for investment research, compliance, and operations.
The Trustees considered that, while the Adviser had only recently begun serving as an investment adviser to a U.S. registered investment company, the Texas Capital Texas Equity Index ETF, the Adviser is staffed by experienced personnel who have extensive portfolio management experience. The Trustees also considered the Funds’ respective primary investment objectives and concluded that the operation of these mandates appear to be within the capabilities of the investment personnel employed by the Adviser.
The Trustees discussed the capitalization of the Adviser and the Adviser’s representation that it and/or its affiliates have sufficient resources to financially support the Funds and execute on the business plan related to each Fund. The Trustees evaluated information about the nature and extent of responsibilities retained and risks assumed by the Adviser in connection with its services to the Funds, including the Adviser’s assumption of business, entrepreneurial, overall managerial and other risks by sponsoring and advising the Funds. Based on these considerations, the Trustees concluded,
46
| Advisory Agreement Approval (Unaudited) (continued) |
within the context of its full deliberations, that the nature, overall quality and extent of the services proposed to be provided by the Adviser to the Funds are expected to be satisfactory and adequate.
Performance. The Trustees considered that each Fund is newly formed and as such does not have a record of prior performance to submit at the Meeting. The Trustees also noted that the Adviser does not currently advise any other U.S. registered investment companies with similar investment strategies to those of the Funds. Consequently, there was currently no performance data available for the Funds or investment vehicles comparable to the Funds managed by the Adviser using similar investment strategies. However, based on the Trustees’ knowledge of the Adviser and its personnel and the operations of the other series of the Trust, as well as on each Fund’s investment strategies and the Adviser’s written and oral presentation, the Trustees concluded, within the context of its full deliberations, that it was satisfied that the Adviser has the capability of providing satisfactory investment performance for the Funds.
Fees and Expenses. The Trustees considered that the Adviser was proposing a unitary management fee structure pursuant to which each Fund pays a single management fee to the Adviser and the Adviser then pays all of the Fund’s ordinary operating expenses. The Trustees noted that, for each Fund, the Adviser provided industry data with respect to the fees of a Peer Group as compared to the proposed unitary fee rate for such Fund. The Trustees noted that the proposed unitary fee rate for the Small Cap ETF was above its Peer Group median, but further considered information provided by the Adviser that distinguished the Small Cap ETF from many funds in its Peer Group. The Trustees noted that the proposed unitary fee rate for the Oil ETF was below its Peer Group median. Based on these considerations and other factors, the Trustees concluded, within the context of its full deliberations, that the proposed management fee rates appeared reasonable in light of the nature, extent and quality of the services proposed to be provided under the proposed Advisory Agreements.
Italic. The Trustees considered that the Funds are not yet operational, and no record of Adviser profitability with respect to the Funds exists. The Trustees also took into account the Adviser’s estimated costs of managing the Funds and information provided by the Adviser regarding its financial condition. The Trustees did not make any conclusions regarding the Adviser’s profitability but will do so during future considerations of the Advisory Agreements.
Economies of Scale. The Trustees considered whether the Adviser would realize economies of scale with respect to its management of the Funds, recognizing that economies of scale are difficult to identify and quantify. The Trustees noted that economies of scale were not a relevant consideration at this time and they would revisit whether economies of scale exist in the future once the Funds have achieved sufficient scale.
Fall-out Benefits. The Trustees discussed direct or indirect “fall-out benefits,” noting that the Adviser and its affiliates may realize certain benefits from their relationships with the Funds, including: (a) trading efficiencies resulting from aggregation of orders of the Funds with those for other funds or accounts managed by the Adviser; (b) the Adviser’s ability to leverage the infrastructure designed to service the Funds on behalf of its other clients; (c) the Adviser’s ability to cross-market other products and services to Fund shareholders; (d) the Adviser’s ability to negotiate better pricing with the custodian on behalf of its other clients as a result of the relationship with the Funds; and/or (e) the possibility that the working relationship between the Adviser and the Funds’ third-party service
47
| Advisory Agreement Approval (Unaudited) (continued) |
providers may cause those service providers to be more likely to do business with other areas of the Adviser and its affiliates.
Conclusion. Based on the Board’s deliberations and its evaluation of the information described above and other factors and information it believed relevant in the exercise of its reasonable business judgment, the Board, with the Independent Trustees having met in an executive session and having been advised by independent legal counsel throughout the process, determined that approval of the Advisory Agreements each for an initial two-year term is in the best interests of the Funds and their future shareholders. In its deliberations, the Board did not identify any absence of information as material to its decision, or any particular factor (or conclusion with respect thereto) or single piece of information that was all-important, controlling or determinative of its decision, but considered all of the factors together, and each Trustee may have attributed different weights to the various factors (and conclusions with respect thereto) and information.
48
| Proxy Voting |
A description of the policies and procedures that each Fund uses to determine how to vote proxies relating to portfolio securities and information regarding how each Fund voted those proxies during the most recent twelve month period ended June 30, are available (1) without charge upon request by calling the Funds at (844) 822-3837 and (2) in Fund documents filed with the SEC on the SEC’s website at www.sec.gov.
| TRUSTEES J. Kyle Bass Avery Johnson Eduardo Margain Daniel S. Hoverman Jocelyn E. Kukulka | INDEPENDENT REGISTERED PUBLIC ACCOUNTING FIRM Ernst and Young LLP 2323 Victory Avenue Suite 2000 Dallas, TX 75219 |
| OFFICERS Edward Rosenberg Joel Colpitts Neil Rajan Paul Leone Kevin Patton | LEGAL COUNSEL Dechert, LLP 1095 Avenue of the Americas New York, NY 10036 |
| INVESTMENT ADVISER Texas Capital Bank Private Wealth Advisors. 2000 McKinney Ave, Unit 1800 Dallas, TX 75201 | CUSTODIANAND TRANSFER AGENT State Street Bank and Trust Company 1 Lincoln Street Boston, MA 02111 |
| DISTRIBUTOR Northern Lights Distributors, LLC 4221 North 203rd Street, Suite 100 Elkhorn, NE 68022 | ADMINISTRATOR AND FUND ACCOUNTANT Ultimus Fund Solutions, LLC 225 Pictoria Drive, Suite 450 Cincinnati, OH 45246 |
This report is intended only for the information of shareholders or those who have received a Funds’ prospectus which contains information about the Funds’ management fee and expenses. Please read the prospectus carefully before investing.
Distributed by Northern Lights Distributors, LLC, Member FINRA/SIPC
Texas Capital-AR-2023
| (b) | Not applicable. |
Item 2. Code of Ethics.
As of the end of the period covered by this report, the registrant has adopted a code of ethics that applies to the registrant’s principal executive officer, principal financial officer, principal accounting officer or controller, or persons performing similar functions, regardless of whether these individuals are employed by the registrant or a third party. Pursuant to Item 13(a)(1), a copy of registrant’s code of ethics is filed as an exhibit to this Form N-CSR. During the period covered by this report, the code of ethics has not been amended, and the registrant has not granted any waivers, including implicit waivers, from the provisions of the code of ethics.
Item 3. Audit Committee Financial Expert.
(a) The registrant’s board of trustees has determined that the registrant does not have an audit committee financial expert. The board of trustees determined that, although none of its members meet the technical definition of an audit committee financial expert, the audit committee, comprised of all of the independent trustees, has sufficient financial expertise to adequately perform its duties under the Audit Committee Charter without the addition of a qualified expert.
Item 4. Principle Accountant Fees and Services.
(a) Audit Fees billed to the registrant by its principal accountants for the most recent fiscal year:
Fiscal year ended 2023: $80,000
(b) Audit-Related Fees billed to the registrant by its principal accountants for the most recent fiscal year:
Fiscal year ended 2023: $0
(c) Tax Fees billed to the registrant by its principal accountants for the most recent fiscal year:
Fiscal year ended 2023: $15,000
Nature of the fees: Preparation of the 1120 RIC and Excise review
(d) All other fees billed to the registrant by its principal accountants for the most recent fiscal year:
Fiscal year ended 2023: $0
(e)(1) Audit Committee’s Pre-Approval Policies
The Audit Committee Charter requires the audit committee to be responsible for the selection, retention, termination and compensation of auditors and, in connection therewith, to (i) evaluate the proposed fees and other compensation, if any, to be paid to the auditors, (ii) evaluate the independence of the auditors, (iii) pre-approve all audit services and, when appropriate, any non-audit services provided by the independent auditors to the registrant, (iv) pre-approve, when appropriate, any non-audit services provided by the independent auditors to the registrant’s investment adviser, or any entity controlling, controlled by, or under common control with the investment adviser and that provides ongoing services to the registrant if the engagement relates directly to the operations and financial reporting of the registrant, and (v) receive the auditors’ specific representations as to their independence.
(e)(2) The percentage of services described in each of paragraphs (b) through (d) of this Item that were approved by the Audit Committee pursuant to paragraph (c)(7)(i)(C) of Rule 2-01 of Regulation S-X is 0%.
(f) During audit of registrant's financial statements for the most recent fiscal year, less than 50 percent of the hours expended on the principal accountant's engagement were attributed to work performed by persons other than the principal accountant's full-time, permanent employees.
(g) The aggregate non-audit fees billed by the registrant’s accountant for services rendered to the registrant, and rendered to the registrant’s investment adviser (not including any sub-adviser whose role is primarily portfolio management and is subcontracted with or overseen by another investment adviser), and any entity controlling, controlled by, or under common control with the adviser that provides ongoing services to the registrant for fiscal year ended December 31, 2023 was $15,000.
(h) Not applicable. The auditor performed no services for the registrant’s investment adviser or any entity controlling, controlled by, or under common control with the investment adviser that provides ongoing services to the registrant.
(i) Not Applicable.
(j) Not Applicable.
Item 5. Audit Committee of Listed Companies.
Certain series of the registrant that appear in the shareholder report included in Item 1 are listed issuers as defined in Rule 10A-3 under the Securities Exchange Act of 1934, as amended (the “Exchange Act”) and have a separately-designated standing audit committee established in accordance with Section 3(a)(58)A of the Exchange Act. All of the Board’s independent trustees are members of the audit committee.
Item 6. Schedule of Investments. Schedule filed with Item 1.
Item 7. Disclosure of Proxy Voting Policies and Procedures for Closed-End Management Investment Companies. Not Applicable.
Item 8. Portfolio Managers of Closed-End Investment Companies. Not Applicable.
Item 9. Purchases of Equity Securities by Closed-End Management Investment Company and Affiliated Purchasers. Not Applicable.
Item 10. Submission of Matters to a Vote of Security Holders.
The guidelines applicable to shareholders desiring to submit recommendations for nominees to the Registrant's board of trustees are contained in the statement of additional information of the Trust with respect to the Funds for which this Form N-CSR is being filed.
Item 11. Controls and Procedures.
(a) Based on their evaluation of the registrant’s disclosure controls and procedures (as defined in Rule 30a-3(c) under the Investment Company Act of 1940, as amended (the “Act”)) as of a date within 90 days of the filing date of this report, the registrant’s principal executive officer and principal financial officer have concluded that such disclosure controls and procedures are reasonably designed and are operating effectively to ensure that material information relating to the registrant is made known to them by others within those entities, particularly during the period in which this report is being prepared, and that the information required in filings on Form N-CSR is recorded, processed, summarized, and reported on a timely basis.
(b) There were no changes in the registrant’s internal control over financial reporting (as defined in Rule 30a-3(d) under the Investment Company Act of 1940) that occurred during the period covered by this report that have materially affected, or are reasonably likely to materially affect, the registrant’s internal control over financial reporting.
Item 12. Disclosure of Securities Lending Activities for Closed-End Investment Companies.
Not Applicable.
Item 13. Exhibits.
| (a)(1) | Code of Ethics is filed herewith. |
| (a)(3) | Not applicable. | |
| (b) | Certification pursuant to 18 U.S.C. Section 1350, as adopted pursuant to Section 906 of the Sarbanes-Oxley Act of 2002 is filed herewith. |
SIGNATURES
Pursuant to the requirements of the Securities Exchange Act of 1934 and the Investment Company Act of 1940, the registrant has duly caused this report to be signed on its behalf by the undersigned, thereunto duly authorized.
(Registrant) Texas Capital Funds Trust
By (Signature and Title) /s/ Edward Rosenberg
Edward Rosenberg, President and Chief Executive Officer
Date March 7, 2024 _
Pursuant to the requirements of the Securities Exchange Act of 1934 and the Investment Company Act of 1940, this report has been signed below by the following persons on behalf of the registrant and in the capacities and on the dates indicated.
By (Signature and Title) /s/ Joel Colpitts _
Joel Colpitts, Treasurer and Chief Financial Officer
Date March 7, 2024 _