UNITED STATES
SECURITIES AND EXCHANGE COMMISSION
Washington, D.C. 20549
FORM 6-K
REPORT OF FOREIGN PRIVATE ISSUER
PURSUANT TO RULE 13a-16 OR 15d-16 UNDER
THE SECURITIES EXCHANGE ACT OF 1934
For the month of February 2025
Commission File Number: 001-41815
AngloGold Ashanti plc
(Translation of registrant’s name into English)
4th Floor, Communications House, South Street
Staines-upon-Thames, Surrey TW18 4PR
United Kingdom
6363 S. Fiddlers Green Circle, Suite 1000
Greenwood Village, CO 80111
United States of America
(Address of principal executive offices)
Indicate by check mark whether the registrant files or will file annual reports under cover of Form
20-F or Form 40-F.
Form 20-F ☒ Form 40-F ☐
Enclosure: AngloGold Ashanti Earnings Release for the Three Months and Year Ended 31
December 2024
QUARTER 4 2024 EARNINGS RELEASE | 2 |  | |||
AngloGold Ashanti delivers nine-fold increase in 2024 free cash flow* to $942m versus prior year; Adjusted EBITDA* +93% year-on-year and H2 dividend growth of 263% to 69 US cents per share; total cash costs* +4% for FY 2024, below group inflation. |
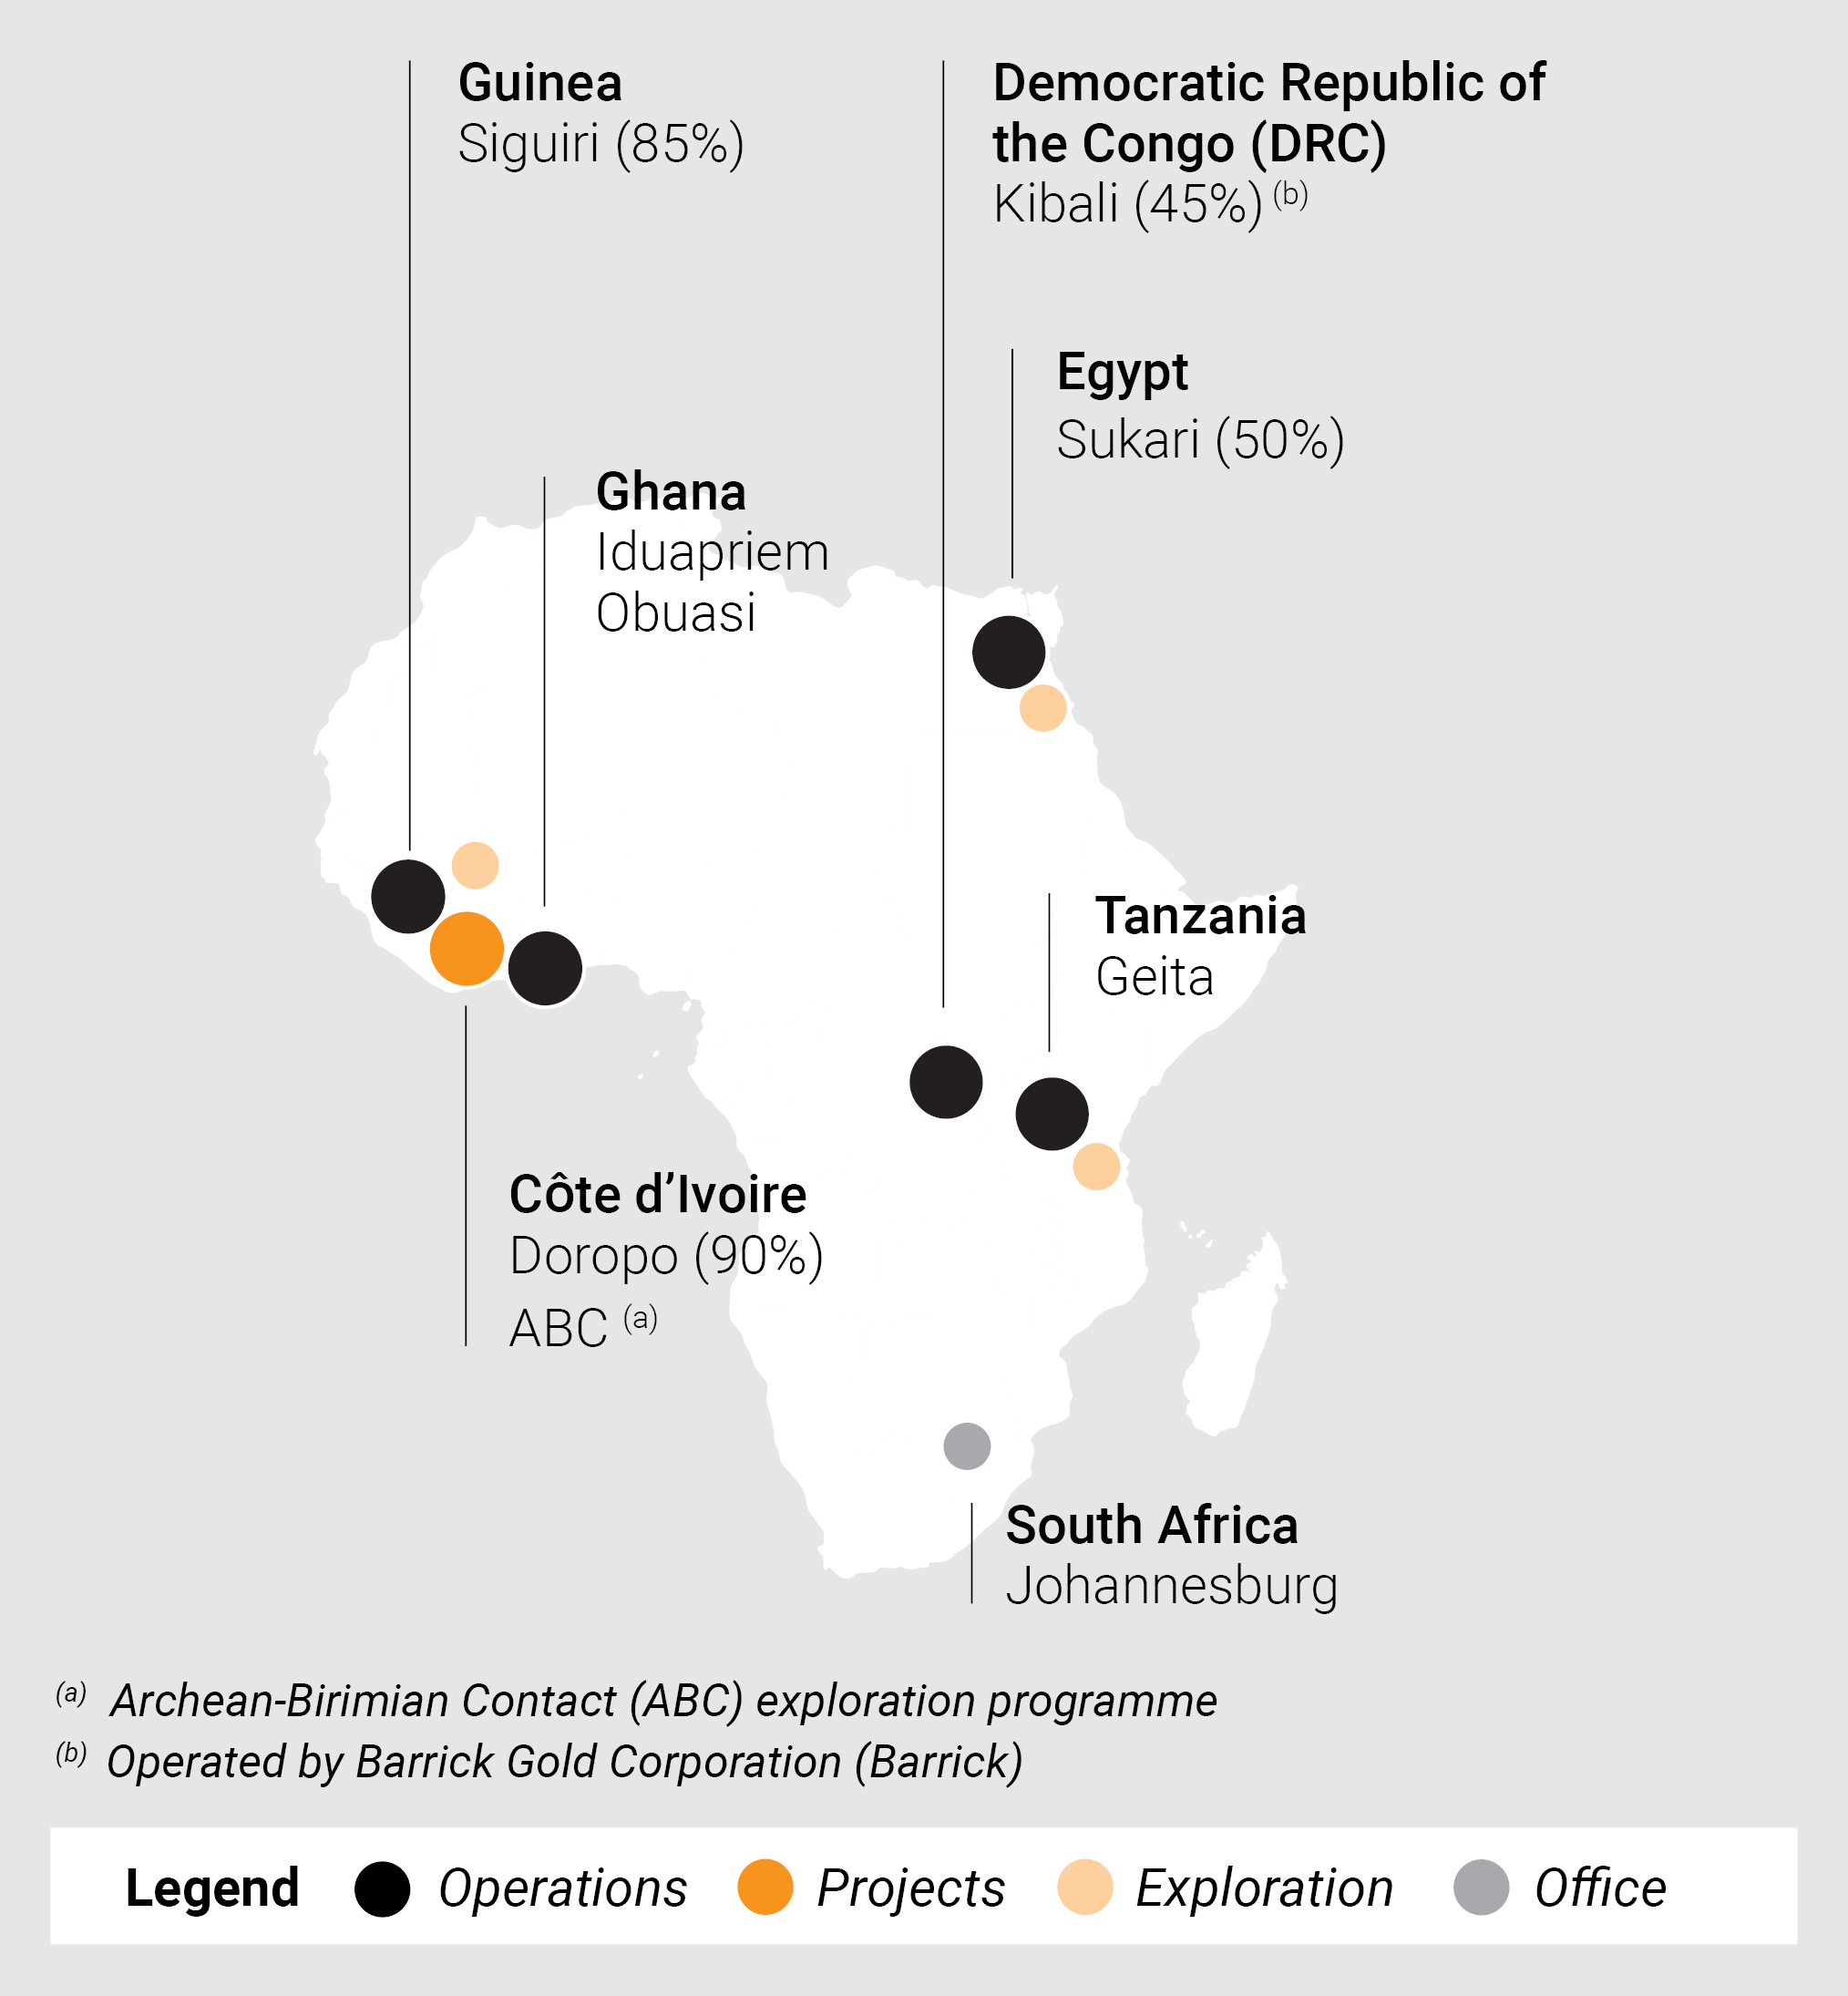
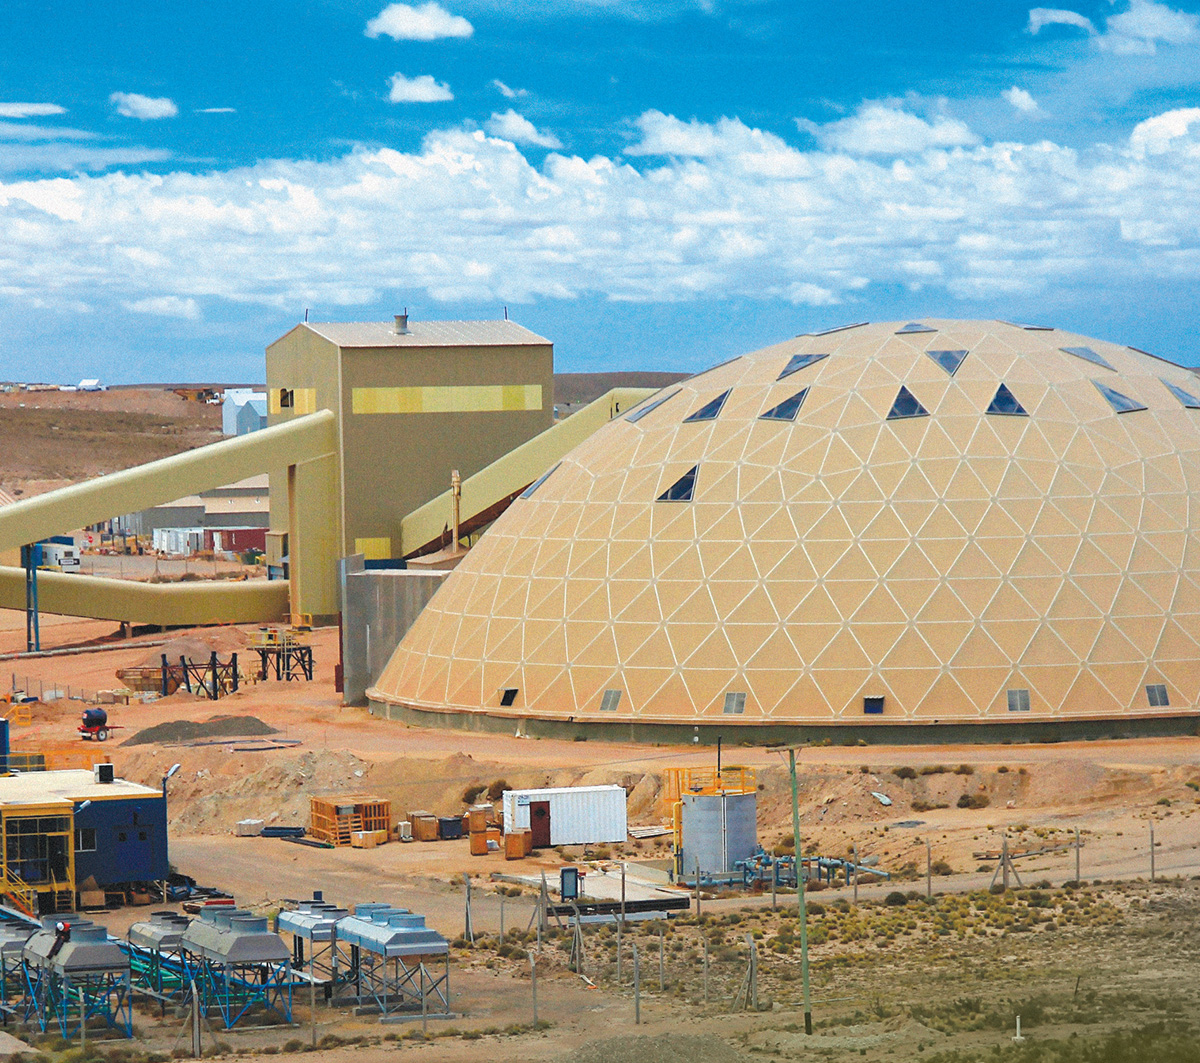
Sukari, Egypt
AngloGold Ashanti plc (“AngloGold Ashanti”, “AGA” or the
“Company”) delivered significant year-on-year gains in earnings
and free cash flow* in 2024, following continued focus on cost
control and the year’s strongest gold production period from its
managed operations(2)(3)(4) in Q4 2024.
Higher revenues were reflected in significantly stronger cash flow
and earnings in a year where costs rose by less than half the
inflation rate for managed operations, and the Company focused
on active management of working capital.
Free cash flow* rose to $942m in 2024, up from $109m in 2023.
Adjusted earnings before interest, tax, depreciation and
amortisation (“Adjusted EBITDA*”) rose 93% to $2.747bn, from
$1.420bn in 2023.
"The significant growth in free cash flow* -- to almost a billion
dollars in 2024 — is a result of our focus on continued operational
and efficiency improvements, which in turn have allowed us to
capture the benefit of a healthy gold price,” CEO Alberto Calderon
said. “With the business receiving appropriate investment and the
balance sheet at its strongest position in well over a decade, we’re
able to pass on those benefits to shareholders in a more generous
dividend policy.”
Headline earnings(5) of $954m, or 221 US cents per share for
2024, compared to a headline loss(5) of $46m, or 11 US cents per
share for 2023. The average gold price received per ounce* for
the group rose 24% to $2,394/oz in 2024 from $1,930/oz in 2023.
New Dividend Policy Improves Competitiveness
As a result of improved operational fundamentals, a robust
balance sheet, and increased confidence in the Company’s
outlook, the Company’s Board of Directors has approved a
revised dividend policy aimed at delivering enhanced and
sustainable shareholder returns. Under the new policy, AngloGold
Ashanti will target a 50% payout of free cash flow, where free
cash flow is defined as operating cash flow less capital
expenditure of managed operations, subject to maintaining an
adjusted net debt to adjusted EBITDA ratio of 1.0 times.
Additionally, the revised policy introduces a base dividend of
$0.50 per share per annum, payable in quarterly increments of
$0.125 per share. This base dividend represents the minimum
payout, ensuring a stable return to shareholders even through
commodity price cycles. This enhanced policy reflects the
Company’s commitment to strong capital discipline, financial
resilience, and delivering long-term value to shareholders, while
providing greater predictability and downside protection in
varying market conditions.
An interim dividend of $347m, or 69 US cents per share, was
declared for the second half. This takes the total payout for 2024
to $439m, or 91 US cents per share.
The new policy is an important part of a balanced capital
allocation framework. The leverage target — a maximum of one
times Adjusted net debt* to Adjusted EBITDA*, through the cycle
— remains unchanged, as does ensuring a well capitalised
portfolio and the ability to fund growth projects.
Lowest Leverage Since 2011
The balance sheet remained in a strong position after funding all
capital expenditure, the prior dividend payment and the cash
portion of the acquisition of Centamin plc (“Centamin”). At the end
of 2024, Adjusted net debt* was $567m, and the Adjusted net
debt* to Adjusted EBITDA* ratio was 0.21 times, the lowest since
2011. There was approximately $2.6bn in liquidity, including cash
and cash equivalents of $1.4bn, at year end.
Improved Fundamentals Support 2024 Performance
AngloGold Ashanti posted strong performances from several key
operations during 2024, demonstrating improved operational
resilience. The Australian mines recovered well from rains and
flooding in the first half of the year, while Siguiri finished the year
well after Q1 2024 production was impacted by metallurgical
recovery challenges.
The marked operational turnaround of the Brazilian operations
also continued to gain momentum following resumption of
concentrate processing at the Queiroz plant during Q3 2024.
Obuasi delivered an improved Q4 2024 performance, in line with
its revised mine plan, amid improved sub-level open stoping and
the continued rollout of the underhand drift and fill method.
The Company’ s Total Recordable Injury Frequency Rate (“TRIFR”)
of 0.98 injuries per million hours worked in 2024 improved
compared to 1.09 in 2023, and remains far better than the
average 2023 performance of 2.59 injuries per million hours
worked by the members of the International Council on Mining
and Metals.
Group gold production(2)(3)(4), including 40,000oz from Sukari, was
2.661Moz for 2024. Gold production(2)(3)(4) for the year was driven
by year-on-year improvements at Cuiabá (AGA Mineração) (+8%),
QUARTER 4 2024 EARNINGS RELEASE | 3 | | |||
 | ||||||
2024 I GROUP PERFORMANCE | ||||||
CONTINUED
Cerro Vanguardia (+7%), Siguiri (+5%), Sunrise Dam (+3%) and
Tropicana (+1%), as well as the introduction of Sukari into the
portfolio. These increases were partly offset by lower gold
production contributions from Iduapriem (-12%), Kibali (-10%) and
Serra Grande (-7%). At Obuasi, gold production for the year was
221,000oz, in line with recent guidance, at a total cash cost* of
$1,214/oz. The Obuasi mine generated $26m of free cash flow*
for 2024.
The solid gold production performance from AngloGold Ashanti’s
managed operations, alongside continued implementation of the
Full Asset Potential programme and increased vigilance on
expenditures at the site level, delivered a strong overall cost
performance despite persistent inflation across several of its
operating jurisdictions. The aggregate inflation rate for the group
was about 6.6%, which represents consumer price index (CPI)
changes in the jurisdictions in which the Company operates. This
increase in inflation was partially mitigated by favourable
exchange rate fluctuations.
Total cash costs per ounce* for the group(1)(2)(3) rose 4% year-on-
year to $1,157/oz in 2024 versus $1,115/oz in 2023. Total cash
costs per ounce* for managed operations(1)(2)(3) rose by only 2%
year-on-year to $1,187/oz in 2024 versus $1,162/oz in 2023,
despite inflationary pressures on labour, material and contractor
costs, and the impact of higher royalties paid, driven by the
increase in the average gold price received per ounce*. All-in
sustaining costs per ounce* (“AISC”) for the group(1)(2)(3) rose 4%
year-on-year to $1,611/oz in 2024 versus $1,544/oz in 2023
mainly due to increased total cash costs per ounce * and higher
sustaining capital expenditure*.
Continued Exploration Success
The Company has achieved significant exploration success over
the past five years, adding 20.9Moz to its gold Mineral Reserve
before accounting for depletion and including the acquisition of
Centamin. This marks the seventh consecutive year that
AngloGold Ashanti has recorded annual increases in gold Mineral
Reserve before depletion. Following the acquisition of Centamin,
total group Mineral Reserve at the end of 2024, was 31.2Moz,
total group gold Measured and Indicated Mineral Resource was
67.1Moz and total group gold Inferred Mineral Resource was
55.0Moz.
Strong Operational Performance Recorded in Q4 2024
Gold production for the group(1)(2)(3)(4), including 40,000oz from the
newly acquired Sukari mine, was 750,000oz for Q4 2024 versus
738,000oz in Q4 2023, mainly due to the addition of Sukari and
higher production from Siguiri, Cerro Vanguardia, Sunrise Dam,
Tropicana and Cuiabá (AGA Mineração). This was partly offset by
lower gold production year-on-year at the Kibali joint venture,
where lower grades resulted in gold production of 80,000oz in Q4
2024 compared with 93,000oz in Q4 2023. At Obuasi, Q4 2024
gold production increased 13% quarter-on-quarter as the mine
ramped up the underhand drift-and-fill mine plan, which targets
the higher-grade areas where challenging ground conditions
prevail.
Total cash costs per ounce* for the group(1)(2)(3) increased 9%
year-on-year to $1,144/oz in Q4 2024 from $1,050/oz in Q4 2023.
AISC per ounce* for the group(1)(2)(3) rose by 3% year-on-year in Q4
2024 to $1,647/oz compared with $1,598/oz in Q4 2023.
Headline earnings(5) of $405m, or 89 US cents per share, in Q4
2024, compared to headline earnings(5) of $87m, or 21 US cents
per share, in Q4 2023. Adjusted EBITDA* increased to $884m in
Q4 2024 from $574m in Q4 2023. Free cash flow* rose to $389m
during Q4 2024, from $293m in Q4 2023.
Sukari Acquisition Bolsters Portfolio
On 22 November 2024, the acquisition of Centamin was
successfully completed. Integration of the Sukari gold mine, and
Eastern Desert Exploration commenced immediately. Sukari
contributed 40,000oz of gold production at a total cash cost* of
$1,165/oz in 2024. The mine contributed $61m in free cash flow*
to group free cash flow* in 2024.
“The addition of Sukari, a true tier-one operation, provides a step-
change in our production profile, while improving the cost outlook
and enhancing cash flow generation”, CEO Alberto Calderon said.
Outlook(6)
The Company is pleased to provide updated 2025 guidance,
following the successful integration of Sukari into the portfolio.
Gold production for the group(2)(3)(4) is forecast to range between
2,900Moz and 3,225Moz. Total cash cost* for the group(2)(3) is
forecast to range between $1,125/oz and $1,225/oz and AISC*
for the group(2)(3) is forecast to range between $1,580/oz and
$1,705/oz. Total capital expenditure for the group(2)(3) is expected
to be between $1,620m and $1,770m.
(1) All financial periods within the financial year ended 31 December 2023 have
been adjusted to exclude the Córrego do Sítio (“CdS”) operation that was placed
on care and maintenance in August 2023.
(2) The term “managed operations” refers to subsidiaries managed by AngloGold
Ashanti and included in its consolidated reporting, while the term “non-managed
joint ventures” (i.e., Kibali) refers to equity-accounted joint ventures that are
reported based on AngloGold Ashanti's share of attributable earnings and are not
managed by AngloGold Ashanti. Managed operations are reported on a
consolidated basis. Non-managed joint ventures are reported on an attributable
basis.
(3) On 22 November 2024, the acquisition of Centamin was successfully
completed. Centamin was included in the financial year ended 31 December 2024
from the effective date of acquisition.
(4) Includes gold concentrate from the Cuiabá mine sold to third parties.
(5) The financial measures “headline earnings (loss)” and “headline earnings (loss)
per share” are not calculated in accordance with IFRS® Accounting Standards, but
in accordance with the Headline Earnings Circular 1/2023, issued by the South
African Institute of Chartered Accountants (SAICA), at the request of the
Johannesburg Stock Exchange Limited (JSE). These measures are required to be
disclosed by the JSE Listings Requirements and therefore do not constitute Non-
GAAP financial measures for purposes of the rules and regulations of the US
Securities and Exchange Commission (“SEC”) applicable to the use and
disclosure of Non-GAAP financial measures.
(6) Refer to the disclaimer below the heading “Guidance” herein for further
information.
* Refer to “Non-GAAP disclosure” for definitions and reconciliations.
QUARTER 4 2024 EARNINGS RELEASE | 4 | | |||
| ||||||
GROUP I FINANCIAL AND OPERATING RESULTS | ||||||
SIGNIFICANT CASH FLOW AND EARNINGS LEVERAGE
Financial Results | Quarter | Quarter | Year | Year | ||
ended | ended | % | ended | ended | % | |
Dec | Dec | Variance | Dec | Dec | Variance | |
US Dollar million, except as otherwise noted | 2024 | 2023 | 2024 | 2023 | ||
Average gold price received *(1)(2)(3) ($/oz) | 2,653 | 1,971 | 35% | 2,394 | 1,930 | 24% |
Adjusted EBITDA* ($m) | 884 | 574 | 54% | 2,747 | 1,420 | 93% |
Headline earnings(5) ($m) | 405 | 87 | 366% | 954 | (46) | 2,174% |
Capital expenditure - Group(2)(3) ($m) | 369 | 357 | 3% | 1,215 | 1,127 | 8% |
Net cash flow from operating activities ($m) | 690 | 404 | 71% | 1,968 | 971 | 103% |
Free cash flow* ($m) | 389 | 293 | 33% | 942 | 109 | 764% |
Adjusted net debt* ($m) | 567 | 1,268 | (55)% | 567 | 1,268 | (55)% |
Highlights
•Strong operating cash flow of
$1,968m, up 103% year-on-
year.
•Free cash flow* up 764% year-
on-year to $942m.
•Average gold price
received*(1)(2)(3) up 24% to
$2,394/oz year-on-year.
•Year-on-year increase of 93%
in Adjusted EBITDA* to
$2,747m.
•Adjusted net debt*, reduced by
55% year-on-year to $567m.
Operating Results | Quarter | Quarter | Year | Year | ||
ended | ended | % | ended | ended | % | |
Dec | Dec | Variance | Dec | Dec | Variance | |
US Dollar million, except as otherwise noted | 2024 | 2023 | 2024 | 2023 | ||
Gold production - Group(1)(2)(3)(4) (koz) | 750 | 738 | 2% | 2,661 | 2,644 | 1% |
Gold production - Managed ops(1)(2)(3)(4)(koz) | 670 | 645 | 4% | 2,352 | 2,301 | 2% |
Total cash costs - Group(1)(2)(3) ($/oz) | 1,144 | 1,050 | 9% | 1,157 | 1,115 | 4% |
Total cash costs - Managed ops(1)(2)(3) ($/oz) | 1,165 | 1,092 | 7% | 1,187 | 1,162 | 2% |
AISC - Group(1)(2)(3) ($/oz) | 1,647 | 1,598 | 3% | 1,611 | 1,544 | 4% |
AISC - Managed ops(1)(2)(3) ($/oz) | 1,702 | 1,701 | —% | 1,672 | 1,634 | 2% |
Highlights
•Group gold production(1)(2)(3)(4)
of 2,661koz, up 1% year-on-
year, with Managed ops(1)(2)(3)(4)
up 2%.
•Group total cash costs*(1)(2)(3)
up 4% year-on-year to $1,157/
oz, with Managed ops(1)(2)(3) up
2%.
•Group AISC*(1)(2)(3), increased
by 4% year-on-year to $1,611/
oz, with Managed ops(1)(2)(3) up
2%.
* Refer to “Non-GAAP disclosure” for definitions and reconciliations. | ||||
QUARTER 4 2024 EARNINGS RELEASE | 5 | | |||
| ||||||
FINANCIAL AND OPERATING RESULTS I AT A GLANCE | ||||||
QUARTER IN REVIEW
Prioritise people, safety, health and sustainability | ZERO | 1.06 injuries per million hours worked | ||||||
Fatalities at Company managed operations (including contractors) | Total Recordable Injury Frequency Rate | |||||||
0% (2023 Q4: 0) | 25% (2023 Q4: 0.85) | |||||||
Maintain financial flexibility | $389m | $690m | $567m | |||||
Free cash flow* | Net cash flow from operating activities | Adjusted net debt* | ||||||
33% (2023 Q4: $293m) | 71% (2023 Q4: $404m) | (55%) (2023 Q4: $1,268m) | ||||||
Optimise overhead, costs and capital expenditure | $1,144/oz | $1,647/oz | $369m | |||||
Total cash costs* | All-in sustaining costs* | Capital expenditure | ||||||
9% (2023 Q4: $1,050/oz) | 3% (2023 Q4: $1,598/oz) | 3% (2023 Q4: $357m) | ||||||
Maintain long-term optionality | 0.21X | $567m | $884m | |||||
Adjusted net debt* : Adjusted EBITDA* | Adjusted net debt* | Adjusted EBITDA* | ||||||
(76%) (2023 Q4: 0.89x) | (55%) (2023 Q4: $1,268m) | 54% (2023 Q4: $574m) | ||||||
*Refer to “Non-GAAP disclosure” for definitions and reconciliations. | ||||||||
Improve portfolio quality | CENTAMIN ACQUISITION | OBUASI NEW UHDF MINING METHOD | ||||||
Centamin acquisition was completed on 22 November 2024 including flagship Sukari Mine in Egypt, which brought another Tier 1 gold mine into our portfolio as well as prospective exploration properties in Egypt’s Eastern Desert and projects in Côte d’Ivoire. The acquisition improved cash flow and long-term value of the business as it increased gold production and decreased our cost profile, further diversifying the portfolio, | The Underhand Drift and Fill mining method (“UHDF”) has been safely and successfully trialed. UHDF will be scaled up to form part of a hybrid mining approach alongside sub-level open stoping, to underpin a progressive increase in anticipated gold production to a rate of approximately 400,000oz per annum by 2028. | |||||||


QUARTER 4 2024 EARNINGS RELEASE | 6 | | |||
| ||||||
FINANCIAL AND OPERATING RESULTS I AT A GLANCE | ||||||
FULL YEAR IN REVIEW
Prioritise people, safety, health and sustainability | One | 0.98injuries per million hours worked | ||||||
Fatalities at Company managed operations (including contractors) | Total Recordable Injury Frequency Rate | |||||||
(2023 : 0) | (10%) (2023: 1.09) | |||||||
Maintain financial flexibility | $942m | $1,968m | $567m | |||||
Free cash flow* | Net cash flow from operating activities | Adjusted net debt* | ||||||
764% (2023: $109m) | 103% (2023: $971m) | (55%) (2023 : $1,268m) | ||||||
Optimise overhead, costs and capital expenditure | $1,157/oz | $1,611/oz | $1,215m | |||||
Total cash costs* | All-in sustaining costs* | Capital expenditure | ||||||
4% (2023: $1,115/oz) | 4% (2023: $1,544/oz) | 8% (2023: $1,127m) | ||||||
Maintain long-term optionality | $2,747m | 67.1Moz | 55.0Moz | |||||
Adjusted EBITDA* | Measured and Indicated Mineral Resource | Inferred Mineral Resource | ||||||
93% (2023 : $1,420m) | 12% (2023: 59.9Moz) | 18% (2023 : 46.4Moz) | ||||||
*Refer to “Non-GAAP disclosure” for definitions and reconciliations. | ||||||||
Improve portfolio quality | FULL ASSET POTENTIAL PROGRAMME | |||||||
Drives strong cost performance, offsetting inflationary impacts which delivers significant efficiencies, greater predictability and much improved resilience to withstand gold production disruptions. Since the implementation of the programme, total cash costs in real terms have declined 5% over Q1 2021 to Q4 2024. Furthermore, this has resulted in $621m in incremental Adjusted EBITDA since 2022. | ||||||||

QUARTER 4 2024 EARNINGS RELEASE | 7 | | |||
| ||||||
GROUP I FINANCIAL AND OPERATING KEY STATISTICS | ||||||
London, Denver, Johannesburg, 19 February 2025 - AngloGold Ashanti plc (“AngloGold Ashanti”, “AGA” or the “Company”) is pleased to
provide its financial and operational update for the three months and year ended 31 December 2024.
Key Statistics | Quarter | Quarter | Year | Year | |
ended | ended | ended | ended | ||
Dec | Dec | Dec | Dec | ||
US Dollar million, except as otherwise noted | 2024 | 2023 | 2024 | 2023 | |
Operating review | |||||
Gold | |||||
Produced - Group (1) (2) (3) (4) | - oz (000) | 750 | 738 | 2,661 | 2,644 |
Produced - Managed operations (1) (2) (3) (4) | - oz (000) | 670 | 645 | 2,352 | 2,301 |
Produced - Non-managed joint ventures (2) | - oz (000) | 80 | 93 | 309 | 343 |
Sold - Group (1) (2) (3) (4) | - oz (000) | 725 | 711 | 2,679 | 2,624 |
Sold - Managed operations(1) (2) (3) (4) | - oz (000) | 647 | 619 | 2,370 | 2,281 |
Sold - Non-managed joint ventures (2) | - oz (000) | 78 | 92 | 309 | 343 |
Financial review | |||||
Gold income | - $m | 1,716 | 1,223 | 5,673 | 4,480 |
Cost of sales - Group | - $m | 1,144 | 1,023 | 4,106 | 3,913 |
Cost of sales - Managed operations | - $m | 1,043 | 929 | 3,726 | 3,541 |
Cost of sales - Non-managed joint ventures | - $m | 101 | 94 | 380 | 372 |
Total operating costs | - $m | 815 | 740 | 2,911 | 2,870 |
Gross profit | - $m | 707 | 327 | 2,067 | 1,041 |
Average gold price received per ounce* - Group (1) (2) (3) | - $/oz | 2,653 | 1,971 | 2,394 | 1,930 |
Average gold price received per ounce* - Managed operations (1) (2) (3) | - $/oz | 2,652 | 1,969 | 2,393 | 1,927 |
Average gold price received per ounce* - Non-managed joint ventures (2) | - $/oz | 2,662 | 1,984 | 2,401 | 1,948 |
All-in sustaining costs per ounce* - Group (1) (2) (3) | - $/oz | 1,647 | 1,598 | 1,611 | 1,544 |
All-in sustaining costs per ounce* - Managed operations (1) (2) (3) | - $/oz | 1,702 | 1,701 | 1,672 | 1,634 |
All-in sustaining costs per ounce* - Non-managed joint ventures (2) | - $/oz | 1,188 | 907 | 1,146 | 951 |
All-in costs per ounce* - Group (1) (2) (3) | - $/oz | 1,840 | 1,794 | 1,846 | 1,754 |
All-in costs per ounce* - Managed operations (1) (2) (3) | - $/oz | 1,895 | 1,909 | 1,910 | 1,857 |
All-in costs per ounce* - Non-managed joint ventures (2) | - $/oz | 1,388 | 1,023 | 1,351 | 1,074 |
Total cash costs per ounce* - Group (1) (2) (3) | - $/oz | 1,144 | 1,050 | 1,157 | 1,115 |
Total cash costs per ounce* - Managed operations (1) (2) (3) | - $/oz | 1,165 | 1,092 | 1,187 | 1,162 |
Total cash costs per ounce* - Non-managed joint ventures (2) | - $/oz | 967 | 761 | 935 | 802 |
Profit before taxation | - $m | 698 | 144 | 1,672 | 63 |
Adjusted EBITDA* | - $m | 884 | 574 | 2,747 | 1,420 |
Total borrowings | - $m | 2,125 | 2,410 | 2,125 | 2,410 |
Adjusted net debt* | - $m | 567 | 1,268 | 567 | 1,268 |
Profit (loss) attributable to equity shareholders | - $m | 470 | 28 | 1,004 | (235) |
- US cents/share | 103 | 7 | 233 | (56) | |
Headline earnings (loss) (5) | - $m | 405 | 87 | 954 | (46) |
- US cents/share | 89 | 21 | 221 | (11) | |
Net cash inflow from operating activities | - $m | 690 | 404 | 1,968 | 971 |
Free cash flow* | - $m | 389 | 293 | 942 | 109 |
Capital expenditure - Group(2)(3) | - $m | 369 | 357 | 1,215 | 1,127 |
Capital expenditure - Managed operations(2)(3) | - $m | 333 | 334 | 1,090 | 1,042 |
Capital expenditure - Non-managed joint ventures (2) | - $m | 36 | 23 | 125 | 85 |
(1)All financial periods within the financial year ended 31 December 2023 have been adjusted to exclude the Córrego do Sítio (“CdS”) operation that was placed on care and maintenance in August 2023. All gold production, gold sold, average gold price received per ounce*, all-in sustaining costs per ounce*, all-in costs per ounce* and total cash costs per ounce* metrics in this document have been adjusted to exclude the CdS operation, unless otherwise stated. | |||||
(2)The term “managed operations” refers to subsidiaries managed by AngloGold Ashanti and included in its consolidated reporting, while the term “non-managed joint ventures” (i.e., Kibali) refers to equity-accounted joint ventures that are reported based on AngloGold Ashanti’s share of attributable earnings and are not managed by AngloGold Ashanti. Managed operations are reported on a consolidated basis. Non-managed joint ventures are reported on an attributable basis. | |||||
(3)On 22 November 2024, the acquisition of Centamin was successfully completed. Centamin was included in the financial year ended 31 December 2024 from the effective date of the acquisition. | |||||
(4)Includes gold concentrate from the Cuiabá mine sold to third parties. | |||||
(5)The financial measures “headline earnings (loss)” and “headline earnings (loss) per share” are not calculated in accordance with IFRS® Accounting Standards, but in accordance with the Headline Earnings Circular 1/2023, issued by the South African Institute of Chartered Accountants (SAICA), at the request of the Johannesburg Stock Exchange Limited (JSE). These measures are required to be disclosed by the JSE Listings Requirements and therefore do not constitute Non-GAAP financial measures for purposes of the rules and regulations of the US Securities and Exchange Commission (“SEC”) applicable to the use and disclosure of Non-GAAP financial measures. | |||||
* Refer to “Non-GAAP disclosure” for definitions and reconciliations. | |||||
$ represents US Dollar, unless otherwise stated. | |||||
Rounding of figures may result in computational discrepancies. | |||||
QUARTER 4 2024 EARNINGS RELEASE | 8 | | |||
| ||||||
GROUP I FINANCIAL AND OPERATING RESULTS | ||||||
QUARTERLY AND ANNUAL REVIEW
GOLD PRODUCTION
Gold production for the group in 2024 was 2,661,000oz,
compared to 2,644,000oz in 2023.
Gold production for the group increased by 1% year-on-year, with
improvements recorded at Cuiabá (AGA Mineração) (+8%), Cerro
Vanguardia (+7%), Siguiri (+5%), Sunrise Dam (+3%) and
Tropicana (+1%), as well as the introduction of Sukari into the
portfolio. These increases were partly offset by lower gold
production contributions from Iduapriem (-12%) and Kibali (-10%)
both impacted by excessive rainfall, as well as Serra Grande (-7%)
and Obuasi (-1%), whilst gold production at Geita remained steady
relative to the prior year. The Company realised overall year-on-
year uplifts in milled tonnes and underground recovered-grade, on
the back of continued reinvestment in improvement initiatives.
Cuiabá (AGA Mineração) had a strong fourth quarter and year,
continuing its performance turnaround with consistent gold
production helped by the resumption of processing and refining
of gold concentrate at the Queiroz metallurgical plant in
September, contributing to a 16% reduction year-on-year in total
cash costs per ounce*. The Australian assets overcame
challenges from flooding, which occurred towards the end of Q1
2024, finishing the year strongly by delivering a 5% improvement
in gold production compared to Q4 2023.
COSTS
Total cash costs per ounce* for the group increased by 9% year-
on-year to $1,144/oz in Q4 2024, from $1,050/oz in Q4 2023.
Total cash costs per ounce* for managed operations increased
7% year-on-year from $1,092/oz in Q4 2023 to $1,165/oz in Q4
2024 mainly due to higher input costs. Total cash costs per
ounce* for non-managed joint ventures increased by 27% year-
on-year from $761/oz in Q4 2023 to $967/oz in Q4 2024,
reflecting Kibali’s weaker performance.
Total cash costs per ounce* for the group increased by 4% year-
on-year to $1,157/oz in 2024 from $1,115/oz in 2023. Total cash
costs per ounce* for managed operations increased 2% year-on-
year from $1,162/oz in 2023 to $1,187/oz in 2024. Total cash
costs per ounce* for non-managed joint ventures increased by
17% year-on-year from $802/oz in 2023 to $935/oz in 2024. The
overall cost performance came amid an about 6.6% inflation rate
increase, which represents CPI changes in the jurisdictions in
which the Company operates, and about 2% higher costs related
to royalties based on the average gold price received per ounce*
during 2024, partly offset by an about 4% weaker cumulative
foreign currency exchange rate against the US dollar.
AISC per ounce* for the group rose 3% year-on-year to $1,647/oz
in Q4 2024, from $1,598/oz in Q4 2023. AISC per ounce* for
managed operations remained steady year-on-year at $1,701/oz
in Q4 2023 versus $1,702/oz in Q4 2024,. AISC per ounce* for
non-managed joint ventures increased by 31% year-on-year from
$907/oz in Q4 2023 to $1,188/oz in Q4 2024.
AISC per ounce* for the group rose by 4% year-on-year to $1,611/
oz in 2024, from $1,544/oz in 2023. AISC per ounce* for
managed operations increased by 2% year-on-year to $1,672/oz,
compared to $1,634/oz in 2023, mainly due to an increase in
total cash costs per ounce*, sustaining capital expenditure*, and
rehabilitation costs. AISC per ounce* for non-managed joint
ventures increased by 21% year-on-year from $951/oz in 2023 to
$1,146/oz in 2024, reflecting Kibali’s weaker performance.
ADJUSTED EBITDA*
Adjusted earnings before interest, tax, depreciation and
amortisation* (“Adjusted EBITDA*”) for Q4 2024 was $884m,
compared with $574m for Q4 2023. Adjusted EBITDA* was higher
year-on-year mainly due to a higher average gold price received
per ounce*, higher gold ounces sold, lower costs associated with
old tailing storage facilities (“TSFs”) and governmental fiscal
claims and higher equity earnings from associates and non-
managed joint ventures. This increase was partly offset by higher
operating costs, higher indirect taxes, legal fees mainly related to
the Centamin acquisition, realised losses on non-hedge derivative
contracts, and lower insurance claim credits than the prior year
period.
Adjusted EBITDA* for 2024 was $2,747m, compared with
$1,420m in 2023. Adjusted EBITDA* was higher year-on-year
mainly due to a higher average gold price received per ounce*,
higher gold ounces sold, lower costs associated with old TSF and
governmental fiscal claims, higher equity earnings from
associates and non-managed joint ventures, and corporate
restructuring costs in the prior period which did not recur in the
current period. This increase was partly offset by higher
operating and rehabilitation costs in the current period,
unfavourable inventory movements, higher corporate costs, legal
fees mainly related to the Centamin acquisition, and realised
losses on non-hedge derivative contracts.
EARNINGS
Basic earnings (profit attributable to equity shareholders) for Q4
2024 were $470m, or 103 US cents per share, compared to
QUARTER 4 2024 EARNINGS RELEASE | 9 | | |||
| ||||||
REGIONS I FINANCIAL AND OPERATING RESULTS | ||||||
QUARTERLY AND ANNUAL REVIEW CONTINUED
$28m, or 7 US cents per share in Q4 2023. Basic earnings were
higher year-on-year mainly due to a higher average gold price
received per ounce*, impairment reversals in the current period
versus impairments in Q4, 2023, lower losses on derecognition of
assets, favourable foreign exchange and fair value adjustments
and lower care and maintenance costs. This increase was partly
offset by higher operating and royalty costs, lower insurance
credits than the prior period, legal fees mainly associated with
the Centamin acquisition, higher other indirect taxes, lower equity
earnings from associates and non-managed joint ventures and
higher taxation.
Basic earnings (profit attributable to equity shareholders) for
2024 were $1,004m, or 233 US cents per share, compared to a
loss of $235m, or 56 US cents per share in 2023. Basic earnings
were higher year-on-year mainly due to a higher average gold
price received per ounce*, impairment reversals in the current
period versus impairments in 2023, lower losses on derecognition
of assets, favourable foreign exchange and fair value
adjustments, lower costs associated with old TSF and
governmental fiscal claims, and corporate restructuring costs in
the prior period which did not recur in the current period. This
increase was partly offset by higher operating and rehabilitation
costs in the current period, unfavourable inventory movements,
higher corporate costs, legal fees mainly related to the Centamin
acquisition, higher care and maintenance costs, lower equity
earnings from associates and non-managed joint ventures and
higher taxation.
Headline earnings‡ for Q4 2024 were $405m, or 89 US cents per
share, compared with $87m, or 21 US cents per share, in Q4
2023. Headline earnings were higher year-on-year mainly due to
the same reasons which contributed to the increase in basic
earnings in Q4 2024, in addition there were impairment reversals
in the current period versus impairments in the prior period, and
lower losses on derecognition of assets and taxes thereon.
Headline earnings‡ for 2024 were $954m, or 221 US cents per
share, compared with a loss of $46m, or 11 US cents per share, in
2023. Headline earnings were higher year-on-year mainly due to
the same reasons which contributed to the increase in basic
earnings in 2024, in addition there were impairment reversals in
the current period versus impairments in the prior period, and
lower losses on derecognition of assets and taxes thereon.
‡ The financial measures “headline earnings (loss)” and “headline
earnings (loss) per share” are not calculated in accordance with
IFRS® Accounting Standards, but in accordance with the Headline
Earnings Circular 1/2023, issued by the South African Institute of
Chartered Accountants (SAICA), at the request of the
Johannesburg Stock Exchange Limited (JSE). These measures
are required to be disclosed by the JSE Listings Requirements
and therefore do not constitute Non-GAAP financial measures for
purposes of the rules and regulations of the SEC applicable to the
use and disclosure of Non-GAAP financial measures.
CASH FLOW
Net cash inflow from operating activities was $690m in Q4 2024,
compared to $404m in Q4 2023. This 71% increase was mainly
due to the higher average gold price received per ounce* and
lower corporate restructuring costs, partly offset by lower
dividends received from joint ventures and higher net taxes paid.
After accounting for capital expenditure and loan repayments
from Kibali, the Company recorded free cash inflow* of $389m
during Q4 2024, compared to a free cash inflow* of $293m in Q4
2023.
Net cash inflow from operating activities was $1,968m in 2024,
compared to $971m in 2023. This 103% increase was mainly due
to the higher average gold price received per ounce* and lower
corporate restructuring costs, partly offset by lower dividends
received from joint ventures and higher net taxes paid. After
accounting for capital expenditure and loan repayments from
Kibali, the Company recorded free cash inflow* of $942m during
2024, compared to a free cash inflow* of $109m in 2023.
Free cash flow* before non-sustaining capital expenditure*
(attributable to ordinary shareholders), the metric on which the
dividend payment was previously based, was an inflow of $408m
in Q4 2024, compared to an inflow of $340m in Q4 2023. The
Company’s Board of Directors has reviewed the capital allocation
policy and approved an amendment to the calculation of the
gross dividend. Under the new policy, AngloGold Ashanti will
target a 50% payout of free cash flow*, where free cash flow* is
defined as operating cash flow less capital expenditure of
managed operations, subject to maintaining an Adjusted net
debt* to Adjusted EBITDA* ratio of 1.0 times. Additionally, the
revised policy introduces a base dividend of $0.50 per share per
annum, payable in quarterly increments of $0.125 per share. The
proposed interim dividend, based on the revised dividend policy,
for the six months ended 31 December 2024, is 69 US cents per
share.
AngloGold Ashanti received dividends of $44m and loan
repayments of $10m from the Kibali joint venture during Q4 2024,
compared to dividends received of $94m during Q4 2023. At
31 December 2024, the Company’s attributable share of the
QUARTER 4 2024 EARNINGS RELEASE | 10 | | |||
| ||||||
REGIONS I FINANCIAL AND OPERATING RESULTS | ||||||
QUARTERLY AND ANNUAL REVIEW CONTINUED
outstanding cash balances from the Democratic Republic of the
Congo (“DRC”) was $39m, compared to nil at 30 September 2024.
Free cash flow* was impacted by movements in the lock-up of
value added tax (“VAT”) at Geita and Kibali and foreign exchange
controls and export duties at Cerro Vanguardia (“CVSA”):
•In Tanzania, net overdue recoverable VAT input credit refunds
(after discounting provisions) increased by $25m during Q4
2024 to $163m from $138m at 30 September 2024, as a
result of foreign exchange adjustments of $25m, new claims
submitted of $23m and discounting adjustments of $3m,
partially offset by processing verified VAT claims against
corporate tax payments of $26m. AngloGold Ashanti expects
to continue offsetting verified VAT claims against corporate
taxes.
•In the DRC, the Company's attributable share of the net
recoverable VAT balance (including recoverable fuel duties
and after discounting provisions) decreased by $11m during
Q4 2024 to $65m from $76m at 30 September 2024, as a
result of claim refunds of $11m and an unwinding of discount
and revaluation adjustments decrease of $6m, partially offset
by new claims submitted of $6m.
•In Argentina, the net export duty receivables (after discounting
provisions) remained steady at $3m# during Q4 2024 relative
to Q3 2024. In addition, CVSA’s cash balance decreased by
$36m# during Q4 2024 to $134m# from $170m# at
30 September 2024. The cash remains available for CVSA’s
operational and exploration requirements.
•During Q4 2024, CVSA paid the remaining offshore dividends
of $50m# to AngloGold Ashanti by entering into a currency
swap to obtain the necessary US dollars.
# US dollar equivalent and at prevailing exchange rates.
GOLD HEDGES
During Q4 2023, AngloGold Ashanti entered into zero-cost collars
for a total of approximately 300,000oz of gold for the period from
January 2024 to December 2024 in order to manage gold price
downside risk of the high costs associated with the Brazilian
operations. During Q4 2024, the price of gold remained elevated
above the cap of these gold derivatives. The call options on the
hedge structure were exercised by the banks resulting in a
realised loss position of approximately $38.5m during Q4 2024.
The average price of gold for Q4 2024 was calculated as
$2,661/ oz which was greater than the call strike of $2,148/oz on
those gold derivatives. AngloGold Ashanti recorded a total
realised loss of $86m in respect of these gold derivatives in 2024.
All gold hedges expired at 31 December 2024 and there are no
hedges in place for 2025. As a result, the Company is fully
unhedged with respect to its gold production as of 1 January
2025.
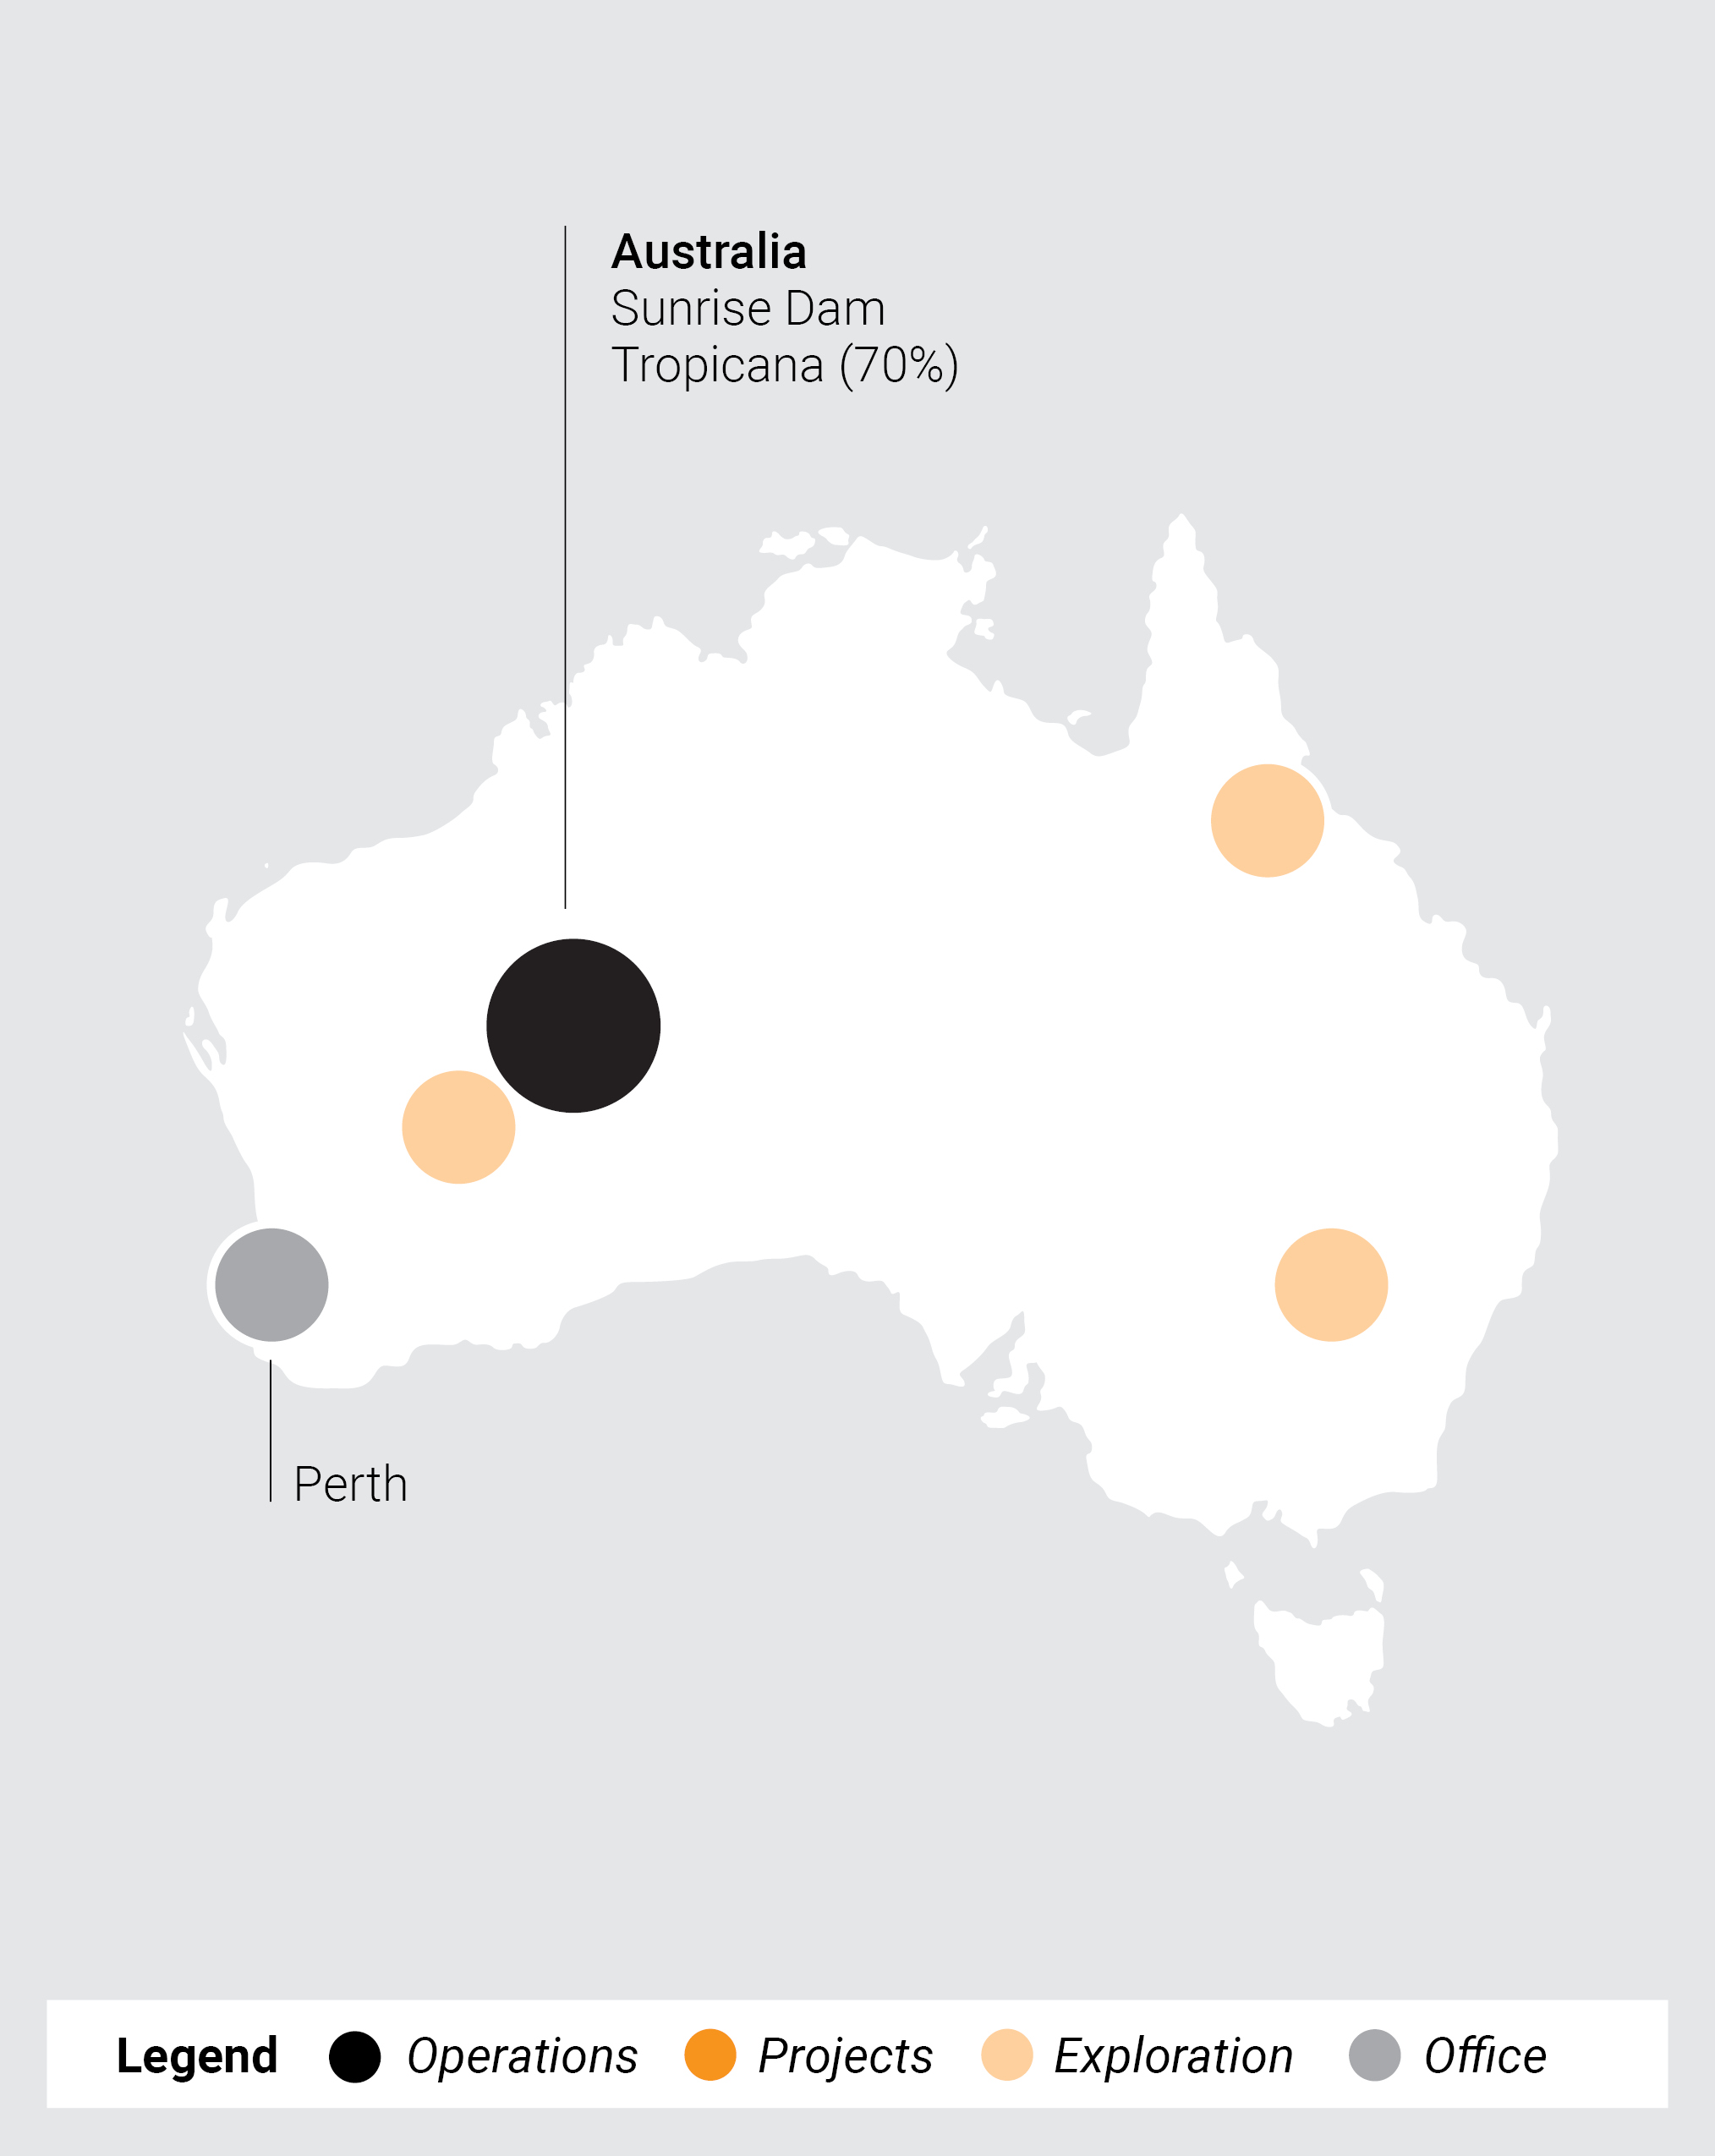
Tropicana, Australia
QUARTER 4 2024 EARNINGS RELEASE | 11 | | |||
| ||||||
GROUP I FINANCIAL AND OPERATING RESULTS | ||||||
FREE CASH FLOW*
FREE CASH FLOW* | Quarter | Quarter | Year | Year |
ended | ended | ended | ended | |
Dec | Dec | Dec | Dec | |
2024 | 2023 | 2024 | 2023 | |
US Dollar million, except as otherwise noted | Unaudited | Unaudited | Unaudited | Unaudited |
Cash generated from operations | 713 | 306 | 2,063 | 871 |
Dividends received from joint ventures | 44 | 94 | 88 | 180 |
Taxation refund | — | 36 | 6 | 36 |
Taxation paid | (67) | (32) | (189) | (116) |
Net cash inflow from operating activities | 690 | 404 | 1,968 | 971 |
Corporate restructuring costs | — | 238 | 2 | 268 |
Capital expenditure on tangible and intangible assets | (333) | (334) | (1,090) | (1,042) |
Net cash from operating activities after capital expenditure | 357 | 308 | 880 | 197 |
Repayment of lease liabilities | (23) | (27) | (91) | (94) |
Finance costs accrued and capitalised | (33) | (37) | (139) | (132) |
Net cash flow after capital expenditure and interest | 301 | 244 | 650 | (29) |
Repayment of loans advanced to joint ventures | 10 | — | 149 | — |
Other net cash inflow from investing activities | 42 | 47 | 113 | 125 |
Other | 26 | 2 | 35 | 4 |
Add backs: | ||||
Cash restricted for use | 10 | — | (5) | 9 |
Free cash flow*(1) | 389 | 293 | 942 | 109 |
(1) Free cash flow* has been adjusted to exclude corporate restructuring costs and Centamin acquisition costs.
* Refer to “Non-GAAP disclosure” for definitions and reconciliations.
Rounding of figures may result in computational discrepancies.
BALANCE SHEET AND LIQUIDITY
Adjusted net debt* decreased to $567m at 31 December 2024
from $1,268m at 31 December 2023. The ratio of Adjusted net
debt* to Adjusted EBITDA* was 0.21 times at 31 December 2024
compared to 0.89 times at 31 December 2023. The Company
remains committed to maintaining a flexible balance sheet with
an Adjusted net debt* to Adjusted EBITDA* target ratio of 1.0
times through the cycle. At 31 December 2024, the balance sheet
remained strong, with liquidity comprising the US$1.4bn 2022
multi-currency RCF of which $1.22bn was undrawn, and the
South African R150m ($8m) RMB corporate overnight facility
which was undrawn. The 2021 Geita multi-currency RCF matured
on 13 December 2024. At 31 December 2024, the $65m 2022
Siguiri RCF was fully drawn. At 31 December 2024, the Company
had a cash and cash equivalent balance (net of bank overdraft)
of approximately $1.397bn, taking overall group liquidity to
approximately $2.6bn.
CAPITAL EXPENDITURE
For Q4 2024, sustaining capital expenditure* of the group
decreased by 7% year-on-year to $285m, from $308m in Q4 2023.
Sustaining capital expenditure* of managed operations for Q4
2024 was $266m, a year-on-year decrease of 10% compared to
$295m in Q4 2023. The decrease was mainly due to once-off
costs incurred in Q4 2023, including the carbon-in-leach (“CIL”)
Tank 1 failure recovery project at Siguiri. Sustaining capital
expenditure* of non-managed joint ventures increased by 46%
year-on-year to $19m in Q4 2024, from $13m in Q4 2023, mainly
due to higher expenditure on heavy mobile equipment (“HME”)
rebuilds and IT projects.
Non-sustaining capital expenditure* of the group was 71% higher
year-on-year at $84m in Q4 2024, compared to $49m in Q4 2023.
Non-sustaining capital expenditure* of managed operations
increased by 72% year-on-year to $67m in Q4 2024, from $39m in
Q4 2023 mainly due to higher Beposo TSF spend at Iduapriem,
the Havana growth project at Tropicana and at Siguiri due to
infrastructure capital expenditure in preparation for Block 3
execution. Non-sustaining capital expenditure* of non-managed
joint ventures increased by 70% year-on-year to $17m in Q4 2024,
from $10m in Q4 2023, mainly due to the solar energy project at
Kibali.
Capital expenditure of the group (including equity-accounted non-
managed joint ventures) was 8% higher year-on-year at $1,215m,
compared to $1,127m in 2023. Capital expenditure of managed
operations increased by 5% year-on-year to $1,090m in 2024,
compared to $1,042m in 2023. This increase was mainly driven
by a $26m increase in non-sustaining capital expenditure*,
primarily due to higher Beposo TSF spend at Iduapriem, and a
$22m increase in sustaining capital expenditure*, mainly due to
acquisition of additional mining fleet at Siguiri and Mineral
Reserve development at Sunrise Dam. Capital expenditure of non-
managed joint ventures increased by 47% year-on-year to $125m
in 2024, from $85m in 2023, mainly as a result of the Kibali solar
energy project and cyanide TSF.
* Refer to “Non-GAAP disclosure” for definitions and reconciliations.
QUARTER 4 2024 EARNINGS RELEASE | 12 | | |||
| ||||||
GROUP I FINANCIAL AND OPERATING RESULTS | ||||||
GUIDANCE
2025 GUIDANCE
2025 Guidance | ||
Gold production | Gold production (koz) | |
–Managed operations | 2,590 - 2,885 | |
–Non-managed joint ventures | 310 - 340 | |
–Group | 2,900 - 3,225 | |
Africa | 1,935 - 2,160 | |
Australia | 500 - 550 | |
Americas | 465 - 515 | |
Costs(1) | All-in sustaining costs per ounce* ($/oz) | |
–Managed operations | 1,600 - 1,725 | |
–Non-managed joint ventures | 1,160 - 1,260 | |
–Group | 1,580 - 1,705 | |
Africa | 1,530 | |
Australia | 1,700 | |
Americas | 1,700 | |
Total cash costs per ounce* ($/oz) | ||
–Managed operations | 1,130 - 1,230 | |
–Non-managed joint ventures | 970 - 1,050 | |
–Group | 1,125 - 1,225 | |
Africa | 1,090 | |
Australia | 1,425 | |
Americas | 1,225 | |
Capital expenditure(1) | Capital expenditure ($m) | |
–Managed operations | 1,505 - 1,635 | |
–Non-managed joint ventures | 115 - 135 | |
–Group | 1,620 - 1,770 | |
Sustaining capital expenditure* ($m) | ||
–Managed operations | 1,035 - 1,125 | |
–Non-managed joint ventures | 50 - 60 | |
–Group | 1,085 - 1,185 | |
Non-sustaining capital expenditure* ($m) | ||
–Managed operations | 470 - 510 | |
–Non-managed joint ventures | 65 - 75 | |
–Group | 535 - 585 | |
QUARTER 4 2024 EARNINGS RELEASE | 13 | | |||
| ||||||
REGIONS I FINANCIAL AND OPERATING RESULTS | ||||||
GUIDANCE CONTINUED
(1) The Company is not providing quantitative reconciliations to the most directly comparable IFRS measures for its Non-GAAP financial guidance shown above in reliance on
the exception provided by Rule 100(a)(2) of Regulation G because the reconciliations cannot be performed without unreasonable efforts as such IFRS measures cannot be
reliably estimated due to their dependence on future uncertainties and adjusting items, including, among other factors, changes in economic, social, political and market
conditions, including related to inflation or international conflicts, the success of business and operating initiatives, changes in the regulatory environment and other
government actions, including environmental approvals, fluctuations in gold prices and exchange rates, the outcome of pending or future litigation proceedings, any supply
chain disruptions, any public health crises, pandemics or epidemics (including the COVID-19 pandemic), and other business and operational risks and challenges and other
factors, including mining accidents, that the Company cannot reasonably predict at this time but which may be material. Outlook economic assumptions for 2025 guidance are
as follows: $0.65/A$, BRL5.88/$, AP1,099/$, ZAR18.00/$ and Brent $75/bbl.
Cost and capital forecast ranges for 2025 are expressed in “nominal” terms. “Nominal” cash flows are current price term cash flows that have been inflated into future value,
using an appropriate “inflation” rate. Estimates assume neither operational or labour interruptions or power disruptions, nor further changes to asset portfolio and/or operating
mines and have not been reviewed by AngloGold Ashanti’s external auditors. Other unknown or unpredictable factors, or factors outside the Company’s control, including
inflationary pressures on its cost base, could also have material adverse effects on AngloGold Ashanti’s future results and no assurance can be given that any expectations
expressed by AngloGold Ashanti will prove to have been correct. Measures taken at AngloGold Ashanti’s operations together with AngloGold Ashanti’s business continuity
plans aim to enable its operations to deliver in line with its production targets. Actual results could differ from guidance and any deviations may be significant. Please refer to
the Risk Factors section in AngloGold Ashanti’s annual report on Form 20-F for the financial year ended 31 December 2023 filed with the SEC.
Gold production is expected to range from 2.900Moz to 3.225Moz. Total cash costs per ounce* for managed operations are expected to
range from $1,130/oz to $1,230/oz in 2025. Total cash costs per ounce* are forecast to remain within the guidance range due to the
continued realisation of benefits from the Company’s Full Asset Potential review programme and the integration of Sukari. Sustaining capital
expenditure* for 2025 is expected to grow from 2024 because of modest increases in stay-in-business capital and the full year of Sukari. The
Company’s managed operations are expected to operate at an AISC per ounce* ranging from $1,600/oz to $1,725/oz in 2025. Non-sustaining
capital expenditure* for 2025 is expected to increase from 2024 due to additional investment in North Bullfrog and mining development at
Siguiri and Tropicana and the inclusion of Sukari for the full year. The Company continues to enforce capital and cost discipline across the
business while prioritising the safety, health, and well-being of its employees and its host communities.
2026 GUIDANCE
2026 Guidance(1) | ||
Gold production | Gold production (koz) - Group | 2,900 - 3,225 |
Costs(1) | All-in sustaining costs per ounce* ($/oz) - Group | 1,580 - 1,705 |
Total cash costs per ounce* ($/oz) - Group | 1,125 - 1,225 | |
Capital expenditure(1) | Capital expenditure ($m) - Group | 1,710 - 1,860 |
Sustaining capital expenditure* ($m) - Group | 1,085 - 1,185 | |
Non-sustaining capital expenditure* ($m) - Group | 625 - 675 | |
(1) The Company is not providing quantitative reconciliations to the most directly comparable IFRS measures for its Non-GAAP financial guidance shown above in reliance on
the exception provided by Rule 100(a)(2) of Regulation G because the reconciliations cannot be performed without unreasonable efforts as such IFRS measures cannot be
reliably estimated due to their dependence on future uncertainties and adjusting items, including, among other factors, changes in economic, social, political and market
conditions, including related to inflation or international conflicts, the success of business and operating initiatives, changes in the regulatory environment and other
government actions, including environmental approvals, fluctuations in gold prices and exchange rates, the outcome of pending or future litigation proceedings, any supply
chain disruptions, any public health crises, pandemics or epidemics (including the COVID-19 pandemic), and other business and operational risks and challenges and other
factors, including mining accidents, that the Company cannot reasonably predict at this time but which may be material. Outlook economic assumptions for 2026 guidance are
as follows: $0.67/A$, BRL5.96/$, AP1,2540/$, ZAR18.00/$ and Brent $70/bbl.
Cost and capital forecast ranges for 2026 are expressed in “real” terms. “Real” cash flows are adjusted for “inflation” in order to reflect the change in value of money over time.
Estimates assume neither operational or labour interruptions or power disruptions, nor further changes to asset portfolio and/or operating mines and have not been reviewed
by AngloGold Ashanti’s external auditors. Other unknown or unpredictable factors, or factors outside the Company’s control, including inflationary pressures on its cost base,
could also have material adverse effects on AngloGold Ashanti’s future results and no assurance can be given that any expectations expressed by AngloGold Ashanti will prove
to have been correct. Measures taken at AngloGold Ashanti’s operations together with AngloGold Ashanti’s business continuity plans aim to enable its operations to deliver in
line with its production targets. Actual results could differ from guidance and any deviations may be significant. Please refer to the Risk Factors section in AngloGold Ashanti’s
annual report on Form 20-F for the financial year ended 31 December 2023 filed with the SEC.
2026 guidance reflects similar output to that in 2025 with anticipated growth at Obuasi. Continued progression of our Full Asset Potential
programme and overall cost discipline underpins the guided flat cost metrics in real terms. The expected increase in non-sustaining capital
expenditure reflects the anticipated incremental investment in the construction of North Bullfrog.
* Refer to “Non-GAAP disclosure” for definitions and reconciliations.
QUARTER 4 2024 EARNINGS RELEASE | 14 | | |||
| ||||||
REGIONS I FINANCIAL AND OPERATING RESULTS | ||||||
QUARTER AND YEAR IN REVIEW
REGIONAL REVIEW
AFRICA REGION
In the Africa region, managed operations (including Sukari)
produced 360,000oz at a total cash cost* of $1,225/oz in Q4
2024, compared to 348,000oz at a total cash cost* of $1,076/oz
in Q4 2023. In the Africa region, non-managed joint ventures
produced (on an attributable basis) 80,000oz at a total cash cost*
of $967/oz in Q4 2024, compared to 93,000oz at a total cash
cost* of $761/oz in Q4 2023.
Managed operations (including Sukari) produced 1,254,000oz at a
total cash cost* of $1,212/oz in 2024, compared to 1,237,000oz
at a total cash cost* of $1,138/oz in 2023. In the Africa region,
non-managed joint ventures produced (on an attributable basis)
309,000oz at a total cash cost* of $935/oz in 2024, compared to
343,000oz at a total cash cost* of $802/oz in 2023.
In Ghana, at Iduapriem, gold production was 50,000oz at a total
cash cost* of $1,478/oz for Q4 2024, compared to 79,000oz at a
total cash cost* of $962/oz during Q4 2023. Gold production
decreased by 37% year-on-year in Q4 2024 compared to Q4 2023,
primarily due to lower ore tonnes mined and temporary
production challenges, including equipment and de-watering
issues. While these factors impacted recovered grades,
mitigation efforts included processing stockpile materials to
sustain operations and maintain production continuity. Total cash
costs per ounce* increased by 54% year-on-year in Q4 2024
compared to Q4 2023, primarily due to lower gold production and
higher operating costs. This was driven by increased explosive
usage and higher stockpile movement due to reduced ore mined.
Iduapriem’s gold production was 237,000oz at a total cash cost*
of $1,118/oz in 2024, compared to 268,000oz at a total cash
cost* of $943/oz in 2023. Gold production deceased by 12% year-
on-year in 2024 compared to 2023, primarily due to adverse
weather conditions, a 23% reduction in ore tonnes mined driven
by operational challenges and lower equipment productivity. The
decline in recovered grades (1.36g/t in 2024 vs. 1.54g/t in 2023),
mainly from Block 7&8 Cut 2b and Block 5, further negatively
impacted output. Gold production was also adversely affected by
the processing of increased volumes of lower-grade stockpile
material. Total cash cost per ounce* increased by 19% year-on-
year in 2024 compared to 2023, mainly reflecting the lower gold
production and higher operating costs. Key factors included
increased mining contractor costs, higher inventory movements
due to reduced ore delivery, and elevated royalties on higher gold
prices. This increase was partially offset by cost savings in fuel,
power, service, and refinery expenses, as well as the earlier-than-
expected completion of certain consultancy activities, and lower
labour costs.
At Obuasi, gold production was 60,000oz at a total cash cost* of
$1,169/oz for Q4 2024, compared to 61,000oz at a total cash
cost* of $1,040/oz during Q4 2023. Gold production marginally
decreased by 2% year-on-year in Q4 2024 compared to Q4 2023,
mainly due to a 16% decline in treated tonnes, partially offset by a
14% grade improvement and higher process recovery.
Underground contributions increased, while surface contributions
declined. Total cash costs per ounce* increased by 12% year-on-
year in Q4 2024 compared to Q4 2023, mainly due to higher
operating costs, including increased labour costs, higher support
costs, higher contractor spend due to increased tonnes mined,
and higher reagent consumption, partially offset by increased
capital credits related to Mineral Reserve development.
Obuasi’s gold production was 221,000oz at a total cash cost* of
$1,214/oz in 2024, compared to 224,000oz at a total cash cost*
of $1,114/oz in 2023. Gold production marginally decreased by
1% year-on-year in 2024 compared to 2023, primarily due to a 3%
decline in treated grade (6.25g/t in 2024 vs. 6.44g/t in 2023),
development delays, supply challenges with slag-based binder for
paste fill, poor ground conditions, and stope sterilisation in Block
10. Treated ore tonnes increased slightly, while mill recovery
remained consistent at 86%. Total cash cost per ounce* rose by
9% year-on-year in 2024 compared to 2023, mainly due to higher
labour, material, and contractor costs, driven by a 9% increase in
tonnes mined and a 1% rise in tonnes treated. Elevated reagent,
QUARTER 4 2024 EARNINGS RELEASE | 15 | | |||
| ||||||
REGIONS I FINANCIAL AND OPERATING RESULTS | ||||||
QUARTER AND YEAR IN REVIEW CONTINUED
cement and power costs, and increased underground
development expenses were partially offset by lower
consumption of other materials and stores.
In Guinea, at Siguiri, gold production was 74,000oz at a total
cash cost* of $1,747/oz for Q4 2024, compared to 66,000oz at a
total cash cost* of $1,693/oz in Q4 2023. Gold production
increased by 12% year-on-year in Q4 2024 compared to Q4 2023,
mainly due to improved recovered grades, driven by the exclusion
of Bidini carbonaceous material from the plant feed. Total cash
costs per ounce* rose by 3% year-on-year in Q4 2024 compared
to Q4 2023, mainly driven by higher operating costs and royalties,
partially offset by the increase in gold production.
Siguiri’s gold production was 273,000oz at a total cash cost* of
$1,703/oz in 2024, compared to 260,000oz at a total cash cost*
of $1,650/oz in 2023. Gold production increased by 5% year-on-
year in 2024 compared to 2023, mainly due to improved
metallurgical recovery following the removal of Bidini
carbonaceous material from the plant feed. This increase was
partially offset by a reduction in head grade due to changes in the
mining sequence. Total cash cost per ounce* increased by 3%
year-on-year in 2024 compared to 2023, mainly driven by higher
mining and rehandle costs resulting from a 35% increase in
tonnes mined and 1% more tonnes treated.
In Tanzania, at Geita, gold production was 136,000oz at a total
cash cost* of $892/oz for Q4 2024, compared to 142,000oz at a
total cash cost* of $868/oz in Q4 2023. Gold production
decreased by 4% year-on-year in Q4 2024 compared to Q4 2023,
mainly due to a 1% decline in head grade, reduced plant recovery,
and 7% fewer tonnes treated, impacted by lower throughput rates
from crusher circuit reliability issues and unplanned breakdowns.
Total cash cost per ounce* increased by 3% year-on-year in Q4
2024 compared to Q4 2023, mainly driven by higher operating
costs, royalties, and production taxes, partially offset by increased
metal inventory credits from higher ore stockpiles from mining at
Nyamulilima Cut 2.
Geita’s gold production was 483,000oz at a total cash cost* of
$984/oz in 2024, compared to 485,000oz at a total cash cost* of
$984/oz in 2023. Gold production remained stable year-on-year in
2024 compared to 2023, with a slight decrease attributed to
minor mining and processing activity variances. Total cash cost
per ounce* remained unchanged year-on-year in 2024 compared
to 2023, though individual cost components varied. Direct
operating costs decreased mainly due to labour, reagents, stores,
and fuel savings. Higher inventory credits were driven by
increased ore stockpiling from Nyamulilima Cut 2. These savings
were offset by higher royalties and production taxes due to
increased gold prices.
In Egypt, at Sukari, gold production was 40,000oz at a total cash
cost* of $1,165/oz since its acquisition by the Company on
22 November 2024.
In the DRC, at Kibali, gold production (on an attributable basis)
was 80,000oz at a total cash cost* of $967/oz for Q4 2024,
compared to 93,000oz at a total cash cost* of $761/oz in Q4
2023. Gold production decreased by 14% year-on-year in Q4 2024
compared to Q4 2023 mainly due to adverse weather conditions,
lower recovered grades, impacted by reduced tonnes and grades
from underground and open-pit mining, operational challenges,
and a higher proportion of open-pit ore treated compared to Q4
2023. Total cash cost per ounce* increased by 27% year-on-year
in Q4 2024 compared to Q4 2023, mainly driven by 14% lower
gold production and higher operating costs, partially offset by
increased stockpile addition credits.
Kibali’s gold production (on an attributable basis) was 309,000oz
at a total cash cost* of $935/oz in 2024, compared to 343,000oz
at a total cash cost* of $802/oz in 2023. Gold production
decreased by 10% year-on-year in 2024 compared to 2023, mainly
due to lower recovered grades from open-pit areas mined, driven
by operational challenges and high initial waste stripping. This
decrease was partially offset by higher open-pit tonnes treated
compared to 2023. Total cash cost per ounce* increased by 17%
year-on-year in 2024 compared to 2023, mainly due to higher
operating costs and lower production volumes. The cost increase
was primarily attributed to greater open-pit mining volumes,
reduced stockpile credits due to less full-grade ore mined, and a
higher stripping ratio. Increased waste-stripping capital credits
partially mitigated these factors. The weakening of the Congolese
franc against the US dollar had a minimal impact on overall costs
due to limited exposure to local currency expenses.
QUARTER 4 2024 EARNINGS RELEASE | 16 | | |||
| ||||||
REGIONS I FINANCIAL AND OPERATING RESULTS | ||||||
QUARTER AND YEAR IN REVIEW CONTINUED
AUSTRALIA REGION
In the Australia region, gold production (on an attributable
basis) was 166,000oz at a total cash cost* of $1,171/oz in Q4
2024, compared to 158,000oz at a total cash cost* of $1,177/oz
in Q4 2023.
Gold production (on an attributable basis) was 572,000oz at a
total cash cost* of $1,287/oz in 2024, compared to 562,000oz at
a total cash cost* of $1,251/oz in 2023.
At Sunrise Dam, gold production was 66,000oz at a total cash
cost* of $1,406/oz for Q4 2024, compared to 62,000oz at a total
cash cost* of $1,314/oz in Q4 2023. Gold production increased by
6% year-on-year in Q4 2024 compared to Q4 2023, mainly driven
by a 5% improvement in recovery, despite lower open-pit material
mined, reduced milled tonnes, and additional shutdown activities.
Total cash cost per ounce* increased by 7% year-on-year in Q4
2024 compared to Q4 2023, mainly due to inventory movements.
Sunrise Dam’s gold production was 259,000oz at a total cash
cost* of $1,343/oz in 2024, compared to 252,000oz at a total
cash cost* of $1,318/oz in 2023. Gold production increased by
3% year-on-year in 2024 compared to 2023, mainly due to higher
grades from the underground mine and higher recoveries.
Total cash cost* per ounce increased by 2% year-on-year in 2024
compared to 2023, mainly due to longer haul distances, additional
ground support requirements and plant shutdown activities
during the year.
At Tropicana, gold production (on an attributable basis) was
100,000oz at a total cash cost* of $924/oz for Q4 2024,
compared to 96,000oz at a total cash cost* of $1,015/oz in Q4
2023. Gold production increased by 4% year-on-year in Q4 2024
compared to Q4 2023, mainly driven by higher surface ore tonnes,
improved mined grades, and better underground grades. Total
cash cost per ounce* decreased by 9% year-on-year in Q4 2024
compared to Q4 2023, reflecting higher gold production, driven by
higher mined grade, as well as reduced open-pit costs due to
lower total material moved, with starting face position variances
and prior year delays. Additionally, improved stockpile material
buildup resulted in cost efficiencies .
Tropicana’s gold production (on an attributable basis) was
313,000oz at a total cash cost* of $1,132/oz in 2024, compared
to 310,000oz at a total cash cost* of $1,105/oz in 2023. Gold
production marginally increased by 1% year-on-year in 2024
compared to 2023, mainly due to higher grades from the open pit
and underground mines, partly offset by lower tonnes milled.
Total cash cost per ounce* increased by 2% in 2024 compared to
2023, primarily due to higher underground and surface mining
costs driven by longer haul distances. Operations were also
impacted by a significant rain event in Q1 2024 that disrupted
surface, underground, and milling activities, contributing to higher
costs and logistical challenges.
QUARTER 4 2024 EARNINGS RELEASE | 17 | | |||
| ||||||
REGIONS I FINANCIAL AND OPERATING RESULTS | ||||||
QUARTER AND YEAR IN REVIEW CONTINUED
AMERICAS REGION
In the Americas region, gold production was 144,000oz at a
total cash cost* of $1,035/oz in Q4 2024, compared to 139,000oz
at a total cash cost* of $1,017/oz in Q4 2023.
Gold production was 526,000oz at a total cash cost* of $1,027/oz
in 2024, compared to 502,000oz at a total cash cost* of $1,122/
oz in 2023.
In Brazil, at Cuiabá (AGA Mineração), gold production was
75,000oz at a total cash cost* of $859/oz for Q4 2024, compared
to 73,000oz at a total cash cost* of $957/oz in Q4 2023. Gold
production rose by 3% year-on-year in Q4 2024 compared to Q4
2023, primarily driven by higher recovered grades at Cuiabá
mainly due to improved mining performance and Full Asset
Potential initiatives, despite a 23% reduction in ore treated
compared to Q4 2023. Total cash cost per ounce* decreased by
10% year-on-year in Q4 2024 compared to Q4 2023, mainly driven
by lower processing volumes and the absence of one-time legal
compliance costs from 2023, partially offset by higher labour
costs due to insourcing at Cuiabá.
Gold production was 271,000oz at a total cash cost* of $876/oz
in 2024, compared to 252,000oz at a total cash cost* of $1,041/
oz in 2023. Gold production increased by 8% year-on-year in 2024
compared to 2023, mainly driven by higher recovered grades at
Cuiabá (5.89g/t in 2024 vs 4.82g/t in 2023) despite a 12%
reduction in ore-treated volumes. Improved mining performance
and the implementation of Full Asset Potential initiatives
enhanced dilution control and recovery rates. Total cash cost* per
ounce decreased by 16% year-on-year in 2024 compared to 2023,
mainly reflecting higher production volumes and reduced
operating costs. Key savings resulted from insourcing services
and process improvements, which reduced contractor costs by
$25m. Lower costs related to legal compliance activities initially
undertaken in 2023, including tailings management and
emergency planning measures, also contributed to savings.
Increased labour costs partially offset this decrease due to
workforce adjustments to support mining insourcing. The 2023
stoppage of the Queiroz metallurgical plant, mandated by the
Brazilian authorities, significantly impacted production in early
2023 but did not recur in 2024, further aiding cost efficiency.
Serra Grande, Brazil
At Serra Grande, gold production was 22,000oz at a total cash
cost* of $1,338/oz for Q4 2024, compared to 25,000oz at a total
cash cost* of $1,307/oz in Q4 2023. Gold production decreased
QUARTER 4 2024 EARNINGS RELEASE | 18 | | |||
| ||||||
REGIONS I FINANCIAL AND OPERATING RESULTS | ||||||
QUARTER AND YEAR IN REVIEW CONTINUED
by 12% year-on-year in Q4 2024 compared to Q4 2023 mainly due
to a lower recovered grade, impacted by operational restrictions
in accessing the high-grade Ingá stope. Total cash cost per
ounce* increased by 2% year-on-year in Q4 2024 compared to Q4
2023, mainly driven by higher processed tonnes, lower recovered
grades, and increased labour costs, partially offset by the
weakening of the Brazilian real against the US dollar, cost-saving
initiatives, and reduced contractor and consulting expenses.
Serra Grande’s gold production was 80,000oz at a total cash
cost* of $1,411/oz in 2024, compared to 86,000oz at a total cash
cost* of $1,498/oz in 2023. Gold production decreased by 7%
year-on year compared to 2023, primarily due to reduced tonnes
processed (1,039kt in 2024 vs. 1,125kt in 2023). This decrease
was partially offset by a slightly higher recovered grade of 2.39g/t
compared to 2.37g/t in 2023. Total cash cost per ounce*
decreased by 6% year-on-year in 2024 compared to 2023, mainly
driven by lower variable costs resulting from reduced mining and
processing volumes. Cost savings were achieved through
insourcing underground development activities, which reduced
contractor costs and lower spending on technical consulting
services related to Full Asset Potential initiatives conducted in
2023. Additionally, the weakening of the Brazilian real against the
US dollar and reduced costs for consumables and services
further contributed to the improvement.
Cerro Vanguardia, Argentina
In Argentina, at Cerro Vanguardia, gold production was
47,000oz at a total cash cost* of $1,155/oz during Q4 2024,
compared to 41,000oz a total cash cost* of $943/oz in Q4 2023.
Gold production increased by 15% year-on-year in Q4 2024
compared to Q4 2023, mainly driven by improved plant and heap
leach performance and higher grades. Total cash cost per ounce*
increased by 22% year-on-year in Q4 2024 compared to Q4 2023,
mainly driven by lower silver by-product revenue, reduced
stripping cost capitalisation, higher mining volumes, inflationary
pressures on materials and labour, and increased royalties,
partially offset by a weaker Argentinian peso against the US
dollar.
Cerro Vanguardia’s gold production was 175,000oz at a total
cash cost* of $1,073/oz in 2024, compared to 164,000oz at a
total cash cost* of $1,045/oz in 2023. Gold production increased
by 7% year-on-year in 2024 compared to 2023, mainly driven by
improved feed grades and better heap leach performance. Total
cash cost per ounce* increased by 3% year-on-year in 2024
compared to 2023, primarily due to cost increases related to
wages, materials, and services. The weakening of the Argentinian
peso against the US dollar partially offset this increase. Additional
cost pressures came from higher royalties, reflecting increased
gold sales and prices and greater consumption of materials and
services due to higher mining activity. The cost increase was also
mitigated by higher by-product revenue from improved silver
prices ($28/oz in 2024 vs. $23/oz in 2023).
QUARTER 4 2024 EARNINGS RELEASE | 19 | | |||
| ||||||
OBUASI I UPDATE | ||||||
MAINTAIN LONG TERM OPTIONALITY
OVERVIEW
Obuasi, Ghana
The last phase of the Obuasi redevelopment project, Phase 3,
was completed on 20 December 2024 and the project was
handed over to the operations team for final testing, ramp-up and
commissioning. This marked the end of a project which started in
2018 with the aim of getting the mine both refurbished and
modernised while addressing the historical production challenges
centered around dewatering, ventilation, and material handling.
Phase 1, completed in 2019, returned a refurbished plant to
production with capacity to treat 2,000tpd. Phase 2 further
increased the plant capacity to 6,000tpd and introduced the first
underground shaft (KRS) to the Obuasi system in 2021. The last
phase, Phase 3, refurbished the deeper KMS and BSVS shafts,
which will support ore production up to 6,000tpd to match the
plant capability. Phase 3, which was delayed by nine months due
to the unexpected presence of significant mud build-up at 50 and
51 levels, has successfully dewatered the mine which had been
flooded since 2018. The entire KMS surface infrastructure has
been rebuilt and refurbished, to support production from existing
areas and allow access to the deeper ore bodies of block 10
lower and future high-grade block 11.
Phase 3 also introduced a new exhaust ventilation system, adding
750m3/sec of ventilation while increasing dewatering capacity to
above 21ML per day. This increased capability will support
mining in the central and lower blocks.
Lastly, to support underground ore handing and hoisting, Phase 3
introduced an electric rail haulage system, allowing underground
material to be efficiently transported from the southern mining
blocks to KMS for hoisting, thereby decongesting the decline
system while relieving some of the ventilation requirements.
Phase 3 introduced a centralised control centre to monitor and
manage all mining and haulage activities. Other Phase 3 activities
included replacing the entire electrical system, removing
centralised compressed air systems, returning an underground
crusher plant to service, and introducing shaft loading systems at
4400L. Together, these systems will add a cost-effective, energy-
efficient, and reliable material handling infrastructure to the
Obuasi mine. Phase 3 closes at $140m against a budget of
$161m, and the overall Obuasi redevelopment project closes at
$812m.
UHDF NOW PROVEN, WILL RAMP UP TO PROVIDE
GROWTH OUNCES
•Underhand Drift and Fill (UHDF) mining method contributed
31.6kt @ 12.17g/t for 12.4Koz mined in 2024.
•First and second panels of the 8m uppers were successfully
mined in August and September 2024 respectively and
successfully filled with paste.
•Third panel of the 8m uppers was mined in November 2024
and filled with paste.
•First UHDF reef drive of the 3500-level development
commenced in December and has been completed and filled
with paste.
•Development of the of 3500-level drift 2 is currently ongoing.
•Operational readiness review of additional UHDF work areas
in Block 8 and Block 10 has commenced.
QUARTER 4 2024 EARNINGS RELEASE | 20 | | |||
| ||||||
OBUASI I UPDATE | ||||||
MAINTAIN LONG TERM OPTIONALITY CONTINUED
OBUASI GOLD PRODUCTION OUTLOOK
The gold production guidance provided for the Obuasi mine in
November 2024 remains unchanged.
Period | Gold production |
2025 | 250koz - 300koz |
2026 | 300koz - 350koz |
2027 | 325koz - 375koz |
2028 | 375koz - 425koz |
Estimates assume neither operational or labour interruptions, or power
disruptions, nor further changes to asset portfolio and/or operating mines and
have not been reviewed by AngloGold Ashanti’s external auditors. Other unknown
or unpredictable factors, or factors outside the Company’s control, including
inflationary pressures on its cost base, could also have material adverse effects
on AngloGold Ashanti’s future results and no assurance can be given that any
expectations expressed by AngloGold Ashanti will prove to have been correct.
Measures taken at AngloGold Ashanti’s operations together with AngloGold
Ashanti’s business continuity plans aim to enable its operations to deliver in line
with its production targets. Actual results could differ from guidance and any
deviations may be significant. Please refer to the Risk Factors section in
AngloGold Ashanti’s annual report on Form 20-F for the financial year ended
31 December 2023 filed with the SEC.
CAPITAL PROJECTS UPDATE
TROPICANA
The Havana underground decline development is progressing.
Detailed infrastructure design is underway, and procurement of
long lead items has commenced, with the primary purchase
orders issued at the end of 2024. Production of first gold is
expected in Q1 2027 as per the feasibility study.
ESG RENEWABLES PROJECT
The Tropicana solar farm and battery energy storage system
were successfully commissioned in Q4 2024, resulting in the
project's first renewable energy generation. Construction of the
four wind turbines was completed and commissioning and
reliability testing is in progress. The Tropicana renewable energy
project is on track to reach full operation in Q1 2025.
SUNRISE DAM CONCENTRATE LEACH
The Concentrate Leach project, which will improve metallurgical
recoveries at Sunrise Dam, was approved at the start of Q4 2024.
Detailed engineering designs are in progress, and procurement of
long lead items has commenced. The civil construction
contractor mobilized to the site, and civil works are underway.
The Concentrate Leach project is on track for completion in Q4
2025.
NEVADA
In the United States, our greenfield concessions, including the
North Bullfrog project and the adjacent Expanded Silicon project,
are in the Beatty District in southern Nevada. The Expanded
Silicon project comprises the Silicon and Merlin deposits.
NORTH BULLFROG PROJECT (“NBP”)
In November 2024, the NBP received approval from the
Management Investment Committee (MIC) to pursue the
engineering design through the detailed engineering phase of the
project. This scope is expected to be complete by the end of Q2
2025, representing approximately 65% of total engineering. A
CAPEX control estimate for the project is expected to be available
by end of Q2 2025. The project team plans to update the project’s
financial model during Q2 2025 and update the MIC and Board of
Directors in July 2025.
Permitting processes are underway for the NBP. The first round
of public scoping occurred in April 2024. The public’s comments
have been primarily focused on potential impacts to
groundwater-dependent ecosystems within the upper reaches of
the Amargosa River. The project team has been updating an
alternative plan to consume less water in connection with the
project’s progress through the permitting process.
The NBP is expected to be the first of the Company’s projects for
the Nevada district. Apart from the initial production, it is
anticipated to allow AngloGold Ashanti to build a cohesive project
development team and improve understanding of the permitting
and project construction processes in Nevada.
QUARTER 4 2024 EARNINGS RELEASE | 21 | | |||
| ||||||
GROUP I CORPORATE UPDATE | ||||||
QUARTERLY REVIEW CONTINUED
EXPANDED SILICON
The successful completion of the Expanded Silicon project
concept study at the end of 2023 allowed the project to proceed
to the next stage gate of pre-feasibility study (PFS). The project
comprises the Silicon and Merlin deposits. This program is
expected to continue to be performed throughout 2025, focusing
on the completion of an extensive drilling program and further
optimisation of development options identified during a project
framing review held during Q1 2024. The Expanded Silicon
deposit gold Inferred Mineral Resource for 2024 has grown due
to exploration success and reinterpretation of the geological
model to 12.91Moz.
CORPORATE UPDATE
ISSUED SHARE CAPITAL
As at 18 February 2025, the total issued ordinary share capital of
the Company comprised 503,539,626 ordinary shares of $1.00
each. Each AngloGold Ashanti ordinary share carries one voting
right. The Company does not hold any of its ordinary shares in
treasury.
This figure may be used by AngloGold Ashanti shareholders to
determine whether they are required to notify their interest, or a
change to their interest, in the Company under its Articles of
Association or to comply with any other applicable laws and
regulations.
CHANGE IN BOARD OF DIRECTORS
Effective 15 October 2024, Mr. Scott Lawson resigned from
AngloGold Ashanti’s Board of Directors. Mr. Lawson was an
independent non-executive director and served as a member of
the Audit and Risk Committee and the Social, Ethics and
Sustainability Committee.
On 20 December 2024, the Company announced several changes
to the composition of its Board Committees effective 1 January
2025. In addition, the Company announced that Mr. Rhidwaan
Gasant, after serving 14 years on the Board, has decided not to
stand for re-election at the 2025 Annual General Meeting (“2025
AGM”), following which he will retire as a non-executive director.
Following the 2025 AGM, Mr. Alan Ferguson will succeed him as
Lead Independent Director and step down as the Chair of the
Audit and Risk Committee, upon which Ms. Diana Sands will
become the new Chair of the Audit and Risk Committee. These
changes remain subject to the re-election of the relevant directors
at the 2025 AGM.
YATELA SALE UPDATE
On 17 October 2024, AngloGold Ashanti and IAMGOLD
Corporation completed the sale of each of their 40 percent
interests in Société d’Exploitation des Mines d’Or de Yatela S.A.
(“Yatela”), the company operating the Yatela gold mine, to the
Government of Mali. Following completion of this transaction,
AngloGold Ashanti no longer owns any mining operations in Mali.
CENTAMIN ACQUISITION
On 22 November 2024, AngloGold Ashanti completed its
acquisition of Centamin plc, a Jersey gold mining and exploration
company whose primary asset is the Sukari gold mine in Egypt,
for a consideration of approximately $2.2bn, comprising a
combination of AGA shares and cash.
UPDATE ON THE PROPOSED GHANA JOINT
VENTURE
Despite constructive engagement with the Government of Ghana
following the announcement of the proposed joint venture in
March 2023, the requisite approvals by the Government for the
proposed joint venture have not yet been obtained. Following the
recent national elections, Gold Fields and AngloGold Ashanti are
working to engage with the new Government on the potential joint
venture.
Gold Fields and AngloGold Ashanti continue to believe that a
combination of Tarkwa and Iduapriem into a single managed
entity is compelling, given that it is anticipated to extend life of
mine, increase production and lower costs, thereby creating value
for all stakeholders. Gold Fields and AngloGold Ashanti continue
to pursue improvements to their respective assets.
EXPLORATION UPDATE
For detailed disclosure on the exploration work done for the three
months and year ended 31 December 2024, see the Exploration
Update document on the Company’s website at
www.anglogoldashanti.com on both brownfield and greenfield
exploration programmes.
QUARTER 4 2024 EARNINGS RELEASE | 22 | | |||
| ||||||
GROUP I FINANCIAL RESULTS | ||||||
INCOME STATEMENT
GROUP INCOME STATEMENT | Quarter | Quarter | Year | Year |
ended | ended | ended | ended | |
Dec | Dec | Dec | Dec | |
2024 | 2023 | 2024 | 2023 | |
US Dollar million, except as otherwise noted | Unaudited | Unaudited | Unaudited | Unaudited |
Revenue from product sales | 1,750 | 1,256 | 5,793 | 4,582 |
Cost of sales | (1,043) | (929) | (3,726) | (3,541) |
Gross profit | 707 | 327 | 2,067 | 1,041 |
Corporate administration, marketing and related expenses | (32) | (31) | (118) | (94) |
Exploration and evaluation costs | (75) | (71) | (252) | (254) |
Reversal of impairment (net impairment), (derecognition of assets) and profit (loss) on disposal | 72 | (65) | 58 | (221) |
Corporate restructuring costs | — | (3) | — | (314) |
Other (expenses) income | (26) | (24) | (144) | (104) |
Finance income | 38 | 35 | 160 | 127 |
Foreign exchange and fair value adjustments (1) | 29 | (48) | (87) | (168) |
Finance costs and unwinding of obligations | (41) | (44) | (167) | (157) |
Share of associates and joint ventures’ profit | 26 | 68 | 155 | 207 |
Profit before taxation | 698 | 144 | 1,672 | 63 |
Taxation | (204) | (109) | (623) | (285) |
Profit (loss) for the period | 494 | 35 | 1,049 | (222) |
Attributable to: | ||||
Equity shareholders | 470 | 28 | 1,004 | (235) |
Non-controlling interests | 24 | 7 | 45 | 13 |
494 | 35 | 1,049 | (222) | |
Basic earnings (loss) per ordinary share (US cents) (2) | 103 | 7 | 233 | (56) |
Diluted earnings (loss) per ordinary share (US cents) (3) | 103 | 7 | 233 | (56) |
(1) The loss on non-hedge derivatives and other commodity contracts of $1m and $71m for Q4 2024 and 2024 respectively (Q4 2023: $21m; 2023: $14m) which was previously included in gross profit has been reclassified to the foreign exchange and fair value adjustments line. | ||||
(2) Calculated on the basic weighted average number of ordinary shares. | ||||
(3) Calculated on the diluted weighted average number of ordinary shares. | ||||
QUARTER 4 2024 EARNINGS RELEASE | 23 | | |||
| ||||||
GROUP I FINANCIAL RESULTS | ||||||
STATEMENT OF FINANCIAL POSITION
GROUP STATEMENT OF FINANCIAL POSITION | As at | As at | |
Dec | Dec | ||
2024 | 2023 | ||
US Dollar million, except as otherwise noted | Unaudited | Unaudited | |
ASSETS | |||
Non-current assets | |||
Tangible assets (1) | 8,256 | 4,419 | |
Right of use assets | 123 | 142 | |
Intangible assets | 98 | 107 | |
Investments in associates and joint ventures | 530 | 599 | |
Other investments | 54 | 1 | |
Loan receivable | 203 | 358 | |
Inventories (1) | 208 | 2 | |
Trade, other receivables and other assets | 243 | 254 | |
Reimbursive right for post-retirement benefits | 49 | 35 | |
Deferred taxation | 12 | 50 | |
Cash restricted for use | 41 | 34 | |
9,817 | 6,001 | ||
Current assets | |||
Loan receivable | 260 | 148 | |
Inventories (1) | 1,067 | 829 | |
Trade, other receivables and other assets (1)(2) | 373 | 181 | |
Taxation (2) | 1 | 18 | |
Cash restricted for use | 20 | 34 | |
Cash and cash equivalents (1) | 1,425 | 964 | |
3,146 | 2,174 | ||
Total assets | 12,963 | 8,175 | |
EQUITY AND LIABILITIES | |||
Share capital and premium | 526 | 420 | |
Accumulated profits and other reserves | 6,103 | 3,291 | |
Shareholders’ equity | 6,629 | 3,711 | |
Non-controlling interests (1) | 1,690 | 29 | |
Total equity | 8,319 | 3,740 | |
Non-current liabilities | |||
Borrowings | 1,901 | 2,032 | |
Lease liabilities | 65 | 98 | |
Environmental rehabilitation and other provisions (1) | 656 | 636 | |
Provision for pension and post-retirement benefits | 57 | 64 | |
Trade and other payables | 6 | 5 | |
Deferred taxation | 519 | 395 | |
3,204 | 3,230 | ||
Current liabilities | |||
Borrowings | 83 | 207 | |
Lease liabilities | 76 | 73 | |
Environmental rehabilitation and other provisions | 109 | 80 | |
Trade and other payables (1) | 957 | 772 | |
Taxation | 187 | 64 | |
Bank overdraft | 28 | 9 | |
1,440 | 1,205 | ||
Total liabilities | 4,644 | 4,435 | |
Total equity and liabilities | 12,963 | 8,175 | |
(1) On 22 November 2024, AngloGold Ashanti completed its acquisition of Centamin Plc, a Jersey gold mining and exploration company whose primary asset is the Sukari gold
mine in Egypt, for a consideration of approximately $2.2bn, comprising a combination of AGA shares and cash. The fair value of material assets acquired, and material
liabilities assumed at the acquisition date on a provisional basis is as follows: tangible assets $3.4bn, inventories (non-current) $198m, inventories (current) $196m, trade, other
receivables and other assets (current) $56m, cash and cash equivalents $216m, long-term environmental rehabilitation and other provisions $51m and trade and other
payables (current) $115m. The fair value of the non-controlling interest is $1.7bn.
(2) The taxation asset has been presented separately on the statement of financial position (previously included in trade and other receivables).
QUARTER 4 2024 EARNINGS RELEASE | 24 | | |||
| ||||||
GROUP I FINANCIAL RESULTS | ||||||
STATEMENT OF CASH FLOWS
GROUP STATEMENT OF CASH FLOWS | Quarter | Quarter | Year | Year | |
ended | ended | ended | ended | ||
Dec | Dec | Dec | Dec | ||
2024 | 2023 | 2024 | 2023 | ||
US Dollar million, except as otherwise noted | Unaudited | Unaudited | Unaudited | Unaudited | |
Cash flows from operating activities | |||||
Cash generated from operations | 713 | 306 | 2,063 | 871 | |
Dividends received from joint ventures | 44 | 94 | 88 | 180 | |
Taxation refund | — | 36 | 6 | 36 | |
Taxation paid | (67) | (32) | (189) | (116) | |
Net cash inflow from operating activities | 690 | 404 | 1,968 | 971 | |
Cash flows from investing activities | |||||
Capital expenditure on tangible and intangible assets | (333) | (334) | (1,090) | (1,042) | |
Dividends from associates and other investments | 12 | 6 | 12 | 12 | |
Proceeds from disposal of tangible assets | 15 | 9 | 16 | 14 | |
Deferred compensation received | — | — | 5 | — | |
Other investments and assets acquired | (1) | — | (30) | — | |
Proceeds from disposal of other investments | — | 20 | — | 20 | |
Payment upon disposal of joint venture and associate | (2) | — | (2) | — | |
Loans advanced | — | — | (1) | (1) | |
Acquisition of subsidiary, net of cash acquired (1) | 68 | — | 68 | — | |
Decrease (increase) in cash restricted for use | (10) | — | 5 | (9) | |
Interest received | 25 | 31 | 106 | 109 | |
Repayment of loans advanced to joint ventures | 10 | — | 149 | — | |
Net cash outflow from investing activities | (216) | (268) | (762) | (897) | |
Cash flows from financing activities | |||||
Share securities tax on redomicile and reorganisation | — | (19) | — | (19) | |
Proceeds from borrowings | 180 | 250 | 655 | 343 | |
Repayment of borrowings | (338) | — | (909) | (87) | |
Repayment of lease liabilities | (23) | (27) | (91) | (94) | |
Finance costs – borrowings | (36) | (36) | (126) | (111) | |
Finance costs – leases | (3) | (3) | (11) | (11) | |
Other borrowing costs | — | — | (1) | (1) | |
Dividends paid | (65) | (2) | (244) | (107) | |
Net cash (outflow) inflow from financing activities | (285) | 163 | (727) | (87) | |
Net increase (decrease) in cash and cash equivalents | 189 | 299 | 479 | (13) | |
Translation | (17) | (69) | (37) | (138) | |
Cash and cash equivalents at beginning of period (net of bank overdraft) | 1,225 | 725 | 955 | 1,106 | |
Cash and cash equivalents at end of period (net of bank overdraft) | 1,397 | 955 | 1,397 | 955 | |
(1) The acquisition of Centamin Plc on 22 November 2024 resulted in cash acquired of $216m partly offset with cash settled in the purchase consideration of $148m.
QUARTER 4 2024 EARNINGS RELEASE | 25 | | |||
| ||||||
GROUP I SEGMENTAL | ||||||
GOLD AND BY-PRODUCT INCOME
AngloGold Ashanti’s operating segments are being reported based on the financial information regularly provided to the Chief Executive Officer and the
Executive Committee, collectively identified as the Chief Operating Decision Maker (CODM). Individual members of the Executive Committee are responsible for
geographical regions of the business. Under the Group’s operating model, the financial results and the composition of the operating segments are reported to
the CODM per geographical region in addition to the Projects’ segment which comprises all the major non-sustaining capital projects with the potential to be
developed into operating entities. In addition to the geographical reportable segments structure, the Group has voluntarily disaggregated and disclosed the
financial information on a line-by-line basis for each mining operation to facilitate comparability of mine performance.
GOLD INCOME | Quarter | Quarter | Year | Year | |
ended | ended | ended | ended | ||
Dec | Dec | Dec | Dec | ||
2024 | 2023 | 2024 | 2023 | ||
US Dollar million, except as otherwise noted | Unaudited | Unaudited | Unaudited | Unaudited | |
AFRICA | 1,114 | 841 | 3,756 | 3,068 | |
Kibali - Attributable 45% | 208 | 183 | 741 | 668 | |
Iduapriem | 125 | 151 | 563 | 522 | |
Obuasi | 157 | 114 | 530 | 439 | |
Siguiri | 182 | 131 | 653 | 505 | |
Geita | 323 | 262 | 1,150 | 934 | |
Sukari | 119 | — | 119 | — | |
AUSTRALIA | 441 | 293 | 1,394 | 1,081 | |
Sunrise Dam | 176 | 124 | 626 | 495 | |
Tropicana - Attributable 70% | 265 | 169 | 768 | 586 | |
AMERICAS | 369 | 272 | 1,264 | 999 | |
Cerro Vanguardia | 116 | 83 | 439 | 317 | |
AngloGold Ashanti Mineração (1) | 195 | 139 | 634 | 515 | |
Serra Grande | 58 | 50 | 191 | 167 | |
1,924 | 1,406 | 6,414 | 5,148 | ||
Equity-accounted joint venture included above | (208) | (183) | (741) | (668) | |
1,716 | 1,223 | 5,673 | 4,480 | ||
(1) Includes income from sale of gold concentrate.
BY-PRODUCT REVENUE | |||||
US Dollar million, except as otherwise noted | Unaudited | Unaudited | Unaudited | Unaudited | |
AFRICA | 1 | 1 | 6 | 5 | |
Kibali - Attributable 45% | — | — | 2 | 2 | |
Iduapriem | — | — | — | — | |
Obuasi | — | — | 1 | 1 | |
Siguiri | — | — | 1 | — | |
Geita | 1 | 1 | 2 | 2 | |
Sukari | — | — | — | — | |
AUSTRALIA | 1 | 1 | 5 | 4 | |
Sunrise Dam | — | — | 2 | 1 | |
Tropicana - Attributable 70% | 1 | 1 | 3 | 3 | |
AMERICAS | 32 | 31 | 111 | 95 | |
Cerro Vanguardia | 30 | 31 | 109 | 93 | |
AngloGold Ashanti Mineração | 2 | — | 2 | 2 | |
34 | 33 | 122 | 104 | ||
Equity-accounted joint venture included above | — | — | (2) | (2) | |
34 | 33 | 120 | 102 | ||
QUARTER 4 2024 EARNINGS RELEASE | 26 | | |||
| ||||||
GROUP I SEGMENTAL | ||||||
COST OF SALES AND GROSS PROFIT
COST OF SALES | Quarter | Quarter | Year | Year | |
ended | ended | ended | ended | ||
Dec | Dec | Dec | Dec | ||
2024 | 2023 | 2024 | 2023 | ||
US Dollar million, except as otherwise noted | Unaudited | Unaudited | Unaudited | Unaudited | |
AFRICA | 658 | 552 | 2,304 | 2,111 | |
Kibali - Attributable 45% | 101 | 94 | 380 | 372 | |
Iduapriem | 91 | 104 | 351 | 387 | |
Obuasi | 101 | 81 | 360 | 313 | |
Siguiri | 134 | 134 | 518 | 473 | |
Geita | 148 | 139 | 612 | 566 | |
Sukari | 83 | — | 83 | — | |
AUSTRALIA | 259 | 237 | 945 | 867 | |
Sunrise Dam | 114 | 103 | 430 | 399 | |
Tropicana - Attributable 70% | 135 | 126 | 479 | 438 | |
Administration and other | 10 | 8 | 36 | 30 | |
AMERICAS | 230 | 231 | 858 | 931 | |
Cerro Vanguardia | 99 | 83 | 368 | 307 | |
AngloGold Ashanti Mineração | 98 | 103 | 352 | 453 | |
Serra Grande | 32 | 45 | 136 | 169 | |
Administration and other | 1 | — | 2 | 2 | |
CORPORATE AND OTHER | (3) | 3 | (1) | 4 | |
1,144 | 1,023 | 4,106 | 3,913 | ||
Equity-accounted joint venture included above | (101) | (94) | (380) | (372) | |
1,043 | 929 | 3,726 | 3,541 | ||
GROSS PROFIT (1) | |||||
US Dollar million, except as otherwise noted | Unaudited | Unaudited | Unaudited | Unaudited | |
AFRICA | 458 | 291 | 1,459 | 961 | |
Kibali - Attributable 45% | 107 | 90 | 363 | 297 | |
Iduapriem | 34 | 47 | 213 | 135 | |
Obuasi | 57 | 33 | 171 | 127 | |
Siguiri | 48 | (2) | 136 | 31 | |
Geita | 176 | 123 | 540 | 370 | |
Sukari | 36 | — | 36 | — | |
Administration and other | — | — | — | 1 | |
AUSTRALIA | 184 | 58 | 453 | 220 | |
Sunrise Dam | 63 | 21 | 197 | 99 | |
Tropicana - Attributable 70% | 131 | 44 | 292 | 151 | |
Administration and other | (10) | (7) | (36) | (30) | |
AMERICAS | 169 | 72 | 517 | 162 | |
Cerro Vanguardia | 47 | 31 | 180 | 102 | |
AngloGold Ashanti Mineração | 98 | 36 | 283 | 63 | |
Serra Grande | 25 | 5 | 56 | (2) | |
Administration and other | (1) | — | (2) | (1) | |
CORPORATE AND OTHER | 3 | (4) | 1 | (5) | |
814 | 417 | 2,430 | 1,338 | ||
Equity-accounted joint venture included above | (107) | (90) | (363) | (297) | |
707 | 327 | 2,067 | 1,041 |
(1) The Group’s segmental profit measure is gross profit (loss), which excludes the results of associates and joint ventures. For the reconciliation of gross profit (loss) to profit
(loss) before taxation, refer to the Group income statement.
QUARTER 4 2024 EARNINGS RELEASE | 27 | | |||
| ||||||
GROUP I SEGMENTAL | ||||||
AMORTISATION AND CAPITAL EXPENDITURE
AMORTISATION | Quarter | Quarter | Year | Year | |
ended | ended | ended | ended | ||
Dec | Dec | Dec | Dec | ||
2024 | 2023 | 2024 | 2023 | ||
US Dollar million, except as otherwise noted | Unaudited | Unaudited | Unaudited | Unaudited | |
AFRICA | 142 | 115 | 455 | 419 | |
Kibali - Attributable 45% | 25 | 25 | 92 | 99 | |
Iduapriem | 19 | 31 | 79 | 129 | |
Obuasi | 22 | 18 | 75 | 61 | |
Siguiri | 14 | 17 | 51 | 39 | |
Geita | 42 | 24 | 138 | 91 | |
Sukari | 20 | — | 20 | — | |
AUSTRALIA | 58 | 59 | 190 | 163 | |
Sunrise Dam | 19 | 19 | 77 | 58 | |
Tropicana - Attributable 70% | 39 | 40 | 112 | 104 | |
Administration and other | — | — | 1 | 1 | |
AMERICAS | 62 | 47 | 195 | 170 | |
Cerro Vanguardia | 21 | 11 | 61 | 39 | |
AngloGold Ashanti Mineração | 33 | 24 | 112 | 88 | |
Serra Grande | 8 | 12 | 22 | 43 | |
CORPORATE AND OTHER | 1 | 1 | 4 | 5 | |
263 | 222 | 844 | 757 | ||
Equity-accounted joint venture included above | (25) | (25) | (92) | (99) | |
238 | 197 | 752 | 658 | ||
CAPITAL EXPENDITURE | |||||
US Dollar million, except as otherwise noted | Unaudited | Unaudited | Unaudited | Unaudited | |
AFRICA | 247 | 247 | 814 | 710 | |
Kibali - Attributable 45% | 36 | 23 | 125 | 85 | |
Iduapriem | 50 | 43 | 169 | 142 | |
Obuasi | 54 | 76 | 202 | 214 | |
Siguiri | 29 | 41 | 102 | 78 | |
Geita | 58 | 64 | 196 | 191 | |
Sukari | 20 | — | 20 | — | |
AUSTRALIA | 40 | 31 | 153 | 135 | |
Sunrise Dam | 26 | 15 | 65 | 47 | |
Tropicana - Attributable 70% | 14 | 16 | 88 | 87 | |
Administration and other | — | — | — | 1 | |
AMERICAS | 66 | 63 | 209 | 254 | |
Cerro Vanguardia | 24 | 26 | 71 | 75 | |
AngloGold Ashanti Mineração | 30 | 23 | 98 | 124 | |
Serra Grande | 12 | 14 | 40 | 55 | |
PROJECTS | 16 | 15 | 38 | 27 | |
Colombian projects | 8 | 4 | 13 | 11 | |
North American projects | 8 | 11 | 25 | 16 | |
CORPORATE AND OTHER | — | 1 | 1 | 1 | |
369 | 357 | 1,215 | 1,127 | ||
Equity-accounted joint venture included above | (36) | (23) | (125) | (85) | |
333 | 334 | 1,090 | 1,042 | ||
QUARTER 4 2024 EARNINGS RELEASE | 28 | | |||
| ||||||
GROUP I SEGMENTAL | ||||||
TOTAL ASSETS
TOTAL ASSETS | As at | As at | |
Dec | Dec | ||
2024 | 2023 | ||
US Dollar million, except as otherwise noted | Unaudited | Unaudited | |
AFRICA | 8,887 | 4,414 | |
Kibali - Attributable 45% | 950 | 1,066 | |
Iduapriem | 579 | 526 | |
Obuasi | 1,481 | 1,288 | |
Siguiri | 591 | 486 | |
Geita | 1,231 | 1,042 | |
Sukari | 4,049 | — | |
Administration and other | 6 | 6 | |
AUSTRALIA | 845 | 942 | |
AMERICAS | 1,460 | 1,254 | |
Cerro Vanguardia | 626 | 524 | |
AngloGold Ashanti Mineração | 668 | 584 | |
Serra Grande | 148 | 127 | |
Administration and other | 18 | 19 | |
PROJECTS | 991 | 833 | |
Colombian projects | 207 | 194 | |
North American projects | 784 | 639 | |
CORPORATE AND OTHER | 780 | 732 | |
12,963 | 8,175 | ||
By order of the Board | ||||
J TILK Chairman | A CALDERON Chief Executive Officer | G DORAN Chief Financial Officer | ||
18 February 2025 | ||||
QUARTER 4 2024 EARNINGS RELEASE | 29 | | |||
| ||||||
GROUP I MINERAL RESOURCE AND MINERAL RESERVE | ||||||
Year in review
The AngloGold Ashanti gold Measured and Indicated Mineral
Resource increased from 59.9Moz at 31 December 2023 to 67.1Moz
at 31 December 2024. Additions included the acquisition of Centamin
assets (Sukari and Doropo) of 2.8Moz, exploration and modelling
changes of 2.6Moz, changes in economic assumptions of 1.6Moz and
other changes of 0.2Moz. As a result, the net year-on-year gold
Measured and Indicated Mineral Resource addition was 7.2Moz.
The AngloGold Ashanti gold Inferred Mineral Resource increased from
46.4Moz at 31 December 2023 to 55.0Moz at 31 December 2024.
Additions included the acquisition of Centamin assets (Sukari, Doropo
and ABC) of 3.0Moz, exploration and modelling changes of 3.6Moz
and changes in economic assumptions of 2.1Moz. The additions were
partially offset by reductions which included other factors of 0.1Moz.
As a result, the net year-on-year gold Inferred Mineral Resource
addition was 8.6Moz.
The AngloGold Ashanti copper Mineral Resource remained
unchanged at 1.32Mt (2,902Mlb) Measured and Indicated Mineral
Resource and 1.47Mt (3,231Mlb) Inferred Mineral Resource at 31
December 2024 as compared to 31 December 2023, as a feasibility
study optimisation is still ongoing and no additional exploration has
been completed at Quebradona.
The AngloGold Ashanti gold Mineral Reserve increased from 28.1Moz
at 31 December 2023 to 31.2Moz at 31 December 2024. Additions
included the acquisition of Centamin assets (Sukari and Doropo) of
4.1Moz, exploration and modelling changes of 2.4Moz and other
changes of 0.8Moz. The additions were partially offset by reductions
which included depletion of 2.8Moz and changes in economic
assumptions of 1.4Moz. As a result, the net year-on-year gold Mineral
Reserve addition was 3.1Moz.
The AngloGold Ashanti copper Mineral Reserve remained unchanged
at 1.47Mt (3,250Mlb) at 31 December 2024 as compared to 31
December 2023, as a feasibility study optimisation is still ongoing and
no additional exploration has been completed at Quebradona.
Notes on the Mineral Resource and Mineral Reserve
estimates
The Mineral Resource and Mineral Reserve stated herein were
prepared in compliance with Subpart 1300 of Regulation S-K (17 CFR
§ 229.1300) (“Regulation S-K 1300”). Refer to Item 1300 (Definitions)
of Regulation S-K for the meaning of the terms used in AngloGold
Ashanti’s Mineral Resource and Mineral Reserve reporting. The
Mineral Resource and Mineral Reserve represent the amount of gold,
copper, silver, sulphur and molybdenum estimated at 31 December
2024 and are based on information available at the time of estimation.
Such estimates are, or will be, to a large extent, based on the prices of
the respective commodities and interpretations of geologic data
obtained from drill holes and other exploration techniques, which data
may not necessarily be indicative of future results. AngloGold Ashanti
publishes its Mineral Resource and Mineral Reserve on an annual
basis and has re-estimated its Mineral Resource and Mineral Reserve
at 31 December 2024, taking into account economic assumptions,
changes to future production, capital expenditure and operating costs
(if any), depletion, additions as well as any acquisitions or disposals
during 2024. The legal tenure of each material property has been
verified to the satisfaction of the accountable Qualified Person and all
of the Mineral Reserve has been confirmed to be covered by the
required mining permits or there exists a realistic expectation, based
on applicable laws and regulations, that issuance of permits or
resolution of legal issues necessary for mining and processing at a
particular deposit will be accomplished in the ordinary course and in a
timeframe consistent with AngloGold Ashanti’s (or its joint venture
partners’) current mine plans. For the Mineral Reserve, the term
“economically viable” means that profitable extraction or production
has been established or analytically demonstrated in, at a minimum, a
pre-feasibility study, to be economically viable under reasonable
investment and market assumptions. Mineral Reserve is subdivided
and reported, in order of increasing geoscientific knowledge and
confidence, into Probable and Proven Mineral Reserve categories.
Mineral Reserve is aggregated from the Probable and Proven Mineral
Reserve categories. Ounces of gold or silver or pounds of copper,
sulphur or molybdenum included in the Probable and Proven Mineral
Reserve are estimated and reported as delivered to plant (i.e., the
point where material is delivered to the processing facility) and
exclude losses during metallurgical treatment. In compliance with
Regulation S-K 1300, the Mineral Resource herein is reported as
exclusive of the Mineral Reserve before dilution and other factors are
applied, unless otherwise stated. Mineral Resource is subdivided and
reported, in order of increasing geoscientific knowledge and
confidence, into Inferred, Indicated and Measured Mineral Resource
categories. Ounces of gold or silver or pounds of copper, sulphur or
molybdenum included in the Inferred, Indicated and Measured Mineral
Resource are those contained in situ prior to losses during
metallurgical treatment. While it would be reasonable to expect that
the majority of Inferred Mineral Resource would upgrade to Indicated
Mineral Resource with continued exploration, due to the uncertainty of
Inferred Mineral Resource, it should not be assumed that such
upgrading will always occur.
If estimations are required to be revised using significantly lower
commodity prices, increases in operating costs, reductions in
metallurgical recovery or other modifying factors, this could result in
the Mineral Resource or Mineral Reserve not being mined or
processed profitably, material write-downs of AngloGold Ashanti’s
investment in mining properties, goodwill and increased amortisation,
reclamation and closure charges. If AngloGold Ashanti determines
that certain of its Mineral Resource or Mineral Reserve have become
uneconomic, this may ultimately lead to a reduction in its aggregate
reported Mineral Resource or Mineral Reserve, respectively.
Consequently, if AngloGold Ashanti’s actual Mineral Resource and
Mineral Reserve is less than current estimates, its business,
prospects, results of operations and financial position may be
materially impaired.
The pre-feasibility and feasibility studies for undeveloped ore bodies
derive estimates of capital expenditure and operating costs based
upon anticipated tonnage and grades of ore to be mined and
processed, the predicted configuration of the ore body, expected
recovery rates of metals from the ore, the costs of comparable
facilities, the costs of operating and processing equipment and other
factors. Actual operating and capital expenditure cost and economic
returns on projects may differ significantly from original estimates.
Further, it may take many years from the initial phases of exploration
until commencement of production, during which time, the economic
feasibility of production may change. The Mineral Resource is subject
to further exploration and development, and is subject to additional
risks, and no assurance can be given that they will eventually convert
to future Mineral Reserve.
For additional information, refer to Table 1 (Summary Mineral
Resource) and Table 2 (Summary Mineral Reserve) to Paragraph (b)
of Item 1303 (Summary disclosure) of Regulation S-K below. These
summary tables will also be presented in AngloGold Ashanti’s annual
report on Form 20-F for the financial year ended 31 December 2024 to
be filed with the SEC. These summary tables include each class of
Mineral Resource (Inferred, Indicated and Measured) together with
total Measured and Indicated Mineral Resource, and each class of
Mineral Reserve (Probable and Proven) together with total Mineral
Reserve. The Mineral Resource at the end of the financial year ended
31 December 2024 was estimated using a gold price of $1,900/oz
(2023: $1,750/oz), a copper price of $3.50/lb (2023: $3.50/lb), a silver
price of $23.00/oz (2023: $21.64/oz) and a molybdenum price of
$12.00/lb (2023: $12.00/lb), unless otherwise stated. The Mineral
Reserve at the end of the financial year ended 31 December 2024 was
estimated using a gold price of $1,600/oz (2023: $1,400/oz), a copper
price of $2.90/lb (2023: $2.90/lb) and a silver price of $19.50/oz
(2023: $19.58/oz), unless otherwise stated. The net difference
between the Mineral Resource and Mineral Reserve at the end of the
last completed financial year and the preceding financial year (if
applicable) will be detailed for material properties in AngloGold
Ashanti’s annual report on Form 20-F for the financial year ended 31
December 2024 to be filed with the SEC.
Notes
The Mineral Resource exclusive of Mineral Reserve is defined as the inclusive
Mineral Resource less the Mineral Reserve before dilution and other factors are
applied.
QUARTER 4 2024 EARNINGS RELEASE | 30 | | |||
| ||||||
GROUP I MINERAL RESOURCE AND MINERAL RESERVE | ||||||
The below summary table is prepared in accordance with Table 1 to Paragraph (b) of Item 1303 of Regulation S-K - Summary Mineral Resource for gold at the end of the financial year ended 31 December 2024, based on
an estimated gold price of $1,900/oz, unless otherwise stated.
MINERAL RESOURCE (1) | AT 31 DECEMBER 2024 | |||||||||||||||
Measured | Indicated | Total Measured and Indicated | Inferred | |||||||||||||
GOLD | Tonnes (3) | Grade | Contained Gold | Tonnes (3) | Grade | Contained Gold | Tonnes (3) | Grade | Contained Gold | Tonnes (3) | Grade | Contained Gold | ||||
Million | g/t | Tonnes | Moz | Million | g/t | Tonnes | Moz | Million | g/t | Tonnes | Moz | Million | g/t | Tonnes | Moz | |
Africa Region | 61.60 | 2.00 | 123.19 | 3.96 | 380.84 | 1.83 | 697.70 | 22.43 | 442.44 | 1.86 | 820.90 | 26.39 | 319.24 | 2.31 | 739.01 | 23.76 |
Democratic Republic of the Congo | 6.16 | 2.94 | 18.12 | 0.58 | 27.83 | 2.71 | 75.34 | 2.42 | 33.99 | 2.75 | 93.46 | 3.00 | 12.44 | 2.32 | 28.80 | 0.93 |
Kibali (45%) (2)(4)(13) | 6.16 | 2.94 | 18.12 | 0.58 | 27.83 | 2.71 | 75.34 | 2.42 | 33.99 | 2.75 | 93.46 | 3.00 | 12.44 | 2.32 | 28.80 | 0.93 |
Ghana | 5.68 | 6.64 | 37.75 | 1.21 | 111.63 | 2.95 | 329.67 | 10.60 | 117.32 | 3.13 | 367.42 | 11.81 | 85.18 | 4.85 | 413.56 | 13.30 |
Iduapriem (13) | 0.09 | 0.91 | 0.08 | 0.00 | 65.93 | 1.40 | 92.33 | 2.97 | 66.02 | 1.40 | 92.42 | 2.97 | 37.38 | 1.48 | 55.47 | 1.78 |
Obuasi (5)(13) | 5.59 | 6.74 | 37.67 | 1.21 | 45.70 | 5.19 | 237.33 | 7.63 | 51.29 | 5.36 | 275.00 | 8.84 | 47.81 | 7.49 | 358.09 | 11.51 |
Guinea | — | — | — | — | 139.75 | 1.09 | 152.42 | 4.90 | 139.75 | 1.09 | 152.42 | 4.90 | 94.07 | 1.21 | 113.88 | 3.66 |
Siguiri (85%) (2)(13) | — | — | — | — | 139.75 | 1.09 | 152.42 | 4.90 | 139.75 | 1.09 | 152.42 | 4.90 | 94.07 | 1.21 | 113.88 | 3.66 |
Tanzania | 10.28 | 2.58 | 26.58 | 0.85 | 49.84 | 1.84 | 91.86 | 2.95 | 60.12 | 1.97 | 118.45 | 3.81 | 48.80 | 2.21 | 107.84 | 3.47 |
Geita (6)(13) | 10.28 | 2.58 | 26.58 | 0.85 | 49.84 | 1.84 | 91.86 | 2.95 | 60.12 | 1.97 | 118.45 | 3.81 | 48.80 | 2.21 | 107.84 | 3.47 |
Egypt | 39.43 | 1.03 | 40.69 | 1.31 | 28.12 | 0.86 | 24.31 | 0.78 | 67.55 | 0.96 | 65.01 | 2.09 | 20.97 | 0.80 | 16.88 | 0.54 |
Sukari (50%) (2)(7)(8)(13) | 39.43 | 1.03 | 40.69 | 1.31 | 28.12 | 0.86 | 24.31 | 0.78 | 67.55 | 0.96 | 65.01 | 2.09 | 20.97 | 0.80 | 16.88 | 0.54 |
Côte d'Ivoire | 0.05 | 0.87 | 0.04 | — | 23.67 | 1.02 | 24.10 | 0.77 | 23.71 | 1.02 | 24.14 | 0.78 | 57.79 | 1.00 | 58.05 | 1.87 |
Doropo (90%) (2)(7)(12) | 0.05 | 0.87 | 0.04 | 0.00 | 23.67 | 1.02 | 24.10 | 0.77 | 23.71 | 1.02 | 24.14 | 0.78 | 6.63 | 1.23 | 8.16 | 0.26 |
ABC (7)(11) | — | — | — | — | — | — | — | — | — | — | — | — | 51.16 | 0.98 | 49.89 | 1.60 |
Americas Region | 16.51 | 3.70 | 61.11 | 1.96 | 35.16 | 3.09 | 108.61 | 3.49 | 51.68 | 3.28 | 169.72 | 5.46 | 49.99 | 3.92 | 195.83 | 6.30 |
Argentina | 7.02 | 2.48 | 17.43 | 0.56 | 12.40 | 2.53 | 31.40 | 1.01 | 19.41 | 2.52 | 48.83 | 1.57 | 3.99 | 3.01 | 12.02 | 0.39 |
Cerro Vanguardia (92.5%) (2)(13) | 7.02 | 2.48 | 17.43 | 0.56 | 12.40 | 2.53 | 31.40 | 1.01 | 19.41 | 2.52 | 48.83 | 1.57 | 3.99 | 3.01 | 12.02 | 0.39 |
Brazil | 9.50 | 4.60 | 43.68 | 1.40 | 22.77 | 3.39 | 77.21 | 2.48 | 32.26 | 3.75 | 120.89 | 3.89 | 46.01 | 4.00 | 183.81 | 5.91 |
AGA Mineração - Córrego do Sítio (9) | 3.03 | 3.31 | 10.04 | 0.32 | 7.80 | 3.16 | 24.66 | 0.79 | 10.83 | 3.20 | 34.70 | 1.12 | 20.45 | 3.94 | 80.56 | 2.59 |
AGA Mineração - Cuiabá (13) | 2.57 | 7.87 | 20.22 | 0.65 | 4.13 | 5.20 | 21.51 | 0.69 | 6.70 | 6.23 | 41.73 | 1.34 | 10.47 | 5.19 | 54.33 | 1.75 |
AGA Mineração - Lamego (13) | 1.05 | 3.32 | 3.49 | 0.11 | 2.93 | 2.47 | 7.23 | 0.23 | 3.98 | 2.69 | 10.71 | 0.34 | 2.14 | 2.36 | 5.05 | 0.16 |
Serra Grande (13) | 2.84 | 3.49 | 9.94 | 0.32 | 7.91 | 3.01 | 23.81 | 0.77 | 10.75 | 3.14 | 33.75 | 1.08 | 12.95 | 3.39 | 43.88 | 1.41 |
Australia Region | 42.12 | 1.65 | 69.37 | 2.23 | 35.10 | 1.91 | 66.95 | 2.15 | 77.21 | 1.77 | 136.32 | 4.38 | 47.40 | 2.21 | 104.66 | 3.37 |
Sunrise Dam (13) | 31.29 | 1.75 | 54.75 | 1.76 | 25.79 | 1.87 | 48.17 | 1.55 | 57.09 | 1.80 | 102.92 | 3.31 | 27.66 | 2.04 | 56.46 | 1.82 |
Butcher Well (70%) (2)(11) | — | — | — | — | — | — | — | — | — | — | — | — | 2.70 | 3.84 | 10.35 | 0.33 |
Tropicana (70%) (2)(13) | 10.83 | 1.35 | 14.62 | 0.47 | 9.30 | 2.02 | 18.78 | 0.60 | 20.13 | 1.66 | 33.40 | 1.07 | 17.04 | 2.22 | 37.85 | 1.22 |
Projects | 69.48 | 0.46 | 32.19 | 1.03 | 1,185.81 | 0.78 | 927.81 | 29.83 | 1,255.29 | 0.76 | 960.00 | 30.86 | 996.82 | 0.67 | 670.28 | 21.55 |
Colombia | 45.15 | 0.37 | 16.93 | 0.54 | 982.40 | 0.79 | 776.20 | 24.96 | 1,027.55 | 0.77 | 793.13 | 25.50 | 523.83 | 0.43 | 225.50 | 7.25 |
La Colosa (10)(11) | — | — | — | — | 833.49 | 0.87 | 726.31 | 23.35 | 833.49 | 0.87 | 726.31 | 23.35 | 217.89 | 0.71 | 154.86 | 4.98 |
Quebradona (12)(14) | 45.15 | 0.37 | 16.93 | 0.54 | 148.91 | 0.34 | 49.89 | 1.60 | 194.06 | 0.34 | 66.82 | 2.15 | 305.94 | 0.23 | 70.64 | 2.27 |
United States of America | 24.33 | 0.63 | 15.26 | 0.49 | 203.41 | 0.75 | 151.61 | 4.87 | 227.74 | 0.73 | 166.87 | 5.37 | 472.98 | 0.94 | 444.78 | 14.30 |
North Bullfrog (12) | — | — | — | — | 45.94 | 0.28 | 12.70 | 0.41 | 45.94 | 0.28 | 12.70 | 0.41 | 38.58 | 0.24 | 9.31 | 0.30 |
Expanded Silicon (11)(16) | — | — | — | — | 121.56 | 0.87 | 105.90 | 3.40 | 121.56 | 0.87 | 105.90 | 3.40 | 391.14 | 1.03 | 401.65 | 12.91 |
Mother Lode (11)(14) | 24.33 | 0.63 | 15.26 | 0.49 | 35.91 | 0.92 | 33.01 | 1.06 | 60.24 | 0.80 | 48.28 | 1.55 | 9.86 | 0.55 | 5.39 | 0.17 |
Sterling (15) | — | — | — | — | — | — | — | — | — | — | — | — | 33.41 | 0.85 | 28.43 | 0.91 |
AngloGold Ashanti Total | 189.72 | 1.51 | 285.86 | 9.19 | 1,636.91 | 1.10 | 1,801.08 | 57.91 | 1,826.63 | 1.14 | 2,086.94 | 67.10 | 1,413.45 | 1.21 | 1,709.78 | 54.97 |
Notes:
Rounding of numbers may result in computational discrepancies in the Mineral Resource tabulations. To reflect that figures are not precise calculations and that there is uncertainty in their estimation, AngloGold Ashanti reports tonnage, grade
and content for gold to two decimals. All ounces are Troy ounces. “Moz” refers to million ounces. The Mineral Resource tonnages and grades are reported in situ and stockpiled material is reported as broken material.
(1)All disclosure of Mineral Resource is exclusive of Mineral Reserve. The Mineral Resource exclusive of Mineral Reserve is defined as the inclusive Mineral Resource less the Mineral Reserve before dilution and other factors are applied.
QUARTER 4 2024 EARNINGS RELEASE | 31 | | |||
| ||||||
GROUP I MINERAL RESOURCE AND MINERAL RESERVE | ||||||
(2) Mineral Resource attributable to AngloGold Ashanti’s percentage interest shown.
(3) “Tonnes” refers to a metric tonne which is equivalent to 1,000 kilograms.
(4)Kibali is operated by Barrick Gold Corporation (“Barrick”). AngloGold Ashanti has recognised that in preparing this information, the Qualified Persons have relied on information provided by Barrick. In 2024, a cut-off grade range from 0.61g/t to
0.96g/t (varying according to rock type) was applied to the open pit, a cut-off grade of 0.50g/t was applied to the stockpile, and a cut-off grade of 0.94g/t was applied to the underground. In 2024, a metallurgical recovery factor range from 75.5%
to 91% (varying according to area) was applied to the open pit and stockpile, and a metallurgical recovery factor of 90.0% was applied to the underground.
(5)In 2024, for Obuasi, a cut-off grade of 1.07g/t was applied to the open pit, and a cut-off grade range from 2.75g/t to 3.79g/t (varying according to area) was applied to the underground. In 2024, a metallurgical recovery factor of 88% was applied
to the open pit and underground.
(6)In 2024, for Geita, a cut-off grade range from 0.50g/t to 1.40g/t (varying according to area) was applied to the open pit, and a cut-off grade range from 0.88g/t to 2.72g/t (varying according to area) was applied to the underground. In 2024, a
metallurgical recovery factor of 91.70% was applied to the open pit, a metallurgical recovery factor range from 91.07% to 91.63% (varying according to area) was applied to the stockpile, and a metallurgical recovery factor range from 78.02% to
93.37% (varying according to area) was applied to the underground.
(7) Acquired by AngloGold Ashanti through its acquisition of Centamin plc in November 2024. Mineral Resource based on a gold price of $2,000/oz.
(8)In 2024, for Sukari, a cut-off grade of 0.30g/t was applied to the open pit, a cut-off grade of 0.40g/t was applied to the stockpile, and a cut-off grade of 1.00g/t was applied to the underground. In 2024, a metallurgical recovery factor of 88.40%
was applied to the open pit, stockpile and underground.
(9) The Córrego do Sítio (“CdS”) operation was placed on care and maintenance in August 2023.
(10)Property currently in force majeure. Based on a gold price of $1,400/oz. The delineation of the Los Nevados Páramo by Resolution 1987/2016 in November 2016 is considered a risk or uncertainty to the Mineral Resource estimate, and
Resolution 1987/2016 is currently being contested before the Colombian courts. This puts potentially approximately 13.99Moz (50%) of the Mineral Resource at risk.
(11) Property currently in an exploration stage.
(12) Property currently in a development stage.
(13) Property currently in a production stage.
(14) Based on a gold price of $1,500/oz.
(15)Based on a gold price of $1,700/oz. The Sterling project includes the Sterling mine, a mining property currently on care and maintenance, and the Crown Block deposits of SNA, Secret Pass and Daisy and the tenements surrounding the
properties which are all in exploration stage.
(16)The Expanded Silicon project includes the Silicon and Merlin deposits. The Mineral Resource Silicon deposit is based on a gold price of $1,750/oz.
The below summary table is prepared in accordance with Table 1 to Paragraph (b) of Item 1303 of Regulation S-K - Summary Mineral Resource for copper at the end of the financial year ended 31 December 2024, based
on an estimated copper price of $3.50/lb.
MINERAL RESOURCE (1) | AT 31 DECEMBER 2024 | |||||||||||||||
Measured | Indicated | Total Measured and Indicated | Inferred | |||||||||||||
COPPER | Tonnes (2) | Grade | Contained Copper | Tonnes (2) | Grade | Contained Copper | Tonnes (2) | Grade | Contained Copper | Tonnes (2) | Grade | Contained Copper | ||||
Million | %Cu | Tonnes Million | Pounds Million | Million | %Cu | Tonnes Million | Pounds Million | Million | %Cu | Tonnes Million | Pounds Million | Million | %Cu | Tonnes Million | Pounds Million | |
Projects | 45.15 | 0.69 | 0.31 | 684 | 148.91 | 0.68 | 1.01 | 2,218 | 194.06 | 0.68 | 1.32 | 2,902 | 305.94 | 0.48 | 1.47 | 3,231 |
Colombia | 45.15 | 0.69 | 0.31 | 684 | 148.91 | 0.68 | 1.01 | 2,218 | 194.06 | 0.68 | 1.32 | 2,902 | 305.94 | 0.48 | 1.47 | 3,231 |
Quebradona (3) | 45.15 | 0.69 | 0.31 | 684 | 148.91 | 0.68 | 1.01 | 2,218 | 194.06 | 0.68 | 1.32 | 2,902 | 305.94 | 0.48 | 1.47 | 3,231 |
AngloGold Ashanti Total | 45.15 | 0.69 | 0.31 | 684 | 148.91 | 0.68 | 1.01 | 2,218 | 194.06 | 0.68 | 1.32 | 2,902 | 305.94 | 0.48 | 1.47 | 3,231 |
Notes:
Rounding of numbers may result in computational discrepancies in the Mineral Resource tabulations. To reflect that figures are not precise calculations and that there is uncertainty in their estimation, AngloGold Ashanti reports tonnage and
grade to two decimals and content for copper with no decimals. “Mlb” refers to million pounds. The Mineral Resource tonnages and grades are reported in situ and stockpiled material is reported as broken material.
(1)All disclosure of Mineral Resource is exclusive of Mineral Reserve. The Mineral Resource exclusive of Mineral Reserve is defined as the inclusive Mineral Resource less the Mineral Reserve before dilution and other factors are applied.
(2)“Tonnes” refers to a metric tonne which is equivalent to 1,000 kilograms.
(3)Property currently in a development stage.
QUARTER 4 2024 EARNINGS RELEASE | 32 | | |||
| ||||||
GROUP I MINERAL RESOURCE AND MINERAL RESERVE | ||||||
The below summary table is prepared in accordance with Table 1 to Paragraph (b) of Item 1303 of Regulation S-K - Summary Mineral Resource for silver at the end of the financial year ended 31 December 2024,
based on an estimated silver price of $23.00/oz, unless otherwise stated.
MINERAL RESOURCE (1) | AT 31 DECEMBER 2024 | |||||||||||||||
Measured | Indicated | Total Measured and Indicated | Inferred | |||||||||||||
SILVER | Tonnes (3) | Grade | Contained Silver | Tonnes (3) | Grade | Contained Silver | Tonnes (3) | Grade | Contained Silver | Tonnes (3) | Grade | Contained Silver | ||||
Million | g/t | Tonnes | Moz | Million | g/t | Tonnes | Moz | Million | g/t | Tonnes | Moz | Million | g/t | Tonnes | Moz | |
Americas Region | 7.02 | 50.04 | 351.20 | 11.29 | 12.40 | 63.96 | 792.83 | 25.49 | 19.41 | 58.93 | 1,144.03 | 36.78 | 3.99 | 91.04 | 362.95 | 11.67 |
Argentina | 7.02 | 50.04 | 351.20 | 11.29 | 12.40 | 63.96 | 792.83 | 25.49 | 19.41 | 58.93 | 1,144.03 | 36.78 | 3.99 | 91.04 | 362.95 | 11.67 |
Cerro Vanguardia (92.5%) (2)(6) | 7.02 | 50.04 | 351.20 | 11.29 | 12.40 | 63.96 | 792.83 | 25.49 | 19.41 | 58.93 | 1,144.03 | 36.78 | 3.99 | 91.04 | 362.95 | 11.67 |
Projects | 69.48 | 3.25 | 226.09 | 7.27 | 352.32 | 3.43 | 1,210.01 | 38.90 | 421.80 | 3.40 | 1,436.10 | 46.17 | 745.52 | 2.59 | 1,932.76 | 62.14 |
Colombia | 45.15 | 4.52 | 203.91 | 6.56 | 148.91 | 4.63 | 688.92 | 22.15 | 194.06 | 4.60 | 892.84 | 28.71 | 305.94 | 3.66 | 1,121.25 | 36.05 |
Quebradona (5)(7) | 45.15 | 4.52 | 203.91 | 6.56 | 148.91 | 4.63 | 688.92 | 22.15 | 194.06 | 4.60 | 892.84 | 28.71 | 305.94 | 3.66 | 1,121.25 | 36.05 |
United States of America | 24.33 | 0.91 | 22.18 | 0.71 | 203.41 | 2.56 | 521.09 | 16.75 | 227.74 | 2.39 | 543.26 | 17.47 | 439.58 | 1.85 | 811.51 | 26.09 |
North Bullfrog (5) | — | — | — | — | 45.94 | 0.28 | 13.03 | 0.42 | 45.94 | 0.28 | 13.03 | 0.42 | 38.58 | 0.32 | 12.46 | 0.40 |
Expanded Silicon (4)(8) | — | — | — | — | 121.56 | 3.98 | 483.31 | 15.54 | 121.56 | 3.98 | 483.31 | 15.54 | 391.14 | 2.01 | 786.63 | 25.29 |
Mother Lode (4)(9) | 24.33 | 0.91 | 22.18 | 0.71 | 35.91 | 0.69 | 24.75 | 0.80 | 60.24 | 0.78 | 46.93 | 1.51 | 9.86 | 1.26 | 12.42 | 0.40 |
AngloGold Ashanti Total | 76.50 | 7.55 | 577.29 | 18.56 | 364.71 | 5.49 | 2,002.84 | 64.39 | 441.21 | 5.85 | 2,580.13 | 82.95 | 749.51 | 3.06 | 2,295.71 | 73.81 |
Notes:
Rounding of numbers may result in computational discrepancies in the Mineral Resource tabulations.To reflect that figures are not precise calculations and that there is uncertainty in their estimation, AngloGold Ashanti reports tonnage, grade
and content for silver to two decimals.All ounces are Troy ounces. “Moz” refers to million ounces. The Mineral Resource tonnages and grades are reported in situ and stockpiled material is reported as broken material. The reported tonnages for
the silver by-product are an outcome from the associated conceptual pit shell or mineable shapes, that have been determined based on the extraction of the primary mineral. The primary mineral for all properties is gold (except for Quebradona
where the primary mineral is copper and a net smelter return (NSR) approach has been adopted).
(1)All disclosure of Mineral Resource is exclusive of Mineral Reserve. The Mineral Resource exclusive of Mineral Reserve is defined as the inclusive Mineral Resource less the Mineral Reserve before dilution and other factors are applied.
(2) Mineral Resource attributable to AngloGold Ashanti’s percentage interest shown.
(3)“Tonnes” refers to a metric tonne which is equivalent to 1,000 kilograms.
(4) Property currently in an exploration stage.
(5) Property currently in a development stage.
(6) Property currently in a production stage.
(7) Based on a silver price of $25.15/oz.
(8)The Expanded Silicon project includes the Silicon and Merlin deposits. The Mineral Resource Silicon deposit is based on a silver price of $26.25/oz.
(9) Based on a silver price of $18.75/oz.
QUARTER 4 2024 EARNINGS RELEASE | 33 | | |||
| ||||||
GROUP I MINERAL RESOURCE AND MINERAL RESERVE | ||||||
The below summary table is prepared in accordance with Table 1 to Paragraph (b) of Item 1303 of Regulation S-K - Summary Mineral Resource for molybdenum at the end of the financial year ended 31 December 2024,
based on an estimated molybdenum price of $12.00/lb.
MINERAL RESOURCE (1) | AT 31 DECEMBER 2024 | |||||||||||||||
Measured | Indicated | Total Measured and Indicated | Inferred | |||||||||||||
MOLYBDENUM | Tonnes (2) | Grade | Contained Molybdenum | Tonnes (2) | Grade | Contained Molybdenum | Tonnes (2) | Grade | Contained Molybdenum | Tonnes (2) | Grade | Contained Molybdenum | ||||
Million | ppm | Kilo- tonnes | Pounds Million | Million | ppm | Kilo- tonnes | Pounds Million | Million | ppm | Kilo- tonnes | Pounds Million | Million | ppm | Kilo- tonnes | Pounds Million | |
Projects | 45.15 | 168 | 7.58 | 17 | 148.91 | 155 | 23.12 | 51 | 194.06 | 158 | 30.70 | 68 | 305.94 | 135 | 41.35 | 91 |
Colombia | 45.15 | 168 | 7.58 | 17 | 148.91 | 155 | 23.12 | 51 | 194.06 | 158 | 30.70 | 68 | 305.94 | 135 | 41.35 | 91 |
Quebradona (3) | 45.15 | 168 | 7.58 | 17 | 148.91 | 155 | 23.12 | 51 | 194.06 | 158 | 30.70 | 68 | 305.94 | 135 | 41.35 | 91 |
AngloGold Ashanti Total | 45.15 | 168 | 7.58 | 17 | 148.91 | 155 | 23.12 | 51 | 194.06 | 158 | 30.70 | 68 | 305.94 | 135 | 41.35 | 91 |
Notes:
Rounding of numbers may result in computational discrepancies in the Mineral Resource tabulations. To reflect that figures are not precise calculations and that there is uncertainty in their estimation, AngloGold Ashanti reports tonnage and
content (kilotonnes) to two decimals and grade and content (pounds million) with no decimals for molybdenum. The Mineral Resource tonnages and grades are reported in situ and stockpiled material is reported as broken material. The reported
tonnages for the molybdenum by-product are an outcome from the associated conceptual pit shell or mineable shapes, that have been determined based on the extraction of the primary mineral. The primary mineral for Quebradona is copper
and a net smelter return (NSR) approach has been adopted.
(1)All disclosure of Mineral Resource is exclusive of Mineral Reserve. The Mineral Resource exclusive of Mineral Reserve is defined as the inclusive Mineral Resource less the Mineral Reserve before dilution and other factors are applied.
(2)“Tonnes” refers to a metric tonne which is equivalent to 1,000 kilograms.
(3)Property currently in a development stage.
The below summary table is prepared in accordance with Table 1 to Paragraph (b) of Item 1303 of Regulation S-K - Summary Mineral Resource for sulphur at the end of the financial year ended 31 December 2024.
MINERAL RESOURCE (1) | AT 31 DECEMBER 2024 | |||||||||||||||
Measured | Indicated | Total Measured and Indicated | Inferred | |||||||||||||
SULPHUR | Tonnes (2) | Grade | Contained Sulphur | Tonnes (2) | Grade | Contained Sulphur | Tonnes (2) | Grade | Contained Sulphur | Tonnes (2) | Grade | Contained Sulphur | ||||
Million | %S | Tonnes Million | Pounds Million | Million | %S | Tonnes Million | Pounds Million | Million | %S | Tonnes Million | Pounds Million | Million | %S | Tonnes Million | Pounds Million | |
Americas Region | 3.62 | 5.6 | 0.20 | 445 | 7.06 | 3.1 | 0.22 | 475 | 10.68 | 3.9 | 0.42 | 920 | 12.61 | 4.0 | 0.50 | 1,101 |
Brazil | 3.62 | 5.6 | 0.20 | 445 | 7.06 | 3.1 | 0.22 | 475 | 10.68 | 3.9 | 0.42 | 920 | 12.61 | 4.0 | 0.50 | 1,101 |
AGA Mineração - Cuiabá (3) | 2.57 | 6.2 | 0.16 | 353 | 4.13 | 3.3 | 0.14 | 298 | 6.70 | 4.4 | 0.30 | 651 | 10.47 | 4.0 | 0.42 | 923 |
AGA Mineração - Lamego (3) | 1.05 | 4.0 | 0.04 | 92 | 2.93 | 2.7 | 0.08 | 177 | 3.98 | 3.1 | 0.12 | 269 | 2.14 | 3.8 | 0.08 | 179 |
AngloGold Ashanti Total | 3.62 | 5.6 | 0.20 | 445 | 7.06 | 3.1 | 0.22 | 475 | 10.68 | 3.9 | 0.42 | 920 | 12.61 | 4.0 | 0.50 | 1,101 |
Notes:
Rounding of numbers may result in computational discrepancies in the Mineral Resource tabulations. To reflect that figures are not precise calculations and that there is uncertainty in their estimation, AngloGold Ashanti reports tonnage and
content (tonnes million) to two decimals, grade to one decimal, and content (pounds million) with no decimals for sulphur. The Mineral Resource tonnages and grades are reported in situ and stockpiled material is reported as broken material.
The reported tonnages for the sulphur by-product are an outcome from the associated conceptual pit shell or mineable shapes, that have been determined based on the extraction of the primary mineral which is gold.
(1)All disclosure of Mineral Resource is exclusive of Mineral Reserve. The Mineral Resource exclusive of Mineral Reserve is defined as the inclusive Mineral Resource less the Mineral Reserve before dilution and other factors are applied.
(2)“Tonnes” refers to a metric tonne which is equivalent to 1,000 kilograms.
(3)Property currently in a production stage. A sulphuric acid price of $168/t is used.
QUARTER 4 2024 EARNINGS RELEASE | 34 | | |||
| ||||||
GROUP I MINERAL RESOURCE AND MINERAL RESERVE | ||||||
The below summary table is prepared in accordance with Table 2 to Paragraph (b) of Item 1303 of Regulation S-K - Summary Mineral Reserve for gold at the end of the financial year ended 31 December 2024, based on
an estimated gold price of $1,600/oz, unless otherwise stated.
MINERAL RESERVE | AT 31 DECEMBER 2024 | |||||||||||
Proven | Probable | Total Mineral Reserve | ||||||||||
GOLD | Tonnes (2) | Grade | Contained Gold | Tonnes (2) | Grade | Contained Gold | Tonnes (2) | Grade | Contained Gold | |||
Million | g/t | Tonnes | Moz | Million | g/t | Tonnes | Moz | Million | g/t | Tonnes | Moz | |
Africa Region | 92.34 | 1.80 | 166.04 | 5.34 | 242.00 | 2.22 | 536.54 | 17.25 | 334.34 | 2.10 | 702.58 | 22.59 |
Democratic Republic of the Congo | 13.44 | 3.28 | 44.10 | 1.42 | 33.47 | 2.93 | 98.00 | 3.15 | 46.91 | 3.03 | 142.10 | 4.57 |
Kibali (45%) (1)(3)(8) | 13.44 | 3.28 | 44.10 | 1.42 | 33.47 | 2.93 | 98.00 | 3.15 | 46.91 | 3.03 | 142.10 | 4.57 |
Ghana | 7.35 | 5.75 | 42.28 | 1.36 | 53.99 | 4.14 | 223.47 | 7.18 | 61.34 | 4.33 | 265.75 | 8.54 |
Iduapriem (8)(11) | 3.84 | 1.01 | 3.86 | 0.12 | 38.26 | 1.36 | 51.97 | 1.67 | 42.10 | 1.33 | 55.82 | 1.79 |
Obuasi (4)(8) | 3.52 | 10.92 | 38.42 | 1.24 | 15.73 | 10.90 | 171.50 | 5.51 | 19.25 | 10.91 | 209.92 | 6.75 |
Guinea | 4.74 | 0.71 | 3.38 | 0.11 | 71.83 | 0.88 | 62.98 | 2.03 | 76.57 | 0.87 | 66.37 | 2.13 |
Siguiri (85%) (1)(8)(14) | 4.74 | 0.71 | 3.38 | 0.11 | 71.83 | 0.88 | 62.98 | 2.03 | 76.57 | 0.87 | 66.37 | 2.13 |
Tanzania | 15.84 | 0.99 | 15.76 | 0.51 | 37.04 | 2.30 | 85.20 | 2.74 | 52.89 | 1.91 | 100.96 | 3.25 |
Geita (5)(8)(11) | 15.84 | 0.99 | 15.76 | 0.51 | 37.04 | 2.30 | 85.20 | 2.74 | 52.89 | 1.91 | 100.96 | 3.25 |
Egypt | 49.82 | 1.18 | 58.56 | 1.88 | 12.39 | 1.32 | 16.34 | 0.53 | 62.21 | 1.20 | 74.90 | 2.41 |
Sukari (50%) (1)(6)(7)(8) | 49.82 | 1.18 | 58.56 | 1.88 | 12.39 | 1.32 | 16.34 | 0.53 | 62.21 | 1.20 | 74.90 | 2.41 |
Côte d'Ivoire | 1.13 | 1.73 | 1.96 | 0.06 | 33.27 | 1.52 | 50.54 | 1.63 | 34.40 | 1.53 | 52.51 | 1.69 |
Doropo (90%) (1)(6)(9) | 1.13 | 1.73 | 1.96 | 0.06 | 33.27 | 1.52 | 50.54 | 1.63 | 34.40 | 1.53 | 52.51 | 1.69 |
Americas Region | 7.51 | 3.89 | 29.20 | 0.94 | 15.11 | 3.55 | 53.57 | 1.72 | 22.62 | 3.66 | 82.78 | 2.66 |
Argentina | 2.43 | 3.16 | 7.68 | 0.25 | 5.62 | 2.35 | 13.19 | 0.42 | 8.05 | 2.59 | 20.87 | 0.67 |
Cerro Vanguardia (92.5%) (1)(8) | 2.43 | 3.16 | 7.68 | 0.25 | 5.62 | 2.35 | 13.19 | 0.42 | 8.05 | 2.59 | 20.87 | 0.67 |
Brazil | 5.08 | 4.23 | 21.52 | 0.69 | 9.49 | 4.25 | 40.39 | 1.30 | 14.57 | 4.25 | 61.91 | 1.99 |
AGA Mineração - Córrego do Sítio (10)(11) | 0.84 | 3.10 | 2.62 | 0.08 | 2.01 | 4.42 | 8.89 | 0.29 | 2.86 | 4.03 | 11.50 | 0.37 |
AGA Mineração - Cuiabá (8)(12) | 1.92 | 6.26 | 12.03 | 0.39 | 3.80 | 5.61 | 21.36 | 0.69 | 5.72 | 5.83 | 33.38 | 1.07 |
AGA Mineração - Lamego (8)(12) | 0.74 | 3.04 | 2.26 | 0.07 | 1.06 | 3.18 | 3.36 | 0.11 | 1.80 | 3.12 | 5.62 | 0.18 |
Serra Grande (8) | 1.58 | 2.93 | 4.63 | 0.15 | 2.62 | 2.59 | 6.78 | 0.22 | 4.20 | 2.72 | 11.40 | 0.37 |
Australia Region | 24.31 | 1.34 | 32.61 | 1.05 | 16.99 | 2.33 | 39.52 | 1.27 | 41.30 | 1.75 | 72.13 | 2.32 |
Sunrise Dam (8)(15) | 10.55 | 1.64 | 17.29 | 0.56 | 4.42 | 2.90 | 12.84 | 0.41 | 14.97 | 2.01 | 30.13 | 0.97 |
Tropicana (70%) (1)(8)(11) | 13.77 | 1.11 | 15.32 | 0.49 | 12.57 | 2.12 | 26.68 | 0.86 | 26.33 | 1.59 | 42.00 | 1.35 |
Projects | — | — | — | — | 197.03 | 0.58 | 114.47 | 3.68 | 197.03 | 0.58 | 114.47 | 3.68 |
Colombia | — | — | — | — | 120.01 | 0.67 | 80.83 | 2.60 | 120.01 | 0.67 | 80.83 | 2.60 |
Quebradona (9)(13) | — | — | — | — | 120.01 | 0.67 | 80.83 | 2.60 | 120.01 | 0.67 | 80.83 | 2.60 |
United States of America | — | — | — | — | 77.01 | 0.44 | 33.64 | 1.08 | 77.01 | 0.44 | 33.64 | 1.08 |
North Bullfrog (9) | — | — | — | — | 77.01 | 0.44 | 33.64 | 1.08 | 77.01 | 0.44 | 33.64 | 1.08 |
AngloGold Ashanti Total | 124.16 | 1.84 | 227.86 | 7.33 | 471.12 | 1.58 | 744.11 | 23.92 | 595.29 | 1.63 | 971.97 | 31.25 |
Notes:
Rounding of numbers may result in computational discrepancies in the Mineral Reserve tabulations. To reflect that figures are not precise calculations and that there is uncertainty in their estimation, AngloGold Ashanti reports tonnage, grade and content
for gold to two decimals. All ounces are Troy ounces. “Moz” refers to million ounces. The Mineral Reserve tonnages and grades are estimated and reported as delivered to plant (i.e., the point where material is delivered to the processing facility).
(1)Mineral Reserve attributable to AngloGold Ashanti’s percentage interest shown.
(2)“Tonnes” refers to a metric tonne which is equivalent to 1,000 kilograms.
(3)Kibali is operated by Barrick. AngloGold Ashanti has recognised that in preparing this information, the Qualified Persons have relied on information provided by Barrick. Based on a gold price of $1,400/oz. In 2024, the Pamao and Pamao South pit
shells were determined based on a gold price of $1,700/oz, but financially evaluated and found to be profitable at a gold price of $1,400/oz (supporting the 2024 Mineral Reserve declaration). This is exceptional and is driven by the need to create
space for in pit tailings, further saving on capital costs. In 2024, a cut-off grade range from 0.88g/t to 1.30g/t (varying according to area) was applied to the open pit, a cut-off grade of 0.50g/t was applied to the stockpile, and a cut-off grade of
2.06g/t was applied to the underground. In 2024, a metallurgical recovery factor range from 75.5% to 91% (varying according to area) was applied to the open pit and stockpile, and a metallurgical recovery factor of 90.0% was applied to the
underground.
QUARTER 4 2024 EARNINGS RELEASE | 35 | | |||
| ||||||
GROUP I MINERAL RESOURCE AND MINERAL RESERVE | ||||||
(4)In 2024, for Obuasi, a cut-off grade range from 5.69g/t to 7.42g/t was applied to the underground (varying according to area). In 2024, a metallurgical recovery factor of 88% was applied to the open pit and underground.
(5)In 2024, for Geita, a cut-off grade of 1.00g/t was applied to the open pit, a cut-off grade range from 0.70g/t to 0.80g/t (varying according to area) was applied to the stockpile, and a cut-off grade range from 1.98g/t to 2.88g/t (varying according to
area) was applied to the underground. In 2024, a metallurgical recovery factor of 91.70% was applied to the open pit, a metallurgical recovery factor range from 91.07% to 91.63% (varying according to area) was applied to the stockpile, and a
metallurgical recovery factor range from 78.02% to 93.37% (varying according to area) was applied to the underground.
(6)Acquired by AngloGold Ashanti through its acquisition of Centamin plc in November 2024. Mineral Reserve based on a gold price of $1,450/oz.
(7)In 2024, for Sukari, a cut-off grade of 0.44g/t was applied to the open pit and stockpile, and a cut-off grade of 2.34g/t was applied to the underground. In 2024, a metallurgical recovery factor of 88.40% was applied to the open pit, stockpile
and underground.
(8)Property currently in a production stage.
(9)Property currently in a development stage.
(10)The CdS operation was placed on care and maintenance in August 2023.
(11)Based on a gold price of $1,400/oz.
(12)Based on a gold price of $1,500/oz.
(13)Based on a gold price of $1,200/oz.
(14)Based on a gold price of $1,475/oz.
(15) Based on a gold price of $1,550/oz.
The below summary table is prepared in accordance with Table 2 to Paragraph (b) of Item 1303 of Regulation S-K - Summary Mineral Reserve for copper at the end of the financial year ended
31 December 2024, based on an estimated copper price of $2.90/lb.
MINERAL RESERVE | AT 31 DECEMBER 2024 | |||||||||||
Proven | Probable | Total Mineral Reserve | ||||||||||
COPPER | Tonnes (1) | Grade | Contained Copper | Tonnes (1) | Grade | Contained Copper | Tonnes (1) | Grade | Contained Copper | |||
Million | %Cu | Tonnes Million | Pounds Million | Million | %Cu | Tonnes Million | Pounds Million | Million | %Cu | Tonnes Million | Pounds Million | |
Projects | — | — | — | — | 120.01 | 1.23 | 1.47 | 3,250 | 120.01 | 1.23 | 1.47 | 3,250 |
Colombia | — | — | — | — | 120.01 | 1.23 | 1.47 | 3,250 | 120.01 | 1.23 | 1.47 | 3,250 |
Quebradona (2) | — | — | — | — | 120.01 | 1.23 | 1.47 | 3,250 | 120.01 | 1.23 | 1.47 | 3,250 |
AngloGold Ashanti Total | — | — | — | — | 120.01 | 1.23 | 1.47 | 3,250 | 120.01 | 1.23 | 1.47 | 3,250 |
Notes:
Rounding of numbers may result in computational discrepancies in the Mineral Reserve tabulations. To reflect that figures are not precise calculations and that there is uncertainty in their estimation, AngloGold Ashanti reports tonnage and grade to two
decimals and content for copper with no decimals. “Mlb” refers to million pounds. The reference point for the Mineral Reserve is the point of delivery to the process plant. The Mineral Reserve tonnages and grades are estimated and reported as delivered
to plant (i.e., the point where material is delivered to the processing facility).
(1)“Tonnes” refers to a metric tonne which is equivalent to 1,000 kilograms.
(2)Property currently in a development stage.
QUARTER 4 2024 EARNINGS RELEASE | 36 | | |||
| ||||||
GROUP I MINERAL RESOURCE AND MINERAL RESERVE | ||||||
The below summary table is prepared in accordance with Table 2 to Paragraph (b) of Item 1303 of Regulation S-K - Summary Mineral Reserve for silver at the end of the financial year ended 31 December 2024, based on
an estimated silver price of $19.50/oz, unless otherwise stated.
MINERAL RESERVE | AT 31 DECEMBER 2024 | |||||||||||
Proven | Probable | Total Mineral Reserve | ||||||||||
SILVER | Tonnes (2) | Grade | Contained Silver | Tonnes (2) | Grade | Contained Silver | Tonnes (2) | Grade | Contained Silver | |||
Million | g/t | Tonnes | Moz | Million | g/t | Tonnes | Moz | Million | g/t | Tonnes | Moz | |
Americas Region | 2.43 | 61.07 | 148.48 | 4.77 | 5.62 | 69.52 | 390.58 | 12.56 | 8.05 | 66.97 | 539.06 | 17.33 |
Argentina | 2.43 | 61.07 | 148.48 | 4.77 | 5.62 | 69.52 | 390.58 | 12.56 | 8.05 | 66.97 | 539.06 | 17.33 |
Cerro Vanguardia (92.5%) (1)(4) | 2.43 | 61.07 | 148.48 | 4.77 | 5.62 | 69.52 | 390.58 | 12.56 | 8.05 | 66.97 | 539.06 | 17.33 |
Projects | — | — | — | — | 197.03 | 5.00 | 985.65 | 31.69 | 197.03 | 5.00 | 985.65 | 31.69 |
Colombia | — | — | — | — | 120.01 | 7.29 | 874.33 | 28.11 | 120.01 | 7.29 | 874.33 | 28.11 |
Quebradona (3)(5) | — | — | — | — | 120.01 | 7.29 | 874.33 | 28.11 | 120.01 | 7.29 | 874.33 | 28.11 |
United States of America | — | — | — | — | 77.01 | 1.45 | 111.32 | 3.58 | 77.01 | 1.45 | 111.32 | 3.58 |
North Bullfrog (3)(6) | — | — | — | — | 77.01 | 1.45 | 111.32 | 3.58 | 77.01 | 1.45 | 111.32 | 3.58 |
AngloGold Ashanti Total | 2.43 | 61.07 | 148.48 | 4.77 | 202.64 | 6.79 | 1,376.23 | 44.25 | 205.08 | 7.43 | 1,524.71 | 49.02 |
Notes:
Rounding of numbers may result in computational discrepancies in the Mineral Reserve tabulations. To reflect that figures are not precise calculations and that there is uncertainty in their estimation, AngloGold Ashanti reports tonnage, grade
and content for silver to two decimals. All ounces are Troy ounces. “Moz” refers to million ounces. The Mineral Reserve tonnages and grades are estimated and reported as delivered to plant (i.e., the point where material is delivered to the
processing facility). The reported tonnages for the silver by-product are an outcome from the associated pit or underground mine plans, that have been determined based on the extraction of the primary mineral. The primary mineral for all
properties is gold (except for Quebradona where the primary mineral is copper and a net smelter return (NSR) approach has been adopted).
(1)Mineral Reserve attributable to AngloGold Ashanti’s percentage interest shown.
(2)“Tonnes” refers to a metric tonne which is equivalent to 1,000 kilograms.
(3) Property currently in a development stage.
(4) Property currently in a production stage.
(5) Based on a silver price of $18.67/oz.
(6) Based on a silver price of $19.58/oz.
The below summary table is prepared in accordance with Table 2 to Paragraph (b) of Item 1303 of Regulation S-K - Summary Mineral Reserve for sulphur at the end of the financial year ended 31 December 2024.
MINERAL RESERVE | AT 31 DECEMBER 2024 | |||||||||||
Proven | Probable | Total Mineral Reserve | ||||||||||
SULPHUR | Tonnes (1) | Grade | Contained Sulphur | Tonnes (2) | Grade | Contained Sulphur | Tonnes (2) | Grade | Contained Sulphur | |||
Million | %S | Tonnes Million | Pounds Million | Million | %S | Tonnes Million | Pounds Million | Million | %S | Tonnes Million | Pounds Million | |
Americas Region | 2.66 | 4.5 | 0.12 | 265 | 4.86 | 3.6 | 0.17 | 384 | 7.52 | 3.9 | 0.29 | 649 |
Brazil | 2.66 | 4.5 | 0.12 | 265 | 4.86 | 3.6 | 0.17 | 384 | 7.52 | 3.9 | 0.29 | 649 |
AGA Mineração - Cuiabá (2) | 1.92 | 5.3 | 0.10 | 226 | 3.80 | 3.9 | 0.15 | 330 | 5.72 | 4.4 | 0.25 | 556 |
AGA Mineração - Lamego (2) | 0.74 | 2.4 | 0.02 | 40 | 1.06 | 2.3 | 0.02 | 54 | 1.80 | 2.4 | 0.04 | 93 |
AngloGold Ashanti Total | 2.66 | 4.5 | 0.12 | 265 | 4.86 | 3.6 | 0.17 | 384 | 7.52 | 3.9 | 0.29 | 649 |
Notes:
Rounding of numbers may result in computational discrepancies in the Mineral Reserve tabulations. To reflect that figures are not precise calculations and that there is uncertainty in their estimation, AngloGold Ashanti reports tonnage and
content (tonnes million) to two decimals, grade to one decimal, and content (pounds million) with no decimals for sulphur. The Mineral Reserve tonnages and grades are estimated and reported as delivered to plant (i.e., the point where material
is delivered to the processing facility). The reported tonnages for the sulphur by-product are an outcome from the associated pit or underground mine plans, that have been determined based on the extraction of the primary mineral which is
gold.
(1)“Tonnes” refers to a metric tonne which is equivalent to 1,000 kilograms.
(2)Property currently in a production stage. A sulphuric acid price of $168/t is used.
QUARTER 4 2024 EARNINGS RELEASE | 37 | | |||
| ||||||
2024 I DIVIDENDS | ||||||
AngloGold Ashanti plc today announces an interim dividend for the six months ended 31 December 2024 of 69 US cents per share. In respect of the
interim dividend, the timelines, including dates for currency conversions, set out below will apply.
To holders of ordinary shares on the New York Stock Exchange (NYSE)
2025 | ||
Ex-dividend on NYSE | Friday, 14 March | |
Record date | Friday, 14 March | |
Payment date | Friday, 28 March | |
To holders of ordinary shares on the South African Register
Additional information for South African resident shareholders of AngloGold Ashanti:
Shareholders registered on the South African section of the register are advised that the distribution of 69 US cents per ordinary share will be
converted to South African rands at the applicable exchange rate.
In compliance with the requirements of Strate and the Johannesburg Stock Exchange (JSE) Listings Requirements, the salient dates for payment of
the dividend are as follows:
2025 | ||
Declaration date | Wednesday, 19 February | |
Currency conversion rate for South African rands announcement date | Friday, 7 March | |
Last date to trade ordinary shares cum dividend | Tuesday, 11 March | |
Ordinary shares trade ex-dividend | Wednesday, 12 March | |
Record date | Friday, 14 March | |
Payment date | Friday, 28 March | |
Dividends in respect of dematerialised shareholdings will be credited to shareholders’ accounts with the relevant CSDP (as defined below) or broker.
To comply with further requirements of Strate, share certificates may not be dematerialised or rematerialised between Wednesday, 12 March 2025
and Friday, 14 March 2025, both days inclusive. No transfers between South African, NYSE and Ghanaian share registers will be permitted between
Friday, 7 March 2025 and Friday, 14 March 2025, both days inclusive.
Details of the exchange rates applicable to the dividend and a summary of the tax considerations applicable to South African shareholders is expected
to be published on Friday, 7 March 2025.
To Beneficial Owners on the Ghana sub-register holding shares through the nominee arrangement with the Central Securities
Depositary (GH) LTD
2025 | |||
Currency conversion date | Friday, 7 March | ||
Last date to trade and to register shares cum dividend | Tuesday, 11 March | ||
Shares trade ex-dividend | Wednesday, 12 March | ||
Record date | Friday, 14 March | ||
Approximate payment date of dividend | Friday, 28 March | ||
To Beneficial Owners holding Ghanaian Depositary Shares (GhDSs) and acting by National Trust Holding Company Ltd as
depository agent 100 GhDSs represent one ordinary share
2025 | |||
Currency conversion date | Friday, 7 March | ||
Last date to trade and to register GhDSs cum dividend | Tuesday, 11 March | ||
GhDSs trade ex-dividend | Wednesday, 12 March | ||
Record date | Friday, 14 March | ||
Approximate payment date of dividend | Friday, 28 March | ||
Beneficial owners on the Ghana sub-register holding shares and beneficial owners holding GhDSs are advised that the distribution of 69 US cents per
ordinary share will be converted to Ghanaian cedis at the applicable exchange rate. Assuming an exchange rate of US$1/¢15.5000, the gross dividend
payable per share, is equivalent to ca. ¢10.695 Ghanaian cedis. However, the actual rate of payment will depend on the exchange rate on the date for
currency conversion.
Entitlement to interim dividends
A “Shareholder of Record” is a person appearing on the register of members of the Company in respect of ordinary shares at the close of business on
the relevant record date. A “Beneficial Owner” is a person who holds ordinary shares of the Company through a bank, broker, central securities
depository participant (“CSDP”), Shareholder of Record or other agent (sometimes referred to as holding shares “in street name”).
QUARTER 4 2024 EARNINGS RELEASE | 38 | | |||
| ||||||
NON-GAAP DISCLOSURE I RESULTS | ||||||
NON-GAAP DISCLOSURE
From time to time AngloGold Ashanti may publicly disclose
certain “Non-GAAP” financial measures in the course of its
financial presentations, earnings releases, earnings conference
calls and otherwise.
In this document, AngloGold Ashanti presents the financial items
“total cash costs”, “total cash costs per ounce”, “all-in sustaining
costs”, “all-in sustaining costs per ounce”, “all-in costs”, “all-in
costs per ounce”, “average gold price received per ounce”,
“sustaining capital expenditure” and “non-sustaining capital
expenditure”, which have been determined using industry
guidelines and practices and are not measures under IFRS. In
addition, AngloGold Ashanti also presents the financial items
“Adjusted EBITDA”, “Adjusted net debt” and “free cash flow” which
are not measures under IFRS either. An investor should not
consider these items in isolation or as alternatives to cost of
sales, gold income, capital expenditure, profit (loss) before
taxation, total borrowings, cash flows from operating activities or
any other measure of financial performance presented in
accordance with IFRS or as an indicator of the Group’s
performance. The Group uses certain Non-GAAP performance
measures and ratios in managing the business and may provide
users of this financial information with additional meaningful
comparisons between current results and results in prior
operating periods. Non-GAAP financial measures should be
viewed in addition to, and not as an alternative to, the reported
operating results or any other measure of performance prepared
in accordance with IFRS. In addition, the presentation of these
measures may not be comparable to similarly titled measures
that other companies use.
During the financial year ended 31 December 2024, AngloGold
Ashanti’s reporting for managed operations shifted from an
attributable basis of reporting to a consolidated basis of
reporting. The change in reporting only impacts managed
operations with non-controlling interests (i.e., Siguiri, Cerro
Vanguardia and Sukari), whereas joint operations (i.e., Tropicana)
which are proportionately consolidated remain unaffected. Non-
managed joint ventures (i.e., Kibali) which are accounted for
under the equity method also remain unaffected and their gold
production, related unit revenue and cost metrics continue to be
reported on an attributable basis. As a result of this change in
reporting, certain adjustments to exclude non-controlling
interests on gold production, related unit revenue and cost
metrics have been discontinued. The metrics for the three
months and year ended 31 December 2023 have been adjusted
to reflect this change in reporting.
The term “managed operations” refers to subsidiaries managed
by AngloGold Ashanti and included in its consolidated reporting,
while the term “non-managed joint ventures” refers to equity-
accounted joint ventures that are reported based on AngloGold
Ashanti’s share of attributable earnings and are not managed by
AngloGold Ashanti. Managed operations are reported on a
consolidated basis. Non-managed joint ventures are reported on
an attributable basis.
ALL-IN SUSTAINING AND ALL-IN COSTS
During 2018, the World Gold Council (“WGC”), an industry body,
published a revised Guidance Note on “all-in sustaining costs” and
“all-in costs” metrics, which gold mining companies can use to
supplement their overall Non-GAAP disclosure. The WGC worked
closely with its members (including AngloGold Ashanti) to
develop these Non-GAAP measures which are intended to provide
further transparency into the full cost associated with producing
gold. It is expected that these metrics, in particular, the “all-in
sustaining cost” and “all-in cost” metrics which AngloGold Ashanti
provides herein, will be helpful to investors, governments, local
communities and other stakeholders in understanding the
economics of gold mining.
“All-in sustaining costs” is a Non-GAAP measure which is an
extension of the existing “total cash costs” metric and
incorporates all costs related to sustaining production and in
particular, recognises sustaining capital expenditures associated
with developing and maintaining gold mines. In addition, this
metric includes the cost associated with Corporate Office
structures that support these operations, the community and
environmental rehabilitation costs attendant with responsible
mining and any exploration and evaluation cost associated with
sustaining current operations. “All-in sustaining costs per ounce -
managed operations” ($/oz) is calculated by dividing the
consolidated US dollar value of this cost metric by the
consolidated ounces of gold sold. “All-in sustaining costs per
ounce - non-managed joint ventures” ($/oz) is calculated by
dividing the attributable US dollar value of this cost metric by the
attributable ounces of gold sold.
“All-in costs” is a Non-GAAP measure comprising “all-in sustaining
costs” including additional costs which reflect the varying costs
of producing gold over the life-cycle of a mine including costs
incurred at new operations and costs related to growth projects
at existing operations, which are expected to increase production.
QUARTER 4 2024 EARNINGS RELEASE | 39 | | |||
| ||||||
NON-GAAP DISCLOSURE I RESULTS | ||||||
CONTINUED
“All-in costs per ounce - managed operations” ($/oz) is calculated
by dividing the consolidated US dollar value of this cost metric by
the consolidated ounces of gold sold. “All-in costs per ounce -
non-managed joint ventures” ($/oz) is calculated by dividing the
attributable US dollar value of this cost metric by the attributable
ounces of gold sold.
TOTAL CASH COSTS
“Total cash costs” is calculated in accordance with the guidelines
of the Gold Institute industry standard and industry practice and
is a Non-GAAP measure. The Gold Institute, which has been
incorporated into the National Mining Association, is a non-profit
international association of miners, refiners, bullion suppliers and
manufacturers of gold products, which developed a uniform
format for reporting total cash costs on a per ounce basis.
The guidance was first adopted in 1996 and revised in
November 1999.
“Total cash costs” is a Non-GAAP measure and, as calculated and
reported by AngloGold Ashanti, include costs for all mining,
processing, onsite administration costs, royalties and production
taxes, as well as contributions from by-products, but exclude
amortisation of tangible, intangible and right of use assets,
rehabilitation costs and other non-cash costs, retrenchment
costs, corporate administration, marketing and related costs,
capital costs and exploration costs. “Total cash costs per ounce -
managed operations” ($/oz) is calculated by dividing the
consolidated US dollar value of this cost metric by the
consolidated ounces of gold produced. “Total cash costs per
ounce - non-managed joint ventures” ($/oz) is calculated by
dividing the attributable US dollar value of this cost metric by the
attributable ounces of gold produced.
AVERAGE GOLD PRICE RECEIVED PER OUNCE
“Average gold price received per ounce” is a Non-GAAP measure
which gives an indication of revenue earned per ounce of gold
sold and serves as a benchmark of performance against the
market spot gold price. “Average gold price received per ounce -
managed operations” is calculated by dividing the consolidated
US dollar value of this revenue metric by the consolidated ounces
of gold sold. “Average gold price received per ounce - non-
managed joint ventures” is calculated by dividing the attributable
US dollar value of this revenue metric by the attributable ounces
of gold sold.
SUSTAINING CAPITAL EXPENDITURE
“Sustaining capital (expenditure)” is a Non-GAAP measure
comprising capital expenditure incurred to sustain and maintain
existing assets at their current productive capacity in order to
achieve constant planned levels of productive output and capital
expenditure to extend useful lives of existing production assets.
This includes replacement of vehicles, plant and machinery,
Mineral Reserve development, deferred stripping and capital
expenditure related to financial benefit initiatives, safety, health
and the environment.
NON-SUSTAINING EXPENDITURE
“Non-sustaining capital (expenditure)” is a Non-GAAP measure
comprising capital expenditure incurred at new operations and
capital expenditure related to ‘major projects’ at existing
operations where these projects will materially increase
production.
While the Gold Institute provided definitions for the calculation of
“total cash costs” and the WGC published a revised Guidance
Note on “all-in sustaining costs” and “all-in costs” metrics during
2018, the calculation of “total cash costs”, “total cash costs per
ounce”, “all-in sustaining costs”, “all-in sustaining costs per
ounce”, “all-in costs” and “all-in costs per ounce” may vary
significantly among gold mining companies, and by themselves
do not necessarily provide a basis for comparison with other gold
mining companies. However, AngloGold Ashanti believes that
“total cash costs”, “all-in sustaining costs” and “all-in costs” in
total by mine and per ounce by mine as well as “average gold
price received per ounce”, “sustaining capital expenditure” and
“non-sustaining capital expenditure” are useful indicators to
investors and management as they provide:
•an indication of profitability, efficiency and cash flows;
•the trend in costs as the mining operations mature over time
on a consistent basis; and
•an internal benchmark of performance to allow for
comparison against other mines, both within the Group and at
other gold mining companies.
Management prepares its internal management reporting
documentation, for use and decision making by the Chief
Operating Decision Maker (CODM), on a total basis.
QUARTER 4 2024 EARNINGS RELEASE | 40 | | |||
| ||||||
NON-GAAP DISCLOSURE I RESULTS | ||||||
CONTINUED
The key metrics are based on the total ounces, gold income, “total
cash costs”, “all-in costs”, “all-in sustaining costs”, “sustaining
capital expenditure” and “non-sustaining capital expenditure” from
each operation and as a consequence includes AngloGold
Ashanti’s share of the “total cash costs”, “all-in costs”, “all-in
sustaining costs”, “sustaining capital expenditure” and “non-
sustaining capital expenditure” of its non-managed joint ventures
that are accounted for under the equity method. In a capital
intensive industry, this basis allows management to make
operating and resource allocation decisions on a comparable
basis between mining operations irrespective of whether they are
consolidated or accounted for under the equity method. This
basis of calculating the metrics is consistent with the WGC’s
Guidance Note on “all-in sustaining costs” and “all-in costs”
metrics.
Although AngloGold Ashanti has shareholder rights and board
representation commensurate with its ownership interests in its
equity-accounted non-managed joint ventures and reviews the
underlying operating results including “total cash costs”, “all-in
costs”, “all-in sustaining costs”, “sustaining capital expenditure”
and “non-sustaining capital expenditure” with them at each
reporting period, it does not have direct control over their
operations or resulting revenue and expenses, nor does it have a
proportionate legal interest in each financial statement line item.
AngloGold Ashanti’s use of “total cash costs”, “all-in costs”, “all-in
sustaining costs”, “sustaining capital expenditure” and “non-
sustaining capital expenditure” on a total basis, is not intended to
imply that it has any such control or proportionate legal interest,
but rather to reflect the Non-GAAP measures on a basis
consistent with its internal and external segmental reporting.
ADJUSTED EBITDA
“Adjusted EBITDA” is a Non-GAAP measure and, as calculated
and reported by AngloGold Ashanti, includes profit (loss) before
taxation, amortisation of tangible, intangible and right of use
assets, retrenchment costs at the operations, finance income,
other gains (losses), care and maintenance costs, finance costs
and unwinding of obligations, impairment and derecognition of
assets, impairment of investments, profit (loss) on disposal of
assets and investments, gain (loss) on early settlement of hedge
contracts, fair value adjustments, repurchase premium and costs
on settlement of issued bonds and the share of associates’
EBITDA. The Adjusted EBITDA calculation is based on the formula
included in AngloGold Ashanti’s Revolving Credit Facility
Agreements for compliance with the debt covenant formula.
“Adjusted EBITDA margin” is calculated as the percentage of
Adjusted EBITDA divided by revenue from product sales.
ADJUSTED NET DEBT
“Adjusted net debt” is a Non-GAAP measure and, as calculated
and reported by AngloGold Ashanti, includes total borrowings
adjusted for the unamortised portion of borrowing costs and IFRS
16 lease adjustments; less cash restricted for use and cash and
cash equivalents (net of bank overdraft). The Adjusted net debt
calculation is based on the formula included in AngloGold
Ashanti’s Revolving Credit Facility Agreements for compliance
with the debt covenant formula.
FREE CASH FLOW
“Free cash flow” is a Non-GAAP measure and, as calculated and
reported by AngloGold Ashanti, includes cash inflow from
operating activities, less cash outflow from investing activities
and after finance costs, adjusted to exclude once-off acquisitions,
disposals and corporate restructuring costs, and movements in
restricted cash.
RECONCILIATIONS
A reconciliation of cost of sales as included in AngloGold
Ashanti’s financial and operational update for the three months
ended 31 December 2024 and 31 December 2023, and the years
ended 31 December 2024 and 31 December 2023 to “all-in
sustaining costs”, “all-in sustaining costs per ounce”, “all-in costs”,
“all-in costs per ounce”, “total cash costs” and “total cash costs
per ounce” for each of the three-month periods ended 31
December 2024 and 31 December 2023, and each of the years
ended 31 December 2024 and 31 December 2023 is presented on
a total (Group), total (managed operations/non-managed joint
ventures) and segment basis in Note A below. In addition, the
Company has provided detail of the consolidated ounces of gold
produced and sold by mine for each of those periods below.
A reconciliation of gold income as included in AngloGold
Ashanti’s financial and operational update for the three months
ended 31 December 2024 and 31 December 2023, and the years
ended 31 December 2024 and 31 December 2023 to “average
gold price received per ounce” for each of the three-months
ended 31 December 2024 and 31 December 2023, and each of
the years ended 31 December 2024 and 31 December 2023 is
presented on a total (Group) and total (managed operations/non-
managed joint ventures) basis in Note B below.
A reconciliation of capital expenditure as included in AngloGold
Ashanti’s financial and operational update for the three months
ended 31 December 2024 and 31 December 2023, and the years
QUARTER 4 2024 EARNINGS RELEASE | 41 | | |||
| ||||||
NON-GAAP DISCLOSURE I RESULTS | ||||||
CONTINUED
ended 31 December 2024 and 31 December 2023 to “sustaining
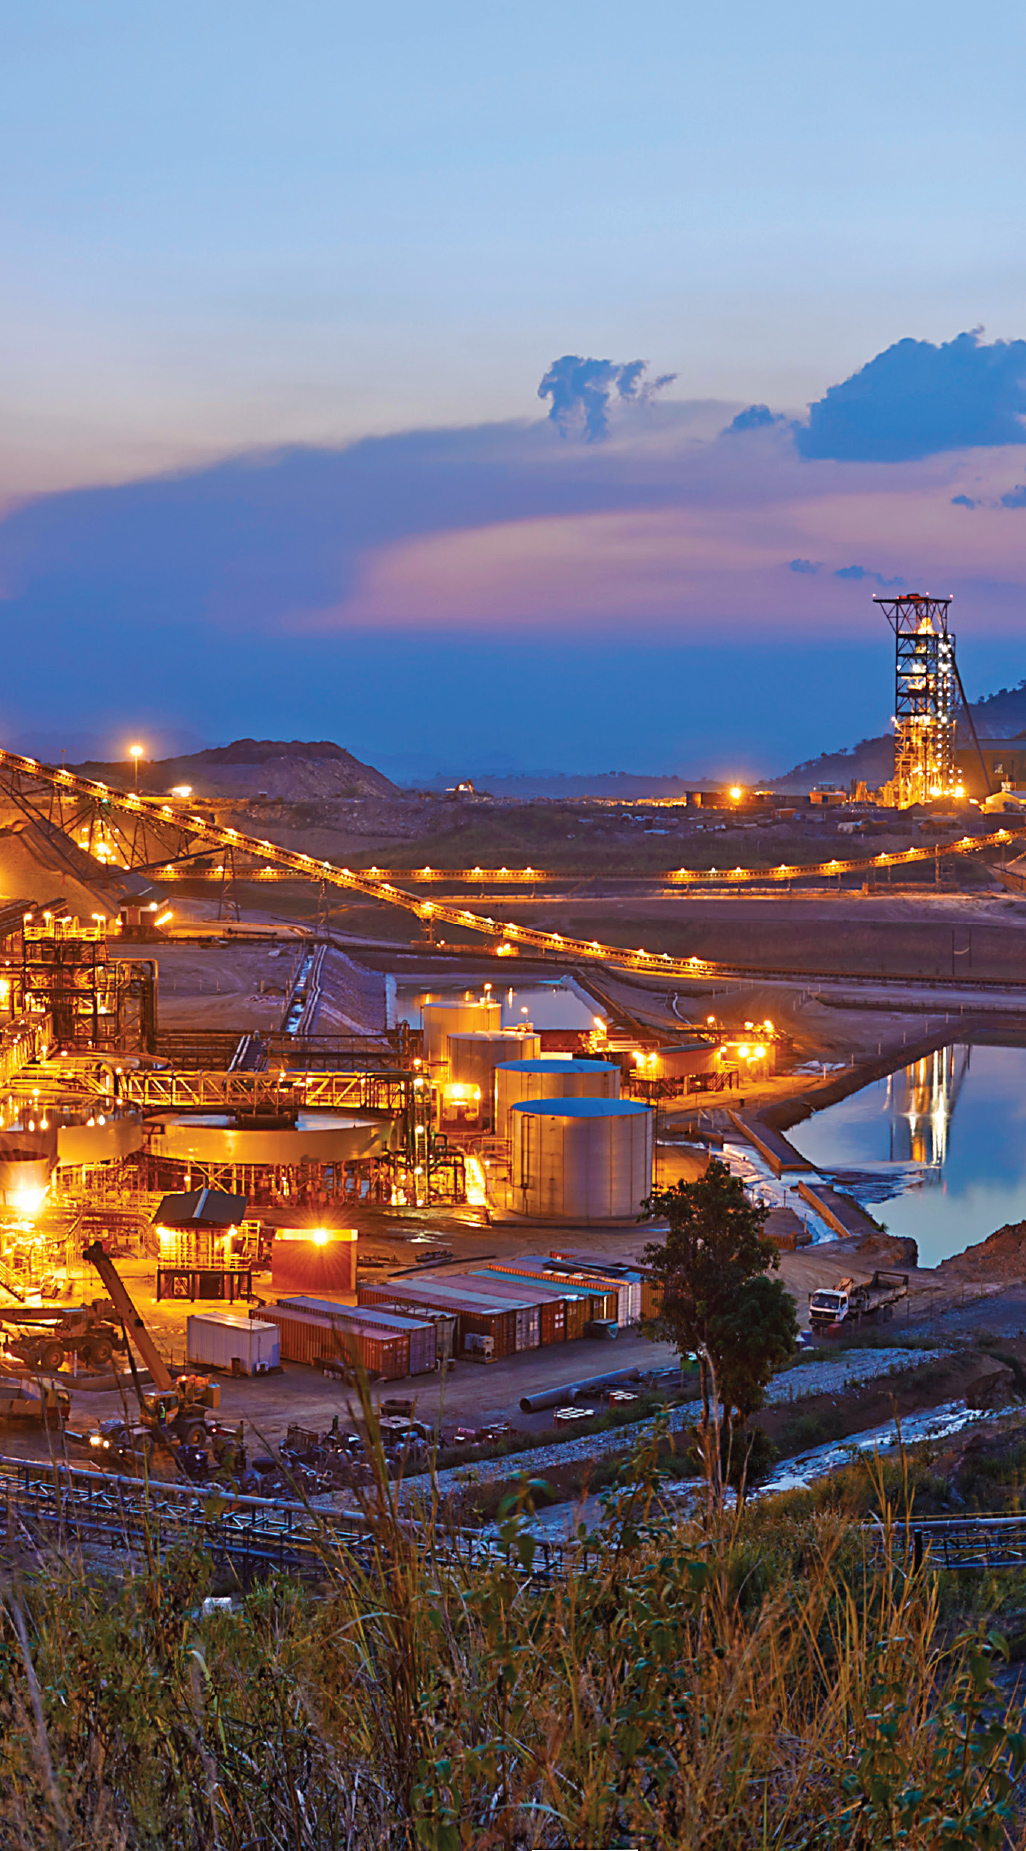
capital expenditure” and “non-sustaining capital expenditure” for
each of the three-month periods ended 31 December 2024 and
31 December 2023, and each of the years ended 31 December
2024 and 31 December 2023 is presented on a total (Group), total
(managed operations/non-managed joint ventures) and segment
basis in Note C below.
A reconciliation of profit (loss) before taxation as included in
AngloGold Ashanti’s financial and operational update for the three
months ended 31 December 2024 and 31 December 2023, and
the years ended 31 December 2024 and 31 December 2023, to
“Adjusted EBITDA” for each of the three-month periods ended
31 December 2024 and 31 December 2023, and each of the years
ended 31 December 2024 and 31 December 2023 is presented on
a total (Group) basis in Note D below.
A reconciliation of total borrowings as included in AngloGold
Ashanti’s financial and operational update as at 31 December
2024 and 31 December 2023 to “Adjusted net debt” as at
31 December 2024 and 31 December 2023 is presented on a total
(Group) basis in Note E below.
A reconciliation of net cash flow from operating activities as
included in AngloGold Ashanti’s financial and operational update
for the three months ended 31 December 2024 and 31 December
2023, and the years ended 31 December 2024 and 31 December
2023 to “free cash flow” for each of the three-month periods
ended 31 December 2024 and 31 December 2023, and each of
the years ended 31 December 2024 and 31 December 2023 is
presented on a total (Group) basis in Note F below.
Kibali, Democratic Republic of the Congo
QUARTER 4 2024 EARNINGS RELEASE | 42 | | |||
| ||||||
NON-GAAP DISCLOSURE I NOTE A | ||||||
ALL-IN SUSTAINING COSTS | FOR THE QUARTER ENDED 31 DECEMBER 2024 | ||||||||||||||
AFRICA | AUSTRALIA | ||||||||||||||
Corporate and other(3) | Kibali | Other | Non- managed joint ventures | Iduapriem | Obuasi | Siguiri | Geita | Sukari | Africa other | Managed operations | Sunrise Dam | Tropicana | Australia other | Australia | |
in US Dollar million, except as otherwise noted | |||||||||||||||
Cost of sales per segmental information (2) | (3) | 101 | — | 101 | 91 | 101 | 134 | 148 | 83 | — | 557 | 114 | 135 | 10 | 259 |
By-product revenue | — | — | — | — | — | — | — | (1) | — | — | (1) | — | (1) | — | (1) |
Realised other commodity contracts | — | — | — | — | — | — | — | — | — | — | — | — | — | — | — |
Amortisation of tangible, intangible and right of use assets | (1) | (25) | — | (25) | (19) | (22) | (14) | (42) | (20) | — | (117) | (19) | (39) | — | (58) |
Adjusted for decommissioning and inventory amortisation | — | — | — | — | — | — | — | — | — | — | — | — | — | — | — |
Corporate administration, marketing and related expenses | 31 | — | — | — | — | — | — | — | — | — | — | — | — | — | — |
Lease payment sustaining | 1 | (3) | — | (3) | 1 | — | 1 | 6 | — | — | 8 | 4 | 3 | — | 7 |
Sustaining exploration and study costs | — | — | — | — | — | 1 | 2 | (2) | — | — | 1 | — | — | — | — |
Total sustaining capital expenditure | — | 19 | — | 19 | 28 | 34 | 26 | 52 | 20 | — | 160 | 26 | 11 | — | 37 |
All-in sustaining costs (5) | 28 | 93 | — | 93 | 100 | 113 | 150 | 161 | 83 | — | 607 | 125 | 109 | 10 | 244 |
Non-sustaining capital expenditure | — | 17 | — | 17 | 22 | 20 | 3 | 6 | — | — | 51 | — | 3 | — | 3 |
Non-sustaining lease payments | — | — | — | — | — | — | — | 1 | — | — | 1 | — | — | — | — |
Non-sustaining exploration and study costs | 1 | — | — | — | 1 | — | 3 | 2 | 3 | 1 | 10 | 2 | 2 | 7 | 11 |
Care and maintenance | — | — | — | — | — | — | — | — | — | — | — | — | — | — | — |
Closure and social responsibility costs not related to current operations | 1 | (1) | — | (1) | 1 | (16) | — | — | — | — | (15) | — | — | — | — |
Other provisions | — | — | — | — | 1 | 1 | 2 | — | — | — | 4 | — | — | 4 | 4 |
All-in costs (5) | 29 | 108 | — | 108 | 125 | 119 | 157 | 170 | 86 | 1 | 658 | 127 | 114 | 21 | 262 |
Gold sold - oz (000) | — | 78 | — | 78 | 47 | 59 | 69 | 122 | 44 | — | 341 | 66 | 100 | — | 166 |
All-in sustaining costs per ounce - $/oz (1) | — | 1,188 | — | 1,188 | 2,131 | 1,905 | 2,186 | 1,327 | 1,858 | — | 1,780 | 1,888 | 1,086 | — | 1,465 |
All-in costs per ounce - $/oz (1) | — | 1,384 | — | 1,388 | 2,658 | 1,996 | 2,290 | 1,395 | 1,945 | — | 1,928 | 1,922 | 1,137 | — | 1,574 |
(1) In addition to the operational performances of the mines, “all-in sustaining costs per ounce”, “all-in costs per ounce” and “total cash costs per ounce” are affected by fluctuations in the foreign currency exchange rate. AngloGold Ashanti reports “all-in sustaining costs per ounce” and “all-in costs per ounce” calculated to the nearest US dollar amount and gold sold in ounces. AngloGold Ashanti reports “total cash costs per ounce” calculated to the nearest US dollar amount and gold produced in ounces. “All-in sustaining costs (per ounce)”, “all-in costs (per ounce)” and “total cash costs (per ounce)” may not be calculated based on amounts presented in this table due to rounding. | |||||||||||||||
(2) Refer to Segmental reporting. | |||||||||||||||
(3) Corporate includes non-gold producing managed operations. | |||||||||||||||
(4) Total including equity-accounted non-managed joint ventures. | |||||||||||||||
(5) “Total cash costs”, “all-in sustaining costs” and “all-in costs” may not be calculated based on amounts presented in this table due to rounding. | |||||||||||||||
(6) Adjusted to exclude the Sukari operation which was acquired on 22 November 2024 as part of the Centamin acquisition. | |||||||||||||||
Rounding of figures may result in computational discrepancies. | |||||||||||||||
QUARTER 4 2024 EARNINGS RELEASE | 43 | | |||
| ||||||
NON-GAAP DISCLOSURE I NOTE A | ||||||
ALL-IN SUSTAINING COSTS | FOR THE QUARTER ENDED 31 DECEMBER 2024 | |||||||||||
AMERICAS | GROUP | ADJUSTED TO EXCLUDE THE SUKARI OPERATION | ||||||||||
Cerro Vanguardia | AngloGold Ashanti Mineração | Serra Grande | Americas other | Americas | Projects | Non- managed joint ventures | Managed operations | Group total (4) | Managed operations (6) | Group total (4)(6) | ||
in US Dollar million, except as otherwise noted | ||||||||||||
Cost of sales per segmental information (2) | 99 | 98 | 32 | 1 | 230 | — | 101 | 1,043 | 1,144 | 960 | 1,061 | |
By-product revenue | (30) | (2) | — | — | (32) | — | — | (34) | (34) | (34) | (34) | |
Realised other commodity contracts | — | — | — | — | — | — | — | — | — | — | — | |
Amortisation of tangible, intangible and right of use assets | (21) | (33) | (8) | — | (62) | — | (25) | (238) | (263) | (218) | (243) | |
Adjusted for decommissioning and inventory amortisation | 6 | — | — | — | 6 | — | — | 6 | 6 | 6 | 6 | |
Corporate administration, marketing and related expenses | — | — | — | — | — | 1 | — | 32 | 32 | 32 | 32 | |
Lease payment sustaining | — | 6 | 3 | — | 9 | — | (3) | 25 | 22 | 25 | 22 | |
Sustaining exploration and study costs | 1 | 1 | — | — | 2 | — | — | 3 | 3 | 3 | 3 | |
Total sustaining capital expenditure | 24 | 30 | 12 | — | 66 | 3 | 19 | 266 | 285 | 246 | 265 | |
All-in sustaining costs (5) | 79 | 100 | 40 | — | 219 | 4 | 93 | 1,102 | 1,195 | 1,019 | 1,112 | |
Non-sustaining capital expenditure | — | — | — | — | — | 13 | 17 | 67 | 84 | 67 | 84 | |
Non-sustaining lease payments | — | — | — | — | — | — | — | 1 | 1 | 1 | 1 | |
Non-sustaining exploration and study costs | 7 | — | — | 3 | 10 | 38 | — | 70 | 70 | 67 | 67 | |
Care and maintenance | — | (29) | — | — | (29) | — | — | (29) | (29) | (29) | (29) | |
Closure and social responsibility costs not related to current operations | — | 21 | (1) | — | 20 | — | (1) | 6 | 5 | 6 | 5 | |
Other provisions | — | — | 1 | — | 1 | — | — | 9 | 9 | 9 | 9 | |
All-in costs (5) | 86 | 93 | 40 | 3 | 222 | 55 | 108 | 1,226 | 1,334 | 1,140 | 1,248 | |
Gold sold - oz (000) | 44 | 74 | 22 | — | 140 | — | 78 | 647 | 725 | 603 | 681 | |
All-in sustaining costs per ounce - $/oz (1) | 1,811 | 1,344 | 1,842 | — | 1,574 | — | 1,188 | 1,702 | 1,647 | 1,691 | 1,633 | |
All-in costs per ounce - $/oz (1) | 1,971 | 1,250 | 1,834 | — | 1,593 | — | 1,388 | 1,895 | 1,840 | 1,891 | 1,834 | |
Rounding of figures may result in computational discrepancies. | ||||||||||||
QUARTER 4 2024 EARNINGS RELEASE | 44 | | |||
| ||||||
NON-GAAP DISCLOSURE I NOTE A | ||||||
TOTAL CASH COSTS | FOR THE QUARTER ENDED 31 DECEMBER 2024 | |||||||||||||
AFRICA | AUSTRALIA | |||||||||||||
Corporate and other(3) | Kibali | Non- managed joint ventures | Iduapriem | Obuasi | Siguiri | Geita | Sukari | Africa other | Managed operations | Sunrise Dam | Tropicana | Australia other | Australia | |
in US Dollar million, except as otherwise noted | ||||||||||||||
Cost of sales per segmental information (2) | (3) | 101 | 101 | 91 | 101 | 134 | 148 | 83 | — | 557 | 114 | 135 | 10 | 259 |
- By-product revenue | — | — | — | — | — | — | (1) | — | — | (1) | — | (1) | — | (1) |
- Inventory change | — | 1 | 1 | 6 | (1) | 11 | 17 | (17) | — | 16 | (1) | — | — | (1) |
- Amortisation of tangible assets | (1) | (25) | (25) | (18) | (22) | (13) | (37) | (19) | — | (109) | (15) | (37) | — | (52) |
- Amortisation of right of use assets | — | — | — | (1) | — | (1) | (5) | (1) | — | (8) | (4) | (2) | — | (6) |
- Amortisation of intangible assets | — | — | — | — | — | — | — | — | — | — | — | — | — | — |
- Rehabilitation and other non-cash costs | — | — | — | (3) | (7) | (2) | (1) | — | — | (13) | (1) | (2) | — | (3) |
- Retrenchment costs | — | — | — | — | — | — | — | — | — | — | — | — | — | — |
Total cash costs (5) | (4) | 77 | 77 | 74 | 71 | 129 | 121 | 46 | — | 441 | 93 | 93 | 9 | 195 |
Gold produced - oz (000) | — | 80 | 80 | 50 | 60 | 74 | 136 | 40 | — | 360 | 66 | 100 | — | 166 |
Total cash costs per ounce - $/oz (1) | — | 967 | 967 | 1,478 | 1,169 | 1,747 | 892 | 1,165 | — | 1,225 | 1,406 | 924 | — | 1,171 |
Rounding of figures may result in computational discrepancies. | ||||||||||||||
QUARTER 4 2024 EARNINGS RELEASE | 45 | | |||
| ||||||
NON-GAAP DISCLOSURE I NOTE A | ||||||
TOTAL CASH COSTS | FOR THE QUARTER ENDED 31 DECEMBER 2024 | |||||||||||
AMERICAS | GROUP | ADJUSTED TO EXCLUDE THE SUKARI OPERATION | ||||||||||
Cerro Vanguardia | AngloGold Ashanti Mineração | Serra Grande | Americas other | Americas | Projects | Non- managed joint ventures | Managed operations | Group total (4) | Managed operations (6) | Group total (4)(6) | ||
in US Dollar million, except as otherwise noted | ||||||||||||
Cost of sales per segmental information (2) | 99 | 98 | 32 | 1 | 230 | — | 101 | 1,043 | 1,144 | 960 | 1,061 | |
- By-product revenue | (30) | (2) | — | — | (32) | — | — | (34) | (34) | (34) | (34) | |
- Inventory change | 9 | (1) | 1 | — | 9 | — | 1 | 24 | 25 | 41 | 42 | |
- Amortisation of tangible assets | (21) | (27) | (7) | — | (55) | — | (25) | (217) | (242) | (198) | (223) | |
- Amortisation of right of use assets | — | (6) | (1) | — | (7) | — | — | (21) | (21) | (21) | (21) | |
- Amortisation of intangible assets | — | — | — | — | — | — | — | — | — | — | — | |
- Rehabilitation and other non-cash costs | (2) | 2 | 4 | — | 4 | — | — | (12) | (12) | (12) | (12) | |
- Retrenchment costs | — | (1) | — | — | (1) | — | — | (1) | (1) | (1) | (1) | |
Total cash costs (5) | 54 | 64 | 30 | 1 | 149 | — | 77 | 781 | 858 | 735 | 812 | |
Gold produced - oz (000) | 47 | 75 | 22 | — | 144 | — | 80 | 670 | 750 | 630 | 710 | |
Total cash costs per ounce - $/oz (1) | 1,155 | 859 | 1,338 | — | 1,035 | — | 967 | 1,165 | 1,144 | 1,165 | 1,143 | |
Rounding of figures may result in computational discrepancies. | ||||||||||||
QUARTER 4 2024 EARNINGS RELEASE | 46 | | |||
| ||||||
NON-GAAP DISCLOSURE I NOTE A | ||||||
ALL-IN SUSTAINING COSTS | FOR THE QUARTER ENDED 31 DECEMBER 2023 | |||||||||||||
AFRICA | AUSTRALIA | |||||||||||||
Corporate and other(3) | Kibali | Other | Non-managed joint ventures | Iduapriem | Obuasi | Siguiri | Geita | Africa other | Managed operations | Sunrise Dam | Tropicana | Australia other | Australia | |
in US Dollar million, except as otherwise noted | ||||||||||||||
Cost of sales per segmental information (2) | 3 | 94 | — | 94 | 104 | 81 | 134 | 139 | — | 458 | 103 | 126 | 8 | 237 |
By-product revenue | — | — | — | — | — | — | — | (1) | — | (1) | — | (1) | — | (1) |
Realised other commodity contracts | 2 | — | — | — | — | — | — | — | — | — | — | — | — | — |
Amortisation of tangible, intangible and right of use assets | (1) | (25) | — | (25) | (31) | (18) | (17) | (24) | — | (90) | (19) | (40) | — | (59) |
Adjusted for decommissioning and inventory amortisation | — | — | — | — | — | — | — | (1) | — | (1) | — | — | — | — |
Corporate administration, marketing and related expenses | 30 | — | — | — | — | — | — | — | — | — | — | — | — | — |
Lease payment sustaining | — | 2 | — | 2 | 1 | — | — | 7 | — | 8 | 8 | 3 | — | 11 |
Sustaining exploration and study costs | — | — | — | — | — | 1 | 1 | 5 | — | 7 | — | — | — | — |
Total sustaining capital expenditure | 1 | 13 | — | 13 | 33 | 56 | 41 | 61 | — | 191 | 15 | 16 | — | 31 |
All-in sustaining costs (5) | 35 | 84 | — | 84 | 107 | 120 | 159 | 186 | — | 572 | 107 | 104 | 8 | 219 |
Non-sustaining capital expenditure | — | 10 | — | 10 | 10 | 20 | — | 3 | — | 33 | — | — | — | — |
Non-sustaining lease payments | — | — | — | — | — | — | — | 1 | — | 1 | — | — | — | — |
Non-sustaining exploration and study costs | — | — | — | — | — | — | 2 | 2 | — | 4 | 2 | 2 | 6 | 10 |
Care and maintenance | — | — | — | — | — | — | — | — | — | — | — | — | — | — |
Closure and social responsibility costs not related to current operations | 1 | 1 | — | 1 | — | 4 | — | — | 1 | 5 | — | — | — | — |
Other provisions | — | — | — | — | — | — | — | — | — | — | — | — | — | — |
All-in costs (5) | 36 | 94 | — | 94 | 117 | 143 | 161 | 193 | 1 | 615 | 109 | 106 | 14 | 229 |
Gold sold - oz (000) | — | 92 | — | 92 | 76 | 57 | 67 | 131 | — | 331 | 63 | 85 | — | 148 |
All-in sustaining costs per ounce - $/oz (1) | — | 907 | — | 907 | 1,407 | 2,081 | 2,397 | 1,423 | — | 1,729 | 1,696 | 1,228 | — | 1,478 |
All-in costs per ounce - $/oz (1) | — | 1,020 | — | 1,023 | 1,543 | 2,507 | 2,421 | 1,473 | — | 1,859 | 1,740 | 1,247 | — | 1,547 |
(1) In addition to the operational performances of the mines, “all-in sustaining costs per ounce”, “all-in costs per ounce” and “total cash costs per ounce” are affected by fluctuations in the foreign currency exchange rate. AngloGold Ashanti reports “all-in sustaining costs per ounce” and “all-in costs per ounce” calculated to the nearest US dollar amount and gold sold in ounces. AngloGold Ashanti reports “total cash costs per ounce” calculated to the nearest US dollar amount and gold produced in ounces. “All-in sustaining costs (per ounce)”, “all-in costs (per ounce)” and “total cash costs (per ounce)” may not be calculated based on amounts presented in this table due to rounding. | ||||||||||||||
(2) Refer to Segmental reporting. | ||||||||||||||
(3) Corporate includes non-gold producing managed operations. | ||||||||||||||
(4) Total including equity-accounted non-managed joint ventures. | ||||||||||||||
(5) “Total cash costs”, “all-in sustaining costs” and “all-in costs” may not be calculated based on amounts presented in this table due to rounding. | ||||||||||||||
(6) Adjusted to exclude the Córrego do Sítio (CdS) operation which was placed on care and maintenance in August 2023. | ||||||||||||||
Rounding of figures may result in computational discrepancies. | ||||||||||||||
QUARTER 4 2024 EARNINGS RELEASE | 47 | | |||
| ||||||
NON-GAAP DISCLOSURE I NOTE A | ||||||
ALL-IN SUSTAINING COSTS | FOR THE QUARTER ENDED 31 DECEMBER 2023 | ||||||||||||||
AMERICAS | GROUP | ADJUSTED TO EXCLUDE THE CÓRREGO do SITIO OPERATION | |||||||||||||
Cerro Vanguardia | AngloGold Ashanti Mineração | Serra Grande | Americas other | Americas | Projects | Non- managed joint ventures | Managed operations | Group total (4) | Córrego do Sítio | AngloGold Ashanti Mineração(6) | Americas(6) | Managed operations (6) | Group total (4)(6) | ||
in US Dollar million, except as otherwise noted | |||||||||||||||
Cost of sales per segmental information (2) | 83 | 103 | 45 | — | 231 | — | 94 | 929 | 1,023 | 3 | 100 | 228 | 926 | 1,020 | |
By-product revenue | (31) | — | — | — | (31) | — | — | (33) | (33) | — | — | (31) | (33) | (33) | |
Realised other commodity contracts | — | — | — | — | — | — | — | 2 | 2 | — | — | — | 2 | 2 | |
Amortisation of tangible, intangible and right of use assets | (11) | (24) | (12) | — | (47) | — | (25) | (197) | (222) | — | (24) | (47) | (197) | (222) | |
Adjusted for decommissioning and inventory amortisation | — | (4) | — | — | (4) | — | — | (5) | (5) | — | (4) | (4) | (5) | (5) | |
Corporate administration, marketing and related expenses | — | — | — | — | — | — | — | 30 | 30 | — | — | — | 30 | 30 | |
Lease payment sustaining | — | 7 | 2 | — | 9 | — | 2 | 28 | 30 | — | 7 | 9 | 28 | 30 | |
Sustaining exploration and study costs | 1 | — | — | — | 1 | — | — | 8 | 8 | — | — | 1 | 8 | 8 | |
Total sustaining capital expenditure | 26 | 21 | 14 | — | 61 | 11 | 13 | 295 | 308 | — | 21 | 61 | 295 | 308 | |
All-in sustaining costs (5) | 68 | 103 | 49 | — | 220 | 11 | 84 | 1,057 | 1,141 | 3 | 100 | 217 | 1,054 | 1,138 | |
Non-sustaining capital expenditure | — | 2 | — | — | 2 | 4 | 10 | 39 | 49 | 2 | — | — | 37 | 47 | |
Non-sustaining lease payments | — | 1 | — | — | 1 | — | — | 2 | 2 | 1 | — | — | 1 | 1 | |
Non-sustaining exploration and study costs | 1 | 2 | — | 1 | 4 | 45 | — | 63 | 63 | 1 | 2 | 3 | 62 | 62 | |
Care and maintenance | — | 35 | — | — | 35 | 1 | — | 36 | 36 | 25 | 10 | 10 | 11 | 11 | |
Closure and social responsibility costs not related to current operations | — | 8 | 2 | — | 10 | — | 1 | 16 | 17 | — | 8 | 10 | 16 | 17 | |
Other provisions | — | — | — | — | — | — | — | — | — | — | — | — | — | — | |
All-in costs (5) | 69 | 152 | 50 | 1 | 272 | 62 | 94 | 1,214 | 1,308 | 32 | 120 | 240 | 1,182 | 1,276 | |
Gold sold - oz (000) | 41 | 76 | 25 | — | 142 | — | 92 | 621 | 713 | 2 | 74 | 140 | 619 | 711 | |
All-in sustaining costs per ounce - $/oz (1) | 1,660 | 1,350 | 1,925 | — | 1,543 | — | 907 | 1,701 | 1,598 | 1,587 | 1,343 | 1,542 | 1,701 | 1,598 | |
All-in costs per ounce - $/oz (1) | 1,673 | 1,994 | 1,988 | — | 1,907 | — | 1,023 | 1,954 | 1,833 | 15,896 | 1,619 | 1,708 | 1,909 | 1,794 | |
Rounding of figures may result in computational discrepancies. | |||||||||||||||
QUARTER 4 2024 EARNINGS RELEASE | 48 | | |||
| ||||||
NON-GAAP DISCLOSURE I NOTE A | ||||||
TOTAL CASH COSTS | FOR THE QUARTER ENDED 31 DECEMBER 2023 | ||||||||||||
AFRICA | AUSTRALIA | ||||||||||||
Corporate and other(3) | Kibali | Non-managed joint ventures | Iduapriem | Obuasi | Siguiri | Geita | Africa other | Managed operations | Sunrise Dam | Tropicana | Australia other | Australia | |
in US Dollar million, except as otherwise noted | |||||||||||||
Cost of sales per segmental information (2) | 3 | 94 | 94 | 104 | 81 | 134 | 139 | — | 458 | 103 | 126 | 8 | 237 |
- By-product revenue | — | — | — | — | — | — | (1) | — | (1) | — | (1) | — | (1) |
- Inventory change | — | 1 | 1 | 3 | 4 | (1) | 11 | — | 17 | (1) | 14 | — | 13 |
- Amortisation of tangible assets | (1) | (25) | (25) | (30) | (18) | (17) | (20) | — | (85) | (12) | (38) | — | (50) |
- Amortisation of right of use assets | — | — | — | (1) | — | — | (4) | — | (5) | (7) | (2) | — | (9) |
- Amortisation of intangible assets | — | — | — | — | — | — | — | — | — | — | — | — | — |
- Rehabilitation and other non-cash costs | — | 2 | 2 | — | (3) | (4) | (3) | — | (10) | (2) | (3) | — | (5) |
- Retrenchment costs | — | — | — | — | — | — | — | — | — | — | — | — | — |
Total cash costs (5) | 2 | 71 | 71 | 76 | 64 | 112 | 123 | — | 375 | 81 | 97 | 7 | 185 |
Gold produced - oz (000) | — | 93 | 93 | 79 | 61 | 66 | 142 | — | 348 | 62 | 96 | — | 158 |
Total cash costs per ounce - $/oz (1) | 761 | 761 | 962 | 1,040 | 1,693 | 868 | — | 1,076 | 1,314 | 1,015 | — | 1,177 | |
Rounding of figures may result in computational discrepancies. | |||||||||||||
QUARTER 4 2024 EARNINGS RELEASE | 49 | | |||
| ||||||
NON-GAAP DISCLOSURE I NOTE A | ||||||
TOTAL CASH COSTS | FOR THE QUARTER ENDED 31 DECEMBER 2023 | ||||||||||||||
AMERICAS | GROUP | ADJUSTED TO EXCLUDE THE CÓRREGO do SITIO OPERATION | |||||||||||||
Cerro Vanguardia | AngloGold Ashanti Mineração | Serra Grande | Americas other | Americas | Projects | Non- managed joint ventures | Managed operations | Group total (4) | Córrego do Sítio | AngloGold Ashanti Mineração(6) | Americas(6) | Managed operations (6) | Group total (4)(6) | ||
in US Dollar million, except as otherwise noted | |||||||||||||||
Cost of sales per segmental information (2) | 83 | 103 | 45 | — | 231 | — | 94 | 929 | 1,023 | 3 | 100 | 228 | 926 | 1,020 | |
- By-product revenue | (31) | — | — | — | (31) | — | — | (33) | (33) | — | — | (31) | (33) | (33) | |
- Inventory change | (4) | (4) | (1) | — | (9) | — | 1 | 21 | 22 | — | (4) | (9) | 21 | 22 | |
- Amortisation of tangible assets | (11) | (19) | (11) | — | (41) | — | (25) | (177) | (202) | — | (19) | (41) | (177) | (202) | |
- Amortisation of right of use assets | — | (5) | (1) | — | (6) | — | — | (20) | (20) | — | (5) | (6) | (20) | (20) | |
- Amortisation of intangible assets | — | — | — | — | — | — | — | — | — | — | — | — | — | — | |
- Rehabilitation and other non-cash costs | 1 | — | 1 | — | 2 | — | 2 | (13) | (11) | — | (1) | 2 | (13) | (11) | |
- Retrenchment costs | — | (1) | — | — | (1) | — | — | (1) | (1) | — | (1) | (1) | (1) | (1) | |
Total cash costs (5) | 39 | 73 | 32 | — | 144 | — | 71 | 706 | 777 | 3 | 70 | 141 | 703 | 774 | |
Gold produced - oz (000) | 41 | 75 | 25 | — | 141 | — | 93 | 647 | 740 | 2 | 73 | 139 | 645 | 738 | |
Total cash costs per ounce - $/oz (1) | 943 | 970 | 1,307 | — | 1,023 | — | 761 | 1,093 | 1,051 | 1,431 | 957 | 1,017 | 1,092 | 1,050 | |
Rounding of figures may result in computational discrepancies. | |||||||||||||||
QUARTER 4 2024 EARNINGS RELEASE | 50 | | |||
| ||||||
NON-GAAP DISCLOSURE I NOTE A | ||||||
ALL-IN SUSTAINING COSTS | FOR THE YEAR ENDED 31 DECEMBER 2024 | ||||||||||||||
AFRICA | AUSTRALIA | ||||||||||||||
Corporate and other (3) | Kibali | Other | Non-managed joint ventures | Iduapriem | Obuasi | Siguiri | Geita | Sukari | Africa other | Managed operations | Sunrise Dam | Tropicana | Australia other | Australia | |
in US Dollar million, except as otherwise noted | |||||||||||||||
Cost of sales per segmental information (2) | (1) | 380 | — | 380 | 351 | 360 | 518 | 612 | 83 | — | 1,924 | 430 | 479 | 36 | 945 |
By-product revenue | — | (2) | — | (2) | — | (1) | (1) | (2) | — | — | (4) | (2) | (3) | — | (5) |
Realised other commodity contracts | — | — | — | — | — | — | — | — | — | — | — | — | — | — | — |
Amortisation of tangible, intangible and right of use assets | (4) | (92) | — | (92) | (79) | (75) | (51) | (138) | (20) | — | (363) | (77) | (112) | (1) | (190) |
Adjusted for decommissioning and inventory amortisation | — | — | — | — | — | — | — | (1) | — | — | (1) | (1) | — | — | (1) |
Corporate administration, marketing and related expenses | 115 | — | — | — | — | — | — | — | — | — | — | — | — | — | — |
Lease payment sustaining | 1 | (1) | — | (1) | 6 | — | 3 | 22 | — | — | 31 | 18 | 10 | 1 | 29 |
Sustaining exploration and study costs | — | — | — | — | — | 2 | 6 | 6 | — | — | 14 | 1 | — | — | 1 |
Total sustaining capital expenditure | 1 | 68 | — | 68 | 108 | 145 | 93 | 181 | 20 | — | 547 | 65 | 37 | — | 102 |
All-in sustaining costs (5) | 112 | 354 | — | 354 | 385 | 430 | 569 | 680 | 83 | — | 2,147 | 434 | 411 | 36 | 881 |
Non-sustaining capital expenditure | — | 57 | — | 57 | 61 | 57 | 9 | 15 | — | — | 142 | — | 51 | — | 51 |
Non-sustaining lease payments | — | — | — | — | — | — | — | 2 | — | — | 2 | — | — | — | — |
Non-sustaining exploration and study costs | 3 | — | — | — | 3 | 2 | 6 | 11 | 3 | 2 | 27 | 9 | 7 | 24 | 40 |
Care and maintenance | — | — | — | — | — | — | — | — | — | — | — | — | — | — | — |
Closure and social responsibility costs not related to current operations | 5 | 5 | 1 | 6 | 2 | (25) | — | — | — | — | (23) | — | — | — | — |
Other provisions | 1 | — | — | — | 1 | 1 | 2 | (3) | — | — | 1 | — | — | 4 | 4 |
All-in costs (5) | 121 | 416 | 1 | 417 | 451 | 466 | 586 | 705 | 86 | 2 | 2,296 | 443 | 469 | 64 | 976 |
Gold sold - oz (000) | — | 309 | — | 309 | 238 | 222 | 272 | 479 | 44 | — | 1,255 | 261 | 317 | — | 578 |
All-in sustaining costs per ounce - $/oz (1) | — | 1,146 | — | 1,146 | 1,614 | 1,942 | 2,093 | 1,418 | 1,858 | — | 1,709 | 1,665 | 1,297 | — | 1,526 |
All-in costs per ounce - $/oz (1) | — | 1,349 | — | 1,351 | 1,891 | 2,101 | 2,154 | 1,471 | 1,945 | — | 1,828 | 1,701 | 1,479 | — | 1,690 |
(1) In addition to the operational performances of the mines, “all-in sustaining costs per ounce”, “all-in costs per ounce” and “total cash costs per ounce” are affected by fluctuations in the foreign currency exchange rate. AngloGold Ashanti reports “all-in sustaining costs per ounce” and “all-in costs per ounce” calculated to the nearest US dollar amount and gold sold in ounces. AngloGold Ashanti reports “total cash costs per ounce” calculated to the nearest US dollar amount and gold produced in ounces. “All-in sustaining costs (per ounce)”, “all-in costs (per ounce)” and “total cash costs (per ounce)’’ may not be calculated based on amounts presented in this table due to rounding. | |||||||||||||||
(2) Refer to Segmental reporting. | |||||||||||||||
(3) Corporate includes non-gold producing managed operations. | |||||||||||||||
(4) Total including equity-accounted non-managed joint ventures. | |||||||||||||||
(5) “Total cash costs”, “all-in sustaining costs” and “all-in costs” may not be calculated based on amounts presented in this table due to rounding. | |||||||||||||||
(6) Adjusted to exclude the Sukari operation which was acquired on 22 November 2024 as part of the Centamin acquisition. | |||||||||||||||
Rounding of figures may result in computational discrepancies. | |||||||||||||||
QUARTER 4 2024 EARNINGS RELEASE | 51 | | |||
| ||||||
NON-GAAP DISCLOSURE I NOTE A | ||||||
ALL-IN SUSTAINING COSTS | FOR THE YEAR ENDED 31 DECEMBER 2024 | |||||||||||
AMERICAS | GROUP | ADJUSTED TO EXCLUDE THE SUKARI OPERATION | ||||||||||
Cerro Vanguardia | AngloGold Ashanti Mineração | Serra Grande | Americas other | Americas | Projects | Non- managed joint ventures | Managed operations | Group total (4) | Managed operations (6) | Group total (4)(6) | ||
in US Dollar million, except as otherwise noted | ||||||||||||
Cost of sales per segmental information (2) | 368 | 352 | 136 | 2 | 858 | — | 380 | 3,726 | 4,106 | 3,643 | 4,023 | |
By-product revenue | (109) | (2) | — | — | (111) | — | (2) | (120) | (122) | (120) | (122) | |
Realised other commodity contracts | — | — | — | — | — | — | — | — | — | — | — | |
Amortisation of tangible, intangible and right of use assets | (61) | (112) | (22) | — | (195) | — | (92) | (752) | (844) | (732) | (824) | |
Adjusted for decommissioning and inventory amortisation | 9 | (1) | (1) | — | 7 | — | — | 5 | 5 | 5 | 5 | |
Corporate administration, marketing and related expenses | — | — | — | — | — | 3 | — | 118 | 118 | 118 | 118 | |
Lease payment sustaining | — | 27 | 10 | — | 37 | 1 | (1) | 99 | 98 | 99 | 98 | |
Sustaining exploration and study costs | 6 | 2 | — | — | 8 | 1 | — | 24 | 24 | 24 | 24 | |
Total sustaining capital expenditure | 71 | 98 | 40 | — | 209 | 5 | 68 | 864 | 932 | 844 | 912 | |
All-in sustaining costs (5) | 284 | 365 | 162 | 2 | 813 | 10 | 354 | 3,963 | 4,317 | 3,880 | 4,234 | |
Non-sustaining capital expenditure | — | — | — | — | — | 33 | 57 | 226 | 283 | 226 | 283 | |
Non-sustaining lease payments | — | 1 | — | — | 1 | — | — | 3 | 3 | 3 | 3 | |
Non-sustaining exploration and study costs | 10 | — | 1 | 5 | 16 | 142 | — | 228 | 228 | 225 | 225 | |
Care and maintenance | — | 48 | — | — | 48 | 3 | — | 51 | 51 | 51 | 51 | |
Closure and social responsibility costs not related to current operations | — | 33 | 35 | — | 68 | — | 6 | 50 | 56 | 50 | 56 | |
Other provisions | — | — | 1 | — | 1 | — | — | 7 | 7 | 7 | 7 | |
All-in costs (5) | 294 | 448 | 198 | 7 | 947 | 189 | 417 | 4,529 | 4,946 | 4,443 | 4,860 | |
Gold sold - oz (000) | 183 | 274 | 80 | — | 537 | — | 309 | 2,370 | 2,679 | 2,326 | 2,635 | |
All-in sustaining costs per ounce - $/oz (1) | 1,544 | 1,334 | 2,039 | — | 1,514 | — | 1,146 | 1,672 | 1,611 | 1,668 | 1,607 | |
All-in costs per ounce - $/oz (1) | 1,600 | 1,635 | 2,495 | — | 1,763 | — | 1,351 | 1,910 | 1,846 | 1,910 | 1,844 | |
Rounding of figures may result in computational discrepancies. | ||||||||||||
QUARTER 4 2024 EARNINGS RELEASE | 52 | | |||
| ||||||
NON-GAAP DISCLOSURE I NOTE A | ||||||
TOTAL CASH COSTS | FOR THE YEAR ENDED 31 DECEMBER 2024 | ||||||||||||||
AFRICA | AUSTRALIA | ||||||||||||||
Corporate and other (3) | Kibali | Other | Non- managed joint ventures | Iduapriem | Obuasi | Siguiri | Geita | Sukari | Africa other | Managed operations | Sunrise Dam | Tropicana | Australia other | Australia | |
in US Dollar million, except as otherwise noted | |||||||||||||||
Cost of sales per segmental information (2) | (1) | 380 | — | 380 | 351 | 360 | 518 | 612 | 83 | — | 1,924 | 430 | 479 | 36 | 945 |
- By-product revenue | — | (2) | — | (2) | — | (1) | (1) | (2) | — | — | (4) | (2) | (3) | — | (5) |
- Inventory change | — | 2 | — | 2 | 1 | (2) | 4 | 7 | (17) | — | (7) | (3) | (7) | — | (10) |
- Amortisation of tangible assets | (3) | (91) | — | (91) | (75) | (75) | (48) | (111) | (19) | — | (328) | (61) | (106) | — | (167) |
- Amortisation of right of use assets | (1) | (1) | — | (1) | (4) | — | (3) | (27) | (1) | — | (35) | (16) | (6) | (1) | (23) |
- Amortisation of intangible assets | — | — | — | — | — | — | — | — | — | — | — | — | — | — | — |
- Rehabilitation and other non-cash costs | — | 1 | — | 1 | (7) | (14) | (6) | (3) | — | — | (30) | (2) | (2) | (1) | (5) |
- Retrenchment costs | — | — | — | — | — | — | — | — | — | — | — | — | — | — | — |
Total cash costs (5) | (5) | 289 | — | 289 | 265 | 268 | 465 | 476 | 46 | (1) | 1,519 | 347 | 354 | 34 | 735 |
Gold produced - oz (000) | — | 309 | — | 309 | 237 | 221 | 273 | 483 | 40 | — | 1,254 | 259 | 313 | — | 572 |
Total cash costs per ounce - $/oz (1) | — | 935 | — | 935 | 1,118 | 1,214 | 1,703 | 984 | 1,165 | — | 1,212 | 1,343 | 1,132 | — | 1,287 |
Rounding of figures may result in computational discrepancies. | |||||||||||||||
QUARTER 4 2024 EARNINGS RELEASE | 53 | | |||
| ||||||
NON-GAAP DISCLOSURE I NOTE A | ||||||
TOTAL CASH COSTS | FOR THE YEAR ENDED 31 DECEMBER 2024 | |||||||||||
AMERICAS | GROUP | ADJUSTED TO EXCLUDE THE SUKARI OPERATION | ||||||||||
Cerro Vanguardia | AngloGold Ashanti Mineração | Serra Grande | Americas other | Americas | Projects | Non- managed joint ventures | Managed operations | Group total (4) | Managed operations (6) | Group total (4)(6) | ||
in US Dollar million, except as otherwise noted | ||||||||||||
Cost of sales per segmental information (2) | 368 | 352 | 136 | 2 | 858 | — | 380 | 3,726 | 4,106 | 3,643 | 4,023 | |
- By-product revenue | (109) | (2) | — | — | (111) | — | (2) | (120) | (122) | (120) | (122) | |
- Inventory change | 1 | (2) | — | — | (1) | — | 2 | (18) | (16) | (1) | 1 | |
- Amortisation of tangible assets | (61) | (89) | (18) | — | (168) | — | (91) | (666) | (757) | (647) | (738) | |
- Amortisation of right of use assets | — | (23) | (4) | — | (27) | — | (1) | (86) | (87) | (86) | (87) | |
- Amortisation of intangible assets | — | — | — | — | — | — | — | — | — | — | — | |
- Rehabilitation and other non-cash costs | (10) | 2 | — | — | (8) | — | 1 | (43) | (42) | (43) | (42) | |
- Retrenchment costs | (1) | (1) | (1) | — | (3) | — | — | (3) | (3) | (3) | (3) | |
Total cash costs (5) | 189 | 237 | 113 | 2 | 541 | — | 289 | 2,790 | 3,079 | 2,744 | 3,033 | |
Gold produced - oz (000) | 175 | 271 | 80 | — | 526 | — | 309 | 2,352 | 2,661 | 2,312 | 2,621 | |
Total cash costs per ounce - $/oz (1) | 1,073 | 876 | 1,411 | — | 1,027 | — | 935 | 1,187 | 1,157 | 1,187 | 1,157 | |
Rounding of figures may result in computational discrepancies. | ||||||||||||
QUARTER 4 2024 EARNINGS RELEASE | 54 | | |||
| ||||||
NON-GAAP DISCLOSURE I NOTE A | ||||||
ALL-IN SUSTAINING COSTS | FOR THE YEAR ENDED 31 DECEMBER 2023 | |||||||||||||
AFRICA | AUSTRALIA | |||||||||||||
Corporate and other (3) | Kibali | Other | Non-managed joint ventures | Iduapriem | Obuasi | Siguiri | Geita | Africa other | Managed operations | Sunrise Dam | Tropicana | Australia other | Australia | |
in US Dollar million, except as otherwise noted | ||||||||||||||
Cost of sales per segmental information (2) | 4 | 372 | — | 372 | 387 | 313 | 473 | 566 | — | 1,739 | 399 | 438 | 30 | 867 |
By-product revenue | — | (2) | — | (2) | — | (1) | — | (2) | — | (3) | (1) | (3) | — | (4) |
Realised other commodity contracts | 7 | — | — | — | — | — | — | — | — | — | — | — | — | — |
Amortisation of tangible, intangible and right of use assets | (5) | (99) | — | (99) | (129) | (61) | (39) | (91) | — | (320) | (58) | (104) | (1) | (163) |
Adjusted for decommissioning and inventory amortisation | — | 1 | — | 1 | — | — | — | (1) | — | (1) | (1) | — | — | (1) |
Corporate administration, marketing and related expenses | 92 | — | — | — | — | — | — | — | — | — | — | — | — | — |
Lease payment sustaining | 2 | 2 | — | 2 | 3 | — | — | 26 | — | 29 | 16 | 11 | 1 | 28 |
Sustaining exploration and study costs | — | — | — | — | — | 2 | 6 | 12 | (1) | 19 | 2 | 1 | — | 3 |
Total sustaining capital expenditure | 1 | 52 | — | 52 | 96 | 148 | 74 | 162 | — | 480 | 47 | 50 | 1 | 98 |
All-in sustaining costs (5) | 101 | 326 | — | 326 | 357 | 401 | 514 | 672 | (1) | 1,943 | 404 | 393 | 31 | 828 |
Non-sustaining capital expenditure | — | 33 | — | 33 | 46 | 66 | 4 | 29 | — | 145 | — | 37 | — | 37 |
Non-sustaining lease payments | — | — | — | — | — | — | — | 2 | — | 2 | — | — | — | — |
Non-sustaining exploration and study costs | — | 1 | — | 1 | — | — | 7 | 9 | 1 | 17 | 5 | 6 | 22 | 33 |
Care and maintenance | — | — | — | — | — | — | — | — | — | — | — | — | — | — |
Closure and social responsibility costs not related to current operations | 5 | 7 | 1 | 8 | (1) | (4) | — | 1 | 1 | (3) | 1 | (1) | (1) | (1) |
Other provisions | 1 | — | — | — | — | — | — | — | — | — | — | — | — | — |
All-in costs (5) | 107 | 367 | 1 | 368 | 402 | 463 | 525 | 713 | 1 | 2,104 | 410 | 435 | 52 | 897 |
Gold sold - oz (000) | — | 343 | — | 343 | 268 | 226 | 260 | 479 | — | 1,233 | 256 | 301 | — | 557 |
All-in sustaining costs per ounce - $/oz (1) | — | 951 | — | 951 | 1,329 | 1,777 | 1,976 | 1,403 | — | 1,576 | 1,583 | 1,304 | — | 1,487 |
All-in costs per ounce - $/oz (1) | — | 1,069 | — | 1,074 | 1,500 | 2,050 | 2,020 | 1,488 | — | 1,706 | 1,603 | 1,446 | — | 1,612 |
(1) In addition to the operational performances of the mines, “all-in sustaining costs per ounce”, “all-in costs per ounce” and “total cash costs per ounce” are affected by fluctuations in the foreign currency exchange rate. AngloGold Ashanti reports “all-in sustaining costs per ounce” and “all-in costs per ounce” calculated to the nearest US dollar amount and gold sold in ounces. AngloGold Ashanti reports “total cash costs per ounce” calculated to the nearest US dollar amount and gold produced in ounces. “All-in sustaining costs (per ounce)”, “all-in costs (per ounce)” and “total cash costs (per ounce)’’ may not be calculated based on amounts presented in this table due to rounding. | ||||||||||||||
(2) Refer to Segmental reporting. | ||||||||||||||
(3) Corporate includes non-gold producing managed operations. | ||||||||||||||
(4) Total including equity-accounted non-managed joint ventures. | ||||||||||||||
(5) “Total cash costs”, “all-in sustaining costs” and “all-in costs” may not be calculated based on amounts presented in this table due to rounding. | ||||||||||||||
(6) Adjusted to exclude the Córrego do Sítio (CdS) operation which was placed on care and maintenance in August 2023. | ||||||||||||||
Rounding of figures may result in computational discrepancies. | ||||||||||||||
QUARTER 4 2024 EARNINGS RELEASE | 55 | | |||
| ||||||
NON-GAAP DISCLOSURE I NOTE A | ||||||
ALL-IN SUSTAINING COSTS | FOR THE YEAR ENDED 31 DECEMBER 2023 | ||||||||||||||
AMERICAS | GROUP | ADJUSTED TO EXCLUDE THE CÓRREGO do SITIO OPERATION | |||||||||||||
Cerro Vanguardia | AngloGold Ashanti Mineração | Serra Grande | Americas other | Americas | Projects | Non- managed joint ventures | Managed operations | Group total (4) | Córrego do Sítio | AngloGold Ashanti Mineração | Americas (6) | Managed operations (6) | Group total (4)(6) | ||
in US Dollar million, except as otherwise noted | |||||||||||||||
Cost of sales per segmental information (2) | 307 | 453 | 169 | 2 | 931 | — | 372 | 3,541 | 3,913 | 104 | 349 | 827 | 3,437 | 3,809 | |
By-product revenue | (93) | (2) | — | — | (95) | — | (2) | (102) | (104) | — | (2) | (95) | (102) | (104) | |
Realised other commodity contracts | — | — | — | — | — | — | — | 7 | 7 | — | — | — | 7 | 7 | |
Amortisation of tangible, intangible and right of use assets | (39) | (88) | (43) | — | (170) | — | (99) | (658) | (757) | (6) | (82) | (164) | (652) | (751) | |
Adjusted for decommissioning and inventory amortisation | 1 | (3) | — | — | (2) | (1) | 1 | (5) | (4) | — | (3) | (2) | (5) | (4) | |
Corporate administration, marketing and related expenses | — | — | — | — | — | 2 | — | 94 | 94 | — | — | — | 94 | 94 | |
Lease payment sustaining | — | 33 | 8 | (1) | 40 | 1 | 2 | 100 | 102 | 7 | 26 | 33 | 93 | 95 | |
Sustaining exploration and study costs | 6 | 1 | — | 1 | 8 | 2 | — | 32 | 32 | — | 1 | 8 | 32 | 32 | |
Total sustaining capital expenditure | 75 | 122 | 55 | — | 252 | 11 | 52 | 842 | 894 | 19 | 103 | 233 | 823 | 875 | |
All-in sustaining costs (5) | 257 | 516 | 189 | 2 | 964 | 15 | 326 | 3,851 | 4,177 | 124 | 392 | 840 | 3,727 | 4,053 | |
Non-sustaining capital expenditure | — | 2 | — | — | 2 | 16 | 33 | 200 | 233 | 2 | — | — | 198 | 231 | |
Non-sustaining lease payments | — | 2 | — | — | 2 | — | — | 4 | 4 | 2 | — | — | 2 | 2 | |
Non-sustaining exploration and study costs | 7 | 6 | 1 | 1 | 15 | 158 | 1 | 223 | 224 | 3 | 3 | 12 | 220 | 221 | |
Care and maintenance | — | 49 | — | — | 49 | 3 | — | 52 | 52 | 34 | 15 | 15 | 18 | 18 | |
Closure and social responsibility costs not related to current operations | — | 62 | 10 | 1 | 73 | — | 8 | 74 | 82 | 4 | 58 | 69 | 70 | 78 | |
Other provisions | — | — | — | — | — | — | — | 1 | 1 | — | — | — | 1 | 1 | |
All-in costs (5) | 264 | 637 | 200 | 4 | 1,105 | 192 | 368 | 4,405 | 4,773 | 169 | 468 | 936 | 4,236 | 4,604 | |
Gold sold - oz (000) | 163 | 285 | 86 | — | 534 | — | 343 | 2,324 | 2,667 | 43 | 242 | 491 | 2,281 | 2,624 | |
All-in sustaining costs per ounce - $/oz (1) | 1,581 | 1,807 | 2,198 | — | 1,805 | — | 951 | 1,657 | 1,566 | 2,894 | 1,615 | 1,710 | 1,634 | 1,544 | |
All-in costs per ounce - $/oz (1) | 1,616 | 2,231 | 2,325 | — | 2,066 | — | 1,074 | 1,895 | 1,790 | 3,949 | 1,927 | 1,901 | 1,857 | 1,754 | |
Rounding of figures may result in computational discrepancies. | |||||||||||||||
QUARTER 4 2024 EARNINGS RELEASE | 56 | | |||
| ||||||
NON-GAAP DISCLOSURE I NOTE A | ||||||
TOTAL CASH COSTS | FOR THE YEAR ENDED 31 DECEMBER 2023 | |||||||||||||
AFRICA | AUSTRALIA | |||||||||||||
Corporate and other (3) | Kibali | Other | Non-managed joint ventures | Iduapriem | Obuasi | Siguiri | Geita | Africa other | Managed operations | Sunrise Dam | Tropicana | Australia other | Australia | |
in US Dollar million, except as otherwise noted | ||||||||||||||
Cost of sales per segmental information (2) | 4 | 372 | — | 372 | 387 | 313 | 473 | 566 | — | 1,739 | 399 | 438 | 30 | 867 |
- By-product revenue | — | (2) | — | (2) | — | (1) | — | (2) | — | (3) | (1) | (3) | — | (4) |
- Inventory change | — | 2 | — | 2 | (2) | 4 | 1 | 5 | (1) | 7 | (6) | 14 | — | 8 |
- Amortisation of tangible assets | (3) | (98) | — | (98) | (126) | (61) | (39) | (68) | — | (294) | (43) | (97) | — | (140) |
- Amortisation of right of use assets | (1) | (1) | — | (1) | (3) | — | — | (23) | — | (26) | (15) | (7) | (1) | (23) |
- Amortisation of intangible assets | (1) | — | — | — | — | — | — | — | — | — | — | — | — | — |
- Rehabilitation and other non-cash costs | 1 | 2 | — | 2 | (3) | (6) | (6) | (1) | — | (16) | (1) | (2) | (1) | (4) |
- Retrenchment costs | — | — | — | — | — | — | — | — | — | — | — | — | — | — |
Total cash costs (5) | — | 275 | — | 275 | 253 | 249 | 429 | 477 | (1) | 1,407 | 333 | 343 | 28 | 704 |
Gold produced - oz (000) | — | 343 | — | 343 | 268 | 224 | 260 | 485 | — | 1,237 | 252 | 310 | — | 562 |
Total cash costs per ounce - $/oz (1) | 802 | — | 802 | 943 | 1,114 | 1,650 | 984 | — | 1,138 | 1,318 | 1,105 | — | 1,251 | |
Rounding of figures may result in computational discrepancies. | ||||||||||||||
QUARTER 4 2024 EARNINGS RELEASE | 57 | | |||
| ||||||
NON-GAAP DISCLOSURE I NOTE A | ||||||
TOTAL CASH COSTS | FOR THE YEAR ENDED 31 DECEMBER 2023 | ||||||||||||||
AMERICAS | GROUP | ADJUSTED TO EXCLUDE THE CÓRREGO do SITIO OPERATION | |||||||||||||
Cerro Vanguardia | AngloGold Ashanti Mineração | Serra Grande | Americas other | Americas | Projects | Non-managed joint ventures | Managed operations | Group total (4) | Córrego do Sítio | AngloGold Ashanti Mineração(6) | Americas(6) | Managed operations (6) | Group total (4)(6) | ||
in US Dollar million, except as otherwise noted | |||||||||||||||
Cost of sales per segmental information (2) | 307 | 453 | 169 | 2 | 931 | — | 372 | 3,541 | 3,913 | 104 | 349 | 827 | 3,437 | 3,809 | |
- By-product revenue | (93) | (2) | — | — | (95) | — | (2) | (102) | (104) | — | (2) | (95) | (102) | (104) | |
- Inventory change | (2) | (2) | — | 1 | (3) | — | 2 | 12 | 14 | (2) | — | (1) | 14 | 16 | |
- Amortisation of tangible assets | (39) | (66) | (37) | — | (142) | — | (98) | (579) | (677) | (3) | (63) | (139) | (576) | (674) | |
- Amortisation of right of use assets | — | (22) | (6) | — | (28) | — | (1) | (78) | (79) | (3) | (19) | (25) | (75) | (76) | |
- Amortisation of intangible assets | — | — | — | — | — | — | — | (1) | (1) | — | — | — | (1) | (1) | |
- Rehabilitation and other non-cash costs | (1) | (4) | 3 | (1) | (3) | — | 2 | (22) | (20) | (3) | (1) | — | (19) | (17) | |
- Retrenchment costs | — | (2) | (1) | (1) | (4) | — | — | (4) | (4) | — | (2) | (4) | (4) | (4) | |
Total cash costs (5) | 172 | 355 | 128 | 1 | 656 | — | 275 | 2,767 | 3,042 | 93 | 262 | 563 | 2,674 | 2,949 | |
Gold produced - oz (000) | 164 | 294 | 86 | — | 544 | — | 343 | 2,343 | 2,686 | 42 | 252 | 502 | 2,301 | 2,644 | |
Total cash costs per ounce - $/oz (1) | 1,045 | 1,210 | 1,498 | — | 1,207 | — | 802 | 1,181 | 1,133 | 2,217 | 1,041 | 1,122 | 1,162 | 1,115 | |
Rounding of figures may result in computational discrepancies. | |||||||||||||||
QUARTER 4 2024 EARNINGS RELEASE | 58 | | |||
| ||||||
NON-GAAP DISCLOSURE I NOTE B | ||||||
FOR THE QUARTER 4 AND FULL YEAR I 2024 AND 2023
AVERAGE GOLD PRICE RECEIVED PER OUNCE | Quarter | Quarter | Year | Year | |||||||||
ended | ended | ended | ended | ||||||||||
Dec | Dec | Dec | Dec | ||||||||||
2024 | 2023 | 2024 | 2023 | ||||||||||
Unaudited | Unaudited | Unaudited | Unaudited | ||||||||||
US Dollar million, except as otherwise noted | Managed operations | Non- managed joint ventures | Group (Equity) | Managed operations (1) | Non- managed joint ventures | Group (Equity) (1) | Managed operations | Non- managed joint ventures | Group (Equity) | Managed operations (1) | Non- managed joint ventures | Group (Equity) (1) | |
Gold income per income statement | 1,223 | 1,223 | 4,480 | 4,480 | |||||||||
Adjustment for CdS gold income | (4) | (4) | (84) | (84) | |||||||||
Gold income | 1,716 | 208 | 1,716 | 1,219 | 183 | 1,219 | 5,673 | 741 | 5,673 | 4,396 | 668 | 4,396 | |
Associates and joint ventures’ share of gold income | 208 | 183 | 741 | 668 | |||||||||
Gold income | 1,716 | 208 | 1,924 | 1,219 | 183 | 1,402 | 5,673 | 741 | 6,414 | 4,396 | 668 | 5,064 | |
Gold sold - oz (000) | 647 | 78 | 725 | 619 | 92 | 711 | 2,370 | 309 | 2,679 | 2,281 | 343 | 2,624 | |
Average gold price received per ounce - $/oz | 2,652 | 2,662 | 2,653 | 1,969 | 1,984 | 1,971 | 2,393 | 2,401 | 2,394 | 1,927 | 1,948 | 1,930 | |
(1) Adjusted to exclude the Córrego do Sítio (“CdS”) operation which was placed on care and maintenance in August 2023. | |||||||||||||
Rounding of figures may result in computational discrepancies. | |||||||||||||
QUARTER 4 2024 EARNINGS RELEASE | 59 | | |||
| ||||||
NON-GAAP DISCLOSURE I NOTE C | ||||||
QUARTER 4 2024 AND 2023
CAPITAL EXPENDITURE | FOR THE QUARTER ENDED 31 DECEMBER 2024 | ||||||||||||||
AFRICA | AUSTRALIA | ||||||||||||||
Corporate and other | Kibali | Other | Non-managed joint ventures | Iduapriem | Obuasi | Siguiri | Geita | Sukari | Africa other | Managed operations | Sunrise Dam | Tropicana | Australia other | Australia | |
in US Dollar million, except as otherwise noted | |||||||||||||||
Sustaining capital expenditure | — | 19 | — | 19 | 28 | 34 | 26 | 52 | 20 | — | 160 | 26 | 11 | — | 37 |
Non-sustaining capital expenditure | — | 17 | — | 17 | 22 | 20 | 3 | 6 | — | — | 51 | — | 3 | — | 3 |
Capital expenditure | — | 36 | — | 36 | 50 | 54 | 29 | 58 | 20 | — | 211 | 26 | 14 | — | 40 |
CAPITAL EXPENDITURE | AMERICAS | GROUP | ADJUSTED TO EXCLUDE SUKARI | |||||||||
Cerro Vanguardia | AngloGold Ashanti Mineração | Serra Grande | Americas other | Americas | Projects | Non-managed joint ventures | Managed operations | Group total (1) | Managed operations (3) | Group total (1)(3) | ||
in US Dollar million, except as otherwise noted | ||||||||||||
Sustaining capital expenditure | 24 | 30 | 12 | — | 66 | 3 | 19 | 266 | 285 | 246 | 265 | |
Non-sustaining capital expenditure | — | — | — | — | — | 13 | 17 | 67 | 84 | 67 | 84 | |
Capital expenditure | 24 | 30 | 12 | — | 66 | 16 | 36 | 333 | 369 | 313 | 349 | |
CAPITAL EXPENDITURE | FOR THE QUARTER ENDED 31 DECEMBER 2023 | |||||||||||||
AFRICA | AUSTRALIA | |||||||||||||
Corporate and other | Kibali | Other | Non-managed joint ventures | Iduapriem | Obuasi | Siguiri | Geita | Africa other | Managed operations | Sunrise Dam | Tropicana | Australia other | Australia | |
in US Dollar million, except as otherwise noted | ||||||||||||||
Sustaining capital expenditure | 1 | 13 | — | 13 | 33 | 56 | 41 | 61 | — | 191 | 15 | 16 | — | 31 |
Non-sustaining capital expenditure | — | 10 | — | 10 | 10 | 20 | — | 3 | — | 33 | — | — | — | — |
Capital expenditure | 1 | 23 | — | 23 | 43 | 76 | 41 | 64 | — | 224 | 15 | 16 | — | 31 |
CAPITAL EXPENDITURE | AMERICAS | GROUP | ADJUSTED TO EXCLUDE CDS | ||||||||||||
Cerro Vanguardia | AngloGold Ashanti Mineração | Serra Grande | Americas other | Americas | Projects | Non-managed joint ventures | Managed operations | Group total (1) | Córrego do Sítio | AngloGold Ashanti Mineração (2) | Americas (2) | Managed operations (2) | Group total (1) (2) | ||
in US Dollar million, except as otherwise noted | |||||||||||||||
Sustaining capital expenditure | 26 | 21 | 14 | — | 61 | 11 | 13 | 295 | 308 | — | 21 | 61 | 295 | 308 | |
Non-sustaining capital expenditure | — | 2 | — | — | 2 | 4 | 10 | 39 | 49 | 2 | — | — | 37 | 47 | |
Capital expenditure | 26 | 23 | 14 | — | 63 | 15 | 23 | 334 | 357 | 2 | 21 | 61 | 332 | 355 | |
(1) Total including equity-accounted non-managed joint ventures.
(2) Adjusted to exclude the Córrego do Sítio (CdS) operation which was placed on care and maintenance in August 2023.
(3) Adjusted to exclude the Sukari operation which was acquired on 22 November 2024 as part of the Centamin acquisition.
Rounding of figures may result in computational discrepancies.
QUARTER 4 2024 EARNINGS RELEASE | 60 | | |||
| ||||||
NON-GAAP DISCLOSURE I NOTE C | ||||||
FULL YEAR 2024 AND 2023
CAPITAL EXPENDITURE | FOR THE YEAR ENDED 31 DECEMBER 2024 | ||||||||||||||
AFRICA | AUSTRALIA | ||||||||||||||
Corporate and other | Kibali | Other | Non-managed joint ventures | Iduapriem | Obuasi | Siguiri | Geita | Sukari | Africa other | Managed operations | Sunrise Dam | Tropicana | Australia other | Australia | |
in US Dollar million, except as otherwise noted | |||||||||||||||
Sustaining capital expenditure | 1 | 68 | — | 68 | 108 | 145 | 93 | 181 | 20 | — | 547 | 65 | 37 | — | 102 |
Non-sustaining capital expenditure | — | 57 | — | 57 | 61 | 57 | 9 | 15 | — | — | 142 | — | 51 | — | 51 |
Capital expenditure | 1 | 125 | — | 125 | 169 | 202 | 102 | 196 | 20 | — | 689 | 65 | 88 | — | 153 |
CAPITAL EXPENDITURE | AMERICAS | GROUP | ADJUSTED TO EXCLUDE SUKARI | |||||||||
Cerro Vanguardia | AngloGold Ashanti Mineração | Serra Grande | Americas other | Americas | Projects | Non-managed joint ventures | Managed operations | Group total (1) | Managed operations (3) | Group total (1)(3) | ||
in US Dollar million, except as otherwise noted | ||||||||||||
Sustaining capital expenditure | 71 | 98 | 40 | — | 209 | 5 | 68 | 864 | 932 | 844 | 912 | |
Non-sustaining capital expenditure | — | — | — | — | — | 33 | 57 | 226 | 283 | 226 | 283 | |
Capital expenditure | 71 | 98 | 40 | — | 209 | 38 | 125 | 1,090 | 1,215 | 1,070 | 1,195 | |
CAPITAL EXPENDITURE | FOR THE YEAR ENDED 31 DECEMBER 2023 | |||||||||||||
AFRICA | AUSTRALIA | |||||||||||||
Corporate and other | Kibali | Other | Non-managed joint ventures | Iduapriem | Obuasi | Siguiri | Geita | Africa other | Managed operations | Sunrise Dam | Tropicana | Australia other | Australia | |
in US Dollar million, except as otherwise noted | ||||||||||||||
Sustaining capital expenditure | 1 | 52 | — | 52 | 96 | 148 | 74 | 162 | — | 480 | 47 | 50 | 1 | 98 |
Non-sustaining capital expenditure | — | 33 | — | 33 | 46 | 66 | 4 | 29 | — | 145 | — | 37 | — | 37 |
Capital expenditure | 1 | 85 | — | 85 | 142 | 214 | 78 | 191 | — | 625 | 47 | 87 | 1 | 135 |
CAPITAL EXPENDITURE | AMERICAS | GROUP | ADJUSTED TO EXCLUDE CDS | ||||||||||||
Cerro Vanguardia | AngloGold Ashanti Mineração | Serra Grande | Americas other | Americas | Projects | Non-managed joint ventures | Managed operations | Group total (1) | Córrego do Sítio | AngloGold Ashanti Mineração (2) | Americas (2) | Managed operations (2) | Group total (1) (2) | ||
in US Dollar million, except as otherwise noted | |||||||||||||||
Sustaining capital expenditure | 75 | 122 | 55 | — | 252 | 11 | 52 | 842 | 894 | 19 | 103 | 233 | 823 | 875 | |
Non-sustaining capital expenditure | — | 2 | — | — | 2 | 16 | 33 | 200 | 233 | 2 | — | — | 198 | 231 | |
Capital expenditure | 75 | 124 | 55 | — | 254 | 27 | 85 | 1,042 | 1,127 | 21 | 103 | 233 | 1,021 | 1,106 | |
1,654.00 | 1,311.00 | — | |||||||||||||
(1)Total including equity-accounted non-managed joint ventures.
(2) All financial periods within the year ended 31 December 2023 have been adjusted to exclude the Córrego do Sítio (CdS) operation which was placed on care and maintenance in August 2023.
(3) Adjusted to exclude the Sukari operation which was acquired on 22 November 2024 as part of the Centamin acquisition.
Rounding of figures may result in computational discrepancies.
QUARTER 4 2024 EARNINGS RELEASE | 61 | | |||
| ||||||
NON-GAAP DISCLOSURE I NOTE D | ||||||
ADJUSTED EBITDA | Quarter | Quarter | Year | Year |
ended | ended | ended | ended | |
Dec | Dec | Dec | Dec | |
2024 | 2023 | 2024 | 2023 | |
US Dollar million, except as otherwise noted | Unaudited | Unaudited | Unaudited | Unaudited |
Adjusted EBITDA (1) | ||||
Profit before taxation | 698 | 144 | 1,672 | 63 |
Add back: | ||||
Finance costs and unwinding of obligations | 41 | 44 | 167 | 157 |
Finance income | (38) | (35) | (160) | (127) |
Amortisation of tangible, right of use and intangible assets | 238 | 197 | 752 | 658 |
Other amortisation | (4) | 4 | (3) | 3 |
Associates and joint ventures share of amortisation, interest, taxation and other | 109 | 59 | 307 | 202 |
EBITDA | 1,044 | 413 | 2,735 | 956 |
Adjustments: | ||||
Foreign exchange and fair value adjustments | (68) | 48 | 1 | 170 |
Care and maintenance costs | (28) | 36 | 51 | 52 |
Retrenchment and related costs | 8 | 12 | 17 | 19 |
Reversal of impairment (net impairment), (derecognition of assets) and profit (loss) on disposal | (72) | 65 | (58) | 221 |
Joint ventures share of costs | — | — | 1 | 2 |
Adjusted EBITDA | 884 | 574 | 2,747 | 1,420 |
(1) EBITDA (as adjusted) and prepared in terms of the formula set out in the Revolving Credit Agreements. | ||||
Rounding of figures may result in computational discrepancies. | ||||
QUARTER 4 2024 EARNINGS RELEASE | 62 | | |||
| ||||||
NON-GAAP DISCLOSURE I NOTE E | ||||||
ADJUSTED NET DEBT(1) | As at | As at | ||
Dec | Dec | |||
2024 | 2023 | |||
US Dollar million, except as otherwise noted | Unaudited | Unaudited | ||
Borrowings - non-current portion | 1,901 | 2,032 | ||
Borrowings - current portion | 83 | 207 | ||
Lease liabilities - non-current portion | 65 | 98 | ||
Lease liabilities - current portion | 76 | 73 | ||
Total borrowings | 2,125 | 2,410 | ||
Less cash and cash equivalents, net of bank overdraft | (1,397) | (955) | ||
Net debt | 728 | 1,455 | ||
Adjustments: | ||||
IFRS16 lease adjustments | (126) | (149) | ||
Unamortised portion of borrowing costs | 26 | 30 | ||
Cash restricted for use | (61) | (68) | ||
Adjusted net debt | 567 | 1,268 | ||
Adjusted net debt to Adjusted EBITDA ratio | 0.21 | 0.89 | ||
Total borrowings to profit before taxation | 1.27 | 38.25 | ||
(1) Net debt (as adjusted) and prepared in terms of the formula set out in the Revolving Credit Agreements. | ||||
Rounding of figures may result in computational discrepancies. | ||||
QUARTER 4 2024 EARNINGS RELEASE | 63 | | |||
| ||||||
NON-GAAP DISCLOSURE I NOTE F | ||||||
FREE CASH FLOW | Quarter | Quarter | Year | Year | ||
ended | ended | ended | ended | |||
Dec | Dec | Dec | Dec | |||
2024 | 2023 | 2024 | 2023 | |||
US Dollar million, except as otherwise noted | Unaudited | Unaudited | Unaudited | Unaudited | ||
Cash generated from operations(1) | 713 | 306 | 2,063 | 871 | ||
Dividends received from joint ventures | 44 | 94 | 88 | 180 | ||
Taxation refund | — | 36 | 6 | 36 | ||
Taxation paid | (67) | (32) | (189) | (116) | ||
Net cash inflow from operating activities | 690 | 404 | 1,968 | 971 | ||
Corporate restructuring costs | — | 238 | 2 | 268 | ||
Capital expenditure on tangible and intangible assets | (333) | (334) | (1,090) | (1,042) | ||
Net cash from operating activities after capital expenditure | 357 | 308 | 880 | 197 | ||
Repayment of lease liabilities | (23) | (27) | (91) | (94) | ||
Finance costs accrued and capitalised | (33) | (37) | (139) | (132) | ||
Net cash flow after capital expenditure and interest | 301 | 244 | 650 | (29) | ||
Repayment of loans advanced to joint ventures | 10 | — | 149 | — | ||
Other net cash inflow from investing activities | 42 | 47 | 113 | 125 | ||
Other | 26 | 2 | 35 | 4 | ||
Add backs: | ||||||
Cash restricted for use | 10 | — | (5) | 9 | ||
Free cash flow(2) | 389 | 293 | 942 | 109 | ||
(1) Includes working capital movements as per table below. | ||||||
(2) Free cash flow has been adjusted to exclude corporate restructuring costs and Centamin acquisition costs. | ||||||
(Increase) decrease in inventories | (55) | (21) | (78) | (58) | ||
(Increase) decrease in trade receivables | (61) | 29 | (182) | (117) | ||
Increase (decrease) in trade payables | (7) | 74 | 6 | 82 | ||
Movement in working capital | (123) | 82 | (254) | (93) | ||
Rounding of figures may result in computational discrepancies. | ||||||
QUARTER 4 2024 EARNINGS RELEASE | 64 | | |||
| ||||||
OTHER INFORMATION I EXCHANGE RATES | ||||||
EXCHANGE RATES | Dec | Dec | |
2024 | 2023 | ||
Unaudited | Unaudited | ||
ZAR/USD | |||
Average for the year to date | 18.32 | 18.45 | |
Average for the quarter | 17.89 | 18.73 | |
Closing | 18.85 | 18.28 | |
AUD/USD | |||
Average for the year to date | 1.52 | 1.51 | |
Average for the quarter | 1.53 | 1.54 | |
Closing | 1.62 | 1.47 | |
BRL/USD | |||
Average for the year to date | 5.39 | 5.00 | |
Average for the quarter | 5.83 | 4.96 | |
Closing | 6.19 | 4.84 | |
ARS/USD | |||
Average for the year to date | 916.78 | 293.67 | |
Average for the quarter | 1,000.92 | 438.18 | |
Closing | 1,032.50 | 808.48 | |
QUARTER 4 2024 EARNINGS RELEASE | 65 | | |||
| ||||||
OPERATING RESULTS I OPERATIONS AT A GLANCE | ||||||
QUARTER 4 2024 AND 2023
OPERATIONS AT A GLANCE | FOR THE QUARTERS ENDED 31 DECEMBER 2024 AND 31 DECEMBER 2023 | |||||||||||||||
Gold production oz (000) | Open-pit treated 000 tonnes | Underground milled / treated 000 tonnes | Other milled / treated 000 tonnes | Open-pit recovered grade g/tonne | Underground recovered grade g/tonne | Other recovered grade g/tonne | Total recovered grade g/tonne | |||||||||
Dec-24 | Dec-23 | Dec-24 | Dec-23 | Dec-24 | Dec-23 | Dec-24 | Dec-23 | Dec-24 | Dec-23 | Dec-24 | Dec-23 | Dec-24 | Dec-23 | Dec-24 | Dec-23 | |
AFRICA Non-managed joint ventures | 80 | 93 | 577 | 478 | 394 | 433 | — | — | 1.13 | 1.72 | 4.64 | 4.76 | — | — | 2.55 | 3.17 |
Kibali - Attributable 45% (1) | 80 | 93 | 577 | 478 | 394 | 433 | — | — | 1.13 | 1.72 | 4.64 | 4.76 | — | — | 2.55 | 3.17 |
AFRICA Managed operations | 360 | 348 | 5,863 | 5,401 | 1,080 | 1,117 | 434 | 86 | 1.03 | 1.11 | 4.77 | 4.24 | 0.07 | 1.15 | 1.52 | 1.64 |
Iduapriem | 50 | 79 | 1,422 | 1,516 | — | — | — | — | 1.09 | 1.61 | — | — | — | — | 1.09 | 1.61 |
Obuasi | 60 | 61 | — | — | 301 | 285 | 11 | 86 | — | — | 6.21 | 6.30 | 1.02 | 1.15 | 6.01 | 5.10 |
Siguiri (4) | 74 | 66 | 2,938 | 3,177 | — | — | — | — | 0.78 | 0.65 | — | — | — | — | 0.78 | 0.65 |
Geita | 136 | 142 | 740 | 708 | 686 | 832 | — | — | 1.85 | 2.10 | 4.17 | 3.53 | — | — | 2.97 | 2.87 |
Sukari (4) | 40 | — | 763 | — | 93 | — | 423 | — | 1.04 | — | 4.52 | — | 0.05 | — | 0.97 | — |
AUSTRALIA | 166 | 158 | 1,603 | 1,616 | 977 | 1,002 | — | — | 1.52 | 1.64 | 2.80 | 2.24 | — | — | 2.00 | 1.87 |
Sunrise Dam | 66 | 62 | 331 | 377 | 622 | 631 | — | — | 1.25 | 1.25 | 2.63 | 2.31 | — | — | 2.15 | 1.91 |
Tropicana - Attributable 70% | 100 | 96 | 1,272 | 1,239 | 355 | 371 | — | — | 1.59 | 1.76 | 3.09 | 2.13 | — | — | 1.92 | 1.85 |
AMERICAS (2) | 144 | 139 | 303 | 215 | 627 | 486 | 676 | 807 | 2.49 | 2.25 | 4.72 | 4.46 | 1.14 | 2.07 | 2.79 | 2.87 |
Cerro Vanguardia (4) | 47 | 41 | 218 | 192 | 122 | 135 | 596 | 467 | 2.91 | 2.35 | 5.44 | 5.04 | 0.27 | 0.32 | 1.56 | 1.62 |
AngloGold Ashanti Mineração (2) (3) | 75 | 73 | — | — | 245 | 84 | 80 | 340 | — | — | 7.01 | 9.00 | 7.59 | 4.47 | 7.15 | 5.37 |
Serra Grande | 22 | 25 | 85 | 23 | 260 | 267 | — | — | 1.39 | 1.39 | 2.21 | 2.74 | — | — | 2.01 | 2.63 |
Managed operations (2) | 670 | 645 | 7,769 | 7,232 | 2,684 | 2,605 | 1,110 | 894 | 1.19 | 1.26 | 4.04 | 3.51 | 0.72 | 1.98 | 1.80 | 1.87 |
Non-managed joint ventures | 80 | 93 | 577 | 478 | 394 | 433 | — | — | 1.13 | 1.72 | 4.64 | 4.76 | — | — | 2.55 | 3.17 |
Group total including equity-accounted non-managed joint ventures (2) | 750 | 738 | 8,346 | 7,710 | 3,078 | 3,038 | 1,110 | 894 | 1.18 | 1.29 | 4.11 | 3.69 | 0.72 | 1.98 | 1.86 | 1.97 |
Managed operations (excluding Sukari) | 630 | 645 | 7,006 | 7,232 | 2,591 | 2,605 | 687 | 894 | 1.20 | 1.26 | 4.02 | 3.51 | 1.14 | 1.98 | 1.91 | 1.87 |
Non-managed joint ventures | 80 | 93 | 577 | 478 | 394 | 433 | — | — | 1.13 | 1.72 | 4.64 | 4.76 | — | — | 2.55 | 3.17 |
Group total including equity-accounted non-managed joint ventures (excluding Sukari) (2) | 710 | 738 | 7,583 | 7,710 | 2,985 | 3,038 | 687 | 894 | 1.20 | 1.29 | 4.10 | 3.69 | 1.14 | 1.98 | 1.96 | 1.97 |
(1) Equity-accounted joint venture. | ||||||||||||||||
(2) Adjusted to exclude the Córrego do Sítio (CdS) operation which was placed on care and maintenance in August 2023. | ||||||||||||||||
(3) Includes gold concentrate from the Cuiabá mine sold to third parties. | ||||||||||||||||
(4) On a consolidated basis. Siguiri, Sukari and Cerro Vanguardia are owned 85%, 50% and 92.50% by AngloGold Ashanti, respectively. | ||||||||||||||||
Rounding of figures may result in computational discrepancies. | ||||||||||||||||
During the financial year ended 31 December 2024, AngloGold Ashanti’s reporting for managed operations shifted from an attributable basis of reporting to a consolidated basis of reporting. The change in reporting only impacts managed operations with non-controlling interests (i.e., Siguiri, Cerro Vanguardia and Sukari), whereas joint operations (i.e., Tropicana), which are proportionately consolidated, remain unaffected. Non-managed joint ventures (i.e., Kibali), which are accounted for under the equity method, also remain unaffected and their gold production, related unit revenue and cost metrics continue to be reported on an attributable basis. As a result of this change in reporting, certain adjustments to exclude non-controlling interests on gold production, related unit revenue and cost metrics have been discontinued. The metrics for the three months and year ended 31 December 2023 have been adjusted to reflect this change in reporting. | ||||||||||||||||
QUARTER 4 2024 EARNINGS RELEASE | 66 | | |||
| ||||||
FINANCIAL RESULTS I OPERATIONS AT A GLANCE | ||||||
QUARTER 4 2024 AND 2023
OPERATIONS AT A GLANCE | FOR THE QUARTERS ENDED 31 DECEMBER 2024 AND 31 DECEMBER 2023 | |||||||||||||
Cost of sales | Gross profit | Total cash costs per ounce* | All-in sustaining costs per ounce* | Sustaining MRD / Stripping capital | Other sustaining capital | Non-sustaining capital* | ||||||||
$m | $m | $/oz | $/oz | $m | $m | $m | ||||||||
Dec-24 | Dec-23 | Dec-24 | Dec-23 | Dec-24 | Dec-23 | Dec-24 | Dec-23 | Dec-24 | Dec-23 | Dec-24 | Dec-23 | Dec-24 | Dec-23 | |
AFRICA Non-managed joint ventures | 101 | 94 | 107 | 90 | 967 | 761 | 1,188 | 907 | 5 | 3 | 14 | 10 | 17 | 10 |
Kibali - Attributable 45% (1) | 101 | 94 | 107 | 90 | 967 | 761 | 1,188 | 907 | 5 | 3 | 14 | 10 | 17 | 10 |
AFRICA Managed operations | 557 | 458 | 351 | 201 | 1,225 | 1,076 | 1,780 | 1,729 | 73 | 86 | 87 | 105 | 51 | 33 |
Iduapriem | 91 | 104 | 34 | 47 | 1,478 | 962 | 2,131 | 1,407 | 17 | 24 | 11 | 9 | 22 | 10 |
Obuasi | 101 | 81 | 57 | 33 | 1,169 | 1,040 | 1,905 | 2,081 | 21 | 23 | 13 | 33 | 20 | 20 |
Siguiri (4) | 134 | 134 | 48 | (2) | 1,747 | 1,693 | 2,186 | 2,397 | 7 | 12 | 19 | 29 | 3 | — |
Geita | 148 | 139 | 176 | 123 | 892 | 868 | 1,327 | 1,423 | 16 | 27 | 36 | 34 | 6 | 3 |
Sukari (4) | 83 | — | 36 | — | 1,165 | — | 1,858 | — | 12 | — | 8 | — | — | — |
Administration and other | — | — | — | — | — | — | — | — | — | — | — | — | — | — |
AUSTRALIA | 259 | 237 | 184 | 58 | 1,171 | 1,177 | 1,465 | 1,478 | 18 | 18 | 19 | 13 | 3 | — |
Sunrise Dam | 114 | 103 | 63 | 21 | 1,406 | 1,314 | 1,888 | 1,696 | 14 | 9 | 12 | 6 | — | — |
Tropicana - Attributable 70% | 135 | 126 | 131 | 44 | 924 | 1,015 | 1,086 | 1,228 | 4 | 9 | 7 | 7 | 3 | — |
Administration and other | 10 | 8 | (10) | (7) | — | — | — | — | — | — | — | — | — | — |
AMERICAS (2) | 230 | 231 | 169 | 72 | 1,035 | 1,017 | 1,574 | 1,542 | 39 | 34 | 27 | 27 | — | 2 |
Cerro Vanguardia (4) | 99 | 83 | 47 | 31 | 1,155 | 943 | 1,811 | 1,660 | 11 | 12 | 13 | 14 | — | — |
AngloGold Ashanti Mineração (2) (3) | 98 | 103 | 98 | 36 | 859 | 957 | 1,344 | 1,343 | 22 | 16 | 8 | 5 | — | 2 |
Serra Grande | 32 | 45 | 25 | 5 | 1,338 | 1,307 | 1,842 | 1,925 | 6 | 6 | 6 | 8 | — | — |
Administration and other | 1 | — | (1) | — | — | — | — | — | — | — | — | — | — | — |
PROJECTS | — | — | — | — | — | — | — | — | — | — | 3 | 11 | 13 | 4 |
Colombian projects | — | — | — | — | — | — | — | — | — | — | — | — | 8 | 4 |
North American projects | — | — | — | — | — | — | — | — | — | — | 3 | 11 | 5 | — |
CORPORATE AND OTHER | (3) | 3 | 3 | (4) | — | — | — | — | — | — | — | 1 | — | — |
Managed operations (2) | 1,043 | 929 | 707 | 327 | 1,165 | 1,092 | 1,702 | 1,701 | 130 | 138 | 136 | 157 | 67 | 39 |
Non-managed joint ventures | 101 | 94 | 107 | 90 | 967 | 761 | 1,188 | 907 | 5 | 3 | 14 | 10 | 17 | 10 |
Group total including equity-accounted non-managed joint ventures (2) | 1,144 | 1,023 | 814 | 417 | 1,144 | 1,050 | 1,647 | 1,598 | 135 | 141 | 150 | 167 | 84 | 49 |
Managed operations (excluding Sukari) | 960 | 929 | 671 | 327 | 1,165 | 1,092 | 1,691 | 1,701 | 118 | 138 | 128 | 157 | 67 | 39 |
Non-managed joint ventures | 101 | 94 | 107 | 90 | 967 | 761 | 1,188 | 907 | 5 | 3 | 14 | 10 | 17 | 10 |
Group total including equity-accounted non-managed joint ventures (excluding Sukari) (2) | 1,061 | 1,023 | 778 | 417 | 1,143 | 1,050 | 1,633 | 1,598 | 123 | 141 | 142 | 167 | 84 | 49 |
(1) Equity-accounted joint venture. | ||||||||||||||
(2) Adjusted to exclude the Córrego do Sítio (CdS) operation which was placed on care and maintenance in August 2023. | ||||||||||||||
(3) Includes gold concentrate from the Cuiabá mine sold to third parties. | ||||||||||||||
(4) On a consolidated basis. Siguiri, Sukari and Cerro Vanguardia are owned 85%, 50% and 92.50% by AngloGold Ashanti, respectively. | ||||||||||||||
* Refer to “Non-GAAP disclosure” for definitions and reconciliations. | ||||||||||||||
Rounding of figures may result in computational discrepancies. | ||||||||||||||
QUARTER 4 2024 EARNINGS RELEASE | 67 | | |||
| ||||||
OPERATING RESULTS I OPERATIONS AT A GLANCE | ||||||
FULL YEAR 2024 AND 2023
OPERATIONS AT A GLANCE | FOR THE YEARS ENDED 31 DECEMBER 2024 AND 31 DECEMBER 2023 | |||||||||||||||
Gold production oz (000) | Open-pit treated 000 tonnes | Underground milled / treated 000 tonnes | Other milled / treated 000 tonnes | Open-pit recovered grade g/tonne | Underground recovered grade g/tonne | Other recovered grade g/tonne | Total recovered grade g/tonne | |||||||||
Dec-24 | Dec-23 | Dec-24 | Dec-23 | Dec-24 | Dec-23 | Dec-24 | Dec-23 | Dec-24 | Dec-23 | Dec-24 | Dec-23 | Dec-24 | Dec-23 | Dec-24 | Dec-23 | |
AFRICA Non-managed joint ventures | 309 | 343 | 2,229 | 2,065 | 1,598 | 1,635 | — | — | 0.99 | 1.58 | 4.63 | 4.54 | — | — | 2.51 | 2.89 |
Kibali - Attributable 45% (1) | 309 | 343 | 2,229 | 2,065 | 1,598 | 1,635 | — | — | 0.99 | 1.58 | 4.63 | 4.54 | — | — | 2.51 | 2.89 |
AFRICA Managed operations | 1,254 | 1,237 | 20,083 | 19,190 | 3,879 | 3,709 | 564 | 261 | 1.06 | 1.15 | 4.54 | 4.36 | 0.29 | 1.05 | 1.59 | 1.66 |
Iduapriem | 237 | 268 | 5,410 | 5,430 | — | — | — | — | 1.36 | 1.54 | — | — | — | — | 1.36 | 1.54 |
Obuasi | 221 | 224 | — | — | 1,144 | 1,017 | 141 | 261 | — | — | 5.89 | 6.58 | 0.99 | 1.05 | 5.35 | 5.45 |
Siguiri (4) | 273 | 260 | 11,103 | 10,972 | — | — | — | — | 0.76 | 0.74 | — | — | — | — | 0.76 | 0.74 |
Geita | 483 | 485 | 2,807 | 2,788 | 2,642 | 2,692 | — | — | 1.64 | 2.01 | 3.95 | 3.52 | — | — | 2.76 | 2.75 |
Sukari (4) | 40 | — | 763 | — | 93 | — | 423 | — | 1.04 | — | 4.52 | — | 0.05 | — | 0.97 | — |
AUSTRALIA | 572 | 562 | 6,427 | 6,731 | 3,709 | 3,808 | — | — | 1.19 | 1.21 | 2.73 | 2.45 | — | — | 1.75 | 1.66 |
Sunrise Dam | 259 | 252 | 1,494 | 1,390 | 2,399 | 2,512 | — | — | 1.18 | 1.31 | 2.62 | 2.40 | — | — | 2.07 | 2.01 |
Tropicana - Attributable 70% | 313 | 310 | 4,933 | 5,341 | 1,310 | 1,296 | — | — | 1.20 | 1.18 | 2.93 | 2.56 | — | — | 1.56 | 1.45 |
AMERICAS (2) | 526 | 502 | 956 | 880 | 1,999 | 2,028 | 2,785 | 2,880 | 2.27 | 2.17 | 4.40 | 3.82 | 1.94 | 2.07 | 2.85 | 2.70 |
Cerro Vanguardia (4) | 175 | 164 | 814 | 808 | 439 | 449 | 2,020 | 1,779 | 2.44 | 2.25 | 5.72 | 5.80 | 0.48 | 0.39 | 1.67 | 1.68 |
AngloGold Ashanti Mineração (2) (3) | 271 | 252 | — | — | 663 | 526 | 765 | 1,101 | — | — | 6.02 | 4.91 | 5.80 | 4.78 | 5.90 | 4.82 |
Serra Grande | 80 | 86 | 142 | 72 | 897 | 1,053 | — | — | 1.30 | 1.27 | 2.56 | 2.44 | — | — | 2.39 | 2.37 |
Managed operations (2) | 2,352 | 2,301 | 27,466 | 26,801 | 9,587 | 9,545 | 3,349 | 3,140 | 1.13 | 1.20 | 3.81 | 3.48 | 1.66 | 1.98 | 1.81 | 1.81 |
Non-managed joint ventures | 309 | 343 | 2,229 | 2,065 | 1,598 | 1,635 | — | — | 0.99 | 1.58 | 4.63 | 4.54 | — | — | 2.51 | 2.89 |
Group total including equity-accounted non-managed joint ventures (2) | 2,661 | 2,644 | 29,695 | 28,866 | 11,185 | 11,180 | 3,349 | 3,140 | 1.12 | 1.22 | 3.93 | 3.64 | 1.66 | 1.98 | 1.87 | 1.90 |
Managed operations (excluding Sukari) | 2,312 | 2,301 | 26,703 | 26,801 | 9,494 | 9,545 | 2,926 | 3,140 | 1.13 | 1.20 | 3.80 | 3.48 | 1.90 | 1.98 | 1.84 | 1.81 |
Non-managed joint ventures | 309 | 343 | 2,229 | 2,065 | 1,598 | 1,635 | — | — | 0.99 | 1.58 | 4.63 | 4.54 | — | — | 2.51 | 2.89 |
Group total including equity-accounted non-managed joint ventures (excluding Sukari) (2) | 2,621 | 2,644 | 28,932 | 28,866 | 11,092 | 11,180 | 2,926 | 3,140 | 1.12 | 1.22 | 3.92 | 3.64 | 1.90 | 1.98 | 1.90 | 1.90 |
(1) Equity-accounted joint venture. | ||||||||||||||||
(2) Adjusted to exclude the Córrego do Sítio (CdS) operation which was placed on care and maintenance in August 2023. | ||||||||||||||||
(3) Includes gold concentrate from the Cuiabá mine sold to third parties. | ||||||||||||||||
(4) On a consolidated basis. Siguiri, Sukari and Cerro Vanguardia are owned 85%, 50% and 92.50% by AngloGold Ashanti, respectively. | ||||||||||||||||
Rounding of figures may result in computational discrepancies. | ||||||||||||||||
QUARTER 4 2024 EARNINGS RELEASE | 68 | | |||
| ||||||
FINANCIAL RESULTS I OPERATIONS AT A GLANCE | ||||||
FULL YEAR 2024 AND 2023
OPERATIONS AT A GLANCE | FOR THE YEARS ENDED 31 DECEMBER 2024 AND 31 DECEMBER 2023 | |||||||||||||
Cost of sales | Gross profit | Total cash costs per ounce* | All-in sustaining costs per ounce* | Sustaining MRD / Stripping capital | Other sustaining capital | Non-sustaining capital* | ||||||||
$m | $m | $/oz | $/oz | $m | $m | $m | ||||||||
Dec-24 | Dec-23 | Dec-24 | Dec-23 | Dec-24 | Dec-23 | Dec-24 | Dec-23 | Dec-24 | Dec-23 | Dec-24 | Dec-23 | Dec-24 | Dec-23 | |
AFRICA Non-managed joint ventures | 380 | 372 | 363 | 297 | 935 | 802 | 1,146 | 951 | 32 | 17 | 36 | 35 | 57 | 33 |
Kibali - Attributable 45% (1) | 380 | 372 | 363 | 297 | 935 | 802 | 1,146 | 951 | 32 | 17 | 36 | 35 | 57 | 33 |
AFRICA Managed operations | 1,924 | 1,739 | 1,096 | 664 | 1,212 | 1,138 | 1,709 | 1,576 | 333 | 273 | 214 | 207 | 142 | 145 |
Iduapriem | 351 | 387 | 213 | 135 | 1,118 | 943 | 1,614 | 1,329 | 85 | 77 | 23 | 19 | 61 | 46 |
Obuasi | 360 | 313 | 171 | 127 | 1,214 | 1,114 | 1,942 | 1,777 | 98 | 87 | 47 | 61 | 57 | 66 |
Siguiri (4) | 518 | 473 | 136 | 31 | 1,703 | 1,650 | 2,093 | 1,976 | 28 | 21 | 65 | 53 | 9 | 4 |
Geita | 612 | 566 | 540 | 370 | 984 | 984 | 1,418 | 1,403 | 110 | 88 | 71 | 74 | 15 | 29 |
Sukari (4) | 83 | — | 36 | — | 1,165 | — | 1,858 | — | 12 | — | 8 | — | — | — |
Administration and other | — | — | — | 1 | — | — | — | — | — | — | ||||
AUSTRALIA | 945 | 867 | 453 | 220 | 1,287 | 1,251 | 1,526 | 1,487 | 53 | 54 | 49 | 44 | 51 | 37 |
Sunrise Dam | 430 | 399 | 197 | 99 | 1,343 | 1,318 | 1,665 | 1,583 | 36 | 21 | 29 | 26 | — | — |
Tropicana - Attributable 70% | 479 | 438 | 292 | 151 | 1,132 | 1,105 | 1,297 | 1,304 | 17 | 33 | 20 | 17 | 51 | 37 |
Administration and other | 36 | 30 | (36) | (30) | — | — | — | 1 | — | — | ||||
AMERICAS (2) | 858 | 931 | 517 | 162 | 1,027 | 1,122 | 1,514 | 1,710 | 143 | 160 | 66 | 92 | — | 2 |
Cerro Vanguardia (4) | 368 | 307 | 180 | 102 | 1,073 | 1,045 | 1,544 | 1,581 | 38 | 41 | 33 | 34 | — | — |
AngloGold Ashanti Mineração (2) (3) | 352 | 453 | 283 | 63 | 876 | 1,041 | 1,334 | 1,615 | 78 | 85 | 20 | 37 | — | 2 |
Serra Grande | 136 | 169 | 56 | (2) | 1,411 | 1,498 | 2,039 | 2,198 | 27 | 34 | 13 | 21 | — | — |
Administration and other | 2 | 2 | (2) | (1) | — | — | — | — | — | — | ||||
PROJECTS | — | — | — | — | — | — | — | — | — | — | 5 | 11 | 33 | 16 |
Colombian projects | — | — | — | — | — | — | — | — | — | — | — | — | 13 | 11 |
North American projects | — | — | — | — | — | — | — | — | — | — | 5 | 11 | 20 | 5 |
CORPORATE AND OTHER | (1) | 4 | 1 | (5) | — | — | 1 | 1 | — | — | ||||
Managed operations (2) | 3,726 | 3,541 | 2,067 | 1,041 | 1,187 | 1,162 | 1,672 | 1,634 | 529 | 487 | 335 | 355 | 226 | 200 |
Non-managed joint ventures | 380 | 372 | 363 | 297 | 935 | 802 | 1,146 | 951 | 32 | 17 | 36 | 35 | 57 | 33 |
Group total including equity-accounted non-managed joint ventures (2) | 4,106 | 3,913 | 2,430 | 1,338 | 1,157 | 1,115 | 1,611 | 1,544 | 561 | 504 | 371 | 390 | 283 | 233 |
Managed operations (excluding Sukari) | 3,643 | 3,541 | 2,031 | 1,041 | 1,187 | 1,162 | 1,668 | 1,634 | 517 | 487 | 327 | 355 | 226 | 200 |
Non-managed joint ventures | 380 | 372 | 363 | 297 | 935 | 802 | 1,146 | 951 | 32 | 17 | 36 | 35 | 57 | 33 |
Total including equity-accounted non-managed joint ventures (excluding Sukari) (2) | 4,023 | 3,913 | 2,394 | 1,338 | 1,157 | 1,115 | 1,607 | 1,544 | 549 | 504 | 363 | 390 | 283 | 233 |
(1) Equity-accounted joint venture. | ||||||||||||||
(2) Adjusted to exclude the Córrego do Sítio (CdS) operation which was placed on care and maintenance in August 2023. | ||||||||||||||
(3) Includes gold concentrate from the Cuiabá mine sold to third parties. | ||||||||||||||
(4) On a consolidated basis. Siguiri, Sukari and Cerro Vanguardia are owned 85%, 50% and 92.50% by AngloGold Ashanti, respectively. | ||||||||||||||
* Refer to “Non-GAAP disclosure” for definitions and reconciliations. | ||||||||||||||
Rounding of figures may result in computational discrepancies. | ||||||||||||||
QUARTER 4 2024 EARNINGS RELEASE | 69 | | |||
| ||||||
ADMINISTRATION AND CORPORATE I INFORMATION | ||||||
AngloGold Ashanti plc Incorporated in England & Wales Registration No. 14654651 LEI No. 2138005YDSA7A82RNU96 Share codes: ISIN: GB00BRXH2664 CUSIP: G0378L100 NYSE: AU JSE: ANG A2X: ANG GhSE (Shares): AGA GhSE (GhDS): AAD JSE Sponsor: The Standard Bank of South Africa Limited Auditor: PricewaterhouseCoopers Inc. Offices Registered and Corporate 4th Floor, Communications House South Street Staines-upon-Thames Surrey TW18 4PR United Kingdom Telephone: +44 (0) 203 968 3320 Fax: +44 (0) 203 968 3325 Global headquarters 6363 S. Fiddlers Green Circle, Suite 1000 Greenwood Village, CO 80111 United States of America Telephone: +1 303 889 0700 Australia Level 10, AMP Building, 140 St George’s Terrace Perth, WA 6000 (PO Box Z5046, Perth WA 6831) Australia Telephone: +61 8 9425 4602 Fax: +61 8 9425 4662 Ghana Gold House Patrice Lumumba Road (PO Box 2665) Accra Ghana Telephone: +233 303 773400 Fax: +233 303 778155 | Directors Executive A Calderon▲º (Chief Executive Officer) GA Doran▲◊ (Chief Financial Officer) Non-Executive JE Tilk§ (Chairman) KOF Busia△ B Cleaver^* AM Ferguson* AH Garner# R Gasant^ J Magie§ N Newton-King^* DL Sands# *British §Canadian #American ▲Australian ◊Irish ^South African △Ghanaian ºColombian Officers C Stead Company Secretary Company secretarial e-mail companysecretary@anglogoldashanti.com Investor Relations contacts Yatish Chowthee Telephone: +27 11 637 6273 Mobile: +27 78 364 2080 E-mail: yrchowthee@anglogoldashanti.com Andrea Maxey Telephone: +61 08 9425 4603 Mobile: +61 400 072 199 E-mail: amaxey@anglogoldashanti.com AngloGold Ashanti website www.anglogoldashanti.com | Share Registrars United States Computershare Trust Company, N.A. 150 Royall Street Suite 101 Canton, MA 02021 United States of America Telephone US: 866-644-4127 Telephone non-US: +1-781-575-2000 Shareholder Online Inquiries: https://www-us.computershare.com/Investor/#Contact Website: www.computershare.com/investor South Africa Computershare Investor Services (Pty) Limited Rosebank Towers, 15 Biermann Avenue Rosebank, 2196 (PO Box 61051, Marshalltown 2107) South Africa Telephone: 0861 100 950 (in SA) Fax: +27 11 688 5218 E-mail: queries@computershare.co.za Website: www.computershare.com Ghana Central Securities Depository (GH) LTD 4th Floor, Cedi House PMB CT 465, Cantonments Accra, Ghana Telephone: +233 302 689313 Fax: +233 302 689315 Ghana depositary NTHC Limited 18 Gamel Abdul Nasser Avenue Ringway Estate Accra, Ghana Telephone: +233 302 235814/6 Fax: +233 302 229975 |
AngloGold Ashanti posts information that may be important to investors on the main page of its website at
www.anglogoldashanti.com and under the “Investors” tab on the main page. This information is updated
periodically. AngloGold Ashanti intends to use its website as a means of disclosing material non-public
information to the public in a broad, non-exclusionary manner and for complying with its disclosure obligations.
Accordingly, investors should visit this website regularly to obtain important information about AngloGold
Ashanti, in addition to following its press releases, documents it files with, or furnishes to, the United States
Securities and Exchange Commission (SEC) and public conference calls and webcasts. No material on the
AngloGold Ashanti website forms any part of, or is incorporated by reference into, this document. References
herein to the AngloGold Ashanti website shall not be deemed to cause such incorporation.
PUBLISHED BY ANGLOGOLD ASHANTI
FORWARD-LOOKING I STATEMENTS
Certain statements contained in this document, other than statements of historical fact, including, without limitation, those concerning the economic outlook for the gold mining industry, expectations
regarding gold prices, production, total cash costs, all-in sustaining costs, all-in costs, cost savings and other operating results, return on equity, productivity improvements, growth prospects and
outlook of AngloGold Ashanti’s operations, individually or in the aggregate, including the achievement of project milestones, commencement and completion of commercial operations of certain of
AngloGold Ashanti’s exploration and production projects and the completion of acquisitions, dispositions or joint venture transactions, AngloGold Ashanti’s liquidity and capital resources and capital
expenditures, the consequences of the COVID-19 pandemic and the outcome and consequences of any potential or pending litigation or regulatory proceedings or environmental, health and safety
issues, are forward-looking statements regarding AngloGold Ashanti’s financial reports, operations, economic performance and financial condition. These forward-looking statements or forecasts are
not based on historical facts, but rather reflect our current beliefs and expectations concerning future events and generally may be identified by the use of forward-looking words, phrases and
expressions such as “believe”, “expect”, “aim”, “anticipate”, “intend”, “foresee”, “forecast”, “predict”, “project”, “estimate”, “likely”, “may”, “might”, “could”, “should”, “would”, “seek”, “plan”, “scheduled”,
“possible”, “continue”, “potential”, “outlook”, “target” or other similar words, phrases, and expressions; provided that the absence thereof does not mean that a statement is not forward-looking. Similarly,
statements that describe our objectives, plans or goals are or may be forward-looking statements. These forward-looking statements or forecasts involve known and unknown risks, uncertainties and
other factors that may cause AngloGold Ashanti’s actual results, performance, actions or achievements to differ materially from the anticipated results, performance, actions or achievements
expressed or implied in these forward-looking statements. Although AngloGold Ashanti believes that the expectations reflected in such forward-looking statements and forecasts are reasonable, no
assurance can be given that such expectations will prove to have been correct. Accordingly, results, performance, actions or achievements could differ materially from those set out in the forward-
looking statements as a result of, among other factors, changes in economic, social, political and market conditions, including related to inflation or international conflicts, the success of business and
operating initiatives, changes in the regulatory environment and other government actions, including environmental approvals, fluctuations in gold prices and exchange rates, the outcome of pending or
future litigation proceedings, any supply chain disruptions, any public health crises, pandemics or epidemics (including the COVID-19 pandemic), the failure to maintain effective internal control over
financial reporting or effective disclosure controls and procedures, the inability to remediate one or more material weaknesses, or the discovery of additional material weaknesses, in the Company’s
internal control over financial reporting, and other business and operational risks and challenges and other factors, including mining accidents. For a discussion of such risk factors, refer to AngloGold
Ashanti’s annual report on Form 20-F for the financial year ended 31 December 2023 filed with the United States Securities and Exchange Commission (SEC). These factors are not necessarily all of the
important factors that could cause AngloGold Ashanti’s actual results, performance, actions or achievements to differ materially from those expressed in any forward-looking statements. Other
unknown or unpredictable factors could also have material adverse effects on AngloGold Ashanti’s future results, performance, actions or achievements. Consequently, readers are cautioned not to
place undue reliance on forward-looking statements. AngloGold Ashanti undertakes no obligation to update publicly or release any revisions to these forward-looking statements to reflect events or
circumstances after the date hereof or to reflect the occurrence of unanticipated events, except to the extent required by applicable law. All subsequent written or oral forward-looking statements
attributable to AngloGold Ashanti or any person acting on its behalf are qualified by the cautionary statements herein.
Non-GAAP financial measures
This communication may contain certain “Non-GAAP” financial measures. AngloGold Ashanti utilises certain Non-GAAP performance measures and ratios in managing its business. Non-GAAP financial
measures should be viewed in addition to, and not as an alternative for, the reported operating results or cash flow from operations or any other measures of performance prepared in accordance with
IFRS. In addition, the presentation of these measures may not be comparable to similarly titled measures other companies may use.
SIGNATURES
Pursuant to the requirements of the Securities Exchange Act of 1934, the registrant has
duly caused this report to be signed on its behalf by the undersigned, thereunto duly authorised.
AngloGold Ashanti plc
Date: 19 February 2025
By:/s/ C STEAD
Name:C Stead
Title:Company Secretary