
Exhibit 99.1Exhibit 99.1
Forward Looking Statements and Other Disclosures Safe Harbor Statement: Some of the Statements in this document concerning future Company performance will be forward-looking within the meanings of the securities laws. Actual results may materially differ from those discussed in these forward-looking statements, and you should refer to the additional information contained in Chesapeake Utilities Corporation’s 2018 Annual Report on Form 10-K filed with the SEC and our other SEC filings concerning factors that could cause those results to be different than contemplated in today’s discussion. REG G Disclosure: Today’s discussion includes certain non-GAAP financial measures as defined under SEC Regulation G. Although non-GAAP measures are not intended to replace the GAAP measures for evaluation of Chesapeake’s performance, Chesapeake believes that the portions of the presentation, which include certain non-GAAP financial measures, provide a helpful comparison for an investor’s evaluation purposes. Gross Margin (non-GAAP measure): Gross Margin is determined by deducting the cost of sales from operating revenue. Cost of sales includes the purchased fuel cost for natural gas, electric and propane distribution operations and the cost of labor spent on different revenue-producing activities and excludes depreciation, amortization and accretion. Other companies may calculate gross margin in a different manner. Adjusted EPS (non-GAAP measure): Diluted Earnings per share excluding the impact of certain significant new non-cash items, including, but not limited to, the following: the impact of unrealized mark-to-market (“MTM”) changes and one-time charges, such as severance charges. The Company calculates adjusted earnings” by adjusting reported (GAAP) earnings to exclude the impact of certain significant non-cash items, including the impact of unrealized MTM gains (losses), one-time charges such as severance charges, and any prior year tax savings retained by our regulated businesses as a result of current year regulatory authorizations. 2Forward Looking Statements and Other Disclosures Safe Harbor Statement: Some of the Statements in this document concerning future Company performance will be forward-looking within the meanings of the securities laws. Actual results may materially differ from those discussed in these forward-looking statements, and you should refer to the additional information contained in Chesapeake Utilities Corporation’s 2018 Annual Report on Form 10-K filed with the SEC and our other SEC filings concerning factors that could cause those results to be different than contemplated in today’s discussion. REG G Disclosure: Today’s discussion includes certain non-GAAP financial measures as defined under SEC Regulation G. Although non-GAAP measures are not intended to replace the GAAP measures for evaluation of Chesapeake’s performance, Chesapeake believes that the portions of the presentation, which include certain non-GAAP financial measures, provide a helpful comparison for an investor’s evaluation purposes. Gross Margin (non-GAAP measure): Gross Margin is determined by deducting the cost of sales from operating revenue. Cost of sales includes the purchased fuel cost for natural gas, electric and propane distribution operations and the cost of labor spent on different revenue-producing activities and excludes depreciation, amortization and accretion. Other companies may calculate gross margin in a different manner. Adjusted EPS (non-GAAP measure): Diluted Earnings per share excluding the impact of certain significant new non-cash items, including, but not limited to, the following: the impact of unrealized mark-to-market (“MTM”) changes and one-time charges, such as severance charges. The Company calculates adjusted earnings” by adjusting reported (GAAP) earnings to exclude the impact of certain significant non-cash items, including the impact of unrealized MTM gains (losses), one-time charges such as severance charges, and any prior year tax savings retained by our regulated businesses as a result of current year regulatory authorizations. 2
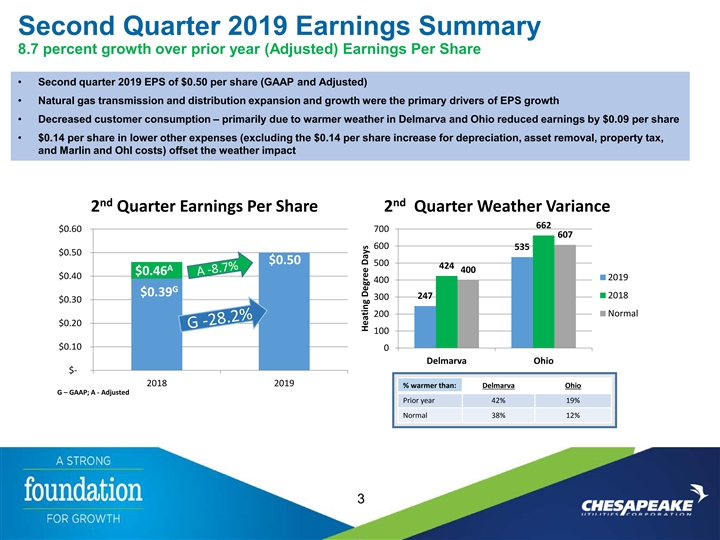
Second Quarter 2019 Earnings Summary 8.7 percent growth over prior year (Adjusted) Earnings Per Share • Second quarter 2019 EPS of $0.50 per share (GAAP and Adjusted) • Natural gas transmission and distribution expansion and growth were the primary drivers of EPS growth • Decreased customer consumption – primarily due to warmer weather in Delmarva and Ohio reduced earnings by $0.09 per share • $0.14 per share in lower other expenses (excluding the $0.14 per share increase for depreciation, asset removal, property tax, and Marlin and Ohl costs) offset the weather impact nd nd 2 Quarter Earnings Per Share 2 Quarter Weather Variance 662 $0.60 700 607 600 535 $0.50 $0.50 500 424 A 400 $0.46 $0.40 2019 400 G $0.39 2018 247 300 $0.30 200 Normal $0.20 100 $0.10 0 Delmarva Ohio $- 2018 2019 % warmer than: Delmarva Ohio G – GAAP; A - Adjusted Prior year 42% 19% Normal 38% 12% 3 Heating Degree DaysSecond Quarter 2019 Earnings Summary 8.7 percent growth over prior year (Adjusted) Earnings Per Share • Second quarter 2019 EPS of $0.50 per share (GAAP and Adjusted) • Natural gas transmission and distribution expansion and growth were the primary drivers of EPS growth • Decreased customer consumption – primarily due to warmer weather in Delmarva and Ohio reduced earnings by $0.09 per share • $0.14 per share in lower other expenses (excluding the $0.14 per share increase for depreciation, asset removal, property tax, and Marlin and Ohl costs) offset the weather impact nd nd 2 Quarter Earnings Per Share 2 Quarter Weather Variance 662 $0.60 700 607 600 535 $0.50 $0.50 500 424 A 400 $0.46 $0.40 2019 400 G $0.39 2018 247 300 $0.30 200 Normal $0.20 100 $0.10 0 Delmarva Ohio $- 2018 2019 % warmer than: Delmarva Ohio G – GAAP; A - Adjusted Prior year 42% 19% Normal 38% 12% 3 Heating Degree Days
First Half 2019 Highlights Superior Return Driven by Consistent Above Average Earnings and Dividend Growth • Greater than 15 percent total shareholder return for 3, 5, 10 & 20 years ended August 31, 2019 • 2019 first half Adjusted EPS of $2.19 represents 17.7 percent growth over 2018 Adjusted EPS as shown on the following slide • Dividend increased by 9.5 percent in May 2019; 5 year dividend growth (CAGR) = 8.4 percent Continued Growth Across the Company’s Businesses • $8.1 million from new pipeline projects ($10.6 million expected for full year) • $3.4 million from natural gas distribution growth - including GRIP and natural gas conversions • $3.4 million from Marlin acquisition ($5.3 million expected for full year) • $1.1 million from Aspire Energy due to customer growth and higher negotiated rates • Ohl acquisition and higher retail margins ($1.7 million) offset lower weather related consumption and wholesale margin for propane Successful Regulatory Initiatives • Florida PSC approved retention of a portion of TCJA tax savings: • $1.3 million gain on reversal of 2018 tax reserves in 2019 • $1.9 million incremental benefit annually beginning in 2019 ($1.0 million in first half of 2019) • Florida PSC approved storm recovery fund surcharge ($2.3 million to be recovered from April 2019 to March 2021) 4First Half 2019 Highlights Superior Return Driven by Consistent Above Average Earnings and Dividend Growth • Greater than 15 percent total shareholder return for 3, 5, 10 & 20 years ended August 31, 2019 • 2019 first half Adjusted EPS of $2.19 represents 17.7 percent growth over 2018 Adjusted EPS as shown on the following slide • Dividend increased by 9.5 percent in May 2019; 5 year dividend growth (CAGR) = 8.4 percent Continued Growth Across the Company’s Businesses • $8.1 million from new pipeline projects ($10.6 million expected for full year) • $3.4 million from natural gas distribution growth - including GRIP and natural gas conversions • $3.4 million from Marlin acquisition ($5.3 million expected for full year) • $1.1 million from Aspire Energy due to customer growth and higher negotiated rates • Ohl acquisition and higher retail margins ($1.7 million) offset lower weather related consumption and wholesale margin for propane Successful Regulatory Initiatives • Florida PSC approved retention of a portion of TCJA tax savings: • $1.3 million gain on reversal of 2018 tax reserves in 2019 • $1.9 million incremental benefit annually beginning in 2019 ($1.0 million in first half of 2019) • Florida PSC approved storm recovery fund surcharge ($2.3 million to be recovered from April 2019 to March 2021) 4
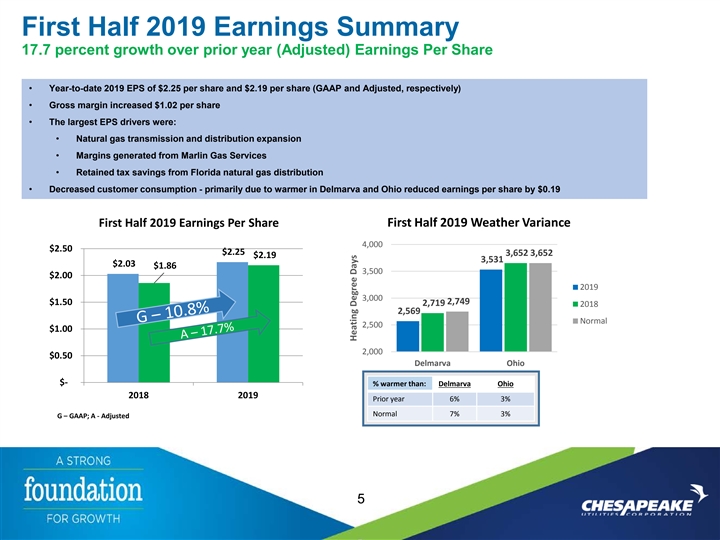
First Half 2019 Earnings Summary 17.7 percent growth over prior year (Adjusted) Earnings Per Share • Year-to-date 2019 EPS of $2.25 per share and $2.19 per share (GAAP and Adjusted, respectively) • Gross margin increased $1.02 per share • The largest EPS drivers were: • Natural gas transmission and distribution expansion • Margins generated from Marlin Gas Services • Retained tax savings from Florida natural gas distribution • Decreased customer consumption - primarily due to warmer in Delmarva and Ohio reduced earnings per share by $0.19 First Half 2019 Earnings Per Share First Half 2019 Weather Variance 4,000 $2.50 $2.25 3,652 3,652 $2.19 3,531 $2.03 $1.86 3,500 $2.00 2019 3,000 2,749 $1.50 2,719 2018 2,569 Normal 2,500 $1.00 2,000 $0.50 Delmarva Ohio $- % warmer than: Delmarva Ohio 2018 2019 Prior year 6% 3% Normal 7% 3% G – GAAP; A - Adjusted 5 Heating Degree DaysFirst Half 2019 Earnings Summary 17.7 percent growth over prior year (Adjusted) Earnings Per Share • Year-to-date 2019 EPS of $2.25 per share and $2.19 per share (GAAP and Adjusted, respectively) • Gross margin increased $1.02 per share • The largest EPS drivers were: • Natural gas transmission and distribution expansion • Margins generated from Marlin Gas Services • Retained tax savings from Florida natural gas distribution • Decreased customer consumption - primarily due to warmer in Delmarva and Ohio reduced earnings per share by $0.19 First Half 2019 Earnings Per Share First Half 2019 Weather Variance 4,000 $2.50 $2.25 3,652 3,652 $2.19 3,531 $2.03 $1.86 3,500 $2.00 2019 3,000 2,749 $1.50 2,719 2018 2,569 Normal 2,500 $1.00 2,000 $0.50 Delmarva Ohio $- % warmer than: Delmarva Ohio 2018 2019 Prior year 6% 3% Normal 7% 3% G – GAAP; A - Adjusted 5 Heating Degree Days
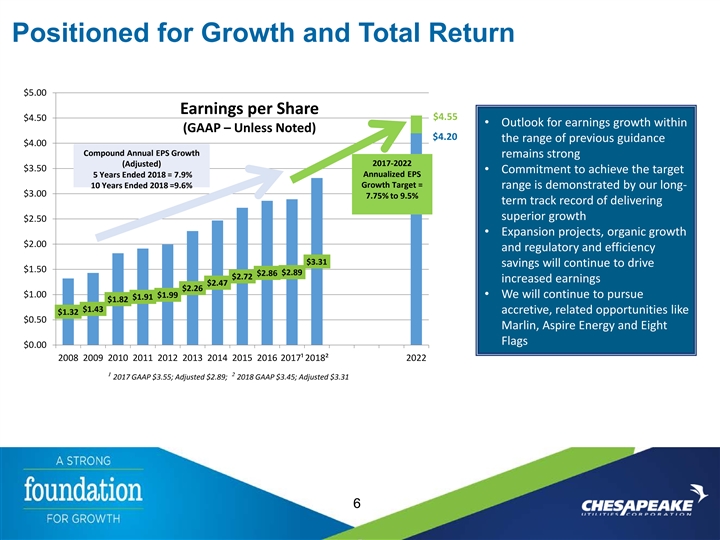
Positioned for Growth and Total Return $5.00 Earnings per Share $4.55 $4.50 • Outlook for earnings growth within (GAAP – Unless Noted) $4.20 the range of previous guidance $4.00 Compound Annual EPS Growth remains strong 2017-2022 (Adjusted) $3.50 • Commitment to achieve the target Annualized EPS 5 Years Ended 2018 = 7.9% 10 Years Ended 2018 =9.6% Growth Target = range is demonstrated by our long- $3.00 7.75% to 9.5% term track record of delivering superior growth $2.50 • Expansion projects, organic growth $2.00 and regulatory and efficiency $3.31 savings will continue to drive $1.50 $2.89 $2.86 $2.72 increased earnings $2.47 $2.26 $1.00 $1.99 • We will continue to pursue $1.91 $1.82 $1.43 accretive, related opportunities like $1.32 $0.50 Marlin, Aspire Energy and Eight Flags $0.00 2008 2009 2010 2011 2012 2013 2014 2015 2016 2017¹ 2018² 2022 ¹ 2017 GAAP $3.55; Adjusted $2.89; ² 2018 GAAP $3.45; Adjusted $3.31 6Positioned for Growth and Total Return $5.00 Earnings per Share $4.55 $4.50 • Outlook for earnings growth within (GAAP – Unless Noted) $4.20 the range of previous guidance $4.00 Compound Annual EPS Growth remains strong 2017-2022 (Adjusted) $3.50 • Commitment to achieve the target Annualized EPS 5 Years Ended 2018 = 7.9% 10 Years Ended 2018 =9.6% Growth Target = range is demonstrated by our long- $3.00 7.75% to 9.5% term track record of delivering superior growth $2.50 • Expansion projects, organic growth $2.00 and regulatory and efficiency $3.31 savings will continue to drive $1.50 $2.89 $2.86 $2.72 increased earnings $2.47 $2.26 $1.00 $1.99 • We will continue to pursue $1.91 $1.82 $1.43 accretive, related opportunities like $1.32 $0.50 Marlin, Aspire Energy and Eight Flags $0.00 2008 2009 2010 2011 2012 2013 2014 2015 2016 2017¹ 2018² 2022 ¹ 2017 GAAP $3.55; Adjusted $2.89; ² 2018 GAAP $3.45; Adjusted $3.31 6
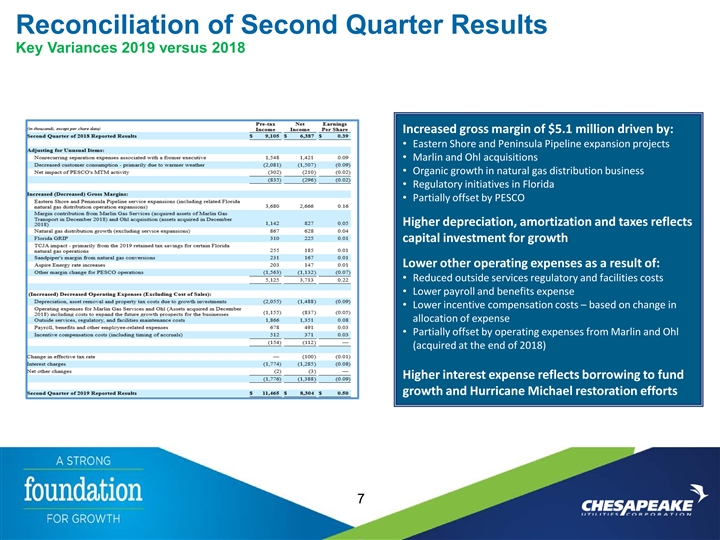
Reconciliation of Second Quarter Results Key Variances 2019 versus 2018 Increased gross margin of $5.1 million driven by: • Eastern Shore and Peninsula Pipeline expansion projects • Marlin and Ohl acquisitions • Organic growth in natural gas distribution business • Regulatory initiatives in Florida • Partially offset by PESCO Higher depreciation, amortization and taxes reflects capital investment for growth Lower other operating expenses as a result of: • Reduced outside services regulatory and facilities costs • Lower payroll and benefits expense • Lower incentive compensation costs – based on change in allocation of expense • Partially offset by operating expenses from Marlin and Ohl (acquired at the end of 2018) Higher interest expense reflects borrowing to fund growth and Hurricane Michael restoration efforts 7Reconciliation of Second Quarter Results Key Variances 2019 versus 2018 Increased gross margin of $5.1 million driven by: • Eastern Shore and Peninsula Pipeline expansion projects • Marlin and Ohl acquisitions • Organic growth in natural gas distribution business • Regulatory initiatives in Florida • Partially offset by PESCO Higher depreciation, amortization and taxes reflects capital investment for growth Lower other operating expenses as a result of: • Reduced outside services regulatory and facilities costs • Lower payroll and benefits expense • Lower incentive compensation costs – based on change in allocation of expense • Partially offset by operating expenses from Marlin and Ohl (acquired at the end of 2018) Higher interest expense reflects borrowing to fund growth and Hurricane Michael restoration efforts 7
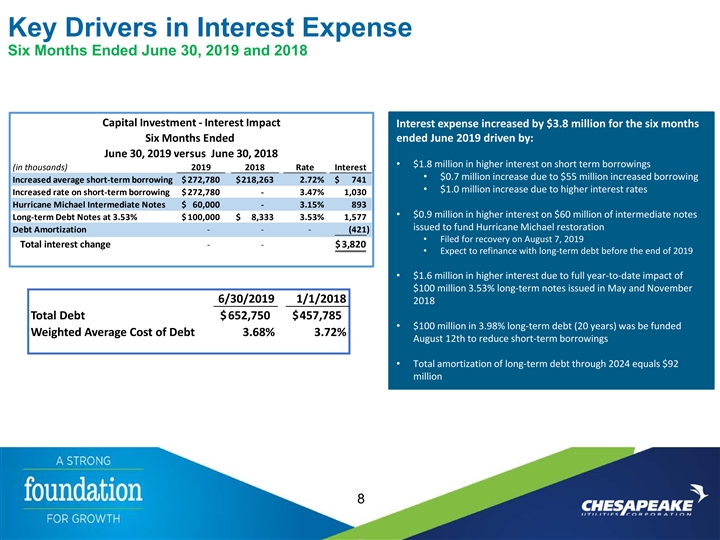
Key Drivers in Interest Expense Six Months Ended June 30, 2019 and 2018 Capital Investment - Interest Impact Interest expense increased by $3.8 million for the six months Six Months Ended ended June 2019 driven by: June 30, 2019 versus June 30, 2018 • $1.8 million in higher interest on short term borrowings (in thousands) 2019 2018 Rate Interest • $0.7 million increase due to $55 million increased borrowing Increased average short-term borrowing $ 272,780 $ 218,263 2.72% $ 7 41 • $1.0 million increase due to higher interest rates Increased rate on short-term borrowing $ 272,780 - 3.47% 1,030 Hurricane Michael Intermediate Notes $ 60,000 - 3.15% 893 • $0.9 million in higher interest on $60 million of intermediate notes Long-term Debt Notes at 3.53% $ 100,000 $ 8,333 3.53% 1,577 issued to fund Hurricane Michael restoration Debt Amortization - - - (421) • Filed for recovery on August 7, 2019 Total interest change - - $ 3,820 • Expect to refinance with long-term debt before the end of 2019 • $1.6 million in higher interest due to full year-to-date impact of $100 million 3.53% long-term notes issued in May and November 6/30/2019 1/1/2018 2018 Total Debt $652,750 $457,785 • $100 million in 3.98% long-term debt (20 years) was be funded Weighted Average Cost of Debt 3.68% 3.72% August 12th to reduce short-term borrowings • Total amortization of long-term debt through 2024 equals $92 million 8Key Drivers in Interest Expense Six Months Ended June 30, 2019 and 2018 Capital Investment - Interest Impact Interest expense increased by $3.8 million for the six months Six Months Ended ended June 2019 driven by: June 30, 2019 versus June 30, 2018 • $1.8 million in higher interest on short term borrowings (in thousands) 2019 2018 Rate Interest • $0.7 million increase due to $55 million increased borrowing Increased average short-term borrowing $ 272,780 $ 218,263 2.72% $ 7 41 • $1.0 million increase due to higher interest rates Increased rate on short-term borrowing $ 272,780 - 3.47% 1,030 Hurricane Michael Intermediate Notes $ 60,000 - 3.15% 893 • $0.9 million in higher interest on $60 million of intermediate notes Long-term Debt Notes at 3.53% $ 100,000 $ 8,333 3.53% 1,577 issued to fund Hurricane Michael restoration Debt Amortization - - - (421) • Filed for recovery on August 7, 2019 Total interest change - - $ 3,820 • Expect to refinance with long-term debt before the end of 2019 • $1.6 million in higher interest due to full year-to-date impact of $100 million 3.53% long-term notes issued in May and November 6/30/2019 1/1/2018 2018 Total Debt $652,750 $457,785 • $100 million in 3.98% long-term debt (20 years) was be funded Weighted Average Cost of Debt 3.68% 3.72% August 12th to reduce short-term borrowings • Total amortization of long-term debt through 2024 equals $92 million 8
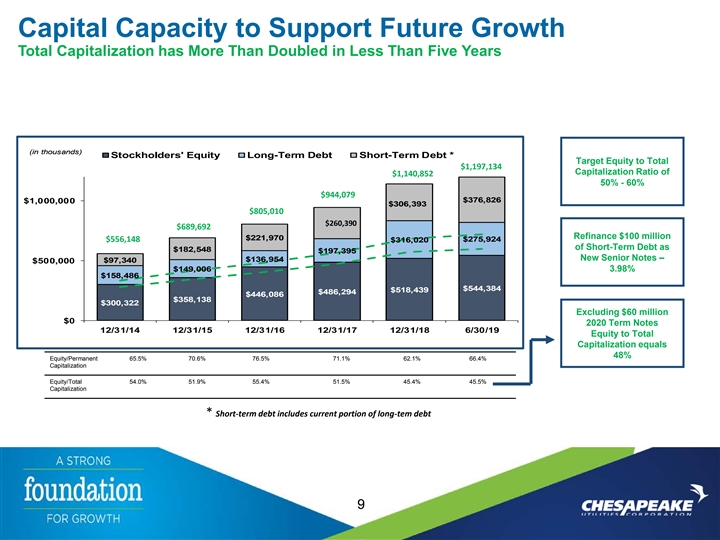
Capital Capacity to Support Future Growth Total Capitalization has More Than Doubled in Less Than Five Years (in thousands) Stockholders' Equity Long-Term Debt Short-Term Debt * Target Equity to Total $1,197,134 Capitalization Ratio of $1,140,852 50% - 60% $944,079 $376,826 $1,000,000 $306,393 $805,010 $260,390 $689,692 Refinance $100 million $221,970 $556,148 $316,020 $275,924 of Short-Term Debt as $182,548 $197,395 New Senior Notes – $136,954 $97,340 $500,000 $149,006 3.98% $158,486 $544,384 $518,439 $486,294 $446,086 $358,138 $300,322 Excluding $60 million $0 2020 Term Notes 12/31/14 12/31/15 12/31/16 12/31/17 12/31/18 6/30/19 Equity to Total Capitalization equals 48% Equity/Permanent 65.5% 70.6% 76.5% 71.1% 62.1% 66.4% Capitalization Equity/Total 54.0% 51.9% 55.4% 51.5% 45.4% 45.5% Capitalization * Short-term debt includes current portion of long-tem debt 9Capital Capacity to Support Future Growth Total Capitalization has More Than Doubled in Less Than Five Years (in thousands) Stockholders' Equity Long-Term Debt Short-Term Debt * Target Equity to Total $1,197,134 Capitalization Ratio of $1,140,852 50% - 60% $944,079 $376,826 $1,000,000 $306,393 $805,010 $260,390 $689,692 Refinance $100 million $221,970 $556,148 $316,020 $275,924 of Short-Term Debt as $182,548 $197,395 New Senior Notes – $136,954 $97,340 $500,000 $149,006 3.98% $158,486 $544,384 $518,439 $486,294 $446,086 $358,138 $300,322 Excluding $60 million $0 2020 Term Notes 12/31/14 12/31/15 12/31/16 12/31/17 12/31/18 6/30/19 Equity to Total Capitalization equals 48% Equity/Permanent 65.5% 70.6% 76.5% 71.1% 62.1% 66.4% Capitalization Equity/Total 54.0% 51.9% 55.4% 51.5% 45.4% 45.5% Capitalization * Short-term debt includes current portion of long-tem debt 9
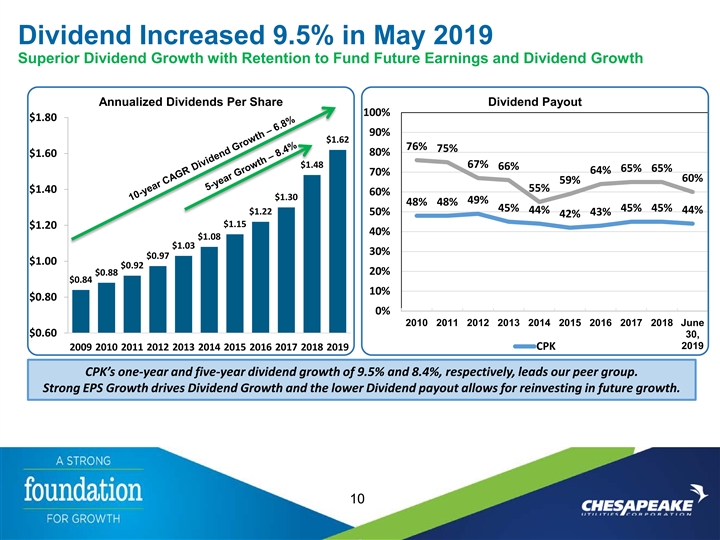
Dividend Increased 9.5% in May 2019 Superior Dividend Growth with Retention to Fund Future Earnings and Dividend Growth Annualized Dividends Per Share Dividend Payout 100% $1.80 90% $1.62 76% 75% 80% $1.60 $1.48 67% 66% 65% 65% 64% 70% 60% 59% 55% $1.40 60% $1.30 49% 48% 48% 45% 45% 45% 44% 44% $1.22 50% 43% 42% $1.15 $1.20 40% $1.08 $1.03 30% $0.97 $1.00 $0.92 20% $0.88 $0.84 10% $0.80 0% 2010 2011 2012 2013 2014 2015 2016 2017 2018 June $0.60 30, 2019 CPK 2009 2010 2011 2012 2013 2014 2015 2016 2017 2018 2019 CPK’s one-year and five-year dividend growth of 9.5% and 8.4%, respectively, leads our peer group. Strong EPS Growth drives Dividend Growth and the lower Dividend payout allows for reinvesting in future growth. 10Dividend Increased 9.5% in May 2019 Superior Dividend Growth with Retention to Fund Future Earnings and Dividend Growth Annualized Dividends Per Share Dividend Payout 100% $1.80 90% $1.62 76% 75% 80% $1.60 $1.48 67% 66% 65% 65% 64% 70% 60% 59% 55% $1.40 60% $1.30 49% 48% 48% 45% 45% 45% 44% 44% $1.22 50% 43% 42% $1.15 $1.20 40% $1.08 $1.03 30% $0.97 $1.00 $0.92 20% $0.88 $0.84 10% $0.80 0% 2010 2011 2012 2013 2014 2015 2016 2017 2018 June $0.60 30, 2019 CPK 2009 2010 2011 2012 2013 2014 2015 2016 2017 2018 2019 CPK’s one-year and five-year dividend growth of 9.5% and 8.4%, respectively, leads our peer group. Strong EPS Growth drives Dividend Growth and the lower Dividend payout allows for reinvesting in future growth. 10
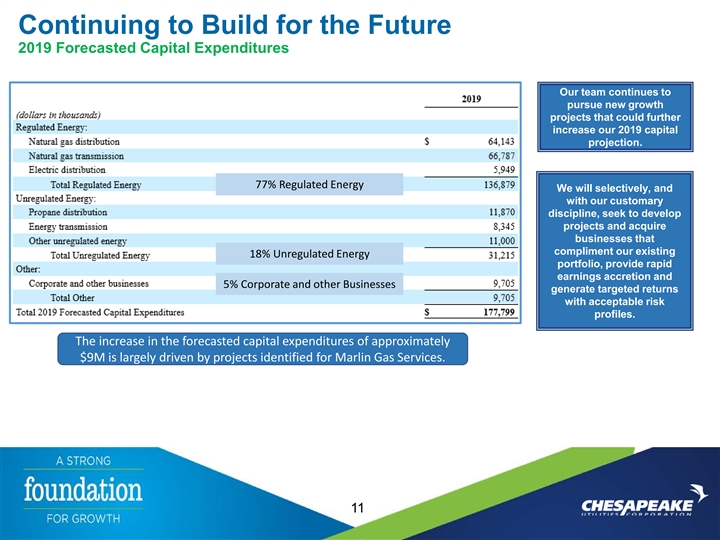
Continuing to Build for the Future 2019 Forecasted Capital Expenditures Our team continues to pursue new growth projects that could further increase our 2019 capital projection. 77% Regulated Energy We will selectively, and with our customary discipline, seek to develop projects and acquire businesses that compliment our existing 18% Unregulated Energy portfolio, provide rapid earnings accretion and 5% Corporate and other Businesses generate targeted returns with acceptable risk profiles. The increase in the forecasted capital expenditures of approximately $9M is largely driven by projects identified for Marlin Gas Services. 11Continuing to Build for the Future 2019 Forecasted Capital Expenditures Our team continues to pursue new growth projects that could further increase our 2019 capital projection. 77% Regulated Energy We will selectively, and with our customary discipline, seek to develop projects and acquire businesses that compliment our existing 18% Unregulated Energy portfolio, provide rapid earnings accretion and 5% Corporate and other Businesses generate targeted returns with acceptable risk profiles. The increase in the forecasted capital expenditures of approximately $9M is largely driven by projects identified for Marlin Gas Services. 11
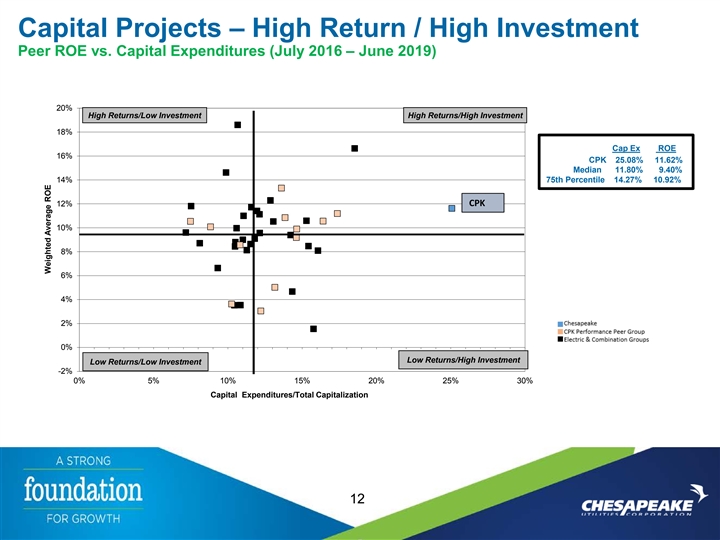
Capital Projects – High Return / High Investment Peer ROE vs. Capital Expenditures (July 2016 – June 2019) 20% High Returns/Low Investment High Returns/High Investment 18% Cap Ex ROE 16% CPK 25.08% 11.62% Median 11.80% 9.40% 14% 75th Percentile 14.27% 10.92% 12% CPK 10% 8% 6% 4% 2% 0% Low Returns/High Investment Low Returns/Low Investment -2% 0% 5% 10% 15% 20% 25% 30% Capital Expenditures/Total Capitalization 12 Weighted Average ROECapital Projects – High Return / High Investment Peer ROE vs. Capital Expenditures (July 2016 – June 2019) 20% High Returns/Low Investment High Returns/High Investment 18% Cap Ex ROE 16% CPK 25.08% 11.62% Median 11.80% 9.40% 14% 75th Percentile 14.27% 10.92% 12% CPK 10% 8% 6% 4% 2% 0% Low Returns/High Investment Low Returns/Low Investment -2% 0% 5% 10% 15% 20% 25% 30% Capital Expenditures/Total Capitalization 12 Weighted Average ROE
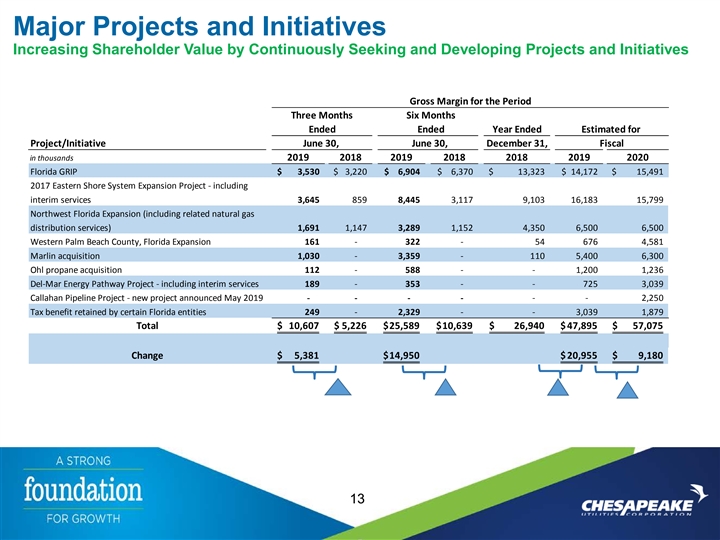
Major Projects and Initiatives Increasing Shareholder Value by Continuously Seeking and Developing Projects and Initiatives Gross Margin for the Period Three Months Six Months Ended Ended Year Ended Estimated for Project/Initiative June 30, June 30, December 31, Fiscal in thousands 2019 2018 2019 2018 2018 2019 2020 Florida GRIP $ 3 ,530 $ 3 ,220 $ 6,904 $ 6 ,370 $ 13,323 $ 14,172 $ 1 5,491 2017 Eastern Shore System Expansion Project - including interim services 3,645 859 8 ,445 3,117 9 ,103 16,183 15,799 Northwest Florida Expansion (including related natural gas distribution services) 1 ,691 1,147 3 ,289 1,152 4,350 6 ,500 6 ,500 Western Palm Beach County, Florida Expansion 161 - 322 - 54 676 4,581 Marlin acquisition 1 ,030 - 3 ,359 - 1 10 5 ,400 6 ,300 Ohl propane acquisition 112 - 5 88 - - 1 ,200 1 ,236 Del-Mar Energy Pathway Project - including interim services 189 - 3 53 - - 7 25 3,039 Callahan Pipeline Project - new project announced May 2019 - - - - - - 2 ,250 Tax benefit retained by certain Florida entities 2 49 - 2,329 - - 3 ,039 1 ,879 Total $ 10,607 $ 5 ,226 $ 25,589 $ 10,639 $ 26,940 $ 47,895 $ 57,075 Change $ 5,381 $ 14,950 $ 20,955 $ 9,180 13Major Projects and Initiatives Increasing Shareholder Value by Continuously Seeking and Developing Projects and Initiatives Gross Margin for the Period Three Months Six Months Ended Ended Year Ended Estimated for Project/Initiative June 30, June 30, December 31, Fiscal in thousands 2019 2018 2019 2018 2018 2019 2020 Florida GRIP $ 3 ,530 $ 3 ,220 $ 6,904 $ 6 ,370 $ 13,323 $ 14,172 $ 1 5,491 2017 Eastern Shore System Expansion Project - including interim services 3,645 859 8 ,445 3,117 9 ,103 16,183 15,799 Northwest Florida Expansion (including related natural gas distribution services) 1 ,691 1,147 3 ,289 1,152 4,350 6 ,500 6 ,500 Western Palm Beach County, Florida Expansion 161 - 322 - 54 676 4,581 Marlin acquisition 1 ,030 - 3 ,359 - 1 10 5 ,400 6 ,300 Ohl propane acquisition 112 - 5 88 - - 1 ,200 1 ,236 Del-Mar Energy Pathway Project - including interim services 189 - 3 53 - - 7 25 3,039 Callahan Pipeline Project - new project announced May 2019 - - - - - - 2 ,250 Tax benefit retained by certain Florida entities 2 49 - 2,329 - - 3 ,039 1 ,879 Total $ 10,607 $ 5 ,226 $ 25,589 $ 10,639 $ 26,940 $ 47,895 $ 57,075 Change $ 5,381 $ 14,950 $ 20,955 $ 9,180 13
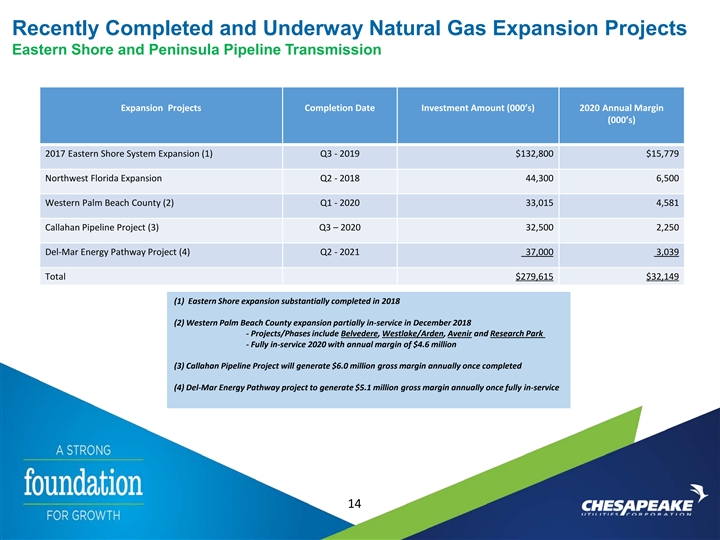
Recently Completed and Underway Natural Gas Expansion Projects Eastern Shore and Peninsula Pipeline Transmission Expansion Projects Completion Date Investment Amount (000’s) 2020 Annual Margin (000’s) 2017 Eastern Shore System Expansion (1) Q3 - 2019 $132,800 $15,779 Northwest Florida Expansion Q2 - 2018 44,300 6,500 Western Palm Beach County (2) Q1 - 2020 33,015 4,581 Callahan Pipeline Project (3) Q3 – 2020 32,500 2,250 Del-Mar Energy Pathway Project (4) Q2 - 2021 37,000 3,039 Total $279,615 $32,149 (1) Eastern Shore expansion substantially completed in 2018 (2) Western Palm Beach County expansion partially in-service in December 2018 - Projects/Phases include Belvedere, Westlake/Arden, Avenir and Research Park - Fully in-service 2020 with annual margin of $4.6 million (3) Callahan Pipeline Project will generate $6.0 million gross margin annually once completed (4) Del-Mar Energy Pathway project to generate $5.1 million gross margin annually once fully in-service 9 14Recently Completed and Underway Natural Gas Expansion Projects Eastern Shore and Peninsula Pipeline Transmission Expansion Projects Completion Date Investment Amount (000’s) 2020 Annual Margin (000’s) 2017 Eastern Shore System Expansion (1) Q3 - 2019 $132,800 $15,779 Northwest Florida Expansion Q2 - 2018 44,300 6,500 Western Palm Beach County (2) Q1 - 2020 33,015 4,581 Callahan Pipeline Project (3) Q3 – 2020 32,500 2,250 Del-Mar Energy Pathway Project (4) Q2 - 2021 37,000 3,039 Total $279,615 $32,149 (1) Eastern Shore expansion substantially completed in 2018 (2) Western Palm Beach County expansion partially in-service in December 2018 - Projects/Phases include Belvedere, Westlake/Arden, Avenir and Research Park - Fully in-service 2020 with annual margin of $4.6 million (3) Callahan Pipeline Project will generate $6.0 million gross margin annually once completed (4) Del-Mar Energy Pathway project to generate $5.1 million gross margin annually once fully in-service 9 14
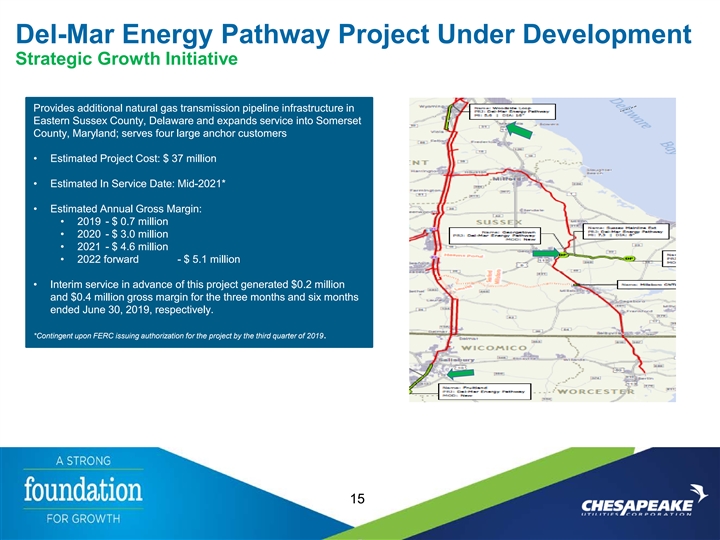
Del-Mar Energy Pathway Project Under Development Strategic Growth Initiative Provides additional natural gas transmission pipeline infrastructure in Eastern Sussex County, Delaware and expands service into Somerset County, Maryland; serves four large anchor customers • Estimated Project Cost: $ 37 million • Estimated In Service Date: Mid-2021* • Estimated Annual Gross Margin: • 2019 - $ 0.7 million • 2020 - $ 3.0 million • 2021 - $ 4.6 million • 2022 forward - $ 5.1 million • Interim service in advance of this project generated $0.2 million and $0.4 million gross margin for the three months and six months ended June 30, 2019, respectively. *Contingent upon FERC issuing authorization for the project by the third quarter of 2019. 15Del-Mar Energy Pathway Project Under Development Strategic Growth Initiative Provides additional natural gas transmission pipeline infrastructure in Eastern Sussex County, Delaware and expands service into Somerset County, Maryland; serves four large anchor customers • Estimated Project Cost: $ 37 million • Estimated In Service Date: Mid-2021* • Estimated Annual Gross Margin: • 2019 - $ 0.7 million • 2020 - $ 3.0 million • 2021 - $ 4.6 million • 2022 forward - $ 5.1 million • Interim service in advance of this project generated $0.2 million and $0.4 million gross margin for the three months and six months ended June 30, 2019, respectively. *Contingent upon FERC issuing authorization for the project by the third quarter of 2019. 15
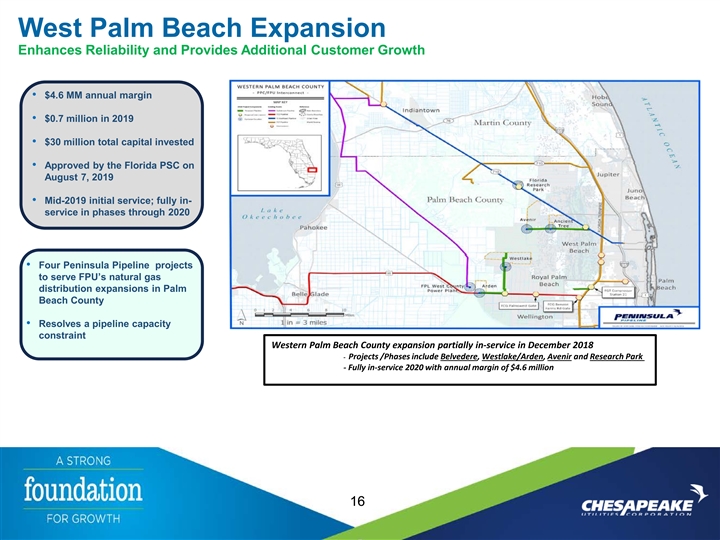
West Palm Beach Expansion Enhances Reliability and Provides Additional Customer Growth • $4.6 MM annual margin • $0.7 million in 2019 • $30 million total capital invested • Approved by the Florida PSC on August 7, 2019 • Mid-2019 initial service; fully in- service in phases through 2020 • Four Peninsula Pipeline projects to serve FPU’s natural gas distribution expansions in Palm Beach County • Resolves a pipeline capacity constraint Western Palm Beach County expansion partially in-service in December 2018 - Projects /Phases include Belvedere, Westlake/Arden, Avenir and Research Park - Fully in-service 2020 with annual margin of $4.6 million 16West Palm Beach Expansion Enhances Reliability and Provides Additional Customer Growth • $4.6 MM annual margin • $0.7 million in 2019 • $30 million total capital invested • Approved by the Florida PSC on August 7, 2019 • Mid-2019 initial service; fully in- service in phases through 2020 • Four Peninsula Pipeline projects to serve FPU’s natural gas distribution expansions in Palm Beach County • Resolves a pipeline capacity constraint Western Palm Beach County expansion partially in-service in December 2018 - Projects /Phases include Belvedere, Westlake/Arden, Avenir and Research Park - Fully in-service 2020 with annual margin of $4.6 million 16
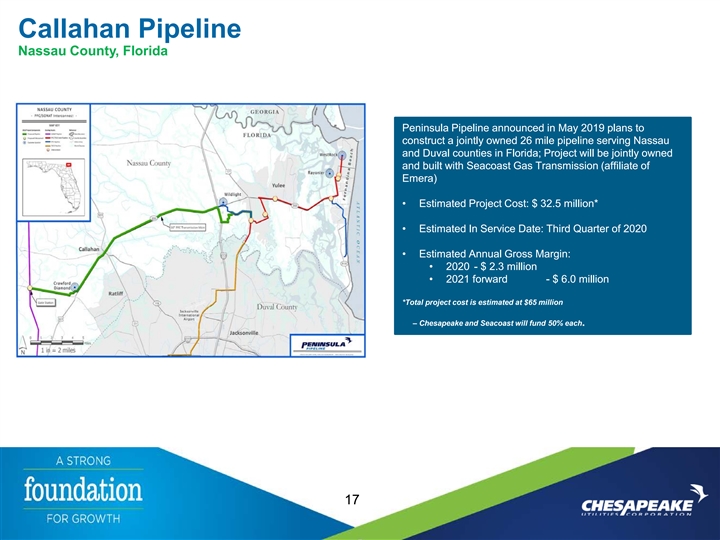
Callahan Pipeline Nassau County, Florida Peninsula Pipeline announced in May 2019 plans to construct a jointly owned 26 mile pipeline serving Nassau and Duval counties in Florida; Project will be jointly owned and built with Seacoast Gas Transmission (affiliate of Emera) • Estimated Project Cost: $ 32.5 million* • Estimated In Service Date: Third Quarter of 2020 • Estimated Annual Gross Margin: • 2020 - $ 2.3 million • 2021 forward - $ 6.0 million *Total project cost is estimated at $65 million – Chesapeake and Seacoast will fund 50% each. 17Callahan Pipeline Nassau County, Florida Peninsula Pipeline announced in May 2019 plans to construct a jointly owned 26 mile pipeline serving Nassau and Duval counties in Florida; Project will be jointly owned and built with Seacoast Gas Transmission (affiliate of Emera) • Estimated Project Cost: $ 32.5 million* • Estimated In Service Date: Third Quarter of 2020 • Estimated Annual Gross Margin: • 2020 - $ 2.3 million • 2021 forward - $ 6.0 million *Total project cost is estimated at $65 million – Chesapeake and Seacoast will fund 50% each. 17
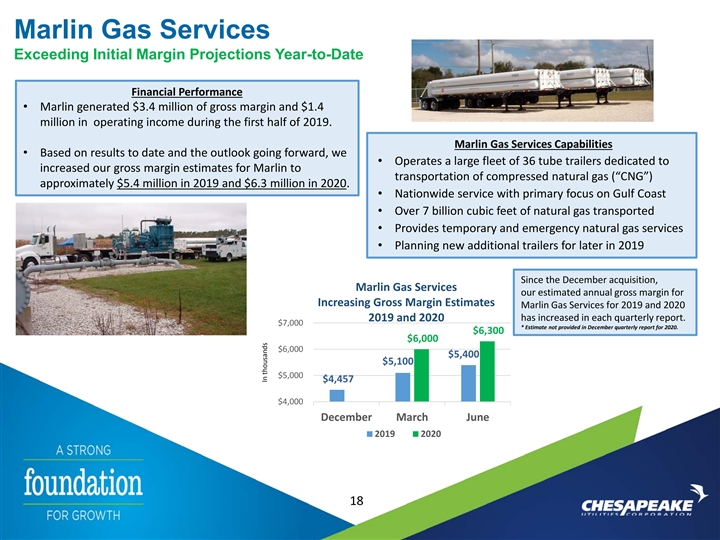
Marlin Gas Services Exceeding Initial Margin Projections Year-to-Date Financial Performance • Marlin generated $3.4 million of gross margin and $1.4 million in operating income during the first half of 2019. Marlin Gas Services Capabilities • Based on results to date and the outlook going forward, we • Operates a large fleet of 36 tube trailers dedicated to increased our gross margin estimates for Marlin to transportation of compressed natural gas (“CNG”) approximately $5.4 million in 2019 and $6.3 million in 2020. • Nationwide service with primary focus on Gulf Coast • Over 7 billion cubic feet of natural gas transported • Provides temporary and emergency natural gas services • Planning new additional trailers for later in 2019 Since the December acquisition, Marlin Gas Services our estimated annual gross margin for Increasing Gross Margin Estimates Marlin Gas Services for 2019 and 2020 2019 and 2020 has increased in each quarterly report. $7,000 * Estimate not provided in December quarterly report for 2020. $6,300 $6,000 $6,000 $5,400 $5,100 $5,000 $4,457 $4,000 9 December March June 2019 2020 18 In thousandsMarlin Gas Services Exceeding Initial Margin Projections Year-to-Date Financial Performance • Marlin generated $3.4 million of gross margin and $1.4 million in operating income during the first half of 2019. Marlin Gas Services Capabilities • Based on results to date and the outlook going forward, we • Operates a large fleet of 36 tube trailers dedicated to increased our gross margin estimates for Marlin to transportation of compressed natural gas (“CNG”) approximately $5.4 million in 2019 and $6.3 million in 2020. • Nationwide service with primary focus on Gulf Coast • Over 7 billion cubic feet of natural gas transported • Provides temporary and emergency natural gas services • Planning new additional trailers for later in 2019 Since the December acquisition, Marlin Gas Services our estimated annual gross margin for Increasing Gross Margin Estimates Marlin Gas Services for 2019 and 2020 2019 and 2020 has increased in each quarterly report. $7,000 * Estimate not provided in December quarterly report for 2020. $6,300 $6,000 $6,000 $5,400 $5,100 $5,000 $4,457 $4,000 9 December March June 2019 2020 18 In thousands
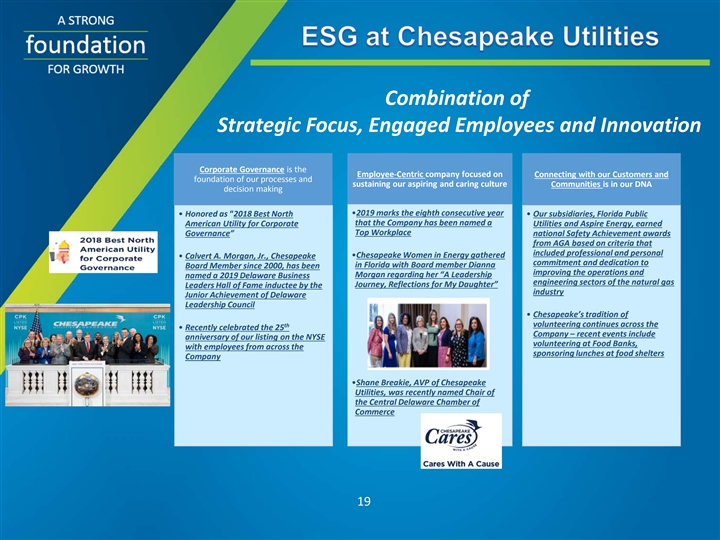
Combination of Strategic Focus, Engaged Employees and Innovation Corporate Governance is the Employee-Centric company focused on Connecting with our Customers and foundation of our processes and sustaining our aspiring and caring culture Communities is in our DNA decision making •2019 marks the eighth consecutive year • Honored as “2018 Best North • Our subsidiaries, Florida Public that the Company has been named a American Utility for Corporate Utilities and Aspire Energy, earned Top Workplace Governance” national Safety Achievement awards from AGA based on criteria that included professional and personal •Chesapeake Women in Energy gathered • Calvert A. Morgan, Jr., Chesapeake commitment and dedication to in Florida with Board member Dianna Board Member since 2000, has been improving the operations and Morgan regarding her “A Leadership named a 2019 Delaware Business engineering sectors of the natural gas Journey, Reflections for My Daughter” Leaders Hall of Fame inductee by the industry Junior Achievement of Delaware Leadership Council • Chesapeake’s tradition of th volunteering continues across the • Recently celebrated the 25 Company – recent events include anniversary of our listing on the NYSE volunteering at Food Banks, with employees from across the sponsoring lunches at food shelters Company •Shane Breakie, AVP of Chesapeake Utilities, was recently named Chair of the Central Delaware Chamber of Commerce 19Combination of Strategic Focus, Engaged Employees and Innovation Corporate Governance is the Employee-Centric company focused on Connecting with our Customers and foundation of our processes and sustaining our aspiring and caring culture Communities is in our DNA decision making •2019 marks the eighth consecutive year • Honored as “2018 Best North • Our subsidiaries, Florida Public that the Company has been named a American Utility for Corporate Utilities and Aspire Energy, earned Top Workplace Governance” national Safety Achievement awards from AGA based on criteria that included professional and personal •Chesapeake Women in Energy gathered • Calvert A. Morgan, Jr., Chesapeake commitment and dedication to in Florida with Board member Dianna Board Member since 2000, has been improving the operations and Morgan regarding her “A Leadership named a 2019 Delaware Business engineering sectors of the natural gas Journey, Reflections for My Daughter” Leaders Hall of Fame inductee by the industry Junior Achievement of Delaware Leadership Council • Chesapeake’s tradition of th volunteering continues across the • Recently celebrated the 25 Company – recent events include anniversary of our listing on the NYSE volunteering at Food Banks, with employees from across the sponsoring lunches at food shelters Company •Shane Breakie, AVP of Chesapeake Utilities, was recently named Chair of the Central Delaware Chamber of Commerce 19
ESG at Chesapeake Utilities • Chesapeake Utilities has a long-standing history of ESG practices and our internal working group (Governance, HR, Finance, Operations, and Technology) has been reviewing industry practices and communicating with stakeholders to ensure we provide the most relevant information on ESG. • Every day, our employees show their entrepreneurial spirit by identifying energy efficient opportunities, generating savings for customers, and reducing carbon emissions within our business operations. • Chesapeake Utilities is committed to providing safe, efficient and reliable solutions to our customers. • Our employees not only participate in community events, they hold leadership roles. 20ESG at Chesapeake Utilities • Chesapeake Utilities has a long-standing history of ESG practices and our internal working group (Governance, HR, Finance, Operations, and Technology) has been reviewing industry practices and communicating with stakeholders to ensure we provide the most relevant information on ESG. • Every day, our employees show their entrepreneurial spirit by identifying energy efficient opportunities, generating savings for customers, and reducing carbon emissions within our business operations. • Chesapeake Utilities is committed to providing safe, efficient and reliable solutions to our customers. • Our employees not only participate in community events, they hold leadership roles. 20
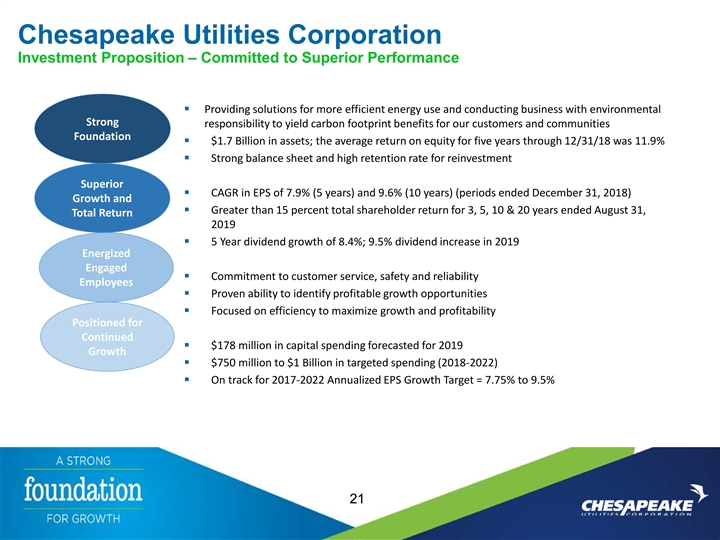
Chesapeake Utilities Corporation Investment Proposition – Committed to Superior Performance § Providing solutions for more efficient energy use and conducting business with environmental Strong responsibility to yield carbon footprint benefits for our customers and communities Foundation § $1.7 Billion in assets; the average return on equity for five years through 12/31/18 was 11.9% § Strong balance sheet and high retention rate for reinvestment Superior § CAGR in EPS of 7.9% (5 years) and 9.6% (10 years) (periods ended December 31, 2018) Growth and § Greater than 15 percent total shareholder return for 3, 5, 10 & 20 years ended August 31, Total Return 2019 § 5 Year dividend growth of 8.4%; 9.5% dividend increase in 2019 Energized Engaged § Commitment to customer service, safety and reliability Employees § Proven ability to identify profitable growth opportunities § Focused on efficiency to maximize growth and profitability Positioned for Continued § $178 million in capital spending forecasted for 2019 Growth § $750 million to $1 Billion in targeted spending (2018-2022) § On track for 2017-2022 Annualized EPS Growth Target = 7.75% to 9.5% 21Chesapeake Utilities Corporation Investment Proposition – Committed to Superior Performance § Providing solutions for more efficient energy use and conducting business with environmental Strong responsibility to yield carbon footprint benefits for our customers and communities Foundation § $1.7 Billion in assets; the average return on equity for five years through 12/31/18 was 11.9% § Strong balance sheet and high retention rate for reinvestment Superior § CAGR in EPS of 7.9% (5 years) and 9.6% (10 years) (periods ended December 31, 2018) Growth and § Greater than 15 percent total shareholder return for 3, 5, 10 & 20 years ended August 31, Total Return 2019 § 5 Year dividend growth of 8.4%; 9.5% dividend increase in 2019 Energized Engaged § Commitment to customer service, safety and reliability Employees § Proven ability to identify profitable growth opportunities § Focused on efficiency to maximize growth and profitability Positioned for Continued § $178 million in capital spending forecasted for 2019 Growth § $750 million to $1 Billion in targeted spending (2018-2022) § On track for 2017-2022 Annualized EPS Growth Target = 7.75% to 9.5% 21

Any Questions? Joseph D. Steinmetz Thomas E. Mahn Vice President and Vice President and Controller Treasurer jsteinmetz@chpk.com tmahn@chpk.com 302-314-7010 302-736-7656 Thank You!Any Questions? Joseph D. Steinmetz Thomas E. Mahn Vice President and Vice President and Controller Treasurer jsteinmetz@chpk.com tmahn@chpk.com 302-314-7010 302-736-7656 Thank You!