UNITED STATES
SECURITIES AND EXCHANGE COMMISSION
Washington, D.C. 20549
FORM N-CSR
CERTIFIED SHAREHOLDER REPORT OF REGISTERED
MANAGEMENT INVESTMENT COMPANIES
Investment Company Act file number (811-23872)
Themes ETF Trust
(Exact name of registrant as specified in charter)
34 East Putnam Avenue Suite 112
Greenwich, CT 06830
(Address of principal executive offices) (Zip code)
Themes Management Company, LLC
34 East Putnam Avenue Suite 112
Greenwich, CT 06830
(Name and address of agent for service)
(646) 206-1788
Registrant’s telephone number, including area code
Date of fiscal year end: 9/30
Date of reporting period: 3/31/2024
Item 1. Reports to Stockholders.
| a) |

Themes ETF Trust
SEMI-ANNUAL REPORT
March 31, 2024
(Unaudited)
Themes Airlines ETF │ AIRL
Themes Cloud Computing ETF │ CLOD
Themes Cybersecurity ETF │ SPAM
Themes European Luxury ETF │ FINE
Themes Generative Artificial Intelligence ETF │ WISE
Themes Global Systemically Important Banks ETF │ GSIB
Themes Gold Miners ETF │ AUMI
Themes Natural Monopoly ETF │ CZAR
Themes US Cash Flow Champions ETF │ USCF
Themes US R&D Champions ETF │ USRD
Themes US Small Cap Cash Flow Champions ETF │ SMCF
Table of Contents
(Unaudited)
Expense Example
Period Ended March 31, 2024 (Unaudited)
As a shareholder of the Funds you incur two types of costs: (1) transaction costs, including brokerage commissions on purchases and sales of Fund shares, and (2) ongoing costs, including management fees and other Fund expenses. These examples are intended to help you understand your ongoing costs (in dollars) of investing in the Funds and to compare these costs with the ongoing costs of investing in other funds. The examples are based on an investment of $1,000 invested for the period of time as indicated in the table below.
Actual Expenses
The first line of the table provides information about actual account values based on actual returns and actual expenses. You may use the information in this line, together with the amount you invested, to estimate the expenses that you paid over the period. Simply divide your account value by $1,000 (for example, an $8,600 account value divided by $1,000 = 8.6), then, multiply the result by the number in the first line under the heading entitled “Expenses Paid During Period” to estimate the expenses you paid on your account during this period.
Hypothetical Example for Comparison Purposes
The second line of the table provides information about hypothetical account values based on a hypothetical return and hypothetical expenses based on the Fund’s actual expense ratio and an assumed rate of return of 5% per year before expenses, which is not the Fund’s actual return. The hypothetical account values and expenses may not be used to estimate the actual ending account balance or expenses you paid for the period. You may use this information to compare the ongoing costs of investing in the Fund and other funds. To do so, compare this 5% hypothetical example with the 5% hypothetical examples that appear in the shareholder reports of the other funds. Please note that the expenses shown in the table are meant to highlight your ongoing costs only and do not reflect any transactional costs, such as brokerage commissions paid on purchases and sales of Fund shares. Therefore, the second line of the table is useful in comparing ongoing costs only and will not help you determine the relative total costs of owning different funds. If these transactional costs were included, your costs would have been higher.
| Fund Name | Beginning Account Value 10/1/2023 | Ending Account Value 3/31/2024 | Expenses Paid During the Period | Annualized Expense Ratio During the Period | ||||||||||||
| Themes Airlines ETF | ||||||||||||||||
| Actual | $ | 1,000.00 | (6) | $ | 1,061.90 | $ | 1.14 | 0.35 | %(2) | |||||||
| Hypothetical (5% annual) | 1,000.00 | 1,023.25 | 1.77 | 0.35 | %(1)(5) | |||||||||||
| Themes Cloud Computing ETF | ||||||||||||||||
| Actual | 1,000.00 | (8) | 1,074.60 | 1.08 | 0.35 | %(4) | ||||||||||
| Hypothetical (5% annual) | 1,000.00 | 1,023.25 | 1.77 | 0.35 | %(1)(5) | |||||||||||
| Themes Cybersecurity ETF | ||||||||||||||||
| Actual | 1,000.00 | (6) | 1,112.10 | 1.27 | 0.38 | %(2) | ||||||||||
| Hypothetical (5% annual) | 1,000.00 | 1,023.10 | 1.92 | 0.38 | %(1)(5) | |||||||||||
| Themes European Luxury ETF | ||||||||||||||||
| Actual | 1,000.00 | (8) | 1,025.80 | 1.06 | 0.35 | %(4) | ||||||||||
| Hypothetical (5% annual) | 1,000.00 | 1,023.25 | 1.77 | 0.35 | %(1)(5) | |||||||||||
| Themes Generative Artificial Intelligence ETF | ||||||||||||||||
| Actual | 1,000.00 | (6) | 1,215.10 | 1.23 | 0.35 | %(2) | ||||||||||
| Hypothetical (5% annual) | 1,000.00 | 1,023.25 | 1.77 | 0.35 | %(1)(5) | |||||||||||
| Themes Global Systemically Important Banks ETF | ||||||||||||||||
| Actual | 1,000.00 | (8) | 1,103.40 | 1.10 | 0.35 | %(4) | ||||||||||
| Hypothetical (5% annual) | 1,000.00 | 1,023.25 | 1.77 | 0.35 | %(1)(5) | |||||||||||
| Themes Gold Miners ETF | ||||||||||||||||
| Actual | 1,000.00 | (7) | 1,178.00 | 1.16 | 0.35 | %(3) | ||||||||||
| Hypothetical (5% annual) | 1,000.00 | 1,023.25 | 1.77 | 0.35 | %(1)(5) | |||||||||||
1
Themes ETFs
Expense Example
Period Ended March 31, 2024 (Unaudited) (Continued)
| Fund Name | Beginning Account Value 10/1/2023 | Ending Account Value 3/31/2024 | Expenses Paid During the Period | Annualized Expense Ratio During the Period | ||||||||||||
| Themes Natural Monopoly ETF | ||||||||||||||||
| Actual | $ | 1,000.00 | (7) | $ | 1,111.70 | $ | 1.15 | 0.36 | %(3) | |||||||
| Hypothetical (5% annual) | 1,000.00 | 1,023.20 | 1.82 | 0.36 | %(1)(5) | |||||||||||
| Themes US Cash Flow Champions ETF | ||||||||||||||||
| Actual | 1,000.00 | (7) | 1,153.10 | 1.04 | 0.32 | %(3) | ||||||||||
| Hypothetical (5% annual) | 1,000.00 | 1,023.40 | 1.62 | 0.32 | %(1)(5) | |||||||||||
| Themes US R&D Champions ETF | ||||||||||||||||
| Actual | 1,000.00 | (7) | 1,183.10 | 0.96 | 0.29 | %(3) | ||||||||||
| Hypothetical (5% annual) | 1,000.00 | 1,023.55 | 1.47 | 0.29 | %(1)(5) | |||||||||||
| Themes US Small Cap Cash Flow Champions ETF | ||||||||||||||||
| Actual | 1,000.00 | (7) | 1,204.70 | 1.00 | 0.30 | %(3) | ||||||||||
| Hypothetical (5% annual) | 1,000.00 | 1,023.50 | 1.52 | 0.30 | %(1)(5) | |||||||||||
| (1) | Expenses are calculated using the Fund’s annualized expense ratio, multiplied by the average account value during the period, multiplied by 183/366 (to reflect the six-month period). |
| (2) | Expenses are calculated using the Fund’s annualized expense ratio, multiplied by the average account value during the period, multiplied by 116/366 (to reflect the period since the Fund’s inception). |
| (3) | Expenses are calculated using the Fund’s annualized expense ratio, multiplied by the average account value during the period, multiplied by 111/366 (to reflect the period since the Fund’s inception). |
| (4) | Expenses are calculated using the Fund’s annualized expense ratio, multiplied by the average account value during the period, multiplied by 109/366 (to reflect the period since the Fund’s inception). |
| (5) | For comparative purposes only as the Fund was not in operation for the full six-month period. |
| (6) | The Fund commenced operations on December 7, 2023. The Beginning Account Value is representative of this commencement date. |
| (7) | The Fund commenced operations on December 12, 2023. The Beginning Account Value is representative of this commencement date. |
| (8) | The Fund commenced operations on December 14, 2023. The Beginning Account Value is representative of this commencement date. |
2
Themes Airlines ETF
Schedule of Investments
as of March 31, 2024 (Unaudited)
Sector Diversification as of March 31, 2024

Percentages are stated as a percent of net assets.
| Shares | Value | |||||||
| COMMON STOCKS – 99.4% | ||||||||
| Industrial Services – 99.4%(a) | ||||||||
| Air Canada(b) | 1,567 | $ | 22,686 | |||||
| Air France-KLM(b) | 1,054 | 11,742 | ||||||
| Air Transport Services Group, Inc.(b) | 450 | 6,192 | ||||||
| Alaska Air Group, Inc.(b) | 620 | 26,653 | ||||||
| Allegiant Travel Co. | 143 | 10,755 | ||||||
| American Airlines Group, Inc.(b) | 1,596 | 24,499 | ||||||
| ANA Holdings, Inc. | 1,100 | 22,961 | ||||||
| Cathay Pacific Airways Ltd. | 5,470 | 6,213 | ||||||
| Copa Holdings SA – Class A | 230 | 23,957 | ||||||
| Delta Air Lines, Inc. | 546 | 26,137 | ||||||
| Deutsche Lufthansa AG | 2,681 | 21,060 | ||||||
| easyJet PLC | 3,543 | 25,524 | ||||||
| Exchange Income Corp. | 395 | 14,438 | ||||||
| Frontier Group Holdings, Inc.(b) | 349 | 2,830 | ||||||
| Hawaiian Holdings, Inc.(b) | 433 | 5,772 | ||||||
| International Consolidated Airlines Group SA(b) | 11,999 | 26,767 | ||||||
| Japan Airlines Co. Ltd. | 1,200 | 22,758 | ||||||
| JetBlue Airways Corp.(b) | 3,011 | 22,342 | ||||||
| Mainfreight Ltd. | 524 | 21,821 | ||||||
| Norwegian Air Shuttle ASA | 6,152 | 9,276 | ||||||
| Qantas Airways Ltd.(b) | 6,319 | 22,442 | ||||||
| Ryanair Holdings PLC – ADR | 179 | 26,061 | ||||||
| Singapore Airlines Ltd. | 4,679 | 22,178 | ||||||
| Skymark Airlines, Inc. | 300 | 1,996 | ||||||
| SkyWest, Inc.(b) | 360 | 24,869 | ||||||
| Southwest Airlines Co. | 774 | 22,593 | ||||||
| Spirit Airlines, Inc. | 986 | 4,772 | ||||||
| Sun Country Airlines Holdings, Inc.(b) | 320 | 4,829 | ||||||
| United Airlines Holdings, Inc.(b) | 519 | 24,850 | ||||||
| Wizz Air Holdings PLC(b)(c) | 699 | 18,933 | ||||||
| 527,906 | ||||||||
| TOTAL COMMON STOCKS (Cost $500,587) | 527,906 | |||||||
| SHORT-TERM INVESTMENTS – 0.5% | ||||||||
| Money Market Funds – 0.5% | ||||||||
| First American Treasury Obligations Fund – Class X, 5.22%(d) | 2,562 | 2,562 | ||||||
| TOTAL SHORT-TERM INVESTMENTS (Cost $2,562) | 2,562 | |||||||
| TOTAL INVESTMENTS – 99.9% (Cost $503,149) | $ | 530,468 | ||||||
| Other Assets in Excess of Liabilities – 0.1% | 458 | |||||||
| TOTAL NET ASSETS – 100.0% | $ | 530,926 | ||||||
Percentages are stated as a percent of net assets.
ADR – American Depositary Receipt
3
Themes ETF Trust
Themes Airlines ETF
Schedule of Investments (Continued)
as of March 31, 2024 (Unaudited)
AG – Aktiengesellschaft
ASA – Advanced Subscription Agreement
PLC – Public Limited Company
SA – Sociedad Anónima
| (a) | To the extent that the Fund invests more heavily in a particular industry or sector of the economy, its performance will be especially sensitive to developments that significantly affect those industries or sectors. |
| (b) | Non-income producing security. |
| (c) | Security is exempt from registration pursuant to Rule 144A under the Securities Act of 1933, as amended. These securities may only be resold in transactions exempt from registration to qualified institutional investors. As of March 31, 2024, the value of these securities total $18,933 or 3.6% of the Fund’s net assets. |
| (d) | The rate shown represents the 7-day effective yield as of March 31, 2024. |
4
Themes ETF Trust
Themes Cloud Computing ETF
Schedule of Investments
as of March 31, 2024 (Unaudited)
Sector Diversification as of March 31, 2024
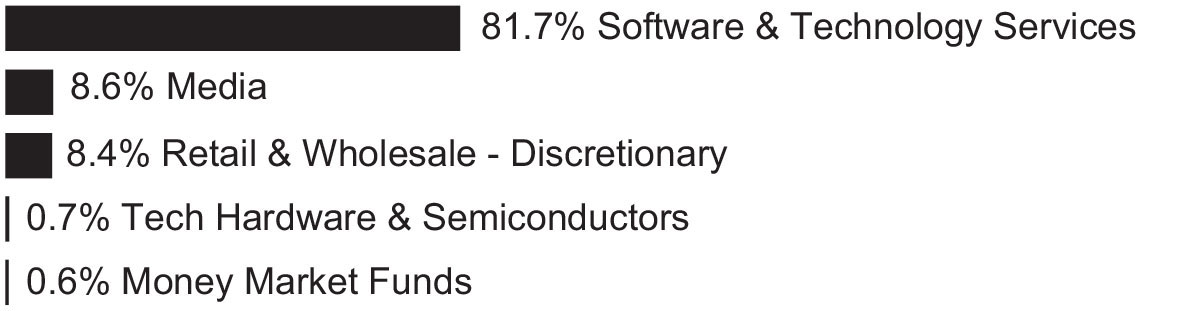
Percentages are stated as a percent of net assets.
| Shares | Value | |||||||
| COMMON STOCKS – 99.4% | ||||||||
| Media – 8.6% | ||||||||
| Alphabet, Inc. – Class A(a) | 406 | $ | 61,277 | |||||
| GoDaddy, Inc. – Class A(a) | 95 | 11,275 | ||||||
| Prosus NV | 1,005 | 31,525 | ||||||
| VeriSign, Inc.(a) | 62 | 11,750 | ||||||
| 115,827 | ||||||||
| Retail & Wholesale – Discretionary – 8.4% | ||||||||
| Amazon.com, Inc.(a) | 376 | 67,823 | ||||||
| MercadoLibre, Inc.(a) | 30 | 45,359 | ||||||
| 113,182 | ||||||||
| Software & Technology Services – 81.7%(b) | ||||||||
| Adobe, Inc.(a) | 98 | 49,451 | ||||||
| Akamai Technologies, Inc.(a) | 102 | 11,094 | ||||||
| ANSYS, Inc.(a) | 59 | 20,482 | ||||||
| Atlassian Corp. – Class A(a) | 105 | 20,487 | ||||||
| Autodesk, Inc.(a) | 146 | 38,021 | ||||||
| Booz Allen Hamilton Holding Corp. | 88 | 13,063 | ||||||
| CACI International, Inc. – Class A(a) | 15 | 5,682 | ||||||
| Cadence Design Systems, Inc.(a) | 184 | 57,276 | ||||||
| Check Point Software Technologies Ltd.(a) | 62 | 10,169 | ||||||
| Cloudflare, Inc. – Class A(a) | 195 | 18,882 | ||||||
| CommVault Systems, Inc.(a) | 30 | 3,043 | ||||||
| Confluent, Inc. – Class A(a) | 140 | 4,273 | ||||||
| Crowdstrike Holdings, Inc. – Class A(a) | 150 | 48,089 | ||||||
| CyberArk Software Ltd.(a) | 28 | 7,438 | ||||||
| Dassault Systemes SE | 456 | 20,190 | ||||||
| Datadog, Inc. – Class A(a) | 195 | 24,102 | ||||||
| Dropbox, Inc. – Class A(a) | 170 | 4,131 | ||||||
| Dynatrace, Inc.(a) | 176 | 8,173 | ||||||
| Fortinet, Inc.(a) | 456 | 31,150 | ||||||
| Gen Digital, Inc. | 424 | 9,498 | ||||||
| HubSpot, Inc.(a) | 32 | 20,050 | ||||||
| Intuit, Inc. | 95 | 61,750 | ||||||
| Microsoft Corp. | 151 | 63,528 | ||||||
| MongoDB, Inc.(a) | 47 | 16,856 | ||||||
| Nice Ltd. – ADR(a) | 43 | 11,207 | ||||||
| Nutanix, Inc. – Class A(a) | 165 | 10,184 | ||||||
5
Themes ETF Trust
Themes Cloud Computing ETF
Schedule of Investments (Continued)
as of March 31, 2024 (Unaudited)
| Shares | Value | |||||||
| Software & Technology Services – 81.7%(b) (Continued) | ||||||||
| Okta, Inc.(a) | 100 | $ | 10,462 | |||||
| Oracle Corp. | 556 | 69,838 | ||||||
| Palo Alto Networks, Inc.(a) | 183 | 51,996 | ||||||
| Salesforce, Inc. | 219 | 65,957 | ||||||
| SAP SE | 366 | 71,256 | ||||||
| ServiceNow, Inc.(a) | 81 | 61,754 | ||||||
| Snowflake, Inc. – Class A(a) | 185 | 29,896 | ||||||
| Synopsys, Inc.(a) | 103 | 58,865 | ||||||
| The Sage Group PLC | 686 | 10,957 | ||||||
| Trend Micro, Inc. | 100 | 5,063 | ||||||
| Twilio, Inc. – Class A(a) | 123 | 7,521 | ||||||
| Wix.com Ltd.(a) | 36 | 4,949 | ||||||
| Workday, Inc. – Class A(a) | 141 | 38,458 | ||||||
| Zoom Video Communications, Inc. – Class A(a) | 170 | 11,113 | ||||||
| Zscaler, Inc.(a) | 60 | 11,558 | ||||||
| 1,097,912 | ||||||||
| Tech Hardware & Semiconductors – 0.7% | ||||||||
| F5, Inc.(a) | 40 | 7,584 | ||||||
| InterDigital, Inc. | 16 | 1,703 | ||||||
| 9,287 | ||||||||
| TOTAL COMMON STOCKS (Cost $1,309,572) | 1,336,208 | |||||||
| SHORT-TERM INVESTMENTS – 0.6% | ||||||||
| Money Market Funds – 0.6% | ||||||||
| First American Treasury Obligations Fund – Class X, 5.22%(c) | 7,657 | 7,657 | ||||||
| TOTAL SHORT-TERM INVESTMENTS (Cost $7,657) | 7,657 | |||||||
| TOTAL INVESTMENTS – 100.0% (Cost $1,317,229) | $ | 1,343,865 | ||||||
| Liabilities in Excess of Other Assets – 0.0%(d) | (628 | ) | ||||||
| TOTAL NET ASSETS – 100.0% | $ | 1,343,237 | ||||||
Percentages are stated as a percent of net assets.
ADR – American Depositary Receipt
NV – Naamloze Vennootschap
PLC – Public Limited Company
| (a) | Non-income producing security. |
| (b) | To the extent that the Fund invests more heavily in a particular industry or sector of the economy, its performance will be especially sensitive to developments that significantly affect those industries or sectors. |
| (c) | The rate shown represents the 7-day effective yield as of March 31, 2024. |
| (d) | Represents less than 0.05% of net assets. |
6
Themes ETF Trust
Themes Cybersecurity ETF
Schedule of Investments
as of March 31, 2024 (Unaudited)
Sector Diversification as of March 31, 2024
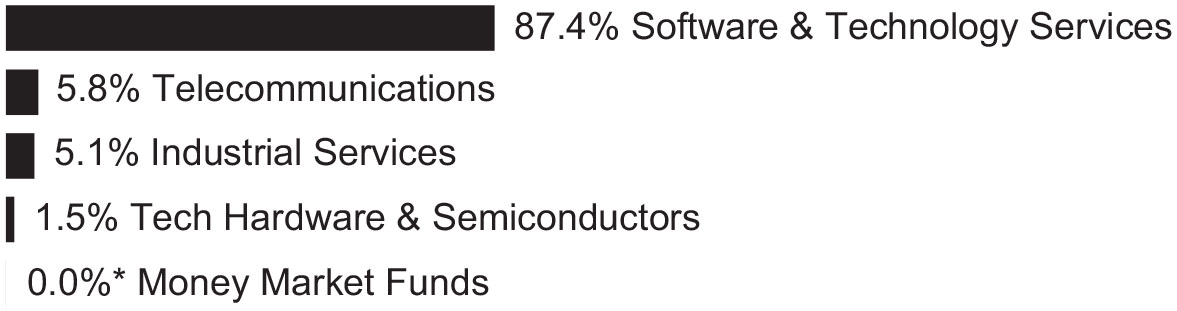
Percentages are stated as a percent of net assets.
| * | Amount is less than 0.05%. |
| Shares | Value | |||||||
| COMMON STOCKS – 99.8% | ||||||||
| Industrial Services – 5.1% | ||||||||
| Alarm.com Holdings, Inc.(a) | 962 | $ | 69,716 | |||||
| Software & Technology Services – 87.4%(b) | ||||||||
| BlackBerry Ltd.(a) | 12,701 | 35,055 | ||||||
| Booz Allen Hamilton Holding Corp. | 465 | 69,026 | ||||||
| CACI International, Inc. – Class A(a) | 180 | 68,189 | ||||||
| Change Holdings, Inc. | 900 | 7,586 | ||||||
| Check Point Software Technologies Ltd.(a) | 380 | 62,324 | ||||||
| Clear Secure, Inc. – Class A | 1,871 | 39,796 | ||||||
| Crowdstrike Holdings, Inc. – Class A(a) | 209 | 67,003 | ||||||
| Cyber Security Cloud, Inc.(a) | 300 | 5,698 | ||||||
| CyberArk Software Ltd.(a) | 270 | 71,720 | ||||||
| Darktrace PLC(a) | 10,601 | 58,444 | ||||||
| Digital Arts, Inc. | 400 | 11,428 | ||||||
| ELEMENTS, Inc.(a) | 300 | 1,732 | ||||||
| Everbridge, Inc.(a) | 910 | 31,695 | ||||||
| Fastly, Inc. – Class A(a) | 2,710 | 35,149 | ||||||
| FFRI Security, Inc. | 300 | 3,882 | ||||||
| Fortinet, Inc.(a) | 962 | 65,713 | ||||||
| Hennge KK(a) | 400 | 3,195 | ||||||
| Netcompany Group A/S(a)(c) | 977 | 40,274 | ||||||
| Okta, Inc.(a) | 702 | 73,444 | ||||||
| OneSpan, Inc.(a) | 745 | 8,664 | ||||||
| Palo Alto Networks, Inc.(a) | 186 | 52,848 | ||||||
| Qualys, Inc.(a) | 311 | 51,897 | ||||||
| Radware Ltd.(a) | 801 | 14,995 | ||||||
| Rapid7, Inc.(a) | 1,086 | 53,257 | ||||||
| Safie, Inc.(a) | 400 | 1,686 | ||||||
| SentinelOne, Inc. – Class A(a) | 2,407 | 56,107 | ||||||
| Tenable Holdings, Inc.(a) | 1,275 | 63,023 | ||||||
| Trend Micro, Inc. | 1,000 | 50,634 | ||||||
| Varonis Systems, Inc.(a) | 1,301 | 61,368 | ||||||
| Zscaler, Inc.(a) | 259 | 49,891 | ||||||
| 1,215,723 | ||||||||
| Tech Hardware & Semiconductors – 1.5% | ||||||||
| A10 Networks, Inc. | 1,532 | 20,973 | ||||||
7
Themes ETF Trust
Themes Cybersecurity ETF
Schedule of Investments (Continued)
as of March 31, 2024 (Unaudited)
| Shares | Value | |||||||
| Telecommunications – 5.8% | ||||||||
| Applied Digital Corp.(a) | 1,406 | $ | 6,018 | |||||
| NEXTDC Ltd.(a) | 6,481 | 75,133 | ||||||
| 81,151 | ||||||||
| TOTAL COMMON STOCKS (Cost $1,337,357) | 1,387,563 | |||||||
| SHORT-TERM INVESTMENTS – 0.0%(d) | ||||||||
| Money Market Funds – 0.0%(d) | ||||||||
| First American Treasury Obligations Fund – Class X, 5.22%(e) | 244 | 244 | ||||||
| TOTAL SHORT-TERM INVESTMENTS (Cost $244) | 244 | |||||||
| TOTAL INVESTMENTS – 99.8% (Cost $1,337,601) | $ | 1,387,807 | ||||||
| Other Assets in Excess of Liabilities – 0.2% | 2,357 | |||||||
| TOTAL NET ASSETS – 100.0% | $ | 1,390,164 | ||||||
Percentages are stated as a percent of net assets.
PLC – Public Limited Company
| (a) | Non-income producing security. |
| (b) | To the extent that the Fund invests more heavily in a particular industry or sector of the economy, its performance will be especially sensitive to developments that significantly affect those industries or sectors. |
| (c) | Security is exempt from registration pursuant to Rule 144A under the Securities Act of 1933, as amended. These securities may only be resold in transactions exempt from registration to qualified institutional investors. As of March 31, 2024, the value of these securities total $40,274 or 2.9% of the Fund’s net assets. |
| (d) | Represents less than 0.05% of net assets. |
| (e) | The rate shown represents the 7-day effective yield as of March 31, 2024. |
8
Themes ETF Trust
Themes European Luxury ETF
Schedule of Investments
as of March 31, 2024 (Unaudited)
Sector Diversification as of March 31, 2024

Percentages are stated as a percent of net assets.
| Shares | Value | |||||||
| COMMON STOCKS – 95.5% | ||||||||
| Consumer Discretionary Products – 63.5%(a) | ||||||||
| Aston Martin Lagonda Global Holdings PLC(b)(c) | 7,425 | $ | 15,922 | |||||
| Beneteau SACA | 1,464 | 21,607 | ||||||
| Burberry Group PLC | 1,149 | 17,591 | ||||||
| Capri Holdings Ltd.(b) | 354 | 16,036 | ||||||
| Cie Financiere Richemont SA | 134 | 20,430 | ||||||
| Coats Group PLC | 19,716 | 20,181 | ||||||
| Ermenegildo Zegna NV | 1,759 | 25,770 | ||||||
| Ferrari NV | 52 | 22,665 | ||||||
| Hermes International SCA | 9 | 22,973 | ||||||
| Kering SA – ADR | 472 | 18,701 | ||||||
| LVMH Moet Hennessy Louis Vuitton SE | 25 | 22,486 | ||||||
| PRADA SpA | 3,068 | 24,303 | ||||||
| Salvatore Ferragamo SpA | 1,529 | 18,591 | ||||||
| The Swatch Group AG | 73 | 16,950 | ||||||
| Tod’s SpA(b) | 535 | 24,819 | ||||||
| Watches of Switzerland Group PLC(b)(c) | 3,669 | 16,606 | ||||||
| 325,631 | ||||||||
| Consumer Discretionary Services – 16.5% | ||||||||
| Accor SA | 467 | 21,816 | ||||||
| InterContinental Hotels Group PLC | 192 | 19,973 | ||||||
| Playa Hotels & Resorts NV(b) | 2,230 | 21,631 | ||||||
| TUI AG(b) | 2,589 | 21,338 | ||||||
| 84,758 | ||||||||
| Consumer Staple Products – 3.9% | ||||||||
| Interparfums SA | 358 | 20,161 | ||||||
| Materials – 4.0% | ||||||||
| Givaudan SA – ADR | 231 | 20,611 | ||||||
| Retail & Wholesale – Discretionary – 7.6% | ||||||||
| Brunello Cucinelli SpA | 195 | 22,300 | ||||||
| HUGO BOSS AG | 286 | 16,853 | ||||||
| 39,153 | ||||||||
| TOTAL COMMON STOCKS (Cost $468,578) | 490,314 | |||||||
9
Themes ETF Trust
Themes European Luxury ETF
Schedule of Investments (Continued)
as of March 31, 2024 (Unaudited)
| Shares | Value | |||||||
| PREFERRED STOCKS – 3.9% | ||||||||
| Consumer Discretionary Products – 3.9% | ||||||||
| Porsche Automobil Holding SE | 373 | $ | 19,766 | |||||
| TOTAL PREFERRED STOCKS (Cost $19,808) | 19,766 | |||||||
| SHORT-TERM INVESTMENTS – 0.3% | ||||||||
| Money Market Funds – 0.3% | ||||||||
| First American Treasury Obligations Fund – Class X, 5.22%(d) | 1,284 | 1,284 | ||||||
| TOTAL SHORT-TERM INVESTMENTS (Cost $1,284) | 1,284 | |||||||
| TOTAL INVESTMENTS – 99.7% (Cost $489,670) | $ | 511,364 | ||||||
| Other Assets in Excess of Liabilities – 0.3% | 1,561 | |||||||
| TOTAL NET ASSETS – 100.0% | $ | 512,925 | ||||||
Percentages are stated as a percent of net assets.
ADR – American Depositary Receipt
AG – Aktiengesellschaft
NV – Naamloze Vennootschap
PLC – Public Limited Company
SA – Sociedad Anónima
| (a) | To the extent that the Fund invests more heavily in a particular industry or sector of the economy, its performance will be especially sensitive to developments that significantly affect those industries or sectors. |
| (b) | Non-income producing security. |
| (c) | Security is exempt from registration pursuant to Rule 144A under the Securities Act of 1933, as amended. These securities may only be resold in transactions exempt from registration to qualified institutional investors. As of March 31, 2024, the value of these securities total $32,528 or 6.3% of the Fund’s net assets. |
| (d) | The rate shown represents the 7-day effective yield as of March 31, 2024. |
10
Themes ETF Trust
Themes Generative Artificial Intelligence ETF
Schedule of Investments
as of March 31, 2024 (Unaudited)
Sector Diversification as of March 31, 2024
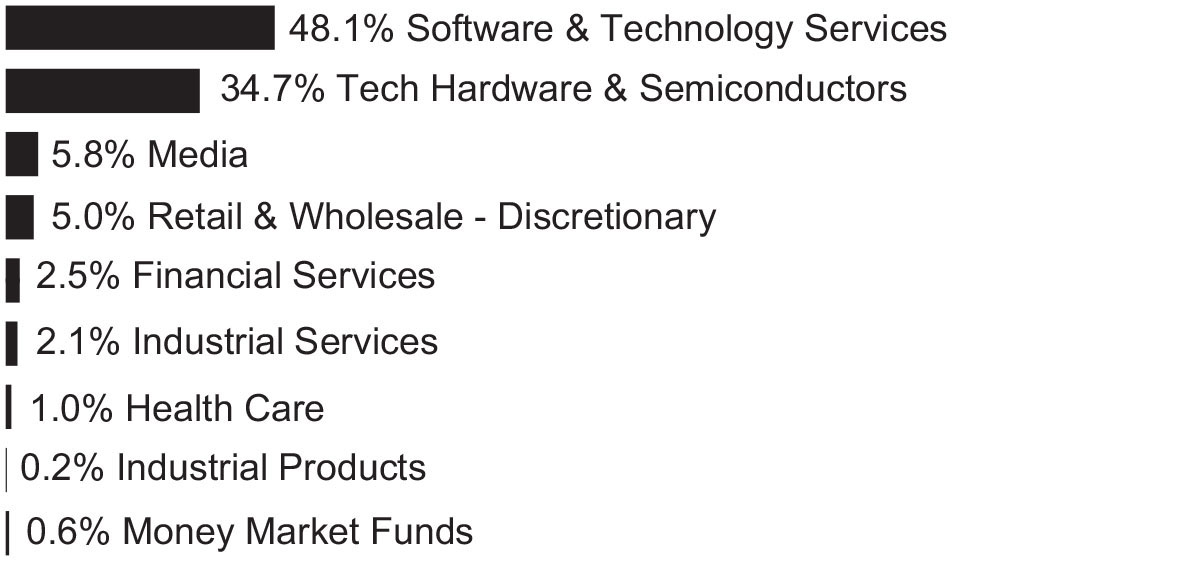
Percentages are stated as a percent of net assets.
| Shares | Value | |||||||
| COMMON STOCKS – 99.4% | ||||||||
| Financial Services – 2.5% | ||||||||
| Upstart Holdings, Inc.(a) | 18,673 | $ | 502,117 | |||||
| Health Care – 1.0% | ||||||||
| Exscientia PLC – ADR(a) | 33,801 | 193,342 | ||||||
| Industrial Products – 0.2% | ||||||||
| Evolv Technologies Holdings, Inc.(a) | 9,356 | 41,634 | ||||||
| Industrial Services – 2.1% | ||||||||
| CorVel Corp.(a) | 1,621 | 426,258 | ||||||
| Media – 5.8% | ||||||||
| Alphabet, Inc. – Class A(a) | 6,557 | 989,648 | ||||||
| Meta Platforms, Inc. – Class A | 364 | 176,751 | ||||||
| 1,166,399 | ||||||||
| Retail & Wholesale – Discretionary – 5.0% | ||||||||
| Amazon.com, Inc.(a) | 5,663 | 1,021,492 | ||||||
| Software & Technology Services – 48.1%(b) | ||||||||
| Accenture PLC – Class A | 681 | 236,041 | ||||||
| Augmedix, Inc.(a) | 80,962 | 331,135 | ||||||
| Bairong, Inc.(a)(c) | 597,178 | 845,383 | ||||||
| BigBear.ai Holdings, Inc.(a) | 33,750 | 69,188 | ||||||
| C3.ai, Inc. – Class A(a) | 25,280 | 684,330 | ||||||
| Cerence, Inc.(a) | 19,007 | 299,360 | ||||||
| ExlService Holdings, Inc.(a) | 11,440 | 363,792 | ||||||
| Fair Isaac Corp.(a) | 408 | 509,841 | ||||||
| Five9, Inc.(a) | 7,377 | 458,185 | ||||||
| Grid Dynamics Holdings, Inc.(a) | 10,776 | 132,437 | ||||||
| Heroz, Inc.(a) | 59,800 | 653,779 | ||||||
| International Business Machines Corp. | 542 | 103,500 | ||||||
| Microsoft Corp. | 2,240 | 942,412 | ||||||
| Northern Data AG(a) | 14,541 | 421,212 | ||||||
| PKSHA Technology, Inc.(a) | 19,900 | 709,869 | ||||||
11
Themes ETF Trust
Themes Generative Artificial Intelligence ETF
Schedule of Investments (Continued)
as of March 31, 2024 (Unaudited)
| Shares | Value | |||||||
| Software & Technology Services – 48.1%(b) (Continued) | ||||||||
| Salesforce, Inc. | 1,125 | $ | 338,828 | |||||
| Snowflake, Inc. – Class A(a) | 106 | 17,130 | ||||||
| SoundHound AI, Inc. – Class A(a) | 53,858 | 317,224 | ||||||
| Synopsys, Inc.(a) | 1,088 | 621,792 | ||||||
| TELUS International CDA, Inc.(a) | 38,906 | 329,447 | ||||||
| UiPath, Inc. – Class A(a) | 30,570 | 693,022 | ||||||
| Verisk Analytics, Inc. | 511 | 120,458 | ||||||
| Zeta Global Holdings Corp. – Class A(a) | 56,857 | 621,447 | ||||||
| 9,819,812 | ||||||||
| Tech Hardware & Semiconductors – 34.7%(b) | ||||||||
| Advanced Micro Devices, Inc.(a) | 5,584 | 1,007,856 | ||||||
| Ambarella, Inc.(a) | 12,076 | 613,099 | ||||||
| Apple, Inc. | 1,512 | 259,278 | ||||||
| Arista Networks, Inc.(a) | 1,614 | 468,028 | ||||||
| CEVA, Inc.(a) | 35,143 | 798,098 | ||||||
| Intel Corp. | 20,113 | 888,391 | ||||||
| Lattice Semiconductor Corp.(a) | 10,875 | 850,751 | ||||||
| NVIDIA Corp. | 1,390 | 1,255,948 | ||||||
| QuickLogic Corp.(a) | 56,599 | 907,282 | ||||||
| 7,048,731 | ||||||||
| TOTAL COMMON STOCKS (Cost $20,510,771) | 20,219,785 | |||||||
| SHORT-TERM INVESTMENTS – 0.6% | ||||||||
| Money Market Funds – 0.6% | ||||||||
| First American Treasury Obligations Fund – Class X, 5.22%(d) | 129,407 | 129,407 | ||||||
| TOTAL SHORT-TERM INVESTMENTS (Cost $129,407) | 129,407 | |||||||
| TOTAL INVESTMENTS – 100.0% (Cost $20,640,178) | $ | 20,349,192 | ||||||
| Other Assets in Excess of Liabilities – 0.0%(e) | 3,458 | |||||||
| TOTAL NET ASSETS – 100.0% | $ | 20,352,650 | ||||||
Percentages are stated as a percent of net assets.
ADR – American Depositary Receipt
AG – Aktiengesellschaft
PLC – Public Limited Company
| (a) | Non-income producing security. |
| (b) | To the extent that the Fund invests more heavily in a particular industry or sector of the economy, its performance will be especially sensitive to developments that significantly affect those industries or sectors. |
| (c) | Security is exempt from registration pursuant to Rule 144A under the Securities Act of 1933, as amended. These securities may only be resold in transactions exempt from registration to qualified institutional investors. As of March 31, 2024, the value of these securities total $845,383 or 4.2% of the Fund’s net assets. |
| (d) | The rate shown represents the 7-day effective yield as of March 31, 2024. |
| (e) | Represents less than 0.05% of net assets. |
12
Themes ETF Trust
Themes Global Systemically Important Banks ETF
Schedule of Investments
as of March 31, 2024 (Unaudited)
Sector Diversification as of March 31, 2024

Percentages are stated as a percent of net assets.
| Shares | Value | |||||||
| COMMON STOCKS – 99.6% | ||||||||
| Banking – 81.7%(a) | ||||||||
| Agricultural Bank of China Ltd. – Class H | 46,012 | $ | 19,399 | |||||
| Banco Santander SA – ADR | 4,327 | 20,942 | ||||||
| Bank of America Corp. | 531 | 20,136 | ||||||
| Bank of China Ltd. – Class H | 46,731 | 19,285 | ||||||
| Bank of Communications Co. Ltd. – Class H | 28,592 | 18,777 | ||||||
| Barclays PLC – ADR | 2,104 | 19,883 | ||||||
| BNP Paribas SA – ADR | 566 | 20,229 | ||||||
| China Construction Bank Corp. – Class H | 30,643 | 18,479 | ||||||
| Citigroup, Inc. | 323 | 20,426 | ||||||
| Credit Agricole SA – ADR | 2,685 | 19,923 | ||||||
| Deutsche Bank AG | 1,288 | 20,311 | ||||||
| HSBC Holdings PLC – ADR | 494 | 19,444 | ||||||
| Industrial & Commercial Bank of China Ltd. – ADR | 1,849 | 18,523 | ||||||
| ING Groep NV – ADR | 1,239 | 20,432 | ||||||
| JPMorgan Chase & Co. | 101 | 20,230 | ||||||
| Mitsubishi UFJ Financial Group, Inc. – ADR | 1,844 | 18,864 | ||||||
| Mizuho Financial Group, Inc. – ADR | 4,831 | 19,227 | ||||||
| Royal Bank of Canada | 190 | 19,167 | ||||||
| Societe Generale SA – ADR | 3,672 | 19,939 | ||||||
| Standard Chartered PLC – ADR | 1,135 | 19,545 | ||||||
| Sumitomo Mitsui Financial Group, Inc. – ADR | 1,628 | 19,162 | ||||||
| Toronto-Dominion Bank | 315 | 19,020 | ||||||
| Wells Fargo & Co. | 329 | 19,069 | ||||||
| 450,412 | ||||||||
| Financial Services – 17.9% | ||||||||
| Bank of New York Mellon Corp. | 347 | 19,994 | ||||||
| Goldman Sachs Group, Inc. | 48 | 20,049 | ||||||
| Morgan Stanley | 213 | 20,056 | ||||||
| State Street Corp. | 264 | 20,413 | ||||||
| UBS Group AG | 600 | 18,432 | ||||||
| 98,944 | ||||||||
| TOTAL COMMON STOCKS (Cost $501,972) | 549,356 | |||||||
13
Themes ETF Trust
Themes Global Systemically Important Banks ETF
Schedule of Investments (Continued)
as of March 31, 2024 (Unaudited)
| Shares | Value | |||||||
| SHORT-TERM INVESTMENTS – 0.1% | ||||||||
| Money Market Funds – 0.1% | ||||||||
| First American Treasury Obligations Fund – Class X, 5.22%(b) | 761 | $ | 761 | |||||
| TOTAL SHORT-TERM INVESTMENTS (Cost $761) | 761 | |||||||
| TOTAL INVESTMENTS – 99.7% (Cost $502,733) | $ | 550,117 | ||||||
| Other Assets in Excess of Liabilities – 0.3% | 1,582 | |||||||
| TOTAL NET ASSETS – 100.0% | $ | 551,699 | ||||||
Percentages are stated as a percent of net assets.
ADR – American Depositary Receipt
AG – Aktiengesellschaft
NV – Naamloze Vennootschap
PLC – Public Limited Company
SA – Sociedad Anónima
| (a) | To the extent that the Fund invests more heavily in a particular industry or sector of the economy, its performance will be especially sensitive to developments that significantly affect those industries or sectors. |
| (b) | The rate shown represents the 7-day effective yield as of March 31, 2024. |
14
Themes ETF Trust
Themes Gold Miners ETF
Schedule of Investments
as of March 31, 2024 (Unaudited)
Sector Diversification as of March 31, 2024

Percentages are stated as a percent of net assets.
| Shares | Value | |||||||
| COMMON STOCKS – 99.5% | ||||||||
| Materials – 99.5%(a) | ||||||||
| Agnico Eagle Mines Ltd. | 1,239 | $ | 73,880 | |||||
| Alamos Gold, Inc. – Class A | 4,904 | 72,299 | ||||||
| Anglogold Ashanti PLC | 3,364 | 74,681 | ||||||
| B2Gold Corp. | 22,611 | 59,259 | ||||||
| Capricorn Metals Ltd.(b) | 15,649 | 52,518 | ||||||
| Centamin PLC | 49,870 | 71,063 | ||||||
| De Grey Mining Ltd.(b) | 73,394 | 60,501 | ||||||
| Endeavour Mining PLC | 3,513 | 71,373 | ||||||
| Equinox Gold Corp.(b) | 12,452 | 75,105 | ||||||
| Gold Fields Ltd. – ADR | 4,256 | 67,628 | ||||||
| Gold Road Resources Ltd. | 51,133 | 52,647 | ||||||
| IAMGOLD Corp.(b) | 22,480 | 75,014 | ||||||
| K92 Mining, Inc.(b) | 11,240 | 52,277 | ||||||
| Kinross Gold Corp. | 11,191 | 68,655 | ||||||
| Lundin Gold, Inc. | 4,992 | 70,169 | ||||||
| Northern Star Resources Ltd. | 6,897 | 65,034 | ||||||
| OceanaGold Corp. | 28,535 | 64,462 | ||||||
| Perseus Mining Ltd. | 52,738 | 73,888 | ||||||
| Ramelius Resources Ltd. | 55,781 | 67,610 | ||||||
| Regis Resources Ltd.(b) | 38,120 | 50,054 | ||||||
| Torex Gold Resources, Inc.(b) | 4,328 | 63,711 | ||||||
| Zhaojin Mining Industry Co. Ltd. – Class H | 60,655 | 82,301 | ||||||
| 1,464,129 | ||||||||
| TOTAL COMMON STOCKS (Cost $1,305,164) | 1,464,129 | |||||||
| SHORT-TERM INVESTMENTS – 0.2% | ||||||||
| Money Market Funds – 0.2% | ||||||||
| First American Treasury Obligations Fund – Class X, 5.22%(c) | 3,585 | 3,585 | ||||||
| TOTAL SHORT-TERM INVESTMENTS (Cost $3,585) | 3,585 | |||||||
| TOTAL INVESTMENTS – 99.7% (Cost $1,308,749) | $ | 1,467,714 | ||||||
| Other Assets in Excess of Liabilities – 0.3% | 4,816 | |||||||
| TOTAL NET ASSETS – 100.0% | $ | 1,472,529 | ||||||
Percentages are stated as a percent of net assets.
ADR – American Depositary Receipt
PLC – Public Limited Company
| (a) | To the extent that the Fund invests more heavily in a particular industry or sector of the economy, its performance will be especially sensitive to developments that significantly affect those industries or sectors. |
| (b) | Non-income producing security. |
| (c) | The rate shown represents the 7-day effective yield as of March 31, 2024. |
15
Themes ETF Trust
Themes Natural Monopoly ETF
Schedule of Investments
as of March 31, 2024 (Unaudited)
Sector Diversification as of March 31, 2024
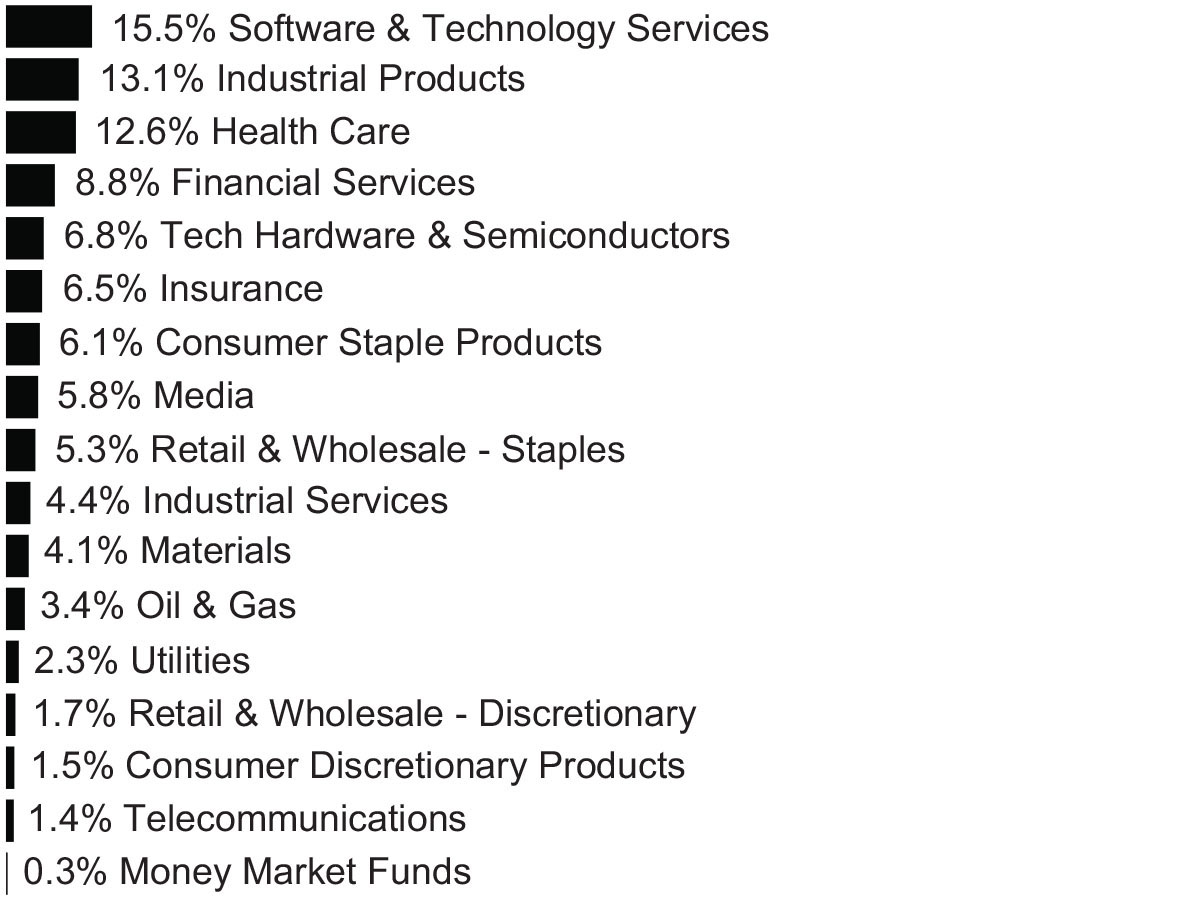
Percentages are stated as a percent of net assets.
| Shares | Value | |||||||
| COMMON STOCKS – 99.3% | ||||||||
| Consumer Discretionary Products – 1.5% | ||||||||
| Ferrari NV | 10 | $ | 4,358 | |||||
| Stellantis NV | 148 | 4,207 | ||||||
| 8,565 | ||||||||
| Consumer Staple Products – 6.1% | ||||||||
| British American Tobacco PLC | 213 | 6,469 | ||||||
| Coca-Cola Co. | 106 | 6,485 | ||||||
| General Mills, Inc. | 96 | 6,717 | ||||||
| Haleon PLC | 276 | 1,160 | ||||||
| PepsiCo, Inc. | 36 | 6,300 | ||||||
| Procter & Gamble Co. | 42 | 6,815 | ||||||
| 33,946 | ||||||||
| Financial Services – 8.8% | ||||||||
| Blackstone, Inc. | 123 | 16,159 | ||||||
| Singapore Exchange Ltd. | 2,146 | 14,638 | ||||||
| Synchrony Financial | 423 | 18,239 | ||||||
| 49,036 | ||||||||
| Health Care – 12.6% | ||||||||
| AbbVie, Inc. | 67 | 12,200 | ||||||
| Amgen, Inc. | 36 | 10,236 | ||||||
| FUJIFILM Holdings Corp. | 300 | 6,714 | ||||||
| IQVIA Holdings, Inc.(a) | 7 | 1,770 | ||||||
| Johnson & Johnson | 66 | 10,441 | ||||||
16
Themes ETF Trust
Themes Natural Monopoly ETF
Schedule of Investments (Continued)
as of March 31, 2024 (Unaudited)
| Shares | Value | |||||||
| Health Care – 12.6% (Continued) | ||||||||
| Laboratory Corp of America Holdings | 8 | $ | 1,748 | |||||
| Novo Nordisk A/S | 100 | 12,746 | ||||||
| Ramsay Health Care Ltd. | 48 | 1,768 | ||||||
| Siemens Healthineers AG(b) | 29 | 1,775 | ||||||
| Vertex Pharmaceuticals, Inc.(a) | 25 | 10,450 | ||||||
| 69,848 | ||||||||
| Industrial Products – 13.1% | ||||||||
| AMETEK, Inc. | 32 | 5,853 | ||||||
| Assa Abloy AB – Class B | 169 | 4,849 | ||||||
| Atlas Copco AB – Class A | 283 | 4,780 | ||||||
| General Dynamics Corp. | 57 | 16,102 | ||||||
| Halma PLC | 508 | 15,183 | ||||||
| Hexagon AB – Class B | 1,231 | 14,571 | ||||||
| Nibe Industrier AB – Class B(a) | 494 | 2,426 | ||||||
| Schneider Electric SE | 24 | 5,428 | ||||||
| Snap-on, Inc. | 12 | 3,555 | ||||||
| 72,747 | ||||||||
| Industrial Services – 4.4% | ||||||||
| CSX Corp. | 69 | 2,558 | ||||||
| FedEx Corp. | 10 | 2,897 | ||||||
| Ferguson PLC | 5 | 1,092 | ||||||
| JB Hunt Transport Services, Inc. | 12 | 2,391 | ||||||
| Kuehne + Nagel International AG | 7 | 1,948 | ||||||
| Quanta Services, Inc. | 6 | 1,559 | ||||||
| Republic Services, Inc. | 8 | 1,532 | ||||||
| Rollins, Inc. | 67 | 3,100 | ||||||
| Vinci SA | 11 | 1,409 | ||||||
| Waste Connections, Inc. | 16 | 2,751 | ||||||
| Waste Management, Inc. | 7 | 1,492 | ||||||
| WSP Global, Inc. | 10 | 1,667 | ||||||
| 24,396 | ||||||||
| Insurance – 6.5% | ||||||||
| Aon PLC – Class A | 55 | 18,355 | ||||||
| Arthur J Gallagher & Co. | 71 | 17,753 | ||||||
| 36,108 | ||||||||
| Materials – 4.1% | ||||||||
| Agnico Eagle Mines Ltd. | 34 | 2,027 | ||||||
| BHP Group Ltd. | 52 | 1,500 | ||||||
| CRH PLC | 26 | 2,243 | ||||||
| Ecolab, Inc. | 12 | 2,771 | ||||||
| Holcim AG | 26 | 2,354 | ||||||
| James Hardie Industries PLC(a) | 46 | 1,847 | ||||||
| Linde PLC | 6 | 2,785 | ||||||
| Nippon Paint Holdings Co. Ltd. | 300 | 2,149 | ||||||
| Sherwin-Williams Co. | 8 | 2,779 | ||||||
| Sika AG | 8 | 2,383 | ||||||
| 22,838 | ||||||||
17
Themes ETF Trust
Themes Natural Monopoly ETF
Schedule of Investments (Continued)
as of March 31, 2024 (Unaudited)
| Shares | Value | |||||||
| Media – 5.8% | ||||||||
| Booking Holdings, Inc. | 1 | $ | 3,628 | |||||
| Charter Communications, Inc. – Class A(a) | 8 | 2,325 | ||||||
| Comcast Corp. – Class A | 67 | 2,904 | ||||||
| Meta Platforms, Inc. – Class A | 48 | 23,309 | ||||||
| 32,166 | ||||||||
| Oil & Gas – 3.4% | ||||||||
| Aker BP ASA | 130 | 3,231 | ||||||
| Delek Group Ltd. | 29 | 3,793 | ||||||
| Inpex Corp. | 300 | 4,556 | ||||||
| ORLEN SA | 227 | 3,699 | ||||||
| Woodside Energy Group Ltd. | 178 | 3,538 | ||||||
| 18,817 | ||||||||
| Retail & Wholesale – Discretionary – 1.7% | ||||||||
| Bunzl PLC | 26 | 1,000 | ||||||
| Genuine Parts Co. | 8 | 1,239 | ||||||
| ZOZO, Inc. | 300 | 7,426 | ||||||
| 9,665 | ||||||||
| Retail & Wholesale – Staples – 5.3% | ||||||||
| Dollar General Corp. | 52 | 8,115 | ||||||
| Dollar Tree, Inc.(a) | 47 | 6,258 | ||||||
| Endeavour Group Ltd. | 1,890 | 6,786 | ||||||
| Koninklijke Ahold Delhaize NV | 234 | 6,998 | ||||||
| Sysco Corp. | 15 | 1,218 | ||||||
| 29,375 | ||||||||
| Software & Technology Services – 15.5% | ||||||||
| Accenture PLC – Class A | 48 | 16,638 | ||||||
| Corpay, Inc.(a) | 9 | 2,777 | ||||||
| CoStar Group, Inc.(a) | 194 | 18,740 | ||||||
| Equifax, Inc. | 10 | 2,675 | ||||||
| Mastercard, Inc. – Class A | 6 | 2,889 | ||||||
| Open Text Corp. | 404 | 15,676 | ||||||
| Pro Medicus Ltd. | 26 | 1,758 | ||||||
| RELX PLC | 66 | 2,852 | ||||||
| The Sage Group PLC | 1,176 | 18,784 | ||||||
| Visa, Inc. – Class A | 10 | 2,791 | ||||||
| 85,580 | ||||||||
| Tech Hardware & Semiconductors – 6.8% | ||||||||
| Analog Devices, Inc. | 74 | 14,636 | ||||||
| Applied Materials, Inc. | 30 | 6,187 | ||||||
| Broadcom, Inc. | 13 | 17,231 | ||||||
| 38,054 | ||||||||
18
Themes ETF Trust
Themes Natural Monopoly ETF
Schedule of Investments (Continued)
as of March 31, 2024 (Unaudited)
| Shares | Value | |||||||
| Telecommunications – 1.4% | ||||||||
| Rogers Communications, Inc. – Class B | 36 | $ | 1,475 | |||||
| SoftBank Corp. | 100 | 1,282 | ||||||
| TELUS Corp. | 93 | 1,488 | ||||||
| T-Mobile US, Inc. | 10 | 1,632 | ||||||
| Verizon Communications, Inc. | 44 | 1,846 | ||||||
| 7,723 | ||||||||
| Utilities – 2.3% | ||||||||
| Eversource Energy | 42 | 2,510 | ||||||
| Fortis, Inc. | 66 | 2,608 | ||||||
| Iberdrola SA | 210 | 2,604 | ||||||
| National Grid PLC | 201 | 2,704 | ||||||
| NextEra Energy, Inc. | 43 | 2,748 | ||||||
| 13,174 | ||||||||
| TOTAL COMMON STOCKS (Cost $505,908) | 552,038 | |||||||
| SHORT-TERM INVESTMENTS – 0.3% | ||||||||
| Money Market Funds – 0.3% | ||||||||
| First American Treasury Obligations Fund – Class X, 5.22%(c) | 1,558 | 1,558 | ||||||
| TOTAL SHORT-TERM INVESTMENTS (Cost $1,558) | 1,558 | |||||||
| TOTAL INVESTMENTS – 99.6% (Cost $507,466) | $ | 553,596 | ||||||
| Other Assets in Excess of Liabilities – 0.4% | 2,232 | |||||||
| TOTAL NET ASSETS – 100.0% | $ | 555,828 | ||||||
Percentages are stated as a percent of net assets.
AG – Aktiengesellschaft
ASA – Advanced Subscription Agreement
NV – Naamloze Vennootschap
PLC – Public Limited Company
SA – Sociedad Anónima
| (a) | Non-income producing security. |
| (b) | Security is exempt from registration pursuant to Rule 144A under the Securities Act of 1933, as amended. These securities may only be resold in transactions exempt from registration to qualified institutional investors. As of March 31, 2024, the value of these securities total $1,775 or 0.3% of the Fund’s net assets. |
| (c) | The rate shown represents the 7-day effective yield as of March 31, 2024. |
19
Themes ETF Trust
Themes US Cash Flow Champions ETF
Schedule of Investments
as of March 31, 2024 (Unaudited)
Sector Diversification as of March 31, 2024

Percentages are stated as a percent of net assets.
| Shares | Value | |||||||
| COMMON STOCKS – 99.2% | ||||||||
| Banking – 9.3% | ||||||||
| Huntington Bancshares Inc. | 192 | $ | 2,678 | |||||
| JPMorgan Chase & Co. | 151 | 30,245 | ||||||
| M&T Bank Corp. | 22 | 3,200 | ||||||
| PNC Financial Services Group, Inc. | 53 | 8,565 | ||||||
| US Bancorp | 198 | 8,851 | ||||||
| 53,539 | ||||||||
| Consumer Discretionary Products – 1.6% | ||||||||
| Lennar Corp. – Class A | 33 | 5,676 | ||||||
| PulteGroup, Inc. | 28 | 3,377 | ||||||
| 9,053 | ||||||||
| Consumer Staple Products – 2.1% | ||||||||
| Altria Group, Inc. | 239 | 10,425 | ||||||
| Molson Coors Beverage Co. – Class B | 24 | 1,614 | ||||||
| 12,039 | ||||||||
| Financial Services – 9.0% | ||||||||
| American Express Co. | 79 | 17,987 | ||||||
| Ameriprise Financial, Inc. | 14 | 6,138 | ||||||
| Bank of New York Mellon Corp. | 101 | 5,820 | ||||||
| Capital One Financial Corp. | 51 | 7,593 | ||||||
| Cboe Global Markets, Inc. | 14 | 2,572 | ||||||
| Discover Financial Services | 33 | 4,326 | ||||||
| Fidelity National Financial, Inc. | 36 | 1,912 | ||||||
| Synchrony Financial | 56 | 2,415 | ||||||
| T Rowe Price Group, Inc. | 30 | 3,658 | ||||||
| 52,421 | ||||||||
20
Themes ETF Trust
Themes US Cash Flow Champions ETF
Schedule of Investments (Continued)
as of March 31, 2024 (Unaudited)
| Shares | Value | |||||||
| Health Care – 22.9% | ||||||||
| AbbVie, Inc. | 169 | $ | 30,774 | |||||
| Bristol-Myers Squibb Co. | 281 | 15,239 | ||||||
| Cardinal Health, Inc. | 34 | 3,805 | ||||||
| CVS Health Corp. | 171 | 13,639 | ||||||
| Gilead Sciences, Inc. | 167 | 12,233 | ||||||
| Humana, Inc. | 17 | 5,894 | ||||||
| McKesson Corp. | 18 | 9,662 | ||||||
| Pfizer, Inc. | 771 | 21,395 | ||||||
| Quest Diagnostics, Inc. | 16 | 2,130 | ||||||
| Regeneron Pharmaceuticals, Inc.(a) | 14 | 13,475 | ||||||
| Royalty Pharma PLC – Class A | 50 | 1,519 | ||||||
| Viatris, Inc. | 160 | 1,910 | ||||||
| 131,675 | ||||||||
| Industrial Products – 0.4% | ||||||||
| Snap-on, Inc. | 7 | 2,074 | ||||||
| Insurance – 13.8% | ||||||||
| Aflac, Inc. | 72 | 6,182 | ||||||
| Allstate Corp. | 36 | 6,228 | ||||||
| Arch Capital Group Ltd.(a) | 50 | 4,622 | ||||||
| Chubb Ltd. | 55 | 14,252 | ||||||
| Cincinnati Financial Corp. | 22 | 2,732 | ||||||
| Everest Group Ltd. | 4 | 1,590 | ||||||
| Globe Life, Inc. | 12 | 1,396 | ||||||
| Hartford Financial Services Group Inc. | 41 | 4,225 | ||||||
| Markel Group, Inc.(a) | 2 | 3,043 | ||||||
| MetLife, Inc. | 84 | 6,225 | ||||||
| Principal Financial Group, Inc. | 32 | 2,762 | ||||||
| Progressive Corp. | 78 | 16,133 | ||||||
| Travelers Cos, Inc. | 31 | 7,134 | ||||||
| W R Berkley Corp. | 28 | 2,476 | ||||||
| 79,000 | ||||||||
| Materials – 3.0% | ||||||||
| Dow, Inc. | 95 | 5,503 | ||||||
| LyondellBasell Industries NV – Class A | 34 | 3,478 | ||||||
| Mosaic Co. | 46 | 1,493 | ||||||
| Nucor Corp. | 34 | 6,729 | ||||||
| 17,203 | ||||||||
| Media – 1.0% | ||||||||
| Expedia Group, Inc.(a) | 20 | 2,755 | ||||||
| Fox Corp. – Class A | 33 | 1,032 | ||||||
| Omnicom Group, Inc. | 26 | 2,516 | ||||||
| 6,303 | ||||||||
| Oil & Gas – 25.7%(b) | ||||||||
| Cheniere Energy, Inc. | 32 | 5,161 | ||||||
| Chevron Corp. | 176 | 27,762 | ||||||
| ConocoPhillips | 162 | 20,619 | ||||||
| Coterra Energy, Inc. | 100 | 2,788 | ||||||
21
Themes ETF Trust
Themes US Cash Flow Champions ETF
Schedule of Investments (Continued)
as of March 31, 2024 (Unaudited)
| Shares | Value | |||||||
| Oil & Gas – 25.7%(b) (Continued) | ||||||||
| Devon Energy Corp. | 85 | $ | 4,265 | |||||
| Diamondback Energy, Inc. | 24 | 4,756 | ||||||
| EOG Resources, Inc. | 78 | 9,972 | ||||||
| Exxon Mobil Corp. | 261 | 30,339 | ||||||
| Marathon Petroleum Corp. | 54 | 10,881 | ||||||
| Occidental Petroleum Corp. | 93 | 6,044 | ||||||
| Phillips 66 | 60 | 9,800 | ||||||
| Pioneer Natural Resources Co. | 31 | 8,138 | ||||||
| Valero Energy Corp. | 47 | 8,022 | ||||||
| 148,547 | ||||||||
| Retail & Wholesale – Discretionary – 1.3% | ||||||||
| Best Buy Co, Inc. | 28 | 2,297 | ||||||
| eBay, Inc. | 71 | 3,747 | ||||||
| LKQ Corp. | 36 | 1,923 | ||||||
| 7,967 | ||||||||
| Retail & Wholesale – Staples – 1.7% | ||||||||
| Archer-Daniels-Midland Co. | 71 | 4,460 | ||||||
| Kroger Co. | 95 | 5,427 | ||||||
| 9,887 | ||||||||
| Software & Technology Services – 0.9% | ||||||||
| Cognizant Technology Solutions Corp. – Class A | 70 | 5,130 | ||||||
| Tech Hardware & Semiconductors – 6.5% | ||||||||
| Broadcom, Inc. | 23 | 30,485 | ||||||
| HP, Inc. | 132 | 3,989 | ||||||
| NetApp, Inc. | 28 | 2,939 | ||||||
| 37,413 | ||||||||
| TOTAL COMMON STOCKS (Cost $500,993) | 572,251 | |||||||
| SHORT-TERM INVESTMENTS – 0.7% | ||||||||
| Money Market Funds – 0.7% | ||||||||
| First American Treasury Obligations Fund – Class X, 5.22%(c) | 3,911 | 3,911 | ||||||
| TOTAL SHORT-TERM INVESTMENTS (Cost $3,911) | 3,911 | |||||||
| TOTAL INVESTMENTS – 99.9% (Cost $504,904) | $ | 576,162 | ||||||
| Other Assets in Excess of Liabilities – 0.1% | 401 | |||||||
| TOTAL NET ASSETS – 100.0% | $ | 576,563 | ||||||
Percentages are stated as a percent of net assets.
NV – Naamloze Vennootschap
PLC – Public Limited Company
| (a) | Non-income producing security. |
| (b) | To the extent that the Fund invests more heavily in a particular industry or sector of the economy, its performance will be especially sensitive to developments that significantly affect those industries or sectors. |
| (c) | The rate shown represents the 7-day effective yield as of March 31, 2024. |
22
Themes ETF Trust
Themes US R&D Champions ETF
Schedule of Investments
as of March 31, 2024 (Unaudited)
Sector Diversification as of March 31, 2024

Percentages are stated as a percent of net assets.
| Shares | Value | |||||||
| COMMON STOCKS – 99.5% | ||||||||
| Consumer Discretionary Products – 2.2% | ||||||||
| General Motors Co. | 292 | $ | 13,242 | |||||
| Health Care – 17.9% | ||||||||
| Align Technology, Inc.(a) | 38 | 12,461 | ||||||
| Edwards Lifesciences Corp.(a) | 132 | 12,613 | ||||||
| Eli Lilly & Co. | 15 | 11,669 | ||||||
| Hologic, Inc.(a) | 153 | 11,928 | ||||||
| Intuitive Surgical, Inc.(a) | 29 | 11,574 | ||||||
| Johnson & Johnson | 72 | 11,390 | ||||||
| Medtronic PLC | 132 | 11,504 | ||||||
| Regeneron Pharmaceuticals, Inc.(a) | 12 | 11,550 | ||||||
| STERIS PLC | 50 | 11,241 | ||||||
| 105,930 | ||||||||
| Industrial Products – 6.2% | ||||||||
| Keysight Technologies, Inc.(a) | 70 | 10,947 | ||||||
| Northrop Grumman Corp. | 25 | 11,967 | ||||||
| Trimble, Inc.(a) | 214 | 13,772 | ||||||
| 36,686 | ||||||||
| Materials – 2.0% | ||||||||
| Corteva, Inc. | 210 | 12,111 | ||||||
| Media – 8.0% | ||||||||
| Alphabet, Inc. – Class A(a) | 75 | 11,320 | ||||||
| Electronic Arts, Inc. | 80 | 10,614 | ||||||
| Meta Platforms, Inc. – Class A | 24 | 11,654 | ||||||
| The Trade Desk, Inc. – Class A(a) | 157 | 13,725 | ||||||
| 47,313 | ||||||||
| Renewable Energy – 1.9% | ||||||||
| Enphase Energy, Inc.(a) | 92 | 11,130 | ||||||
23
Themes ETF Trust
Themes US R&D Champions ETF
Schedule of Investments (Continued)
as of March 31, 2024 (Unaudited)
| Shares | Value | |||||||
| Software & Technology Services – 38.2%(b) | ||||||||
| Adobe, Inc.(a) | 18 | $ | 9,083 | |||||
| Akamai Technologies, Inc.(a) | 88 | 9,571 | ||||||
| Amdocs Ltd. | 125 | 11,296 | ||||||
| ANSYS, Inc.(a) | 32 | 11,109 | ||||||
| Autodesk, Inc.(a) | 42 | 10,938 | ||||||
| Cadence Design Systems, Inc.(a) | 36 | 11,206 | ||||||
| CoStar Group, Inc.(a) | 135 | 13,040 | ||||||
| Fortinet, Inc.(a) | 158 | 10,793 | ||||||
| International Business Machines Corp. | 60 | 11,457 | ||||||
| Intuit, Inc. | 17 | 11,050 | ||||||
| Microsoft Corp. | 27 | 11,359 | ||||||
| Oracle Corp. | 96 | 12,058 | ||||||
| Paycom Software, Inc. | 60 | 11,941 | ||||||
| PayPal Holdings, Inc.(a) | 191 | 12,795 | ||||||
| Roper Technologies, Inc. | 20 | 11,217 | ||||||
| Salesforce, Inc. | 39 | 11,746 | ||||||
| ServiceNow, Inc.(a) | 14 | 10,674 | ||||||
| Synopsys, Inc.(a) | 19 | 10,859 | ||||||
| Veeva Systems, Inc. – Class A(a) | 52 | 12,048 | ||||||
| Zoom Video Communications, Inc. – Class A(a) | 171 | 11,178 | ||||||
| 225,418 | ||||||||
| Tech Hardware & Semiconductors – 23.1% | ||||||||
| Advanced Micro Devices, Inc.(a) | 65 | 11,732 | ||||||
| Applied Materials, Inc. | 61 | 12,580 | ||||||
| Arista Networks, Inc.(a) | 40 | 11,599 | ||||||
| Cisco Systems, Inc. | 224 | 11,180 | ||||||
| Hewlett Packard Enterprise Co. | 724 | 12,837 | ||||||
| KLA Corp. | 17 | 11,876 | ||||||
| Lam Research Corp. | 12 | 11,659 | ||||||
| NetApp, Inc. | 124 | 13,016 | ||||||
| NVIDIA Corp. | 16 | 14,458 | ||||||
| QUALCOMM, Inc. | 74 | 12,528 | ||||||
| Zebra Technologies Corp. – Class A(a) | 44 | 13,263 | ||||||
| 136,728 | ||||||||
| TOTAL COMMON STOCKS (Cost $509,532) | 588,558 | |||||||
| SHORT-TERM INVESTMENTS – 0.5% | ||||||||
| Money Market Funds – 0.5% | ||||||||
| First American Treasury Obligations Fund – Class X, 5.22%(c) | 3,148 | 3,148 | ||||||
| TOTAL SHORT-TERM INVESTMENTS (Cost $3,148) | 3,148 | |||||||
| TOTAL INVESTMENTS – 100.0% (Cost $512,680) | $ | 591,706 | ||||||
| Liabilities in Excess of Other Assets – 0.0%(d) | (178 | ) | ||||||
| TOTAL NET ASSETS – 100.0% | $ | 591,528 | ||||||
Percentages are stated as a percent of net assets.
PLC – Public Limited Company
| (a) | Non-income producing security. |
| (b) | To the extent that the Fund invests more heavily in a particular industry or sector of the economy, its performance will be especially sensitive to developments that significantly affect those industries or sectors. |
| (c) | The rate shown represents the 7-day effective yield as of March 31, 2024. |
| (d) | Represents less than 0.05% of net assets. |
24
Themes ETF Trust
Themes US Small Cap Cash Flow Champions ETF
Schedule of Investments
as of March 31, 2024 (Unaudited)
Sector Diversification as of March 31, 2024

Percentages are stated as a percent of net assets.
| Shares | Value | |||||||
| COMMON STOCKS – 98.8% | ||||||||
| Banking – 11.6% | ||||||||
| Axos Financial, Inc.(a) | 74 | $ | 3,999 | |||||
| Bank OZK | 150 | 6,819 | ||||||
| East West Bancorp, Inc. | 194 | 15,346 | ||||||
| First BanCorp Puerto Rico | 243 | 4,262 | ||||||
| First Bancorp/Southern Pines NC | 55 | 1,987 | ||||||
| First Horizon Corp. | 763 | 11,750 | ||||||
| Heartland Financial USA, Inc. | 55 | 1,933 | ||||||
| Hope Bancorp, Inc. | 158 | 1,819 | ||||||
| International Bancshares Corp. | 74 | 4,154 | ||||||
| S&T Bancorp, Inc. | 53 | 1,700 | ||||||
| SouthState Corp. | 104 | 8,843 | ||||||
| TriCo Bancshares | 42 | 1,545 | ||||||
| Trustmark Corp. | 78 | 2,193 | ||||||
| WSFS Financial Corp. | 84 | 3,792 | ||||||
| 70,142 | ||||||||
| Consumer Discretionary Products – 5.1% | ||||||||
| Taylor Morrison Home Corp.(a) | 145 | 9,015 | ||||||
| Toll Brothers, Inc. | 150 | 19,405 | ||||||
| Vista Outdoor, Inc.(a) | 77 | 2,524 | ||||||
| 30,944 | ||||||||
| Consumer Discretionary Services – 0.3% | ||||||||
| Perdoceo Education Corp. | 88 | 1,545 | ||||||
25
Themes ETF Trust
Themes US Small Cap Cash Flow Champions ETF
Schedule of Investments (Continued)
as of March 31, 2024 (Unaudited)
| Shares | Value | |||||||
| Financial Services – 7.2% | ||||||||
| Artisan Partners Asset Management, Inc. – Class A | 93 | $ | 4,257 | |||||
| Bread Financial Holdings, Inc. | 68 | 2,532 | ||||||
| Enova International, Inc.(a) | 42 | 2,639 | ||||||
| Evercore, Inc. – Class A | 49 | 9,437 | ||||||
| MGIC Investment Corp. | 393 | 8,787 | ||||||
| Stifel Financial Corp. | 142 | 11,100 | ||||||
| Virtu Financial, Inc. – Class A | 125 | 2,565 | ||||||
| Virtus Investment Partners, Inc. | 9 | 2,232 | ||||||
| 43,549 | ||||||||
| Health Care – 5.9% | ||||||||
| Dynavax Technologies Corp.(a) | 176 | 2,184 | ||||||
| Innoviva, Inc.(a) | 90 | 1,372 | ||||||
| Ironwood Pharmaceuticals, Inc.(a) | 210 | 1,829 | ||||||
| Molina Healthcare, Inc.(a) | 74 | 30,401 | ||||||
| 35,786 | ||||||||
| Industrial Products – 2.4% | ||||||||
| Mueller Industries, Inc. | 154 | 8,305 | ||||||
| NEXTracker, Inc. – Class A(a) | 104 | 5,852 | ||||||
| 14,157 | ||||||||
| Industrial Services – 5.3% | ||||||||
| API Group Corp.(a) | 293 | 11,506 | ||||||
| Matson, Inc. | 49 | 5,508 | ||||||
| Sterling Infrastructure, Inc.(a) | 41 | 4,523 | ||||||
| TriNet Group, Inc. | 77 | 10,202 | ||||||
| 31,739 | ||||||||
| Insurance – 9.6% | ||||||||
| American Equity Investment Life Holding Co.(a) | 85 | 4,779 | ||||||
| Axis Capital Holdings Ltd. | 107 | 6,957 | ||||||
| CNA Financial Corp. | 30 | 1,363 | ||||||
| Genworth Financial, Inc. – Class A(a) | 634 | 4,077 | ||||||
| Hanover Insurance Group, Inc. | 49 | 6,672 | ||||||
| NMI Holdings, Inc. – Class A(a) | 113 | 3,654 | ||||||
| Old Republic International Corp. | 364 | 11,182 | ||||||
| Reinsurance Group of America, Inc. | 92 | 17,745 | ||||||
| SiriusPoint Ltd.(a) | 127 | 1,614 | ||||||
| 58,043 | ||||||||
| Materials – 12.5% | ||||||||
| Alpha Metallurgical Resources, Inc. | 16 | 5,298 | ||||||
| Boise Cascade Co. | 54 | 8,282 | ||||||
| CF Industries Holdings, Inc. | 269 | 22,383 | ||||||
| CONSOL Energy, Inc. | 43 | 3,602 | ||||||
| Encore Wire Corp. | 22 | 5,781 | ||||||
| Peabody Energy Corp. | 155 | 3,760 | ||||||
| Ternium SA – ADR | 272 | 11,321 | ||||||
| UFP Industries, Inc. | 84 | 10,333 | ||||||
| Warrior Met Coal, Inc. | 71 | 4,310 | ||||||
| 75,070 | ||||||||
26
Themes ETF Trust
Themes US Small Cap Cash Flow Champions ETF
Schedule of Investments (Continued)
as of March 31, 2024 (Unaudited)
| Shares | Value | |||||||
| Oil & Gas – 22.6% | ||||||||
| Antero Resources Corp.(a) | 384 | $ | 11,136 | |||||
| APA Corp. | 426 | 14,646 | ||||||
| Chord Energy Corp. | 56 | 9,981 | ||||||
| Civitas Resources, Inc. | 113 | 8,578 | ||||||
| CVR Energy, Inc. | 41 | 1,462 | ||||||
| Hess Midstream LP – Class A | 77 | 2,782 | ||||||
| HF Sinclair Corp. | 189 | 11,411 | ||||||
| Magnolia Oil & Gas Corp. – Class A | 249 | 6,462 | ||||||
| Marathon Oil Corp. | 853 | 24,175 | ||||||
| Matador Resources Co. | 152 | 10,149 | ||||||
| Murphy Oil Corp. | 205 | 9,369 | ||||||
| PBF Energy, Inc. – Class A | 155 | 8,923 | ||||||
| Permian Resources Corp. | 481 | 8,494 | ||||||
| SM Energy Co. | 164 | 8,175 | ||||||
| 135,743 | ||||||||
| Retail & Wholesale – Discretionary – 13.4% | ||||||||
| Asbury Automotive Group, Inc.(a) | 28 | 6,602 | ||||||
| Builders FirstSource, Inc.(a) | 160 | 33,368 | ||||||
| Dillard’s, Inc. – Class A | 11 | 5,188 | ||||||
| Group 1 Automotive, Inc. | 19 | 5,552 | ||||||
| Penske Automotive Group, Inc. | 25 | 4,050 | ||||||
| Williams-Sonoma, Inc. | 83 | 26,355 | ||||||
| 81,115 | ||||||||
| Tech Hardware & Semiconductors – 2.9% | ||||||||
| Flex Ltd.(a) | 610 | 17,452 | ||||||
| TOTAL COMMON STOCKS (Cost $505,593) | 595,285 | |||||||
| REAL ESTATE INVESTMENT TRUSTS – 0.5% | ||||||||
| Equity Commonwealth(a) | 145 | 2,738 | ||||||
| TOTAL REAL ESTATE INVESTMENT TRUSTS (Cost $2,793) | 2,738 | |||||||
| SHORT-TERM INVESTMENTS – 0.7% | ||||||||
| Money Market Funds – 0.7% | ||||||||
| First American Treasury Obligations Fund – Class X, 5.22%(b) | 4,500 | 4,500 | ||||||
| TOTAL SHORT-TERM INVESTMENTS (Cost $4,500) | 4,500 | |||||||
| TOTAL INVESTMENTS – 100.0% (Cost $512,886) | $ | 602,523 | ||||||
| Liabilities in Excess of Other Assets – 0.0%(c) | (186 | ) | ||||||
| TOTAL NET ASSETS – 100.0% | $ | 602,337 | ||||||
Percentages are stated as a percent of net assets.
ADR – American Depositary Receipt
SA – Sociedad Anónima
| (a) | Non-income producing security. |
| (b) | The rate shown represents the 7-day effective yield as of March 31, 2024. |
| (c) | Represents less than 0.05% of net assets. |
27
Statements of Assets and Liabilities (Unaudited)
March 31, 2024
| Themes Airlines ETF | Themes Cloud Computing ETF | Themes Cybersecurity ETF | Themes European Luxury ETF | Themes Generative Artificial Intelligence ETF | ||||||||||||||||
| ASSETS: | ||||||||||||||||||||
| Investments, at value | $ | 530,468 | $ | 1,343,865 | $ | 1,387,807 | $ | 511,364 | $ | 20,349,192 | ||||||||||
| Dividends and interest receivable | 650 | 126 | 830 | 369 | 794 | |||||||||||||||
| Foreign currency, at value | 421 | – | 2,512 | 1,726 | 8,899 | |||||||||||||||
| Cash | – | – | – | – | 175 | |||||||||||||||
| Prepaid expenses and other assets | – | – | – | 13 | 370 | |||||||||||||||
| Total assets | 531,539 | 1,343,991 | 1,391,149 | 513,472 | 20,359,430 | |||||||||||||||
| LIABILITIES: | ||||||||||||||||||||
| Payable to adviser | 546 | 747 | 962 | 493 | 6,780 | |||||||||||||||
| Dividends payable | 67 | – | 23 | 54 | – | |||||||||||||||
| Payable to custodian foreign currency, at value | – | 7 | – | – | – | |||||||||||||||
| Total liabilities | 613 | 754 | 985 | 547 | 6,780 | |||||||||||||||
| NET ASSETS | $ | 530,926 | $ | 1,343,237 | $ | 1,390,164 | $ | 512,925 | $ | 20,352,650 | ||||||||||
| NET ASSETS CONSISTS OF: | ||||||||||||||||||||
| Paid-in capital | $ | 501,088 | $ | 1,315,159 | $ | 1,333,144 | $ | 501,104 | $ | 20,406,950 | ||||||||||
| Total distributable earnings/(accumulated losses) | 29,838 | 28,078 | 57,020 | 11,821 | (54,300 | ) | ||||||||||||||
| Total net assets | $ | 530,926 | $ | 1,343,237 | $ | 1,390,164 | $ | 512,925 | $ | 20,352,650 | ||||||||||
| Net asset value | $ | 530,926 | $ | 1,343,237 | $ | 1,390,164 | $ | 512,925 | $ | 20,352,650 | ||||||||||
| Shares issued and outstanding(a) | 20,000 | 50,000 | 50,000 | 20,000 | 670,000 | |||||||||||||||
| Net asset value per share | $ | 26.55 | $ | 26.86 | $ | 27.80 | $ | 25.65 | $ | 30.38 | ||||||||||
| Cost: | ||||||||||||||||||||
| Investments cost | $ | 503,149 | $ | 1,317,229 | $ | 1,337,601 | $ | 489,670 | $ | 20,640,178 | ||||||||||
| Foreign currency cost | $ | 420 | $ | – | $ | 2,511 | $ | 1,761 | $ | 8,926 | ||||||||||
| Proceeds: | ||||||||||||||||||||
| Foreign currency proceeds | $ | – | $ | 6 | $ | – | $ | – | $ | – | ||||||||||
| (a) | Unlimited shares authorized without par value. |
28
Themes ETF Trust
Statements of Assets and Liabilities (Unaudited) (Continued)
March 31, 2024
| Themes Global Systemically Important Banks ETF | Themes Gold Miners ETF | Themes Natural Monopoly ETF | Themes US Cash Flow Champions ETF | Themes US R&D Champions ETF | ||||||||||||||||
| ASSETS: | ||||||||||||||||||||
| Investments, at value | $ | 550,117 | $ | 1,467,714 | $ | 553,596 | $ | 576,162 | $ | 591,706 | ||||||||||
| Dividends and interest receivable | 1,955 | 1,139 | 868 | 663 | 297 | |||||||||||||||
| Cash | 130 | 743 | 144 | 198 | – | |||||||||||||||
| Foreign currency, at value | 9 | 4,308 | 1,799 | – | – | |||||||||||||||
| Total assets | 552,211 | 1,473,904 | 556,407 | 577,023 | 592,003 | |||||||||||||||
| LIABILITIES: | ||||||||||||||||||||
| Payable to adviser | 512 | 1,333 | 553 | 460 | 475 | |||||||||||||||
| Dividends payable | – | 42 | 26 | – | – | |||||||||||||||
| Total liabilities | 512 | 1,375 | 579 | 460 | 475 | |||||||||||||||
| NET ASSETS | $ | 551,699 | $ | 1,472,529 | $ | 555,828 | $ | 576,563 | $ | 591,528 | ||||||||||
| NET ASSETS CONSISTS OF: | ||||||||||||||||||||
| Paid-in capital | $ | 500,216 | $ | 1,313,565 | $ | 501,300 | $ | 500,487 | $ | 500,044 | ||||||||||
| Total distributable earnings/(accumulated losses) | 51,483 | (1,154,836 | ) | (446,485 | ) | 76,076 | 91,484 | |||||||||||||
| Total net assets | $ | 551,699 | $ | 1,472,529 | $ | 555,828 | $ | 576,563 | $ | 591,528 | ||||||||||
| Net asset value | $ | 551,699 | $ | 1,472,529 | $ | 555,828 | $ | 576,563 | $ | 591,528 | ||||||||||
| Shares issued and outstanding(a) | 20,000 | 50,000 | 20,000 | 20,000 | 20,000 | |||||||||||||||
| Net asset value per share | $ | 27.58 | $ | 29.45 | $ | 27.79 | $ | 28.83 | $ | 29.58 | ||||||||||
| Cost: | ||||||||||||||||||||
| Investments cost | $ | 502,733 | $ | 1,308,749 | $ | 507,466 | $ | 504,904 | $ | 512,680 | ||||||||||
| Foreign currency cost | $ | 9 | $ | 4,301 | $ | 1,810 | $ | – | $ | – | ||||||||||
| (a) | Unlimited shares authorized without par value. |
29
Themes ETF Trust
Statements of Assets and Liabilities (Unaudited) (Continued)
March 31, 2024
| Themes US Small Cap Cash Flow Champions ETF | ||||
| ASSETS: | ||||
| Investments, at value | $ | 602,523 | ||
| Dividends and interest receivable | 213 | |||
| Cash | 72 | |||
| Total assets | 602,808 | |||
| LIABILITIES: | ||||
| Payable to adviser | 471 | |||
| Total liabilities | 471 | |||
| NET ASSETS | $ | 602,337 | ||
| NET ASSETS CONSISTS OF: | ||||
| Paid-in capital | $ | 500,893 | ||
| Total distributable earnings | 101,444 | |||
| Total net assets | $ | 602,337 | ||
| Net asset value | $ | 602,337 | ||
| Shares issued and outstanding(a) | 20,000 | |||
| Net asset value per share | $ | 30.12 | ||
| Cost: | ||||
| Investments cost | $ | 512,886 | ||
| (a) | Unlimited shares authorized without par value. |
30
Statements of Operations (Unaudited)
For the Period Ended March 31, 2024
| Themes Airlines ETF | Themes Cloud Computing ETF | Themes Cybersecurity ETF | Themes European Luxury ETF | Themes Generative Artificial Intelligence ETF | ||||||||||||||||
| INVESTMENT INCOME: | ||||||||||||||||||||
| Dividend income | $ | 2,301 | $ | 321 | $ | 3,506 | $ | 575 | $ | 2,750 | ||||||||||
| Less: Dividend withholding taxes | (102 | ) | – | – | (125 | ) | – | |||||||||||||
| Interest income | 20 | 71 | 14 | 12 | 613 | |||||||||||||||
| Other income | 9 | 7 | 31 | – | – | |||||||||||||||
| Total investment income | 2,228 | 399 | 3,551 | 462 | 3,363 | |||||||||||||||
| EXPENSES: | ||||||||||||||||||||
| Investment advisory fee | 546 | 747 | 962 | 493 | 6,780 | |||||||||||||||
| Income tax expense | 7 | – | 88 | – | – | |||||||||||||||
| Total expenses | 553 | 747 | 1,050 | 493 | 6,780 | |||||||||||||||
| NET INVESTMENT INCOME/(LOSS) | 1,675 | (348 | ) | 2,501 | (31 | ) | (3,417 | ) | ||||||||||||
| REALIZED AND UNREALIZED GAIN/(LOSS) | ||||||||||||||||||||
| Net realized gain/(loss) from: | ||||||||||||||||||||
| Investments | 1,647 | 1,789 | 4,594 | (9,856 | ) | 239,958 | ||||||||||||||
| Foreign currency translation | (804 | ) | 2 | (282 | ) | 49 | 172 | |||||||||||||
| Net realized gain/(loss) | 843 | 1,791 | 4,312 | (9,807 | ) | 240,130 | ||||||||||||||
| Net change in unrealized appreciation/(depreciation) on: | ||||||||||||||||||||
| Investments | 27,319 | 26,636 | 50,206 | 21,694 | (290,986 | ) | ||||||||||||||
| Foreign currency translation | 1 | (1 | ) | 1 | (35 | ) | (27 | ) | ||||||||||||
| Net change in unrealized appreciation/(depreciation) | 27,320 | 26,635 | 50,207 | 21,659 | (291,013 | ) | ||||||||||||||
| Net realized and unrealized gain/(loss) | 28,163 | 28,426 | 54,519 | 11,852 | (50,883 | ) | ||||||||||||||
| NET INCREASE/(DECREASE) IN NET ASSETS RESULTING FROM OPERATIONS | $ | 29,838 | $ | 28,078 | $ | 57,020 | $ | 11,821 | $ | (54,300 | ) | |||||||||
31
Themes ETF Trust
Statements of Operations (Unaudited) (Continued)
For the Period Ended March 31, 2024
| Themes Global Systemically Important Banks ETF | Themes Gold Miners ETF | Themes Natural Monopoly ETF | Themes US Cash Flow Champions ETF | Themes US R&D Champions ETF | ||||||||||||||||
| INVESTMENT INCOME: | ||||||||||||||||||||
| Dividend income | $ | 3,494 | $ | 6,871 | $ | 3,082 | $ | 5,039 | $ | 1,170 | ||||||||||
| Less: Dividend withholding taxes | (82 | ) | (642 | ) | (114 | ) | – | – | ||||||||||||
| Interest income | 25 | 95 | 27 | 47 | 33 | |||||||||||||||
| Other income | – | – | 79 | – | – | |||||||||||||||
| Total investment income | 3,437 | 6,324 | 3,074 | 5,086 | 1,203 | |||||||||||||||
| EXPENSES: | ||||||||||||||||||||
| Investment advisory fee | 512 | 1,333 | 553 | 460 | 475 | |||||||||||||||
| Income tax expense | 4 | – | 11 | 40 | 3 | |||||||||||||||
| Total expenses | 516 | 1,333 | 564 | 500 | 478 | |||||||||||||||
| NET INVESTMENT INCOME | 2,921 | 4,991 | 2,510 | 4,586 | 725 | |||||||||||||||
| REALIZED AND UNREALIZED GAIN | ||||||||||||||||||||
| Net realized gain/(loss) from: | ||||||||||||||||||||
| Investments | 1,178 | (5,231 | ) | 5,934 | 232 | 11,733 | ||||||||||||||
| Foreign currency translation | – | 235 | (31 | ) | – | – | ||||||||||||||
| Net realized gain/(loss) | 1,178 | (4,996 | ) | 5,903 | 232 | 11,733 | ||||||||||||||
| Net change in unrealized appreciation on: | ||||||||||||||||||||
| Investments | 47,384 | 158,965 | 46,130 | 71,258 | 79,026 | |||||||||||||||
| Foreign currency translation | – | 4 | (15 | ) | – | – | ||||||||||||||
| Net change in unrealized appreciation | 47,384 | 158,969 | 46,115 | 71,258 | 79,026 | |||||||||||||||
| Net realized and unrealized gain | 48,562 | 153,973 | 52,018 | 71,490 | 90,759 | |||||||||||||||
| NET INCREASE IN NET ASSETS RESULTING FROM OPERATIONS | $ | 51,483 | $ | 158,964 | $ | 54,528 | $ | 76,076 | $ | 91,484 | ||||||||||
32
Themes ETF Trust
Statements of Operations (Unaudited) (Continued)
For the Period Ended March 31, 2024
Themes US Small Cap Cash Flow Champions ETF | ||||
| INVESTMENT INCOME: | ||||
| Dividend income | $ | 3,036 | ||
| Less: Dividend withholding taxes | (6 | ) | ||
| Interest income | 50 | |||
| Total investment income | 3,080 | |||
| EXPENSES: | ||||
| Investment advisory fee | 471 | |||
| Income tax expense | 16 | |||
| Total expenses | 487 | |||
| NET INVESTMENT INCOME | 2,593 | |||
| REALIZED AND UNREALIZED GAIN | ||||
| Net realized gain from: | ||||
| Investments | 9,214 | |||
| Net realized gain | 9,214 | |||
| Net change in unrealized appreciation on: | ||||
| Investments | 89,637 | |||
| Net change in unrealized appreciation | 89,637 | |||
| Net realized and unrealized gain | 98,851 | |||
| NET INCREASE IN NET ASSETS RESULTING FROM OPERATIONS | $ | 101,444 | ||
33
Statements of Changes in Net Assets (Unaudited)
| Themes Airlines ETF | Themes Cloud Computing ETF | Themes Cybersecurity ETF | Themes European Luxury ETF | |||||||||||||
| For the Period Ended March 31, 2024(a) | For the Period Ended March 31, 2024(b) | For the Period Ended March 31, 2024(a) | For the Period Ended March 31, 2024(b) | |||||||||||||
| OPERATIONS: | ||||||||||||||||
| Net investment income/(loss) | $ | 1,675 | $ | (348 | ) | $ | 2,501 | $ | (31 | ) | ||||||
| Net realized gain/(loss) | 843 | 1,791 | 4,312 | (9,807 | ) | |||||||||||
| Unrealized appreciation | 27,320 | 26,635 | 50,207 | 21,659 | ||||||||||||
| Net increase in net assets from operations | 29,838 | 28,078 | 57,020 | 11,821 | ||||||||||||
| CAPITAL TRANSACTIONS: | ||||||||||||||||
| Subscriptions | 500,000 | 1,314,737 | 1,332,182 | 500,000 | ||||||||||||
| ETF transaction fees (see note 4) | 1,088 | 422 | 962 | 1,104 | ||||||||||||
| Net increase in net assets from capital transactions | 501,088 | 1,315,159 | 1,333,144 | 501,104 | ||||||||||||
| NET INCREASE IN NET ASSETS | 530,926 | 1,343,237 | 1,390,164 | 512,925 | ||||||||||||
| NET ASSETS: | ||||||||||||||||
| Beginning of the period | – | – | – | – | ||||||||||||
| End of the period | $ | 530,926 | $ | 1,343,237 | $ | 1,390,164 | $ | 512,925 | ||||||||
| SHARES TRANSACTIONS | ||||||||||||||||
| Subscriptions shares | 20,000 | 50,000 | 50,000 | 20,000 | ||||||||||||
| Total increase in shares outstanding | 20,000 | 50,000 | 50,000 | 20,000 | ||||||||||||
| (a) | Inception date of the Fund was December 7, 2023. |
| (b) | Inception date of the Fund was December 14, 2023. |
34
Themes ETF Trust
Statements of Changes in Net Assets (Unaudited) (Continued)
| Themes Generative Artificial Intelligence ETF | Themes Global Systemically Important Banks ETF | Themes Gold Miners ETF | Themes Natural Monopoly ETF | |||||||||||||
| For the Period Ended March 31, 2024(a) | For the Period Ended March 31, 2024(b) | For the Period Ended March 31, 2024(c) | For the Period Ended March 31, 2024(c) | |||||||||||||
| OPERATIONS: | ||||||||||||||||
| Net investment income/(loss) | $ | (3,417 | ) | $ | 2,921 | $ | 4,991 | $ | 2,510 | |||||||
| Net realized gain/(loss) | 240,130 | 1,178 | (4,996 | ) | 5,903 | |||||||||||
| Unrealized appreciation/(depreciation) | (291,013 | ) | 47,384 | 158,969 | 46,115 | |||||||||||
| Net increase/(decrease) in net assets from operations | (54,300 | ) | 51,483 | 158,964 | 54,528 | |||||||||||
| CAPITAL TRANSACTIONS: | ||||||||||||||||
| Subscriptions | 20,406,053 | 500,000 | 1,313,402 | 500,000 | ||||||||||||
| ETF transaction fees (see note 4) | 897 | 216 | 163 | 1,300 | ||||||||||||
| Net increase in net assets from capital transactions | 20,406,950 | 500,216 | 1,313,565 | 501,300 | ||||||||||||
| NET INCREASE IN NET ASSETS | 20,352,650 | 551,699 | 1,472,529 | 555,828 | ||||||||||||
| NET ASSETS: | ||||||||||||||||
| Beginning of the period | – | – | – | – | ||||||||||||
| End of the period | $ | 20,352,650 | $ | 551,699 | $ | 1,472,529 | $ | 555,828 | ||||||||
| SHARES TRANSACTIONS | ||||||||||||||||
| Subscriptions shares | 670,000 | 20,000 | 50,000 | 20,000 | ||||||||||||
| Total increase in shares outstanding | 670,000 | 20,000 | 50,000 | 20,000 | ||||||||||||
| (a) | Inception date of the Fund was December 7, 2023. |
| (b) | Inception date of the Fund was December 14, 2023. |
| (c) | Inception date of the Fund was December 12, 2023. |
35
Themes ETF Trust
Statements of Changes in Net Assets (Unaudited) (Continued)
| Themes US Cash Flow Champions ETF | Themes US R&D Champions ETF | Themes US Small Cap Cash Flow Champions ETF | ||||||||||
| For the Period Ended March 31, 2024(a) | For the Period Ended March 31, 2024(a) | For the Period Ended March 31, 2024(a) | ||||||||||
| OPERATIONS: | ||||||||||||
| Net investment income | $ | 4,586 | $ | 725 | $ | 2,593 | ||||||
| Net realized gain | 232 | 11,733 | 9,214 | |||||||||
| Unrealized appreciation | 71,258 | 79,026 | 89,637 | |||||||||
| Net increase in net assets from operations | 76,076 | 91,484 | 101,444 | |||||||||
| CAPITAL TRANSACTIONS: | ||||||||||||
| Subscriptions | 500,000 | 500,000 | 500,000 | |||||||||
| ETF transaction fees (see note 4) | 487 | 44 | 893 | |||||||||
| Net increase in net assets from capital transactions | 500,487 | 500,044 | 500,893 | |||||||||
| NET INCREASE IN NET ASSETS | 576,563 | 591,528 | 602,337 | |||||||||
| NET ASSETS: | ||||||||||||
| Beginning of the period | – | – | – | |||||||||
| End of the period | $ | 576,563 | $ | 591,528 | $ | 602,337 | ||||||
| SHARES TRANSACTIONS | ||||||||||||
| Subscriptions shares | 20,000 | 20,000 | 20,000 | |||||||||
| Total increase in shares outstanding | 20,000 | 20,000 | 20,000 | |||||||||
| (a) | Inception date of the Fund was December 12, 2023. |
36
Financial Highlights
Themes Airlines ETF | Themes Cloud Computing ETF | |||||||
| Period ended March 31, 2024(a) | Period ended March 31, 2024(b) | |||||||
| (Unaudited) | (Unaudited) | |||||||
| PER SHARE DATA: | ||||||||
| Net asset value, beginning of period | $ | 25.00 | $ | 25.00 | ||||
| INVESTMENTS OPERATIONS: | ||||||||
| Net investment income (loss)(c) | 0.09 | (0.01 | ) | |||||
| Net realized and unrealized gain on investments | 1.40 | 1.85 | ||||||
| Total from investment operations | 1.49 | 1.84 | ||||||
| ETF transaction fees per share | 0.06 | 0.02 | ||||||
| Net asset value, end of period | $ | 26.55 | $ | 26.86 | ||||
| TOTAL RETURN | 6.19 | %(d) | 7.46 | %(d) | ||||
| SUPPLEMENTAL DATA AND RATIOS: | ||||||||
| Net assets, end of period (in thousands) | $ | 531 | $ | 1,343 | ||||
| Ratio of expenses to average net assets(e) | 0.35 | % | 0.35 | % | ||||
| Portfolio turnover rate | 1.07 | % | (0.16 | )% | ||||
| 2 | %(d) | 4 | %(d) | |||||
| (a) | Inception date of the Fund was December 7, 2023. |
| (b) | Inception date of the Fund was December 14, 2023. |
| (c) | Net investment income (loss) per share has been calculated based on average shares outstanding during the period. |
| (d) | Not annualized for periods less than one year. |
| (e) | Annualized for periods less than one year. |
37
Themes ETF Trust
Financial Highlights (Continued)
Themes Cybersecurity ETF | Themes European Luxury ETF | |||||||
| Period ended March 31, 2024(a) | Period ended March 31, 2024(b) | |||||||
| (Unaudited) | (Unaudited) | |||||||
| PER SHARE DATA: | ||||||||
| Net asset value, beginning of period | $ | 25.00 | $ | 25.00 | ||||
| INVESTMENTS OPERATIONS: | ||||||||
| Net investment income (loss)(c) | 0.08 | (0.00 | )(d) | |||||
| Net realized and unrealized gain on investments | 2.69 | 0.59 | ||||||
| Total from investment operations | 2.77 | 0.59 | ||||||
| ETF transaction fees per share | 0.03 | 0.06 | ||||||
| Net asset value, end of period | $ | 27.80 | $ | 25.65 | ||||
| TOTAL RETURN | 11.21 | %(e) | 2.58 | %(e) | ||||
| SUPPLEMENTAL DATA AND RATIOS: | ||||||||
| Net assets, end of period (in thousands) | $ | 1,390 | $ | 513 | ||||
| Ratio of expenses to average net assets(f) | 0.38 | %(g) | 0.35 | % | ||||
| Ratio of net investment income (loss) to average net assets(f) | 0.91 | % | (0.02 | )% | ||||
| Portfolio turnover rate | 9 | %(e) | 21 | %(e) | ||||
| (a) | Inception date of the Fund was December 7, 2023. |
| (b) | Inception date of the Fund was December 14, 2023. |
| (c) | Net investment income (loss) per share has been calculated based on average shares outstanding during the period. |
| (d) | Amount represents less than $0.005 per share. |
| (e) | Not annualized for periods less than one year. |
| (f) | Annualized for periods less than one year. |
| (g) | Includes tax expense of 0.03% for the period ended March 31, 2024. |
38
Themes ETF Trust
Financial Highlights (Continued)
Themes Generative Artificial Intelligence ETF | Themes Global Systemically Important Banks ETF | |||||||
| Period ended March 31, 2024(a) | Period ended March 31, 2024(b) | |||||||
| (Unaudited) | (Unaudited) | |||||||
| PER SHARE DATA: | ||||||||
| Net asset value, beginning of period | $ | 25.00 | $ | 25.00 | ||||
| INVESTMENTS OPERATIONS: | ||||||||
| Net investment income (loss)(c) | (0.02 | ) | 0.15 | |||||
| Net realized and unrealized gain on investments | 5.40 | 2.42 | ||||||
| Total from investment operations | 5.38 | 2.57 | ||||||
| ETF transaction fees per share | 0.00 | (f) | 0.01 | |||||
| Net asset value, end of period | $ | 30.38 | $ | 27.58 | ||||
| TOTAL RETURN | 21.51 | %(d) | 10.34 | %(d) | ||||
| SUPPLEMENTAL DATA AND RATIOS: | ||||||||
| Net assets, end of period (in thousands) | $ | 20,353 | $ | 552 | ||||
| Ratio of expenses to average net assets(e) | 0.35 | % | 0.35 | % | ||||
| Ratio of net investment income (loss) to average net assets(e) | (0.18 | )% | 1.99 | % | ||||
| Portfolio turnover rate | 34 | %(d) | 3 | %(d) | ||||
| (a) | Inception date of the Fund was December 7, 2023. |
| (b) | Inception date of the Fund was December 14, 2023. |
| (c) | Net investment income (loss) per share has been calculated based on average shares outstanding during the period. |
| (d) | Not annualized for periods less than one year. |
| (e) | Annualized for periods less than one year. |
| (f) | Amount represents less than $0.005 per share. |
39
Themes ETF Trust
Financial Highlights (Continued)
Themes Gold Miners ETF | Themes Natural Monopoly ETF | |||||||
| Period ended March 31, 2024(a) | Period ended March 31, 2024(a) | |||||||
| (Unaudited) | (Unaudited) | |||||||
| PER SHARE DATA: | ||||||||
| Net asset value, beginning of period | $ | 25.00 | $ | 25.00 | ||||
| INVESTMENTS OPERATIONS: | ||||||||
| Net investment income(b) | 0.10 | 0.13 | ||||||
| Net realized and unrealized gain on investments | 4.35 | 2.59 | ||||||
| Total from investment operations | 4.45 | 2.72 | ||||||
| ETF transaction fees per share | 0.00 | (f) | 0.07 | |||||
| Net asset value, end of period | $ | 29.45 | $ | 27.79 | ||||
| TOTAL RETURN | 17.80 | %(c) | 11.17 | %(c) | ||||
| SUPPLEMENTAL DATA AND RATIOS: | ||||||||
| Net assets, end of period (in thousands) | $ | 1,473 | $ | 556 | ||||
| Ratio of expenses to average net assets(d) | 0.35 | % | 0.36 | %(e) | ||||
| Ratio of net investment income to average net assets(d) | 1.31 | % | 1.58 | % | ||||
| Portfolio turnover rate | 11 | %(c) | 36 | %(c) | ||||
| (a) | Inception date of the Fund was December 12, 2023. |
| (b) | Net investment income (loss) per share has been calculated based on average shares outstanding during the period. |
| (c) | Not annualized for periods less than one year. |
| (d) | Annualized for periods less than one year. |
| (e) | Includes tax expense of 0.01% for the period ended March 31, 2024. |
| (f) | Amount represents less than $0.005 per share. |
40
Themes ETF Trust
Financial Highlights (Continued)
Themes US Cash Flow Champions ETF | Themes US R&D Champions ETF | |||||||
| Period ended March 31, 2024(a) | Period ended March 31, 2024(a) | |||||||
| (Unaudited) | (Unaudited) | |||||||
| PER SHARE DATA: | ||||||||
| Net asset value, beginning of period | $ | 25.00 | $ | 25.00 | ||||
| INVESTMENTS OPERATIONS: | ||||||||
| Net investment income(b) | 0.23 | 0.04 | ||||||
| Net realized and unrealized gain on investments | 3.58 | 4.54 | ||||||
| Total from investment operations | 3.81 | 4.58 | ||||||
| ETF transaction fees per share | 0.02 | 0.00 | (c) | |||||
| Net asset value, end of period | $ | 28.83 | $ | 29.58 | ||||
| TOTAL RETURN | 15.31 | %(d) | 18.31 | %(d) | ||||
| SUPPLEMENTAL DATA AND RATIOS: | ||||||||
| Net assets, end of period (in thousands) | $ | 577 | $ | 592 | ||||
| Ratio of expenses to average net assets(e) | 0.32 | %(f) | 0.29 | % | ||||
| Ratio of net investment income to average net assets(e) | 2.88 | % | 0.44 | % | ||||
| Portfolio turnover rate | 4 | %(d) | 17 | %(d) | ||||
| (a) | Inception date of the Fund was December 12, 2023. |
| (b) | Net investment income per share has been calculated based on average shares outstanding during the period. |
| (c) | Amount represents less than $0.005 per share. |
| (d) | Not annualized for periods less than one year. |
| (e) | Annualized for periods less than one year. |
| (f) | Includes tax expense of 0.03% for the period ended March 31, 2024. |
41
Themes ETF Trust
Financial Highlights (Continued)
Themes US Small Cap Cash Flow Champions ETF | ||||
| Period ended March 31, 2024(a) | ||||
| (Unaudited) | ||||
| PER SHARE DATA: | ||||
| Net asset value, beginning of period | $ | 25.00 | ||
| INVESTMENTS OPERATIONS: | ||||
| Net investment income(b) | 0.13 | |||
| Net realized and unrealized gain on investments | 4.94 | |||
| Total from investment operations | 5.07 | |||
| ETF transaction fees per share | 0.05 | |||
| Net asset value, end of period | $ | 30.12 | ||
| TOTAL RETURN | 20.47 | %(c) | ||
| SUPPLEMENTAL DATA AND RATIOS: | ||||
| Net assets, end of period (in thousands) | $ | 602 | ||
| Ratio of expenses to average net assets(d) | 0.30 | %(e) | ||
| Ratio of net investment income to average net assets(d) | 1.59 | % | ||
| Portfolio turnover rate | 25 | %(c) | ||
| (a) | Inception date of the Fund was December 12, 2023. |
| (b) | Net investment income per share has been calculated based on average shares outstanding during the period. |
| (c) | Not annualized for periods less than one year. |
| (d) | Annualized for periods less than one year. |
| (e) | Includes tax expense of 0.01% for the period ended March 31, 2024. |
42
Notes to the Financial Statements
March 31, 2024 (Unaudited)
| 1. | ORGANIZATION |
The Themes Airlines ETF (“AIRL”), Themes Cloud Computing ETF (“CLOD”), Themes Cybersecurity ETF (“SPAM”), Themes European Luxury ETF (“FINE”), Themes Generative Artificial Intelligence ETF (“WISE”), Themes Global Systemically Important Banks ETF (“GSIB”), Themes Gold Miners ETF (“AUMI”), Themes Natural Monopoly ETF (“CZAR”), Themes US Cash Flow Champions ETF (“USCF”), Themes US R&D Champions ETF (“USRD”), Themes US Small Cap Cash Flow Champions ETF (“SMCF”), (collectively, the “Funds”) are non-diversified series of Themes ETF Trust (the “Trust”). The Trust was organized as a Delaware statutory trust on February 22, 2023 and is registered with the U.S. Securities and Exchange Commission (the “SEC”) as an open-end management investment company under the Investment Company Act of 1940, as amended (the “1940 Act”).
Costs incurred by the Fund in connection with the organization, registration and the initial public offering of shares were paid by Themes Management Company, LLC (“Themes” or the “Adviser”), the Funds’ Investment Adviser.
The below Funds’ investment objective is to track the performance, before fees and expenses, of an index comprised of:
| Fund | Investment Objectives |
| AIRL | Companies that have business operations in the airlines industry |
| CLOD | Companies that have business operations in the field of cloud computing |
| SPAM | Companies that have business operations in the cybersecurity industry |
| FINE | European companies that have business operations in the luxury industry |
| WISE | Companies that have business operations in the field of artificial intelligence related industries |
| AUMI | Companies that are active in the gold mining industry |
| CZAR | Global companies which exhibit a strong competitive advantage in their sector |
| USCF | U.S. companies with a high cash flow yield |
| USRD | Innovative U.S. companies which exhibit strong and consistent investment in research and development as well as profitability |
| SMCF | Small capitalization U.S. companies with a high cash flow yield |
The investment objective of GSIB is to seek growth of capital.
| 2. | SUMMARY OF SIGNIFICANT ACCOUNTING POLICIES |
Each Fund is an investment company and accordingly follows the investment company accounting and reporting guidance of the Financial Accounting Standards Board (“FASB”) Accounting Standards Codification (“ASC”) Topic 946, Financial Services — Investment Companies. Each Fund prepares its financial statement in accordance with accounting principles generally accepted in the United States of America (“U.S. GAAP”) and follows the significant accounting policies described below.
Use of Estimates
The preparation of the financial statement in conformity with U.S. GAAP requires management to make estimates and assumptions that affect the reported amounts of assets and liabilities and disclosure of contingent assets and liabilities at the date of the financial statement and the reported amounts of increases and decreases in net assets from operations during the reporting period. Actual results could differ from those estimates.
43
Themes ETF Trust
Notes to the Financial Statements (Continued)
March 31, 2024 (Unaudited)
Share Transactions
The net asset value (“NAV”) per share of each Fund will be equal to a Fund’s total assets minus a Fund’s total liabilities divided by the total number of shares outstanding. The NAV that is published will be rounded to the nearest cent. The NAV is determined as of the close of trading (generally, 4:00 p.m. Eastern Time) on each day the New York Stock Exchange (“NYSE”) is open for trading.
Fair Value Measurement
In calculating the NAV, each Fund’s exchange-traded equity securities will be valued at fair value, which will generally be determined using the last reported official closing or last trading price on the exchange or market on which the security is primarily traded at the time of valuation. Such valuations are typically categorized as Level 1 in the fair value hierarchy described below.
Securities listed on the NASDAQ Stock Market, Inc. are generally valued at the NASDAQ official closing price. Foreign securities will be priced at their local currencies as of the close of their primary exchange or market or as of the time each Fund calculates its NAV on the valuation date, whichever is earlier.
If market quotations are not readily available, or if it is determined that a quotation of a security does not represent fair value, then the security is valued at fair value as determined in good faith by the Adviser using procedures adopted by the Board of Trustees of the Trust (the “Board”). The valuation of each Fund’s investments is performed in accordance with the principles found in Rule 2a-5 of the 1940 Act. The Board has delegated the Adviser as the valuation designee of the Funds. The circumstances in which a security may be fair valued include, among others: the occurrence of events that are significant to a particular issuer, such as mergers, restructurings or defaults; the occurrence of events that are significant to an entire market, such as natural disasters in a particular region or government actions; trading restrictions on securities; thinly traded securities; and market events such as trading halts and early market closings. Due to the inherent uncertainty of valuations, fair values may differ significantly from the values that would have been used had an active market existed. Fair valuation could result in a different NAV than a NAV determined by using market quotations. Such valuations are typically categorized as Level 2 or Level 3 in the fair value hierarchy described below.
FASB ASC Topic 820, Fair Value Measurements and Disclosures (“ASC 820”) defines fair value, establishes a framework for measuring fair value in accordance with U.S. GAAP, and requires disclosure about fair value measurements. It also provides guidance on determining when there has been a significant decrease in the volume and level of activity for an asset or liability, when a transaction is not orderly, and how that information must be incorporated into fair value measurements. Under ASC 820, various inputs are used in determining the value of each Funds’ investments. These inputs are summarized in the following hierarchy:
| ● | Level 1 — Unadjusted quoted prices in active markets for identical assets or liabilities that the Funds have the ability to access. |
| ● | Level 2 — Observable inputs other than quoted prices included in Level 1 that are observable for the asset or liability, either directly or indirectly. These inputs may include quoted prices for the identical instrument on an inactive market, prices for similar securities, interest rates, prepayment speeds, credit risk, yield curves, default rates and similar data. |
| ● | Level 3 — Unobservable inputs for the asset or liability, to the extent relevant observable inputs are not available; representing the Funds’ own assumptions about the assumptions a market participant would use in valuing the asset or liability, and would be based on the best information available. |
44
Themes ETF Trust
Notes to the Financial Statements (Continued)
March 31, 2024 (Unaudited)
The fair value hierarchy gives the highest priority to quoted prices (unadjusted) in active markets for identical assets or liabilities (Level 1) and the lowest priority to unobservable inputs (Level 3).
The availability of observable inputs can vary from security to security and is affected by a wide variety of factors, including, for example, the type of security, whether the security is new and not yet established in the marketplace, the liquidity of markets, and other characteristics particular to the security. To the extent that valuation is based on models or inputs that are less observable or unobservable in the market, the determination of fair value requires more judgment. Accordingly, the degree of judgment exercised in determining fair value is greatest for instruments categorized in Level 3.
All other securities and investments for which market values are not readily available, including restricted securities, and those securities for which it is inappropriate to determine prices in accordance with the aforementioned procedures, are valued at fair value as determined in good faith under procedures adopted by the Board, although the actual calculations may be done by others. Factors considered in making this determination may include, but are not limited to, information obtained by contacting the issuer, analysts, or the appropriate stock exchange (for exchange-traded securities), analysis of the issuer’s financial statements or other available documents and, if necessary, available information concerning other securities in similar circumstances.
The inputs or methodology used for valuing securities are not necessarily an indication of the risk associated with investing in those securities. The hierarchy classification of inputs used to value the Funds’ investments at March 31, 2024, are as follows:
Themes Airlines ETF
| Level 1 | Level 2 | Level 3 | Total | |||||||||||||
| Assets: | ||||||||||||||||
| Common Stocks | 527,906 | – | – | 527,906 | ||||||||||||
| Money Market Funds | 2,562 | – | – | 2,562 | ||||||||||||
| Total Assets | 530,468 | – | – | 530,468 | ||||||||||||
Refer to the Schedule of Investments for industry classifications.
Themes Cloud Computing ETF
| Level 1 | Level 2 | Level 3 | Total | |||||||||||||
| Assets: | ||||||||||||||||
| Common Stocks | 1,336,208 | – | – | 1,336,208 | ||||||||||||
| Money Market Funds | 7,657 | – | – | 7,657 | ||||||||||||
| Total Assets | 1,343,865 | – | – | 1,343,865 | ||||||||||||
Refer to the Schedule of Investments for industry classifications.
Themes Cybersecurity ETF
| Level 1 | Level 2 | Level 3 | Total | |||||||||||||
| Assets: | ||||||||||||||||
| Common Stocks | 1,387,563 | – | – | 1,387,563 | ||||||||||||
| Money Market Funds | 244 | – | – | 244 | ||||||||||||
| Total Assets | 1,387,807 | – | – | 1,387,807 | ||||||||||||
Refer to the Schedule of Investments for industry classifications.
45
Themes ETF Trust
Notes to the Financial Statements (Continued)
March 31, 2024 (Unaudited)
Themes European Luxury ETF
| Level 1 | Level 2 | Level 3 | Total | |||||||||||||
| Assets: | ||||||||||||||||
| Common Stocks | 490,314 | – | – | 490,314 | ||||||||||||
| Preferred Stocks | 19,766 | – | – | 19,766 | ||||||||||||
| Money Market Funds | 1,284 | – | – | 1,284 | ||||||||||||
| Total Assets | 511,364 | – | – | 511,364 | ||||||||||||
Refer to the Schedule of Investments for industry classifications.
Themes Generative Artificial Intelligence ETF
| Level 1 | Level 2 | Level 3 | Total | |||||||||||||
| Assets: | ||||||||||||||||
| Common Stocks | 20,219,785 | – | – | 20,219,785 | ||||||||||||
| Money Market Funds | 129,407 | – | – | 129,407 | ||||||||||||
| Total Assets | 20,349,192 | – | – | 20,349,192 | ||||||||||||
Refer to the Schedule of Investments for industry classifications.
Themes Global Systemically Important Banks ETF
| Level 1 | Level 2 | Level 3 | Total | |||||||||||||
| Assets: | ||||||||||||||||
| Common Stocks | 549,356 | – | – | 549,356 | ||||||||||||
| Money Market Funds | 761 | – | – | 761 | ||||||||||||
| Total Assets | 550,117 | – | – | 550,117 | ||||||||||||
Refer to the Schedule of Investments for industry classifications.
Themes Gold Miners ETF
| Level 1 | Level 2 | Level 3 | Total | |||||||||||||
| Assets: | ||||||||||||||||
| Common Stocks | 1,464,129 | – | – | 1,464,129 | ||||||||||||
| Money Market Funds | 3,585 | – | – | 3,585 | ||||||||||||
| Total Assets | 1,467,714 | – | – | 1,467,714 | ||||||||||||
Refer to the Schedule of Investments for industry classifications.
Themes Natural Monopoly ETF
| Level 1 | Level 2 | Level 3 | Total | |||||||||||||
| Assets: | ||||||||||||||||
| Common Stocks | 552,038 | – | – | 552,038 | ||||||||||||
| Money Market Funds | 1,558 | – | – | 1,558 | ||||||||||||
| Total Assets | 553,596 | – | – | 553,596 | ||||||||||||
Refer to the Schedule of Investments for industry classifications.
46
Themes ETF Trust
Notes to the Financial Statements (Continued)
March 31, 2024 (Unaudited)
Themes US Cash Flow Champions ETF
| Level 1 | Level 2 | Level 3 | Total | |||||||||||||
| Assets: | ||||||||||||||||
| Common Stocks | 572,251 | – | – | 572,251 | ||||||||||||
| Money Market Funds | 3,911 | – | – | 3,911 | ||||||||||||
| Total Assets | 576,162 | – | – | 576,162 | ||||||||||||
Refer to the Schedule of Investments for industry classifications.
Themes US R&D Champions ETF
| Level 1 | Level 2 | Level 3 | Total | |||||||||||||
| Assets: | ||||||||||||||||
| Common Stocks | 588,558 | – | – | 588,558 | ||||||||||||
| Money Market Funds | 3,148 | – | – | 3,148 | ||||||||||||
| Total Assets | 591,706 | – | – | 591,706 | ||||||||||||
Refer to the Schedule of Investments for industry classifications.
Themes US Small Cap Cash Flow Champions ETF
| Level 1 | Level 2 | Level 3 | Total | |||||||||||||
| Assets: | ||||||||||||||||
| Common Stocks | 595,285 | – | – | 595,285 | ||||||||||||
| Real Estate Investment Trusts | 2,738 | – | – | 2,738 | ||||||||||||
| Money Market Funds | 4,500 | – | – | 4,500 | ||||||||||||
| Total Assets | 602,523 | – | – | 602,523 | ||||||||||||
Refer to the Schedule of Investments for industry classifications.
Security Transactions
Investment transactions are recorded as of the date that the securities are purchased or sold (trade date). Realized gains and losses from the sale or disposition of securities are calculated based on the specific identification basis.
Investment Income
Dividend income is recognized on the ex-dividend date. Interest income is accrued daily. Withholding taxes on foreign dividends has been provided for in accordance with Funds’ understanding of the applicable tax rules and regulations. An amortized cost method of valuation may be used with respect to debt obligations with sixty days or less remaining to maturity, unless the Adviser determines in good faith that such method does not represent fair value.
Tax Information, Dividends and Distributions to Shareholders and Uncertain Tax Positions
The Funds are treated as separate entities for Federal income tax purposes. Each Fund intends to qualify as a regulated investment company (“RIC”) under Subchapter M of the Internal Revenue Code of 1986, as amended (the “Internal Revenue Code”). To qualify and remain eligible for the special tax treatment accorded to RICs, each Fund must meet certain annual
47
Themes ETF Trust
Notes to the Financial Statements (Continued)
March 31, 2024 (Unaudited)
income and quarterly asset diversification requirements and must distribute annually at least 90% of the sum of (i) its investment company taxable income (which includes dividends, interest and net short-term capital gains) and (ii) certain net tax-exempt income, if any. If so qualified, each Fund will not be subject to Federal income tax.
Distributions to shareholders are recorded on the ex-dividend date. The Funds generally pay out dividends from net investment income, if any, annually, and distribute its net capital gains, if any, to shareholders at least annually. The Funds may also pay a special distribution at the end of the calendar year to comply with Federal tax requirements. The amount of dividends and distributions from net investment income and net realized capital gains are determined in accordance with Federal income tax regulations, which may differ from U.S. GAAP. These “book/tax” differences are either considered temporary or permanent in nature. To the extent these differences are permanent in nature, such amounts are reclassified within the components of net assets based on their Federal tax basis treatment; temporary differences do not require reclassification. Dividends and distributions which exceed earnings and profit for tax purposes are reported as a tax return of capital.
Management evaluates the Funds’ tax positions to determine if the tax positions taken meet the minimum recognition threshold in connection with accounting for uncertainties in income tax positions taken or expected to be taken for the purposes of measuring and recognizing tax liabilities in the financial statements. Recognition of tax benefits of an uncertain tax position is required only when the position is “more likely than not” to be sustained assuming examination by taxing authorities. Interest and penalties related to income taxes would be recorded as income tax expense. The Funds’ Federal income tax returns are subject to examination by the Internal Revenue Service (the “IRS”) for a period of three fiscal years after they are filed. State and local tax returns may be subject to examination for an additional fiscal year depending on the jurisdiction.
The Funds commenced operations on December 7, December 12, and December 14, 2023.
Indemnification
In the normal course of business, the Funds expect to enter into contracts that contain a variety of representations and warranties and which provide general indemnifications. The Funds’ maximum exposure under these anticipated arrangements is unknown, as this would involve future claims that may be made against the Funds that have not yet occurred. However, the Adviser expects the risk of loss to be remote.
| 3. | INVESTMENT ADVISORY AND OTHER AGREEMENTS |
Investment Advisory Agreement
The Trust has entered into an Investment Advisory Agreement (the “Advisory Agreement”) with the Adviser. Under the Advisory Agreement, the Adviser provides a continuous investment program for the Funds’ assets in accordance with its investment objectives, policies and limitations, and oversees the day-to-day operations of the Funds subject to the supervision of the Board, including the Trustees who are not “interested persons” of the Trust as defined in the 1940 Act.
Pursuant to the Advisory Agreement between the Trust, on behalf of Funds, and Themes, each Fund pays a unified management fee to the Adviser, which is calculated daily and paid monthly, at an annual rate of 0.29% for USCF, USRD and SMCF and 0.35% for AIRL, CLOD, SPAM, FINE, WISE, GSIB, AUMI, CZAR, based on each Fund’s average daily net assets.
The Adviser has agreed to pay all expenses of the Funds except the fee paid to the Adviser under the Advisory Agreement, interest charges on any borrowings, taxes, brokerage commissions and other expenses incurred in placing orders for the purchase and sale of securities and other investment instruments, acquired fund fees and expenses, accrued deferred tax liability, extraordinary expenses, and distribution (12b-1) fees and expenses (if any) (collectively, “Excluded Expenses”). The Trust acknowledges and agrees that the Adviser may delegate its responsibility to pay some or all expenses incurred by the Funds, except for Excluded Expenses, to one or more third parties, including but not limited to, sub-advisers.
48
Themes ETF Trust
Notes to the Financial Statements (Continued)
March 31, 2024 (Unaudited)
Distribution Agreement and 12b-1 Plan
ALPS Distributors, Inc. (the “Distributor”) serves as each Fund’s distributor pursuant to a Distribution Agreement. The Distributor receives compensation from the Adviser for certain statutory underwriting services it provides to the Funds. The Distributor enters into agreements with certain broker-dealers and others that will allow those parties to be “Authorized Participants” and to subscribe for and redeem shares of the Funds. The Distributor will not distribute shares in less than whole Creation Units and does not maintain a secondary market in shares.
The Board has adopted a Distribution and Service Plan pursuant to Rule 12b-1 under the 1940 Act (“Rule 12b-1 Plan”). In accordance with the Rule 12b-1 Plan, each Fund is authorized to pay an amount up to 0.25% of the Fund’s average daily net assets each year for certain distribution-related activities. As authorized by the Board, no Rule 12b-1 fees are currently paid by the Funds and there are no plans to impose these fees. However, in the event Rule 12b-1 fees are charged in the future, they will be paid out of each Fund’s assets. The Adviser and its affiliates may, out of their own resources, pay amounts to third parties for distribution or marketing services on behalf of the Funds.
Administrator, Custodian and Transfer Agent
U.S. Bancorp Fund Services, LLC, doing business as U.S. Bank Global Fund Services (“Fund Services” or “Administrator”) serves as administrator, transfer agent and fund accounting agent of the Funds pursuant to an Administration Agreement, Transfer Agency and Service Agreement and Fund Accounting Agreement. U.S. Bank N.A. (the “Custodian”), an affiliate of Fund Services, serves as the Funds’ custodian pursuant to a Custody Agreement. Under the terms of these agreements, the Adviser pays each Fund’s administrative, custody and transfer agency fees.
Pursuant to an agreement between the Trust, on behalf of the Funds, and ACA Global, an employee of ACA Global serves as Chief Compliance Officer of the Trust. Fees for these services are paid by the Adviser under the terms of the Advisory Agreement.
At March 31, 2024, certain Officers and a Trustee of the Trust were also officers or employees of the Adviser.
| 4. | CREATION AND REDEMPTION TRANSACTIONS |
Shares of the Funds are listed and traded on the NASDAQ Stock Market LLC (the “Exchange”). Each Fund issues and redeems shares on a continuous basis at NAV only in large blocks of shares called “Creation Units.” Creation Units are to be issued and redeemed principally in kind for a basket of securities and a balancing cash amount. Shares generally will trade in the secondary market in amounts less than a Creation Unit at market prices that change throughout the day. Market prices for the shares may be different from their NAV. The NAV is determined as of the close of trading (generally, 4:00 p.m. Eastern Time) on each day the NYSE is open for trading. The NAV of the shares of each Fund will be equal to a Fund’s total assets minus a Fund’s total liabilities divided by the total number of shares outstanding. The NAV that is published will be rounded to the nearest cent; however, for purposes of determining the price of Creation Units, the NAV will be calculated to four decimal places.
Creation Unit Transaction Fee
Authorized Participants will be required to pay to the Custodian a fixed transaction fee (the “Creation Unit Transaction Fee”) in connection with the issuance or redemption of Creation Units. The standard Creation Unit Transaction Fee will be the same regardless of the number of Creation Units purchased or redeemed by an investor on the applicable business day. The Creation Unit Transaction Fee charged by each Fund for each creation order is $300.
The fixed creation unit transaction fee may be waived on certain orders if the applicable Fund’s custodian has determined to waive some or all of the Creation Order Costs associated with the order or another party, such as the Adviser, has agreed to pay such fee.
49
Themes ETF Trust
Notes to the Financial Statements (Continued)
March 31, 2024 (Unaudited)
An additional variable fee of up to a maximum of 2% of the value of the Creation Units subject to the transaction may be imposed for (i) creations effected outside the Clearing Process and (ii) creations made in an all cash amount (to offset the Trust’s brokerage and other transaction costs associated with using cash to purchase or redeem the requisite deposit securities). Investors are responsible for the costs of transferring the securities constituting the deposit securities to the account of the Trust. Each Fund may determine to not charge a variable fee on certain orders when the Adviser has determined that doing so is in the best interests of Fund shareholders.
Only “Authorized Participants” may purchase or redeem shares directly from the Funds. An Authorized Participant is either (i) a broker-dealer or other participant in the clearing process through the Continuous Net Settlement System of National Securities Clearing Corporation or (ii) a DTC participant and, in each case, must have executed a Participant Agreement with the Distributor. Most retail investors will not qualify as Authorized Participants or have the resources to buy and sell whole Creation Units. Therefore, they will be unable to purchase or redeem the shares directly from the Funds. Rather, most retail investors will purchase shares in the secondary market with the assistance of a broker and will be subject to customary brokerage commissions or fees. Securities received or delivered in connection with in-kind creates and redeems are valued as of the close of business on the effective date of the creation or redemption.
A creation unit will generally not be issued until the transfer of good title of the deposit securities to the Funds and the payment of any cash amounts have been completed. To the extent contemplated by the applicable participant agreement, Creation Units of the Funds will be issued to such authorized participant notwithstanding the fact that the Funds’ deposits have not been received in part or in whole, in reliance on the undertaking of the authorized participant to deliver the missing deposit securities as soon as possible. If the Funds or their agents do not receive all of the deposit securities, or the required cash amounts, by such time, then the order may be deemed rejected and the authorized participant shall be liable to the Funds for losses, if any.
| 5. | INVESTMENT TRANSACTIONS |
Purchases and sales of investments (excluding short-term investments), creations in-kind and redemptions in-kind for the period ended March 31, 2024, were as follows:
| Purchases | Sales | Creations In-Kind | Redemptions In-Kind | |||||||||||||
| AIRL | $ | 512,241 | $ | 12,225 | $ | – | $ | – | ||||||||
| CLOD | 48,643 | 38,471 | 1,297,610 | – | ||||||||||||
| SPAM | 581,570 | 87,200 | 838,660 | – | ||||||||||||
| FINE | 107,659 | 103,464 | 494,048 | – | ||||||||||||
| WISE | 3,637,914 | 2,787,559 | 19,420,869 | – | ||||||||||||
| GSIB | 16,655 | 24,101 | 508,224 | – | ||||||||||||
| AUMI | 213,357 | 148,926 | 1,245,911 | – | ||||||||||||
| CZAR | 193,713 | 191,476 | 497,782 | – | ||||||||||||
| USCF | 25,875 | 23,293 | 498,179 | – | ||||||||||||
| USRD | 92,643 | 94,464 | 499,620 | – | ||||||||||||
| SMCF | 146,201 | 137,812 | 490,810 | – | ||||||||||||
50
Themes ETF Trust
Notes to the Financial Statements (Continued)
March 31, 2024 (Unaudited)
| 6. | PRINCIPAL RISKS |
As with all ETFs, shareholders of the Funds are subject to the risk that their investment could lose money. Each Fund is subject to the principal risks, any of which may adversely affect a Fund’s NAV, trading price, yield, total return and ability to meet its investment objective.
A complete description of the principal risks is included in the Funds’ prospectuses under the heading “Principal Investment Risks.”
| 7. | SUBSEQUENT EVENTS |
Management has evaluated subsequent events through March 31, 2024, the date the financial statement was available for issuance. Based on this evaluation, no adjustments to the financial statement were required.
51
Board Consideration and Approval of Advisory Agreement (Unaudited)
At a meeting held on November 3, 2023 (the “Meeting”), the Board of Trustees (the “Board”) of Themes ETF Trust (the “Trust”), including those trustees who are not “interested persons” of the Trust, as defined in the Investment Company Act of 1940 (the “1940 Act”) (the “Independent Trustees”), considered the approval of an advisory agreement (the “Agreement”) between Themes Management Company, LLC (the “Adviser” or “Themes”) and the Trust, on behalf of an initial 22 series of shares (each, a “Fund” and together, the “Funds”).
At the Meeting, the Board and the Independent Trustees evaluated a number of factors, including, among other things: (i) the nature, extent, and quality of the services to be provided by Themes; (ii) the investment performance of the Fund and Themes; (iii) the costs of the services to be provided and profits to be realized by Themes from its relationship with each Fund; (iv) the extent to which economies of scale would be realized as a Fund grows and whether advisory fee levels reflect those economies of scale for the benefit of the Fund’s investors; and (v) Themes’ practices regarding possible conflicts of interest.
In assessing these factors and reaching its decisions, the Board took into consideration information specifically prepared and/or presented in connection with the approval process with respect to each Fund, including information presented to the Board by representatives of Themes. The Trustees noted having met with Independent Trustee Counsel prior to today’s Meeting and that they discussed at length their duties and responsibilities in considering approval of the Advisory Agreement and the information provided in Themes’ 15c response along with the various exhibits. The Board noted that it requested and/or was provided with information and reports relevant to the approval of the Advisory Agreement, including: (i) reports regarding the services and support to be provided to each Fund and its shareholders; (ii) presentations by management of Themes addressing the investment strategy, personnel and operations to be utilized in managing each Fund; (iii) disclosure information contained in the registration statement of the Trust and the Form ADV and/or policies and procedures of Themes; and (iv) the memorandum from Practus that summarized the fiduciary duties and responsibilities of the Board in reviewing and approving the Advisory Agreement, including the material factors set forth above and the types of information included in each factor that should be considered by the Board in order to make an informed decision.
The Board also requested and received various informational materials including, without limitation: (i) documents containing information about Themes, including financial information, a description of personnel and the services to be provided to each Fund, information on the indexes that will be utilized by the respective Funds along with information on the index providers, summaries of its compliance program, including Themes Code of Ethics and other general information; (ii) comparative expense information; (iii) the anticipated effect of size on each Fund’s performance and expenses; and (iv) benefits to be realized by Themes from its relationship with the Funds.
The Board reflected on its discussions regarding the Advisory Agreement and the anticipated manner in which each Fund would be managed with representatives of Themes. The Board did not identify any particular information that was most relevant to its consideration to approve the Advisory Agreement and each Trustee may have afforded different weight to the various factors. In deciding whether to approve the Advisory Agreement, the Trustees considered numerous factors, including:
| 1. | The nature, extent, and quality of the services to be provided by Themes. |
In this regard, the Board considered the responsibilities of Themes under the Advisory Agreement and the services to be provided including, without limitation, the process for tracking each Fund’s benchmark index (where applicable) and assuring compliance with each Fund’s investment objectives and limitations; the anticipated coordination of services for the Funds among the service providers, and the anticipated efforts of Themes to promote the Funds and grow their assets. The Board considered Themes’ staffing, personnel, shared services arrangement with an affiliated company, and methods of operating, the education and experience of its personnel, and its compliance programs, policies and procedures. The Board considered that while Themes was a newly formed entity and that it had no experience managing registered funds, its personnel had significant experience in managing the portfolios of other registered funds and the overall operations of a large family of funds. The Board also considered the financial condition of Themes and the commitment of financial support from its owners. The Board considered the measures that Themes had put in place to ensure compliance with applicable law and regulations, including the hiring of an independent compliance firm to assist with the development of its compliance policies and procedures and the hiring an independent chief compliance officer to oversee its compliance program. The Board
52
Themes ETF Trust
Board Consideration and Approval of Advisory Agreement (Unaudited) (Continued)
also considered the trading and operational capabilities of Themes, noting in particular the highly automated trading and compliance systems. It was noted by the Board that 21 of the 22 funds are passively managed index funds which typically rebalance only semi-annually or quarterly thus reducing potential strains on the portfolio management and trading team. After reviewing the foregoing and further information from Themes, and notwithstanding the limited operating experience of Themes as an entity, the Board concluded that the personnel at Themes have the resources, experience and expertise to provide the Funds with the quality, extent, and nature of the services required by the Advisory Agreement.
| 2. | Investment Performance of the Funds and Themes. |
The Board noted that the Funds had not commenced operations and therefore consideration of a Fund’s performance was not relevant at this time. It was also noted that Themes was a new entity formed expressly to manage the Funds and did not manage any other accounts. As such, there was no investment performance to review at this time. The Board acknowledged the investment management, operational, trading and compliance teams at Themes have extensive experience in their respective roles and are qualified to manage the Funds’ in accordance with their respective investment objectives and strategies.
| 3. | The costs of services to be provided and profits to be realized by Themes from its relationship with the Funds. |
In this regard, the Board considered the financial condition of Themes and the level of commitment to the Funds by its owners and the expenses of each Fund, including the nature and frequency of advisory fee payments. The Board noted projections from Themes as to the level of assets under management needed in each Fund in order for it to become profitable. The Board reviewed comparative information on other ETFs that employ an investment strategy that is similar to the respective Funds. The Board considered how the Funds’ management fees compare to other similar funds, noting that each Fund’s management fee was in line with or lower than the management fees charged by the similar fund. They also compared the Funds’ expense ratios to the respective group of similar funds, finding that each Fund’s expense ratio was in line with or below the average similar fund. The Board also discussed the differences in certain of the Funds’ investment strategies from the group of similar funds, noting that in each instance the Themes Fund will likely be more operationally expensive to operate than its similar funds. Following a review of the comparative information provided for each Fund and upon further consideration and discussion of the foregoing, the Board concluded that the fees to be paid to Themes were fair and reasonable.
| 4. | The extent to which economies of scale would be realized as a Fund grows and whether advisory fee levels reflect these economies of scale for the benefit of the Fund’s investors. |
In this regard, the Board considered each Fund’s proposed fee arrangements with Themes, noting that each Fund has a unitary fee structure. The Board noted that none of the proposed advisory fees include a breakpoint but that the unitary fee structure would have the effect of capping the expenses for each Fund. Following further discussion of each Fund’s projected asset levels, expectations for growth, and levels of fees, the Board determined that each Fund’s proposed fee arrangement with Themes was fair and reasonable in relation to the nature and quality of the services to be provided by Themes.
| 5. | Possible conflicts of interest and other benefits. |
In evaluating the possibility for conflicts of interest, the Board considered such matters as: the experience and ability of the advisory personnel assigned to the Funds; the basis of decisions to buy or sell securities for the Funds; the substance and administration of the Code of Ethics and other relevant policies described in Themes’ Form ADV and compliance policies and procedures. The Board considered that Themes does not currently manage any other investments for clients. The Board also considered potential benefits for Themes in managing the Funds. The Board noted that Themes represented that it may utilize soft dollars at some point in the future. Following further consideration and discussion, the Board indicated that Themes’ standards and practices relating to the identification and mitigation of potential conflicts of interest, as well as the benefits to be derived by Themes from managing the Funds were satisfactory.
53
Themes ETF Trust
Board Consideration and Approval of Advisory Agreement (Unaudited) (Continued)
Based on a consideration of all the factors in their totality, the Board, including a majority of the Independent Trustees, determined that the terms of the Agreement, including the compensation payable under the Agreement, are fair and reasonable to each Fund. The Board, including a majority of the Independent Trustees, therefore determined that the approval of the Agreement for an initial term of two years was in the best interests of each Fund and its respective shareholders.
54
Review of Liquidity Risk Management Program (Unaudited)
Pursuant to Rule 22e-4 under the Investment Company Act of 1940, the Trust, on behalf of the series of the Trust covered by this shareholder report (the “Series”), has adopted a liquidity risk management program to govern the Trust’s approach to managing liquidity risk. Rule 22e-4 seeks to promote effective liquidity risk management, thereby reducing the risk that a fund will be unable to meet its redemption obligations and mitigating dilution of the interests of fund shareholders. The Trust’s liquidity risk management program is tailored to reflect the Series’ particular risks, but not to eliminate all adverse impacts of liquidity risk, which would be incompatible with the nature of such Series.
The investment adviser to the Series has adopted and implemented its own written liquidity risk management program (the “Program”) tailored specifically to assess and manage the liquidity risk of the Series.
There can be no assurance that the Program will achieve its objectives in the future. Please refer to the prospectus for more information regarding the Series’ exposure to liquidity risk and other principal risks to which an investment in the Series may be subject.
55
Supplemental Information (Unaudited)
Investors should consider the investment objective and policies, risk considerations, charges and ongoing expenses of an investment carefully before investing. The prospectus contains this and other information relevant to an investment in the Funds. Please read the prospectus carefully before investing. A copy of the prospectus for the Funds may be obtained without charge by writing to the Funds, c/o U.S. Bank Global Fund Services, P.O. Box 701, Milwaukee, Wisconsin 53201-0701 or by calling 1-866-584-3637, or by visiting the Funds’ website at www.ThemesETFs.com.
Quarterly Portfolio Holding Information
Each Fund files its complete schedule of portfolio holdings for its first and third fiscal quarters with the Securities and Exchange Commission (“SEC”) on Part F of Form N-PORT. The Funds’ Part F of Form N-PORT is available without charge, upon request, by calling toll-free at 1-866-584-3637. Furthermore, you may obtain the Part F of Form N-PORT on the SEC’s website at www.sec.gov.
Proxy Voting Information
Each Fund is required to file a Form N-PX, with the Fund’s complete proxy voting record for the 12 months ended June 30, no later than August 31 of each year. The Fund’s proxy voting record will be available without charge, upon request, by calling toll-free 1-866-584-3637 and on the SEC’s website at www.sec.gov.
Frequency Distribution of Premiums and Discounts
Information regarding how often shares of the Funds trade on an exchange at a price above (i.e., at a premium) or below (i.e., at a discount) the NAV of the Funds is available without charge, on the Funds’ website at www.ThemesETFs.com.
56
Themes ETF Trust
General Information (Unaudited)
Investment Adviser:
Themes Management Company, LLC
34 East Putnam Avenue, Suite 112
Greenwich, CT 06830
Legal Counsel:
Practus, LLP
11300 Tomahawk Creek Parkway, Suite 310
Leawood, Kansas 66211
Independent Registered Public Accounting Firm:
Cohen & Company, Ltd.
1350 Euclid Avenue, Suite 800
Cleveland, OH 44115
Distributor:
Alps Distributors, Inc.
1290 Broadway, Suite 1000
Denver, CO 80203
Administrator, Fund Accountant & Transfer Agent:
U.S. Bancorp Fund Services, LLC
d/b/a U.S. Bank Global Fund Services
615 E. Michigan St.
Milwaukee, WI 53202
Custodian:
U.S. Bank N.A.
1555 North RiverCenter Drive, Suite 302
Milwaukee, WI 53212
This information must be preceded or accompanied by a current prospectus for the Funds.
| b) | Not applicable. |
Item 2. Code of Ethics.
Not applicable for semi-annual reports.
Item 3. Audit Committee Financial Expert.
Not applicable for semi-annual reports.
Item 4. Principal Accountant Fees and Services.
Not applicable for semi-annual reports.
Item 5. Audit Committee of Listed Registrants.
(a) Not applicable for semi-annual reports.
(b) Not applicable.
Item 6. Investments.
| (a) | Schedule of Investments is included as part of the report to shareholders filed under Item 1 of this Form. |
| (b) | Not applicable. |
Item 7. Disclosure of Proxy Voting Policies and Procedures for Closed-End Management Investment Companies.
Not applicable to open-end investment companies.
Item 8. Portfolio Managers of Closed-End Management Investment Companies.
Not applicable to open-end investment companies.
Item 9. Purchases of Equity Securities by Closed-End Management Investment Company and Affiliated Purchasers.
Not applicable to open-end investment companies.
Item 10. Submission of Matters to a Vote of Security Holders.
There have been no material changes to the procedures by which shareholders may recommend nominees to the registrant’s board of trustees.
Item 11. Controls and Procedures.
| (a) | The Registrant’s Principal Executive Officer and Principal Financial Officer have reviewed the Registrant’s disclosure controls and procedures (as defined in Rule 30a-3(c) under the Investment Company Act of 1940 (the “Act”)) as of a date within 90 days of the filing of this report, as required by Rule 30a-3(b) under the Act and Rules 13a-15(b) or 15d-15(b) under the Securities Exchange Act of 1934. Based on their review, such officers have concluded that the disclosure controls and procedures are effective in ensuring that information required to be disclosed in this report is appropriately recorded, processed, summarized and reported and made known to them by others within the Registrant and by the Registrant’s service provider. |
| (b) | There were no changes in the Registrant’s internal control over financial reporting (as defined in Rule 30a-3(d) under the Act) that occurred during the period covered by this report that have materially affected, or are reasonably likely to materially affect, the Registrant’s internal control over financial reporting. |
Item 12. Disclosure of Securities Lending Activities for Closed-End Management Investment Companies
Not applicable to open-end investment companies.
Item 13. Exhibits.
| (a) | (1) Any code of ethics or amendment thereto, that is the subject of the disclosure required by Item 2, to the extent that the registrant intends to satisfy Item 2 requirements through filing an exhibit. Not Applicable. |
(3) Any written solicitation to purchase securities under Rule 23c-1 under the Act sent or given during the period covered by the report by or on behalf of the registrant to 10 or more persons. Not applicable to open-end investment companies.
(4) Change in the registrant’s independent public accountant. There was no change in the registrant’s independent public accountant for the period covered by this report.
| (b) | Certifications pursuant to Section 906 of the Sarbanes-Oxley Act of 2002. Furnished herewith. |
SIGNATURES
Pursuant to the requirements of the Securities Exchange Act of 1934 and the Investment Company Act of 1940, the registrant has duly caused this report to be signed on its behalf by the undersigned, thereunto duly authorized.
| (Registrant) | Themes ETF Trust | ||||
| By (Signature and Title)* | /s/ Jose Gonzalez | ||||
| Jose Gonzalez CEO/Principal Executive Officer | |||||
| Date | 6/5/2024 | ||||
Pursuant to the requirements of the Securities Exchange Act of 1934 and the Investment Company Act of 1940, this report has been signed below by the following persons on behalf of the registrant and in the capacities and on the dates indicated.
| By (Signature and Title)* | /s/ Jose Gonzalez | ||||
| Jose Gonzalez, CEO/Principal Executive Officer | |||||
| Date | 6/5/2024 | ||||
| By (Signature and Title)* | /s/ Dobromir Kamburov | ||||
| Dobromir Kamburov, COO/Principal Financial Officer | |||||
| Date | 6/5/2024 | ||||
| * | Print the name and title of each signing officer under his or her signature. |