Madison ETFs Trust
Core Financial Statements
June 30, 2024
UNITED STATES
SECURITIES AND EXCHANGE COMMISSION
Washington, D.C. 20549
FORM N-CSR
CERTIFIED SHAREHOLDER REPORT OF REGISTERED
MANAGEMENT INVESTMENT COMPANIES
Investment Company Act file number 811-23875
Madison ETFs Trust
(Exact name of registrant as specified in charter)
550 Science Drive
Madison, Wisconsin 53711
(Address of principal executive offices) (Zip code)
Greg Hoppe
Madison ETFs Trust
550 Science Drive
Madison, Wisconsin 53711
(Name and address of agent for service)
800-767-0300
Registrant’s telephone number, including area code
Date of fiscal year end: June 30
Date of reporting period: June 30, 2024
Item 1. Reports to Stockholders.
| (a) | A copy of the report transmitted to shareholders pursuant to Rule 30e-1 under the Investment Company Act of 1940, as amended (“Act”), is filed herewith. |
 | Madison Short-Term Strategic Income ETF |  |
| MSTI (Principal U.S. Listing Exchange: NYSE) | ||
| Annual Shareholder Report | June 30, 2024 |
Fund Name | Costs of a $10,000 investment | Costs paid as a percentage of a $10,000 investment |
| Madison Short-Term Strategic Income ETF | $34* | 0.40% |
| * | Amount shown reflects the expenses of the Fund from inception date through June 30, 2024. Expenses would be higher if the Fund had been in operations for the full year. |
| Madison Short-Term Strategic Income ETF | PAGE 1 | TSR_AR_557441201 |
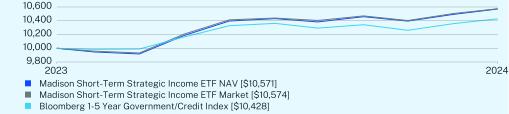
Since Inception (09/05/2023) | |
Madison Short-Term Strategic Income ETF NAV | 5.71 |
Madison Short-Term Strategic Income ETF Market | 5.74 |
Bloomberg 1-5 Year Government/Credit Index | 4.28 |
| * | The Fund’s past performance is not a good predictor of the Fund’s future performance. The returns do not reflect the deduction of taxes that a shareholder would pay on Fund distributions or redemption of Fund shares. |
Net Assets | $59,797,928 |
Number of Holdings | 96 |
Net Advisory Fee | $183,162 |
Portfolio Turnover | 17% |
Average Credit Quality | Baa2 |
Effective Duration | 2.43 yrs |
30-Day SEC Yield | 5.02% |
Top Sectors (% of net assets) | |
Financials | 31.5% |
Asset Backed Securities | 12.5% |
Government | 8.9% |
Mortgage Securities | 8.6% |
Communications | 6.9% |
Industrials | 6.8% |
Technology | 6.5% |
Energy | 5.1% |
Health Care | 4.0% |
Cash & Other | 9.2% |
Top 10 Issuers (% of net assets) | |
United States Treasury Note/Bond | 7.6% |
Federal Home Loan Mortgage Corp. | 3.2% |
Federal National Mortgage Association | 2.8% |
GM Financial Consumer Automobile Receivables Trust | 2.2% |
Discover Financial Services | 2.2% |
Bank of America Corp. | 2.1% |
Netflix, Inc. | 2.1% |
Goldman Sachs Group, Inc. | 2.0% |
PNC Financial Services Group, Inc. | 2.0% |
JPMorgan Chase & Co. | 2.0% |
| Madison Short-Term Strategic Income ETF | PAGE 2 | TSR_AR_557441201 |
| Madison Short-Term Strategic Income ETF | PAGE 3 | TSR_AR_557441201 |
 | Madison Aggregate Bond ETF |  |
| MAGG (Principal U.S. Listing Exchange: NYSE ) | ||
| Annual Shareholder Report | June 30, 2024 |
Fund Name | Costs of a $10,000 investment | Costs paid as a percentage of a $10,000 investment |
| Madison Aggregate Bond ETF | $34* | 0.40% |
| * | Amount shown reflects the expenses of the Fund from inception date through June 30, 2024. Expenses would be higher if the Fund had been in operations for the full year. |
| Madison Aggregate Bond ETF | PAGE 1 | TSR_AR_557441300 |
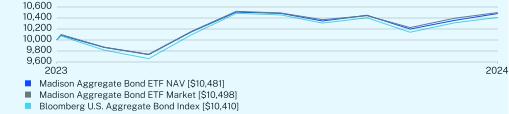
Since Inception (08/28/2023) | |
Madison Aggregate Bond ETF NAV | 4.81 |
Madison Aggregate Bond ETF Market | 4.98 |
Bloomberg U.S. Aggregate Bond Index | 4.10 |
| * | The Fund’s past performance is not a good predictor of the Fund’s future performance. The returns do not reflect the deduction of taxes that a shareholder would pay on Fund distributions or redemption of Fund shares. |
Net Assets | $54,479,727 |
Number of Holdings | 199 |
Net Advisory Fee | $161,267 |
Portfolio Turnover | 19% |
Average Credit Quality | AA3 |
Effective Duration | 5.56 yrs |
30-Day SEC Yield | 4.80% |
Security Type (% of net assets) | |
Mortgage-Backed Securities | 32.8% |
Corporate Bonds | 32.3% |
U.S. Treasury Securities | 23.2% |
Asset-Backed Securities | 5.3% |
Collateralized Mortgage Obligations | 3.5% |
Cash & Other | 2.9% |
Top 10 Issuers (% of net assets) | |
United States Treasury Note/Bond | 23.2% |
Federal Home Loan Mortgage Corp. | 17.7% |
Federal National Mortgage Association | 16.6% |
Chase Auto Owner Trust | 1.3% |
AerCap Ireland Capital DAC / AerCap Global Aviation Trust | 1.2% |
Energy Transfer LP | 1.0% |
AbbVie, Inc. | 1.0% |
GE HealthCare Technologies, Inc. | 1.0% |
PNC Financial Services Group, Inc. | 0.9% |
Towd Point Mortgage Trust | 0.9% |
| Madison Aggregate Bond ETF | PAGE 2 | TSR_AR_557441300 |
| Madison Aggregate Bond ETF | PAGE 3 | TSR_AR_557441300 |
 | Madison Covered Call ETF |  |
| CVRD (Principal U.S. Listing Exchange: NYSE) | ||
| Annual Shareholder Report | June 30, 2024 |
Fund Name | Costs of a $10,000 investment | Costs paid as a percentage of a $10,000 investment |
| Madison Covered Call ETF | $80* | 0.90% |
| * | Amount shown reflects the expenses of the Fund from inception date through June 30, 2024. Expenses would be higher if the Fund had been in operations for the full year. |
| Madison Covered Call ETF | PAGE 1 | TSR_AR_557441409 |
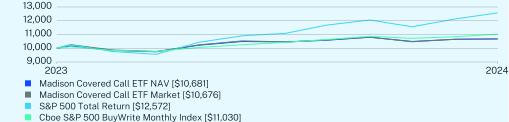
Since Inception (08/21/2023) | |
Madison Covered Call ETF NAV | 6.82 |
Madison Covered Call ETF Market | 6.76 |
S&P 500 Total Return | 25.72 |
Cboe S&P 500 BuyWrite Monthly Index | 10.30 |
| * | The Fund’s past performance is not a good predictor of the Fund’s future performance. The returns do not reflect the deduction of taxes that a shareholder would pay on Fund distributions or redemption of Fund shares. |
Net Assets | $71,238,013 |
Number of Holdings | 87 |
Net Advisory Fee | $533,677 |
Portfolio Turnover | 205% |
30-Day SEC Yield | 1.51% |
30-Day SEC Yield Unsubsidized | 1.36% |
Top Sectors (% of net assets) | |
Technology | 26.8% |
Financials | 13.2% |
Health Care | 12.3% |
Consumer Discretionary | 10.1% |
Industrials | 8.8% |
Consumer Staples | 6.8% |
Communications | 6.5% |
Energy | 5.3% |
Materials | 3.2% |
Cash & Other | 7.0% |
Top 10 Issuers (% of net assets) | |
Danaher Corp. | 3.7% |
Las Vegas Sands Corp. | 3.2% |
Cisco Systems, Inc. | 3.1% |
Adobe, Inc. | 3.1% |
CME Group, Inc. | 3.1% |
Constellation Brands, Inc. | 2.9% |
Lowe’s Cos., Inc. | 2.8% |
Microchip Technology, Inc. | 2.9% |
Texas Instruments, Inc. | 2.7% |
Accenture PLC | 2.6% |
| Madison Covered Call ETF | PAGE 2 | TSR_AR_557441409 |
| Madison Covered Call ETF | PAGE 3 | TSR_AR_557441409 |
 | Madison Dividend Value ETF |  |
| DIVL (Principal U.S. Listing Exchange: NYSE) | ||
| Annual Shareholder Report | June 30, 2024 |
Fund Name | Costs of a $10,000 investment | Costs paid as a percentage of a $10,000 investment |
| Madison Dividend Value ETF | $58* | 0.65% |
| * | Amount shown reflects the expenses of the Fund from inception date through June 30, 2024. Expenses would be higher if the Fund had been in operations for the full year. |
| Madison Dividend Value ETF | PAGE 1 | TSR_AR_557441508 |
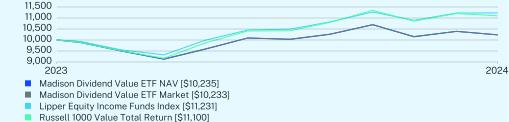
Since Inception (08/14/2023) | |
Madison Dividend Value ETF NAV | 2.35 |
Madison Dividend Value ETF Market | 2.33 |
Lipper Equity Income Funds Index | 12.31 |
Russell 1000 Value Total Return | 11.00 |
| * | The Fund’s past performance is not a good predictor of the Fund’s future performance. The returns do not reflect the deduction of taxes that a shareholder would pay on Fund distributions or redemption of Fund shares. |
Net Assets | $55,581,123 |
Number of Holdings | 37 |
Net Advisory Fee | $361,104 |
Portfolio Turnover | 60% |
30-Day SEC Yield | 2.40% |
30-Day SEC Yield Unsubsidized | 2.40% |
Top Sectors (% of net assets) | |
Financials | 22.3% |
Industrials | 18.9% |
Energy | 12.1% |
Technology | 10.4% |
Health Care | 10.0% |
Utilities | 7.0% |
Consumer Discretionary | 6.6% |
Consumer Staples | 4.8% |
Materials | 3.2% |
Cash & Other | 4.7% |
Top 10 Issuers (% of net assets) | |
NextEra Energy, Inc. | 4.2% |
Texas Instruments, Inc. | 4.0% |
AbbVie, Inc. | 4.0% |
Automatic Data Processing, Inc. | 4.0% |
Morgan Stanley | 3.9% |
Fastenal Co. | 3.9% |
EOG Resources, Inc. | 3.8% |
Bank of America Corp. | 3.8% |
Home Depot, Inc. | 3.6% |
Medtronic PLC | 3.5% |
| Madison Dividend Value ETF | PAGE 2 | TSR_AR_557441508 |
| Madison Dividend Value ETF | PAGE 3 | TSR_AR_557441508 |
Item 2. Code of Ethics.
The registrant has adopted a code of ethics that applies to the registrant’s principal executive officer and principal financial officer. The registrant has not made any substantive amendments to its code of ethics during the period covered by this report. The registrant has not granted any waivers from any provisions of the code of ethics during the period covered by this report.
The registrant undertakes to provide to any person without charge, upon request, a copy of its code of ethics by mail when they call the registrant at 800-767-0300.
Item 3. Audit Committee Financial Expert.
The registrant’s board of trustees has determined that there is at least one audit committee financial expert serving on its audit committee. Richard E. Struthers is the “audit committee financial expert” and is considered to be “independent” as each term is defined in Item 3 of Form N-CSR.
Item 4. Principal Accountant Fees and Services.
The registrant has engaged its principal accountant to perform audit services, audit-related services, tax services and other services since inception. “Audit services” refer to performing an audit of the registrant’s annual financial statements or services that are normally provided by the accountant in connection with statutory and regulatory filings or engagements for those fiscal years. “Audit-related services” refer to the assurance and related services by the principal accountant that are reasonably related to the performance of the audit. “Tax services” refer to professional services rendered by the principal accountant for tax compliance, tax advice, and tax planning. These services were for the completion of the Funds federal and state income tax returns, excise tax returns, and review of excise tax calculations. “Other services” refer to other services rendered by the registrant’s principal accountant to the registrant other than those reported under the "audit services", "audit-related services", and "tax services”. The following table details the aggregate fees billed or expected to be billed since inception for audit fees, audit-related fees, tax fees and other fees by the principal accountant.
| FYE 6/30/2024 | ||
| (a) Audit Fees | 49,500 | |
| (b) Audit-Related Fees | 0 | |
| (c) Tax Fees | 12,000 | |
| (d) All Other Fees | 0 |
(e)(1) The audit committee of the registrant has adopted pre-approval policies and procedures that require the audit committee to pre-approve all audit and non-audit services of the registrant, including services provided to any entity affiliated with the registrant. The audit committee may delegate to one or more of its members the authority to grant such pre-approvals. Any decision of any member to whom such authority is delegated shall be presented to the full audit committee at the next regularly scheduled meeting of the registrant’s board of trustees.
(e)(2) The percentage of fees billed by Cohen & Company, Ltd applicable to non-audit services pursuant to waiver of pre-approval requirement were as follows:
| FYE 6/30/2024 | ||
| Audit-Related Fees | 0% | |
| Tax Fees | 0% | |
| All Other Fees | 0% |
(f) Not applicable.
(g) The following table indicates the non-audit fees billed or expected to be billed by the registrant’s accountant for services to the registrant and to the registrant’s investment adviser (not including any sub-adviser whose role is primarily portfolio management and is subcontracted with or overseen by another investment adviser), and any entity controlling, controlled by, or under common control with the adviser that provides ongoing services to the registrant since inception.
| Non-Audit Related Fees | FYE 6/30/2024 | |
| Registrant | None | |
| Registrant’s Investment Adviser | None |
(h) Because no such non-audit services were rendered, the audit committee of the board of trustees did not consider whether the provision of non-audit services that were rendered to the registrant’s investment adviser (not including any subadviser whose role is primarily portfolio management and is subcontracted with or overseen by another investment adviser), and any entity controlling, controlled by, or under common control with the investment adviser that provides ongoing services to the registrant that were not pre-approved pursuant to paragraph (c)(7)(ii) of Rule 2-01 of Regulation S-X, is compatible with maintaining the principal accountant’s independence.
(i) Not applicable.
(j) Not applicable.
Item 5. Audit Committee of Listed Registrants.
(a) The registrant is an issuer as defined in Rule 10A-3 under the Securities Exchange Act of 1934, (the “Act”) and has a separately-designated standing audit committee established in accordance with Section 3(a)(58)(A) of the Act. The independent members of the committee are as follows: Steven P. Riege and Richard E. Struthers.
(b) Not applicable.
Item 6. Investments.
| (a) | Schedule of Investments is included within the financial statements filed under Item 7(a) of this Form. |
| (b) | Not applicable. |
Item 7. Financial Statements and Financial Highlights for Open-End Investment Companies.
| (a) | The registrant’s Financial Statements are filed herewith. |
Page | |||
Par | Value | |||||
CORPORATE BONDS - 68.4% | ||||||
Communications - 6.9% | ||||||
Lamar Media Corp., 4.88%, 01/15/2029 | $620,000 | $595,800 | ||||
Netflix, Inc., 6.38%, 05/15/2029 | 1,180,000 | 1,243,693 | ||||
Sprint LLC, 7.63%, 03/01/2026 | 1,150,000 | 1,181,690 | ||||
VeriSign, Inc., 4.75%, 07/15/2027 | 1,140,000 | 1,120,277 | ||||
4,141,460 | ||||||
Consumer Discretionary - 2.0% | ||||||
Royal Caribbean Cruises Ltd., 7.50%, 10/15/2027 | 400,000 | 420,337 | ||||
Williams Scotsman, Inc., 6.13%, 06/15/2025(a) | 748,000 | 746,747 | ||||
1,167,084 | ||||||
Consumer Staples - 2.3% | ||||||
Lamb Weston Holdings, Inc., 4.88%, 05/15/2028(a) | 600,000 | 581,184 | ||||
Performance Food Group, Inc., 5.50%, 10/15/2027(a) | 800,000 | 782,456 | ||||
1,363,640 | ||||||
Energy - 5.1% | ||||||
Murphy Oil USA, Inc., 5.63%, 05/01/2027 | 1,175,000 | 1,161,330 | ||||
Sunoco LP / Sunoco Finance Corp., 6.00%, 04/15/2027 | 793,000 | 791,973 | ||||
Valero Energy Partners LP, 4.50%, 03/15/2028 | 1,155,000 | 1,126,547 | ||||
3,079,850 | ||||||
Financials - 31.5%(b) | ||||||
AerCap Ireland Capital DAC / AerCap Global Aviation Trust, 4.63%, 10/15/2027 | 1,033,000 | 1,006,666 | ||||
American Express Co., 4.20%, 11/06/2025 | 920,000 | 906,381 | ||||
Bank of America Corp., 3.50%, 04/19/2026 | 1,318,000 | 1,277,674 | ||||
Bank of New York Mellon Corp., 4.60% to 07/26/2029 then SOFR + 1.76%, 07/26/2030 | 1,023,000 | 1,000,357 | ||||
Boston Properties LP, 6.75%, 12/01/2027 | 715,000 | 733,541 | ||||
Capital One Financial Corp., 3.80%, 01/31/2028 | 1,043,000 | 992,013 | ||||
Discover Financial Services, 4.10%, 02/09/2027 | 1,348,000 | 1,295,923 | ||||
Fifth Third Bancorp, 4.77% to 07/28/2029 then SOFR + 2.13%, 07/28/2030 | 1,188,000 | 1,143,374 | ||||
Fiserv, Inc., 3.20%, 07/01/2026 | 920,000 | 882,782 | ||||
Goldman Sachs Group, Inc., 4.48% to 08/23/2027 then SOFR + 1.73%, 08/23/2028 | 1,243,000 | 1,214,644 | ||||
Huntington Bancshares, Inc./OH, 6.21% to 08/21/2028 then SOFR + 2.02%, 08/21/2029 | 973,000 | 993,891 | ||||
Par | Value | |||||
Iron Mountain, Inc., 4.50%, 02/15/2031(a) | $575,000 | $519,059 | ||||
JPMorgan Chase & Co., 4.20% to 07/23/2028 then 3 mo. Term SOFR + 1.52%, 07/23/2029 | 1,233,000 | 1,187,102 | ||||
KeyCorp, 4.10%, 04/30/2028 | 1,028,000 | 972,081 | ||||
LPL Holdings, Inc., 4.00%, 03/15/2029(a) | 1,150,000 | 1,072,550 | ||||
Morgan Stanley, 3.77% to 01/24/2028 then 3 mo. Term SOFR + 1.40%, 01/24/2029 | 1,180,000 | 1,123,921 | ||||
PNC Financial Services Group, Inc., 5.35% to 12/02/2027 then SOFR + 1.62%, 12/02/2028 | 1,188,000 | 1,189,103 | ||||
RHP Hotel Properties LP / RHP Finance Corp., 7.25%, 07/15/2028(a) | 625,000 | 646,368 | ||||
SBA Communications Corp., 3.88%, 02/15/2027 | 713,000 | 679,563 | ||||
18,836,993 | ||||||
Health Care - 4.0% | ||||||
Centene Corp., 4.25%, 12/15/2027 | 768,000 | 733,564 | ||||
HCA, Inc., 5.88%, 02/15/2026 | 1,150,000 | 1,151,482 | ||||
UnitedHealth Group, Inc., 5.25%, 02/15/2028 | 523,000 | 530,046 | ||||
2,415,092 | ||||||
Industrials - 6.8% | ||||||
Boeing Co., 6.30%, 05/01/2029(a) | 1,000,000 | 1,014,672 | ||||
Clean Harbors, Inc., 6.38%, 02/01/2031(a) | 625,000 | 626,581 | ||||
Roller Bearing Co. of America, Inc., 4.38%, 10/15/2029(a) | 575,000 | 529,169 | ||||
TransDigm, Inc., 6.88%, 12/15/2030(a) | 750,000 | 765,678 | ||||
United Rentals North America, Inc., 5.50%, 05/15/2027 | 1,150,000 | 1,141,319 | ||||
4,077,419 | ||||||
Materials - 3.3% | ||||||
Ball Corp., 4.88%, 03/15/2026 | 988,000 | 972,286 | ||||
Celanese US Holdings LLC, 6.17%, 07/15/2027 | 963,000 | 977,508 | ||||
1,949,794 | ||||||
Technology - 6.5% | ||||||
Booz Allen Hamilton, Inc., 3.88%, 09/01/2028(a) | 1,053,000 | 991,262 | ||||
CDW LLC / CDW Finance Corp., 4.13%, 05/01/2025 | 935,000 | 919,488 | ||||
Gartner, Inc., 4.50%, 07/01/2028(a) | 953,000 | 918,491 | ||||
Oracle Corp., 6.15%, 11/09/2029 | 998,000 | 1,044,301 | ||||
3,873,542 | ||||||
TOTAL CORPORATE BONDS (Cost $40,080,993) | 40,904,874 | |||||
1 |
Par | Value | |||||
ASSET-BACKED SECURITIES - 12.5% | ||||||
Capital One Financial Corp., Series 2022-A3, Class A, 4.95%, 10/15/2027 | $100,000 | $99,498 | ||||
CarMax Auto Owner Trust, Series 2022-3, Class A4, 4.06%, 02/15/2028 | 500,000 | 488,594 | ||||
Chase Auto Owner Trust, Series 2023-AA, Class A2, 5.90%, 03/25/2027(a) | 363,040 | 363,471 | ||||
CNH Equipment Trust | ||||||
Series 2021-C, Class B, 1.41%, 04/16/2029 | 735,000 | 688,197 | ||||
Series 2023-A, Class A3, 4.81%, 08/15/2028 | 300,000 | 297,530 | ||||
Enterprise Fleet Financing | ||||||
Series 2022-1, Class A2, 3.03%, 01/20/2028(a) | 235,428 | 233,064 | ||||
Series 2022-4, Class A2, 5.76%, 10/22/2029(a) | 167,125 | 167,245 | ||||
Series 2023-1, Class A2, 5.51%, 01/22/2029(a) | 148,313 | 148,051 | ||||
GM Financial Consumer Automobile Receivables Trust | ||||||
Series 2020-3, Class A4, 0.58%, 01/16/2026 | 282,542 | 281,823 | ||||
Series 2020-3, Class C, 1.37%, 01/16/2026 | 145,000 | 144,676 | ||||
Series 2021-4, Class B, 1.25%, 10/18/2027 | 975,000 | 916,673 | ||||
Hertz Global Holdings, Inc., Series 2021-1A, Class A, 1.21%, 12/26/2025(a) | 1,000,000 | 986,752 | ||||
Hertz Vehicle Financing LLC, Series 2022-1A, Class A, 1.99%, 06/25/2026(a) | 150,000 | 145,712 | ||||
Honda Auto Receivables Owner Trust, Series 2021-3, Class A3, 0.41%, 11/18/2025 | 185,734 | 182,974 | ||||
JPMorgan Chase Bank NA, Series 2021-2, Class B, 0.89%, 12/26/2028(a) | 30,798 | 30,455 | ||||
LAD Auto Receivables Trust, Series 2022-1A, Class A, 5.21%, 06/15/2027(a) | 351,560 | 350,395 | ||||
PHH Arval | ||||||
Series 2023-1A, Class A1, 5.65%, 05/15/2035(a) | 142,215 | 142,157 | ||||
Series 2023-2A, Class A1, 6.16%, 10/15/2035(a) | 103,353 | 104,057 | ||||
Santander Consumer USA Holdings, Inc., Series 2022-2, Class B, 3.44%, 09/15/2027 | 90,747 | 89,639 | ||||
Santander Consumer USA, Inc., Series 2022-6, Class B, 4.72%, 06/15/2027 | 500,000 | 496,528 | ||||
Par | Value | |||||
Santander Revolving Auto Loan Trust, Series 2019-A, Class C, 3.00%, 01/26/2032(a) | $325,000 | $320,268 | ||||
Towd point HE Trust, Series 2021-HE1, Class A1, 0.92%, 02/25/2063(a)(c) | 80,409 | 77,127 | ||||
Towd Point Mortgage Trust, Series 2024-CES1, Class A1A, 5.85%, 01/25/2064(a)(c) | 697,526 | 695,279 | ||||
TOTAL ASSET-BACKED SECURITIES (Cost $7,417,998) | 7,450,165 | |||||
U.S. TREASURY SECURITIES - 7.6% | ||||||
United States Treasury Note/Bond | ||||||
4.63%, 02/28/2025 | 1,000,000 | 995,908 | ||||
4.25%, 10/15/2025 | 925,000 | 916,292 | ||||
4.63%, 03/15/2026 | 715,000 | 712,514 | ||||
4.13%, 06/15/2026 | 450,000 | 444,850 | ||||
4.13%, 09/30/2027 | 500,000 | 494,492 | ||||
4.63%, 09/30/2028 | 1,000,000 | 1,008,985 | ||||
TOTAL U.S. TREASURY SECURITIES (Cost $4,567,254) | 4,573,041 | |||||
COLLATERALIZED MORTGAGE OBLIGATIONS - 7.1% | ||||||
Commercial Mortgage Pass Through Certificates | ||||||
Series 2015-CR26, Class A4, 3.63%, 10/10/2048 | 290,000 | 281,190 | ||||
Series 2015-DC1, Class A5, 3.35%, 02/10/2048 | 100,000 | 98,491 | ||||
Federal Home Loan Mortgage Corp. | ||||||
Series 3187, Class Z, 5.00%, 07/15/2036 | 77,491 | 77,669 | ||||
Series 4037, Class B, 3.00%, 04/15/2027 | 103,645 | 100,937 | ||||
Series 4838, Class VA, 4.00%, 03/15/2036 | 280,675 | 275,871 | ||||
Series K066, Class A2, 3.12%, 06/25/2027 | 800,000 | 761,202 | ||||
Series KJ17, Class A2, 2.98%, 11/25/2025 | 228,408 | 224,680 | ||||
Federal National Mortgage Association | ||||||
Series 2005-79, Class LT, 5.50%, 09/25/2035 | 164,793 | 168,003 | ||||
Series 2011-31, Class DB, 3.50%, 04/25/2031 | 140,491 | 135,306 | ||||
Series 2011-36, Class QB, 4.00%, 05/25/2031 | 221,068 | 216,035 | ||||
Series 2020-44, Class TI, 5.50%, 12/25/2035(d) | 576,721 | 86,508 | ||||
Series 2023-29, Class JA, 5.50%, 05/25/2036 | 623,133 | 620,741 | ||||
2 |
Par | Value | |||||
COLLATERALIZED MORTGAGE OBLIGATIONS - (Continued) | ||||||
FREMF Mortgage Trust | ||||||
Series 2014-K41, Class B, 3.96%, 11/25/2047(a)(c) | $250,000 | $247,615 | ||||
Series 2015-K44, Class B, 3.84%, 01/25/2048(a)(c) | 460,000 | 453,216 | ||||
JP Morgan Mortgage Trust, Series 2024-5, Class A4, 6.00%, 11/25/2054(a)(c) | 500,000 | 498,854 | ||||
TOTAL COLLATERALIZED MORTGAGE OBLIGATIONS (Cost $4,219,374) | 4,246,318 | |||||
MORTGAGE-BACKED SECURITIES - 1.5% | ||||||
Federal Home Loan Mortgage Corp., Pool SD8276, 5.00%, 12/01/2052 | 453,173 | 439,361 | ||||
Federal National Mortgage Association | ||||||
Pool 254904, 5.50%, 10/01/2033 | 60,108 | 60,399 | ||||
Pool 555880, 5.50%, 11/01/2033 | 101,744 | 102,236 | ||||
Pool 890696, 3.00%, 09/01/2030 | 44,413 | 42,354 | ||||
Pool MA0919, 3.50%, 12/01/2031 | 161,118 | 154,282 | ||||
Pool MA2177, 4.00%, 02/01/2035 | 89,717 | 86,604 | ||||
TOTAL MORTGAGE-BACKED SECURITIES (Cost $884,329) | 885,236 | |||||
U.S. GOVERNMENT AGENCY ISSUES - 1.3% | ||||||
Federal Home Loan Banks, 6.05%, 11/21/2031 | 250,000 | 249,556 | ||||
United States of America, 5.48%, 10/02/2028 | 500,000 | 499,700 | ||||
TOTAL U.S. GOVERNMENT AGENCY ISSUES (Cost $750,000) | 749,256 | |||||
TOTAL INVESTMENTS - 98.4% (Cost $57,919,948) | $58,808,890 | |||||
Money Market Deposit Account - 0.5%(e) | 317,994 | |||||
Other Assets in Excess of Liabilities - 1.1% | 671,044 | |||||
TOTAL NET ASSETS - 100.0% | $59,797,928 | |||||
(a) | Security is exempt from registration pursuant to Rule 144A under the Securities Act of 1933, as amended. These securities may only be resold in transactions exempt from registration to qualified institutional investors. As of June 30, 2024, the value of these securities total $14,157,935 or 23.7% of the Fund’s net assets. |
(b) | To the extent that the Fund invests more heavily in a particular industry or sector of the economy, its performance will be especially sensitive to developments that significantly affect those industries or sectors. |
(c) | Coupon rate is variable based on the weighted average coupon of the underlying collateral. To the extent the weighted average coupon of the underlying assets which comprise the collateral increases or decreases, the coupon rate of this security will increase or decrease correspondingly. The rate disclosed is as of June 30, 2024. |
(d) | Interest only security. |
(e) | The U.S. Bank Money Market Deposit Account (the “MMDA”) is a short-term vehicle in which the Fund holds cash balances. The MMDA will bear interest at a variable rate that is determined based on market conditions and is subject to change daily. The rate as of June 30, 2024 was 5.24%. |
3 |
Par | Value | |||||
MORTGAGE-BACKED SECURITIES - 32.8% | ||||||
Federal Home Loan Mortgage Corp. | ||||||
Pool G06168, 3.50%, 11/01/2040 | $136,254 | $125,661 | ||||
Pool G08653, 3.00%, 07/01/2045 | 222,690 | 195,825 | ||||
Pool G60722, 3.00%, 10/01/2046 | 281,682 | 247,029 | ||||
Pool Q04092, 4.00%, 10/01/2041 | 181,574 | 171,853 | ||||
Pool Q35614, 3.50%, 08/01/2045 | 289,511 | 263,222 | ||||
Pool Q52955, 3.50%, 12/01/2047 | 124,550 | 112,861 | ||||
Pool QA1033, 3.00%, 07/01/2049 | 215,187 | 185,905 | ||||
Pool RA7380, 3.50%, 05/01/2052 | 434,447 | 387,192 | ||||
Pool RA8278, 5.00%, 12/01/2052 | 226,629 | 219,802 | ||||
Pool RB5105, 2.00%, 03/01/2041 | 108,219 | 91,661 | ||||
Pool SB0546, 2.00%, 01/01/2036 | 394,123 | 349,734 | ||||
Pool SC0151, 2.50%, 06/01/2041 | 366,285 | 319,348 | ||||
Pool SD0960, 3.50%, 04/01/2052 | 542,903 | 486,794 | ||||
Pool SD1859, 5.50%, 11/01/2052 | 133,311 | 132,138 | ||||
Pool SD1921, 4.50%, 12/01/2052 | 359,936 | 342,580 | ||||
Pool SD2172, 5.50%, 02/01/2053 | 369,320 | 367,754 | ||||
Pool SD2875, 5.00%, 05/01/2053 | 857,651 | 840,608 | ||||
Pool SD3174, 5.50%, 06/01/2053 | 471,694 | 468,141 | ||||
Pool SD3739, 6.00%, 09/01/2053 | 537,867 | 544,193 | ||||
Pool SD4901, 5.50%, 02/01/2054 | 296,668 | 293,544 | ||||
Pool SD7552, 2.50%, 01/01/2052 | 667,837 | 556,429 | ||||
Pool SD7556, 3.00%, 08/01/2052 | 499,597 | 431,156 | ||||
Pool SD8214, 3.50%, 05/01/2052 | 87,941 | 78,036 | ||||
Pool SD8266, 4.50%, 11/01/2052 | 273,747 | 258,656 | ||||
Pool SD8267, 5.00%, 11/01/2052 | 179,000 | 173,590 | ||||
Pool SD8268, 5.50%, 11/01/2052 | 108,933 | 107,959 | ||||
Pool SD8276, 5.00%, 12/01/2052 | 453,173 | 439,361 | ||||
Pool SD8299, 5.00%, 02/01/2053 | 231,774 | 224,618 | ||||
Pool SD8363, 6.00%, 09/01/2053 | 741,802 | 744,811 | ||||
Pool V80025, 3.00%, 04/01/2043 | 114,050 | 100,917 | ||||
Pool V80026, 3.00%, 04/01/2043 | 270,214 | 239,096 | ||||
Pool ZS8641, 2.50%, 02/01/2032 | 114,917 | 107,131 | ||||
Federal National Mortgage Association | ||||||
Pool 890696, 3.00%, 09/01/2030 | 122,991 | 117,286 | ||||
Pool AB2080, 4.00%, 01/01/2041 | 164,981 | 155,951 | ||||
Pool AB8818, 3.00%, 03/01/2043 | 90,065 | 79,588 | ||||
Pool AJ4046, 4.00%, 10/01/2041 | 171,957 | 163,389 | ||||
Pool AL3072, 3.00%, 02/01/2043 | 377,359 | 333,705 | ||||
Pool AL8924, 3.00%, 12/01/2030 | 147,916 | 142,102 | ||||
Pool AO4134, 3.50%, 06/01/2042 | 231,138 | 212,122 | ||||
Pool AP2133, 3.50%, 08/01/2042 | 212,030 | 194,301 | ||||
Pool AP7363, 4.00%, 10/01/2042 | 245,292 | 231,071 | ||||
Pool BV4133, 2.50%, 03/01/2052 | 348,617 | 286,363 | ||||
Pool CB2548, 2.50%, 01/01/2052 | 106,533 | 87,853 | ||||
Pool CB2601, 2.00%, 01/01/2052 | 128,192 | 102,559 | ||||
Pool CB3105, 2.00%, 03/01/2052 | 654,796 | 522,904 | ||||
Pool CB3115, 3.00%, 03/01/2052 | 613,336 | 529,006 | ||||
Pool CB3845, 3.50%, 06/01/2052 | 442,783 | 394,643 | ||||
Pool CB4383, 4.50%, 08/01/2052 | 452,421 | 429,927 | ||||
Pool FM5530, 4.00%, 11/01/2050 | 390,503 | 362,390 | ||||
Pool FS1704, 4.00%, 05/01/2052 | 251,265 | 232,965 | ||||
Par | Value | |||||
Pool FS2605, 4.50%, 08/01/2052 | $118,555 | $ 112,141 | ||||
Pool FS4049, 2.50%, 09/01/2036 | 413,371 | 376,773 | ||||
Pool FS4138, 2.50%, 04/01/2052 | 409,370 | 339,041 | ||||
Pool FS4296, 3.00%, 01/01/2049 | 445,604 | 393,840 | ||||
Pool FS4996, 4.50%, 07/01/2053 | 416,270 | 394,858 | ||||
Pool FS5575, 5.50%, 09/01/2053 | 141,488 | 140,605 | ||||
Pool FS7759, 5.50%, 05/01/2054 | 248,387 | 245,308 | ||||
Pool MA2177, 4.00%, 02/01/2035 | 176,812 | 170,676 | ||||
Pool MA4571, 2.50%, 03/01/2042 | 536,488 | 460,244 | ||||
Pool MA4806, 5.00%, 11/01/2052 | 557,689 | 541,356 | ||||
Pool MA4841, 5.00%, 12/01/2052 | 180,189 | 174,908 | ||||
Pool MA4842, 5.50%, 12/01/2052 | 243,389 | 240,460 | ||||
Pool MA5013, 4.50%, 05/01/2038 | 103,324 | 101,117 | ||||
TOTAL MORTGAGE-BACKED SECURITIES (Cost $17,845,440) | 17,877,057 | |||||
CORPORATE BONDS - 32.3% | ||||||
Communications - 0.8% | ||||||
AT&T, Inc. | ||||||
4.25%, 03/01/2027 | 150,000 | 146,491 | ||||
2.25%, 02/01/2032 | 90,000 | 73,158 | ||||
Verizon Communications, Inc., 4.33%, 09/21/2028 | 200,000 | 194,573 | ||||
414,222 | ||||||
Consumer Discretionary - 1.6% | ||||||
General Motors Financial Co., Inc., 5.85%, 04/06/2030 | 130,000 | 131,668 | ||||
Hilton Domestic Operating Co., Inc., 5.38%, 05/01/2025(a) | 260,000 | 259,177 | ||||
Lowe’s Cos., Inc., 4.25%, 04/01/2052 | 150,000 | 118,539 | ||||
Royal Caribbean Cruises Ltd., 7.50%, 10/15/2027 | 100,000 | 105,084 | ||||
Tractor Supply Co., 5.25%, 05/15/2033 | 225,000 | 223,418 | ||||
837,886 | ||||||
Consumer Staples - 0.9% | ||||||
J M Smucker Co. | ||||||
5.90%, 11/15/2028 | 100,000 | 103,049 | ||||
6.20%, 11/15/2033 | 200,000 | 210,314 | ||||
Performance Food Group, Inc., 5.50%, 10/15/2027(a) | 190,000 | 185,833 | ||||
499,196 | ||||||
Energy - 4.3% | ||||||
Diamondback Energy, Inc., 5.40%, 04/18/2034 | 150,000 | 148,690 | ||||
Energy Transfer LP | ||||||
5.25%, 04/15/2029 | 200,000 | 199,268 | ||||
6.55%, 12/01/2033 | 275,000 | 291,412 | ||||
5.60%, 09/01/2034 | 60,000 | 59,618 | ||||
Enterprise Products Operating LLC, 5.35%, 01/31/2033 | 130,000 | 131,300 | ||||
Exxon Mobil Corp., 4.11%, 03/01/2046 | 275,000 | 227,819 | ||||
4 |
Par | Value | |||||
CORPORATE BONDS - (Continued) | ||||||
Energy - (Continued) | ||||||
Kinder Morgan, Inc., 5.55%, 06/01/2045 | $200,000 | $187,297 | ||||
Marathon Petroleum Corp., 4.70%, 05/01/2025 | 300,000 | 297,517 | ||||
MPLX LP, 4.80%, 02/15/2029 | 100,000 | 98,076 | ||||
Murphy Oil USA, Inc., 5.63%, 05/01/2027 | 200,000 | 197,673 | ||||
ONEOK, Inc., 5.80%, 11/01/2030 | 100,000 | 102,425 | ||||
Phillips 66 Co., 4.95%, 12/01/2027 | 100,000 | 99,737 | ||||
Schlumberger Holdings Corp., 3.90%, 05/17/2028(a) | 150,000 | 143,295 | ||||
Valero Energy Corp., 4.00%, 06/01/2052 | 200,000 | 147,345 | ||||
2,331,472 | ||||||
Financials - 13.9% | ||||||
AerCap Ireland Capital DAC / AerCap Global Aviation Trust, 4.63%, 10/15/2027 | 650,000 | 633,430 | ||||
Air Lease Corp., 1.88%, 08/15/2026 | 90,000 | 83,465 | ||||
Alexandria Real Estate Equities, Inc., 4.75%, 04/15/2035 | 150,000 | 139,928 | ||||
Ally Financial, Inc., 6.85% to 01/03/2029 then SOFR + 2.82%, 01/03/2030 | 250,000 | 257,162 | ||||
American Express Co. | ||||||
4.05%, 05/03/2029 | 20,000 | 19,313 | ||||
5.28% to 07/27/2028 then SOFR + 1.28%, 07/27/2029 | 350,000 | 350,871 | ||||
Bank of America Corp. | ||||||
1.66% to 03/11/2026 then SOFR + 0.91%, 03/11/2027 | 90,000 | 84,352 | ||||
4.95% to 07/22/2027 then SOFR + 2.04%, 07/22/2028 | 175,000 | 173,624 | ||||
5.02% to 07/22/2032 then SOFR + 2.16%, 07/22/2033 | 130,000 | 127,548 | ||||
Bank of New York Mellon Corp., 4.60% to 07/26/2029 then SOFR + 1.76%, 07/26/2030 | 275,000 | 268,913 | ||||
Berkshire Hathaway Finance Corp., 3.85%, 03/15/2052 | 30,000 | 23,312 | ||||
BlackRock, Inc., 4.75%, 05/25/2033 | 200,000 | 196,481 | ||||
Capital One Financial Corp. | ||||||
5.47% to 02/01/2028 then SOFR + 2.08%, 02/01/2029 | 125,000 | 124,481 | ||||
6.31% to 06/08/2028 then SOFR + 2.64%, 06/08/2029 | 170,000 | 174,022 | ||||
Citigroup, Inc., 4.91% to 05/24/2032 then SOFR + 2.09%, 05/24/2033 | 130,000 | 125,056 | ||||
Discover Financial Services, 6.70%, 11/29/2032 | 200,000 | 209,058 | ||||
Fifth Third Bancorp | ||||||
4.77% to 07/28/2029 then SOFR + 2.13%, 07/28/2030 | 175,000 | 168,426 | ||||
Par | Value | |||||
4.34% to 04/25/2032 then SOFR + 1.66%, 04/25/2033 | $120,000 | $109,529 | ||||
Fiserv, Inc., 3.50%, 07/01/2029 | 100,000 | 92,523 | ||||
Goldman Sachs Group, Inc., 4.48% to 08/23/2027 then SOFR + 1.73%, 08/23/2028 | 275,000 | 268,726 | ||||
Huntington Bancshares, Inc./OH | ||||||
4.44% to 08/04/2027 then SOFR + 1.97%, 08/04/2028 | 15,000 | 14,533 | ||||
6.21% to 08/21/2028 then SOFR + 2.02%, 08/21/2029 | 200,000 | 204,294 | ||||
Intercontinental Exchange, Inc., 4.60%, 03/15/2033 | 90,000 | 86,059 | ||||
Iron Mountain, Inc., 4.50%, 02/15/2031(a) | 150,000 | 135,407 | ||||
Jefferies Financial Group, Inc., 6.20%, 04/14/2034 | 200,000 | 202,656 | ||||
JPMorgan Chase & Co., 4.91% to 07/25/2032 then SOFR + 2.08%, 07/25/2033 | 300,000 | 291,860 | ||||
KeyCorp, 4.10%, 04/30/2028 | 100,000 | 94,560 | ||||
LPL Holdings, Inc., 4.00%, 03/15/2029(a) | 275,000 | 256,479 | ||||
Morgan Stanley | ||||||
5.45% to 07/20/2028 then SOFR + 1.63%, 07/20/2029 | 250,000 | 251,653 | ||||
1.93% to 04/28/2031 then SOFR + 1.02%, 04/28/2032 | 90,000 | 72,435 | ||||
PNC Financial Services Group, Inc. | ||||||
5.35% to 12/02/2027 then SOFR + 1.62%, 12/02/2028 | 250,000 | 250,232 | ||||
6.88% to 10/20/2033 then SOFR + 2.28%, 10/20/2034 | 200,000 | 218,287 | ||||
Public Storage Operating Co., 5.13%, 01/15/2029 | 175,000 | 176,583 | ||||
Regions Financial Corp., 1.80%, 08/12/2028 | 200,000 | 172,833 | ||||
State Street Corp., 5.82% to 11/04/2027 then SOFR + 1.72%, 11/04/2028 | 125,000 | 127,560 | ||||
Synchrony Financial, 3.70%, 08/04/2026 | 275,000 | 262,410 | ||||
Truist Financial Corp. | ||||||
4.12% to 06/06/2027 then SOFR + 1.37%, 06/06/2028 | 125,000 | 120,549 | ||||
5.87% to 06/08/2033 then SOFR + 2.36%, 06/08/2034 | 80,000 | 80,757 | ||||
US Bancorp | ||||||
4.55% to 07/22/2027 then SOFR + 1.66%, 07/22/2028 | 200,000 | 195,532 | ||||
4.84% to 02/01/2033 then SOFR + 1.60%, 02/01/2034 | 190,000 | 180,461 | ||||
Wells Fargo & Co. | ||||||
5.57% to 07/25/2028 then SOFR + 1.74%, 07/25/2029 | 175,000 | 176,679 | ||||
4.90% to 07/25/2032 then SOFR + 2.10%, 07/25/2033 | 20,000 | 19,273 | ||||
5 |
Par | Value | |||||
CORPORATE BONDS - (Continued) | ||||||
Financials - (Continued) | ||||||
5.39% to 04/24/2033 then SOFR + 2.02%, 04/24/2034 | $150,000 | $148,573 | ||||
Weyerhaeuser Co., 3.38%, 03/09/2033 | 250,000 | 214,574 | ||||
7,584,459 | ||||||
Health Care - 3.6% | ||||||
AbbVie, Inc. | ||||||
3.20%, 11/21/2029 | 240,000 | 220,465 | ||||
5.40%, 03/15/2054 | 325,000 | 323,201 | ||||
Amgen, Inc., 5.65%, 03/02/2053 | 250,000 | 247,545 | ||||
Centene Corp., 2.45%, 07/15/2028 | 150,000 | 133,164 | ||||
CVS Health Corp., 5.13%, 07/20/2045 | 140,000 | 123,769 | ||||
GE HealthCare Technologies, Inc., 6.38%, 11/22/2052 | 485,000 | 529,053 | ||||
Pfizer Investment Enterprises Pte Ltd., 5.30%, 05/19/2053 | 250,000 | 242,476 | ||||
UnitedHealth Group, Inc., 4.20%, 05/15/2032 | 125,000 | 117,839 | ||||
Zoetis, Inc., 3.00%, 05/15/2050 | 50,000 | 32,779 | ||||
1,970,291 | ||||||
Industrials - 2.1% | ||||||
BAE Systems PLC, 5.30%, 03/26/2034(a) | 200,000 | 198,572 | ||||
Boeing Co., 6.86%, 05/01/2054(a) | 250,000 | 257,741 | ||||
Nordson Corp., 5.80%, 09/15/2033 | 100,000 | 102,803 | ||||
Norfolk Southern Corp., 5.95%, 03/15/2064 | 250,000 | 255,982 | ||||
Textron, Inc., 2.45%, 03/15/2031 | 100,000 | 83,923 | ||||
United Rentals North America, Inc., 5.50%, 05/15/2027 | 260,000 | 258,037 | ||||
1,157,058 | ||||||
Materials - 0.9% | ||||||
Ball Corp., 4.88%, 03/15/2026 | 190,000 | 186,978 | ||||
Packaging Corp. of America, 4.05%, 12/15/2049 | 100,000 | 78,957 | ||||
Vulcan Materials Co., 3.50%, 06/01/2030 | 110,000 | 100,465 | ||||
WRKCo, Inc., 3.90%, 06/01/2028 | 150,000 | 142,793 | ||||
509,193 | ||||||
Technology - 2.6% | ||||||
Booz Allen Hamilton, Inc., 3.88%, 09/01/2028(a) | 250,000 | 235,343 | ||||
Cisco Systems, Inc., 5.05%, 02/26/2034 | 250,000 | 250,339 | ||||
Dell International LLC / EMC Corp., 3.45%, 12/15/2051 | 200,000 | 136,208 | ||||
Gartner, Inc., 4.50%, 07/01/2028(a) | 180,000 | 173,482 | ||||
Intel Corp., 3.73%, 12/08/2047 | 240,000 | 177,190 | ||||
Intuit, Inc., 5.20%, 09/15/2033 | 250,000 | 251,491 | ||||
Oracle Corp. | ||||||
6.15%, 11/09/2029 | 150,000 | 156,959 | ||||
3.95%, 03/25/2051 | 55,000 | 40,898 | ||||
1,421,910 | ||||||
Par | Value | |||||
Utilities - 1.6% | ||||||
AES Corp., 1.38%, 01/15/2026 | $300,000 | $281,104 | ||||
Duke Energy Corp., 4.30%, 03/15/2028 | 180,000 | 174,711 | ||||
Florida Power & Light Co., 2.88%, 12/04/2051 | 300,000 | 191,772 | ||||
National Rural Utilities Cooperative Finance Corp., 4.80%, 03/15/2028 | 100,000 | 99,241 | ||||
PECO Energy Co., 3.05%, 03/15/2051 | 200,000 | 130,746 | ||||
877,574 | ||||||
TOTAL CORPORATE BONDS (Cost $17,282,251) | 17,603,261 | |||||
U.S. TREASURY SECURITIES - 23.2% | ||||||
United States Treasury Note/Bond | ||||||
4.50%, 07/15/2026 | 1,700,000 | 1,692,762 | ||||
4.00%, 06/30/2028 | 1,750,000 | 1,724,160 | ||||
4.38%, 08/31/2028 | 525,000 | 524,631 | ||||
4.88%, 10/31/2028 | 1,850,000 | 1,885,410 | ||||
4.00%, 07/31/2030 | 2,000,000 | 1,963,906 | ||||
3.50%, 02/15/2033 | 2,300,000 | 2,159,574 | ||||
4.38%, 05/15/2034 | 250,000 | 250,625 | ||||
3.88%, 05/15/2043 | 900,000 | 815,520 | ||||
4.13%, 08/15/2053 | 1,750,000 | 1,639,805 | ||||
TOTAL U.S. TREASURY SECURITIES (Cost $12,762,806) | 12,656,393 | |||||
ASSET-BACKED SECURITIES - 5.3% | ||||||
CarMax Auto Owner Trust, Series 2022-3, Class A4, 4.06%, 02/15/2028 | 130,000 | 127,034 | ||||
Chase Auto Owner Trust, Series 2023-AA, Class A2, 5.90%, 03/25/2027(a) | 726,080 | 726,942 | ||||
CNH Equipment Trust, Series 2023-A, Class A3, 4.81%, 08/15/2028 | 200,000 | 198,354 | ||||
Dell Equipment Finance Trust, Series 2023-2, Class A2, 5.84%, 01/22/2029(a) | 133,392 | 133,439 | ||||
Enterprise Fleet Financing | ||||||
Series 2022-4, Class A2, 5.76%, 10/22/2029(a) | 33,425 | 33,449 | ||||
Series 2023-1, Class A2, 5.51%, 01/22/2029(a) | 37,078 | 37,013 | ||||
GM Financial Consumer Automobile Receivables Trust, Series 2020-3, Class A4, 0.58%, 01/16/2026 | 241,489 | 240,874 | ||||
Honda Auto Receivables Owner Trust, Series 2021-3, Class A3, 0.41%, 11/18/2025 | 371,468 | 365,947 | ||||
LAD Auto Receivables Trust, Series 2023-2A, Class A2, 5.93%, 06/15/2027(a) | 72,428 | 72,497 | ||||
6 |
Par | Value | |||||
ASSET-BACKED SECURITIES - (Continued) | ||||||
Nissan Auto Receivables Owner Trust, Series 2022-B, Class A4, 4.45%, 11/15/2029 | $50,000 | $ 49,309 | ||||
PHH Arval | ||||||
Series 2023-1A, Class A1, 5.65%, 05/15/2035(a) | 142,215 | 142,157 | ||||
Series 2023-2A, Class A1, 6.16%, 10/15/2035(a) | 248,047 | 249,735 | ||||
Santander Revolving Auto Loan Trust, Series 2019-A, Class C, 3.00%, 01/26/2032(a) | 25,000 | 24,636 | ||||
Towd Point Mortgage Trust, Series 2024-CES1, Class A1A, 5.85%, 01/25/2064(a)(b) | 465,018 | 463,519 | ||||
TOTAL ASSET-BACKED SECURITIES (Cost $2,859,098) | 2,864,905 | |||||
COLLATERALIZED MORTGAGE OBLIGATIONS - 3.5% | ||||||
Fannie Mae Connecticut Avenue Securities, Series 2022-R01, Class 1M1, 6.34% (30 day avg SOFR US + 1.00%), 12/25/2041(a) | 195,474 | 195,687 | ||||
Federal Home Loan Mortgage Corp., Series K066, Class A2, 3.12%, 06/25/2027 | 100,000 | 95,150 | ||||
Federal National Mortgage Association | ||||||
Series 2017-M15, Class ATS2, 3.20%, 11/25/2027(b) | 211,848 | 202,048 | ||||
Series 2020-44, Class TI, 5.50%, 12/25/2035(c) | 576,721 | 86,508 | ||||
Series 2022-M1, Class A2, 1.72%, 10/25/2031(b) | 530,000 | 426,896 | ||||
Flagstar Mortgage Trust, Series 2021-9INV, Class A1, 2.50%, 09/25/2041(a)(b) | 212,530 | 184,783 | ||||
Freddie Mac Structured Agency Credit Risk Debt Notes, Series 2021-DNA3, Class M1, 6.09% (30 day avg SOFR US + 0.75%), 10/25/2033(a) | 16,106 | 16,101 | ||||
FREMF Mortgage Trust | ||||||
Series 2015-K44, Class B, 3.84%, 01/25/2048(a)(b) | 80,000 | 78,820 | ||||
Series 2020-K106, Class B, 3.68%, 03/25/2053(a)(b) | 100,000 | 90,572 | ||||
Par | Value | |||||
JP Morgan Mortgage Trust | ||||||
Series 2021-6, Class A4, 2.50%, 10/25/2051(a)(b) | $102,919 | $88,914 | ||||
Series 2024-5, Class A4, 6.00%, 11/25/2054(a)(b) | 250,000 | 249,427 | ||||
Sequoia Mortgage Trust, Series 2013-7, Class A2, 3.00%, 06/25/2043(b) | 241,589 | 209,345 | ||||
TOTAL COLLATERALIZED MORTGAGE OBLIGATIONS (Cost $1,903,009) | 1,924,251 | |||||
TOTAL INVESTMENTS - 97.1% (Cost $52,652,604) | $52,925,867 | |||||
Money Market Deposit Account - 2.0% (d) | 1,077,670 | |||||
Other Assets in Excess of Liabilities - 0.9% | 476,190 | |||||
TOTAL NET ASSETS - 100.0% | $54,479,727 | |||||
(a) | Security is exempt from registration pursuant to Rule 144A under the Securities Act of 1933, as amended. These securities may only be resold in transactions exempt from registration to qualified institutional investors. As of June 30, 2024, the value of these securities total $4,633,020 or 8.5% of the Fund’s net assets. |
(b) | Coupon rate is variable based on the weighted average coupon of the underlying collateral. To the extent the weighted average coupon of the underlying assets which comprise the collateral increases or decreases, the coupon rate of this security will increase or decrease correspondingly. The rate disclosed is as of June 30, 2024. |
(c) | Interest only security. |
(d) | The U.S. Bank Money Market Deposit Account (the “MMDA”) is a short-term vehicle in which the Fund holds cash balances. The MMDA will bear interest at a variable rate that is determined based on market conditions and is subject to change daily. The rate as of June 30, 2024 was 5.24%. |
7 |
Share | Value | |||||
COMMON STOCKS - 97.5% | ||||||
Communications - 7.2% | ||||||
Alphabet, Inc. - Class C(a) | 8,500 | $1,559,070 | ||||
Comcast Corp. - Class A | 44,800 | 1,754,368 | ||||
T-Mobile US, Inc.(a) | 10,200 | 1,797,036 | ||||
5,110,474 | ||||||
Consumer Discretionary - 10.1% | ||||||
Amazon.com, Inc.(a)(b) | 7,000 | 1,352,750 | ||||
Las Vegas Sands Corp. | 52,700 | 2,331,975 | ||||
Lowe's Cos., Inc.(a) | 9,500 | 2,094,370 | ||||
Starbucks Corp.(a) | 18,200 | 1,416,870 | ||||
7,195,965 | ||||||
Consumer Staples - 6.8% | ||||||
Archer-Daniels-Midland Co. | 25,400 | 1,535,430 | ||||
Constellation Brands, Inc. - Class A(a) | 8,300 | 2,135,424 | ||||
PepsiCo, Inc.(a) | 7,200 | 1,187,496 | ||||
4,858,350 | ||||||
Energy - 5.4% | ||||||
APA Corp. | 36,000 | 1,059,840 | ||||
ConocoPhillips(a) | 8,000 | 915,040 | ||||
Matador Resources Co.(a) | 19,000 | 1,132,400 | ||||
Transocean Ltd.(b) | 135,000 | 722,250 | ||||
3,829,530 | ||||||
Financials - 13.2% | ||||||
BlackRock, Inc.(a) | 2,100 | 1,653,372 | ||||
Charles Schwab Corp.(a) | 17,500 | 1,289,575 | ||||
CME Group, Inc.(a) | 11,200 | 2,201,920 | ||||
Morgan Stanley(a) | 12,000 | 1,166,280 | ||||
PayPal Holdings, Inc.(a)(b) | 26,900 | 1,561,007 | ||||
Visa, Inc. - Class A(a) | 5,800 | 1,522,326 | ||||
9,394,480 | ||||||
Health Care - 12.3% | ||||||
Abbott Laboratories | 15,000 | 1,558,650 | ||||
Agilent Technologies, Inc.(a) | 7,500 | 972,225 | ||||
Danaher Corp.(a) | 10,600 | 2,648,410 | ||||
Gilead Sciences, Inc.(a) | 27,500 | 1,886,775 | ||||
Medtronic PLC(a) | 22,000 | 1,731,620 | ||||
8,797,680 | ||||||
Industrials - 8.8% | ||||||
Amphenol Corp.(a) | 22,000 | 1,482,140 | ||||
Fastenal Co. | 10,500 | 659,820 | ||||
Honeywell International, Inc.(a) | 7,000 | 1,494,780 | ||||
Union Pacific Corp.(a) | 5,100 | 1,153,926 | ||||
United Parcel Service, Inc. - Class B(a) | 10,700 | 1,464,295 | ||||
6,254,961 | ||||||
Materials - 3.2% | ||||||
Air Products and Chemicals, Inc.(a) | 5,100 | 1,316,055 | ||||
CF Industries Holdings, Inc.(a) | 13,000 | 963,560 | ||||
2,279,615 | ||||||
Share | Value | |||||
Technology - 27.5%(c) | ||||||
Accenture PLC - Class A(a) | 6,400 | $1,941,824 | ||||
Adobe, Inc.(a)(b) | 4,400 | 2,444,376 | ||||
Ciena Corp.(a)(b) | 32,900 | 1,585,122 | ||||
Cisco Systems, Inc.(a) | 46,600 | 2,213,966 | ||||
Corning, Inc.(a) | 50,200 | 1,950,270 | ||||
International Business Machines Corp.(a) | 10,200 | 1,764,090 | ||||
Microchip Technology, Inc.(a) | 22,200 | 2,031,300 | ||||
Microsoft Corp.(a) | 4,100 | 1,832,495 | ||||
Oracle Corp.(a) | 13,300 | 1,877,960 | ||||
Texas Instruments, Inc.(a) | 10,000 | 1,945,300 | ||||
19,586,703 | ||||||
Utilities - 3.0% | ||||||
AES Corp.(a) | 59,000 | 1,036,630 | ||||
NextEra Energy, Inc.(a) | 15,300 | 1,083,393 | ||||
2,120,023 | ||||||
TOTAL COMMON STOCKS (Cost $73,320,048) | 69,427,781 | |||||
REAL ESTATE INVESTMENT TRUSTS - 2.3% | ||||||
American Tower Corp.(a) | 8,500 | 1,652,230 | ||||
TOTAL REAL ESTATE INVESTMENT TRUSTS (Cost $1,693,926) | 1,652,230 | |||||
TOTAL INVESTMENTS - 99.8% (Cost $75,013,974) | $71,080,011 | |||||
Money Market Deposit Account - 2.4% (d) | 1,729,462 | |||||
Liabilities in Excess of Other Assets - (2.2)% | (1,571,460) | |||||
TOTAL NET ASSETS - 100.0% | $71,238,013 | |||||
(a) | Held in connection with written option contracts. See Schedule of Written Options for further information. |
(b) | Non-income producing security. |
(c) | To the extent that the Fund invests more heavily in a particular industry or sector of the economy, its performance will be especially sensitive to developments that significantly affect those industries or sectors. |
(d) | The U.S. Bank Money Market Deposit Account (the “MMDA”) is a short-term vehicle in which the Fund holds cash balances. The MMDA will bear interest at a variable rate that is determined based on market conditions and is subject to change daily. The rate as of June 30, 2024 was 5.24%. |
8 |
Notional Amount | Contracts | Value | |||||||
WRITTEN OPTIONS - (2.4)%(a)(b) | |||||||||
Call Options - (2.4)% | |||||||||
Abbott Laboratories, Expiration: 09/20/2024; Exercise Price: $110.00 | $ (1,558,650) | (150) | $ (26,700) | ||||||
Accenture PLC, Expiration: 09/20/2024; Exercise Price: $320.00 | (1,941,824) | (64) | (40,320) | ||||||
Adobe, Inc., Expiration: 08/16/2024; Exercise Price: $510.00 | (2,444,376) | (44) | (233,860) | ||||||
AES Corp., Expiration: 08/16/2024; Exercise Price: $20.00 | (1,036,630) | (590) | (11,800) | ||||||
Agilent Technologies, Inc., Expiration: 07/19/2024; Exercise Price: $160.00 | (972,225) | (75) | (750) | ||||||
Air Products and Chemicals, Inc., Expiration: 09/20/2024; Exercise Price: $280.00 | (1,316,055) | (51) | (20,145) | ||||||
Alphabet, Inc., Expiration: 07/19/2024; Exercise Price: $185.00 | (1,559,070) | (85) | (29,750) | ||||||
Amazon.com, Inc., Expiration: 07/19/2024; Exercise Price: $190.00 | (1,352,750) | (70) | (50,750) | ||||||
American Tower Corp., Expiration: 08/16/2024; Exercise Price: $200.00 | (1,652,230) | (85) | (41,225) | ||||||
Amphenol Corp., Expiration: 07/19/2024; Exercise Price: $60.00 | (1,482,140) | (220) | (170,500) | ||||||
BlackRock, Inc., Expiration: 08/16/2024; Exercise Price: $840.00 | (1,653,372) | (21) | (15,435) | ||||||
CF Industries Holdings, Inc., Expiration: 08/16/2024; Exercise Price: $85.00 | (963,560) | (130) | (5,525) | ||||||
Charles Schwab Corp., Expiration: 08/16/2024; Exercise Price: $75.00 | (1,289,575) | (175) | (40,688) | ||||||
Ciena Corp., Expiration: 07/19/2024; Exercise Price: $55.00 | (1,585,122) | (329) | (3,290) | ||||||
Cisco Systems, Inc., Expiration: 07/19/2024; Exercise Price: $52.50 | (2,213,966) | (466) | (1,165) | ||||||
CME Group, Inc., Expiration: 09/20/2024; Exercise Price: $210.00 | (2,201,920) | (112) | (25,760) | ||||||
Comcast Corp., Expiration: 09/20/2024; Exercise Price: $42.50 | (1,754,368) | (448) | (32,032) | ||||||
ConocoPhillips, Expiration: 09/20/2024; Exercise Price: $120.00 | (915,040) | (80) | (20,320) | ||||||
Constellation Brands, Inc., Expiration: 09/20/2024; Exercise Price: $265.00 | (2,135,424) | (83) | (57,270) | ||||||
Corning, Inc., Expiration: 08/16/2024; Exercise Price: $35.00 | (1,950,270) | (502) | (218,370) | ||||||
Danaher Corp., Expiration: 07/19/2024; Exercise Price: $270.00 | (2,648,410) | (106) | (5,300) | ||||||
Gilead Sciences, Inc., Expiration: 09/20/2024; Exercise Price: $75.00 | (1,886,775) | (275) | (24,750) | ||||||
Honeywell International, Inc., Expiration: 08/16/2024; Exercise Price: $220.00 | (1,494,780) | (70) | (20,300) | ||||||
International Business Machines Corp., Expiration: 08/16/2024; Exercise Price: $185.00 | (1,764,090) | (102) | (28,866) | ||||||
Las Vegas Sands Corp., Expiration: 09/20/2024; Exercise Price: $49.00 | (2,331,975) | (527) | (59,024) | ||||||
Lowe's Cos., Inc., Expiration: 09/20/2024; Exercise Price: $230.00 | (2,094,370) | (95) | (55,812) | ||||||
Matador Resources Co., Expiration: 09/20/2024; Exercise Price: $65.00 | (1,132,400) | (190) | (28,025) | ||||||
Medtronic PLC, Expiration: 09/20/2024; Exercise Price: $82.50 | (1,731,620) | (220) | (34,980) | ||||||
Microchip Technology, Inc., Expiration: 07/19/2024; Exercise Price: $105.00 | (2,031,300) | (222) | (2,220) | ||||||
Microsoft Corp., Expiration: 09/20/2024; Exercise Price: $460.00 | (1,832,495) | (41) | (60,475) | ||||||
Morgan Stanley, Expiration: 08/16/2024; Exercise Price: $105.00 | (1,166,280) | (120) | (9,660) | ||||||
NextEra Energy, Inc., Expiration: 08/16/2024; Exercise Price: $75.00 | (1,083,393) | (153) | (18,207) | ||||||
Oracle Corp., Expiration: 08/16/2024; Exercise Price: $135.00 | (1,412,000) | (100) | (84,750) | ||||||
PayPal Holdings, Inc., Expiration: 07/19/2024; Exercise Price: $65.00 | (1,561,007) | (269) | (3,631) | ||||||
PepsiCo, Inc., Expiration: 08/16/2024; Exercise Price: $170.00 | (1,187,496) | (72) | (16,056) | ||||||
Starbucks Corp., Expiration: 08/16/2024; Exercise Price: $85.00 | (1,416,870) | (182) | (26,390) | ||||||
9 |
Notional Amount | Contracts | Value | |||||||
Texas Instruments, Inc. | $0 | 0 | $— | ||||||
Expiration: 07/19/2024; Exercise Price: $210.00 | (1,167,180) | (60) | (2,520) | ||||||
Expiration: 08/16/2024; Exercise Price: $200.00 | (778,120) | (40) | (20,500) | ||||||
T-Mobile US, Inc., Expiration: 08/16/2024; Exercise Price: $170.00 | (1,797,036) | (102) | (97,920) | ||||||
Union Pacific Corp., Expiration: 09/20/2024; Exercise Price: $235.00 | (1,153,926) | (51) | (26,775) | ||||||
United Parcel Service, Inc., Expiration: 08/16/2024; Exercise Price: $145.00 | (1,464,295) | (107) | (24,557) | ||||||
Visa, Inc., Expiration: 09/20/2024; Exercise Price: $280.00 | (1,522,326) | (58) | (21,315) | ||||||
Total Call Options | $ (1,717,688) | ||||||||
TOTAL WRITTEN OPTIONS (Premiums received $1,526,655) | $(1,717,688) | ||||||||
(a) | Exchange-traded. |
(b) | 100 shares per contract. |
10 |
Shares | Value | |||||
COMMON STOCKS - 96.8% | ||||||
Communications - 1.5% | ||||||
Comcast Corp. - Class A | 21,190 | $829,800 | ||||
Consumer Discretionary - 6.6% | ||||||
Home Depot, Inc. | 5,819 | 2,003,133 | ||||
Lowe’s Cos., Inc. | 7,509 | 1,655,434 | ||||
3,658,567 | ||||||
Consumer Staples - 4.8% | ||||||
Colgate-Palmolive Co. | 6,726 | 652,691 | ||||
PepsiCo, Inc. | 7,161 | 1,181,064 | ||||
Procter & Gamble Co. | 5,210 | 859,233 | ||||
2,692,988 | ||||||
Energy - 12.1% | ||||||
Chevron Corp. | 11,844 | 1,852,638 | ||||
ConocoPhillips | 14,102 | 1,612,987 | ||||
EOG Resources, Inc. | 16,875 | 2,124,056 | ||||
Exxon Mobil Corp. | 9,724 | 1,119,427 | ||||
6,709,108 | ||||||
Financials - 22.3% | ||||||
Bank of America Corp. | 53,058 | 2,110,117 | ||||
BlackRock, Inc. | 2,349 | 1,849,415 | ||||
CME Group, Inc. | 9,493 | 1,866,324 | ||||
JPMorgan Chase & Co. | 8,965 | 1,813,261 | ||||
Morgan Stanley | 22,282 | 2,165,587 | ||||
Prudential Financial, Inc. | 15,074 | 1,766,522 | ||||
US Bancorp | 21,347 | 847,476 | ||||
12,418,702 | ||||||
Health Care - 10.0% | ||||||
Abbott Laboratories | 5,441 | 565,374 | ||||
AbbVie, Inc. | 12,867 | 2,206,948 | ||||
Johnson & Johnson | 5,672 | 829,020 | ||||
Medtronic PLC | 24,978 | 1,966,018 | ||||
5,567,360 | ||||||
Industrials - 18.9% | ||||||
Automatic Data Processing, Inc. | 9,206 | 2,197,380 | ||||
Caterpillar, Inc. | 1,885 | 627,894 | ||||
Cummins, Inc. | 3,668 | 1,015,779 | ||||
Fastenal Co. | 33,955 | 2,133,732 | ||||
Honeywell International, Inc. | 8,341 | 1,781,137 | ||||
Paychex, Inc. | 9,367 | 1,110,552 | ||||
Union Pacific Corp. | 7,163 | 1,620,700 | ||||
10,487,174 | ||||||
Shares | Value | |||||
Materials - 3.2% | ||||||
Air Products and Chemicals, Inc. | 3,009 | $776,472 | ||||
Dow, Inc. | 19,173 | 1,017,128 | ||||
1,793,600 | ||||||
Technology - 10.4% | ||||||
Analog Devices, Inc. | 4,108 | 937,692 | ||||
Hewlett Packard Enterprise Co. | 76,747 | 1,624,734 | ||||
International Business Machines Corp. | 5,692 | 984,432 | ||||
Texas Instruments, Inc. | 11,506 | 2,238,262 | ||||
5,785,120 | ||||||
Utilities - 7.0% | ||||||
Dominion Energy, Inc. | 31,269 | 1,532,181 | ||||
NextEra Energy, Inc. | 32,920 | 2,331,065 | ||||
3,863,246 | ||||||
TOTAL COMMON STOCKS (Cost $51,039,098) | 53,805,665 | |||||
REAL ESTATE INVESTMENT TRUSTS - 2.8% | ||||||
American Tower Corp. | 8,210 | 1,595,860 | ||||
TOTAL REAL ESTATE INVESTMENT TRUSTS (Cost $1,672,373) | 1,595,860 | |||||
TOTAL INVESTMENTS - 99.6% (Cost $52,711,471) | $55,401,525 | |||||
Money Market Deposit Account - 0.3%(a) | 143,603 | |||||
Other Assets in Excess of Liabilities - 0.1% | 35,995 | |||||
TOTAL NET ASSETS - 100.0% | $55,581,123 | |||||
(a) | The U.S. Bank Money Market Deposit Account (the “MMDA”) is a short-term vehicle in which the Fund holds cash balances. The MMDA will bear interest at a variable rate that is determined based on market conditions and is subject to change daily. The rate as of June 30, 2024 was 5.24%. |
11 |
Madison Short-Term Strategic Income ETF | Madison Aggregate Bond ETF | Madison Covered Call ETF | Madison Dividend Value ETF | |||||||||
ASSETS: | ||||||||||||
Investments, at value | $58,808,890 | $52,925,867 | $71,080,011 | $55,401,525 | ||||||||
Cash - interest bearing deposit account | 317,994 | 1,077,670 | 1,729,463 | 143,603 | ||||||||
Dividends and interest receivable | 690,678 | 493,460 | 60,476 | 67,996 | ||||||||
Receivable for investments sold | — | — | 109,956 | — | ||||||||
Deposit at broker for option contracts | — | — | 30,218 | — | ||||||||
Total assets | 59,817,562 | 54,496,997 | 73,010,124 | 55,613,124 | ||||||||
LIABILITIES: | ||||||||||||
Written option contracts, at value | — | — | 1,717,688 | — | ||||||||
Payable to adviser | 19,634 | 17,270 | 54,423 | 32,001 | ||||||||
Total liabilities | 19,634 | 17,270 | 1,772,111 | 32,001 | ||||||||
NET ASSETS | $59,797,928 | $54,479,727 | $71,238,013 | $55,581,123 | ||||||||
NET ASSETS CONSISTS OF: | ||||||||||||
Paid-in capital | $58,831,915 | $54,175,938 | $75,444,621 | $55,237,342 | ||||||||
Total distributable earnings/(accumulated losses) | 966,013 | 303,789 | (4,206,608) | 343,781 | ||||||||
Total net assets | $59,797,928 | $54,479,727 | $71,238,013 | $55,581,123 | ||||||||
Net asset | $59,797,928 | $54,479,727 | $71,238,013 | $55,581,123 | ||||||||
Shares issued and outstanding(a) | 2,950,000 | 2,705,000 | 3,775,000 | 2,775,000 | ||||||||
Net asset value per share | $20.27 | $20.14 | $18.87 | $20.03 | ||||||||
Cost: | ||||||||||||
Investments, at cost | $57,919,948 | $52,652,604 | $75,013,974 | $52,711,471 | ||||||||
Proceeds: | ||||||||||||
Written options premium | $— | $— | $1,526,655 | $— | ||||||||
(a) | Unlimited shares authorized without par value. |
12 |
Madison Short-Term Strategic Income ETF | Madison Aggregate Bond ETF | Madison Covered Call ETF | Madison Dividend Value ETF | |||||||||
INVESTMENT INCOME: | ||||||||||||
Dividend income | $— | $— | $1,203,565 | $1,771,092 | ||||||||
Interest income | 2,698,478 | 2,240,258 | 562,520 | 7,035 | ||||||||
Total investment income | 2,698,478 | 2,240,258 | 1,766,085 | 1,778,127 | ||||||||
EXPENSES: | ||||||||||||
Investment advisory fee | 183,162 | 161,267 | 591,492 | 361,104 | ||||||||
Interest expense | — | — | 57,815 | — | ||||||||
Total expenses | 183,162 | 161,267 | 649,307 | 361,104 | ||||||||
Expense reimbursement | — | — | (57,815) | — | ||||||||
Net expenses | 183,162 | 161,267 | 591,492 | 361,104 | ||||||||
NET INVESTMENT INCOME | 2,515,316 | 2,078,991 | 1,174,593 | 1,417,023 | ||||||||
REALIZED AND UNREALIZED GAIN | ||||||||||||
Net realized gain/(loss) from: | ||||||||||||
Investments | 24,089 | (15,082) | 4,137,809 | (2,378,091) | ||||||||
In-kind redemptions | — | 24,974 | — | 1,040,696 | ||||||||
Written option contracts expired or closed | — | — | 3,523,392 | — | ||||||||
Net realized gain/(loss) | 24,089 | 9,892 | 7,661,201 | (1,337,395) | ||||||||
Net change in unrealized appreciation/(depreciation) on: | ||||||||||||
Investments | 888,942 | 273,262 | (3,933,963) | 2,690,054 | ||||||||
Written option contracts | — | — | (191,033) | — | ||||||||
Net change in unrealized appreciation/(depreciation) | 888,942 | 273,262 | (4,124,996) | 2,690,054 | ||||||||
Net realized and unrealized gain | 913,031 | 283,154 | 3,536,205 | 1,352,659 | ||||||||
NET INCREASE IN NET ASSETS RESULTING FROM OPERATIONS | $3,428,347 | $2,362,145 | $4,710,798 | $2,769,682 | ||||||||
13 |
Madison Short- Term Strategic Income ETF | Madison Aggregate Bond ETF | Madison Covered Call ETF | Madison Dividend Value ETF | |||||||||
Period ended June 30, 2024(d) | Period ended June 30, 2024(a) | Period ended June 30, 2024(b) | Period ended June 30, 2024(c) | |||||||||
OPERATIONS: | ||||||||||||
Net investment income | $2,515,316 | $2,078,991 | $1,174,593 | $1,417,023 | ||||||||
Net realized gain/(loss) | 24,089 | 9,892 | 7,661,201 | (1,337,395) | ||||||||
Net change in unrealized appreciation/(depreciation) | 888,942 | 273,262 | (4,124,996) | 2,690,054 | ||||||||
Net increase in net assets from operations | 3,428,347 | 2,362,145 | 4,710,798 | 2,769,682 | ||||||||
DISTRIBUTIONS TO SHAREHOLDERS: | ||||||||||||
Distributions to shareholders | (2,462,334) | (2,035,682) | (8,917,406) | (1,394,996) | ||||||||
Return of capital | — | — | (702,958) | — | ||||||||
Total distributions to shareholders | (2,462,334) | (2,035,682) | (9,620,364) | (1,394,996) | ||||||||
CAPITAL TRANSACTIONS: | ||||||||||||
Subscriptions | 58,822,175 | 57,747,652(e) | 81,696,777 | 68,685,902 | ||||||||
Redemptions | — | (3,609,865) | (5,549,198) | (14,479,465) | ||||||||
ETF transaction fees (See Note 10) | 9,740 | 15,477 | — | — | ||||||||
Net increase in net assets from capital transactions | 58,831,915 | 54,153,264 | 76,147,579 | 54,206,437 | ||||||||
NET INCREASE IN NET ASSETS | 59,797,928 | 54,479,727 | 71,238,013 | 55,581,123 | ||||||||
NET ASSETS: | ||||||||||||
Beginning of the period | — | — | — | — | ||||||||
End of the period | $59,797,928 | $54,479,727 | $71,238,013 | $55,581,123 | ||||||||
SHARES TRANSACTIONS | ||||||||||||
Subscriptions | 2,950,000 | 2,880,000(e) | 4,050,000 | 3,500,000 | ||||||||
Redemptions | — | (175,000) | (275,000) | (725,000) | ||||||||
Total increase in shares outstanding | 2,950,000 | 2,705,000 | 3,775,000 | 2,775,000 | ||||||||
(a) | Inception date of the Fund was August 28, 2023. |
(b) | Inception date of the Fund was August 21, 2023. |
(c) | Inception date of the Fund was August 14, 2023. |
(d) | Inception date of the Fund was September 5, 2023. |
(e) | The Fund was organized with 5,000 shares of beneficial interest on June 27, 2023 for $100,000, which represents the seed investment made by the Investment Advisor. |
14 |
Period ended June 30, 2024(a) | |||
PER SHARE DATA: | |||
Net asset value, beginning of period | $20.00 | ||
INVESTMENT OPERATIONS: | |||
Net investment income(b) | 0.90 | ||
Net realized and unrealized gain on investments | 0.22 | ||
Total from investment operations | 1.12 | ||
LESS DISTRIBUTIONS FROM: | |||
From net investment income | (0.85) | ||
Total distributions | (0.85) | ||
ETF transaction fees per share | 0.00(c) | ||
Net asset value, end of period | $20.27 | ||
Total Return(d) | 5.71% | ||
SUPPLEMENTAL DATA AND RATIOS: | |||
Net assets, end of period (in thousands) | $59,798 | ||
Ratio of expenses to average net assets(e) | 0.40% | ||
Ratio of net investment income to average net assets(e) | 5.49% | ||
Portfolio turnover rate(d)(f) | 17% | ||
(a) | Inception date of the Fund was September 5, 2023. |
(b) | Net investment income per share has been calculated based on average shares outstanding during the period. |
(c) | Amount represents less than $0.005 per share. |
(d) | Not annualized for periods less than one year. |
(e) | Annualized for periods less than one year. |
(f) | Portfolio turnover rate excludes in-kind transactions. |
15 |
Period ended June 30, 2024(a) | |||
PER SHARE DATA: | |||
Net asset value, beginning of period | $20.00 | ||
INVESTMENT OPERATIONS: | |||
Net investment income(b) | 0.87 | ||
Net realized and unrealized gain on investments | 0.06 | ||
Total from investment operations | 0.93 | ||
LESS DISTRIBUTIONS FROM: | |||
From net investment income | (0.80) | ||
Total distributions | (0.80) | ||
ETF transaction fees per share | 0.01 | ||
Net asset value, end of period | $20.14 | ||
Total Return(c) | 4.81% | ||
SUPPLEMENTAL DATA AND RATIOS: | |||
Net assets, end of period (in thousands) | $54,480 | ||
Ratio of expenses to average net assets(d) | 0.40% | ||
Ratio of net investment income to average net assets(d) | 5.16% | ||
Portfolio turnover rate(c)(e) | 19% | ||
(a) | Inception date of the Fund was August 28, 2023. |
(b) | Net investment income per share has been calculated based on average shares outstanding during the period. |
(c) | Not annualized for periods less than one year. |
(d) | Annualized for periods less than one year. |
(e) | Portfolio turnover rate excludes in-kind transactions. |
16 |
Period ended June 30, 2024(a) | |||
PER SHARE DATA: | |||
Net asset value, beginning of period | $20.00 | ||
INVESTMENT OPERATIONS: | |||
Net investment income(b) | 0.31 | ||
Net realized and unrealized gain on investments | 1.05 | ||
Total from investment operations | 1.36 | ||
LESS DISTRIBUTIONS FROM: | |||
From net investment income | (2.31) | ||
Return of capital | (0.18) | ||
Total distributions | (2.49) | ||
Net asset value, end of period | $18.87 | ||
Total Return(c) | 6.81% | ||
SUPPLEMENTAL DATA AND RATIOS: | |||
Net assets, end of period (in thousands) | $71,238 | ||
Ratio of expenses to average net assets: | |||
Before expense reimbursement/recoupment(d) | 0.99% | ||
After expense reimbursement/recoupment(d) | 0.90% | ||
Ratio of interest expense to average next assets(d) | 0.09% | ||
Ratio of net investment income to average net assets(d) | 1.79% | ||
Portfolio turnover rate(c)(e) | 205% | ||
(a) | Inception date of the Fund was August 21, 2023. |
(b) | Net investment income per share has been calculated based on average shares outstanding during the period. |
(c) | Not annualized for periods less than one year. |
(d) | Annualized for periods less than one year. |
(e) | Portfolio turnover rate excludes in-kind transactions. |
17 |
Period ended June 30, 2024(a) | |||
PER SHARE DATA: | |||
Net asset value, beginning of period | $20.00 | ||
INVESTMENT OPERATIONS: | |||
Net investment income(b) | 0.44 | ||
Net realized and unrealized gain on investments | 0.02(c) | ||
Total from investment operations | 0.46 | ||
LESS DISTRIBUTIONS FROM: | |||
From net investment income | (0.43) | ||
Total distributions | (0.43) | ||
Net asset value, end of period | $20.03 | ||
Total Return(d) | 2.35% | ||
SUPPLEMENTAL DATA AND RATIOS: | |||
Net assets, end of period (in thousands) | $55,581 | ||
Ratio of expenses to average net assets(e) | 0.65% | ||
Ratio of net investment income to average net assets(e) | 2.55% | ||
Portfolio turnover rate(d)(f) | 60% | ||
(a) | Inception date of the Fund was August 14, 2023. |
(b) | Net investment income per share has been calculated based on average shares outstanding during the period. |
(c) | Due to timing of capital share transactions, the per share amount of net realized and unrealized gain (loss) on investments varies from the amounts shown in the Statement of Operations. |
(d) | Not annualized for periods less than one year. |
(e) | Annualized for periods less than one year. |
(f) | Portfolio turnover rate excludes in-kind transactions. |
18 |
Fund |
Madison Short-Term Strategic Income ETF (“MSTI”) |
Madison Aggregate Bond ETF (“MAGG”) |
Madison Covered Call ETF (“CVRD”) |
Madison Dividend Value ETF (“DIVL”) |
19 |
20 |
21 |
Description^ | Level 1 | Level 2 | Level 3 | Total | ||||||||
Corporate Bonds | $— | $ 40,904,874 | $— | $40,904,874 | ||||||||
Asset-Backed Securities | — | 7,450,165 | — | 7,450,165 | ||||||||
U.S. Treasury Obligations | — | 4,573,041 | — | 4,573,041 | ||||||||
Collateralized Mortgage Obligations | — | 4,246,318 | — | 4,246,318 | ||||||||
Mortgage-Backed Securities | — | 885,236 | — | 885,236 | ||||||||
U.S. Government Agency Issues | — | 749,256 | — | 749,256 | ||||||||
Total Investments in Securities | $ — | $ 58,808,890 | $ — | $ 58,808,890 | ||||||||
| ^ | See Schedule of Investments for underlying holdings. |
Description^ | Level 1 | Level 2 | Level 3 | Total | ||||||||
Mortgage-Backed Securities | $— | $17,877,057 | $— | $17,877,057 | ||||||||
Corporate Bonds | — | 17,603,261 | — | 17,603,261 | ||||||||
U.S. Treasury Obligations | — | 12,656,393 | — | 12,656,393 | ||||||||
Asset-Backed Securities | — | 2,864,905 | — | 2,864,905 | ||||||||
Collateralized Mortgage Obligations | — | 1,924,251 | — | 1,924,251 | ||||||||
Total Investments in Securities | $ — | $ 52,925,867 | $ — | $ 52,925,867 | ||||||||
| ^ | See Schedule of Investments for underlying holdings. |
Description^ | Level 1 | Level 2 | Level 3 | Total | ||||||||
Assets | ||||||||||||
Common Stocks | $ 69,427,781 | $— | $— | $ 69,427,781 | ||||||||
Real Estate Investment Trusts | 1,652,230 | — | — | 1,652,230 | ||||||||
Total Investments in Securities | $71,080,011 | $— | $— | $71,080,011 | ||||||||
Liabilities | ||||||||||||
Written Option Contracts, at value | $— | $ 1,717,688 | $ — | $1,717,688 | ||||||||
Total Investments in Securities | $— | $1,717,688 | $— | $1,717,688 | ||||||||
| ^ | See Schedule of Investments for underlying holdings. |
Description^ | Level 1 | Level 2 | Level 3 | Total | ||||||||
Common Stocks | $ 53,805,665 | $— | $— | $53,805,665 | ||||||||
Real Estate Investment Trusts | 1,595,860 | — | — | 1,595,860 | ||||||||
Total Investments in Securities | $53,805,665 | $ — | $ — | $ 55,401,525 | ||||||||
| ^ | See Schedule of Investments for underlying holdings. |
22 |
Fund | Instrument | Assets Derivatives as of June 30, 2024 | Liabilities Derivatives as of June 30, 2024 | ||||||||||||
Statements of Assets and Liabilities Location | Fair Value | Statements of Assets and Liabilities Location | Fair Value | ||||||||||||
CVRD | Equity Contracts - Call Options Written | Written Option Contracts, at value | $ — | Written Option Contracts, at value | $(1,717,688) | ||||||||||
Fund | Instrument | Statement of Operations | Realized Gain (Loss) Written Options | Change in Unrealized Appreciation/Depreciation Written Options | ||||||||
CVRD | Equity Contracts – Call Options Written | Written Option Contracts | $3,523,392 | $(191,033) | ||||||||
Fund | Average Contracts(a) | Average Notional Amount | |||||||
CVRD | Equity Contracts - Call Options Written | 6,551 | $1,301,618 | ||||||
| (a) | Number of Contracts |
Fund | Management Fee | ||
MSTI | 0 .40% | ||
MAGG | 0 .40% | ||
CVRD | 0 .90% | ||
DIVL | 0 .65% | ||
23 |
Purchases | Sales | In-Kind Purchases | In-Kind Sales | U.S. Government Purchases | U.S. Government Sales | |||||||||||||
Madison Short-Term Strategic Income ETF | $21,097,345 | $8,719,735 | $44,981,581 | $— | $6,779,715 | $2,219,940 | ||||||||||||
Madison Aggregate Bond ETF | 32,143,759 | 8,104,469 | 31,339,536 | 3,184,048 | 18,325,324 | 5,566,768 | ||||||||||||
Madison Covered Call ETF | 126,734,712 | 132,801,289 | 78,591,402 | — | — | — | ||||||||||||
Madison Dividend Value ETF | 35,587,220 | 35,318,107 | 68,131,491 | 14,346,248 | — | — | ||||||||||||
24 |
Fund | Short-Term | Long-Term | ||||
Madison Short-Term Strategic Income ETF | $— | $ — | ||||
Madison Aggregate Bond ETF | — | — | ||||
Madison Covered Call ETF | — | — | ||||
Madison Dividend Value ETF | 2,364,694 | — | ||||
Fund | Ordinary Income | Return of Capital | ||||
Madison Short-Term Strategic Income ETF | $2,462,334 | $— | ||||
Madison Aggregate Bond ETF | 2,035,682 | — | ||||
Madison Covered Call ETF | 8,917,406 | 702,958 | ||||
Madison Dividend Value ETF | 1,394,996 | — | ||||
Madison Short-Term Strategic Income ETF | Madison Aggregate Bond ETF | Madison Covered Call ETF | Madison Dividend Value ETF | |||||||||
Cost of investments(1) | $57,919,948 | $52,680,794 | $73,568,931 | $52,711,534 | ||||||||
Gross tax unrealized appreciation | 907,238 | 495,340 | 2,036,475 | 3,869,289 | ||||||||
Gross tax unrealized depreciation | (18,296) | (250,267) | (6,243,083) | (1,179,298) | ||||||||
Net tax unrealized appreciation (depreciation) | 888,942 | 245,073 | (4,206,608) | 2,689,991 | ||||||||
Undistributed ordinary income (loss) | 77,071 | 58,717 | — | 22,027 | ||||||||
Undistributed long-term capital gain (loss) | — | — | — | — | ||||||||
Total distributable earnings | 77,071 | 58,717 | — | 22,027 | ||||||||
Other accumulated gain (loss) | — | (1) | — | (2,368,237) | ||||||||
Total distributable earnings/(accumulated losses) | $966,013 | $303,879 | $(4,206,608) | $343,781 | ||||||||
(1) | The difference between book and tax-basis cost of investments was attributable primarily to wash sales. |
Fund | Distributable Earnings/ (Accumulated Losses) | Paid In Capital | ||||
Madison Short-Term Strategic Income ETF | $— | $— | ||||
Madison Aggregate Bond ETF | (22,674) | 22,674 | ||||
Madison Covered Call ETF | — | — | ||||
Madison Dividend Value ETF | (1,030,904) | 1,030,904 | ||||
25 |
26 |
27 |
28 |
MSTI | MAGG | CVRD | DIVL | |||||||||
Call Risk | X | X | ||||||||||
Counterparty Risk | X | |||||||||||
Covered Call Strategy Risk | X | |||||||||||
Covered Put Strategy Risk | X | |||||||||||
Credit Risk | X | X | ||||||||||
Debt Securities Risk | X | X | ||||||||||
Depository Receipt Risk | X | |||||||||||
Derivatives Risk | X | |||||||||||
Equity Risk | X | X | ||||||||||
ETF Risks | X | X | X | |||||||||
Extension Risk | X | X | ||||||||||
Foreign Security and Emerging Market Risk | X | X | ||||||||||
Growth Investing Risk | X | |||||||||||
Income Risk | X | X | ||||||||||
Inflation Risk | X | X | ||||||||||
Interest Rate Risk | X | X | ||||||||||
29 |
MSTI | MAGG | CVRD | DIVL | |||||||||
Market Risk | X | X | X | X | ||||||||
Mid Cap Risk | X | |||||||||||
Mortgage-Backed Securities Risk | X | X | ||||||||||
New Fund Risk | X | X | X | X | ||||||||
Non-Investment Grade Security Risk | X | X | ||||||||||
Options Risk | X | |||||||||||
Prepayment Risk | X | X | ||||||||||
Restricted Securities Risk | X | X | ||||||||||
Risk of Default | X | X | ||||||||||
Valuation Risk | X | X | X | |||||||||
Value Investing Risk | X | X | ||||||||||
Ordinary Income | Per Share Amount | |||||
MSTI | $219,008 | $0.07424 | ||||
MAGG | 189,360 | 0.06575 | ||||
DIVL | 53,891 | 0.01942 | ||||
30 |
Ordinary Income | Per Share Amount | |||||
MSTI | $279,985 | $0.09490 | ||||
MAGG | 256,082 | 0.08740 | ||||
DIVL | 83,005 | 0.03100 | ||||
31 |
Fund Name | Statements of Operations | Statements of Changes in Net Assets | Financial Highlights | ||||||
Madison Short-Term Strategic Income ETF | For the period from September 5, 2023 (commencement of operations) to June 30, 2024 | ||||||||
Madison Aggregate Bond ETF | For the period from August 28, 2023 (commencement of operations) to June 30, 2024 | ||||||||
Madison Covered Call ETF | For the period from August 21, 2023 (commencement of operations) to June 30, 2024 | ||||||||
Madison Dividend Value ETF | For the period from August 14, 2023 (commencement of operations) to June 30, 2024 | ||||||||

32 |
33 |
Madison Short-Term Strategic Income ETF | 0.00% | ||
Madison Aggregate Bond ETF | 0.00% | ||
Madison Covered Call ETF | 12.79% | ||
Madison Dividend Value ETF | 100.00% | ||
Madison Short-Term Strategic Income ETF | 0.00% | ||
Madison Aggregate Bond ETF | 0.00% | ||
Madison Covered Call ETF | 11.93% | ||
Madison Dividend Value ETF | 100.00% | ||
Madison Short-Term Strategic Income ETF | 0.00% | ||
Madison Aggregate Bond ETF | 0.00% | ||
Madison Covered Call ETF | 86.83% | ||
Madison Dividend Value ETF | 0.00% | ||
34 |
| (b) | Financial Highlights are included within the financial statements filed under Item 7(a) of this Form. |
Item 8. Changes in and Disagreements with Accountants for Open-End Investment Companies.
There have been no changes in or disagreements with the Fund’s accountants.
Item 9. Proxy Disclosure for Open-End Investment Companies.
At special meetings of shareholders held on November 30, 2023 for the Madison Covered Call ETF (CVRD) and Madison Dividend Value ETF (DIVL), shareholders of each Fund approved a new investment advisory agreement between the registrant, on behalf of their Fund, and the adviser, Madison Asset Management, LLC. The voting results of CVRD and DIVL are described in the table below:
| Fund | | Outstanding Shares (O/S) Voted | | % O/S | | % Voted |
| Madison Covered Call ETF | ||||||
| For: | | 3,975,829.00 | | 99.395% | | 100.000% |
| Against: | | 0.00 | | 0.000% | | 0.000% |
| Abstain: | | 0.00 | | 0.000% | | 0.000% |
| Madison Dividend Value ETF | ||||||
| For: | | 3,208,946.00 | | 98.737% | | 100.000% |
| Against: | | 0.00 | | 0.000% | | 0.000% |
| Abstain: | | 0.00 | | 0.000% | | 0.000% |
The initial shareholder of Madison Short Term Strategic Income ETF (MSTI) and Madison Aggregate Bond ETF (MAGG) approved a new investment advisory agreement for each Fund via written consent dated August 28, 2023 prior to beginning operations and the fund’s public offering.
Item 10. Remuneration Paid to Directors, Officers, and Others of Open-End Investment Companies.
See Item 7(a).
Item 11. Statement Regarding Basis for Approval of Investment Advisory Contract.
Not applicable.
Item 12. Disclosure of Proxy Voting Policies and Procedures for Closed-End Management Investment Companies.
Not applicable to open-end investment companies.
Item 13. Portfolio Managers of Closed-End Management Investment Companies.
Not applicable to open-end investment companies.
Item 14. Purchases of Equity Securities by Closed-End Management Investment Company and Affiliated Purchasers.
Not applicable to open-end investment companies.
Item 15. Submission of Matters to a Vote of Security Holders.
There have been no material changes to the procedures by which shareholders may recommend nominees to the registrant’s board of trustees.
Item 16. Controls and Procedures.
| (a) | The registrant’s Principal Executive Officer and Principal Financial Officer have reviewed the registrant’s disclosure controls and procedures (as defined in Rule 30a-3(c) under the Investment Company Act of 1940 (the “Act”)) as of a date within 90 days of the filing of this report, as required by Rule 30a-3(b) under the Act and Rules 13a-15(b) or 15d-15(b) under the Securities Exchange Act of 1934. Based on their review, such officers have concluded that the disclosure controls and procedures are effective in ensuring that information required to be disclosed in this report is appropriately recorded, processed, summarized and reported and made known to them by others within the registrant and by the registrant’s service provider. |
| (b) | There were no changes in the registrant’s internal control over financial reporting (as defined in Rule 30a-3(d) under the Act) that occurred during the period covered by this report that have materially affected, or are reasonably likely to materially affect, the registrant’s internal control over financial reporting. |
Item 17. Disclosure of Securities Lending Activities for Closed-End Management Investment Companies
Not applicable to open-end investment companies.
Item 18. Recovery of Erroneously Awarded Compensation.
(a) Not Applicable.
(b) Not Applicable.
Item 19. Exhibits.
| (a) | (1) Code of ethics – See Item 2. |
(2) Not applicable.
(4) Not applicable to open-end investment companies.
(5) Not applicable to open-end investment companies and ETFs.
| (b) | Certifications pursuant to Section 906 of the Sarbanes-Oxley Act of 2002. Furnished herewith. |
SIGNATURES
Pursuant to the requirements of the Securities Exchange Act of 1934 and the Investment Company Act of 1940, the registrant has duly caused this report to be signed on its behalf by the undersigned, thereunto duly authorized.
| (Registrant) | Madison ETFs Trust |
| By: | /s/ Patrick F. Ryan | ||
| Patrick F. Ryan, President/Principal Executive Officer |
| Date | September 6, 2024 |
Pursuant to the requirements of the Securities Exchange Act of 1934 and the Investment Company Act of 1940, this report has been signed below by the following persons on behalf of the registrant and in the capacities and on the dates indicated.
| By: | /s/ Patrick F. Ryan | ||
| Patrick F. Ryan, President/Principal Executive Officer |
| Date | September 6, 2024 |
| By: | /s/ Greg D. Hoppe | ||
| Greg D. Hoppe, Treasurer/Principal Financial Officer |
| Date | September 6, 2024 |