UNITED STATES
SECURITIES AND EXCHANGE COMMISSION
Washington, D.C. 20549
FORM N-CSR
CERTIFIED SHAREHOLDER REPORT OF REGISTERED MANAGEMENT
INVESTMENT COMPANIES
Investment Company Act file number 811-02631
Chestnut Street Exchange Fund
(Exact name of registrant as specified in charter)
103 Bellevue Parkway
Wilmington, DE 19809
(Address of principal executive offices) (Zip code)
Edward J. Roach
Chestnut Street Exchange Fund
103 Bellevue Parkway
Wilmington, DE 19809
(Name and address of agent for service)
Registrant’s telephone number, including area code: (302) 791-1112
Date of fiscal year end: December 31
Date of reporting period: December 31, 2008
Form N-CSR is to be used by management investment companies to file reports with the Commission not later than 10 days after the transmission to stockholders of any report that is required to be transmitted to stockholders under Rule 30e-1 under the Investment Company Act of 1940 (17 CFR 270.30e-1). The Commission may use the information provided on Form N-CSR in its regulatory, disclosure review, inspection, and policymaking roles.
A registrant is required to disclose the information specified by Form N-CSR, and the Commission will make this information public. A registrant is not required to respond to the collection of information contained in Form N-CSR unless the Form displays a currently valid Office of Management and Budget (“OMB”) control number. Please direct comments concerning the accuracy of the information collection burden estimate and any suggestions for reducing the burden to Secretary, Securities and Exchange Commission, 100 F Street, NE, Washington, DC 20549. The OMB has reviewed this collection of information under the clearance requirements of 44 U.S.C. § 3507.
Item 1. Reports to Stockholders.
The Report to Shareholders is attached herewith.
MANAGING GENERAL PARTNERS
Richard C. Caldwell
Gordon L. Keen, Jr.
Edward J. Roach
Langhorne B. Smith
David R. Wilmerding, Jr.
INVESTMENT ADVISERS
BlackRock Capital Management, Inc.
100 Bellevue Parkway
Wilmington, Delaware 19809
TRANSFER AGENT
PNC Global Investment
Servicing (U.S.) Inc.
P.O. Box 8950
Wilmington, Delaware 19899
(800) 852-4750
Annual Report
December 31, 2008
Chestnut Street Exchange
Fund
103 Bellevue Parkway
Wilmington, Delaware 19809
(302) 791-1112
Edward J. Roach, President & Treasurer
CHESTNUT STREET EXCHANGE FUND
(A California Limited Partnership)
David R. Wilmerding, Jr.
Chairman
January 28, 2009
Fellow Partner:
Enclosed is the Annual Report of Chestnut Street Exchange Fund for the year ended December 31, 2008.
Our Fund earned $8.06 per share of net investment income for a share outstanding throughout 2008, compared to $7.62 per share earned in 2007. Total investment income and expenses for 2008 were very close to those same numbers for 2007, resulting in an increase of only $31,554 in net investment income for the year 2008 over 2007. The reduction in outstanding partnership shares of 48,331 is largely responsible for the increase of $0.44 in dividends paid per partnership share in 2008.
After providing for the January 2009 distribution, the net asset value per partnership share at December 31, 2008 was $267.13. The net asset value at September 30, 2008, the date of our last report was $338.01.
Shares added to the portfolio in the fourth quarter were Cisco Systems, Inc., Home Depot, Inc. and Kohl’s Corp. Entirely distributed in redemption of Fund shares was Motorola, along with portions of Moody’s, Johnson & Johnson and Wachovia Corp. holdings.
Additional information required by Securities and Exchange Commission regulations is enclosed.
Data on the equity markets, on certain holdings and on the performance of our Fund since inception, including comparisons to leading stock market indices, appear in the accompanying Investment Adviser’s Report.
Your comments or questions concerning Chestnut Street Exchange Fund are welcomed.
Yours sincerely,

David R. Wilmerding, Jr.
CHESTNUT STREET EXCHANGE FUND
(A California Limited Partnership)
INVESTMENT ADVISER’S REPORT
| | |
| | | |
| U.S. Equity Market Review | | Annual 2008 |
For much of the first half of 2008, U.S. equity markets remained stable as investors believed that mounting credit problems could be contained. That hope began to fade late in the third quarter and into the fourth, after Lehman Brothers declared bankruptcy on September 15, triggering a massive decline in economic activity and stock prices.
There is little positive that can be said about U.S. stocks in 2008. The Dow Jones Industrial Average posted its worst year since 1931 (-31.9%), the S&P 500 had its sharpest decline since 1937 (-37.0%), and the Nasdaq Composite suffered the worst year in its history (-40.5%). From their highs in October 2007, U.S. stocks have lost more than 50%. The bulk of the negative performance for 2008 occurred during the fourth quarter, with U.S. stocks down 21.9%. Nevertheless, stocks managed to post gains in December, with the S&P 500 Index up 1.1% for the month, which helped offset some of the negative performance for the quarter. For the fourth quarter as a whole, the S&P 500 Index lost 21.9% and the Russell 1000 declined 22.5%.
During the fourth quarter, there was some differentiation in performance among capitalizations, styles, and sectors. Smaller cap stocks underperformed large caps in the fourth quarter, with the Russell 2000 dropping 26.1%. However, small caps managed to outperform large caps for the year as a whole. Growth outperformed value, as measured by the S&P/Citigroup indices, for both the quarter and the year. Among market sectors, financials followed the pattern that had been in place throughout the year, lagging sharply, while the defensive areas of the market were more resilient.
The main factors affecting U.S. market performance throughout the quarter were the lack of credit availability and policymakers’ responses. This caused stock prices to be caught in a tug of war between credit deflation and policy stimulus. The Fed and other policymakers have been aggressively combating deflation and, should their efforts succeed, improved credit conditions should help both the overall economic environment as well as the corporate earnings landscape.
Oil prices also had a significant impact on equities throughout 2008. After skyrocketing in July to nearly $150 a barrel, prices plummeted in the fall and through the fourth quarter to end the year at roughly $40 a barrel. High oil prices acted as a strong headwind for equity market performance, and there was widespread debate about whether this advance was due to the fundamental factors of supply and demand, or whether the high prices were a result of speculation. As oil prices began to unwind in the fall, it became clear that speculative investing had, to some extent, pushed prices to unrealistically high levels. Looking ahead, most observers believe that prices will eventually rebound. While rising oil (and other commodity) prices are generally regarded as a negative for stocks, in the current environment higher prices could be taken as a sign of possible economic recovery, since it would indicate that demand levels have increased.
Any opinions expressed are those of BlackRock as of the date of this report and are subject to change based on changes in market or economic conditions. Past performance is not a guarantee of future results. There is no guarantee that forecasts made herein will come to pass. The comments should not be construed as a recommendation for any individual holdings or market sectors. Actual portfolios may differ as a result of account size, client imposed investment restrictions, the timing of client investment, and market, economic, and individual company considerations, among other things. Information and opinions are derived from proprietary and non-proprietary sources deemed by BlackRock to be reliable. We cannot guarantee the accuracy of such information, assure its completeness, or warrant that such information will not be changed without notice. Reliance upon information in this report is at the sole discretion of the reader.
2
CHESTNUT STREET EXCHANGE FUND
(A California Limited Partnership)
INVESTMENT ADVISER’S REPORT (Continued)
Portfolio Review
The credit crisis, which accelerated in September with the failure of Lehman Brothers, shifted into high gear in October. Volatility rose to extreme levels as continued government intervention and stimulation grappled with massive deleveraging and a flight to safety. The uncertainty of the credit crisis, combined with the lack of lending activity resulted in a sharp downturn in economic activity guaranteeing a second consecutive decline in quarterly GDP. These factors combined to produce the largest quarterly losses in recent history for the S&P 500. Investors in stocks found no safe haven, as sharp declines impacted all sectors, market capitalizations, and style segments. All sectors within the S&P 500 Index experienced declines as the Index dropped -21.9% in the 4th quarter.
With all sectors falling sharply during the quarter, equity managers struggled to find positive performers. The Chestnut Street Exchange Fund was not immune from the terrible investing environment, but performed better than the -21.9% return posted by the S&P 500.
The portfolio’s significant overweight in the health care sector boosted relative returns as the sector was one of the top performers during the turbulent quarter. Stock selection across a number of industries, including health care, energy, information technology, and industrials, also added value on the quarter.
Within health care, the portfolio’s orientation toward pharmaceutical stocks benefited relative returns. While every industry within the S&P 500 declined during the quarter, the pharmaceutical industry registered a very modest decline, as investors favored more defensive investments. The diversification of the companies and non-discretionary nature of their products enabled Fund holdings such as Merck & Co. and Abbott Laboratories to fare relatively well.
In the energy sector, the Fund’s holdings in the exploration & production industry delivered positive absolute and relative returns thanks to the preference for large integrated oil companies Exxon Mobil and BP PLC in the Fund. In this falling oil price environment, these diversified companies, which are less sensitive to the swing in oil prices, solidly outperformed the pure exploration & production companies.
Underweight positions in both consumer staples and telecommunications services hindered relative returns during the month as these sectors performed relatively well and declined less than the Index.
Stock selection in the materials sector also detracted modestly, with chemicals company Cabot Corp. accounting for the relative underperformance after lowering quarterly guidance due to the very weak macroeconomic environment.
BlackRock Capital Management, Inc.
Any opinions expressed are those of BlackRock as of the date of this report and are subject to change based on changes in market or economic conditions. Past performance is not a guarantee of future results. There is no guarantee that forecasts made herein will come to pass. The comments should not be construed as a recommendation for any individual holdings or market sectors. Actual portfolios may differ as a result of account size, client imposed investment restrictions, the timing of client investment, and market, economic, and individual company considerations, among other things. Information and opinions are derived from proprietary and non-proprietary sources deemed by BlackRock to be reliable. We cannot guarantee the accuracy of such information, assure its completeness, or warrant that such information will not be changed without notice. Reliance upon information in this report is at the sole discretion of the reader.
3
CHESTNUT STREET EXCHANGE FUND
(A California Limited Partnership)
INVESTMENT ADVISER’S REPORT (Concluded)
(Unaudited)
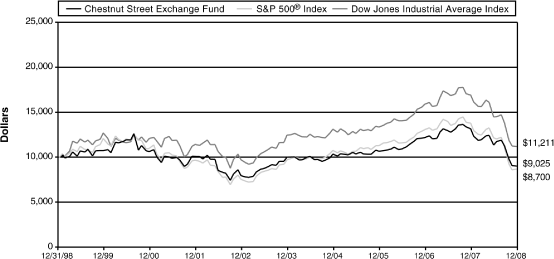
PERFORMANCE COMPARISON
Comparison of Change in Value of $10,000 Investment in Chestnut Street
Exchange Fund (1) vs. S&P 500® Index and Dow Jones Industrial Average Index(2)
The performance data represents past performance and the principal value and investment return will fluctuate so that an investor’s shares, when redeemed, may be worth more or less than their original cost. Past performance is no guarantee of future results. Please call (302) 791-1112 for the most recent month-end performance.
In addition, the data does not reflect the deduction of taxes that a shareholder would pay on distributions or redemption of Fund shares.
For the Year Ended December 31, 2008
| | | | | | | | | | | | | | | | | |
| | | Average Annual Total Returns |
| | | | | | | | | | | | | | | Since |
| | | 1 Year | | 5 Year | | 10 Year | | Inception(3) |
| Chestnut Street Exchange Fund | | | (31.56 | )% | | | (2.06 | )% | | | (1.02 | )% | | | 10.55 | % |
S&P 500® Index | | | (36.98 | )% | | | (2.18 | )% | | | (1.38 | )% | | | 10.24 | % |
| Dow Jones Industrial Average Index | | | (31.92 | )% | | | (1.11 | )% | | | 1.67 | % | | | 10.76 | % |
| | |
| (1) | | The chart assumes a hypothetical $10,000 initial investment in the Fund made on January 1, 1998 and reflects Fund expenses. Investors should note that the Fund is a managed fund while the indices are unmanaged, do not incur expenses and are not available for investment. The Fund’s gross expense ratio for the fiscal year ended December 31, 2008 was 0.46%. |
| |
| (2) | | Results of index performance are presented for general comparative purposes. |
| |
| (3) | | Cumulative since inception total returns were 2,399.93%, 2,165.35% and 2,532.17% for the Chestnut Street Exchange Fund, the S&P 500® Index and the Dow Jones Industrial Average Index, respectively, for the period December 29, 1976 (inception) to December 31, 2008. |
BlackRock Capital Management, Inc.
4
CHESTNUT STREET EXCHANGE FUND
(A California Limited Partnership)
Fund Expense Example
(Unaudited)
As a shareholder of the Fund, you incur two types of costs: (1) transaction costs, and (2) ongoing costs, including management fees, and other Fund expenses. The example is intended to help you understand your ongoing costs (in dollars) of investing in the Fund and to compare these costs with the ongoing costs of investing in other mutual funds.
The example is based on an investment of $1,000 invested at the beginning of the six-month period from July 1, 2008 through December 31, 2008, and held for the entire period.
Actual Expenses
The first line of the accompanying table provides information about actual account values and actual expenses. You may use the information in this line, together with the amount you invested, to estimate the expenses that you paid over the period. Simply divide your account value by $1,000 (for example, an $8,600 account value divided by $1,000 = 8.6), then multiply the result by the number in the first line under the heading entitled “Expenses Paid During Six Months Ending December 31, 2008” to estimate the expenses you paid on your account during this period.
Hypothetical Example for Comparison Purposes
The second line of the accompanying table provides information about hypothetical account values and hypothetical expenses based on the Fund’s actual expense ratio and an assumed rate of return of 5% per year before expenses, which is not your Fund’s actual return. The hypothetical account values and expenses may not be used to estimate the actual ending account balance or expenses you paid for the period. You may use this information to compare the ongoing costs of investing in the Fund and other funds. To do so, compare this 5% hypothetical example with the 5% hypothetical examples that appear in the shareholder reports of other funds.
Please note that the expenses shown in the accompanying table are meant to highlight your ongoing costs only and do not reflect any transactional costs. Therefore, the second line of the accompanying table is useful in comparing ongoing costs only, and will not help you determine the relative total costs of owning different funds. In addition, if these transactional costs were included, your costs would have been higher.
Chestnut Street Exchange Fund
| | | | | | | | | | | | | |
| | | | | | | | | | | Expenses Paid |
| | | Beginning | | Ending | | During Six |
| | | Account Value | | Account Value | | Months Ending |
| | | July 1, 2008 | | December 31, 2008 | | December 31, 2008* |
| Actual | | $ | 1,000.00 | | | $ | 793.20 | | | $ | 2.12 | |
| Hypothetical (5% return before expenses) | | $ | 1,000.00 | | | $ | 1,022.74 | † | | $ | 2.39 | |
| | |
| * | | Expenses are equal to the Fund’s annualized six-month expense ratio of 0.47%, multiplied by the average account value over the period, multiplied by the number of days (184) in the most recent fiscal half-year, then divided by 366 to reflect the one-half year period. The Fund’s ending account value on the first line of the table is based on the actual total return of (20.68)% for the six-month period ending December 31, 2008. |
| |
| † | | Hypothetical expenses are based on the Fund’s actual annualized six-month expense ratio and an assumed rate of return of 5% per year before expenses. |
5
CHESTNUT STREET EXCHANGE FUND
(A California Limited Partnership)
PORTFOLIO HOLDINGS SUMMARY TABLE
December 31, 2008
(Unaudited)
| | | | | | | | | |
| | | % of Net | | | | |
| Security Type/Industry | | Assets | | | Value | |
COMMON STOCKS: | | | | | | | | |
| Health Care | | | 24.6 | % | | $ | 45,387,161 | |
| Financial | | | 14.7 | | | | 27,122,147 | |
| Technology | | | 10.9 | | | | 20,079,189 | |
| Consumer Cyclicals | | | 10.3 | | | | 19,011,754 | |
| Energy | | | 10.0 | | | | 18,565,571 | |
| Capital Equipment | | | 7.3 | | | | 13,525,748 | |
| Transportation | | | 6.6 | | | | 12,223,879 | |
| Staples | | | 6.3 | | | | 11,725,636 | |
| Basics | | | 4.1 | | | | 7,478,568 | |
| Utilities | | | 2.6 | | | | 4,884,736 | |
| Retail | | | 2.1 | | | | 3,913,942 | |
| Other Assets In Excess of Liabilities | | | 0.5 | | | | 879,891 | |
| | | | | | | |
| Net Assets | | | 100.0 | % | | $ | 184,798,222 | |
| | | | | | | |
| | | | | | | |
6
CHESTNUT STREET EXCHANGE FUND
(A California Limited Partnership)
SCHEDULE OF INVESTMENTS
December 31, 2008
| | | | | | | | | |
| | | Shares | | | Value | |
COMMON STOCKS—99.5% | | | | | | | | |
BASICS—4.1% | | | | | | | | |
| Air Products & Chemicals, Inc. | | | 100,609 | | | $ | 5,057,614 | |
| Cabot Corp. | | | 86,032 | | | | 1,316,290 | |
| Cabot Microelectronics Corp.* | | | 42,373 | | | | 1,104,664 | |
| | | | | | | | |
| | | | | | | | 7,478,568 | |
| | | | | | | | |
| | | | | | | | | |
CAPITAL EQUIPMENT—7.3% | | | | | | | | |
| Emerson Electric Co. | | | 181,112 | | | | 6,630,510 | |
| General Electric Co. | | | 364,049 | | | | 5,897,594 | |
| Pitney Bowes, Inc. | | | 39,154 | | | | 997,644 | |
| | | | | | | | |
| | | | | | | | 13,525,748 | |
| | | | | | | | |
| | | | | | | | | |
CONSUMER CYCLICALS—10.3% | | | | | | | | |
| 3M Co. | | | 144,103 | | | | 8,291,687 | |
| Citadel Broadcasting Corp.* | | | 9,916 | | | | 1,586 | |
| Comcast Corp., — Class A | | | 149,743 | | | | 2,527,662 | |
| Procter & Gamble Co. | | | 85,100 | | | | 5,260,882 | |
| Walt Disney Co. (The) | | | 129,129 | | | | 2,929,937 | |
| | | | | | | | |
| | | | | | | | 19,011,754 | |
| | | | | | | | |
| | | | | | | | | |
ENERGY—10.0% | | | | | | | | |
| BP PLC ADR | | | 41,979 | | | | 1,962,099 | |
| Exxon Mobil Corp. | | | 147,227 | | | | 11,753,131 | |
| Schlumberger, Ltd. | | | 114,584 | | | | 4,850,341 | |
| | | | | | | | |
| | | | | | | | 18,565,571 | |
| | | | | | | | |
| | | | | | | | | |
FINANCIAL—14.7% | | | | | | | | |
| American Express Co. | | | 98,525 | | | | 1,827,639 | |
| Ameriprise Financial, Inc. | | | 22,266 | | | | 520,134 | |
| Bank of America Corp. | | | 316,782 | | | | 4,460,291 | |
| JPMorgan Chase & Co. | | | 140,310 | | | | 4,423,974 | |
| Moody’s Corp. | | | 82,738 | | | | 1,662,206 | |
| Wells Fargo & Co. | | | 482,629 | | | | 14,227,903 | |
| | | | | | | | |
| | | | | | | | 27,122,147 | |
| | | | | | | | |
| | | | | | | | | |
HEALTH CARE—24.6% | | | | | | | | |
| Abbott Laboratories | | | 231,254 | | | | 12,342,026 | |
| Baxter International, Inc. | | | 64,986 | | | | 3,482,600 | |
| Hospira, Inc.* | | | 23,125 | | | | 620,212 | |
| IMS Health, Inc. | | | 74,542 | | | | 1,130,057 | |
| Johnson & Johnson | | | 238,482 | | | $ | 14,268,378 | |
| Medco Health Solutions, Inc.* | | | 91,862 | | | | 3,849,936 | |
| Merck & Company, Inc. | | | 318,880 | | | | 9,693,952 | |
| | | | | | | | |
| | | | | | | | 45,387,161 | |
| | | | | | | | |
| | | | | | | | | |
RETAIL—2.1% | | | | | | | | |
| Home Depot, Inc. | | | 23,400 | | | | 538,668 | |
| Kohl’s Corp.* | | | 15,200 | | | | 550,240 | |
| Safeway, Inc. | | | 44,558 | | | | 1,059,144 | |
| Wal-Mart Stores, Inc. | | | 31,500 | | | | 1,765,890 | |
| | | | | | | | |
| | | | | | | | 3,913,942 | |
| | | | | | | | |
| | | | | | | | | |
STAPLES—6.3% | | | | | | | | |
| Altria Group, Inc. | | | 18,000 | | | | 271,080 | |
| Coca-Cola Co. (The) | | | 164,147 | | | | 7,430,935 | |
| Hanesbrands, Inc.* | | | 5,688 | | | | 72,522 | |
| Kraft Foods, Inc., — Class A | | | 12,456 | | | | 334,443 | |
| PepsiCo, Inc. | | | 43,600 | | | | 2,387,972 | |
| Philip Morris International, Inc. | | | 18,000 | | | | 783,180 | |
| Sara Lee Corp. | | | 45,506 | | | | 445,504 | |
| | | | | | | | |
| | | | | | | | 11,725,636 | |
| | | | | | | | |
| | | | | | | | | |
TECHNOLOGY—10.9% | | | | | | | | |
| Cisco Systems, Inc.* | | | 32,700 | | | | 533,010 | |
| Hewlett-Packard Co. | | | 57,923 | | | | 2,102,026 | |
| Intel Corp. | | | 776,785 | | | | 11,387,668 | |
| International Business Machines Corp. | | | 39,708 | | | | 3,341,825 | |
| Microsoft Corp. | | | 139,643 | | | | 2,714,660 | |
| | | | | | | | |
| | | | | | | | 20,079,189 | |
| | | | | | | | |
| | | | | | | | | |
TRANSPORTATION—6.6% | | | | | | | | |
| Burlington Northern Santa Fe Corp. | | | 113,572 | | | | 8,598,536 | |
| Union Pacific Corp. | | | 75,844 | | | | 3,625,343 | |
| | | | | | | | |
| | | | | | | | 12,223,879 | |
| | | | | | | | |
See Accompanying Notes to Financial Statements.
7
CHESTNUT STREET EXCHANGE FUND
(A California Limited Partnership)
SCHEDULE OF INVESTMENTS (Concluded)
| | | | | | | | | |
| | | Shares | | | Value | |
UTILITIES—2.6% | | | | | | | | |
| FairPoint Communications, Inc. | | | 2,713 | | | $ | 8,899 | |
| Verizon Communications, Inc. | | | 143,830 | | | | 4,875,837 | |
| | | | | | | | |
| | | | | | | | 4,884,736 | |
| | | | | | | | |
| | | | | | | | | |
TOTAL INVESTMENT IN SECURITIES | | | | | | | | |
| (Cost: $40,161,142) | | | 99.5 | % | | $ | 183,918,331 | |
| Other assets in excess of liabilities | | | 0.5 | % | | | 879,891 | |
| | | | | | | |
NET ASSETS | | | 100.0 | % | | $ | 184,798,222 | |
| | | | | | | |
| | |
| * | | Non-income producing. |
| |
| ADR — American Depositary Receipt. |
| |
| PLC — Public Limited Company. |
See Accompanying Notes to Financial Statements.
8
CHESTNUT STREET EXCHANGE FUND
(A California Limited Partnership)
Statement of Assets and Liabilities
December 31, 2008
| | | | | |
| Assets | | | | |
| Investments, at value (cost $40,161,142) | | $ | 183,918,331 | |
| Cash | | | 2,135,231 | |
| Dividends receivable | | | 503,162 | |
| Interest receivable | | | 430 | |
| Prepaid expenses | | | 16,942 | |
| | | | |
| | | | | |
| Total assets | | | 186,574,096 | |
| | | | |
| | | | | |
Liabilities | | | | |
| Payables for: | | | | |
| Distributions | | | 1,557,030 | |
| Capital shares repurchased | | | 101,413 | |
| Advisory fees | | | 54,928 | |
| Managing general partners | | | 12,113 | |
| Transfer agent fees | | | 7,001 | |
| Custodian fees | | | 2,282 | |
| Accrued expenses and other liabilities | | | 41,107 | |
| | | | |
| | | | | |
| Total liabilities | | | 1,775,874 | |
| | | | |
| | | | | |
Net Assets | | $ | 184,798,222 | |
| | | | |
| | | | | |
Net Assets Consisted of: | | | | |
| Other capital — paid-in or reinvested | | $ | 44,636,477 | |
| Undistributed net investment income | | | 1,467 | |
| Accumulated net realized losses on securities | | | (3,596,911 | ) |
| Net unrealized appreciation of investments | | | 143,757,189 | |
| | | | |
| | | | | |
| Net Assets (Applicable to 691,802 partnership shares outstanding) | | $ | 184,798,222 | |
| | | | |
| | | | | |
Net Asset Value per share ($184,798,222 / 691,802 shares) | | $ | 267.13 | |
| | | | |
| | | | | |
Net assets applicable to shares owned by: | | | | |
| Limited partners (691,709 shares) | | $ | 184,773,379 | |
| Managing general partners (93 shares) | | | 24,843 | |
| | | | |
| | | | | |
| Total net assets (691,802 shares) | | $ | 184,798,222 | |
| | | | |
See Accompanying Notes to Financial Statements.
9
CHESTNUT STREET EXCHANGE FUND
(A California Limited Partnership)
Statement of Operations
Year Ended December 31, 2008
| | | | | | | | | |
Investment income | | | | | | | | |
| Dividends | | | | | | $ | 6,802,433 | |
| Interest | | | | | | | 39,793 | |
| | | | | | | | |
| Total Investment Income | | | | | | | 6,842,226 | |
| | | | | | | | |
| | | | | | | | | |
Expenses | | | | | | | | |
| Investment advisory services | | | | | | | 833,470 | |
| Managing general partners’ compensation, officer’s salary and expenses | | | | | | | 100,976 | |
| Legal fees | | | | | | | 85,096 | |
| Custodian fees | | | | | | | 26,879 | |
| Printing | | | | | | | 25,001 | |
| Insurance | | | | | | | 24,417 | |
| Audit fees | | | | | | | 16,048 | |
| Transfer agent fees | | | | | | | 13,722 | |
| Miscellaneous | | | | | | | 9,903 | |
| | | | | | | | |
| Total Expenses | | | | | | | 1,135,512 | |
| | | | | | | | |
| Net Investment Income | | | | | | | 5,706,714 | |
| | | | | | | | |
| | | | | | | | | |
Net realized and unrealized gain/(loss) on investments | | | | | | | | |
| Realized loss on sale of investment securities | | | | | | | (3,118,303 | ) |
| | | | | | | | | |
| Realized gain from securities transactions: distributed on redemption of partnership shares | | | | | | | 14,991,707 | |
| | | | | | | | | |
| Unrealized appreciation on investments | | | | | | | | |
| Beginning of year | | $ | 251,092,441 | | | | | |
| End of year | | | 143,757,189 | | | | | |
| | | | | | | | | |
| Net change in unrealized appreciation | | | | | | | (107,335,252 | ) |
| | | | | | | | |
| | | | | | | | | |
| Net realized and unrealized loss on Investments | | | | | | | (95,461,848 | ) |
| | | | | | | | |
| | | | | | | | | |
| Net decrease in net assets resulting from operations | | | | | | $ | (89,755,134 | ) |
| | | | | | | | |
Statement of Changes in Net Assets
Years Ended December 31,
| | | | | | | | | |
| | | 2008 | | | 2007 | |
Increase/(decrease) in net assets Operations: | | | | | | | | |
| Net investment income | | $ | 5,706,714 | | | $ | 5,675,160 | |
| Net realized gain/(loss) from securities transactions, for federal income tax purposes, net gain/(loss) is $(3,100,083) and $2,001,276 | | | (3,118,303 | ) | | | 1,964,787 | |
| Excess of market value over book value of securities distributed upon redemption of partnership shares | | | 14,991,707 | | | | 11,636,706 | |
| Net change in unrealized appreciation/(depreciation) on investments | | | (107,335,252 | ) | | | 3,565,681 | |
| | | | | | | |
| Increase/(decrease) in net assets resulting from operations | | | (89,755,134 | ) | | | 22,842,334 | |
| | | | | | | |
| | | | | | | | | |
Distributions to partners from: | | | | | | | | |
| Net Investment income | | | (5,708,668 | ) | | | (5,675,969 | ) |
| | | | | | | |
| | | | | | | | | |
Capital share transactions: | | | | | | | | |
| Net asset value of 2,328 and 893 shares issued lieu of cash distributions | | | 782,761 | | | | 355,979 | |
| Cost of 50,659 and 30,133 shares repurchased | | | (16,797,525 | ) | | | (11,825,990 | ) |
| | | | | | | |
| Decrease in net assets from capital share transactions | | | (16,014,764 | ) | | | (11,470,011 | ) |
| | | | | | | |
| Total increase/(decrease) in net assets | | | (111,478,566 | ) | | | 5,696,354 | |
| | | | | | | |
| | | | | | | | | |
Net assets: | | | | | | | | |
| Beginning of year | | | 296,276,788 | | | | 290,580,434 | |
| | | | | | | |
| End of year* | | $ | 184,798,222 | | | $ | 296,276,788 | |
| | | | | | | |
| | |
| * | | Includes undistributed net investment income of $1,467 and $3,421, respectively. |
See Accompanying Notes to Financial Statements.
10
CHESTNUT STREET EXCHANGE FUND
(A California Limited Partnership)
FINANCIAL HIGHLIGHTS
(For a Share of the Fund Outstanding Throughout Each Year)
| | | | | | | | | | | | | | | | | | | | | |
| | | Years Ended December 31, | |
| | | 2008 | | | 2007 | | | 2006 | | | 2005 | | | 2004 | |
| Net Asset Value, Beginning of Year | | $ | 400.30 | | | $ | 377.68 | | | $ | 337.28 | | | $ | 333.18 | | | $ | 327.39 | |
| | | | | | | | | | | | | | | | |
| | | | | | | | | | | | | | | | | | | | | |
| Income/(Loss) From Investment Operations: | | | | | | | | | | | | | | | | | | | | |
| Net investment income | | | 8.06 | | | | 7.62 | | | | 6.88 | | | | 6.19 | | | | 5.65 | |
| Net gain/(loss) on securities (both realized and unrealized) | | | (133.17 | ) | | | 22.62 | | | | 40.40 | | | | 4.10 | | | | 5.80 | |
| | | | | | | | | | | | | | | | |
| | | | | | | | | | | | | | | | | | | | | |
| Total from investment operations | | | (125.11 | ) | | | 30.24 | | | | 47.28 | | | | 10.29 | | | | 11.45 | |
| | | | | | | | | | | | | | | | |
| | | | | | | | | | | | | | | | | | | | | |
| Less Distributions: | | | | | | | | | | | | | | | | | | | | |
| From net investment income | | | (8.06 | ) | | | (7.62 | ) | | | (6.88 | ) | | | (6.19 | ) | | | (5.66 | ) |
| | | | | | | | | | | | | | | | |
| | | | | | | | | | | | | | | | | | | | | |
| Net Asset Value, End of Year | | $ | 267.13 | | | $ | 400.30 | | | $ | 377.68 | | | $ | 337.28 | | | $ | 333.18 | |
| | | | | | | | | | | | | | | | |
| | | | | | | | | | | | | | | | | | | | | |
| Total Return | | | (31.56 | )% | | | 8.05 | % | | | 14.13 | % | | | 3.12 | % | | | 3.56 | % |
| | | | | | | | | | | | | | | | |
| | | | | | | | | | | | | | | | | | | | | |
| Ratios/Supplemental Data: | | | | | | | | | | | | | | | | | | | | |
| Net Assets, End of Year (000’s) | | $ | 184,798 | | | $ | 296,277 | | | $ | 290,580 | | | $ | 271,390 | | | $ | 298,159 | |
| Ratios to average net assets: | | | | | | | | | | | | | | | | | | | | |
| Operating expenses | | | 0.46 | % | | | 0.44 | % | | | 0.44 | % | | | 0.43 | % | | | 0.42 | % |
| Net investment income | | | 2.33 | % | | | 1.91 | % | | | 1.93 | % | | | 1.82 | % | | | 1.75 | % |
| Portfolio Turnover Rate | | | 0.29 | % | | | 0.68 | % | | | 0.99 | % | | | 0.82 | % | | | 0.47 | % |
See Accompanying Notes to Financial Statements.
11
CHESTNUT STREET EXCHANGE FUND
(A California Limited Partnership)
NOTES TO FINANCIAL STATEMENTS
December 31, 2008
(A) ORGANIZATION
Chestnut Street Exchange Fund (the “Fund”), a California Limited Partnership, is registered under the Investment Company Act of 1940, as amended, as a diversified open-end investment management company. The Fund’s investment objective is to seek long-term growth of capital and, secondarily, current income. Effective January 1, 1998, the Fund changed its status for tax purposes from a partnership to a regulated investment company. The change resulted from the enactment of the “Publicly Traded Partnership” rules to the Internal Revenue Code in 1987 which first applied to the Fund after 1997.
(B) SIGNIFICANT ACCOUNTING PRINCIPLES
The preparation of financial statements in conformity with accounting principles generally accepted in the United States of America requires management to make estimates and assumptions that affect the reported amounts of assets and liabilities and disclosure of contingent assets and liabilities at the date of the financial statements and the reported amounts of increases and decreases in net assets from operations during the reporting period. Actual results could differ from those estimates. The following is a summary of significant accounting policies followed by the Fund in the preparation of its financial statements.
Security Valuations
Securities listed or traded on an exchange are valued generally at the last sales price as of the close of the customary trading session on the exchange where the security is principally traded, or lacking any sales on a particular day, valued at the closing bid price on that day. Each security reported on the NASDAQ Stock Market, Inc. is valued at the NASDAQ Official Close Price. Securities for which market quotations are not readily available or are believed to be unreliable are valued at fair value as determined in good faith using methods approved by the Managing General Partners. Short-term obligations having 60 days or less to maturity are valued at amortized cost which approximates market value.
Effective as of the commencement of investment operations on January 1, 2008, the Fund adopted Financial Accounting Standards Board (“FASB”) Statement of Financial Accounting Standards No. 157 (“SFAS 157”). This standard clarifies the definition of fair value for financial reporting, establishes a framework for measuring fair value and requires additional disclosures about the use of fair value measurements. The three levels of the fair value hierarchy under SFAS 157 are described below:
| | • | | Level 1 — quoted prices in active markets for identical securities |
| |
| | • | | Level 2 — other significant observable inputs (including quoted prices for similar securities, interest rates, prepayment speeds, credit risk, etc.) |
| |
| | • | | Level 3 — significant unobservable inputs (including the Fund’s own assumptions in determining the fair value of investments) |
12
The inputs or methodology used for valuing securities are not necessarily an indication of the risk associated with investing in those securities.
The following is a summary of the inputs used, as of December 31, 2008, in valuing the Fund’s assets carried at fair value:
| | | | | |
| | | Investments | |
| | | in | |
| Valuation Inputs | | Securities | |
| Level 1 — Quoted Prices | | $ | 183,918,331 | |
| Level 2 — Other Significant Observable Inputs | | | — | |
| Level 3 — Significant Unobservable Inputs | | | — | |
| | | | |
| Total | | $ | 183,918,331 | |
| | | | |
Securities Transactions and Investment Income
Securities transactions are accounted for on a trade date basis. Realized gains and losses on sales and redemptions in-kind are computed on the basis of specific identification for both financial reporting and income tax purposes. For securities exchanged into the Fund at the Fund’s inception in 1976, the cost for financial reporting purposes is the value of those securities as used in the Exchange. The cost, for income tax purposes, of securities exchanged into the Fund is the tax basis of the individual investor. Interest income is recorded on the accrual basis. Dividend income is recorded on the ex-dividend date.
Distributions
Distributions from net investment income are paid quarterly and recorded on the ex-dividend date. Distributions of capital gains, if any, are paid annually and recorded on the ex-dividend date.
Federal Income Taxes
The Fund intends to comply with the requirements of the Internal Revenue Code necessary to qualify as a regulated investment company and, as such, will not be subject to federal income taxes on otherwise taxable income which is distributed to shareholders. The Fund may elect not to distribute long-term capital gains to shareholders, but retain these gains and pay the income tax at the applicable corporate income tax rate. If the Fund elects to pay the tax on long-term capital gains, on the last day of the year the tax is paid, the partners are entitled to a proportionate credit for the tax payment and the tax basis of their shares is increased by the amount of undistributed gains less the tax paid by the Fund. At December 31, 2008, the Fund had a capital loss carryforward of $3,596,911, of which $275,627 expires December 31, 2011, $221,201 expires December 31, 2012 and $3,100,083 expires December 31, 2016. Therefore, no provision for federal income taxes is recorded in the financial statements.
The Fund adopted FASB Interpretation No. 48 (“FIN 48”), Accounting for Uncertainty in Income Taxes. FIN 48 sets forth a minimum threshold for financial statement recognition of the benefit of a tax position taken or expected to be taken in a tax return. Management has analyzed the Fund’s tax positions and has concluded that no provision for income tax is required in the Fund’s financial statements. However, management’s conclusions regarding the adoption of FIN 48 may be subject to review and adjustment at a later date based on factors including, but not limited to, further implementation guidance from the FASB, new tax laws, regulations and administrative interpretations
13
(including court decisions). The Fund’s federal tax return for the prior three years remain subject to examination by the Internal Revenue Service.
At December 31, 2008, the federal tax cost, aggregate gross unrealized appreciation and depreciation of securities held by the Fund were as follows:
| | | | | |
| Federal tax cost | | $ | 36,409,656 | |
| | | | |
| Gross unrealized appreciation | | | 150,283,882 | |
| Gross unrealized depreciation | | | (2,775,207 | ) |
| | | | |
| Net unrealized appreciation | | $ | 147,508,675 | |
| | | | |
The difference between book basis and tax basis of investments is attributable to the use of the individual partners’ tax basis for those securities contributed to the Fund at its inception as required by law.
(C) INVESTMENT ADVISORY FEES and OTHER TRANSACTIONS WITH AFFILIATES
BlackRock Capital Management, Inc. (“BCM” or the “Adviser”), a wholly owned subsidiary of BlackRock Institutional Management, Inc., serves as Investment Adviser to the Fund pursuant to an advisory agreement dated September 29, 2006 (“Advisory Agreement”). BCM provides advisory, accounting and administrative services to the Fund. All BlackRock entities named are subsidiaries of BlackRock, Inc. in which PNC Bank holds a minority interest.
The Advisory Agreement provides for a fee at the annual rate of 4/10ths of 1% of the first $100,000,000 of the Fund’s average daily net assets plus 3/10ths of 1% of net assets exceeding $100,000,000.
PNC Global Investment Servicing (U.S.) Inc. (“PNC”), formerly PFPC Inc., an affiliate of PNC Bank, serves as the Fund’s transfer and dividend disbursing agent.
PFPC Trust Company, a subsidiary of PNC, serves as the Fund’s custodian. As compensation for its services as custodian, PFPC Trust Company is entitled to a fee computed at an annual rate of 0.0065% of the Fund’s average gross assets plus additional fees based on the number and type of transactions.
The Managing General Partners each receive a fixed fee as compensation for their services. In addition, the President, Treasurer and Chief Compliance Officer receives additional payments for overseeing the Fund’s activities including compliance with federal securities laws, plus reimbursements of related expenses. Total payments to or for the Managing General Partners amounted to $100,976.
Legal fees amounting to $85,096 were paid to Drinker Biddle & Reath LLP. Michael P. Malloy, Esq., Secretary of the Fund, is a partner of that firm.
(D) INVESTMENT TRANSACTIONS
Purchases and sales of investment securities (excluding short-term obligations and redemptions in-kind) were $1,693,033 and $701,282, respectively, for the year ended December 31, 2008.
(E) DISTRIBUTIONS TO SHAREHOLDERS
Net investment income and capital gain distributions are determined in accordance with federal income tax regulations, which may differ from accounting principles generally accepted in the United States of America. The primary difference applicable to the Fund’s distributions is the requirement to pass through 40% of its aggregate expenses to the partners of the Fund. This is required because the Fund has fewer
14
than 500 partners and does not continuously offer shares. The partners treat this pass-through of expenses as a distribution of net investment income and a corresponding miscellaneous itemized deduction of investment expense.
The tax character of distributions paid during 2008 and 2007 was as follows:
| | | | | | | | | |
| | | 2008 | | | 2007 | |
| Ordinary income | | $ | 6,162,873 | | | $ | 6,194,338 | |
| Investment expense | | | (454,205 | ) | | | (518,369 | ) |
| | | | | | | |
| | | $ | 5,708,668 | | | $ | 5,675,969 | |
| | | | | | | |
For federal income tax purposes, distributions of net investment income and short-term capital gains are treated as ordinary income dividends.
(F) IN-KIND DISTRIBUTION OF SECURITIES
During the year ended December 31, 2008, the Fund distributed portfolio securities in lieu of cash for most shareholder redemptions. The value of these redemptions was as follows:
| | | | | |
| | | Net Realized | | Fund |
| Value of the | | Gain Included | | Shares |
| Redemptions | | In Redemptions | | Redeemed |
| $16,684,522 | | $14,991,707 | | 50,237 |
Net realized gains from these transactions are not taxable to the Fund. Such gains are not distributed to shareholders and will be reclassified to paid-in capital at the Fund’s fiscal year end. These transactions were completed following guidelines approved by the Managing General Partners.
(G) INDEMNIFICATIONS
In the ordinary course of business, the Fund enters into contracts that contain a variety of indemnifications. The Fund’s maximum exposure under these arrangements is immaterial. The Fund has not had prior claims or losses pursuant to the contracts and expects the risk of loss to be remote.
(H) TAX MATTERS
At December 31, 2008, the components of distributable earnings on a tax basis were as follows:
| | | | | |
| Undistributed ordinary income | | $ | 1,467 | |
| Capital loss carryover | | | (3,596,911 | ) |
| Net unrealized appreciation of investments | | | 147,508,675 | |
| | | | |
| | | | $143,913,231 | |
| | | | |
On December 31, 2008, undistributed net realized gain/accumulated realized loss on securities was decreased by $14,973,487 and additional paid-in capital was increased by $14,973,487 due to permanent differing book and tax treatment of realized gains and losses attributable to the differences in the book and tax cost of securities described in Note B. Net assets of the Fund were unaffected by this change.
15
REPORT OF INDEPENDENT REGISTERED PUBLIC ACCOUNTING FIRM
To the Partners of
Chestnut Street Exchange Fund
We have audited the accompanying statement of assets and liabilities, including the schedule of investments of Chestnut Street Exchange Fund (the “Fund”), as of December 31, 2008, and the related statement of operations for the year then ended, the statement of changes in net assets for each of the two years in the period then ended and the financial highlights for each of the five years in the period then ended. These financial statements and financial highlights are the responsibility of the Fund’s management. Our responsibility is to express an opinion on these financial statements and financial highlights based on our audits.
We conducted our audits in accordance with the standards of the Public Company Accounting Oversight Board (United States). Those standards require that we plan and perform the audit to obtain reasonable assurance about whether the financial statements and financial highlights are free of material misstatement. An audit includes examining, on a test basis, evidence supporting the amounts and disclosures in the financial statements. Our procedures included confirmation of securities owned as of December 31, 2008 by correspondence with the custodian. An audit also includes assessing the accounting principles used and significant estimates made by management, as well as evaluating the overall financial statement presentation. We believe that our audits provide a reasonable basis for our opinion.
In our opinion, the financial statements and financial highlights referred to above present fairly, in all material respects, the financial position of Chestnut Street Exchange Fund as of December 31, 2008, the results of its operations for the year then ended, the changes in its net assets for each of the two years in the period then ended and the financial highlights for each of the five years in the period then ended, in conformity with accounting principles generally accepted in the United States of America.
BRIGGS, BUNTING & DOUGHERTY, LLP
Philadelphia, Pennsylvania
February 20, 2009
16
CHESTNUT STREET EXCHANGE FUND
(A California Limited Partnership)
Additional Information (Unaudited)
Proxy Voting
Policies and procedures that the Fund uses to determine how to vote proxies relating to portfolio securities as well as information regarding how the Fund voted proxies relating to portfolio securities for the most recent 12-month period ended June 30 are available without charge, upon request, by calling (888) 261-4073 and on the Securities and Exchange Commission’s (“SEC”) website at http://www.sec.gov.
Quarterly Portfolio Schedule
The Fund files a complete schedule of portfolio holdings with the SEC for the first and third fiscal quarters of each fiscal year (quarters ended March 31 and September 30) on Form N-Q. The Fund’s Form N-Q is available on the SEC website at http://www.sec.gov and may be reviewed and copied at the SEC Public Reference Room in Washington, D.C. Information on the operation of the SEC Public Reference Room may be obtained by calling 1-800-SEC-0330.
Annual Approval of Investment Advisory Agreement.
At a meeting held on July 30, 2008, the Managing General Partners of the Fund, including the Independent Managing General Partners, approved the continuation of the investment advisory agreement with BlackRock Capital Management, Inc. (“BCM”) with respect to the Fund for an additional one-year period. In connection with their approval, the Managing General Partners considered, with the assistance of independent counsel, their legal responsibilities and reviewed the nature and quality of services provide to the Fund and BCM’s experience and qualifications. Among other items, the Managing General Partners reviewed and considered a report that included, among other things, (1) a comparison of the assets, advisory fee and total expense ratio of shares of the Fund to those of the BlackRock Funds Exchange Portfolio (the “BlackRock Portfolio”), the other exchange fund managed by BCM; (2) a comparison of the performance of the Fund to its benchmark (S&P 500) as well as the Dow Jones Industrial Average and its Lipper peer group; (3) compensation or possible benefits to BCM and its affiliates, including PNC Global Investment Servicing, arising from its relationship with the Fund; (4) a discussion of the current business activities of BCM’s parent, BlackRock Inc. (“BlackRock”); (5) information about the services provided to the Fund, the personnel that are involved in the management of the Fund and how they are compensated; (6) a description of the procedures for determining that the Fund receives best execution and for allocating portfolio opportunities among the Fund and other advisory clients of BCM; (7) the nature of BCM’s internal controls to monitor portfolio compliance; and (8) economies of scale. Also included in the materials was BlackRock’s 2007 Annual Report and financial statements for its second quarter 2008 earnings release as well as a copy of the Fund’s investment advisory agreement.
17
CHESTNUT STREET EXCHANGE FUND
(A California Limited Partnership)
Additional Information (Unaudited) (Continued)
After discussion, the Managing General Partners concluded that BCM had the capabilities, resources and personnel necessary to manage the Fund. The Managing General Partners also concluded that, based on the services that BCM would provide to the Fund under the investment advisory agreement, the fee was fair and equitable with respect to the Fund. The Managing General Partners considered the fees paid by the Fund in relation to BlackRock Portfolio’s fees, as well as the Fund’s performance. After evaluating the above information, the Managing General Partners concluded that the advisory fees paid by the Fund are fair and equitable. The Managing General Partners also concluded that BCM had allocated sufficient resources and personnel to the investment management operations of the Fund and was able to provide quality services to the Fund.
Tax Information
As required by the Internal Revenue Code, 100% of ordinary income dividends paid for the year ended December 31, 2008 have been designated as: 1) qualified for the reduced tax rate under The Job and Growth Tax Relief Reconciliation Act of 2003, and 2) eligible for the dividend received deduction for corporate shareholders.
18
CHESTNUT STREET EXCHANGE FUND
(A California Limited Partnership)
INFORMATION ON THE MANAGING GENERAL
PARTNERS AND OFFICERS OF THE FUND
The list below provides certain information about the identity and business experience of the Managing General Partners and officers of the Fund. The Fund’s Statement of Additional Information includes additional information about the Fund’s Managing General Partners, which may be obtained from the Fund free of charge by calling 1-800-852-4750.
TERM OF OFFICE: The Fund’s partnership agreement provides that each Managing General Partner holds officer until the earliest of (a) the election of his or her successor; or (b) the date a Managing General Partner dies, resigns, becomes insane, is adjudicated as bankrupt or is removed by a majority of the partners. The officers of the Fund are elected by the Managing General Partners and each officer holds office for one year or until he or she shall resign or be removed or until his or her successor is elected and qualified.
| | | | | | | | | | | |
| | | | | | | Number of | | |
| | | | | | | Portfolios | | |
| | | | | | | in Fund | | Other |
| | | Position with | | Principal | | Complex(1) | | Directorship(2) |
| | | the Fund and | | Occupations During | | Overseen by | | Held by |
| | | Length of | | Past 5 Years and | | Managing | | Managing |
| Name, Address, and Age | | Time Served | | Current Affiliations | | General Partners | | General Partner |
| | | | | | | | | | | |
Interested Managing | | | | | | | | | | |
General Partners | | | | | | | | | | |
| | | | | | | | | | | |
Richard C. Caldwell*
c/o Edward J. Roach
103 Bellevue Parkway
Wilmington, DE 19809
Age: 64 | | Managing
General Partner
since 1997 | | Advisory Director, PNC Florida, FSB; Advisory Director in Philadelphia and Southern New Jersey region for PNC Bank; Consultant for PNC Florida; Chairman, Florida Advisory Council; formerly, President and Chief Executive Officer, PNC Bank FSB from May 1998 until July 1999; Director, JLC, Inc. since February 1996 (investment holding company); Director, DR Inc. and Dingess-Rum Properties Inc. since April 1994 (investment holding company). | | | 1 | | | None |
| | | | | | | | | | | |
Edward J. Roach*
103 Bellevue Parkway
Wilmington, DE 19809
Age: 84 | | Managing
General Partner
since 2000, Chief
Compliance
Officer since
2004, President
since 2002,
Treasurer since
1981 | | Certified Public Accountant; President and/or Treasurer of 1 other investment company advised by BCM. | | | 1 | | | None |
19
| | | | | | | | | | | |
| | | | | | | Number of | | |
| | | | | | | Portfolios | | |
| | | | | | | in Fund | | Other |
| | | Position with | | Principal | | Complex(1) | | Directorship(2) |
| | | the Fund and | | Occupations During | | Overseen by | | Held by |
| | | Length of | | Past 5 Years and | | Managing | | Managing |
| Name, Address, and Age | | Time Served | | Current Affiliations | | General Partners | | General Partner |
| | | | | | | | | | | |
Disinterested Managing | | | | | | | | | | |
General Partners | | | | | | | | | | |
| | | | | | | | | | | |
Gordon L. Keen, Jr.
c/o Edward J. Roach
103 Bellevue Parkway
Wilmington, DE 19809
Age: 64 | | Managing
General Partner
since 2006 | | Senior Vice President, Law & Corporate Department, Airgas, Inc. (Radnor, PA-based distributor of industrial, medical and specialty gases, and welding and safety equipment and supplies) from January 1992 to January 2006. | | | 1 | | | None |
| |
Langhorne B. Smith
c/o Edward J. Roach
103 Bellevue Parkway
Wilmington, DE 19809
Age: 72 | | Managing
General Partner
since 1997 | | Retired. President and Director, The Sandridge Corporation (private investment company); Director, Claneil Enterprises, Inc. (private investment company). | | | 1 | | | None |
| | | | | | | | | | | |
David R. Wilmerding, Jr.
c/o Edward J. Roach
103 Bellevue Parkway
Wilmington, DE 19809
Age: 73 | | Managing General Partner since 1976; Chairman of the Managing General Partners since 2006 | | Retired. Chairman, Wilmerding & Associates (investment advisers) from February 1989 to 2006. | | | 1 | | | Director, Beaver
Management
Corporation |
| | | | | | | | | | | |
Officer | | | | | | | | | | |
Michael P. Malloy
Drinker Biddle & Reath
One Logan Square
18th and Cherry Streets
Philadelphia, PA 19103
Age: 49 | | Secretary
since 2001 | | Secretary of the Chestnut Street Exchange Fund; Partner in the law firm of Drinker Biddle & Reath LLP. | | | N/A | | | N/A |
| | |
| * | | Messrs. Caldwell and Roach are “interested persons” of the Fund as that term is defined in the Investment Company Act of 1940 (“1940 Act”). Mr. Caldwell owns stock of an affiliate of the adviser and Mr. Roach is an employee of the Fund. |
| |
| (1) | | A Fund Complex means two or more investment companies that hold themselves out to investors as related companies for purposes of investment and investor services, or have a common investment adviser or have an investment adviser that is an affiliated person of the investment adviser of any of the other investment companies. Mr. Roach serves as President and Treasurer of The RBB Fund, Inc. |
| |
| (2) | | Directorships of companies required to report to the Securities and Exchange Commission under the Securities Exchange Act of 1934, as amended (i.e., “public companies”) or other investment companies registered under the 1940 Act. |
20
[THIS PAGE INTENTIONALLY LEFT BLANK]
[THIS PAGE INTENTIONALLY LEFT BLANK]
[THIS PAGE INTENTIONALLY LEFT BLANK]
Item 2. Code of Ethics.
| | (a) | | The registrant, as of the end of the period covered by this report, has adopted a code of ethics that applies to the registrant’s principal executive officer, principal financial officer, principal accounting officer or controller, or persons performing similar functions, regardless of whether these individuals are employed by the registrant or a third party. |
| |
| | (c) | | There have been no amendments, during the period covered by this report, to a provision of the code of ethics that applies to the registrant’s principal executive officer, principal financial officer, principal accounting officer or controller, or persons performing similar functions, regardless of whether these individuals are employed by the registrant or a third party, and that relates to any element of the code of ethics description. |
| |
| | (d) | | The registrant has not granted any waivers, including an implicit waiver, from a provision of the code of ethics that applies to the registrant’s principal executive officer, principal financial officer, principal accounting officer or controller, or persons performing similar functions, regardless of whether these individuals are employed by the registrant or a third party, that relates to one or more of the items set forth in paragraph (b) of this item’s instructions. |
Item 3. Audit Committee Financial Expert.
The registrant’s board of managing general partners has determined that the registrant has at least one “audit committee financial expert” (as defined in Item 3 of Form N-CSR) serving on its audit committee. Langhorne B. Smith is the “audit committee financial expert” and is “independent” (as each item is defined in Item 3 of Form N-CSR).
Item 4. Principal Accountant Fees and Services.
Audit Fees
| | (a) | | The aggregate fees billed for each of the last two fiscal years for professional services rendered by the principal accountant for the audit of the registrant’s annual financial statements or services that are normally provided by the accountant in connection with statutory and regulatory filings or engagements for those fiscal years are $19,000 for 2007 and $19,000 for 2008. |
Audit-Related Fees
| | (b) | | The aggregate fees billed in each of the last two fiscal years for assurance and related services by the principal accountant that are reasonably related to the performance of the audit of the |
| | | | registrant’s financial statements and are not reported under paragraph (a) of this Item are $0 for 2007 and $0 for 2008. |
Tax Fees
| | (c) | | The aggregate fees billed in each of the last two fiscal years for professional services rendered by the principal accountant for tax compliance, tax advice, and tax planning are $0 for 2007 and $0 for 2008. |
All Other Fees
| | | |
| (d) | | The aggregate fees billed in each of the last two fiscal years for products and services provided by the principal accountant, other than the services reported in paragraphs (a) through (c) of this Item are $0 for 2007 and $0 for 2008. |
| | | |
| (e)(1) | | Disclose the audit committee’s pre-approval policies and procedures described in paragraph (c)(7) of Rule 2-01 of Regulation S-X. |
| | | |
| | | The Audit Committee does not have pre-approved policies and procedures. Instead, the Audit Committee approves on a case-by-case basis each audit or non-audit service before the accountant is engaged by the Registrant. |
| | | |
| (e)(2) | | The percentage of services described in each of paragraphs (b) through (d) of this Item that were approved by the audit committee pursuant to paragraph (c)(7)(i)(C) of Rule 2-01 of Regulation S-X are as follows: |
(b) Not applicable
(c) Not applicable
(d) Not applicable
| | (f) | | The percentage of hours expended on the principal accountant’s engagement to audit the registrant’s financial statements for the most recent fiscal year that were attributed to work performed by persons other than the principal accountant’s full-time, permanent employees was 0%. |
| |
| | (g) | | The aggregate non-audit fees billed by the registrant’s accountant for services rendered to the registrant, and rendered to the registrant’s investment adviser (not including any sub-adviser whose role is primarily portfolio management and is subcontracted with or overseen by another investment adviser), and any entity controlling, controlled by, or under common control with the adviser that provides ongoing services to the registrant for each of the last two fiscal years of the registrant was $0 for 2007 and $0 for 2008. |
| |
| | (h) | | Not applicable. |
Item 5. Audit Committee of Listed registrants.
Not applicable.
Item 6. Investments.
| (a) | | Schedule of Investments in securities of unaffiliated issuers as of the close of the reporting period is included as part of the report to shareholders filed under Item 1 of this form. |
| |
| (b) | | Not applicable. |
Item 7. Disclosure of Proxy Voting Policies and Procedures for Closed-End Management Investment Companies.
Not applicable.
Item 8. Portfolio Managers of Closed-End Management Investment Companies.
Not applicable.
Item 9. Purchases of Equity Securities by Closed-End Management Investment Company and Affiliated Purchasers.
Not applicable.
Item 10. Submission of Matters to a Vote of Security Holders.
There have been no material changes to the procedures by which shareholders may recommend nominees to the registrant’s board of managing general partners.
Item 11. Controls and Procedures.
| | (a) | | The registrant’s principal executive and principal financial officers, or persons performing similar functions, have concluded that the registrant’s disclosure controls and procedures (as defined in Rule 30a-3(c) under the Investment Company Act of 1940, as amended (the “1940 Act”) (17 CFR 270.30a-3(c))) are effective, as of a date within 90 days of the filing date of the report, based on the evaluation of these controls and procedures required by Rule 30a-3(b) under the 1940 Act (17 CFR 270.30a-3(b)) and Rule 15d-15(b) under the Securities Exchange Act of 1934, as amended (17 CFR 240.15d-15(b)). |
| |
| | (b) | | There were no changes in the registrant’s internal control over financial reporting (as defined in Rule 30a-3(d) under the 1940 Act (17 CFR 270.30a-3(d)) that occurred during the second fiscal |
| | | | quarter of the period covered by this report that have materially affected, or are reasonably likely to materially affect, the registrant’s internal control over financial reporting. |
Item 12. Exhibits.
| | | |
| (a)(1) | | Code of ethics that is the subject of disclosure required by Item 2 is incorporated by reference to the N-CSR filed on March 9, 2005 (SEC Accession No. 0000893220-05-000491). |
| | | |
| (a)(2) | | Certifications pursuant to Rule 30a-2(a) under the 1940 Act and Section 302 of the Sarbanes-Oxley Act of 2002 are attached hereto. |
| | | |
| (a)(3) | | Not applicable. |
| | | |
| (b) | | Certifications pursuant to Rule 30a-2(b) under the 1940 Act and Section 906 of the Sarbanes- Oxley Act of 2002 are attached hereto. |
SIGNATURES
Pursuant to the requirements of the Securities Exchange Act of 1934 and the Investment Company Act of 1940, the registrant has duly caused this report to be signed on its behalf by the undersigned, thereunto duly authorized.
| | | | | |
| (registrant) Chestnut Street Exchange Fund | | |
| | | | | |
| By (Signature and Title)* | | /s/ Edward J. Roach Edward J. Roach, President & Treasurer
(Principal Executive Officer & Principal Financial Officer) | | |
| | | | | |
| Date February 20, 2009 | | | | |
Pursuant to the requirements of the Securities Exchange Act of 1934 and the Investment Company Act of 1940, this report has been signed below by the following persons on behalf of the registrant and in the capacities and on the dates indicated.
| | | | | |
| By (Signature and Title)* | | /s/ Edward J. Roach Edward J. Roach, President & Treasurer
(Principal Executive Officer & Principal Financial Officer) | | |
| | | | | |
| Date February 20, 2009 | | | | |
| | |
| * | | Print the name and title of each signing officer under his or her signature. |