Exhibit 99.1
PRO FORMA VALUATION REPORT
SECOND-STEP CONVERSION
Gouverneur Bancorp, Inc.│Gouverneur, New York
PROPOSED HOLDING COMPANY FOR:
Gouverneur Savings and Loan Association│ Gouverneur, New York
Dated as of May 8, 2023

1311-A Dolley Madison Boulevard
Suite 2A
McLean, Virginia 22101
703.528.1700
rpfinancial.com

May 8, 2023
Boards of Directors
Cambray Mutual Holding Company
Gouverneur Bancorp, Inc.
Gouverneur Savings and Loan Association
42 Church Street
Gouverneur, New York 13642
Members of the Boards of Directors:
At your request, we have completed and hereby provide an independent appraisal ("Appraisal") of the estimated pro forma market value of the common stock which is to be issued in connection with the mutual-to-stock conversion transaction described below.
This Appraisal is furnished pursuant to the requirements stipulated in the Code of Federal Regulations and has been prepared in accordance with the “Guidelines for Appraisal Reports for the Valuation of Savings and Loan Associations Converting from Mutual to Stock Form of Organization” (the “Valuation Guidelines”) of the Office of Thrift Supervision (“OTS”) and accepted by the Federal Reserve Board (“FRB”), the Federal Deposit Insurance Corporation (“FDIC”), the Office of the Comptroller of the Currency (“OCC”) and the New York State Department of Financial Services, and applicable regulatory interpretations thereof.
Description of Plan of Conversion
On May 22, 2023, the Boards of Directors of Cambray Mutual Holding Company (the “MHC”), Gouverneur Bancorp, Inc. (“GOVB”) and Gouverneur Savins and Loan Association (the “Bank”) adopted a plan of conversion whereby the MHC will convert to stock form. As a result of the conversion, GOVB, which currently owns all of the issued and outstanding common stock of the Bank, will be succeeded by a new Maryland corporation with the name of Gouverneur Bancorp, Inc. (“Gouverneur Bancorp” or the “Company”). Following the conversion, the MHC will no longer exist. For purposes of this document, the existing consolidated entity will hereinafter also be referred to as Gouverneur Bancorp or the Company, unless otherwise identified as GOVB. As of March 31, 2023, the MHC had a majority ownership interest in, and its principal asset consisted of, approximately 64.55% of the common stock (the “MHC Shares”) of GOVB. The remaining 35.45% of GOVB’s common stock is owned by public stockholders.
It is our understanding that Gouverneur Bancorp will offer its stock, representing the majority ownership interest held by the MHC, in a subscription offering to Eligible Account Holders, Tax-Qualified Plans including the Bank’s new employee stock ownership plan (the “ESOP”), Supplemental Eligible Account Holders and Other Members. To the extent that shares remain available for purchase after satisfaction of all subscriptions received in the subscription offering, the shares may be offered for sale to the public at large in a
| Washington Headquarters | |
| 1311-A Dolley Madison Boulevard | Telephone: (703) 528-1700 |
| Suite 2A | Fax No.: (703) 528-1788 |
| McLean, VA 22101 | Toll-Free No.: (866) 723-0594 |
| www.rpfinancial.com | E-Mail: mail@rpfinancial.com |
Boards of Directors
May 8, 2023
Page 2
community offering and a syndicated community offering. Upon completing the mutual-to-stock conversion and stock offering (the “second-step conversion”), the Company will be 100% owned by public shareholders, the publicly-held shares of GOVB will be exchanged for shares in the Company at a ratio that retains their ownership interest at the time the conversion is completed and the MHC assets will be consolidated with the Company.
RP® Financial, LC.
RP® Financial, LC. (“RP Financial”) is a financial consulting firm serving the financial services industry nationwide that, among other things, specializes in financial valuations and analyses of business enterprises and securities, including the pro forma valuation for savings institutions converting from mutual-to-stock form. The background and experience of RP Financial is detailed in Exhibit V-1. We believe that, except for the fee we will receive for the Appraisal, we are independent of the Company, GOVB, the Bank, the MHC and the other parties engaged by the Bank or the Company to assist in the second-step conversion process.
Valuation Methodology
In preparing our Appraisal, we have reviewed the regulatory applications of the Company, the Bank and the MHC, including the prospectus as filed with the FRB and the Securities and Exchange Commission (“SEC”). We have conducted a financial analysis of the Company, the Bank and the MHC that has included a review of audited financial information for the fiscal years ended September 30, 2018 through September 30, 2022, a review of various unaudited information and internal financial reports through March 31, 2023, and due diligence related discussions with the Company’s management; Bonadio & Co., LLP, the Company’s independent auditor; Kilpatrick Townsend & Stockton LLP, the Company’s conversion counsel and Keefe, Bruyette & Woods, Inc., the Company’s marketing advisor in connection with the stock offering. All assumptions and conclusions set forth in the Appraisal were reached independently from such discussions. In addition, where appropriate, we have considered information based on other available published sources that we believe are reliable. While we believe the information and data gathered from all these sources are reliable, we cannot guarantee the accuracy and completeness of such information.
We have investigated the competitive environment within which Gouverneur Bancorp operates and have assessed Gouverneur Bancorp’s relative strengths and weaknesses. We have kept abreast of the changing regulatory and legislative environment for financial institutions and analyzed the potential impact on Gouverneur Bancorp and the industry as a whole. We have analyzed the potential effects of the stock conversion on Gouverneur Bancorp’s operating characteristics and financial performance as they relate to the pro forma market value of Gouverneur Bancorp. We have analyzed the assets held by the MHC, which will be consolidated with Gouverneur Bancorp’s assets and equity pursuant to the completion of the second-step conversion. We have reviewed the economic and demographic characteristics of the Company’s primary market area. We have compared Gouverneur Bancorp’s financial performance and condition with selected publicly-traded thrifts in accordance with the Valuation Guidelines, as well as all publicly-traded thrifts and thrift
Boards of Directors
May 8, 2023
Page 3
holding companies. We have reviewed the current conditions in the securities markets in general and the market for thrift stocks in particular, including the market for existing thrift issues, initial public offerings by thrifts and thrift holding companies and second-step conversion offerings. We have excluded from such analyses thrifts subject to announced or rumored acquisition, and/or institutions that exhibit other unusual characteristics.
The Appraisal is based on Gouverneur Bancorp’s representation that the information contained in the regulatory applications and additional information furnished to us by Gouverneur Bancorp and its independent auditor, legal counsel and other authorized agents are truthful, accurate and complete. We did not independently verify the financial statements and other information provided by Gouverneur Bancorp, or its independent auditor, legal counsel and other authorized agents nor did we independently value the assets or liabilities of Gouverneur Bancorp. The valuation considers Gouverneur Bancorporation only as a going concern and should not be considered as an indication of Gouverneur Bancorp’s liquidation value.
Our appraised value is predicated on a continuation of the current operating environment for Gouverneur Bancorp and for all thrifts and their holding companies. Changes in the local, state and national economy, the legislative and regulatory environment for financial institutions and mutual holding companies, the stock market, interest rates, and other external forces (such as natural disasters or significant world events) may occur from time to time, often with great unpredictability and may materially impact the value of thrift stocks as a whole or the value of Gouverneur Bancorp’s stock alone. It is our understanding that there are no current plans for selling control of Gouverneur Bancorp following completion of the second-step conversion. To the extent that such factors can be foreseen, they have been factored into our analysis.
The estimated pro forma market value is defined as the price at which Gouverneur Bancorp’s common stock, immediately upon completion of the second-step stock offering, would change hands between a willing buyer and a willing seller, neither being under any compulsion to buy or sell and both having reasonable knowledge of relevant facts.
In preparing the pro forma pricing analysis we have taken into account the pro forma impact of the MHC’s net assets (i.e., unconsolidated equity) that will be consolidated with the Company and thus will increase equity. After accounting for the impact of the MHC’s net assets and dividends waived by the MHC, the public shareholders’ ownership interest was reduced by approximately 0.71%. Accordingly, for purposes of the Company’s pro forma valuation, the public shareholders’ pro forma ownership interest was reduced from 35.45% to 34.74% and the MHC’s ownership interest was increased from 64.55% to 65.26%.
Valuation Conclusion
It is our opinion that, as of May 8, 2023, the estimated aggregate pro forma valuation of the shares of the Company to be issued and outstanding at the end of the conversion offering – including (1) newly-issued shares representing the MHC’s current ownership interest in the Company and (2) exchange shares issued to existing public shareholders of GOVB – was $13,025,610 at the midpoint, equal to 1,302,561 shares at $10.00 per share. The resulting range of value and pro forma shares, all based on $10.00 per share, are as follows: $11,071,770 or 1,107,177 shares at the minimum and $14,979,450 or 1,497,945 shares at the maximum.
Boards of Directors
May 8, 2023
Page 4
Based on this valuation and taking into account the ownership interest represented by the shares owned by the MHC, the midpoint of the offering range is $8,500,000 equal to 850,000 shares at $10.00 per share. The resulting offering range and offering shares, all based on $10.00 per share, are as follows: $7,225,000 or 722,500 shares at the minimum and $9,775,000 or 977,500 shares at the maximum,
Establishment of the Exchange Ratio
The conversion regulations provide that in a conversion of a mutual holding company, the minority stockholders are entitled to exchange the public shares for newly issued shares in the fully converted company. The Boards of Directors of the MHC and GOVB have independently determined the exchange ratio, which has been designed to preserve the current aggregate percentage ownership in the Company (adjusted for the dilution resulting from the consolidation of the MHC’s unconsolidated equity into the Company). The exchange ratio to be received by the existing minority shareholders of the Company will be determined at the end of the offering, based on the total number of shares sold in the offering and the final appraisal. Based on the valuation conclusion herein, the resulting offering value and the $10.00 per share offering price, the indicated exchange ratio at the midpoint is 0.6284 shares of the Company’s stock for every one share held by public shareholders. Furthermore, based on the offering range of value, the indicated exchange ratio is 0.5342 at the minimum and 0.7227 at the maximum. RP Financial expresses no opinion on the proposed exchange of newly issued Company shares for the shares held by the public stockholders or on the proposed exchange ratio.
Limiting Factors and Considerations
The valuation is not intended, and must not be construed, as a recommendation of any kind as to the advisability of purchasing shares of the common stock. Moreover, because such valuation is determined in accordance with applicable regulatory guidelines and is necessarily based upon estimates and projections of a number of matters, all of which are subject to change from time to time, no assurance can be given that persons who purchase shares of common stock in the conversion offering, or prior to that time, will thereafter be able to buy or sell such shares at prices related to the foregoing valuation of the estimated pro forma market value thereof. The appraisal reflects only a valuation range as of this date for the pro forma market value of Gouverneur Bancorp immediately upon issuance of the stock and does not take into account any trading activity with respect to the purchase and sale of common stock in the secondary market on the date of issuance of such securities or at anytime thereafter following the completion of the second-step conversion.
RP Financial’s valuation was based on the financial condition, operations and shares outstanding of GOVB as of March 31, 2023, the date of the financial data included in the prospectus. The proposed exchange ratio to be received by the current public stockholders of GOVB and the exchange of the public shares for newly issued shares of Gouverneur Bancorp’s common stock as a full public company was determined independently by the Boards of Directors of the MHC and GOVB. RP Financial expresses no opinion on the proposed exchange ratio to public stockholders or the exchange of public shares for newly issued shares.
Boards of Directors
May 8, 2023
Page 5
RP Financial is not a seller of securities within the meaning of any federal and state securities laws and any report prepared by RP Financial shall not be used as an offer or solicitation with respect to the purchase or sale of any securities. RP Financial maintains a policy which prohibits RP Financial, its principals or employees from purchasing stock of its client institutions.
This valuation may be updated as provided for in the conversion regulations and guidelines. These updates will consider, among other things, any developments or changes in the financial performance and condition of Gouverneur Bancorp, management policies, and current conditions in the equity markets for thrift shares, both existing issues and new issues. These updates may also consider changes in other external factors which impact value including, but not limited to: various changes in the legislative and regulatory environment for financial institutions, the stock market and the market for thrift stocks, and interest rates. Should any such new developments or changes be material, in our opinion, to the valuation of the shares, appropriate adjustments to the estimated pro forma market value will be made. The reasons for any such adjustments will be explained in the update at the date of the release of the update. The valuation will also be updated at the completion of Gouverneur Bancorp’s stock offering.
| | Respectfully submitted, |
| | |
| | RP® FINANCIAL, LC. |
| | |
| |  |
| | Ronald S. Riggins |
| | Managing Director |
| | |
| |  |
| | Gregory E. Dunn |
| | Director |
| RP® Financial, LC. | TABLE OF CONTENTS |
| | i |
TABLE OF CONTENTS
GOUVERNEUR BANCORP, INC.
GOUVERNEUR SAVINGS AND LOAN ASSOCIATION
Gouverneur, New York
| | | PAGE |
| DESCRIPTION | | NUMBER |
| | | |
| CHAPTER ONE | OVERVIEW AND FINANCIAL ANALYSIS | |
| | | |
| Introduction | | I.1 |
| Plan of Conversion | | I.1 |
| Strategic Overview | | I.2 |
| Balance Sheet Trends | | I.5 |
| Income and Expense Trends | | I.9 |
| Interest Rate Risk Management | | I.12 |
| Lending Activities and Strategy | | I.13 |
| Asset Quality | | I.15 |
| Funding Composition and Strategy | | I.16 |
| Subsidiaries | | I.17 |
| Legal Proceedings | | I.17 |
| | | |
| CHAPTER TWO | MARKET AREA ANALYSIS | |
| | | |
| Introduction | | II.1 |
| National Economic Factors | | II.1 |
| Market Area Demographics | | II.6 |
| Regional Economy | | II.8 |
| Unemployment Trends | | II.10 |
| Market Area Deposit Characteristics and Competition | | II.10 |
| | | |
| CHAPTER THREE | PEER GROUP ANALYSIS | |
| | | |
| Peer Group Selection | | III.1 |
| Financial Condition | | III.5 |
| Income and Expense Components | | III.8 |
| Loan Composition | | III.11 |
| Interest Rate Risk | | III.13 |
| Credit Risk | | III.13 |
| Summary | | III.16 |
| | | | |
| RP® Financial, LC. | TABLE OF CONTENTS |
| | ii |
TABLE OF CONTENTS
GOUVERNEUR BANCORP, INC.
GOUVERNEUR SAVINGS AND LOAN ASSOCIATION
Gouverneur, New York
(continued)
| | | | PAGE |
| DESCRIPTION | | NUMBER |
| | | | | |
| CHAPTER FOUR | VALUATION ANALYSIS | | |
| | | | | |
| Introduction | | IV.1 |
| Appraisal Guidelines | | IV.1 |
| RP Financial Approach to the Valuation | | IV.1 |
| Valuation Analysis | | IV.2 |
| 1. | Financial Condition | | IV.2 |
| 2. | Profitability, Growth and Viability of Earnings | | IV.4 |
| 3. | Asset Growth | | IV.6 |
| 4. | Primary Market Area | | IV.6 |
| 5. | Dividends | | IV.8 |
| 6. | Liquidity of the Shares | | IV.8 |
| 7. | Marketing of the Issue | | IV.9 |
| | A. | The Public Market | | IV.9 |
| | B. | The New Issue Market | | IV.14 |
| | C. | The Acquisition Market | | IV.15 |
| | D. | Trading in GOVB’s Stock | | IV.17 |
| 8. | Management | | IV.17 |
| 9. | Effect of Government Regulation and Regulatory Reform | | IV.18 |
| Summary of Adjustments | | IV.18 |
| Valuation Approaches | | IV.19 |
| 1. | Price-to-Earnings (“P/E”) | | IV.21 |
| 2. | Price-to-Book (“P/B”) | | IV.23 |
| 3. | Price-to-Assets (“P/A”) | | IV.23 |
| Comparison to Recent Offerings | | IV.24 |
| Valuation Conclusion | | IV.24 |
| Establishment of the Exchange Ratio | | IV.25 |
| | | | | | |
| RP® Financial, LC. | LIST OF TABLES |
| | iii |
LIST OF TABLES
GOUVERNEUR BANCORP, INC.
GOUVERNEUR SAVINGS AND LOAN ASSOCIATION
Gouverneur, New York
| TABLE | | |
| Number | DESCRIPTION | page |
| | | |
| 1.1 | Historical Balance Sheet Data | I.6 |
| 1.2 | Historical Income Statements | I.10 |
| | | |
| 2.1 | Summary Demographic/Economic Data | II.7 |
| 2.2 | Primary Market Area Employment Sectors | II.9 |
| 2.3 | Market Area Largest Employers | II.9 |
| 2.4 | Unemployment Trends | II.10 |
| 2.5 | Deposit Summary | II.11 |
| 2.6 | Market Area Deposit Competitors | II.12 |
| | | |
| 3.1 | Peer Group of Publicly-Traded Thrifts | III.3 |
| 3.2 | Balance Sheet Composition and Growth Rates | III.6 |
| 3.3 | Income as a % of Average Assets and Yields, Costs, Spreads | III.9 |
| 3.4 | Loan Portfolio Composition and Related Information | III.12 |
| 3.5 | Interest Rate Risk Measures and Net Interest Income Volatility | III.14 |
| 3.6 | Credit Risk Measures and Related Information | III.15 |
| | | |
| 4.1 | Market Area Unemployment Rates | IV.7 |
| 4.2 | Pricing Characteristics and After-Market Trends | IV.16 |
| 4.3 | Market Pricing Versus Peer Group | IV.22 |
| RP® Financial, LC. | OVERVIEW AND FINANCIAL ANALYSIS |
| | I.1 |
I. Overview and Financial Analysis
Introduction
Gouverneur Savings and Loan Association (“Gouverneur Savings” or the “Bank”), established in 1892, is a New York chartered stock savings and loan association headquartered in Gouverneur, New York. Gouverneur Savings serves the North Country region of northern New York through five branch offices. One branch is located in St. Lawrence County and the remaining four branches are located in Jefferson County. A map of the Bank’s office locations is provided in Exhibit I-1. Gouverneur Savings is a member of the Federal Home Loan Bank (“FHLB”) system and its deposits are insured up to the maximum allowable amount by the Federal Deposit Insurance Corporation (“FDIC”).
Gouverneur Bancorp, Inc. (“GOVB”) is the federally chartered mid-tier holding company of the Bank. GOVB owns 100% of the outstanding common stock of the Bank. Since its formation in 1999, GOVB has been engaged primarily in the business of holding the common stock of the Bank. GOVB completed its initial public offering on March 23, 1999, pursuant to which it sold 1,072,818 shares or 45.0% of its outstanding common stock to the public and issued 1,311,222 shares or 55.0% of its common stock outstanding to Cambray Mutual Holding Company (the “MHC”), the mutual holding company parent of GOVB. The MHC and GOVB are subject to supervision and regulation by the Board of Governors of the Federal Reserve System (the “Federal Reserve Board” or the “FRB”). At March 31, 2023, GOVB had total consolidated assets of $205.2 million, deposits of $165.9 million and equity of $26.3 million or 12.84% of total assets. Excluding goodwill and core deposit intangibles of $6.3 million, GOVB’s tangible equity equaled $20.1 million or 9.78% of total assets at March 31, 2023. GOVB’s audited financial statements for the most recent period are included by reference as Exhibit I-2.
Plan of Conversion
On May 22, 2023, the respective Board of Directors of the MHC, GOVB and the Bank adopted a Plan of Conversion, whereby the MHC will convert to stock form. As a result of the conversion, GOVB, which currently owns all of the issued and outstanding common stock of the Bank, will be succeeded by Gouverneur Bancorp, Inc. (“Gouverneur Bancorp” or the “Company”), a newly formed Maryland corporation. Following the conversion, the MHC will no longer exist. For purposes of this document, the existing consolidated entity will hereinafter be
| RP® Financial, LC. | OVERVIEW AND FINANCIAL ANALYSIS |
| | I.2 |
referred to as Gouverneur Bancorp or the Company, unless otherwise identified as GOVB. As of March 31, 2023, the MHC had a majority ownership interest of approximately 64.55% in GOVB and its principal asset consisted of 1,311,222 common stock shares of GOVB (the “MHC Shares”). The remaining 720,155 shares or approximately 35.45% of GOVB’s common stock was owned by public shareholders.
It is our understanding that Gouverneur Bancorp will offer its stock, representing the majority ownership interest held by the MHC, in a subscription offering to Eligible Account Holders, Tax-Qualified Plans including the Bank’s new employee stock ownership plan (the “ESOP”), Supplemental Eligible Account Holders and Other Members. To the extent that shares remain available for purchase after satisfaction of all subscriptions received in the subscription offering, the shares may be offered for sale to the public at large in a community offering and a syndicated community offering. Upon completing the mutual-to-stock conversion and stock offering (the “second-step conversion”), the Company will be 100% owned by public shareholders, the publicly-held shares of GOVB will be exchanged for shares in the Company at a ratio that retains their ownership interest at the time the conversion is completed and the MHC assets will be consolidated with the Company.
Strategic Overview
Gouverneur Bancorp maintains a local community banking emphasis, with a primary strategic objective of meeting the borrowing and savings needs of its local customer base. The Company is pursuing a strategy of strengthening its community bank franchise dedicated to meeting the banking needs of business and retail customers in the communities that are served by the Company. Growth strategies are to continue to focus on 1-4 family lending, while also pursuing lending diversification that will continue to consist of originations of commercial real estate, home equity commercial business, consumer and construction loans. The Bank’s objective is to fund asset growth primarily through deposit growth, emphasizing growth of lower cost core deposits and increasing municipal deposits as an additional source of funding. To facilitate solicitation of municipal deposits, the Bank operates a limited-purpose wholly owned subsidiary, GS&L Municipal Bank that was formed in September 2022 as a New York chartered limited purpose corporation.
In fiscal year 2022, the Company supplemented organic growth with the acquisition of Citizens Bank of Cape Vincent, Cape Vincent, New York (“Citizens Bank”). The acquisition was
| RP® Financial, LC. | OVERVIEW AND FINANCIAL ANALYSIS |
| | I.3 |
completed on September 16, 2022 and, per the merger agreement, Citizens Bank stockholders received $1,056.11 in cash for each share of Citizen Bank stock held, equaling total merger consideration of $8.4 million. With the acquisition of Citizens Bank, the Bank added $81.6 million in assets, $37.0 million in loans, $77.2 million in deposits and three branch offices in northern New York. All three of Citizens Bank’s branches are located in Jefferson County.
Loans constitute the major portion of the Company’s composition of interest-earning assets, with 1-4 family permanent mortgage comprising approximately 80% of the Company’s loan portfolio composition. Investments serve as a supplement to the Company’s lending activities and the investment portfolio is considered to be indicative of a low risk investment philosophy, consisting of a mix of municipal bonds, U.S. Treasury securities, U.S. Government agencies and government-sponsored obligations, and mortgage-backed securities.
Deposits have consistently served as the primary funding source for the Company, supplemented with borrowings as an alternative funding source for purposes of managing funding costs and interest rate risk. Core deposits, consisting of transaction and savings account deposits, constitute the largest portion of the Company’s deposit base. The Company’s utilization of borrowings has been limited to FHLB advances.
Gouverneur Bancorp’s earnings base is largely dependent upon net interest income and operating expense levels. Following three years of net interest income trending lower during fiscal years 2019 through 2021, the Company’s net interest income increased slightly during fiscal year 2022 and then showed a more significant increase for the twelve months ended March 31, 2023. The recent positive trend in net interest income was facilitated by an increase in interest income and a decrease in interest expense, with the acquisition of Citizens Bank contributing to the more significant increase in net interest income recorded during the twelve months ended March 31, 2023. Following an upward trend during fiscal years 2019 through 2021, operating expenses declined during fiscal year 2022 and then increased during the twelve months ended March 31, 2023 pursuant to the operating expenses added in connection with the acquisition of Citizen Bank. While the acquisition of Citizens Bank provided for some leveraging of operating expenses as a percent of average assets, operating expenses have been maintained at a relatively higher level as a percent of average assets. Diversification into products and service that generate sources of non-interest operating income, as well as the Company’s relatively small asset size combined with certain inherent fixed operating costs are viewed as factors that have contributed to the Company’s maintenance of relatively high
| RP® Financial, LC. | OVERVIEW AND FINANCIAL ANALYSIS |
| | I.4 |
operating expense ratios. Non-interest operating income has been a moderate contributor to the Company’s earnings, while loan loss provisions have been a minor factor in the Company’s earnings during the past five and one-half fiscal years. Non-operating gains and losses have consisted substantially of gains and losses on swap agreements, which have been a fairly significant factor in the Company’s earnings over the past five and one-half fiscal years.
A key component of the Company’s business plan is to complete a second-step conversion offering. The Company’s strengthened capital position will increase operating flexibility and facilitate implementation of planned growth strategies. Additionally, in the near term, the second-step offering will serve to increase regulatory capital and strengthen liquidity, which were reduced in connection with the cash acquisition of Citizens Bank. The Company’s strengthened capital position will provide more of a cushion against potential credit quality related losses that may be incurred during an economic slowdown. Gouverneur Bancorp’s higher capital position resulting from the infusion of stock proceeds will also serve to reduce interest rate risk, particularly through enhancing the Company’s interest-earning assets/interest-bearing liabilities (“IEA/IBL”) ratio. The additional funds realized from the stock offering will serve to raise the level of interest-earning assets funded with equity and, thereby, reduce the ratio of interest-earning assets funded with interest-bearing liabilities as the balance of interest-bearing liabilities will initially remain relatively unchanged following the conversion, which may facilitate a reduction in Gouverneur Bancorp’s funding costs. Gouverneur Bancorp’s strengthened capital position will position the Company to pursue additional expansion opportunities. Such expansion could potentially include establishing loan production offices, branch offices and/or acquiring branch offices to gain a market presence in nearby markets that are complementary to the Company’s existing branch network.
The additional capital raised in the second-step offering will also better position the Company to continue to make additional investments in its information technology infrastructure and to attract and retain executive management. Effective April 14, 2023, the Company’s previous longtime President and Chief Executive Officer and current member of the Company’s board of directors, was appointed to assume the duties of President and Chief Executive Officer on an interim basis while the Company undertakes a search for a permanent replacement for the Company’sr former President and Chief Executive Officer, who resigned effective as of that same date. The Company is currently working with a third party executive search firm to find its next President and Chief Executive Officer, but currently expects that the interim President and
| RP® Financial, LC. | OVERVIEW AND FINANCIAL ANALYSIS |
| | I.5 |
Chief Executive Officer will continue to serve in that position until a new President and Chief Executive Officer has been hired.
The projected uses of proceeds are highlighted below.
| · | Gouverneur Bancorp. The Company is expected to retain up to 50% of the net offering proceeds. At present, funds at the Company level, net of the loan to the ESOP, are expected to be primarily invested initially into liquid funds, some of which may be held as a deposit at the Bank. Over time, the funds may be utilized for various corporate purposes, possibly including acquisitions, infusing additional equity into the Bank, repurchases of common stock and the payment of cash dividends. |
| · | Gouverneur Savings. Approximately 50% of the net stock proceeds will be infused into the Bank in exchange for all of the Bank’s stock. Cash proceeds (i.e., net proceeds less deposits withdrawn to fund stock purchases) infused into the Bank are anticipated to become part of general operating funds. |
Overall, it is the Company’s objective to pursue growth that will serve to increase returns, while, at the same time, growth will not be pursued that could potentially compromise the overall risk associated with Gouverneur Bancorp’s operations.
Balance Sheet Trends
Table 1.1 shows the Company’s historical balance sheet data for the past five and one-half fiscal years. Since fiscal yearend 2018, the Company’s assets ranged from a low of $125.3 million at fiscal yearend 2019 to a high of $213.0 million at fiscal yearend 2022 and equaled $205.2 million at March 31, 2023. The substantial portion of the Company’s asset growth since fiscal yearend 2018 was realized during fiscal year 2022, as the result of the Citizen Bank acquisition. Overall, assets increased at an annual rate of 10.33% from fiscal yearend 2018 through March 31, 2023. Asset growth primarily consisted of loans and investment securities and was mostly funded by deposit growth, in which most of the growth consisted of the loans, investment securities and deposits acquired with the acquisition of Citizens Bank. A summary of Gouverneur Bancorp’s key operating ratios for the past five and one-half fiscal years is presented in Exhibit I-3.
Gouverneur Bancorp’s loans receivable portfolio increased at a 6.02% annual rate from fiscal yearend 2018 through March 31, 2023, with all of the loan growth occurring during fiscal year 2022 in connection with the Citizens Bank acquisition. The Company’s comparatively stronger asset growth relative to loan growth provided for a decrease in the loans-to-assets ratio from 72.54% at fiscal yearend 2018 to 60.62% at March 31, 2023.
| RP® Financial, LC. | OVERVIEW AND FINANCIAL ANALYSIS |
| | I.6 |
Table 1.1
Gouverneur Bancorp, Inc.
Historical Balance Sheet Data
| | | | | | | | | | | | | | | | | | | | | | | | | | | | | | | | | | | | | | | 9/30/18- | |
| | | | | | | | | | | | | | | | | | | | | | | | | | | | | | | | | | | | | | | 3/31/23 | |
| | | At September 30, | | | At March 31, | | | Annual
Growth | |
| | | 2018 | | | 2019 | | | 2020 | | | 2021 | | | 2022 | | | 2023 | | | Rate | |
| | | Amount | | | Pct(1) | | | Amount | | | Pct(1) | | | Amount | | | Pct(1) | | | Amount | | | Pct(1) | | | Amount | | | Pct(1) | | | Amount | | | Pct(1) | | | Pct | |
| | | ($000) | | | (%) | | | ($000) | | | (%) | | | ($000) | | | (%) | | | ($000) | | | (%) | | | ($000) | | | (%) | | | ($000) | | | (%) | | | (%) | |
| Total Amount of: | | | | | | | | | | | | | | | | | | | | | | | | | | | | | | | | | | | | | | | | | | | | | | | | | | | | |
| Assets | | $ | 131,831 | | | | 100.00 | % | | $ | 125,268 | | | | 100.00 | % | | $ | 129,261 | | | | 100.00 | % | | $ | 134,922 | | | | 100.00 | % | | $ | 213,019 | | | | 100.00 | % | | $ | 205,196 | | | | 100.00 | % | | | 10.33 | % |
| Cash , cash equivalents and time deposits | | | 6,547 | | | | 4.97 | % | | | 3,701 | | | | 2.95 | % | | | 7,810 | | | | 6.04 | % | | | 11,049 | | | | 8.19 | % | | | 15,062 | | | | 7.07 | % | | | 8,452 | | | | 4.12 | % | | | 5.84 | % |
| Investment securities | | | 15,627 | | | | 11.85 | % | | | 17,070 | | | | 13.63 | % | | | 20,458 | | | | 15.83 | % | | | 24,616 | | | | 18.24 | % | | | 49,646 | | | | 23.31 | % | | | 49,448 | | | | 24.10 | % | | | 29.17 | % |
| Loans held for sale | | | - | | | | 0.00 | % | | | - | | | | 0.00 | % | | | - | | | | 0.00 | % | | | 200 | | | | 0.15 | % | | | - | | | | 0.00 | % | | | - | | | | 0.00 | % | | | NM | |
| Loans receivable, net | | | 95,629 | | | | 72.54 | % | | | 90,705 | | | | 72.41 | % | | | 86,876 | | | | 67.21 | % | | | 86,147 | | | | 63.85 | % | | | 125,111 | | | | 58.73 | % | | | 124,395 | | | | 60.62 | % | | | 6.02 | % |
| FHLB/ACBB stock | | | 946 | | | | 0.72 | % | | | 891 | | | | 0.71 | % | | | 698 | | | | 0.54 | % | | | 770 | | | | 0.57 | % | | | 895 | | | | 0.42 | % | | | 1,277 | | | | 0.62 | % | | | 6.89 | % |
| Bank-owned life insurance | | | 6,242 | | | | 4.73 | % | | | 6,778 | | | | 5.41 | % | | | 6,921 | | | | 5.35 | % | | | 6,704 | | | | 4.97 | % | | | 6,841 | | | | 3.21 | % | | | 6,911 | | | | 3.37 | % | | | 2.29 | % |
| Goodwill and other intangible assets | | | - | | | | 0.00 | % | | | - | | | | 0.00 | % | | | - | | | | 0.00 | % | | | - | | | | 0.00 | % | | | 6,498 | | | | 3.05 | % | | | 6,267 | | | | 3.05 | % | | | NM | |
| | | | | | | | | | | | | | | | | | | | | | | | | | | | | | | | | | | | | | | | | | | | | | | | | | | | | |
| Deposits | | $ | 84,621 | | | | 64.19 | % | | $ | 79,284 | | | | 63.29 | % | | $ | 91,157 | | | | 70.52 | % | | $ | 100,754 | | | | 74.68 | % | | $ | 183,951 | | | | 86.35 | % | | $ | 165,896 | | | | 80.85 | % | | | 16.14 | % |
| Borrowings | | | 12,000 | | | | 9.10 | % | | | 10,000 | | | | 7.98 | % | | | 3,000 | | | | 2.32 | % | | | - | | | | 0.00 | % | | | - | | | | 0.00 | % | | | 8,900 | | | | 4.34 | % | | | -6.43 | % |
| | | | | | | | | | | | | | | | | | | | | | | | | | | | | | | | | | | | | | | | | | | | | | | | | | | | | |
| Equity | | $ | 29,975 | | | | 22.74 | % | | $ | 29,452 | | | | 23.51 | % | | $ | 26,629 | | | | 20.60 | % | | $ | 27,402 | | | | 20.31 | % | | $ | 24,829 | | | | 11.66 | % | | $ | 26,339 | | | | 12.84 | % | | | -2.83 | % |
| Tangible equity | | | 29,975 | | | | 22.74 | % | | | 29,452 | | | | 23.51 | % | | | 26,629 | | | | 20.60 | % | | | 27,402 | | | | 20.31 | % | | | 18,331 | | | | 8.61 | % | | | 20,072 | | | | 9.78 | % | | | -8.53 | % |
| | | | | | | | | | | | | | | | | | | | | | | | | | | | | | | | | | | | | | | | | | | | | | | | | | | | | |
| Loans/Deposits | | | | | | | 113.01 | % | | | | | | | 114.41 | % | | | | | | | 95.30 | % | | | | | | | 85.50 | % | | | | | | | 68.01 | % | | | | | | | 74.98 | % | | | | |
| | | | | | | | | | | | | | | | | | | | | | | | | | | | | | | | | | | | | | | | | | | | | | | | | | | | | |
| Number of Full Service Offices | | | | | | | 2 | | | | | | | | 2 | | | | | | | | 2 | | | | | | | | 2 | | | | | | | | 5 | | | | | | | | 5 | | | | | |
(1) Ratios are as a percent of ending assets.
Sources: Gouverneur Bancorp's prospectus, audited financial statements, and RP Financial calculations.
| RP® Financial, LC. | OVERVIEW AND FINANCIAL ANALYSIS |
| | I.7 |
Most of the loans acquired in the Citizens Bank acquisition consisted of 1-4 family permanent mortgage loans and such loans comprise the largest concentration of Company’s loan portfolio. The balance of loans acquired in the Citizens Bank acquisition was concentrated in commercial real estate loans followed by construction loans, consumer loans and commercial business loans. Trends in the Bank’s loan portfolio composition over the past two and one-half fiscal years show that the concentration of 1-4 family permanent mortgage loans comprising total loans remained stable, equaling 79.61% and 79.56% of total loans at fiscal yearend 2021 and at March 31, 2023, respectively. Similarly, there was essentially no change in the concentration of commercial real estate loans, equaling 9.58% and 9.57% of total loans at fiscal yearend 2021 and at March 31, 2023, respectively. Over the same time period, the relative concentrations of construction loans increased from 1.90% to 3.20% of total loans, consumer loans increased from 3.50% to 4.45% of total loans, and commercial business loans decreased from 1.72% to 1.50% of total loans. Loans held for sale decreased from 0.23% of total loans at fiscal yearend 2021 to a zero balance at March 31, 2023.
The intent of the Company’s investment policy is to provide adequate liquidity and to generate a favorable return within the context of supporting overall credit and interest rate risk objectives. It is anticipated that proceeds retained at the holding company level will initially be primarily invested into liquid funds, some of which may be held as a deposit at the Bank. Since fiscal yearend 2018, the Company’s level of cash and investment securities (inclusive of FHLB stock) ranged from a low of 17.29% of assets at fiscal yearend 2019 to a high of 30.80% of assets at fiscal yearend 2022. As of March 31, 2023, the Company held investment securities totaling $49.4 million or 24.10% of assets. Municipal bonds totaling $22.0 million comprised the most significant component of the Company’s investment portfolio at March 31, 2023. Other investments held by the Company at March 31, 2023 consisted of U.S. Government agencies ($12.0 million), mortgage-backed securities ($8.6 million), U.S. Treasury securities ($4.2 million) and SBA securities ($2.7 million). As of March 31, 2023, except for $1,000 of mortgage-backed securities, the entire investment portfolio was maintained as available for sale and had a net unrealized loss of $2.6 million. Exhibit I-4 provides historical detail of the Company’s investment portfolio. As of March 31, 2023, the Company also held $8.5 million of cash and cash equivalents and $1.3 million of FHLB/ACBB stock.
The Company also maintains an investment in bank-owned life insurance (“BOLI”) policies, which covers the lives of certain employees and executive officers of the Company. The life insurance policies earn tax-exempt income through cash value accumulation and death
| RP® Financial, LC. | OVERVIEW AND FINANCIAL ANALYSIS |
| | I.8 |
proceeds. As of March 31, 2023, the cash surrender value of the Company’s BOLI equaled $6.9 million or 3.37% of assets.
Gouverneur Bancorp’s funding needs have been addressed through a combination of deposits, borrowings and internal cash flows. From fiscal yearend 2018 through March 31, 2023, the Company’s deposits increased at a 16.14% annual rate. Most of the Company’s deposit growth was realized during fiscal year 2022, pursuant to the acquisition of Citizens Bank. The acquisition of Citizens Bank served to increase the concentration of core deposits that comprise total deposits; however, for the six months ended March 31, 2023, the Company experienced deposit run-off of transaction and savings account deposits. Core deposits equaled 86.26% of total deposits at March 31, 2023, versus 83.93% of total deposits at September 30, 2021.
Borrowings serve as an alternative funding source for the Company to address funding needs for growth and to support management of deposit costs and interest rate risk, in which the Company’s utilization of borrowings over the past five and one-half fiscal years has consisted of FHLB advances. Over the five-and one-half year period covered in Table 1.1, borrowings ranged from a zero balance at fiscal year ends 2021 and 2022 to $12.0 million or 9.10% of assets at fiscal yearend 2018 and equaled $8.9 million or 4.34% of assets at March 31, 2023.
The Company’s equity decreased at a 2.83% annual rate from fiscal yearend 2018 through March 31, 2023, which was mostly due to the reductions in equity that were recorded during fiscal years 2020 and 2022. The decline in equity during fiscal year 2020 was largely due to stock repurchases, while an increase in the accumulated other comprehensive loss related to unrealized losses maintained on the available for sale securities portfolio accounted for the reduction in equity during fiscal year 2022. Over the five and one-half year period, asset growth combined with a decline in equity provided for a decrease in the Company’s equity-to-assets ratio from 22.74% at fiscal yearend 2018 to 12.84% at March 31, 2023. Comparatively, as the result of the goodwill and intangibles created from the acquisition of Citizen Bank, the Company’s tangible equity-to-assets ratio decreased from 22.74% at fiscal yearend 2018 to 9.78% at March 31, 2023. Goodwill and other intangibles totaled $6.3 million or 3.05% of assets at March 31, 2023. The Bank maintained capital surpluses relative to all of its regulatory capital requirements at March 31, 2023. The addition of stock proceeds will serve to strengthen
| RP® Financial, LC. | OVERVIEW AND FINANCIAL ANALYSIS |
| | I.9 |
the Company’s capital position, as well as support growth opportunities. At the same time, the increase in Gouverneur Bancorp’s pro forma capital position will initially depress its ROE.
Income and Expense Trends
Table 1.2 shows the Company’s historical income statements for the fiscal years ended September 30, 2018 through September 30, 2022 and for the twelve months ended March 31, 2023. During the period covered in Table 1.2, the Company’s reported earnings from a net loss of $464,000 or 0.36% of average assets during fiscal year 2019 to a high of net income of $1.5 million or 1.16% of average assets during fiscal year 2022. For the twelve months ended March 31, 2023, the Company reported net income of $740,000 or 0.43% of average assets. Net interest income and operating expenses represent the primary components of the Company’s earnings, while non-interest operating income has been a moderate contributor to the Company’s earnings. Loan loss provisions have typically been a relatively minor factor in the Company’s earnings throughout the past five fiscal years, while non-operating income and losses resulting from gains on losses on swap agreements have had a notable impact on the Company’s earnings throughout the past five and one-half fiscal years.
For the period covered in Table 1.2, the Company’s net interest income to average assets ratio ranged from a low of 3.19% during fiscal year 2022 to a high of 3.98% during fiscal year 2018 and equaled 3.65% during the twelve months ended March 31, 2023. The downward trend in the Company’s net interest income ratio from fiscal year 2018 through fiscal year 2021 was largely due to a narrowing of its net interest rate spread, which was mostly the result of a more significant decrease in the yield earned on interest-earning assets relative to the cost of interest-bearing liabilities. Factors contributing to the more significant decline in yield earned on interest-earning assets included a shift in the Company’s interest-earning asset composition toward a higher concentration of lower yielding cash and investments, as well as the refinancing of residential mortgages into lower rate loans pursuant to the decline in market rates for 1-4 family loans. Comparatively, the increase in the net interest income ratio during fiscal year 2022 and for the twelve months ended March 31, 2023 was facilitated by higher interest rate spreads, as the result of lower funding costs and an increase in the average yield earned on interest-earning asset during the six months ended March 31, 2023 compared to the year ago period. The reduction in funding costs was primarily due to an increase in interest income earned on swap agreements hedged against certain borrowings and deposits. During the past two and one- half fiscal years, the Company’s interest rate spread ranged from a low of 3.40% during the
| RP® Financial, LC. | OVERVIEW AND FINANCIAL ANALYSIS |
| | I.10 |
Table 1.2
Gouverneur Bancorp, Inc.
Historical Income Statements
| | | For the Fiscal Year Ended September 30, | | | For the 12 Months | |
| | | 2018 | | | 2019 | | | 2020 | | | 2021 | | | 2022 | | | Ended 3/31/2023 | |
| | | Amount | | | Pct(1) | | | Amount | | | Pct(1) | | | Amount | | | Pct(1) | | | Amount | | | Pct(1) | | | Amount | | | Pct(1) | | | Amount | | | Pct(1) | |
| | | ($000) | | | (%) | | | ($000) | | | (%) | | | ($000) | | | (%) | | | ($000) | | | (%) | | | ($000) | | | (%) | | | ($000) | | | (%) | |
| Interest income | | $ | 5,725 | | | | 4.37 | % | | $ | 5,623 | | | | 4.38 | % | | $ | 5,012 | | | | 3.88 | % | | $ | 4,467 | | | | 3.47 | % | | $ | 4,547 | | | | 3.45 | % | | $ | 6,419 | | | | 3.77 | % |
| Interest expense | | | (516 | ) | | | -0.39 | % | | | (581 | ) | | | -0.45 | % | | | (522 | ) | | | -0.40 | % | | | (365 | ) | | | -0.28 | % | | | (268 | ) | | | -0.20 | % | | | (209 | ) | | | -0.12 | % |
| Net interest income | | $ | 5,209 | | | | 3.98 | % | | $ | 5,042 | | | | 3.93 | % | | $ | 4,490 | | | | 3.48 | % | | $ | 4,102 | | | | 3.19 | % | | $ | 4,279 | | | | 3.24 | % | | $ | 6,210 | | | | 3.65 | % |
| Provision for loan losses | | | (65 | ) | | | -0.05 | % | | | (70 | ) | | | -0.05 | % | | | (58 | ) | | | -0.04 | % | | | (18 | ) | | | -0.01 | % | | | (61 | ) | | | -0.05 | % | | | (92 | ) | | | -0.05 | % |
| Net interest income after provisions | | $ | 5,144 | | | | 3.93 | % | | $ | 4,972 | | | | 3.87 | % | | $ | 4,432 | | | | 3.43 | % | | $ | 4,084 | | | | 3.17 | % | | $ | 4,218 | | | | 3.20 | % | | $ | 6,118 | | | | 3.59 | % |
| | | | | | | | | | | | | | | | | | | | | | | | | | | | | | | | | | | | | | | | | | | | | | | | | |
| Non-interest operating income | | $ | 776 | | | | 0.59 | % | | $ | 716 | | | | 0.56 | % | | $ | 766 | | | | 0.59 | % | | $ | 963 | | | | 0.75 | % | | $ | 623 | | | | 0.47 | % | | $ | 739 | | | | 0.43 | % |
| Mortgage banking earnings | | | 39 | | | | 0.03 | % | | | 38 | | | | 0.03 | % | | | 76 | | | | 0.06 | % | | | 142 | | | | 0.11 | % | | | 24 | | | | 0.02 | % | | | 10 | | | | 0.01 | % |
| Operating expense | | | (4,674 | ) | | | -3.57 | % | | | (4,794 | ) | | | -3.74 | % | | | (4,879 | ) | | | -3.78 | % | | | (5,007 | ) | | | -3.89 | % | | | (4,546 | ) | | | -3.44 | % | | | (5,953 | ) | | | -3.49 | % |
| Net operating income | | $ | 1,285 | | | | 0.98 | % | | $ | 932 | | | | 0.73 | % | | $ | 395 | | | | 0.31 | % | | $ | 182 | | | | 0.14 | % | | $ | 319 | | | | 0.24 | % | | $ | 914 | | | | 0.54 | % |
| | | | | | | | | | | | | | | | | | | | | | | | | | | | | | | | | | | | | | | | | | | | | | | | | |
| Non-Operating Income/(Losses) | | | | | | | | | | | | | | | | | | | | | | | | | | | | | | | | | | | | | | | | | | | | | | | | |
| Gain (loss) on swap agreements | | $ | 747 | | | | 0.57 | % | | $ | (1,765 | ) | | | -1.38 | % | | $ | (1,062 | ) | | | -0.82 | % | | $ | 943 | | | | 0.73 | % | | $ | 2,158 | | | | 1.64 | % | | $ | 896 | | | | 0.53 | % |
| Gains on sales of securities | | | 34 | | | | 0.03 | % | | | 89 | | | | 0.07 | % | | | 29 | | | | 0.02 | % | | | 45 | | | | 0.03 | % | | | - | | | | 0.00 | % | | | (661 | ) | | | -0.39 | % |
| Merger expenses | | | - | | | | 0.00 | % | | | - | | | | 0.00 | % | | | - | | | | 0.00 | % | | | - | | | | 0.00 | % | | | (558 | ) | | | -0.42 | % | | | (270 | ) | | | -0.16 | % |
| Net non-operating income(losses) | | $ | 781 | | | | 0.60 | % | | $ | (1,676 | ) | | | -1.31 | % | | $ | (1,033 | ) | | | -0.80 | % | | $ | 988 | | | | 0.77 | % | | $ | 1,600 | | | | 1.21 | % | | $ | (35 | ) | | | -0.02 | % |
| | | | | | | | | | | | | | | | | | | | | | | | | | | | | | | | | | | | | | | | | | | | | | | | | |
| Net income before tax | | $ | 2,066 | | | | 1.58 | % | | $ | (744 | ) | | | -0.58 | % | | $ | (638 | ) | | | -0.49 | % | | $ | 1,170 | | | | 0.91 | % | | $ | 1,919 | | | | 1.45 | % | | $ | 879 | | | | 0.52 | % |
| Income tax provision | | | (880 | ) | | | -0.67 | % | | | 280 | | | | 0.22 | % | | | 257 | | | | 0.20 | % | | | 86 | | | | 0.07 | % | | | (392 | ) | | | -0.30 | % | | | (139 | ) | | | -0.08 | % |
| Net income (loss) | | $ | 1,186 | | | | 0.91 | % | | $ | (464 | ) | | | -0.36 | % | | $ | (381 | ) | | | -0.30 | % | | $ | 1,256 | | | | 0.98 | % | | $ | 1,527 | | | | 1.16 | % | | $ | 740 | | | | 0.43 | % |
| | | | | | | | | | | | | | | | | | | | | | | | | | | | | | | | | | | | | | | | | | | | | | | | | |
| Adjusted Earnings | | | | | | | | | | | | | | | | | | | | | | | | | | | | | | | | | | | | | | | | | | | | | | | | |
| Net income | | $ | 1,186 | | | | 0.91 | % | | $ | (464 | ) | | | -0.36 | % | | $ | (381 | ) | | | -0.30 | % | | $ | 1,256 | | | | 0.98 | % | | $ | 1,527 | | | | 1.16 | % | | $ | 740 | | | | 0.43 | % |
| Add(Deduct): Non-operating income | | | (781 | ) | | | -0.60 | % | | | 1,676 | | | | 1.31 | % | | | 1,033 | | | | 0.80 | % | | | (988 | ) | | | -0.77 | % | | | (1,600 | ) | | | -1.21 | % | | | 35 | | | | 0.02 | % |
| Tax effect (2) | | | 164 | | | | 0.13 | % | | | (352 | ) | | | -0.27 | % | | | (217 | ) | | | -0.17 | % | | | 207 | | | | 0.16 | % | | | 336 | | | | 0.25 | % | | | (7 | ) | | | 0.00 | % |
| Adjusted earnings | | $ | 569 | | | | 0.43 | % | | $ | 860 | | | | 0.67 | % | | $ | 435 | | | | 0.34 | % | | $ | 475 | | | | 0.37 | % | | $ | 263 | | | | 0.20 | % | | $ | 768 | | | | 0.45 | % |
| | | | | | | | | | | | | | | | | | | | | | | | | | | | | | | | | | | | | | | | | | | | | | | | | |
| Expense Coverage Ratio (3) | | | 1.11 | x | | | | | | | 1.05 | x | | | | | | | 0.92 | x | | | | | | | 0.82 | x | | | | | | | 0.94 | x | | | | | | | 1.05 | x | | | | |
| Efficiency Ratio (4) | | | 77.61 | % | | | | | | | 82.74 | % | | | | | | | 91.53 | % | | | | | | | 96.05 | % | | | | | | | 92.23 | % | | | | | | | 85.33 | % | | | | |
| (1) | Ratios are as a percent of average assets. |
| (2) | Assumes a 21.0% effective tax rate. |
| (3) | Expense coverage ratio calculated as net interest income before provisions for loan losses divided by operating expenses. |
| (4) | Efficiency ratio calculated as operating expenses divided by the sum of net interest income before provisions for loan losses plus non-interest operating income. |
Sources: Gouverneur Bancorp's prospectus, audited financial statements and RP Financial calculations.
| RP® Financial, LC. | OVERVIEW AND FINANCIAL ANALYSIS |
| | I.11 |
six months ended March 31, 2022 to a high of 4.30% during the six months March 31, 2023. Historical trends in the Company’s net interest margin and interest spreads are set forth in Exhibit I-3 and Exhibit I-5.
Non-interest operating income has been a fairly stable contributor to the Company’s earnings over the past five and one-half fiscal years. Throughout the period shown in Table 1.2, sources of non-interest operating income ranged from a low of $815,000 or 0.62% of average assets during fiscal year 2018 to a high of $1.1 million or 0.86% of average assets during fiscal year 2021 and equaled $749,000 or 0.44% of average assets during the twelve months ended March 31, 2023. Fees and service charges, mortgage banking earnings and income earned on BOLI constitute the major sources of the Company’s non-interest operating revenues.
Operating expenses represent the other major component of the Bank’s earnings, ranging from a low of $4.5 million or 3.44% of average assets during fiscal year 2022 to a high of $6.0 million or 3.49% of average assets during the twelve months ended March 31, 2023. Assets added in connection with the acquisition of Citizens Bank provided for leveraging of the Company’s operating expense ratio during fiscal year 2022 and for twelve months ended March 31, 2023, as the Company’s operating expense ratio decreased from 3.89% during fiscal year 2021 to 3.44% during fiscal year 2022 and then increased slightly to 3.49% for the twelve months ended March 31, 2023.
Overall, the general trends in the Company’s net interest income ratio and operating expense ratio showed a slight decline in core earnings, as indicated by the Company’s expense coverage ratios (net interest income divided by operating expenses). Gouverneur Bancorp’s expense coverage ratio equaled 1.11 times during fiscal year 2018, versus a ratio of 1.05 times during the twelve months ended March 31, 2023. However, it is noteworthy that the Company’s expense coverage ratio trended higher over the past one and one-half fiscal years after reaching a low of 0.82x times during fiscal year 2021. Similarly, Gouverneur Bancorp’s efficiency ratio (operating expenses as a percent of the sum of net interest income and other operating income) of 77.61% during fiscal year 2018 was more favorable compared to its efficiency ratio of 85.33% during the twelve months ended March 31, 2023, although the Company’s efficiency ratio showed a favorable downward trend since reaching a high of 96.05% during fiscal year 2021.
Over the past five and one-half fiscal years, maintenance of favorable credit quality measures has served to limit the impact of loan loss provisions on the Company’s earnings.
| RP® Financial, LC. | OVERVIEW AND FINANCIAL ANALYSIS |
| | I.12 |
During the period covered in Table 1.2, the amount of loan loss provisions recorded by the Company ranged from $18,000 or 0.01% of average assets during fiscal year 2021 to $92,000 or 0.05% of average assets during the twelve months ended March 31, 2023. As of March 31, 2023, the Company maintained valuation allowances of $675,000, equal to 0.54% of total loans and 79.88% of non-performing loans. As of March 31, 2023, non-performing loans totaled $845,000 or 0.67% of total loans. After taking into account the $375,000 fair value credit adjustment applied to the loan portfolio of Citizens Bank, the Company’s reserve coverage ratios equaled 0.84% of total loans and 124.26% of non-performing loans. Exhibit I-6 sets forth the Company’s loan loss allowance activity during the past two and one-half fiscal years.
Non-operating income and losses have been a relevant factor in the Company’s earnings during the past five and one-half fiscal years, which was mostly related to gains and losses recorded on interest rate swap agreements. The Company’s fiscal year 2022 earnings and earnings for the twelve months ended March 31, 2023 were also impacted by non-operating merger related expenses, while earnings for the twelve months ended March 31, 2023 included a non-operating loss on the sale of investment securities. Overall, during the period covered in Table 1.2, net non-operating income and losses ranged from a loss of $1.7 million or 1.31% of average assets during fiscal year 2019 to non-operating income of $1.6 million or 1.21% of average assets during fiscal year 2022. For the twelve months ended March 31, 2023, the Company recorded a net non-operating loss of $35,000 or 0.02% of average assets. The net-non-operating loss for the twelve months ended March 31, 2023 consisted of an $896,000 gain on interest rate swap agreements, $270,000 of merger related expenses and a $661,000 loss on the sale of investment securities. Overall, the items that comprise the Company’s non-operating income and losses are not viewed to be part of the Company’s core or recurring earnings base.
The Company’s effective tax rate ranged from a benefit of 40.28% during fiscal year 2020 to an expense of 42.59% during fiscal year 2018 and equaled an expense of 15.81% during the twelve months ended March 31, 2023. As set forth in the prospectus, the Company’s marginal effective tax rate is 21.0%.
Interest Rate Risk Management
The Company pursues a number of strategies to manage interest rate risk, particularly with respect to seeking to limit the repricing mismatch between interest rate sensitive assets and liabilities. The Company manages interest rate risk from the asset side of the balance
| RP® Financial, LC. | OVERVIEW AND FINANCIAL ANALYSIS |
| | I.13 |
sheet through underwriting 1-4 family loans to conform to secondary market standards that facilitates the sale of longer term 1-4 family fixed rate loan originations as warranted, maintaining the investment portfolio as available for sale and lending diversification into other types of lending beyond 1-4 family permanent mortgage loans which consist primarily of adjustable rate or shorter term fixed rate loans. As of March 31, 2023, of the Company’s total loans due after March 31, 2024, adjustable rate loans comprised 28.57% of those loans (see Exhibit I-7). On the liability side of the balance sheet, management of interest rate risk has been primarily pursued through emphasizing growth of lower costing and less interest rate sensitive transaction and savings account deposits and extending CD maturities through offering attractive rates on certain longer terms CDs.
As part of the Company’s management of interest rate risk, it has entered into interest rate swap agreements whereby it pays a fixed rate and receives a variable rate on the notional amount. As of March 31, 2023, the notional amount of interest rate swaps held by the Company consisted of $7.0 million of interest rate swaps on FHLB advances and Bank deposits.
The Company’s interest rate risk analysis as of March 31, 2023 indicates that in the event of a 200 basis point increase in the United States Treasury yield curve, assuming a parallel and immediate shift across the yield curve over such period, net interest income would decrease by 2.3% over a one year period and economic value of equity would decrease by 14.4% (see Exhibit I-8).
The infusion of stock proceeds will serve to further limit the Company’s interest rate risk exposure, as most of the net proceeds will be redeployed into interest-earning assets and the increase in the Company’s capital position will lessen the proportion of interest rate sensitive liabilities funding assets.
Lending Activities and Strategy
Gouverneur Bancorp’s lending activities have emphasized 1-4 family permanent mortgage loans and such loans comprise the major portion of the Company’s loan portfolio. Beyond 1-4 family loans, lending diversification by the Company consists of a mix of commercial real estate loans, construction loans, consumer loans, home equity loans and lines of credit and commercial business loans. Pursuant to the Company’s strategic plan, the Company is pursuing a lending strategy that will continue to emphasize origination of 1-4 family loans that will be supplemented with diversification into higher yielding types of loans. Exhibit I-9 provides
| RP® Financial, LC. | OVERVIEW AND FINANCIAL ANALYSIS |
| | I.14 |
historical detail of Gouverneur Bancorp’s loan portfolio composition over the past two and one-half fiscal years and Exhibit I-10 provides the contractual maturity of the Company’ss loan portfolio by loan type as of March 31, 2023.
1-4 Family Residential Real Estate Loans. Gouverneur Bancorp offers both fixed rate and ARM 1-4 family permanent mortgage loans with terms of up to 30 years. Loans are generally underwritten to secondary market guidelines, so as to provide the Company with the flexibility to sell the loans into the secondary market for purposes of managing interest rate risk. The Bank’s current practice is to sell loans on a servicing retained basis. ARM loans offered by the Company have initial repricing terms of one, five or ten years and then reprice annually for the balance of the loan term. ARM loans are indexed to the one-year Constant Maturity U.S. Treasury indices. As of March 31, 2023, the Company’s outstanding balance of 1-4 family residential real estate loans totaled $100.0 million equal to 79.56% of total loans outstanding.
Commercial Real Estate and Multi-family Loans Commercial real estate and multi-family loans consist substantially of loans originated by the Company, which are generally collateralized by properties in the Company’s regional lending area. On a limited basis, Gouverneur Bancorp supplements originations of commercial real estate and multi-family loans with purchased loan participations from local banks. Loan participations are subject to the same underwriting criteria and loan approvals as applied to loans originated by Gouverneur Bancorp. Gouverneur Bancorp generally originates commercial real estate and multi-family loans up to a loan-to-value (“LTV”) ratio of 70%. Commercial real estate and multi-family loans are generally originated as adjustable rate loans with amortization terms of up to 20 years. Adjustable rate loans reprice every one, five or ten years and are indexed to the prime rate as published in The Wall Street Journal. Properties securing the commercial real estate and multi-family loan portfolio include office buildings, retail and mixed-use properties, apartment buildings and owner occupied properties used for businesses. As of March 31, 2023, Gouverneur Bancorp’s outstanding balance of commercial real estate and multi-family loans totaled $12.0 million equal to 9.57% of total loans outstanding.
Home Equity Loans and Lines of Credit. The Company’s 1-4 family lending activities include home equity loans and lines of credit. Home equity loans and lines of credit are originated for terms up to 20 years and are indexed to the prime rate as published in The Wall Street Journal. The Company will originate home equity loans and lines of credit up to a maximum loan-to value (“LTV”) ratio of 80%, inclusive of other liens on the property. As of
| RP® Financial, LC. | OVERVIEW AND FINANCIAL ANALYSIS |
| | I.15 |
March 31, 2023, the Company’s outstanding balance of home equity loans and lines of credit totaled $2.2 million equal to 1.72% of total loans outstanding.
Construction and Land Loans. Construction loans originated by the Company consist substantially of loans to individuals that finance the construction of residential dwellings for personal use. Residential construction loans are originated as interest-only loans during the construction phase, which is typically up to twelve months. At the end of the construction phase, the loan generally converts to a permanent mortgage loan or the loan may be paid in full. Residential construction loans are generally originated up to a maximum LTV ratio of 80% of the appraised market value. Commercial construction loans are generally originated up to a maximum LTV ratio of 70% of the appraised market value. Land loans consist of approved residential building lots acquired for personal use and are extended up to a maximum LTV ratio of 65.0% with terms of up to 15 years. As of March 31, 2023, Gouverneur Bancorp’s outstanding balance of construction and land loans equaled $4.0 million or 3.20% of total loans outstanding.
Commercial Business Loans. The commercial business loan portfolio is generated through extending loans to small businesses operating in the local market area. Commercial business loans offered by the Company include operating lines of credit secured by general business assets and equipment. Operating lines of credit are generally floating rate loans indexed to the prime rate as published in The Wall Street Journal. Equipment loans are typically fixed rate loans with terms of up to five years. As of March 31, 2023, the Company’s outstanding balance of commercial business loans totaled $1.9 million equal to 1.50% of total loans outstanding.
Consumer Loans. Consumer lending other than home equity loans and lines of credit consists substantially of automobile loans and other installment loans, with the balance of the portfolio consisting of a limited amount of personal secured and unsecured loans. As of March 31, 2023, the Company held $5.6 million of consumer loans equal to 4.45% of total loans outstanding.
Asset Quality
The Company experienced a slight upward trend in non-performing assets since fiscal yearend 2021, which was primarily due to an increase in non-performing 1-4 family loans and was partially offset by a decrease in real estate owned (“REO”). Over the past two and one-half
| RP® Financial, LC. | OVERVIEW AND FINANCIAL ANALYSIS |
| | I.16 |
fiscal years, Gouverneur Bancorp’s balance of non-performing assets increased from $645,000 or 0.48% of assets at fiscal yearend 2021 to $903,000 or 0.44% of assets at March 31, 2023. As shown in Exhibit I-11, non-performing assets at March 31, 2023 consisted of $845,000 of non-accruing loans and $58,000 of REO. Non-accruing loans held by the Company at March 31, 2023 were concentrated in 1-4 family permanent mortgage loans totaling $740,000.
To track the Company’s asset quality and the adequacy of valuation allowances, the Company has established detailed asset classification policies and procedures which are consistent with regulatory guidelines. Classified assets are reviewed on a regular basis by senior management and the Board. Pursuant to these procedures, when needed, the Company establishes additional valuation allowances to cover anticipated losses in classified or non-classified assets. As of March 31, 2023, the Company maintained loan loss allowances of $675,000, equal to 0.54% of total loans outstanding and 79.88% of non-performing loans. After taking into account the $375,000 fair value credit adjustment applied to the loan portfolio of Citizens Bank, the Company’s reserve coverage ratios equaled 0.84% of total loans and 124.26% of non-performing loans.
Funding Composition and Strategy
Deposits have consistently served as the Company’s primary funding source and, as of March 31, 2023, deposits accounted for 94.91% of Gouverneur Bancorp’s combined balance of deposits and borrowings. Exhibit I-12 sets forth the Company’s deposit composition for the past two and one-half fiscal years. Transaction and savings account deposits constituted 86.26% of total deposits at March 31, 2023, as compared to 83.93% of total deposits at September 30, 2021. The increase in the concentration of core deposits comprising total deposits since fiscal yearend 2021 was the result of a more significant increase in core deposits relative to the increase in CDs, which was facilitated by the deposits acquired in connection with the acquisition of Citizens Bank. Since fiscal yearend 2021, savings account deposits were the largest source of core deposit growth for the Bank and savings account deposits comprise the largest concentration of the Company’s core deposits. As of March 31, 2023, savings account deposits totaled $74.0 million or 51.71% of core deposits. The balance of the Company’s deposits consists of CDs, which equaled 13.74% of total deposits at March 31, 2023 compared to 16.07% of total deposits at September 30, 2021. As of March 31, 2023, jumbo CDs (CD accounts with balances of $250,000 or more) amounted to $3.5 million or 15.14% of total CDs.
| RP® Financial, LC. | OVERVIEW AND FINANCIAL ANALYSIS |
| | I.17 |
Borrowings serve as an alternative funding source for the Company to facilitate management of funding costs and interest rate risk. FHLB advances have been the only source of borrowings utilized by the Company over the past five and one-half fiscal years. The Company maintained $8.9 million of short-term FHLB advances at March 31, 2023 with a weighted average interest rate of 4.93%.
Subsidiaries
The Company’s only subsidiary is Gouverneur Savings and Gouverneur Savings maintains one wholly-owned subsidiary, GS&L Municipal Bank. GS&L Municipal Bank, was formed in September 2022 as a New York chartered limited purpose commercial bank. GS&L Municipal Bank has the power to receive deposits only to the extent of accepting for deposit the funds of the State of New York and its respective agents, authorities and instrumentalities, and local governments as defined in Section 10(a)(1) of the New York General Municipal Law. GS&L Municipal Bank’s purpose is to attract deposits from local municipalities and, at March 31, 2023, GS&L Municipal Bank had $20.64 million in deposits. GS&L Municipal Bank is regulated by the New York State Department of Financial Services and the Federal Deposit Insurance Corporation.
Legal Proceedings
From time to time, the Company is involved in routine legal proceedings in the ordinary course of business. Such routine legal proceedings, in the aggregate, are believed by management to be immaterial to the Company’s financial condition, results of operations and cash flows.
| RP® Financial, LC. | MARKET AREA |
| | II.1 |
II. MARKET AREA
Introduction
Gouverneur Bancorp serves northern New York through five branch offices. One branch is located in St. Lawrence County and the remaining four branches are located in Jefferson County. Exhibit II-1 provides information on the Company’s office properties.
Future growth opportunities for Gouverneur Bancorp depend on the future growth and stability of the national and regional economy, demographic growth trends and the nature and intensity of the competitive environment. These factors have been examined to help determine the growth potential that exists for the Company, the relative economic health of the Company’s market area, and the resultant impact on value.
National Economic Factors
The future success of the Company’s operations is partially dependent upon various national and local economic trends. In assessing national economic trends over the past few quarters, manufacturing activity for July 2022 slowed to an index reading of 52.8. Comparatively, July service sector activity increased to a three-month high to an index reading of 56.7. The employment report for July showed stronger-than-expected job growth, as the U.S. economy added 528,000 jobs and the July unemployment rate fell to 3.5%. Retail sales for July were flat. July existing home sales marked the sixth straight month of declining sales with a decrease of 5.9%, which was the longest streak of declines in more than eight years. Rising prices and higher mortgage rates also depressed July new home sales, as July new home sales declined by 12.9%. August manufacturing activity was unchanged with an index reading of 52.8, while August service sector activity edged up to an index reading of 56.9. U.S. employers added 315,000 jobs in August and the August unemployment rate ticked up to 3.7%. Existing home sales declined for a seventh straight month in August, with a decline of 0.4%. Comparatively, new homes sales for August jumped 28.8%. September manufacturing activity slowed to an index reading of 50.9, while service sector activity for September was little changed with an index reading of 56.7. The U.S. economy added 263,000 jobs in September and the September unemployment rate fell to 3.5%. Existing and new home sales for September showed declines of 1.5% and 10.9%, respectively, as home sales were impacted by rising mortgage rates and affordability issues. Third quarter GDP increased at an annual rate of 2.6%.
| RP® Financial, LC. | MARKET AREA |
| | II.2 |
October 2022 manufacturing activity grew at its slowest pace in two and one-half years with an index reading of 50.2, while service sector activity for October slowed to an index reading of 54.4. U.S. employers added 261,000 jobs in October and the October unemployment rate increased to 3.7%. In a sign of economic strength, October retail sales rose 1.3%. Existing home sales for October declined 5.9%, which was the ninth straight month of declining sales. Comparatively, October new home sales increased 7.5%. Manufacturing activity contracted in November with an index reading of 49.0, while November service sector activity accelerated to an index reading of 56.5. The U.S. economy added 263,000 jobs in November and the November unemployment rate held steady at 3.7%. Existing home sales for November plunged 7.7%, which was the 10th straight month of declining sales. Conversely, new home sales for November increased 5.8%. Manufacturing activity for December contracted for a second straight month with an index reading of 48.4, while December service sector activity contracted for the first time since May 2020 with an index reading of 49.6. December employment data showed 223,000 were added and the unemployment rate declined to 3.5%. Retail sales for December posted their biggest decline in 2022, declining by 1.1%, and December existing home sales fell by 1.5%, which was a 12-year low. Comparatively, December new home sales increased 2.3%. Fourth quarter GDP increased at a 2.9% annualized rate (subsequently revised down to 2.7%).
January 2023 manufacturing activity showed further contraction with an index reading of 47.4, while service sector activity for January rebounded to an index reading of 55.2. January’s employment report showed stronger-than-expected job growth, as 517,000 jobs were added and the January unemployment rate dropped to 3.4%. Retail sales for January jumped 3.0%. Existing home sales for January fell for a 12th straight month, decreasing 0.7%. Conversely, January new home sales increased 7.2%. Manufacturing activity for February decreased for a fourth straight month with an index reading of 47.7, while February service sector activity slowed slightly to an index reading of 55.1. U.S. employers added 311,000 jobs in February and the February unemployment rate ticked up to 3.6% on a rise in labor force participation. A dip in home prices and slightly lower mortgage rates contributed to a 14.5% increase in existing home sales for February, while new home sales for February rose 1.1%. Manufacturing activity and service sector activity both slowed in March, with index readings of 46.3 and 51.2, respectively. Hiring gains moderated in March with U.S. employers adding 236,000 jobs, while the March unemployment rate ticked down to 3.5%. Existing home sales fell 2.4% in March, versus a 9.6% increase in March new home sales. First quarter GDP slowed to an annual growth rate of 1.1%.
| RP® Financial, LC. | MARKET AREA |
| | II.3 |
Manufacturing activity for April 2023 contracted for a sixth straight month with an index reading of 47.1. Comparatively, service sector activity for April picked-up slightly with an index reading of 51.9. The April employment report showed better-than-expected job growth, as U.S. employers added 253,000 jobs and the April unemployment rate dropped to 3.4%.
In terms of interest rates trends over the past few quarters, long-term Treasury yields continued to trend lower at the start of the third quarter of 2022 with the 10-year Treasury declining to 2.81% in early-July. After a strong employment report for June pushed the 10-year Treasury yield back above 3.0% at the close of the first full week of July, the 10-year Treasury yield edged back below 3.0% in mid-July on expectations that the Federal Reserve would continue to aggressively raise interest rates to bring inflation down. A 9.1% increase in the June CPI translated into the 10-year Treasury yield edging back above 3.0% going into the second half of July. Long-term Treasuries rallied at the end of July, with the 10-year Treasury yield falling below 2.7% as the Federal Reserve increased its target interest rate by 0.75% to a range of 2.25% to 2.5% and signaled more tightening was likely this year to combat 40-year high inflation. Data showing a pick-up in certain sectors of the economy, including strong job growth during July, pushed Treasury yields higher in the first week of August. While the pace of price increases slowed in July, the 8.5% increase in the July CPI pressured long-term Treasury yields slightly higher going into mid-August with the yield curve remaining inverted based on expectations that the Federal Reserve would continue to raise rates in an effort to tame inflation and the possibility that could lead to a deeper recession. Indications from Federal Reserve officials that it remained hawkish in its efforts to tame inflation pushed the 10-year Treasury yield above 3.0% in late-August. Driven by expectations of tighter Federal Reserve policy, Treasury yields continued to climb higher at the beginning of September. An 8.3% increase in the August CPI pushed the 10-year Treasury yield to 2022 highs in mid-September, while mortgage rates topped 6% for the first time since 2008. The Federal Reserve approved its third consecutive interest rate increase of 0.75% at its September policy meeting and indicated that additional large interest rate increases were likely. Following the rate hike, long-term Treasury yields edged higher in late-September and then declined slightly at the close of the third quarter.
At the start of the fourth quarter of 2022, long-term Treasury yields retreated slightly on data showing a slowdown in manufacturing activity. The 10-year Treasury yield trended above 4.0% through mid-October, as hopes faded for a less aggressive monetary policy by the Federal Reserve in light of the relatively strong jobs report for September and affirmation that inflation remained persistently high with an 8.2% increase in the September CPI. The upward trend in
| RP® Financial, LC. | MARKET AREA |
| | II.4 |
the 10-year Treasury yield continued heading into the last week of October, which was followed by the 10-year Treasury yield dipping slightly below 4.0% as third quarter GDP data showed signs of a broad slowdown in the U.S. economy. In advance of the Federal Reserve’s early- November meeting, the 10-year Treasury yield edged back up above 4.0% at the end of October on expectations that the Federal Reserve was poised to approve its fourth consecutive 0.75% rate increase. The upward trend in long-term Treasury yields continued through early-November, as the Federal Reserve lifted its target rate by another 0.75% to combat inflation and signaled plans to keep raising rates. A softer-than-expected 7.7% increase in the October CPI ignited a bond rally heading into mid-November, with the yield on the 10-year Treasury yield dipping below 4.0%. The downward trend in long-term Treasury yields continued through the second half November and into the beginning of December, as the 10-year Treasury yield dipped below 3.5% and the Treasury yield curve inverted to its deepest level since 1981. The 10-year Treasury yield edged higher ahead of the release of November inflation data and then retreated back below 3.5% as inflation slowed in November with the November CPI showing a less-than-expected 7.1% increase from a year ago. The Federal Reserve concluded its mid-December meeting by raising its target rate 0.5% and signaled plans to continue to increase interest rates through the first quarter of 2023. Following the rate hike and subsequent upward revision to third quarter GDP growth, long-term Treasury yields generally edged higher through the balance of 2022.
Economic data signaling a slowing economy and a slower rate of inflation translated into long-term Treasury yields edging lower at the start of 2023, as the 10-year Treasury yield dipped below 3.5% after December’s CPI report showed the pace of inflation eased for a sixth straight month with a 6.5% increase from a year ago. A weak retail sales report for December furthered the downward trend in long-term Treasury yields going into the second half of January, which was followed by the 10-year Treasury yield edging back above 3.5% at the end of January. Long-term Treasury yields dipped lower after the Federal Reserve approved a quarter-point rate hike on February 1st and signaled it was on track to raise rates by another quarter-point at its next meeting in March. Stronger-than-expected job growth reflected in the January employment report pushed the 10-year Treasury yield back above 3.5% going into the second week of February. The upward trend in long-term Treasury yields continued going into the second half February as new inflation data was stronger than expected, with the January CPI and producer price index showing respective increases of 6.4% and 0.7%. The 10-year Treasury yield edged above 4.0% in early-March and then declined sharply heading into mid-March, as investors flocked to safe-haven investments after regulators shutdown Silicon Valley
| RP® Financial, LC. | MARKET AREA |
| | II.5 |
Bank. Inflation cooled in February but remained stubbornly high with the February CPI registering a 6.0% increase from a year ago, which translated into the 10-year Treasury edging higher in mid-March. As investors remained on edge about further bank failures, the 10-year Treasury yield declined below 3.5% going into the second half of March. The Federal Reserve concluded its March meeting by increasing the federal funds target rate 0.25% to a range between 4.75% and 5.0%, while also signaling that banking-system turmoil might end its rate-rise campaign sooner than previously anticipated. After initially declining following the Federal Reserve meeting, long-term Treasury yields edged higher going into the final week of the first quarter and then declined at the close of first quarter as February consumer price data showed inflation increased at a slower rate.
A slowdown in March manufacturing activity extended the decline in long-term Treasury yield at the start of the second quarter of 2023, with the 10-year Treasury yield retreating below 3.35%. While the pace of inflation slowed in March with an increase in the March CPI of 5.0%, long-term Treasury yields edged higher going into mid-April. A mid-April statement by a Federal Reserve official that advocated more interest rate increases were needed to combat inflation contributed to sustaining the upward trend in long-term Treasury yields going into the second half of April, which was followed by a general decline in long-term Treasury yields at the end of April and the beginning of May as investors gravitated toward safe-haven investments ahead of the Federal Reserve’s rate decision in early-May. The Federal Reserve concluded its May meeting by raising its target rate by another quarter-point and indicated that they might be done raising interest rates further. The rate hike was the 10th consecutive rate increase and moved the federal funds rate to a range between 5.0% and 5.25%, which was a 16-year high. Stronger-than-expected job growth reflected in the April employment report translated into long-term Treasury yields edging higher going into the second week of May. As of May 8, 2023, the bond equivalent yields for U.S. Treasury bonds with terms of one and ten years equaled 4.79% and 3.52%, respectively, versus comparable year ago yields of 2.08% and 3.12%. Exhibit II-2 provides historical interest rate trends.
Based on the consensus outlook of economists surveyed by The Wall Street Journal in April 2023, GDP was projected to increase 0.5% in 2023 and increase to 1.6% annual growth in 2024. The U.S. unemployment rate was forecasted to equal 4.3% in December 2023 and increase to 4.6% in June 2024. An average of 12,000 jobs were projected to be added per month over the next four quarters. On average, the economists forecasted the federal funds rate would equal 4.96% in December 2023 and then decrease to 4.19% in June 2024. On
| RP® Financial, LC. | MARKET AREA |
| | II.6 |
average, the economists forecasted that the 10-year Treasury yield would equal 3.42% in December 2023 and then decrease to 3.31% in June 2024.
The April 2023 mortgage finance forecast from the Mortgage Bankers Association (the “MBA”) was for 2023 existing home sales to decrease by 17.6% from 2022 sales, while 2023 new home sales were forecasted to decrease by 2.3% from sales in 2022. The 2023 median sale prices for existing and new homes were forecasted to decrease by 6.0% and 5.3%, respectively. Total mortgage production was forecasted to decrease in 2023 to $1.806 trillion, compared to $2.245 trillion in 2022. The forecasted decrease in 2023 originations was based on a 12.9% decrease in purchase volume and a 35.2% decrease in refinancing volume. Purchase mortgage originations were forecasted to total $1.374 trillion in 2023, versus refinancing volume totaling $432 billion. Housing starts for 2023 were projected to decrease by 11.7% to total 1.372 million.
Market Area Demographics
Demographic and economic growth trends, measured by changes in population, number of households, age distribution and median household income, provide key insight into the health of the market area served by Gouverneur Bancorp. Demographic data for Jefferson and St. Lawrence Counties, as well as for New York and the U.S., is provided in Table 2.1.
Population and household data indicate that the market area served by the Company’s branches is somewhat rural in nature and is part of the North Country region of New York. Jefferson County, which is located on the northern border of the state of New York, maintained a population of 116,000 as of 2023. Comparatively, St. Lawrence County, which is the adjacent county to the northeast of Jefferson County maintained a population of 107,000 as of 2023. From 2018 to 2023, Jefferson County’s population increased at an annual rate of 0.8% and St. Lawrence County’s population decreased at an annual rate of 0.3%. Comparatively, New York and the U.S. recorded annual population growth rates of 0.1% and 0.5%, respectively, over the past five years.
Over the past five years, Jefferson County recorded a 1.6% annual increase in households versus a 0.1% annual increase in households recorded by St. Lawrence County. Comparatively, annual rates of household growth over the past five years for New York and the U.S. equaled 0.3% and 0.7%, respectively. Both of the primary market area counties are projected to experience a decline in population over the next five years and household growth is also projected to be slightly negative for St. Lawrence County versus a projected slight increase
| RP® Financial, LC. | MARKET AREA |
| | II.7 |
Table 2.1
Gouverneur Bancorp, Inc.
Summary Demographic/Economic Data
| | | Year | | | Growth Rate | |
| | | 2018 | | | 2023 | | | 2028 | | | 2018-2023 | | | 2023-2028 | |
| | | | | | | | | | | | (%) | | | (%) | |
| Population (000) | | | | | | | | | | | | | | | | | | | | |
| USA | | | 326,533 | | | | 334,500 | | | | 341,663 | | | | 0.5 | % | | | 0.4 | % |
| New York | | | 19,788 | | | | 19,879 | | | | 19,853 | | | | 0.1 | % | | | 0.0 | % |
| Jefferson County | | | 111 | | | | 116 | | | | 116 | | | | 0.8 | % | | | -0.1 | % |
| Saint Lawrence County | | | 109 | | | | 107 | | | | 106 | | | | -0.3 | % | | | -0.3 | % |
| | | | | | | | | | | | | | | | | | | | | |
| Households (000) | | | | | | | | | | | | | | | | | | | | |
| USA | | | 123,943 | | | | 128,298 | | | | 131,438 | | | | 0.7 | % | | | 0.5 | % |
| New York | | | 7,533 | | | | 7,653 | | | | 7,709 | | | | 0.3 | % | | | 0.1 | % |
| Jefferson County | | | 42 | | | | 45 | | | | 46 | | | | 1.6 | % | | | 0.1 | % |
| Saint Lawrence County | | | 41 | | | | 41 | | | | 40 | | | | 0.1 | % | | | -0.2 | % |
| | | | | | | | | | | | | | | | | | | | | |
| Median Household Income ($) | | | | | | | | | | | | | | | | | | | | |
| USA | | | 61,045 | | | | 73,503 | | | | 83,333 | | | | 3.8 | % | | | 2.5 | % |
| New York | | | 66,418 | | | | 80,716 | | | | 91,247 | | | | 4.0 | % | | | 2.5 | % |
| Jefferson County | | | 54,041 | | | | 60,960 | | | | 68,305 | | | | 2.4 | % | | | 2.3 | % |
| Saint Lawrence County | | | 45,962 | | | | 58,066 | | | | 64,778 | | | | 4.8 | % | | | 2.2 | % |
| | | | | | | | | | | | | | | | | | | | | |
| Per Capita Income ($) | | | | | | | | | | | | | | | | | | | | |
| USA | | | 33,583 | | | | 41,287 | | | | 46,830 | | | | 4.2 | % | | | 2.6 | % |
| New York | | | 38,275 | | | | 47,636 | | | | 54,043 | | | | 4.5 | % | | | 2.6 | % |
| Jefferson County | | | 26,726 | | | | 31,825 | | | | 36,700 | | | | 3.6 | % | | | 2.9 | % |
| Saint Lawrence County | | | 24,739 | | | | 32,877 | | | | 37,525 | | | | 5.9 | % | | | 2.7 | % |
| | | | | | | | | | | | | | | | | | | | | |
| | | 0-14 Yrs. | | | 15-34 Yrs. | | | 35-54 Yrs. | | | 55-69 Yrs. | | | 70+ Yrs. | |
| 2023 Age Distribution (%) | | | | | | | | | | | | | | | |
| USA | | | 18.0 | | | | 26.5 | | | | 25.0 | | | | 18.5 | | | | 12.1 | |
| New York | | | 17.0 | | | | 26.4 | | | | 24.9 | | | | 19.1 | | | | 12.5 | |
| Jefferson County | | | 20.8 | | | | 31.2 | | | | 22.1 | | | | 15.3 | | | | 10.6 | |
| Saint Lawrence County | | | 15.8 | | | | 29.1 | | | | 22.4 | | | | 20.0 | | | | 12.8 | |
| | | | | | | | | | | | | | | | | | | | | |
| | | Less Than | | | $25,000 to | | | $50,000 to | | | | | | | |
| | | 25,000 | | | 50,000 | | | 100,000 | | | $100,000+ | | | | |
| 2023 HH Income Dist. (%) | | | | | | | | | | | | | | | |
| USA | | | 16.0 | | | | 18.8 | | | | 28.7 | | | | 36.4 | | | | | |
| New York | | | 17.0 | | | | 16.3 | | | | 25.5 | | | | 41.2 | | | | | |
| Jefferson County | | | 17.9 | | | | 23.2 | | | | 34.1 | | | | 24.7 | | | | | |
| Saint Lawrence County | | | 22.9 | | | | 22.1 | | | | 27.5 | | | | 27.5 | | | | | |
Source: S&P Global Market Intelligence.
| RP® Financial, LC. | MARKET AREA |
| | II.8 |
in household growth for Jefferson County. Comparatively, over the next five years, population and household growth for New York and the U.S. are projected to be slightly less in comparison to the past five years.
Median household and per capita income measures for Jefferson and St. Lawrence Counties were below the comparable measures for the U.S. and New York, which is indicative of the market area's more rural nature that provides for a lower cost of living than the more highly populated markets within the state. Over the next five years, median household income growth rates for Jefferson and St. Lawrence Counties are projected to be slightly less than the comparable New York and U.S. growth rates, while projected per capita income growth rates for the two primary market area counties are projected to be slightly higher than the comparable projected New York and U.S. growth rates.
Household income distribution measures show that in comparison to Jefferson and St. Lawrence Counties, both the U.S. and New York maintain a higher percentage of households with incomes of $100,000 or more. Age distribution measures reflect that in comparison to New York and the U.S.. Jefferson County and St. Lawrence County have slightly younger- and slightly older-aged populations, respectively.
Regional Economy
Comparative employment data shown in Table 2.2 shows that employment in education/healthcare/social services followed by services were the largest and second largest employment sectors in both of the primary market area counties, as well as New York. Wholesale/retail trade jobs were the third largest employment sector for both of the primary area counties, as well as for New York. Other noteworthy employment sectors for the primary market area counties included government, manufacturing and construction. Overall, the distribution of employment exhibited in the primary market area is indicative of a diverse economic environment.
| RP® Financial, LC. | MARKET AREA |
| | II.9 |
Table 2.2
Gouverneur Bancorp, Inc.
Primary Market Area Employment Sectors
(Percent of Labor Force)
| | | | | | Jefferson | | | Saint Lawrence | |
| Employment Sector | | New York | | | County | | | County | |
| | | (%) | | | (%) | | | (%) | |
| Services | | | 26.2 | % | | | 20.3 | % | | | 16.7 | % |
| Education,Healthcare, Soc. Serv. | | | 28.3 | % | | | 27.3 | % | | | 36.6 | % |
| Government | | | 4.6 | % | | | 11.8 | % | | | 7.7 | % |
| Wholesale/Retail Trade | | | 12.2 | % | | | 17.0 | % | | | 12.6 | % |
| Finance/Insurance/Real Estate | | | 7.9 | % | | | 3.3 | % | | | 4.0 | % |
| Manufacturing | | | 5.9 | % | | | 6.3 | % | | | 7.4 | % |
| Construction | | | 5.8 | % | | | 7.3 | % | | | 5.9 | % |
| Information | | | 2.9 | % | | | 1.6 | % | | | 1.3 | % |
| Transportation/Utility | | | 5.6 | % | | | 3.4 | % | | | 4.5 | % |
| Agriculture | | | 0.5 | % | | | 1.7 | % | | | 3.3 | % |
| | | | 100.0 | % | | | 100.0 | % | | | 100.0 | % |
Source: S&P Global Market Intelligence.
The market area served by the Company is part of the North Country region of northern New York., Fort Drum, a U.S. Army military reservation, is the primary source of employment in the region and serves as the foundation of the regional economy. In addition to Fort Drum, healthcare, government and education constitute major sources of employment, which tend to provide relatively stable sources of employment. Table 2.3 lists the major employers in Company’s primary market area.
Table 2.3
Gouverneur Bancorp, Inc.
Market Area Largest Employers
| Company/Institution | | Employees | | | Industry |
| Fort Drum | | | 19,748 | | | Department of Defense |
| Samaritan Medical Center/Samaritan Keep/Summit Sr. Village | | | 2,300 | | | Healthcare |
| NYS (includes regional state offices & correctional facilities) | | | 1,921 | | | Government |
| Clarkson University | | | 1,655 | | | Education |
| St. Lawrence University | | | 1,339 | | | Education |
| County of Jefferson | | | 790 | | | Government |
| Claxton-Hepburn Medical Center | | | 750 | | | Healthcare |
| Canton-Potsdam Hospital | | | 573 | | | Healthcare |
| Jefferson Rehabilitation Center | | | 557 | | | Healthcare |
| St. Lawrence NYSARC | | | 537 | | | Transportation |
Sources: Jefferson County, NY Economic Development and www.zippia.com.
| RP® Financial, LC. | MARKET AREA |
| | II.10 |
Unemployment Trends
Comparative unemployment rates for the primary market area counties, as well as for the U.S. and New York, are shown in Table 2.4. The March 2023 unemployment rates for Jefferson and St. Lawrence Counties equaled 4.5% and 4.1, respectively, which were above the comparable unemployment rates of 4.0% and 3.6% for New York and the U.S., respectively. Consistent with New York and the U.S., March 2023 unemployment rates for Jefferson and St. Lawrence Counties were slightly lower from their respective year ago unemployment rates.
Table 2.4
Gouverneur Bancorp, Inc.
Unemployment Trends
| | | Unemployment Rate | | | | |
| Region | | Mar. 2022 | | | Mar. 2023 | | | Change | |
| USA | | | 3.8 | % | | | 3.6 | % | | | -0.2 | % |
| New York | | | 4.7 | % | | | 4.0 | % | | | -0.7 | % |
| Jefferson County | | | 4.7 | % | | | 4.5 | % | | | -0.2 | % |
| Saint Lawrence County | | | 4.4 | % | | | 4.1 | % | | | -0.3 | % |
Source: S&P Global Market Intelligence.
Market Area Deposit Characteristics and Competition
The Company’s deposit base is closely tied to the economic fortunes of Jefferson and St. Lawrence Counties and, in particular, the areas that are nearby to one of Gouverneur Bancorp’s branches. The deposits and branches acquired with the acquisition of Citizen Bank are shown separately. Table 2.5 displays deposit market trends from June 30, 2017 through June 30, 2022 for all commercial bank and savings institution branches located in the market area counties, as well as New York. In comparison to New York, commercial banks did not maintain as a dominant market share relative to savings institutions in both of the primary market area counties. Overall, from June 30, 2017 to June 30, 2022, bank and thrift deposits increased in both of the primary market area counties, but at lower rates compared to the state of New York.
| RP® Financial, LC. | MARKET AREA |
| | II.11 |
Table 2.5
Gouverneur Bancorp, Inc.
Deposit Summary
| | | As of June 30, | | | | |
| | | 2017 | | | 2022 | | | Deposit | |
| | | | | | Market | | | No. of | | | | | | Market | | | No. of | | | Growth Rate | |
| | | Deposits | | | Share | | | Branches | | | Deposits | | | Share | | | Branches | | | 2017-2022 | |
| | | | | | | | | | | | | | | | | | | | | | |
| | | (Dollars in Thousands) | | | (%) | |
| New York | | $ | 1,683,281,581 | | | | 100.0 | % | | | 5,038 | | | $ | 2,632,578,079 | | | | 100.0 | % | | | 4,269 | | | | 9.4 | % |
| Commercial Banks | | $ | 1,565,333,943 | | | | 93.0 | % | | | 4,261 | | | $ | 2,500,834,770 | | | | 95.0 | % | | | 3,647 | | | | 9.8 | % |
| Savings Institutions | | $ | 72,476,767 | | | | 4.3 | % | | | 769 | | | $ | 84,080,763 | | | | 3.2 | % | | | 614 | | | | 3.0 | % |
| Other (1) | | $ | 45,470,871 | | | | 2.7 | % | | | 8 | | | $ | 47,662,546 | | | | 1.8 | % | | | 8 | | | | 0.9 | % |
| | | | | | | | | | | | | | | | | | | | | | | | | | | | | |
| Jefferson County | | $ | 1,630,842 | | | | 100.0 | % | | | 36 | | | $ | 2,142,186 | | | | 100.0 | % | | | 31 | | | | 5.6 | % |
| Commercial Banks | | $ | 900,460 | | | | 55.2 | % | | | 22 | | | $ | 1,276,422 | | | | 59.6 | % | | | 20 | | | | 7.2 | % |
| Savings Institutions | | $ | 730,382 | | | | 44.8 | % | | | 14 | | | $ | 865,764 | | | | 40.4 | % | | | 11 | | | | 3.5 | % |
| Gouverneur Bancorp | | $ | 18,547 | | | | 1.1 | % | | | 1 | | | $ | 25,143 | | | | 1.2 | % | | | 1 | | | | 6.3 | % |
| Citizens Bank of Cape Vincent | | $ | 59,826 | | | | 3.7 | % | | | 3 | | | $ | 77,824 | | | | 3.6 | % | | | 3 | | | | 5.4 | % |
| | | | | | | | | | | | | | | | | | | | | | | | | | | | | |
| Saint Lawrence County | | $ | 1,210,074 | | | | 100.0 | % | | | 33 | | | $ | 1,588,047 | | | | 100.0 | % | | | 30 | | | | 5.6 | % |
| Commercial Banks | | $ | 830,486 | | | | 68.6 | % | | | 27 | | | $ | 1,121,628 | | | | 70.6 | % | | | 24 | | | | 6.2 | % |
| Savings Institutions | | $ | 379,588 | | | | 31.4 | % | | | 6 | | | $ | 466,419 | | | | 29.4 | % | | | 6 | | | | 4.2 | % |
| Gouverneur Bancorp | | $ | 65,108 | | | | 5.4 | % | | | 1 | | | $ | 76,664 | | | | 4.8 | % | | | 1 | | | | 3.3 | % |
(1) Insured U.S. branch of a foreign chartered institution.
Source: S&P Global Market Intelligence.
As the result of the acquisition of the Citizens Bank branches, the Company maintains its largest balance of deposits in Jefferson County, where the Company maintains four of its five branches. Based on June 30, 2022 deposit data, Gouverneur Bancorp’s and Citizens Bank’s deposits totaled $103.0 million for a 4.8% market share of bank and thrift deposits in Jefferson County. As of June 30, 2022, the Bank maintained $76.7 million of deposits at its St. Lawrence County branch for a deposit market share of 4.8%. During the five year period covered in Table 2.5, Gouverneur Bancorp’s deposit market share did not change in Jefferson County (inclusive of Citizens Bank’s deposits) and declined slightly in St. Lawrence County.
Competition among financial institutions in the Company’s market area is significant. Among the Company’s competitors are much larger and more diversified institutions, which have greater resources than maintained by Gouverneur Bancorp. Financial institution competitors in the Company’s primary market area include other locally based thrifts, banks and credit unions, as well as regional and super regional banks. Table 2.6 lists the Company’s largest competitors in the market area counties, based on deposit market share.
| RP® Financial, LC. | MARKET AREA |
| | II.12 |
Table 2.6
Gouverneur Bancorp, Inc.
Market Area Deposit Competitors
As of June 30, 2022
| Location | | Name | | Market Share | | | Rank |
| Jefferson County | | Watertown Savings Bank (NY) | | | 39.24 | % | | |
| | | Community Bank System Inc. (NY) | | | 27.86 | % | | |
| | | KeyCorp (OH) | | | 11.06 | % | | |
| | | Riverbank Financial Corp. MHC (NY) | | | 10.65 | % | | |
| | | WSB Municipal Bank (NY) | | | 5.58 | % | | |
| | | Gouverneur Bancorp (NY) | | | 4.81 | % | | 6 out of 9 |
| | | | | | | | | |
| Saint Lawrence County | | Community Bank System Inc. (NY) | | | 40.36 | % | | |
| | | North Country SB (NY) | | | 16.36 | % | | |
| | | NBT Bancorp Inc. (NY) | | | 14.44 | % | | |
| | | KeyCorp (OH) | | | 13.87 | % | | |
| | | Massena S&L (NY) | | | 8.18 | % | | |
| | | Gouverneur Bancorp (NY) | | | 4.83 | % | | 6 out of 8 |
Source: S&P Global Market Intelligence.
| RP® Financial, LC. | PEER GROUP ANALYSIS |
| | III.1 |
III. PEER GROUP ANALYSIS
This chapter presents an analysis of Gouverneur Bancorp’s operations versus a group of comparable savings institutions (the "Peer Group") selected from the universe of all publicly-traded savings institutions in a manner consistent with the regulatory valuation guidelines. The basis of the pro forma market valuation of Gouverneur Bancorp is derived from the pricing ratios of the Peer Group institutions, incorporating valuation adjustments for key differences in relation to the Peer Group. Since no Peer Group can be exactly comparable to Gouverneur Bancorp, key areas examined for differences are: financial condition; profitability, growth and viability of earnings; asset growth; primary market area; dividends; liquidity of the shares; marketing of the issue; management; and effect of government regulations and regulatory reform.
Peer Group Selection
The Peer Group selection process is governed by the general parameters set forth in the regulatory valuation guidelines. Accordingly, the Peer Group is comprised of only those publicly-traded savings institutions whose common stock is either listed on the NYSE or NASDAQ, since their stock trading activity is regularly reported and generally more frequent than non-publicly traded and closely-held institutions. Institutions that are not listed on the NYSE or NASDAQ are inappropriate, since the trading activity for thinly-traded or closely-held stocks are typically highly irregular in terms of frequency and price and thus may not be a reliable indicator of market value. We have also excluded from the Peer Group those companies under acquisition or subject to rumored acquisition, mutual holding companies and recent conversions, since their pricing ratios are subject to unusual distortion and/or have limited trading history. A recent listing of the universe of all publicly-traded savings institutions is included as Exhibit III-1.
Ideally, the Peer Group, which must have at least 10 members to comply with the regulatory valuation guidelines, should be comprised of locally- or regionally-based institutions with comparable resources, strategies and financial characteristics. There are approximately 45 fully-converted, publicly-traded institutions nationally and, thus, it is typically the case that the Peer Group will be comprised of institutions with relatively comparable characteristics. To the extent that differences exist between the converting institution and the Peer Group, valuation adjustments will be applied to account for the differences. Since Gouverneur Bancorp will be a full public company upon completion of the offering, we considered only full public companies to
| RP® Financial, LC. | PEER GROUP ANALYSIS |
| | III.2 |
be viable candidates for inclusion in the Peer Group. From the universe of publicly-traded thrifts, we selected ten institutions with characteristics similar to those of Gouverneur Bancorp. In the selection process, we applied two “screens” to the universe of all public companies that were eligible for consideration:
| o | Screen #1 Mid-Atlantic, New England and Midwest institutions with assets less than $1.0 billion, equity-to-assets ratios of greater than 7.0% and positive core earnings. Five companies met the criteria for Screen #1 and four were included in the Peer Group: 1895 Bancorp of Wisconsin, Inc., Generations Bancorp NY, Inc. of New York, Mid-Southern Bancorp, Inc. of Indiana and PB Bankshares, Inc. of Pennsylvania. The company that met the selection criteria and was not included in the Peer Group was First Seacoast Bancorp, Inc. of New Hampshire, which was excluded as the result of completing its second-step conversion within the past twelve months. Exhibit III-2 provides financial and public market pricing characteristics of all publicly-traded Mid-Atlantic, New England and Midwest thrifts. |
| o | Screen #2 Southeast and Southwest institutions with assets less than $1.0 billion, equity-to-assets ratios of greater than 7.0% and positive core earnings. Six companies met the criteria for Screen #2 and all six were included in the Peer Group: Affinity Bancshares, Inc. of Georgia, Catalyst Bancorp, Inc. of Louisiana, Cullman Bancorp, Inc. of Alabama, Home Federal Bancorp, Inc. of Louisiana, TC Bancshares, Inc. of Georgia and Texas Community Bancshares, Inc. of Texas. Exhibit III-3 provides financial and public market pricing characteristics of all publicly-traded Southeast and Southwest thrifts. |
Table 3.1 shows the general characteristics of each of the ten Peer Group companies and Exhibit III-4 provides summary demographic and deposit market share data for the primary market areas served by each of the Peer Group companies. While there are expectedly some differences between the Peer Group companies and Gouverneur Bancorp, we believe that the Peer Group companies, on average, provide a good basis for valuation subject to valuation adjustments. The following sections present a comparison of Gouverneur Bancorp’s financial condition, income and expense trends, loan composition, interest rate risk and credit risk versus the Peer Group as of the most recent publicly available date. Comparative data for all publicly-traded thrifts has been included in the Chapter III tables as well.
In addition to the selection criteria used to identify the Peer Group companies, a summary description of the key comparable characteristics of each of the Peer Group companies relative to Gouverneur Bancorp’s characteristics is detailed below.
| o | 1895 Bancorp of Wisconsin, Inc. of Wisconsin. Comparable due to completed second-step conversion in 2021, similar size of branch network, similar concentration of cash and investments as a percent of assets, similar impact of loan loss provisions on earnings, similar earnings contribution from sources of non-interest operating income, |
| RP® Financial, LC. | PEER GROUP ANALYSIS |
| | III.3 |
Table 3.1
Peer Group of Publicly-Traded Thrifts
As of March 31, 2023 or the Most Recent Date Available
| | | | | | | | | | | | | | | | | | | | | | As of | |
| | | | | | | | | | | | | | | | | | | | | | May 8, 2023 | |
| | | | | | | | | | | | | Total | | | | | Fiscal | | Conv. | | Stock | | | Market | |
| Ticker | | Financial Institution | | Exchange | | Region | | City | | State | | Assets | | | Offices | | Mth End | | Date | | Price | | | Value | |
| | | | | | | | | | | | | ($Mil) | | | | | | | | | ($) | | | ($Mil) | |
| BCOW | | 1895 Bancorp of Wisconsin, Inc. | | NASDAQCM | | MW | | Greenfield | | WI | | $ | 543 | (1) | | 6 | | Dec | | 1/8/2019 | | $ | 6.99 | | | $ | 43 | |
| AFBI | | Affinity Bancshares, Inc. | | NASDAQCM | | SE | | Covington | | GA | | $ | 932 | | | 3 | | Dec | | 4/27/2017 | | $ | 12.50 | | | $ | 82 | |
| CLST | | Catalyst Bancorp, Inc. | | NASDAQCM | | SW | | Opelousas | | LA | | $ | 276 | | | 6 | | Dec | | 10/12/2021 | | $ | 9.57 | | | $ | 48 | |
| CULL | | Cullman Bancorp, Inc. | | NASDAQCM | | SE | | Cullman | | AL | | $ | 423 | (1) | | 4 | | Dec | | 10/8/2009 | | $ | 10.62 | | | $ | 78 | |
| GBNY | | Generations Bancorp NY, Inc. | | NASDAQCM | | MA | | Seneca Falls | | NY | | $ | 389 | | | 10 | | Dec | | 7/10/2006 | | $ | 9.15 | | | $ | 21 | |
| HFBL | | Home Federal Bancorp, Inc. of Louisiana | | NASDAQCM | | SW | | Shreveport | | LA | | $ | 686 | | | 11 | | Jun | | 1/18/2005 | | $ | 16.13 | | | $ | 48 | |
| MSVB | | Mid-Southern Bancorp, Inc. | | NASDAQCM | | MW | | Salem | | IN | | $ | 266 | | | 3 | | Dec | | 4/8/1998 | | $ | 9.87 | | | $ | 28 | |
| PBBK | | PB Bankshares, Inc. | | NASDAQCM | | MA | | Coatesville | | PA | | $ | 393 | | | 4 | | Dec | | 7/14/2021 | | $ | 11.50 | | | $ | 30 | |
| TCBC | | TC Bancshares, Inc. | | NASDAQCM | | SE | | Thomasville | | GA | | $ | 430 | (1) | | 2 | | Dec | | 7/20/2021 | | $ | 13.50 | | | $ | 62 | |
| TCBS | | Texas Community Bancshares, Inc. | | NASDAQCM | | SW | | Mineola | | TX | | $ | 417 | (1) | | 6 | | Dec | | 7/14/2021 | | $ | 10.25 | | | $ | 32 | |
(1) As of December 31, 2022.
Source: S&P Global Market Intelligence.
| RP® Financial, LC. | PEER GROUP ANALYSIS |
| | III.4 |
lending diversification emphasis on commercial real estate loans and similar ratio of non-performing assets as a percent of assets.
| o | Affinity Bancorp, Inc. of Georgia. Comparable due to completed second-step conversion in 2021, similar composition of interest-bearing liabilities, similar net interest income to average assets ratio, similar impact of loan loss provisions on earnings and lending diversification emphasis on commercial real estate loans. |
| o | Catalyst Bancorp, Inc. of Louisiana. Comparable due to similar asset size, similar size of branch network, similar earnings contribution from sources of non-interest operating income, similar combined concentration of mortgage-backed securities and 1-4 family loans as a percent of assets and lending diversification emphasis on commercial real estate loans. |
| o | Cullman Bancorp, Inc. of Alabama. Comparable due to completed second-step conversion in 2021, similar size of branch network, similar earnings contribution form sources of non-interest operating income, relatively high concentration of 1-4 family loans as a percent of assets, lending diversification emphasis on commercial real estate loans and similar ratio of non-performing assets as a percent of assets. |
| o | Generations Bancorp NY, Inc. of New York. Comparable due to completed second-step conversion in 2021, rural New York market area, similar earnings contribution from sources of non-interest operating income, relatively high concentration of 1-4 family loans as a percent of assets and similar concentration of commercial real estate loans as a percent of assets. |
| o | Home Federal Bancorp, Inc. of Louisiana. Comparable due to completed second-step conversion in 2010, similar net interest income to average assets ratio, similar earnings contribution from sources of non-interest operating income, lending diversification emphasis on commercial real estate loans and similar ratio of non-performing assets as a percent of assets. |
| o | Mid-Southern Bancorp, Inc. of Indiana. Comparable due to completed second-step conversion in 2018, similar asset size, similar concentration of deposits funding assets, similar impact of loan loss provisions on earnings, similar earnings contribution from sources of non-interest operating income, lending diversification emphasis on commercial real estate loans and similar ratio of non-performing assets as a percent of assets. |
| o | PB Bankshares, Inc. of Pennsylvania. Comparable due to similar size of branch network, lending diversification emphasis on commercial real estate loans and similar ratio of non-performing assets as a percent of assets. |
| o | TC Bancshares, Inc. of Georgia. Comparable due to similar composition of interest-bearing liabilities, similar return on average assets, similar impact of loan loss provisions on earnings, similar earnings contribution from sources of non-interest operating income, relatively high operating expenses as a percent of average assets, relatively high concentration of 1-4 family loans as a percent of assets, lending diversification emphasis on commercial real estate loans and similar ratio of non-performing assets as a percent of assets. |
| o | Texas Community Bancshares, Inc. of Texas. Comparable due similar size of branch network, similar concentration of loans as a percent of assets, similar return on average assets, similar impact of loan loss provisions on earnings, similar earnings contribution from sources of non-interest operating incomes, relatively high concentration of 1-4 |
| RP® Financial, LC. | PEER GROUP ANALYSIS |
| | III.5 |
family loans as a percent of assets, lending diversification emphasis on commercial real estate loans and similar ratio of non-performing assets as a percent of assets.
In aggregate, the Peer Group companies maintained a higher level of tangible equity compared to the industry average (15.34% of assets versus 12.70% for all public companies), generated lower earnings as a percent of average assets (0.54% core ROAA versus 0.75% for all public companies) and earned a lower ROE (4.03% core ROE versus 6.32% for all public companies). Overall, the Peer Group's average P/TB ratio and average core P/E multiple were below and above the respective averages for all publicly-traded thrifts.
| | | All | | | | |
| | | Publicly-Traded | | | Peer Group | |
| Financial Characteristics (Averages) | | | | | | | | |
| Assets ($Mil) | | $ | 5,955 | | | $ | 476 | |
| Market capitalization ($Mil) | | $ | 449 | | | $ | 47 | |
| Tangible equity/assets (%) | | | 12.70 | % | | | 15.34 | % |
| Core return on average assets (%) | | | 0.75 | | | | 0.54 | |
| Core return on average equity (%) | | | 6.32 | | | | 4.03 | |
| | | | | | | | | |
| Pricing Ratios (Averages)(1) | | | | | | | | |
| Core price/earnings (x) | | | 11.43 | x | | | 17.40 | x |
| Price/tangible book (%) | | | 80.50 | % | | | 73.65 | % |
| Price/assets (%) | | | 8.97 | | | | 10.84 | |
(1) Based on market prices as of May 8, 2023.
Ideally, the Peer Group companies would be comparable to Gouverneur Bancorp in terms of all of the selection criteria, but the universe of publicly-traded thrifts does not provide for an appropriate number of such companies. However, in general, the companies selected for the Peer Group were fairly comparable to Gouverneur Bancorp, as will be highlighted in the following comparative analysis. Comparative data for all publicly-traded thrifts has been included in the Chapter III tables as well.
Financial Condition
Table 3.2 shows comparative balance sheet measures for Gouverneur Bancorp and the Peer Group, reflecting the expected similarities and some differences given the selection procedures outlined above. The Company’s and the Peer Group's ratios reflect balances as of March 31, 2023, unless indicated otherwise for the Peer Group companies. Gouverneur Bancorp’s equity-to-assets ratio of 12.84% was below the Peer Group's average net worth ratio of 15.65%. The Company’s pro forma capital position will increase with the addition of stock
| RP® Financial, LC. | PEER GROUP ANALYSIS |
| | III.6 |
Table 3.2
Balance Sheet Composition and Growth Rates
Comparable Institution Analysis
As of March 31, 2023 or the Most Recent Date Available
| | | | | Balance Sheet as a Percent of Assets | | Balance Sheet Annual Growth Rates | | Regulatory Capital | |
| | | | | Cash & | | MBS & | | | | Net | | | | Borrowed | | Sub. | | Total | | Goodwill | | Tangible | | | | MBS, Cash | | | | | | Borrows. | | Total | | Tangible | | Tier 1 | | Tier 1 | | Risk-Based | |
| | | | | Equival. | | Invest | | BOLI | | Loans (1) | | Deposits | | Funds | | Debt | | Equity | | & Intang | | Equity | | Assets | | Invests | | Loans | | Deposits | | &Subdebt | | Equity | | Equity | | Leverage | | Risk-Based | | Capital | |
| Gouvernor Bancorp, Inc. | | NY | | | | | | | | | | | | | | | | | | | | | | | | | | | | | | | | | | | | | | | | |
| March 31, 2023 | | | 4.12 | % | 24.72 | % | 3.37 | % | 60.62 | % | 80.85 | % | 4.34 | % | 0.00 | % | 12.84 | % | 3.05 | % | 9.78 | % | 31.43 | % | 37.04 | % | 26.95 | % | 38.23 | % | NM | | -2.61 | % | -19.04 | % | 10.73 | % | 19.54 | % | 20.14 | % |
| | | | | | | | | | | | | | | | | | | | | | | | | | | | | | | | | | | | | | | | | | | | |
| All Non-MHC Public Thrifts | | | | | | | | | | | | | | | | | | | | | | | | | | | | | | | | | | | | | | | | | | |
| Averages | | | 5.83 | % | 16.07 | % | 1.73 | % | 72.11 | % | 74.86 | % | 10.17 | % | 0.38 | % | 13.32 | % | 0.69 | % | 12.70 | % | 10.56 | % | -8.81 | % | 15.92 | % | 5.29 | % | 56.32 | % | 6.10 | % | 3.67 | % | 11.53 | % | 13.47 | % | 16.02 | % |
| Medians | | | 5.18 | % | 15.17 | % | 1.70 | % | 74.23 | % | 75.11 | % | 7.98 | % | 0.00 | % | 11.78 | % | 0.05 | % | 10.61 | % | 6.43 | % | -20.10 | % | 14.11 | % | 1.81 | % | 46.17 | % | -1.64 | % | -5.49 | % | 10.19 | % | 12.52 | % | 14.10 | % |
| | | | | | | | | | | | | | | | | | | | | | | | | | | | | | | | | | | | | | | | | | | | |
| Comparable Group | | | | | | | | | | | | | | | | | | | | | | | | | | | | | | | | | | | | | | | | | | |
| Averages | | | 6.65 | % | 19.14 | % | 2.18 | % | 68.41 | % | 76.23 | % | 7.30 | % | 0.00 | % | 15.65 | % | 0.31 | % | 15.34 | % | 9.68 | % | -21.78 | % | 16.49 | % | 9.34 | % | 48.60 | % | -6.08 | % | -9.51 | % | 14.21 | % | 20.52 | % | 21.66 | % |
| Medians | | | 6.50 | % | 13.96 | % | 1.91 | % | 70.51 | % | 75.86 | % | 5.92 | % | 0.00 | % | 13.25 | % | 0.00 | % | 13.21 | % | 9.73 | % | -25.14 | % | 13.27 | % | 7.36 | % | 34.53 | % | -5.93 | % | -8.11 | % | 11.61 | % | 13.46 | % | 14.35 | % |
| | | | | | | | | | | | | | | | | | | | | | | | | | | | | | | | | | | | | | | | | | | | |
| Comparable Group | | | | | | | | | | | | | | | | | | | | | | | | | | | | | | | | | | | | | | | | | | |
| BCOW | 1895 Bancorp of Wisconsin, Inc. | (2) | WI | 5.22 | % | 22.25 | % | 2.64 | % | 66.24 | % | 71.40 | % | 13.16 | % | 0.00 | % | 13.88 | % | 0.00 | % | 13.88 | % | 0.63 | % | -22.33 | % | 10.69 | % | 0.84 | % | 28.90 | % | -17.09 | % | -16.49 | % | 11.89 | % | 16.37 | % | 17.34 | % |
| AFBI | Affinity Bancshares, Inc. | | GA | 14.68 | % | 9.47 | % | 1.70 | % | 69.96 | % | 80.54 | % | 5.90 | % | 0.00 | % | 12.69 | % | 1.99 | % | 10.70 | % | 22.64 | % | -38.50 | % | 10.00 | % | 19.55 | % | NM | | 1.68 | % | -3.59 | % | 10.85 | % | 11.60 | % | 12.86 | % |
| CLST | Catalyst Bancorp, Inc. | | LA | 9.98 | % | 34.16 | % | 4.97 | % | 47.36 | % | 65.15 | % | 3.35 | % | 0.00 | % | 31.22 | % | 0.00 | % | 31.22 | % | -4.05 | % | -25.02 | % | 0.42 | % | -1.84 | % | 1.99 | % | -9.01 | % | -10.23 | % | 30.11 | % | 56.43 | % | 57.69 | % |
| CULL | Cullman Bancorp, Inc. | (2) | AL | 8.66 | % | 7.63 | % | 2.12 | % | 77.96 | % | 69.22 | % | 5.93 | % | 0.00 | % | 23.67 | % | 0.00 | % | 23.67 | % | 19.32 | % | -49.18 | % | 30.85 | % | 26.26 | % | 34.53 | % | 0.45 | % | -1.22 | % | 18.18 | % | NA | | NA | |
| GBNY | Generations Bancorp NY, Inc. | | NY | 1.73 | % | 9.27 | % | 1.90 | % | 79.23 | % | 86.60 | % | 2.65 | % | 0.00 | % | 9.64 | % | 0.38 | % | 9.26 | % | 3.11 | % | -30.83 | % | 12.35 | % | 7.02 | % | -35.56 | % | -10.91 | % | -13.79 | % | 10.32 | % | 13.46 | % | 14.35 | % |
| HFBL | Home Federal Bancorp, Inc. of Louisiana | | LA | 6.64 | % | 17.58 | % | 0.97 | % | 71.07 | % | 89.56 | % | 2.66 | % | 0.00 | % | 7.31 | % | 0.67 | % | 6.63 | % | 19.39 | % | -26.15 | % | 33.50 | % | 18.86 | % | NM | | -4.77 | % | -8.84 | % | 8.41 | % | 12.11 | % | 13.19 | % |
| MSVB | Mid-Southern Bancorp, Inc. | | IN | 1.68 | % | 38.80 | % | 1.44 | % | 55.26 | % | 77.20 | % | 9.39 | % | 0.00 | % | 13.12 | % | 0.00 | % | 13.12 | % | 1.86 | % | -9.35 | % | 15.63 | % | -1.92 | % | 150.00 | % | -14.67 | % | -28.38 | % | 15.33 | % | NA | | NA | |
| PBBK | PB Bankshares, Inc. | | PA | 8.89 | % | 8.83 | % | 1.92 | % | 78.58 | % | 75.17 | % | 12.36 | % | 0.00 | % | 11.78 | % | 0.00 | % | 11.78 | % | 6.69 | % | 15.61 | % | 12.44 | % | 3.26 | % | 35.98 | % | 2.36 | % | -2.65 | % | 10.06 | % | 12.10 | % | 13.35 | % |
| TCBC | TC Bancshares, Inc. | (2) | GA | 6.35 | % | 10.35 | % | 2.66 | % | 78.26 | % | 76.54 | % | 2.56 | % | 0.00 | % | 19.85 | % | 0.00 | % | 19.85 | % | 12.78 | % | -25.26 | % | 24.92 | % | 13.66 | % | NM | | -1.77 | % | -2.50 | % | 15.60 | % | 21.55 | % | 22.81 | % |
| TCBS | Texas Community Bancshares, Inc. | (2) | TX | 2.63 | % | 33.01 | % | 1.47 | % | 60.22 | % | 70.94 | % | 15.07 | % | 0.00 | % | 13.39 | % | 0.10 | % | 13.29 | % | 14.40 | % | -6.82 | % | 14.11 | % | 7.69 | % | 124.33 | % | -7.09 | % | -7.39 | % | 11.32 | % | NA | | NA | |
| (1) | Includes loans held for sale. |
| (2) | As of December 31, 2022. |
Source: S&P Global Market Intelligence and RP® Financial, LC. calculations. The information provided in this table has been obtained from sources we believe are reliable, but we cannot guarantee the accuracy or completeness of such information.
Copyright (c) 2023 by RP® Financial, LC.
| RP® Financial, LC. | PEER GROUP ANALYSIS |
| | III.7 |
proceeds, which will provide the Company with an equity-to-assets ratio that is comparable to the Peer Group’s ratio. Tangible equity-to-assets ratios for the Company and the Peer Group equaled 9.78% and 15.34%, respectively. The increase in Gouverneur Bancorp’s pro forma capital position will be favorable from a risk perspective and in terms of future earnings potential that could be realized through leverage and lower funding costs. At the same time, the Company’s higher pro forma capitalization will initially depress return on equity. Both Gouverneur Bancorp’s and the Peer Group's capital ratios reflected capital surpluses with respect to the regulatory capital requirements.
The interest-earning asset compositions for the Company and the Peer Group were somewhat similar, with loans constituting the largest concentration of interest-earning assets for both Gouverneur Bancorp and the Peer Group. The Company’s loans-to-assets ratio of 60.62% was lower than the comparable Peer Group ratio of 68.41%. Comparatively, the Company’s cash and investments-to-assets ratio of 28.84% was higher than the comparable Peer Group ratio of 25.79%. Overall, Gouverneur Bancorp’s interest-earning assets amounted to 89.46% of assets, which was less than the comparable Peer Group ratio of 94.20%. The Peer Group’s non-interest earning assets included bank-owned life insurance (“BOLI”) equal to 2.18% of assets and goodwill/intangibles equal to 0.31% of assets, while the Company maintained BOLI equal to 3.37% of assets and goodwill/intangibles equal to 3.05% of assets.
Gouverneur Bancorp’s funding liabilities reflected a funding composition that was somewhat similar to that of the Peer Group's funding composition. The Company’s deposits equaled 80.85% of assets, which was above the Peer Group’s ratio of 76.23%. Comparatively, the Company maintained a lower borrowings-to-assets ratio of 4.34%, versus a borrowings-to-assets ratio of 7.30% for the Peer Group. Total interest-bearing liabilities maintained by the Company and the Peer Group, as a percent of assets, equaled 85.19% and 83.53%, respectively.
A key measure of balance sheet strength for a thrift institution is its interest-earning assets/interest-bearing liabilities (“IEA/IBL”) ratio. Presently, the Company’s IEA/IBL ratio is lower than the Peer Group’s ratio, based on IEA/IBL ratios of 105.01% and 112.77%, respectively. The additional capital realized from stock proceeds should serve to provide Gouverneur Bancorp with an IEA/IBL ratio that is more comparable to the Peer Group’s ratio, as the increase in capital provided by the infusion of stock proceeds will serve to lower the level of interest-bearing liabilities funding assets and will be primarily deployed into interest-earning assets.
| RP® Financial, LC. | PEER GROUP ANALYSIS |
| | III.8 |
The growth rate section of Table 3.2 shows annual growth rates for key balance sheet items. Gouverneur Bancorp’s growth rates are based on annualized growth for the eighteen months ended March 31, 2023 and the Peer Group’s growth rates are based on annual growth for twelve months ended March 31, 2023 or December 31, 2022. Gouverneur Bancorp recorded a 31.43% increase in assets, versus asset growth of 9.68% recorded by the Peer Group. Gouverneur Bancorp’s higher asset growth rate was largely related to completing the acquisition of Citizens Bank during the eighteen-month period. Asset growth for Gouverneur Bancorp included a 26.95% increase in loans and a 37.04% increase in cash and investments. Asset growth for the Peer Group included a 16.49% increase in loans, which was partially offset by a 21.78% decrease in cash and investments.
Acquisition-related growth provided the Company with a higher deposit growth rate of 38.23%, versus a 9.34% increase in deposits recorded by the Peer Group. The Company’s borrowings increased from a zero balance to 4.34% of assets, while borrowings for the Peer Group showed an increase of 48.60%. The Company’s tangible capital decreased by 19.04%, which was largely related to the reduction in tangible capital resulting from the cash acquisition of Citizens Bank and, to a lesser extent, the increase in the accumulated other comprehensive loss maintained on the portfolio of available for sale securities. Comparatively, the Peer Group’s tangible capital decreased by 9.51%, as retention of earnings was more than offset by stock repurchases, dividend payments and increases in the accumulated other comprehensive losses maintained on their available for sale securities portfolios. The Company’s post-conversion capital growth rate will initially be constrained by maintenance of a higher pro forma capital position. Additional implementation of any stock repurchases and dividend payments, pursuant to regulatory limitations and guidelines, could also slow the Company’s capital growth rate in the longer term following the stock offering.
Income and Expense Components
Table 3.3 displays statements of operations for the Company and the Peer Group. The Company’s and the Peer Group’s ratios are based on earnings for the twelve months ended March 31, 2023, unless indicated otherwise for the Peer Group companies. Gouverneur Bancorp and the Peer Group reported net income to average assets ratios of 0.43% and 0.53%, respectively. A lower operating expense ratio represented an earnings advantage for the Peer Group, while higher ratios for net interest income and non-interest operating income and a lower ratio for loan loss provisions were earnings advantages for the Company.
| RP® Financial, LC. | PEER GROUP ANALYSIS |
| | III.9 |
Table 3.3
Income as Percent of Average Assets and Yields, Costs, Spreads
Comparable Institution Analysis
For the 12 Months Ended March 31, 2023 or the Most Recent 12 Months Available
| | | | | | | Net Interest Income | | | | Non-Interest Income | | | | NonOp Items | | | | Yields, Costs, and Spreads | | | | | |
| | | | | | | | | | | | | Loss | | NII | | Gain | | Other | | Total | | | | | | Provision | | | | | | | | MEMO: | | MEMO: | |
| | | | | Net | | | | | | | | Provis. | | After | | on Sale of | | Non-Int | | Non-Int | | Net Gains/ | | Extrao. | | for | | Yield | | Cost | | Yld-Cost | | Assets/ | | Effective | |
| | | | | Income | | Income | | Expense | | NII | | on IEA | | Provis. | | Loans | | Income | | Expense | | Losses (1) | | Items | | Taxes | | On IEA | | Of IBL | | Spread | | FTE Emp. | | Tax Rate | |
| | | | | (%) | | (%) | | (%) | | (%) | | (%) | | (%) | | (%) | | (%) | | (%) | | (%) | | (%) | | (%) | | (%) | | (%) | | (%) | | ($000) | | (%) | |
| Gouverneur Bancorp, Inc. | | NY | | | | | | | | | | | | | | | | | | | | | | | | | | | | | | | | | | | |
| March 31, 2023 | | | 0.43 | % | 3.77 | % | 0.12 | % | 3.65 | % | 0.05 | % | 3.59 | % | 0.01 | % | 0.43 | % | 3.49 | % | -0.02 | % | 0.00 | % | 0.08 | % | 4.23 | % | 0.16 | % | 4.07 | % | $ | 4,661 | | 15.81 | % |
| | | | | | | | | | | | | | | | | | | | | | | | | | | | | | | | | | | | | | | |
| All Non-MHC Public Thrifts | | | | | | | | | | | | | | | | | | | | | | | | | | | | | | | | | | | | | |
| Averages | | | 0.70 | % | 3.90 | % | 0.69 | % | 3.21 | % | 0.21 | % | 3.04 | % | 0.13 | % | 0.41 | % | 2.65 | % | 0.05 | % | 0.00 | % | 0.22 | % | 4.13 | % | 0.72 | % | 3.42 | % | $ | 9,324 | | 23.69 | % |
| Medians | | | 0.75 | % | 3.70 | % | 0.59 | % | 3.04 | % | 0.07 | % | 2.93 | % | 0.01 | % | 0.39 | % | 2.56 | % | 0.00 | % | 0.00 | % | 0.20 | % | 3.98 | % | 0.60 | % | 3.23 | % | $ | 8,011 | | 23.69 | % |
| | | | | | | | | | | | | | | | | | | | | | | | | | | | | | | | | | | | | | | |
| Comparable Group | | | | | | | | | | | | | | | | | | | | | | | | | | | | | | | | | | | | | |
| Averages | | | 0.53 | % | 3.71 | % | 0.55 | % | 3.16 | % | 0.09 | % | 3.06 | % | 0.04 | % | 0.37 | % | 2.82 | % | -0.01 | % | 0.00 | % | 0.12 | % | 3.93 | % | 0.63 | % | 3.30 | % | $ | 6,974 | | 16.55 | % |
| Medians | | | 0.53 | % | 3.73 | % | 0.57 | % | 2.99 | % | 0.07 | % | 2.84 | % | 0.00 | % | 0.41 | % | 2.80 | % | -0.01 | % | 0.00 | % | 0.13 | % | 4.04 | % | 0.58 | % | 3.24 | % | $ | 6,993 | | 19.43 | % |
| | | | | | | | | | | | | | | | | | | | | | | | | | | | | | | | | | | | | | | |
| Comparable Group | | | | | | | | | | | | | | | | | | | | | | | | | | | | | | | | | | | | | |
| BCOW | 1895 Bancorp of Wisconsin, Inc. | (2) | WI | -0.03 | % | 3.06 | % | 0.37 | % | 2.69 | % | 0.04 | % | 2.65 | % | 0.06 | % | 0.40 | % | 3.03 | % | -0.13 | % | 0.00 | % | -0.03 | % | 3.27 | % | 0.62 | % | 2.65 | % | $ | 5,466 | | NM | |
| AFBI | Affinity Bancshares, Inc. | | GA | 0.89 | % | 4.37 | % | 0.72 | % | 3.65 | % | 0.06 | % | 3.59 | % | 0.00 | % | 0.30 | % | 2.72 | % | 0.00 | % | 0.00 | % | 0.27 | % | 4.66 | % | 0.56 | % | 4.10 | % | $ | 8,608 | | 23.52 | % |
| CLST | Catalyst Bancorp, Inc. | | LA | 0.14 | % | 3.00 | % | 0.30 | % | 2.70 | % | -0.11 | % | 2.81 | % | 0.00 | % | 0.47 | % | 3.05 | % | -0.03 | % | 0.00 | % | 0.01 | % | 3.16 | % | 0.44 | % | 2.72 | % | $ | 5,040 | | 5.25 | % |
| CULL | Cullman Bancorp, Inc. | (2) | AL | 1.09 | % | 4.30 | % | 0.36 | % | 3.95 | % | 0.11 | % | 3.83 | % | 0.02 | % | 0.41 | % | 2.89 | % | -0.01 | % | 0.00 | % | 0.29 | % | 4.56 | % | 0.58 | % | 3.98 | % | $ | 7,149 | | 20.84 | % |
| GBNY | Generations Bancorp NY, Inc. | | NY | 0.14 | % | 3.66 | % | 0.75 | % | 2.91 | % | 0.17 | % | 2.74 | % | 0.00 | % | 0.56 | % | 3.12 | % | -0.01 | % | 0.00 | % | 0.03 | % | 4.07 | % | 0.71 | % | 3.36 | % | $ | 4,694 | | 15.78 | % |
| HFBL | Home Federal Bancorp, Inc. of Louisiana | | LA | 0.93 | % | 4.04 | % | 0.54 | % | 3.50 | % | 0.17 | % | 3.33 | % | 0.11 | % | 0.26 | % | 2.52 | % | -0.10 | % | 0.00 | % | 0.16 | % | 4.28 | % | 0.50 | % | 3.78 | % | $ | 7,589 | | 14.42 | % |
| MSVB | Mid-Southern Bancorp, Inc. | | IN | 0.66 | % | 3.54 | % | 0.60 | % | 2.94 | % | 0.08 | % | 2.86 | % | 0.00 | % | 0.45 | % | 2.66 | % | 0.00 | % | 0.00 | % | 0.01 | % | 3.70 | % | 0.58 | % | 3.12 | % | $ | 6,253 | | 1.13 | % |
| PBBK | PB Bankshares, Inc. | | PA | 0.59 | % | 4.00 | % | 0.96 | % | 3.04 | % | 0.33 | % | 2.71 | % | 0.00 | % | 0.17 | % | 2.33 | % | 0.20 | % | 0.00 | % | 0.16 | % | 4.10 | % | 1.01 | % | 3.09 | % | $ | 10,828 | | 20.90 | % |
| TCBC | TC Bancshares, Inc. | (2) | GA | 0.43 | % | 3.79 | % | 0.33 | % | 3.46 | % | 0.03 | % | 3.43 | % | 0.24 | % | 0.23 | % | 3.30 | % | 0.00 | % | 0.00 | % | 0.17 | % | 4.00 | % | 0.50 | % | 3.50 | % | $ | 7,280 | | 27.71 | % |
| TCBS | Texas Community Bancshares, Inc. | (2) | TX | 0.47 | % | 3.33 | % | 0.61 | % | 2.73 | % | 0.06 | % | 2.67 | % | 0.00 | % | 0.49 | % | 2.58 | % | -0.01 | % | 0.00 | % | 0.11 | % | 3.52 | % | 0.84 | % | 2.68 | % | $ | 6,836 | | 19.43 | % |
| (1) | Net gains/losses includes gain/loss on sale of securities and nonrecurring income and expense. |
| (2) | For the 12 months ended December 31, 2022. |
| Source: | S&P Global Market Intelligence and RP® Financial, LC. calculations. The information provided in this table has been obtained from sources we believe are reliable, but we cannot guarantee the accuracy or completeness of such information. |
Copyright (c) 2023 by RP® Financial, LC.
| RP® Financial, LC. | PEER GROUP ANALYSIS |
| | III.10 |
The Company’s higher net interest income to average assets ratio was primarily realized through a lower interest expense ratio, which was facilitated by a lower cost of interest-bearing liabilities (0.16% versus 0.63% for the Peer Group). Likewise, the Company’s slightly higher interest income ratio was facilitated by a higher yield earned on interest-earning assets (4.23% versus 3.93% for the Peer Group). Overall, Gouverneur Bancorp and the Peer Group reported net interest income to average assets ratios of 3.65% and 3.16%, respectively.
In another key area of core earnings strength, the Company maintained a higher level of operating expenses than the Peer Group. For the period covered in Table 3.3, the Company and the Peer Group reported operating expense to average assets ratios of 3.49% and 2.82%, respectively. The Company’s higher operating expense ratio was consistent with maintaining a comparatively higher number of employees relative to its asset size. Assets per full time equivalent employee equaled $4.661 million for the Company, versus $6.974 million for the Peer Group.
When viewed together, net interest income and operating expenses provide considerable insight into a thrift's earnings strength, since those sources of income and expenses are typically the most prominent components of earnings and are generally more predictable than losses and gains realized from the sale of assets or other non-recurring activities. In this regard, as measured by their expense coverage ratios (net interest income divided by operating expenses), the Company’s earnings were slightly less favorable than the Peer Group’s earnings. Expense coverage ratios for Gouverneur Bancorp and the Peer Group equaled 1.05x and 1.12x, respectively.
Sources of non-interest operating income provided a slightly larger contribution to the Company’s earnings, with such income amounting to 0.44% and 0.41% of Gouverneur Bancorp’s and the Peer Group’s average assets, respectively. Taking non-interest operating income into account in comparing the Company’s and the Peer Group's earnings, Gouverneur Bancorp’s efficiency ratio (operating expenses, as a percent of the sum of non-interest operating income and net interest income) of 85.33% was less favorable than the Peer Group's efficiency ratio of 78.99%.
Loan loss provisions had a slightly large impact on the Peer Group’s earnings, as loan loss provisions established by the Company and the Peer Group equaled 0.05% and 0.09% of average assets, respectively
| RP® Financial, LC. | PEER GROUP ANALYSIS |
| | III.11 |
The Company and the Peer Group recorded net non-operating losses equal to 0.02% and 0.01% of average assets, respectively. Typically, gains and losses generated from the sale of assets and other non-operating activities are viewed as earnings with a relatively high degree of volatility, and, thus, are not considered to be part of an institution’s core earnings. Extraordinary items were not a factor in either the Company’s or the Peer Group's earnings.
The Company recorded an effective tax rate of 15.81% compared to an effective tax rate of 16.55% for the Peer Group. As indicated in the prospectus, the Company’s effective marginal tax rate is equal to 21.0%.
Loan Composition
Table 3.4 presents data related to the Company’s and the Peer Group’s loan portfolio compositions (including the investment in mortgage-backed securities). In comparison to the Peer Group, the Company’s loan portfolio composition reflected a higher combined concentration of 1-4 family permanent mortgage loans and mortgage-backed securities (53.97% of assets versus 38.20% for the Peer Group), as the Company’s higher concentration of 1-4 family loans more than offset the Peer Group’s higher concentration of mortgage-backed securities. Loan servicing intangibles constituted a more significant balance sheet item for the Peer Group, equal to an average of $188,000 for the Peer Group compared to a zero balance for the Company.
Diversification into higher risk and higher yielding types of lending was more significant for the Peer Group. The Peer Group’s loan portfolio composition reflected higher concentrations of commercial real estate loans (19.21% of assets versus 5.78% of assets for the Company), multi-family loans (3.48% of assets versus 0.08% of assets for the Company), construction/land loans (4.76% of assets versus 1.96% of assets for the Company), commercial business loans (6.56% of assets versus 0.92% of assets for the Company) and consumer loans (4.84% of assets versus 2.72% of assets for the Company). In total, construction/land, commercial real estate, multi-family, commercial business and consumer loans comprised 11.46% and 38.85% of the Company’s and the Peer Group’s assets, respectively. Overall, the Company’s asset composition provided for a lower risk weighted assets-to-assets ratio of 54.47% compared to 72.24% for the Peer Group.
| RP® Financial, LC. | PEER GROUP ANALYSIS |
| | III.12 |
Table 3.4
Loan Portfolio Composition and Related Information
Comparable Institution Analysis
As of March 31, 2023 or the Most Recent Date Available
| | | | | Portfolio Composition as a Percent of Assets | |
| | | | | | | 1-4 | | Constr. | | Multi- | | | | Commerc. | | | | RWA/ | | Servicing | |
| | | | MBS | | Family | | & Land | | Family | | Comm RE | | Business | | Consumer | | Assets | | Assets | |
| | | | | (%) | | (%) | | (%) | | (%) | | (%) | | (%) | | (%) | | (%) | | ($000) | |
| Gouverneur Bancorp, Inc. | | NY | | | | | | | | | | | | | | | | | | | |
| March 31, 2023 | | | 4.20 | % | 49.77 | % | 1.96 | % | 0.08 | % | 5.78 | % | 0.92 | % | 2.72 | % | 54.47 | % | $ | 0 | |
| | | | | | | | | | | | | | | | | | | | | | | |
| All Non-MHC Public Thrifts | | | | | | | | | | | | | | | | | | | | | |
| Averages | | | 9.95 | % | 25.78 | % | 5.85 | % | 11.10 | % | 18.30 | % | 7.79 | % | 2.13 | % | 78.36 | % | $ | 26,020 | |
| Medians | | | 7.73 | % | 23.57 | % | 4.20 | % | 5.22 | % | 17.37 | % | 5.70 | % | 0.19 | % | 79.10 | % | $ | 97 | |
| | | | | | | | | | | | | | | | | | | | | | | |
| Comparable Group | | | | | | | | | | | | | | | | | | | | | |
| Averages | | | 9.42 | % | 28.78 | % | 4.76 | % | 3.48 | % | 19.21 | % | 6.56 | % | 4.84 | % | 72.24 | % | $ | 188 | |
| Medians | | | 8.31 | % | 29.95 | % | 5.34 | % | 2.28 | % | 19.74 | % | 6.18 | % | 0.83 | % | 72.54 | % | $ | 0 | |
| | | | | | | | | | | | | | | | | | | | | | | |
| Comparable Group | | | | | | | | | | | | | | | | | | | | | |
| BCOW | 1895 Bancorp of Wisconsin, Inc. | (1) | WI | 11.13 | % | 20.09 | % | 5.48 | % | 13.90 | % | 19.20 | % | 8.13 | % | 0.03 | % | 72.30 | % | $ | 1,860 | |
| AFBI | Affinity Bancshares, Inc. | | GA | 1.97 | % | 5.51 | % | 3.99 | % | 0.48 | % | 31.56 | % | 15.87 | % | 11.92 | % | 82.37 | % | $ | 0 | |
| CLST | Catalyst Bancorp, Inc. | | LA | 21.62 | % | 31.73 | % | 2.23 | % | 1.16 | % | 7.05 | % | 5.02 | % | 1.25 | % | 52.55 | % | $ | 0 | |
| CULL | Cullman Bancorp, Inc. | (1) | AL | 2.40 | % | 42.25 | % | 6.76 | % | 0.87 | % | 20.28 | % | 7.24 | % | 0.86 | % | NA | | $ | 0 | |
| GBNY | Generations Bancorp NY, Inc. | | NY | 0.25 | % | 38.84 | % | 0.10 | % | 0.22 | % | 5.17 | % | 2.14 | % | 32.25 | % | 76.54 | % | $ | 14 | |
| HFBL | Home Federal Bancorp, Inc. of Louisiana | | LA | 15.22 | % | 22.92 | % | 6.58 | % | 3.97 | % | 21.27 | % | 7.34 | % | 0.09 | % | 67.05 | % | $ | 0 | |
| MSVB | Mid-Southern Bancorp, Inc. | | IN | 11.41 | % | 24.21 | % | 2.36 | % | 3.40 | % | 18.59 | % | 5.54 | % | 0.79 | % | NA | | $ | 0 | |
| PBBK | PB Bankshares, Inc. | | PA | 0.79 | % | 28.17 | % | 5.19 | % | 6.18 | % | 31.60 | % | 6.65 | % | 0.01 | % | 82.31 | % | $ | 0 | |
| TCBC | TC Bancshares, Inc. | (1) | GA | 5.49 | % | 35.14 | % | 6.23 | % | 4.57 | % | 27.45 | % | 5.70 | % | 0.19 | % | 72.54 | % | $ | 0 | |
| TCBS | Texas Community Bancshares, Inc. | (1) | TX | 23.92 | % | 38.93 | % | 8.69 | % | 0.08 | % | 9.88 | % | 2.02 | % | 1.05 | % | NA | | $ | 7 | |
| (1) | As of December 31, 2022. |
| Source: | S&P Global Market Intelligence and RP® Financial, LC. calculations. The information provided in this table has been obtained from sources we believe are reliable, but we cannot guarantee the accuracy or completeness of such information. |
Copyright (c) 2023 by RP® Financial, LC.
| RP® Financial, LC. | PEER GROUP ANALYSIS |
| | III.13 |
Interest Rate Risk
Table 3.5 reflects various key ratios highlighting the relative interest rate risk exposure of the Company versus the Peer Group. In terms of balance sheet composition, Gouverneur Bancorp’s interest rate risk characteristics implied a higher degree of interest rate risk exposure relative to the comparable measures for the Peer Group. In particular, the Company’s tangible equity-to-assets ratio and IEA/IBL ratio were lower than the respective Peer Group ratios, while the Company’s ratio of non-interest earning assets as a percent of assets was higher than the Peer Group’s ratio. On a pro forma basis, the infusion of stock proceeds should serve to strengthen the Company’s balance sheet interest rate risk characteristics, given the increases that will be realized in Company’s tangible equity-to-assets and IEA/IBL ratios.
To analyze interest rate risk associated with the net interest margin, we reviewed quarterly changes in net interest income as a percent of average assets for Gouverneur Bancorp and the Peer Group. In general, the comparative fluctuations in the Company’s and the Peer Group’s net interest income ratios implied that a slightly greater degree of interest rate risk was associated with the Company’s net interest margin, based on the interest rate environment that prevailed during the period covered in Table 3.5. The stability of the Company’s net interest margin should be enhanced by the infusion of stock proceeds, as interest rate sensitive liabilities will be funding a lower portion of Gouverneur Bancorp’s assets and the proceeds will be substantially deployed into interest-earning assets.
Credit Risk
Overall, based on a comparison of credit risk measures, the Company’s implied credit risk exposure was viewed to be similar to the Peer Group’s credit risk exposure. As shown in Table 3.6, the Company’s ratios for non-performing/assets and non-performing loans/loans equaled 0.44% and 0.67%, respectively, versus comparable measures of 0.56% and 0.75% for the Peer Group. The Company’s and Peer Group’s loss reserves as a percent of non-performing loans equaled 79.88% and 216.95%, respectively. Loss reserves maintained as percent of loans receivable equaled 0.54% for the Company, versus 1.18% for the Peer Group. The Company’s lower reserve ratios were in part related to the fair value accounting credit adjustment for the acquisition of Citizens Bank. Net loan charge-offs were a similar factor for the Peer Group and the Company, as net loan charge-offs for the Company and the Peer Group both equaled 0.02% of loans.
| RP® Financial, LC. | PEER GROUP ANALYSIS |
| | III.14 |
Table 3.5
Interest Rate Risk Measures and Net Interest Income Volatility
Comparable Institution Analysis
As of March 31, 2023 or the Most Recent Date Available
| | | | | Balance Sheet Measures | | | | | | | | | | | | | |
| | | | | Tangible | | | | Non-Earn. | | | |
| | | | | Equity/ | | IEA/ | | Assets/ | | Quarterly Change in Net Interest Income | |
| | | | Assets | | IBL | | Assets | | 3/31/2023 | | 12/31/2022 | | 9/30/2022 | | 6/30/2022 | | 3/31/2022 | | 12/31/2021 | |
| | | | | | | | | | | | | | | | | | | | | |
| | | | | (%) | | (%) | | (%) | | (change in net interest income is annualized in basis points) | |
| Gouverneur Bancorp, Inc. | | NY | | | | | | | | | | | | | | | | | | | | | | | | | | | |
| March 31, 2023 | | | | 9.8 | % | | 105.0 | % | | 10.5 | % | | -4 | | | 31 | | | 35 | | | -5 | | | 9 | | | 4 | |
| | | | | | | | | | | | | | | | | | | | | | | | | | | | | | | |
| All Non-MHC Public Thrifts | | | | | | | | | | | | | | | | | | | | | | | | | | | | | |
| Average | | | | 12.8 | % | | 110.1 | % | | 6.0 | % | | -18 | | | -2 | | | 17 | | | 12 | | | -1 | | | 1 | |
| Median | | | | 10.7 | % | | 113.8 | % | | 5.4 | % | | -17 | | | -4 | | | 14 | | | 15 | | | -4 | | | 0 | |
| | | | | | | | | | | | | | | | | | | | | | | | | | | | | | | |
| Comparable Group | | | | | | | | | | | | | | | | | | | | | | | | | | | | | |
| Average | | | | 15.3 | % | | 113.5 | % | | 5.8 | % | | -12 | | | -7 | | | 23 | | | 5 | | | 10 | | | 3 | |
| Median | | | | 13.2 | % | | 110.7 | % | | 5.4 | % | | -10 | | | -12 | | | 23 | | | 7 | | | 5 | | | 6 | |
| | | | | | | | | | | | | | | | | | | | | | | | | | | | | | | |
| Comparable Group | | | | | | | | | | | | | | | | | | | | | | | | | | | | | |
| BCOW | 1895 Bancorp of Wisconsin, Inc. | (1) | WI | | 13.9 | % | | 110.8 | % | | 6.3 | % | | 0 | | | -18 | | | 49 | | | -19 | | | 12 | | | 30 | |
| AFBI | Affinity Bancshares, Inc. | | GA | | 10.7 | % | | 108.9 | % | | 5.9 | % | | -32 | | | -25 | | | 10 | | | -37 | | | 80 | | | -12 | |
| CLST | Catalyst Bancorp, Inc. | | LA | | 31.2 | % | | 133.6 | % | | 8.5 | % | | 8 | | | 22 | | | 7 | | | 9 | | | 8 | | | -27 | |
| CULL | Cullman Bancorp, Inc. | (1) | AL | | 23.7 | % | | 125.4 | % | | 5.7 | % | | 0 | | | -21 | | | -1 | | | 20 | | | 62 | | | 13 | |
| GBNY | Generations Bancorp NY, Inc. | | NY | | 9.3 | % | | 101.1 | % | | 9.8 | % | | -27 | | | -32 | | | 16 | | | -5 | | | -11 | | | -12 | |
| HFBL | Home Federal Bancorp, Inc. of Louisiana | | LA | | 6.6 | % | | 103.3 | % | | 4.7 | % | | -23 | | | 7 | | | 41 | | | 23 | | | 3 | | | -2 | |
| MSVB | Mid-Southern Bancorp, Inc. | | IN | | 13.1 | % | | 110.6 | % | | 4.3 | % | | -20 | | | -4 | | | 1 | | | 33 | | | -14 | | | 5 | |
| PBBK | PB Bankshares, Inc. | | PA | | 11.8 | % | | 110.0 | % | | 3.7 | % | | -21 | | | 25 | | | 48 | | | 4 | | | -20 | | | 11 | |
| TCBC | TC Bancshares, Inc. | (1) | GA | | 19.8 | % | | 120.1 | % | | 5.0 | % | | 0 | | | -7 | | | 34 | | | 3 | | | -31 | | | 17 | |
| TCBS | Texas Community Bancshares, Inc. | (1) | TX | | 13.3 | % | | 111.5 | % | | 4.1 | % | | 0 | | | -20 | | | 30 | | | 15 | | | 7 | | | 8 | |
NA=Change is greater than 100 basis points during the quarter.
| (1) | As of December 31, 2022. |
| Source: | S&P Global Market Intelligence and RP® Financial, LC. calculations. The information provided in this table has been obtained from sources we believe are reliable, but we cannot guarantee the accuracy or completeness of such information. |
Copyright (c) 2023 by RP® Financial, LC.
| RP® Financial, LC. | PEER GROUP ANALYSIS |
| | III.15 |
Table 3.6
Credit Risk Measures and Related Information
Comparable Institution Analysis
As of March 31, 2023 or the Most Recent Date Available
| | | | | | | NPAs & | | | | | | | | Rsrves/ | | | | | |
| | | | | REO/ | | 90+Del/ | | NPLs/ | | Rsrves/ | | Rsrves/ | | NPAs & | | Net Loan | | NLCs/ | |
| | | | Assets | | Assets (1) | | Loans (2) | | Loans HFI | | NPLs (2) | | 90+Del (1) | | Chargeoffs (3) | | Loans | |
| | | | | (%) | | (%) | | (%) | | (%) | | (%) | | (%) | | ($000) | | (%) | |
| Gouverneur Bancorp, Inc. | | NY | | | | | | | | | | | | | | | | | | | | | | | | |
| March 31, 2023 | | | | 0.03 | % | | 0.44 | % | | 0.67 | % | | 0.54 | % | | 79.88 | % | | 74.75 | % | $ | 24 | | | 0.02 | % |
| | | | | | | | | | | | | | | | | | | | | | | | | | | | |
| All Non-MHC Public Thrifts | | | | | | | | | | | | | | | | | | | | | | | | | | |
| Averages | | | | 0.04 | % | | 0.34 | % | | 0.62 | % | | 1.04 | % | | 255.34 | % | | 215.19 | % | $ | 2,749 | | | 0.13 | % |
| Medians | | | | 0.01 | % | | 0.26 | % | | 0.32 | % | | 0.98 | % | | 242.53 | % | | 251.61 | % | $ | 45 | | | 0.01 | % |
| | | | | | | | | | | | | | | | | | | | | | | | | | | | |
| Comparable Group | | | | | | | | | | | | | | | | | | | | | | | | | | |
| Averages | | | | 0.05 | % | | 0.56 | % | | 0.75 | % | | 1.18 | % | | 216.95 | % | | 202.56 | % | $ | 47 | | | 0.02 | % |
| Medians | | | | 0.01 | % | | 0.53 | % | | 0.80 | % | | 1.20 | % | | 159.42 | % | | 150.34 | % | $ | 6 | | | 0.01 | % |
| | | | | | | | | | | | | | | | | | | | | | | | | | | | |
| Comparable Group | | | | | | | | | | | | | | | | | | | | | | | | | | |
| BCOW | 1895 Bancorp of Wisconsin, Inc. | (4) | WI | | 0.00 | % | | 0.21 | % | | 0.31 | % | | 0.79 | % | | 257.65 | % | | 257.65 | % | $ | -123 | | | -0.02 | % |
| AFBI | Affinity Bancshares, Inc. | | GA | | 0.31 | % | | 1.03 | % | | 1.01 | % | | 1.40 | % | | 138.82 | % | | 96.71 | % | $ | 26 | | | 0.01 | % |
| CLST | Catalyst Bancorp, Inc. | | LA | | 0.12 | % | | 0.93 | % | | 1.55 | % | | 1.56 | % | | 100.58 | % | | 84.59 | % | $ | 8 | | | 0.01 | % |
| CULL | Cullman Bancorp, Inc. | (4) | AL | | 0.01 | % | | 0.62 | % | | 0.74 | % | | 0.92 | % | | 124.73 | % | | 119.60 | % | $ | 3 | | | 0.00 | % |
| GBNY | Generations Bancorp NY, Inc. | | NY | | 0.04 | % | | 0.85 | % | | 1.01 | % | | 0.85 | % | | 84.60 | % | | 80.69 | % | $ | -33 | | | -0.01 | % |
| HFBL | Home Federal Bancorp, Inc. of Louisiana | | LA | | 0.05 | % | | 0.39 | % | | 0.47 | % | | 1.00 | % | | 214.33 | % | | 184.32 | % | $ | 231 | | | 0.06 | % |
| MSVB | Mid-Southern Bancorp, Inc. | | IN | | 0.01 | % | | 0.49 | % | | 0.86 | % | | 1.55 | % | | 180.02 | % | | 177.81 | % | $ | -32 | | | -0.02 | % |
| PBBK | PB Bankshares, Inc. | | PA | | 0.00 | % | | 0.35 | % | | 0.44 | % | | 1.31 | % | | 300.29 | % | | 300.29 | % | $ | 414 | | | 0.14 | % |
| TCBC | TC Bancshares, Inc. | (4) | GA | | 0.01 | % | | 0.18 | % | | 0.21 | % | | 1.37 | % | | 645.34 | % | | 601.04 | % | $ | -68 | | | -0.01 | % |
| TCBS | Texas Community Bancshares, Inc. | (4) | TX | | 0.00 | % | | 0.56 | % | | 0.88 | % | | 1.09 | % | | 123.13 | % | | 122.86 | % | $ | 45 | | | 0.01 | % |
| (1) | NPAs are defined as nonaccrual loans, accruing loans 90 days or more past due, performing TDRs, and OREO. |
| (2) | NPLs are defined as nonaccrual loans, accruing loans 90 days or more past due and performing TDRs. |
| (3) | Net loan chargeoffs are shown on a last twelve month basis. |
| (4) | As of December 31, 2022. |
| Source: | S&P Global Market Intelligence and RP® Financial, LC. calculations. The information provided in this table has been obrained from sources we believe are reliable, but we cannot guarantee the accuracy or completeness of such information. |
Copyright (c) 2023 by RP® Financial, LC.
| RP® Financial, LC. | PEER GROUP ANALYSIS |
| | III.16 |
Summary
Based on the above analysis, RP Financial concluded that the Peer Group forms a reasonable basis for determining the pro forma market value of the Company. Such general characteristics as asset size, capital position, interest-earning asset composition, funding composition, core earnings measures, loan composition, credit quality and exposure to interest rate risk all tend to support the reasonability of the Peer Group from a financial standpoint. Those areas where differences exist will be addressed in the form of valuation adjustments to the extent necessary.
| RP® Financial, LC. | VALUATION ANALYSIS |
| | IV.1 |
IV. VALUATION ANALYSIS
Introduction
This chapter presents the valuation analysis and methodology, prepared pursuant to the regulatory valuation guidelines, and valuation adjustments and assumptions used to determine the estimated pro forma market value of the common stock to be issued in conjunction with the Company’s conversion transaction.
Appraisal Guidelines
The federal regulatory appraisal guidelines required by the FRB, the OCC, the FDIC and state banking agencies specify the pro forma market value methodology for estimating the pro forma market value of a converting thrift. Pursuant to this methodology: (1) a peer group of comparable publicly-traded institutions is selected; (2) a financial and operational comparison of the subject company to the peer group is conducted to discern key differences; and (3) a valuation analysis in which the pro forma market value of the subject company is determined based on the market pricing of the peer group as of the date of valuation, incorporating valuation adjustments for key differences. In addition, the pricing characteristics of recent conversions, both at conversion and in the aftermarket, must be considered.
RP Financial Approach to the Valuation
The valuation analysis herein complies with such regulatory approval guidelines. Accordingly, the valuation incorporates a detailed analysis based on the Peer Group, discussed in Chapter III, which constitutes “fundamental analysis” techniques. Additionally, the valuation incorporates a “technical analysis” of recently completed stock conversions, particularly second-step conversions, including closing pricing and aftermarket trading of such offerings. It should be noted that these valuation analyses cannot possibly fully account for all the market forces which impact trading activity and pricing characteristics of a particular stock on a given day.
The pro forma market value determined herein is a preliminary value for the Company’s to-be-issued stock. Throughout the conversion process, RP Financial will: (1) review changes in Gouverneur Bancorp’s operations and financial condition; (2) monitor Gouverneur Bancorp’s operations and financial condition relative to the Peer Group to identify any fundamental changes; (3) monitor the external factors affecting value including, but not limited to, local and
| RP® Financial, LC. | VALUATION ANALYSIS |
| | IV.2 |
national economic conditions, interest rates, and the stock market environment, including the market for thrift stocks and GOVB’s stock specifically; and (4) monitor pending conversion offerings, particularly second-step conversions, (including those in the offering phase), both regionally and nationally. If during the second-conversion process material changes occur, RP Financial will determine if updated valuation reports should be prepared to reflect such changes and their related impact on value, if any. RP Financial will also prepare a final valuation update at the closing of the offering to determine if the prepared valuation analysis and resulting range of value continues to be appropriate.
The appraised value determined herein is based on the current market and operating environment for the Company and for all thrifts. Subsequent changes in the local and national economy, the legislative and regulatory environment, the stock market, interest rates, and other external forces (such as natural disasters or major world events), which may occur from time to time (often with great unpredictability) may materially impact the market value of all thrift stocks, including Gouverneur Bancorp’s value or Gouverneur Bancorp’s value alone. To the extent a change in factors impacting the Company’s value can be reasonably anticipated and/or quantified, RP Financial has incorporated the estimated impact into the analysis.
Valuation Analysis
A fundamental analysis discussing similarities and differences relative to the Peer Group was presented in Chapter III. The following sections summarize the key differences between the Company and the Peer Group and how those differences affect the pro forma valuation. Emphasis is placed on the specific strengths and weaknesses of the Company relative to the Peer Group in such key areas as financial condition, profitability, growth and viability of earnings, asset growth, primary market area, dividends, liquidity of the shares, marketing of the issue, management and the effect of government regulations and/or regulatory reform. We have also considered the market for thrift stocks, in particular new issues, to assess the impact on value of the Company coming to market at this time.
The financial condition of an institution is an important determinant in pro forma market value because investors typically look to such factors as liquidity, capital, asset composition and quality and funding sources in assessing investment attractiveness. The similarities and differences in the Company’s and the Peer Group’s financial strengths are noted as follows:
| RP® Financial, LC. | VALUATION ANALYSIS |
| | IV.3 |
| § | Overall A/L Composition. In comparison to the Peer Group, the Company’s interest-earning asset composition showed a lower concentration of loans and a higher concentration of cash and investments. Diversification into higher risk and higher yielding types of loans was more significant for the Peer Group, while the Company maintained a higher concentration of 1-4 family loans. Overall, in comparison to the Peer Group, the Company’s interest-earning asset composition provided for a higher yield earned on interest-earning assets with a lower risk weighted assets-to-assets ratio. Gouverneur Bancorp’s funding composition reflected a higher level of deposits and a lower level of borrowings relative to the comparable Peer Group measures, which translated into a lower cost of funds for the Company. Overall, as a percent of assets, the Company maintained a lower level of interest-earning assets and a higher level of interest-bearing liabilities compared to the Peer Group’s ratios, which resulted in a lower IEA/IBL ratio for the Company. After factoring in the impact of the net stock proceeds, the Company’s IEA/IBL ratio should be more comparable to the Peer Group’s IEA/IBL ratio. On balance, RP Financial concluded that asset/liability composition was a neutral factor in our adjustment for financial condition. |
| § | Credit Quality. The Company’s ratios for non-performing assets as a percent of assets and non-performing loans as a percent of loans were similar to the comparable ratios for the Peer Group. In comparison to the Peer Group, the Company maintained lower loss reserves as a percent of non-performing loans and as a percent of loans. The lower reserve ratios maintained by the Company were in part due to the fair value accounting adjustments applied for the acquisition of Citizens Bank. Net loan charge-offs as a percent of loans were similar for the Company and the Peer Group. The Company’s risk weighted assets-to-assets ratio was lower than the Peer Group’s ratio. Overall, RP Financial concluded that credit quality was a neural factor in our adjustment for financial condition. |
| § | Balance Sheet Liquidity. The Company operated with a higher level of cash and investment securities relative to the Peer Group (28.84% of assets versus 25.79% for the Peer Group). Following the infusion of stock proceeds, the Company’s cash and investments ratio is expected to increase as the net proceeds realized from the second-step offering will be initially deployed into cash and investments. The Company was viewed as having slightly greater future borrowing capacity relative to the Peer Group, based on the higher level of borrowings currently funding the Peer Group’s assets. Overall, RP Financial concluded that balance sheet liquidity was a slightly positive factor in our adjustment for financial condition. |
| § | Funding Liabilities. The Company’s interest-bearing funding composition reflected a higher concentration of deposits and a lower concentration of borrowings relative to the comparable Peer Group ratios, which translated into a lower cost of funds for the Company. Total interest-bearing liabilities as a percent of assets were higher for the Company. Following the stock offering, the increase in the Company’s capital position will reduce the level of interest-bearing liabilities funding the Company’s assets. Overall, RP Financial concluded that funding liabilities was a neutral factor in our adjustment for financial condition. |
| § | Capital. The Company currently operates with a lower tangible equity-to-assets ratio than the Peer Group. Following the stock offering, Gouverneur Bancorp’s pro forma tangible capital position will be more comparable to the Peer Group's tangible equity-to-assets ratio. The increase in the Company's pro forma capital position will result in greater leverage potential and reduce the level of interest-bearing liabilities utilized |
| RP® Financial, LC. | VALUATION ANALYSIS |
| | IV.4 |
to fund assets. At the same time, the Company’s more significant capital surplus will likely result in a lower ROE. On balance, RP Financial concluded that capital strength was a neutral factor in our adjustment for financial condition.
On balance, Gouverneur Bancorp’s balance sheet strength was considered to be similar relative to the Peer Group’s balance sheet strength and, thus, no adjustment was applied for the Company’s financial condition.
| 2. | Profitability, Growth and Viability of Earnings |
Earnings are a key factor in determining pro forma market value, as the level and risk characteristics of an institution’s earnings stream and the prospects and ability to generate future earnings heavily influence the multiple that the investment community will pay for earnings. The major factors considered in the valuation are described below.
| § | Reported Earnings. The Company’s reported earnings were lower than the Peer Group’s on a ROAA basis (0.43% of average assets versus 0.53% for the Peer Group). The Peer Group’s higher return was realized through a lower operating expense ratio, while the Company maintained earnings advantages with respect to higher net interest income and non-interest operating income ratios and a lower ratio of loan loss provisions. Reinvestment of stock proceeds into interest-earning assets will serve to increase the Company’s earnings, with the benefit of reinvesting proceeds expected to be somewhat offset by implementation of the stock benefit plans in connection with the second-step offering. Overall, the Company’s pro forma reported earnings were considered to be slightly less favorable than the Peer Group’s reported earnings and, thus, RP Financial concluded that this was a slightly negative factor in our adjustment for profitability, growth and viability of earnings. |
| § | Core Earnings. Net interest income, operating expenses, non-interest operating income and loan loss provisions were reviewed in assessing the relative strengths and weaknesses of the Company’s and the Peer Group’s core earnings. The Company maintained a higher net interest income ratio, a higher operating expense ratio and a higher level of non-interest operating income. The Company’s more favorable net interest income ratio and less favorable operating expense ratio translated into a slightly lower expense coverage ratio in comparison to the Peer Group’s ratio (equal to 1.05x versus 1.12x for the Peer Group). Likewise, the Company’s efficiency ratio of 85.33% was less favorable than the Peer Group’s efficiency ratio of 78.99%. Loan loss provisions had a slightly large impact on the Peer Group’s earnings. Overall, these measures, as well as the expected earnings benefits the Company should realize from the redeployment of stock proceeds into interest-earning assets and leveraging of post-conversion capital, which will be somewhat negated by expenses associated with the stock benefit plans, indicate that the Company’s pro forma core earnings will remain slightly less favorable than the Peer Group’s core earnings. Therefore, RP Financial concluded that this was a slightly negative factor in our adjustment for profitability, growth and viability of earnings. |
| RP® Financial, LC. | VALUATION ANALYSIS |
| | IV.5 |
| § | Interest Rate Risk. Quarterly changes in the Company’s and the Peer Group's net interest income to average assets ratios indicated a slightly greater degree of volatility was associated with the Company’s net interest margin. Other measures of interest rate risk, such as capital, IEA/IBL and non-interest earning asset ratios were more favorable for the Peer Group. On a pro forma basis, the infusion of stock proceeds can be expected to provide the Company with equity-to-assets and IEA/ILB ratios that are more comparable to the Peer Group’s ratios and perhaps provide greater stability in the quarterly net interest margin. On balance, RP Financial concluded that interest rate risk was a neutral factor in our adjustment for profitability, growth and viability of earnings. |
| § | Credit Risk. Loan loss provisions were a slightly larger factor in the Peer Group’s earnings (0.09% of average assets versus 0.05% of average assets for the Company). In terms of future exposure to credit quality related losses, lending diversification into higher risk types of loans was more significant for the Peer Group. The Company’s credit quality measures generally implied a similar degree of credit risk exposure relative to the comparable credit quality measures indicated for the Peer Group, particularly as differences in the Company’s and the Peer Group’s reserve coverage ratios narrowed after taking into consideration the fair value credit adjustment applied for the Company’s acquisition of Citizens Bank. Overall, RP Financial concluded that credit risk was a neutral factor in our adjustment for profitability, growth and viability of earnings. |
| § | Earnings Growth Potential. Several factors were considered in assessing earnings growth potential. First, the Company maintained a slightly higher interest rate spread than the Peer Group, which would tend to facilitate continuation of a higher net interest margin for the Company going forward based on the current prevailing interest rate environment. The reinvestment of the net proceeds will add to the Company’s net interest income, which will be somewhat negated by expenses associated with the new stock benefit plans. Second, the infusion of stock proceeds will provide the Company with similar growth potential through leverage as currently maintained by the Peer Group. Third, the Peer Group’s lower operating expense ratio was viewed as an advantage to sustain earnings growth during periods when net interest margins come under pressure as the result of adverse changes in interest rates. Overall, earnings growth potential was considered to be a neutral factor in our adjustment for profitability, growth and viability of earnings. |
| § | Return on Equity. Currently, the Company’s core ROE is slightly lower than the Peer Group’s core ROE. As the result of the increase in capital that will be realized from the infusion of net stock proceeds into the Company’s equity, the Company’s pro forma return equity on a core earnings basis will likely continue to be lower than the Peer Group’s core ROE. Accordingly, this was a slightly negative factor in the adjustment for profitability, growth and viability of earnings. |
On balance, Gouverneur Bancorp’s pro forma earnings strength was considered to be less favorable than the Peer Group’s earnings strength and, thus, a slight downward adjustment was applied for profitability, growth and viability of earnings.
| RP® Financial, LC. | VALUATION ANALYSIS |
| | IV.6 |
Comparative annual asset growth rates for the Company and the Peer Group showed respective increases of 31.43% and 9.68%, as the Company’s significantly higher growth rate was driven by the acquisitions of Citizens Bank. The Company’s asset growth was realized through a 37.04% increase in cash and investments and a 26.95% increase in loans. Comparatively, asset growth for the Peer Group consisted of a 16.49% increase in loans, which was somewhat offset by a 21.78% decrease in cash and investments. The Company’s acquisition related growth is viewed as providing the Company with greater earnings growth potential relative to the earnings growth potential that may be realized from the Peer Group’s asset growth, particularly as Company’s trailing twelve month earnings do not fully reflect the increase in earnings that is expected to be realized from the acquisition of Citizens Bank. However, at the same time, exclusive of the acquisition-related growth, the Company’s organic asset growth was less than the Peer Group’s asset growth and, in fact, following the acquisition of Citizens Bank the Company has experienced a decline in assets that included a decline in loans. On a pro forma basis, the Company’s tangible equity-to-assets ratio will be similar to the Peer Group's tangible equity-to-assets ratio, indicating similar leverage capacity for the Company and the Peer Group. On balance, no adjustment was applied for asset growth.
The general condition of an institution’s market area has an impact on value, as future success is in part dependent upon opportunities for profitable activities in the local market served. Operating in the North Country region of northern New York, the Company serves a somewhat rural market area. The Company competes against significantly larger institutions that provide a larger array of services and have significantly larger branch networks than maintained by Gouverneur Bancorp.
The Peer Group companies operate in a mix of urban, suburban and rural markets, with the six out of the ten markets served by the Peer Group companies having smaller populations compared to St. Lawrence County. Population growth for the primary market area counties served by the Peer Group companies reflected a range of growth rates, but overall population growth rates in the markets served by the Peer Group companies were stronger than St. Lawrence County’s historical and projected population growth rates which showed a declining population base. St. Lawrence County has a per capita income, which is between the Peer Group’s average and median per capita income measures, while the Peer Group’s primary
| RP® Financial, LC. | VALUATION ANALYSIS |
| | IV.7 |
market area counties were relatively more affluent markets within their respective states compared to St. Lawrence County which had a comparatively lower per capita income as a percent of New York’s per capita income (69.0% versus 91.2% for the Peer Group average). The average and median deposit market shares maintained by the Peer Group companies were higher than the Company’s market share of deposits in St. Lawrence County. Overall, the degree of competition faced by the Peer Group companies was viewed to be less than faced by the Company, while the growth potential in the markets served by the Peer Group companies was for the most part viewed to be slightly more favorable than the Company’s primary market area. Summary demographic and deposit market share data for the Company and the Peer Group companies is provided in Exhibit III-4. As shown in Table 4.1, the average unemployment rate for the primary market area counties served by the Peer Group companies was slightly lower than the unemployment rate reflected for St. Lawrence County. On balance, we concluded that a slight downward adjustment was appropriate for the Company’s market area.
Table 4.1
Market Area Unemployment Rates
Gouverneur Bancorp, Inc. and the Peer Group Companies(1)
| | | | | March 2023 | |
| | | County | | Unemployment | |
| Gouverneur Bancorp - NY | | St. Lawrence | | | 4.1 | % |
| | | | | | | |
| Peer Group Average | | | | | 3.4 | % |
| | | | | | | |
| 1895 Bancorp of Wisconsin, Inc. – WI | | Milwaukee | | | 2.8 | |
| Affinity Bancshares, Inc. – GA | | Newton | | | 3.7 | |
| Catalyst Bancorp, Inc. - LA | | St. Landry | | | 4.1 | |
| Cullman Bancorp, Inc. – AL | | Cullman | | | 1.5 | |
| Generations Bancorp NY, Inc. – NY | | Seneca | | | 3.6 | |
| Home Federal Bancorp, Inc. - LA | | Caddo | | | 3.6 | |
| Mid-Southern Bancorp, Inc. - IN | | Washington | | | 3.2 | |
| PB Bankshares, Inc. - PA | | Chester | | | 2.6 | |
| TC Bancshares, Inc. – GA | | Thomas | | | 3.8 | |
| Texas Community Bancshares, Inc. – TX | | Wood | | | 4.6 | |
(1) Unemployment rates are not seasonally adjusted.
Source: S&P Global Market Intelligence.
| RP® Financial, LC. | VALUATION ANALYSIS |
| | IV.8 |
5. Dividends
Gouverneur Bancorp has historically paid a semi-annual cash dividend to its minority shareholders and, during the fiscal year ended September 30, 2022, Gouverneur Bancorp declared total cash dividends of $0.16 per share. Gouverneur Bancorp has not indicated its intention with respect to paying cash dividends following the second-step conversion. Future declarations of dividends by the Board of Directors will depend upon a number of factors, including investment opportunities, growth objectives, financial condition, profitability, tax considerations, minimum capital requirements, regulatory limitations, stock market characteristics and general economic conditions.
Five out of the ten Peer Group companies pay regular cash dividends, with implied dividend yields ranging from 0.74% to 2.98%. The average dividend yield on the stocks of the Peer Group institutions was 0.81% as of May 8, 2023. Comparatively, as of May 8, 2023, the average dividend yield on the stocks of all fully-converted publicly-traded thrifts equaled 3.21%.
Overall, following the second-step conversion, the Company’s capacity to pay dividends is viewed to be comparable to the Peer Group’s capacity to pay dividends based on pro forma earnings and capitalization. On balance, we concluded that no adjustment was warranted for this factor.
6. Liquidity of the Shares
The Peer Group is by definition composed of companies that are traded in the public markets. All of the Peer Group companies trade on NASDAQ. Typically, the number of shares outstanding and market capitalization provides an indication of how much liquidity there will be in a particular stock. The market capitalization of the Peer Group companies ranged from $21.4 million to $82.1 million as of May 8, 2023, with average and median market values of $47.5 million and $45.8 million, respectively. The shares issued and outstanding of the Peer Group companies ranged from 2.3 million to 7.4 million, with average and median shares outstanding equal to 4.4 million and 3.9 million, respectively. The Company’s second-step stock offering is expected to provide for a pro forma market value and shares outstanding that will be less than the low end of Peer Group’s range of market values and shares outstanding. Following the second-step conversion, the Company’s stock will be quoted on the OTCQB Marketplace. Overall, we anticipate that the Company’s stock will have a less liquid trading market than the
| RP® Financial, LC. | VALUATION ANALYSIS |
| | IV.9 |
Peer Group companies on average and, therefore, concluded that a slight downward adjustment was necessary for this factor.
7. Marketing of the Issue
We believe that four separate markets exist for thrift stocks, including those coming to market such as Gouverneur Bancorp: (A) the after-market for public companies, in which trading activity is regular and investment decisions are made based upon financial condition, earnings, capital, ROE, dividends and future prospects; (B) the new issue market in which converting thrifts are evaluated on the basis of the same factors, but on a pro forma basis without the benefit of prior operations as a fully-converted company; (C) the acquisition market for thrift and bank franchises based in New York; and (D) the market for the public stock of GOVB. All of these markets were considered in the valuation of the Company’s to-be-issued stock.
A. The Public Market
The value of publicly-traded thrift stocks is easily measurable, and is tracked by most investment houses and related organizations. Exhibit IV-1 provides pricing and financial data on all publicly-traded thrifts. In general, thrift stock values react to market stimuli such as interest rates, inflation, perceived industry health, projected rates of economic growth, regulatory issues and stock market conditions in general. Exhibit IV-2 displays historical stock market trends for various indices and includes historical stock price index values for publicly-traded thrifts and commercial banks. Exhibit IV-3 displays various stock price indices as of May 8, 2023.
In terms of assessing general stock market conditions, the performance of the overall stock market has been mixed in recent quarters. Stocks opened the third quarter of 2022 trading unevenly ahead of the release of the June employment report. Fears about a recession on the horizon and the June CPI showing inflation recached a four-decade high weighed on stocks going into mid-July, which was followed by a one-day rally to closeout the second full week of trading in July. The one-day rally was fueled by a larger than expected increase in June retail sales. Second quarter earnings reports drove day-to-day fluctuations in the broader stock market going into the second half of July, which was followed by stocks rallying at the end of July after the Federal Reserve increased its target rate by 0.75% and signaled more tightening was likely this year. Geopolitical tensions in China weighed on stocks
| RP® Financial, LC. | VALUATION ANALYSIS |
| | IV.10 |
at the start of August, which was followed a broad stock market rally through mid-August. Factors contributing to the upswing in stocks included some strong earnings reports and a slowdown in inflation as indicated by the CPI. Stocks snapped a four week winning streak to close out the third week of August, as fears of additional sharp interest rate increases by the Federal Reserve prompted a multi-day selloff heading into the last two weeks of August. After rallying in advance of the Federal Reserve Chairman’s late-August speech on the economy, stocks plummeted to close out August as investors reacted to the Federal Reserve Chairman’s pledge to keep raising interest rates until it was confident that inflation was under control. Expectations that the Federal Reserve remained on track to raise interest rates following the release of the August jobs report provided for an up-and-down market for stocks during the first few days of trading in September. Stocks suffered their worst day in more than two years on September 13th, as a stronger than expected increase in the August CPI raised expectations that the Federal Reserve would move aggressively to combat inflation and, in turn, increase the possibility of a recession. In advance of the Federal Reserve’s September meeting, stocks edged higher, which was followed by a board-based selloff after the Federal Reserve raised its target rate by 0.75% and signaled the need for further rate increases. The Dow Jones Industrial Average (“DJIA”) slid into bear market territory to close out the third quarter, as investors confronted new signs of slowing global economic growth, Russia’s attempt to escalate the war in Ukraine and growing certainty that the Federal Reserve would continue to raise rates to fight inflation.
The broader stock market rebounded at the start of the fourth quarter of 2022, with the DJIA posting its best two-day gain since April 2020. A relative strong jobs report for September 2022 translated into stocks trading lower following the early-October rally, as hopes faded that the Federal Reserve would pursue a less aggressive monetary policy. After NASDAQ moved into bear territory for the second time of 2022, some favorable third quarter earnings reports fueled a broad stock market rally in the second half of October. Overall, the DJIA was up 14% for the month of October, which was its best month since 1976. Stocks traded lower at the start of November in conjunction with the Federal Reserve raising its target rate by another 0.75% and plans to keep raising rates, but potentially in smaller increments. A favorable employment report for October boosted stocks ahead of the mid-term elections, which was followed by a one-day selloff after election day amid uncertainty around the mid-term election results and turmoil in cryptocurrency markets. With the release of the October CPI showing a smaller-than-expected increase, stocks posted their biggest gains in more than two
| RP® Financial, LC. | VALUATION ANALYSIS |
| | IV.11 |
years on November 10th. Trading in the broader stock market was mixed through mid-November, as investor enthusiasm over a potential slowdown in interest rate increases faded. The up and down market continued through the second half of November, with stocks trading lower on worries about a rise in Covid-19 cases in China and then rallying after the Federal Reserve Chairman signaled a potential slowdown in interest rate increases. Economically sensitive shares led the market lower in early-December, as strong economic data increased expectations that the Federal Reserve would continue to raise interest rates throughout 2023. Slowing inflation indicated by November’s CPI fueled a stock market rally heading into mid-December, which was followed by a selloff in mid-December as weak data for retail sales and manufacturing output heightened recession fears. A jump in consumer confidence data for December sparked a one-day rally heading into the last week of 2022, which was followed by an up and down stock market during the final week of the year. Overall, the DJIA closed at 33147.25 on the last day of trading in 2022, a decrease of 8.8% for 2022, while the S&P 500 and the NASDAQ Composite ended 2022 with respective declines of 19.4% and 33.1%.
Signs that inflation was moderating and the December jobs report showing a slowdown in hiring translated into stocks trending higher during the first two weeks of 2023. A sharp drop in December retail sales prompted a selloff in the broader stock market heading into the second half of January. Some favorable fourth quarter earnings reports and indications that inflation was moderating contributed to stocks trading higher during the second half of January. All three of the major U.S. stock indexes recorded strong monthly gains for January, as investors became more confident that Federal Reserve interest rate increases were nearing an end. After a stronger-than-expected jobs report for January stoked fears that interest rate increases could continue longer than anticipated, stocks pulled back in early-February. A general downward trend continued in the broader stock market going into the second half of February, as stronger than expected inflation data further heightened concerns that Federal Reserve tightening would last longer than investors had anticipated. All three of the U.S. stock indexes posted losses for the month of February. Defensive stocks led the market higher at the start of March, which was followed by stocks sinking at the beginning of the second week of March after the Federal Reserve Chairman said the Federal Reserve would likely lift rates more than previously expected to fight inflation. Bank stocks led the market lower to close out the second week of March, as investors reacted to SVB Financial Group reporting a $2 billion loss on the sale of assets following a larger-than-expected decline in deposits and the subsequent takeover of Silicon Valley Bank by the FDIC. With investors remaining on edge about further
| RP® Financial, LC. | VALUATION ANALYSIS |
| | IV.12 |
bank failures and the heightened risk that banking-sector turmoil could tip the U.S. economy into a recession, volatility prevailed in the broader stock market in mid-March. As concerns about the health of the banking sector ebbed, stocks generally drifted higher in the closing weeks of the first the quarter with the exception of a one-day selloff that occurred when the Federal Reserve raised its target rate by another 0.25%.
The positive trend in the broader stock market generally was sustained during the first half of April 2023, as data suggesting that inflation was easing heightened optimism that the Federal Reserve could be nearing an end to its current round of interest rate increases. Growing fears of an economic slowdown pulled stocks lower heading into late-April, which was followed by stocks rallying at the end of April as a strong round of earnings reports helped the broader stock market to advance for a second month in a row. Stocks faltered at the start of May, as investors moved into safe-haven investments following the takeover of First Republic Bank by regulators and the Federal Reserve’s decision to increase its benchmark rate by another quarter-point. An upbeat jobs report for April propelled stocks higher to close out the first week of May. Major U.S. stock indexes traded in a narrow range to start the second week of May, although the NASDAQ edged up to return to bull-market territory. On May 8, 2023, the DJIA closed at 33618.69, an increase of 4.3% from one year ago and an increase of 1.4% year-to-date, and the NASDAQ closed at 12256.92, an increase of 5.5% from one year ago and an increase of 17.1% year-to-date. The S&P 500 Index closed at 4138.12 on May 8, 2023, an increase of 3.7% from one year ago and an increase of 7.8% year-to-date.
The market for thrift stocks has also experienced varied trends in recent quarters, but, in general, has significantly underperformed the broader stock market. At the start of the third quarter of 2022, bank stocks showed little movement ahead of the June employment report. Bank stocks traded lower at the start of the second quarter earnings season, as J.P. Morgan’s second quarter earnings report spotlighted concerns about the outlook for the U.S. economy. The one-day rally in the broader stock market in mid-July lifted bank stocks as well, which was in part supported by favorable second quarter earnings reports posted by some large banks. A favorable earnings outlook reported by some banks in their second quarter earnings reports and the rally in the broader stock market following the Federal Reserve’s rate hike helped to sustain a positive trend for financial shares through the second half of July. After edging lower at the start of August, a stronger-than-expected jobs report for July and a slightly slower pace of inflation indicated by the July CPI contributed to financial shares trending higher through mid-August. Bank stocks reversed course and followed the broader stock market lower
| RP® Financial, LC. | VALUATION ANALYSIS |
| | IV.13 |
during the second half of August, as investors assessed the likelihood that the Federal Reserve would continue to move aggressively to tame inflation and the potential that higher interest rates could push the U.S. economy into a protracted economic downturn. After edging lower at the start of September, financial shares traded higher along with the broader stock market heading into mid-September. Financial shares participated in the broader market selloff with the release of the August CPI in mid-September, which indicated that inflation remained elevated and raised expectations that the Federal Reserve would continue to raise rates aggressively in an effort to combat inflation. The downturn in bank stocks accelerated in the second half of September, as fears of an economic slowdown mounted following the Federal Reserve’s 0.75% rate hike and expectations that the Federal Reserve would continue to raise rates for the balance of 2022.
Financial shares paralleled trends in the broader stock market at the beginning of the fourth quarter of 2022, initially trading up and then retreating with the strong jobs report for September diminishing expectations of an easing in the Federal Reserve’s monetary policy. Bank shares led a mid-October stock market rally, as some large banks posted better-than-expected third quarter earnings. Generally favorable third quarter earnings reports coming out of the banking sector and indications by some Federal Reserve officials that they were considering whether to slow the pace of monetary tightening helped to sustain the positive trend for bank stocks through the end of October. After trading in a narrow range at the beginning of November and through the mid-term elections, bank stocks traded up on the lower-than-expected increase in the October CPI. Financial shares eased lower heading into the second half of November, as stronger-than-expected retail sales for October increased expectations that the Federal Reserve would keep raising interest rates to reduce persistently high inflation. Signs of inflation cooling and the possibility of smaller interest rate increases by the Federal Reserve contributed to bank stocks edging higher during the second half of November, which was followed by bank stocks and other economically shares leading the market lower during the first half of December. Recession worries elevated by indications from the Federal Reserve that it may have to hold interest rates higher for longer than expected was a driving factor that fueled the downturn in bank stocks. In the closing weeks of 2022, bank stocks traded in a narrow range and then edged higher at the end of December. For 2022 overall, the S&P U.S. BMI Banks Index was down 19.4%.
Bank stocks followed the broader stock market’s positive trend during the first half of January 2023 and then retreated heading into the second half of January, as recession worries came into focus on the report that retail sales for December posted their biggest decline
| RP® Financial, LC. | VALUATION ANALYSIS |
| | IV.14 |
in 2022. Prospects that the Federal Reserve would begin to dial back its interest rate increases and fourth quarter GDP data that showed economic growth slowed less than expected provided for a slightly positive trend for bank stocks in the second half of January, which continued into early-February as the quarter-point rate hike by the Federal Reserve was in line with expectations. Fourth quarter earnings season translated into a narrow trading range for bank stocks through mid-February, which was followed by bank stocks trading lower along with the selloff in the broader stock market as inflation data raised expectations that the Federal Reserve would keep interest rates higher for longer than had been anticipated. A generally stable market prevailed for bank stocks at the end of February and into early-March, which was followed by a sharp selloff in the banking sector through mid-March. The selloff was ignited by the collapse of Silicon Valley Bank followed by the failure of Signature Bank, which raised fears that more banks could be in trouble. Bank shares closed out the last two weeks of the first quarter trading in a narrow range, as concerns about the health of the banking sector eased and the FDIC completed the sale of Silicon Valley Bank to First Citizens Bancshares.
Data indicating that the labor market was softening translated into bank stocks trading lower at the start of the second quarter of 2023, which was followed by an upswing in bank stocks through mid-April. Factors contributing to the positive trend in bank stocks included a stronger-than-expected jobs report for March, data showing a slower pace of inflation and some big banks reporting better-than-expected earnings at the start of the first quarter earnings season. Heightened recession fears pressured financial shares lower in the second half of April, which was followed by a more pronounced selloff in bank stocks at the beginning of May. Persistent worries about regional banks and the economy were noted factors that fueled the retreat in bank stocks. The better-than-expected employment report for April helped banks stocks to reverse course and rally along with the broader stock market to close out the first week of May. On May 8, 2023, the S&P U.S. BMI Banks Index closed at 122.2, a decrease of 21.7% from one year ago and a decrease of 17.7% year-to-date.
B. The New Issue Market
In addition to thrift stock market conditions in general, the new issue market for converting thrifts is also an important consideration in determining the Company’s pro forma market value. The new issue market is separate and distinct from the market for seasoned thrift stocks in that the pricing ratios for converting issues are computed on a pro forma basis, specifically: (1) the numerator and denominator are both impacted by the conversion offering
| RP® Financial, LC. | VALUATION ANALYSIS |
| | IV.15 |
amount, unlike existing stock issues in which price change affects only the numerator; and (2) the pro forma pricing ratio incorporates assumptions regarding source and use of proceeds, effective tax rates, stock plan purchases, etc. which impact pro forma financials, whereas pricing for existing issues are based on reported financials. The distinction between pricing of converting and existing issues is perhaps no clearer than in the case of the price/book (“P/B”) ratio in that the P/B ratio of a converting thrift will typically result in a discount to book value whereas in the current market for existing thrifts the P/B ratio may reflect a premium to book value. Therefore, it is appropriate to also consider the market for new issues, both at the time of the conversion and in the aftermarket.
As shown in Table 4.2, three standard conversion offerings, one second -step offering and one mutual holding company offering were completed during 2022 and one second-step offering has been completed during 2023 through May 8, 2023. The recent second-step conversion offering was completed by First Seacoast Bancorp, Inc. of New Hampshire (“First Seacoast”), which was completed on January 20, 2023. First Seacoast’s offering was larger in size in comparison to Gouverneur Bancorp’s proposed second-step offering. First Seacoast’s second-step offering was closed at the minimum of its offerings range at a closing pro forma price/tangible book ratio of 74.10% and the stock was up 3.9% after the first week of trading. As of May 8, 2023, First Seacoast’s stock price was down 16.3% from its IPO price.
C. The Acquisition Market
Also considered in the valuation was the potential impact on Gouverneur Bancorp’s stock price of recently completed and pending acquisitions of other thrift and bank institutions operating in New York. As shown in Exhibit IV-4, there were 27 acquisitions of New York based bank and savings institutions completed from the beginning of 2018 through May 8, 2023, including GOVB’s acquisition of Citizens Bank, and there is currently one acquisition pending for a New York based bank or savings institution. The recent acquisition activity involving New York bank and savings institutions may imply a certain degree of acquisition speculation for the Company’s stock. To the extent that acquisition speculation may impact the Company’s offering, we have largely taken this into account in selecting companies for the Peer Group that could be subject to the same type of acquisition speculation that may influence Gouverneur Bancorp’s stock. However, since converting thrifts are subject to a three-year
| Table 4.2 |
| Pricing Characteristics and After-Market Trends |
| Conversions Completed in 2022 and Year-to-Date 2023 |
| | | | | | | | | | | | | | | | | | | | | | | | | | | | | | | | | | | | | | | | | | | | | | | | | | | | | | | | | | | | | | | | | | | | | | | | | | | | | | | | | | | | | | | | | | | | | | |
| Institutional Information | | Pre-Conversion Data | | | Offering Information | | | Contribution to | | Insider Purchases | | | | | | Pro Forma Data | | | | | | Post-IPO Pricing Trends | |
| | | | | | | Financial Info. | | | Asset Quality | | | | | | | | | | | | | | | Char. Found. | | % Off Incl. Fdn.+Merger Shares | | | | | | Pricing Ratios(2)(5) | | | Financial Charac. | | | | | | Closing Price: | |
| | | | | | | | | | | | | | | | | | | Excluding Foundation | | | | | % of | | | Benefit Plans | | | | | | Initial | | | | | | | | | | | | | | | | | | | | | | | | First | | | | | | After | | | | | | After | | | | | | | | | | |
| | | Conversion | | | | | | | Equity/ | | | NPAs/ | | | Res. | | | Gross | | | % | | | % of | | | Exp./ | | | | | Public Off. | | | | | | Recog. | | | Stk | | | Mgmt.& | | | Div. | | | | | | Core | | | | | | Core | | | | | | Core | | | IPO | | | Trading | | | % | | | First | | | % | | | First | | | % | | | Thru | | | % | |
| Institution | | Date | | Ticker | | Assets | | | Assets | | | Assets | | | Cov. | | | Proc. | | | Offer | | | Mid. | | | Proc. | | | Form | | Inc. Fdn. | | | ESOP | | | Plans | | | Option | | | Dirs. | | | Yield | | | P/TB | | | P/E | | | P/A | | | ROA | | | TE/A | | | ROE | | | Price | | | Day | | | Chg | | | Week(3) | | | Chg | | | Month(4) | | | Chg | | | 5/8/23 | | | Chg | |
| | | | | | | ($Mil) | | | (%) | | | (%) | | | (%) | | | ($Mil.) | | | (%) | | | (%) | | | (%) | | | | | (%) | | | (%) | | | (%) | | | (%) | | | (%)(1) | | | (%) | | | (%) | | | (x) | | | (%) | | | (%) | | | (%) | | | (%) | | | ($) | | | ($) | | | (%) | | | ($) | | | (%) | | | ($) | | | (%) | | | ($) | | | (%) | |
| Standard Conversions | | | | | | | | | | | | | | | | | | | | | | | | | | | | | | | | | | | | | | | | | | | | | | | | | | | | | | | | | | | | | | | | | | | | | | | | | | | | | | | | | | | | | | | | | | | | | | | | | | | | | | | | | | | | | | | | | | | | | | | | | | |
| ECB Bancorp, Inc., MA | | 7/28/22 | | ECBK-NASDAQ | | $ | 689 | | | | 11.42 | % | | | 0.11 | % | | | 589 | % | | $ | 89.2 | | | | 100 | % | | | 96 | % | | | 2.7 | % | | C/S | | $ | 600/2.83 | % | | | 8.0 | % | | | 4.0 | % | | | 10.0 | % | | | 3.8 | % | | | 0.00 | % | | | 59.3 | % | | | 19.1 | x | | | 12.0 | % | | | 0.6 | % | | | 20.2 | % | | | 3.1 | % | | $ | 10.00 | | | $ | 14.09 | | | | 40.9 | % | | $ | 14.13 | | | | 41.3 | % | | $ | 14.06 | | | | 40.6 | % | | $ | 11.25 | | | | 12.5 | % |
| VWF Bancorp, Inc., OH | | 7/14/22 | | VWFB-OTCQB | | $ | 137 | | | | 17.62 | % | | | 0.17 | % | | | 96 | % | | $ | 19.2 | | | | 100 | % | | | 87 | % | | | 7.8 | % | | N.A. | | | N.A. | | | | 8.0 | % | | | 4.0 | % | | | 10.0 | % | | | 25.1 | % | | | 0.00 | % | | | 51.8 | % | | | NM | | | | 12.8 | % | | | 0.1 | % | | | 24.8 | % | | | 0.3 | % | | $ | 10.00 | | | $ | 12.90 | | | | 29.0 | % | | $ | 14.50 | | | | 45.0 | % | | $ | 14.90 | | | | 49.0 | % | | $ | 13.55 | | | | 35.5 | % |
| NSTS Bancorp, Inc., IL | | 1/19/22 | | NSTS-NASDAQ | | $ | 260 | | | | 17.68 | % | | | 0.70 | % | | | 529 | % | | $ | 52.9 | | | | 100 | % | | | 132 | % | | | 3.7 | % | | C/S | | $ | 150/2.00 | % | | | 8.0 | % | | | 4.0 | % | | | 10.0 | % | | | 5.0 | % | | | 0.00 | % | | | 59.5 | % | | | NM | | | | 17.7 | % | | | -0.2 | % | | | 29.8 | % | | | -0.6 | % | | $ | 10.00 | | | $ | 12.59 | | | | 25.9 | % | | $ | 12.30 | | | | 23.0 | % | | $ | 12.50 | | | | 25.0 | % | | $ | 8.40 | | | | -16.0 | % |
| | | | | | | | | | | | | | | | | | | | | | | | | | | | | | | | | | | | | | | | | | | | | | | | | | | | | | | | | | | | | | | | | | | | | | | | | | | | | | | | | | | | | | | | | | | | | | | | | | | | | | | | | | | | | | | | | | | | | | | | | | | |
| Averages - Standard Conversions: | | $ | 362 | | | | 15.57 | % | | | 0.33 | % | | | 405 | % | | $ | 53.8 | | | | 100 | % | | | 105 | % | | | 4.7 | % | | N.A. | | | N.A. | | | | 8.0 | % | | | 4.0 | % | | | 10.0 | % | | | 11.3 | % | | | 0.00 | % | | | 56.9 | % | | | 19.1 | x | | | 14.2 | % | | | 0.2 | % | | | 24.9 | % | | | 0.9 | % | | $ | 10.00 | | | $ | 13.19 | | | | 31.9 | % | | $ | 13.64 | | | | 36.4 | % | | $ | 13.82 | | | | 38.2 | % | | $ | 11.07 | | | | 10.7 | % |
| Medians - Standard Conversions: | | $ | 260 | | | | 17.62 | % | | | 0.17 | % | | | 529 | % | | $ | 52.9 | | | | 100 | % | | | 96 | % | | | 3.7 | % | | N.A. | | | N.A. | | | | 8.0 | % | | | 4.0 | % | | | 10.0 | % | | | 5.0 | % | | | 0.00 | % | | | 59.3 | % | | | 19.1 | x | | | 12.8 | % | | | 0.1 | % | | | 24.8 | % | | | 0.3 | % | | $ | 10.00 | | | $ | 12.90 | | | | 29.0 | % | | $ | 14.13 | | | | 41.3 | % | | $ | 14.06 | | | | 40.6 | % | | $ | 11.25 | | | | 12.5 | % |
| | | | | | | | | | | | | | | | | | | | | | | | | | | | | | | | | | | | | | | | | | | | | | | | | | | | | | | | | | | | | | | | | | | | | | | | | | | | | | | | | | | | | | | | | | | | | | | | | | | | | | | | | | | | | | | | | | | | | | | | | | | |
| Second Step Conversions | | | | | | | | | | | | | | | | | | | | | | | | | | | | | | | | | | | | | | | | | | | | | | | | | | | | | | | | | | | | | | | | | | | | | | | | | | | | | | | | | | | | | | | | | | | | | | | | | | | | | | | | | | | | | | | | | | | | | | | | | | |
| First Seacoast Bancorp, Inc., NH | | 1/20/23 | | FSEA-NASDAQ | | $ | 524 | | | | 9.11 | % | | | 0.00 | % | | | 717 | % | | $ | 28.1 | | | | 55 | % | | | 85 | % | | | 5.7 | % | | N.A. | | | N.A. | | | | 8.0 | % | | | 4.0 | % | | | 10.0 | % | | | 1.5 | % | | | 0.00 | % | | | 74.1 | % | | | 30.6 | x | | | 9.3 | % | | | 0.3 | % | | | 12.6 | % | | | 2.4 | % | | $ | 10.00 | | | $ | 10.35 | | | | 3.5 | % | | $ | 10.39 | | | | 3.9 | % | | $ | 10.28 | | | | 2.8 | % | | $ | 8.37 | | | | -16.3 | % |
| Ponce Financial Group, Inc., NY* | | 1/28/22 | | PDLB-NASDAQ | | $ | 1,561 | | | | 11.14 | % | | | 1.05 | % | | | 157 | % | | $ | 133.2 | | | | 54 | % | | | 127 | % | | | 3.0 | % | | C/S | | $ | 1.0M/2.91 | % | | | 8.0 | % | | | 4.0 | % | | | 10.0 | % | | | 0.9 | % | | | 0.00 | % | | | 85.9 | % | | | 34.6 | x | | | 14.8 | % | | | 0.4 | % | | | 17.2 | % | | | 2.5 | % | | $ | 10.00 | | | $ | 10.79 | | | | 7.9 | % | | $ | 10.65 | | | | 6.5 | % | | $ | 10.65 | | | | 6.5 | % | | $ | 7.05 | | | | -29.5 | % |
| | | | | | | | | | | | | | | | | | | | | | | | | | | | | | | | | | | | | | | | | | | | | | | | | | | | | | | | | | | | | | | | | | | | | | | | | | | | | | | | | | | | | | | | | | | | | | | | | | | | | | | | | | | | | | | | | | | | | | | | | | | |
| Averages - Second Step Conversions: | | $ | 1,042 | | | | 10.13 | % | | | 0.53 | % | | | 437 | % | | $ | 80.6 | | | | 55 | % | | | 106 | % | | | 4.3 | % | | N.A. | | | N.A. | | | | 8.0 | % | | | 4.0 | % | | | 10.0 | % | | | 1.2 | % | | | 0.00 | % | | | 80.0 | % | | | 32.6 | x | | | 12.0 | % | | | 0.4 | % | | | 14.9 | % | | | 2.4 | % | | $ | 10.00 | | | $ | 10.57 | | | | 5.7 | % | | $ | 10.52 | | | | 5.2 | % | | $ | 10.47 | | | | 4.7 | % | | $ | 7.71 | | | | -22.9 | % |
| Medians - Second Step Conversions: | | $ | 1,042 | | | | 10.13 | % | | | 0.53 | % | | | 437 | % | | $ | 80.6 | | | | 106 | % | | | 4 | % | | | 4.3 | % | | N.A. | | | N.A. | | | | 8.0 | % | | | 4.0 | % | | | 10.0 | % | | | 1.2 | % | | | 0.00 | % | | | 80.0 | % | | | 32.6 | x | | | 12.0 | % | | | 0.4 | % | | | 14.9 | % | | | 2.4 | % | | $ | 10.00 | | | $ | 10.57 | | | | 5.7 | % | | $ | 10.52 | | | | 5.2 | % | | $ | 10.47 | | | | 4.7 | % | | $ | 7.71 | | | | -22.9 | % |
| | | | | | | | | | | | | | | | | | | | | | | | | | | | | | | | | | | | | | | | | | | | | | | | | | | | | | | | | | | | | | | | | | | | | | | | | | | | | | | | | | | | | | | | | | | | | | | | | | | | | | | | | | | | | | | | | | | | | | | | | | | |
| Mutual Holding Companies | | | | | | | | | | | | | | | | | | | | | | | | | | | | | | | | | | | | | | | | | | | | | | | | | | | | | | | | | | | | | | | | | | | | | | | | | | | | | | | | | | | | | | | | | | | | | | | | | | | | | | | | | | | | | | | | | | | | | | | | | | |
| CFSB Bancorp, Inc., MA* | | 1/13/22 | | CFSB-NASDAQ | | $ | 337 | | | | 14.56 | % | | | 0.00 | % | | | NM | | | $ | 28.0 | | | | 43 | % | | | 130 | % | | | 5.4 | % | | C/S | | $ | 250/4.44 | % | | | 8.7 | % | | | 4.4 | % | | | 10.9 | % | | | 5.2 | % | | | 0.00 | % | | | 63.2 | % | | | 75.4 | x | | | 16.7 | % | | | 0.3 | % | | | 20.0 | % | | | 1.6 | % | | $ | 10.00 | | | $ | 10.18 | | | | 1.8 | % | | $ | 10.65 | | | | 6.5 | % | | $ | 10.63 | | | | 6.3 | % | | $ | 6.72 | | | | -32.8 | % |
| | | | | | | | | | | | | | | | | | | | | | | | | | | | | | | | | | | | | | | | | | | | | | | | | | | | | | | | | | | | | | | | | | | | | | | | | | | | | | | | | | | | | | | | | | | | | | | | | | | | | | | | | | | | | | | | | | | | | | | | | | | |
| Averages - MHC Conversions: | | $ | 337 | | | | 14.56 | % | | | 0.00 | % | | | NM | | | $ | 28.0 | | | | 43 | % | | | 130 | % | | | 5.4 | % | | N.A. | | | N.A. | | | | 8.7 | % | | | 4.4 | % | | | 10.9 | % | | | 5.2 | % | | | 0.00 | % | | | 63.2 | % | | | 75.4 | x | | | 16.7 | % | | | 0.3 | % | | | 20.0 | % | | | 1.6 | % | | $ | 10.00 | | | $ | 10.18 | | | | 1.8 | % | | $ | 10.65 | | | | 6.5 | % | | $ | 10.63 | | | | 6.3 | % | | $ | 6.72 | | | | -32.8 | % |
| Medians - MHC Conversions: | | $ | 337 | | | | 14.56 | % | | | 0.00 | % | | | NM | | | $ | 28.0 | | | | 43 | % | | | 130 | % | | | 5.4 | % | | N.A. | | | N.A. | | | | 8.7 | % | | | 4.4 | % | | | 10.9 | % | | | 5.2 | % | | | 0.00 | % | | | 63.2 | % | | | 75.4 | x | | | 16.7 | % | | | 0.3 | % | | | 20.0 | % | | | 1.6 | % | | $ | 10.00 | | | $ | 10.18 | | | | 1.8 | % | | $ | 10.65 | | | | 6.5 | % | | $ | 10.63 | | | | 6.3 | % | | $ | 6.72 | | | | -32.8 | % |
| | | | | | | | | | | | | | | | | | | | | | | | | | | | | | | | | | | | | | | | | | | | | | | | | | | | | | | | | | | | | | | | | | | | | | | | | | | | | | | | | | | | | | | | | | | | | | | | | | | | | | | | | | | | | | | | | | | | | | | | | | | |
| Averages - All Conversions: | | $ | 584 | | | | 13.59 | % | | | 0.34 | % | | | 418 | % | | $ | 58.4 | | | | 75 | % | | | 110 | % | | | 4.7 | % | | N.A. | | | N.A. | | | | 8.1 | % | | | 4.1 | % | | | 10.1 | % | | | 6.9 | % | | | 0.00 | % | | | 65.6 | % | | | 33.0 | x | | | 13.9 | % | | | 0.3 | % | | | 20.8 | % | | | 1.6 | % | | $ | 10.00 | | | $ | 11.82 | | | | 18.2 | % | | $ | 12.10 | | | | 21.0 | % | | $ | 12.17 | | | | 21.7 | % | | $ | 9.22 | | | | -7.8 | % |
| Medians - All Conversions: | | $ | 430 | | | | 12.99 | % | | | 0.17 | % | | | 529 | % | | $ | 40.5 | | | | 78 | % | | | 112 | % | | | 4.5 | % | | N.A. | | | N.A. | | | | 8.0 | % | | | 4.0 | % | | | 10.0 | % | | | 4.4 | % | | | 0.00 | % | | | 61.3 | % | | | 24.9 | x | | | 13.8 | % | | | 0.3 | % | | | 20.1 | % | | | 2.0 | % | | $ | 10.00 | | | $ | 11.69 | | | | 16.9 | % | | $ | 11.48 | | | | 14.8 | % | | $ | 11.58 | | | | 15.8 | % | | $ | 8.39 | | | | -16.2 | % |
| Note: * - Appraisal performed by RP Financial; BOLD = RP Financial assisted in the business plan preparation, "NT" - Not Traded; "NA" - Not Applicable, Not Available; C/S-Cash/Stock. |
| | | | | |
| (1) As a percent of MHC offering for MHC transactions. | | (5) Mutual holding company pro forma data on full conversion basis. | | |
| (2) Does not take into account the adoption of SOP 93-6. | | (6) Simultaneously completed acquisition of another financial institution. | | |
| (3) Latest price if offering is less than one week old. | | (7) Simultaneously converted to a commercial bank charter. | | |
| (4) Latest price if offering is more than one week but less than one month old. | | (8) Former credit union. | | May 8, 2023 |
| RP® Financial, LC. | VALUATION ANALYSIS |
| | IV.17 |
regulatory moratorium from being acquired, acquisition speculation in Gouverneur Bancorp’s stock would tend to be less compared to the stocks of the Peer Group companies.
D. Trading in GOVB’s Stock
Since GOVB’s minority stock currently trades under the symbol “GOVB” on the OTC Pink Market Place, RP Financial also considered the recent trading activity in the valuation analysis, although, in general, trading activity in the Company’s stock is very limited. GOVB had a total of 2,031,377 shares issued and outstanding at March 31, 2023, of which 720,155 shares were held by public shareholders and traded as public securities. The Company’s stock has had a 52 week trading range of $6.50 to $10.97 per share and its closing price on May 8, 2023 was $7.20 per share. There are significant differences between the Company’s minority stock (currently being traded) and the conversion stock that will be issued by the Company. Such differences include different liquidity characteristics, a different return on equity for the conversion stock and the stock is currently traded based on its MHC ownership structure. Since the pro forma impact has not been publicly disseminated to date, it is appropriate to discount the current trading level. As the pro forma impact is made known publicly, the trading level will become more informative.
* * * * * * * * * * *
In determining our valuation adjustment for marketing of the issue, we considered trends in both the overall thrift market, the new issue market including the new issue market for second-step conversions, the acquisition market and recent trading activity in the Company’s minority stock. Taking these factors and trends into account, RP Financial concluded that a moderate downward adjustment was appropriate in the valuation analysis for purposes of marketing of the issue.
8. Management
The Company’s management team appears to have experience and expertise in all of the key areas of the Company’s operations. Exhibit IV-5 provides summary resumes of the Company’s Board of Directors and senior management. The financial characteristics of the Company and the recent successful completion of the Citizens Bank acquisition suggest that
| RP® Financial, LC. | VALUATION ANALYSIS |
| | IV.18 |
the Board and senior management have been effective in implementing an operating strategy that can be well managed by the Company’s present organizational structure.
The Company’s previous longtime President and Chief Executive Officer and current member of the Company’s board of directors, was appointed to assume the duties of President and Chief Executive Officer on an interim basis while the Company undertakes a search for a permanent replacement for the Company’sr former President and Chief Executive Officer, who resigned in April 2023. The Company is currently working with a third party executive search firm to find its next President and Chief Executive Officer, but currently expects that the interim President and Chief Executive Officer will continue to serve in that position until a new President and Chief Executive Officer has been hired.
Similarly, the returns, equity positions and other operating measures of the Peer Group companies are indicative of well-managed financial institutions, which have Boards and management teams that have been effective in implementing competitive operating strategies. Therefore, on balance, we concluded no valuation adjustment relative to the Peer Group was appropriate for this factor.
9. Effect of Government Regulation and Regulatory Reform
As a fully-converted regulated institution, Gouverneur Bancorp will operate in substantially the same regulatory environment as the Peer Group members -- all of whom are adequately capitalized institutions and are operating with no apparent restrictions. Exhibit IV-6 reflects the Bank’s pro forma regulatory capital ratios. On balance, no adjustment has been applied for the effect of government regulation and regulatory reform.
Summary of Adjustments
Overall, based on the factors discussed above, we concluded that the Company’s pro forma market value should reflect the following valuation adjustments relative to the Peer Group:
| RP® Financial, LC. | VALUATION ANALYSIS |
| | IV.19 |
| Key Valuation Parameters: | | Valuation Adjustment |
| | | |
| Financial Condition | | No Adjustment |
| Profitability, Growth and Viability of Earnings | | Slight Downward |
| Asset Growth | | No Adjustment |
| Primary Market Area | | Slight Downward |
| Dividends | | No Adjustment |
| Liquidity of the Shares | | Slight Downward |
| Marketing of the Issue | | Moderate Downward |
| Management | | No Adjustment |
| Effect of Govt. Regulations and Regulatory Reform | | No Adjustment |
Valuation Approaches
In applying the accepted valuation methodology promulgated by the FRB, i.e., the pro forma market value approach, we considered the three key pricing ratios in valuing the Company’s to-be-issued stock -- price/earnings (“P/E”), price/book (“P/B”), and price/assets (“P/A”) approaches -- all performed on a pro forma basis including the effects of the stock proceeds. In computing the pro forma impact of the conversion and the related pricing ratios, we have incorporated the valuation parameters disclosed in the Company’s prospectus for reinvestment rate, effective tax rate, stock benefit plan assumptions and expenses (summarized in Exhibits IV-7 and IV-8). In our estimate of value, we assessed the relationship of the pro forma pricing ratios relative to the Peer Group and recent conversion offerings.
RP Financial’s valuation placed an emphasis on the following:
| § | P/E Approach. The P/E approach is generally the best indicator of long-term value for a stock and we have given it significant weight among the valuation approaches. Given certain similarities between the Company’s and the Peer Group’s earnings composition and overall financial condition, the P/E approach was carefully considered in this valuation. At the same time, recognizing that (1) the earnings multiples will be evaluated on a pro forma basis for the Company; and (2) the Peer Group companies have had the opportunity to realize the benefit of reinvesting and leveraging their offering proceeds, we also gave weight to the other valuation approaches. |
| § | P/B Approach. P/B ratios have generally served as a useful benchmark in the valuation of thrift stocks, particularly in the context of a public offering, as the earnings approach involves assumptions regarding the use of proceeds. RP Financial considered the P/B approach to be a valuable indicator of pro forma value, taking into account the pricing ratios under the P/E and P/A approaches. We have also modified the P/B approach to exclude the impact of intangible assets (i.e., price/tangible book value or “P/TB”), in that the investment community frequently makes this adjustment in its evaluation of this pricing approach. |
| RP® Financial, LC. | VALUATION ANALYSIS |
| | IV.20 |
| § | P/A Approach. P/A ratios are generally a less reliable indicator of market value, as investors typically assign less weight to assets and attribute greater weight to book value and earnings. Furthermore, this approach as set forth in the regulatory valuation guidelines does not take into account the amount of stock purchases funded by deposit withdrawals, thus understating the pro forma P/A ratio. At the same time, the P/A ratio is an indicator of franchise value, and, in the case of highly capitalized institutions, high P/A ratios may limit the investment community’s willingness to pay market multiples for earnings or book value when ROE is expected to be low. |
| § | Trading of GOVB stock. Converting institutions generally do not have stock outstanding. GOVB, however, has public shares outstanding due to the mutual holding company form of ownership and first-step minority stock offering. Since GOVB’s stock is currently quoted on the OTC Pink Marketplace, it is an indicator of the Company’s current market value and, therefore, received some limited consideration in our valuation. Based on the May 8, 2022 closing stock price of $7.20 per share and the 2,031,377 shares of GOVB common stock outstanding, the Company’s implied market value of $14.6 million was considered in the valuation process. However, since the Company’s stock is not actively traded, the conversion stock will have different characteristics than the minority shares and the pro forma information has not been publicly disseminated to date, the current trading price of GOVB’s stock was somewhat discounted herein but will become more important towards the closing of the offering. |
The Company has adopted “Employers’ Accounting for Employee Stock Ownership Plans” (“ASC 718-40”), which causes earnings per share computations to be based on shares issued and outstanding excluding unreleased ESOP shares. For purposes of preparing the pro forma pricing analyses, we have reflected all shares issued in the offering, including all ESOP shares, to capture the full dilutive impact, particularly since the ESOP shares are economically dilutive, receive dividends and can be voted. However, we did consider the impact of ASC 718-40 in the valuation.
In preparing the pro forma pricing analysis we have taken into account the pro forma impact of the MHC’s net assets (i.e., unconsolidated equity) that will be consolidated with the Company and, thus, will slightly increase equity. At March 31, 2023, the MHC had net assets of $260,000, which has been added to the Company’s March 31, 2023 pro forma equity to reflect the consolidation of the MHC into the Company’s operations. Exhibit IV-9 shows that after accounting for the impact of the MHC’s net assets, the public shareholders’ ownership interest was reduced by approximately 0.71%. Accordingly, for purposes of the Company’s pro forma valuation, the public shareholders’ ownership interest was reduced from 35.45% to 34.74% and the MHC’s ownership interest was increased from 64.55% to 65.26%.
| RP® Financial, LC. | VALUATION ANALYSIS |
| | IV.21 |
Based on the application of the three valuation approaches, taking into consideration the valuation adjustments discussed above, RP Financial concluded that as of May 8, 2023, the aggregate pro forma market value of Gouverneur Bancorp’s conversion stock equaled $13,025,610 at the midpoint, equal to 1,302,561 shares at $10.00 per share. The $10.00 per share price was determined by the Boards of Directors of GOVB, the Bank and the MHC. The midpoint and resulting valuation range is based on the sale of a 65.26% ownership interest to the public, which provides for an $8,500,000 public offering at the midpoint value.
1. Price-to-Earnings (“P/E”). The application of the P/E valuation method requires calculating the Company’s pro forma market value by applying a valuation P/E multiple to the pro forma earnings base. In applying this technique, we considered both reported earnings and a recurring earnings base, that is, earnings adjusted to exclude any one-time non-operating items, plus the estimated after-tax earnings benefit of the reinvestment of the net proceeds. The Company’s reported earnings equaled $740,000 for the twelve months ended March 31, 2023. In deriving Gouverneur Bancorp’s core earnings, the adjustments we made to reported earnings included the elimination of net gains on interest rate swaps of $896,000, loss on sale of securities of $661,000 and merger related expenses of $270,000. As shown below, on a tax effected basis, assuming an effective marginal tax rate of 21.0% for the earnings adjustments, the Company’s core earnings were determined to equal $768,000 for the twelve months ended March 31, 2023.
| | | Amount | |
| | | | ($000) | |
| Net income(loss) | | $ | 740 | |
| Add: Merger expenses(1) | | | 213 | |
| Add: Loss on sale of securities (1) | | | 522 | |
| Deduct: Gain on interest rate swaps (1) | | | (707 | ) |
| Core earnings estimate | | $ | 768 | |
(1) Tax effected at 21.0%.
Based on the Company’s reported earnings and incorporating the impact of the pro forma assumptions discussed previously, the Company’s pro forma reported and core P/E multiples at the $13.0 million midpoint value equaled 17.35x and 16.73x, respectively, indicating a premium of 22.53% and a discount of 3.85% relative to the Peer Group’s average reported and core earnings multiples of 14.16x and 17.40x, respectively (see Table 4.3). In comparison to the Peer Group’s median reported and core earnings multiples of 14.05x and 16.47x,
| RP® Financial, LC. | VALUATION ANALYSIS |
| | IV.22 |
Table 4.3
Market Pricing Versus Peer Group
Gouverneur Bancorp, Inc.
As of May 8, 2023
| | | | | | Market | | Per Share Data | | | | | | | | | | | | | | | | | | | | | | | | | | | | | | | | | | | | | | | | | | | | | | | | | |
| | | | | | Capitalization | | Core | | Book | | | | | | | | | | | | | | | Dividends(3) | | | Financial Characteristics(5) | | | | | | |
| | | | | | Price/ | | Market | | 12 Month | | Value/ | | Pricing Ratios(2) | | Amount/ | | | | | Payout | | | Total | | Equity/ | | | Tang. Eq./ | | | NPAs/ | | | Reported | | | Core | | | Offering | | Exchange | |
| | | | | Share | | Value | | EPS(1) | | Share | | P/E | | P/B | | | P/A | | | P/TB | | | P/Core | | Share | | Yield | | | Ratio(4) | | | Assets | | Assets | | | T. Assets | | | Assets | | | ROAA | | | ROAE | | | ROAA | | | ROAE | | | Range | | Ratio | |
| | | | | | ($) | | ($Mil) | | ($) | | ($) | | (x) | | (%) | | | (%) | | | (%) | | | (x) | | ($) | | (%) | | | (%) | | | ($Mil) | | (%) | | | (%) | | | (%) | | | (%) | | | (%) | | | (%) | | | (%) | | | ($Mil) | | (xl) | |
| Gouverneur Bancorp, Inc. | | NY | | | | | | | | | | | | | | | | | | | | | | | | | | | | | | | | | | | | | | | | | | | | | | | | | | | | | | | | | | | | | | | | | | |
| Maximum | | | | $ | 10.00 | | $ | 14.98 | | $ | 0.52 | | $ | 22.56 | | 19.78x | | 44.33 | % | | 7.04 | % | | 54.41 | % | | 19.08x | | $ | 0.00 | | | 0.00 | % | | 0.00 | % | | $ | 213 | | | 15.89 | % | | 13.34 | % | | 0.44 | % | | 0.36 | % | | 2.24 | % | | 0.37 | % | | 2.32 | % | | $ | 9.78 | | 0.7227x | |
| Midpoint | | | | $ | 10.00 | | $ | 13.03 | | $ | 0.60 | | $ | 25.08 | | 17.35x | | 39.87 | % | | 6.16 | % | | 49.33 | % | | 16.73x | | $ | 0.00 | | | 0.00 | % | | 0.00 | % | | $ | 212 | | | 15.44 | % | | 12.86 | % | | 0.44 | % | | 0.35 | % | | 2.30 | % | | 0.37 | % | | 2.38 | % | | $ | 8.50 | | 0.6284x | |
| Minimum | | | | $ | 10.00 | | $ | 11.07 | | $ | 0.70 | | $ | 28.49 | | 14.88x | | 35.10 | % | | 5.26 | % | | 43.80 | % | | 14.34x | | $ | 0.00 | | | 0.00 | % | | 0.00 | % | | $ | 210 | | | 14.99 | % | | 12.38 | % | | 0.44 | % | | 0.35 | % | | 2.36 | % | | 0.37 | % | | 2.45 | % | | $ | 7.23 | | 0.5342x | |
| | | | | | | | | | | | | | | | | | | | | | | | | | | | | | | | | | | | | | | | | | | | | | | | | | | | | | | | | | | | | | | | | | | | | | |
| All Non-MHC Public Thrifts(6) | | | | | | | | | | | | | | | | | | | | | | | | | | | | | | | | | | | | | | | | | | | | | | | | | | | | | | | | | | | | | | | | | | | | |
| Averages | | | | $ | 16.88 | | $ | 449.07 | | $ | 1.79 | | $ | 20.99 | | 9.63x | | 73.24 | % | | 8.97 | % | | 80.50 | % | | 11.43x | | $ | 0.49 | | | 3.21 | % | | 35.89 | % | | $ | 5,955 | | | 13.32 | % | | 12.77 | % | | 0.41 | % | | 0.70 | % | | 6.04 | % | | 0.75 | % | | 6.32 | % | | | | | | |
| Median | | | | $ | 10.62 | | $ | 123.38 | | $ | 1.08 | | $ | 16.26 | | 9.04x | | 69.37 | % | | 7.97 | % | | 73.33 | % | | 8.71x | | $ | 0.33 | | | 2.81 | % | | 28.31 | % | | $ | 1,702 | | | 11.78 | % | | 10.72 | % | | 0.26 | % | | 0.75 | % | | 6.38 | % | | 0.77 | % | | 6.71 | % | | | | | | |
| | | | | | | | | | | | | | | | | | | | | | | | | | | | | | | | | | | | | | | | | | | | | | | | | | | | | | | | | | | | | | | | | | | | | | |
| All Non-MHC State of NY(6) | | | | | | | | | | | | | | | | | | | | | | | | | | | | | | | | | | | | | | | | | | | | | | | | | | | | | | | | | | | | | | | | | | | | |
| Averages | | | | $ | 11.89 | | $ | 1,352.55 | | $ | 1.47 | | $ | 15.87 | | 5.20x | | 74.53 | % | | 7.25 | % | | 80.12 | % | | 13.48x | | $ | 0.59 | | | 3.46 | % | | 22 | % | | $ | 22,491 | | | 11.98 | % | | 11.52 | % | | 2.59 | % | | 0.96 | % | | 8.15 | % | | 0.96 | % | | 6.74 | % | | | | | | |
| Medians | | | | $ | 9.56 | | $ | 170.98 | | $ | 1.51 | | $ | 15.13 | | 5.94x | | 72.30 | % | | 6.71 | % | | 80.77 | % | | 6.84x | | $ | 0.46 | | | 3.51 | % | | 18 | % | | $ | 2,021 | | | 9.90 | % | | 9.73 | % | | 2.59 | % | | 0.69 | % | | 6.90 | % | | 1.24 | % | | 12.04 | % | | | | | | |
| | | | | | | | | | | | | | | | | | | | | | | | | | | | | | | | | | | | | | | | | | | | | | | | | | | | | | | | | | | | | | | | | | | | | | |
| Comparable Group | | | | | | | | | | | | | | | | | | | | | | | | | | | | | | | | | | | | | | | | | | | | | | | | | | | | | | | | | | | | | | | | | | | | |
| Averages | | | | $ | 11.01 | | $ | 47.49 | | $ | 0.63 | | $ | 15.55 | | 14.16x | | 71.06 | % | | 10.84 | % | | 73.65 | % | | 17.40x | | $ | 0.10 | | | 0.81 | % | | 11.33 | % | | $ | 476 | | | 15.65 | % | | 15.37 | % | | 0.56 | % | | 0.53 | % | | 3.91 | % | | 0.54 | % | | 4.03 | % | | | | | | |
| Medians | | | | $ | 10.43 | | $ | 45.80 | | $ | 0.61 | | $ | 16.26 | | 14.05x | | 69.58 | % | | 8.51 | % | | 74.09 | % | | 16.47x | | $ | 0.04 | | | 0.37 | % | | 1.72 | % | | $ | 420 | | | 13.25 | % | | 13.21 | % | | 0.53 | % | | 0.53 | % | | 4.11 | % | | 0.47 | % | | 3.89 | % | | | | | | |
| | | | | | | | | | | | | | | | | | | | | | | | | | | | | | | | | | | | | | | | | | | | | | | | | | | | | | | | | | | | | | | | | | | | | | |
| Comparable Group | | | | | | | | | | | | | | | | | | | | | | | | | | | | | | | | | | | | | | | | | | | | | | | | | | | | | | | | | | | | | | | | | | | | |
| BCOW | 1895 Bancorp of Wisconsin, Inc. | | WI | | $ | 6.99 | | $ | 43.28 | | $ | 0.08 | | $ | 12.14 | | NM | | 57.56 | % | | 7.99 | % | | 57.56 | % | | NM | | $ | 0.00 | | | 0.00 | % | | 0.00 | % | | $ | 543 | | | 13.88 | % | | 13.88 | % | | 0.21 | % | | -0.03 | % | | -0.19 | % | | 0.08 | % | | 0.52 | % | | | | | | |
| AFBI | Affinity Bancshares, Inc. | | GA | | $ | 12.50 | | $ | 82.08 | | $ | 1.08 | | $ | 18.02 | | 11.79x | | 69.37 | % | | 8.80 | % | | 82.24 | % | | 11.55x | | $ | 0.00 | | | 0.00 | % | | 0.00 | % | | $ | 932 | | | 12.69 | % | | 10.92 | % | | 1.03 | % | | 0.89 | % | | 6.03 | % | | 0.91 | % | | 6.16 | % | | | | | | |
| CLST | Catalyst Bancorp, Inc. | | LA | | $ | 9.57 | | $ | 48.39 | | $ | 0.09 | | $ | 17.03 | | NM | | 57.19 | % | | 17.55 | % | | 57.19 | % | | NM | | $ | 0.00 | | | 0.00 | % | | 0.00 | % | | $ | 276 | | | 31.22 | % | | 31.22 | % | | 0.93 | % | | 0.14 | % | | 0.44 | % | | 0.16 | % | | 0.51 | % | | | | | | |
| CULL | Cullman Bancorp, Inc. | | AL | | $ | 10.62 | | $ | 78.41 | | $ | 0.59 | | $ | 13.55 | | 18.00x | | 78.39 | % | | 18.56 | % | | 78.39 | % | | 17.92x | | $ | 0.12 | | | 1.13 | % | | 20.34 | % | | $ | 423 | | | 23.67 | % | | 23.67 | % | | 0.62 | % | | 1.09 | % | | 4.21 | % | | 1.09 | % | | 4.23 | % | | | | | | |
| GBNY | Generations Bancorp NY, Inc. | | NY | | $ | 9.15 | | $ | 21.42 | | $ | 0.27 | | $ | 16.03 | | NM | | 57.09 | % | | 5.50 | % | | 59.46 | % | | 34.49x | | $ | 0.00 | | | 0.00 | % | | 0.00 | % | | $ | 389 | | | 9.64 | % | | 9.29 | % | | 0.85 | % | | 0.14 | % | | 1.39 | % | | 0.16 | % | | 1.60 | % | | | | | | |
| HFBL | Home Federal Bancorp, Inc. of Louisiana | | LA | | $ | 16.13 | | $ | 48.32 | | $ | 1.88 | | $ | 16.05 | | 9.38x | | 100.50 | % | | 7.34 | % | | 110.72 | % | | 8.57x | | $ | 0.48 | | | 2.98 | % | | 27.91 | % | | $ | 686 | | | 7.31 | % | | 6.68 | % | | 0.39 | % | | 0.93 | % | | 11.19 | % | | 1.01 | % | | 12.22 | % | | | | | | |
| MSVB | Mid-Southern Bancorp, Inc. | | IN | | $ | 9.87 | | $ | 28.47 | | $ | 0.65 | | $ | 12.11 | | 15.18x | | 81.48 | % | | 10.69 | % | | 81.48 | % | | 15.23x | | $ | 0.24 | | | 2.43 | % | | 33.85 | % | | $ | 266 | | | 13.12 | % | | 13.12 | % | | 0.49 | % | | 0.66 | % | | 5.14 | % | | 0.66 | % | | 5.12 | % | | | | | | |
| PBBK | PB Bankshares, Inc. | | PA | | $ | 11.50 | | $ | 30.01 | | $ | 0.65 | | $ | 16.48 | | 12.92x | | 69.79 | % | | 8.22 | % | | 69.79 | % | | 17.61x | | $ | 0.00 | | | 0.00 | % | | 0.00 | % | | $ | 393 | | | 11.78 | % | | 11.78 | % | | 0.35 | % | | 0.59 | % | | 4.85 | % | | 0.43 | % | | 3.55 | % | | | | | | |
| TCBC | TC Bancshares, Inc. | | GA | | $ | 13.50 | | $ | 62.39 | | $ | 0.36 | | $ | 17.14 | | NM | | 78.75 | % | | 15.63 | % | | 78.75 | % | | NM | | $ | 0.10 | | | 0.74 | % | | 27.78 | % | | $ | 430 | | | 19.85 | % | | 19.85 | % | | 0.18 | % | | 0.43 | % | | 2.05 | % | | 0.43 | % | | 2.05 | % | | | | | | |
| TCBS | Texas Community Bancshares, Inc. | | TX | | $ | 10.25 | | $ | 32.16 | | $ | 0.62 | | $ | 16.95 | | 17.66x | | 60.45 | % | | 8.09 | % | | 60.89 | % | | 16.47x | | $ | 0.08 | | | 0.78 | % | | 3.45 | % | | $ | 417 | | | 13.39 | % | | 13.30 | % | | 0.56 | % | | 0.47 | % | | 4.01 | % | | 0.50 | % | | 4.30 | % | | | | | | |
(1) Core income, on a diluted per-share basis. Core income is net income after taxes and before extraordinary items, less net income attributable to noncontrolling interest, gain on the sale of securities, amortization of intangibles, goodwill and nonrecurring items. Assumed tax rate is 35%.
(2) P/E = Price to earnings; P/B = Price to book; P/A = Price to assets; P/TB = Price to tangible book value; and P/Core = Price to core earnings. P/E and P/Core =NM if the ratio is negative or above 35x.
(3) Indicated 12 month dividend, based on last quarterly dividend declared.
(4) Indicated 12 month dividend as a percent of trailing 12 month earnings.
(5) Equity and tangible equity equal common equity and tangible common equity, respectively. ROAA (return on average assets) and ROAE (return on average equity) are indicated ratios based on trailing 12 month earnings and average equity and assets balances.
(6) Excludes from averages and medians those companies the subject of actual or rumored acquisition activities or unusual operating characteristics.
Source: S&P Global Market Intelligence and RP Financial, LC. calculations. The information provided in this report has been obtained from sources we believe are reliable, but we cannot guarantee the accuracy or completeness of such information.
Copyright (c) 2023 by RP® Financial, LC.
| RP® Financial, LC. | VALUATION ANALYSIS |
| | IV.23 |
respectively, the Company’s pro forma reported and core P/E multiples at the midpoint value indicated premiums of 23.49% and 1.58%, respectively. The Company’s pro forma P/E ratios based on reported earnings at the minimum and the maximum equaled 14.88x and 19.78x, respectively, and based on core earnings at the minimum and the maximum equaled 14.34x and 19.08x, respectively.
2. Price-to-Book (“P/B”). The application of the P/B valuation method requires calculating the Company’s pro forma market value by applying a valuation P/B ratio, as derived from the Peer Group’s P/B ratio, to the Company’s pro forma book value. Based on the $13.0 million midpoint valuation, the Company’s pro forma P/B and P/TB ratios equaled 39.87% and 49.33%, respectively. In comparison to the average P/B and P/TB ratios for the Peer Group of 71.06% and 73.65%, respectively, the Company’s ratios reflected discounts of 43.89% on a P/B basis and 33.02% on a P/TB basis. In comparison to the Peer Group’s median P/B and P/TB ratios of 69.58% and 74.09%, respectively, the Company’s pro forma P/B and P/TB ratios at the midpoint value reflected discounts of 42.70% on a P/B basis and 33.42% on a P/TB basis. At the maximum of the range, the Company’s P/B and P/TB ratios equaled 44.33% and 54.41%, respectively. In comparison to the Peer Group’s average P/B and P/TB ratios, the Company’s P/B and P/TB ratios at the maximum of the range reflected discounts of 37.62% and 26.12%, respectively. In comparison to the Peer Group’s median P/B and P/TB ratios, the Company’s P/B and P/TB ratio at the maximum of the range reflected discounts of 36.29% and 26.56%, respectively.
3. Price-to-Assets (“P/A”). The P/A valuation methodology determines market value by applying a valuation P/A ratio to the Company’s pro forma asset base, conservatively assuming no deposit withdrawals are made to fund stock purchases. In all likelihood there will be deposit withdrawals, which results in understating the pro forma P/A ratio which is computed herein. At the $13.0 million midpoint of the valuation range, the Company’s value equaled 6.16% of pro forma assets. Comparatively, the Peer Group companies exhibited an average P/A ratio of 10.84%, which implies a discount of 43.17% has been applied to the Company’s pro forma P/A ratio. In comparison to the Peer Group’s median P/A ratio of 8.51%, the Company’s pro forma P/A ratio at the midpoint value reflects a discount of 27.61%.
| RP® Financial, LC. | VALUATION ANALYSIS |
| | IV.24 |
Comparison to Recent Offerings
As indicated at the beginning of this chapter, RP Financial’s analysis of recent conversion offering pricing characteristics at closing and in the aftermarket has been limited to a “technical” analysis and, thus, the pricing characteristics of recent conversion offerings cannot be a primary determinate of value. Particular focus was placed on the P/TB approach in this analysis, since the P/E multiples do not reflect the actual impact of reinvestment and the source of the stock proceeds (i.e., external funds vs. deposit withdrawals). As discussed previously, the most recently completed second-step offering was by First Seacoast in January 2023. In comparison to First Seacoast’s 74.10% closing pro forma P/TB ratio, the Company’s pro forma P/TB ratio of 49.33% at the midpoint value reflects an implied discount of 33.43%. At the maximum of the offering range, the Company’s pro forma P/TB ratio of 54.41% reflects an implied discount of 26.57% relative to First Seacoast’s pro forma P/TB ratio at closing. As of May 8, 2023, First Seacoast’s stock price was down 16.3% from its IPO price.
Valuation Conclusion
Based on the foregoing, it is our opinion that, as of May 8, 2023, the estimated aggregate pro forma valuation of the shares of the Company to be issued and outstanding at the end of the conversion offering – including (1) newly-issued shares representing the MHC’s current ownership interest in the Company and (2) exchange shares issued to existing public shareholders of the Company - was $13,025,610 at the midpoint, equal to 1,302,561 shares at a per share value of $10.00. The resulting range of value and pro forma shares, all based on $10.00 per share, are shown below.
| | | | | | | | | Exchange Shares | | | | |
| | | Total Shares | | | Offering
Shares | | | Issued to Public
Shareholders | | | Exchange
Ratio | |
| Shares | | | | | | | | | | | | | | | | |
| Maximum | | | 1,497,945 | | | | 977,500 | | | | 520,445 | | | | 0.7227 | |
| Midpoint | | | 1,302,561 | | | | 850,000 | | | | 452,561 | | | | 0.6284 | |
| Minimum | | | 1,107,177 | | | | 722,500 | | | | 384,677 | | | | 0.5342 | |
| Distribution of Shares | | | | | | | | | | | | | | | | |
| Maximum | | | 100.00 | % | | | 65.26 | % | | | 34.74 | % | | | | |
| Midpoint | | | 100.00 | % | | | 65.26 | % | | | 34.74 | % | | | | |
| Minimum | | | 100.00 | % | | | 65.26 | % | | | 34.74 | % | | | | |
| Aggregate Market Value at $10 per share | | | | | | | | | | | | | | | | |
| Maximum | | $ | 14,979,450 | | | $ | 9,775,000 | | | $ | 5,204,450 | | | | | |
| Midpoint | | $ | 13,025,610 | | | $ | 8,500,000 | | | $ | 4,525,610 | | | | | |
| Minimum | | $ | 11,071,770 | | | $ | 7,225,000 | | | $ | 3,846,770 | | | | | |
| RP® Financial, LC. | VALUATION ANALYSIS |
| | IV.25 |
The pro forma valuation calculations relative to the Peer Group are shown in Table 4.3 and are detailed in Exhibit IV-7 and Exhibit IV-8.
Establishment of the Exchange Ratio
Conversion regulations provide that in a conversion of a mutual holding company, the minority shareholders are entitled to exchange the public shares for newly issued shares in the fully converted company. The Boards of Directors of the MHC, the Bank and GOVB have independently determined the exchange ratio, which has been designed to preserve the current aggregate percentage ownership in the Company (adjusted for the dilution resulting from the consolidation of the MHC’s unconsolidated equity into the Company). The exchange ratio to be received by the existing minority shareholders of the Company will be determined at the end of the offering, based on the total number of shares sold in the second-step conversion offering and the final appraisal. Based on the valuation conclusion herein, the resulting offering value and the $10.00 per share offering price, the indicated exchange ratio at the midpoint is 0.6284 shares of the Company for every one public share held by public shareholders. Furthermore, based on the offering range of value, the indicated exchange ratio is 0.5342 at the minimum and 0.7227 at the maximum. RP Financial expresses no opinion on the proposed exchange of newly issued Company shares for the shares held by the public shareholders or on the proposed exchange ratio.
EXHIBITS
LIST OF EXHIBITS
| Exhibit | | |
| Number | | Description |
| | | |
| I-1 | | Map of Office Locations |
| | | |
| I-2 | | Audited Financial Statements |
| | | |
| I-3 | | Key Operating Ratios |
| | | |
| I-4 | | Investment Portfolio Composition |
| | | |
| I-5 | | Yields and Costs |
| | | |
| I-6 | | Loan Loss Allowance Activity |
| | | |
| I-7 | | Fixed and Adjustable Rate Loans |
| | | |
| I-8 | | Interest Rate Risk Analysis |
| | | |
| I-9 | | Loan Portfolio Composition |
| | | |
| I-10 | | Contractual Maturity by Loan Type |
| | | |
| I-11 | | Non-Performing Assets |
| | | |
| I-12 | | Deposit Composition |
| | | |
| | | |
| II-1 | | Description of Office Properties |
| | | |
| II-2 | | Historical Interest Rates |
| | | |
| | | |
| III-1 | | Characteristics of Publicly-Traded Thrifts |
| | | |
| III-2 | | Public Market Pricing of Mid-Atlantic, New England and Midwest Thrifts |
| | | |
| III-3 | | Public Market Pricing of Southeast and Southwest Thrifts |
| | | |
| III-4 | | Peer Group Market Area Comparative Analysis |
LIST OF EXHIBITS (continued)
| Exhibit | | |
| Number | | Description |
| | | |
| IV-1 | | Stock Prices: As of May 8, 2023 |
| | | |
| IV-2 | | Historical Stock Price Indices |
| | | |
| IV-3 | | Stock Price Indices as of May 8, 2023 |
| | | |
| IV-4 | | New York Bank and Thrift Acquisitions 2018 - Present |
| | | |
| IV-5 | | Director and Senior Management Summary Resumes |
| | | |
| IV-6 | | Pro Forma Regulatory Capital Ratios |
| | | |
| IV-7 | | Pro Forma Analysis Sheet |
| | | |
| IV-8 | | Pro Forma Effect of Conversion Proceeds |
| | | |
| IV-9 | | Calculation of Minority Ownership Dilution in a Second-Step Offering |
| | | |
| | | |
| V-1 | | Firm Qualifications Statement |
EXHIBIT I-1
Gouverneur Bancorp, Inc.
Map of Office Locations
Exhibit I-1
Gouverneur Bancorp, Inc.
Map of Office Locations
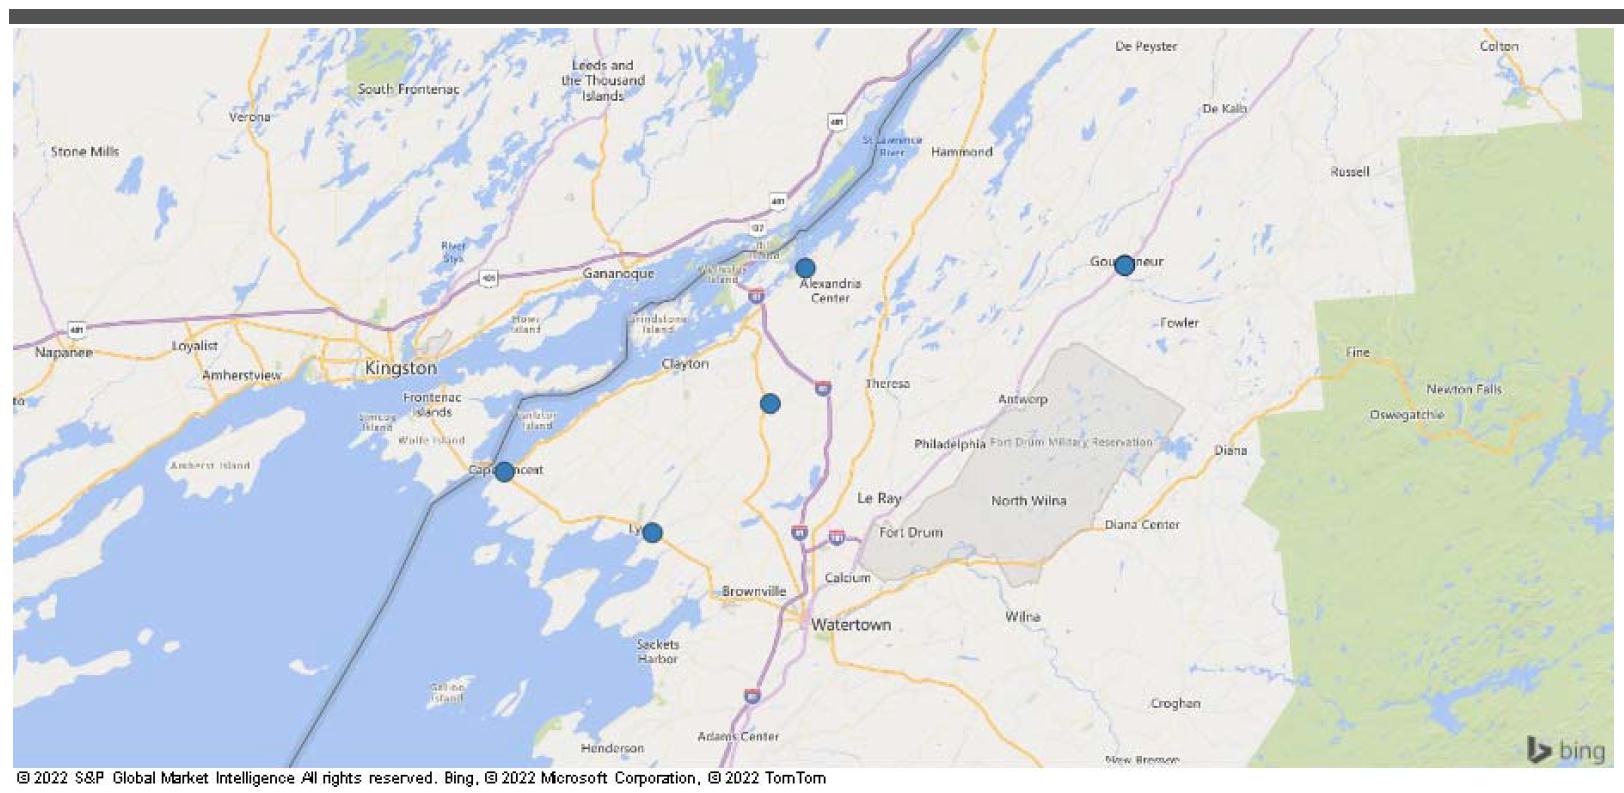
|  | U.S. Branches: Current Ownership (6) |
EXHIBIT I-2
Gouverneur Bancorp, Inc.
Audited Financial Statements
[Incorporated by Reference]
EXHIBIT I-3
Gouverneur Bancorp, Inc.
Key Operating Ratios
Exhibit I-3
Gouverneur Bancorp, Inc.
Key Operating Ratios
| | | At or for the Six Months
Ended March 31, | | | At or For the Years
Ended September 30, | |
| | | 2023 | | | 2022 | | | 2022 | | | 2021 | |
| Performance Ratios(2): | | | | | | | | | | | | | | | | |
| Return on average assets | | | 0.00 | % | | | 1.22 | % | | | 1.16 | % | | | 0.98 | % |
| Return on average equity | | | 0.00 | % | | | 5.81 | % | | | 5.79 | % | | | 4.62 | % |
| Interest rate spread(3) | | | 4.30 | % | | | 3.40 | % | | | 3.55 | % | | | 3.54 | % |
| Net interest margin(4) | | | 4.32 | % | | | 3.49 | % | | | 3.62 | % | | | 3.65 | % |
| Noninterest expense to average assets | | | 3.51 | % | | | 3.85 | % | | | 3.87 | % | | | 3.89 | % |
| Efficiency ratio(5) | | | 101.29 | % | | | 72.10 | % | | | 72.05 | % | | | 80.82 | % |
| Average interest-earning assets to average interest-bearing liabilities | | | 115.06 | % | | | 133.43 | % | | | 131.87 | % | | | 134.92 | % |
| | | | | | | | | | | | | | | | | |
| Capital Ratios(6): | | | | | | | | | | | | | | | | |
| Average equity to average assets | | | 12.36 | % | | | 20.95 | % | | | 19.99 | % | | | 21.11 | % |
| Total capital to risk-weighted assets(7) | | | 20.14 | % | | | 36.03 | % | | | 19.90 | % | | | 35.15 | % |
| Tier 1 capital to risk-weighted assets(7) | | | 19.54 | % | | | 35.25 | % | | | 19.36 | % | | | 34.35 | % |
| Common equity tier 1 capital to risk-weighted assets(7) | | | 19.54 | % | | | 35.25 | % | | | 19.36 | % | | | 34.35 | % |
| Tier 1 capital to average assets(7) | | | 10.73 | % | | | 21.24 | % | | | 15.79 | % | | | 19.76 | % |
| | | | | | | | | | | | | | | | | |
| Asset Quality Ratios: | | | | | | | | | | | | | | | | |
| Allowance for loan losses as a percentage of total loans(8) | | | 0.75 | % | | | 0.69 | % | | | 0.71 | % | | | 0.72 | % |
| Allowance for loan losses as a percentage of non-performing loans | | | 79.88 | % | | | 139.86 | % | | | 100.49 | % | | | 167.57 | % |
| Net (charge-offs) recoveries to average outstanding loans during the year | | | (0.006 | )% | | | (0.049 | )% | | | (0.066 | )% | | | (0.034 | )% |
| Non-performing loans as a percentage of total loans(8) | | | 0.94 | % | | | 0.49 | % | | | 0.71 | % | | | 0.43 | % |
| Non-performing loans as a percentage of total assets | | | 0.44 | % | | | 0.46 | % | | | 0.33 | % | | | 0.48 | % |
| Total non-performing assets as a percentage of total assets | | | 0.44 | % | | | 0.46 | % | | | 0.33 | % | | | 0.48 | % |
| | | | | | | | | | | | | | | | | |
| Other: | | | | | | | | | | | | | | | | |
| Number of offices | | | 5 | | | | 2 | | | | 5 | | | | 2 | |
| Number of full-time equivalent employees | | | 46 | | | | 27 | | | | 44 | | | | 30 | |
| (1) | Gouverneur Bancorp uses derivative instruments as a risk management tool and has entered into several interest rate swap agreements whereby it pays a fixed rate and receives a variable rate on a notional amount. The notional amount of the swap agreements at March 31, 2023, September 30, 2022 and 2021, was $7.0 million, $18.0 million and $18.0 million, respectively. Gouverneur Bancorp enters into these arrangements to hedge the cost of certain borrowings and to increase the interest rate sensitivity of certain assets. Financial derivatives are recorded at fair value as other assets or liabilities. The accounting for changes in the fair value of a derivative depends on whether it has been designated and qualifies as a part of a hedging relationship. For a fair value hedge, changes in the fair value of the derivative instrument and changes in the fair value of the hedged asset or liability are currently recognized in current year earnings. Amounts recognized in earnings as noninterest gain (loss) for the six months ended March 31, 2023 and 2022 were $(823,000) and $1.1 million, respectively. Amounts recognized in earnings as noninterest gain for the years ended September 30, 2022 and 2021 were $2.2 million and $943,000, respectively. The gain is the result of the swaps market value fluctuations with long-term bond rates and projected short-term rates. |
| (2) | Ratios at and for the six months ended March 31, 2023 and 2022 are annualized. |
| (3) | Represents the difference between the weighted average yield on interest-earning assets and the weighted average cost of interest-bearing liabilities. |
| (4) | Represents net interest income as a percentage of average interest-earning assets. |
| (5) | Represents noninterest expenses divided by the sum of net interest income and noninterest income. |
| (6) | Ratios are for Gouverneur Savings and Loan Association. |
| (7) | The acquisition of Citizens Bank of Cape Vincent, which was completed in September 2022, caused assets to increase in greater proportion than regulatory capital, which resulted in an immediate reduction in capital ratios for Gouverneur Savings and Loan Association as of the effective date of the acquisition. |
| (8) | Total loans exclude loans held for sale and acquired loans. |
Source: Gouverneur Bancorp’s prospectus.
EXHIBIT I-4
Gouverneur Bancorp, Inc.
Investment Portfolio Composition
Exhibit I-4
Gouverneur Bancorp, Inc.
Investment Portfolio Composition
| | | One Year or Less | | | More than
One Year to Five Years | | | More than
Five Years to Ten Years | | | More than
Ten Years | | | Total | |
| March 31, 2023 (unaudited) | | Amortized
Cost | | | Weighted
Average
Yield | | | Amortized
Cost | | | Weighted
Average
Yield | | | Amortized
Cost | | | Weighted
Average
Yield | | | Amortized
Cost | | | Weighted
Average
Yield | | | Amortized
Cost | | | Fair Value | | | Weighted
Average
Yield | |
| | | | | | | | | | | | | | | | | | | | | | | | | | | | | | | | | | |
| | | (Dollars in thousands) | |
| Securities available-for-sale: | | | | | | | | | | | | | | | | | | | | | | | | | | | | | | | | | | | | | | | | | | | | |
| Municipal bonds, treasuries, agencies, other government-sponsored enterprises | | $ | 5,366 | | | | 4.13 | % | | $ | 15,874 | | | | 4.24 | % | | $ | 5,103 | | | | 4.10 | % | | $ | 14,115 | | | | 3.12 | % | | $ | 40,458 | | | $ | 38,167 | | | | 3.81 | % |
| Residential mortgage-backed securities | | | 4 | | | | 2.96 | % | | | 3,423 | | | | 4.38 | % | | | 4,688 | | | | 3.51 | % | | | 811 | | | | 2.87 | % | | | 8,926 | | | | 8,626 | | | | 3.79 | % |
| SBA-guaranteed debenture | | | - | | | | - | | | | 2,309 | | | | 5.07 | % | | | 326 | | | | 4.65 | % | | | - | | | | - | | | | 2,635 | | | | 2,654 | | | | 5.02 | % |
| Total | | $ | 5,370 | | | | 4.13 | % | | $ | 21,606 | | | | 4.35 | % | | $ | 10,117 | | | | 3.85 | % | | $ | 14,926 | | | | 3.10 | % | | $ | 52,019 | | | $ | 49,447 | | | | 3.87 | % |
| | | | | | | | | | | | | | | | | | | | | | | | | | | | | | | | | | | | | | | | | | | | | |
| Securities held-to-maturity: | | | | | | | | | | | | | | | | | | | | | | | | | | | | | | | | | | | | | | | | | | | | |
| Mortgage backed securities | | | - | | | | - | | | $ | 1 | | | | 2.58 | % | | $ | - | | | | - | | | $ | - | | | | - | | | $ | 1 | | | $ | 1 | | | | 2.58 | % |
| | | | | | | | | | | | | | | | | | | | | | | | | | | | | | | | | | | | | | | | | | | | | |
| Total | | $ | - | | | | | | | $ | 1 | | | | 2.58 | % | | $ | - | | | | | | | $ | - | | | | | | | $ | 1 | | | $ | 1 | | | | 2.58 | % |
Source: Gouverneur Bancorp’s prospectus.
EXHIBIT I-5
Gouverneur Bancorp, Inc.
Yields and Costs
Exhibit I-5
Gouverneur Bancorp, Inc.
Yields and Costs
| | | For the Six Months Ended March 31, | |
| | | 2023 | | | 2022 | |
| | | Average
Outstanding
Balance | | | Interest | | | Average
Yield/Rate | | | Average
Outstanding
Balance | | | Interest | | | Average
Yield/Rate | |
| | | | | | | | | | | | | | | | | | | |
| | | (Dollars in thousands) | |
| | | (unaudited) | |
| Interest-earning assets: | | | | | | | | | | | | | | | | | | | | | | | | |
| Loans | | $ | 124,626 | | | $ | 3,009 | | | | 4.84 | % | | $ | 87,312 | | | $ | 1,856 | | | | 4.26 | % |
| Securities | | | 55,250 | | | | 969 | | | | 3.52 | % | | | 24,234 | | | | 302 | | | | 2.50 | % |
| Other short term investments | | | 2,660 | | | | 54 | | | | 4.07 | % | | | 3,507 | | | | 2 | | | | 0.11 | % |
| Federal funds sold and other | | | | | | | | | | | | | | | | | | | | | | | | |
| Total interest-earning assets | | | 182,536 | | | | 4,032 | | | | 4.43 | % | | | 115,053 | | | | 2,160 | | | | 3.77 | % |
| Noninterest-earning assets | | | 23,855 | | | | | | | | | | | | 14,583 | | | | | | | | | |
| Total assets | | $ | 206,391 | | | | | | | | | | | $ | 129,636 | | | | | | | | | |
| | | | | | | | | | | | | | | | | | | | | | | | | |
| Interest-bearing liabilities(1): | | | | | | | | | | | | | | | | | | | | | | | | |
| Interest-bearing demand deposits | | | | | | | | | | | | | | | | | | | | | | | | |
| Regular savings and club deposits | | | 83,012 | | | | 48 | | | | 0.12 | % | | | 39,928 | | | | 27 | | | | 0.14 | % |
| Money market and NOW deposits(2) | | | 53,110 | | | | (40 | ) | | | (0.15 | )% | | | 30,308 | | | | 77 | | | | 0.51 | % |
| Certificates of deposit | | | 20,254 | | | | 63 | | | | 0.62 | % | | | 15,992 | | | | 54 | | | | 0.68 | % |
| Total interest-bearing deposits | | | 153,376 | | | | 71 | | | | 0.09 | % | | | 86,228 | | | | 158 | | | | 0.37 | % |
| Federal Home Loan Bank advances and other borrowings(3) | | | 2,266 | | | | 28 | | | | 2.48 | % | | | - | | | | - | | | | - | |
| Total interest-bearing liabilities | | | 158,642 | | | | 99 | | | | 0.13 | % | | | 86,228 | | | | 158 | | | | 0.37 | % |
| Noninterest-bearing demand deposits | | | 21,483 | | | | | | | | | | | | 12,844 | | | | | | | | | |
| Other noninterest-bearing liabilities | | | 747 | | | | | | | | | | | | 3,400 | | | | | | | | | |
| Total liabilities | | | 180,872 | | | | | | | | | | | | 102,472 | | | | | | | | | |
| Total shareholders’ equity | | | 25,519 | | | | | | | | | | | | 27,164 | | | | | | | | | |
| Total liabilities and shareholders’ equity | | $ | 206,391 | | | | | | | | | | | $ | 129,636 | | | | | | | | | |
| Net interest income | | | | | | $ | 3,933 | | | | | | | | | | | $ | 2,002 | | | | | |
| Net interest rate spread(4) | | | | | | | | | | | 4.30 | % | | | | | | | | | | | 3.40 | % |
| Net interest-earning assets(5) | | $ | 23,894 | | | | | | | | | | | $ | 28,825 | | | | | | | | | |
| Net interest margin(6) | | | | | | | | | | | 4.32 | % | | | | | | | | | | | 3.49 | % |
| Average interest-earning assets to interest-bearing liabilities | | | | | | | | | | | 1.15x | | | | | | | | | | | | 1.33x | |
Exhibit I-5 (continued)
Gouverneur Bancorp, Inc.
Yields and Costs
| | | For the Years Ended September 30, | |
| | | 2022 | | | 2021 | |
| | | Average
Outstanding
Balance | | | Interest | | | Average
Yield/Rate | | | Average
Outstanding
Balance | | | Interest | | | Average
Yield/Rate | |
| | | | | | | | | | | | | | | | | | | |
| | | (Dollars in thousands) | |
| Interest-earning assets: | | | | | | | | | | | | | | | | | | | | | | | | |
| Loans | | $ | 88,661 | | | $ | 3,843 | | | | 4.33 | % | | $ | 86,353 | | | $ | 3,868 | | | | 4.48 | % |
| Securities | | | 25,405 | | | | 660 | | | | 2.60 | % | | | 21,703 | | | | 595 | | | | 2.74 | % |
| Other short term investments | | | 4,093 | | | | 44 | | | | 1.08 | % | | | 4,253 | | | | 4 | | | | 0.09 | % |
| Federal funds sold and other | | | | | | | | | | | | | | | | | | | | | | | | |
| Total interest-earning assets | | | 118,159 | | | | 4,547 | | | | 3.85 | % | | | 112,309 | | | | 4,467 | | | | 3.98 | % |
| Noninterest-earning assets | | | 13,815 | | | | | | | | | | | | 16,399 | | | | | | | | | |
| Total assets | | | 131,974 | | | | | | | | | | | $ | 128,708 | | | | | | | | | |
| | | | | | | | | | | | | | | | | | | | | | | | | |
| Interest-bearing liabilities(1): | | | | | | | | | | | | | | | | | | | | | | | | |
| Interest-bearing demand deposits | | | | | | | | | | | | | | | | | | | | | | | | |
| Regular savings and club deposits | | | 42,676 | | | | 59 | | | | 0.14 | % | | | 37,069 | | | | 53 | | | | 0.14 | % |
| Money market and NOW deposits | | | 30,765 | | | | 105 | | | | 0.34 | % | | | 28,288 | | | | 156 | | | | 0.55 | % |
| Certificates of deposit | | | 15,997 | | | | 100 | | | | 0.63 | % | | | 16,776 | | | | 128 | | | | 0.76 | % |
| Total interest-bearing deposits | | | 89,438 | | | | 264 | | | | 0.41 | % | | | 82,133 | | | | 337 | | | | 0.41 | % |
| Federal Home Loan Bank advances and other borrowings | | | 163 | | | | 4 | | | | 2.45 | % | | | 1,111 | | | | 28 | | | | 2.52 | % |
| Total interest-bearing liabilities | | | 89,601 | | | | 268 | | | | 0.30 | % | | | 83,244 | | | | 365 | | | | 0.44 | % |
| Noninterest-bearing demand deposits | | | 13,784 | | | | | | | | | | | | 12,596 | | | | | | | | | |
| Other noninterest-bearing liabilities | | | 2,206 | | | | | | | | | | | | 5,698 | | | | | | | | | |
| Total liabilities | | | 105,591 | | | | | | | | | | | | 101,538 | | | | | | | | | |
| Total shareholders’ equity | | | 26,383 | | | | | | | | | | | | 27,170 | | | | | | | | | |
| Total liabilities and shareholders’ equity | | $ | 131,974 | | | | | | | | | | | $ | 128,708 | | | | | | | | | |
| Net interest income | | | | | | $ | 4,279 | | | | | | | | | | | $ | 4,102 | | | | | |
| Net interest rate spread(2) | | | | | | | | | | | 3.55 | % | | | | | | | | | | | 3.54 | % |
| Net interest-earning assets(3) | | $ | 28,558 | | | | | | | | | | | $ | 29,065 | | | | | | | | | |
| Net interest margin(4) | | | | | | | | | | | 3.62 | % | | | | | | | | | | | 3.65 | % |
| Average interest-earning assets to interest-bearing liabilities | | | | | | | | | | | 1.32x | | | | | | | | | | | | 1.35x | |
Source: Gouverneur Bancorp’s prospectus.
EXHIBIT I-6
Gouverneur Bancorp, Inc.
Loan Loss Allowance Activity
Exhibit I-6
Gouverneur Bancorp, Inc.
Loan Loss Allowance Activity
| | | For the Six Months Ended March 31, | | | For the Years Ended September 30, | |
| | | 2023 | | | 2022 | | | 2022 | | | 2021 | |
| | | | | | | | | | | | | |
| | | (Dollars in thousands) | |
| | | (unaudited) | |
| Allowance for loan losses at beginning of year | | $ | 621 | | | $ | 620 | | | $ | 620 | | | $ | 631 | |
| Provision for loan losses | | | 62 | | | | 31 | | | | 61 | | | | 18 | |
| Charge-offs: | | | | | | | | | | | | | | | | |
| Real estate loans: | | | | | | | | | | | | | | | | |
| One- to four-family residential | | | - | | | | 45 | | | | 63 | | | | 33 | |
| Commercial | | | - | | | | - | | | | - | | | | - | |
| Construction | | | - | | | | - | | | | - | | | | - | |
| Home equity loans and lines of credit | | | - | | | | - | | | | - | | | | - | |
| Commercial and industrial loans | | | - | | | | - | | | | - | | | | - | |
| Consumer loans: | | | | | | | | | | | | | | | | |
| Automobile | | | - | | | | - | | | | - | | | | - | |
| Passbook | | | - | | | | - | | | | - | | | | - | |
| Other consumer | | | 10 | | | | 4 | | | | 6 | | | | 5 | |
| Total charge-offs | | $ | 10 | | | $ | 49 | | | $ | 69 | | | $ | 38 | |
| | | | | | | | | | | | | | | | | |
| Recoveries: | | | | | | | | | | | | | | | | |
| Real estate loans: | | | | | | | | | | | | | | | | |
| One- to four-family residential | | $ | 1 | | | $ | 3 | | | $ | 5 | | | $ | 6 | |
| Commercial | | | - | | | | - | | | | - | | | | - | |
| Construction | | | - | | | | - | | | | - | | | | - | |
| Home equity loans and lines of credit | | | - | | | | - | | | | - | | | | - | |
| Commercial and industrial loans | | | - | | | | - | | | | - | | | | - | |
| Consumer loans: | | | | | | | | | | | | | | | | |
| Automobile | | | - | | | | - | | | | - | | | | - | |
| Passbook | | | - | | | | - | | | | - | | | | - | |
| Other consumer | | | 1 | | | | 2 | | | | 4 | | | | 3 | |
| Total recoveries | | | 2 | | | | 5 | | | | 9 | | | | 9 | |
| | | | | | | | | | | | | | | | | |
| Net (charge-offs) recoveries | | $ | (8 | ) | | $ | (44 | ) | | $ | (60 | ) | | $ | (29 | ) |
| | | | | | | | | | | | | | | | | |
| Allowance at end of year | | $ | 675 | | | $ | 607 | | | $ | 621 | | | $ | 620 | |
| Non-performing loans to total loans outstanding at the end of the period | | | 0.94 | % | | | 0.49 | % | | | 0.71 | % | | | 0.43 | % |
| Allowance to non-performing loans(1) | | | 79.88 | % | | | 139.86 | % | | | 100.49 | % | | | 167.57 | % |
| Allowance to total loans outstanding at the end of the period | | | 0.54 | % | | | 0.69 | % | | | 0.50 | % | | | 0.72 | % |
| Allowance to total loans outstanding at the end of the period, excluding acquired loans | | | 0.75 | % | | | 0.69 | % | | | 0.71 | % | | | 0.72 | % |
| Net (charge-offs) recoveries to average loans outstanding during the period | | | (0.006 | )% | | | (0.049 | )% | | | (0.066 | )% | | | (0.034 | )% |
| (1) | At March 31, 2023 and September 30, 2022, there were no loans from the Citizens Bank of Cape Vincent acquisition on non-accrual or non-performing status. The increase in non-accrual loans at September 30, 2022 was the result of three residential mortgage customers going over 90 days delinquent. |
Source: Gouverneur Bancorp’s prospectus.
EXHIBIT I-7
Gouverneur Bancorp, Inc.
Fixed and Adjustable Rate Loans
Exhibit I-7
Gouverneur Bancorp, Inc.
Fixed and Adjustable Rate Loans
Fixed and Adjustable-Rate Loans. The following tables set forth our fixed and adjustable-rate loans at March 31, 2023 (unaudited) and September 30, 2022 that are contractually due after March 31, 2024 and September 30, 2023, respectively.
| | | Due After March 31, 2024 | |
| At March 31, 2023 (unaudited) | | Fixed | | | Adjustable | | | Total | |
| | | | | | | | | | |
| | | (In thousands) | |
| Real estate loans: | | | | | | | | | | | | |
| One- to four-family residential | | $ | 70,874 | | | $ | 28,060 | | | $ | 98,934 | |
| Commercial | | | 7,194 | | | | 3,395 | | | | 10,589 | |
| Construction | | | - | | | | - | | | | - | |
| Home equity loans and lines of credit | | | - | | | | 2,154 | | | | 2,154 | |
| Commercial loans | | | 1,144 | | | | 185 | | | | 1,329 | |
| Consumer loans: | | | | | | | | | | | | |
| Automobile | | | 2,478 | | | | - | | | | 2,478 | |
| Passbook | | | 282 | | | | 21 | | | | 303 | |
| Other consumer | | | 2,565 | | | | - | | | | 2,565 | |
| Total loans | | $ | 84,537 | | | $ | 33,815 | | | $ | 118,352 | |
Source: Gouverneur Bancorp’s prospectus.
EXHIBIT I-8
Gouverneur Bancorp, Inc.
Interest Rate Risk Analysis
Exhibit I-8
Gouverneur Bancorp, Inc.
Interest Rate Risk Analysis
| At March 31, 2023 | |
Change in Interest Rates
(basis points)(1) | | Net Interest Income
Year 1 Forecast | | | Year 1 Change
from Level | |
| | | | | | | |
| (Dollars in thousands) |
| (unaudited) |
| +400 | | | 7,377 | | | | (338 | ) |
| +300 | | | 7,452 | | | | (263 | ) |
| +200 | | | 7,540 | | | | (175 | ) |
| +100 | | | 7,626 | | | | (89 | ) |
| Level | | | 7,715 | | | | - | |
| -100 | | | 7,624 | | | | (91 | ) |
| -200 | | | 7,430 | | | | (285 | ) |
|
| (1) | Assumes an immediate uniform change in interest rates at all maturities. |
| At March 31, 2023 | |
Change in Interest
Rates (basis points)(1) | | Estimated
EVE(2) | | | Estimated Increase (Decrease) in
EVE | | | EVE as a Percentage of Present
Value of Assets(3) | |
| | | | | | | | | | |
| | | | | | Amount | | | Percent | | | EVE
Ratio(4) | | | Increase
(Decrease)
(basis points) | |
| (Dollars in thousands) |
| (unaudited) |
| +400 | | | 38,551 | | | | (13,447 | ) | | | (25.86 | )% | | | 24.48 | % | | | (3.13 | )% |
| +300 | | | 41,845 | | | | (10,153 | ) | | | (19.53 | )% | | | 25.45 | % | | | (2.17 | )% |
| +200 | | | 44,529 | | | | (7,469 | ) | | | (14.36 | )% | | | 26.01 | % | | | (1.60 | )% |
| +100 | | | 47,258 | | | | (4,740 | ) | | | (9.12 | )% | | | 26.48 | % | | | (1.13 | )% |
| — | | | 51,998 | | | | - | | | | - | | | | 27.61 | % | | | - | |
| -100 | | | 55,979 | | | | 3,981 | | | | 7.66 | % | | | 28.17 | % | | | 0.56 | % |
| -200 | | | 55,985 | | | | 3,987 | | | | 7.67 | % | | | 27.13 | % | | | (0.48 | )% |
|
| (1) | Assumes an immediate uniform change in interest rates at all maturities. |
| (2) | EVE is the discounted present value of expected cash flows from assets, liabilities and off-balance sheet contracts. |
| (3) | Present value of assets represents the discounted present value of incoming cash flows on interest-earning assets. |
| (4) | EVE ratio represents EVE divided by the present value of assets. |
Source: Gouverneur Bancorp’s prospectus.
EXHIBIT I-9
Gouverneur Bancorp, Inc.
Loan Portfolio Composition
Exhibit I-9
Gouverneur Bancorp, Inc.
Loan Portfolio Composition
| | | At March 31, | | | At September 30, | |
| | | 2023 | | | 2022 | | | 2021 | |
| | | Amount | | | Percent | | | Amount | | | Percent | | | Amount | | | Percent | |
| | | | | | | | | | | | | | | | | | | |
| | | (Dollars in thousands) | |
| Real estate loans: | | | | | | | | | | | | | | | | | | | | | | | | |
| One- to four-family residential | | $ | 99,952 | | | | 79.56 | % | | $ | 99,363 | | | | 78.64 | % | | $ | 68,742 | | | | 79.61 | % |
| Loans held for sale | | | - | | | | - | | | | - | | | | - | | | | 200 | | | | 0.23 | % |
| Commercial | | | 12,023 | | | | 9.57 | % | | | 12,326 | | | | 9.75 | % | | | 8,268 | | | | 9.58 | % |
| Construction | | | 4,016 | | | | 3.20 | % | | | 4,757 | | | | 3.76 | % | | | 1,642 | | | | 1.90 | % |
| Home equity loans and lines of credit | | | 2,167 | | | | 1.72 | % | | | 2,464 | | | | 1.95 | % | | | 2,984 | | | | 3.46 | % |
| Commercial loans | | | 1,879 | | | | 1.50 | % | | | 2,064 | | | | 1.63 | % | | | 1,483 | | | | 1.72 | % |
| Consumer loans: | | | | | | | | | | | | | | | | | | | | | | | | |
| Automobile | | | 2,512 | | | | 2.00 | % | | | 2,276 | | | | 1.80 | % | | | 1,693 | | | | 1.96 | % |
| Passbook | | | 398 | | | | 0.32 | % | | | 540 | | | | 0.43 | % | | | 102 | | | | 0.12 | % |
| Other consumer | | | 2,679 | | | | 2.13 | % | | | 2,570 | | | | 2.04 | % | | | 1,231 | | | | 1.42 | % |
| | | | | | | | | | | | | | | | | | | | | | | | | |
| Add: | | | | | | | | | | | | | | | | | | | | | | | | |
| Net deferred loan fees | | | 540 | | | | | | | | 577 | | | | | | | | 622 | | | | | |
| Less: | | | | | | | | | | | | | | | | | | | | | | | | |
| Net discount on acquired loans | | | (1,096 | ) | | | | | | | (1,205 | ) | | | | | | | - | | | | | |
| Allowance for losses | | | (675 | ) | | | | | | | (621 | ) | | | | | | | (620 | ) | | | | |
| Total net loans | | $ | 124,395 | | | | | | | $ | 125,111 | | | | | | | $ | 86,347 | | | | | |
Source: Gouverneur Bancorp’s prospectus.
EXHIBIT I-10
Gouverneur Bancorp, Inc.
Contractual Maturity by Loan Type
Exhibit I-10
Gouverneur Bancorp, Inc.
Contractual Maturity by Loan Type
| March 31, 2023 (unaudited) | | One- to Four-
Family Residential
Real Estate | | | Commercial Real
Estate | | | Construction | | | Commercial | | | Consumer | | | Total | |
| | | | | | | | | | | | | | | | | | | |
| | | (In thousands) | |
| Amounts due in: | | | | | | | | | | | | | | | | | | | | | | | | |
| One year or less | | $ | 110 | | | $ | 1,193 | | | $ | 3,992 | | | $ | 545 | | | $ | 203 | | | $ | 6,043 | |
| More than one to five years | | | 2,320 | | | | 5,654 | | | | - | | | | 606 | | | | 3,633 | | | | 12,213 | |
| More than five to 15 years | | | 29,776 | | | | 1,915 | | | | - | | | | 667 | | | | 1,482 | | | | 33,840 | |
| More than 15 years | | | 68,992 | | | | 3,020 | | | | - | | | | 56 | | | | 231 | | | | 72,299 | |
| Total | | $ | 101,198 | | | $ | 11,782 | | | $ | 3,992 | | | $ | 1,874 | | | $ | 5,549 | | | $ | 124,395 | |
Source: Gouverneur Bancorp’s prospectus.
EXHIBIT I-11
Gouverneur Bancorp, Inc.
Non-Performing Assets
Exhibit I-11
Gouverneur Bancorp, Inc.
Non-Performing Assets
| | | At March 31 | | | At September 30, | |
| | | 2023 | | | 2022 | | | 2021 | |
| | | | | | | | | | |
| | | (Dollars in thousands) | |
| | | (unaudited) | | | | |
| Non-accrual loans: | | | | | | | | | | | | |
| Real estate loans: | | | | | | | | | | | | |
| One- to four-family residential | | $ | 740 | | | $ | 607 | | | $ | 369 | |
| Commercial | | | 65 | | | | - | | | | - | |
| Construction | | | - | | | | - | | | | - | |
| Home equity loans and lines of credit | | | - | | | | - | | | | - | |
| Commercial loans | | | - | | | | - | | | | - | |
| Consumer loans: | | | | | | | | | | | | |
| Automobile | | | - | | | | - | | | | - | |
| Passbook | | | - | | | | - | | | | - | |
| Other consumer | | | 40 | | | | 10 | | | | - | |
| Total non-accrual loans | | | 845 | | | | 617 | | | | 369 | |
| | | | | | | | | | | | | |
| Accruing loans past due 90 days or more | | | - | | | | - | | | | - | |
| | | | | | | | | | | | | |
| Real estate owned: | | | | | | | | | | | | |
| One- to four-family residential | | | 58 | | | | 75 | | | | 276 | |
| Commercial | | | - | | | | - | | | | - | |
| Construction | | | - | | | | - | | | | - | |
| Total real estate owned | | | 58 | | | | 75 | | | | 276 | |
| | | | | | | | | | | | | |
| Total non-performing assets | | $ | 903 | | | $ | 692 | | | $ | 645 | |
| | | | | | | | | | | | | |
| Total accruing troubled debt restructured loans | | $ | 19 | | | $ | 20 | | | $ | 22 | |
| Total non-performing loans to total loans(1) | | | 0.94 | % | | | 0.71 | % | | | 0.43 | % |
| Total non-accruing loans to total loans | | | 0.92 | % | | | 0.69 | % | | | 0.40 | % |
| Total non-performing assets to total assets | | | 0.44 | % | | | 0.33 | % | | | 0.48 | % |
| (1) | At March 31, 2023 and September 30, 2022, there were no loans from the Citizens Bank of Cape Vincent acquisition on non-accrual or non-performing status. The increase in non-accrual loans at September 30, 2022 was the result of three residential mortgage customers going over 90 days delinquent. |
Source: Gouverneur Bancorp’s prospectus.
EXHIBIT I-12
Gouverneur Bancorp, Inc.
Deposit Composition
EXHIBIT I-12
Gouverneur Bancorp, Inc.
Deposit Composition
| | | At March 31, | | | At September 30, | |
| | | 2023 | | | 2022 | | | 2021 | |
| | | Amount | | | Percent | | | Average Rate | | | Amount | | | Percent | | | Average Rate | | | Amount | | | Percent | | | Average Rate | |
| | | | | | | | | | | | | | | | | | | | | | | | | | | | |
| | | (Dollars in thousands) | |
| | | | | | | | (unaudited) | | | | | | | | | | | | | | | | | | | | | | | | | | | | | |
| Noninterest-bearing demand deposits | | $ | 17,195 | | | | 10.36 | % | | | 0.00 | % | | $ | 25,760 | | | | 14.00 | % | | | 0.00 | % | | $ | 14,142 | | | | 14.04 | % | | | 0.00 | % |
| Regular savings and other deposits | | | 73,994 | | | | 44.61 | % | | | 0.10 | % | | | 83,735 | | | | 45.53 | % | | | 0.10 | % | | | 39,360 | | | | 39.07 | % | | | 0.10 | % |
| NOW and money market deposits | | | 51,916 | | | | 31.29 | % | | | 0.08 | % | | | 54,085 | | | | 29.40 | % | | | 0.08 | % | | | 31,057 | | | | 30.82 | % | | | 0.10 | % |
| Time deposits and certificates of deposit | | | 22,791 | | | | 13.74 | % | | | 1.28 | % | | | 20,371 | | | | 11.07 | % | | | 0.47 | % | | | 16,195 | | | | 16.07 | % | | | 0.70 | % |
| Total | | $ | 165,896 | | | | 100.00 | % | | | | | | $ | 183,951 | | | | 100.00 | % | | | | | | $ | 100,754 | | | | 100.00 | % | | | | |
Source: Gouverneur Bancorp’s prospectus.
EXHIBIT II-1
Description of Office Properties
Exhibit II-1
Gouverneur Bancorp, Inc.
Description of Office Properties
Properties
We conduct business through our five branch offices located in Jefferson and St. Lawrence Counties in New York. At March 31, 2023, we owned four of our branch office locations and leased one of our branch office locations. At March 31, 2023, the total net book value of our land, buildings, furniture, fixtures and equipment was $3.2 million.
Source: Gouverneur Bancorp’s prospectus.
EXHIBIT II-2
Historical Interest Rates
| Exhibit II-2 |
| Historical Interest Rates(1) |
| | | | | | | | | | | | | | | |
| | | | | Prime | | | 90 Day | | | One Year | | | 10 Year | |
| Year/Qtr. Ended | | Rate | | | T-Note | | | T-Note | | | T-Note | |
| 2010: | | Quarter 1 | | | 3.25 | % | | | 0.16 | % | | | 0.41 | % | | | 3.84 | % |
| | | Quarter 2 | | | 3.25 | % | | | 0.18 | % | | | 0.32 | % | | | 2.97 | % |
| | | Quarter 3 | | | 3.25 | % | | | 0.18 | % | | | 0.32 | % | | | 2.97 | % |
| | | Quarter 4 | | | 3.25 | % | | | 0.12 | % | | | 0.29 | % | | | 3.30 | % |
| | | | | | | | | | | | | | | | | | | |
| 2011: | | Quarter 1 | | | 3.25 | % | | | 0.09 | % | | | 0.30 | % | | | 3.47 | % |
| | | Quarter 2 | | | 3.25 | % | | | 0.03 | % | | | 0.19 | % | | | 3.18 | % |
| | | Quarter 3 | | | 3.25 | % | | | 0.02 | % | | | 0.13 | % | | | 1.92 | % |
| | | Quarter 4 | | | 3.25 | % | | | 0.02 | % | | | 0.12 | % | | | 1.89 | % |
| | | | | | | | | | | | | | | | | | | |
| 2012: | | Quarter 1 | | | 3.25 | % | | | 0.07 | % | | | 0.19 | % | | | 2.23 | % |
| | | Quarter 2 | | | 3.25 | % | | | 0.09 | % | | | 0.21 | % | | | 1.67 | % |
| | | Quarter 3 | | | 3.25 | % | | | 0.10 | % | | | 0.17 | % | | | 1.65 | % |
| | | Quarter 4 | | | 3.25 | % | | | 0.05 | % | | | 0.16 | % | | | 1.78 | % |
| | | | | | | | | | | | | | | | | | | |
| 2013: | | Quarter 1 | | | 3.25 | % | | | 0.07 | % | | | 0.14 | % | | | 1.87 | % |
| | | Quarter 2 | | | 3.25 | % | | | 0.04 | % | | | 0.15 | % | | | 2.52 | % |
| | | Quarter 3 | | | 3.25 | % | | | 0.02 | % | | | 0.10 | % | | | 2.64 | % |
| | | Quarter 4 | | | 3.25 | % | | | 0.07 | % | | | 0.13 | % | | | 3.04 | % |
| | | | | | | | | | | | | | | | | | | |
| 2014: | | Quarter 1 | | | 3.25 | % | | | 0.05 | % | | | 0.13 | % | | | 2.73 | % |
| | | Quarter 2 | | | 3.25 | % | | | 0.04 | % | | | 0.11 | % | | | 2.53 | % |
| | | Quarter 3 | | | 3.25 | % | | | 0.02 | % | | | 0.13 | % | | | 2.52 | % |
| | | Quarter 4 | | | 3.25 | % | | | 0.04 | % | | | 0.25 | % | | | 2.17 | % |
| | | | | | | | | | | | | | | | | | | |
| 2015: | | Quarter 1 | | | 3.25 | % | | | 0.03 | % | | | 0.26 | % | | | 1.94 | % |
| | | Quarter 2 | | | 3.25 | % | | | 0.01 | % | | | 0.28 | % | | | 2.35 | % |
| | | Quarter 3 | | | 3.25 | % | | | 0.00 | % | | | 0.33 | % | | | 2.06 | % |
| | | Quarter 4 | | | 3.50 | % | | | 0.16 | % | | | 0.65 | % | | | 2.27 | % |
| | | | | | | | | | | | | | | | | | | |
| 2016: | | Quarter 1 | | | 3.50 | % | | | 0.21 | % | | | 0.59 | % | | | 1.78 | % |
| | | Quarter 2 | | | 3.50 | % | | | 0.26 | % | | | 0.45 | % | | | 1.49 | % |
| | | Quarter 3 | | | 3.50 | % | | | 0.29 | % | | | 0.59 | % | | | 1.60 | % |
| | | Quarter 4 | | | 3.75 | % | | | 0.51 | % | | | 0.85 | % | | | 2.45 | % |
| | | | | | | | | | | | | | | | | | | |
| 2017: | | Quarter 1 | | | 4.00 | % | | | 0.76 | % | | | 1.03 | % | | | 2.40 | % |
| | | Quarter 2 | | | 4.25 | % | | | 1.03 | % | | | 1.24 | % | | | 2.31 | % |
| | | Quarter 3 | | | 4.25 | % | | | 1.06 | % | | | 1.31 | % | | | 2.33 | % |
| | | Quarter 4 | | | 4.50 | % | | | 1.39 | % | | | 1.76 | % | | | 2.40 | % |
| | | | | | | | | | | | | | | | | | | |
| 2018: | | Quarter 1 | | | 4.75 | % | | | 1.73 | % | | | 2.09 | % | | | 2.74 | % |
| | | Quarter 2 | | | 5.00 | % | | | 1.93 | % | | | 2.33 | % | | | 2.85 | % |
| | | Quarter 3 | | | 5.25 | % | | | 2.19 | % | | | 2.59 | % | | | 3.05 | % |
| | | Quarter 4 | | | 5.50 | % | | | 2.45 | % | | | 2.63 | % | | | 2.69 | % |
| | | | | | | | | | | | | | | | | | | |
| 2019: | | Quarter 1 | | | 5.50 | % | | | 2.40 | % | | | 2.40 | % | | | 2.41 | % |
| | | Quarter 2 | | | 5.00 | % | | | 2.12 | % | | | 1.92 | % | | | 2.00 | % |
| | | Quarter 3 | | | 4.75 | % | | | 1.88 | % | | | 1.75 | % | | | 1.68 | % |
| | | Quarter 4 | | | 4.75 | % | | | 1.55 | % | | | 1.59 | % | | | 1.92 | % |
| | | | | | | | | | | | | | | | | | | |
| 2020: | | Quarter 1 | | | 3.25 | % | | | 0.11 | % | | | 0.17 | % | | | 0.70 | % |
| | | Quarter 2 | | | 3.25 | % | | | 0.16 | % | | | 0.16 | % | | | 0.66 | % |
| | | Quarter 3 | | | 3.25 | % | | | 0.10 | % | | | 0.12 | % | | | 0.69 | % |
| | | Quarter 4 | | | 3.25 | % | | | 0.09 | % | | | 0.10 | % | | | 0.93 | % |
| | | | | | | | | | | | | | | | | | | |
| 2021: | | Quarter 1 | | | 3.25 | % | | | 0.03 | % | | | 0.07 | % | | | 1.74 | % |
| | | Quarter 2 | | | 3.25 | % | | | 0.05 | % | | | 0.08 | % | | | 1.44 | % |
| | | Quarter 3 | | | 3.25 | % | | | 0.04 | % | | | 0.09 | % | | | 1.52 | % |
| | | Quarter 4 | | | 3.25 | % | | | 0.06 | % | | | 0.39 | % | | | 1.52 | % |
| | | | | | | | | | | | | | | | | | | |
| 2022: | | Quarter 1 | | | 3.50 | % | | | 0.52 | % | | | 1.63 | % | | | 2.32 | % |
| | | Quarter 2 | | | 4.75 | % | | | 1.72 | % | | | 2.80 | % | | | 2.98 | % |
| | | Quarter 3 | | | 6.25 | % | | | 3.33 | % | | | 4.05 | % | | | 3.83 | % |
| | | Quarter 4 | | | 7.50 | % | | | 4.42 | % | | | 4.73 | % | | | 3.88 | % |
| | | | | | | | | | | | | | | | | | | |
| 2023: | | Quarter 1 | | | 8.00 | % | | | 4.85 | % | | | 4.64 | % | | | 3.48 | % |
| As of May 8, 2022 | | | 8.25 | % | | | 5.31 | % | | | 4.79 | % | | | 3.52 | % |
| (1) End of period data. | | | | | | | |
| | | | | | | | | | |
| Sources: Federal Reserve and The Wall Street Journal. | | | |
EXHIBIT III-1
Characteristics of Publicly-Traded Thrifts
| Exhibit III-1 |
| Characteristics of Publicly-Traded Thrifts |
| May 8, 2023 |
| | | | | | | | | | | | | | | | | | | | | | | | | | | |
| | | | | | | | | | | | | | | | | | | | | | | As of | |
| | | | | | | | | | | | | | | | | | | | | | | May 8, 2023 | |
| | | | | | | | | | | | | Total | | | | | | Fiscal | | Conv. | | Stock | | | Market | |
| Ticker | | Financial Institution | | Exchange | | Region | | City | | State | | Assets | | | Offices | | | Mth End | | Date | | Price | | | Value | |
| | | | | | | | | | | | | ($Mil) | | | | | | | | | | ($) | | | ($Mil) | |
| BCOW | | 1895 Bancorp of Wisconsin, Inc. | | NASDAQCM | | MW | | Greenfield | | WI | | $ | 543 | | | | 6 | | | Dec | | 1/8/19 | | $ | 6.99 | | | $ | 43 | |
| AFBI | | Affinity Bancshares, Inc. | | NASDAQCM | | SE | | Covington | | GA | | $ | 932 | | | | 3 | | | Dec | | 4/27/17 | | $ | 12.50 | | | $ | 82 | |
| AX | | Axos Financial, Inc. | | NYSE | | WE | | Las Vegas | | NV | | $ | 19,782 | | | | 1 | | | Jun | | 3/14/05 | | $ | 38.84 | | | $ | 2,296 | |
| BLFY | | Blue Foundry Bancorp | | NASDAQGS | | MA | | Rutherford | | NJ | | $ | 2,101 | | | | 19 | | | Dec | | 7/15/21 | | $ | 8.88 | | | $ | 243 | |
| BYFC | | Broadway Financial Corporation | | NASDAQCM | | WE | | Los Angeles | | CA | | $ | 1,184 | | | | 3 | | | Dec | | 1/8/96 | | $ | 0.94 | | | $ | 46 | |
| CFFN | | Capitol Federal Financial, Inc. | | NASDAQGS | | MW | | Topeka | | KS | | $ | 10,086 | | | | 50 | | | Sep | | 3/31/99 | | $ | 5.52 | | | $ | 735 | |
| CARV | | Carver Bancorp, Inc. | | NASDAQCM | | MA | | New York | | NY | | $ | 712 | | | | 7 | | | Mar | | 10/24/94 | | $ | 4.32 | | | $ | 18 | |
| CLST | | Catalyst Bancorp, Inc. | | NASDAQCM | | SW | | Opelousas | | LA | | $ | 276 | | | | 6 | | | Dec | | 10/12/21 | | $ | 9.57 | | | $ | 48 | |
| CULL | | Cullman Bancorp, Inc. | | NASDAQCM | | SE | | Cullman | | AL | | $ | 423 | | | | 4 | | | Dec | | 10/8/09 | | $ | 10.62 | | | $ | 78 | |
| ECBK | | ECB Bancorp, Inc. | | NASDAQCM | | NE | | Everett | | MA | | $ | 1,064 | | | | 2 | | | Dec | | 7/27/22 | | $ | 11.25 | | | $ | 103 | |
| ESSA | | ESSA Bancorp, Inc. | | NASDAQGS | | MA | | Stroudsburg | | PA | | $ | 1,986 | | | | 22 | | | Sep | | 4/3/07 | | $ | 13.91 | | | $ | 135 | |
| FNWB | | First Northwest Bancorp | | NASDAQGM | | WE | | Port Angeles | | WA | | $ | 2,172 | | | | 14 | | | Dec | | 1/29/15 | | $ | 10.91 | | | $ | 97 | |
| FSEA | | First Seacoast Bancorp, Inc. | | NASDAQCM | | NE | | Dover | | NH | | $ | 537 | | | | 5 | | | Dec | | 7/16/19 | | $ | 8.12 | | | $ | 41 | |
| FSBW | | FS Bancorp, Inc. | | NASDAQCM | | WE | | Mountlake Terrace | | WA | | $ | 2,783 | | | | 29 | | | Dec | | 7/9/12 | | $ | 29.25 | | | $ | 223 | |
| GBNY | | Generations Bancorp NY, Inc. | | NASDAQCM | | MA | | Seneca Falls | | NY | | $ | 389 | | | | 10 | | | Dec | | 7/10/06 | | $ | 9.15 | | | $ | 21 | |
| HONE | | HarborOne Bancorp, Inc. | | NASDAQGS | | NE | | Brockton | | MA | | $ | 5,573 | | | | 34 | | | Dec | | 6/29/16 | | $ | 8.13 | | | $ | 366 | |
| HIFS | | Hingham Institution for Savings | | NASDAQGM | | NE | | Hingham | | MA | | $ | 4,206 | | | | 8 | | | Dec | | 12/13/88 | | $ | 182.28 | | | $ | 391 | |
| HMNF | | HMN Financial, Inc. | | NASDAQGM | | MW | | Rochester | | MN | | $ | 1,072 | | | | 14 | | | Dec | | 6/30/94 | | $ | 18.00 | | | $ | 78 | |
| HFBL | | Home Federal Bancorp, Inc. of Louisiana | | NASDAQCM | | SW | | Shreveport | | LA | | $ | 686 | | | | 11 | | | Jun | | 1/18/05 | | $ | 16.13 | | | $ | 48 | |
| IROQ | | IF Bancorp, Inc. | | NASDAQCM | | MW | | Watseka | | IL | | $ | 843 | | | | 8 | | | Jun | | 7/7/11 | | $ | 15.12 | | | $ | 48 | |
| KRNY | | Kearny Financial Corp. | | NASDAQGS | | MA | | Fairfield | | NJ | | $ | 8,349 | | | | 45 | | | Jun | | 2/23/05 | | $ | 7.17 | | | $ | 457 | |
| MGYR | | Magyar Bancorp, Inc. | | NASDAQGM | | MA | | New Brunswick | | NJ | | $ | 840 | | | | 7 | | | Sep | | 1/23/06 | | $ | 9.99 | | | $ | 67 | |
| MSVB | | Mid-Southern Bancorp, Inc. | | NASDAQCM | | MW | | Salem | | IN | | $ | 266 | | | | 3 | | | Dec | | 4/8/98 | | $ | 9.87 | | | $ | 28 | |
| NYCB | | New York Community Bancorp, Inc. | | NYSE | | MA | | Hicksville | | NY | | $ | 123,754 | | | | 436 | | | Dec | | 11/23/93 | | $ | 9.97 | | | $ | 7,200 | |
| NECB | | Northeast Community Bancorp, Inc. | | NASDAQCM | | MA | | White Plains | | NY | | $ | 1,503 | | | | 12 | | | Dec | | 7/5/06 | | $ | 12.77 | | | $ | 178 | |
| NFBK | | Northfield Bancorp, Inc. (Staten Island, NY) | | NASDAQGS | | MA | | Woodbridge | | NJ | | $ | 5,663 | | | | 38 | | | Dec | | 11/7/07 | | $ | 9.51 | | | $ | 443 | |
| NSTS | | NSTS Bancorp, Inc. | | NASDAQCM | | MW | | Waukegan | | IL | | $ | 264 | | | | 3 | | | Dec | | 1/18/22 | | $ | 8.40 | | | $ | 45 | |
| PBBK | | PB Bankshares, Inc. | | NASDAQCM | | MA | | Coatesville | | PA | | $ | 393 | | | | 4 | | | Dec | | 7/14/21 | | $ | 11.50 | | | $ | 30 | |
| PDLB | | Ponce Financial Group, Inc. | | NASDAQGM | | MA | | Bronx | | NY | | $ | 2,540 | | | | 14 | | | Dec | | 9/29/17 | | $ | 7.05 | | | $ | 164 | |
| PVBC | | Provident Bancorp, Inc. | | NASDAQCM | | NE | | Amesbury | | MA | | $ | 1,702 | | | | 7 | | | Dec | | 7/15/15 | | $ | 7.05 | | | $ | 123 | |
| PROV | | Provident Financial Holdings, Inc. | | NASDAQGS | | WE | | Riverside | | CA | | $ | 1,335 | | | | 14 | | | Jun | | 6/27/96 | | $ | 12.62 | | | $ | 89 | |
| PFS | | Provident Financial Services, Inc. | | NYSE | | MA | | Jersey City | | NJ | | $ | 13,779 | | | | 95 | | | Dec | | 1/15/03 | | $ | 15.39 | | | $ | 1,150 | |
| RVSB | | Riverview Bancorp, Inc. | | NASDAQGS | | WE | | Vancouver | | WA | | $ | 1,590 | | | | 18 | | | Mar | | 10/26/93 | | $ | 4.49 | | | $ | 95 | |
| SBT | | Sterling Bancorp, Inc. (Southfield, MI) | | NASDAQCM | | MW | | Southfield | | MI | | $ | 2,412 | | | | 28 | | | Dec | | 11/16/17 | | $ | 4.59 | | | $ | 233 | |
| TCBC | | TC Bancshares, Inc. | | NASDAQCM | | SE | | Thomasville | | GA | | $ | 430 | | | | 2 | | | Dec | | 7/20/21 | | $ | 13.50 | | | $ | 62 | |
| TBNK | | Territorial Bancorp Inc. | | NASDAQGS | | WE | | Honolulu | | HI | | $ | 2,213 | | | | 30 | | | Dec | | 7/10/09 | | $ | 11.02 | | | $ | 96 | |
| TCBS | | Texas Community Bancshares, Inc. | | NASDAQCM | | SW | | Mineola | | TX | | $ | 417 | | | | 6 | | | Dec | | 7/14/21 | | $ | 10.25 | | | $ | 32 | |
| TCBX | | Third Coast Bancshares, Inc. | | NASDAQGS | | SW | | Humble | | TX | | $ | 3,860 | | | | 16 | | | Dec | | 11/8/21 | | $ | 14.51 | | | $ | 216 | |
| TSBK | | Timberland Bancorp, Inc. | | NASDAQGM | | WE | | Hoquiam | | WA | | $ | 1,787 | | | | 23 | | | Sep | | 1/12/98 | | $ | 22.75 | | | $ | 187 | |
| TFIN | | Triumph Financial, Inc. | | NASDAQGS | | SW | | Dallas | | TX | | $ | 5,628 | | | | 64 | | | Dec | | 11/6/14 | | $ | 47.88 | | | $ | 1,108 | |
| TRST | | TrustCo Bank Corp NY | | NASDAQGS | | MA | | Glenville | | NY | | $ | 6,046 | | | | 143 | | | Dec | | | | $ | 28.06 | | | $ | 534 | |
| WSBF | | Waterstone Financial, Inc. | | NASDAQGS | | MW | | Wauwatosa | | WI | | $ | 2,114 | | | | 16 | | | Dec | | 10/4/05 | | $ | 13.91 | | | $ | 315 | |
| WNEB | | Western New England Bancorp, Inc. | | NASDAQGS | | NE | | Westfield | | MA | | $ | 2,562 | | | | 27 | | | Dec | | 12/27/01 | | $ | 6.02 | | | $ | 134 | |
| WMPN | | William Penn Bancorporation | | NASDAQCM | | MA | | Bristol | | PA | | $ | 862 | | | | 13 | | | Jun | | 4/15/08 | | $ | 9.71 | | | $ | 127 | |
| WSFS | | WSFS Financial Corporation | | NASDAQGS | | MA | | Wilmington | | DE | | $ | 20,319 | | | | 98 | | | Dec | | 11/26/86 | | $ | 31.36 | | | $ | 1,927 | |
| BSBK | | Bogota Financial Corp. | | NASDAQCM | | MA | | Teaneck | | NJ | | $ | 950 | | | | 8 | | | Dec | | 1/15/20 | | $ | 8.21 | | | $ | 108 | |
| CFSB | | CFSB Bancorp, Inc. | | NASDAQCM | | NE | | Quincy | | MA | | $ | 352 | | | | 4 | | | Jun | | 1/12/22 | | $ | 6.99 | | | $ | 44 | |
| CLBK | | Columbia Financial, Inc. | | NASDAQGS | | MA | | Fair Lawn | | NJ | | $ | 10,635 | | | | 67 | | | Dec | | 4/19/18 | | $ | 15.75 | | | $ | 1,666 | |
| GCBC | | Greene County Bancorp, Inc. | | NASDAQCM | | MA | | Catskill | | NY | | $ | 2,729 | | | | 19 | | | Jun | | 12/30/98 | | $ | 18.27 | | | $ | 311 | |
| KFFB | | Kentucky First Federal Bancorp | | NASDAQGM | | MW | | Hazard | | KY | | $ | 343 | | | | 7 | | | Jun | | 3/2/05 | | $ | 6.01 | | | $ | 49 | |
| LSBK | | Lake Shore Bancorp, Inc. | | NASDAQGM | | MA | | Dunkirk | | NY | | $ | 730 | | | | 12 | | | Dec | | 4/3/06 | | $ | 11.35 | | | $ | 63 | |
| OFED | | Oconee Federal Financial Corp. | | NASDAQCM | | SE | | Seneca | | SC | | $ | 565 | | | | 8 | | | Jun | | 1/13/11 | | $ | 19.58 | | | $ | 110 | |
| PBFS | | Pioneer Bancorp, Inc. | | NASDAQCM | | MA | | Albany | | NY | | $ | 1,835 | | | | 23 | | | Jun | | 7/17/19 | | $ | 8.61 | | | $ | 217 | |
| RBKB | | Rhinebeck Bancorp, Inc. | | NASDAQCM | | MA | | Poughkeepsie | | NY | | $ | 1,351 | | | | 18 | | | Dec | | 1/16/19 | | $ | 6.40 | | | $ | 70 | |
| TFSL | | TFS Financial Corporation | | NASDAQGS | | MW | | Cleveland | | OH | | $ | 16,262 | | | | 37 | | | Sep | | 4/20/07 | | $ | 11.75 | | | $ | 3,259 | |
Source: S&P Global Market Intelligence.
EXHIBIT III-2
Public Market Pricing of Mid-Atlantic, New England and Midwest Thrifts
RP ® Financial, LC.
Exhibit III-2
Public Market Pricing of Mid-Atlantic, New England and Midwest Institutions
As of May 8, 2023
| | | | | | | Market | | | Per Share Data | | | | | | | | | | | | | | | | | | | | | | | | | | | | | | | | | | | | | | | | | | | | | | | | | |
| | | | | | | Capitalization | | | Core | | | Book | | | | | | | | | | | | | | | | | | Dividends(3) | | | Financial Characteristics(5) | |
| | | | | | | Price/ | | | Market | | | 12 Month | | | Value/ | | | Pricing Ratios(2) | | | Amount/ | | | | | | Payout | | | Total | | | Equity/ | | | Tang. Eq./ | | | NPAs/ | | | Reported | | | Core | |
| | | | | Share | | | Value | | | EPS(1) | | | Share | | | P/E | | | P/B | | | P/A | | | P/TB | | | P/Core | | | Share | | | Yield | | | Ratio(4) | | | Assets | | | Assets | | | T. Assets | | | Assets | | | ROAA | | | ROAE | | | ROAA | | | ROAE | |
| | | | | | | ($) | | | ($Mil) | | | ($) | | | ($) | | | (x) | | | (%) | | | (%) | | | (%) | | | (x) | | | ($) | | | (%) | | | (%) | | | ($Mil) | | | (%) | | | (%) | | | (%) | | | (%) | | | (%) | | | (%) | | | (%) | |
| All Non-MHC Public Thrifts(6) | | | | | | | | | | | | | | | | | | | | | | | | | | | | | | | | | | | | | | | | | | | | | | | | | | | | | | | | | | | | | | | | | | | | | | | | | | | | | | | | | | |
| Averages | | | | $ | 16.88 | | | $ | 449.07 | | | $ | 1.79 | | | $ | 20.99 | | | | 9.63 | x | | | 73.24 | % | | | 8.97 | % | | | 80.50 | % | | | 11.43 | x | | $ | 0.49 | | | | 3.21 | % | | | 35.89 | % | | $ | 5,955 | | | | 13.32 | % | | | 12.77 | % | | | 0.41 | % | | | 0.70 | % | | | 6.04 | % | | | 0.75 | % | | | 6.32 | % |
| Median | | | | $ | 10.62 | | | $ | 123.38 | | | $ | 1.08 | | | $ | 16.26 | | | | 9.04 | x | | | 69.37 | % | | | 7.97 | % | | | 73.33 | % | | | 8.71 | x | | $ | 0.33 | | | | 2.81 | % | | | 28.31 | % | | $ | 1,702 | | | | 11.78 | % | | | 10.72 | % | | | 0.26 | % | | | 0.75 | % | | | 6.38 | % | | | 0.77 | % | | | 6.71 | % |
| | | | | | | | | | | | | | | | | | | | | | | | | | | | | | | | | | | | | | | | | | | | | | | | | | | | | | | | | | | | | | | | | | | | | | | | | | | | | | | | | | | | | |
| Comparable Group | | | | | | | | | | | | | | | | | | | | | | | | | | | | | | | | | | | | | | | | | | | | | | | | | | | | | | | | | | | | | | | | | | | | | | | | | | | | | | | | | | |
| Averages | | | | $ | 17.03 | | | $ | 530.35 | | | $ | 1.76 | | | $ | 21.45 | | | | 9.19 | x | | | 71.00 | % | | | 8.70 | % | | | 76.83 | % | | | 12.41 | x | | $ | 0.53 | | | | 3.28 | % | | | 39.88 | % | | $ | 7,672 | | | | 12.89 | % | | | 12.48 | % | | | 0.48 | % | | | 0.59 | % | | | 5.19 | % | | | 0.63 | % | | | 5.18 | % |
| Medians | | | | $ | 9.71 | | | $ | 135.08 | | | $ | 0.77 | | | $ | 14.92 | | | | 8.68 | x | | | 69.79 | % | | | 7.96 | % | | | 72.48 | % | | | 8.89 | x | | $ | 0.34 | | | | 2.64 | % | | | 30.55 | % | | $ | 1,986 | | | | 11.78 | % | | | 11.11 | % | | | 0.22 | % | | | 0.62 | % | | | 5.14 | % | | | 0.71 | % | | | 6.15 | % |
| | | | | | | | | | | | | | | | | | | | | | | | | | | | | | | | | | | | | | | | | | | | | | | | | | | | | | | | | | | | | | | | | | | | | | | | | | | | | | | | | | | | | |
| Comparable Group | | | | | | | | | | | | | | | | | | | | | | | | | | | | | | | | | | | | | | | | | | | | | | | | | | | | | | | | | | | | | | | | | | | | | | | | | | | | | | | | | | |
| BLFY | | Blue Foundry Bancorp | | NJ | | $ | 8.88 | | | $ | 243.05 | | | | NA | | | $ | 14.08 | | | | NM | | | | 63.02 | % | | | 11.57 | % | | | 63.14 | % | | | NM | | | | NA | | | | NA | | | | NA | | | $ | 2,101 | | | | 18.36 | % | | | 18.33 | % | | | NA | | | | 0.03 | % | | | 0.16 | % | | | NA | | | | NA | |
| CARV | | Carver Bancorp, Inc. | | NY | | $ | 4.32 | | | $ | 18.26 | | | $ | (0.63 | ) | | $ | 4.60 | | | | NM | | | | 93.95 | % | | | 2.70 | % | | | 93.95 | % | | | NM | | | $ | 0.00 | | | | 0.00 | % | | | NA | | | $ | 712 | | | | 6.34 | % | | | 6.34 | % | | | 2.59 | % | | | -0.39 | % | | | -5.38 | % | | | -0.39 | % | | | -5.38 | % |
| ESSA | | ESSA Bancorp, Inc. | | PA | | $ | 13.91 | | | $ | 135.08 | | | $ | 2.11 | | | $ | 21.03 | | | | 6.66 | x | | | 66.13 | % | | | 7.29 | % | | | 70.65 | % | | | 6.60 | x | | $ | 0.60 | | | | 4.31 | % | | | 28.71 | % | | $ | 1,986 | | | | 11.02 | % | | | 10.39 | % | | | NA | | | | 1.08 | % | | | 9.43 | % | | | 1.09 | % | | | 9.50 | % |
| GBNY | | Generations Bancorp NY, Inc. | | NY | | $ | 9.15 | | | $ | 21.42 | | | $ | 0.27 | | | $ | 16.03 | | | | NM | | | | 57.09 | % | | | 5.50 | % | | | 59.46 | % | | | 34.49 | x | | | NA | | | | NA | | | | NA | | | $ | 389 | | | | 9.64 | % | | | 9.29 | % | | | NA | | | | 0.14 | % | | | 1.39 | % | | | 0.16 | % | | | 1.60 | % |
| KRNY | | Kearny Financial Corp. | | NJ | | $ | 7.17 | | | $ | 456.55 | | | $ | 0.79 | | | $ | 12.99 | | | | 11.75 | x | | | 55.19 | % | | | 5.73 | % | | | 73.33 | % | | | 9.05 | x | | $ | 0.44 | | | | 6.14 | % | | | 72.13 | % | | $ | 8,349 | | | | 10.37 | % | | | NA | | | | 0.81 | % | | | 0.51 | % | | | 4.51 | % | | | 0.66 | % | | | 5.84 | % |
| MGYR | | Magyar Bancorp, Inc. | | NJ | | $ | 9.99 | | | $ | 67.38 | | | $ | 1.23 | | | $ | 15.12 | | | | 8.12 | x | | | 66.09 | % | | | 7.96 | % | | | 66.09 | % | | | 8.12 | x | | $ | 0.12 | | | | 1.20 | % | | | 16.26 | % | | $ | 840 | | | | 12.05 | % | | | 12.05 | % | | | NA | | | | 1.01 | % | | | 8.18 | % | | | 1.01 | % | | | 8.18 | % |
| NYCB | | New York Community Bancorp, Inc. | | NY | | $ | 9.97 | | | $ | 7,199.84 | | | $ | 1.51 | | | $ | 14.23 | | | | 2.62 | x | | | 70.04 | % | | | 5.84 | % | | | 101.14 | % | | | 6.62 | x | | $ | 0.68 | | | | 6.82 | % | | | 17.85 | % | | $ | 123,754 | | | | 8.71 | % | | | 6.32 | % | | | NA | | | | 3.42 | % | | | 32.85 | % | | | 1.25 | % | | | 12.04 | % |
| NECB | | Northeast Community Bancorp, Inc. | | NY | | $ | 12.77 | | | $ | 177.60 | | | $ | 2.21 | | | $ | 17.13 | | | | 5.94 | x | | | 74.56 | % | | | 13.02 | % | | | 74.61 | % | | | 5.78 | x | | $ | 0.24 | | | | 1.88 | % | | | 11.16 | % | | $ | 1,503 | | | | 17.47 | % | | | 17.46 | % | | | NA | | | | 2.44 | % | | | 12.41 | % | | | 2.51 | % | | | 12.76 | % |
| NFBK | | Northfield Bancorp, Inc. (Staten Island, NY) | | NJ | | $ | 9.51 | | | $ | 442.50 | | | $ | 1.28 | | | $ | 15.00 | | | | 7.43 | x | | | 63.38 | % | | | 7.81 | % | | | 67.36 | % | | | 7.42 | x | | $ | 0.52 | | | | 5.47 | % | | | 40.63 | % | | $ | 5,663 | | | | 12.33 | % | | | 11.68 | % | | | 0.23 | % | | | 1.04 | % | | | 8.33 | % | | | 1.04 | % | | | 8.35 | % |
| PBBK | | PB Bankshares, Inc. | | PA | | $ | 11.50 | | | $ | 30.01 | | | $ | 0.65 | | | $ | 16.48 | | | | 12.92 | x | | | 69.79 | % | | | 8.22 | % | | | 69.79 | % | | | 17.61 | x | | | NA | | | | NA | | | | NA | | | $ | 393 | | | | 11.78 | % | | | 11.78 | % | | | NA | | | | 0.59 | % | | | 4.85 | % | | | 0.43 | % | | | 3.55 | % |
| PDLB | | Ponce Financial Group, Inc. | | NY | | $ | 7.05 | | | $ | 164.36 | | | | NA | | | $ | 10.90 | | | | NM | | | | 64.67 | % | | | 7.57 | % | | | 64.67 | % | | | NM | | | | NA | | | | NA | | | | NA | | | $ | 2,540 | | | | 19.53 | % | | | 19.53 | % | | | NA | | | | -1.09 | % | | | -5.01 | % | | | NA | | | | NA | |
| PFS | | Provident Financial Services, Inc. | | NJ | | $ | 15.39 | | | $ | 1,150.04 | | | $ | 2.39 | | | $ | 21.73 | | | | 6.66 | x | | | 70.82 | % | | | 8.43 | % | | | 98.43 | % | | | 6.44 | x | | $ | 0.96 | | | | 6.24 | % | | | 41.56 | % | | $ | 13,779 | | | | 11.90 | % | | | 8.86 | % | | | NA | | | | 1.26 | % | | | 10.74 | % | | | 1.29 | % | | | 10.99 | % |
| TRST | | TrustCo Bank Corp NY | | NY | | $ | 28.06 | | | $ | 533.83 | | | $ | 3.98 | | | $ | 32.31 | | | | 7.06 | x | | | 86.84 | % | | | 8.83 | % | | | 86.92 | % | | | 7.06 | x | | $ | 1.44 | | | | 5.13 | % | | | 35.71 | % | | $ | 6,046 | | | | 10.17 | % | | | 10.16 | % | | | NA | | | | 1.24 | % | | | 12.66 | % | | | 1.24 | % | | | 12.66 | % |
| WMPN | | William Penn Bancorporation | | PA | | $ | 9.71 | | | $ | 127.03 | | | $ | 0.28 | | | $ | 12.87 | | | | NM | | | | 75.46 | % | | | 15.23 | % | | | 77.89 | % | | | 34.50 | x | | $ | 0.12 | | | | 1.24 | % | | | 48.00 | % | | $ | 862 | | | | 20.18 | % | | | 19.68 | % | | | 0.59 | % | | | 0.39 | % | | | 1.80 | % | | | 0.45 | % | | | 2.07 | % |
| WSFS | | WSFS Financial Corporation | | DE | | $ | 31.36 | | | $ | 1,927.03 | | | $ | 4.80 | | | $ | 37.57 | | | | 7.00 | x | | | 83.47 | % | | | 9.47 | % | | | 147.63 | % | | | 6.54 | x | | $ | 0.60 | | | | 1.91 | % | | | 13.39 | % | | $ | 20,319 | | | | 11.34 | % | | | 6.74 | % | | | 0.16 | % | | | 1.39 | % | | | 12.33 | % | | | 1.49 | % | | | 13.19 | % |
| BCOW | | 1895 Bancorp of Wisconsin, Inc. | | WI | | $ | 6.99 | | | $ | 43.28 | | | $ | 0.08 | | | $ | 12.14 | | | | NM | | | | 57.56 | % | | | 7.99 | % | | | 57.56 | % | | | NM | | | | NA | | | | NA | | | | NA | | | $ | 543 | | | | 13.88 | % | | | 13.88 | % | | | 0.21 | % | | | -0.03 | % | | | -0.19 | % | | | 0.08 | % | | | 0.52 | % |
| CFFN | | Capitol Federal Financial, Inc. | | KS | | $ | 5.52 | | | $ | 735.22 | | | $ | 0.54 | | | $ | 7.87 | | | | 10.42 | x | | | 70.10 | % | | | 7.45 | % | | | 70.86 | % | | | 10.29 | x | | $ | 0.34 | | | | 6.16 | % | | | 138.68 | % | | $ | 10,086 | | | | 10.63 | % | | | 10.53 | % | | | NA | | | | 0.62 | % | | | 6.38 | % | | | 0.62 | % | | | 6.46 | % |
| HMNF | | HMN Financial, Inc. | | MN | | $ | 18.00 | | | $ | 78.31 | | | $ | 1.86 | | | $ | 22.35 | | | | 9.63 | x | | | 80.54 | % | | | 7.53 | % | | | 81.19 | % | | | 9.67 | x | | $ | 0.32 | | | | 1.78 | % | | | 13.90 | % | | $ | 1,072 | | | | 9.35 | % | | | 9.28 | % | | | NA | | | | 0.76 | % | | | 7.09 | % | | | 0.76 | % | | | 7.05 | % |
| IROQ | | IF Bancorp, Inc. | | IL | | $ | 15.12 | | | $ | 48.26 | | | | NA | | | $ | 21.98 | | | | 9.51 | x | | | 68.80 | % | | | 6.02 | % | | | 68.80 | % | | | NM | | | $ | 0.40 | | | | 2.64 | % | | | 25.16 | % | | $ | 843 | | | | 8.75 | % | | | 8.75 | % | | | NA | | | | 0.62 | % | | | 7.10 | % | | | NA | | | | NA | |
| MSVB | | Mid-Southern Bancorp, Inc. | | IN | | $ | 9.87 | | | $ | 28.47 | | | $ | 0.65 | | | $ | 12.11 | | | | 15.18 | x | | | 81.48 | % | | | 10.69 | % | | | 81.48 | % | | | 15.23 | x | | $ | 0.24 | | | | 2.43 | % | | | 33.85 | % | | $ | 266 | | | | 13.12 | % | | | 13.12 | % | | | NA | | | | 0.66 | % | | | 5.14 | % | | | 0.66 | % | | | 5.12 | % |
| NSTS | | NSTS Bancorp, Inc. | | IL | | $ | 8.40 | | | $ | 45.34 | | | $ | (0.14 | ) | | $ | 14.92 | | | | NM | | | | 56.30 | % | | | 17.16 | % | | | 56.30 | % | | | NM | | | | NA | | | | NA | | | | NA | | | $ | 264 | | | | 30.48 | % | | | 30.48 | % | | | 0.32 | % | | | 0.01 | % | | | 0.03 | % | | | -0.13 | % | | | -0.45 | % |
| SBT | | Sterling Bancorp, Inc. (Southfield, MI) | | MI | | $ | 4.59 | | | $ | 233.21 | | | $ | (0.40 | ) | | $ | 6.21 | | | | NM | | | | 73.92 | % | | | 9.67 | % | | | 73.92 | % | | | NM | | | $ | 0.00 | | | | 0.00 | % | | | NA | | | $ | 2,412 | | | | 13.08 | % | | | 13.08 | % | | | NA | | | | -0.79 | % | | | -6.04 | % | | | -0.79 | % | | | -5.98 | % |
| WSBF | | Waterstone Financial, Inc. | | WI | | $ | 13.91 | | | $ | 314.54 | | | $ | 0.75 | | | $ | 16.73 | | | | 18.55 | x | | | 83.15 | % | | | 14.39 | % | | | 83.29 | % | | | 18.55 | x | | $ | 0.80 | | | | 5.75 | % | | | 106.67 | % | | $ | 2,114 | | | | 17.30 | % | | | 17.28 | % | | | 0.22 | % | | | 0.82 | % | | | 4.25 | % | | | 0.82 | % | | | 4.25 | % |
| ECBK | | ECB Bancorp, Inc. | | MA | | $ | 11.25 | | | $ | 103.22 | | | $ | 0.54 | | | $ | 17.74 | | | | NM | | | | 63.43 | % | | | 9.70 | % | | | 63.43 | % | | | 20.88 | x | | | NA | | | | NA | | | | NA | | | $ | 1,064 | | | | 15.29 | % | | | 15.29 | % | | | 0.06 | % | | | 0.35 | % | | | 2.37 | % | | | 0.58 | % | | | 3.99 | % |
| FSEA | | First Seacoast Bancorp, Inc. | | NH | | $ | 8.12 | | | $ | 41.23 | | | $ | 0.01 | | | $ | 9.73 | | | | NM | | | | 83.42 | % | | | 7.66 | % | | | 83.93 | % | | | NM | | | | NA | | | | NA | | | | NA | | | $ | 537 | | | | 9.18 | % | | | 9.13 | % | | | 0.05 | % | | | -0.11 | % | | | -1.05 | % | | | 0.01 | % | | | 0.10 | % |
| HONE | | HarborOne Bancorp, Inc. | | MA | | $ | 8.13 | | | $ | 366.45 | | | $ | 0.91 | | | $ | 12.74 | | | | 9.24 | x | | | 63.79 | % | | | 6.87 | % | | | 72.48 | % | | | 8.92 | x | | $ | 0.30 | | | | 3.69 | % | | | 32.39 | % | | $ | 5,573 | | | | 10.76 | % | | | 9.60 | % | | | NA | | | | 0.82 | % | | | 6.49 | % | | | 0.84 | % | | | 6.71 | % |
| HIFS | | Hingham Institution for Savings | | MA | | $ | 182.28 | | | $ | 391.43 | | | $ | 20.58 | | | $ | 182.89 | | | | 11.74 | x | | | 99.67 | % | | | 9.31 | % | | | 99.67 | % | | | 8.86 | x | | $ | 2.52 | | | | 1.38 | % | | | 19.90 | % | | $ | 4,206 | | | | 9.34 | % | | | 9.34 | % | | | 0.01 | % | | | 0.86 | % | | | 8.93 | % | | | 1.14 | % | | | 11.84 | % |
| PVBC | | Provident Bancorp, Inc. | | MA | | $ | 7.05 | | | $ | 123.38 | | | $ | (1.53 | ) | | $ | 11.95 | | | | NM | | | | 58.99 | % | | | 7.33 | % | | | 58.99 | % | | | NM | | | $ | 0.16 | | | | 0.00 | % | | | NA | | | $ | 1,702 | | | | 12.42 | % | | | 12.42 | % | | | NA | | | | -1.47 | % | | | -11.05 | % | | | -1.47 | % | | | -11.05 | % |
| WNEB | | Western New England Bancorp, Inc. | | MA | | $ | 6.02 | | | $ | 133.70 | | | $ | 1.09 | | | $ | 10.50 | | | | 5.06 | x | | | 57.33 | % | | | 5.22 | % | | | 61.15 | % | | | 5.53 | x | | $ | 0.28 | | | | 4.65 | % | | | 21.85 | % | | $ | 2,562 | | | | 9.10 | % | | | 8.58 | % | | | NA | | | | 1.01 | % | | | 11.74 | % | | | 0.93 | % | | | 10.75 | % |
| | | | | | | | | | | | | | | | | | | | | | | | | | | | | | | | | | | | | | | | | | | | | | | | | | | | | | | | | | | | | | | | | | | | | | | | | | | | | | | | | | | | | |
| MHC | | | | | | | | | | | | | | | | | | | | | | | | | | | | | | | | | | | | | | | | | | | | | | | | | | | | | | | | | | | | | | | | | | | | | | | | | | | | | | | | | | | | |
| BSBK | | Bogota Financial Corp. | | NJ | | $ | 8.21 | | | $ | 107.90 | | | $ | 0.48 | | | $ | 10.25 | | | | 17.10 | x | | | 80.12 | % | | | 11.73 | % | | | 80.26 | % | | | 16.96 | x | | | NA | | | | NA | | | | NA | | | $ | 950 | | | | 14.64 | % | | | 14.61 | % | | | NA | | | | 0.71 | % | | | 4.56 | % | | | 0.71 | % | | | 4.60 | % |
| CLBK | | Columbia Financial, Inc. | | NJ | | $ | 15.75 | | | $ | 1,665.99 | | | $ | 0.85 | | | $ | 9.75 | | | | 19.69 | x | | | 161.59 | % | | | 15.79 | % | | | 183.41 | % | | | 18.49 | x | | | NA | | | | NA | | | | NA | | | $ | 10,635 | | | | 9.77 | % | | | 8.71 | % | | | NA | | | | 0.84 | % | | | 7.96 | % | | | 0.88 | % | | | 8.35 | % |
| GCBC | | Greene County Bancorp, Inc. | | NY | | $ | 18.27 | | | $ | 311.08 | | | | NA | | | $ | 10.49 | | | | 9.96 | x | | | 174.10 | % | | | 11.40 | % | | | 174.10 | % | | | NM | | | $ | 0.28 | | | | 1.53 | % | | | 15.26 | % | | $ | 2,729 | | | | 6.55 | % | | | 6.55 | % | | | NA | | | | 1.21 | % | | | 19.03 | % | | | NA | | | | NA | |
| LSBK | | Lake Shore Bancorp, Inc. | | NY | | $ | 11.35 | | | $ | 63.45 | | | | NA | | | $ | 14.70 | | | | 10.51 | x | | | 77.21 | % | | | 8.85 | % | | | 77.21 | % | | | NM | | | $ | 0.72 | | | | 0.00 | % | | | 33.33 | % | | $ | 730 | | | | 11.46 | % | | | 11.46 | % | | | NA | | | | 0.90 | % | | | 7.76 | % | | | NA | | | | NA | |
| PBFS | | Pioneer Bancorp, Inc. | | NY | | $ | 8.61 | | | $ | 216.60 | | | $ | 0.59 | | | $ | 9.61 | | | | 15.11 | x | | | 89.56 | % | | | 12.19 | % | | | 93.73 | % | | | 14.59 | x | | | NA | | | | NA | | | | NA | | | $ | 1,835 | | | | 13.61 | % | | | 13.09 | % | | | 0.45 | % | | | 0.72 | % | | | 5.79 | % | | | 0.75 | % | | | 6.00 | % |
| RBKB | | Rhinebeck Bancorp, Inc. | | NY | | $ | 6.40 | | | $ | 69.99 | | | | NA | | | $ | 9.81 | | | | 12.55 | x | | | 65.23 | % | | | 5.35 | % | | | 66.76 | % | | | NM | | | | NA | | | | NA | | | | NA | | | $ | 1,351 | | | | 8.19 | % | | | 8.02 | % | | | NA | | | | 0.44 | % | | | 5.14 | % | | | NA | | | | NA | |
| KFFB | | Kentucky First Federal Bancorp | | KY | | $ | 6.01 | | | $ | 49.01 | | | | NA | | | $ | 6.32 | | | | NM | | | | 95.17 | % | | | 14.19 | % | | | 96.96 | % | | | NM | | | $ | 0.40 | | | | 6.66 | % | | | 307.69 | % | | $ | 343 | | | | 14.91 | % | | | 14.68 | % | | | NA | | | | 0.33 | % | | | 2.12 | % | | | NA | | | | NA | |
| TFSL | | TFS Financial Corporation | | OH | | $ | 11.75 | | | $ | 3,258.75 | | | $ | 0.29 | | | $ | 6.54 | | | | NM | | | | 179.55 | % | | | 20.26 | % | | | 180.51 | % | | | NM | | | $ | 1.13 | | | | 9.62 | % | | | 389.66 | % | | $ | 16,262 | | | | 11.28 | % | | | 11.23 | % | | | NA | | | | 0.52 | % | | | 4.35 | % | | | 0.52 | % | | | 4.35 | % |
| CFSB | | CFSB Bancorp, Inc. | | MA | | $ | 6.99 | | | $ | 43.87 | | | | NA | | | $ | 11.41 | | | | NM | | | | 61.27 | % | | | 13.18 | % | | | 61.27 | % | | | NM | | | | NA | | | | NA | | | | NA | | | $ | 352 | | | | 21.52 | % | | | 21.52 | % | | | NA | | | | 0.52 | % | | | 2.51 | % | | | 0.52 | % | | | 2.50 | % |
| | | | | | | | | | | | | | | | | | | | | | | | | | | | | | | | | | | | | | | | | | | | | | | | | | | | | | | | | | | | | | | | | | | | | | | | | | | | | | | | | | | | | |
| Under Merger/Acquisition | | | | | | | | | | | | | | | | | | | | | | | | | | | | | | | | | | | | | | | | | | | | | | | | | | | | | | | | | | | | | | | | | | | | | | | | | | | | | | | | | | |
| HVBC | | HV Bancorp, Inc. | | PA | | $ | 31.16 | | | $ | 69.87 | | | $ | 1.11 | | | $ | 18.77 | | | | 29.40 | x | | | 166.00 | % | | | 11.35 | % | | | 166.00 | % | | | 28.15 | x | | | NA | | | | NA | | | | NA | | | $ | 616 | | | | 6.84 | % | | | 6.84 | % | | | 0.53 | % | | | 0.38 | % | | | 5.50 | % | | | 0.40 | % | | | 5.75 | % |
(1) Core income, on a diluted per-share basis. Core income is net income after taxes and before extraordinary items, less net income attributable to noncontrolling interest, gain on the sale of securities, amortization of intangibles, goodwill and nonrecurring items. Assumed tax rate is 35%.
(2) P/E = Price to earnings; P/B = Price to book; P/A = Price to assets; P/TB = Price to tangible book value; and P/Core = Price to core earnings. P/E and P/Core =NM if the ratio is negative or above 35x.
(3) Indicated 12 month dividend, based on last quarterly dividend declared.
(4) Indicated 12 month dividend as a percent of trailing 12 month earnings.
(5) Equity and tangible equity equal common equity and tangible common equity, respectively. ROAA (return on average assets) and ROAE (return on average equity) are indicated ratios based on trailing 12 month earnings and average equity and assets balances.
(6) Excludes from averages and medians those companies the subject of actual or rumored acquisition activities or unusual operating characteristics.
Source: S&P Global Market Intelligence and RP Financial, LC. calculations. The information provided in this report has been obtained from sources we believe are reliable, but we cannot guarantee the accuracy or completeness of such information.
Copyright (c) 2023 by RP® Financial, LC.
EXHIBIT III-3
Public Market Pricing of Southeast and Southwest Thrifts
Exhibit III-3
Public Market Pricing of Southeast and Southwest Institutions
As of May 8, 2023
| | | | | | | Market | | | Per Share Data | | | | | | | | | | | | | | | | | | | | | | | | | | | | | | | | | | | | | | | | | | | | | | | | | |
| | | | | | | Capitalization | | | Core | | | Book | | | | | | | | | | | | | | | | | | Dividends(3) | | | Financial Characteristics(5) | |
| | | | | | | Price/ | | | Market | | | 12 Month | | | Value/ | | | Pricing Ratios(2) | | | Amount/ | | | | | | Payout | | | Total | | | Equity/ | | | Tang. Eq./ | | | NPAs/ | | | Reported | | | Core | |
| | | | | Share | | | Value | | | EPS(1) | | | Share | | | P/E | | | P/B | | | P/A | | | P/TB | | | P/Core | | | Share | | | Yield | | | Ratio(4) | | | Assets | | | Assets | | | T. Assets | | | Assets | | | ROAA | | | ROAE | | | ROAA | | | ROAE | |
| | | | | | | ($) | | | ($Mil) | | | ($) | | | ($) | | | (x) | | | (%) | | | (%) | | | (%) | | | (x) | | | ($) | | | (%) | | | (%) | | | ($Mil) | | | (%) | | | (%) | | | (%) | | | (%) | | | (%) | | | (%) | | | (%) | |
| All Non-MHC Public Thrifts(6) | | | | | | | | | | | | | | | | | | | | | | | | | | | | | | | | | | | | | | | | | | | | | | | | | | | | | | | | | | | | | | | | | | | | | | | | | | | | | | |
| Averages | | | | $ | 16.88 | | | $ | 449.07 | | | $ | 1.79 | | | $ | 20.99 | | | | 9.63 | x | | | 73.24 | % | | | 8.97 | % | | | 80.50 | % | | | 11.43 | x | | $ | 0.49 | | | | 3.21 | % | | | 35.89 | % | | $ | 5,955 | | | | 13.32 | % | | | 12.77 | % | | | 0.41 | % | | | 0.70 | % | | | 6.04 | % | | | 0.75 | % | | | 6.32 | % |
| Median | | | | $ | 10.62 | | | $ | 123.38 | | | $ | 1.08 | | | $ | 16.26 | | | | 9.04 | x | | | 69.37 | % | | | 7.97 | % | | | 73.33 | % | | | 8.71 | x | | $ | 0.33 | | | | 2.81 | % | | | 28.31 | % | | $ | 1,702 | | | | 11.78 | % | | | 10.72 | % | | | 0.26 | % | | | 0.75 | % | | | 6.38 | % | | | 0.77 | % | | | 6.71 | % |
| | | | | | | | | | | | | | | | | | | | | | | | | | | | | | | | | | | | | | | | | | | | | | | | | | | | | | | | | | | | | | | | | | | | | | | | | | | | | | | | | | | | | |
| Comparable Group | | | | | | | | | | | | | | | | | | | | | | | | | | | | | | | | | | | | | | | | | | | | | | | | | | | | | | | | | | | | | | | | | | | | | | | | | | | | | | |
| Averages | | | | $ | 16.87 | | | $ | 209.55 | | | $ | 1.30 | | | $ | 19.83 | | | | 13.25 | x | | | 81.14 | % | | | 11.95 | % | | | 93.78 | % | | | 13.30 | x | | $ | 0.20 | | | | 1.41 | % | | | 19.87 | % | | $ | 1,582 | | | | 16.61 | % | | | 15.71 | % | | | 0.39 | % | | | 0.79 | % | | | 5.68 | % | | | 0.86 | % | | | 6.43 | % |
| Medians | | | | $ | 13.00 | | | $ | 70.40 | | | $ | 1.08 | | | $ | 17.14 | | | | 12.82 | x | | | 73.88 | % | | | 8.80 | % | | | 78.57 | % | | | 14.01 | x | | $ | 0.11 | | | | 0.96 | % | | | 24.06 | % | | $ | 558 | | | | 14.04 | % | | | 12.11 | % | | | 0.36 | % | | | 0.82 | % | | | 5.12 | % | | | 0.91 | % | | | 6.16 | % |
| | | | | | | | | | | | | | | | | | | | | | | | | | | | | | | | | | | | | | | | | | | | | | | | | | | | | | | | | | | | | | | | | | | | | | | | | | | | | | | | | | | | | |
| Comparable Group | | | | | | | | | | | | | | | | | | | | | | | | | | | | | | | | | | | | | | | | | | | | | | | | | | | | | | | | | | | | | | | | | | | | | | | | | | | | | | | | | | |
| AFBI | | Affinity Bancshares, Inc. | | GA | | $ | 12.50 | | | $ | 82.08 | | | $ | 1.08 | | | $ | 18.02 | | | | 11.79 | x | | | 69.37 | % | | | 8.80 | % | | | 82.24 | % | | | 11.55 | x | | | NA | | | | NA | | | | NA | | | $ | 932 | | | | 12.69 | % | | | 10.92 | % | | | NA | | | | 0.89 | % | | | 6.03 | % | | | 0.91 | % | | | 6.16 | % |
| CULL | | Cullman Bancorp, Inc. | | AL | | $ | 10.62 | | | $ | 78.41 | | | $ | 0.59 | | | $ | 13.55 | | | | 18.00 | x | | | 78.39 | % | | | 18.56 | % | | | 78.39 | % | | | 17.92 | x | | $ | 0.12 | | | | 1.13 | % | | | 20.34 | % | | $ | 423 | | | | 23.67 | % | | | 23.67 | % | | | 0.62 | % | | | 1.09 | % | | | 4.21 | % | | | 1.09 | % | | | 4.23 | % |
| TCBC | | TC Bancshares, Inc. | | GA | | $ | 13.50 | | | $ | 62.39 | | | $ | 0.36 | | | $ | 17.14 | | | | NM | | | | 78.75 | % | | | 15.63 | % | | | 78.75 | % | | | NM | | | $ | 0.10 | | | | 0.74 | % | | | 27.78 | % | | $ | 430 | | | | 19.85 | % | | | 19.85 | % | | | 0.36 | % | | | 0.43 | % | | | 2.05 | % | | | 0.43 | % | | | 2.05 | % |
| CLST | | Catalyst Bancorp, Inc. | | LA | | $ | 9.57 | | | $ | 48.39 | | | | NA | | | | NA | | | | NM | | | | 57.19 | % | | | NA | | | | 57.19 | % | | | NM | | | | NA | | | | NA | | | | NA | | | $ | 276 | | | | 31.22 | % | | | 31.22 | % | | | NA | | | | 0.14 | % | | | 0.44 | % | | | NA | | | | NA | |
| HFBL | | Home Federal Bancorp, Inc. of Louisiana | | LA | | $ | 16.13 | | | $ | 48.32 | | | $ | 1.88 | | | $ | 16.05 | | | | 9.38 | x | | | 100.50 | % | | | 7.34 | % | | | 110.72 | % | | | 8.57 | x | | $ | 0.48 | | | | 2.98 | % | | | 27.91 | % | | $ | 686 | | | | 7.31 | % | | | 6.68 | % | | | NA | | | | 0.93 | % | | | 11.19 | % | | | 1.01 | % | | | 12.22 | % |
| TCBS | | Texas Community Bancshares, Inc. | | TX | | $ | 10.25 | | | $ | 32.16 | | | $ | 0.62 | | | $ | 16.95 | | | | 17.66 | x | | | 60.45 | % | | | 8.09 | % | | | 60.89 | % | | | 16.47 | x | | $ | 0.08 | | | | 0.78 | % | | | 3.45 | % | | $ | 417 | | | | 13.39 | % | | | 13.30 | % | | | 0.37 | % | | | 0.47 | % | | | 4.01 | % | | | 0.50 | % | | | 4.30 | % |
| TCBX | | Third Coast Bancshares, Inc. | | TX | | $ | 14.51 | | | $ | 216.19 | | | $ | 1.69 | | | $ | 23.63 | | | | 8.85 | x | | | 61.42 | % | | | 5.19 | % | | | 65.31 | % | | | 8.57 | x | | | NA | | | | NA | | | | NA | | | $ | 3,860 | | | | 10.03 | % | | | 9.58 | % | | | 0.27 | % | | | 0.75 | % | | | 7.50 | % | | | 0.77 | % | | | 7.72 | % |
| TFIN | | Triumph Financial, Inc. | | TX | | $ | 47.88 | | | $ | 1,108.48 | | | $ | 2.86 | | | $ | 33.47 | | | | 13.84 | x | | | 143.05 | % | | | 20.04 | % | | | 216.75 | % | | | 16.72 | x | | | NA | | | | NA | | | | NA | | | $ | 5,628 | | | | 14.70 | % | | | 10.47 | % | | | 0.34 | % | | | 1.59 | % | | | 10.03 | % | | | 1.32 | % | | | 8.34 | % |
| | | | | | | | | | | | | | | | | | | | | | | | | | | | | | | | | | | | | | | | | | | | | | | | | | | | | | | | | | | | | | | | | | | | | | | | | | | | | | | | | | | | | |
| MHC | | | | | | | | | | | | | | | | | | | | | | | | | | | | | | | | | | | | | | | | | | | | | | | | | | | | | | | | | | | | | | | | | | | | | | | | | | | | | | | | | | |
| OFED | | Oconee Federal Financial Corp. | | SC | | $ | 19.58 | | | $ | 109.83 | | | $ | 0.82 | | | $ | 12.77 | | | | 24.48 | x | | | 153.30 | % | | | 19.43 | % | | | 159.17 | % | | | 23.75 | x | | $ | 0.40 | | | | 2.04 | % | | | 50.00 | % | | $ | 565 | | | | 12.68 | % | | | 12.27 | % | | | 0.19 | % | | | 0.83 | % | | | 5.84 | % | | | 0.85 | % | | | 6.02 | % |
(1) Core income, on a diluted per-share basis. Core income is net income after taxes and before extraordinary items, less net income attributable to noncontrolling interest, gain on the sale of securities, amortization of intangibles, goodwill and nonrecurring items. Assumed tax rate is 35%.
(2) P/E = Price to earnings; P/B = Price to book; P/A = Price to assets; P/TB = Price to tangible book value; and P/Core = Price to core earnings. P/E and P/Core =NM if the ratio is negative or above 35x.
(3) Indicated 12 month dividend, based on last quarterly dividend declared.
(4) Indicated 12 month dividend as a percent of trailing 12 month earnings.
(5) Equity and tangible equity equal common equity and tangible common equity, respectively. ROAA (return on average assets) and ROAE (return on average equity) are indicated ratios based on trailing 12 month earnings and average equity and assets balances.
(6) Excludes from averages and medians those companies the subject of actual or rumored acquisition activities or unusual operating characteristics.
Source: S&P Global Market Intelligence and RP Financial, LC. calculations. The information provided in this report has been obtained from sources we believe are reliable, but we cannot guarantee the accuracy or completeness of such information.
Copyright (c) 2023 by RP® Financial, LC.
EXHIBIT III-4
Peer Group Market Area Comparative Analysis
| Exhibit III-4 |
| Peer Group Market Area Comparative Analysis |
| | | | | | | | | | | | | | | | | | | | | | | | | | | |
| | | | | | | | | | | Proj. | | | | | | | | | Per Capita Income | | | Deposit | |
| | | | | Population | | | Pop. | | | 2018-2023 | | | 2023-2028 | | | 2023 | | | % State | | | Market | |
| Institution | | County | | 2018 | | | 2023 | | | 2028 | | | % Change | | | % Change | | | Amount | | | Average | | | Share(1) | |
| 1895 Bancorp of Wisconsin, Inc. | | Milwaukee, WI | | | 949,014 | | | | 924,278 | | | | 913,957 | | | | -0.5 | % | | | -0.2 | % | | | 34,908 | | | | 87.8 | % | | | 0.42 | % |
| Affinity Bancshares, Inc. | | Newton, GA | | | 109,176 | | | | 117,157 | | | | 123,539 | | | | 1.4 | % | | | 1.1 | % | | | 28,561 | | | | 74.6 | % | | | 22.17 | % |
| Catalyst Bancorp, Inc. | | Saint Landry, LA | | | 84,002 | | | | 81,735 | | | | 81,070 | | | | -0.5 | % | | | -0.2 | % | | | 24,599 | | | | 74.0 | % | | | 10.40 | % |
| Cullman Bancorp, Inc. | | Cullman, AL | | | 83,246 | | | | 90,531 | | | | 94,259 | | | | 1.7 | % | | | 0.8 | % | | | 28,155 | | | | 82.8 | % | | | 12.97 | % |
| Generations Bancorp NY, Inc. | | Seneca, NY | | | 34,618 | | | | 33,368 | | | | 32,834 | | | | -0.7 | % | | | -0.3 | % | | | 35,620 | | | | 74.8 | % | | | 19.93 | % |
| Home Federal Bancorp, Inc. of Louisiana | | Caddo, LA | | | 246,000 | | | | 229,764 | | | | 221,284 | | | | -1.4 | % | | | -0.7 | % | | | 32,334 | | | | 97.3 | % | | | 6.47 | % |
| Mid-Southern Bancorp, Inc. | | Washington, IN | | | 27,558 | | | | 28,037 | | | | 28,049 | | | | 0.3 | % | | | 0.0 | % | | | 30,030 | | | | 84.5 | % | | | 27.78 | % |
| PB Bankshares, Inc. | | Chester, PA | | | 519,514 | | | | 543,020 | | | | 556,068 | | | | 0.9 | % | | | 0.5 | % | | | 62,108 | | | | 151.6 | % | | | 1.00 | % |
| TC Bancshares, Inc. | | Thomas, GA | | | 45,440 | | | | 45,915 | | | | 46,522 | | | | 0.2 | % | | | 0.3 | % | | | 32,144 | | | | 84.0 | % | | | 12.42 | % |
| Texas Community Bancshares, Inc. | | Wood, TX | | | 44,812 | | | | 46,295 | | | | 47,791 | | | | 0.7 | % | | | 0.6 | % | | | 37,484 | | | | 100.6 | % | | | 17.80 | % |
| | | | | | | | | | | | | | | | | | | | | | | | | | | | | | | | | | | |
| Averages: | | | 214,338 | | | | 214,010 | | | | 214,537 | | | | 0.2 | % | | | 0.2 | % | | | 34,594 | | | | 91.2 | % | | | 13.14 | % |
| Medians: | | | 83,624 | | | | 86,133 | | | | 87,665 | | | | 0.3 | % | | | 0.1 | % | | | 32,239 | | | | 84.2 | % | | | 12.70 | % |
| | | | | | | | | | | | | | | | | | | | | | | | | | | | | | | | | | | |
| Gouverneur Bancorp, Inc. | | St. Lawrence, NY | | | 109,045 | | | | 107,182 | | | | 105,732 | | | | -0.3 | % | | | -0.3 | % | | | 32,877 | | | | 69.0 | % | | | 4.83 | % |
(1) Total institution deposits in headquarters county as percent of total county deposits as of June 30, 2022.
EXHIBIT IV-1
Stock Prices:
As of May 8, 2023
| RP® Financial, LC. | | | | | | | | | | | | | | | | | | | | | | | | | | | | | | | | | | | | | | | | | | | | |
| Exhibit IV-1A |
| Weekly Thrift Market Line - Part One |
| Prices As of May 8, 2023 |
| | | | | | | | | | | | | | | | | | | | | | | | | | |
| | | | | | | Market Capitalization | | | Price Change Data | | | Current Per Share Financials | |
| | | | | | | Price/ | | | Shares | | | Market | | | 52 Week (1) | | | | | | % Change From | | | LTM | | | LTM Core | | | BV/ | | | TBV/ | | | Assets/ | |
| | | | | Share(1) | | | Outstanding | | | Capitalization | | | High | | | Low | | | Last Wk | | | Last Wk | | | 52 Wks (2) | | | MRY (2) | | | EPS (3) | | | EPS (3) | | | Share | | | Share (4) | | | Share | |
| | | | | | | ($) | | | (000) | | | ($Mil) | | | ($) | | | ($) | | | ($) | | | (%) | | | (%) | | | (%) | | | ($) | | | ($) | | | ($) | | | ($) | | | ($) | |
| Companies | | | | | | | | | | | | | | | | | | | | | | | | | | | | | | | | | | | | | | | | | | | | | | | | | | | | | | | | | | |
| BCOW | | 1895 Bancorp of Wisconsin, Inc. | | MW | | | 6.99 | | | | 6,192 | | | | 43.3 | | | | 11.16 | | | | 6.33 | | | | 6.33 | | | | 10.43 | | | | -33.81 | | | | -30.10 | | | | 0.00 | | | | 0.00 | | | | 12.14 | | | | 12.14 | | | | 87.70 | |
| AFBI | | Affinity Bancshares, Inc. | | SE | | | 12.50 | | | | 6,566 | | | | 82.1 | | | | 16.50 | | | | 11.29 | | | | 14.75 | | | | -15.25 | | | | -17.33 | | | | -17.22 | | | | 0.26 | | | | 0.27 | | | | 18.02 | | | | 15.20 | | | | 141.99 | |
| AX | | Axos Financial, Inc. | | WE | | | 38.84 | | | | 59,113 | | | | 2,295.9 | | | | 51.46 | | | | 33.15 | | | | 40.02 | | | | -2.95 | | | | 3.08 | | | | 1.62 | | | | 1.32 | | | | 1.36 | | | | 31.07 | | | | 28.46 | | | | 334.66 | |
| BLFY | | Blue Foundry Bancorp | | MA | | | 8.88 | | | | 27,385 | | | | 243.0 | | | | 13.17 | | | | 8.14 | | | | 9.32 | | | | -4.77 | | | | -28.08 | | | | -30.93 | | | | -0.05 | | | | NA | | | | 14.08 | | | | 14.06 | | | | 76.72 | |
| BYFC | | Broadway Financial Corporation | | WE | | | 0.94 | | | | 73,503 | | | | 69.3 | | | | 1.89 | | | | 0.83 | | | | 0.89 | | | | 5.76 | | | | -40.35 | | | | -6.69 | | | | 0.02 | | | | 0.02 | | | | 1.76 | | | | 1.38 | | | | 16.11 | |
| CFFN | | Capitol Federal Financial, Inc. | | MW | | | 5.52 | | | | 133,193 | | | | 735.2 | | | | 10.39 | | | | 5.25 | | | | 6.01 | | | | -8.15 | | | | -42.26 | | | | -36.18 | | | | 0.11 | | | | 0.11 | | | | 7.87 | | | | 7.79 | | | | 75.72 | |
| CARV | | Carver Bancorp, Inc. | | MA | | | 4.32 | | | | 4,227 | | | | 18.3 | | | | 12.30 | | | | 3.62 | | | | 4.40 | | | | -1.82 | | | | -51.57 | | | | 5.11 | | | | -0.25 | | | | -0.25 | | | | 4.60 | | | | 4.60 | | | | 168.51 | |
| CLST | | Catalyst Bancorp, Inc. | | SW | | | 9.57 | | | | 5,059 | | | | 48.4 | | | | 13.69 | | | | 9.30 | | | | 10.86 | | | | -11.92 | | | | -28.76 | | | | -24.69 | | | | 0.02 | | | | NA | | | | NA | | | | NA | | | | 54.53 | |
| CULL | | Cullman Bancorp, Inc. | | SE | | | 10.62 | | | | 7,384 | | | | 78.4 | | | | 13.25 | | | | 10.40 | | | | 10.58 | | | | 0.43 | | | | -8.37 | | | | -7.57 | | | | 0.13 | | | | 0.13 | | | | 13.55 | | | | 13.55 | | | | 57.32 | |
| ECBK | | ECB Bancorp, Inc. | | NE | | | 11.25 | | | | 9,175 | | | | 103.2 | | | | 16.91 | | | | 10.33 | | | | 10.87 | | | | 3.50 | | | | -20.16 | | | | -29.91 | | | | 0.11 | | | | 0.11 | | | | 17.74 | | | | 17.74 | | | | 116.01 | |
| ESSA | | ESSA Bancorp, Inc. | | MA | | | 13.91 | | | | 9,711 | | | | 135.1 | | | | 21.80 | | | | 13.77 | | | | 15.81 | | | | -12.02 | | | | -17.94 | | | | -33.35 | | | | 0.48 | | | | 0.48 | | | | 21.03 | | | | 19.69 | | | | 204.45 | |
| FNWB | | First Northwest Bancorp | | WE | | | 10.91 | | | | 9,039 | | | | 96.8 | | | | 18.40 | | | | 9.94 | | | | 11.62 | | | | -6.11 | | | | -39.72 | | | | -28.97 | | | | 0.39 | | | | 0.39 | | | | 16.92 | | | | 16.81 | | | | 240.31 | |
| FSEA | | First Seacoast Bancorp, Inc. | | NE | | | 8.12 | | | | 5,077 | | | | 41.2 | | | | 13.40 | | | | 8.01 | | | | 8.66 | | | | -6.24 | | | | -35.49 | | | | -28.94 | | | | -0.34 | | | | -0.20 | | | | 9.73 | | | | 9.67 | | | | 105.85 | |
| FSBW | | FS Bancorp, Inc. | | WE | | | 29.25 | | | | 7,631 | | | | 223.2 | | | | 37.39 | | | | 26.08 | | | | 30.30 | | | | -3.47 | | | | -0.34 | | | | -12.53 | | | | 1.04 | | | | 1.24 | | | | 31.23 | | | | 28.14 | | | | 364.67 | |
| GBNY | | Generations Bancorp NY, Inc. | | MA | | | 9.15 | | | | 2,341 | | | | 21.4 | | | | 11.87 | | | | 8.25 | | | | 8.51 | | | | 7.52 | | | | -20.78 | | | | -15.28 | | | | -0.07 | | | | -0.07 | | | | 16.03 | | | | 15.39 | | | | 166.24 | |
| HONE | | HarborOne Bancorp, Inc. | | NE | | | 8.13 | | | | 45,073 | | | | 366.4 | | | | 15.57 | | | | 7.51 | | | | 9.60 | | | | -15.31 | | | | -41.09 | | | | -41.51 | | | | 0.16 | | | | 0.16 | | | | 12.74 | | | | 11.22 | | | | 123.64 | |
| HIFS | | Hingham Institution for Savings | | NE | | | 182.28 | | | | 2,147 | | | | 391.4 | | | | 335.53 | | | | 173.51 | | | | 191.66 | | | | -4.89 | | | | -42.11 | | | | -33.95 | | | | 3.87 | | | | 2.60 | | | | 182.89 | | | | 182.89 | | | | 1958.62 | |
| HMNF | | HMN Financial, Inc. | | MW | | | 18.00 | | | | 4,351 | | | | 78.3 | | | | 24.23 | | | | 17.31 | | | | 18.06 | | | | -0.33 | | | | -25.16 | | | | -15.65 | | | | 0.37 | | | | 0.36 | | | | 22.35 | | | | 22.17 | | | | 246.29 | |
| HFBL | | Home Federal Bancorp, Inc. of Louisiana | | SW | | | 16.13 | | | | 2,996 | | | | 48.3 | | | | 22.21 | | | | 15.08 | | | | 18.05 | | | | -10.65 | | | | -19.57 | | | | -5.74 | | | | 0.34 | | | | 0.50 | | | | 16.05 | | | | 14.57 | | | | 228.96 | |
| IROQ | | IF Bancorp, Inc. | | MW | | | 15.12 | | | | 3,191 | | | | 48.3 | | | | 24.00 | | | | 14.75 | | | | 14.81 | | | | 2.13 | | | | -35.14 | | | | -12.32 | | | | 0.21 | | | | NA | | | | 21.98 | | | | 21.98 | | | | 264.17 | |
| KRNY | | Kearny Financial Corp. | | MA | | | 7.17 | | | | 63,675 | | | | 456.6 | | | | 12.51 | | | | 6.81 | | | | 7.75 | | | | -7.48 | | | | -40.05 | | | | -29.36 | | | | 0.16 | | | | 0.17 | | | | 12.99 | | | | NA | | | | 131.12 | |
| MGYR | | Magyar Bancorp, Inc. | | MA | | | 9.99 | | | | 6,743 | | | | 67.4 | | | | 13.45 | | | | 9.64 | | | | 10.24 | | | | -2.41 | | | | -14.95 | | | | -22.05 | | | | 0.28 | | | | 0.28 | | | | 15.12 | | | | 15.12 | | | | 124.55 | |
| MSVB | | Mid-Southern Bancorp, Inc. | | MW | | | 9.87 | | | | 2,885 | | | | 28.5 | | | | 14.40 | | | | 9.29 | | | | 11.70 | | | | -15.65 | | | | -30.50 | | | | -24.15 | | | | 0.13 | | | | 0.14 | | | | 12.11 | | | | 12.11 | | | | 92.33 | |
| NYCB | | New York Community Bancorp, Inc. | | MA | | | 9.97 | | | | 722,150 | | | | 7,199.8 | | | | 11.02 | | | | 5.81 | | | | 10.71 | | | | -6.91 | | | | 7.78 | | | | 15.93 | | | | 2.87 | | | | 0.69 | | | | 14.23 | | | | 9.86 | | | | 171.37 | |
| NECB | | Northeast Community Bancorp, Inc. | | MA | | | 12.77 | | | | 13,907 | | | | 177.6 | | | | 15.99 | | | | 10.67 | | | | 13.00 | | | | -1.77 | | | | 16.51 | | | | -14.41 | | | | 0.77 | | | | 0.76 | | | | 17.13 | | | | 17.12 | | | | 108.05 | |
| NFBK | | Northfield Bancorp, Inc. (Staten Island, NY) | | MA | | | 9.51 | | | | 46,530 | | | | 442.5 | | | | 16.13 | | | | 9.13 | | | | 10.27 | | | | -7.40 | | | | -26.68 | | | | -39.54 | | | | 0.26 | | | | 0.26 | | | | 15.00 | | | | 14.12 | | | | 121.71 | |
| NSTS | | NSTS Bancorp, Inc. | | MW | | | 8.40 | | | | 5,398 | | | | 45.3 | | | | 11.58 | | | | 8.25 | | | | 8.45 | | | | -0.59 | | | | -27.40 | | | | -17.08 | | | | 0.01 | | | | 0.01 | | | | 14.92 | | | | 14.92 | | | | 48.95 | |
| PBBK | | PB Bankshares, Inc. | | MA | | | 11.50 | | | | 2,609 | | | | 30.0 | | | | 14.64 | | | | 10.99 | | | | 12.43 | | | | -7.44 | | | | -14.50 | | | | -15.32 | | | | 0.16 | | | | 0.16 | | | | 16.48 | | | | 16.48 | | | | 150.61 | |
| PDLB | | Ponce Financial Group, Inc. | | MA | | | 7.05 | | | | 23,313 | | | | 164.4 | | | | 10.11 | | | | 6.66 | | | | 7.14 | | | | -1.26 | | | | -26.41 | | | | -24.36 | | | | 0.01 | | | | NA | | | | 10.90 | | | | 10.90 | | | | 108.93 | |
| PVBC | | Provident Bancorp, Inc. | | NE | | | 7.05 | | | | 17,694 | | | | 123.4 | | | | 16.74 | | | | 5.76 | | | | 6.81 | | | | 3.52 | | | | -54.89 | | | | -3.16 | | | | 0.13 | | | | 0.13 | | | | 11.95 | | | | 11.95 | | | | 96.20 | |
| PROV | | Provident Financial Holdings, Inc. | | WE | | | 12.62 | | | | 7,023 | | | | 88.6 | | | | 15.74 | | | | 12.62 | | | | 13.35 | | | | -5.47 | | | | -16.97 | | | | -8.35 | | | | 0.33 | | | | 0.33 | | | | 18.40 | | | | 18.40 | | | | 190.14 | |
| PFS | | Provident Financial Services, Inc. | | MA | | | 15.39 | | | | 74,727 | | | | 1,150.0 | | | | 25.61 | | | | 14.54 | | | | 16.94 | | | | -9.15 | | | | -31.45 | | | | -27.95 | | | | 0.54 | | | | 0.55 | | | | 21.73 | | | | 15.64 | | | | 184.39 | |
| RVSB | | Riverview Bancorp, Inc. | | WE | | | 4.49 | | | | 21,222 | | | | 95.3 | | | | 8.00 | | | | 4.25 | | | | 5.00 | | | | -10.20 | | | | -33.08 | | | | -41.54 | | | | 0.14 | | | | 0.14 | | | | 7.32 | | | | 6.02 | | | | 74.91 | |
| SBT | | Sterling Bancorp, Inc. (Southfield, MI) | | MW | | | 4.59 | | | | 50,808 | | | | 233.2 | | | | 6.88 | | | | 4.49 | | | | 5.16 | | | | -11.05 | | | | -31.70 | | | | -24.63 | | | | -0.01 | | | | -0.01 | | | | 6.21 | | | | 6.21 | | | | 47.46 | |
| TCBC | | TC Bancshares, Inc. | | SE | | | 13.50 | | | | 4,622 | | | | 62.4 | | | | 17.28 | | | | 12.00 | | | | 13.99 | | | | -3.50 | | | | 1.89 | | | | -9.40 | | | | -0.05 | | | | -0.05 | | | | 17.14 | | | | 17.14 | | | | 92.96 | |
| TBNK | | Territorial Bancorp Inc. | | WE | | | 11.02 | | | | 8,755 | | | | 95.7 | | | | 25.50 | | | | 10.51 | | | | 16.56 | | | | -33.45 | | | | -49.31 | | | | -54.10 | | | | 0.26 | | | | 0.26 | | | | 28.18 | | | | 28.18 | | | | 252.74 | |
| TCBS | | Texas Community Bancshares, Inc. | | SW | | | 10.25 | | | | 3,139 | | | | 32.2 | | | | 17.72 | | | | 9.38 | | | | 10.38 | | | | -1.31 | | | | -42.18 | | | | -33.26 | | | | 0.13 | | | | 0.14 | | | | 16.95 | | | | 16.83 | | | | 132.95 | |
| TCBX | | Third Coast Bancshares, Inc. | | SW | | | 14.51 | | | | 14,900 | | | | 216.2 | | | | 26.75 | | | | 12.31 | | | | 13.95 | | | | 4.01 | | | | -37.48 | | | | -21.27 | | | | 0.55 | | | | 0.55 | | | | 23.63 | | | | 22.22 | | | | 259.05 | |
| TSBK | | Timberland Bancorp, Inc. | | WE | | | 22.75 | | | | 8,203 | | | | 186.6 | | | | 35.62 | | | | 22.36 | | | | 24.96 | | | | -8.85 | | | | -13.17 | | | | -33.34 | | | | 0.80 | | | | 0.81 | | | | 27.75 | | | | 25.81 | | | | 217.80 | |
| TFIN | | Triumph Financial, Inc. | | SW | | | 47.88 | | | | 23,151 | | | | 1,108.5 | | | | 76.49 | | | | 45.08 | | | | 51.25 | | | | -6.58 | | | | -33.48 | | | | -2.03 | | | | 0.43 | | | | 0.52 | | | | 33.47 | | | | 22.09 | | | | 243.10 | |
| TRST | | TrustCo Bank Corp NY | | MA | | | 28.06 | | | | 19,024 | | | | 533.8 | | | | 39.36 | | | | 27.55 | | | | 29.58 | | | | -5.14 | | | | -11.23 | | | | -25.35 | | | | 0.93 | | | | 0.93 | | | | 32.31 | | | | 32.28 | | | | 317.79 | |
| WSBF | | Waterstone Financial, Inc. | | MW | | | 13.91 | | | | 20,771 | | | | 286.8 | | | | 18.93 | | | | 12.99 | | | | 13.75 | | | | 1.16 | | | | -15.13 | | | | -19.32 | | | | 0.10 | | | | 0.10 | | | | 16.73 | | | | 16.70 | | | | 101.80 | |
| WNEB | | Western New England Bancorp, Inc. | | NE | | | 6.02 | | | | 22,209 | | | | 133.7 | | | | 10.25 | | | | 5.80 | | | | 6.40 | | | | -5.94 | | | | -27.47 | | | | -36.36 | | | | 0.24 | | | | 0.23 | | | | 10.50 | | | | 9.84 | | | | 115.36 | |
| WMPN | | William Penn Bancorporation | | MA | | | 9.71 | | | | 13,321 | | | | 127.0 | | | | 12.52 | | | | 8.77 | | | | 9.98 | | | | -2.71 | | | | -19.62 | | | | -19.88 | | | | 0.01 | | | | 0.03 | | | | 12.87 | | | | 12.47 | | | | 64.74 | |
| WSFS | | WSFS Financial Corporation | | MA | | | 31.36 | | | | 61,449 | | | | 1,927.0 | | | | 51.77 | | | | 29.86 | | | | 34.80 | | | | -9.89 | | | | -21.29 | | | | -30.83 | | | | 1.01 | | | | 1.05 | | | | 37.57 | | | | 21.24 | | | | 330.67 | |
| | | | | | | | | | | | | | | | | | | | | | | | | | | | | | | | | | | | | | | | | | | | | | | | | | | | | | | | | | | | | |
| MHCs | | | | | | | | | | | | | | | | | | | | | | | | | | | | | | | | | | | | | | | | | | | | | | | | | | | | | | | | | | |
| BSBK | | Bogota Financial Corp. | | MA | | | 8.21 | | | | 13,139 | | | | 107.9 | | | | 11.75 | | | | 8.00 | | | | 8.68 | | | | -5.41 | | | | -23.77 | | | | -26.57 | | | | 0.08 | | | | 0.08 | | | | 10.25 | | | | 10.23 | | | | 72.33 | |
| CFSB | | CFSB Bancorp, Inc. | | NE | | | 6.99 | | | | 6,276 | | | | 43.9 | | | | 9.70 | | | | 6.50 | | | | 6.90 | | | | 1.30 | | | | -27.34 | | | | -13.60 | | | | 0.06 | | | | 0.06 | | | | 11.41 | | | | 11.41 | | | | 56.03 | |
| CLBK | | Columbia Financial, Inc. | | MA | | | 15.75 | | | | 105,777 | | | | 1,666.0 | | | | 22.86 | | | | 14.11 | | | | 15.94 | | | | -1.19 | | | | -19.85 | | | | -27.15 | | | | 0.18 | | | | 0.19 | | | | 9.75 | | | | 8.59 | | | | 100.54 | |
| GCBC | | Greene County Bancorp, Inc. | | MA | | | 18.27 | | | | 17,027 | | | | 311.1 | | | | 44.90 | | | | 17.50 | | | | 20.41 | | | | -10.49 | | | | -29.23 | | | | -36.36 | | | | 0.48 | | | | NA | | | | 10.49 | | | | 10.49 | | | | 160.28 | |
| KFFB | | Kentucky First Federal Bancorp | | MW | | | 6.01 | | | | 8,154 | | | | 49.0 | | | | 8.69 | | | | 6.00 | | | | 6.05 | | | | -0.66 | | | | -17.52 | | | | -9.76 | | | | 0.02 | | | | NA | | | | 6.32 | | | | 6.20 | | | | 42.05 | |
| LSBK | | Lake Shore Bancorp, Inc. | | MA | | | 11.35 | | | | 5,592 | | | | 63.4 | | | | 15.00 | | | | 9.61 | | | | 11.26 | | | | 0.80 | | | | -24.05 | | | | -5.97 | | | | 0.29 | | | | NA | | | | 14.70 | | | | 14.70 | | | | 130.56 | |
| OFED | | Oconee Federal Financial Corp. | | SE | | | 19.58 | | | | 5,609 | | | | 109.8 | | | | 27.00 | | | | 17.21 | | | | 20.51 | | | | -4.53 | | | | -19.42 | | | | -21.68 | | | | 0.20 | | | | 0.20 | | | | 12.77 | | | | 12.30 | | | | 100.77 | |
| PBFS | | Pioneer Bancorp, Inc. | | MA | | | 8.61 | | | | 25,157 | | | | 216.6 | | | | 11.97 | | | | 8.16 | | | | 8.80 | | | | -2.16 | | | | -15.51 | | | | -24.47 | | | | 0.25 | | | | 0.24 | | | | 9.61 | | | | 9.19 | | | | 72.92 | |
| RBKB | | Rhinebeck Bancorp, Inc. | | MA | | | 6.40 | | | | 10,935 | | | | 70.0 | | | | 10.15 | | | | 6.07 | | | | 7.26 | | | | -11.84 | | | | -34.36 | | | | -29.75 | | | | 0.07 | | | | NA | | | | 9.81 | | | | 9.59 | | | | 123.56 | |
| TFSL | | TFS Financial Corporation | | MW | | | 11.75 | | | | 277,340 | | | | 3,258.7 | | | | 15.70 | | | | 11.05 | | | | 12.00 | | | | -2.08 | | | | -16.25 | | | | -18.46 | | | | 0.06 | | | | 0.06 | | | | 6.54 | | | | 6.51 | | | | 58.63 | |
| | | | | | | | | | | | | | | | | | | | | | | | | | | | | | | | | | | | | | | | | | | | | | | | | | | | | | | | | | | | | |
| Under Merger/Acquisition | | | | | | | | | | | | | | | | | | | | | | | | | | | | | | | | | | | | | | | | | | | | | | | | | | | | | | | | | | |
| HVBC | | HV Bancorp, Inc. | | MA | | | 31.16 | | | | 2,242 | | | | 69.9 | | | | 34.00 | | | | 18.52 | | | | 32.00 | | | | -2.63 | | | | 42.28 | | | | 9.56 | | | | 0.14 | | | | 0.33 | | | | 18.77 | | | | 18.77 | | | | 274.59 | |
(1) Average of High/Low or Bid/Ask price per share.
(2) Or since offering price if converted of first listed in the past 52 weeks. Percent change figures are actual year-to-date and are not annualized.
(3) EPS (earnings per share) is based on actual trailing 12 month data and is not shown on a pro forma basis.
(4) Excludes intangibles (such as goodwill, value of core deposits, etc.).
(5) ROA (return on assets) and ROE (return on equity) are indicated ratios based on trailing 12 month common earnings and average common equity and total assets balances.
(6) Annualized based on last regular quarterly cash dividend announcement.
(7) Indicated dividend as a percent of trailing 12 month earnings.
(8) Excluded from averages due to actual or rumored acquisition activities or unusual operating characteristics.
(9) For MHC institutions, market value reflects share price multiplied by public (non-MHC) shares.
Source: S&P Global Market Intelligence and RP® Financial, LC. calculations. The information provided in this table has been obtained from sources we believe are reliable, but we cannot guarantee the accuracy or completeness of such information.
Copyright (c) 2023 by RP® Financial, LC.
RP® Financial, LC.
Exhibit IV-1B
Weekly Thrift Market Line - Part Two
Prices As of May 8, 2023
| | | | Key Financial Ratios | | Asset Quality Ratios | | Pricing Ratios | | Dividend Data (6) | |
| | | | Equity/ | | Tang Equity/ | | Reported Earnings | | Core Earnings | | NPAs/ | | Rsvs/ | | Price/ | | Price/ | | Price/ | | Price/ | | Price/ | | Div/ | | Dividend | | Payout | |
| | | | Assets(1) | | Assets(1) | | ROA(5) | | ROE(5) | | ROA(5) | | ROE(5) | | Assets | | NPLs | | Earnings | | Book | | Assets | | Tang Book | | Core Earnings | | Share | | Yield | | Ratio (7) | |
| | | | (%) | | (%) | | (%) | | (%) | | (%) | | (%) | | (%) | | (%) | | (x) | | (%) | | (%) | | (%) | | (x) | | ($) | | (%) | | (%) | |
| Companies | | | | | | | | | | | | | | | | | | | | | | | | | | | | | | | | | | | | | | | | | | | | | | | | | |
| BCOW | 1895 Bancorp of Wisconsin, Inc. | MW | | 13.88 | | | 13.88 | | | -0.03 | | | -0.19 | | | 0.08 | | | 0.52 | | | 0.21 | | | 284.96 | | | NM | | | 57.56 | | | 7.99 | | | 57.56 | | | 82.89 | | | NA | | | NA | | | NM | |
| AFBI | Affinity Bancshares, Inc. | SE | | 12.69 | | | 10.92 | | | 0.89 | | | 6.03 | | | 0.91 | | | 6.16 | | | NA | | | NA | | | 11.79 | | | 69.37 | | | 8.80 | | | 82.24 | | | 11.55 | | | NA | | | NA | | | NM | |
| AX | Axos Financial, Inc. | WE | | 9.32 | | | 8.61 | | | 1.56 | | | 16.11 | | | 1.72 | | | 17.84 | | | 0.51 | | | 168.12 | | | 8.44 | | | 125.01 | | | 11.65 | | | 136.48 | | | 7.46 | | | NA | | | NA | | | NM | |
| BLFY | Blue Foundry Bancorp | MA | | 18.36 | | | 18.33 | | | 0.03 | | | 0.16 | | | NA | | | NA | | | NA | | | NA | | | NM | | | 63.02 | | | 11.57 | | | 63.14 | | | NA | | | NA | | | NA | | | NM | |
| BYFC | Broadway Financial Corporation | WE | | 23.61 | | | 21.74 | | | 0.50 | | | 2.55 | | | 0.52 | | | 2.63 | | | 0.15 | | | 251.61 | | | 11.78 | | | 53.45 | | | 6.69 | | | 68.43 | | | 11.23 | | | 0.00 | | | 0.00 | | | NM | |
| CFFN | Capitol Federal Financial, Inc. | MW | | 10.63 | | | 10.53 | | | 0.62 | | | 6.38 | | | 0.62 | | | 6.46 | | | NA | | | NA | | | 10.42 | | | 70.10 | | | 7.45 | | | 70.86 | | | 10.29 | | | 0.34 | | | 6.16 | | | 138.68 | |
| CARV | Carver Bancorp, Inc. | MA | | 6.34 | | | 6.34 | | | -0.39 | | | -5.38 | | | -0.39 | | | -5.38 | | | 2.59 | | | 27.99 | | | NM | | | 93.95 | | | 2.70 | | | 93.95 | | | NM | | | 0.00 | | | 0.00 | | | NM | |
| CLST | Catalyst Bancorp, Inc. | SW | | 31.22 | | | 31.22 | | | 0.14 | | | 0.44 | | | NA | | | NA | | | NA | | | NA | | | 95.65 | | | 57.19 | | | NA | | | 57.19 | | | NA | | | NA | | | NA | | | NM | |
| CULL | Cullman Bancorp, Inc. | SE | | 23.67 | | | 23.67 | | | 1.09 | | | 4.21 | | | 1.09 | | | 4.23 | | | 0.62 | | | 111.24 | | | 18.00 | | | 78.39 | | | 18.56 | | | 78.39 | | | 17.92 | | | 0.12 | | | 1.13 | | | 20.34 | |
| ECBK | ECB Bancorp, Inc. | NE | | 15.29 | | | 15.29 | | | 0.35 | | | 2.37 | | | 0.58 | | | 3.99 | | | 0.06 | | | NM | | | 35.16 | | | 63.43 | | | 9.70 | | | 63.43 | | | 20.88 | | | NA | | | NA | | | NM | |
| ESSA | ESSA Bancorp, Inc. | MA | | 11.02 | | | 10.39 | | | 1.08 | | | 9.43 | | | 1.09 | | | 9.50 | | | NA | | | NA | | | 6.66 | | | 66.13 | | | 7.29 | | | 70.65 | | | 6.60 | | | 0.60 | | | 4.31 | | | 28.71 | |
| FNWB | First Northwest Bancorp | WE | | 7.38 | | | 7.34 | | | 0.72 | | | 8.76 | | | 0.76 | | | 9.27 | | | NA | | | NA | | | 6.09 | | | 64.47 | | | 4.85 | | | 64.90 | | | 5.83 | | | 0.28 | | | 2.57 | | | 15.64 | |
| FSEA | First Seacoast Bancorp, Inc. | NE | | 9.18 | | | 9.13 | | | -0.11 | | | -1.05 | | | 0.01 | | | 0.10 | | | 0.05 | | | NM | | | NM | | | 83.42 | | | 7.66 | | | 83.93 | | | NM | | | NA | | | NA | | | NM | |
| FSBW | FS Bancorp, Inc. | WE | | 8.69 | | | 7.90 | | | 1.21 | | | 11.96 | | | 1.32 | | | 12.99 | | | NA | | | NA | | | 7.46 | | | 93.66 | | | 8.14 | | | 103.95 | | | 6.86 | | | 1.00 | | | 3.42 | | | 22.96 | |
| GBNY | Generations Bancorp NY, Inc. | MA | | 9.64 | | | 9.29 | | | 0.14 | | | 1.39 | | | 0.16 | | | 1.60 | | | NA | | | NA | | | 39.78 | | | 57.09 | | | 5.50 | | | 59.46 | | | 34.49 | | | NA | | | NA | | | NM | |
| HONE | HarborOne Bancorp, Inc. | NE | | 10.76 | | | 9.60 | | | 0.82 | | | 6.49 | | | 0.84 | | | 6.71 | | | NA | | | NA | | | 9.24 | | | 63.79 | | | 6.87 | | | 72.48 | | | 8.92 | | | 0.30 | | | 3.69 | | | 32.39 | |
| HIFS | Hingham Institution for Savings | NE | | 9.34 | | | 9.34 | | | 0.86 | | | 8.93 | | | 1.14 | | | 11.84 | | | 0.01 | | | NM | | | 11.74 | | | 99.67 | | | 9.31 | | | 99.67 | | | 8.86 | | | 2.52 | | | 1.38 | | | 19.90 | |
| HMNF | HMN Financial, Inc. | MW | | 9.35 | | | 9.28 | | | 0.76 | | | 7.09 | | | 0.76 | | | 7.05 | | | NA | | | 610.44 | | | 9.63 | | | 80.54 | | | 7.53 | | | 81.19 | | | 9.67 | | | 0.32 | | | 1.78 | | | 13.90 | |
| HFBL | Home Federal Bancorp, Inc. of Louisiana | SW | | 7.31 | | | 6.68 | | | 0.93 | | | 11.19 | | | 1.01 | | | 12.22 | | | NA | | | NA | | | 9.38 | | | 100.50 | | | 7.34 | | | 110.72 | | | 8.57 | | | 0.48 | | | 2.98 | | | 27.91 | |
| IROQ | IF Bancorp, Inc. | MW | | 8.75 | | | 8.75 | | | 0.62 | | | 7.10 | | | NA | | | NA | | | NA | | | NA | | | 9.51 | | | 68.80 | | | 6.02 | | | 68.80 | | | NA | | | 0.40 | | | 2.64 | | | 25.16 | |
| KRNY | Kearny Financial Corp. | MA | | 10.37 | | | NA | | | 0.51 | | | 4.51 | | | 0.66 | | | 5.84 | | | 0.81 | | | 90.60 | | | 11.75 | | | 55.19 | | | 5.73 | | | 73.33 | | | 9.05 | | | 0.44 | | | 6.14 | | | 72.13 | |
| MGYR | Magyar Bancorp, Inc. | MA | | 12.05 | | | 12.05 | | | 1.01 | | | 8.18 | | | 1.01 | | | 8.18 | | | NA | | | NA | | | 8.12 | | | 66.09 | | | 7.96 | | | 66.09 | | | 8.12 | | | 0.12 | | | 1.20 | | | 16.26 | |
| MSVB | Mid-Southern Bancorp, Inc. | MW | | 13.12 | | | 13.12 | | | 0.66 | | | 5.14 | | | 0.66 | | | 5.12 | | | NA | | | NA | | | 15.18 | | | 81.48 | | | 10.69 | | | 81.48 | | | 15.23 | | | 0.24 | | | 2.43 | | | 33.85 | |
| NYCB | New York Community Bancorp, Inc. | MA | | 8.71 | | | 6.32 | | | 3.42 | | | 32.85 | | | 1.25 | | | 12.04 | | | NA | | | NA | | | 2.62 | | | 70.04 | | | 5.84 | | | 101.14 | | | 6.62 | | | 0.68 | | | 6.82 | | | 17.85 | |
| NECB | Northeast Community Bancorp, Inc. | MA | | 17.47 | | | 17.46 | | | 2.44 | | | 12.41 | | | 2.51 | | | 12.76 | | | NA | | | NA | | | 5.94 | | | 74.56 | | | 13.02 | | | 74.61 | | | 5.78 | | | 0.24 | | | 1.88 | | | 11.16 | |
| NFBK | Northfield Bancorp, Inc. (Staten Island, NY) | MA | | 12.33 | | | 11.68 | | | 1.04 | | | 8.33 | | | 1.04 | | | 8.35 | | | 0.23 | | | 323.57 | | | 7.43 | | | 63.38 | | | 7.81 | | | 67.36 | | | 7.42 | | | 0.52 | | | 5.47 | | | 40.63 | |
| NSTS | NSTS Bancorp, Inc. | MW | | 30.48 | | | 30.48 | | | 0.01 | | | 0.03 | | | -0.13 | | | -0.45 | | | 0.32 | | | 74.37 | | | NM | | | 56.30 | | | 17.16 | | | 56.30 | | | NM | | | NA | | | NA | | | NM | |
| PBBK | PB Bankshares, Inc. | MA | | 11.78 | | | 11.78 | | | 0.59 | | | 4.85 | | | 0.43 | | | 3.55 | | | NA | | | NA | | | 12.92 | | | 69.79 | | | 8.22 | | | 69.79 | | | 17.61 | | | NA | | | NA | | | NM | |
| PDLB | Ponce Financial Group, Inc. | MA | | 19.53 | | | 19.53 | | | -1.09 | | | -5.01 | | | NA | | | NA | | | NA | | | 123.05 | | | NM | | | 64.67 | | | 7.57 | | | 64.67 | | | NA | | | NA | | | NA | | | NM | |
| PVBC | Provident Bancorp, Inc. | NE | | 12.42 | | | 12.42 | | | -1.47 | | | -11.05 | | | -1.47 | | | -11.05 | | | NA | | | NA | | | NM | | | 58.99 | | | 7.33 | | | 58.99 | | | NM | | | 0.16 | | | 0.00 | | | NM | |
| PROV | Provident Financial Holdings, Inc. | WE | | 9.69 | | | 9.69 | | | 0.75 | | | 7.13 | | | 0.75 | | | 7.13 | | | 0.12 | | | 375.06 | | | 9.78 | | | 68.60 | | | 6.65 | | | 68.60 | | | 9.78 | | | 0.56 | | | 4.44 | | | 43.41 | |
| PFS | Provident Financial Services, Inc. | MA | | 11.90 | | | 8.86 | | | 1.26 | | | 10.74 | | | 1.29 | | | 10.99 | | | NA | | | NA | | | 6.66 | | | 70.82 | | | 8.43 | | | 98.43 | | | 6.44 | | | 0.96 | | | 6.24 | | | 41.56 | |
| RVSB | Riverview Bancorp, Inc. | WE | | 9.77 | | | 8.18 | | | 1.08 | | | 11.71 | | | 1.09 | | | 11.77 | | | NA | | | NA | | | 5.41 | | | 61.38 | | | 5.99 | | | 74.57 | | | 5.38 | | | 0.24 | | | 5.35 | | | 28.92 | |
| SBT | Sterling Bancorp, Inc. (Southfield, MI) | MW | | 13.08 | | | 13.08 | | | -0.79 | | | -6.04 | | | -0.79 | | | -5.98 | | | NA | | | 146.80 | | | NM | | | 73.92 | | | 9.67 | | | 73.92 | | | NM | | | 0.00 | | | 0.00 | | | NM | |
| TCBC | TC Bancshares, Inc. | SE | | 19.85 | | | 19.85 | | | 0.43 | | | 2.05 | | | 0.43 | | | 2.05 | | | 0.36 | | | 504.86 | | | 37.50 | | | 78.75 | | | 15.63 | | | 78.75 | | | 37.50 | | | 0.10 | | | 0.74 | | | 27.78 | |
| TBNK | Territorial Bancorp Inc. | WE | | 11.47 | | | 11.47 | | | 0.63 | | | 5.36 | | | 0.63 | | | 5.36 | | | NA | | | NA | | | 7.11 | | | 39.11 | | | 4.49 | | | 39.11 | | | 7.11 | | | 0.92 | | | 8.35 | | | 65.81 | |
| TCBS | Texas Community Bancshares, Inc. | SW | | 13.39 | | | 13.30 | | | 0.47 | | | 4.01 | | | 0.50 | | | 4.30 | | | 0.37 | | | 113.59 | | | 17.66 | | | 60.45 | | | 8.09 | | | 60.89 | | | 16.47 | | | 0.08 | | | 0.78 | | | 3.45 | |
| TCBX | Third Coast Bancshares, Inc. | SW | | 10.03 | | | 9.58 | | | 0.75 | | | 7.50 | | | 0.77 | | | 7.72 | | | 0.27 | | | 349.98 | | | 8.85 | | | 61.42 | | | 5.19 | | | 65.31 | | | 8.57 | | | NA | | | NA | | | NM | |
| TSBK | Timberland Bancorp, Inc. | WE | | 12.74 | | | 11.96 | | | 1.46 | | | 12.35 | | | 1.47 | | | 12.45 | | | 0.26 | | | 325.25 | | | 7.02 | | | 81.97 | | | 10.45 | | | 88.15 | | | 6.97 | | | 0.92 | | | 4.04 | | | 30.86 | |
| TFIN | Triumph Financial, Inc. | SW | | 14.70 | | | 10.47 | | | 1.59 | | | 10.03 | | | 1.32 | | | 8.34 | | | 0.34 | | | 233.45 | | | 13.84 | | | 143.05 | | | 20.04 | | | 216.75 | | | 16.72 | | | NA | | | NA | | | NM | |
| TRST | TrustCo Bank Corp NY | MA | | 10.17 | | | 10.16 | | | 1.24 | | | 12.66 | | | 1.24 | | | 12.66 | | | NA | | | NA | | | 7.06 | | | 86.84 | | | 8.83 | | | 86.92 | | | 7.06 | | | 1.44 | | | 5.13 | | | 35.71 | |
| WSBF | Waterstone Financial, Inc. | MW | | 17.30 | | | 17.28 | | | 0.82 | | | 4.25 | | | 0.82 | | | 4.25 | | | 0.22 | | | 396.34 | | | 18.55 | | | 83.15 | | | 14.39 | | | 83.29 | | | 18.55 | | | 0.80 | | | 5.75 | | | 106.67 | |
| WNEB | Western New England Bancorp, Inc. | NE | | 9.10 | | | 8.58 | | | 1.01 | | | 11.74 | | | 0.93 | | | 10.75 | | | NA | | | NA | | | 5.06 | | | 57.33 | | | 5.22 | | | 61.15 | | | 5.53 | | | 0.28 | | | 4.65 | | | 21.85 | |
| WMPN | William Penn Bancorporation | MA | | 20.18 | | | 19.68 | | | 0.39 | | | 1.80 | | | 0.45 | | | 2.07 | | | 0.59 | | | 67.06 | | | 38.84 | | | 75.46 | | | 15.23 | | | 77.89 | | | 34.50 | | | 0.12 | | | 1.24 | | | 48.00 | |
| WSFS | WSFS Financial Corporation | MA | | 11.34 | | | 6.74 | | | 1.39 | | | 12.33 | | | 1.49 | | | 13.19 | | | 0.16 | | | 528.35 | | | 7.00 | | | 83.47 | | | 9.47 | | | 147.63 | | | 6.54 | | | 0.60 | | | 1.91 | | | 13.39 | |
| | | | | | | | | | | | | | | | | | | | | | | | | | | | | | | | | | | | | | | | | | | | | | | | | | | |
| MHCs | | | | | | | | | | | | | | | | | | | | | | | | | | | | | | | | | | | | | | | | | | | | | | | | | |
| BSBK | Bogota Financial Corp. | MA | | 14.64 | | | 14.61 | | | 0.71 | | | 4.56 | | | 0.71 | | | 4.60 | | | NA | | | NA | | | 17.10 | | | 80.12 | | | 11.73 | | | 80.26 | | | 16.96 | | | NA | | | NA | | | NM | |
| CFSB | CFSB Bancorp, Inc. | NE | | 21.52 | | | 21.52 | | | 0.52 | | | 2.51 | | | 0.52 | | | 2.50 | | | NA | | | NA | | | NA | | | 61.27 | | | 13.18 | | | 61.27 | | | NA | | | NA | | | NA | | | NA | |
| CLBK | Columbia Financial, Inc. | MA | | 9.77 | | | 8.71 | | | 0.84 | | | 7.96 | | | 0.88 | | | 8.35 | | | NA | | | NA | | | 19.69 | | | 161.59 | | | 15.79 | | | 183.41 | | | 18.49 | | | NA | | | NA | | | NM | |
| GCBC | Greene County Bancorp, Inc. | MA | | 6.55 | | | 6.55 | | | 1.21 | | | 19.03 | | | NA | | | NA | | | NA | | | NA | | | 9.96 | | | 174.10 | | | 11.40 | | | 174.10 | | | NA | | | 0.28 | | | 1.53 | | | 15.26 | |
| KFFB | Kentucky First Federal Bancorp | MW | | 14.91 | | | 14.68 | | | 0.33 | | | 2.12 | | | NA | | | NA | | | NA | | | NA | | | 46.23 | | | 95.17 | | | 14.19 | | | 96.96 | | | NA | | | 0.40 | | | 6.66 | | | 307.69 | |
| LSBK | Lake Shore Bancorp, Inc. | MA | | 11.46 | | | 11.46 | | | 0.90 | | | 7.76 | | | NA | | | NA | | | NA | | | NA | | | 10.51 | | | 77.21 | | | 8.85 | | | 77.21 | | | NA | | | 0.72 | | | 0.00 | | | 33.33 | |
| OFED | Oconee Federal Financial Corp. | SE | | 12.68 | | | 12.27 | | | 0.83 | | | 5.84 | | | 0.85 | | | 6.02 | | | 0.19 | | | 150.21 | | | 24.48 | | | 153.30 | | | 19.43 | | | 159.17 | | | 23.75 | | | 0.40 | | | 2.04 | | | 50.00 | |
| PBFS | Pioneer Bancorp, Inc. | MA | | 13.61 | | | 13.09 | | | 0.72 | | | 5.79 | | | 0.75 | | | 6.00 | | | 0.45 | | | 268.15 | | | 15.11 | | | 89.56 | | | 12.19 | | | 93.73 | | | 14.59 | | | NA | | | NA | | | NM | |
| RBKB | Rhinebeck Bancorp, Inc. | MA | | 8.19 | | | 8.02 | | | 0.44 | | | 5.14 | | | NA | | | NA | | | NA | | | NA | | | 12.55 | | | 65.23 | | | 5.35 | | | 66.76 | | | NA | | | NA | | | NA | | | NM | |
| TFSL | TFS Financial Corporation | MW | | 11.28 | | | 11.23 | | | 0.52 | | | 4.35 | | | 0.52 | | | 4.35 | | | NA | | | NA | | | 40.52 | | | 179.55 | | | 20.26 | | | 180.51 | | | 40.52 | | | 1.13 | | | 9.62 | | | 389.66 | |
| | | | | | | | | | | | | | | | | | | | | | | | | | | | | | | | | | | | | | | | | | | | | | | | | | | |
| Under Merger/Acquisition | | | | | | | | | | | | | | | | | | | | | | | | | | | | | | | | | | | | | | | | | | | | | | | | | |
| HVBC | HV Bancorp, Inc. | MA | | 6.84 | | | 6.84 | | | 0.38 | | | 5.50 | | | 0.40 | | | 5.75 | | | 0.53 | | | 112.91 | | | 29.40 | | | 166.00 | | | 11.35 | | | 166.00 | | | 28.15 | | | NA | | | NA | | | NM | |
| (1) | Average of High/Low or Bid/Ask price per share. |
| (2) | Or since offering price if converted of first listed in the past 52 weeks. Percent change figures are actual year-to-date and are not annualized. |
| (3) | EPS (earnings per share) is based on actual trailing 12 month data and is not shown on a pro forma basis. |
| (4) | Exludes intangibles (such as goodwill, value of core deposits, etc.). |
| (5) | ROA (return on assets) and ROE (return on equity) are indicated ratios based on trailing 12 month common earnings and average common equity and total assets balances. |
| (6) | Annualized based on last regular quarterly cash dividend announcement. |
| (7) | Indicated dividend as a percent of trailing 12 month earnings. |
| (8) | Excluded from averages due to actual or rumored acquisition activities or unusual operating characteristics. |
| (9) | For MHC institutions, market value reflects share price multiplied by public (non-MHC) shares. |
Source: S&P Global Market Intelligence and RP® Financial, LC. calculations. The information provided in this table has been obtained from sources we believe are reliable, but we cannot guarantee the accuracy or completeness of such information.
Copyright (c) 2023 by RP® Financial, LC.
EXHIBIT IV-2
Historical Stock Price Indices
Exhibit IV-2
Historical Stock Price Indices(1)
| | | | | | | | | | S&P U.S. | | KBW NASDAQ | |
| | | | | | | | NASDAQ | | BMI Banks | | Regional Bank | |
| Year/Qtr. Ended | | DJIA | | S&P 500 | | Composite | | Index | | Index | |
| 2010: | Quarter 1 | | | 10856.6 | | | 1169.4 | | | 2398.0 | | | 68.4 | | | 53.2 | |
| | Quarter 2 | | | 9744.0 | | | 1030.7 | | | 2109.2 | | | 59.3 | | | 46.9 | |
| | Quarter 3 | | | 9744.0 | | | 1030.7 | | | 2109.2 | | | 58.7 | | | 46.7 | |
| | Quarter 4 | | | 11577.5 | | | 1257.6 | | | 2652.9 | | | 68.5 | | | 53.7 | |
| | | | | | | | | | | | | | | | | | |
| 2011: | Quarter 1 | | | 12319.7 | | | 1325.8 | | | 2781.1 | | | 68.5 | | | 54.2 | |
| | Quarter 2 | | | 12414.3 | | | 1320.6 | | | 2773.5 | | | 63.6 | | | 51.8 | |
| | Quarter 3 | | | 10913.4 | | | 1131.4 | | | 2415.4 | | | 51.4 | | | 39.3 | |
| | Quarter 4 | | | 12217.6 | | | 1257.6 | | | 2605.2 | | | 59.8 | | | 49.8 | |
| | | | | | | | | | | | | | | | | | |
| 2012: | Quarter 1 | | | 13212.0 | | | 1408.5 | | | 3091.6 | | | 71.0 | | | 56.9 | |
| | Quarter 2 | | | 12880.1 | | | 1362.2 | | | 2935.1 | | | 69.0 | | | 55.1 | |
| | Quarter 3 | | | 13437.1 | | | 1440.7 | | | 3116.2 | | | 72.9 | | | 56.7 | |
| | Quarter 4 | | | 13104.1 | | | 1426.2 | | | 3019.5 | | | 71.1 | | | 55.0 | |
| | | | | | | | | | | | | | | | | | |
| 2013: | Quarter 1 | | | 14578.5 | | | 1569.2 | | | 3267.5 | | | 78.1 | | | 62.0 | |
| | Quarter 2 | | | 14909.6 | | | 1606.3 | | | 3404.3 | | | 84.9 | | | 65.0 | |
| | Quarter 3 | | | 15129.7 | | | 1681.6 | | | 3771.5 | | | 87.0 | | | 69.6 | |
| | Quarter 4 | | | 16576.7 | | | 1848.4 | | | 4176.6 | | | 96.3 | | | 79.1 | |
| | | | | | | | | | | | | | | | | | |
| 2014: | Quarter 1 | | | 16457.7 | | | 1872.3 | | | 4199.0 | | | 101.0 | | | 79.8 | |
| | Quarter 2 | | | 16826.6 | | | 1960.2 | | | 4408.2 | | | 99.0 | | | 77.4 | |
| | Quarter 3 | | | 17042.9 | | | 1972.3 | | | 4493.4 | | | 100.1 | | | 72.6 | |
| | Quarter 4 | | | 17823.1 | | | 2058.9 | | | 4736.1 | | | 105.5 | | | 79.2 | |
| | | | | | | | | | | | | | | | | | |
| 2015: | Quarter 1 | | | 17776.1 | | | 2067.9 | | | 4900.9 | | | 102.0 | | | 79.9 | |
| | Quarter 2 | | | 17619.5 | | | 2063.1 | | | 4986.9 | | | 109.1 | | | 87.5 | |
| | Quarter 3 | | | 16284.7 | | | 1920.0 | | | 4620.2 | | | 100.1 | | | 81.2 | |
| | Quarter 4 | | | 17425.0 | | | 2043.9 | | | 5007.4 | | | 105.4 | | | 82.0 | |
| | | | | | | | | | | | | | | | | | |
| 2016: | Quarter 1 | | | 17685.1 | | | 2059.7 | | | 4869.9 | | | 92.8 | | | 77.6 | |
| | Quarter 2 | | | 17930.0 | | | 2098.9 | | | 4842.7 | | | 93.9 | | | 80.0 | |
| | Quarter 3 | | | 18308.2 | | | 2168.3 | | | 5312.0 | | | 100.7 | | | 86.5 | |
| | Quarter 4 | | | 19762.6 | | | 2238.8 | | | 5383.1 | | | 130.4 | | | 111.2 | |
| | | | | | | | | | | | | | | | | | |
| 2017: | Quarter 1 | | | 20663.2 | | | 2362.7 | | | 5911.7 | | | 131.2 | | | 106.7 | |
| | Quarter 2 | | | 21349.6 | | | 2423.4 | | | 6140.4 | | | 134.9 | | | 106.6 | |
| | Quarter 3 | | | 22405.1 | | | 2519.4 | | | 6496.0 | | | 140.4 | | | 109.0 | |
| | Quarter 4 | | | 24719.2 | | | 2673..6 | | | 6903.4 | | | 151.0 | | | 110.9 | |
| | | | | | | | | | | | | | | | | | |
| 2018: | Quarter 1 | | | 24103.1 | | | 2640.9 | | | 7063.5 | | | 148.9 | | | 111.9 | |
| | Quarter 2 | | | 24271.4 | | | 2718.4 | | | 7510.3 | | | 146.2 | | | 113.9 | |
| | Quarter 3 | | | 26458.3 | | | 2914.0 | | | 8046.4 | | | 149.1 | | | 110.7 | |
| | Quarter 4 | | | 23327.5 | | | 2506.9 | | | 6635.3 | | | 123.4 | | | 89.4 | |
| | | | | | | | | | | | | | | | | | |
| 2019: | Quarter 1 | | | 25928.7 | | | 2834.4 | | | 7729.3 | | | 133.9 | | | 97.1 | |
| | Quarter 2 | | | 26600.0 | | | 2941.8 | | | 8006.2 | | | 142.2 | | | 100.2 | |
| | Quarter 3 | | | 26916.8 | | | 2976.7 | | | 7999.3 | | | 145.3 | | | 98.8 | |
| | Quarter 4 | | | 28538.4 | | | 3230.8 | | | 8972.6 | | | 164.6 | | | 107.6 | |
| | | | | | | | | | | | | | | | | | |
| 2020: | Quarter 1 | | | 21917.2 | | | 2584.6 | | | 7700.1 | | | 97.1 | | | 63.6 | |
| | Quarter 2 | | | 25812.9 | | | 3100.3 | | | 10058.8 | | | 106.3 | | | 72.2 | |
| | Quarter 3 | | | 27781.7 | | | 3363.0 | | | 11167.5 | | | 103.1 | | | 64.1 | |
| | Quarter 4 | | | 30606.5 | | | 3756.1 | | | 12888.3 | | | 138.9 | | | 94.6 | |
| | | | | | | | | | | | | | | | | | |
| 2021: | Quarter 1 | | | 32981.6 | | | 3972.9 | | | 13246.9 | | | 171.3 | | | 121.9 | |
| | Quarter 2 | | | 34502.5 | | | 4297.5 | | | 14504.0 | | | 176.0 | | | 119.4 | |
| | Quarter 3 | | | 33843.9 | | | 4307.5 | | | 14448.6 | | | 182.7 | | | 122.5 | |
| | Quarter 4 | | | 36338.3 | | | 4766.2 | | | 15645.0 | | | 184.0 | | | 126.0 | |
| | | | | | | | | | | | | | | | | | |
| 2022: | Quarter 1 | | | 34678.4 | | | 4530.4 | | | 14220.5 | | | 171.0 | | | 122.5 | |
| | Quarter 2 | | | 30775.4 | | | 3785.4 | | | 11028.7 | | | 141.2 | | | 107.1 | |
| | Quarter 3 | | | 28725.5 | | | 3585.6 | | | 10575.6 | | | 136.7 | | | 110.5 | |
| | Quarter 4 | | | 33147.3 | | | 3839.5 | | | 10466.5 | | | 148.4 | | | 114.1 | |
| | | | | | | | | | | | | | | | | | |
| 2023: | Quarter 1 | | | 33274.2 | | | 4109.3 | | | 12221.9 | | | 128.0 | | | 92.9 | |
| As of May 8, 2023 | | | 33618.7 | | | 4138.1 | | | 12256.9 | | | 122.2 | | | 80.1 | |
| Sources: | S&P Global Market Intelligence and The Wall Street Journal. |
EXHIBIT IV-3
Stock Price Indices as of May 8, 2023

Index Summary (Current Data)
Industry Banking
Geography All
| Index Name | | Current Value | | As Of | | Day's Change | | Day's Change
(%) | |
| Banking Indexes | | | | | | | | | | | | |
| S&P U.S. BMI Banks | | | 122.23 | | 5/8/2023 | | | (0.45 | ) | | (0.37 | ) |
| KBW Nasdaq Bank Index | | | 75.08 | | 5/8/2023 | | | (0.20 | ) | | (0.26 | ) |
| KBW Nasdaq Regional Bank Index | | | 80.06 | | 5/8/2023 | | | (2.32 | ) | | (2.82 | ) |
| S&P 500 Bank | | | 280.35 | | 5/8/2023 | | | 0.04 | | | 0.01 | |
| NASDAQ Bank | | | 2,739.74 | | 5/8/2023 | | | (41.60 | ) | | (1.50 | ) |
| S&P 500 Commercial Banks | | | 400.53 | | 5/8/2023 | | | 0.05 | | | 0.01 | |
| S&P 500 Diversified Banks | | | 524.87 | | 5/8/2023 | | | 0.55 | | | 0.10 | |
| S&P 500 Regional Banks | | | 66.12 | | 5/8/2023 | | | (0.55 | ) | | (0.82 | ) |
| Market Cap Indexes | | | | | | | | | | | | |
| Dow Jones U.S. MicroCap Banks | | | 21,283.28 | | 5/8/2023 | | | (286.04 | ) | | (1.33 | ) |
| S&P U.S. SmallCap Banks | | | 161.63 | | 5/8/2023 | | | (2.98 | ) | | (1.81 | ) |
| S&P U.S. MidCap Banks | | | 365.36 | | 5/8/2023 | | | (6.25 | ) | | (1.68 | ) |
| S&P U.S. LargeCap Banks | | | 336.79 | | 5/8/2023 | | | 0.56 | | | 0.17 | |
| S&P United States Between USD1 Billion and USD5 Billion Banks | | | 479.35 | | 5/8/2023 | | | (13.62 | ) | | (2.76 | ) |
| S&P United States Over USD5 Billion Banks | | | 355.89 | | 5/8/2023 | | | (0.31 | ) | | (0.09 | ) |
| S&P United States Between USD250 Million and USD1 Billion Banks | | | 1,039.90 | | 5/8/2023 | | | (19.21 | ) | | (1.81 | ) |
| S&P United States Under USD250 Million Banks | | | 948.11 | | 5/8/2023 | | | (2.69 | ) | | (0.28 | ) |
| Geographic Indexes | | | | | | | | | | | | |
| S&P U.S. BMI Banks - Mid-Atlantic Region | | | 566.56 | | 5/8/2023 | | | (0.10 | ) | | (0.02 | ) |
| S&P U.S. BMI Banks - Midwest Region | | | 438.58 | | 5/8/2023 | | | (10.97 | ) | | (2.44 | ) |
| S&P U.S. BMI Banks - New England Region | | | 358.90 | | 5/8/2023 | | | (8.53 | ) | | (2.32 | ) |
| S&P U.S. BMI Banks - Southeast Region | | | 332.64 | | 5/8/2023 | | | (0.85 | ) | | (0.26 | ) |
| S&P U.S. BMI Banks - Southwest Region | | | 881.55 | | 5/8/2023 | | | (21.92 | ) | | (2.43 | ) |
| S&P U.S. BMI Banks - Western Region | | | 862.18 | | 5/8/2023 | | | 4.21 | | | 0.49 | |
| Broad Market Indexes | | | | | | | | | | | | |
| DJIA | | | 33,618.69 | | 5/8/2023 | | | (55.69 | ) | | (0.17 | ) |
| S&P 500 | | | 4,138.12 | | 5/8/2023 | | | 1.87 | | | 0.05 | |
| S&P 400 Mid Cap | | | 2,453.87 | | 5/8/2023 | | | (7.23 | ) | | (0.29 | ) |
| S&P 600 Small Cap | | | 1,133.24 | | 5/8/2023 | | | (5.73 | ) | | (0.50 | ) |
| S&P 500 Financials | | | 537.96 | | 5/8/2023 | | | 1.13 | | | 0.21 | |
| MSCI US IMI Financials | | | 1,858.52 | | 5/8/2023 | | | 0.93 | | | 0.05 | |
| NASDAQ | | | 12,256.92 | | 5/8/2023 | | | 21.51 | | | 0.18 | |
| NASDAQ Finl | | | 4,153.47 | | 5/8/2023 | | | (9.84 | ) | | (0.24 | ) |
| NYSE | | | 15,391.27 | | 5/8/2023 | | | 10.40 | | | 0.07 | |
| Russell 1000 | | | 2,263.13 | | 5/8/2023 | | | 1.88 | | | 0.08 | |
| Russell 2000 | | | 1,754.47 | | 5/8/2023 | | | (5.41 | ) | | (0.31 | ) |
| Russell 3000 | | | 2,372.34 | | 5/8/2023 | | | 1.46 | | | 0.06 | |
| S&P TSX Composite | | | 20,585.15 | | 5/8/2023 | | | 43.13 | | | 0.21 | |
Intraday data is available for certain exchanges. In all cases, the data is at least 15 minutes delayed.
* - Intraday data is not currently available. Data is as of the previous close.
** - Non-publicly traded institutions and institutions outside of your current subscription are not included in custom indexes. Data is as of the previous close.
Source: MSCI. MSCI makes no express or implied warranties or representations and shall have no liability whatsoever with respect to any MSCI data contained herein. The MSCI data may not be further redistributed or used as a basis for other indices or any securities or financial products.
EXHIBIT IV-4
New York Bank and Thrift Acquisitions 2018 - Present
Exhibit IV-4
New York Bank and Thrift Acquisitions 2018-Present
| | | | | | | | | | | Target Financials at Announcement | | Deal Terms and Pricing at Announcement | |
| | | | | | | | | | | Total | | | | | | | | | | NPAs/ | | Rsrvs/ | | Deal | | Value/ | | | | | | | | | | Prem/ | |
| Announce | | Complete | | | | | | | | Assets | | E/A | | TE/A | | ROAA | | ROAE | | Assets | | NPLs | | Value | | Share | | P/B | | P/TB | | P/E | | P/A | | Cdeps | |
| Date | | Date | | Buyer Name | | | Target Name | | | ($000) | | (%) | | (%) | | (%) | | (%) | | (%) | | (%) | | ($M) | | ($) | | (%) | | (%) | | (x) | | (%) | | (%) | |
| 11/28/2022 | | Pending | | SNBNY Holdings Ltd. | | | Delta North Bankcorp, Inc. | | NY | | 334,511 | | | 15.29 | | | 15.29 | | | -0.06 | | | -0.49 | | | 0.00 | | | NA | | | NA | | | NA | | | NA | | | NA | | | NA | | | NA | | | NA | |
| 08/02/2021 | | 01/06/2023 | | Newtek Business Services Corp | | FL | National Bank of New York City | | NY | | 203,570 | | | 17.90 | | | 17.90 | | | 0.61 | | | 3.30 | | | 1.65 | | | 81.46 | | | 20.0 | | | 595.238 | | | 54.87 | | | 54.87 | | | 20.60 | | | 9.82 | | | NM | |
| 05/24/2022 | | 01/01/2023 | | Brookline Bancorp Inc. | | MA | PCSB Financial Corporation | | NY | | 1,984,541 | | | 13.93 | | | 13.66 | | | 0.79 | | | 5.37 | | | 0.44 | | | 100.88 | | | 320.1 | | | 20.724 | | | 114.98 | | | 117.62 | | | 20.32 | | | 16.13 | | | 3.30 | |
| 01/08/2022 | | 10/26/2022 | | TBB Investments LLC | | | Berkshire Bancorp Inc. | | NY | | 716,680 | | | 23.63 | | | 23.63 | | | 0.38 | | | 1.61 | | | NA | | | NA | | | NA | | | NA | | | NA | | | NA | | | NA | | | NA | | | NA | |
| 10/26/2022 | | 10/26/2022 | | TBB Investments LLC | | | Berkshire Bancorp Inc. | | NY | | 702,360 | | | 23.50 | | | NA | | | NA | | | NA | | | NA | | | NA | | | 13.0 | | | 12.400 | | | 108.31 | | | NA | | | NA | | | 25.45 | | | NA | |
| 01/06/2022 | | 09/16/2022 | | Gouverneur Bancorp | | NY | Citizens Bank of Cape Vincent | | NY | | 87,204 | | | 8.34 | | | 8.34 | | | 0.33 | | | 3.66 | | | 0.61 | | | 123.11 | | | 8.4 | | | 1056.110 | | | 116.23 | | | 116.23 | | | 31.76 | | | 9.69 | | | 1.53 | |
| 06/16/2021 | | 06/01/2022 | | Rhodium BA Holdings LLC | | NY | Sunnyside Bancorp, Inc. | | NY | | 95,281 | | | 10.90 | | | 10.90 | | | -0.90 | | | -7.73 | | | NA | | | 50.62 | | | 14.5 | | | 20.250 | | | 154.68 | | | 154.68 | | | NA | | | 16.86 | | | 8.94 | |
| 10/03/2021 | | 05/13/2022 | | Community Bank System Inc. | | NY | Elmira Savings Bank | | NY | | 643,596 | | | 9.85 | | | 8.09 | | | 0.83 | | | 8.74 | | | NA | | | 98.43 | | | 82.8 | | | 23.100 | | | 129.44 | | | 160.69 | | | 15.00 | | | 12.87 | | | 6.95 | |
| 09/23/2021 | | 04/01/2022 | | Valley National Bancorp | | NY | Bank Leumi Le-Israel Corporation | | NY | | 8,350,814 | | | 10.54 | | | 10.48 | | | 0.79 | | | 7.13 | | | 0.61 | | | 136.50 | | | 1180.9 | | | 51.246 | | | 134.30 | | | 135.00 | | | 19.27 | | | 14.14 | | | 4.53 | |
| 04/19/2021 | | 01/31/2022 | | Webster Financial Corp. | | CT | Sterling Bancorp | | NY | | 29,914,282 | | | 15.44 | | | 10.12 | | | 1.03 | | | 6.83 | | | 0.74 | | | 149.16 | | | 5225.2 | | | 26.562 | | | 114.08 | | | 188.72 | | | 17.03 | | | 17.47 | | | NA | |
| 10/16/2020 | | 01/03/2022 | | First Citizens BancShares Inc. | | NC | CIT Group Inc. | | NY | | 60,865,000 | | | 9.47 | | | 9.05 | | | -0.87 | | | -8.15 | | | NA | | | NA | | | 2158.6 | | | 21.906 | | | 41.20 | | | 43.56 | | | NA | | | 3.55 | | | -7.35 | |
| 06/29/2021 | | 12/01/2021 | | Valley National Bancorp | | NY | The Westchester Bank Holding Corp | | NY | | 1,313,073 | | | 10.06 | | | 10.06 | | | 1.07 | | | 10.25 | | | 0.21 | | | 531.50 | | | 220.2 | | | 3081.836 | | | 168.98 | | | 168.98 | | | 18.05 | | | 16.77 | | | 8.66 | |
| 08/27/2020 | | 05/26/2021 | | Hanover Bancorp Inc. | | NY | Savoy Bank | | NY | | 596,948 | | | 7.11 | | | 7.08 | | | 1.14 | | | 11.93 | | | 0.89 | | | 190.48 | | | 63.0 | | | 6.543 | | | 148.49 | | | 149.20 | | | 13.03 | | | 10.55 | | | 16.45 | |
| 07/01/2020 | | 02/01/2021 | | Dime Community Bancshares Inc. | | NY | Bridge Bancorp, Inc. | | NY | | 6,150,664 | | | 8.17 | | | 6.53 | | | 0.94 | | | 9.73 | | | 0.51 | | | 137.21 | | | 498.2 | | | 14.800 | | | NA | | | NA | | | NA | | | NA | | | NA | |
| 10/25/2019 | | 10/30/2020 | | Flushing Financial Corp. | | NY | Empire Bancorp, Inc. | | NY | | 1,012,542 | | | 8.02 | | | NA | | | 0.35 | | | 4.68 | | | NA | | | NA | | | 111.4 | | | 14.242 | | | 134.62 | | | 141.00 | | | 30.96 | | | 11.00 | | | 3.60 | |
| 12/18/2019 | | 07/17/2020 | | CNB Financial Corp. | | PA | Bank of Akron | | NY | | 388,877 | | | 9.88 | | | 9.88 | | | 1.30 | | | 13.00 | | | 1.21 | | | 124.19 | | | 65.8 | | | 219.255 | | | 171.21 | | | 171.21 | | | 13.92 | | | 16.91 | | | 9.58 | |
| 01/09/2020 | | 07/07/2020 | | Norwood Financial Corp. | | PA | UpState New York Bancorp, Inc. | | NY | | 439,784 | | | 10.56 | | | 10.56 | | | 1.08 | | | 10.53 | | | 1.32 | | | 133.45 | | | 80.0 | | | 36.233 | | | 177.94 | | | 177.94 | | | 17.29 | | | 18.25 | | | 20.59 | |
| 12/23/2019 | | 07/01/2020 | | Northfield Bancorp Inc. | | NJ | VSB Bancorp, Inc. | | NY | | 375,704 | | | 10.14 | | | 10.14 | | | 0.95 | | | 10.30 | | | 0.58 | | | 79.69 | | | 64.4 | | | 33.300 | | | 161.62 | | | 161.62 | | | 16.32 | | | 17.14 | | | 9.54 | |
| 10/21/2019 | | 06/12/2020 | | Community Bank System Inc. | | NY | Steuben Trust Corporation | | NY | | 575,879 | | | 11.38 | | | 11.37 | | | 1.26 | | | 11.73 | | | 0.66 | | | 263.98 | | | 108.8 | | | 64.033 | | | 164.99 | | | 165.15 | | | 15.10 | | | 18.89 | | | 11.26 | |
| 12/19/2019 | | 05/01/2020 | | Evans Bancorp Inc. | | NY | FSB Bancorp, Inc. | | NY | | 324,810 | | | 9.83 | | | 9.83 | | | 0.00 | | | 0.02 | | | 0.32 | | | 166.28 | | | 34.6 | | | 17.829 | | | 108.40 | | | 108.40 | | | NM | | | 10.65 | | | 1.72 | |
| 07/24/2019 | | 04/03/2020 | | Investors Bancorp Inc | | NJ | Gold Coast Bancorp, Inc. | | NY | | 572,323 | | | 8.07 | | | 8.07 | | | 0.45 | | | 5.65 | | | NA | | | NA | | | 62.3 | | | 15.838 | | | 134.91 | | | 134.91 | | | 25.14 | | | 10.89 | | | 4.67 | |
| 08/09/2019 | | 01/01/2020 | | OceanFirst Financial Corp. | | NJ | Country Bank Holding Company, Inc. | | NY | | 783,352 | | | 8.62 | | | NA | | | NA | | | NA | | | NA | | | NA | | | 102.2 | | | 46280.000 | | | 151.00 | | | 151.00 | | | 9.80 | | | 13.05 | | | 7.50 | |
| 09/20/2018 | | 08/09/2019 | | Hanover Bancorp Inc. | | NY | Chinatown Federal Savings Bank | | NY | | 131,610 | | | 19.39 | | | 19.39 | | | 0.01 | | | 0.03 | | | 2.15 | | | 27.17 | | | 28.8 | | | 140.762 | | | 112.84 | | | 112.84 | | | NM | | | 21.88 | | | 3.65 | |
| 01/22/2019 | | 07/12/2019 | | Community Bank System Inc. | | NY | Kinderhook Bank Corp. | | NY | | 631,996 | | | 8.97 | | | 8.08 | | | 0.86 | | | 10.04 | | | NA | | | NA | | | 93.2 | | | 62.000 | | | 161.47 | | | 186.68 | | | 17.13 | | | 14.74 | | | NA | |
| 07/12/2018 | | 01/02/2019 | | ConnectOne Bancorp, Inc. | | NJ | Greater Hudson Bank | | NY | | 519,643 | | | 10.13 | | | 10.13 | | | -0.59 | | | -5.13 | | | 1.09 | | | 131.33 | | | 76.3 | | | NA | | | 144.96 | | | 144.96 | | | NA | | | 14.69 | | | 6.84 | |
| 04/23/2018 | | 10/15/2018 | | RBB Bancorp | | CA | First American International Corp. | | NY | | 889,618 | | | 9.23 | | | 9.23 | | | 0.95 | | | 10.62 | | | 0.30 | | | 357.42 | | | 115.3 | | | 52.321 | | | 177.21 | | | 177.21 | | | 15.57 | | | 12.96 | | | NA | |
| 03/05/2018 | | 09/29/2018 | | Seneca-Cayuga Bncp Inc. (MHC) | | NY | Medina Savings and Loan Association | | NY | | 53,925 | | | 6.90 | | | 6.90 | | | 0.06 | | | 0.95 | | | 0.31 | | | 284.85 | | | NA | | | NA | | | NA | | | NA | | | NA | | | NA | | | NA | |
| 01/22/2018 | | 05/22/2018 | | Investor group | | NY | Bank Leumi Le-Israel Corporation | | NY | | 7,026,521 | | | 11.02 | | | 10.96 | | | 0.54 | | | 4.96 | | | 1.68 | | | 37.31 | | | 141.0 | | | 42.119 | | | 121.44 | | | 122.16 | | | 24.90 | | | 13.38 | | | 4.73 | |
| | | | | | | | | | | | | | | | | | | | | | | | | | | | | | | | | | | | | | | | | | | | | | | | | | | | |
| | | | | | | | Average: | | | | 4,488,754 | | | 11.65 | | | 11.03 | | | 0.51 | | | 4.98 | | | 0.80 | | | 160.25 | | | | | | | | | 133.67 | | | 141.07 | | | 18.96 | | | 14.49 | | | 6.67 | |
| | | | | | | | Median: | | | | 614,472 | | | 10.10 | | | 10.12 | | | 0.70 | | | 5.51 | | | 0.61 | | | 132.39 | | | | | | | | | 134.77 | | | 149.20 | | | 17.21 | | | 14.42 | | | 6.84 | |
Source: S&P Global Market Intelligence.
EXHIBIT IV-5
Gouverneur Bancorp, Inc.
Director and Senior Management Summary Resumes
Exhibit IV-5
Gouverneur Bancorp, Inc.
Director and Senior Management Summary Resumes
Board of Directors
Information regarding our directors is provided below. Unless otherwise stated, each individual has held his or her current occupation for the last five years. The age indicated for each individual is as of March 31, 2023. The indicated period of service as a director includes the period of service as a director of Gouverneur Savings and Loan Association.
The following directors have terms ending in 2024:
Clara P. Cummings graduated from Clarkson University with a Bachelor of Science in Accounting and a Master of Science in Teaching from SUNY Potsdam. She was hired as an accountant at Zinc Corporation of America in 1997, continued with St. Lawrence Zinc Corporation in 2006 and upon revitalization of the mine in 2017, was named Human Resource Director of Empire State Mines, LLC. Mrs. Cummings is an active member of the community and currently serves as a member of the Gouverneur Central School’s Shared Decision-Making Team, holds the position of Parish Council Member and Education Council Member at St. James Parish and School and is a member of the Gouverneur Hospital Auxiliary. Mrs. Cummings has extensive ties to our market area, as well as valuable business and leadership experience that she brings to the board of directors. Age 47. Director since 2021.
John N. Mason has owned and operated a residential plumbing business, John N. Mason Plumbing, since 1987 and, in 2014, Mr. Mason retired as a corrections officer after 25 years of service with the New York State Department of Corrections. Prior to joining the board of directors in 2022, Mr. Mason served as a director of Citizens Bank of Cape Vincent until its merger with Gouverneur Savings and Loan Association on September 16, 2022. Mr. Mason has extensive ties to our market area, as well as valuable business and leadership experience that he brings to the board of directors. Age 57. Director since 2022.
Timothy J. Monroe is a veterinarian in private practice in Gouverneur, New York and the proprietor of the Northland Veterinary Hospital in Gouverneur, New York. Dr. Monroe served as the Chairman of our board of directors from March 2015 to February 2017. Dr. Monroe was an elected Councilman for the Town of Gouverneur for twenty-four years, has served as a board member of Gouverneur EJ Noble Hospital, and was a member of the board of directors of a local public television station. Dr. Monroe also served as a member of the St. Lawrence County Board of Health and as a trustee and parish council member of the St. James Church in Gouverneur. Dr. Monroe has extensive ties to our market area, as well as valuable business and leadership experience that he brings to the board of directors. Age 71. Director since 1999.
The following directors have terms ending in 2025:
David C. McClure serves as the Chairman of our board of directors and has served as a Vice President of KPH Healthcare Services in various capacities since 1993, where he became Vice President of Real Estate in 2008 and Executive Vice President for the company in 2022. Mr. McClure has been a member of the board of directors of KPH Healthcare since 1993 and is also currently President of the Kinney Drugs Foundation. He is a past member of the Gouverneur EJ Noble Hospital board of trustees. As a result of his local business operations, Mr. McClure has extensive ties to our market area, as well as valuable business and leadership experience that he brings to the board of directors. Age 63. Director since 2016.
Amy M. Rapholz has been a senior accountant with the accounting firm of Stackel & Navarra, CPA PC in Watertown, New York since 2015. In 1984, Ms. Rapholz joined the accounting firm of Robb, Dowling and Adams in Watertown, New York, which later became Morrow & Poulsen and then Poulsen & Podvin. In January of 2014 the firm merged with Bowers and Company PLLC located in Syracuse, New York. Ms. Rapholz left the firm in February 2015 to begin her current role as a senior accountant at Stackel & Navarra, CPA PC. As a certified public accountant, Ms. Rapholz provides the board of directors with significant experience regarding financial and accounting matters. Age 59. Director since 2019.
Exhibit IV-5 (continued)
Gouverneur Bancorp, Inc.
Director and Senior Management Summary Resumes
The following directors have terms ending in 2026:
Henry J. Leader has been a Partner in Case & Leader LLP, a law firm in Gouverneur, New York, since 1988. He has been Secretary of Gouverneur Bancorp and Gouverneur Savings and Loan Association since 2010. Mr. Leader is a member of the Gouverneur Foundation Board and serves as legal counsel to several Towns and Villages in Jefferson and St. Lawrence Counties. Mr. Leader serves as local attorney for the Gouverneur Central School District and several local corporate entities. He is an ordained Deacon with the Roman Catholic Diocese of Ogdensburg and serves the parish of St. James Church in Gouverneur. Mr. Leader’s extensive legal experience provides the board of directors with valuable experience regarding legal matters associated with our operations. Age 60. Director since 2009.
Chad B. Soper is President and owner of Cooke Sand & Gravel, Inc., with over thirty-five years of experience in the mining and concrete industry. He served as Vice President of Cooke Sand & Gravel, Inc. from 1984 to 2004, when he became President. As a result of his local business operations, Mr. Soper has extensive ties to our market area, as well as valuable business and leadership experience that he brings to the board of directors. Age 56. Director since 2015.
Charles C. Van Vleet, Jr. has served as our President and Chief Executive Officer since April 2023 and previously served as our President and Chief Executive Officer from 2010 through 2021. Mr. Van Vleet joined Gouverneur Savings and Loan Association as an Assistant Vice President in August 1996 and held the same position with Gouverneur Bancorp from its organization through February 2001. From February 2001 until August 2005 he was a Vice President with Gouverneur Savings and Loan Association and Gouverneur Bancorp and, in August 2005, he was named Senior Vice President of Gouverneur Savings and Loan Association and Gouverneur Bancorp. He served as Secretary of Gouverneur Savings and Loan Association and Gouverneur Bancorp from 1999 to 2010. Mr. Van Vleet served as Executive Vice President and Chief Operating Officer for Gouverneur Savings and Loan Association and Gouverneur Bancorp from July 2009 to January 2010, when he was named the President and Chief Executive Officer. He served as Chief Executive Officer until February 2021 and retired as President in May 2021. Mr. Van Vleet has also held numerous offices as a member of the Gouverneur Rotary Club. Mr. Van Vleet’s service as our current and former President and Chief Executive Officer, as well as his long history with Gouverneur Savings and Loan Association, provides the board of directors with valuable insight regarding the operations of Gouverneur Savings and Loan Association and the markets in which we operate. Age 65. Director since 2010.
Exhibit IV-5 (continued)
Gouverneur Bancorp, Inc.
Director and Senior Management Summary Resumes
Below is information regarding our executive officers who are not also directors. Each executive officer has held his or her current position for the period indicated below. Ages presented are as of March 31, 2023.
Taylor Robbins has served as Executive Vice President of Gouverneur Bancorp, Cambray Mutual Holding Company and Gouverneur Savings and Loan Association since September 2022. Prior to that time, Mr. Robbins served as the President and Chief Executive Officer of Citizens Bank of Cape Vincent until its merger with Gouverneur Savings and Loan Association on September 16, 2022. Age 34.
Kimberly A. Adams joined Gouverneur Savings and Loan Association in May 2009 as Accounting Manager. She was named Vice President and Chief Financial Officer of Gouverneur Savings and Loan Association and Gouverneur Bancorp in January 2010. Mrs. Adams is a member of the Heuvelton Alumni Band, Potsdam Community Band and Ogdensburg Pro Musica, and is a past member of the Gouverneur Business Women’s Association. She was a volunteer for Hospice and Palliative Care of St. Lawrence Valley and is an exempt 10-year member with the Lisbon Volunteer Fire Department as an emergency medical technician. Mrs. Adams previously held the position of Compliance Officer and Senior Accountant with Claxton-Hepburn Medical Center in Ogdensburg and Accounting Manager at Massena Memorial Hospital. Age 64.
Sadie M. Hall was hired as an accountant with Gouverneur Savings and Loan Association in September 2012 and was named Compliance Officer and Assistant Vice President in February 2015. Mrs. Hall was also named Vice President in January 2021. She earned the Certified Regulatory Compliance Manager designation in May 2018 also currently serves as the BSA/OFAC Officer for Gouverneur Savings and Loan Association. Mrs. Hall is a member of the Clifton Fine Hospital board and the Samaritan Medical Center Board of Trustees. In addition, Mrs. Hall is part owner of AJs Portables LLC in Lisbon, New York. Age 33.
Victor James was hired by Gouverneur Savings and Loan Association in August 2011 as an Assistant Vice President and Collections Officer. He was promoted to Vice President and Chief Operating Officer in December 2012. Mr. James previously held the position of Vice President of Lending and Operations with Northern Credit Union and has over 30 years of banking experience. Age 64.
Source: Gouverneur Bancorp’s prospectus.
EXHIBIT IV-6
Gouverneur Bancorp, Inc.
Pro Forma Regulatory Capital Ratios
Exhibit IV-6
Gouverneur Bancorp, Inc.
Pro Forma Regulatory Capital Ratios
| | | Gouverneur Savings and
Loan Association
Historical at | | | Pro Forma at March 31, 2023, Based Upon the Sale in the Offering of | |
| | | March 31, 2023 | | | 722,500 Shares | | | 850,000 Shares | | | 977,500 Shares | |
| | | Amount | | | Percent of
Assets | | | Amount | | | Percent of
Assets | | | Amount | | | Percent of
Assets | | | Amount | | | Percent of
Assets | |
| | | | | | | | | | | | | | | | | | | | | | | | | |
| | | (Dollars in thousands) | |
| Equity | | $ | 25,984 | | | | 12.66 | % | | $ | 28,025 | | | | 13.47 | % | | $ | 28,509 | | | | 13.66 | % | | $ | 28,994 | | | | 13.85 | % |
| | | | | | | | | | | | | | | | | | | | | | | | | | | | | | | | | |
| Tier 1 leverage capital(1)(2) | | $ | 21,837 | | | | 10.73 | % | | $ | 23,878 | | | | 11.57 | % | | $ | 24,362 | | | | 11.77 | % | | $ | 24,847 | | | | 11.97 | % |
| Tier 1 leverage requirement | | | 10,173 | | | | 5.00 | | | | 10,318 | | | | 5.00 | | | | 10,350 | | | | 5.00 | | | | 10,382 | | | | 5.00 | |
| Excess | | $ | 11,664 | | | | 5.73 | % | | $ | 13,560 | | | | 6.57 | % | | $ | 14,012 | | | | 6.77 | % | | $ | 14,465 | | | | 6.97 | % |
| | | | | | | | | | | | | | | | | | | | | | | | | | | | | | | | | |
| Tier 1 risk-based capital(1)(2) | | $ | 21,837 | | | | 19.54 | % | | $ | 23,878 | | | | 21.25 | % | | $ | 24,362 | | | | 21.66 | % | | $ | 24,847 | | | | 22.06 | % |
| Tier 1 risk-based requirement | | | 8,942 | | | | 8.00 | | | | 8,989 | | | | 8.00 | | | | 8,999 | | | | 8.00 | | | | 9,009 | | | | 8.00 | |
| Excess | | $ | 12,895 | | | | 11.54 | % | | $ | 14,889 | | | | 13.25 | % | | $ | 15,363 | | | | 13.66 | % | | $ | 15,838 | | | | 14.06 | % |
| | | | | | | | | | | | | | | | | | | | | | | | | | | | | | | | | |
| Total risk-based capital(1)(2) | | $ | 22,512 | | | | 20.14 | % | | $ | 24,553 | | | | 21.85 | % | | $ | 25,037 | | | | 22.26 | % | | $ | 25,522 | | | | 22.66 | % |
| Total risk-based requirement | | | 11,178 | | | | 10.00 | | | | 11,236 | | | | 10.00 | | | | 11,249 | | | | 10.00 | | | | 11,261 | | | | 10.00 | |
| Excess | | $ | 11,334 | | | | 10.14 | % | | $ | 13,317 | | | | 11.85 | % | | $ | 13,788 | | | | 12.26 | % | | $ | 14,261 | | | | 12.66 | % |
| | | | | | | | | | | | | | | | | | | | | | | | | | | | | | | | | |
| Common equity tier 1 risk-based capital(1)(2) | | $ | 21,837 | | | | 19.54 | % | | $ | 23,878 | | | | 21.25 | % | | $ | 24,362 | | | | 21.66 | % | | $ | 24,847 | | | | 22.06 | % |
| Common equity tier 1 risk-based requirement | | | 7,266 | | | | 6.50 | | | | 7,303 | | | | 6.50 | | | | 7,312 | | | | 6.50 | | | | 7,320 | | | | 6.50 | |
| Excess | | $ | 14,571 | | | | 13.04 | % | | $ | 16,575 | | | | 14.75 | % | | $ | 17,050 | | | | 15.16 | % | | $ | 17,527 | | | | 15.56 | % |
| | | | | | | | | | | | | | | | | | | | | | | | | | | | | | | | | |
| Reconciliation of capital infused into Gouverneur Savings and Loan Association: | | | | | | | | | | | | | | | | | | | | | | | | | | | | | | | | |
| Net proceeds | | | | | | | | | | $ | 2,908 | | | | | | | $ | 3,545 | | | | | | | $ | 4,183 | | | | | |
| Less: Common stock acquired by new equity incentive plan | | | | | | | | | | | (289 | ) | | | | | | | (340 | ) | | | | | | | (391 | ) | | | | |
| Less: Common stock acquired by employee stock ownership plan | | | | | | | | | | | (578 | ) | | | | | | | (680 | ) | | | | | | | (782 | ) | | | | |
| Pro forma increase | | | | | | | | | | $ | 2,041 | | | | | | | $ | 2,525 | | | | | | | $ | 3,010 | | | | | |
| (1) | Tier 1 leverage capital levels are shown as a percentage of total average assets. Risk-based capital levels are shown as a percentage of risk-weighted assets. |
| (2) | Pro forma amounts and percentages assume net proceeds are invested in assets that carry a 20% risk weighting. |
Source: Gouverneur Bancorp’s prospectus.
EXHIBIT IV-7
Gouverneur Bancorp, Inc.
Pro Forma Analysis Sheet
EXHIBIT IV-7
PRO FORMA ANALYSIS SHEET
Gouverneur Bancorp, Inc.
Prices as of May 8, 2023
| | | | | | | Subject | | | | Peer Group | | | New York | | | All Public | |
| Valuation Midpoint Pricing Multiples | | | | Symbol | | at Midpoint | | | | Mean | | | Median | | | Mean | | | Median | | | Mean | | | Median | |
| Price-earnings multiple | | = | | P/E | | | 17.35x | | | | | 14.16x | | | | 14.05x | | | | 5.20x | | | | 5.94x | | | | 9.63x | | | | 9.04x | |
| Price-core earnings multiple | | = | | P/CE | | | 16.73x | | | | | 17.40x | | | | 16.47x | | | | 13.48x | | | | 6.84x | | | | 11.43x | | | | 8.71x | |
| Price-book ratio | | = | | P/B | | | 39.87 | % | | | | 71.06 | % | | | 69.58 | % | | | 74.53 | % | | | 72.30 | % | | | 73.24 | % | | | 69.37 | % |
| Price-tangible book ratio | | = | | P/TB | | | 49.33 | % | | | | 73.65 | % | | | 74.09 | % | | | 80.12 | % | | | 80.77 | % | | | 80.50 | % | | | 73.33 | % |
| Price-assets ratio | | = | | P/A | | | 6.16 | % | | | | 10.84 | % | | | 8.51 | % | | | 7.25 | % | | | 6.71 | % | | | 8.97 | % | | | 7.97 | % |
| Valuation Parameters | | | | | | | | | Adjusted | | |
| | | | | | | | | | | | |
| Pre-Conversion Earnings (Y) | | $ | 747,394 | | | (12 Mths 3/23(2) | | ESOP Stock (% of Offering + Foundation) (E) | | | 8.00 | % | |
| Pre-Conversion Core Earnings (YC) | | $ | 775,394 | | | (12 Mths 3/23(2) | | Cost of ESOP Borrowings (S) | | | 0.00 | % | |
| Pre-Conversion Book Value (B) | | $ | 26,599,000 | | | (2) | | ESOP Amortization (T) | | | 15.00 | Years | |
| Pre-Conv. Tang. Book Value (B) | | $ | 20,332,000 | | | (2) | | Stock Program (% of Offering + Foundation (M) | | | 4.00 | % | |
| Pre-Conversion Assets (A) | | $ | 205,456,000 | | | (2) | | Stock Programs Vesting (N) | | | 5.00 | Years | |
| Reinvestment Rate (R) | | | 3.60 | % | | | | Fixed Expenses | | $ | 1,410,000 | | |
| Tax rate (TAX) | | | 21.00 | % | | | | Variable Expenses (Blended Commission %) | | | 0.86 | % | |
| After Tax Reinvest. Rate (R) | | | 2.84 | % | | | | Percentage Sold (PCT) | | | 65.2561 | % | |
| Est. Conversion Expenses (1)(X) | | | 16.59 | % | | | | MHC Assets | | $ | 260,000 | | |
| Insider Purchases | | $ | 122,000 | | | | | Options as (% of Offering + Foundation) (O1) | | | 10.00 | % | |
| Price/Share | | $ | 10.00 | | | | | Estimated Option Value (O2) | | | 49.50 | % | |
| Foundation Cash Contribution (FC) | | $ | - | | | | | Option Vesting Period (O3) | | | 5.00 | Years | |
| Foundation Stock Contribution (FS) | | $ | - | | | | | % of Options taxable (O4) | | | 25.00 | % | |
| Foundation Tax Benefit (FT) | | $ | - | | | | | | | | | | |
| Calculation of Pro Forma Value After Conversion | | | | | | | | | | |
| | | | | | | | | | | | | | |
| 1. V= | P/E * (Y - FC * R) | | V= | $13,025,610 | | |
| | 1 - P/E * PCT * ((1-X-E-M-FS)*R - (1-TAX)*(E/T) - (1-TAX)*(M/N)-(1-TAX*O4)*(O1*O2/O3))) | | | | | | |
| | | | | | | | | | | | | | |
| 2. V= | P/Core E * (YC) | V= | $13,025,610 | | |
| | 1 - P/Core E * PCT * ((1-X-E-M-FS)*R - (1-TAX)*(E/T) - (1-TAX)*(M/N)-(1-TAX*O4)*(O1*O2/O3))) | | | | | |
| | | | | | | | | | | | | | |
| 3. V= | P/B * (B-FC+FT) | | | | | | | | V= | $13,025,610 | | |
| | 1 - P/B * PCT * (1-X-E-M) | | | | | | | | | | | |
| | | | | | | | | | | | | | |
| 4. V= | P/TB * (B-FC+FT) | | | | | | | | V= | $13,025,610 | | |
| | 1 - P/TB * PCT * (1-X-E-M) | | | | | | | | | | | |
| | | | | | | | | | | | | | |
| 5. V= | P/A * (A-FC+FT) | | | | | | | | V= | $13,025,610 | | |
| | 1 - P/A * PCT * (1-X-E-M) | | | | | | | | | | | |
Shares
| | | | | | 2nd Step | | | Full | | | Plus: | | | Total Market | | | | |
| | | 2nd Step | | | Exchange | | | Conversion | | | Foundation | | | Capitalization | | | Exchange | |
| Conclusion | | Offering Shares | | | Shares | | | Shares | | | Shares | | | Shares | | | Ratio | |
| Maximum | | | 977,500 | | | | 520,445 | | | | 1,497,945 | | | | 0 | | | | 1,497,945 | | | | 0.7227 | |
| Midpoint | | | 850,000 | | | | 452,561 | | | | 1,302,561 | | | | 0 | | | | 1,302,561 | | | | 0.6284 | |
| Minimum | | | 722,500 | | | | 384,677 | | | | 1,107,177 | | | | 0 | | | | 1,107,177 | | | | 0.5342 | |
Market Value
| | | | | | 2nd Step | | | Full | | | | | | Total Market | |
| | | 2nd Step | | | Exchange | | | Conversion | | | Foundation | | | Capitalization | |
| Conclusion | | Offering Value | | | Shares Value | | | $ Value | | | $ Value | | | $ Value | |
| Maximum | | $ | 9,775,000 | | | $ | 5,204,450 | | | $ | 14,979,450 | | | | 0 | | | $ | 14,979,450 | |
| Midpoint | | $ | 8,500,000 | | | $ | 4,525,610 | | | $ | 13,025,610 | | | | 0 | | | $ | 13,025,610 | |
| Minimum | | $ | 7,225,000 | | | $ | 3,846,770 | | | $ | 11,071,770 | | | | 0 | | | $ | 11,071,770 | |
(1) Estimated offering expenses at midpoint of the offering.
(2) Adjusted to reflect consolidation and reinvesment of $260,000 of MHC net assets.
EXHIBIT IV-8
Gouverneur Bancorp, Inc.
Pro Forma Effect of Conversion Proceeds
Exhibit IV-8
PRO FORMA EFFECT OF CONVERSION PROCEEDS
Gouverneur Bancorp, Inc.
At the Minimum of the Range
| 1. | | Fully Converted Value and Exchange Ratio | | | | |
| | | Fully Converted Value | | $ | 11,071,770 | |
| | | Exchange Ratio | | | 0.53416 | |
| | | | | | | |
| | | 2nd Step Offering Proceeds | | $ | 7,225,000 | |
| | | Less: Estimated Offering Expenses | | | 1,410,000 | |
| | | 2nd Step Net Conversion Proceeds | | $ | 5,815,000 | |
| | | | | | | |
| | | | | | | |
| 2. | | Estimated Additional Income from Conversion Proceeds | | | | |
| | | | | | | |
| | | Net Conversion Proceeds | | $ | 5,815,000 | |
| | | Less: Cash Contribution to Foundation | | | 0 | |
| | | Less: ESOP Stock Purchases (1) | | | (578,000 | ) |
| | | Less: RRP Stock Purchases (2) | | | (289,000 | ) |
| | | Net Cash Proceeds | | $ | 4,948,000 | |
| | | Estimated after-tax net incremental rate of return | | | 2.84 | % |
| | | Earnings Increase | | $ | 140,721 | |
| | | Less: Consolidated interest cost of ESOP borrowings | | | 0 | |
| | | Less: Amortization of ESOP borrowings(3) | | | (30,441 | ) |
| | | Less: RRP Vesting (3) | | | (45,662 | ) |
| | | Less: Option Plan Vesting (4) | | | (67,772 | ) |
| | | Net Earnings Increase | | $ | (3,155 | ) |
| | | | | | | | Net | | | | |
| | | | | Before | | | Earnings | | | After | |
| | | | | Conversion(5) | | | Increase | | | Conversion | |
| 3. | | Pro Forma Earnings | | | | | | | | | |
| | 12 Months ended March 31, 2023 (reported) | | $ | 747,394 | | | $ | (3,155 | ) | | $ | 744,240 | |
| | | 12 Months ended March 31, 2023 (core) | | $ | 775,394 | | | $ | (3,155 | ) | | $ | 772,240 | |
| | | | | Before | | | Net Cash | | | Tax Benefit | | | After | |
| | | | | Conversion(5) | | | Proceeds | | | and Other | | | Conversion | |
| 4. | | Pro Forma Net Worth | | | | | | | | | | | | |
| | | March 31, 2023 | | $ | 26,599,000 | | | $ | 4,948,000 | | | $ | 0 | | | $ | 31,547,000 | |
| | | March 31, 2023 (Tangible) | | $ | 20,332,000 | | | $ | 4,948,000 | | | $ | 0 | | | $ | 25,280,000 | |
| | | | | Before | | | Net Cash | | | Tax Benefit | | | After | |
| | | | | Conversion(5) | | | Proceeds | | | and Other | | | Conversion | |
| 5. | | Pro Forma Assets | | | | | | | | | | | | |
| | | March 31, 2023 | | $ | 205,456,000 | | | $ | 4,948,000 | | | $ | 0 | | | $ | 210,404,000 | |
| (1) | Includes ESOP purchases of 8.0% of the second step offering. |
| (2) | Includes RRP purchases of 4.0% of the second step offering. |
| (3) | ESOP amortized over 15 years, RRP amortized over 5 years, tax effected at: 21.00% |
| (4) | Option valuation based on Black-Scholes model, 5 year vesting, and assuming 25% of the options are taxable. |
| (5) | Adjusted to reflect consolidation and reinvestment of net MHC assets. |
Exhibit IV-8
PRO FORMA EFFECT OF CONVERSION PROCEEDS
Gouverneur Bancorp, Inc.
At the Midpoint of the Range
| 1. | | Fully Converted Value and Exchange Ratio | | | | |
| | | Fully Converted Value | | $ | 13,025,610 | |
| | | Exchange Ratio | | | 0.62842 | |
| | | | | | | |
| | | 2nd Step Offering Proceeds | | $ | 8,500,000 | |
| | | Less: Estimated Offering Expenses | | | 1,410,000 | |
| | | 2nd Step Net Conversion Proceeds | | $ | 7,090,000 | |
| | | | | | | |
| | | | | | | |
| 2. | | Estimated Additional Income from Conversion Proceeds | | | | |
| | | | | | | |
| | | Net Conversion Proceeds | | $ | 7,090,000 | |
| | | Less: Cash Contribution to Foundation | | | 0 | |
| | | Less: ESOP Stock Purchases (1) | | | (680,000 | ) |
| | | Less: RRP Stock Purchases (2) | | | (340,000 | ) |
| | | Net Cash Proceeds | | $ | 6,070,000 | |
| | | Estimated after-tax net incremental rate of return | | | 2.84 | % |
| | | Earnings Increase | | $ | 172,631 | |
| | | Less: Consolidated interest cost of ESOP borrowings | | | 0 | |
| | | Less: Amortization of ESOP borrowings(3) | | | (35,813 | ) |
| | | Less: RRP Vesting (3) | | | (53,720 | ) |
| | | Less: Option Plan Vesting (4) | | | (79,732 | ) |
| | | Net Earnings Increase | | $ | 3,365 | |
| | | | | | | | Net | | | | |
| | | | | Before | | | Earnings | | | After | |
| | | | | Conversion(5) | | | Increase | | | Conversion | |
| 3. | | Pro Forma Earnings | | | | | | | | | |
| | | 12 Months ended March 31, 2023 (reported) | | $ | 747,394 | | | $ | 3,365 | | | $ | 750,760 | |
| | | 12 Months ended March 31, 2023 (core) | | $ | 775,394 | | | $ | 3,365 | | | $ | 778,760 | |
| | | | | Before | | | Net Cash | | | Tax Benefit | | | After | |
| | | | | Conversion (5) | | | Proceeds | | | of Foundation | | | Conversion | |
| 4. | | Pro Forma Net Worth | | | | | | | | | | | | |
| | | March 31, 2023 | | $ | 26,599,000 | | | $ | 6,070,000 | | | $ | 0 | | | $ | 32,669,000 | |
| | | March 31, 2023 (Tangible) | | $ | 20,332,000 | | | $ | 6,070,000 | | | $ | 0 | | | $ | 26,402,000 | |
| | | | | Before | | | Net Cash | | | Tax Benefit | | | After | |
| | | | | Conversion (5) | | | Proceeds | | | of Foundation | | | Conversion | |
| 5. | | Pro Forma Assets | | | | | | | | | | | | |
| | | March 31, 2023 | | $ | 205,456,000 | | | $ | 6,070,000 | | | $ | 0 | | | $ | 211,526,000 | |
| (1) | Includes ESOP purchases of 8.0% of the second step offering. |
| (2) | Includes RRP purchases of 4.0% of the second step offering. |
| (3) | ESOP amortized over 15 years, RRP amortized over 5 years, tax effected at: 21.00% |
| (4) | Option valuation based on Black-Scholes model, 5 year vesting, and assuming 25% of the options are taxable. |
| (5) | Adjusted to reflect consolidation and reinvestment of net MHC assets. |
Exhibit IV-8
PRO FORMA EFFECT OF CONVERSION PROCEEDS
Gouverneur Bancorp, Inc.
At the Maximum of the Range
| 1. | | Fully Converted Value and Exchange Ratio | | | | |
| | | Fully Converted Value | | $ | 14,979,450 | |
| | | Exchange Ratio | | | 0.72268 | |
| | | | | | | |
| | | 2nd Step Offering Proceeds | | $ | 9,775,000 | |
| | | Less: Estimated Offering Expenses | | | 1,410,000 | |
| | | 2nd Step Net Conversion Proceeds | | $ | 8,365,000 | |
| | | | | | | |
| | | | | | | |
| 2. | | Estimated Additional Income from Conversion Proceeds | | | | |
| | | | | | | |
| | | Net Conversion Proceeds | | $ | 8,365,000 | |
| | | Less: Cash Contribution to Foundation | | | 0 | |
| | | Less: ESOP Stock Purchases (1) | | | (782,000 | ) |
| | | Less: RRP Stock Purchases (2) | | | (391,000 | ) |
| | | Net Cash Proceeds | | $ | 7,192,000 | |
| | | Estimated after-tax net incremental rate of return | | | 2.84 | % |
| | | Earnings Increase | | $ | 204,540 | |
| | | Less: Consolidated interest cost of ESOP borrowings | | | 0 | |
| | | Less: Amortization of ESOP borrowings(3) | | | (41,185 | ) |
| | | Less: RRP Vesting (3) | | | (61,778 | ) |
| | | Less: Option Plan Vesting (4) | | | (91,692 | ) |
| | | Net Earnings Increase | | $ | 9,885 | |
| | | | | | | | Net | | | | |
| | | | | Before | | | Earnings | | | After | |
| | | | | Conversion(5) | | | Increase | | | Conversion | |
| 3. | | Pro Forma Earnings | | | | | | | | | |
| | | 12 Months ended March 31, 2023 (reported) | | $ | 747,394 | | | $ | 9,885 | | | $ | 757,280 | |
| | | 12 Months ended March 31, 2023 (core) | | $ | 775,394 | | | $ | 9,885 | | | $ | 785,280 | |
| | | | | Before | | | Net Cash | | | Tax Benefit | | | After | |
| | | | | Conversion (5) | | | Proceeds | | | of Foundation | | | Conversion | |
| 4. | | Pro Forma Net Worth | | | | | | | | | | | | |
| | | March 31, 2023 | | $ | 26,599,000 | | | $ | 7,192,000 | | | $ | 0 | | | $ | 33,791,000 | |
| | | March 31, 2023 (Tangible) | | $ | 20,332,000 | | | $ | 7,192,000 | | | $ | 0 | | | $ | 27,524,000 | |
| | | | | Before | | | Net Cash | | | Tax Benefit | | | After | |
| | | | | Conversion (5) | | | Proceeds | | | of Foundation | | | Conversion | |
| 5. | | Pro Forma Assets | | | | | | | | | | | | |
| | | March 31, 2023 | | $ | 205,456,000 | | | $ | 7,192,000 | | | $ | 0 | | | $ | 212,648,000 | |
| (1) | Includes ESOP purchases of 8.0% of the second step offering. |
| (2) | Includes RRP purchases of 4.0% of the second step offering. |
| (3) | ESOP amortized over 15 years, RRP amortized over 5 years, tax effected at: 21.00% |
| (4) | Option valuation based on Black-Scholes model, 5 year vesting, and assuming 25% of the options are taxable. |
| (5) | Adjusted to reflect consolidation and reinvestment of net MHC assets. |
EXHIBIT IV-9
Calculation of Minority Ownership Dilution in a Second-Step Offering
Exhibit IV-9
Gouverneur Bancorp, Inc.
Calculation of Minority Ownership Dilution in a Second-Step Offering
Stock Ownership Data as of March 31, 2023
Financial Data as of March 31, 2023
Reflects Pro Forma Market Value as of May 8, 2023
| Key Input Assumptions | | | | | | |
| | | | | | | |
| Mid-Tier Stockholders' Equity | | $ | 26,339,000 | | | (BOOK) |
| Aggregate Dividends Waived by MHC | | $ | 0 | | | (WAIVED DIVIDENDS) |
| Minority Ownership Interest | | | 35.4516 | % | | (PCT) |
| Pro Forma Market Value | | $ | 13,025,610 | | | (VALUE) |
| Market Value of MHC Assets (Other than Stock in Mid-Tier) | | $ | 260,000 | | | (MHC ASSETS) |
| Adjustment for MHC Assets & Waived Dividends - 2 Step Calculation (as required by FDIC & FRB) | | |
| | | | | | | | | | | |
| | | | | | | (BOOK - WAIVED DIVIDENDS) x PCT | | |
| Step 1: To Account for Waiver of Dividends | = | | BOOK | | |
| | | | | | | | | | | |
| | | | | = | | 35.4516% | | | | |
| | | | | | | | | | | |
| | | | | | | (VALUE - MHC ASSETS) x Step 1 | | |
| Step 2: To Account for MHC Assets | = | | VALUE | | |
| | | | | | | | | | | |
| | | | | = | | 34.7439% | (rounded) | | |
| Current Ownership | | | | | | | | |
| | | | | | | | | |
| MHC Shares | | | 1,311,222 | | | | 64.55 | % |
| Public Shares | | | 720,155 | | | | 35.45 | % |
| Total Shares | | | 2,031,377 | | | | 100.00 | % |
EXHIBIT V-1
RP® Financial, LC.
Firm Qualifications Statement

FIRM QUALIFICATION STATEMENT
RP® Financial (“RP®) provides financial and management consulting, merger advisory and valuation services to the financial services industry nationwide. We offer a broad array of services, high quality and prompt service, hands-on involvement by principals and senior staff, careful structuring of strategic initiatives and sophisticated valuation and other analyses consistent with industry practices and regulatory requirements. Our staff maintains extensive background in financial and management consulting, valuation and investment banking. Our clients include commercial banks, thrifts, credit unions, mortgage companies, insurance companies and other financial services companies.
STRATEGIC PLANNING SERVICES
RP®’s strategic planning services are designed to provide effective feasible plans with quantifiable results. We analyze strategic options to enhance shareholder value, achieve regulatory approval or realize other objectives. Such services involve conducting situation analyses; establishing mission/vision statements, developing strategic goals and objectives; and identifying strategies to enhance franchise and/or market value, capital management, earnings enhancement, operational matters and organizational issues. Strategic recommendations typically focus on: capital formation and management, asset/liability targets, profitability, return on equity and stock pricing. Our proprietary financial simulation models provide the basis for evaluating the impact of various strategies and assessing their feasibility and compatibility with regulations.
MERGER ADVISORY SERVICES
RP®’s merger advisory services include targeting potential buyers and sellers, assessing acquisition merit, conducting due diligence, negotiating and structuring merger transactions, preparing merger business plans and financial simulations, rendering fairness opinions, preparing mark-to-market analyses, valuing intangible assets and supporting the implementation of post-acquisition strategies. Our merger advisory services involve transactions of financially healthy companies and failed bank deals. RP® is also expert in de novo charters and shelf charters. Through financial simulations, comprehensive data bases, valuation proficiency and regulatory familiarity, RP®’s merger advisory services center on enhancing shareholder returns.
VALUATION SERVICES
RP®’s extensive valuation practice includes bank and thrift mergers, thrift mutual-to-stock conversions, goodwill impairment, insurance company demutualizations, ESOPs, subsidiary companies, merger accounting and other purposes. We are highly experienced in performing appraisals which conform to regulatory guidelines and appraisal standards. RP® is the nation’s leading valuation firm for thrift mutual-to-stock conversions, with appraised values ranging up to $4 billion.
OTHER CONSULTING SERVICES
RP® offers other consulting services including evaluating the impact of regulatory changes (TARP, etc.), branching and diversification strategies, feasibility studies and special research. We assist banks/thrifts in preparing CRA plans and evaluating wealth management activities on a de novo or merger basis. Our other consulting services are facilitated by proprietary valuation and financial simulation models.
KEY PERSONNEL (Years of Relevant Experience & Contact Information)
| Ronald S. Riggins, Managing Director (42) | | (703) 647-6543 | | rriggins@rpfinancial.com |
| William E. Pommerening, Managing Director (38) | | (703) 647-6546 | | wpommerening@rpfinancial.com |
| Gregory E. Dunn, Director (39) | | (703) 647-6548 | | gdunn@rpfinancial.com |
| James P. Hennessey, Director (35) | | (703) 647-6544 | | jhennessey@rpfinancial.com |
| James J. Oren, Director (35) | | (703) 647-6549 | | joren@rpfinancial.com |
| Washington Headquarters | | |
| 1311-A Dolley Madison Boulevard | | Telephone: (703) 528-1700 |
| Suite 2A | | Fax No.: (703) 528-1788 |
| McLean, VA 22101 | | Toll-Free No.: (866) 723-0594 |
| www.rpfinancial.com | | E-Mail: mail@rpfinancial.com |