Exhibit 96.3
TECHNICAL REPORT SUMMARY
FRAC SAND RESOURCES AND RESERVES
KERMIT AND MONAHANS MINES
Ward and Winkler Counties, Texas
Prepared For
ATLAS ENERGY SOLUTIONS, INC
Austin, Texas
By
John T. Boyd Company
Mining and Geological Consultants
Pittsburgh, Pennsylvania, USA

Report No. 3871.009
FEBRUARY 2024
| |

| John T. Boyd Company |
Mining and Geological Consultants |
| | |
Chairman James W. Boyd | February 22, 2024 File: 3871.009 |
President and CEO John T. Boyd II | |
Managing Director and COO Ronald L. Lewis | Atlas Energy Solutions, Inc 5918 W. Courtyard Drive, #500 Austin, TX 78730 |
| |
Vice Presidents Robert J. Farmer Jisheng (Jason) Han John L. Weiss Michael F. Wick William P. Wolf | Attention: | Mr. John Turner Chief Financial Officer |
Managing Director - Australia Jacques G. Steenekamp | Subject: | Technical Report Summary Frac Sand Resources and Reserves Kermit and Monahans Mines Ward and Winkler Counties, Texas |
Managing Director - China Rongjie (Jeff) Li | |
| Dear Sirs: |
Managing Director – South America | |
Carlos F. Barrera Pittsburgh 4000 Town Center Boulevard, Suite 300 Canonsburg, PA 15317 (724) 873-4400 (724) 873-4401 Fax jtboydp@jtboyd.com | This S-K 1300-compliant technical report summary provides the results of John T. Boyd Company’s (BOYD) independent estimate of the frac sand (proppant) resources and reserves for Atlas Energy Solutions, Inc.’s (Atlas) Kermit and Monahans mines as of December 31, 2023. |
Denver (303) 293-8988 jtboydd@jtboyd.com Brisbane 61 7 3232-5000 jtboydau@jtboyd.com Beijing 86 10 6500-5854 jtboydcn@jtboyd.com Bogota +57-3115382113 jtboydcol@jtboyd.com www.jtboyd.com | We wish to acknowledge the cooperation of Atlas’s management and staff for providing the technical, financial, and legal information used in completing this project. Our findings are based on BOYD’s extensive experience in preparing frac sand resource and reserve estimates used in US Securities and Exchange Commission (SEC) filings, and our knowledge of frac sand mining in Texas and throughout North America. Respectfully submitted, JOHN T. BOYD COMPANY By: 
John T. Boyd II President and CEO |
TABLE OF CONTENTS
| | | | |
| | | | Page |
| | | | |
LETTER OF TRANSMITTAL | |
| | |
TABLE OF CONTENTS | |
| | |
GLOSSARY AND ABBREVIATIONS | |
| | |
1.0 | EXECUTIVE SUMMARY | 1-1 |
| 1.1 | Introduction | 1-1 |
| 1.2 | Property Description and Control | 1-2 |
| 1.3 | Geology | 1-2 |
| 1.4 | Exploration | 1-5 |
| 1.5 | Frac Sand Reserves and Quality | 1-6 |
| 1.6 | Operations | 1-8 |
| | 1.6.1 | Mining | 1-8 |
| | 1.6.2 | Processing | 1-9 |
| | 1.6.3 | Infrastructure | 1-9 |
| 1.7 | Financial Analysis | 1-10 |
| | 1.7.1 | Market Analysis | 1-10 |
| | 1.7.2 | Sales, Production, and Cost Forecast | 1-11 |
| | 1.7.3 | Economic Analysis | 1-13 |
| 1.8 | Permitting and Compliance | 1-15 |
| 1.9 | Conclusions | 1-15 |
| | | | |
2.0 | INTRODUCTION | 2-1 |
| 2.1 | Registrant | 2-1 |
| 2.2 | Purpose and Terms of Reference | 2-1 |
| 2.3 | Expert Qualifications | 2-2 |
| 2.4 | Principal Sources of Information | 2-2 |
| | 2.4.1 | Personal Inspections | 2-3 |
| | 2.4.2 | Reliance on Information Provided by the Registrant | 2-4 |
| | 2.4.3 | Verification of Information | 2-4 |
| | 2.4.4 | Other Relevant Data and Information | 2-4 |
| 2.5 | Report Version | 2-5 |
| 2.6 | Units of Measure | 2-5 |
| | | | |
3.0 | PROPERTY OVERVIEW | 3-1 |
| 3.1 | Description and Location | 3-1 |
| | 3.1.1 | Kermit Mines | 3-1 |
| | 3.1.2 | Monahans Mine | 3-1 |
| 3.2 | History | 3-3 |
| 3.3 | Property Control | 3-3 |
| | 3.3.1 | Kermit Property | 3-5 |
| | 3.3.2 | Monahans Property | 3-5 |
TABLE OF CONTENTS - Continued
| | | | |
| | | | Page |
| | | | |
| 3.4 | Adjacent Properties | 3-5 |
| 3.5 | Regulation and Liabilities | 3-5 |
| 3.6 | Accessibility, Local Resources, and Infrastructure | 3-5 |
| | 3.6.1 | Kermit Property | 3-5 |
| | 3.6.2 | Monahans Property | 3-6 |
| 3.7 | Physiography | 3-6 |
| 3.8 | Climate | 3-7 |
| | | | |
4.0 | GEOLOGY | 4-1 |
| 4.1 | Regional Geology | 4-1 |
| 4.2 | Property Stratigraphy | 4-1 |
| | 4.2.1 | General Stratigraphy | 4-1 |
| | 4.2.2 | Structural Geology | 4-2 |
| | 4.2.3 | Frac Sand Geology | 4-3 |
| | | | |
5.0 | EXPLORATION DATA | 5-1 |
| 5.1 | Background | 5-1 |
| 5.2 | Exploration Procedures | 5-2 |
| | 5.2.1 | Drilling, Sampling, and Sample Security | 5-2 |
| | 5.2.2 | Frac Sand Testing | 5-4 |
| | 5.2.3 | Other Exploration Methods | 5-5 |
| 5.3 | Laboratory Testing Results | 5-6 |
| | 5.3.1 | Frac Sand Testing Overview | 5-6 |
| | 5.3.2 | Quality Summary | 5-11 |
| 5.4 | Data Verification | 5-12 |
| 5.5 | Adequacy of Exploration and Sampling Data | 5-12 |
| | | | |
6.0 | FRAC SAND RESOURCES AND RESERVES | 6-1 |
| 6.1 | Applicable Standards and Definitions | 6-1 |
| 6.2 | Frac Sand Resources | 6-2 |
| | 6.2.1 | Methodology | 6-2 |
| | 6.2.2 | Classification | 6-6 |
| | 6.2.3 | Estimation Criteria | 6-6 |
| | 6.2.4 | Frac Sand Exploration Results Areas | 6-7 |
| | 6.2.5 | Frac Sand Resource Estimates | 6-8 |
| | 6.2.6 | Validation | 6-8 |
| 6.3 | Frac Sand Reserves | 6-9 |
| | 6.3.1 | Methodology | 6-9 |
| | 6.3.2 | Classification | 6-9 |
| | 6.3.3 | Frac Sand Reserve Estimates | 6-9 |
| | 6.3.4 | Significant Risks and Uncertainties | 6-11 |
| | 6.3.5 | Reconciliation with Previous Estimates | 6-11 |
| | | | |
TABLE OF CONTENTS - Continued
| | | | |
| | | | Page |
| | | | |
7.0 | MINING OPERATIONS | 7-1 |
| 7.1 | Mining Method | 7-1 |
| 7.2 | Mine Schedule and Equipment | 7-1 |
| 7.3 | Mine Historical and Forecast Production | 7-2 |
| | 7.3.1 | Historical Mine Production | 7-2 |
| | 7.3.2 | Forecasted Production | 7-2 |
| 7.4 | Mine Plan (Life-of-Mine) | 7-3 |
| | 7.4.1 | Kermit Mines | 7-3 |
| | 7.4.2 | Monahans Mine | 7-3 |
| | 7.4.3 | Mining Risk | 7-6 |
| | | | |
8.0 | PROCESSING OPERATIONS | 8-1 |
| 8.1 | Overview | 8-1 |
| 8.2 | Wet Process Plants | 8-2 |
| 8.3 | Dry Process Plants | 8-2 |
| 8.4 | Product Storage/Truck Loadouts | 8-3 |
| | | | |
9.0 | MINE INFRASTRUCTURE | 9-1 |
| 9.1 | Overview | 9-1 |
| 9.2 | Transportation | 9-1 |
| 9.3 | Utilities (Power and Natural Gas) | 9-1 |
| 9.4 | Process Water | 9-1 |
| 9.5 | Tailings Disposal | 9-2 |
| 9.6 | Other Infrastructure | 9-2 |
| | | | |
10.0 | MARKET ANALYSIS | 10-1 |
| | | | |
11.0 | CAPITAL, REVENUES, AND OPERATING COSTS | 11-1 |
| 11.1 | Introduction | 11-1 |
| 11.2 | Kermit Mines | 11-1 |
| | 11.2.1 | Historical Capital Expenditures | 11-1 |
| | 11.2.2 | Historical Revenues and Sales | 11-1 |
| | 11.2.3 | Historical Cost of Production | 11-2 |
| | 11.2.4 | Projected Production, Sales, and Costs | 11-2 |
| 11.3 | Monahans Mine | 11-3 |
| | 11.3.1 | Historical Capital Expenditures | 11-3 |
| | 11.3.2 | Historical Revenues and Sales | 11-3 |
| | 11.3.3 | Historical Cash Operating Costs | 11-4 |
| | 11.3.4 | Projected Production, Sales, and Costs | 11-4 |
| | | | |
12.0 | ECONOMIC ANALYSIS | 12-1 |
| 12.1 | Introduction | 12-1 |
| 12.2 | Kermit Mines | 12-2 |
| | 12.2.1 | Economic Analysis | 12-2 |
| | 12.2.2 | Cash Flow Analysis | 12-2 |
| | 12.2.3 | Sensitivity Analyses | 12-4 |
| 12.3 | Monahans Mine | 12-5 |
| | 12.3.1 | Economic Analysis | 12-5 |
| | 12.3.2 | Cash Flow Analysis | 12-5 |
TABLE OF CONTENTS - Continued
| | | | |
| | | | Page |
| | | | |
| | 12.3.3 | Sensitivity Analyses | 12-7 |
| | | | |
13.0 | PERMITTING AND COMPLIANCE | 13-1 |
| 13.1 | Permitting Requirements and Status | 13-1 |
| 13.2 | Environmental Studies | 13-1 |
| 13.3 | Waste Disposal and Water Management | 13-2 |
| 13.4 | Compliance | 13-2 |
| 13.5 | Plans, Negotiations, or Agreements | 13-2 |
| 13.6 | Post-Mining Land Use and Reclamation | 13-2 |
| 13.7 | Local Procurement and Hiring | 13-3 |
| | | | |
14.0 | INTERPRETATION AND CONCLUSIONS | 14-1 |
| 14.1 | Findings | 14-1 |
| 14.2 | Significant Risks and Uncertainties | 14-1 |
| 14.3 | Recommendations | 14-2 |
TABLE OF CONTENTS - Continued
| | | |
| | | Page |
List of Tables | | |
1.1 | Kermit and Monahans Drilling Campaign Summary | 1-5 |
1.2 | Atlas Energy Solutions Reserves (As of December 31, 2023) | 1-7 |
1.3 | Atlas Energy Solutions Resources (As of December 31, 2023) | 1-7 |
1.4 | Proppant Characteristic Test Results for Kermit and Monahans Mines | 1-8 |
1.5 | Kermit Mines’ Sales Projections | 1-12 |
1.6 | Kermit Mines’ Annual Cash Cost of Production Projections | 1-12 |
1.7 | Monahans Mine’s Sales Projections | 1-12 |
1.8 | Monahans Mine’s Annual Cash Cost of Production Projections | 1-13 |
1.9 | Kermit Mines’ Five-Year Cash Flow Summary | 1-13 |
1.10 | Kermit Mines’ DCF-NPV Analysis | 1-14 |
1.11 | Monahans Mine’s Five-Year Cash Flow Summary | 1-14 |
1.12 | Monahans Mine’s DCF-NPV Analysis | 1-14 |
5.1 | Kermit and Monahans Drilling Campaign Summary | 5-4 |
5.2 | Particle Size Distribution | 5-6 |
5.3 | Proppant Characteristic Test Results for Kermit and Monahans Mines | 5-12 |
6.1 | Kermit and Monahans Frac Sand Resource Classification Criteria | 6-6 |
6.2 | Exploration Results Area Deposit Characteristics, Monahans Property | 6-8 |
6.3 | In-Place Frac Sand Resources as of December 31, 2023 | 6-8 |
6.4 | Frac Sand Reserves as of December 31, 2023 | 6-10 |
7.1 | Historic ROM Sand Production (000 tons) | 7-2 |
7.2 | Forecasted ROM Sand Production (000 tons) | 7-2 |
11.1 | Kermit Mines’ Historical Capital Expenditures | 11-1 |
11.2 | Kermit Mines’ Historical Sales | 11-1 |
11.3 | Kermit Mines’ Historical Cost of Production | 11-2 |
11.4 | Kermit Mines’ Sales Projections | 11-2 |
11.5 | Kermit Mines’ Cash Cost of Production Projection | 11-3 |
11.6 | Monahans Mine’s Historical Capital Expenditures | 11-3 |
11.7 | Monahans Mine’s Historical Sales | 11-3 |
11.8 | Monahans Mine’s Historical Cost of Production | 11-4 |
11.9 | Monahans Mine’s Sales Projections | 11-4 |
11.10 | Monahans Mine’s Cash Cost of Production Projections | 11-5 |
12.1 | Kermit Mines’ Five-Year Cash Flow Summary | 12-2 |
12.2 | Kermit Mines’ DCF-NPV Analysis | 12-2 |
12.3 | Pre-Tax And After-Tax Cash Flow Analysis, Kermit Mines | 12-3 |
12.4 | Price Adjustments for Sensitivity Analysis | 12-4 |
12.5 | Sensitivity of Kermit Mines’ After-Tax DCF-NPV at 10% | 12-4 |
12.6 | Monahans Mine’s Five-Year Cash Flow Summary | 12-5 |
12.7 | Monahans Mine’s DCF-NPV Analysis | 12-5 |
12.8 | Pre-Tax And After-Tax Cash Flow Analysis, Monahans Mine | 12-6 |
12.9 | Price Adjustments for Sensitivity Analysis | 12-7 |
12.10 | Sensitivity of Monahans Mine’s After-Tax DCF-NPV at 10% | 12-7 |
13.1 | Permit/Registration Summary | 13-1 |
TABLE OF CONTENTS - Continued
| | | |
| | | Page |
List of Figures | | |
1.1 | General Location Map Showing Kermit and Monahans Mines | 1-4 |
1.2 | Permian Basin HZ Permit Submissions | 1-10 |
1.3 | Oil Production (bbl/d) | 1-11 |
3.1 | Map Showing General Layout of the Kermit Mines | 3-2 |
3.2 | Map Showing General Layout of the Monahans Mine | 3-4 |
4.1 | Generalized Stratigraphic Chart, Surficial Deposits of Ward and Winkler Counties, TX | 4-2 |
4.2 | Cross Section A-A’, Kermit Mines | 4-3 |
4.3 | Cross Section B-B’, Monahans Mine | 4-4 |
4.4 | Stratigraphic Columns of Drill Holes AT1-18-54 and AT2-17-51 Kermit and
Monahans Mines | 4-5 |
5.1 | Drill Hole Sand Sample | 5-3 |
5.2 | Map Showing In-Place Frac Sand Isopleths (%) 40/70 Mesh Material Kermit Mines | 5-7 |
5.3 | Map Showing In-Place Frac Sand Isopleths (%) 70/140 Mesh Material
Kermit Mines | 5-8 |
5.4 | Map Showing In-Place Frac Sand Isopleths (%) 40/70 Mesh Material Monahans Mine | 5-9 |
5.5 | Map Showing In-Place Frac Sand Isopleths (%) 70/140 Mesh Material Monahans Mine | 5-10 |
6.1 | Relationship Between Frac Sand Resources and Frac Sand Reserves | 6-2 |
6.2 | Map Showing Frac Sand Mineable Thickness Isopachs, Kermit Mines | 6-4 |
6.3 | Map Showing Frac Sand Mineable Thickness Isopachs, Monahans Mine | 6-5 |
6.4 | Kermit Reconciliation with Previous Frac Sand Reserves Estimate | 6-11 |
6.5 | Monahans Reconciliation with Previous Frac Sand Reserves Estimate | 6-12 |
7.1 | Kermit Mines’ Dredge Pond | 7-1 |
7.2 | Map Showing Life of Mine Plan Kermit Mines | 7-4 |
7.3 | Map Showing Life of Mine Plan Monahans Mine | 7-5 |
8.1 | General Arrangement Layout of Atlas Processing Plants | 8-2 |
8.2 | Kermit Plant with Capacity Expansion | 8-3 |
8.3 | Monahans Plant with Truck Loadouts | 8-4 |
10.1 | WTI Crude Oil CME Futures Price | 10-2 |
10.2 | U.S. Global Horizontal Drilling Permits by Region and Type | 10-3 |
10.3 | Permian Region Horizontal Drilling Permits by Type | 10-3 |
10.4 | U.S. Horizontal Drilling Permits | 10-4 |
10.5 | Oil Production (bbl/d) | 10-5 |
10.6 | Natural Gas Production (Mcf/d) | 10-5 |
10.7 | U.S. Drilled but Uncompleted Wells (DUC) | 10-6 |
10.8 | Permian Drilled but Uncompleted Wells (DUC) | 10-6 |
10.9 | All U.S. Regions Mine Hours (Quarterly) | 10-7 |
10.10 | Permian Wide In-Basin Mine Hours (Quarterly) | 10-7 |
|
GLOSSARY OF ABBREVIATIONS AND DEFINITIONS |
| | |
$ | : | US dollar(s) |
% | : | Percent or percentage |
Atlas | : | Atlas Energy Solutions, Inc. |
API | : | American Petroleum Institute |
BOYD | : | John T. Boyd Company |
CapEx | : | Capital expenditures |
CCAA | : | Candidate Conservation Agreement with Assurances |
COGS | : | Cost of goods sold |
Constant Dollar | : | A monetary measure that is not influenced by inflation and used to compare time periods. Sometimes referred to as “real dollars”. |
CY | : | Cubic yards |
DCF | : | Discounted Cash Flow |
Discount Rate | : | A rate of return used to discount future cash flows based on the return investors expect to receive from their investment. |
DSL | : | Dunes sagebrush lizard (Sceloporus arenicolus) |
DUC | : | Drilled but uncompleted gas or oil well. |
FOB | : | Free-on-Board |
Frac Sand | : | Frac sand is a naturally occurring, high silica content quartz sand, with grains that are generally well rounded and exhibit high compressive strength characteristics relative to other silica sand. It is utilized as a prop or “proppant” in unconventional shale frac well completions. |
Frac Sand
Resource | : | Frac sand resource is a concentration or occurrence of sand material of economic interest in or on the Earth’s crust in such form, grade or quality, and quantity that there are reasonable prospects for economic extraction. A mineral resource is a reasonable estimate of mineralization, taking into account relevant factors such as quality specifications, likely mining dimensions, location or continuity, that, with the assumed and justifiable technical and economic conditions, is likely to, in whole or in part, become economically extractable. It is not merely an inventory of all mineralization drilled or sampled. |
| | |
| | |
Frac Sand
Reserve | : | Frac sand reserve is an estimate of tonnage and grade or quality of mineral resources that, in the opinion of the qualified person, can be the basis of an economically viable project. More specifically, it is the economically mineable part of a mineral resource, which includes diluting materials and allowances for losses that may occur when the material is mined or extracted. |
gpm | : | Gallons per minute |
Indicated Sand
Resource | : | An Indicated Sand Resource is that part of a Sand Resource for which quantity, grade or quality, densities, shape, and physical characteristics are estimated with sufficient confidence to allow the application of Modifying Factors in sufficient detail to support mine planning and evaluation of the economic viability of the deposit. Geological evidence is derived from adequately detailed and reliable exploration, sampling and testing, and is sufficient to assume geological and grade or quality continuity between points of observation. An Indicated Sand Resource has a lower level of confidence than that applying to a Measured Sand Resource and may only be converted to a Probable Sand Reserve. |
IRR | : | Internal rate-of-return |
ISO | : | International Organization for Standardization |
lb | : | Pound |
LOM | : | Life-of-Mine |
Measured Sand
Resource | : | A Measured Sand Resource is that part of a Sand Resource for which quantity, grade or quality, densities, shape, and physical characteristics are estimated with confidence sufficient to allow the application of Modifying Factors to support detailed mine planning and final evaluation of the economic viability of the deposit. Geological evidence is derived from detailed and reliable exploration, sampling, and testing and is sufficient to confirm geological and grade or quality continuity between points of observation. A Measured Sand Resource has a higher level of confidence than that applying to either an Indicated Sand Resource or an Inferred Sand Resource. It may be converted to a Proven Sand Reserve or to a Probable Sand Reserve. |
Mesh | : | A measurement of particle size often used in determining the size distribution of granular material. |
Mineral Reserve | : | See “Frac Sand Reserve” |
| | |
Mineral Resource | : | See “Frac Sand Resource” |
Modifying Factors | : | The factors that a qualified person must apply to indicated and measured sand resources and then evaluate to establish the economic viability of sand reserves. A qualified person must apply and evaluate modifying factors to convert measured and indicated resources to proven and probable reserves. These factors include, but are not restricted to: mining; processing; metallurgical; infrastructure; economic; marketing; legal; environmental compliance; plans, negotiations, or agreements with local individuals or groups; and governmental factors. The number, type and specific characteristics of the modifying factors applied will necessarily be a function of and depend upon the mineral, mine, property, or project. |
Mscf | : | Thousand standard cubic feet per day |
MSHA | : | Mine Safety and Health Administration. A division of the U.S. Department of Labor. |
NOAA | : | National Oceanic and Atmospheric Administration |
NSR | : | New Source Review |
NTU | : | Nephelometric turbidity units |
NPV | : | Net Present Value |
| | |
Permian Basin | : | A large sedimentary shale basin in the southwestern part of the United States in mainly Texas and New Mexico. The basin produces approximately 6 million barrels per day of oil and holds some of the largest oil and gas reserves in the world. |
Probable Sand
Reserve | : | A Probable Sand Reserve is the economically mineable part of an Indicated and, in some circumstances, a Measured Sand Resource. The confidence in the Modifying Factors applying to a Probable Sand Reserve is lower than that applying to a Proven Sand Reserve. |
Proppant Sand | : | See “Frac Sand” |
Proven Sand
Reserve | : | A Proven Mineral Reserve is the economically mineable part of a Measured Sand Resource. A Proven Sand Reserve implies a high degree of confidence in the Modifying Factors. |
PSI | : | Pounds per square inch |
| | |
ROM | : | Run-of-Mine. The as-mined including in-seam clay partings mined with the sand, and out-of-seam dilution. |
Rotosonic Drilling | : | A type of core drilling combining rotary drilling with ultrasonic frequency to drill through loosely consolidated soil and rock. |
SEC | : | U.S. Securities and Exchange Commission |
S-K 1300 | : | Subpart 1300 and Item 601(b)(96) of the U.S. Securities and Exchange Commission’s Regulation S-K |
S&S | : | The Sealey and Smith Foundation |
Surficial | : | Relating to the earths surface or the geology that is on the surface. |
TCEQ | : | Texas Commission on Environmental Quality |
Ton | : | Short Ton. A unit of weight equal to 2,000 pounds |
tph | : | Tons per Hour |
Westward | : | Westward Environmental Inc |
1.0 EXECUTIVE SUMMARY
BOYD was retained by Atlas to complete an updated independent technical audit of mineral resource and mineral reserve estimates—hereafter referred to as frac sand resource and frac sand reserve estimates—for their active mining and processing operations located near Kermit, Texas (the “Kermit Mines”) and Monahans, Texas (the “Monahans Mine”). Throughout the report, the Kermit and Monahans mines may also be referred to as the Kermit and Monahans “operations”, “plants”, “properties”, or “facilities”. This report summarizes the results of our resource and reserve estimation and satisfies the requirements for Atlas’s disclosure of frac sand resources and reserves set forth in Subpart 1300 and Item 601(b)(96) of the SEC’s Regulation S-K (S-K 1300).
This update was requested by Atlas to replace BOYD’s original Technical Report Summary (TRS) for their Kermit and Monahans mines (BOYD Report No.: 3871.006), as Atlas has made the following material updates: (1) expanded their Kermit production capacity in 2023 by adding a new mining and processing facility with 5.5 million tons of annual production capacity, for a combined total production capacity at Kermit of 11.0 million tons per year, (2) converted significant portions of the Kermit Mines’ frac sand resources to frac sand reserves by revising the extents of the mine plans to support the expanded production capacity, and (3) continued construction of their Dune Express, a 42-mile long electric conveyor system that originates at the Kermit Mines and ends in New Mexico.
BOYD’s findings are based on our detailed examination of the supporting geologic, technical, and economic information obtained from: (1) Atlas provided files, (2) discussions with Atlas personnel, (3) records on file with regulatory agencies, (4) public sources, and (5) nonconfidential BOYD files. Our analysis was performed to obtain reasonable assurance that Atlas’s frac sand resource and reserve statements are free from material misstatement. This report provides an independent estimate of the frac sand resources and reserves underlying the Kermit and Monahans controlled properties.
This report provides a summary of the material technical and scientific information for the subject mining properties. The Economic Analysis and resulting Net Present Value (NPV) estimate in this report were made for the purpose of confirming the economic viability of the reported sand reserves and not for the purpose of valuing Atlas or its assets. Internal Rate of Return (IRR) and project payback were not calculated, as there was no initial investment considered in the financial model.
Weights and measurements are expressed in US customary units. Unless noted, the effective date of the information, including estimates of frac sand reserves, is December 31, 2023.
1.2.Property Description and Control
From mid-2018 through late-2023, Atlas operated one mining and processing facility at Kermit and one at Monahans. The combined total production capacity of these two operations was 11 million tons of finished frac sand per year. In response to the increase in market demand, and also in connection with the expansion of their logistics offerings, Atlas expanded their Kermit production capacity in 2023 by adding a new mining and processing facility with 5.5 million tons of annual production capacity. By the end of 2023, Atlas operated three mining and processing facilities with a combined total production capacity of 16.5 million tons annually.
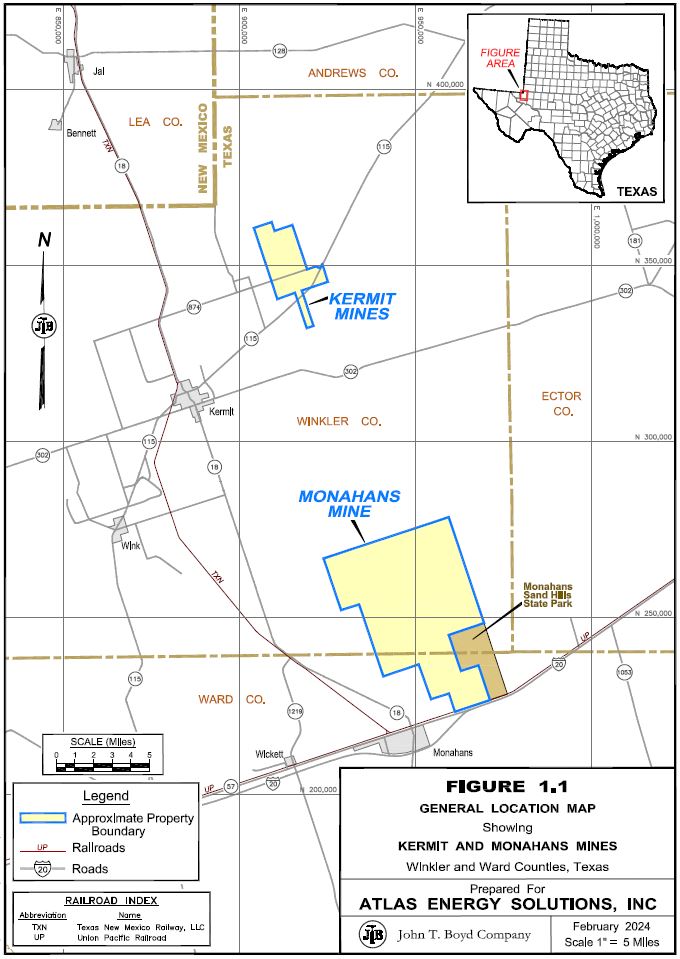
The Kermit Mines, in Winkler County, Texas, are located approximately seven miles northeast of the town of Kermit and are surface frac sand mining and processing facilities, located on approximately 5,826 “gross” acres (the “Kermit Property”) of which 5,341 “net” acres are controlled (leases and fee-owned). After applying requisite mining setbacks and observing any easements and/or rights-of-way, approximately 4,521 acres (or 78% of the property) have been explored and are considered as either mineable frac sand resources or frac sand reserves.
Atlas owns a portion of the Kermit Property in fee (including the property on which the Kermit Mines are located). The remaining land is leased from various parties, and Atlas pays either a royalty or delay rental to the lessors to retain the leased properties.
The Monahans Mine, in Ward and Winkler counties, Texas, is located approximately three miles northeast of the town of Monahans and is a surface frac sand mining and processing facility, located on approximately 32,224 “gross” acres (the “Monahans Property”) which is entirely leased by Atlas. After applying requisite mining offsets, a total area covering approximately 11,187 acres (or 35%) of the Monahans Property has been explored with sufficient drilling and sampling to be considered, as of the date of this report, frac sand resources or frac sand reserves. Atlas has also completed a reconnaissance-level of exploration drilling and sampling work on an additional 9,575 acres (or an additional 30%) outside of the resource and reserve areas of the Monahans Property. This “exploration target” area has been drilled with a wider spacing (or less density) than the aforementioned frac sand resource and reserve areas; however, drilling and testing indicates these portions of the deposit exhibit similar characteristics, both in thickness and frac sand quality, to the reported frac sand resources and reserves. The general location of the subject mines is provided in Figure 1.1, following this page.
Frac sand is a naturally occurring, high silica content quartz sand with grains that are generally well-rounded and monocrystalline. The main difference between frac sand and other sands is that frac sand grains are relatively pure in composition, consisting almost entirely of quartz; other sands have numerous impurities that may be cemented to the quartz grains. The pure quartz composition of frac sand grains, along with being well‑rounded and spherical in shape, gives these sands the characteristics (crush strength, high acid solubility, low turbidity) that are sought after by oil and gas producers for use in developing wells.
Surficial geologic units overlying the properties and surrounding areas are predominantly Quaternary age unconsolidated deposits, ranging from windblown dunes and sheet sands to alluvial sands, silts, clays, and caliche. The Llano Estacado Caprock Escarpment marks the eastern-most extent of the surficial sand deposits. Winds transporting particles into the area are thought to have collided with the escarpment, slowing their velocity and dropping particles out of suspension where they have accumulated over time. Winnowing processes have caused some degree of particle sorting to occur. Due to the mechanisms and long distances of particle transport, sand grains were abraded and rounded as they reached their current locations. Quaternary unconsolidated deposition covers nearly all of the subject properties, with the surficial deposits on Atlas’s properties noted as generally ranging from 60-ft to over 100-ft in thickness. Both the Kermit and Monahans properties contain no discernable overburden materials except for sparse areas of vegetation and roots that are removed during processing and are mineable from the surface down to the total defined depth of the deposits. Data from extensive crush testing along with the API RP-19C/ISO 13503-2 (API/ISO) testing performed on the composite samples by Atlas indicate little variability within the overall mineable deposits on each property.
Atlas contracted Westward Environmental, Inc. (Westward) to perform a series of drilling and sampling programs on the Kermit and Monahans properties, which occurred from June 2017 through September 2021.
The drilling and sampling programs were executed in an equivalent manner on each property as Westward supervised the field work and sampled each hole. Holes were drilled using a rotosonic drill rig, and each hole was sampled on 5-ft increments from the surface on the initial exploration drill programs and 10-ft increments on the follow up infill drilling programs. Westward geologists and geological technicians determined the terminus of the sampling interval of a hole, as drilling would be stopped when the amount of sand in a recovered interval was neither the first nor second most abundant material present in a given sample interval. All drilled intervals were geologically logged, photographed, and sampled in duplicate. One set of samples was retained by Atlas for archival purposes, while the other set of samples was sent to a lab for grain size analyses and proppant sand quality testing.
In 2017, an initial drilling and sampling program utilized widely spaced exploration drill holes, with nominal spacing of 3,000-ft to 4,500-ft between drill holes (one hole drilled per section of controlled property), in order to determine the depth and lateral extent of the sand deposits across the Kermit and Monahans properties. This phase of work resulted in 36 drill holes being drilled and sampled on the Kermit Property, and 53 drill holes being drilled and sampled on the Monahans Property. Sample analyses were performed by PropTester in Cyprus, Texas and FracTAL in St. Paul, Minnesota.
An infill drilling program was subsequently initiated in March 2018 to increase geologic confidence on each of the subject properties. This campaign consisted of completing an additional 25 drill holes on the Kermit Property and 27 drill holes on the Monahans Property. Upon completion of the infill drilling programs, each property had been drilled to a nominal 1,500-ft spacing within their respective initial mining areas, which provided enough geoscientific information to classify the infill drilled areas as Proven and Probable Reserves.
Most recently, Atlas retained BOYD to design a 2021 infill drilling and sampling campaign over select areas of the Kermit Property. This campaign was completed as Atlas considered constructing a second mine on the Kermit Property, increasing the existing frac sand reserve base of Kermit by approximately 3.5 sections of land (over 2,200 acres). An additional 26 drill holes were completed in late September 2021, following the same procedures undertaken during the first two campaigns.
A summary of all drilling completed to date on the Kermit and Monahans properties is included in Table 1.1.
| | | | | | | | |
Table 1.1: Kermit and Monahans Drilling Campaign Summary |
| | Rotosonic Drill Holes Completed |
| | By Drilling Campaign |
| | 2017 | | 2018 | | 2021 | | Total |
Kermit Property | | 36 | | 25 | | 26 | | 87 |
Monahans Property | | 53 | | 27 | | - | | 80 |
Total | | 89 | | 52 | | 26 | | 167 |
1.5.Frac Sand Reserves and Quality
This technical report summary provides an estimate of frac sand reserves for Atlas’s Kermit and Monahans mines in accordance with the requirements set forth in S-K 1300. These estimates were independently prepared by BOYD utilizing relevant mining, processing, economic (including independent estimates of capital, revenue, and cost), marketing, legal, environmental, socio-economic, and regulatory factors for each operation.
Estimates of mineral resources and reserves are always subject to a degree of uncertainty. The level of confidence that can be applied to a particular estimate is a function of, among other things: the amount, quality, and completeness of exploration data; the geological complexity of the deposit; and economic, legal, social, and environmental factors associated with mining the resource/reserve. BOYD used the definitions provided in S-K 1300 to describe the varying degree of certainty associated with the estimates reported here.
Estimates of frac sand resources are subdivided to reflect the different levels of geological confidence into measured (highest geological confidence), indicated, and inferred (lowest geological assurance). Upon application of modifying factors that include adjustments for mining loss, processing loss, and economic factors, a measured resource may be converted to either a proven or probable reserve, while an indicated resource may only be converted to a probable reserve. An inferred resource may not be converted to a reserve without further exploration, due to the lower level of geological confidence.
A mineral reserve is the economically mineable part of a measured or indicated mineral resource, which includes diluting materials and allowances for losses that may occur when the material is mined or extracted. Estimates of mineral reserves are subdivided to reflect geologic confidence, and potential uncertainties in the modifying factors, into proven (highest assurance) and probable.
In this report, the term “frac sand reserves” represents the tonnage and quality of product sand that will be available for sale after washing and drying the run-of-mine (ROM) sand. When material variations in thickness, depth, and/or sand quality occur between drill holes, the allowable spacing distance is reduced. The following drill hole spacing criteria were determined by the Qualified Person and used in this report to define the sand resources within Atlas’s properties:
| | |
| | Spacing Requirement (ft) |
Classification | | (Nominal Maximum) |
Measured | | 1,500 |
Indicated | | 2,500 |
Inferred | | 5,000 |
BOYD’s estimate of frac sand reserves for the Kermit and Monahans mines as of December 31, 2023, total 488.1 million tons of saleable product (i.e., greater than 140 mesh and less than 40 mesh in size). There are 337.6 million tons underlying the Kermit Property and 150.5 million tons underlying the Monahans Property.
Table 1.2 presents the estimated frac sand reserves by product mesh size, reserve classification, and mineral ownership status for the Kermit and Monahans mines:
| | | | | | | | | | | | | | | | | | |
| | Table 1.2: Atlas Energy Solutions Reserves (As of December 31, 2023) |
| | Tons (000) By Classification and Mesh Size |
| | Proven | | Probable | | Total By Mesh Size |
Control | | 40/70 | | 70/140 | | Total | | 40/70 | | 70/140 | | Total | | 40/70 | | 70/140 | | Total |
Kermit Mines |
Owned | | 81,869 | | 67,718 | | 149,587 | | 254 | | 317 | | 571 | | 82,123 | | 68,035 | | 150,158 |
Leased | | 70,709 | | 80,410 | | 151,119 | | 16,215 | | 20,066 | | 36,281 | | 86,924 | | 100,476 | | 187,400 |
Total | | 152,578 | | 148,128 | | 300,706 | | 16,469 | | 20,383 | | 36,852 | | 169,047 | | 168,511 | | 337,558 |
Monahans Mine |
Leased | | 90,294 | | 58,000 | | 148,294 | | 1,372 | | 819 | | 2,191 | | 91,666 | | 58,819 | | 150,485 |
Projecting sales volumes of approximately 10.5 million tons per year, the expected life of the Kermit Mines’ frac sand reserves are approximately 31 years. Likewise, at projected sales volumes of 5.0 million tons per year, the expected life of the Monahans Mine’s frac sand reserves is approximately 29 years.
Additional in-place frac sand resources consist of: 1) measured and indicated resources that have not been formally included in mine plans by Atlas, and 2) inferred resources in areas that generally need additional exploration drilling and sampling to classify them as measured or indicated resources. These resources are estimated at 1.4 billion tons—including 170.5 million tons at the Kermit Mines and 1.3 billion tons at the Monahans Mine—and represent the in-place material prior to applying any mining and processing losses. Table 1.3 presents the estimated in-place frac sand resources, exclusive of those frac sand resources already converted to frac sand reserves, for the Kermit and Monahans mines:
| | | | | | | | | | |
Table 1.3: Atlas Energy Solutions Resources (As of December 31, 2023) |
Resource | | | | Average
Sand | | Estimated In-Place Frac Sand Tons (000) |
Category | | Acres | | Thick (ft) | | Owned | | Leased | | Total |
Kermit Mines |
Measured | | 165 | | | | 2,750 | | 16,636 | | 19,386 |
Indicated | | 460 | | | | 563 | | 75,515 | | 76,078 |
Inferred | | 800 | | | | - | | 75,076 | | 75,076 |
Total | | 1,425 | | 74 | | 3,313 | | 167,227 | | 170,540 |
Monahans Mine |
Measured | | 487 | | | | - | | 71,730 | | 71,730 |
Indicated | | 785 | | | | - | | 102,755 | | 102,755 |
Inferred | | 8,908 | | | | - | | 1,094,030 | | 1,094,030 |
Total | | 10,180 | | 57 | | - | | 1,268,515 | | 1,268,515 |
PropTester performed API/ISO tests on composite samples created from sample material collected during the drilling programs on the Kermit and Monahans properties. A composite of the entire length of each selected hole was created, and for each composite sample, the testing labs created 40/70 mesh and 40/140 mesh product samples which were subjected to the full suite of API/ISO proppant sand tests.
Overall, this extensive testing indicates that a relatively uniform range of crush values exist through the entire depth of the deposit, except for one or two intervals where the caliche interval was not completely removed before performing the crush tests. These caliche intervals were about 1,000 psi less than all other intervals, and as such were not included in the summary quality data.
Combining the extensive crush testing conducted with the API/ISO testing performed on the composite samples, Atlas has completed a comprehensive review of grain characteristics for each of the reserve areas within each property. The data indicate little variability within the overall mineable deposit on each property.
Sample testing results are summarized in Table 1.4 below for each product size analyzed within each property:
| | | | | | | | | | |
| | Table 1.4: Proppant Characteristic Test Results for Kermit and Monahans Mines |
| | Average API/ISO Test Results By Product Size and Mine |
| | 40/70 mesh | | 40/140 mesh(1)(2) |
| | | | | | Recommended | | | | |
Test | | Kermit | | Monahans | | Specification | | Kermit | | Monahans |
Sphericity | | 0.7 | | 0.7 | | > 0.6 | | 0.7 | | 0.7 |
Roundness | | 0.8 | | 0.7 | | > 0.6 | | 0.7 | | 0.7 |
Acid Solubility (%) | | 1.1 | | 0.9 | | < 3.0 | | 2.6 | | 1.6 |
Turbidity (NTU) | | 15.0 | | 7.0 | | < 250 | | 15.0 | | 13.0 |
K-Value (000 psi) | | 7 - 8 | | 7 - 8 | | - | | 10 - 11 | | 10 - 11 |
(1)100 mesh proppant sand material currently does not have and API/ISO specification.
(2)test results were for a single 40/140 mesh product.
The extent to which the frac sand reserves may be affected by any known geological, operational, environmental, permitting, legal, title, variation, socio-economic, marketing, political, or other relevant issues has been reviewed as warranted. It is the opinion of BOYD that Atlas has appropriately mitigated, or has the operational acumen to mitigate, the risks associated with these factors. BOYD is not aware of any additional risks that could materially affect the development of the frac sand reserves.
Based on our independent estimate and operations review, we have a high degree of confidence that the estimates shown in this report accurately represent the available frac sand reserves controlled by Atlas, as of December 31, 2023.
The Kermit and the Monahans mines employ dredging as the primary sand extraction method. Most of the mineable areas at each property have minimal overburden and vegetation; as such, sand excavation normally begins at the surface throughout most of the mine plan area. The water forming the dredge ponds is sourced from a shallow aquifer which lies below each property. The dredge is a floating barge that lowers an arm or “ladder” with an attached submersible pump to the bottom of the deposit. Sand is pumped through poly pipe to the mine skid where waste material is removed. The sand is then further pumped to the wet plant with tailings and excess water returning to the dredge pit. All three mines operate continuously 24 hours a day, seven days a week. Conceptual mine plans with sequencing are illustrated in Chapter 7 of this report for the subject mine sites.
The first Kermit processing facility was commissioned in July 2018 with a nameplate capacity of 5.5 million tons per year of finished product, and a second Kermit processing facility was constructed in 2023, increasing total nameplate capacity at Kermit to 11 million tons per year. The Monahans processing facility was commissioned in October 2018 with a nameplate capacity of approximately 5.5 million tons per year of finished product. The Kermit and Monahans operations predominantly produce 40/70 mesh and 40/140 mesh frac sand. Since the commissioning of the wet plants in 2018 through the end of 2023, the recorded process yield for the plants is approximately 90%. That is, for every 100 tons of ROM material fed into the plant, 90 tons of saleable frac sand is produced. It should be noted that these achieved process yields are slightly different than the overall process yields used to estimate the frac sand resources and reserves which are based on the results of drill hole sample testing at each property.
Once the material has been mined from the pit, it proceeds to the processing plants as follows:
•Wet Process Plant- ROM material from the dredge is pumped to the wet plant and the greater than 40 mesh and less than 140 mesh sand and silt material is removed.
•Dry Process Plant- The damp 40/140 mesh material produced by the wet process plant is dried and screened into finished products. An on-site quality laboratory samples and monitors production and shipping sand quality daily.
•Storage and Loadout- Finished products are stored in silos and gravity loaded from under the silos into highway trucks for transport to the customer. The Atlas loadout operates 24 hours per day, 7 days per week every day of the year.
Each plant is supplied with three-phase line power. Substations access 138 kV lines and step voltage down to a 12.5 kV line which delivers power to the plants. Line natural gas is supplied to the plants. Natural gas line capacity and substation capacity at each of the plants is sufficient to serve much more than 100% of Atlas’s current requirements.
Plant process water is recycled within the plants and is pumped from the dredge pond reservoir. Additional makeup water is obtained from a wellfield containing 14 water wells having an approximate capacity of 1,600 gallons per minute (gpm) at Kermit, and 21 water wells having an approximate capacity of 2,500 gpm at Monahans. These wells are only utilized as a backup water supply.
On-site facilities at each site include a scale house, office, shop, and a quality laboratory located in the dry process plants. The surface facilities currently located at the mines are well constructed and have the necessary capacity/capabilities to support the three operations.
Permit submissions for horizontal oil and gas wells in the Permian Basin indicate a continuation of strong drilling ahead. Utilizing data from Baker Hughes and the Railroad Commission of Texas (RRC), the total number of permits filed ranges between 1,000 and 1,600 per quarter in 2023, a strong rebound from the pandemic lows of 2020.

Figure 1.2: Permian Basin HZ Permit Submissions
Domestic oil production continues to increase with the Permian leading the way at almost 6 million barrels per day by late 2023.
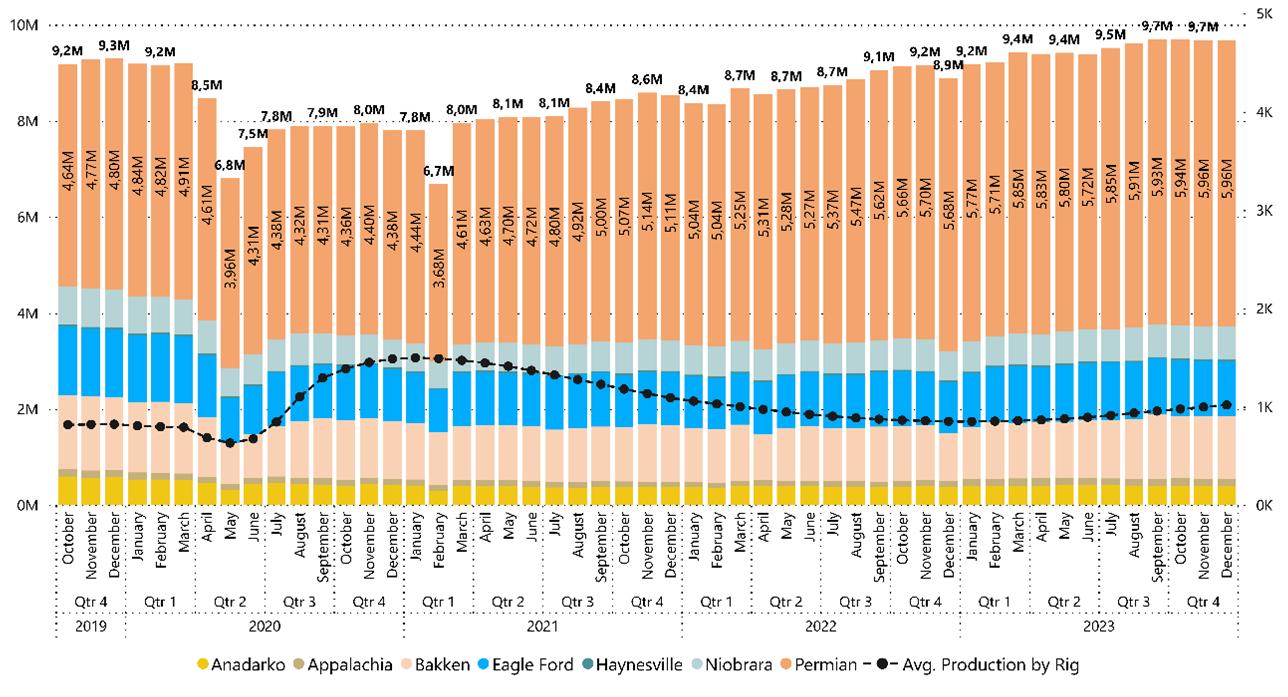
Source EIA (U.S. Energy Information Administration)
Figure 1.3: Oil Production (bbl/d)
Current frac sand production in the Permian Basin is estimated at 60 million to 65 million tons per year with fairly balanced demand and stable pricing. BOYD anticipates stable frac sand pricing substantially above the $30 per ton pricing used to estimate frac sand reserves for the subject mines. Additionally, we anticipate continued upward sand consumption in the basin due to economic and geopolitical influences on energy demand.
1.7.2.Sales, Production, and Cost Forecast
Annual forecasted ROM production of approximately 12.4 million tons per year is based on the dry plants producing 10.5 million tons per year of saleable product after a processing (wet and dry processing plant) loss of approximately 15%, as discussed in Chapter 6. Forecasted dry processing plant production is within the Kermit Mines’ current infrastructure capacities and capabilities.
As noted in Table 1.5, the dry processing plants are projected to produce approximately 10.5 million tons per year of saleable 40/70 mesh and 40/140 mesh frac sand, as discussed in Chapter 6.
The forecasted sales price of $30 per ton sold, for all products, presented in Table 1.5 is based on long-term forecasted average product prices as provided by Atlas, and reflects the doubling of sales to 10.5 million tons per year.
| | | | | | | | | | |
Table 1.5: Kermit Mines' Sales Projections |
| | 2024 | | 2025 | | 2026 | | 2027 | | 2028 |
Tons Sold (000) | | 10,500 | | 10,500 | | 10,500 | | 10,500 | | 10,500 |
Revenues ($ 000) | | 315,000 | | 315,000 | | 315,000 | | 315,000 | | 315,000 |
Product Pricing ($ per ton sold) | | 30.00 | | 30.00 | | 30.00 | | 30.00 | | 30.00 |
Table 1.6 following this page, presents the cash cost projections for the period 2024 through 2028. Operating cost projections were provided by Atlas and are based on prior year actuals. BOYD considered their estimates to be reasonable. However, adjustments were made based on our review of historical operating costs as well as other information and our experience with such operations.
| | | | | | | | | | |
Table 1.6: Kermit Mines'Cash Cost of Production Projections |
| | 2024 | | 2025 | | 2026 | | 2027 | | 2028 |
Total Cash cost of Production ($ 000) | | 92,265 | | 91,818 | | 91,818 | | 91,818 | | 91,818 |
$ per ton sold | | 8.79 | | 8.74 | | 8.74 | | 8.74 | | 8.74 |
Annual forecasted ROM production of approximately 5.7 million tons per year is based on the dry plant producing 5.0 million tons per year of saleable product after a processing (wet and dry processing plant) loss of approximately 12%, as discussed in Chapter 6. Forecasted dry processing plant production is within the operation’s current infrastructure capacities and capabilities.
As noted in Table 1.7, the dry processing plant is projected to produce approximately 5.0 million tons per year of saleable 40/70 mesh and 40/140 mesh frac sand, as discussed in Chapter 6.
The forecasted sales price of $30 per ton sold, for all products, presented in Table 1.7 is based on forecasted average product prices for the long term as provided by Atlas. We opine that this is a reasonable average sales price.
| | | | | | | | | | |
Table 1.7: Monahans Mine's Sales Projections |
| | 2024 | | 2025 | | 2026 | | 2027 | | 2028 |
Tons Sold (000) | | 5,000 | | 5,000 | | 5,000 | | 5,000 | | 5,000 |
Revenues ($ 000) | | 150,000 | | 150,000 | | 150,000 | | 150,000 | | 150,000 |
Product Pricing ($ per ton sold) | | 30.00 | | 30.00 | | 30.00 | | 30.00 | | 30.00 |
Table 1.8 presents the cash cost projections for the period 2024 through 2028. Operating cost projections were provided by Atlas and are based on prior year actuals. BOYD considered their estimates to be reasonable. However, adjustments were made based on our review of historical operating costs as well as other information and our experience with such operations.
| | | | | | | | | | |
Table 1.8: Monahans Mine's Cash Cost of Production Projections |
| | 2024 | | 2025 | | 2026 | | 2027 | | 2028 |
Total Cash cost of Production ($ 000) | | 57,450 | | 57,250 | | 57,250 | | 57,250 | | 57,250 |
$ per ton sold | | 11.49 | | 11.45 | | 11.45 | | 11.45 | | 11.45 |
The Discounted Cash Flow - Net Present Value (DCF-NPV) estimates presented herein were made for purposes of confirming the general economic viability of the reported frac sand reserves and not for purposes of valuing Atlas, the Kermit and Monahans operations, or its assets. Internal rate-of-return (IRR) and project payback were not calculated, as there were no initial investments considered in the Kermit and Monahans financial models.
All DCF-NPV values are as of January 1, 2024, for the Kermit and Monahans operations. The intent of this exercise is to demonstrate that the operations generate positive cash flows (based on a 10% discount rate), on a pre-tax and after-tax basis, which supports their statements of frac sand reserves.
Resource tons have not been included in the DCF-NPV analyses, although substantial additional saleable product may be available as the in-place frac sand resources and other exploration target areas are converted to reserves.
Table 1.9 below presents the five-year pre-tax and after-tax cash flow projections based on the proposed LOM production schedule and revenue, cost of production, and capital expenditures (CapEx) estimates discussed above for the Kermit Mines.
| | | | | | | | | | | | |
Table 1.9: Kermit Mines' Five-Year Cash Flow Summary |
| | 2024 | | 2025 | | 2026 | | 2027 | | 2028 | | Total |
Total Tons Sold (000) | | 10,500 | | 10,500 | | 10,500 | | 10,500 | | 10,500 | | 52,500 |
Revenues ($ 000) | | 315,000 | | 315,000 | | 315,000 | | 315,000 | | 315,000 | | 1,575,000 |
Cost of Production ($ 000) | | 92,265 | | 91,818 | | 91,818 | | 91,818 | | 91,818 | | 459,537 |
CapEx ($ 000) | | 3,300 | | 3,300 | | 3,300 | | 3,300 | | 3,300 | | 16,500 |
Net Pre-Tax Cash flow ($ 000) | | 219,435 | | 219,882 | | 219,882 | | 219,882 | | 219,882 | | 1,098,963 |
Federal Income Tax ($ 000) | | 43,786 | | 43,811 | | 43,741 | | 43,672 | | 43,603 | | 218,613 |
Net After-Tax Cash Flow ($ 000) | | 175,649 | | 176,071 | | 176,141 | | 176,210 | | 176,279 | | 880,350 |
Three DCF-NPVs on a pre-tax basis and three DCF-NPVs on an after-tax basis, using discount rates of 8%, 10%, and 12%, were calculated utilizing the cash flows above. The DCF-NPV values used mid-year discounting and all cash flows were on a constant dollar basis. Table 1.10 summarizes the results of the NPV analyses:
| | | | | | |
Table 1.10: Kermit Mines'
DCF-NPV Analysis |
| | DCF-NPV ($ millions) |
| | 8% | | 10% | | 12% |
Pre-Tax | | 2,613 | | 2,196 | | 1,887 |
After-Tax | | 2,100 | | 1,764 | | 1,514 |
Please refer to Table 12.3, in Chapter 12, for the LOM cash flow analysis and corresponding pre-tax and after-tax DCF-NPV analyses at a 10% discount rate.
Table 1.11 below presents the five-year pre-tax and after-tax cash flow projections based on the proposed LOM production schedule and revenue, cost of production, and CapEx estimates discussed above for the Monahans Mine.
| | | | | | | | | | | | |
Table 1.11: Monahans Mine's Five-Year Cash Flow Summary |
| | 2024 | | 2025 | | 2026 | | 2027 | | 2028 | | Total |
Total Tons Sold (000) | | 5,000 | | 5,000 | | 5,000 | | 5,000 | | 5,000 | | 25,000 |
Revenues ($ 000) | | 150,000 | | 150,000 | | 150,000 | | 150,000 | | 150,000 | | 750,000 |
Cost of Production ($ 000) | | 57,450 | | 57,250 | | 57,250 | | 57,250 | | 57,250 | | 286,450 |
CapEx ($ 000) | | 3,300 | | 3,300 | | 3,300 | | 3,300 | | 3,300 | | 16,500 |
Net Pre-Tax Cash Flow ($ 000) | | 89,250 | | 89,450 | | 89,450 | | 89,450 | | 89,450 | | 447,050 |
Federal Income Tax ($ 000) | | 16,993 | | 16,966 | | 16,896 | | 16,827 | | 16,758 | | 84,439 |
Net After-Tax Cash Flow ($ 000) | | 72,257 | | 72,484 | | 72,554 | | 72,623 | | 72,692 | | 362,611 |
Three DCF-NPVs on a pre-tax basis and three DCF-NPVs on an after-tax basis, using discount rates of 8%, 10%, and 12%, were calculated utilizing the cash flows above. The DCF-NPV values used mid-year discounting and all cash flows were on a constant dollar basis.
Table 1.12 summarizes the results of the pre-tax and after-tax analyses:
| | | | | | |
Table 1.12: Monahans Mine's |
DCF-NPV Analysis |
| | DCF-NPV ($ millions) |
| | 8% | | 10% | | 12% |
Pre-Tax | | 1,046 | | 884 | | 762 |
After-Tax | | 848 | | 717 | | 619 |
Please refer to Table 12.3, in Chapter 12, for the LOM cash flow analysis and corresponding pre-tax and after-tax DCF-NPV analyses at a 10% discount rate.
1.8.Permitting and Compliance
Several permits are required by federal and state law for mining, processing, and related activities at each of the Kermit and Monahans operations. BOYD reviewed the permits necessary to support continued operations at Kermit and Monahans. The approved permits and certifications appear to be valid, in good standing, and adequate for the continued operation of the mining and processing facilities. New permits, permit revisions, and/or renewals may be necessary from time to time to facilitate future operations. Given sufficient time and planning, Atlas should be able to secure new permits, as required, to maintain its planned operations within the context of current regulations.
Under current regulations, the State of Texas does not require reclamation or remediation of surface mined lands by aggregate (including frac sand) operations. While there are no formal state or federal reclamation obligations, the leased portions of the Monahans property have defined reclamation requirements for post mining land use, including removal of any equipment, structures, and other improvements. Additionally, Atlas voluntarily participates in a Candidate Conservation Agreement with Assurances (CCAA) for the Dune Sagebrush Lizard (DSL). This mitigates DSL regulatory risk for each of the mining operations. Atlas has the option to either set aside acreage for the DSL habitat or contribute cash based on the acreage within the habitat area.
The Kermit and Monahans mines are regulated by TCEQ on matters involving air and water pollution and inspected periodically by the state if issues arise.
Mine safety is regulated by the U.S. Department of Labor’s Mine Safety and Health Administration (MSHA). MSHA inspects the facilities a minimum of twice yearly. Atlas’s safety record compares favorably with its regional peers.
BOYD is not aware of any regulatory violation or compliance issue that would materially impact the reported frac sand reserves for the subject mines.
It is BOYD’s overall conclusion that Atlas’s frac sand resources and frac sand reserves, as reported herein: (1) were prepared in conformance with accepted industry standards and practices, and (2) are reasonably and appropriately supported by technical evaluations, which consider all relevant modifying factors. We do not believe there is other relevant data or information material to the properties that would render this technical report summary misleading. Our conclusions represent only informed professional judgment.
Given the operating history and actual performance of Atlas through the COVID-19 pandemic and volatile energy market conditions, we consider the going concern to be viable under the current and foreseeable operating environment. A general assessment of risk is presented in the relevant sections of this report.
The ability of Atlas, or any mine operator, to recover all of the reported frac sand reserves is dependent on numerous factors that are beyond the control of, and cannot be anticipated by, BOYD. These factors include mining and geologic conditions, the capabilities of management and employees, the securing of required approvals and permits in a timely manner, future sand prices, etc. Unforeseen changes in regulations could also impact performance. Opinions presented in this report apply to the site conditions and features as they existed at the time of BOYD’s investigations and those reasonably foreseeable.
2.0 INTRODUCTION
Atlas provides high quality proppant (frac) sand products, as well as proppant supply chain logistics services to the Permian Basin oil and gas industry. The company was founded in 2017 by long-time exploration and production (E&P) operators and is headquartered in Austin, Texas. Mining and processing operations commenced on their Kermit, Texas property in June 2018, and at their Monahans, Texas property in July 2018. In 2023, Atlas added a second mining and processing facility at their Kermit property.
The company’s common stock is listed on the New York Stock Exchange under the symbol AESI. Additional information regarding Atlas can be found on their website at www.atlas.energy.
2.2.Purpose and Terms of Reference
Atlas retained BOYD to complete independent estimates of frac sand resources and reserves and a technical report summary encompassing their sand mines in accordance with the disclosure requirements set forth in S-K 1300. As such, the purpose of this TRS is threefold: (1) to summarize technical and scientific information for the subject mining properties, (2) to provide the conclusions of our review of the information for each of the properties, and (3) to provide statements of frac sand resources and frac sand reserves for the Kermit and Monahans mines.
BOYD’s opinions and conclusions are based on our detailed review of the supporting geologic, technical, and economic information provided by Atlas, which were used in formulating the estimates of frac sand resources and frac sand reserves disclosed in this report. We independently estimated the frac sand resources and frac sand reserves from first principles using exploration information provided by Atlas or by third-party experts engaged by Atlas. We employed standard engineering and geoscience methods, or a combination of methods, that we considered to be appropriate and necessary to establish the conclusions set forth herein. As in all aspects of mining property evaluation, there are uncertainties inherent in the interpretation of engineering and geoscience data; therefore, our conclusions necessarily represent only informed professional judgment.
The ability of Atlas, or any mine operator, to recover all of the estimated frac sand reserves presented in this report is dependent on numerous factors that are beyond the control of, and cannot be anticipated by, BOYD. These factors include mining and geologic conditions, the capabilities of management and employees, the securing of required approvals and permits in a timely manner, future sand prices, etc. Unforeseen changes in regulations could also impact performance. Opinions presented in this report apply to the site conditions and features as they existed at the time of BOYD’s investigations and those reasonably foreseeable.
This report is intended for use by Atlas, subject to the terms and conditions of its professional services agreement with BOYD. We also consent to Atlas filing this TRS with the SEC pursuant to S-K 1300. Except for the purposes legislated under US securities law, any other uses of or reliance on this report by any third party is at that party’s sole risk.
2.3.Expert Qualifications
BOYD is an independent consulting firm specializing in mining-related engineering and financial consulting services. Since 1943, BOYD has completed over 4,000 projects in the United States and more than 90 other countries. Our full-time staff comprises mining experts in: civil, environmental, geotechnical, and mining engineering; geology; mineral economics; and market analysis. Our extensive experience in frac sand resource and frac sand reserve estimation, and our knowledge of the subject properties, provides BOYD an informed basis on which to opine on the frac sand resources and frac sand reserves available at the Kermit and Monahans mines. An overview of BOYD can be found on our website at www.jtboyd.com.
The individuals primarily responsible for the preparation of this report and the estimates of frac sand resources and frac sand reserves herein are by virtue of their education, experience, and professional association considered qualified persons (QPs) as defined in S-K 1300.
Neither BOYD nor its staff employed in the preparation of this report have any beneficial interest in Atlas, and are not insiders, associates, or affiliates of Atlas. The results of our assignment were not dependent upon any prior agreements concerning the conclusions to be reached, nor were there any undisclosed understandings concerning any future business dealings between Atlas and BOYD. This report was prepared in return for fees based on agreed upon commercial rates, and the payment for our services was not contingent upon our opinions regarding the project or approval of our work by Atlas and its representatives.
2.4.Principal Sources of Information
The information, estimates, opinions, and conclusions presented herein are informed by: (1) data, reports, and other information provided by Atlas; (2) discussions with Atlas personnel; (3) records on file with regulatory agencies; (4) data, reports, and other information from public sources, and (5) nonconfidential information in BOYD’s possession.
The basis for this report is the following previously compiled BOYD technical reports:
•BOYD Report No. 3871.000, dated December 7, 2018, which provided an independent estimate of frac sand resources and frac sand reserves for the Kermit and Monahans mines as of the commencement of mining in 2018.
•BOYD Report No. 3871.006, dated May 13, 2022, which was Atlas’s first TRS for the Kermit and Monahans frac sand mines.
The following information was provided by Atlas:
| | |
| - | “Geologic Exploration & Reserves Estimate: Atlas 1”, prepared by Westward Environmental, Engineering, Natural Resources (Westward), dated November 2017. |
| - | “Exploration Summary Report, Atlas 2 Site (AT2), Monahans, Ward County, Texas, Project No.: 10977-025”, prepared by Westward, dated July 17, 2018. |
| - | “Infill Drilling Summary Report, Atlas 1, Kermit, Winkler County, Texas”, prepared by Westward, dated October 28, 2021. |
•Exploration records (e.g., drill hole location maps, drilling logs, and lab testing summaries) associated with the above noted exploration reports.
•Mapping data, including:
| | |
| - | Property control boundaries |
| - | Infrastructure locations |
| - | Easement and right-of-way boundaries |
| - | Topographic site surveys |
| - | Recent mining extents |
•Overview of mining and processing operations, including detailed flow diagrams.
•Financial forecasting models.
•Historical information, including:
| | |
| - | Production reports and reconciliation statements |
| - | Financial statements |
| - | Product sales and pricing |
| - | Mine plans |
| - | Site plans |
| - | Operational data |
•Files related to mining and operating permits.
Any other information from sources external to BOYD and/or Atlas is referenced accordingly.
The data and workpapers used in the preparation of this report are on file in our offices.
2.4.1.Personal Inspections
Personal inspections of the Atlas operations were made by two of BOYD’s senior geology and mining staff, both qualified persons and co-authors of this report, on April 4, 2018. The site visits included: (1) observation of the active mining operations, (2) a tour of each mine site’s surface infrastructure, and (3) a tour of the process plants and truck loadouts. BOYD’s representatives were accompanied by Atlas’s General Manager who openly and cooperatively answered questions regarding, but not limited to: site geology, mining conditions and operations, equipment usage, labor relations, operating and capital costs, current and proposed processing operations, and frac sand marketing.
Significant operational changes to the mines since the time of our site visit include: (1) the transition to utilizing a combination of dry and dredge mining methods (dredges were not being utilized at the time of the site visit), and (2) the recent addition of the new mining and processing facility and subsequent production capacity expansion at Kermit.
2.4.2.Reliance on Information Provided by the Registrant
In the preparation of this report, we have relied, exclusively and without independent verification, upon information furnished by Atlas with respect to:
•Property title and status
•Encumbrances, easements, and rights-of-way
•Permits, bonds, and reclamation liability
•Sustainability initiatives
•Surface tailings management
•Mine closure requirements and plans
•Monitoring/compliance requirements for protected areas/species
•Market overview and strategy
•Marketing and sales contracts
•Inflation and discount rates
•Current and historical production
•Current and historical costs of operation and production
Our opinions and conclusions regarding this information are provided in the relevant sections of this report.
2.4.3.Verification of Information
BOYD exercised due care in reviewing the information provided by Atlas within the scope of our expertise and experience (which is in technical and financial mining issues) and concluded the data are valid and appropriate considering the status of the subject properties and the purpose for which this report was prepared.
We have no reason to believe that any material facts have been withheld, or that further analysis may reveal additional material information. However, the accuracy of the results and conclusions of this report are reliant on the accuracy of the information provided by Atlas. While we are not responsible for any material omissions in the information provided for use in this report, we do not disclaim responsibility for the disclosure of information contained herein which is within the realm of our expertise.
2.4.4.Other Relevant Data and Information
BOYD is not aware of any additional information which would materially impact the frac sand resource and frac sand reserve estimates reported herein.
The effective (i.e., “as of”) date of this TRS is December 31, 2023. The estimates of frac sand resources and frac sand reserves and supporting information presented in this report are effective as of December 31, 2023.
This is the second TRS filed for Atlas’s Kermit and Monahans mines and supersedes the previously filed TRS (BOYD Report No. 3871.006). The user of this document should ensure that this is the most recent disclosure of frac sand resources and frac sand reserves for Atlas’s Kermit and Monahans mines, as this report is no longer valid if more recent estimates are available.
The US customary measurement system has been used throughout this report. Tons are dry short tons of 2,000 pounds-mass. Historic prices and costs are presented in nominal (unadjusted) dollars. Future dollar values are expressed on a constant (unescalated) basis as of the effective date of this report.
3.0 PROPERTY OVERVIEW
3.1.Description and Location
Referring to Figure 1.1 (General Location Map), the Kermit and Monahans properties are approximately 15 miles apart. From the Kermit Property, it is approximately a 40-mile drive southeast to reach the Monahans Property.
The two Kermit Mines, in Winkler County, Texas, are active surface frac sand mining and processing operations, located on approximately 5,826 “gross” acres (the “Kermit Property”) of which 5,341 “net” acres are controlled (leases and fee-owned) by Atlas. After applying requisite mining setbacks and observing any easements and/or rights‑of‑way, approximately 4,521 acres (or 78% of the property) have been explored and are considered as either mineable frac sand resources or frac sand reserves.
The Kermit operations are located approximately seven miles northeast of the town of Kermit, with a majority of the property on the north side of State Route 115. The southeast corner of the Texas-New Mexico border is less than five miles from the northwest corner of the property.
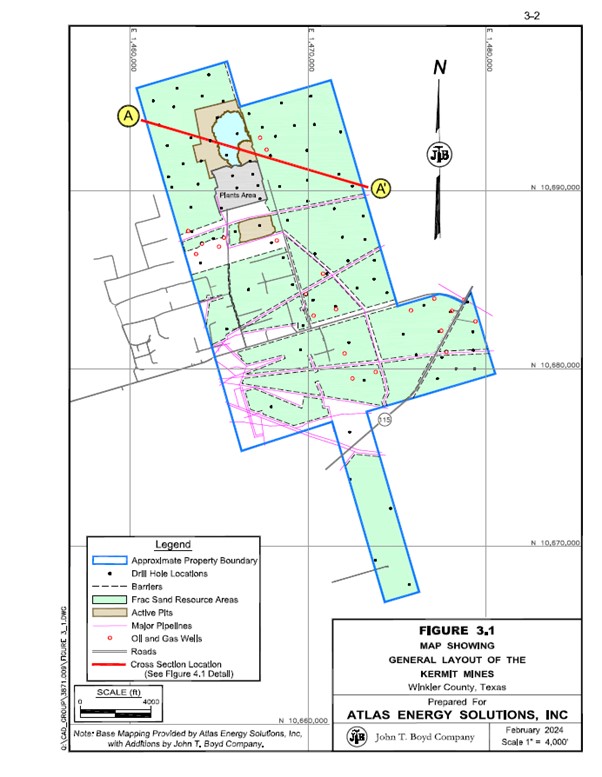
Geographically, Kermit’s frac sand processing plants are located at approximately 31° 58’ 6.29” N latitude and 103° 0’ 39.46” W longitude. Please refer to Figure 3.1, following this page, which illustrates the general layout of the Kermit Mines.
The Monahans Mine, in Ward and Winkler Counties, Texas, is an active surface frac sand mining and processing operation, located on approximately 32,224 “gross” acres (the “Monahans Property”) which is entirely leased by Atlas. After applying requisite mining setbacks and observing any easements and/or rights-of-way, approximately 11,187 acres (or 35% of the property) have been explored and are considered as either mineable frac sand resources or frac sand reserves. Atlas has also completed more widely spaced and reconnaissance-level exploration drilling and sampling work on an additional 9,575 acres (or 30% of the property) outside of the above-described resource and reserve areas, which are being reported as “exploration target” areas.
Drilling density in the exploration target areas is more widely-spaced, resulting in less geologic confidence within these areas; although drilling and testing results indicate very similar characteristics, both in thickness and frac sand quality, to the frac sand resource and frac sand reserve areas within the Monahans Property.
The Monahans operation is located approximately three miles northeast of the town of Monahans and is situated on the north side of Highway 20. Monahans Sand Hills State Park borders the southeastern corner of the property.
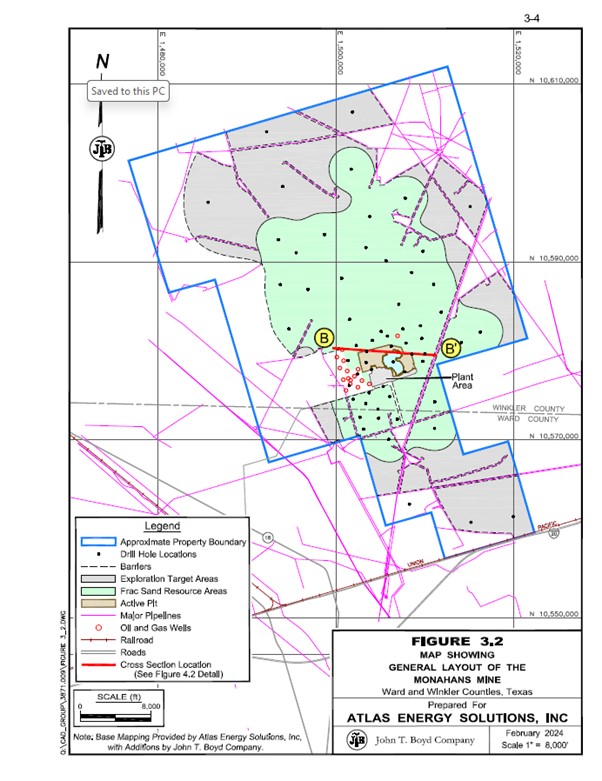
Geographically, the Monahans Mine’s frac sand processing facility is located at approximately 31° 39’ 32.53” N latitude and 102° 52’ 55.46” W longitude. Please refer to Figure 3.2, following this page, which illustrates the general layout of the Monahans Mine.
Since the first “in-basin” frac sand mine opened in August 2017 and began selling frac sand to the Permian Basin oil and gas industry, numerous mines have opened in the general vicinity of the Kermit and Monahans operations.
Atlas began developing the Kermit and Monahans properties by completing initial subsurface exploration, sampling, and testing work mid-2017. Operations commenced on both properties in mid-late 2018. Ongoing development of the properties has continued since, with additional exploration work completed in 2021, and construction of a second mining and processing facility at Kermit in 2023.
Property control data provided for the Kermit and Monahans properties included maps, mining lease agreements, and royalty agreements, which have been accepted as being true and accurate for the purpose of this report.
Under the Monahans Lease and the Kermit Royalty Agreement, Atlas makes monthly royalty payments to Permian Dunes Holding Company, LLC, based on a percentage of their gross monthly proppant sand sales. The lease also includes an annual minimum royalty payment in the amount of $1,000,000 (the “Minimum Annual Royalty Payment”) in any year of the term following an occurrence of a Capital Event. Royalty expenses are recorded as products are sold, and is included in cost of sales, totaling less than 5% of costs of sales.
The Kermit Property comprises approximately 5,826 “gross” acres of which 5,341 “net” acres are controlled by Atlas (3,887 acres leased and 1,454 acres owned in fee).
The Monahans Property comprises approximately 32,224 “gross” acres which is entirely leased by Atlas.
Several existing frac sand mining operations are located in the general vicinity of Atlas’s Kermit and Monahans frac sand mines, including ProFrac’s Kermit and Monahans mines; Hi-Crush’s Kermit Mine; and Black Mountain’s Vest and El Dorado mines located between Atlas’s mines.
3.5.Regulation and Liabilities
Mining and related activities for the Kermit and Monahans operations are predominantly regulated by the TCEQ. The subject mines operate under several permits and must comply with various federal, state, and municipal law regulations that do not require specific permits. Atlas reports that necessary permits are in place or applied for to support immediate operations. New permits or permit revisions may be necessary from time to time to facilitate future operations. Given sufficient time and planning, Atlas should be able to secure new permits, as required, to maintain its planned operations within the context of current regulations.
Atlas participates in a voluntary CCAA for the DSL. The agreement, which Atlas signed in January 2021, lasts for 23 years. Their voluntary participation in the CCAA effectively mitigates DSL regulatory risk for Atlas’s Kermit and Monahans mining operations.
Atlas can either set aside acreage for DSL habitat or contribute cash to continue participating in the CCAA. Atlas holds significant sand acreage outside of their current resources and reserves that would be able to be contributed or set aside for the CCAA, allowing them to continue mining operations, even if the DSL is listed as an endangered species. Atlas did not inform BOYD of any issues related to the DSL with regards to mining of the Kermit and Monahans properties.
To the extent known to BOYD, there are no violations, fines, liens, or other significant factors and risks that may affect access, title, or the right or ability to perform work on the Kermit or Monahans properties.
3.6.Accessibility, Local Resources, and Infrastructure
The Kermit Property is located near small rural towns in western Texas and southeastern New Mexico. The surrounding region has a well-established history of oil and gas production, being located within the center of the Permian Basin. Winkler and the surrounding counties have a combined population of over 280,000 people, according to 2020 population estimates by the Texas Demographic Center and Lea County, New Mexico.
General access to the Kermit Property is via a well-developed network of primary and secondary roads serviced by state and local governments. These roads offer direct access to the mines and processing facilities, and are generally open year-round. Primary vehicular access to the property is via SR 115, running north-south. Various state highways (302, 115, 18, 128) in Texas and New Mexico are accessible to the subject property and provide primary access to various portions of the oil and gas fields.
The Midland International Air and Space Port is located approximately 45 miles southeast of the Kermit Mines, and there are additional local/regional airports located within a 65-mile radius of the Kermit Property.
With regards to utilities, three phase electrical power is supplied to the property from a local utility, a natural gas line supplies gas to the dry plants, and other miscellaneous services are readily available. Water is gathered in a central collection pond or mine pit reservoir which acts as the primary source of water. In addition, 14 water wells drilled throughout the property function as a backup source of water.
The Monahans Property is located near small rural towns in western Texas. The region has a well-established history of oil and gas production, being located within the center of the Permian Basin. Ward, Winkler, and the surrounding counties have a combined population of over 225,000 people, according to 2020 population estimates by the Texas Demographic Center.
General access to the Monahans Property is via a network of primary and secondary roads serviced by state and local governments. These roads offer direct access to the mine and processing facilities and are generally open year-round. Primary vehicular access to the property is via SH 18, which runs northeast-southwest, and Interstate 20 which also runs northeast-southwest below the southern boundary of the property. These roads provide access to various portions of the oil and gas fields. In addition, a connection to the UP railroad via the Texas-New Mexico railroad branch line is located in the city of Monahans.
The Midland International Air and Space Port is approximately 40 miles east of the Monahans operation, and there are additional local/regional airports located within a 50‑mile radius of the Monahans property.
Regarding utilities to the property, three phase electrical power is supplied from a local utility, a natural gas line supplies gas to the dry plant, and other miscellaneous services are available. Water is gathered in a central collection pond which acts as the primary source of water. In addition, 21 water wells drilled throughout the property provide a backup supply of water.
The Kermit and Monahans properties are situated within the Texas Great Plains physiographic province, a region encompassing much of northwestern and western Texas. The surrounding areas generally consist of desert valleys covered with windblown sheet and dune sands, high plains covered with thick alluvium (the Llano Estacado or Staked Plains), or plateaus consisting of thin carbonate-based soils (the Caprock Escarpment). The two properties encompass a majority of the active dune complexes found in this area. The plateau areas, typically covered by a weathering-resistant caliche (a hardened natural cement of calcium
carbonate that binds other materials―such as gravel, sand, clay, and silt), may abruptly stand up to 1,000 ft above the plains. Much of the region may be covered by various types of desert scrub grasses, sages, yuccas, junipers, shin oaks, and mesquites.
Surface elevations across the properties range from approximately 2,960 ft to 3,050 ft above mean sea-level (AMSL) on Kermit, and 2,660 ft to 2,930 ft AMSL on Monahans.
There are no natural surface waters present on either property, however, a perched groundwater table is located approximately 20 ft below the present ground surface, which allows Atas to dredge mine the remaining sand after initially dry mining to the water table.
Land cover in the immediate area consists predominantly of a mixture of shinnery oak, grasses, and other various scrub vegetation.
In and around the general area of the Kermit and Monahans mines, summers are long, hot, and humid; winters are short, cold, and dry; skies are generally clear year-round.
The hot season generally spans from May through September when average daily high temperatures often reach 88°F or higher, and lows are above 57°F. The hottest month is either June or July when highs often reach 97°F. The cool season generally spans November to February when average highs are rarely above 70°F and lows are often near or below freezing (32°F). The coldest month of the year is generally January, with an average low of 33°F.
Annual precipitation may vary widely from year to year, however rainfall generally totals 14 to 15 inches annually, with little to no snowfall.
In general, the operating season for Atlas’s Kermit and Monahans mines is year-round. Adverse weather conditions are seldom expected to restrict or interfere with mining, processing, and loading operations; however, extreme weather conditions may temporarily impact operations. Periodic flooding is possible during heavy rainfall events.
4.0 GEOLOGY
Surface sand formations are present across much of the area in and around the Kermit and Monahans properties. Both properties are located within an active sand dune complex, consisting of large and open sand dunes exposed at the surface. The region is bordered to the east by the Llano Estacado Caprock Escarpment, and caliche outcrops to the west. Much of the surrounding area contains surficial deposits consisting primarily of windblown Quaternary age sheet sands, ancient dunes and dune ridges, and undivided sand and silt deposits. The frac sand resources and frac sand reserves of the Kermit and Monahans mines are hosted in these surficial sand dunes.
The origins of these deposits are believed to be a combination of eroded bedrock material from the southern Rocky Mountains, and locally eroded Ogallala Formation sandstone. As portions of the southern Rockies were eroded via weathering, particles were carried to the Pecos River. Ancient flooding events of the Pecos River resulted in the suspended particles being deposited into flood plains. Once flood waters receded, winds took over, drying and further transporting these particles into the western Texas region.
The Llano Estacado Caprock Escarpment marks the eastern-most extent of the surficial sand deposits. Winds transporting particles into the area are thought to have collided with the escarpment, causing them to slow, dropping particles out of suspension, to where they have accumulated over time. Winnowing processes caused a further degree of particle sorting to occur. Due to the mechanisms and long distances of particle transport, sand grains were abraded and rounded as they reached their current locations.
These regional geologic processes resulted in the formation of the Kermit and Monahans dune fields, covering an area of approximately 5-10 miles wide, and 60 miles long, extending primarily through Ward and Winkler counties in west Texas.
4.2.Property Stratigraphy
4.2.1.General Stratigraphy
The present-day dune systems and sheet sands surrounding the Kermit and Monahans properties are largely vegetated, however the active dune fields on the subject mining properties contain no discernable overburden materials except for sparse areas of vegetation and roots that are removed during processing. The Kermit and Monahans deposits are mineable from the surface down, to the total defined depth defined by the drilling and sampling campaigns completed, which are further discussed in Chapter 5.
Quaternary unconsolidated dune deposits cover the entirety of the subject properties, generally ranging in thickness from 60-ft to over 100-ft, which is above average thicknesses seen in other surficial sand deposits of the area. A generalized stratigraphic chart of the geologic units in Ward and Winkler counties, Texas is presented in Figure 4.1.
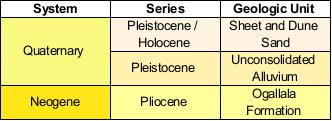
Figure 4.1: Generalized Stratigraphic Chart, Surficial
Deposits of Ward and Winkler Counties, TX
The following text discusses the strata encountered in and around Atlas’s Kermit and Monahans properties, in depositional order:
Ogallala Formation
The Ogallala Formation is predominantly comprised of weakly cemented to unconsolidated fine-to medium-grained sands, which may be silty and calcareous in places. A caliche caprock is frequently exhibited, which resists weathering and forms ledges. Thickness of this formation has been recorded up to 550 ft.
Quaternary Sheet and Dune Sands
The Kermit and Monahans properties are uniformly covered by Quaternary dune and sheet sands generally consisting of fine-to medium-grained quartz sand grains mixed with varying degrees of silts, calcareous sands, and caliche nodules.
Surficial sand deposition may range in thickness from less than 10-ft of windblown sheet sands to over a hundred feet of dune sands. Unconsolidated alluvial deposits consisting of pebble-to cobble-sized limestone and chert nodules overlain by silts are found to the east of the properties.
Cross sections created from the geologic models of each property are presented in Figures 4.2 (Kermit) and 4.3 (Monahans), on the following pages, with locations of each cross section shown on Figures 3.1 and 3.2, respectively. A representative stratigraphic column from one drill hole completed within each of the subject properties is also presented in Figure 4.4 (page 4-6) for reference.
The structural features of the Quaternary sands in and around the Kermit and Monahans properties are relatively non-descript. While the mineable unit exhibits variable thickness over the area, it is unaffected by folding or faulting. Due to the lack of structural features encountered, there are no known geological features that are believed to materially affect frac sand mining operations in the immediate area; as such, the deposit is considered to be of low geologic complexity.
The sand mined at the Kermit and Monahans properties is processed into various frac sand products. Frac sand is a naturally occurring silica sand—also known as quartz sand or white sand—which generally exhibit the following characteristics required by oil and gas producers for use in developing wells:
•High-purity – frac sand grains are relatively pure (typically, >95% silicon dioxide) in composition and almost entirely free from contaminants. Typical sand deposits have numerous impurities fused to the silica grains, such as iron, carbonate, potassium, and other trace elements/minerals, which can make them more susceptible to mechanical and chemical alteration. Mineralogical purity of silica content is a characteristic of mature sand, which has been highly reworked and well sorted, so that the mechanically and chemically less-resistant minerals and fine particles have been dissolved or winnowed away.
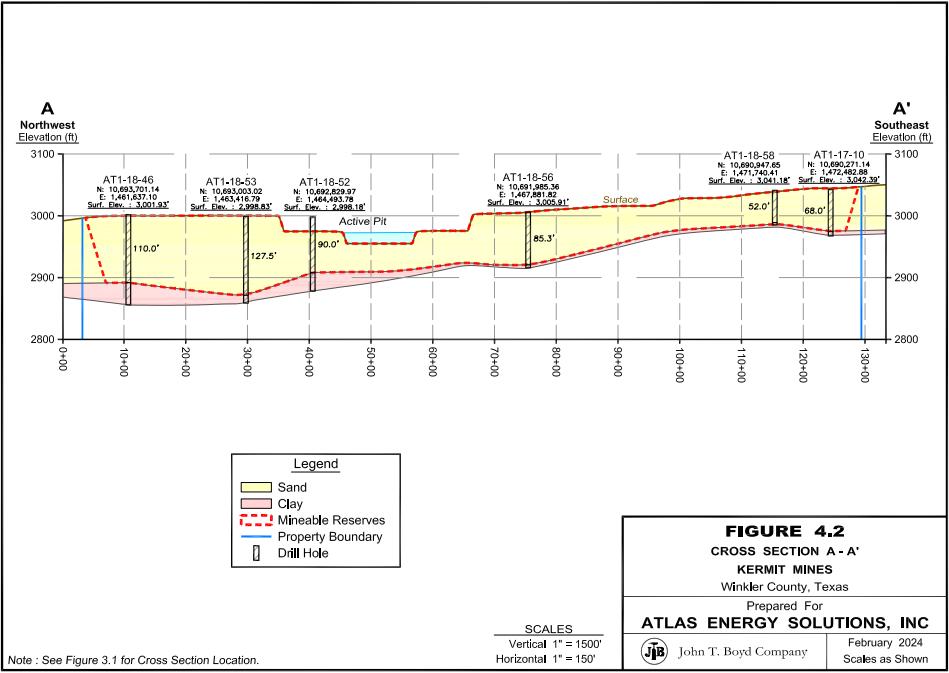
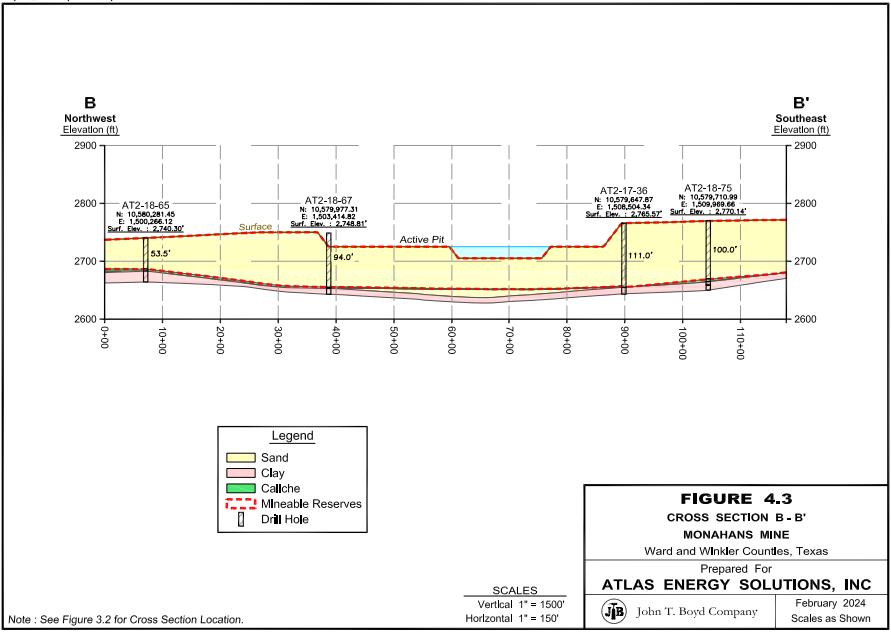
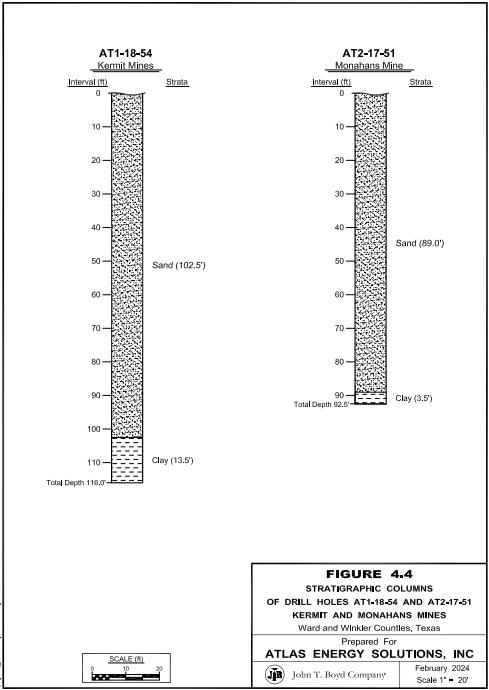
•Homogeneous grain size – hydraulic fracturing procedures require sand in a relatively narrow range of grain sizes which are dependent on the specific geological conditions of the well and the fracking procedures used. Larger sand grains generally provide better permeability, but smaller sand grains are typically stronger. When describing frac sand, the product is frequently referred to as simply the sieve cut, e.g. 20/40 mesh sand—meaning that 90 percent of the sand is fine enough to pass through a 20 mesh sieve and is coarse enough to be retained on a 40 mesh sieve. Common frac sand sizes include 20/40 mesh, 30/50 mesh, 40/70 mesh, “100 mesh”, “200 mesh”, and finer. The size ranges for “100 mesh” and “200 mesh” vary significantly between manufacturers. As of the date of this report, finer sands such as 40/70 mesh and “100 mesh” have become more widely utilized in shale gas well fracturing.
•High sphericity and roundness – Sphericity and roundness describe the overall shape of the sand grains. Sphericity measures how close the grains approach the shape of a sphere while roundness measures the relative sharpness of corners and curvatures of the grains. Greater sphericity and roundness provide better grain strength and porosity/permeability between grains, allowing better flow of oil and gas from the fractures to the wellhead. A more spherical shape also enables the grains to be carried in the fracking fluid with minimal turbulence.
•High crush resistance – Crush resistance of frac sand is dependent upon the hardness and shape of the sand grain. Generally, a high percentage of silica in the sand increases its crush resistance. Additionally, monocrystalline grains are stronger than composite grains. Crush resistance is expressed as a K-value that indicates the highest pressure (rounded to the nearest 1,000 psi) that generates less than 10 weight percent fines (i.e., crushed sand grains). For example, a K-value of 7 means that, at 7,000 psi pressure, no more than 10 weight percent fines were generated, but more than 10 weight percent fines were generated at the next highest pressure. The higher the K-value, the more crush-resistant the sand is.
•Low acid solubility – Acid solubility is an indication of the amount of soluble cement or soluble mineral grains (i.e., non-silica contaminants) in the frac sand; low solubility requires a high silica content, as pure quartz tends to be insoluble under normal conditions.
•Low turbidity – Turbidity is a measure of the clay, silt, or other fine grains and impurities in the sand. Low turbidity is a result of mineralogical maturity and grain‑size sorting in the natural depositional environment. Generally, fine suspended matter in the mined sand is washed out during processing, so this property can be somewhat controlled for the final product.
Aeolian sand deposits, such as those found at the Kermit and Monahans mines, which are predominantly comprised of silica sand grains meeting the abovementioned characteristics are well‑suited to the commercial production frac sands.
5.0 EXPLORATION DATA
Atlas has completed significant testing in order to thoroughly understand the frac sand deposits at their Kermit and Monahans properties. Throughout development of the subject properties, Atlas has completed numerous exploration campaigns and analyzed thousands of sand samples for various frac sand characteristics, including API/ISO standards.
Atlas engaged Westward in 2017 to design and conduct comprehensive initial exploration campaigns for both the Kermit and Monahans properties. These initial exploration campaigns were completed mid-late 2017 and resulted in a total of 36 completed drill holes on the Kermit Property, and 53 completed drill holes on the Monahans Property.
Infill exploration campaigns were then undertaken at each of the properties in early 2018, with the intent to increase the level of geologic confidence throughout select areas of each property. Westward again designed and completed these campaigns, which resulted in an additional 25 drill holes completed on the Kermit Property, and 27 additional drill holes completed on the Monahans Property.
Most recently, in 2021, a second infill drilling campaign was completed on the Kermit Property, which targeted areas of the sand deposit previously under-explored. The intent of this campaign was to increase the Kermit Property’s total frac sand reserve base, as Atlas considered constructing a second mining and processing facility on the property. Drill hole locations for the 2021 campaign were proposed by BOYD, with drilling and sampling completed by Westward. By late September 2021, an additional 26 drill holes were completed on the Kermit Property.
As of the date of this report, a total of 87 drill holes have been drilled, sampled, and analyzed on the Kermit Property over the course of three separate exploration campaigns, and 80 drill holes have been drilled, sampled, and analyzed on the Monahans Property through two exploration campaigns. Results from these exploration campaigns consist of summary reports, geologic logs, subsurface samples, grain size analyses, and API/ISO proppant sand testing of composited samples.
Electronic copies of drilling and sampling logs and laboratory testing summaries were provided for our review and served as the basis of our independent geologic models. Exploration reports authored by Westward for each exploration campaign provided background information, such as equipment used, and sampling, logging, and fieldwork methodologies and procedures undertaken throughout each of the exploration campaigns completed on the Kermit and Monahans properties. BOYD opines that the information was obtained appropriately, and the work completed by Westward was thorough and complete for purposes of evaluating and estimating frac sand resources and frac sand reserves on the Kermit and Monahans properties.
5.2.Exploration Procedures
5.2.1.Drilling, Sampling, and Sample Security
Westward employed various rotosonic drilling contractors to perform a series of exploratory drilling and sampling campaigns on the Kermit and Monahans properties, from June 2017 through September 2021. The two main goals of these campaigns were to: (1) define the lateral extent and thickness of the potentially mineable deposit, and (2) obtain samples through the total depth of mineable sand found on each property for the purpose of determining grain size distribution and proppant performance qualities.
Each of the drilling and sampling campaigns were executed in an equivalent manner, through the various phases of work completed on each property. Westward supervised the field work and geologically logged, photographed, and sampled each drill hole, as well as arranging sample storage and transport to the various testing laboratories. Drilling was conducted utilizing track-mounted rotosonic drilling rigs, which were selected not only to provide highest potential core recoveries in the loosely deposited dune and sheet sand formations found on the subject properties, but also because the loose surface material required track mounted vehicles to traverse most areas within the properties.
Each drill hole was completed by advancing the 6.25-inch outside diameter core barrel 10 ft at a time and recovering a 4.50-inch diameter core sample for each drilling run. Each recovered core was extruded into two 5-ft long sample bags, with the bottom depths of each core run written on the bags by the driller. After logging and photographing an interval, cores were then sampled, generally on 5-ft or 10-ft increments by gathering material along the entire length of the core with a hand trowel, in order to obtain a representative sample of the entire length of core. This process was repeated from the surface through the total depth of sand drilled, in every drill hole completed on the subject properties. Sample material was placed into burlap sample bags as it was gathered from the drill core, and each bag was labeled with the drill hole name and the top and bottom sample depth. This process was completed a second time to create a duplicate sample set of each interval drilled.
Westward geologists and geological technicians determined the terminus of the sampling interval of a drill hole when the amount of sand in a recovered interval was neither the first nor second most abundant material present.
Drilling samples were kept on-site in a secure location until the laboratory set was shipped to the respective labs, at which time Atlas obtained the duplicate set of samples for archival purposes.
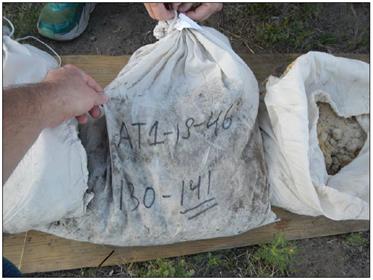
Figure 5.1: Drill Hole Sand Sample
5.2.1.1 Initial Drilling and Sampling Campaigns
The initial drilling and sampling campaigns were conducted in 2017. The completed drill holes were spaced approximately 3,000 ft to 4,500 ft apart (one hole drilled per section of controlled property). These exploration campaigns were aimed at determining the depth and lateral extent of the sand deposits across the Kermit and Monahans properties. Drilling and sampling results for each property were reviewed, and potential locations to commence mining operations were identified.
Westward retained Boart Longyear to drill the Kermit and Monahans properties, resulting in 36 holes drilled and sampled on the Kermit Property from June to July 2017, and 53 holes drilled and sampled on the Monahans Property from June to August 2017.
5.2.1.2 Infill Drilling and Sampling Campaigns
Once the initial drilling and sampling campaigns were completed and the associated lab testing results were reviewed, Atlas again retained Westward to design and complete an infill drilling campaign within the designated initial mining areas of each property. The goal of the 2018 infill drilling campaigns was to support the estimation of frac sand reserves within the designated initial mining areas of each property.
Westward supervised the drilling activities and performed geological logging and sampling. To expedite the infill drilling and sampling campaigns, two drilling companies were used, both utilizing similar track mounted rotosonic drilling rigs. Boart Longyear performed drilling work on the Kermit Property, and Yellow Jacket Drilling performed drilling work on the Monahans Property.
Both infill drilling campaigns were completed in 2018, resulting in an additional 25 holes being drilled and sampled on the Kermit Property, and 27 holes being drilled and sampled on the Monahans Property. As a result of the infill drilling program, the designated initial mining areas of each property were now drilled to a nominal 1,500-ft spacing.
5.2.1.3 Expansion Drilling and Sampling Campaign
As part of their planning for the Kermit Property, Atlas retained BOYD to locate additional drill holes throughout select areas of the property in 2021. The purpose of this campaign was to complete enough drilling and testing to allow Atlas to increase the frac sand reserve base of the Kermit Property, as Atlas considered constructing a second mining and processing facility.
BOYD located additional drill holes in areas of the Kermit Property beyond the initial reserve areas, in order to decrease the overall drill hole spacing throughout additional portions of the Kermit Property. Westward again managed and conducted the field work portion of this campaign, contracting Boart Longyear to provide rotosonic drilling services. In total, 26 drill holes were completed by September 2021 during this exploration campaign, which ultimately increased the frac sand resource/reserve area by approximately 3.5 sections of land (over 2,200 acres).
Table 5.1 below presents a summary of the number of drill holes completed during each exploration campaign, on each of the properties.
| | | | | | | | |
Table 5.1: Kermit and Manahans Drilling Campaign Summary |
| | | | | | | | |
| Rotosonic Drill Holes Completed By Driling Campaign |
| | | | | | | | |
| | 2017 | | 2018 | | 2021 | | Total |
Kermit Property | | 36 | | 25 | | 26 | | 87 |
Monahans Property | | 53 | | 27 | | - | | 80 |
Total | | 89 | | 52 | | 26 | | 167 |
Please refer to Figures 3.1 and 3.2 (pages 3-3 and 3-4), for the locations of completed drill holes on the Kermit and Monahans properties, respectively.
Samples obtained from the exploration campaigns on the Kermit and Monahans properties were sent to designated laboratories, each performing different analyses to evaluate the frac sand characteristics of the subject deposits.
Sample preparation and testing was generally completed in the same manner for each property and each drilling campaign. After samples were delivered to their respective testing laboratory, they were catalogued and then prepared for analysis. Sample preparation generally consisted of thoroughly mixing the obtained sample material and gathering a subsample large enough to perform the required analyses. The general procedure for sample analyses was as follows:
1.Prepared samples material was dried to remove moisture.
2.A 600- to 1,200-gram subsample was collected, and the initial sample weight was recorded.
3.The weighed subsample was agitated to disaggregate the material as much as possible, and then washed over a 200 mesh screen to remove fine materials (e.g., clay and silt).
4.Remaining material (larger than the 200 mesh screen size) is then dried and weighed to determine the mass of fine material that was washed out (i.e., wash loss).
5.The remaining dried subsample is split through a riffle splitter to create multiple washed samples that may be utilized for additional analyses.
6.A portion of the split sample is then either placed into a sieve stack and agitated for 20 minutes or run through a high-speed photographic particle size analyzer (i.e., CAMSIZER) to determine the particle size distribution of the subsample.
The initial drilling and sampling campaigns utilized PropTester, Inc. (PropTester), Cypress, Texas, to perform sample preparation and sieve (gradation) analyses on samples from both the Kermit and Monahans properties.
The infill drilling and sampling campaign lab testing was split up between different labs, to expedite analyses of drilling samples:
•The Kermit Property infill exploration campaign sample preparation and sieve (gradation) analyses were performed by both PropTester and FracTAL LLC (FracTAL), St. Paul, Minnesota; PropTester also created composite samples and performed crush tests and API/ISO testing.
•The Monahans property infill exploration campaign sample preparation and sieve (gradation) analyses were performed by Lonquist Engineering LLC (Lonquist), College Station, Texas, while PropTester again prepared composite samples and performed the crush tests and the API/ISO testing.
5.2.3 Other Exploration Methods
To our knowledge, no other methods of exploration (such as airborne or ground geophysical surveys) were completed on either the Kermit or the Monahans properties.
5.3.Laboratory Testing Results
The relatively uniform and clean nature of the sampled dune deposits underlying the Kermit and Monahans properties, combined with laboratory testing results, indicated that the subject properties would yield a variety of frac sand products – typically in the 40/140 mesh size fraction – that meet various customer specifications for in-basin frac sand applications within the Permian basin.
5.3.1 Frac Sand Testing Overview
5.3.1.1 Grain Size Distribution
Grain size distribution was analyzed according to API/ISO, Section 6. The weighted average grain size distribution, based on laboratory testing results, as contained within the in-place sand resources for each property is presented in Table 5.2 below.
| | | | | | | | | | | | |
Table 5.2: Particle Size Distribution |
| | | | | | | | | | | | |
| In-Place % Retained, By Mesh Size | | % Product |
| | | | | | | | | | | | |
| | +40 | | 40/70 | | 70/140 | | -140 | | 40/70 | | 70/140 |
Kermit Property | | 1.6 | | 46.6 | | 37.1 | | 14.7 | | 54.9 | | 45.1 |
Monahans Property | | 2.9 | | 54.4 | | 34.4 | | 8.3 | | 61.2 | | 38.8 |
The grain size distribution data highlights the relative fineness of the sand found within Atlas’s properties and indicates that a majority of the sand particles are concentrated between the passing 40 mesh and retained 140 mesh size fraction. Accordingly, the predominant marketable product from the Kermit and Monahans mines consists of the 40/140 mesh size sands. Refer to Figures 5.2 and 5.3 for percent of in-place frac sand material isopleths, 40/70 mesh and 70/140 mesh respectively, for the Kermit Mines, and Figures 5.4 and 5.5 for percent of in-place frac sand material isopleths, 40/70 mesh and 70/140 mesh respectively, for the Monahans Mine.
5.3.1.2 Grain Shape (Sphericity and Roundness)
Grain shape was analyzed according to API/ISO, Section 7. Under this standard, recommended sphericity and roundness values for proppants are 0.6 or greater. As part of the grain shape analysis, the presence of grain clusters (weakly cemented grain aggregates) and their approximate proportion in the sample were reported.
5.3.1.3 Crush Resistance
Crush resistance is a key test that determines the amount of pressure a sand grain can withstand under laboratory conditions for a two-minute duration. It is analyzed according to API/ISO, Section 11. Under this standard, the highest stress level (psi) in which the proppant produces no more than 10% crushed fine material is rounded down to the nearest 1,000 psi and reported as the “K-value” of the material.
5.3.1.4 Acid Solubility
Acid solubility was analyzed according to API/ISO, Section 8. Under this standard, 5 grams of proppant is treated with 100 ml of 12:3 HCI: HF at 150° F for 30 minutes. The recommended maximum acid solubility for proppants in the 40/70 size range and finer is 3.0%.
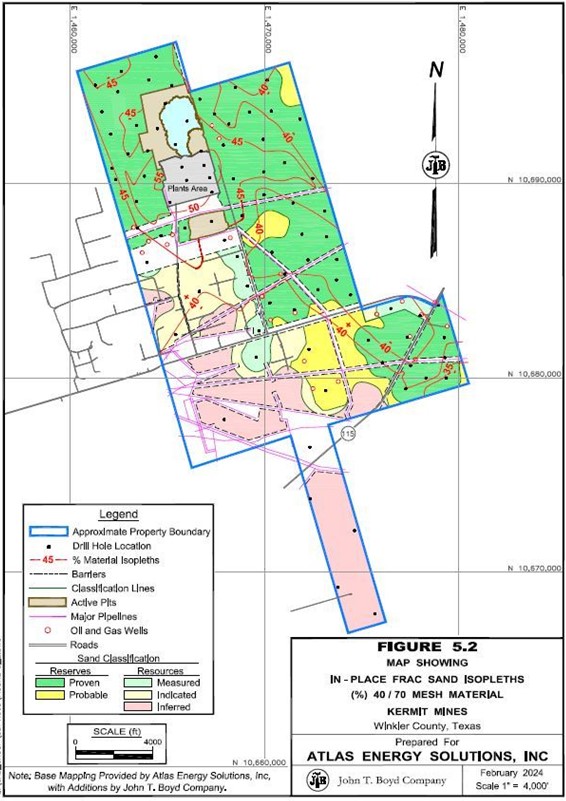
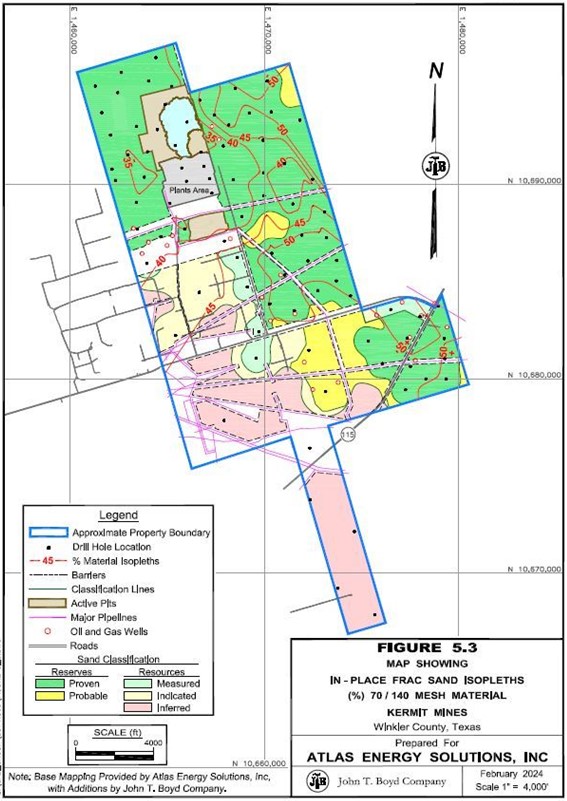
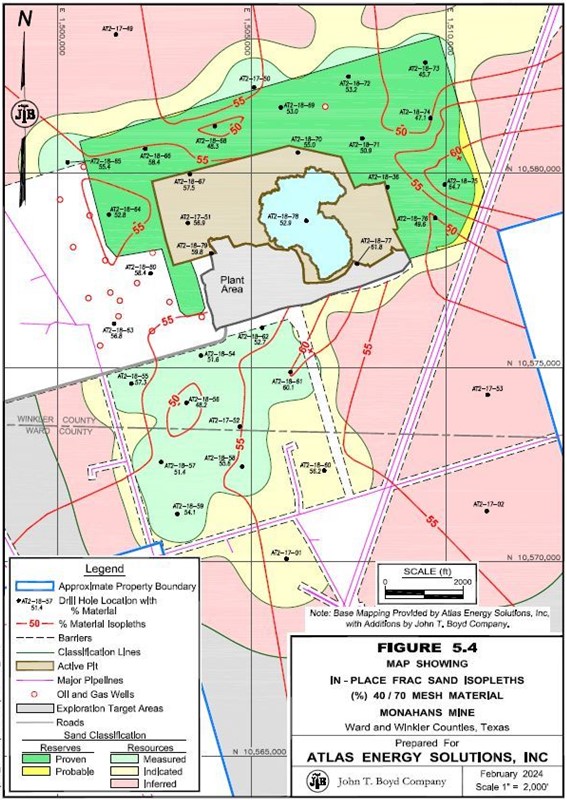
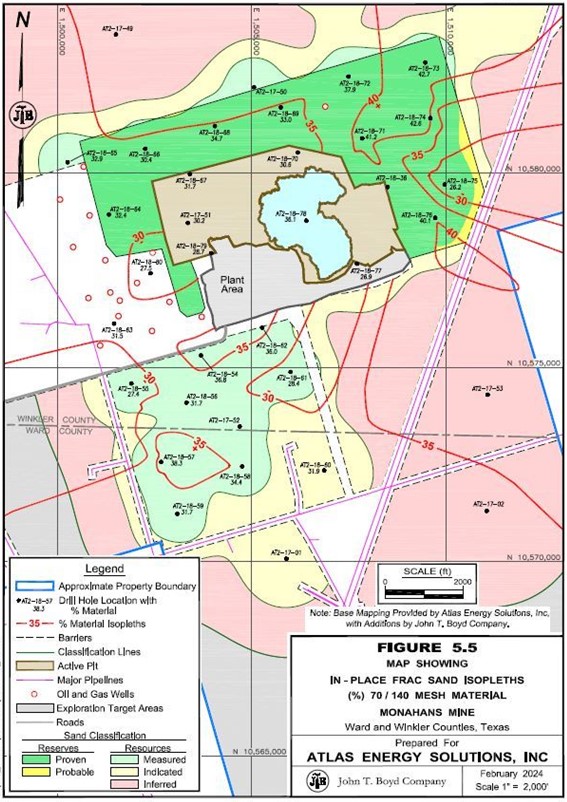
5.3.1.5 Turbidity
Turbidity was analyzed according to API/ISO, Section 9. Under this standard, the suggested maximum frac sand turbidity should be equal to or less than 250 nephelometric turbidity units (NTU).
5.3.2 Quality Summary
As general customer specifications tend to adapt to the local sand characteristics, API/ISO testing for locally sourced frac sands has become less relevant over the past several years. However, it is still of value to be able to demonstrate that the frac sand produced at a mine meets specifications for certain well applications.
PropTester and Lonquist performed API/ISO tests on composite samples created from sample material collected during the exploration campaigns completed on the Kermit and Monahans properties. The purpose of this testing was to obtain an indication of the “overall quality” characteristics of the mineable sand materials contained on the subject properties. Three drill holes located within the infill drilling areas of each property were selected to create composite samples, which consisted of samples from the entire depth drilled from each hole selected. The testing labs then created a 40/70 mesh and 40/140 mesh product cut from each drill hole composite, which were analyzed for the full suite of API/ISO proppant sand characteristics.
Atlas also performed additional crush testing to check for variability in grain strength throughout the total depth of the mineable sand interval. These additional crush tests were conducted on every 10-ft sample interval from two additional drill holes on each property. Overall, this extensive testing indicated a relatively uniform range of crush values through the entire depth of the deposit, with the exception of one or two intervals where a caliche interval was not completely removed before performing the crush tests. Results from the intervals containing caliche were about 1,000 psi less than all other intervals tested, and as such were not included in the summary quality data.
Combining the extensive crush testing conducted with the API/ISO testing performed on the composite samples, Atlas has completed a comprehensive review of grain characteristics for each of the reserve areas within the subject properties. The data indicate little variability within the overall mineable deposit of each property.
BOYD opines that the methodologies utilized during exploration, sampling, handling, security, preparation, and testing generally meet standard industry practice and present an unbiased overview of the deposits contained in the subject properties.
Sample testing results are summarized in Table 5.3 below for each product size analyzed within each property:
| | | | | | | | | | |
Table 5.3: Proppant Characteristic Test Results for Kermit and Monahans Mines |
| | | | | | | | | | |
| Average API/ISO Test Results By Product Size and Mine | | |
| 40/70 mesh | | 40/140 mesh(1)(2) |
Test | | Kermit | | Monahans | | Recommended Specification | | Kermit | | Monahans |
| | | | | | | | | | |
Sphericity | | 0.7 | | 0.7 | | ≥0.6 | | 0.7 | | 0.7 |
Roundness | | 0.8 | | 0.7 | | ≥0.6 | | 0.7 | | 0.7 |
Acid Solubility (%) | | 1.1 | | 0.9 | | ≤3.0 | | 2.6 | | 1.6 |
Turbidity (NTU) | | 15.0 | | 7.0 | | ≤250 | | 15.0 | | 13.0 |
K-Value (000 psi) | | 7 - 8 | | 7 - 8 | | - | | 10 - 11 | | 10 - 11 |
(1)100 mesh propane and material currently does not have and API/ISO specification.
(2)Test results were for a single 40/140 mesh product.
The composite testing results suggest the Kermit and Monahans mines can produce frac sands that meet minimum API/ISO recommended specifications. Moreover, Atlas has demonstrated commercial success producing and selling frac sand to Permian Basin oil and gas producers, where ultimately the sand has been shown to meet customer specifications.
5.4 Data Verification
For purposes of this report, BOYD did not verify historic drill hole data by conducting independent drilling in areas already explored. It is customary in preparing frac sand resource and frac sand reserve estimates to accept basic drilling and quality testing data as provided by the client, subject to the reported results being judged representative and reasonable.
BOYD’s efforts to judge appropriateness and reasonability of the source exploration data included reviewing provided drilling logs, sampling procedures, sand quality testing results, and discussing related aspects of the Kermit and Monahans deposits and processing operations with Atlas personnel during our site visit.
5.5 Adequacy of Exploration and Sampling Data
BOYD’s review of the reported procedures indicate the exploration and sampling data obtained for the Kermit and Monahans mines were: (1) carefully and professionally collected, prepared, and documented in conformance with general industry standards, and (2) are appropriate for use of evaluating and estimating frac sand resources and frac sand reserves. Similarly, BOYD’s review of testing data provided by Atlas suggests that the analyses completed are generally appropriate to determine frac sand characteristics a determine the subsequent quality of finished frac sand products. As such, it is BOYD’s opinion that the sampling data are also suitable for use in the estimation of frac sand resources and frac sand reserves for the Kermit and Monahans mines.
6.0 FRAC SAND RESOURCES AND RESERVES
6.1.Applicable Standards and Definitions
Unless otherwise stated, frac sand resource and frac sand reserve estimates disclosed herein are completed in accordance with the standards and definitions provided by S-K 1300. It should be noted that BOYD considers the terms “mineral” and “frac sand” to be generally interchangeable within the relevant sections of S-K 1300.
Estimates of any mineral resources and reserves are always subject to a degree of uncertainty. The level of confidence that can be applied to a particular estimate is a function of, among other things: the amount, quality, and completeness of exploration data; the geological complexity of the deposit; and economic, legal, social, and environmental factors associated with mining the resource/reserve. By assignment, BOYD used the definitions provided in S-K 1300 to describe the degree of uncertainty associated with the estimates reported herein.
The definition of mineral (frac sand) resource provided by S-K 1300 is:
Mineral resource is a concentration or occurrence of material of economic interest in or on the Earth’s crust in such form, grade or quality, and quantity that there are reasonable prospects for economic extraction. A mineral resource is a reasonable estimate of mineralization, taking into account relevant factors such as cut-off grade, likely mining dimensions, location or continuity, that, with the assumed and justifiable technical and economic conditions, is likely to, in whole or in part, become economically extractable. It is not merely an inventory of all mineralization drilled or sampled.
Estimates of frac sand resources are subdivided to reflect different levels of geological confidence into measured (highest geologic assurance), indicated, and inferred (lowest geologic assurance). Please refer to the Glossary of Abbreviations and Definitions for the meanings ascribed to these terms.
The definition of mineral (frac sand) reserve provided by S-K 1300 is:
Mineral reserve is an estimate of tonnage and grade or quality of indicated and measured mineral resources that, in the opinion of the qualified person, can be the basis of an economically viable project. More specifically, it is the economically mineable part of a measured or indicated mineral resource, which includes diluting materials and allowances for losses that may occur when the material is mined or extracted.
Estimates of frac sand reserves are subdivided to reflect geologic confidence, and potential uncertainties in the modifying factors, into proven (highest assurance) and probable. Please refer to the Glossary of Abbreviations and Definitions for the meanings ascribed to these terms.
Figure 6.1 shows the relationship between frac sand resources and frac sand reserves.
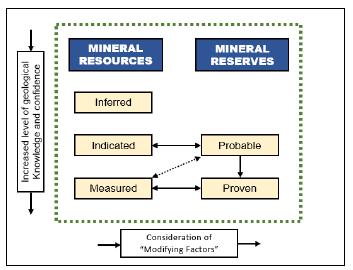
Figure 6.1: Relationship Between Frac Sand Resources and Frac Sand Reserves
In this report, the term “frac sand reserves” represents the tonnage of frac sand products that meets customer specifications and will be available for sale after processing of the ROM sand.
BOYD independently prepared estimates of in-place frac sand resources for each of the Kermit and Monahans mines by performing the following tasks:
1.Available drilling logs and laboratory testing results were compiled and reviewed to check for accuracy and to support development of each operation’s geologic model. The geologic databases utilized for modeling and estimation consist of results from 87 drill holes completed on the Kermit Property, and 80 drill holes completed on the Monahans Property, as is discussed in Chapter 5. The geologic data were imported into Carlson Software, a geologic modeling and mine planning software suite that is widely used and accepted by the mining industry.
2.A geologic model of each deposit was created in Carlson Software using industry-standard grid modeling methods well-suited for simple stratigraphic deposits. Each geologic model delineates the top and bottom of the mineable sand horizon and the distribution of the product size fractions across the deposits. The top and bottom of the mineable frac sand interval were established as follow:
a.As there is minimal overburden material across the subject properties, the top of the mineable sand interval was defined as the current ground surface, as provided by a combination of originally flown aerial topographic surveys and recently surveyed active mining pits.
b.The bottom of the mineable sand interval on both Atlas properties was determined by Westward geologists and geological technicians present during the various exploration and sampling campaigns. Westward defined the bottom of the mineable sand interval as the depth at which a drilled interval no longer contained sand as either the first or second most abundant material present.
Overall mineable frac sand thicknesses based on the defined top and bottom noted above, are presented in Figures 6.2 and 6.3, for the Kermit and Monahans properties, respectively.
3.After reviewing the continuity and variability of the deposit, suitable resource classification criteria were developed and applied as per the discussion in Section 6.2.2.
4.Estimation of the in-place frac sand resources for the Kermit and Monahans properties assumes mining operations will utilize a combination of standard surface excavation equipment for the near-surface initial operations (dry mining) and dredging equipment once initial excavation has reached into the water table. This sequence of operating is widely utilized for mining of similar deposit types. As such, the estimates were subject to the following setbacks and slope requirements:
a.50 ft inside of property lines.
c.50 ft around the wet and dry process plant areas and main access road/right of way.
d.An overall pit wall slope of 3:1 (approximately 19 degrees).
5.In-place volumes for each property were estimated from the geologic model within Carlson Software. A dry, in-place, bulk density of 100 pounds per cubic foot was used to calculate the in-place tonnage of frac sand.
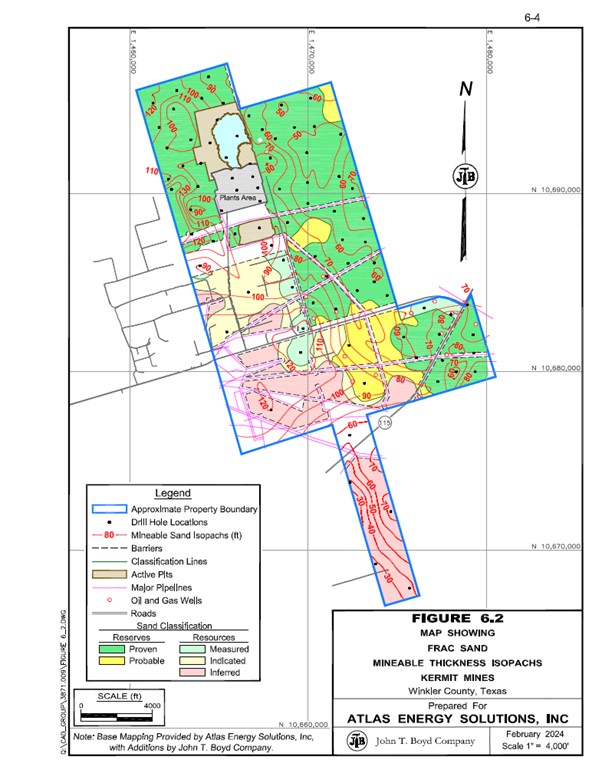
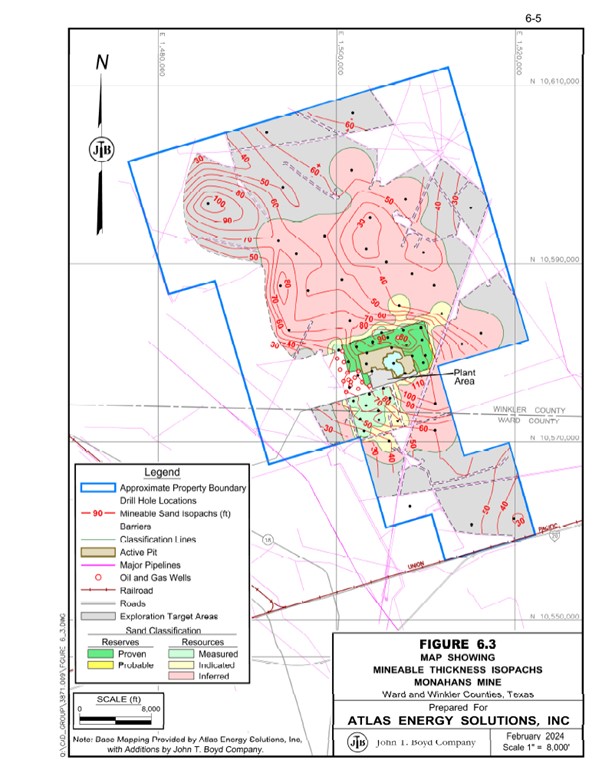
6.BOYD utilized a combination of the provided updated mining pit survey information and reported monthly production data for each of Atlas’s subject properties in order to adjust the estimate of in-place frac sand resources as of December 31, 2023.
Geologic assuredness is established by the availability of both structural (thickness and elevation) and quality (size fraction) information for the deposit. Resource classification is generally based on the concentration or spacing of exploration data which can be used to demonstrate the geologic continuity of the deposit. When material variations in thickness, depth, and/or sand quality occur between drill holes, the allowable spacing distance between drill holes is reduced. The following drill hole spacing criteria were established by the Qualified Person after review of the available exploration data and geologic models and used to classify the frac sand resources of the Kermit and Monahans mines:
| | |
Table 6.1: Kermit and Monahans Frac Sand Resource Classification Criteria |
|
Classification | | Spacing Requirement (ft) (Nominal Maximum) |
| | |
Measured | | 1,500 |
Indicated | | 2,500 |
Inferred | | 5,000 |
Extrapolation or projection of resources in any category beyond any data point does not exceed half the point spacing distance.
The surficial sand deposits on Atlas’s Kermit and Monahans properties are of low geologic complexity. Since sufficient drilling and sampling has been performed within the remaining mineable portions of the subject properties, BOYD is of the opinion that there is a low degree of uncertainty associated with the estimates of frac sand resources provided herein.
6.2.3.Estimation Criteria
Development of the frac sand resource estimates for the Kermit and Monahans properties assumes mining and processing methods and equipment which have been utilized successfully at the operation for several years.
The target mining horizons at both operations are manifested as continuous, low rolling sand dunes with relatively consistent depth, thickness, and quality. There is no discernable overburden, and the high-quality sand is easily distinguished from the underlying waste unit; as such, interpretation of the mineable horizon is relatively easy. Generally, the entire sand interval, from the surface to the total depths drilled, is mined and processed Atlas’s Kermit and Monahans operations. The mined sand is processed to remove out-sized material (i.e., sand which is either too coarse or silts/clays which are too fine to be sold) and produce saleable
finished products. The amount of finished sand produced as a percentage of the raw sand mined is referred to as the processing yield (or plant yield), which is analogous to the “cut-off grade” of other mining operations. If the expected processing yield of the sand is too low, the costs of production will outweigh sales revenues and the deposit cannot be economically mined. The minimum economic processing yields are approximately 30% at the Kermit Mines and 39% at the Monahans Mine, based on 3-year historic financial results provided from each operation; however, this is well below the expected processing yields of these deposits. Other limiting criteria, such as minimum mining thicknesses or maximum stripping ratios (the ratio of waste to sand excavated) are generally not considered in the estimation of frac sand resources for the Kermit and Monahans mines.
The limits of the frac sand resources are constrained to those portions of the interpreted sand deposit that:
•Are reasonably defined by available drilling and sampling data.
•Contain products that meet generally accepted specifications and can be sold at a profit (i.e., be economic).
•Honor any legal mining constraints (e.g., property boundaries, environmental setbacks, utility and infrastructure setbacks, etc.).
•Adhere to physical mining limitations.
Frac sand resources for the subject properties are assessed for reasonable prospects for eventual economic extraction by reporting: (1) those resources which have been subsequently converted to proppant sand reserves after the application of all material modifying factors, and/or (2) those resources which have similar characteristics (i.e., mining conditions, and expected processing yields and qualities) to those converted to frac sand reserves.
The criteria employed in developing the estimates of frac sand resources for the Kermit and Monahans mines are supported by historical results and align with those employed at similar operations. As such, it is BOYD’s opinion that the stated criteria are reasonable and appropriate for the estimation of frac sand resources at the Kermit and Monahans mines.
6.2.4.Frac Sand Exploration Results Areas
There are significant portions of the Monahans Property in which some exploration has been performed (i.e. holes drilled) but for which the distance between drill holes falls outside of the classification criteria noted in Section 6.2.2. These “Exploration Results Areas” are confined to the outer-most portions of the Monahans Property. No Exploration Results Areas are located on the Kermit Property.
Exploration Results Areas have less geologic confidence than Inferred Resources and are not quantifiable or reportable under the S-K 1300 guidelines. The intent of disclosing the acreage in Table 6.2, below, is generally to let the reader know that even beyond the extensive quantity of reportable frac sand resources and reserves, it is likely that additional exploration will confirm the existence of frac sand resources beyond those identified
as of the effective date of this report. Exploration results from these portions of the deposit exhibit similar characteristics, both in thickness and frac sand quality to that of the reported frac sand resources and frac sand reserves. The following table presents a summary of characteristics of the Monahans Property Exploration Results Areas, based on drilling and sampling data completed to date.
| | | | | | | | | | |
Table 6.2: Exploration Results Area Deposit Characteristics, Monahans Property |
| | | | Total Drill Hole Count | | Sand Thickness (ft) |
Property | | Acres | | | Min | | Max | | Average |
Monahans | | 9,575 | | 8 | | 13 | | 115 | | 58 |
6.2.5.Frac Sand Resource Estimates
Significant amounts of reportable frac sand resources, in addition to those converted to frac sand reserves within each property’s mine plan area, exist for both the Kermit and Monahans properties. These quantities of frac sand resources fall within the defined boundaries of the Kermit and Monahans properties and are not reported as frac sand reserves, however they are considered to be potentially material to each operation. Reportable resources must have demonstrated geoscientific information based on varying levels of drilling, sampling, and laboratory testing results. The quantities of frac sand resources (in addition to the reported frac sand reserves) available at the Kermit and Monahans mines are presented in the following table.
| | | | | | | | | | |
Table 6.3: In-Place Frac Sand Resources as of December 31,2023 |
Resource Category | | Acres | | Average Sand Thick (ft) | | Estimated In-Place Frac Sand Tons (000) |
| | Owned | | Leased | | Total |
| | | | Kermit Mines | | | | |
Measured | | 165 | | | | 2,750 | | 16,636 | | 19,386 |
Indicated | | 460 | | | | 563 | | 75,515 | | 76,078 |
Inferred | | 800 | | | | - | | 75,076 | | 75,076 |
Total | | 1,425 | | 74 | | 3,313 | | 167,227 | | 170,540 |
| | | | Monahans Mine | | | | |
Measured | | 487 | | | | - | | 71,730 | | 71,730 |
Indicated | | 785 | | | | - | | 102,755 | | 102,755 |
Inferred | | 8,908 | | | | - | | 1,094,030 | | 1,094,030 |
Total | | 10,180 | | 57 | | - | | 1,268,515 | | 1,268,515 |
| | | | | | | | | | |
BOYD independently estimated in-place frac sand resources for the Kermit and Monahans operations based on the provided drilling, sampling, and testing data provided by Atlas. We have reviewed this information, on a representative basis, by confirming the accuracy of geologic model inputs by comparison with drilling logs and laboratory reports. Utilizing industry-standard grid modeling techniques we have estimated volumes of frac sand present on each property, as indicated by such data. Based on our review of Atlas’s well-documented geologic exploration and sampling methods, we are of the opinion that the data provided are reasonable and appropriate, and our independent geologic model is representative of the informing data and that the data are of sufficient quality to support the estimates of frac sand resources provided herein. Furthermore, it is our
opinion that the estimation methods and criteria employed are both appropriate and reasonable for the deposit type and proposed extraction methods.
Estimates of frac sand reserves for the Kermit and Monahans mines were derived contemporaneously with the estimates of frac sand resources for each property. To derive an estimate of saleable product tons (proven and probable frac sand reserves), the following modifying factors were applied to the in-place measured and indicated frac sand resources underlying the respective mine plan areas of each operation:
•A 95% mining recovery factor which assumes that 5% of the mineable (in-place) frac sand resource will not be recovered for various reasons. Applying this recovery factor to the in-place resource results in the estimated ROM sand tonnage that will be delivered to the wet process plants.
•Processing recoveries, based on exploration sample gradation testing, are 85% for the Kermit Mines, and 88% for the Monahans Mine. These recovery factors account for removal of out-sized (i.e., larger than 40 mesh and smaller than 140 mesh) sand and losses in the wet processing plants, and minor dry processing plant inefficiencies.
The overall product yields (after considering both the mining and processing losses discussed above) for the Kermit and Monahans operations are estimated at 81% and 83%, respectively. That is, for every 100 tons of in-place frac sand resources available at each operation, approximately 81 tons will be recovered and sold as product from the Kermit Mines, and approximately 83 tons will be recovered and sold as product from the Monahans Mine.
BOYD estimated reserves on the subject properties utilizing current mining pit extents and depths as of early December 2023, together with adjusted December 2023 actual production data, in order to arrive at an estimate of frac sand reserves for the Kermit and Monahans operations, as of December 31, 2023.
Proven and probable frac sand reserves are derived from estimated measured and indicated frac sand resources, respectively, which have a life-of-mine projected mine plan developed in accordance with S-K 1300. BOYD is satisfied that the frac sand reserve classifications reflect the outcome of technical and economic studies. Figures 6.2 and 6.3 also illustrate the reserve classifications of the Kermit and Monahans operations, respectively.
6.3.3.Frac Sand Reserve Estimates
BOYD’s estimate of surface mineable frac sand reserves for the Kermit Mines totals approximately 337.6 million saleable product tons, as of December 31, 2023.
Estimated surface mineable frac sand reserves for Atlas’s Monahans Mine total approximately 150.5 million saleable product tons, as of December 31, 2023.
The following table presents the estimated frac sand reserve by product (size), for each operation, as of December 31, 2023.
| | | | | | | | | | | | | | | | | | |
Table 6.4: Frac Sand Reserves as of December 31,2023 |
| | Tons (000) By Classification and Mesh Size |
| | Proven | | Probable | | Total By Mesh Size |
Control | | 40/70 | | 70/140 | | Total | | 40/70 | | 70/140 | | Total | | 40/70 | | 70/140 | | Total |
| | | | | | | | Kermit Mines | | | | | | | | |
Owned | | 81,869 | | 67,718 | | 149,587 | | 254 | | 317 | | 571 | | 82,132 | | 68,035 | | 150,158 |
Leased | | 70,709 | | 80,410 | | 151,119 | | 16,215 | | 20,066 | | 36,281 | | 86,924 | | 100,476 | | 187,400 |
Total | | 152,578 | | 148,128 | | 300,706 | | 16,469 | | 20,383 | | 36,852 | | 169,047 | | 168,511 | | 337,558 |
| | | | | | | | Monahans Mine | | | | | | | | |
Leased | | 90,294 | | 58,000 | | 148,294 | | 1,372 | | 819 | | 2,191 | | 91,666 | | 58,819 | | 150,485 |
The reported reserves include only frac sand which is reportedly leased or owned as of December 31, 2023.
Atlas owns approximately 150.2 million product tons at the Kermit Mines, or approximately 44% of the current frac sand reserves for this operation, with the remainder held under lease agreements.
At the Monahans Mine, Atlas holds leases for all reported reserves.
The frac sand reserves at Atlas’s Kermit and Monahans mines are generally well-explored and defined. It is our conclusion that approximately 91% of the stated reserves at the Kermit Mines, and approximately 98% of the stated reserves at the Monahans Mine, can be classified in the proven reliability category (the highest level of assurance) with the remainder classified as probable.
The estimated product distribution of the frac sand reserves is based on a combination of available laboratory gradation test data and actual production yields provided by Atlas. Grain size distribution and overall yields may vary based on the depth and location at which mining occurs.
The subject operations, and other frac sand operations in the area, have a well‑established history of mining and selling frac sand products into the local Permian Basin energy fields. BOYD has assessed that sufficient studies have been undertaken to enable the frac sand resources to be converted to frac sand reserves based on current and proposed operating methods and practices. Changes in the factors and assumptions employed in these studies may materially affect the frac sand reserve estimate.
The economic viability of the stated frac sand reserves is demonstrated by forecasted sales prices of $30.00 per ton sold for all products sold from the Kermit and Monahans operations (refer to Sections 11.2.4.1 and 11.3.4.1 for additional information). The economic analyses performed on the Kermit and Monahans operations support the statements of frac sand reserves provided herein (refer to Chapter 12 for additional information pertaining to the respective economic analyses).
6.3.4.Significant Risks and Uncertainties
The extent to which the frac sand reserves may be affected by any known geological, operational, environmental, permitting, legal, title, variation, socio-economic, marketing, political, or other relevant issues has been reviewed as warranted. It is the opinion of BOYD that Atlas has appropriately mitigated, or has the operational acumen to mitigate, the risks associated with these factors. BOYD is not aware of any additional risks that could materially affect the development of the frac sand reserves.
Given the data available at the time this report was prepared, the estimates presented herein are considered reasonable. However, they should be accepted with the understanding that additional data and analysis available after the date of the estimate may result in a change to the current estimate. These revisions may be material.
Based on our independent estimate and operations review, we have a high degree of confidence that the estimates shown in this report accurately represent the available frac sand reserves controlled by Atlas, at the Kermit and Monahans mines, as of December 31, 2023.
6.3.5.Reconciliation with Previous Estimates
When comparing the Kermit Mines’ estimated frac sand reserves as of December 31, 2023, with those reported as of December 31, 2022, we note a net increase. This increase is a direct result of converting a significant portion of the operations’ frac sand resources to frac sand reserves in order to support the operational capacity of the Kermit Mines. Depletion through ordinary mining operations and inventory sales was also considered, and combined with the added reserves, resulting in a net increase of approximately 144.7 million tons of additional frac sand reserves at the Kermit Mines. Figure 6.4, below, illustrates the effect of each of these changes.
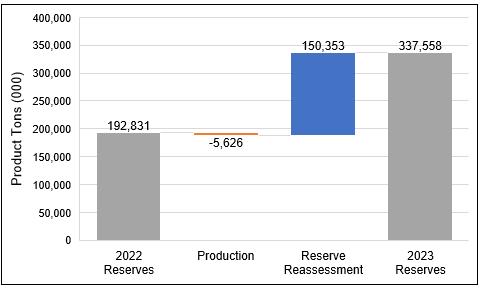
Figure 6.4: Kermit Reconciliation with Previous Frac Sand Reserves Estimate
When comparing the Monahans Mine’s estimated frac sand reserves as of December 31, 2023, with those reported as of December 31, 2022, we note a net decrease. This decrease is the result of depletion through ordinary mining operations and inventory sales, as well as minor reserve boundary reassessments. Together, these changes resulted in a net decrease of approximately 14.1 million tons of frac sand reserves at the Monahans Mine. Figure 6.5, below, illustrates the effect of each of these changes.
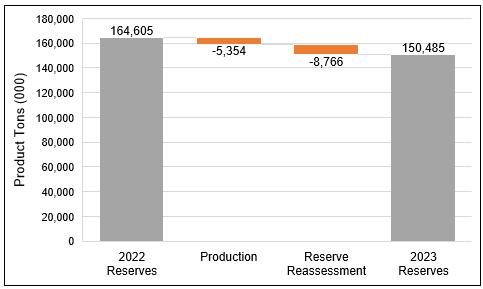
Figure 6.5: Monahans Reconciliation with Previous Frac Sand Reserves Estimate
7.0 MINING OPERATIONS
The Kermit and Monahans mines both employ a sequence of dry mining in higher elevation areas initially, followed by dredge mining once excavation penetrates the water table. Most of the mineable area at both locations has minimal overburden and vegetation; as such, sand excavation begins at the ground surface throughout most of the mine plan areas. The water forming the dredge ponds is sourced from a shallow aquifer which lies below each property. Both properties utilize a common suction dredge, which consists of a floating barge that lowers an arm or “ladder” with an attached submersible pump to the bottom of the deposit. The Kermit operations’ dredge pond and one of its dredges are shown in Figure 7.1 below.
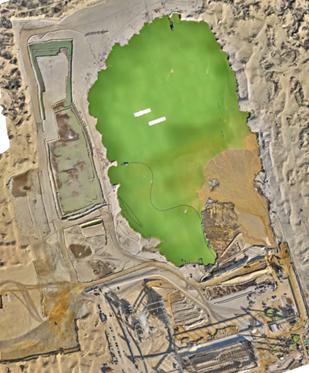
Figure 7.1: Kermit Mines’ Dredge Pond
Dredged sand is pumped through floating poly pipes to the mine skids, where material greater than 1.5 mm in size is removed. The remaining sand is then further pumped to the wet plants, where tailings and excess water are removed and returned to the dredge pit.
7.2.Mine Schedule and Equipment
The Kermit operations are replacing their existing dredge with two new dredges to scale production up to 10.5 million product tons annually. This production target requires approximately 12.4 million ROM tons of sand being mined in total, or between 6 to 6.5 million ROM tons annually, per dredge. Commissioning of the two new dredges is planned for the first half of 2024, at which time the current Kermit dredge will be moved to the Monahans Mine to join the dredge already located there. The Monahans site will dredge approximately 5.7
million ROM tons per year to produce 5 million tons of finished product annually. Between all three operations, the four dredges will operate year-round and be able to supply enough ROM sand to produce between 15 to 16.5 million tons of finished frac sand per year.
The primary mobile equipment involved in the sand excavation, processing, and loading (other than the dredges) includes excavators, dozers, front-end loaders, skid steers, telehandlers, water trucks, personnel lifts, motor graders, sweepers, and vac trailers.
Various fuel tanks, lube tanks, and other storage tanks are also located throughout each of the operations.
7.3.Mine Historical and Forecast Production
7.3.1.Historical Mine Production
Atlas produces predominantly 40/70 mesh and 100 mesh (70/140 mesh) frac sand products for sale into the Permian Basin.
Currently, the final sand products are shipped from both facilities by highway truck. The Kermit Mines will, however, have the capability of shipping finished sand product via conveyor once construction on Atlas’s “Dune Express” overland conveyor system is complete. Production from the subject operations commenced in July 2018 at Kermit, and October 2018 at Monahans. Historic production for the last two years is presented in Table 7.1, below.
| | | | |
Table 7.1: Historic ROM Sand Production (000 tons) |
| | 2022 | | 2023 |
Kermit Mines | | 5,125 | | 5,742 |
Monahans Mine | | 5,282 | | 5,169 |
7.3.2.Forecasted Production
Forecasted ROM sand production over the next five years for the Kermit and Monahans mines is presented in Table 7.2, below.
| | | | | | | | | | |
Table 7.2: Forecasted ROM Sand Production (000 tons) |
| | 2024 | | 2025 | | 2026 | | 2027 | | 2028 |
Kermit Mines | | 12,355 | | 12,355 | | 12,355 | | 12,355 | | 12,355 |
Monahans Mine | | 5,680 | | 5,680 | | 5,680 | | 5,680 | | 5,680 |
7.4.Mine Plan (Life-of-Mine)
As of December 31, 2023, the frac sand reserves for the Kermit Mines are estimated at 337.6 million product tons. Atlas has developed a long range mine plan, as illustrated in Figure 7.2 on the following page, for the extraction of these reserves, utilizing the following assumptions:
•Total dredge depths ranging from 78 ft to 104 ft below land surface.
•Pumping approximately 12.4 million ROM tons per year.
•Mine life of currently planned frac sand reserve totaling 31 years to 2055, at 10.5 million tons per year sales.
As of December 31, 2023, the frac sand reserves for the Monahans Mine are estimated at 150.5 million product tons. The current mine plan is illustrated in Figure 7.3 (page 7-5) and utilizes the following assumptions:
•Dredge depth ranging from 67 ft to 91 ft below land surface.
•Pumping approximately 5.7 million ROM tons per year.
•Mine life of currently planned frac sand reserves is approximately 28 years to 2053.
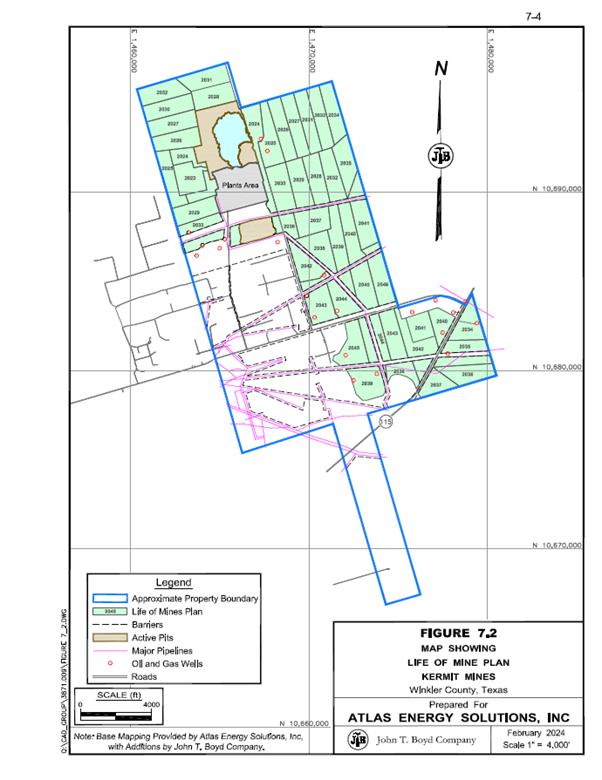
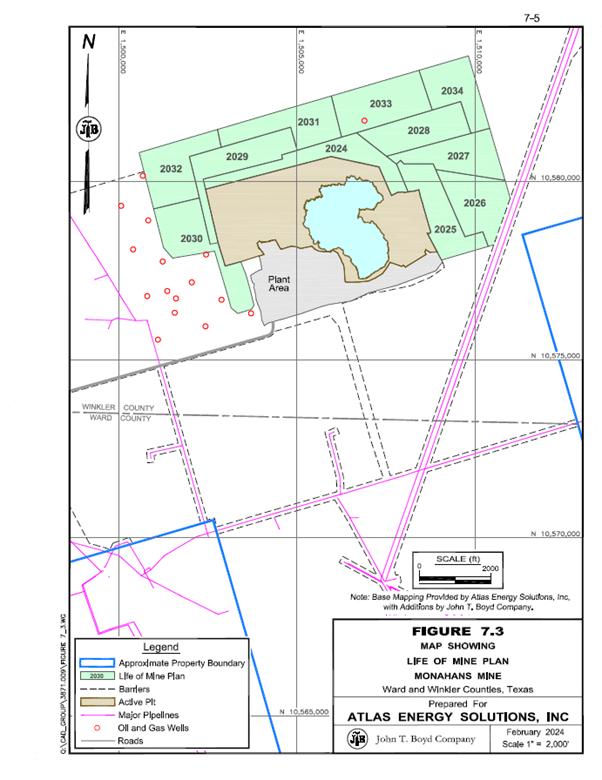
Surface mines face two primary types of operational risks. The first category of risk includes those daily variations in physical mining conditions, mechanical failures, and operational activities that can temporarily disrupt production activities. Several examples are as follows:
•Process water spot shortages
•Variations in grain size consistency
•Encountering excessive clay and other waste material
•Failures or breakdowns of operating equipment and supporting infrastructure
•Adverse weather disruptions (power outages, dust storms, excessive heat etc.)
The above conditions/circumstances can adversely affect production on any given day but are not regarded as “risk issues” relative to the long-term operation of a mining entity. Instead, these are considered “nuisance items” that, while undesirable, are encountered on a periodic basis at many mining operations. BOYD does not regard the issues listed above as being material to the mining operations or otherwise compromising their forecasted performance.
The second type of risk is categorized as “event risk.” Items in this category are rare, but significant occurrences that are confined to an individual mine, and ultimately have a pronounced impact on production activities and corresponding financial outcomes. Examples of event risks are major fires or extreme droughts, floods, or unforeseen geological anomalies that disrupt extensive areas of proposed or operating mine workings and require alterations of mining plans. Such an event can result in the cessation of production activities for an undefined but extended period (measured in months, and perhaps years) and/or result in the sterilization of frac sand reserves. This type of risk is minimal in a relatively simple surface sand mining operation.
8.0 PROCESSING OPERATIONS
The processing plants at Kermit and Monahans were constructed by Atlas with work directed and supervised by experienced project managers. Originally, each property had a nominal capacity of approximately 5.5 million tons per year of finished product; however, a second mining and processing facility was added to the Kermit property in 2023, which increased the total production capacity from 5.5 million tons per year to approximately 11 million tons per year. The Kermit and Monahans operations predominantly produce 40/70 mesh and 40/140 mesh-sized frac sand—that is, sand particles larger than 40 mesh and smaller than 140 mesh are not considered finished product and are discarded as waste.
The Kermit process plants, both wet and dry, have an overall process yield of approximately 85%. For every 100 tons ton of ROM dredged material fed into the wet plants, approximately 85 tons of finished sand is produced. Similarly, the Monahans process plant has an approximate process yield of 88%. The estimated process yields reported are the average laboratory yield from the drill hole samples representative of the entire properties. These yields are utilized in the frac sand reserve estimates. Actual process yields may be higher or lower based on the location and depth of mining. Current (2023) process yields are reported to be approximately 86% at Kermit and 91% at Monahans.
The Kermit and Monahans process operations are similar and consist of the following activities:
•Wet Process Plants ROM material from the dredge is pumped to the wet plant where the material larger than 40 mesh and finer than 140 mesh is removed. Fines are eventually pumped back into the depleted dredge lakes.
•Dry Process Plants The damp 40/140 mesh material resulting from the wet process plant is dried and screened into finished products.
•Storage and Loadouts Finished product is stored in silos and gravity loaded into drive through highway truck loadouts for transport to the customer. The Atlas loadouts operate 24 hours per day, 7 days per week, every day of the year.
A general layout of the processing operations is illustrated in Figure 8.1:
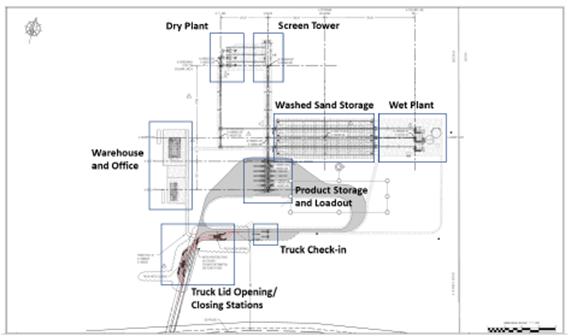
Figure 8.1: General Arrangement Layout of Atlas Processing Plants
ROM sand is first pumped from the dredge pit to the wet plants where the feed material is dewatered and deslimed before being liberated of clays and other deleterious materials. Rinse water is added and then removed carrying away any contamination, and the process water is then recycled. The closed loop process water circuit should allow for efficient use of water as the majority is collected and recycled, as water conservation is a high priority at the subject operations. Washed sand is then stored in two large stockpiles where it naturally decants prior to dry processing.
The Kermit wet plants have recently increased finished capacity by approximately 750 feed tons per hour to 1500 feed tons per hour. The Monahans wet plant has an approximate capacity of 750 feed tons per hour.
The dry process plants utilize rotary dryers operating in parallel to complete the drying process. The dryers are fueled by line natural gas. After drying, the sand is conveyed to the screen tower where multi-deck screeners remove oversized material as well as segregate the 40/70 mesh and 40/140 mesh products.
The two Kermit plants recently increased dry plant capacity by 600 tons per hour to 1200 tons per hour of finished product throughput capacity. The Monahans dry plant has 600 tons per hour of finished product throughput capacity.
On-site quality laboratories regularly sample and monitor production and finished sand quality daily.
8.4.Product Storage/Truck Loadouts
The Kermit and Monahans loadouts operate 24 hours per day, 7 days per week, every day of the year. Both facilities have seven under silo product loadouts with truck scales. Figures 8.2 and 8.3 illustrate the overall layout of each plant, including the truck under silo product loadouts. All of the frac sand products are trucked to the well site from the facilities.
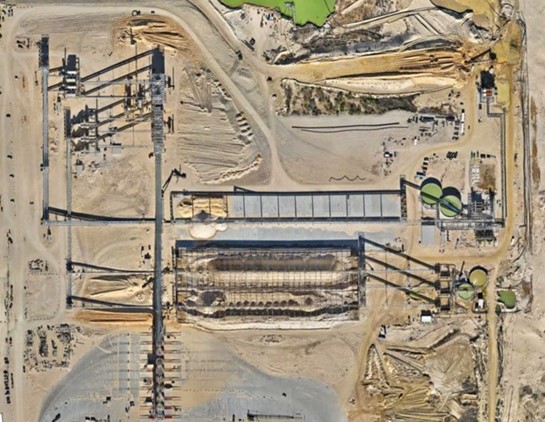
Figure 8.2: Kermit Plant with Capacity Expansion
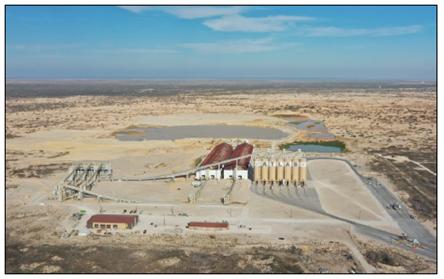
Figure 8.3: Monahans Plant with Truck Loadouts
9.0 MINE INFRASTRUCTURE
All of the basic infrastructure required for the ongoing mining and processing operations is in place at the Kermit and Monahans facilities. Figures 3.1 (page 3-3) and 3.2 (page 3-4) illustrate the general layout of the infrastructure at the Kermit and Monahans operations, respectively.
The surface facilities currently located at the operations are well constructed and have the necessary capacity/capabilities to support near-term operating plans. Operational preference may lead to the upgrading of some existing facilities if the operation expands in the future.
BOYD is unaware of any reported interruptions, outages, shortages, or failures related to infrastructure requirements that have materially affected either the Kermit or Monahans operations. Given the operations are well-established, we believe the risk of such events materially affecting the estimates of frac sand reserves presented herein is low.
The Kermit and Monahans operations are serviced by several roads maintained by the local municipality, county, and state governments. These roads are either paved or well‑maintained graded roadways. Road access is available year-round.
There is not any rail infrastructure available at either of the operations. All finished frac sand products are currently shipped via bulk trucks. However, Atlas is underway on completing construction of their Dune Express sand conveyor, which is a 42-mile electric conveyor system originating at the Kermit Mines.
9.3.Utilities (Power and Natural Gas)
Each operation is supplied with three-phase line power. Substations access 138 kV lines and step voltage down to 12.5 kV lines which deliver power to the plants. Line natural gas is supplied to all plants. Natural gas line capacity and substation capacity at the plants is sufficient to serve much more than 100% of Atlas’s current requirements.
Plant process water is recycled within the plants and is pumped from the dredge pond reservoir. Additional makeup water is obtained from wellfields near the plants. The wells are only utilized as a backup water supply.
The mining and processing of frac sand at each of the operations creates a substantial amount of tailings (i.e., waste material). These tailings are typically a mixture of clay, very fine sand, and other non-silica minerals. Tailings are typically disposed of in ponds and former mining areas where the solid materials settle to the bottom and water is recovered for reuse. As mining progresses, depleted mining areas will become new tailings disposal sites. A freshwater pond is maintained on the property so water can be stored after processing through the tailings ponds.
On-site facilities at each operation include a scale house, office, shop, and a quality laboratory located in the dry process plant.
10.0 MARKET ANALYSIS
The Permian Basin’s (Permian) frac sand market is driven by unconventional horizontal drilling in the oil and gas industry. In the late 1990s, rapid advances in horizontal drilling and hydraulic fracturing (fracking) in North America ushered in large-scale commercial oil and gas production. This fracking technique has been increasingly successful and modified over time to extract oil and gas held in dense layers of shale rocks, whose low permeability had previously prevented the flow of hydrocarbons.
Hydraulic fracturing uses a mixture of water, chemicals, and proppant (natural sand or man-made sand-like substances) to fracture shale rock and release hydrocarbons such as oil, natural gas, and natural gas liquids. The proppant acts to keep the fractures open (prop) while the pressurized fluids flow back up the well piping. Wells have become more productive with the addition of horizontal drilling capabilities, longer lateral lengths, and multi-stage fracks.
North America’s shale oil industry’s growing competitiveness gained through continuous technology improvement and falling production costs have had major implications on the global energy market. Oilfield service companies, including frac sand producers, made significant efficiency gains in 2020 to survive lower commodity prices because of the COVID-19 pandemic. These gains have followed through to present day.
Figure 10.1, on the following page, illustrates the CME Group’s West Texas Intermediate (WTI) Crude Oil Annual Average Futures Price. We estimate breakeven pricing for unconventional oil wells in the Permian to be in the $30 to $40 per barrel range. 2023 WTI futures estimate pricing to generally be in the $64 to $75 range through 2032. This cost and pricing combination supports positive wellfield economics and thus frac sand consumption.
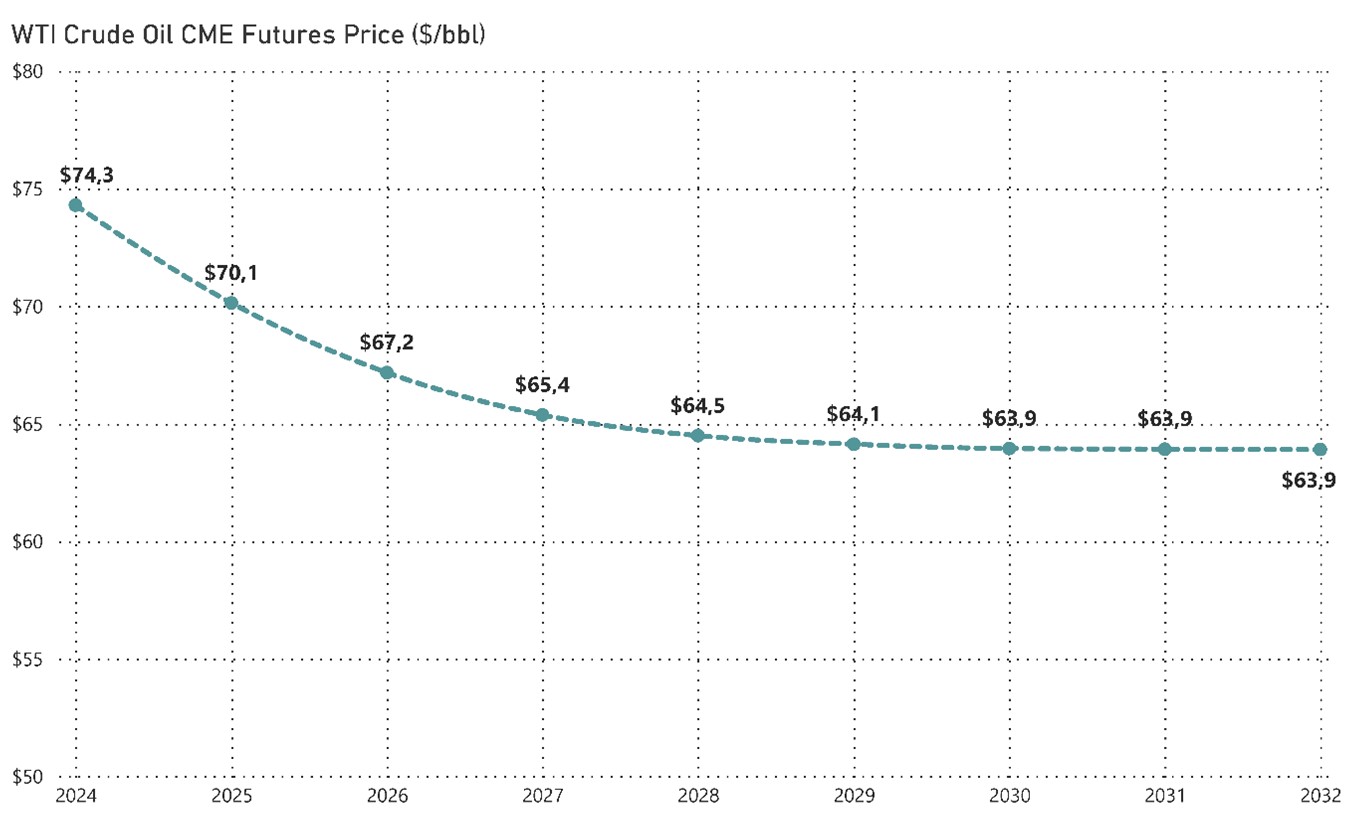
Source: CME Group
Figure 10.1: WTI Crude Oil CME Futures Price
Figure 10.2, on the following page, is compiled from downloaded and processed publicly available data from the Railroad Commission of Texas (RCC) for horizontal oil and gas permits in the U.S. This data shows a steady increment from the post-pandemic all-time low of 716 permits recorded in the 2nd quarter of 2020, to almost 2,000 permits in the 3rd quarter of 2022. From this period until the 4th quarter of 2023, a slow decreasing trend is shown with an average of 1,600 permits by quarter. It is important to note in this figure that most of the permits are based in the Permian region (with an average of 70% of all permits) followed next by permits in the Eagle Ford region (with an average of 21% of all permits) over the last 4 years.
From the 1st quarter of 2021 to the 4th quarter of 2023, the global distribution by permit type is 76% oil and 24% gas. Permit submissions for horizontal oil and gas wells in the
Permian follow the same trend of the U.S. Global Permits which suggests a continuation of strong drilling ahead.
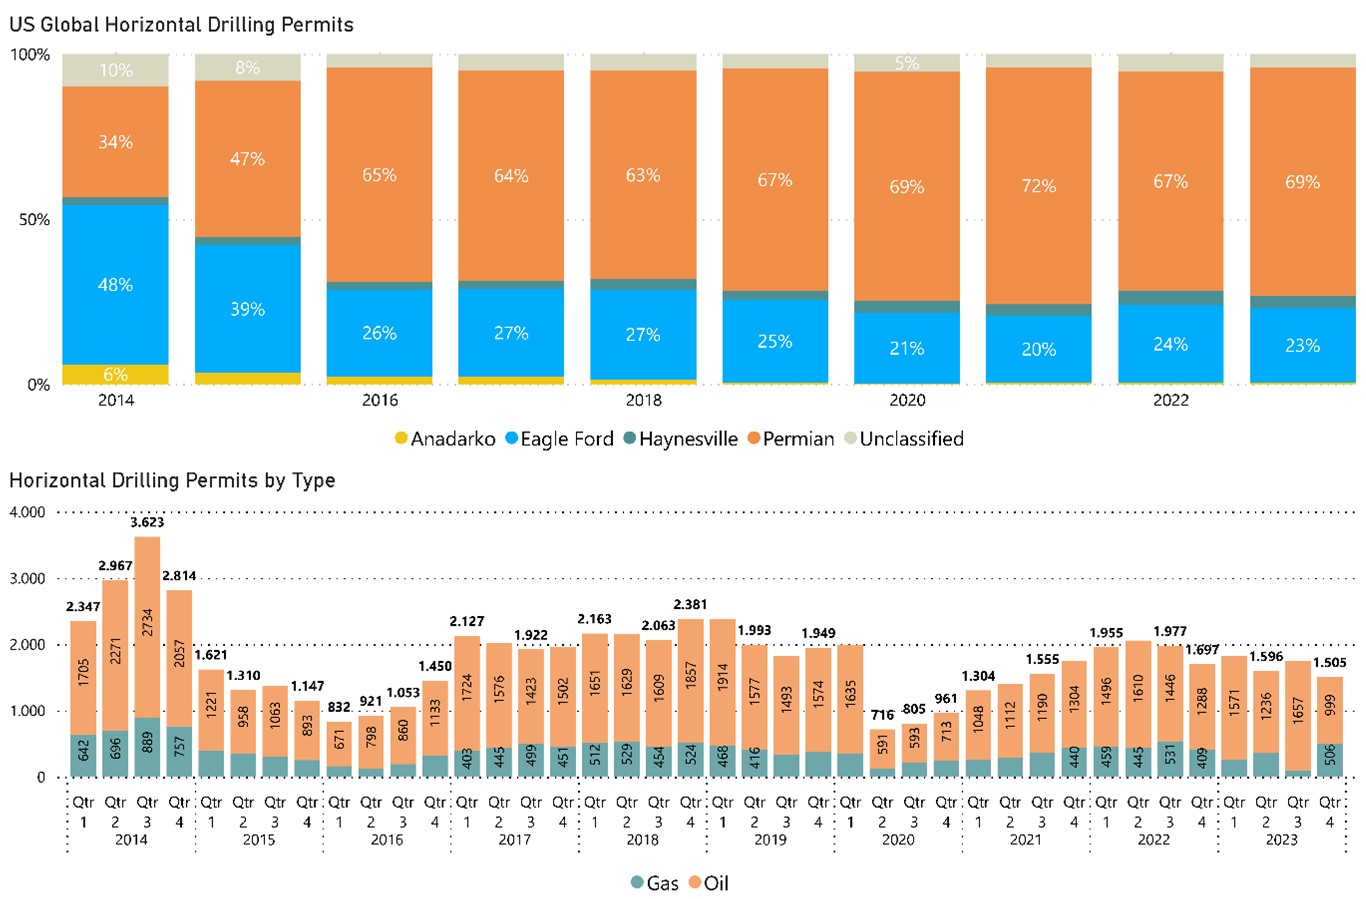
Source RCC
Figure 10.2: U.S. Global Horizontal Drilling Permits by Region and Type
A quarterly summary of Permian horizontal oil and gas well permits (from 2014 through 2023) is presented in Figure 10.3 below.
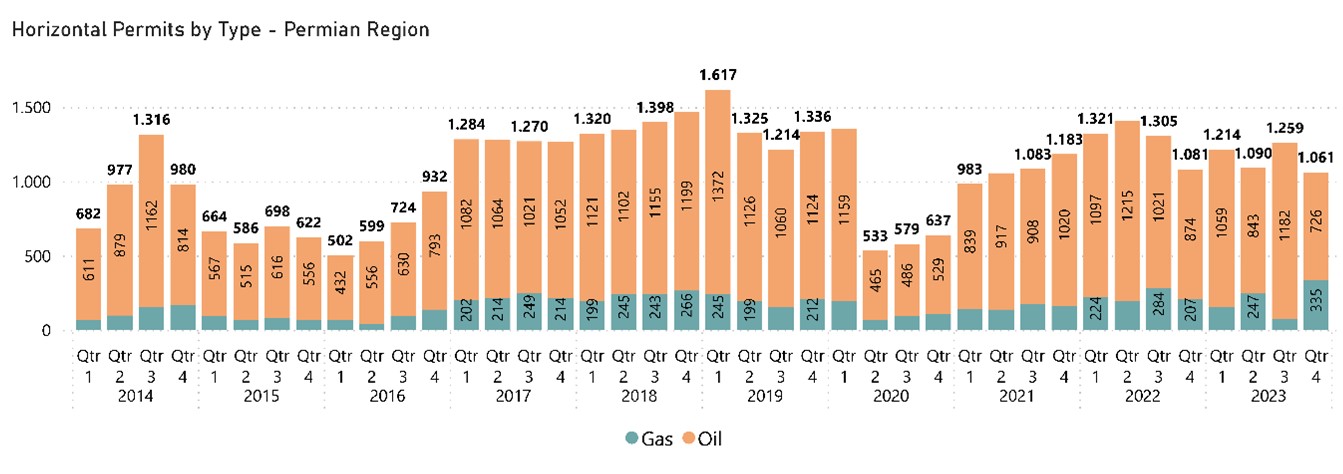
Source RCC
Figure 10.3: Permian Region Horizontal Drilling Permits by Type
Figure 10.4 was prepared combining data available for the current working rigs by region and the horizontal drilling permits. From September 2020 there is a noticeable and constant increase in the rig counts, reaching an all-time high number of permits since the COVID-19 pandemic in January 2023.
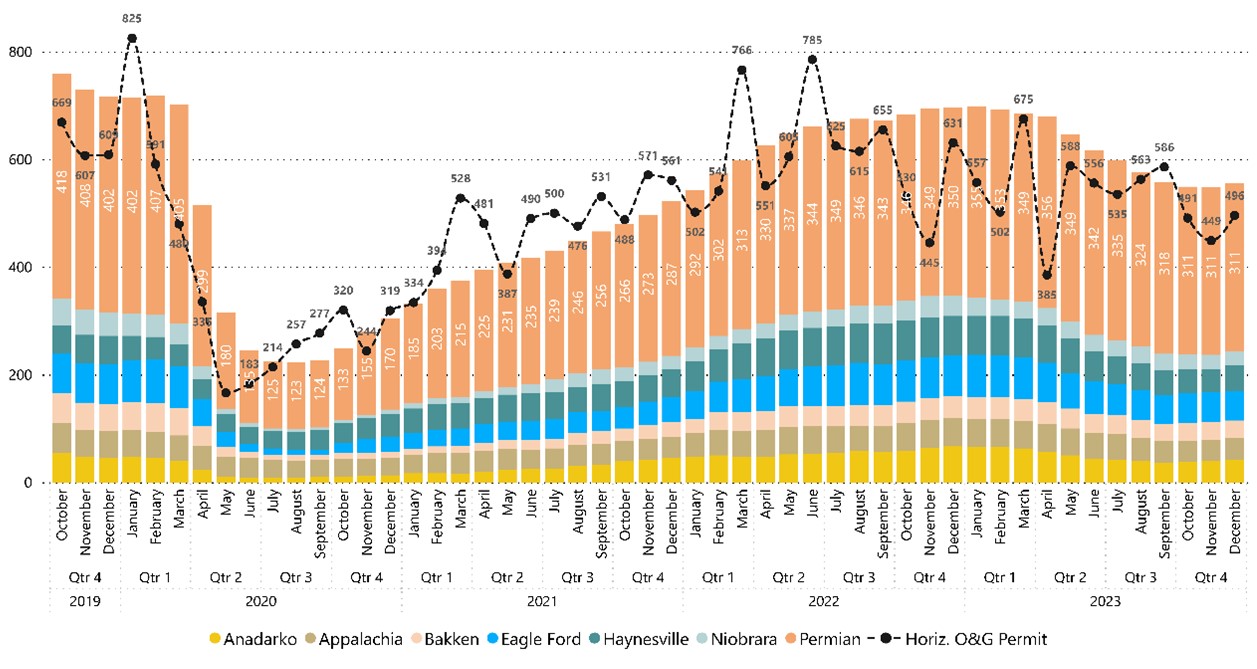
Source EIA and RCC
Figure 10.4: U.S. Horizontal Drilling Permits
During the previous 52 weeks, rig counts were down approximately 13%. However, the continuous growth through the last three years has led to increased production for both crude oil and natural gas. For the same period, crude oil (barrels per day) and natural gas production (thousand cubic feet per day) in the Permian are up 30% and 24%, respectively.
As Figures 10.5 and 10.6 illustrate, Permian daily crude oil production is reaching multi-year highs, while daily natural gas production in the Permian continues to make new records, now standing at 24.1 million cubic feet per day.
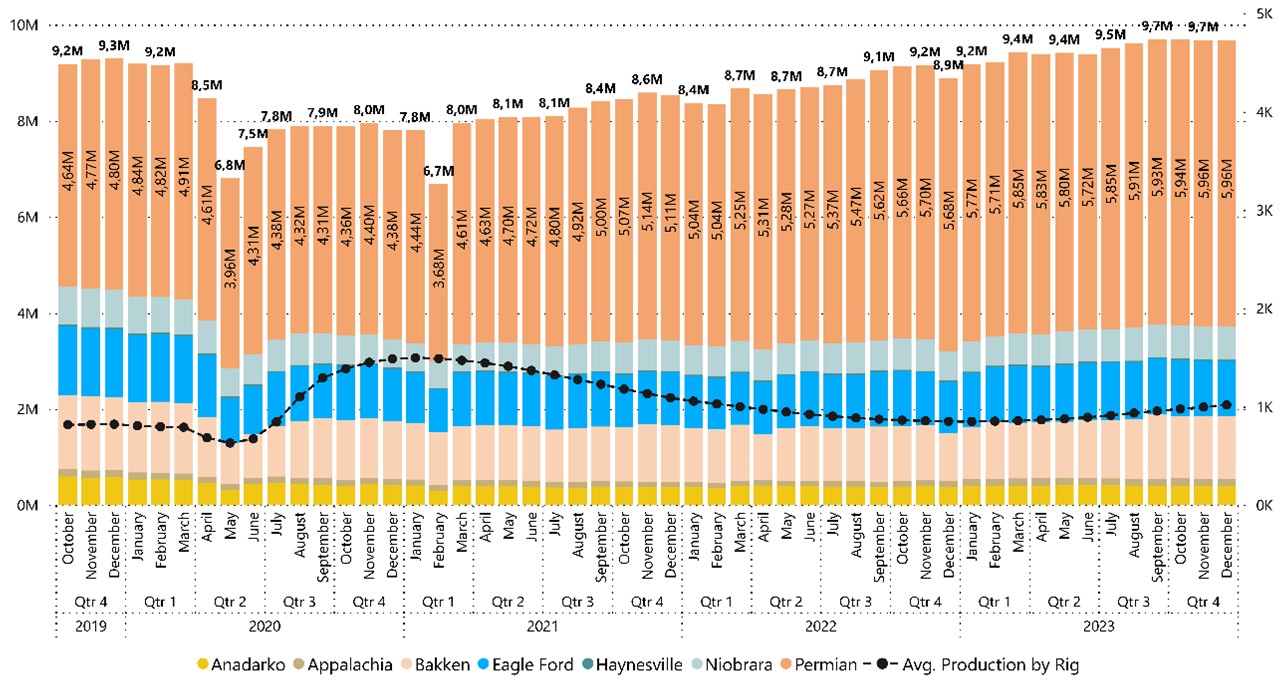
Source EIA
Figure 10.5: Oil Production (bbl/d)
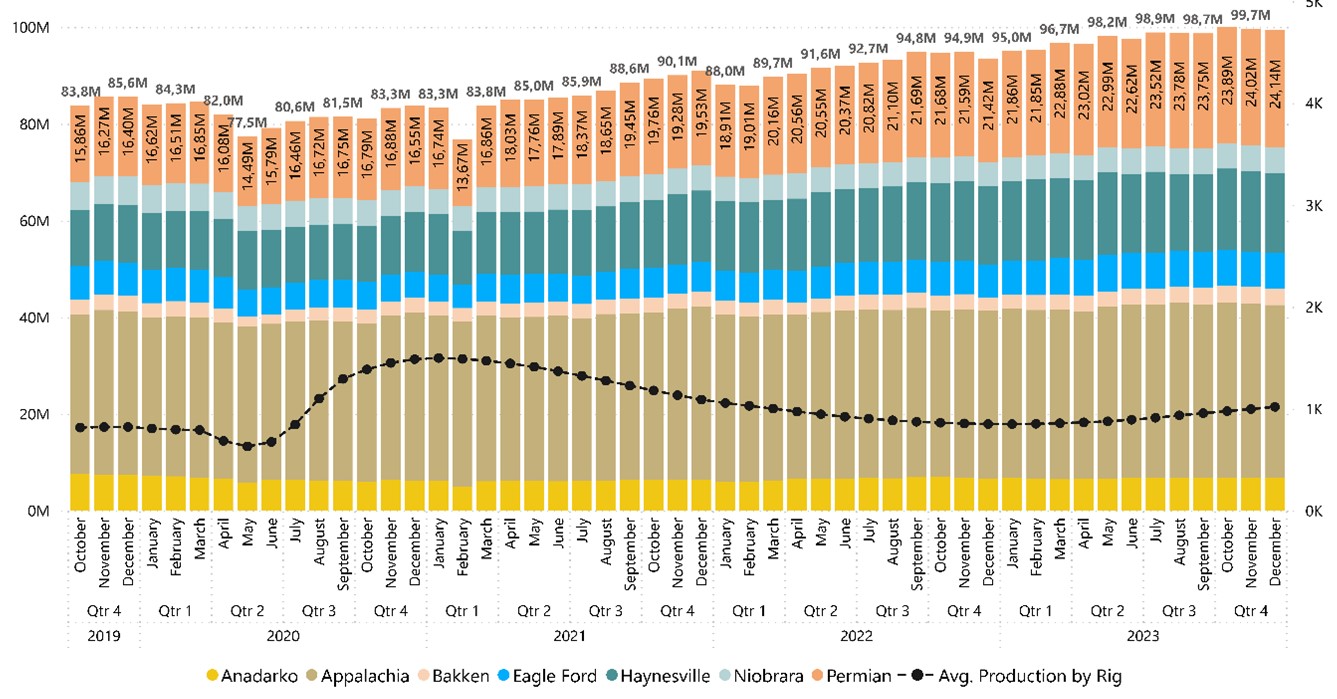
Source EIA
Figure 10.6: Natural Gas Production (Mcf/d)
The EIA’s Drilling Productivity Report reports that the inventory of drilled but uncompleted wells (DUCs) in all regions have declined 49% since peaking in July 2020 (refer to Figure 10.7 for all U.S. regions, and Figure 10.8 for the Permian). This data dovetails with increased crude oil and natural gas production.
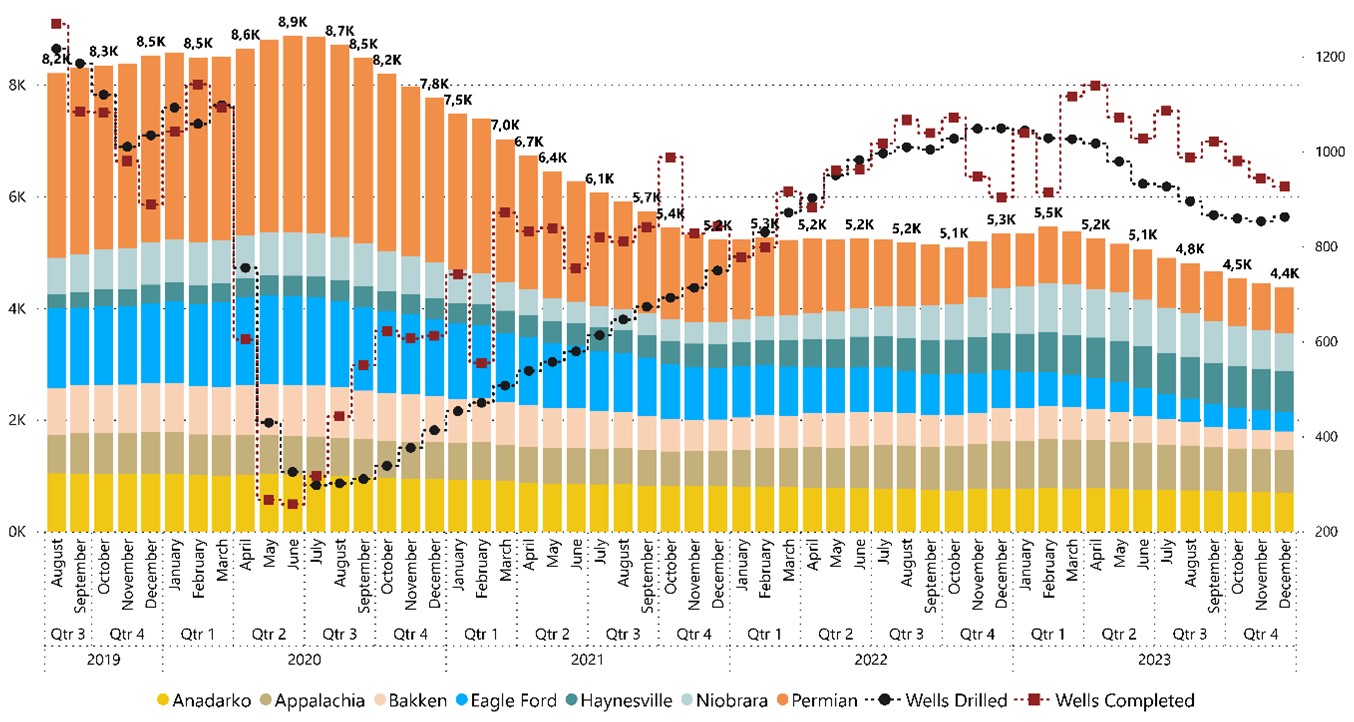
Source EIA
Figure 10.7: U.S. Drilled but Uncompleted Wells (DUC)
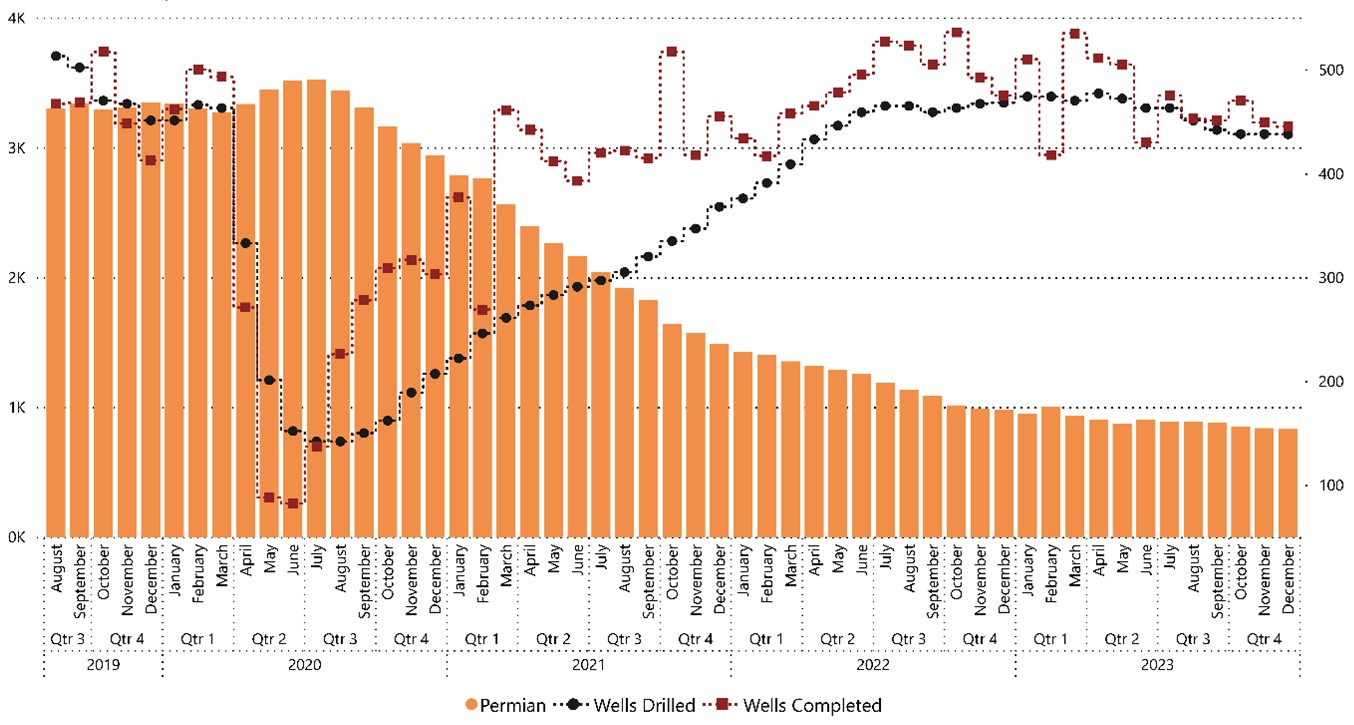
Source EIA
Figure 10.8: Permian Drilled but Uncompleted Wells (DUC)
Consequently, with increases in production and well completions, activity at frac sand mines has correspondingly increased throughout the U.S. According to MSHA, operating hours from 1st quarter of 2021 through 3rd quarter of 2023 were up 60% for Permian Basin frac sand mines. This data is presented in Figures 10.9 (U.S.) and 10.10 (Permian).
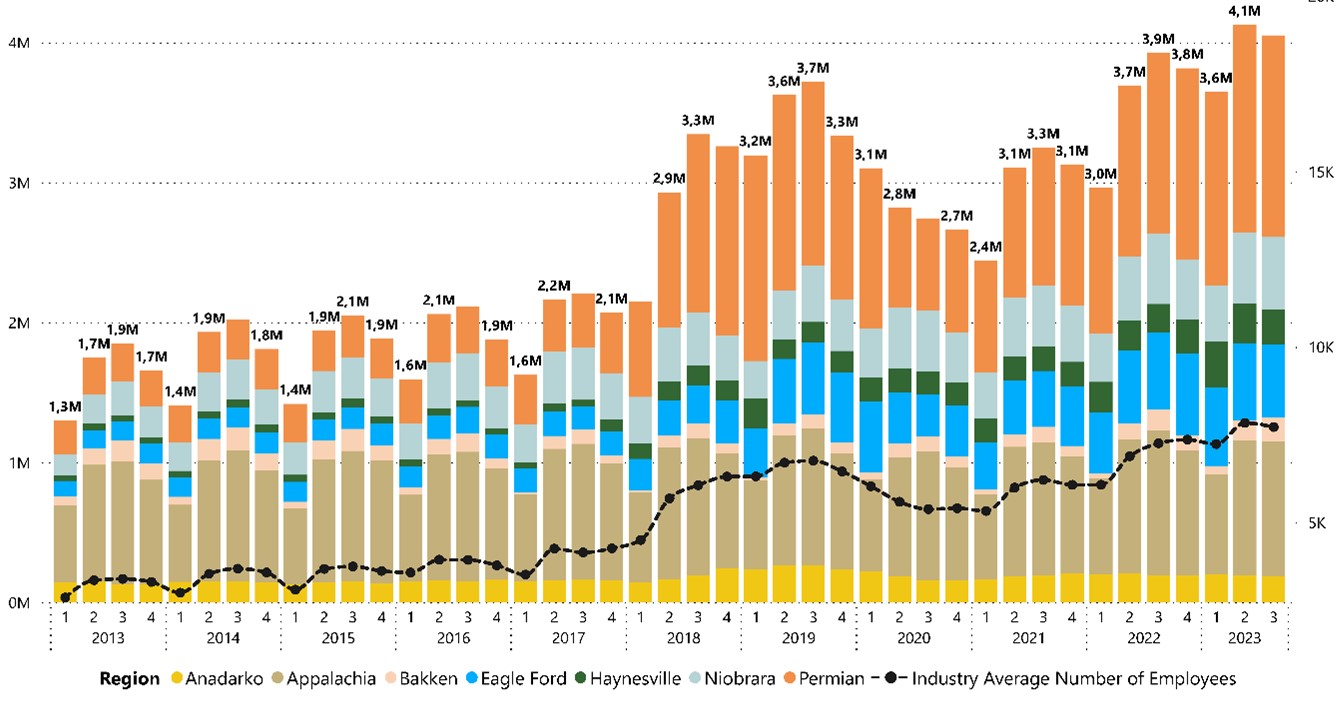
Source MSHA
Figure 10.9: All U.S. Regions Mine Hours (Quarterly)
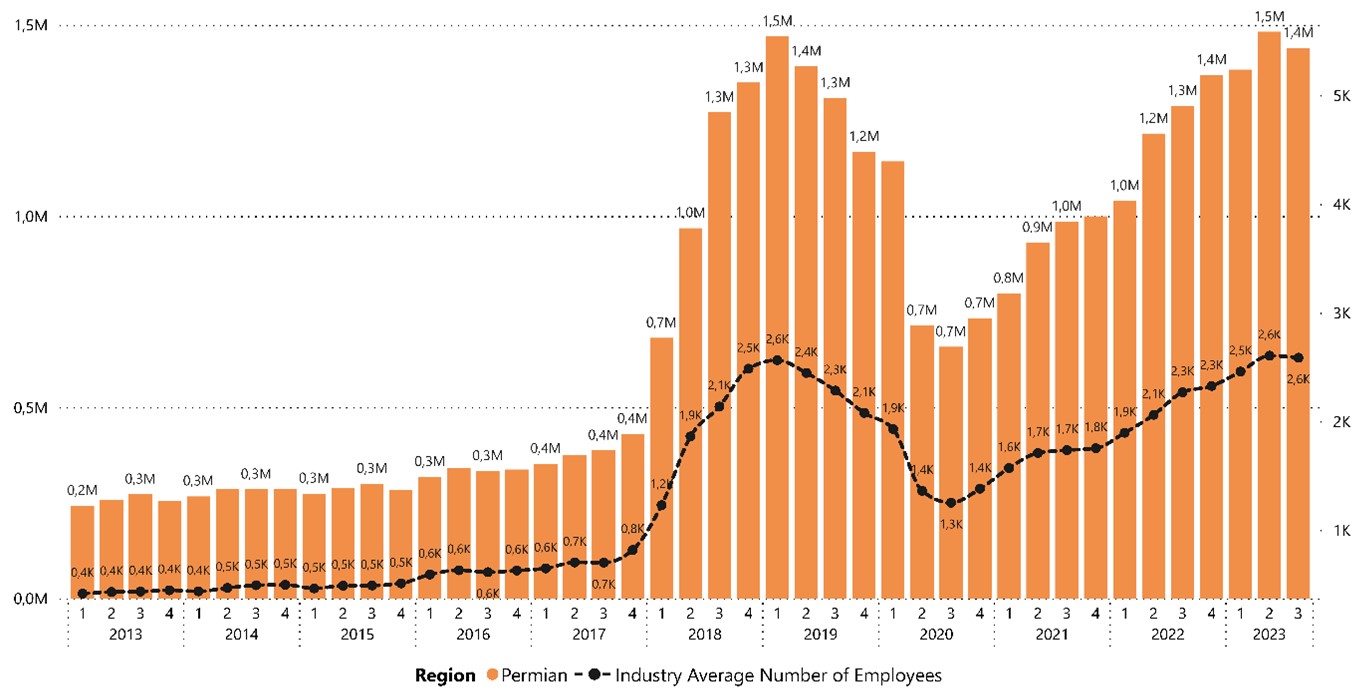
Source MSHA
Figure 10.10: Permian Wide In-Basin Mine Hours (Quarterly)
Industry research speculates that total in-basin mine hours, as of 2nd quarter 2023, are at the same level as the 2019 peak. Mine hours serve as a directional indicator that dovetails with previous crude oil and natural gas production and DUC data. Current frac sand production in the Permian is estimated to be in the 60 million to 65 million tons per year range, with fairly well-balanced demand and stable pricing. BOYD anticipates frac sand pricing stabilizing substantially above the $30 per ton pricing used in this report. Additionally, we anticipate continued upward sand consumption in the Permian due to economic and geopolitical influences on energy demand.
11.0 CAPITAL, REVENUES, AND OPERATING COSTS
11.1 Introduction
This chapter will contain two main sections, one for the Kermit Mines and one for the Monahans Mine. Both sections will address similar topics for each mine.
Atlas commenced processing operations at the Kermit Mine in July 2018 and at the Monahans Mine in October 2018. BOYD was originally provided with financial data for the years 2021 and prior, for use in the original previous TRS report (BOYD Report No. 3871.006). Since the initial TRS was completed, Atlas has converted substantial additional frac sand resources into frac sand reserves, completed construction of a second mine on the Kermit Property, and has provided BOYD with updated historic (pre-2023), current year end 2023, and forecasted (projected 2024-on) financial information and forecasts to be utilized in this updated report.
11.2 Kermit Mines
11.2.1 Historical Capital Expenditures
Table 11.1 presents Kermit’s annual investment capital expenditures (CapEx) for the last two years, based on fixed asset data provided by Atlas. The addition of a second Kermit mine has substantially expanded frac sand production capacity in 2023. A 42-mile overland sand delivery conveyor is also under construction (Dune Express) for delivery of frac sand from the Kermit Mines to portions of the Permian, and into New Mexico. Capital expenditures for the Dune Express are related to transportation/logistics and not included in the Kermit Mines’ CapEx.
| | |
Table 11.1: Kermit Mines' |
Historical Capital Expenditures |
| | |
| | CapEx |
Year | | ($ million) |
| | |
2022 | | 18.1 |
2023* | | 151.6 |
Total | | 169.7 |
|
* Includes $6.5 million of joint |
Kermit/Monahans projects. |
11.2.2 Historical Revenues and Sales
Table 11.2 presents Atlas’s historical annual sales data for 2022 and 2023. Year-over-year (YOY) prices have increased approximately 8% at Kermit.
| | | | |
Table 11.2: Kermit Mines' Historical sales |
|
| | 2022 | | 2023 |
| | | | |
Tons sold (000) | | 5,125 | | 5,626 |
Revenues ($ 000) | | 200,867 | | 237,074 |
Product Pricing ($ per ton sold) | | 39.19 | | 42.14 |
11.2.3 Historical Cost of Production
Table 11.3 presents Kermit’s historical Cash Cost of Production for the years 2022 and 2023.
| | | | |
Table 11.3: Kermit Mines' Historical Cost of Production |
|
| | 2022 | | 2023 |
| | | | |
Cash Cost of Production ($ 000) | | 65,432 | | 64,797 |
$ per ton sold | | 12.77 | | 11.52 |
Cash Cost of Production is actual through November and annualized for the respective year. Included are the costs associated with mining, wet processing, dry processing, product loadout, maintenance, quality control, property taxes, royalties, and other related operating costs.
11.2.4 Projected Production, Sales, and Costs
BOYD was provided with production, sales, and cost projections for the Kermit Mines, which forecasted financial data, product pricing, and costs in 2023 constant dollars. BOYD opines that the production and financial projections are reasonable and are likely to be within ±20% accuracy level.
11.2.4.1 Production and Sales Projections
Annual forecasted ROM production of approximately 12.4 million tons per year is based on the dry plants producing 10.5 million tons per year of saleable product after accounting for processing losses as discussed in Chapter 6. Forecasted dry processing plant production is within the operation’s current infrastructure capacities and capabilities, following the substantial capacity increase resulting from the two Kermit Mines’ processing plants.
As noted in Table 11.4, the dry processing plants are projected to produce approximately 10.5 million tons per year of 40/70 mesh and 40/140 mesh frac sand.
The forecasted sales price of $30 per ton for all products presented in Table 11.4 is based on a significant reduction in current pricing ($42.14 per ton) to account for market share expansion to 10.5 million tons per year. We opine that this is a reasonable price projection.
| | | | | | | | | | |
Table 11.4: Kermit Mines' Sales Projections |
|
| | 2024 | | 2025 | | 2026 | | 2027 | | 2028 |
| | | | | | | | | | |
Tons sold (000) | | 10,500 | | 10,500 | | 10,500 | | 10,500 | | 10,500 |
Revenues ($ 000) | | 315,000 | | 315,000 | | 315,000 | | 315,000 | | 315,000 |
Product Pricing ($ per ton sold) | | 30.00 | | 30.00 | | 30.00 | | 30.00 | | 30.00 |
11.2.4.2 Operating Cost Projections
Table 11.5, below, presents the cash cost projections for 2024 through 2028. Operating cost projections were provided by Atlas and are based on prior year and current year actuals and the fixed cost per unit reductions as capacity is increased. BOYD considers their estimates to be reasonable, however adjustments were made based on our review of historical operating costs and our experience with similar frac sand mining operations.
| | | | | | | | | | |
Table 11.5: Kermit Mines' Cash Cost of Production Projections |
|
| | 2024 | | 2025 | | 2026 | | 2027 | | 2028 |
| | | | | | | | | | |
Total Cash Cost of Production ($ 000) | | 92,265 | | 91,818 | | 91,818 | | 91,818 | | 91,818 |
$ per ton sold | | 8.79 | | 8.74 | | 8.74 | | 8.74 | | 8.74 |
11.2.4.3 Projected Sustaining Capital Expenditures
Atlas projected sustaining CapEx, which includes maintenance of production equipment, as well as other items, to be $3.3 million per year. The projected annual CapEx is a reasonable estimate.
11.3 Monahans Mine
11.3.1 Historical Capital Expenditures
Table 11.6 presents Monahan’s investment CapEx for the years 2022 and 2023 based on fixed asset data provided by Atlas.
| | |
Table 11.6: Monahans Mine's |
Historical Capital Expenditures |
| | |
| | CapEx |
Year | | ($ millions) |
| | |
2022 | | 14.1 |
2023* | | 23.7 |
Total | | 37.8 |
|
* Includes $6.5 million of joint |
Kermit/Monahans projects. |
11.3.2 Historical Revenues and Sales
Table 11.7 presents Atlas’s historical sales data for the years 2022 and 2023. YOY prices have increased approximately 6% at Monahans.
| | | | |
Table 11.7: Monahans Mine's Historical sales |
|
| | 2022 | | 2023 |
| | | | |
Tons sold (000) | | 5,062 | | 5,354 |
Revenues ($ 000) | | 206,398 | | 226,792 |
Product Pricing ($ per ton sold) | | 40.77 | | 42.36 |
11.3.3 Historical Cash Operating Costs
Table 11.8 presents the Monahans Mine’s historical Cash Cost of Production data for the years 2022 and 2023.
| | | | |
Table 11.8: Monahans Mine's Historical Cost of Production |
|
| | 2022 | | 2023 |
| | | | |
Cash Cost of Production ($ 000) | | 66,606 | | 67,999 |
$ per ton sold | | 13.16 | | 12.70 |
Cash Cost of Production is actual through November and annualized for the respective year. Included are the costs associated with mining, wet processing, dry processing, product loadout, maintenance, quality control, property taxes, royalties, and other related operating costs.
11.3.4 Projected Production, Sales, and Costs
BOYD was provided with production, sales, and cost projections for the Monahans Mine, which forecasted financial data, product pricing, and costs in 2021 constant dollars.
BOYD opines that the production and financial projections are reasonable and are likely to be within ±20% accuracy level.
11.3.4.1 Production and Sales Projections
Annual forecasted ROM production of approximately 5.7 million tons per year is based on the dry plant producing 5.0 million tons per year of saleable frac sand after accounting for processing losses of approximately 12%, as discussed in Chapter 6. Forecasted dry processing plant production is within the operation’s current infrastructure capacities and capabilities.
As noted in Table 11.9, the dry processing plant is projected to produce approximately 5.0 million tons per year of saleable 40/70 mesh and 40/140 mesh frac sand.
The forecasted average sales price of $30 per ton for all products presented in Table 11.9 is based on long term average pricing as provided by Atlas and reflects a significant discount from actual 2022 and 2023 prices. We opine that this is a reasonable average sales price.
| | | | | | | | | | |
Table 11.9: Monahans Mine's Sales Projections |
|
| | 2024 | | 2025 | | 2026 | | 2027 | | 2028 |
| | | | | | | | | | |
Tons sold (000) | | 5,000 | | 5,000 | | 5,000 | | 5,000 | | 5,000 |
Revenues ($ 000) | | 150,000 | | 150,000 | | 150,000 | | 150,000 | | 150,000 |
Product Pricing ($ per ton sold) | | 30.00 | | 30.00 | | 30.00 | | 30.00 | | 30.00 |
11.3.4.2 Operating Cost Projections
Table 11.10, below, presents the cash cost projections for 2024 through 2028. Operating cost projections were provided by Atlas and are based on the prior year and current year actuals. BOYD considered their estimates to be reasonable, however adjustments were made based on our review of historical operating costs and our experience with similar frac sand mining operations.
| | | | | | | | | | |
Table 11.10: Monahans Mine's Cash Cost of Production Projections |
|
| | 2024 | | 2025 | | 2026 | | 2027 | | 2028 |
| | | | | | | | | | |
Total Cash Cost of Production ($ 000) | | 57,450 | | 57,250 | | 57,250 | | 57,250 | | 57,250 |
$ per ton sold | | 11.49 | | 11.45 | | 11.45 | | 11.45 | | 11.45 |
11.3.4.3 Projected Sustaining Capital Expenditures
Atlas projected sustaining CapEx, which includes maintenance of production equipment as well as other items, to be $3.3 million per year. The projected annual CapEx is a reasonable estimate.
12.0 ECONOMIC ANALYSIS
This chapter will contain two main sections, one for the Kermit Mines and one for the Monahans Mine. Each section will address similar topics in their respective subsections.
Cash flow projections for the Kermit and Monahans operations have been generated from their respective proposed LOM production schedules and revenues, cost of production, and CapEx estimates discussed in Chapter 11. A summary of the key assumptions used is provided below.
•LOM ROM frac sand tons and finished product tons sold were based on the respective total frac sand reserve estimates discussed in Chapter 6 of this report. The Kermit Mines are estimated to be depleted in approximately 32 years, in 2055, based on the current reserve estimate and sales of 10.5 million tons per year . The Monahans Mine is estimated to be depleted in approximately 30 years, in 2053, based on the current reserve estimate and annual sales of 5.0 million tons per year. This estimate will fluctuate, possibly substantially, based on market conditions in the Permian Basin and/or additional reserves being converted/acquired.
•Forecasted revenues at the respective on-site loadouts (mine gate) are based on sales of both 40/70 and 40/140 mesh size products to be delivered by truck or conveyor to various sites in the Permian Basin.
•Projected Operating Costs and Other Costs (as discussed in Chapter 11) include:
− Employee wages, benefits, and other employee expenses
− Contract mining
− Maintenance
− Mobile Equipment and Fuel
− Utilities (including dryer fuel) and Waste Disposal
− Other Operating Expenses (includes Property Taxes, Reclamation)
− Royalty
•Capital Expenditures (as discussed in Chapter 11) include:
− Sustaining/Maintenance
− Federal Business Income Tax Rate of 21%
•Adjustments used to determine After-Tax cash flows:
− Current fixed assets, by asset class, are depreciated based on their respective Year 2023 average monthly expense.
− Depreciation expense for new fixed assets (from sustaining/maintenance CapEx) are based on a straight-line depreciation calculation using a 10-year asset life.
− Operating losses, if any, are carried forward in the tax computation.
BOYD prepared an economic analysis, as of January 1, 2024, for the Kermit Mines using the production, sales, and financial projections presented in this report. Our analysis confirms that the operations generate positive cash flows (based on a 10% discount rate), on a pre-tax and after-tax basis, thus supporting the statement of frac sand reserves provided herein.
12.2.2.Cash Flow Analysis
Table 12.1, below, presents the five-year pre-tax and after-tax cash flow projections based on the proposed LOM production schedule and revenue, cost of production, and CapEx estimates discussed above for the Kermit Mines.
| | | | | | | | | | | | |
Table 12.1: Kermit Mines' Five-Year Cash Flow Summary |
| | | | | | | | | | | | |
| | 2024 | | 2025 | | 2026 | | 2027 | | 2028 | | Total |
| | | | | | | | | | | | |
Total Tons Sold (000) | | 10,500 | | 10,500 | | 10,500 | | 10,500 | | 10,500 | | 52,500 |
| | | | | | | | | | | | |
Revenues ($ 000) | | 315,000 | | 315,000 | | 315,000 | | 315,000 | | 315,000 | | 1,575,000 |
Cost of Production ($ 000) | | 92,265 | | 91,818 | | 91,818 | | 91,818 | | 91,818 | | 459,537 |
CapEx ($ 000) | | 3,300 | | 3,300 | | 3,300 | | 3,300 | | 3,300 | | 16,500 |
Net Pre-Tax Cash Flow ($ 000) | | 219,435 | | 219,882 | | 219,882 | | 219,882 | | 219,882 | | 1,098,963 |
Federal Income Tax ($ 000) | | 43,786 | | 43,811 | | 43,741 | | 43,672 | | 43,603 | | 218,613 |
Net After-Tax Cash Flow ($ 000) | | 175,649 | | 176,071 | | 176,141 | | 176,210 | | 176,279 | | 880,350 |
Three DCF-NPVs on a pre-tax basis and three DCF-NPVs on an after-tax basis, using discount rates of 8%, 10%, and 12%, were calculated utilizing the cash flows above. The
DCF-NPV values used mid-year discounting and all cash flows were on a constant dollar basis.
The pre-tax DCF-NPVs range from approximately $1,887 million to $2,613 million, and the after-tax DCF-NPVs range from approximately $1,514 million to $2,100 million. Table 12.2 summarizes the results of the pre-tax and after-tax analyses:
| | | | | | |
Table 12.2: Kermit Mines' DCF-NPV Analysis |
| | DCF-NPV ($ millions) |
| | 8% | | 10% | | 12% |
Pre-Tax | | 2,613 | | 2,196 | | 1,887 |
After-Tax | | 2,100 | | 1,764 | | 1,514 |
Refer to Table 12.3, on the following page, for the detailed LOM cash flow analysis and corresponding pre-tax and after-tax DCF-NPV analyses at a 10% discount rate.
BOYD notes that the DCF-NPV estimate was made for purposes of confirming the economic viability of the reported frac sand reserves and not for purposes of valuing Atlas, the Kermit Mines, or their assets. IRR and project payback were not calculated, as there was no initial investment considered in the financial model. Risk is subjective, as such, BOYD recommends that each reader should evaluate the project based on their own investment criteria.
| | | | | | | | | | | | | | | | | | |
TABLE 12.3 |
|
PRE-TAX AND AFTER-TAX CASH FLOW ANALYSIS |
KERMIT MINES |
Winkler County, Texas |
Prepared For |
ATLAS ENERGY SOLUTIONS, INC. |
By |
John T. Boyd Company |
Mining and Geological Consultants |
February 2024 |
| | 2024 | | 2025 | | 2026 | | 2027 | | 2028 | | 2029 to 2033 | | 2034 to 2043 | | 2044 to 2055 | | Total |
Production Statistics (Tons 000): | | | | | | | | | | | | | | | | | | |
ROM Production | | 12,355 | | 12,355 | | 12,355 | | 12,355 | | 12,355 | | 61,775 | | 123,550 | | 148,260 | | 395,360 |
Overall Processing Recovery (%) | | 85 | | 85 | | 85 | | 85 | | 85 | | 85 | | 85 | | 85 | | 85 |
Dry Plant Product | | 10,500 | | 10,500 | | 10,500 | | 10,500 | | 10,500 | | 52,500 | | 105,000 | | 126,000 | | 336,000 |
Sales and Financial Data: | | | | | | | | | | | | | | | | | | |
Saleable Product Tons Sold (000): | | 10,500 | | 10,500 | | 10,500 | | 10,500 | | 10,500 | | 52,500 | | 105,000 | | 126,000 | | 336,000 |
Product Pricing ($ per ton) | | 30.00 | | 30.00 | | 30.00 | | 30.00 | | 30.00 | | 30.00 | | 30.00 | | 30.00 | | 30.00 |
Revenues ($ 000) | | 315,000 | | 315,000 | | 315,000 | | 315,000 | | 315,000 | | 1,575,000 | | 3,150,000 | | 3,780,000 | | 10,080,000 |
Cost of Production ($ 000) | | 92,265 | | 91,818 | | 91,818 | | 91,818 | | 91,818 | | 459,090 | | 918,180 | | 1,101,816 | | 2,938,623 |
$ per ton sold | | 8.79 | | 8.74 | | 8.74 | | 8.74 | | 8.74 | | 8.74 | | 8.74 | | 8.74 | | 8.75 |
Net Pre-Tax Cash Flow Before CapEx ($ 000) | | 222,735 | | 223,182 | | 223,182 | | 223,182 | | 223,182 | | 1,115,910 | | 2,231,820 | | 2,678,184 | | 7,141,377 |
$ per ton sold | | 21.21 | | 21.26 | | 21.26 | | 21.26 | | 21.26 | | 21.26 | | 21.26 | | 21.26 | | 21.25 |
CapEx ($ 000): | | | | | | | | | | | | | | | | | | |
Total CapEx | | 3,300 | | 3,300 | | 3,300 | | 3,300 | | 3,300 | | 16,500 | | 33,000 | | 39,600 | | 105,600 |
Net Pre-Tax Cash Flow ($ 000) | | 219,435 | | 219,882 | | 219,882 | | 219,882 | | 219,882 | | 1,099,410 | | 2,198,820 | | 2,638,584 | | 7,035,777 |
Federal Income Tax ($ 000) | | 43,786 | | 43,811 | | 43,741 | | 43,672 | | 43,603 | | 216,974 | | 432,562 | | 554,103 | | 1,422,252 |
After-Tax Net Cash Flow ($ 000) | | 175,649 | | 176,071 | | 176,141 | | 176,210 | | 176,279 | | 882,436 | | 1,766,258 | | 2,084,481 | | 5,613,525 |
| | | | | | | | | | | | | | | | | | |
DCF-NPV Analysis ($ 000): | | | | | | | | | | | | | | | | | | |
Pre-Tax Discounted Cash Flows at 10% | | 209,223 | | 190,590 | | 173,264 | | 157,513 | | 143,193 | | 542,815 | | 546,324 | | 233,569 | | 2,196,491 |
Cumulative Pre-Tax Discounted Cash Flows at 10% | | 209,223 | | 399,813 | | 573,077 | | 730,590 | | 873,783 | | 1,416,598 | | 1,962,922 | | 2,196,491 | | |
After-Tax Discounted Cash Flows at 10% | | 167,475 | | 152,616 | | 138,796 | | 126,288 | | 114,798 | | 435,655 | | 438,849 | | 189,336 | | 1,763,753 |
Cumulative After-Tax Discounted Cash Flows at 10% | | 167,475 | | 320,091 | | 458,887 | | 585,115 | | 699,913 | | 1,135,568 | | 1,574,417 | | 1,763,753 | | |
12.2.3.Sensitivity Analyses
Sensitivity analyses for the after-tax cash flow considering changes to revenues and Cost of Production were prepared using a discount rate of 10%. Revenues were adjusted in increments of 5% and range from minus 15% to plus 15% base revenues; the corresponding weighted average sales price would range from $25.50 per ton sold to $34.50 per ton sold, with the base price of $30.00 per ton sold as noted in Table 12.4, below.
| | |
Table 12.4: Price |
Adjustments for Sensitivity |
Analysis |
| | Average Sales |
Adjustment | | Price ($) |
-15% | | 25.50 |
-10% | | 27.00 |
-5% | | 28.50 |
0% | | 30.00 |
+5% | | 31.50 |
+10% | | 33.00 |
+15% | | 34.50 |
Costs were adjusted in increments of 5% and range from minus 15% to plus 15% base costs. BOYD notes that although the royalty expense is in Cost of Production, it changes with revenues as it is a function of revenue.
12.2.3.1 After-Tax Sensitivity Analyses
Table 12.5, below, summarizes the results of the after-tax sensitivity analyses, which utilize a 10% discount rate and incorporate the changes to revenue and cost of production discussed above:
| | | | | | | | |
Table 12.5: Sensitivity of Kermit Mines' After-Tax |
DCF-NPV at 10% ($ millions) |
| | | | | | | | |
| Revenues |
| -15% | -10% | -5% | 0% | +5% | +10% | +15% |
-15% | 1,499 | 1,623 | 1,748 | 1,873 | 1,997 | 2,122 | 2,242 |
-10% | 1,462 | 1,587 | 1,712 | 1,836 | 1,961 | 2,086 | 2,210 |
-5% | 1,426 | 1,551 | 1,675 | 1,800 | 1,925 | 2,049 | 2,174 |
0% | 1,390 | 1,514 | 1,632 | 1,764 | 1,881 | 2,013 | 2,138 |
+5% | 1,353 | 1,478 | 1,603 | 1,727 | 1,852 | 1,977 | 2,101 |
+10% | 1,317 | 1,442 | 1,566 | 1,691 | 1,816 | 1,940 | 2,065 |
+15% | 1,281 | 1,405 | 1,530 | 1,655 | 1,780 | 1,904 | 2,029 |
BOYD prepared an economic analysis, as of January 1, 2024, for the Monahans Mine using the production, sales, and financial projections presented in this report. Our analysis confirms that the operation generates positive cash flows (based on a 10% discount rate), on a pre-tax and after-tax basis, and supports the statement of frac sand reserves provided herein.
12.3.2.Cash Flow Analysis
Table 12.6, below, presents the five-year pre-tax and after-tax cash flow projections based on the proposed LOM production schedule and revenue, cost of production, and CapEx estimates discussed above for the Monahans Mine.
| | | | | | | | | | | | |
Table 12.6: Monahans Mine's Five-Year Cash Flow Summary |
| | | | | | | | | | | | |
| | 2024 | | 2025 | | 2026 | | 2027 | | 2028 | | Total |
| | | | | | | | | | | | |
Total Tons Sold (000) | | 5,000 | | 5,000 | | 5,000 | | 5,000 | | 5,000 | | 25,000 |
| | | | | | | | | | | | |
Revenues ($ 000) | | 150,000 | | 150,000 | | 150,000 | | 150,000 | | 150,000 | | 750,000 |
Cost of Production ($ 000) | | 57,450 | | 57,250 | | 57,250 | | 57,250 | | 57,250 | | 286,450 |
CapEx ($ 000) | | 3,300 | | 3,300 | | 3,300 | | 3,300 | | 3,300 | | 16,500 |
Net Pre-Tax Cash Flow ($ 000) | | 89,250 | | 89,450 | | 89,450 | | 89,450 | | 89,450 | | 447,050 |
Federal Income Tax ($ 000) | | 16,993 | | 16,966 | | 16,896 | | 16,827 | | 16,758 | | 84,439 |
Net After-Tax Cash Flow ($ 000) | | 72,257 | | 72,484 | | 72,554 | | 72,623 | | 72,692 | | 362,611 |
Three DCF-NPVs on a pre-tax basis and three DCF-NPVs on an after-tax basis, using discount rates of 8%, 10%, and 12%, were calculated utilizing the cash flows above. The DCF-NPV values used mid-year discounting and all cash flows were on a constant dollar basis.
The pre-tax DCF-NPVs range from approximately $762 million to $1,046 million, and the after-tax DCF-NPVs range from approximately $619 million to $848 million. Table 12.7 summarizes the results of the pre-tax and after-tax analyses:
| | | | | | |
Table 12.7: Monahans Mine's DCF-NPV Analysis |
| | DCF-NPV ($ millions) |
| | 8% | | 10% | | 12% |
Pre-Tax | | 1,046 | | 884 | | 762 |
After-Tax | | 848 | | 717 | | 619 |
Refer to Table 12.8, on the following page, for the detailed LOM cash flow analysis and corresponding pre-tax and after-tax DCF-NPV analyses at a 10% discount rate.
BOYD notes that the NPV estimate was made for purposes of confirming the economic viability of the reported frac sand reserves and not for purposes of valuing Atlas, the Monahans Mine, or its assets. IRR and project payback were not calculated, as there was no initial investment considered in the financial model. Risk is subjective, as such, BOYD recommends that each reader should evaluate the project based on their own investment criteria.
| | | | | | | | | | | | | | | | | | |
TABLE 12.8 |
|
PRE-TAX AND AFTER-TAX CASH FLOW ANALYSIS |
monahans MINE |
Ward and Winkler Counties, Texas |
Prepared For |
ATLAS ENERGY SOLUTIONS, INC. |
By |
John T. Boyd Company |
Mining and Geological Consultants |
February 2024 |
| | 2024 | | 2025 | | 2026 | | 2027 | | 2028 | | 2029 to 2033 | | 2034 to 2043 | | 2044 to 2053 | | Total |
Production Statistics (Tons 000): | | | | | | | | | | | | | | | | | | |
ROM Production | | 5,680 | | 5,680 | | 5,680 | | 5,680 | | 5,680 | | 28,400 | | 56,800 | | 56,800 | | 170,400 |
Overall Processing Recovery (%) | | 88 | | 88 | | 88 | | 88 | | 88 | | 88 | | 88 | | 88 | | 85 |
Dry Plant Product | | 5,000 | | 5,000 | | 5,000 | | 5,000 | | 5,000 | | 25,000 | | 50,000 | | 50,000 | | 150,000 |
Sales and Financial Data | | | | | | | | | | | | | | | | | | |
Saleable Product Tons Sold (000): | | 5,000 | | 5,000 | | 5,000 | | 5,000 | | 5,000 | | 25,000 | | 50,000 | | 50,000 | | 150,000 |
Product Pricing ($ per ton) | | 30.00 | | 30.00 | | 30.00 | | 30.00 | | 30.00 | | 30.00 | | 30.00 | | 30.00 | | 30.00 |
Revenues ($ 000) | | 150,000 | | 150,000 | | 150,000 | | 150,000 | | 150,000 | | 750,000 | | 1,500,000 | | 1,500,000 | | 4,500,000 |
Cost of Production ($ 000) | | 57,450 | | 57,250 | | 57,250 | | 57,250 | | 57,250 | | 286,250 | | 572,500 | | 572,500 | | 1,717,700 |
$ per ton sold | | 11.49 | | 11.45 | | 11.45 | | 11.45 | | 11.45 | | 11.45 | | 11.45 | | 11.45 | | 11.45 |
Net Pre-Tax Cash Flow Before CapEx ($ 000) | | 92,550 | | 92,750 | | 92,750 | | 92,750 | | 92,750 | | 463,750 | | 927,500 | | 927,500 | | 2,782,300 |
$ per ton sold | | 18.51 | | 18.55 | | 18.55 | | 18.55 | | 18.55 | | 18.55 | | 18.55 | | 18.55 | | 18.55 |
CapEx ($ 000): | | | | | | | | | | | | | | | | | | |
Total CapEx | | 3,300 | | 3,300 | | 3,300 | | 3,300 | | 3,300 | | 16,500 | | 33,000 | | 33,000 | | 99,000 |
Net Pre-Tax Cash Flow ($ 000) | | 89,250 | | 89,450 | | 89,450 | | 89,450 | | 89,450 | | 447,250 | | 894,500 | | 894,500 | | 2,683,300 |
Federal Income Tax ($ 000) | | 16,993 | | 16,966 | | 16,896 | | 16,827 | | 16,758 | | 82,749 | | 164,111 | | 188,261 | | 519,559 |
After-Tax Net Cash Flow ($ 000) | | 72,257 | | 72,484 | | 72,554 | | 72,623 | | 72,692 | | 364,501 | | 730,389 | | 706,239 | | 2,163,741 |
| | | | | | | | | | | | | | | | | | |
DCF-NPV Analysis ($ 000): | | | | | | | | | | | | | | | | | | |
Pre-Tax Discounted Cash Flows at 10% | | 85,097 | | 77,534 | | 70,485 | | 64,078 | | 58,252 | | 220,822 | | 222,250 | | 85,687 | | 884,204 |
Cumulative Pre-Tax Discounted Cash Flows at 10% | | 85,097 | | 162,630 | | 233,116 | | 297,193 | | 355,446 | | 576,268 | | 798,517 | | 884,204 | | |
After-Tax Discounted Cash Flows at 10% | | 68,895 | | 62,828 | | 57,171 | | 52,024 | | 47,339 | | 179,934 | | 181,474 | | 67,666 | | 717,331 |
Cumulative After-Tax Discounted Cash Flows at 10% | | 68,895 | | 131,723 | | 188,894 | | 240,918 | | 288,257 | | 468,191 | | 649,665 | | 717,331 | | |
12.3.3.Sensitivity Analyses
Sensitivity analyses for the after-tax cash flow considering changes to revenues and Cost of Production were prepared using a discount rate of 10%. Revenues were adjusted in increments of 5% and range from minus 15% to plus 15% base revenues; the corresponding weighted average sales price would range from $25.50 per ton sold to $34.50 per ton sold, with the base price of $30.00 per ton sold as noted in Table 12.9, below.
| | |
Table 12.9: Price |
Adjustments for Sensitivity |
Analysis |
| | Average Sales |
Adjustment | | Price ($) |
-15% | | 25.50 |
-10% | | 27.00 |
-5% | | 28.50 |
0% | | 30.00 |
+5% | | 31.50 |
+10% | | 33.00 |
+15% | | 34.50 |
Costs were adjusted in increments of 5% and range from minus 15% to plus 15% base costs. BOYD notes that although the royalty expense is in Cost of Production, it changes with revenues as it is a function of revenue.
12.2.3.1 After-Tax Sensitivity Analyses
Table 12.10, below, summarizes the results of the after-tax sensitivity analyses performed, which utilize a 10% discount rate and incorporate the changes to revenue and cost of production discussed above:
| | | | | | | | |
Table 12.10: Sensitivity of Monahans Mine's After-Tax |
DCF-NPV at 10% ($ millions) |
| | | | | | | | |
| Revenues |
| -15% | -10% | -5% | 0% | +5% | +10% | +15% |
-15% | 609 | 667 | 726 | 784 | 843 | 902 | 960 |
-10% | 586 | 645 | 703 | 762 | 821 | 879 | 938 |
-5% | 564 | 622 | 681 | 740 | 798 | 857 | 915 |
0% | 542 | 600 | 659 | 717 | 775 | 834 | 893 |
+5% | 519 | 578 | 636 | 695 | 754 | 812 | 871 |
+10% | 497 | 555 | 614 | 673 | 731 | 790 | 848 |
+15% | 475 | 533 | 592 | 650 | 709 | 767 | 826 |
13.0 PERMITTING AND COMPLIANCE
13.1.Permitting Requirements and Status
The Kermit and Monahans operations are predominantly regulated by the TCEQ with respect to environmental compliance. The predominant permitting requirement for the operations is an active Air New Source Permit for air pollution control. Other permit requirements include annually renewable Aggregate Production Operation Registrations, Public Water System/Supply (i.e., water well) Registrations, and On‑Site Sewage Facilities (Septic Systems) Permits. A summary of the permits for the operations is provided in Table 13.1, below.
| | | | | | |
Table 13.1: Permit/Registration Summary |
Permit Type | | Permit ID | | Status | | Renewal Date |
Kermit Mines |
Aggregate Production Operation | | Registration No. AP0002721 | | Active | | 9/11/2024 |
Air New Source Permits | | Permit No. 149761 | | Active | | 6/29/2028 |
Air New Source Permits | | Registration No. 158007 | | Active | | n/a |
Air New Source Permits | | Registration No. 170943 | | Active | | n/a |
Air New Source Permits | | Registration No. 173975 | | Active | | n/a |
Public Water System/Supply | | Registration No. 2480014 | | Active | | n/a |
On-Site Sewage Facilities (Septic Systems) | | Permit No. NOA WKP-14-17 | | Active | | n/a |
| | | | | | |
Monahans Mine |
Aggregate Production Operation | | Registration No. AP0002804 | | Active | | 8/29/2024 |
Air New Source Permits | | Permit No. 150399 | | Active | | 6/29/2028 |
Air New Source Permits | | Registration No. 148572 | | Active | | n/a |
Air New Source Permits | | Registration No. 158008 | | Active | | n/a |
Air New Source Permits | | Registration No. 170944 | | Active | | n/a |
Air New Source Permits | | Registration No. 173976 | | Active | | n/a |
Public Water System/Supply | | Registration No. 2480015 | | Active | | n/a |
On-Site Sewage Facilities (Septic Systems) | | Permit No. NOA WKP-14-17 | | Active | | n/a |
BOYD reviewed the permits necessary to support continued operations at Kermit and Monahans. Such required permits appear to be valid and in good standing. The approved permits and certifications are adequate for the continued operation of the mining and processing facilities. New permits, permit revisions, and/or renewals may be necessary from time to time to facilitate future operations. Given sufficient time and planning, Atlas should be able to secure new permits, as required, to maintain its planned operations within the context of current regulations.
13.2.Environmental Studies
It is BOYD’s understanding that no standalone environmental studies have been conducted for the Kermit or Monahans operations. As part of the state and federal permitting process, various environmental assessments have been conducted and reviewed by the relevant local, state, and federal agencies. As the necessary permits for mining and processing operations have been issued, it is BOYD’s understanding that all environmental assessments have been accepted by the relevant regulatory bodies and no material issues were found.
13.3.Waste Disposal and Water Management
The coarse refuse generated from the sand processing operations is stockpiled and used in the construction of impoundment or backfilled into dredge ponds or previously mined pits. The fine refuse generated from the sand processing operations is disposed of by pumping it into dredge or impoundment ponds. Waste disposal facilities are in place for current mining operations, with plans to expand the disposal facilities to meet life of reserve storage requirements.
Water control structures are in place and function as required by regulatory agencies.
The Kermit and Monahans operations are regulated by TCEQ on matters involving air and water pollution and inspected periodically by the state if issues arise.
Mine safety is regulated by the federal government by MSHA as are all surface mining operations. MSHA inspects the facilities a minimum of twice yearly. Atlas’s safety record compares favorably with its regional peers. Atlas’s safety record compares favorably with its regional peers.
Based on our review of information provided by Atlas and available public information, it is BOYD’s opinion that the Kermit and Monahans operations’ record of compliance with applicable mining, water quality, and environmental regulations is generally typical for that of the industry. BOYD is not aware of any regulatory violation or compliance issue which would materially impact the estimated frac sand reserves for either operation.
13.5.Plans, Negotiations, or Agreements
New permits and certain permit amendments/revisions require public notification. The public is made aware of pending permits by advertisement in local newspapers. Additionally, a copy of the application is retained at the local county’s public library for review. A comment period follows the last advertisement date to allow the public to submit comments to the regulatory authority.
BOYD is not aware of any community or stakeholder concerns, impacts, negotiations, or agreements which would materially impact the frac sand reserve estimates contained herein.
13.6.Post-Mining Land Use and Reclamation
Under current regulations, the State of Texas does not require reclamation or remediation of surface mined lands by aggregate (including frac sand) operations. While there are no formal state or federal reclamation obligations, the leased portions of the Monahans property have defined reclamation requirements for post mining land use. An excerpt from the lease document pertaining to these requirements is as follows:
Maintenance, Security, and Restoration of the Leased Premises.
(a)Lessee shall maintain the Leased Premises in a neat and orderly condition, free of loose trash and debris, and in keeping with industry standard practices in the sand mining industry. Lessee shall construct and maintain all roads constructed and/or used by Lessee in "all weather" condition such that they are capable of normal use by Lessee and others without significant damage during inclement weather.
(b)To the extent deemed necessary by Lessor, Lessee shall construct and maintain a fence around the perimeter of Lessee's facility (or portions thereof, as set forth in written notice to Lessee) in order to protect livestock belonging to Lessor's grazing tenant(s). Such fences shall be constructed within ninety (90) days after written notice to Lessee. Lessee is solely responsible for the security of Lessee's facility and improvements, but shall provide keys, lock combinations or access cards to Lessor as necessary for Lessor to access Lessee's facility and all parts of the Leased Premises. Lessor may visit the Leased Premises at any time, but will provide at least forty-eight (48) hours' verbal notice to Lessee's on site manager before entering Lessee's gated processing facility.
(c)Lessee shall, within six (6) months after termination of this Lease for any reason, remove all equipment, structures, and other improvements placed by Lessee on the Leased Premises during the Term (including, without limitation, any pipelines), other than any supports placed in openings, any timbers, framework, or fences necessary to the use and maintenance of openings, approaches to operating pit, or dikes, water level control structures, and roads. Lessee further agrees with respect to any Materials stored or stockpiled on unmined portions of the Leased Premises to level such Materials. Notwithstanding the foregoing, after any termination of this Lease, Lessee may, for a period not to exceed six (6) months, and for no additional consideration, store on any unmined portions of the Leased Premises, any equipment and other Materials. Notwithstanding the foregoing, Lessee shall have the right at any time during the Term, or within six (6) months after the expiration of this Lease, to remove any improvements, structures, fixtures, machinery, equipment, supplies and other property and Materials placed by Lessee in, on or under the Leased Premises.
Additionally, Atlas voluntarily participates in a CCAA for the DSL. This mitigates DSL regulatory risk for the mining operations. Atlas has the option to either set aside acreage for the DSL habitat or contribute cash based on the acreage within the habitat area. Atlas has significant acreage without sand reserves to set aside for this purpose and can continue mining based on the agreement. The CCAA lasts for 23 years starting in January 2021.
13.7.Local Procurement and Hiring
BOYD is not aware of any commitments for local procurement or hiring. Atlas reports making efforts to source supplies and materials from regional vendors. The workforce is likewise located in the regional area.
Atlas’s stated core values include making positive impacts in the communities in which it operates. In addition to the payment of income taxes and other local community taxes such as property taxes and royalties, Atlas supports, financially and otherwise, local community endeavors.
14.0 INTERPRETATION AND CONCLUSIONS
14.1 Findings
Based on our independent technical review and geoscientific study of the Kermit and Monahans mines, BOYD concludes:
•Sufficient data have been obtained through the site exploration and sampling program and mining operations to support the geological interpretations of deposit thickness, grain size distribution and API quality for the portions of the sand underlying the controlled property of the subject mining operations. The data are of sufficient quantity and reliability to reasonably support the sand resource and sand reserve estimates in this technical report summary.
•BOYD is of the opinion that our data validation efforts: (1) adequately confirm the reasonableness of the geologic interpretations, resource estimation criteria, and economic assumptions; and (2) support the use of the data in frac sand resource/reserve estimation.
•The 337.6 million and 150.5 million product tons of frac sand reserves (as of December 31, 2023) estimated for the Kermit Mines and Monahans Mine, respectively, are reasonably and appropriately supported by technical studies, which consider expected geologic conditions, planned mining and processing operations, forecasted product revenues, and operating and capital cost estimates. As such, BOYD is of the opinion that there are reasonable expectations that the stated frac sand reserves for the Kermit and Monahans mines are technically, economically, and legally extractable as of December 31, 2023.
•To our knowledge, there are no other relevant data or information material to the Kermit or Monahans mines that would materially impact or change this technical report summary.
14.2 Significant Risks and Uncertainties
The ability of Atlas, or any mining company, to achieve production and financial projections is dependent on numerous factors. These factors primarily include site-specific geological conditions, the capabilities of management and operational personnel, product sales prices and market conditions, environmental issues, securing permit renewals and bonds, and developing and operating mines in a safe and efficient manner. Unforeseen changes in legislation and new industry developments could substantially alter the performance of any mining company. It is our understanding that Atlas continuously assesses these factors and adjusts operating plans as a matter of course.
As mining operations with established histories of commercial success, there is a high degree of certainty for the Kermit and Monahans operations under the current and foreseeable operating environment. However, it should be noted that frac sand is generally marketed exclusively to the energy sector which has historically faced more volatility than many other industries.
Subject specific assessments of risk are presented in the relevant sections of this report.
14.3 Recommendations
Based on the status of the Kermit and Monahans operations, BOYD has no recommendations for additional work relevant to the subject frac sand reserves at this time.