UNITED STATES
SECURITIES AND EXCHANGE COMMISSION
Washington, D.C. 20549
FORM N-CSR
CERTIFIED SHAREHOLDER REPORT OF REGISTERED
MANAGEMENT INVESTMENT COMPANIES
| Investment Company Act file number | 811-23892 |
| CAZ Strategic Opportunities Fund |
| (Exact name of registrant as specified in charter) |
| One Riverway, Suite 2000 Houston, TX | 77056 |
| (Address of principal executive offices) | (Zip code) |
Christopher Zook
| CAZ Investments LP One Riverway, Suite 2000 Houston, Texas 77056 |
| (Name and address of agent for service) |
| Registrant’s telephone number, including area code: | (713) 403-8250 |
| Date of fiscal year end: | March 31 | |
| Date of reporting period: | September 30, 2024 |
Form N-CSR is to be used by management investment companies to file reports with the Commission not later than 10 days after the transmission to stockholders of any report that is required to be transmitted to stockholders under Rule 30e-1 under the Investment Company Act of 1940 (17 CFR 270.30e-1). The Commission may use the information provided on Form N-CSR in its regulatory, disclosure review, inspection, and policymaking roles.
A registrant is required to disclose the information specified by Form N-CSR, and the Commission will make this information public. A registrant is not required to respond to the collection of information contained in Form N-CSR unless the Form displays a currently valid Office of Management and Budget (“OMB”) control number. Please direct comments concerning the accuracy of the information collection burden estimate and any suggestions for reducing the burden to the Secretary, Securities and Exchange Commission, 450 Fifth Street, NW, Washington, DC 20549-0609. The OMB has reviewed this collection of information under the clearance requirements of 44 U.S.C. § 3507.
| Item 1. | Reports to Stockholders. |
(a)
 |
| CAZ Strategic Opportunities Fund |
| Semi-Annual Report |
| September 30, 2024 |
| (Unaudited) |
| cazstrategicopportunitiesfund.com | (855) 886-2307 |
| The CAZ Strategic Opportunities Fund is distributed by Ultimus Fund Distributors, LLC, Member FINRA/SIPC. |
 | TABLE OF CONTENTS |
| Manager’s Commentary | 1 |
| Performance Information | 2 |
| Portfolio Information | 3 |
| Consolidated Schedule of Investments | 4 |
| Consolidated Statement of Assets and Liabilities | 7 |
| Consolidated Statement of Operations | 8 |
| Consolidated Statements of Changes in Net Assets | 9 |
| Consolidated Statement of Cash Flows | 11 |
| Consolidated Financial Highlights | 12 |
| Notes to Consolidated Financial Statements | 15 |
| Other Information | 30 |
| CAZ STRATEGIC OPPORTUNITIES FUND MANAGER’S COMMENTARY September 30, 2024 (Unaudited) |
On behalf of the Team at CAZ Investments, we are honored to have you investing alongside us in the CAZ Strategic Opportunities Fund (the “Fund”). For those investors new to the Fund, we would like to welcome you as our Partner.
The Fund launched in March 2024 with the key objective of providing long-term capital appreciation and current income by seeking to invest or make capital commitments in a broad cross section of private market assets across multiple strategies, geographies, and asset classes. For the six-month period ending September 30th, 2024, Class I shares of the Fund achieved an 8.09% net rate of return.
Investors have faced a myriad of challenges over the first three quarters of 2024, driven by election uncertainty, geopolitical turmoil, and an evolving economic landscape. The Fund has navigated these challenges successfully, highlighted by the strong positive performance, and we continue to see attractive opportunities across key Themes—particularly Growth of Private Assets, Energy Evolution, Disruptive Technology, and Shift in Consumer Behavior.
The Fund deployed capital across these key areas, with a particular emphasis on secondary investments, co-investments, and direct investments. Additional information regarding portfolio construction is detailed in this letter, and the most up-to-date information is available via the Fund’s website https://cazstrategicopportunitiesfund.com/.
If you are a new investor in the Fund, you should have received a welcome letter in the mail from Ultimus Fund Solutions, LLC (“Ultimus”), the Fund’s administrator, sent to the physical address you provided in subscription documents. This letter includes your Ultimus account number and instructions enabling you to login to the portal where you will be able access account statements, performance information, and more. If you have not received that letter or are unable to access your account, please reach out to our Team via SOFTeam@cazinvestments.com.
Additionally, the first quarterly video update was recently published with commentary from our Team on performance and portfolio construction, and we will seek to provide similar videos 45-60 days after each quarter’s end. These updates will be in addition to the Fund’s semi-annual and annual reports, which you can expect ~60 days following September 30th and March 31st each year, respectively.
As a reminder, every month you can add to your investment in the Fund. Please feel free to reach out to our Team via SOFTeam@cazinvestments.com and we will work with you to complete the Additional Investment Form, which is available on the Fund’s website.
Lastly, we have a firm adage: The power of the Network is the Network. As the CAZ Network of investors continues to grow, we receive enhanced access to unique opportunities and can command better economics for everyone involved. The Fund has seen tremendous growth since its launch and now has over 600 investors and approximately $350 million in committed capital. There are investors in your ecosystem that would likely benefit from the CAZ Strategic Opportunities Fund, so please connect us, as their addition should benefit you and all investors.
We look forward to a very productive end to the year and we are very grateful for your partnership. Please let us know if there is anything we can do for you. All our very best!
The Team at CAZ Investments
| Semi-Annual Report Dated September 30, 2024 | 1 |
| CAZ STRATEGIC OPPORTUNITIES FUND PERFORMANCE INFORMATION September 30, 2024 (Unaudited) |
Total Returns (a)
For the periods ended September 30, 2024
| Inception Date: March 1, 2024 | ||||||
| Six | Since | |||||
| Share Class | Month | Inception | ||||
| CAZ Strategic Opportunities Fund - Class I | 8.09% | 8.25% | ||||
| CAZ Strategic Opportunities Fund - Class R | 7.89% | 8.05% | ||||
| All Seasons Blended Index (b) | 7.45% | 9.96% | ||||
| Inception Date: June 1, 2024 | |||
| Since | |||
| Share Class | Inception | ||
| CAZ Strategic Opportunities Fund - Class F | (0.09%) | ||
| All Seasons Blended Index (b) | 8.18% | ||
| (a) | The Fund’s total returns assume reinvestment of dividends and capital gains, and do not reflect the deduction of taxes a shareholder would pay on Fund distributions or the repurchase of Fund shares. Fund returns would have been lower if a portion of the fees had not been waived. |
| (b) | The All Seasons Blended Index is comprised of 40% ICE U.S. Treasury 20+ Year Bond Index, 30% MSCI World Index, 15% ICE BofA 1-10 Year U.S. Treasury & Agency Index, 7.5% Bloomberg Commodity Index and 7.5% SPDR Gold Shares. |
The performance shown represents past performance and does not guarantee future results. Investment return and principal value will fluctuate so that an investor’s shares when repurchased may be worth more or less than their original cost. Current performance may be higher or lower than the performance data quoted. To obtain performance data current to the most recent month end, please call (855) 886-2307, or visit www.cazstrategicopportunitiesfund.com. Please read the Fund’s Prospectus carefully before investing.
| 2 | CAZ Strategic Opportunities Fund |
| CAZ STRATEGIC OPPORTUNITIES FUND PORTFOLIO INFORMATION September 30, 2024 (Unaudited) |
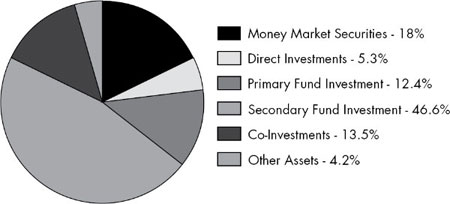
ASSET ALLOCATION (% of Net Assets)
| Percent of Total | ||||
| Security Type/Geographic Region | Net Assets | |||
| Private Investments | ||||
| Co-Investments | ||||
| Global | 1.3 | % | ||
| North America | 12.2 | % | ||
| Direct Investments | ||||
| Global | 2.8 | % | ||
| North America | 2.5 | % | ||
| Primary Fund Investments | ||||
| Global | 5.0 | % | ||
| North America | 7.4 | % | ||
| Secondary Fund Investments | ||||
| Global | 11.3 | % | ||
| North America | 35.3 | % | ||
| Total Private Investments | 77.8 | % | ||
| Money Market Securities | 18.0 | % | ||
| Total Investments | 95.8 | % | ||
| Other assets in excess of liabilities | 4.2 | % | ||
| Net Assets | 100.0 | % | ||
See accompanying notes to financial statements.
| Semi-Annual Report Dated September 30, 2024 | 3 |
| CAZ STRATEGIC OPPORTUNITIES FUND CONSOLIDATED SCHEDULE OF INVESTMENTS September 30, 2024 (Unaudited) |
| Shares | Value | |||||||
| PRIVATE INVESTMENTS — 77.8% | ||||||||
| CO-INVESTMENTS — 13.5% | ||||||||
| AEROSPACE AND DEFENSE — 3.1% | ||||||||
| Caffeinated Capital Saronic SPV, LLC (a)(b)(c)(d) | — | $ | 1,000,000 | |||||
| Caffeinated Capital Varda SPV II, LLC (a)(b)(c)(d) | — | 2,000,000 | ||||||
| Tamarack Global Impulse Space II, LP (a)(b)(c)(d) | — | 1,500,000 | ||||||
| 4,500,000 | ||||||||
| CONSUMER DISCRETIONARY — 1.2% | ||||||||
| ASP II AMR Co-Invest, LP (a)(b)(c)(d)(h) | — | 1,785,604 | ||||||
| ENERGY — 2.9% | ||||||||
| Hercules CV, LP (a)(b)(c)(d)(h) | — | 3,639,892 | ||||||
| Quantum Energy Partners VIII-D Co-Investment Fund, LP (a)(b)(c)(d) | — | 462,566 | ||||||
| 4,102,458 | ||||||||
| FINANCIALS — 2.1% | ||||||||
| Endurance Parallel Offshore LP (a)(b)(c)(d) | — | 2,983,803 | ||||||
| INFORMATION TECHNOLOGY — 3.6% | ||||||||
| Caffeinated Capital Aven SPV III, LLC (a)(b)(c)(d) | — | 2,180,724 | ||||||
| Caffeinated Capital Playground SPV, LLC (a)(b)(c)(d) | — | 250,050 | ||||||
| GrowthCurve Capital Destination Co-Invest LP (a)(b)(c)(d) | — | 1,004,414 | ||||||
| M13 SO X LLC (a)(c)(d)(e) | — | 1,615,000 | ||||||
| 5,050,188 | ||||||||
| UTILITIES — 0.6% | ||||||||
| Stonepeak Cologix Holdings LP (a)(b)(c)(d) | — | 916,919 | ||||||
| TOTAL CO-INVESTMENTS (Cost $19,399,046) | 19,338,972 | |||||||
| DIRECT INVESTMENTS — 5.3% | ||||||||
| CONSUMER STAPLES — 1.7% | ||||||||
| Wonder Group, Inc. (a)(c)(d)(e)(f) | — | 2,500,000 | ||||||
| FINANCIALS — 2.8% | ||||||||
| Pershing Square Holdco, LP (a)(c)(e)(h) | — | 4,000,000 | ||||||
See accompanying notes to financial statements.
| 4 | CAZ Strategic Opportunities Fund |
| CAZ STRATEGIC OPPORTUNITIES FUND CONSOLIDATED SCHEDULE OF INVESTMENTS September 30, 2024 (Unaudited) (Continued) |
| Shares | Value | |||||||
| PRIVATE INVESTMENTS — 77.8% (Continued) | ||||||||
| DIRECT INVESTMENTS — 5.3% (Continued) | ||||||||
| INFORMATION TECHNOLOGY — 0.8% | ||||||||
| Biofire Group Inc. (c)(d)(e) | 234,345 | $ | 249,999 | |||||
| ICON Technology, Inc. (c)(d)(e) | 54,372 | 890,699 | ||||||
| 1,140,698 | ||||||||
| TOTAL DIRECT INVESTMENTS (Cost $7,640,698) | 7,640,698 | |||||||
| PRIMARY FUND INVESTMENTS — 12.4% | ||||||||
| DIVERSIFIED — 5.0% | ||||||||
| Capstone Dispersion Fund (US) LP (a)(b)(c)(d) | — | 3,533,931 | ||||||
| Saba Capital Carry Neutral Tail Hedge Partners, LP (a)(b)(c)(d) | — | 3,558,990 | ||||||
| 7,092,921 | ||||||||
| ENERGY — 2.1% | ||||||||
| Quantum Parallel Partners VIII-D, LP (a)(b)(c)(d) | — | 3,046,060 | ||||||
| FINANCIALS — 2.9% | ||||||||
| GCM Grosvenor Elevate Feeder Fund I, LP (a)(b)(c)(d) | — | 1,518,698 | ||||||
| Palmer Square Income Plus Fund LLC (a)(b)(c)(d) | — | 2,594,735 | ||||||
| 4,113,433 | ||||||||
| INFORMATION TECHNOLOGY — 2.4% | ||||||||
| H. Barton Venture Select V, LLC (a)(b)(c)(d) | — | 319,288 | ||||||
| Tamarack Global Opportunities II, LP (a)(b)(c)(d) | — | 1,875,000 | ||||||
| Vista Equity Partners Fund VIII-A, LP (a)(b)(c)(d) | — | 1,311,431 | ||||||
| 3,505,719 | ||||||||
| TOTAL PRIMARY FUND INVESTMENTS (Cost $17,780,783) | 17,758,133 | |||||||
| SECONDARY FUND INVESTMENTS — 46.6% | ||||||||
| CONSUMER DISCRETIONARY — 6.0% | ||||||||
| Arctos Sports Partners Fund I, LP (a)(b)(c)(d)(h) | — | 8,577,796 | ||||||
| DIVERSIFIED — 13.4% | ||||||||
| Dawson Rated Fund 6-R1 Holdings LP (a)(b)(c)(d)(h) | — | 2,622,212 | ||||||
| Gordon Holdings (Offshore) I LP (a)(b)(c)(d) | — | 16,523,075 | ||||||
| 19,145,287 | ||||||||
See accompanying notes to financial statements.
| Semi-Annual Report Dated September 30, 2024 | 5 |
| CAZ STRATEGIC OPPORTUNITIES FUND CONSOLIDATED SCHEDULE OF INVESTMENTS September 30, 2024 (Unaudited) (Continued) |
| Shares | Value | |||||||
| PRIVATE INVESTMENTS — 77.8% (Continued) | ||||||||
| SECONDARY FUND INVESTMENTS — 46.6% (Continued) | ||||||||
| FINANCIALS — 25.6% | ||||||||
| Blue Owl GP Stakes Atlas Fund I Offshore Investors LP (a)(b)(c)(d) | — | $ | 24,000,000 | |||||
| Blue Owl GP Stakes II Pension Investors LP (a)(b)(c)(d) | — | 2,961,663 | ||||||
| Blue Owl GP Stakes IV US Investors, LP (a)(b)(c)(d)(h) | — | 5,034,292 | ||||||
| Blue Owl GP Stakes Offshore Investors LP (a)(b)(c)(d) | — | 1,118,781 | ||||||
| Petershill Private Equity Seeding Offshore SCSp (a)(b)(c)(d) | — | 3,700,626 | ||||||
| 36,815,362 | ||||||||
| INFORMATION TECHNOLOGY — 1.6% | ||||||||
| NEA Secondary Opportunity Fund, LP (a)(b)(c)(d) | — | 2,255,000 | ||||||
| TOTAL SECONDARY FUND INVESTMENTS (Cost $61,739,894) | 66,793,445 | |||||||
| TOTAL PRIVATE INVESTMENTS (Cost $106,560,421) | $ | 111,531,248 | ||||||
| MONEY MARKET SECURITIES — 18.0% | Par Value | Value | ||||||
| Federated Treasury Obligations Fund - Institutional Shares, 4.80% (g)(h) (Cost $25,729,757) | $ | 25,729,757 | $ | 25,729,757 | ||||
| TOTAL INVESTMENTS AT VALUE — 95.8% (Cost $132,290,178) | $ | 137,261,005 | ||||||
| OTHER ASSETS IN EXCESS OF LIABILITIES — 4.2% | 6,084,900 | |||||||
| NET ASSETS — 100.0% | $ | 143,345,905 | ||||||
| (a) | Investment does not issue shares. |
| (b) | Investment is valued using the Fund’s pro rata net asset value (or its equivalent) as a practical expedient. Please see Note 2 in the Notes to the Financial Statements for respective investment strategies, unfunded commitments, and redemption restrictions. |
| (c) | Restricted investments as to resale (see Note 2). |
| (d) | Non-income producing security. |
| (e) | Level 3 securities fair valued using significant unobservable inputs (see Note 2). |
| (f) | Represents the right to convert the holding to common stock upon a liquidity event. |
| (g) | The rate shown is the 7-day effective yield as of September 30, 2024. |
| (h) | All or portion of the security is a holding of the CAZ SOF Opportunistic Blocker LLC (see Note 1). |
LLC — Limited Liability Company
LP — Limited Partnership
See accompanying notes to financial statements.
| 6 | CAZ Strategic Opportunities Fund |
| CAZ STRATEGIC OPPORTUNITIES FUND CONSOLIDATED STATEMENT OF ASSETS AND LIABILITIES September 30, 2024 (Unaudited) |
| ASSETS | ||||
| Investments in securities: | ||||
| Investments at cost | $ | 132,290,178 | ||
| Investments at value | $ | 137,261,005 | ||
| Cash | 6,148,118 | |||
| Dividends and interest receivable | 149,744 | |||
| Deferred offering costs (Note 4) | 185,867 | |||
| Prepaid expenses | 22,084 | |||
| TOTAL ASSETS | 143,766,818 | |||
| LIABILITIES | ||||
| Subscription received in advance | 25,000 | |||
| Payable to Adviser (Note 4) | 149,215 | |||
| Payable to administrator (Note 4) | 45,536 | |||
| Accrued shareholder servicing fees (Note 4) | 7,851 | |||
| Accrued professional fees | 121,464 | |||
| Other accrued expenses | 71,847 | |||
| TOTAL LIABILITIES | 420,913 | |||
| Contingencies and Commitments (Note 6) | ||||
| NET ASSETS | $ | 143,345,905 | ||
| NET ASSETS CONSIST OF: | ||||
| Paid-in capital | $ | 138,529,280 | ||
| Distributable earnings | 4,816,625 | |||
| NET ASSETS | $ | 143,345,905 | ||
| PRICING OF CLASS I SHARES | ||||
| Net assets applicable to Class I Shares | $ | 62,847,059 | ||
| Shares of Class I Shares outstanding (no par value, unlimited number of shares authorized) | 2,903,161 | |||
| Net asset value, offering and repurchase price per share (a) (Note 2) | $ | 21.65 | ||
| PRICING OF CLASS F SHARES | ||||
| Net assets applicable to Class F Shares | $ | 60,213,616 | ||
| Shares of Class F Shares outstanding (no par value, unlimited number of shares authorized) | 2,779,589 | |||
| Net asset value, offering and repurchase price per share (a) (Note 2) | $ | 21.66 | ||
| PRICING OF CLASS R SHARES | ||||
| Net assets applicable to Class R Shares | $ | 20,285,230 | ||
| Shares of Class R Shares outstanding (no par value, unlimited number of shares authorized) | 938,520 | |||
| Net asset value, offering and repurchase price per share (a) (Note 2) | $ | 21.61 |
| (a) | Early repurchase fee may apply to tender of shares held for less than one year (Note 7). |
See accompanying notes to financial statements.
| Semi-Annual Report Dated September 30, 2024 | 7 |
| CAZ STRATEGIC OPPORTUNITIES FUND CONSOLIDATED STATEMENT OF OPERATIONS For the Six Months Ended September 30, 2024 (Unaudited) |
| INVESTMENT INCOME | ||||
| Dividend income | $ | 849,132 | ||
| Distribution income from the Private Investments | 20,757 | |||
| TOTAL INVESTMENT INCOME | 869,889 | |||
| EXPENSES | ||||
| Investment management fees (Note 4) | 534,536 | |||
| Offering costs (Note 4) | 223,041 | |||
| Investment subclose interest expense | 164,242 | |||
| Administration fees (Note 4) | 140,189 | |||
| Legal fees | 116,490 | |||
| Audit and tax services fees | 54,250 | |||
| Trustees’ fees (Note 4) | 51,233 | |||
| Transfer agent fees and expenses (Note 4) | 48,710 | |||
| Certifying financial officer fees (Note 4) | 32,500 | |||
| Fund accounting fees (Note 4) | 31,165 | |||
| Compliance fees (Note 4) | 27,500 | |||
| Shareholder servicing fees, Class R (Note 4) | 16,393 | |||
| Registration and filing fees | 13,957 | |||
| Report printing fees | 10,785 | |||
| Custodian fees | 7,270 | |||
| Other expenses | 32,410 | |||
| TOTAL EXPENSES | 1,504,671 | |||
| Investment management fees waived and expenses reimbursed by the Adviser (Note 4) | (322,337 | ) | ||
| Class F other expenses reimbursed by the Adviser (Note 4) | (35,241 | ) | ||
| NET EXPENSES | 1,147,093 | |||
| NET INVESTMENT LOSS | (277,204 | ) | ||
| REALIZED AND UNREALIZED GAINS (LOSSES) | ||||
| Net realized gains from: | ||||
| Investments | 36,477 | |||
| Net change in unrealized appreciation (depreciation) on: | ||||
| Investments | 4,960,062 | |||
| NET REALIZED AND UNREALIZED GAINS (LOSSES) | 4,996,539 | |||
| NET INCREASE IN NET ASSETS RESULTING FROM OPERATIONS | $ | 4,719,335 |
See accompanying notes to financial statements.
| 8 | CAZ Strategic Opportunities Fund |
| CAZ STRATEGIC OPPORTUNITIES FUND CONSOLIDATED STATEMENTS OF CHANGES IN NET ASSETS |
| Six Months Ended | ||||||||
| September 30, | Period Ended | |||||||
| 2024 | March 31, | |||||||
| (Unaudited) | 2024(a) | |||||||
| FROM OPERATIONS | ||||||||
| Net investment income (loss) | $ | (277,204 | ) | $ | 86,525 | |||
| Net realized gains | 36,477 | — | ||||||
| Net change in unrealized appreciation (depreciation) | 4,960,062 | 10,765 | ||||||
| Net increase in net assets resulting from operations | 4,719,335 | 97,290 | ||||||
| CAPITAL SHARE TRANSACTIONS | ||||||||
| Class I | ||||||||
| Proceeds from shares sold | 8,180,000 | 50,310,000 | ||||||
| Net increase in Class I net assets from capital share transactions | 8,180,000 | 50,310,000 | ||||||
| Class F | ||||||||
| Proceeds from shares sold | 60,259,000 | (b) | N/A | |||||
| Net increase in Class F net assets from capital share transactions | 60,259,000 | (b) | N/A | |||||
| Class R | ||||||||
| Proceeds from shares sold | 17,065,300 | 2,614,980 | ||||||
| Net increase in Class R net assets from capital share transactions | 17,065,300 | 2,614,980 | ||||||
| TOTAL INCREASE IN NET ASSETS | 90,223,635 | 53,022,270 | ||||||
| NET ASSETS | ||||||||
| Beginning of period | $ | 53,122,270 | $ | 100,000 | ||||
| End of period | $ | 143,345,905 | $ | 53,122,270 | ||||
See accompanying notes to financial statements.
| Semi-Annual Report Dated September 30, 2024 | 9 |
| CAZ STRATEGIC OPPORTUNITIES FUND CONSOLIDATED STATEMENTS OF CHANGES IN NET ASSETS (Continued) |
| Six Months Ended | ||||||||
| September 30, | Period Ended | |||||||
| 2024 | March 31, | |||||||
| (Unaudited) | 2024(a) | |||||||
| CAPITAL SHARE ACTIVITY | ||||||||
| Class I | ||||||||
| Shares sold | 382,661 | 2,515,500 | ||||||
| Net increase in shares outstanding | 382,661 | 2,515,500 | ||||||
| Shares outstanding, beginning of period | 2,520,500 | 5,000 | ||||||
| Shares outstanding, end of period | 2,903,161 | 2,520,500 | ||||||
| Class F | ||||||||
| Shares sold | 2,779,589 | (b) | N/A | |||||
| Net increase in shares outstanding | 2,779,589 | (b) | N/A | |||||
| Shares outstanding, beginning of period | — | N/A | ||||||
| Shares outstanding, end of period | 2,779,589 | (b) | N/A | |||||
| Class R | ||||||||
| Shares sold | 807,771 | 130,749 | ||||||
| Net increase in shares outstanding | 807,771 | 130,749 | ||||||
| Shares outstanding, beginning of period | 130,749 | — | ||||||
| Shares outstanding, end of period | 938,520 | 130,749 | ||||||
| (a) | Represents the period from the commencement date of operations March 1, 2024 through March 31, 2024. |
| (b) | Represents the period from the commencement date of operations June 1, 2024 through September 30, 2024. |
See accompanying notes to financial statements.
| 10 | CAZ Strategic Opportunities Fund |
| CAZ STRATEGIC OPPORTUNITIES FUND CONSOLIDATED STATEMENT OF CASH FLOWS For the Six Months Ended September 30, 2024 (Unaudited) |
| Cash flows from operating activities | ||||
| Net increase in net assets from operations | $ | 4,719,335 | ||
| Adjustments to reconcile net increase in net assets resulting from operations to net cash used in operating activities: | ||||
| Purchases of investments | (92,087,696 | ) | ||
| Sales of investments | 3,536,477 | |||
| Sales of short-term investments, net | 9,133,421 | |||
| Net realized gains | (36,477 | ) | ||
| Net change in unrealized appreciation on investments | (4,960,062 | ) | ||
| (Increase)/Decrease in Assets: | ||||
| Decrease to dividend and interest receivable | 36,749 | |||
| Decrease to deferred offering cost | 223,041 | |||
| Increase to prepaid expenses | (5,321 | ) | ||
| Increase/(Decrease) in Liabilities: | ||||
| Decrease to payable to Adviser | (30,788 | ) | ||
| Decrease to accrued organizational cost | (63,869 | ) | ||
| Decrease to payable to administrator | (6,509 | ) | ||
| Increase to accrued shareholder servicing fees | 7,306 | |||
| Increase to professional fees | 96,631 | |||
| Increase to other accrued expenses | 56,580 | |||
| Net cash used in operating activities | $ | (79,381,182 | ) | |
| Cash flows from financing activities | ||||
| Proceeds from issuance of shares net of change in subscription received in advance | 81,210,187 | |||
| Proceeds from early repurchased fees collected | — | |||
| Net cash provided by financing activities | $ | 81,210,187 | ||
| Net change in cash | $ | 1,829,005 | ||
| Cash at beginning of period | $ | 4,319,113 | ||
| Cash at end of period | $ | 6,148,118 | ||
| Supplemental disclosure of non-cash activity: | ||||
| Reinvestment of distributions from underlying investments | $ | 44,121 | ||
| Reinvestment of Fund distributions to shareholders | $ | — |
See accompanying notes to financial statements.
| Semi-Annual Report Dated September 30, 2024 | 11 |
| CAZ STRATEGIC OPPORTUNITIES FUND CLASS I SHARES CONSOLIDATED FINANCIAL HIGHLIGHTS |
Per Share Data for a Share Outstanding Throughout Each Period
| Six Months Ended | ||||||||
| September 30, | Period Ended | |||||||
| 2024 | March 31, | |||||||
| (Unaudited)* | 2024*(a) | |||||||
| Net asset value at beginning of period | $ | 20.04 | $ | 20.00 | ||||
| Income (loss) from investment operations: | ||||||||
| Net investment income (loss) (b)(c) | (0.05 | ) | 0.03 | |||||
| Net realized and unrealized gains (losses) on investments | 1.66 | 0.01 | ||||||
| Total from investment operations | 1.61 | 0.04 | ||||||
| Net asset value at end of period | $ | 21.65 | $ | 20.04 | ||||
| Total return (d) | 8.09 | % (e) | 0.20 | % (e) | ||||
| Net assets at end of period (000’s) | $ | 62,847 | $ | 50,503 | ||||
| Ratios/supplementary data: | ||||||||
| Ratio of total expenses to average net assets inclusive of interest expense(f) | 3.24 | % (i) | 6.05 | % (g) | ||||
| Ratio of net expenses to average net assets inclusive of interest expense(f)(h) | 2.46 | % (i) | 2.25 | % (i) | ||||
| Ratio of total expenses to average net assets exclusive of interest expense(f) | 2.93 | % (i) | 6.05 | % (g) | ||||
| Ratio of net expenses to average net assets exclusive of interest expense(f)(h) | 2.15 | % (i) | 2.25 | % (i) | ||||
| Ratio of net investment income (loss) to average net assets (b)(f)(h) | (0.48 | %) (i) | 1.97 | % (i) | ||||
| Portfolio turnover rate | 20 | % (e) | 0 | % (e) | ||||
| * | Includes adjustments in accordance with generally accepted accounting principles in the United States, and consequently, the net asset value for financial reporting purposes and returns based upon these net asset values may differ from the net asset values and returns for shareholder transactions. |
| (a) | Represents the period from the commencement date of operations March 1, 2024 through March 31, 2024. |
| (b) | Recognition of net investment income (loss) by the Fund is affected by the timing of the declaration of the dividends by the underlying investment companies in which the Fund invests. The ratio of net investment income (loss) does not include the net investment income (loss) of the investment companies in which the Fund invests. |
| (c) | Net investment income (loss) per share has been calculated using the average monthly shares outstanding during the period. |
| (d) | Total return is a measure of the change in value of an investment in the Fund over the period covered, which assumes any dividends and capital gain distributions are reinvested in shares of the Fund. The returns shown do not reflect the deduction of taxes a shareholder would pay on Fund distributions, if any, or the repurchase of Fund shares. The returns would have been lower if certain expenses had not been waived or reimbursed by the Adviser. |
| (e) | Not annualized. |
| (f) | The ratios of expenses and net investment income to average net assets do not reflect the Fund’s proportionate share of income and expenses of underlying investment companies in which the Fund invests, including management and performance fees. As of September 30, 2024, the Fund’s underlying investment companies included a range of management and/or administrative fees from 0.0% to 2.0% (unaudited) and performance fees of 0.0% to 25.0% (unaudited). |
| (g) | Annualized, except for non-recurring organizational expenses. |
| (h) | Ratio was determined after management fees waived and expense reimbursements (Note 4). |
| (i) | Annualized. |
See accompanying notes to financial statements.
| 12 | CAZ Strategic Opportunities Fund |
| CAZ STRATEGIC OPPORTUNITIES FUND CLASS F SHARES CONSOLIDATED FINANCIAL HIGHLIGHTS |
Per Share Data for a Share Outstanding Throughout the Period
| Period Ended | ||||
| September 30, | ||||
| 2024 | ||||
| (Unaudited)*(a) | ||||
| Net asset value at beginning of period | $ | 21.68 | ||
| Income (loss) from investment operations: | ||||
| Net investment loss (b)(c) | (0.05 | ) | ||
| Net realized and unrealized gains (losses) on investments | 0.03 | |||
| Total from investment operations | (0.02 | ) | ||
| Net asset value at end of period | $ | 21.66 | ||
| Total return (d) | (0.09 | )% (e) | ||
| Net assets at end of period (000’s) | $ | 60,214 | ||
| Ratios/supplementary data: | ||||
| Ratio of total expenses to average net assets inclusive of interest expense(f) | 3.06 | % (g) | ||
| Ratio of net expenses to average net assets inclusive of interest expense(f)(h) | 2.29 | % (g) | ||
| Ratio of total expenses to average net assets exclusive of interest expense(f) | 2.61 | % (g) | ||
| Ratio of net expenses to average net assets exclusive of interest expense(f)(h) | 1.84 | % (g) | ||
| Ratio of net investment income (loss) to average net assets (b)(f)(h) | (0.69 | %) (g) | ||
| Portfolio turnover rate | 20 | % (e) | ||
| * | Includes adjustments in accordance with generally accepted accounting principles in the United States, and consequently, the net asset value for financial reporting purposes and returns based upon these net asset values may differ from the net asset values and returns for shareholder transactions. |
| (a) | Represents the period from the commencement date of operations June 1, 2024 through September 30, 2024. |
| (b) | Recognition of net investment income (loss) by the Fund is affected by the timing of the declaration of the dividends by the underlying investment companies in which the Fund invests. The ratio of net investment income (loss) does not include the net investment income (loss) of the investment companies in which the Fund invests. |
| (c) | Net investment income (loss) per share has been calculated using the average monthly shares outstanding during the period. |
| (d) | Total return is a measure of the change in value of an investment in the Fund over the period covered, which assumes any dividends and capital gain distributions are reinvested in shares of the Fund. The returns shown do not reflect the deduction of taxes a shareholder would pay on Fund distributions, if any, or the repurchase of Fund shares. The returns would have been lower if certain expenses had not been waived or reimbursed by the Adviser. |
| (e) | Not annualized. |
| (f) | The ratios of expenses and net investment income to average net assets do not reflect the Fund’s proportionate share of income and expenses of underlying investment companies in which the Fund invests, including management and performance fees. As of September 30, 2024, the Fund’s underlying investment companies included a range of management and/or administrative fees from 0.0% to 2.0% (unaudited) and performance fees of 0.0% to 25.0% (unaudited). |
| (g) | Annualized. |
| (h) | Ratio was determined after management fees waived and expense reimbursements (Note 4). |
See accompanying notes to financial statements.
| Semi-Annual Report Dated September 30, 2024 | 13 |
| CAZ STRATEGIC OPPORTUNITIES FUND CLASS R SHARES CONSOLIDATED FINANCIAL HIGHLIGHTS |
Per Share Data for a Share Outstanding Throughout Each Period
| Six Months Ended | ||||||||
| September 30, | Period Ended | |||||||
| 2024 | March 31, | |||||||
| (Unaudited)* | 2024*(a) | |||||||
| Net asset value at beginning of period | $ | 20.03 | $ | 20.00 | ||||
| Income (loss) from investment operations: | ||||||||
| Net investment income (loss) (b)(c) | (0.10 | ) | 0.03 | |||||
| Net realized and unrealized gains (losses) on investments | 1.68 | — | (d) | |||||
| Total from investment operations | 1.58 | 0.03 | ||||||
| Net asset value at end of period | $ | 21.61 | $ | 20.03 | ||||
| Total return (e) | 7.89 | % (f) | 0.15 | % (f) | ||||
| Net assets at end of period (000’s) | $ | 20,285 | $ | 2,619 | ||||
| Ratios/supplementary data: | ||||||||
| Ratio of total expenses to average net assets inclusive of interest expense(g) | 3.42 | % (j) | 6.30 | % (h) | ||||
| Ratio of net expenses to average net assets inclusive of interest expense(g)(i) | 2.76 | % (j) | 2.50 | % (j) | ||||
| Ratio of total expenses to average net assets exclusive of interest expense(g) | 3.06 | % (j) | 6.30 | % (h) | ||||
| Ratio of net expenses to average net assets exclusive of interest expense(g)(i) | 2.39 | % (j) | 2.50 | % (j) | ||||
| Ratio of net investment income (loss) to average net assets (b)(g)(i) | (0.91 | %) (j) | 1.72 | % (j) | ||||
| Portfolio turnover rate | 20 | % (f) | 0 | % (f) | ||||
| * | Includes adjustments in accordance with generally accepted accounting principles in the United States, and consequently, the net asset value for financial reporting purposes and returns based upon these net asset values may differ from the net asset values and returns for shareholder transactions. |
| (a) | Represents the period from the commencement date of operations March 1, 2024 through March 31, 2024. |
| (b) | Recognition of net investment income (loss) by the Fund is affected by the timing of the declaration of the dividends by the underlying investment companies in which the Fund invests. The ratio of net investment income (loss) does not include the net investment income (loss) of the investment companies in which the Fund invests. |
| (c) | Net investment income (loss) per share has been calculated using the average monthly shares outstanding during the period. |
| (d) | Amount rounds to less than $0.01 per share. |
| (e) | Total return is a measure of the change in value of an investment in the Fund over the period covered, which assumes any dividends and capital gain distributions are reinvested in shares of the Fund. The returns shown do not reflect the deduction of taxes a shareholder would pay on Fund distributions, if any, or the repurchase of Fund shares. The returns would have been lower if certain expenses had not been waived or reimbursed by the Adviser. |
| (f) | Not annualized. |
| (g) | The ratios of expenses and net investment income to average net assets do not reflect the Fund’s proportionate share of income and expenses of underlying investment companies in which the Fund invests, including management and performance fees. As of September 30, 2024, the Fund’s underlying investment companies included a range of management and/or administrative fees from 0.0% to 2.0% (unaudited) and performance fees of 0.0% to 25.0% (unaudited). |
| (h) | Annualized, except for non-recurring organizational expenses. |
| (i) | Ratio was determined after management fees waived and expense reimbursements (Note 4). |
| (j) | Annualized. |
See accompanying notes to financial statements.
| 14 | CAZ Strategic Opportunities Fund |
| CAZ STRATEGIC OPPORTUNITIES FUND NOTES TO CONSOLIDATED FINANCIAL STATEMENTS September 30, 2024 (Unaudited) |
| 1. | Organization |
CAZ Strategic Opportunities Fund (the “Fund”) is organized as a Delaware statutory trust that is registered under the Investment Company Act of 1940, as amended (the “1940 Act”), as a non-diversified, closed-end management investment company. The Fund operates as a “tender offer fund,” which means that it is subject to the requirements of Rule 13e-4 under the Securities Exchange Act of 1934, as amended (the “1934 Act”), with respect thereto. The Fund’s investment objectives are to seek long-term capital appreciation and current income. The Fund seeks to achieve its investment objective by investing or making capital commitments in a broad cross section of private market assets across multiple strategies, geographies and asset classes. The Fund commenced operations on March 1, 2024.
The Fund currently offers six classes of shares: Class D shares and Class R shares are sold without any sales loads and subject to a $25,000 initial investment minimum. Class E shares and Class F shares are sold without any sales loads, but are subject to a $100,000 initial investment minimum. Class I shares are sold without any sales loads, but are subject to a $500,000 initial investment minimum. Class A shares are subject to a sales charge of up to 3.00% and a $25,000 initial investment. As of September 30, 2024, Class D, Class E and Class A have not yet commenced operations.
Consolidation of a Subsidiary – CAZ SOF Opportunistic Blocker LLC (the “Subsidiary”), a Delaware limited liability company and wholly-owned subsidiary of the Fund was formed on February 25, 2024. These consolidated financial statements include the financial position and the results of operations of the Fund and the Subsidiary. The Subsidiary has the same investment objective as the Fund. As of September 30, 2024, the net assets of the Subsidiary were $25,807,464, which is 18.00% of the Fund’s net assets.
2. Significant Accounting Policies
The following is a summary of the Fund’s significant accounting policies.
Basis of Presentation and Use of Estimates – The Fund is an investment company and accordingly follows the investment company accounting and reporting guidance of the Financial Accounting Standards Board (“FASB”) Accounting Standards Codification Topic 946, Financial Services – Investment Companies. The consolidated financial statements are prepared in conformity with accounting principles generally accepted in the United States of America (“U.S. GAAP”), which requires management to make estimates and assumptions that affect the reported amounts of assets and liabilities and disclosure of contingent assets and liabilities at the date of the financial statement. Actual results could differ from those estimates.
Cash and Cash Equivalents — Idle cash may be swept into various short-term investments, including money market funds or interest bearing overnight demand deposit accounts, in amounts which may exceed insured limits. Amounts swept overnight are available on the next business day.
Valuation of Securities –- The Fund calculates the net asset value (“NAV”) of each class of shares of the Fund as of the close of business on the last business day of each calendar month, each date that a Share is offered, as of the date of any distribution and at such other times as the Trustees of the Fund (the “Board”) shall determine (each, a “Determination Date”). In determining the NAV of each class of shares, the Fund values its investments as of the relevant Determination Date. The net assets of each class of the Fund equals the value of the total assets of the class, less all of the liabilities attributable to the class, including accrued fees and expenses, each determined as of the relevant Determination Date.
The valuation of the Fund’s investments is performed in accordance with the Pricing and Fair Valuation Policies (“Valuation Policies”) approved by the Board, and in conjunction with FASB’s Accounting Standards Codification Topic 820, Fair Value Measurements and Disclosures.
| Semi-Annual Report Dated September 30, 2024 | 15 |
| CAZ STRATEGIC OPPORTUNITIES FUND NOTES TO CONSOLIDATED FINANCIAL STATEMENTS September 30, 2024 (Unaudited) (Continued) |
The Board has designated CAZ Investments Registered Adviser LLC (the “Adviser” or “Valuation Designee”), the investment adviser to the Fund, as the Valuation Designee pursuant to Rule 2a-5 under the 1940 Act to perform the fair value determination relating to any and all Fund investments, subject to the conditions and oversight requirements described in the Valuation Policies.
The Fund’s investments are comprised primarily of instruments for which market prices are not readily available, such as hedge funds and private equity investments, including, but not limited to primary and secondary investments in private equity funds managed by third-party managers and direct private equity investments. Such investments may be valued at acquisition cost initially until the Valuation Designee determines acquisition cost no longer represents fair market value. The fair value of such investments as of each Determination Date ordinarily will be the capital account value of the Fund’s interest in such investments as provided by the relevant general partner, managing member or affiliated investment adviser of the private investment vehicles, such as private equity funds and private credit funds, in which the Fund invests (the “Investment Funds”) (the “Investment Managers”) as of or prior to the relevant Determination Date; provided that such values will be adjusted for any other relevant information available at the time the Fund values its portfolio, including capital activity and material events occurring between the reference dates of the Investment Managers’ valuations and the relevant Determination Date.
Securities traded on one or more of the U.S. national securities exchanges, the Nasdaq Stock Market or any foreign stock exchange are valued based on their respective market price. Shares of mutual funds, including money market funds, are valued at their reported NAV. Fixed income investments (other than short-term obligations) held by the Fund are normally valued at prices supplied by independent pricing services in accordance with the Valuation Policies. Short term investments maturing in 60 days or less are generally valued at amortized cost.
Assets and liabilities initially expressed in foreign currencies will be converted into U.S. Dollars using foreign exchange rates provided by a recognized pricing service.
U.S. GAAP establishes a single authoritative definition of fair value, sets out a framework for measuring fair value and requires additional disclosures about fair value measurement.
Various inputs are used in determining the value of the Fund’s investments. These inputs are summarized in the three broad levels listed below:
| ● | Level 1 – quoted prices in active markets for identical assets |
| ● | Level 2 – other significant observable inputs (including quoted prices of similar securities, interest rates, prepayment speeds, credit risk, etc.) |
| ● | Level 3 – significant unobservable inputs (including the Fund’s own assumptions in determining the fair value of investments) |
Private investments that are measured at fair value using the Fund’s pro rata NAV (or its equivalent) without further adjustment, as a practical expedient of fair value are excluded from the fair value hierarchy. Generally, the fair value of the Fund’s investment in a privately offered investment represents the amount that the Fund could reasonably expect to receive from the investment fund if the Fund’s investment is withdrawn at the measurement date based on NAV.
The inputs or methodology used for valuing securities are not necessarily an indication of the risks associated with investing in those securities. The inputs used to measure fair value may fall into different levels of the fair value hierarchy. In such cases, for disclosure purposes, the level in the fair value hierarchy within which the fair value measurement falls in its entirety is determined based on the lowest level input that is significant to the fair value measurement.
| 16 | CAZ Strategic Opportunities Fund |
| CAZ STRATEGIC OPPORTUNITIES FUND NOTES TO CONSOLIDATED FINANCIAL STATEMENTS September 30, 2024 (Unaudited) (Continued) |
The following is a summary of the Fund’s investments and inputs used to value the investments, by security type, as of September 30, 2024:
| Practical | ||||||||||||||||||||
| Investments in Securities | Expedient* | Level 1 | Level 2 | Level 3 | Total | |||||||||||||||
| Private Investments** | $ | 102,275,550 | $ | — | $ | — | $ | 9,255,698 | $ | 111,531,248 | ||||||||||
| Money Market Securities | — | 25,729,757 | — | — | 25,729,757 | |||||||||||||||
| Total | $ | 102,275,550 | $ | 25,729,757 | $ | — | $ | 9,255,698 | $ | 137,261,005 | ||||||||||
| * | Certain investments that are measured at fair value using the Fund’s pro rata NAV (or its equivalent) as a practical expedient have not been categorized in the fair value hierarchy. The fair value amounts presented in this table are intended to permit reconciliation of the fair value hierarchy to the amounts presented in the Consolidated Schedule of Investments. |
| ** | All sub-categories within the security type represent their respective evaluation status. For a detailed breakout please refer to the Consolidated Schedule of Investments. |
The following is the fair value measurement of investments that are measured at the Fund’s pro rata NAV (or its equivalent) as a practical expedient:
| Investment | Unfunded | Redemption | Redemption | |||||||||||
| Private Investment(a) | Strategy | Fair Value | Commitment | Frequency | Notice Period | |||||||||
| Arctos Sports Partners Fund I, LP | Professional Sports(c) | $ | 8,577,796 | $ | 1,461,705 | None(b) | Not Applicable | |||||||
| ASP II AMR Co-Invest, LP | Professional Sports(c) | 1,785,604 | 2,072,325 | None(b) | Not Applicable | |||||||||
| Blue Owl GP Stakes Atlas Fund I Offshore Investors LP | GP Stakes(d) | 24,000,000 | — | None(b) | Not Applicable | |||||||||
| Blue Owl GP Stakes II Pension Investors LP | GP Stakes(d) | 2,961,663 | 616,545 | None(b) | Not Applicable | |||||||||
| Blue Owl GP Stakes IV US Investors, LP | GP Stakes(d) | 5,034,292 | 4,624,816 | None(b) | Not Applicable | |||||||||
| Blue Owl GP Stakes Offshore Investors LP | GP Stakes(d) | 1,118,781 | 391,089 | None(b) | Not Applicable | |||||||||
| Caffeinated Capital Aven SPV III,LLC | Venture Capital(e) | 2,180,724 | — | None(b) | Not Applicable | |||||||||
| Caffeinated Capital Playground SPV,LLC | Venture Capital(e) | 250,050 | — | None(b) | Not Applicable | |||||||||
| Caffeinated Capital Saronic SPV, LLC | Venture Capital(e) | 1,000,000 | — | None(b) | Not Applicable | |||||||||
| Caffeinated Capital Varda SPV II, LLC | Venture Capital(e) | 2,000,000 | — | None(b) | Not Applicable | |||||||||
| Capstone Dispersion Fund (US) LP | Derivative(f) | 3,533,931 | — | Monthly on on the last business day of each month | 60 Days Notice | |||||||||
| Semi-Annual Report Dated September 30, 2024 | 17 |
| CAZ STRATEGIC OPPORTUNITIES FUND NOTES TO CONSOLIDATED FINANCIAL STATEMENTS September 30, 2024 (Unaudited) (Continued) |
| Investment | Unfunded | Redemption | Redemption | |||||||||||
| Private Investment(a) | Strategy | Fair Value | Commitment | Frequency | Notice Period | |||||||||
| Dawson Rated Fund 6-R1 Holdings LP | Secondaries(g) | $ | 2,622,212 | $ | 7,385,176 | None(b) | Not Applicable | |||||||
| Endurance Parallel Offshore LP | GP Stakes(d) | 2,983,803 | 3,516,197 | None(b) | Not Applicable | |||||||||
| GCM Grosvenor Elevate Feeder Fund I, LP | GP Stakes(d) | 1,518,698 | 23,481,302 | None(b) | Not Applicable | |||||||||
| Gordon Holdings (Offshore) I LP | Secondaries(g) | 16,523,075 | 6,527,275 | None(b) | Not Applicable | |||||||||
| GrowthCurve Capital Destination Co-Invest LP | Buyout(h) | 1,004,414 | — | None(b) | Not Applicable | |||||||||
| H. Barton Venture Select V, LLC | Venture Capital(e) | 319,288 | 2,670,000 | None(b) | Not Applicable | |||||||||
| Hercules CV, LP | Real Assets(i) | 3,639,892 | 307,546 | None(b) | Not Applicable | |||||||||
| NEA Secondary Opportunity Fund, LP | Venture Capital(e) | 2,255,000 | 245,000 | None(b) | Not Applicable | |||||||||
| Palmer Square Income Plus Fund LLC | Credit(j) | 2,594,735 | — | Bi-Monthly as of the 15th or final calendar day of the month | 5 business days | |||||||||
| Petershill Private Equity Seeding Offshore SCSp | GP Stakes(d) | 3,700,626 | 3,996,902 | None(b) | Not Applicable | |||||||||
| Quantum Energy Partners VIII-D Co-Investment Fund, LP | Real Assets(i) | 462,566 | 677,434 | None(b) | Not Applicable | |||||||||
| Quantum Parallel Partners VIII-D, LP | Real Assets(i) | 3,046,060 | 3,813,940 | None(b) | Not Applicable | |||||||||
| Saba Capital Carry Neutral Tail Hedge Partners, LP | Long/Short(k) | 3,558,990 | — | Monthly, Soft Lock-Up: 6 months on each new capital contribution. 2.5% early redemption fee. Gate: 25% of Master Fund Level Net Asset | 35 days Notice | |||||||||
| Stonepeak Cologix Holdings LP | Growth(l) | 916,919 | 2,083,081 | None(b) | Not Applicable | |||||||||
| Tamarack Global Impulse Space II,LP | Venture Capital(e) | 1,500,000 | — | None(b) | Not Applicable | |||||||||
| Tamarack Global Opportunities II, LP | Venture Capital(e) | 1,875,000 | 3,125,000 | None(b) | Not Applicable | |||||||||
| Vista Equity Partners Fund VIII-A, LP | Buyout(h) | 1,311,431 | 3,688,569 | None(b) | Not Applicable | |||||||||
| $ | 102,275,550 | $ | 70,683,902 | |||||||||||
| (a) | Refer to the Consolidated Schedule of Investments for classifications of individual securities. |
| (b) | Redemptions are not permitted. Proceeds will be distributed as they become available, the timing of which is currently unknown. Redemptions may be permitted based on general partner consent. |
| (c) | Professional Sports typically include minority equity investments in professional sports franchises, holding companies that own sports franchises, or preferred equity structures, where sports franchises and ancillary businesses are the underlying exposure. |
| 18 | CAZ Strategic Opportunities Fund |
| CAZ STRATEGIC OPPORTUNITIES FUND NOTES TO CONSOLIDATED FINANCIAL STATEMENTS September 30, 2024 (Unaudited) (Continued) |
| (d) | GP Stakes include investments in the General Partnership (“GP”) of a private asset management company. A GP Stake in a private asset manager can potentially provide cash flow and returns from at least three distinct sources: management fees, carried interest, and balance sheet return, in addition to the possible increase in the value of the asset management business. |
| (e) | A venture capital investment is an equity investment in which the target company is raising capital primarily to fund research and development, market development or revenue growth initiatives. Companies targeted for venture capital investments are typically at an early stage of development and are pursuing large market opportunities through the creation of innovative technologies and/or business models that have the potential to disrupt an established industry or deliver a novel solution for a specific market need. |
| (f) | Derivatives strategies involve using various derivative instruments such as futures, options, swaps and forward contracts. These financial instruments derive their value from an underlying asset, group of assets or benchmark. Common underlying assets for derivatives are stocks, bonds, commodities, currencies, interest rates, and market indexes. Derivatives may be used to hedge risk, speculate on directional movement of an underlying asset, or leverage a position. |
| (g) | Secondary investments involve the acquisition of an interest in one or more assets already acquired and held by a private fund or another investor’s existing interest in a private investment. The Adviser and/or Investment Managers determine the terms of each secondary investment through a negotiated transaction with the seller in which the private firm then managing such investment does not change. |
| (h) | A buyout investment is an equity investment in a company that facilitates a change in control of the company’s ownership. The private equity firm sponsoring such a transaction invests equity capital to acquire a controlling interest in, or effective control of, the target company. By acquiring a controlling interest, the private equity investor typically acquires a strong position from which to influence the target company’s strategic direction. |
| (i) | Investments in real assets may provide exposure to real estate, commodities, natural resources (such as agriculture and timber), infrastructure, and precious metals. |
| (j) | Credit investments may include, but are not limited to: (i) asset-backed securities including collateralized loan obligations and mortgage-backed securities, (ii) corporate bonds, notes, commercial paper and debentures, (iii) Securities issued or guaranteed by the U.S. Government, its agencies, instrumentalities or sponsored entities, senior secured floating rate and fixed rate loans or debt, and (iv) second lien or other subordinated or unsecured floating rate and fixed rate loans or debt. |
| (k) | A long/short strategy involves purchasing securities expected to increase in value (long) and selling borrowed securities expected to decline in value (short). This investment strategy can be used to hedge risk, reduce market exposure, or enhance risk-adjusted returns in varying market environments. |
| (l) | A growth equity investment is an equity investment in a company seeking capital primarily to fund growth initiatives. Growth equity often includes investments in private companies that have seen strong success but may still need additional capital to achieve the desired level of scale. |
The following is the activity in investments in which significant unobservable inputs (Level 3) were used in determining fair value as of September 30, 2024:
| Beginning | ||||||||||||||||
| balance | Transfers into | Transfers out of | ||||||||||||||
| March 31, | Level 3 during | Level 3 during | Purchases or | |||||||||||||
| 2024 | the period | the period | Contributions | |||||||||||||
| Private Investments | $ | 2,500,000 | $ | — | $ | — | $ | 6,755,698 | ||||||||
| Change in net | Ending | |||||||||||||||
| unrealized | Balance | |||||||||||||||
| Sales or | Net realized | Appreciation | September 30, | |||||||||||||
| Distributions | gain (loss) | (Depreciation) | 2024 | |||||||||||||
| Private Investments | $ | — | $ | — | $ | — | $ | 9,255,698 | ||||||||
The change in net unrealized appreciation (depreciation) included in the Consolidated Statement of Operations attributable to Level 3 investments that were held as of September 30, 2024 is $0.
During the six months ended September 30, 2024, there were no transfers into or out of any levels.
| Semi-Annual Report Dated September 30, 2024 | 19 |
| CAZ STRATEGIC OPPORTUNITIES FUND NOTES TO CONSOLIDATED FINANCIAL STATEMENTS September 30, 2024 (Unaudited) (Continued) |
The following is a summary of quantitative information about significant unobservable valuation inputs for Level 3 Fair Value Measurements for investments held as of September 30, 2024:
| Impact to | ||||||||||||
| Valuation from | ||||||||||||
| Valuation | Unobservable | Range of | an Increase | |||||||||
| Level 3 Investment(a) | Fair Value | Technique | Inputs | Inputs/Average | in Input | |||||||
| Biofire Group Inc. | $ | 249,999 | Recent Transaction | Transaction Price | Not Applicable | Increase | ||||||
| ICON Technology, Inc. | 890,699 | Recent Transaction | Transaction Price | Not Applicable | Increase | |||||||
| M13SOXLLC | 1,615,000 | Recent Transaction | Transaction Price | Not Applicable | Increase | |||||||
| Pershing Square Holdco, LP | 4,000,000 | Recent Transaction | Transaction Price | Not Applicable | Increase | |||||||
| Wonder Group, Inc. | 2,500,000 | Recent Transaction | Transaction Price | Not Applicable | Increase | |||||||
| $ | 9,255,698 | |||||||||||
| (a) | Refer to Consolidated Schedule of Investments for classifications of individual securities. |
Restricted Securities – Restricted securities are securities that may be resold only upon registration under federal securities laws or in transactions exempt from such registration. In some cases, the issuer of restricted securities has agreed to register such securities for resale, at the issuer’s expense either upon demand by the Fund or in connection with another registered offering of the securities. Many restricted securities may be resold in the secondary market in transactions exempt from registration. Such restricted securities may be determined to be liquid under criteria established by the Board. The restricted securities may be valued at the price provided by dealers in the secondary market or, if no market prices are available, the fair value as determined in good faith in accordance with the Fund’s Valuation Policies. Private Investments generally are restricted securities that are subject to substantial holding periods and are not traded in public markets. The Fund may not be able to resell some of its investments for extended periods, which may be several years.
Additional information on each restricted investment held by the Fund on September 30, 2024 is as follows:
| Security Description | Acquisition Date | Cost | Value | % of Net Assets | ||||||||
| Co-Investments | ||||||||||||
| ASP II AMR Co-Invest, LP | 6/3/2024 | $ | 1,791,887 | $ | 1,785,604 | 1.2% | ||||||
| Caffeinated Capital Aven SPV III, LLC | 4/30/2024 | 2,179,450 | 2,180,724 | 1.5% | ||||||||
| Caffeinated Capital Playground SPV, LLC | 5/7/2024 | 250,000 | 250,050 | 0.2% | ||||||||
| Caffeinated Capital Saronic SPV, LLC | 6/18/2024 | 1,000,000 | 1,000,000 | 0.7% | ||||||||
| Caffeinated Capital Varda SPV II, LLC | 9/6/2024 | 2,000,000 | 2,000,000 | 1.4% | ||||||||
| Endurance Parallel Offshore LP | 8/21/2024 | 2,983,803 | 2,983,803 | 2.1% | ||||||||
| GrowthCurve Capital Destination Co-Invest LP | 6/28/2024 | 1,006,968 | 1,004,414 | 0.7% | ||||||||
| Hercules CV, LP | 5/15/2024 | 3,692,453 | 3,639,892 | 2.6% | ||||||||
| M13SOXLLC | 7/19/2024 | 1,615,000 | 1,615,000 | 1.2% | ||||||||
| Quantum Energy Partners VIII-D Co-Investment Fund, LP | 9/11/2024 | 462,566 | 462,566 | 0.3% | ||||||||
| Stonepeak Cologix Holdings LP | 9/5/2024 | 916,919 | 916,919 | 0.6% | ||||||||
| Tamarack Global Impulse Space II, LP | 8/22/2024 | 1,500,000 | 1,500,000 | 1.0% | ||||||||
| 20 | CAZ Strategic Opportunities Fund |
| CAZ STRATEGIC OPPORTUNITIES FUND NOTES TO CONSOLIDATED FINANCIAL STATEMENTS September 30, 2024 (Unaudited) (Continued) |
| Security Description | Acquisition Date | Cost | Value | % of Net Assets | ||||||||
| Direct Investments | ||||||||||||
| Biofire Group Inc. | 7/11/2024 | $ | 249,999 | $ | 249,999 | 0.2% | ||||||
| ICON Technology, Inc. | 5/30/2024 | 890,699 | 890,699 | 0.6% | ||||||||
| Pershing Square Holdco, LP | 5/15/2024 | 4,000,000 | 4,000,000 | 2.8% | ||||||||
| Wonder Group, Inc. | 3/15/2024 | 2,500,000 | 2,500,000 | 1.7% | ||||||||
| Primary Fund Investments | ||||||||||||
| Capstone Dispersion Fund (US) LP | 9/1/2024 | $ | 3,536,477 | $ | 3,533,931 | 2.5% | ||||||
| GCM Grosvenor Elevate Feeder Fund I, LP | 8/2/2024 | 1,598,893 | 1,518,698 | 1.1% | ||||||||
| H. Barton Venture Select V, LLC | 4/18/2024 | 330,000 | 319,288 | 0.2% | ||||||||
| Palmer Square Income Plus Fund LLC | 3/15/2024 | 2,500,000 | 2,594,735 | 1.8% | ||||||||
| Quantum Parallel Partners VIII-D, LP | 9/11/2024 | 3,046,060 | 3,046,060 | 2.1% | ||||||||
| Saba Capital Carry Neutral Tail Hedge Partners, LP | 7/1/2024 | 3,500,000 | 3,558,990 | 2.5% | ||||||||
| Tamarack Global Opportunities II, LP | 8/1/2024 | 1,875,000 | 1,875,000 | 1.3% | ||||||||
| Vista Equity Partners Fund VIII-A, LP | 7/31/2024 | 1,394,353 | 1,311,431 | 0.9% | ||||||||
| Secondary Fund Investments | ||||||||||||
| Arctos Sports Partners Fund I, LP | 7/1/2024 | $ | 8,577,796 | $ | 8,577,796 | 6.0% | ||||||
| Blue Owl GP Stakes Atlas Fund I Offshore Investors LP | 8/6/2024 | 24,000,000 | 24,000,000 | 16.6% | ||||||||
| Blue Owl GP Stakes II Pension Investors LP | 4/1/2024 | 2,353,403 | 2,961,663 | 2.1% | ||||||||
| Blue Owl GP Stakes IV US Investors, LP | 9/30/2024 | 5,034,292 | 5,034,292 | 3.5% | ||||||||
| Blue Owl GP Stakes Offshore Investors LP | 4/1/2024 | 642,995 | 1,118,781 | 0.8% | ||||||||
| Dawson Rated Fund 6-R1 Holdings LP | 9/30/2024 | 2,622,212 | 2,622,212 | 1.8% | ||||||||
| Gordon Holdings (Offshore) I LP | 3/26/2024 | 12,553,571 | 16,523,075 | 11.6% | ||||||||
| NEA Secondary Opportunity Fund, LP | 7/17/2024 | 2,255,000 | 2,255,000 | 1.6% | ||||||||
| Petershill Private Equity Seeding Offshore SCSp | 7/2/2024 | 3,700,625 | 3,700,626 | 2.6% | ||||||||
| $ | 106,560,421 | $ | 111,531,248 | 77.8% | ||||||||
Foreign Currency Translation — Securities and other assets and liabilities denominated in or expected to settle in foreign currencies are translated into U.S. dollars based on exchange rates on the following basis:
| A. | The fair values of investment securities and other assets and liabilities are translated as of the close of the NYSE each day. |
| B. | Purchases and sales of investment securities and income and expenses are translated at the rate of exchange prevailing as of 4:00 p.m. Eastern Time on the respective date of such transactions. |
| C. | The Fund does not isolate that portion of the results of operations caused by changes in foreign exchange rates on investments from those caused by changes in market prices of securities held. Such fluctuations are included with the net realized and unrealized gains or losses on investments. |
| Semi-Annual Report Dated September 30, 2024 | 21 |
| CAZ STRATEGIC OPPORTUNITIES FUND NOTES TO CONSOLIDATED FINANCIAL STATEMENTS September 30, 2024 (Unaudited) (Continued) |
Reported net realized foreign exchange gains or losses arise from 1) purchases and sales of foreign currencies, 2) currency gains or losses realized between the trade and settlement dates on securities transactions and 3) the difference between the amounts of dividends and foreign withholding taxes recorded on the Fund’s books and the U.S. dollar equivalent of the amounts actually received or paid. Reported net unrealized foreign exchange gains and losses arise from changes in the value of assets and liabilities that result from changes in exchange rates.
Share Valuation – The NAV per share of each class of the Fund is calculated as of the close of business on the last business day of each calendar month, each date that a Share is offered, by dividing the total value of the assets attributable to that class, less liabilities attributable to that class, by the number of shares outstanding of that class. The offering price and repurchase price per share of each class of the Fund is equal to the NAV per share of such class, except that a 2.00% early repurchase fee may be charged as discussed in Note 7.
Investment Income and Return of Capital – Dividend income is recorded on the ex-dividend date. Non-cash dividends included in dividend income, if any, are recorded at the fair value of the security received. Interest income is accrued as earned. Withholding taxes on foreign dividends have been recorded for in accordance with the Fund’s understanding of the applicable country’s tax rules and rates. Distributions received from investments in securities and private funds that represent a return of capital or capital gains are recorded as a reduction of cost of investments or as a realized gain, respectively.
Investment Transactions – Investment transactions are accounted for on the trade date. Realized gains and losses on investment securities sold are determined on a specific identification basis.
Distributions to Shareholders – Distributions to shareholders arising from net investment and net realized capital gains, if any, are declared and paid annually to shareholders. The amount of distributions from net investment income and net realized capital gains are determined in accordance with federal income tax regulations, which may differ from U.S. GAAP. Dividends and distributions to shareholders are recorded on the ex-dividend date.
Federal Income Tax – The Fund has qualified and intends to continue to qualify as a regulated investment company (“RIC”) for U.S. federal income tax purposes, and expects each year to qualify as a RIC for U.S. federal income tax purposes. As such, the Fund generally will not be subject to U.S. federal corporate income tax, provided that it distributes substantially all of its net taxable income and gains each year. It is also the Fund’s intention to declare as dividends in each calendar year at least 98% of its net investment income (earned during the calendar year) and 98.2% of its net realized capital gains (earned during the twelve months ended October 31) plus undistributed amounts from prior years.
The Fund has selected a tax year end of September 30. The following information is computed on a tax basis for each item as of September 30, 2024:
| Cost of portfolio investments | $ | 132,292,509 | ||
| Gross unrealized appreciation | 5,332,731 | |||
| Gross unrealized depreciation | (364,235 | ) | ||
| Net unrealized appreciation | $ | 4,968,496 | ||
| Net unrealized appreciation on foreign currency translation | — | |||
| Undistributed ordinary income | 36,477 | |||
| Accumulated Capital and Other Losses | (228,830 | ) | ||
| Distributable earnings | $ | 4,776,143 |
There were no distributions for the six months ended September 30, 2024.
| 22 | CAZ Strategic Opportunities Fund |
| CAZ STRATEGIC OPPORTUNITIES FUND NOTES TO CONSOLIDATED FINANCIAL STATEMENTS September 30, 2024 (Unaudited) (Continued) |
The difference between the federal income tax cost of portfolio investments and the financial statement cost of portfolio investments is due to certain timing differences in the recognition of capital gains or losses under income tax regulations and U.S. GAAP. These “book/tax” differences are temporary in nature and are primarily due to the Subsidiary treatment as a C Corporation for federal and state income tax purposes.
The Subsidiary is a wholly-owned subsidiary of the Fund and is a domestic limited liability company that has elected to be treated as a C Corporation for federal and state income tax purposes. State tax returns are filed in various states in which an economic presence exists. Current state taxes consist of income taxes, franchise taxes, business taxes, excise taxes or gross receipts taxes, depending on the state in which the returns are filed. Income taxes are charged based on apportioned income for each state.
The Subsidiary recognizes deferred income taxes for differences in the basis of assets and liabilities for financial and income tax purposes. Deferred tax assets are recognized for deductible temporary differences, tax credit carryforwards or net operating loss carryforwards and deferred tax liabilities are recognized for taxable temporary differences. Deferred tax assets are reduced by a valuation allowance when, based on the weight of available evidence, it is more likely than not that some portion or all of the deferred tax assets will not be realized. Deferred tax assets and liabilities are adjusted for the effects of changes in tax laws and the rates on the date of enactment.
| 3. | Investment Transactions |
During the six months ended September 30, 2024, cost of purchases and proceeds from sales of investment securities, other than short-term investments, were $92,087,696 and $3,536,477, respectively.
| 4. | Investment Management and Other Agreements |
Under the terms of the Investment Advisory Agreement between the Fund and the Adviser (the “Investment Advisory Agreement”), the Adviser manages the Fund’s investments subject to oversight by the Board. The Fund pays the Adviser a Management Fee, which is paid monthly in arrears at an annual rate of 1.25% of the average net assets of the Fund, including assets purchased with the borrowed funds or other forms of leverage, at the end of the two most recently completed months.
Pursuant to an Expense Support Agreement (the “Expense Support Agreement”), the Adviser has contractually agreed to waive fees or reimburse expenses to limit total annual fund operating expenses (excluding management fees paid under the Investment Advisory Agreement, Rule 12b-1 distribution and service fees, acquired fund fees and expenses, interest expenses, and certain extraordinary expenses) to no more than 1.00%, on an annualized basis, of the Fund’s month-end net assets (the “Expense Cap”). This contractual arrangement will remain in effect until at least January 9, 2026 unless the Board approves an earlier termination. Pursuant to the Expense Support Agreement, fees totaling $322,337 were waived or reimbursed by the Adviser during the six months ended September 30, 2024.
If the Adviser waives its Management Fee or pays any operating expenses of the Fund pursuant to the Expense Support Agreement, the Adviser may, for a period ending three years from the date of the relevant waiver or payment, recoup amounts waived or incurred, except for amounts waived or reimbursed pursuant to the Class E expense reimbursement and Class F expense reimbursement, to the extent that the Adviser may only recoup the waived fees, reimbursed expenses or directly paid expenses if (i) the waived fees, reimbursed expenses or directly paid expenses have fallen to a level below the Expense Cap and (ii) the reimbursement amount does not raise the level of waived fees, reimbursed expenses or
| Semi-Annual Report Dated September 30, 2024 | 23 |
| CAZ STRATEGIC OPPORTUNITIES FUND NOTES TO CONSOLIDATED FINANCIAL STATEMENTS September 30, 2024 (Unaudited) (Continued) |
directly paid expenses in the month the reimbursement is being made to a level that exceeds the Expense Cap applicable at that time. As of September 30, 2024, the Adviser may seek repayment of investment management fees and expense reimbursements no later than the date below:
| November 6, 2026 | $ | 433,925 | ||
| March 31, 2027 | 411,334 | |||
| September 30, 2027 | 322,337 | |||
| $ | 1,167,596 |
In addition, the Adviser has contractually agreed to reimburse a portion of Class E’s Other Expenses equal to: (x) 0.20% of Class E’s average monthly net assets if Class E’s total net assets are less than $100,000,000; (y) 0.30% of Class E’s average monthly net assets if Class E’s total net assets are equal to or greater than $100,000,000 but less than $250,000,000; and (z) 0.40% of Class E’s average monthly net assets if Class E’s total net assets are greater than $250,000,000. The Adviser may not recoup expenses reimbursed pursuant to the expense reimbursement agreement for Class E’s Other Expenses. This contractual arrangement will remain in effect until at least January 9, 2026 unless the Board approves an earlier termination. Because Class E has not commenced operations, there were no fees waived or reimbursed by the Adviser during the six months ended September 30, 2024.
In addition, the Adviser has contractually agreed to reimburse a portion of Class F’s Other Expenses equal to: (x) 0.30% of Class F’s average monthly net assets if Class F’s total net assets are less than $100,000,000; (y) 0.40% of Class F’s average monthly net assets if Class F’s total net assets are equal to or greater than $100,000,000 but less than $250,000,000; and (z) 0.50% of Class F’s average monthly net assets if Class F’s total net assets are greater than $250,000,000. The Adviser may not recoup expenses reimbursed pursuant to the expense reimbursement agreement for Class F’s Other Expenses. This contractual arrangement will remain in effect until at least January 9, 2026 unless the Board approves an earlier termination. Pursuant to the expense reimbursement arrangement, fees totaling $35,241 were waived or reimbursed by the Adviser during the six months ended September 30, 2024.
The Fund’s offering costs of $408,908, consists of legal fees for preparing the prospectus and statement of additional information in connection with the Fund’s registration and public offering, state registration fees, insurance, and fees paid to be listed on an exchange. Offering costs are accounted for as a deferred charge and then are amortized on a straight-line basis over the first twelve months of the Fund’s operations. As of September 30, 2024, $185,867 of offering costs remain as an unamortized deferred asset, while $223,041 has been expensed subject to the Fund’s Expense Support Agreement.
FSG Operating LLC (“FSG”) provides the Fund with certain accounting, consulting, compliance, operational and administrative services. In consideration of these services, the Fund pays FSG a quarterly fee. The Fund also reimburses FSG for certain out-of-pocket expenses. CAZ Investments LP, an affiliate of the Adviser, indirectly holds 20% of FSG’s outstanding equity interests. Fees paid to FSG by the Fund for the six months ended September 30, 2024 totaled $58,481.
Employees of PINE Advisors, LLC (“PINE”) serve as the Fund’s Chief Compliance Officer and Chief Financial Officer. PINE receives an annual base fee for the services provided to the Fund, paid monthly. PINE is reimbursed for certain out-of-pocket expenses by the Fund. Fees paid to PINE by the Fund for the six months ended September 30, 2024 are disclosed in the Consolidated Statement of Operations as Compliance fees and Certifying financial officer fees.
Ultimus Fund Solutions, LLC (“Ultimus”) provides certain administrative, accounting and transfer agency services to the Fund pursuant to a Master Services Agreement between the Fund and Ultimus (the “Master Services Agreement”). For its services, the Fund pays Ultimus a fee and separate fixed fees to make certain filings. The Fund also reimburses Ultimus for certain out-of-pocket expenses incurred on the Fund’s behalf. The fees are accrued daily and paid monthly by the Fund and the administrative fees are based on the average net assets for the prior month and subject to monthly minimums.
| 24 | CAZ Strategic Opportunities Fund |
| CAZ STRATEGIC OPPORTUNITIES FUND NOTES TO CONSOLIDATED FINANCIAL STATEMENTS September 30, 2024 (Unaudited) (Continued) |
The Fund has entered into a Distribution Agreement with Ultimus Fund Distributors, LLC (the “Distributor”), pursuant to which the Distributor acts as principal underwriter and distributor of the Fund’s shares of beneficial interest on a best effort basis, subject to various conditions. The Distributor may retain additional broker-dealers and other financial intermediaries (each a “Selling Agent”) to assist in the distribution of shares and shares are available for purchase through these Selling Agents or directly through the Distributor. The Distributor is a wholly-owned subsidiary of Ultimus. For these services, the Distributor receives an annual fee from the Adviser. The Adviser is also responsible for paying any out-of-pocket expenses incurred by the Distributor in providing services under the Distribution Agreement.
The Fund has adopted distribution and service plans (the “Plan”) pursuant to Rule 12b-1 under the 1940 Act for Class A Shares, Class D Shares, and Class R Shares. Under the Plan, Class A Shares and Class D Shares of the Fund bear distribution and/or service fees paid to the Distributor, some of which may be paid to select broker-dealers or other financial intermediaries. Pursuant to the Plan, the Fund may pay the Distributor a fee of up to 0.60% of the average monthly net assets attributable to Class A Shares or Class D Shares on an annualized basis, respectively, for distribution financing activities. Pursuant to the Plan, the Fund may pay a financial intermediary a fee of up to 0.25% of the average monthly net assets attributable to Class R Shares for shareholder account servicing activities. The entire amount of the fee may be used for shareholder servicing expenses. For the six months ended September 30, 2024, distribution and service fees incurred are disclosed on the Consolidated Statement of Operations.
In consideration of the services rendered by the Independent Trustees, the Fund pays each Independent Trustee a retainer of $30,000 per year. The Fund pays an additional retainer of $10,000 per year to the Chairman of the Fund’s Audit Committee. Trustees that are interested persons will not be compensated by the Fund. The Trustees do not receive any pension or retirement benefits.
Certain officers of the Fund are also employees of the Adviser, PINE and/or Ultimus.
Beneficial Ownership of Fund Shares
The beneficial ownership, either directly or indirectly, of more than 25% of the voting securities of the Fund creates a presumption of control under Section 2(a)(9) of the 1940 Act. As of September 30, 2024, the following shareholders of record owned more than 25% of the outstanding shares of the Fund:
| Name of Record Owner | % Ownership | |
| CAZ Founders Class SOF Aggregator, L.P. | 41% |
| 5. | Risk Factors |
Risk is inherent in all investing. The value of your investment in the Fund, as well as the amount of return you receive on your investment, may fluctuate significantly from day to day and over time. The following list is not intended to be a comprehensive listing of all the potential risks associated with the Fund. The Fund’s prospectus provides further details regarding the Fund’s risks and considerations.
Market Risk − Market risk is the risk that one or more markets in which the Fund invests will go down in value, including the possibility that the markets will go down sharply and unpredictably. Securities of a company may decline in value due to its financial prospects and activities, including certain operational impacts, such as data breaches and cybersecurity attacks. Securities may also decline in value due to general market and economic movements and trends, including adverse changes to credit markets, or as a result of other events such as geopolitical events, natural disasters, or widespread pandemics (such as COVID-19) or other adverse public health developments.
| Semi-Annual Report Dated September 30, 2024 | 25 |
| CAZ STRATEGIC OPPORTUNITIES FUND NOTES TO CONSOLIDATED FINANCIAL STATEMENTS September 30, 2024 (Unaudited) (Continued) |
Private Equity Investment Risk – The Fund’s investment portfolio will consist of Investment Funds that hold securities issued primarily by privately held companies, and operating results for the portfolio companies in a specified period will be difficult to predict. Such investments involve a high degree of business and financial risk, including those relating to the current global pandemic, that can result in substantial losses.
Valuation of Private Investments Risk – The Fund’s ownership interests in private investments are not publicly traded, and the Fund will use a third-party pricing service or internal pricing methodologies to provide pricing information for certain private investments. The value of investments that are not publicly traded may not be readily determinable, and the Valuation Designee will value these investments at fair value as determined in good faith pursuant to the Valuation Policies, including to reflect significant events affecting the value of the Fund’s investments.
Infrastructure Sector Risk − The Fund will invest, directly or indirectly, in infrastructure. Infrastructure asset investments (“Infrastructure Assets”) may be subject to a variety of risks, not all of which can be foreseen or quantified, including: (i) the burdens of ownership of infrastructure: (ii) local, national and international political and economic conditions; (iii) the supply and demand for services from and access to infrastructure; (iv) the financial condition of users and suppliers of Infrastructure Assets; (v) changes in interest rates and the availability of funds which may render the purchase, sale or refinancing of Infrastructure Assets difficult or impracticable; (vi) changes in regulations, planning laws and other governmental rules; (vii) changes in fiscal and monetary policies; (viii) under-insured or uninsurable losses, such as force majeure acts and terrorist events; (ix) reduced investment in public and private infrastructure projects; and (x) other factors which are beyond the reasonable control of the Fund. Many of the foregoing factors could cause fluctuations in usage, expenses and revenues, causing the value of investments to decline and a material adverse effect on the Fund’s performance.
Real Estate Related Securities Risk – In addition to general market risk, the main risk of investing in real estate related securities, including public and private real estate investment trusts (REITs) and private real estate investment funds, is that the value of the underlying real estate may go down due to, among other factors, possible declines in the value of real estate; risks related to general and local economic conditions; possible lack of availability of mortgage financing, variations in rental income, neighborhood values or the appeal of property to tenants; interest rates; overbuilding; extended vacancies of properties; increases in competition, property taxes and operating expenses; and changes in zoning laws. The real estate industry is particularly sensitive to economic downturns. The values of securities of companies in the real estate industry may go through cycles of relative under-performance and out-performance in comparison to equity securities markets in general.
Real Assets Investments Risk – The Fund may invest a portion of its assets in securities and credit instruments associated with real assets, which have historically experienced substantial price volatility. The value of companies engaged in these industries is affected by (i) changes in general economic and market conditions; (ii) changes in environmental, governmental and other regulations; (iii) risks related to local economic conditions, overbuilding and increased competition; (iv) increases in property taxes and operating expenses; (v) changes in zoning laws; (vi) casualty and condemnation losses; (vii) surplus capacity and depletion concerns; (viii) the availability of financing; and (ix) changes in interest rates and leverage. In addition, the availability of attractive financing and refinancing typically plays a critical role in the success of these investments. The value of securities in these industries may go through cycles of relative under-performance and over-performance in comparison to equity securities markets in general.
Venture Capital and Growth Equity Risk − The Fund may invest in venture capital and growth equity. Venture capital is usually classified by investments in private companies that have a limited operating history, are attempting to develop or commercialize unproven technologies or implement novel business plans or are not otherwise developed sufficiently to be self-sustaining financially or to become public. Although these investments may offer the opportunity for significant gains, such investments involve a high degree of business and financial risk that can result in substantial losses. Growth equity is usually classified by investments in private companies that have achieved product-market fit but may still need capital to achieve the desired level of scale before having access to the public markets for financing. As a result of the risks associated with advancing the company’s growth plan, investors can expect a higher return than might be available in the public
| 26 | CAZ Strategic Opportunities Fund |
| CAZ STRATEGIC OPPORTUNITIES FUND NOTES TO CONSOLIDATED FINANCIAL STATEMENTS September 30, 2024 (Unaudited) (Continued) |
markets, but also need to recognize the business and financial risks that remain in advancing the company’s commercial aspirations. For both venture capital and growth equity companies, the risks are generally greater than the risks of investing in public companies that may be at a later stage of development.
Investments in Small or Middle-Market Portfolio Companies Risk − The Fund’s investments may consist of equity investments and loans to small and/or less well-established privately held companies. While smaller private companies may have potential for rapid growth, investments in private companies pose significantly greater risks than investments in public companies.
First Lien Senior Secured Loans, Second Lien Senior Secured Loans and Unitranche Debt − When the Fund invests, directly or indirectly, in first lien senior secured loans, second lien senior secured loans, and unitranche debt of portfolio companies, the Fund will generally seek to take a security interest in the available assets of those portfolio companies, including the equity interests of the portfolio companies’ subsidiaries. There is a risk that the collateral securing these loans may decrease in value over time or lose its entire value, may be difficult to sell in a timely manner, may be difficult to appraise and may fluctuate in value based upon the success of the business and market conditions, including as a result of the inability of the portfolio company to raise additional capital. To the extent a debt investment is collateralized by the securities of a portfolio company’s subsidiaries, such securities may lose some or all of their value in the event of the bankruptcy or insolvency of the portfolio company. Also, in some circumstances, the Fund’s lien may be contractually or structurally subordinated to claims of other creditors. In addition, deterioration in a portfolio company’s financial condition and prospects, including its inability to raise additional capital, may be accompanied by deterioration in the value of the collateral for the loan. Loans that are under- collateralized involve a greater risk of loss. Consequently, the fact that a loan is secured does not guarantee that we will receive principal and interest payments according to the loan’s terms, or at all, or that we will be able to collect on the loan should the remedies be enforced. Finally, particularly with respect to a unitranche debt structure, unitranche debt will generally have higher leverage levels than a standard first lien term loan.
Mezzanine Investments Risk − The Fund may, directly or indirectly, invest in mezzanine loans. Structurally, mezzanine loans usually rank subordinate in priority of payment to senior debt, such as senior bank debt, and are often unsecured. However, mezzanine loans rank senior to common and preferred equity in a borrower’s capital structure. Mezzanine debt is often used in leveraged buyout and real estate finance transactions. Typically, mezzanine loans have elements of both debt and equity instruments, offering the fixed returns in the form of interest payments associated with senior debt, while providing lenders an opportunity to participate in the capital appreciation of a borrower, if any, through an equity interest. This equity interest typically takes the form of warrants. Due to their higher risk profile and often less restrictive covenants as compared to senior loans, mezzanine loans generally earn a higher return than senior secured loans. The warrants associated with mezzanine loans are typically detachable, which allows lenders to receive repayment of their principal on an agreed amortization schedule while retaining their equity interest in the borrower. Mezzanine loans also may include a “put” feature, which permits the holder to sell its equity interest back to the borrower at a price determined through an agreed-upon formula. Mezzanine investments may be issued with or without registration rights. Similar to other high yield securities, maturities of mezzanine investments are typically seven to ten years, but the expected average life is significantly shorter at three to six years. Mezzanine investments are usually unsecured and subordinate to other debt obligations of an issuer.
Foreign Investments Risk − Investments in foreign securities may be riskier, more volatile, and less liquid than investments in U.S. securities. Differences between the U.S. and foreign regulatory regimes and securities markets, including the less stringent investor protection, less stringent accounting, corporate governance, financial reporting and disclosure standards of some foreign markets, as well as political and economic developments in foreign countries and regions and the U.S. (including the imposition of sanctions, tariffs, or other governmental restrictions), may affect the value of the Fund’s investments in foreign securities. Changes in currency exchange rates may also adversely affect the Fund’s foreign investments.
| Semi-Annual Report Dated September 30, 2024 | 27 |
| CAZ STRATEGIC OPPORTUNITIES FUND NOTES TO CONSOLIDATED FINANCIAL STATEMENTS September 30, 2024 (Unaudited) (Continued) |
Leverage Risk − Certain transactions may give rise to leverage. Leverage can increase market exposure, magnify investment risks, and cause losses to be realized more quickly. Leverage may also cause the Fund to be more volatile than if it had not been leveraged. The use of leverage may cause the Fund to liquidate portfolio positions to satisfy its obligations or to meet margin or collateral requirements when it may not be advantageous to do so.
Illiquid and Restricted Securities Risk – The Fund may invest without limit in illiquid securities. The Fund may also invest in restricted securities. Investments in restricted securities could have the effect of increasing the amount of the Fund’s assets invested in illiquid securities, including but not limited to if qualified institutional buyers are unwilling to purchase these securities.
Liquidity Risk − The risk that the market for a particular investment or type of investment is or becomes relatively illiquid, making it difficult for the Fund to sell that investment at an advantageous time or price. Illiquidity may be due to events relating to the issuer of the securities, market events, rising interest rates, economic conditions or investor perceptions. Illiquid securities may be difficult to value and their value may be lower than the market price of comparable liquid securities, which would negatively affect the Fund’s performance.
Active Investment Management Risk − The risk that, if the Adviser’s investment strategy does not perform as expected, the Fund could underperform its peers or lose money. The Fund’s performance depends upon the performance of the portfolio managers and selected strategies, the adherence by such Investment Managers to such selected strategies, the instruments used by such Investment Managers and the Adviser’s ability to select Investment Managers and strategies and effectively allocate Fund assets among them. The Fund is organized to provide shareholders with a multi-strategy investment program and not as an indirect way to gain access to any particular Investment Funds. There is no guarantee that the Fund’s investment objective will be achieved.
| 6. | Contingencies and Commitments |
The Fund indemnifies the Fund’s officers and the Board for certain liabilities that might arise from their performance of their duties to the Fund. Additionally, in the normal course of business the Fund enters into contracts that contain a variety of representations and warranties and which provide general indemnifications. The Fund’s maximum exposure under these arrangements is unknown, as this would involve future claims that may be made against the Fund that have not yet occurred. However, based on experience, the Fund expects the risk of loss to be remote.
The Fund is required to provide financial support in the form of investment commitments to certain investees as part of the conditions for entering into such investments. As of September 30, 2024, the Fund had unfunded commitments in the amount of $117,183,902. At September 30, 2024, the Fund reasonably believes its assets will provide adequate cover to satisfy all its unfunded commitments.
| 28 | CAZ Strategic Opportunities Fund |
| CAZ STRATEGIC OPPORTUNITIES FUND NOTES TO CONSOLIDATED FINANCIAL STATEMENTS September 30, 2024 (Unaudited) (Continued) |
The Fund’s unfunded commitments as of September 30, 2024 are as follows:
| Unfunded | ||||||||
| Private Equity Investment | Fair Value | Commitment | ||||||
| EnCap Energy Capital Fund XII, LP (a) | $ | — | $ | 10,000,000 | ||||
| Five Point Water Management and Sustainable Infrastructure Fund IV LP (a) | — | 4,000,000 | ||||||
| General Catalyst Group XII, LP (a) | — | 5,000,000 | ||||||
| H.I.G. Capital Partners VII-B, LP | — | 3,000,000 | ||||||
| Platinum Credit Opportunities Fund, LP (a) | — | 8,000,000 | ||||||
| Snowpoint Ventures II – S&T, LP (a) | — | 6,000,000 | ||||||
| Trivest Growth Investment Fund III-A, LP (a) | — | 2,500,000 | ||||||
| VMG Consumer VI, LP (a) | — | 8,000,000 | ||||||
| Investments valued at NAV as a practical expedient (b) | 102,275,550 | 70,683,902 | ||||||
| $ | 102,275,550 | $ | 117,183,902 | |||||
| (a) | As of September 30, 2024, $46,500,000 has been committed to for these investments but have not been funded by the Fund. |
| (b) | See Note 2 for investments valued at NAV as a practical expedient. |
| 7. | Capital Stock |
The Fund is a closed-end tender offer fund and, to provide liquidity to shareholders, may from time to time offer to repurchase shares in accordance with written tenders by shareholders at those times, in those amounts and on such terms and conditions as the Board may determine in its sole discretion. In determining whether the Fund should offer to repurchase shares from shareholders, the Board will consider the recommendation of the Adviser. The Adviser currently expects to recommend to the Board that the Fund offer to repurchase up to 5% of the Fund’s outstanding shares at the applicable NAV per share on a quarterly basis. However, the Fund is not required to conduct repurchase offers and may be less likely to do so during the first few years following the commencement of Fund operations and during periods of exceptional market conditions. Shares of the Fund will be offered for purchase only through the Distributor, or a Selling Agent, as of the first business day of each month. Capital transactions are recorded on their effective date.
During the six months ended September 30, 2024, the Fund did not complete any quarterly repurchase offers.
A 2.00% early repurchase fee will be charged by the Fund with respect to any repurchase of an investor’s Shares at any time prior to the day immediately preceding the one-year anniversary of an investor’s purchase of the shares. Shares tendered for repurchase will be treated as having been repurchased on a “first in-first out” basis. The Fund may waive the early repurchase fee for certain categories of shareholders or transactions, such as repurchases of shares in the event of the shareholder’s death or disability, or in connection with certain distributions from employer sponsored benefit plans. During the six months ended September 30, 2024, there were no proceeds from early repurchase fees charged by the Fund.
| 8. | Subsequent Events |
Subsequent events after the date of the Consolidated Statement of Assets and Liabilities have been evaluated through the date of the consolidated financial statements were issued. Management has concluded that there are no subsequent events requiring adjustment or disclosure in the consolidated financial statements.
| Semi-Annual Report Dated September 30, 2024 | 29 |
| CAZ STRATEGIC OPPORTUNITIES FUND OTHER INFORMATION (Unaudited) |
PROXY VOTING
A description of the policies and procedures that the Fund uses to vote proxies relating to portfolio securities is available without charge upon request by calling toll-free (855) 886-2307, or on the SEC’s website at www.sec.gov. Information regarding how the Fund voted proxies relating to portfolio securities during the most recent 12-month period ended June 30 will be available without charge upon request by calling toll-free (855) 886-2307, on the SEC’s website at www.sec.gov or on the Fund’s website at www.cazstrategicopportunitiesfund.com.
DISCLOSURE OF PORTFOLIO HOLDINGS
The Fund files its complete listing of portfolio holdings with the SEC as of the end of the first and third quarters of each fiscal year as an exhibit to Form N- PORT. These filings are available upon request by calling (855) 886-2307. Furthermore, you may obtain a copy of the filings on the SEC’s website at www.sec.gov or by visiting www.cazstrategicopportunitiesfund.com.
DIVIDEND REINVESTMENT
Unless a shareholder is ineligible or otherwise elects, all distributions of dividends (including capital gain dividends) with respect to a class of shares will be automatically reinvested by the Fund in additional shares of the corresponding class, which will be issued at the NAV per share determined as of the ex-dividend date. Election not to reinvest dividends and to instead receive all dividends and capital gain distributions in cash may be made by contacting the Fund’s Transfer Agent by telephone at (833) 957-4795.
This report has been prepared for the general information of the shareholders. It is not authorized for distribution to prospective investors unless preceded or accompanied by a current prospectus. The Fund’s prospectus contains more complete information about the objectives, policies, expenses and risks of the Fund. The Fund is not a bank deposit, not FDIC insured and may lose value. Please read the prospectus carefully before investing or sending money.
This report may contain certain forward-looking statements which are subject to known and unknown risks and uncertainties that could cause actual results to differ materially from those expressed or implied by such statements. Forward looking statements generally include words such as ’‘believes,” ’‘expects,’’ ’‘anticipates’’ and other words of similar import. Such risks and uncertainties include, among other things, the Risk Factors noted in the Fund’s filings with the SEC. The Fund undertakes no obligation to update any forward-looking statement.
| 30 | CAZ Strategic Opportunities Fund |
NOTICE OF PRIVACY POLICY AND PRACTICES
| FACTS | WHAT DOES THE CAZ STRATEGIC OPPORTUNITIES FUND (THE “FUND”) DO WITH YOUR PERSONAL INFORMATION? |
| Why? | Financial companies choose how they share your personal information. Federal law gives consumers the right to limit some but not all sharing. Federal law also requires us to tell you how we collect, share, and protect your personal information. Please read this notice carefully to understand what we do. |
| What? | The types of personal information we collect, and share depend on the product or service you apply for or have with us. This information can include:
● Social Security number, income, and employment information.
● Account balances, transaction history, and credit information
● Assets and investment experience.
We use information that we collect about you or that you provide to us, including any personal information:
● To provide you with information, products, or services that you request from us.
● To fulfill any other purpose for which you provide it.
● To provide you with notices about your user and account registration.
● To carry out our obligations and enforce our rights arising from any contracts entered into between you and us, or between us and our customers.
● To notify you about changes to the Website or any products or services we offer or provide through it, including important services-related notices, updates to our privacy policy and Terms of Use
● In any other way we may describe when you provide the information.
● For any other purpose with your consent.
● We will only retain your information for as long as necessary to fulfill our service obligations. To determine the appropriate retention period of your information, we consider the amount, nature, and sensitivity of the information, the potential risk of harm from unauthorized use or disclosure of the information, and the applicable legal and regulatory requirements.
● We will not sell any of your personal information to any third party for purposes of advertising, soliciting, or telemarketing.
● When you are no longer our customer, we continue to share your information as described in this notice. |
| How? | All financial companies need to share customers’ personal information to run their everyday business. In the section below, we list the reasons financial companies can share their customers’ personal information; the reasons the Fund chooses to share; and whether you can limit this sharing. |
| Semi-Annual Report Dated September 30, 2024 | 31 |
| Reasons we can share your personal information | Does the Fund share? | Can you limit this sharing? | |
| For our everyday business purposes- such as to process your transactions, maintain your account(s), respond to court orders and legal investigations, or report to credit bureaus | Yes | No | |
| For our marketing purposes – to offer our products and services to you | Yes | No | |
| For joint marketing with other financial companies | No | We don’t share | |
| For our affiliates’ everyday business purposes- information about your transactions and experiences | Yes | No | |
| For our affiliates’ everyday business purposes – Information about your creditworthiness | No | We don’t share | |
| For our affiliates to market to you | Yes | Yes | |
| For nonaffiliates to market to you | No | We don’t share | |
| Questions? | Email us at myteam@cazinvestments.com or call us at 713-403-8250 | ||
| Who are we | |
| Who is providing this notice? | CAZ Strategic Opportunities Fund (the “Fund”) |
| What we do | |
| How does the Fund protect my personal information? | To protect your personal information from unauthorized access and use, we use security measures that comply with federal law. These measures include computer safeguards and secured files and buildings. |
| How does the Fund collect my personal information? | We collect your personal information, for example, when detail is disclosed via an application, in conversation, or regarding your transactions which may include, but is not limited to:
● Name, phone number, social security number, assets, income, and date of birth; and
● Account number, balance, payments, parties to transactions, or cost basis information
We also collect your personal information from other companies. |
| Why can’t I limit all sharing? | Federal law gives you the right to limit only;
● sharing for affiliates’ everyday business purposes – information about your creditworthiness
● affiliates from using your information to market to you
● sharing for nonaffiliates to market to you
State laws and individual companies may give you additional rights to limit sharing. |
| 32 | CAZ Strategic Opportunities Fund |
| Definitions | |
| Affiliates | Companies related by common ownership or control. They can be financial and nonfinancial companies.
● The Fund has affiliates. |
| Non-affiliates | Companies not related by common ownership or control. They can be financial and nonfinancial companies.
● The Fund does not share with nonaffiliates so they can market to you. |
| Joint marketing | A formal agreement between nonaffiliated financial companies that together market financial products or services to you.
● The Fund does not jointly market. |
| Semi-Annual Report Dated September 30, 2024 | 33 |
| Investment Adviser CAZ Investments Registered Adviser LLC One Riverway Suite 2000 Houston, Texas | Legal Counsel Dechert LLP 1900 K Street, NW Washington, DC |
| Distributor Ultimus Fund Distributors, LLC 4221 North 203rd Street Suite 100 Elkhorn, Nebraska | Custodian Fifth Third Bank, n.a. 38 Fountain Square Plaza Cincinnati, Ohio |
| Administrator Ultimus Fund Solutions, LLC 225 Pictoria Drive Suite 450 Cincinnati, Ohio | Trustees Christopher Zook, President Austin Adams Frank Easterly Matthew Lindholm Richard Wilson |
| Independent Registered Public Accounting Firm Deloitte & Touche LLP 1111 Bagby Street Suite 4500 Houston, Texas | Officers Marcie McVeigh, Treasurer Kent Barnes, Secretary Randi Jean Roessler, Chief Compliance Officer |
CAZ SAR-24
(b) Not applicable
| Item 2. | Code of Ethics. |
Not required.
| Item 3. | Audit Committee Financial Expert. |
Not required.
| Item 4. | Principal Accountant Fees and Services. |
Not required.
| Item 5. | Audit Committee of Listed Registrants. |
Not applicable.
| Item 6. | Schedule of Investments. |
(a) Not applicable [schedule filed with Item 1].
(b) Not applicable.
| Item 7. | Financial Statements and Financial Highlights for Open-End Management Investment Companies |
Not applicable.
| Item 8. | Changes in and Disagreements with Accountants for Open-End Management Investment Companies. |
Not applicable.
| Item 9. | Proxy Disclosures for Open-End Management Investment Companies. |
Not applicable.
| Item 10. | Remuneration Paid to Directors, Officers, and Others of Open-End Management Investment Companies. |
Not applicable.
| Item 11. | Statement Regarding Basis for Approval of Investment Advisory Contract. |
Not applicable.
| Item 12. | Disclosure of Proxy Voting Policies and Procedures for Closed-End Management Investment Companies. |
Not required.
| Item 13. | Portfolio Managers of Closed-End Management Investment Companies. |
(a)(1) Identification of Portfolio Manager(s) and Description of Role of Portfolio Manager(s)
All information included in this Item is as of November 29, 2024, unless otherwise noted.
The following table provides biographical information about the Portfolio Managers, who are primarily responsible for the day-to-day portfolio management of the Fund as of the date hereof:
| Name of Portfolio Manager | Title | Length of Time of Service to the Fund | Principal Occupation During the past 5 years | |||
| Christopher Zook | President, Chief Executive Officer, and Treasurer | Since 2024 | Chairman and Chief Investment Officer of CAZ Investments, LP | |||
| Mark Wade | Portfolio Manager | Since 2024 | Partner, CAZ Investments, LP | |||
| Matthew Lindholm | Portfolio Manager | Since 2024 | Partner, CAZ Investments, LP | |||
| Clark Edlund | Portfolio Manager | Since 2024 | Partner, CAZ Investments, LP | |||
Michael O’Keefe | Portfolio Manager | Since 2024 | Chief of Staff, CAZ Investments, LP Vice President, Investment Strategies, CAZ Investments, LP
|
(a)(2) Other Accounts Managed by Portfolio Managers and Potential Conflicts of Interest.
The following table provides information about portfolios and accounts, other than the Fund, for which the Portfolio Managers are primarily responsible for the day-to-day portfolio management as of March 31, 2024:
| Name of Portfolio Manager | Type of Accounts | Total Number of Accounts Managed | Total Assets | Number of Accounts Managed for Which Advisory Fee is Based on Performance | Total Assets for Which Advisory Fee is Based on Performance (in millions) | |||||
| Christopher Zook | Registered Investment Companies | 0 | $0 | 0 | $0 | |||||
| Other Pooled Investment Vehicles | 94 | $6,907 | 93 | $6,902 | ||||||
| Other Accounts | 1 | $1 | 0 | $0 | ||||||
| Mark Wade | Registered Investment Companies | 0 | $0 | 0 | $0 | |||||
| Other Pooled Investment Vehicles | 0 | $0 | 0 | $0 | ||||||
| Other Accounts | 0 | $0 | 0 | $0 | ||||||
| Matthew Lindholm | Registered Investment Companies | 0 | $0 | 0 | $0 | |||||
| Other Pooled Investment Vehicles | 0 | $0 | 0 | $0 | ||||||
| Other Accounts | 0 | $0 | 0 | $0 | ||||||
| Clark Edlund | Registered Investment Companies | 0 | $0 | 0 | $0 | |||||
| Other Pooled Investment Vehicles | 0 | $0 | 0 | $0 | ||||||
| Other Accounts | 0 | $0 | 0 | $0 | ||||||
| Michael O’Keefe* | Registered Investment Companies | 0 | $0 | 0 | $0 | |||||
| Other Pooled Investment Vehicles | 0 | $0 | 0 | $0 | ||||||
| Other Accounts | 0 | $0 | 0 | $0 |
| * | Mr. O’Keefe’s information is as of November 29, 2024. |
Potential Conflicts of Interests:
Whenever a portfolio manager of the Fund manages other accounts, potential conflicts of interest exist, including potential conflicts between the investment strategy of the Fund and the investment strategy of the other accounts. For example, in certain instances, a portfolio manager may take conflicting positions in a particular security for different accounts, by selling a security for one account and continuing to hold it for another account. In addition, the fact that other accounts require the portfolio manager to devote less than all of his or her time to the Fund may be seen itself to constitute a conflict with the interest of the Fund.
Each portfolio manager may also execute transactions for another fund or account at the direction of such fund or account that may adversely impact the value of securities held by the Fund. Securities selected for funds or accounts other than the Fund may outperform the securities selected for the Fund. In addition, some of these accounts managed by the portfolio managers may have fee structures, including performance fees, that are or have the potential to be higher, in some cases significantly higher, than the fees the Adviser receives for managing the Fund. Finally, if the portfolio manager identifies a limited investment opportunity that may be suitable for more than one fund or other account, the Fund may not be able to take advantage of that opportunity due to an allocation of that opportunity to or across eligible funds and accounts. CAZ’s policies, however, require that portfolio managers allocate investment opportunities among accounts managed by them in an equitable manner over time. Orders are normally allocated on a pro rata basis, except that in certain circumstances, such as the small size of an issue, orders will be allocated among clients in a manner believed by CAZ to be fair and equitable over time.
The structure of a portfolio manager’s compensation may give rise to potential conflicts of interest. A portfolio manager’s base pay tends to increase with additional and more complex responsibilities that include increased assets under management, which indirectly links compensation to sales. Also, potential conflicts of interest may arise since the structure of CAZ’s compensation may vary from account to account.
CAZ has adopted certain compliance procedures that are designed to address these, and other, types of conflicts. However, there is no guarantee that such procedures will detect each and every situation where a conflict arises.
(a)(3) Compensation Structure of Portfolio Manager(s) as of March 31, 2024
The Adviser receives a fee based on the assets under management of the Fund as set forth in the Investment Advisory Agreement between the Fund and the Adviser. The Adviser pays its investment professionals out of its total revenues, including the advisory fees earned with respect to the Fund.
CAZ’s methodology for measuring and rewarding the contribution made by portfolio managers combines quantitative measures with qualitative measures. The Fund’s portfolio managers are compensated for their services to the Fund and to other accounts they manage in a combination of base salary and annual discretionary bonus, as well as the standard retirement, health and welfare benefits available to all CAZ employees. Certain fund managers may also receive awards under a long-term incentive program. Base salary of CAZ’s employees is determined by reference to the level of responsibility inherent in the role and the experience of the incumbent, and is benchmarked annually against market data to ensure that CAZ is paying competitively. CAZ reviews base salaries annually, targeting increases at employees whose roles have increased in scope materially during the year and those whose salary is behind market rates. At more senior levels, base salaries tend to be adjusted less frequently as the emphasis is increasingly on the discretionary bonus. Discretionary bonuses for portfolio managers may be comprised of an agreed contractual floor, a revenue component and/or a discretionary component. Any discretionary bonus is determined by a number of factors. At a macro level the total amount available to spend is a function of the bonus to pre-bonus profit ratio before tax and the compensation to revenue ratio achieved by CAZ globally. CAZ then assesses the performance of the division and of a management team to determine the share of the aggregate bonus pool that is spent in each area. This focus on “team” maintains consistency and minimizes internal competition that may be detrimental to the interests of CAZ’s clients. For each team, CAZ assesses the performance of their funds relative to competitors and to relevant benchmarks (which may be internally-and/or externally-based and are considered over a range of performance periods), the level of funds under management, and the level of performance fees generated, if any. CAZ also reviews “softer” factors such as leadership, contribution to other parts of the business, and an assessment of the employee’s behavior and the extent to which it is in line with our corporate values of excellence, integrity, teamwork, passion and innovation.
(a)(4) Disclosure of Securities Ownership
The following table sets forth the dollar range of equity securities beneficially owned by each Portfolio Manager in the Fund as of March 31, 2024:
| Portfolio Manager | Dollar Range of Fund Shares Beneficially Owned | |
| Christopher Zook | $500,001-$1,000,000 | |
Mark Wade | $10,001 - $50,000 | |
| Matthew Lindholm | None | |
| Clark Edlund | None | |
Michael O’Keefe* |
None |
| * | Mr. O’Keefe’s information is as of November 29, 2024. |
(b) See updates to Items (a)(1), (a)(2), (a)(3) and (a)(4) above.
| Item 14. | Purchases of Equity Securities by Closed-End Management Investment Company and Affiliated Purchasers. |
Not applicable.
| Item 15. | Submission of Matters to a Vote of Security Holders. |
There have been no material changes to the procedures by which the shareholders may recommend nominees to the registrant’s Board of Trustees.
| Item 16. | Controls and Procedures. |
(a) Based on their evaluation of the registrant’s disclosure controls and procedures (as defined in Rule 30a-3(c) under the Investment Company Act of 1940) as of a date within 90 days of the filing date of this report, the registrant’s principal executive officer and principal financial officer have concluded that such disclosure controls and procedures are reasonably designed and are operating effectively to ensure that material information relating to the registrant, including its consolidated subsidiaries, is made known to them by others within those entities, particularly during the period in which this report is being prepared, and that the information required in filings on Form N-CSR is recorded, processed, summarized, and reported on a timely basis.
(b) There were no changes in the registrant’s internal control over financial reporting (as defined in Rule 30a-3(d) under the Investment Company Act of 1940) that occurred during the registrant’s period covered by this report that have materially affected, or are reasonably likely to materially affect, the registrant’s internal control over financial reporting.
Item 17. Disclosure of Securities Lending Activities for Closed-End Management Investment Companies.
Not applicable.
Item 18. Recovery of Erroneously Awarded Compensation.
(a) Not applicable.
(b) Not applicable.
| Item 19. | Exhibits. |
File the exhibits listed below as part of this Form. Letter or number the exhibits in the sequence indicated.
(a)(1) Any code of ethics, or amendment thereto, that is the subject of the disclosure required by Item 2, to the extent that the registrant intends to satisfy the Item 2 requirements through filing of an exhibit:
Not applicable.
(a)(2) Any policy required by the listing standards adopted pursuant to Rule 10D-1 under the Exchange Act (17 CFR 240.10D-1) by the registered national securities exchange or registered national securities association upon which the registrant’s securities are listed: Not required.
(a)(3) A separate certification for each principal executive officer and principal financial officer of the registrant as required by Rule 30a-2(a) under the Act (17 CFR 270.30a-2(a)): Attached hereto.
(a)(4) Any written solicitation to purchase securities under Rule 23c-1 under the Act sent or given during the period covered by the report by or on behalf of the registrant to 10 or more persons: Not applicable.
(a)(5) Change in the registrant’s independent public accountant: Not applicable.
(b) Certifications required by Rule 30a-2(b) under the Act (17 CFR 270.30a-2(b)): Attached hereto.
| Exhibit 99.CERT | Certifications required by Rule 30a-2(a) under the Act |
| Exhibit 99.906CERT | Certifications required by Rule 30a-2(b) under the Act |
SIGNATURES
Pursuant to the requirements of the Securities Exchange Act of 1934 and the Investment Company Act of 1940, the registrant has duly caused this report to be signed on its behalf by the undersigned, thereunto duly authorized.
| (Registrant) | CAZ Strategic Opportunities Fund | |
| By (Signature and Title)* | /s/ Christopher Zook | |
Christopher Zook, President (Principal Executive Officer) | ||
| Date | December 6, 2024 | |
| Pursuant to the requirements of the Securities Exchange Act of 1934 and the Investment Company Act of 1940, this report has been signed below by the following persons on behalf of the registrant and in the capacities and on the dates indicated. | ||
| By (Signature and Title)* | /s/ Christopher Zook | |
Christopher Zook, President (Principal Executive Officer) | ||
| Date | December 6, 2024 | |
| By (Signature and Title)* | /s/ Marcie McVeigh | |
Marcie McVeigh, Treasurer (Principal Financial Officer) | ||
| Date | December 6, 2024 | |
| * | Print the name and title of each signing officer under his or her signature. |