| FREE WRITING PROSPECTUS | ||
| FILED PURSUANT TO RULE 433 | ||
| REGISTRATION FILE NO.: 333-255934-07 | ||
| Dated August 3, 2023 | BMO 2023-C6 |
Structural and Collateral Term Sheet | |||||
BMO 2023-C6 Mortgage Trust | |||||
$604,423,959 (Approximate Mortgage Pool Balance) | |||||
$[ ] (Approximate Offered Certificates) | |||||
BMO Commercial Mortgage Securities LLC Depositor | |||||
Commercial Mortgage Pass-Through Certificates, Series 2023-C6 | |||||
Bank of Montreal KeyBank National Association Argentic Real Estate Finance 2 LLC Wells Fargo Bank, National Association LMF Commercial, LLC UBS AG Zions Bancorporation, N.A. Goldman Sachs Mortgage Company German American Capital Corporation Starwood Mortgage Capital LLC Sponsors and Mortgage Loan Sellers | |||||
| BMO Capital Markets | KeyBanc Capital Markets | UBS Securities LLC | Goldman Sachs & Co. LLC | Deutsche Bank Securities | Wells Fargo Securities, LLC |
| Co-Lead Managers and Joint Bookrunners | |||||
| Academy Securities Co-Manager | Bancroft Capital, LLC Co-Manager | Drexel Hamilton Co-Manager | |||
| THE INFORMATION IN THIS STRUCTURAL AND COLLATERAL TERM SHEET IS NOT COMPLETE AND MAY BE AMENDED PRIOR TO THE TIME OF SALE. THIS TERM SHEET IS NOT AN OFFER TO SELL THESE SECURITIES AND IT IS NOT A SOLICITATION OF AN OFFER TO BUY THESE SECURITIES IN ANY JURISDICTION WHERE THE OFFER OR SALE IS NOT PERMITTED. |
| Dated August 3, 2023 | BMO 2023-C6 |
This material is for your information, and none of BMO Capital Markets Corp., Wells Fargo Securities, LLC, KeyBanc Capital Markets Inc., UBS Securities LLC, Goldman Sachs & Co. LLC, Deutsche Bank Securities Inc., Academy Securities, Inc., Bancroft Capital, LLC and Drexel Hamilton, LLC (collectively, the “Underwriters”) are soliciting any action based upon it. This material is not to be construed as an offer to sell or the solicitation of any offer to buy any security in any jurisdiction where such an offer or solicitation would be illegal.
The depositor has filed a registration statement (including the prospectus) with the Securities and Exchange Commission (File No. 333-255934) for the offering to which this communication relates. Before you invest, you should read the prospectus in the registration statement and other documents the depositor has filed with the Securities and Exchange Commission for more complete information about the depositor, the issuing entity and this offering. You may get these documents for free by visiting EDGAR on the SEC website at www.sec.gov. Alternatively, the depositor or BMO Capital Markets Corp., any other underwriter, or any dealer participating in this offering will arrange to send you the prospectus if you request it by calling 1-866-864-7760. The Offered Certificates referred to in these materials, and the asset pool backing them, are subject to modification or revision (including the possibility that one or more Classes of Certificates may be split, combined or eliminated at any time prior to issuance or availability of a final prospectus) and are offered on a “when, as and if issued” basis. You understand that, when you are considering the purchase of these Certificates, a contract of sale will come into being no sooner than the date on which the relevant Class has been priced and we have verified the allocation of Certificates to be made to you; any “indications of interest” expressed by you, and any “soft circles” generated by us, will not create binding contractual obligations for you or us.
Neither this document nor anything contained in this document shall form the basis for any contract or commitment whatsoever. The information contained in this document is preliminary as of the date of this document, supersedes any previous such information delivered to you and will be superseded by any such information subsequently delivered prior to the time of sale. These materials are subject to change, completion or amendment from time to time. The information should be reviewed only in conjunction with the entire offering document relating to the Commercial Mortgage Pass-Through Certificates, Series 2023-C6 (the “Offering Document”). All of the information contained herein is subject to the same limitations and qualifications contained in the Offering Document. The information contained herein does not contain all relevant information relating to the underlying mortgage loans or mortgaged properties. Such information is described elsewhere in the Offering Document. The information contained herein will be more fully described elsewhere in the Offering Document. The information contained herein should not be viewed as projections, forecasts, predictions or opinions with respect to value. Prior to making any investment decision, prospective investors are strongly urged to read the Offering Document its entirety. Neither the Securities and Exchange Commission nor any state securities commission has approved or disapproved of these securities or determined if this free writing prospectus is truthful or complete. Any representation to the contrary is a criminal offense.
This document has been prepared by the Underwriters for information purposes only and does not constitute, in whole or in part, a prospectus for the purposes of Regulation (EU) 2017/1129 (as amended or superseded) and/or Part VI of the Financial Services and Markets Act 2000 (as amended) or other offering document.
The attached information contains certain tables and other statistical analyses (the “Computational Materials”) which have been prepared in reliance upon information furnished by the Mortgage Loan Sellers. Numerous assumptions were used in preparing the Computational Materials, which may or may not be reflected herein. As such, no assurance can be given as to the Computational Materials’ accuracy, appropriateness or completeness in any particular context; or as to whether the Computational Materials and/or the assumptions upon which they are based reflect present market conditions or future market performance. The Computational Materials should not be construed as either projections or predictions or as legal, tax, financial or accounting advice. You should consult your own counsel, accountant and other advisors as to the legal, tax, business, financial and related aspects of a purchase of these Certificates. Any weighted average lives, yields and principal payment periods shown in the Computational Materials are based on prepayment and/or loss assumptions, and changes in such prepayment and/or loss assumptions may dramatically affect such weighted average lives, yields and principal payment periods. In addition, it is possible that prepayments or losses on the underlying assets will occur at rates higher or lower than the rates shown in the attached Computational Materials. The specific characteristics of the Certificates may differ from those shown in the Computational Materials due to differences between the final underlying assets and the preliminary underlying assets used in preparing the Computational Materials. The principal amount and designation of any security described in the Computational Materials are subject to change prior to issuance. None of the Underwriters or any of their respective affiliates make any representation or warranty as to the actual rate or timing of payments or losses on any of the underlying assets or the payments or yield on the Certificates. The information in this presentation is based upon management forecasts and reflects prevailing conditions and management’s views as of this date, all of which are subject to change. In preparing this presentation, we have relied upon and assumed, without independent verification, the accuracy and completeness of all information available from public sources or which was provided to us by or on behalf of the Mortgage Loan Sellers or which was otherwise reviewed by us.
This document contains forward-looking statements. If and when included in this document, the words “expects”, “intends”, “anticipates”, “estimates” and analogous expressions and all statements that are not historical facts, including statements about our beliefs or expectations, are intended to identify forward-looking statements. Any forward-looking statements are made subject to risks and uncertainties which could cause actual results to differ materially from those stated. Those risks and uncertainties include, among other things, declines in general economic and business conditions, increased competition, changes in demographics, changes in political and social conditions, regulatory initiatives and changes in consumer preferences, many of which are beyond our control and the control of any other person or entity related to this offering. The forward-looking statements made in this document are made as of the date hereof. We have no obligation to update or revise any forward-looking statement.
BMO Capital Markets is a trade name used by BMO Financial Group for the wholesale banking businesses of Bank of Montreal, BMO Harris Bank N.A. (member FDIC), Bank of Montreal Europe p.l.c, and Bank of Montreal (China) Co. Ltd, the institutional broker dealer business of BMO Capital Markets Corp. (Member FINRA and SIPC) and the agency broker dealer business of Clearpool Execution Services, LLC (Member FINRA and SIPC) in the U.S., and the institutional broker dealer businesses of BMO Nesbitt Burns Inc. (Member Investment Industry Regulatory Organization of Canada and Member Canadian Investor Protection Fund) in Canada and Asia, Bank of Montreal Europe p.l.c. (authorized and regulated by the Central Bank of Ireland) in Europe and BMO Capital Markets Limited (authorized and regulated by the Financial Conduct Authority) in the UK and Australia.
Securities and investment banking activities in the United States are performed by Deutsche Bank Securities Inc., a member of NYSE, FINRA and SIPC, and its broker-dealer affiliates. Lending and other commercial banking activities in the United States are performed by Deutsche Bank AG and its banking affiliates.
| THE INFORMATION IN THIS STRUCTURAL AND COLLATERAL TERM SHEET IS NOT COMPLETE AND MAY BE AMENDED PRIOR TO THE TIME OF SALE. THIS TERM SHEET IS NOT AN OFFER TO SELL THESE SECURITIES AND IT IS NOT A SOLICITATION OF AN OFFER TO BUY THESE SECURITIES IN ANY JURISDICTION WHERE THE OFFER OR SALE IS NOT PERMITTED. | ||
| 2 | ||
| Dated August 3, 2023 | BMO 2023-C6 |
IMPORTANT NOTICE RELATING TO AUTOMATICALLY-GENERATED EMAIL DISCLAIMERS
Any legends, disclaimers or other notices that may appear at the bottom of any email communication to which this document is attached relating to (1) these materials not constituting an offer (or a solicitation of an offer), (2) no representation that these materials are accurate or complete and may not be updated or (3) these materials possibly being confidential, are not applicable to these materials and should be disregarded. Such legends, disclaimers or other notices have been automatically generated as a result of these materials having been sent via Bloomberg or another system.
THE CERTIFICATES REFERRED TO IN THESE MATERIALS ARE SUBJECT TO MODIFICATION OR REVISION (INCLUDING THE POSSIBILITY THAT ONE OR MORE CLASSES OF CERTIFICATES MAY BE SPLIT, COMBINED OR ELIMINATED AT ANY TIME PRIOR TO ISSUANCE OR AVAILABILITY OF A FINAL PROSPECTUS) AND ARE OFFERED ON A “WHEN, AS AND IF ISSUED” BASIS.
THE UNDERWRITERS MAY FROM TIME TO TIME PERFORM INVESTMENT BANKING SERVICES FOR, OR SOLICIT INVESTMENT BANKING BUSINESS FROM, ANY COMPANY NAMED IN THESE MATERIALS. THE UNDERWRITERS AND/OR THEIR AFFILIATES OR RESPECTIVE EMPLOYEES MAY FROM TIME TO TIME HAVE A LONG OR SHORT POSITION IN ANY CERTIFICATE OR CONTRACT DISCUSSED IN THESE MATERIALS.
| THE INFORMATION IN THIS STRUCTURAL AND COLLATERAL TERM SHEET IS NOT COMPLETE AND MAY BE AMENDED PRIOR TO THE TIME OF SALE. THIS TERM SHEET IS NOT AN OFFER TO SELL THESE SECURITIES AND IT IS NOT A SOLICITATION OF AN OFFER TO BUY THESE SECURITIES IN ANY JURISDICTION WHERE THE OFFER OR SALE IS NOT PERMITTED. | ||
| 2 | ||
| Structural and Collateral Term Sheet | BMO 2023-C6 | |
| Collateral Characteristics | ||
Mortgage Loan Seller | Number of Mortgage Loans | Number of Mortgaged Properties | Aggregate | % of IPB | Roll-up Aggregate Cut-off Date Balance | Roll-up Aggregate % of Cut-off Date Balance |
| BMO | 5 | 8 | $126,125,000 | 20.9% | $126,125,000 | 20.9% |
| KeyBank | 2 | 63 | $63,950,000 | 10.6% | $103,950,000 | 17.2% |
| AREF2 | 3 | 6 | $48,889,660 | 8.1% | $76,385,187 | 12.6% |
| WFB | 1 | 1 | $46,200,000 | 7.6% | $72,684,196 | 12.0% |
| LMF | 7 | 9 | $45,372,210 | 7.5% | $50,372,210 | 8.3% |
| UBS AG | 2 | 2 | $28,350,000 | 4.7% | $48,350,000 | 8.0% |
| ZBNA | 2 | 2 | $44,957,366 | 7.4% | $44,957,366 | 7.4% |
| GSMC | 3 | 19 | $40,600,000 | 6.7% | $40,600,000 | 6.7% |
| GACC | 1 | 22 | $22,200,000 | 3.7% | $22,200,000 | 3.7% |
| SMC | 3 | 3 | $18,800,000 | 3.1% | $18,800,000 | 3.1% |
| WFB, AREF2 | 1 | 1 | $33,979,723 | 5.6% | - | - |
| KeyBank, AREF2 | 1 | 1 | $60,000,000 | 9.9% | - | - |
| UBS AG, LMF | 1 | 1 | $25,000,000 | 4.1% | - | - |
| Total: | 32 | 138 | $604,423,959 | 100.0% | $604,423,959 | 100.0% |
| Loan Pool | ||
| Initial Pool Balance (“IPB”): | $604,423,959 | |
| Number of Mortgage Loans: | 32 | |
| Number of Mortgaged Properties: | 138 | |
| Average Cut-off Date Balance per Mortgage Loan: | $18,888,249 | |
| Weighted Average Current Mortgage Rate: | 6.77038% | |
| 10 Largest Mortgage Loans as % of IPB: | 61.5% | |
| Weighted Average Remaining Term to Maturity: | 113 months | |
| Weighted Average Seasoning: | 1 month | |
| Credit Statistics | ||
| Weighted Average UW NCF Debt Service Coverage Ratio (“DSCR”): | 1.77x | |
| Weighted Average UW NOI Debt Yield (“DY”): | 13.2% | |
| Weighted Average Cut-off Date Loan-to-Value Ratio (“LTV”): | 53.5% | |
| Weighted Average Maturity Date/ARD LTV: | 51.7% | |
| Other Statistics | ||
| % of Mortgage Loans with Additional Debt: | 8.3% | |
| % of Mortgage Loans with Single Tenants(1): | 40.2% | |
| % of Mortgage Loans secured by Multiple Properties: | 22.1% | |
| Amortization | ||
| Weighted Average Original Amortization Term: | 360 months | |
| Weighted Average Remaining Amortization Term: | 359 months | |
| % of Mortgage Loans with Interest-Only: | 62.7% | |
| % of Mortgage Loans with Amortizing Balloon: | 19.0% | |
| % of Mortgage Loans with Partial Interest-Only followed by Amortizing Balloon: | 10.7% | |
| % of Mortgage Loans with Interest-Only with Anticipated Repayment Date: | 7.6% | |
| Lockboxes | ||
| % of Mortgage Loans with Hard Lockboxes: | 72.2% | |
| % of Mortgage Loans with Springing Lockboxes: | 26.6% | |
| % of Mortgage Loans with Soft Lockboxes: | 1.3% | |
| Reserves | ||
| % of Mortgage Loans Requiring Monthly Tax Reserves: | 57.2% | |
| % of Mortgage Loans Requiring Monthly Insurance Reserves: | 40.3% | |
| % of Mortgage Loans Requiring Monthly CapEx Reserves: | 36.7% | |
| % of Mortgage Loans Requiring Monthly TI/LC Reserves(2): | 21.9% | |
| (1) | Excludes mortgage loans that are secured by multiple properties with multiple tenants and includes two mortgage loans that are partially secured by single tenant. |
| (2) | Calculated only with respect to the Cut-off Date Balance of mortgage loans secured or partially secured by office, industrial, retail, and mixed use properties. |
| THE INFORMATION IN THIS STRUCTURAL AND COLLATERAL TERM SHEET IS NOT COMPLETE AND MAY BE AMENDED PRIOR TO THE TIME OF SALE. THIS TERM SHEET IS NOT AN OFFER TO SELL THESE SECURITIES AND IT IS NOT A SOLICITATION OF AN OFFER TO BUY THESE SECURITIES IN ANY JURISDICTION WHERE THE OFFER OR SALE IS NOT PERMITTED. | ||
| 3 | ||
| Structural and Collateral Term Sheet | BMO 2023-C6 | |
| Collateral Characteristics | ||
| Ten Largest Mortgage Loans | ||||||||||||
| No. | Loan Name | City, State | Mortgage Loan Seller | No. of Prop. | Cut-off Date Balance | % of IPB | Square Feet / Rooms / Units | Property Type | UW NCF DSCR | UW NOI DY | Cut-off Date LTV | Maturity Date/ARD LTV |
| 1 | Healthcare Trust MOB Portfolio | Various, Various | KeyBank | 62 | $60,000,000 | 9.9% | 1,247,943 | Office | 1.75x | 12.1% | 52.7% | 52.7% |
| 2 | Skorpios Industrial | Temecula, CA | KeyBank, AREF2 | 1 | $60,000,000 | 9.9% | 450,000 | Industrial | 1.95x | 15.6% | 41.7% | 41.7% |
| 3 | Fashion Valley Mall | San Diego, CA | BMO | 1 | $50,000,000 | 8.3% | 1,377,155 | Retail | 3.15x | 18.7% | 31.5% | 31.5% |
| 4 | CX - 250 Water Street | Cambridge, MA | WFB | 1 | $46,200,000 | 7.6% | 479,004 | Mixed Use | 1.66x | 9.3% | 48.8% | 48.8% |
| 5 | Marriott Philadelphia West | West Conshohocken, PA | WFB, AREF2 | 1 | $33,979,723 | 5.6% | 289 | Hospitality | 1.52x | 14.3% | 49.7% | 43.6% |
| 6 | Maple Creek Village | Indianapolis, IN | BMO | 1 | $28,200,000 | 4.7% | 247 | Multifamily | 1.43x | 10.6% | 68.8% | 68.8% |
| 7 | 11 West 42nd Street | New York, NY | UBS AG, LMF | 1 | $25,000,000 | 4.1% | 960,568 | Office | 1.39x | 11.6% | 49.4% | 49.4% |
| 8 | Back Bay Office | Boston, MA | ZBNA | 1 | $25,000,000 | 4.1% | 1,283,670 | Office | 2.55x | 16.3% | 33.7% | 33.7% |
| 9 | Four Springs Net Lease Portfolio | Various, Various | GACC | 22 | $22,200,000 | 3.7% | 1,316,654 | Industrial | 1.88x | 11.3% | 54.7% | 54.7% |
| 10 | Cincinnati Multifamily Portfolio II | Cincinnati, OH | BMO | 4 | $21,000,000 | 3.5% | 212 | Multifamily | 1.43x | 10.4% | 65.3% | 65.3% |
| Top 3 Total/Weighted Average | 64 | $170,000,000 | 28.1% | 2.23x | 15.3% | 42.6% | 42.6% | |||||
| Top 5 Total/Weighted Average | 66 | $250,179,723 | 41.4% | 2.03x | 14.0% | 44.7% | 43.9% | |||||
| Top 10 Total/Weighted Average | 95 | $371,579,723 | 61.5% | 1.93x | 13.4% | 47.9% | 47.3% | |||||
| Non-Top 10 Total/Weighted Average | 43 | $232,844,236 | 38.5% | 1.50x | 12.9% | 62.4% | 58.6% | |||||
| THE INFORMATION IN THIS STRUCTURAL AND COLLATERAL TERM SHEET IS NOT COMPLETE AND MAY BE AMENDED PRIOR TO THE TIME OF SALE. THIS TERM SHEET IS NOT AN OFFER TO SELL THESE SECURITIES AND IT IS NOT A SOLICITATION OF AN OFFER TO BUY THESE SECURITIES IN ANY JURISDICTION WHERE THE OFFER OR SALE IS NOT PERMITTED. | ||
| 4 | ||
| Structural and Collateral Term Sheet | BMO 2023-C6 | |
| Collateral Characteristics | ||
| Pari Passu Companion Loan Summary | |||||||||
No. | Loan Name | Mortgage Loan Seller | Trust Cut-off | Aggregate Pari | Controlling | Master Servicer | Special Servicer | Related Pari Passu | Related Pari |
| 1 | Healthcare Trust MOB Portfolio | KeyBank | $60,000,000 | $180,000,000 | BBCMS 2023-C20 | KeyBank | LNR | BBCMS 2023-C20 Future Securitization(s) | $61,500,000 $118,500,000 |
| 2 | Skorpios Industrial | KeyBank, AREF2 | $60,000,000 | $15,000,000 | BMO 2023-C6 | Midland | Rialto | Future Securitization(s) | $15,000,000 |
| 3 | Fashion Valley Mall | BMO | $50,000,000 | $400,000,000 | BBCMS 2023-C20(1) | KeyBank(1) | LNR(1) | BMARK 2023-B39 BBCMS 2023-C20 Future Securitization(s) | $85,000,000 $82,500,000 $167,500,000 |
| 4 | CX - 250 Water Street | WFB | $46,200,000 | $485,300,000 | BANK 2023-BNK45(2) | Wells Fargo Bank(2) | LNR(2) | BANK 2023-BNK45 MSWF 2023-1 BMARK 2023-B38 BBCMS 2023-C20 BANK 2023-BNK46 Future securitizations | $55,000,000 $65,625,000 $53,150,000 $75,125,000 $72,000,000 $164,400,000 |
| 5 | Marriott Philadelphia West | WFB, AREF2 | $33,979,723 | $4,997,018 | BMO 2023-C6 | Midland | Rialto | Future Securitization(s) | $5,000,000 |
| 7 | 11 West 42nd Street | UBS AG, LMF | $25,000,000 | $249,000,000 | BMO 2023-5C1(3)(4) | KeyBank(3)(4) | 3650 REIT(3)(4) | BMO 2023-5C1 Future Securitization(s) | $62,500,000 $186,500,000 |
| 8 | Back Bay Office | ZBNA | $25,000,000 | $450,000,000 | BMARK 2023-B39 | Midland | Situs | New York Life TIAA BMARK 2023-V3 BMARK 2023-B39 BANK5 2023-5YR2 BMO 2023-5C1 Future Securitization(s) | $137,500,000 $100,000,000 $45,000,000 $50,000,000 $60,000,000 $30,000,000 $27,500,000 |
| 9 | Four Springs Net Lease Portfolio | GACC | $22,200,000 | $50,000,000 | BMARK 2023-B39 | Midland | Situs | BMARK 2023-B39 | $50,000,000 |
| 12 | J&O Industrial Facility | GSMC | $20,000,000 | $26,480,000 | BMARK 2023-B39 | Midland | K-Star | BMARK 2023-B39 | $26,480,000 |
| 13 | Brier Creek Commons | ZBNA | $19,957,366 | $64,861,440 | BMO 2023-C5 | Midland | Rialto | BMO 2023-C5 | $65,000,000 |
| 20 | Novolex Portfolio | GSMC | $10,500,000 | $114,500,000 | BMARK 2023-B39 | Midland | K-Star | BMARK 2023-B39 Future Securitization(s) | $89,500,000 $25,000,000 |
| (1) | In the case of Loan No. 3, until the securitization of the related controlling pari passu companion loan, the related whole loan will be serviced and administered pursuant to the pooling and servicing agreement for the BBCMS 2023-C20 securitization transaction by the parties thereto. Upon the securitization of the related controlling pari-passu companion loan, servicing of the related whole loan will shift to the servicers under the servicing agreement with respect to such future securitization transaction, which servicing agreement will become the Controlling Pooling/Trust & Servicing Agreement. |
| (2) | In the case of Loan No. 4, until the securitization of the related controlling pari passu companion loan, the related whole loan will be serviced and administered pursuant to the pooling and servicing agreement for the BANK 2023-BNK45 securitization transaction by the parties thereto. Upon the securitization of the related controlling pari-passu companion loan, servicing of the related whole loan will shift to the servicers under the servicing agreement with respect to such future securitization transaction, which servicing agreement will become the Controlling Pooling/Trust & Servicing Agreement. |
| (3) | In the case of Loan No. 7, until the securitization of the related controlling pari passu companion loan, the related whole loan will be serviced and administered pursuant to the pooling and servicing agreement for the BMO 2023-5C1 securitization transaction by the parties thereto. Upon the securitization of the related controlling pari-passu companion loan, servicing of the related whole loan will shift to the servicers under the servicing agreement with respect to such future securitization transaction, which servicing agreement will become the Controlling Pooling/Trust & Servicing Agreement. |
| (4) | Based on a publicly available prospectus. The BMO 2023-5C1 transaction is expected to close prior to the closing of this securitization transaction. |
| THE INFORMATION IN THIS STRUCTURAL AND COLLATERAL TERM SHEET IS NOT COMPLETE AND MAY BE AMENDED PRIOR TO THE TIME OF SALE. THIS TERM SHEET IS NOT AN OFFER TO SELL THESE SECURITIES AND IT IS NOT A SOLICITATION OF AN OFFER TO BUY THESE SECURITIES IN ANY JURISDICTION WHERE THE OFFER OR SALE IS NOT PERMITTED. | ||
| �� | 5 | |
| Structural and Collateral Term Sheet | BMO 2023-C6 | |
| Collateral Characteristics | ||
| Mortgaged Properties by Type |
Weighted Average | ||||||||
| Property Type | Property Subtype | Number of Properties | Cut-off Date Principal Balance | % of IPB | UW NCF DSCR | UW NOI DY | Cut-off Date LTV | Maturity Date/ARD LTV |
| Industrial | Manufacturing | 15 | $87,278,582 | 14.4% | 1.82x | 14.2% | 48.6% | 48.6% |
| Warehouse | 8 | 22,503,852 | 3.7 | 1.56x | 12.1% | 59.2% | 57.2% | |
| Warehouse / Distribution | 11 | 11,095,022 | 1.8 | 1.87x | 11.4% | 55.3% | 55.3% | |
| Manufacturing / Warehouse | 4 | 3,945,498 | 0.7 | 1.85x | 11.5% | 57.5% | 57.5% | |
| Warehouse / Manufacturing | 2 | 2,482,249 | 0.4 | 1.88x | 11.3% | 54.7% | 54.7% | |
| Cold Storage | 1 | 2,382,380 | 0.4 | 1.88x | 11.3% | 54.7% | 54.7% | |
| Flex | 2 | 1,662,417 | 0.3 | 1.88x | 11.3% | 54.7% | 54.7% | |
| Subtotal: | 43 | $131,350,000 | 21.7% | 1.78x | 13.4% | 51.5% | 51.2% | |
| Office | Medical | 63 | $65,500,000 | 10.8% | 1.74x | 12.2% | 53.2% | 53.2% |
| CBD | 2 | 50,000,000 | 8.3 | 1.97x | 14.0% | 41.6% | 41.6% | |
| Suburban | 1 | 6,100,000 | 1.0 | 1.44x | 13.2% | 59.2% | 55.0% | |
| Subtotal: | 66 | $121,600,000 | 20.1% | 1.82x | 13.0% | 48.7% | 48.5% | |
| Hospitality | Full Service | 5 | $82,479,723 | 13.6% | 1.59x | 15.1% | 57.5% | 52.2% |
| Limited Service | 4 | 36,886,869 | 6.1 | 1.59x | 15.3% | 64.4% | 57.3% | |
| Subtotal: | 9 | $119,366,593 | 19.7% | 1.59x | 15.1% | 59.6% | 53.8% | |
| Retail | Super Regional Mall | 1 | $50,000,000 | 8.3% | 3.15x | 18.7% | 31.5% | 31.5% |
| Anchored | 6 | 46,057,366 | 7.6 | 1.25x | 11.1% | 63.2% | 55.9% | |
| Subtotal: | 7 | $96,057,366 | 15.9% | 2.24x | 15.1% | 46.7% | 43.2% | |
| Multifamily | Garden | 6 | $69,700,000 | 11.5% | 1.50x | 11.0% | 65.7% | 65.7% |
| Mid Rise | 2 | 12,200,000 | 2.0 | 1.31x | 9.3% | 61.9% | 61.9% | |
| Low Rise | 2 | 2,200,000 | 0.4 | 1.22x | 9.8% | 74.4% | 74.4% | |
| Subtotal: | 10 | $84,100,000 | 13.9% | 1.47x | 10.7% | 65.3% | 65.3% | |
| Mixed Use | Lab / Office | 1 | $46,200,000 | 7.6% | 1.66x | 9.3% | 48.8% | 48.8% |
| Multifamily / Retail | 1 | 1,800,000 | 0.3 | 1.22x | 9.8% | 74.4% | 74.4% | |
| Subtotal: | 2 | $48,000,000 | 7.9% | 1.64x | 9.3% | 49.8% | 49.8% | |
| Self Storage | Self Storage | 1 | $3,950,000 | 0.7% | 1.49x | 10.4% | 36.9% | 36.9% |
| Total / Weighted Average: | 138 | $604,423,959 | 100.0% | 1.77x | 13.2% | 53.5% | 51.7% | |
| THE INFORMATION IN THIS STRUCTURAL AND COLLATERAL TERM SHEET IS NOT COMPLETE AND MAY BE AMENDED PRIOR TO THE TIME OF SALE. THIS TERM SHEET IS NOT AN OFFER TO SELL THESE SECURITIES AND IT IS NOT A SOLICITATION OF AN OFFER TO BUY THESE SECURITIES IN ANY JURISDICTION WHERE THE OFFER OR SALE IS NOT PERMITTED. | ||
| 6 | ||
| Structural and Collateral Term Sheet | BMO 2023-C6 | |
| No. 1 – Healthcare Trust MOB Portfolio | ||

| THE INFORMATION IN THIS STRUCTURAL AND COLLATERAL TERM SHEET IS NOT COMPLETE AND MAY BE AMENDED PRIOR TO THE TIME OF SALE. THIS TERM SHEET IS NOT AN OFFER TO SELL THESE SECURITIES AND IT IS NOT A SOLICITATION OF AN OFFER TO BUY THESE SECURITIES IN ANY JURISDICTION WHERE THE OFFER OR SALE IS NOT PERMITTED. | ||
| 7 | ||
| Structural and Collateral Term Sheet | BMO 2023-C6 | |
| No. 1 – Healthcare Trust MOB Portfolio | ||

| THE INFORMATION IN THIS STRUCTURAL AND COLLATERAL TERM SHEET IS NOT COMPLETE AND MAY BE AMENDED PRIOR TO THE TIME OF SALE. THIS TERM SHEET IS NOT AN OFFER TO SELL THESE SECURITIES AND IT IS NOT A SOLICITATION OF AN OFFER TO BUY THESE SECURITIES IN ANY JURISDICTION WHERE THE OFFER OR SALE IS NOT PERMITTED. | ||
| 8 | ||
| Structural and Collateral Term Sheet | BMO 2023-C6 | |
| No. 1 – Healthcare Trust MOB Portfolio | ||
| Mortgage Loan Information | Property Information | |||
| Mortgage Loan Seller: | KeyBank | Single Asset / Portfolio: | Portfolio | |
| Original Principal Balance(1): | $60,000,000 | Title: | Various | |
| Cut-off Date Principal Balance(1): | $60,000,000 | Property Type – Subtype: | Office – Medical | |
| % of IPB: | 9.9% | Net Rentable Area (SF): | 1,247,943 | |
| Loan Purpose: | Refinance | Location: | Various | |
| Borrowers(2): | Various | Year Built / Renovated: | Various / Various | |
| Borrower Sponsor: | Healthcare Trust Operating | Occupancy: | 96.5% | |
| Partnership, L.P. | Occupancy Date: | 5/24/2023 | ||
| Interest Rate: | 6.45300% | 4th Most Recent NOI (As of)(5): | $15,108,391 (12/31/2020) | |
| Note Date: | 5/24/2023 | 3rd Most Recent NOI (As of)(5): | $18,702,482 (12/31/2021) | |
| Maturity Date: | 6/6/2033 | 2nd Most Recent NOI (As of)(5): | $26,544,839 (12/31/2022) | |
| Interest-only Period: | 120 months | Most Recent NOI (As of): | $26,932,240 (TTM 3/31/2023) | |
| Original Term: | 120 months | UW Economic Occupancy: | 95.0% | |
| Original Amortization Term: | None | UW Revenues: | $39,365,086 | |
| Amortization Type: | Interest Only | UW Expenses: | $10,218,760 | |
| Call Protection(3): | L(12),YM1(14),DorYM1(87),O(7) | UW NOI: | $29,146,326 | |
| Lockbox / Cash Management: | Hard / Springing | UW NCF: | $27,420,277 | |
| Additional Debt(1): | Yes | Appraised Value / Per SF(6): | $455,000,000 / $365 | |
| Additional Debt Balance(1): | $180,000,000 | Appraisal Date(6): | 3/24/2023 | |
| Additional Debt Type(1): | Pari Passu | |||
| Escrows and Reserves(4) | Financial Information(1) | ||||||
| Initial | Monthly | Initial Cap | Cut-off Date Loan / SF: | $192 | |||
| Taxes: | $643,802 | $321,901 | N/A | Maturity Date Loan / SF: | $192 | ||
| Insurance: | $6,283 | $1,257 | N/A | Cut-off Date LTV(6): | 52.7% | ||
| Replacement Reserves: | $0 | Springing | N/A | Maturity Date LTV(6): | 52.7% | ||
| TI/LC Reserve: | $0 | Springing | N/A | UW NCF DSCR: | 1.75x | ||
| Other: | $5,319,348 | Springing | N/A | UW NOI Debt Yield: | 12.1% | ||
| Sources and Uses | |||||||
| Sources | Proceeds | % of Total | Uses | Proceeds | % of Total | ||
| Whole Loan | $240,000,000 | 100.0% | Loan Payoff | $196,076,830 | 81.7 | % | |
| Return of Equity | 29,390,626 | 12.2 | |||||
| Closing Costs(7) | 8,563,111 | 3.6 | |||||
| Upfront Reserves | 5,969,433 | 2.5 | |||||
| Total Sources | $240,000,000 | 100.0% | Total Uses | $240,000,000 | 100.0 | % | |
| (1) | The Healthcare Trust MOB Portfolio Mortgage Loan (as defined below) is part of a whole loan evidenced by 14 pari passu notes with an aggregate original principal balance of $240.0 million. The Financial Information in the chart above reflects the Cut-off Date Balance of the Healthcare Trust MOB Portfolio Whole Loan (as defined below). |
| (2) | The borrowers are 59 Delaware limited liability companies and special purpose entities that are subsidiaries of Healthcare Trust Operating Partnership, L.P., a Delaware limited partnership. See the footnotes to Annex A-1 in the Preliminary Prospectus for the names of each entity. |
| (3) | Defeasance of the Healthcare Trust MOB Portfolio Whole Loan is permitted at any time after the date that is the earlier to occur of (i) two years after the closing date of the securitization that includes the last note to be securitized and (ii) May 24, 2026. The assumed defeasance lockout period of 26 payments is based on the anticipated closing date of the BMO 2023-C6 securitization trust in August 2023. The actual defeasance lockout period may be longer. |
| (4) | For a full description of Escrows and Reserves, see “Escrows and Reserves” below. |
| (5) | The borrower sponsor progressively acquired the Healthcare Trust MOB Portfolio Properties (as defined below) between 2013 and 2023, which resulted in an increase in historical NOI. For additional information on how many Healthcare Trust MOB Portfolio Properties were owned by the borrower sponsor in each year, see “Historical and Current Occupancy” below. |
| (6) | The Appraised Value represents the “as portfolio” value which includes a portfolio premium to the Healthcare Trust MOB Portfolio Properties if sold together on a bulk basis. The sum of the “as-is” appraised values on a stand-alone basis is $444,475,000. The Cut-off Date LTV Ratio and Maturity Date LTV Ratio based on the aggregate stand-alone appraised “as-is” values are 54.0% and 54.0%, respectively. Appraisal dates for the Healthcare Trust MOB Portfolio Properties range from March 20, 2023, to April 5, 2023. |
| (7) | Closing Costs include an interest rate buydown of $3,240,000. |
| THE INFORMATION IN THIS STRUCTURAL AND COLLATERAL TERM SHEET IS NOT COMPLETE AND MAY BE AMENDED PRIOR TO THE TIME OF SALE. THIS TERM SHEET IS NOT AN OFFER TO SELL THESE SECURITIES AND IT IS NOT A SOLICITATION OF AN OFFER TO BUY THESE SECURITIES IN ANY JURISDICTION WHERE THE OFFER OR SALE IS NOT PERMITTED. | ||
| 9 | ||
| Structural and Collateral Term Sheet | BMO 2023-C6 | |
| No. 1 – Healthcare Trust MOB Portfolio | ||
The Loan. The largest mortgage loan (the “Healthcare Trust MOB Portfolio Mortgage Loan”) is part of a fixed rate whole loan (the “Healthcare Trust MOB Portfolio Whole Loan”) evidenced by 14 pari passu promissory notes in the aggregate original principal amount of $240,000,000. The Healthcare Trust MOB Portfolio Whole Loan is secured by the borrowers’ fee and/or leasehold interests in a 1,247,943 square foot medical office portfolio comprised of 62 properties located in 19 states (the “Healthcare Trust MOB Portfolio Properties”). The Healthcare Trust MOB Portfolio Whole Loan was co-originated on May 24, 2023, by Barclays Capital Real Estate Inc. (“Barclays”), Societe Generale Financial Corporation (“SGFC”) and KeyBank National Association (“KeyBank”). The Healthcare Trust MOB Portfolio Whole Loan has a 10-year interest-only term and accrues interest at a rate of 6.45300% per annum on an Actual/360 basis. The Healthcare Trust MOB Portfolio Mortgage Loan is evidenced by the non-controlling notes A-12 and A-13, with an aggregate original principal balance of $60,000,000. The Healthcare Trust MOB Portfolio Whole Loan is serviced pursuant to the pooling and servicing agreement for the BBCMS 2023-C20 securitization trust. See “Description of the Mortgage Pool—The Whole Loans—The Outside Serviced Pari Passu Whole Loans” and “Pooling and Servicing Agreement—Servicing of the Outside Serviced Mortgage Loans” in the Preliminary Prospectus.
| Whole Loan Summary | |||||
| Note | Original Balance | Cut-off Date Balance | Note Holder | Controlling Piece | |
| A-1 | $40,000,000 | $40,000,000 | BBCMS 2023-C20 | Yes | |
| A-2(1) | $30,000,000 | $30,000,000 | Barclays | No | |
| A-3(1) | $20,000,000 | $20,000,000 | Barclays | No | |
| A-4(1) | $10,000,000 | $10,000,000 | Barclays | No | |
| A-5(1) | $5,000,000 | $5,000,000 | Barclays | No | |
| A-6 | $3,000,000 | $3,000,000 | BBCMS 2023-C20 | No | |
| A-7(1) | $20,600,000 | $20,600,000 | SGFC | No | |
| A-8 | $18,500,000 | $18,500,000 | BBCMS 2023-C20 | No | |
| A-9(1) | $9,100,000 | $9,100,000 | SGFC | No | |
| A-10(1) | $6,400,000 | $6,400,000 | SGFC | No | |
| A-11(1) | $5,400,000 | $5,400,000 | SGFC | No | |
| A-12 | $40,000,000 | $40,000,000 | BMO 2023-C6 | No | |
| A-13 | $20,000,000 | $20,000,000 | BMO 2023-C6 | No | |
| A-14(1) | $12,000,000 | $12,000,000 | KeyBank | No | |
| Whole Loan | $240,000,000 | $240,000,000 | |||
| (1) | Expected to be contributed to one or more future securitization trust(s). |
The Properties. The Healthcare Trust MOB Portfolio Properties are comprised of 62 medical office buildings located across 19 different states and totaling 1,247,943 square feet. The Healthcare Trust MOB Portfolio Properties are currently 96.5% leased to approximately 107 tenants, with approximately 24.0% of the tenancy being investment-grade rated. 57 of the Healthcare Trust MOB Portfolio Properties are located on-campus or near a hospital and/or are affiliated with a hospital campus or health system and all Healthcare Trust MOB Portfolio Properties provide outpatient care. The borrower sponsor acquired the Healthcare Trust MOB Portfolio Properties between 2013 and 2023 for a reported cost of $403.7 million. The five largest individual properties based on allocated loan amount are the Belpre V Cancer Center - Belpre, OH property (6.2% of square feet, 17.6% of underwritten base rent), the Glendale MOB - Farmington Hills, MI property (3.6% of square feet, 3.7% of underwritten base rent), the 1600 State Street property (2.5% of square feet, 2.6% of underwritten base rent), the Palm Valley Medical Plaza - Goodyear, AZ property (3.1% of square feet, 2.9% of underwritten base rent) and the Eastside Cancer Institute - Greenville, SC property (2.5% of square feet, 2.1% of underwritten base rent), with no other individual property representing more than 3.6% of square feet or 3.0% of underwritten base rent.
| THE INFORMATION IN THIS STRUCTURAL AND COLLATERAL TERM SHEET IS NOT COMPLETE AND MAY BE AMENDED PRIOR TO THE TIME OF SALE. THIS TERM SHEET IS NOT AN OFFER TO SELL THESE SECURITIES AND IT IS NOT A SOLICITATION OF AN OFFER TO BUY THESE SECURITIES IN ANY JURISDICTION WHERE THE OFFER OR SALE IS NOT PERMITTED. | ||
| 10 | ||
| Structural and Collateral Term Sheet | BMO 2023-C6 | |
| No. 1 – Healthcare Trust MOB Portfolio | ||
The following table presents certain information relating to the Healthcare Trust MOB Portfolio Properties:
| Portfolio Summary | |||||||||
| Property Name/Location | Year Built/ Renovated | SF(1) | Occupancy(1) | Allocated Whole Loan Amount (“ALA”) | % of ALA | Appraised Value(2) | UW NOI | ||
| Belpre V Cancer Center - Belpre, OH | 2020/NAP | 77,367 | 100.0 | % | $47,060,000 | 19.6 | % | $87,150,000 | $5,465,509 |
| Glendale MOB - Farmington Hills, MI | 1988/NAP | 44,639 | 93.9 | 7,990,000 | 3.3 | 14,800,000 | 1,047,768 | ||
| 1600 State Street | 1977/2006 | 30,642 | 100.0 | 6,860,000 | 2.9 | 12,700,000 | 814,292 | ||
| Palm Valley Medical Plaza - Goodyear, AZ | 1995/NAP | 38,637 | 96.8 | 5,720,000 | 2.4 | 10,600,000 | 722,580 | ||
| Eastside Cancer Institute - Greenville, SC | 1999/NAP | 30,924 | 100.0 | 5,560,000 | 2.3 | 10,300,000 | 686,452 | ||
| Aurora Healthcare Center - Waterford, WI | 1999/NAP | 23,662 | 100.0 | 5,130,000 | 2.1 | 9,500,000 | 612,774 | ||
| Beaumont Medical Center - Warren, MI | 2005/NAP | 35,219 | 54.5 | 5,080,000 | 2.1 | 9,400,000 | 467,769 | ||
| Millennium Eye Care - Freehold, NJ | 1985/2009 | 25,164 | 100.0 | 4,990,000 | 2.1 | 9,250,000 | 698,290 | ||
| 757 Franciscan Medical - Munster, IN | 2008/2012 | 37,040 | 100.0 | 4,970,000 | 2.1 | 9,200,000 | 760,957 | ||
| Vascular Surgery Associates - Tallahassee, FL | 2008/2018 | 20,000 | 100.0 | 4,700,000 | 2.0 | 8,700,000 | 553,992 | ||
| Decatur Medical Office Building - Decatur, GA | 1993/2022 | 20,800 | 100.0 | 4,590,000 | 1.9 | 8,500,000 | 535,783 | ||
| Aurora Healthcare Center - Wautoma, WI | 2004/NAP | 21,048 | 100.0 | 4,540,000 | 1.9 | 8,400,000 | 545,079 | ||
| Greenfield Medical Plaza - Gilbert, AZ | 2001/NAP | 28,488 | 90.5 | 4,270,000 | 1.8 | 7,900,000 | 594,151 | ||
| Swedish American MOB - Roscoe, IL | 2014/NAP | 25,200 | 93.7 | 4,270,000 | 1.8 | 7,900,000 | 523,490 | ||
| West Michigan Surgery Center - Big Rapids, MI | 1982, 2015/NAP | 20,404 | 100.0 | 4,180,000 | 1.7 | 7,750,000 | 552,983 | ||
| UPMC - Sir Thomas Court - Harrisburg, PA | 1994/NAP | 24,000 | 100.0 | 4,170,000 | 1.7 | 7,725,000 | 462,232 | ||
| Eastern Carolina ENT - Greenville, NC | 2001/NAP | 22,528 | 100.0 | 4,160,000 | 1.7 | 7,700,000 | 509,976 | ||
| Lancaster Medical Arts MOB - Lancaster | 1988/NAP | 30,623 | 100.0 | 4,140,000 | 1.7 | 7,675,000 | 477,483 | ||
| UPMC - Fisher Road - Mechanicsburg, PA | 1990/NAP | 15,000 | 100.0 | 3,980,000 | 1.7 | 7,375,000 | 434,519 | ||
| Pensacola Nephrology MOB - Pensacola, FL | 2011/2021 | 18,435 | 100.0 | 3,830,000 | 1.6 | 7,100,000 | 451,276 | ||
| Kingwood Executive Center - Kingwood, TX | 2005/NAP | 29,120 | 88.0 | 3,830,000 | 1.6 | 7,100,000 | 462,467 | ||
| Lee Memorial Health System - Fort Myers, FL | 1998/2021 | 24,174 | 100.0 | 3,560,000 | 1.5 | 6,600,000 | 448,229 | ||
| Greenville Health System - Greenville, SC | 1997/NAP | 21,603 | 100.0 | 3,560,000 | 1.5 | 6,600,000 | 461,316 | ||
| UPMC - Chambers Hill - Harrisburg, PA | 1955/2018 | 11,000 | 100.0 | 3,510,000 | 1.5 | 6,500,000 | 384,791 | ||
| Rockwall Medical Plaza - Rockwall, TX | 2008/NAP | 18,176 | 100.0 | 3,420,000 | 1.4 | 6,330,000 | 456,104 | ||
| Pioneer Spine Sports - West Springfield | 2008/NAP | 15,000 | 100.0 | 3,350,000 | 1.4 | 6,200,000 | 423,804 | ||
| Women’s Healthcare Group MOB - York, PA | 1993/NAP | 21,316 | 100.0 | 3,330,000 | 1.4 | 6,175,000 | 356,226 | ||
| OrthoOne Hilliard - Hilliard, OH | 2006/NAP | 24,836 | 100.0 | 3,210,000 | 1.3 | 5,950,000 | 452,536 | ||
| Metropolitan Eye Lakeshore Surgery - St. Clair Shores, MI | 1985/NAP | 17,594 | 100.0 | 3,130,000 | 1.3 | 5,800,000 | 370,923 | ||
| St Peter’s - Albany, NY - 5 Palisades | 1999/NAP | 44,323 | 100.0 | 3,130,000 | 1.3 | 5,800,000 | 541,122 | ||
| Crittenton MOB - Washington Township, MI | 2002/2021, 2022 | 19,561 | 92.7 | 3,100,000 | 1.3 | 5,750,000 | 398,182 | ||
| Surgery Center of Temple - Temple, TX | 2008/NAP | 10,400 | 100.0 | 3,020,000 | 1.3 | 5,600,000 | 330,966 | ||
| RAI Care Center-Clearwater, FL | 1973/2009 | 14,936 | 100.0 | 2,970,000 | 1.2 | 5,500,000 | 384,937 | ||
| Medical Center V - Peoria, AZ | 2002/NAP | 33,615 | 100.0 | 2,920,000 | 1.2 | 5,400,000 | 459,358 | ||
| MetroHealth Buckeye Health - Cleveland, OH | 2004/NAP | 25,070 | 100.0 | 2,920,000 | 1.2 | 5,400,000 | 350,365 | ||
| South Douglas MOB - Midwest City, OK | 2004/NAP | 20,756 | 100.0 | 2,890,000 | 1.2 | 5,350,000 | 371,363 | ||
| Crittenton MOB - Sterling Heights, MI | 1997/2019, 2021-2022 | 16,936 | 72.0 | 2,860,000 | 1.2 | 5,300,000 | 203,889 | ||
| SPHP MOB, Albany, NY | 1994/NAP | 20,780 | 100.0 | 2,810,000 | 1.2 | 5,200,000 | 354,946 | ||
| Atlanta Gastroenterology Associates - Lawrenceville, GA | 2007/NAP | 10,500 | 100.0 | 2,780,000 | 1.2 | 5,150,000 | 333,945 | ||
| Bone and Joint Specialists - Merrillville, IN | 1985/2008 | 15,504 | 100.0 | 2,590,000 | 1.1 | 4,800,000 | 339,002 | ||
| St. Peter’s - Albany, NY - 2 Palisades | 1989/NAP | 27,840 | 100.0 | 2,540,000 | 1.1 | 4,700,000 | 340,876 | ||
| 1550 State Street | 1977/NAP | 13,968 | 100.0 | 2,540,000 | 1.1 | 4,700,000 | 302,452 | ||
| St Lukes Heart Vascular Center - East Stroudsburg | 2008/NAP | 13,410 | 100.0 | 2,440,000 | 1.0 | 4,525,000 | 254,237 | ||
| Naidu Clinic - Odessa, TX | 1984/NAP | 12,901 | 100.0 | 2,120,000 | 0.9 | 3,920,000 | 259,087 | ||
| Aurora Healthcare Center - Kiel, WI | 2004/NAP | 9,842 | 100.0 | 2,110,000 | 0.9 | 3,900,000 | 254,878 | ||
| THE INFORMATION IN THIS STRUCTURAL AND COLLATERAL TERM SHEET IS NOT COMPLETE AND MAY BE AMENDED PRIOR TO THE TIME OF SALE. THIS TERM SHEET IS NOT AN OFFER TO SELL THESE SECURITIES AND IT IS NOT A SOLICITATION OF AN OFFER TO BUY THESE SECURITIES IN ANY JURISDICTION WHERE THE OFFER OR SALE IS NOT PERMITTED. | ||
| 11 | ||
| Structural and Collateral Term Sheet | BMO 2023-C6 | |
| No. 1 – Healthcare Trust MOB Portfolio | ||
| Property Name/Location | Year Built/ Renovated | SF(1) | Occupancy(1) | Allocated Whole Loan Amount (“ALA”) | % of ALA | Appraised Value(2) | UW NOI | ||
| Florida Medical Heartcare - Tampa, FL | 1988/NAP | 10,472 | 100.0 | 2,050,000 | 0.9 | 3,800,000 | 240,885 | ||
| Florida Medical Wesley Chapel - Tampa, FL | 1990/NAP | 10,368 | 100.0 | 2,000,000 | 0.8 | 3,700,000 | 238,588 | ||
| Aurora Healthcare Center - Green Bay, WI | 2007/NAP | 9,318 | 100.0 | 2,000,000 | 0.8 | 3,700,000 | 240,858 | ||
| Center for Advanced Dermatology - Lakewood, CO | 2005/NAP | 7,650 | 100.0 | 1,890,000 | 0.8 | 3,500,000 | 222,720 | ||
| Pioneer Spine Sports - Springfield | 1981/2005 | 11,000 | 80.7 | 1,890,000 | 0.8 | 3,500,000 | 180,773 | ||
| Pioneer Spine Sports - Northampton | 2008/NAP | 10,563 | 83.2 | 1,840,000 | 0.8 | 3,400,000 | 88,180 | ||
| DaVita Dialysis - Hudson, FL | 1982/2009 | 8,984 | 100.0 | 1,730,000 | 0.7 | 3,200,000 | 225,326 | ||
| Florida Medical Clinic - Tampa, FL | 1985/NAP | 9,724 | 100.0 | 1,730,000 | 0.7 | 3,200,000 | 204,772 | ||
| St Peter’s - Albany, NY - 4 Palisades | 1992/NAP | 28,597 | 88.5 | 1,620,000 | 0.7 | 3,000,000 | 198,759 | ||
| 5825 Shoreview Lane North | 1999/NAP | 6,510 | 100.0 | 1,300,000 | 0.5 | 2,400,000 | 153,777 | ||
| Fresenius Medical Care - Winfield, AL | 2008/NAP | 5,564 | 100.0 | 1,240,000 | 0.5 | 2,300,000 | 178,762 | ||
| Florida Medical Tampa Palms - Tampa, FL | 2006/NAP | 6,522 | 100.0 | 1,240,000 | 0.5 | 2,300,000 | 151,324 | ||
| Florida Medical Somerset - Tampa, FL | 2002/NAP | 6,027 | 100.0 | 1,190,000 | 0.5 | 2,200,000 | 139,984 | ||
| DaVita Bay Breeze Dialysis Center - Largo, FL | 1995/2012 | 7,247 | 100.0 | 1,080,000 | 0.5 | 2,000,000 | 130,422 | ||
| St. Peter’s - Troy, NY - 2 New Hampshire | 2000/NAP | 18,842 | 83.4 | 1,080,000 | 0.5 | 2,000,000 | 180,509 | ||
| Aurora Healthcare Center - Greenville, WI | 2005/NAP | 4,088 | 100.0 | 860,000 | 0.4 | 1,600,000 | 105,867 | ||
| 1586 State Street | 1956/NAP | 3,486 | 100.0 | 430,000 | 0.2 | 800,000 | 51,466 | ||
| Total/Wtd. Avg. | 1,247,943 | 96.5 | % | $240,000,000 | 100.0 | % | $455,000,000 | $29,146,326 | |
| (1) | Based on the underwritten rent roll dated as of May 24, 2023. |
| (2) | The Total Appraised Value reflects the “as portfolio” value which includes a portfolio premium to the Healthcare Trust MOB Portfolio Properties if sold together on a bulk basis. The sum of the “as-is” appraised values on a stand-alone basis would result in a Total Appraised Value of $444,475,000. |
| THE INFORMATION IN THIS STRUCTURAL AND COLLATERAL TERM SHEET IS NOT COMPLETE AND MAY BE AMENDED PRIOR TO THE TIME OF SALE. THIS TERM SHEET IS NOT AN OFFER TO SELL THESE SECURITIES AND IT IS NOT A SOLICITATION OF AN OFFER TO BUY THESE SECURITIES IN ANY JURISDICTION WHERE THE OFFER OR SALE IS NOT PERMITTED. | ||
| 12 | ||
| Structural and Collateral Term Sheet | BMO 2023-C6 | |
| No. 1 – Healthcare Trust MOB Portfolio | ||
Major Tenants.
St. Peter’s Health Partners (98,078 square feet; 7.9% of the NRA; 6.7% of underwritten base rent): St. Peter’s Health Partners includes St. Peter’s Health Partners Medical Associates, P.C., St. Peter’s Hospital of Albany, St. Peter’s Health Partners and SPHPMA (collectively, “St. Peter’s”). St. Peter’s is a healthcare system that runs hospitals in the Albany, New York area. St. Peter’s is the largest not-for-profit health care network in northeastern New York with more than 185 locations. St. Peter’s is a tenant at five of the Healthcare Trust MOB Portfolio Properties totaling 98,078 square feet, including the SPHP MOB, Albany, NY property, the St. Peter’s - Troy, NY - 2 New Hampshire property, the St. Peter’s - Albany, NY - 2 Palisades property, the St Peter’s - Albany, NY - 4 Palisades property and the St Peter’s - Albany, NY - 5 Palisades property. St. Peter’s provides a variety of services at these properties including cardiology, pulmonology, critical care and internal medicine. St. Peter’s has lease expiration dates spanning from October 2023 to July 2028 at the Healthcare Trust MOB Portfolio Properties. At the St Peter’s - Albany, NY - 4 Palisades property, St. Peter’s has the right to terminate its lease covering suite 100A, representing 857 square feet, upon delivery of written notice four months prior to December 31, 2023.
Pinnacle Health Hospitals (80,623 square feet; 6.5% of the NRA; 5.3% of underwritten base rent): Pinnacle Health Hospitals includes UPMC Pinnacle Lancaster and Pinnacle Health Hospitals (collectively, “Pinnacle”). Pinnacle is a health care group based primarily in the Northeast Philadelphia, Pennsylvania and Bucks County, Pennsylvania areas. Pinnacle has seven hospitals and over 160 outpatient clinics and ancillary facilities. Pinnacle is located at four of the Healthcare Trust MOB Portfolio Properties totaling 80,623 square feet, including the UPMC - Chambers Hill - Harrisburg, PA property, the UPMC - Fisher Road - Mechanicsburg, PA property, the UPMC - Sir Thomas Court - Harrisburg, PA property and the Lancaster Medical Arts MOB - Lancaster property. Pinnacle provides a variety of services at these properties, including chronic care, pediatric care, gynecology, skin care and mental health services. Pinnacle has lease expiration dates spanning from October 2027 through January 2032, with each lease containing various renewal options and no early termination options.
Belpre V Cancer Center (77,367 square feet; 6.2% of the NRA; 17.6% of underwritten base rent): Belpre V Cancer Center (“Belpre V”) is part of the Memorial Health System, which is a not-for-profit integrated health care provider in the Mid-Ohio Valley. Belpre V is the sole tenant at the Belpre V Cancer Center - Belpre, OH property. The Belpre V Cancer Center - Belpre, OH property is used as a cancer center, providing gastroenterology services, heart and vascular services, neuroscience services, pulmonary and respiratory services, a spine center and diagnostic services. Belpre V has a lease expiration date in February 2038, with three, five-year extension options and no early termination options.
Environmental. According to the Phase I environmental assessments dated between January 3, 2023, and April 14, 2023, there was no evidence of any recognized environmental conditions at the Healthcare Trust MOB Portfolio Properties, with the exception of the South Douglas MOB - Midwest City, OK property, at which the potential for petroleum contamination was identified based on the property’s historical use as an automobile sales facility from the early 1960s until the early 2000s. A Phase I environmental assessment also identified a controlled recognized environmental condition at the Belpre V Cancer Center - Belpre, OH property in connection with residual concentrations of petroleum-impacted soil associated with former underground storage tanks and fuel dispensers, for which a no further action letter was issued subject to certain restrictions. See “Description of the Mortgage Pool—Mortgage Pool Characteristics—Environmental Considerations” in the Preliminary Prospectus.
| THE INFORMATION IN THIS STRUCTURAL AND COLLATERAL TERM SHEET IS NOT COMPLETE AND MAY BE AMENDED PRIOR TO THE TIME OF SALE. THIS TERM SHEET IS NOT AN OFFER TO SELL THESE SECURITIES AND IT IS NOT A SOLICITATION OF AN OFFER TO BUY THESE SECURITIES IN ANY JURISDICTION WHERE THE OFFER OR SALE IS NOT PERMITTED. | ||
| 13 | ||
| Structural and Collateral Term Sheet | BMO 2023-C6 | |
| No. 1 – Healthcare Trust MOB Portfolio | ||
The following table presents certain information relating to the historical and current occupancy of the Healthcare Trust MOB Portfolio Properties:
| Historical and Current Occupancy(1) | |||
| 2020(2) | 2021(3) | 2022(4) | Current(5) |
| 96.2% | 97.0% | 96.9% | 96.5% |
| (1) | Historical occupancies represent the average portfolio occupancy of each year. |
| (2) | 2020 historical occupancy is based on 39 of the Healthcare Trust MOB Portfolio Properties as the other properties were subsequently acquired. |
| (3) | 2021 historical occupancy is based on 53 of the Healthcare Trust MOB Portfolio Properties as the other properties were subsequently acquired. |
| (4) | 2022 historical occupancy is based on 57 of the Healthcare Trust MOB Portfolio Properties as the other properties were subsequently acquired. |
| (5) | Current occupancy is as of May 24, 2023. |
The following table presents certain information relating to the largest tenants based on net rentable area at the Healthcare Trust MOB Portfolio Properties:
Top Tenant Summary(1) | ||||||||||
| Tenant | Ratings Moody’s/S&P/Fitch(2) | Number of Leases | Net Rentable Area (SF) | % of Total NRA | UW Base Rent PSF(3) | UW Base Rent(3) | % of Total Base Rent(3) | Lease Expiration Date | ||
| St. Peter’s | NR/NR/NR | 5 | 98,078 | 7.9 | % | $21.98 | $2,155,979 | 6.7 | % | Various(4) |
| Pinnacle | A2/NR/NR | 4 | 80,623 | 6.5 | $21.17 | 1,707,123 | 5.3 | Various(5) | ||
| Belpre V | NR/NR/NR | 1 | 77,367 | 6.2 | $73.21 | 5,664,109 | 17.6 | 2/28/2038 | ||
| Aurora Health Center | Aa3/NR/NR | 5 | 67,958 | 5.4 | $24.48 | 1,663,612 | 5.2 | 12/31/2032 | ||
| Willamette Orthopedic Group LLC | NR/NR/NR | 4 | 54,606 | 4.4 | $25.09 | 1,370,023 | 4.3 | 2/28/2035 | ||
| Prisma Health-Upstate | A3/NR/A- | 2 | 52,527 | 4.2 | $21.25 | 1,116,247 | 3.5 | Various(6) | ||
| Top Tenants | 21 | 431,159 | 34.5 | % | $31.72 | $13,677,093 | 42.5 | % | ||
| Remaining Tenants | 114 | 772,541 | 61.9 | % | $23.97 | $18,521,404 | 57.5 | % | ||
| Occupied Collateral Total / Wtd. Avg. | 135 | 1,203,700 | 96.5 | % | $26.75 | $32,198,497 | 100.0 | % | ||
| Vacant Space | NAP | 44,243 | 3.5 | % | ||||||
| Collateral Total | 135 | 1,247,943 | 100.0 | % | ||||||
| (1) | Based on the underwritten rent roll dated as of May 24, 2023. |
| (2) | In certain instances, ratings provided are for the parent company of the entity listed in the “Tenant” field whether or not the parent company guarantees the lease. |
| (3) | UW Base Rent PSF, UW Base Rent and % of Total Base Rent are inclusive of $414,557 of underwritten rent steps. |
| (4) | St. Peter’s leases 98,078 square feet across five properties: (i) 18,433 square feet with a lease expiration date of December 31, 2027, and 2,347 square feet with a lease expiration date of April 30, 2027, at the SPHP MOB, Albany, NY property; (ii) 27,840 square feet with a lease expiration date of July 31, 2028, at the St. Peter’s - Albany, NY - 2 Palisades property; (iii) 857 square feet with a lease expiration date of December 31, 2024, 880 square feet with a lease expiration date of March 31, 2025, and 9,229 square feet with a lease expiration date of April 30, 2025, at the St. Peter’s - Albany, NY - 4 Palisades property; (iv) 17,222 square feet with a lease expiration date of July 31, 2027, and 5,555 square feet with a lease expiration date of December 31, 2027, at the St. Peter’s - Albany, NY - 5 Palisades property; and (v) 15,715 square feet with a lease expiration date of October 31, 2023, at the St. Peter’s - Troy, NY - 2 New Hampshire property. |
| (5) | Pinnacle leases 80,623 square feet across four properties: (i) 30,623 square feet with a lease expiration date of August 31, 2031, at the Lancaster Medical Arts MOB - Lancaster property; (ii) 15,000 square feet with a lease expiration date of January 31, 2032, at the UPMC - Fisher Road - Mechanicsburg, PA property; (iii) 24,000 square feet with a lease expiration date of October 31, 2027, at the UPMC - Sir Thomas Court - Harrisburg, PA property; and (iv) 11,000 square feet with a lease expiration date of December 31, 2028, at the UPMC - Chambers Hill - Harrisburg, PA property. |
| (6) | Prisma Health-Upstate leases 52,527 square feet across two properties: (i) 21,603 square feet with a lease expiration date of September 30, 2033, at the Greenville Health System - Greenville, SC property and (ii) 30,924 square feet with a lease expiration date of June 30, 2028, at the Eastside Cancer Institute - Greenville, SC property. |
| THE INFORMATION IN THIS STRUCTURAL AND COLLATERAL TERM SHEET IS NOT COMPLETE AND MAY BE AMENDED PRIOR TO THE TIME OF SALE. THIS TERM SHEET IS NOT AN OFFER TO SELL THESE SECURITIES AND IT IS NOT A SOLICITATION OF AN OFFER TO BUY THESE SECURITIES IN ANY JURISDICTION WHERE THE OFFER OR SALE IS NOT PERMITTED. | ||
| 14 | ||
| Structural and Collateral Term Sheet | BMO 2023-C6 | |
| No. 1 – Healthcare Trust MOB Portfolio | ||
The following table presents certain information relating to the tenant lease expirations at the Healthcare Trust MOB Portfolio Properties:
| Lease Rollover Schedule(1) | ||||||||||||||
| Year | Number of Leases Expiring | Net Rentable Area Expiring | % of NRA Expiring | UW Base Rent Expiring(2) | % of UW Base Rent Expiring(2) | Cumulative Net Rentable Area Expiring | Cumulative % of NRA Expiring | Cumulative UW Base Rent Expiring(2) | Cumulative % of UW Base Rent Expiring(2) | |||||
| Vacant | NAP | 44,243 | 3.5 | % | NAP | NAP | 44,243 | 3.5% | NAP | NAP | ||||
| 2023 & MTM | 12 | 33,266 | 2.7 | $787,817 | 2.4 | % | 77,509 | 6.2% | $787,817 | 2.4% | ||||
| 2024 | 15 | 54,800 | 4.4 | 1,353,113 | 4.2 | 132,309 | 10.6% | $2,140,930 | 6.6% | |||||
| 2025 | 15 | 64,335 | 5.2 | 1,401,695 | 4.4 | 196,644 | 15.8% | $3,542,624 | 11.0% | |||||
| 2026 | 13 | 64,198 | 5.1 | 1,372,107 | 4.3 | 260,842 | 20.9% | $4,914,731 | 15.3% | |||||
| 2027 | 21 | 228,532 | 18.3 | 4,701,311 | 14.6 | 489,374 | 39.2% | $9,616,042 | 29.9% | |||||
| 2028 | 13 | 158,533 | 12.7 | 4,417,143 | 13.7 | 647,907 | 51.9% | $14,033,185 | 43.6% | |||||
| 2029 | 8 | 105,843 | 8.5 | 2,338,027 | 7.3 | 753,750 | 60.4% | $16,371,212 | 50.8% | |||||
| 2030 | 12 | 105,960 | 8.5 | 2,828,719 | 8.8 | 859,710 | 68.9% | $19,199,931 | 59.6% | |||||
| 2031 | 4 | 45,030 | 3.6 | 802,638 | 2.5 | 904,740 | 72.5% | $20,002,569 | 62.1% | |||||
| 2032 | 9 | 110,245 | 8.8 | 2,874,624 | 8.9 | 1,014,985 | 81.3% | $22,877,193 | 71.1% | |||||
| 2033 | 6 | 60,863 | 4.9 | 1,374,264 | 4.3 | 1,075,848 | 86.2% | $24,251,457 | 75.3% | |||||
| 2034 & Beyond | 7 | 172,095 | 13.8 | 7,947,040 | 24.7 | 1,247,943 | 100.0% | $32,198,497 | 100.0% | |||||
| Total | 135 | 1,247,943 | 100.0 | % | $32,198,497 | 100.0 | % | |||||||
| (1) | Based on the underwritten rent roll dated as of May 24, 2023. |
| (2) | UW Base Rent Expiring, % of UW Base Rent Expiring, Cumulative UW Base Rent Expiring and Cumulative % of UW Base Rent Expiring are inclusive of $414,557 of underwritten rent steps. |
The following table presents certain information relating to the operating history and underwritten cash flows of the Healthcare Trust MOB Portfolio Properties.
| Operating History and Underwritten Net Cash Flow(1)(2) | ||||||||
| 2020 | 2021 | 2022 | TTM(3) | Underwritten(3) | Per Square Foot | %(4) | ||
| Base Rent | $16,229,547 | $20,379,355 | $29,092,788 | $29,515,569 | $31,783,940 | $25.47 | 76.8 | % |
| Rent Steps(5) | 0 | 0 | 0 | 0 | 414,557 | 0.33 | 1.0 | |
| Straight-Line Rent | 0 | 0 | 0 | 0 | 441,050 | 0.35 | 1.1 | |
| Expense Reimbursements | 3,867,555 | 4,328,265 | 5,371,645 | 5,464,468 | 7,655,965 | 6.13 | 18.5 | |
| Vacant Income | 0 | 0 | 0 | 0 | 1,073,403 | 0.86 | 2.6 | |
| Gross Potential Rent | $20,097,102 | $24,707,619 | $34,464,433 | $34,980,037 | $41,368,915 | $33.15 | 100.0 | % |
| Miscellaneous Income | 5,003 | 55,850 | 80,943 | 80,008 | 64,617 | 0.05 | 0.2 | |
| (Vacancy/Credit Loss) | 0 | 0 | 0 | 0 | (2,068,446) | (1.66) | (5.0) | |
| Effective Gross Income | $20,102,104 | $24,763,470 | $34,545,376 | $35,060,045 | $39,365,086 | 31.54 | 95.2 | % |
| Total Expenses | $4,993,714 | $6,060,988 | $8,000,537 | $8,127,805 | $10,218,760 | $8.19 | 26.0 | % |
| Net Operating Income | $15,108,391 | $18,702,482 | $26,544,839 | $26,932,240 | $29,146,326 | $23.36 | 74.0 | % |
| Capital Expenditures | 0 | 0 | 0 | 0 | 478,107 | 0.38 | 1.2 | |
| TI/LC | 0 | 0 | 0 | 0 | 1,247,943 | 1.00 | 3.2 | |
| Net Cash Flow | $15,108,391 | $18,702,482 | $26,544,839 | $26,932,240 | $27,420,277 | $21.97 | 69.7 | % |
| (1) | Based on the underwritten rent roll dated as of May 24, 2023. |
| (2) | The increases in historical Net Operating Income are due to the borrowers acquiring the Healthcare Trust MOB Portfolio Properties on a rolling basis throughout these years. |
| (3) | TTM represents the trailing 12-month period ending March 31, 2023. The increase between TTM Net Operating Income and Underwritten Net Operating Income is due to the borrowers acquiring five of the Healthcare Trust MOB Portfolio Properties in 2023 prior to loan origination. |
| (4) | % column represents percent of Gross Potential Rent for all revenue lines and represents percent of Effective Gross Income for the remainder of fields. |
| (5) | Represents contractual rent steps through May 31, 2024. |
| THE INFORMATION IN THIS STRUCTURAL AND COLLATERAL TERM SHEET IS NOT COMPLETE AND MAY BE AMENDED PRIOR TO THE TIME OF SALE. THIS TERM SHEET IS NOT AN OFFER TO SELL THESE SECURITIES AND IT IS NOT A SOLICITATION OF AN OFFER TO BUY THESE SECURITIES IN ANY JURISDICTION WHERE THE OFFER OR SALE IS NOT PERMITTED. | ||
| 15 | ||
| Structural and Collateral Term Sheet | BMO 2023-C6 | |
| No. 1 – Healthcare Trust MOB Portfolio | ||
The Market. The Healthcare Trust MOB Portfolio Properties are geographically diverse with properties located in 19 different states. According to the appraisal, demand for medical office buildings (“MOB”) across the United States has experienced continued growth due to healthcare job growth, the aging population and medical office demand.
| Healthcare Trust MOB Portfolio Properties Market Summary(1) | ||||
| Property Name | Appraiser-Defined Market/Area(2) | MOB Market Occupancy | UW Rental Rate PSF(3) | Appraiser’s Concluded Market Rent |
| Belpre V Cancer Center - Belpre, OH | Marietta | NAV | $73.21 | $51.00 |
| Glendale MOB - Farmington Hills, MI | Detroit-Warren-Dearborn | 90.6% | $28.33 | $26.00 |
| 1600 State Street | Salem | 96.2% | $27.54 | $27.00 |
| Palm Valley Medical Plaza - Goodyear, AZ | Phoenix-Mesa-Scottsdale | 88.6% | $24.81 | $23.50 |
| Eastside Cancer Institute - Greenville, SC | Greenville-Anderson-Mauldin | 93.0% | $22.02 | $21.50 |
| Aurora Healthcare Center - Waterford, WI | Racine County | 88.9% | $24.48 | $22.50 |
| Beaumont Medical Center - Warren, MI | Detroit-Warren-Dearborn | 90.6% | $35.87 | $26.00 |
| Millennium Eye Care - Freehold, NJ | Monmouth County | 93.6% | $29.27 | $25.00 |
| 757 Franciscan Medical - Munster, IN | Chicago-Naperville-Elgin | 92.8% | $20.47 | $18.50 |
| Vascular Surgery Associates - Tallahassee, FL | Tallahassee | 97.0% | $28.71 | $28.00 |
| Decatur Medical Office Building - Decatur, GA | Atlanta-Sandy Springs-Roswell | 90.7% | $28.19 | $27.50 |
| Aurora Healthcare Center - Wautoma, WI | Waushara County | 96.0% | $24.48 | $23.00 |
| Greenfield Medical Plaza - Gilbert, AZ | Phoenix-Mesa-Scottsdale | 88.6% | $24.45 | $25.00 |
| Swedish American MOB - Roscoe, IL | Rockford | 92.8% | $26.00 | $25.08 |
| West Michigan Surgery Center - Big Rapids, MI | Big Rapids | 94.5% | $28.09 | $27.00 |
| UPMC - Sir Thomas Court - Harrisburg, PA | Harrisburg-Carlisle | 92.9% | $19.28 | $19.00 |
| Eastern Carolina ENT - Greenville, NC | Greenville | 94.6% | $23.46 | $23.00 |
| Lancaster Medical Arts MOB - Lancaster | Lancaster | 96.7% | $14.44 | $14.00 |
| UPMC - Fisher Road - Mechanicsburg, PA | Harrisburg-Carlisle | 92.9% | $28.01 | $27.50 |
| Pensacola Nephrology MOB - Pensacola, FL | Pensacola-Ferry Pass-Brent | 95.0% | $25.96 | $26.00 |
| Kingwood Executive Center - Kingwood, TX | Houston-The Woodlands-Sugar Land | 87.9% | $20.14 | $22.00 |
| Lee Memorial Health System - Fort Myers, FL | Cape Coral-Fort Myers | 95.1% | $18.04 | $18.00 |
| Greenville Health System - Greenville, SC | Greenville-Anderson-Mauldin | 93.0% | $20.15 | $20.00 |
| UPMC - Chambers Hill - Harrisburg, PA | Harrisburg-Carlisle | 92.9% | $34.72 | $31.50 |
| Rockwall Medical Plaza - Rockwall, TX | Dallas-Fort Worth-Arlington | 90.1% | $26.55 | $26.00 |
| Pioneer Spine Sports - West Springfield | Springfield | 95.0% | $29.28 | $28.00 |
| Women’s Healthcare Group MOB - York, PA | York-Hanover | 95.8% | $17.32 | $17.00 |
| OrthoOne Hilliard - Hilliard, OH | Columbus | 92.3% | $19.30 | $16.56 |
| Metropolitan Eye Lakeshore Surgery - St. Clair Shores, MI | Detroit-Warren-Dearborn | 90.6% | $21.85 | $24.00 |
| St Peter’s - Albany, NY - 5 Palisades | Albany County | 93.9% | $21.68 | $23.50 |
| Crittenton MOB - Washington Township, MI | Detroit-Warren-Dearborn | 90.6% | $23.03 | $24.00 |
| Surgery Center of Temple - Temple, TX | Killeen-Temple | 97.0% | $33.00 | $33.00 |
| RAI Care Center-Clearwater, FL | Tampa-St. Petersburg-Clearwater | 93.8% | $26.74 | $28.71 |
| Medical Center V - Peoria, AZ | Arrowhead | 88.8% | $25.69 | $25.00 |
| MetroHealth Buckeye Health - Cleveland, OH | Cleveland-Elyria | 93.9% | $13.00 | $15.00 |
| South Douglas MOB - Midwest City, OK | Oklahoma City | NAV | $18.54 | $20.00 |
| Crittenton MOB - Sterling Heights, MI | Detroit-Warren-Dearborn | 90.6% | $26.60 | $24.00 |
| SPHP MOB, Albany, NY | Albany | 93.9% | $17.70 | $21.00 |
| Atlanta Gastroenterology Associates - Lawrenceville, GA | Atlanta-Sandy Springs-Roswell | 90.7% | $32.96 | $32.00 |
| Bone and Joint Specialists - Merrillville, IN | Chicago-Naperville-Elgin | 92.8% | $22.66 | $24.00 |
| St. Peter’s - Albany, NY - 2 Palisades | Albany County | 93.9% | $24.39 | $23.50 |
| 1550 State Street | Salem | 96.2% | $22.44 | $22.00 |
| THE INFORMATION IN THIS STRUCTURAL AND COLLATERAL TERM SHEET IS NOT COMPLETE AND MAY BE AMENDED PRIOR TO THE TIME OF SALE. THIS TERM SHEET IS NOT AN OFFER TO SELL THESE SECURITIES AND IT IS NOT A SOLICITATION OF AN OFFER TO BUY THESE SECURITIES IN ANY JURISDICTION WHERE THE OFFER OR SALE IS NOT PERMITTED. | ||
| 16 | ||
| Structural and Collateral Term Sheet | BMO 2023-C6 | |
| No. 1 – Healthcare Trust MOB Portfolio | ||
| Property Name | Appraiser-Defined Market/Area(2) | MOB Market Occupancy | UW Rental Rate PSF(3) | Appraiser’s Concluded Market Rent |
| St Lukes Heart Vascular Center - East Stroudsburg | East Stroudsburg | 93.7% | $19.69 | $20.00 |
| Naidu Clinic - Odessa, TX | Midland-Odessa | 94.5% | $20.21 | $19.50 |
| Aurora Healthcare Center - Kiel, WI | Manitowoc County | 88.7% | $24.48 | $22.50 |
| Florida Medical Heartcare - Tampa, FL | Tampa-St. Petersburg-Clearwater | 93.8% | $23.06 | $22.52 |
| Florida Medical Wesley Chapel - Tampa, FL | Tampa-St. Petersburg-Clearwater | 93.8% | $23.06 | $22.52 |
| Aurora Healthcare Center - Green Bay, WI | Brown County | 92.8% | $24.48 | $23.00 |
| Center for Advanced Dermatology - Lakewood, CO | Denver-Aurora-Lakewood | 91.3% | $30.17 | $30.00 |
| Pioneer Spine Sports - Springfield | Springfield | 95.0% | $24.42 | $24.00 |
| Pioneer Spine Sports - Northampton | Springfield | 95.0% | $17.77 | $25.00 |
| DaVita Dialysis - Hudson, FL | Tampa-St. Petersburg-Clearwater | 93.8% | $25.86 | $26.00 |
| Florida Medical Clinic - Tampa, FL | Tampa-St. Petersburg-Clearwater | 93.8% | $21.82 | $21.40 |
| St Peter’s - Albany, NY - 4 Palisades | Albany | 93.9% | $18.08 | $23.50 |
| 5825 Shoreview Lane North | Salem | 96.2% | $24.48 | $24.00 |
| Fresenius Medical Care - Winfield, AL | Birmingham | 91.0% | $31.42 | $26.75 |
| Florida Medical Tampa Palms - Tampa, FL | Tampa-St. Petersburg-Clearwater | 93.8% | $23.06 | $22.52 |
| Florida Medical Somerset - Tampa, FL | Tampa-St. Petersburg-Clearwater | 93.8% | $23.06 | $22.52 |
| DaVita Bay Breeze Dialysis Center - Largo, FL | Tampa-St. Petersburg-Clearwater | 93.8% | $18.65 | $18.00 |
| St. Peter’s - Troy, NY - 2 New Hampshire | Albany | 93.9% | $26.26 | $23.84 |
| Aurora Healthcare Center - Greenville, WI | Outagamie County | 91.6% | $24.48 | $22.75 |
| 1586 State Street | Salem | 96.2% | $15.30 | $15.00 |
| (1) | Source: Appraisals. |
| (2) | Appraiser data was based on the medical office market for each property if available. If unavailable, the appraiser data was based on the surrounding area. Some medical office market or area data was unavailable. |
| (3) | UW Rental Rate PSF is based on the underwritten rent roll dated as of May 24, 2023. |
The Borrowers. The borrowers are 59 Delaware limited liability companies and special purpose entities that are subsidiaries of Healthcare Trust Operating Partnership, L.P., a Delaware limited partnership. See the footnotes to Annex A-1 for the names of each entity. Each borrower has two independent directors. Legal counsel to the borrowers delivered a non-consolidation opinion in connection with the origination of the Healthcare Trust MOB Portfolio Whole Loan.
The Borrower Sponsor. The borrower sponsor and non-recourse carve-out guarantor is Healthcare Trust Operating Partnership, L.P. Healthcare Trust Operating Partnership, L.P. is a subsidiary of Healthcare Trust, Inc., a publicly registered real estate investment trust that is externally managed by AR Global Investments, LLC. Healthcare Trust, Inc. is focused on acquiring a diversified portfolio of healthcare real estate, with an emphasis on senior housing real estate and medical office buildings located in the United States. As of year-end 2022, Healthcare Trust, Inc. owned 202 properties, totaling approximately 9.1 million square feet across 34 states.
Property Management. The Healthcare Trust MOB Portfolio Properties are managed by Healthcare Trust Properties, LLC, an affiliate of the borrower sponsor, and by Hiffman Asset Management LLC and Plaza Del Rio Management Corp., each a third-party property management company.
Escrows and Reserves. At origination, the borrowers deposited into escrow $289,100 for deferred maintenance, $4,760,872 for outstanding tenant improvements and leasing commissions, $269,376 for unfunded obligations of free rent, approximately $643,802 for real estate taxes and approximately $6,283 for insurance premiums.
Tax Escrows – On a monthly basis, the borrowers are required to escrow approximately $321,901 for real estate taxes. The borrowers are not required to make monthly tax deposits for an individual property if (i) no event of default has occurred and is continuing, (ii) the applicable property is leased to a single tenant and that tenant is paying any taxes directly with satisfactory evidence given to the lender, (iii) no Cash Sweep Period (as defined below) is in effect and (iv) the applicable lease is in full force and effect and there is no event of default under the lease.
Insurance Escrows – On a monthly basis, the borrowers are required to escrow approximately $1,257 for insurance premiums. The borrowers are not required to pay monthly insurance premiums if they obtain a blanket policy satisfactory to the lender or, in regard to an individual property, if (i) no event of default has occurred and is continuing, (ii) the applicable property is leased to a single tenant and that tenant is paying any insurance premiums directly with satisfactory evidence
| THE INFORMATION IN THIS STRUCTURAL AND COLLATERAL TERM SHEET IS NOT COMPLETE AND MAY BE AMENDED PRIOR TO THE TIME OF SALE. THIS TERM SHEET IS NOT AN OFFER TO SELL THESE SECURITIES AND IT IS NOT A SOLICITATION OF AN OFFER TO BUY THESE SECURITIES IN ANY JURISDICTION WHERE THE OFFER OR SALE IS NOT PERMITTED. | ||
| 17 | ||
| Structural and Collateral Term Sheet | BMO 2023-C6 | |
| No. 1 – Healthcare Trust MOB Portfolio | ||
given to the lender, (iii) no Cash Sweep Period is in effect and (iv) the applicable lease is in full force and effect and there is no event of default under the lease.
Replacement Reserve – During a Cash Sweep Period, the borrowers are required to escrow 1/12th of the product obtained by multiplying $0.20 by the aggregate square footage of the Healthcare Trust MOB Portfolio Properties (initially equal to approximately $20,799 per month).
TI/LC Reserve – During a Cash Sweep Period, the borrowers are required to escrow 1/12th of the product obtained by multiplying $1.50 by the aggregate square footage of the Healthcare Trust MOB Portfolio Properties (initially equal to approximately $155,993 per month).
A “Cash Sweep Period” will commence upon a Cash Sweep Event (as defined below).
Lockbox / Cash Management. The Healthcare Trust MOB Portfolio Whole Loan is structured with a hard lockbox and springing cash management. The borrowers were required to establish a lockbox account and deliver letters to the tenants at the Healthcare Trust MOB Portfolio Properties directing them to pay all rents directly into a lender-controlled lockbox account. Additionally, all revenues and other monies received by the borrowers or related property manager are required to be deposited into the lockbox account within one business day after receipt. During the occurrence and continuance of a Cash Sweep Event, all funds are required to be swept each business day into the cash management account controlled by the lender and disbursed on each payment date in accordance with the Healthcare Trust MOB Portfolio Whole Loan documents, with all excess cash flow to be held as additional security for the Healthcare Trust MOB Portfolio Whole Loan.
A “Cash Sweep Event” will commence upon any of the following: (i) an event of default under the Healthcare Trust MOB Portfolio Whole Loan documents has occurred and is continuing; (ii) the debt yield being less than 9.5% for two consecutive calendar quarters; or (iii) a Belpre V Trigger Event (as defined below). A Cash Sweep Event will end upon, with respect to clause (i), the end of such event of default, with respect to clause (ii) above, an occurrence of a Debt Yield Cure (as defined below), or with respect to clause (iii) above, a Belpre V Trigger Event Cure (as defined below).
A “Debt Yield Cure” will occur upon the debt yield being greater than or equal to 9.5% for two consecutive calendar quarters based on the trailing 12-month period preceding the date of determination. The borrowers have the option to cure the debt yield event by (i) making a partial prepayment in the amount that results in a reduction of the then-outstanding principal balance of the Healthcare Trust MOB Portfolio Whole Loan sufficient to achieve a debt yield of at least 9.5% or (ii) obtaining a letter of credit in the amount equal to the excess cash flow that would have been swept in the three-month period immediately preceding the applicable determination date as acceptable to the lender. Each letter of credit will be effective for a three-month period, upon expiration of which the borrowers can submit subsequent letter(s) of credit if the debt yield remains less than 9.5%.
A “Belpre V Trigger Event” will commence upon any of the following: (i) Belpre V giving notice of its intent to terminate its lease; (ii) Belpre V going dark; (iii) Belpre V or its parent company filing for bankruptcy or insolvency; or (iv) Belpre V defaulting under the terms of its lease. A Cash Sweep Event due to a Belpre V Trigger Event will not commence if a Belpre V Reserve Funds Cap Cure (as defined below) occurs within five business days of such Belpre V Trigger Event.
A “Belpre V Trigger Event Cure” will occur, with respect to clause (i), (a) Belpre V rescinding its termination notice or (b) satisfaction of the Belpre V Replacement Lease Criteria (as defined below); with respect to clause (ii), (a) Belpre V resuming occupancy of the premises and delivery of an estoppel that the lease is in full force and effect or (b) the satisfaction of the Belpre V Replacement Lease Criteria; with respect to clause (iii), (a) Belpre V or its parent no longer being in bankruptcy or insolvency proceedings and the Belpre V lease or its guaranty (as applicable) has been affirmed, is unmodified and is in full force and effect or (b) satisfaction of the Belpre V Replacement Lease Criteria; and with respect to clause (iv), (a) the borrowers providing evidence satisfactory to the lender that the event of default is cured or (b) satisfaction of the Belpre V Replacement Lease Criteria.
The “Belpre V Replacement Lease Criteria” will occur upon the following: (i) the borrowers have entered into one or more Belpre V replacement leases; (ii) each Belpre V Replacement Tenant (as defined below) being in occupancy of the space covered by the replacement lease; (iii) the borrowers providing (a) a copy of each executed Belpre V applicable replacement lease and updated tenant estoppels, (b) a subordination, non-disturbance and attornment agreement if requested by the lender, (c) satisfactory evidence that the borrowers have paid for and performed all tenant improvements related to such Belpre V Replacement Tenant, and (d) an updated rent roll.
| THE INFORMATION IN THIS STRUCTURAL AND COLLATERAL TERM SHEET IS NOT COMPLETE AND MAY BE AMENDED PRIOR TO THE TIME OF SALE. THIS TERM SHEET IS NOT AN OFFER TO SELL THESE SECURITIES AND IT IS NOT A SOLICITATION OF AN OFFER TO BUY THESE SECURITIES IN ANY JURISDICTION WHERE THE OFFER OR SALE IS NOT PERMITTED. | ||
| 18 | ||
| Structural and Collateral Term Sheet | BMO 2023-C6 | |
| No. 1 – Healthcare Trust MOB Portfolio | ||
A “Belpre V Replacement Tenant” means a new tenant or tenants reasonably approved by the lender and leasing all or part of the Belpre V premises.
A “Belpre V Reserve Funds Cap Cure” means that (i) the borrowers have deposited $10,750,000 in cash or in a letter of credit with the lender, less, if applicable, the Belpre V replacement rent amount or (ii) during the applicable Cash Sweep Event, the amount on deposit in the excess cash flow reserve account exceeds $10,750,000.
Subordinate Debt. None.
Mezzanine Debt. None.
Partial Release. On any payment date following (a) the payment date in June 2024 (with the payment of a yield maintenance premium) or (b) the earlier of two years following the last note to be securitized or May 24, 2026 (with either a partial defeasance or payment of a yield maintenance premium), the borrowers may release any of the Healthcare Trust MOB Portfolio Properties with 15 days’ notice if the following conditions are met: (i) no event of default has occurred and is continuing; (ii) the borrowers pay all costs and provide customary documentation as described in the Healthcare Trust MOB Portfolio Whole Loan documents; (iii) after such release and defeasance, the debt service coverage ratio for the remaining properties is no less than the greater of (1) the debt service coverage ratio immediately preceding such release and (2) 1.69x; (iv) after such release or defeasance, the net operating income debt yield for all remaining properties being no less than the greater of (1) the net operating income debt yield immediately preceding such release and (2) 11.94%; (v) satisfaction of customary REMIC requirements; (vi) payment of the release amount of 115.0% of the allocated loan amount for the release property and (vii) other conditions as set forth in the Healthcare Trust MOB Portfolio Whole Loan documents.
Ground Leases. The Healthcare Trust MOB Portfolio Mortgage Loan is secured by the borrowers’ fee interests in the Healthcare Trust MOB Portfolio Properties and by the borrowers’ leasehold interests in certain parcels at each of the Greenville Health System - Greenville, SC property and the Decatur Medical Office Building - Decatur, GA property pursuant to ground leases of space used for additional parking. The ground lease at the Greenville Health System - Greenville, SC property expires in September 2024, automatically extends to September 2026 and will be subsequently extended automatically by additional two-year terms so long as neither party to the lease provides written notice of its intent not to renew at least 180 days prior to the expiration of the then-current term. The current ground rent is approximately $5,069 per month with 3.0% annual increases. The parking at the Greenville Health System - Greenville, SC property is considered legal non-conforming without the ground lease spaces. The ground lease at the Decatur Medical Office Building - Decatur, GA property expires in November 2032 and is subject to one, ten-year extension. The current ground rent is approximately $3,272 per month with 3.0% annual increases. The parking at the Decatur Medical Office Building - Decatur, GA property is considered legal conforming without the ground lease spaces, and the borrower is not required to provide the tenant with the additional parking spaces granted through the ground lease.
| THE INFORMATION IN THIS STRUCTURAL AND COLLATERAL TERM SHEET IS NOT COMPLETE AND MAY BE AMENDED PRIOR TO THE TIME OF SALE. THIS TERM SHEET IS NOT AN OFFER TO SELL THESE SECURITIES AND IT IS NOT A SOLICITATION OF AN OFFER TO BUY THESE SECURITIES IN ANY JURISDICTION WHERE THE OFFER OR SALE IS NOT PERMITTED. | ||
| 19 | ||
| Structural and Collateral Term Sheet | BMO 2023-C6 | |
| No. 2 – Skorpios Industrial | ||

| THE INFORMATION IN THIS STRUCTURAL AND COLLATERAL TERM SHEET IS NOT COMPLETE AND MAY BE AMENDED PRIOR TO THE TIME OF SALE. THIS TERM SHEET IS NOT AN OFFER TO SELL THESE SECURITIES AND IT IS NOT A SOLICITATION OF AN OFFER TO BUY THESE SECURITIES IN ANY JURISDICTION WHERE THE OFFER OR SALE IS NOT PERMITTED. | ||
| 20 | ||
| Structural and Collateral Term Sheet | BMO 2023-C6 | |
| No. 2 – Skorpios Industrial | ||

| THE INFORMATION IN THIS STRUCTURAL AND COLLATERAL TERM SHEET IS NOT COMPLETE AND MAY BE AMENDED PRIOR TO THE TIME OF SALE. THIS TERM SHEET IS NOT AN OFFER TO SELL THESE SECURITIES AND IT IS NOT A SOLICITATION OF AN OFFER TO BUY THESE SECURITIES IN ANY JURISDICTION WHERE THE OFFER OR SALE IS NOT PERMITTED. | ||
| 21 | ||
| Structural and Collateral Term Sheet | BMO 2023-C6 | |
| No. 2 – Skorpios Industrial | ||
| Mortgage Loan Information | Property Information | |||
| Mortgage Loan Seller: | KeyBank, AREF2 | Single Asset / Portfolio: | Single Asset | |
| Original Principal Balance(1): | $60,000,000 | Title: | Fee | |
| Cut-off Date Principal Balance(1): | $60,000,000 | Property Type – Subtype: | Industrial – Manufacturing | |
| % of IPB: | 9.9% | Net Rentable Area (SF): | 450,000 | |
| Loan Purpose: | Acquisition | Location: | Temecula, CA | |
| Borrower: | NexPoint Life Sciences III DST | Year Built / Renovated: | 1987 / NAP | |
| Borrower Sponsor: | NexPoint Real Estate Advisors, L.P. | Occupancy: | 100.0% | |
| Interest Rate: | 6.63500% | Occupancy Date: | 8/1/2023 | |
| Note Date: | 8/1/2023 | 4th Most Recent NOI (As of)(4): | NAV | |
| Maturity Date: | 8/1/2033 | 3rd Most Recent NOI (As of)(4): | NAV | |
| Interest-only Period: | 120 months | 2nd Most Recent NOI (As of)(4): | NAV | |
| Original Term: | 120 months | Most Recent NOI (As of)(4): | NAV | |
| Original Amortization Term: | None | UW Economic Occupancy: | 95.0% | |
| Amortization Type: | Interest Only | UW Revenues: | $16,622,222 | |
| Call Protection(2): | L(24),D(93),O(3) | UW Expenses: | $4,892,451 | |
| Lockbox / Cash Management: | Hard / In Place | UW NOI: | $11,729,772 | |
| Additional Debt(1): | Yes | UW NCF: | $9,858,772 | |
| Additional Debt Balance(1): | $15,000,000 | Appraised Value / Per SF: | $180,000,000 / $400 | |
| Additional Debt Type(1): | Pari Passu | Appraisal Date: | 6/28/2023 | |
| Escrows and Reserves(3) | Financial Information(1) | |||||
| Initial | Monthly | Initial Cap | Cut-off Date Loan / SF: | $167 | ||
| Taxes: | $0 | Springing | N/A | Maturity Date Loan / SF: | $167 | |
| Insurance: | $0 | Springing | N/A | Cut-off Date LTV: | 41.7% | |
| Replacement Reserve: | $250,000 | Springing | $250,000 | Maturity Date LTV: | 41.7% | |
| TI/LC Reserve: | $3,000,000 | Springing | N/A | UW NCF DSCR: | 1.95x | |
| Other: | $1,019,792 | Springing | N/A | UW NOI Debt Yield: | 15.6% | |
| Sources and Uses | ||||||||
| Sources | Proceeds | % of Total | Uses | Proceeds | % of Total | |||
| Whole Loan | $75,000,000 | 37.2 | % | Purchase Price | $190,000,000 | 94.2 | % | |
| Borrower Sponsor Equity | 126,761,552 | 62.8 | Closing Costs(5) | 7,491,760 | 3.7 | |||
| Reserves | 4,269,792 | 2.1 | ||||||
| Total Sources | $201,761,552 | 100.0 | % | Total Uses | $201,761,552 | 100.0 | % | |
| (1) | The Skorpios Industrial Mortgage Loan (as defined below) is part of a whole loan evidenced by four pari passu notes with an aggregate original principal balance of $75,000,000. Financial Information in the chart above reflects the Cut-off Date Balance and Maturity Date Balance of the Skorpios Industrial Whole Loan (as defined below). For additional information, see “The Loan” below. |
| (2) | The lockout period will be at least 24 payments beginning with and including the first payment date of September 1, 2023. Defeasance of the Skorpios Industrial Whole Loan in whole is permitted after the date that is two years from the closing date of the securitization that includes the last note to be securitized. The assumed lockout period of 24 payments is based on the closing date of the BMO 2023-C6 securitization trust in August 2023. The actual lockout period may be longer. |
| (3) | For a full description of escrows and reserves, please refer to “Escrows and Reserves” below. |
| (4) | Historical financial information is not available due to the acquisition of the Skorpios Industrial Property (as defined below) at origination of the Skorpios Industrial Whole Loan. |
| (5) | Closing Costs include an interest rate buydown of $1,500,000. |
The Loan. The second largest mortgage loan (the “Skorpios Industrial Mortgage Loan”) is part of a whole loan (the “Skorpios Industrial Whole Loan”) that is evidenced by four pari passu promissory notes in the aggregate original principal amount of $75,000,000. The Skorpios Industrial Whole Loan is secured by a first lien mortgage on the borrower’s fee simple interest in a 450,000 square foot industrial manufacturing property located in Temecula, California (the “Skorpios Industrial Property”). The Skorpios Industrial Whole Loan was co-originated on August 1, 2023, by KeyBank National Association (“KeyBank”) and Argentic Real Estate Finance 2 LLC (“AREF2”). The Skorpios Industrial Mortgage Loan is evidenced by the controlling Note A-1 and the non-controlling Note A-3 with an aggregate outstanding principal balance as of the Cut-off Date of $60,000,000. The remaining notes are currently held by KeyBank and AREF2 and are expected to be contributed to one or more future securitization trust(s). The Skorpios Industrial Whole Loan will be serviced pursuant to the BMO 2023-
| THE INFORMATION IN THIS STRUCTURAL AND COLLATERAL TERM SHEET IS NOT COMPLETE AND MAY BE AMENDED PRIOR TO THE TIME OF SALE. THIS TERM SHEET IS NOT AN OFFER TO SELL THESE SECURITIES AND IT IS NOT A SOLICITATION OF AN OFFER TO BUY THESE SECURITIES IN ANY JURISDICTION WHERE THE OFFER OR SALE IS NOT PERMITTED. | ||
| 22 | ||
| Structural and Collateral Term Sheet | BMO 2023-C6 | |
| No. 2 – Skorpios Industrial | ||
C6 pooling and servicing agreement. The Skorpios Industrial Whole Loan has a 10-year interest only term and accrues interest at a rate of 6.63500% per annum.
| Whole Loan Summary | |||||
| Note | Original Balance | Cut-off Date Balance | Note Holder | Controlling Piece | |
| A-1 | $40,000,000 | $40,000,000 | BMO 2023-C6 | Yes | |
| A-2 | $10,000,000 | $10,000,000 | KeyBank | No | |
| A-3 | $20,000,000 | $20,000,000 | BMO 2023-C6 | No | |
| A-4 | $5,000,000 | $5,000,000 | AREF2 | No | |
| Whole Loan | $75,000,000 | $75,000,000 | |||
The Property. The Skorpios Industrial Property is a single-tenant industrial manufacturing facility comprised of one, 450,000 square foot, three-story building located on 28.77 acres in Temecula, California. Built in 1987, the improvements are 100.0% occupied by Skorpios Technologies, Inc. (“Skorpios”), which utilizes the building as a semiconductor and chip manufacturing facility. The Skorpios Industrial Property contains four grade-level loading doors, two dock high loading doors, and 24-foot warehouse ceiling heights. Parking is provided by 375 surface parking spaces, which results in a parking ratio of approximately 0.83 spaces per 1,000 square feet. The interior of the building includes fabrication and lab space totaling 88,580 square feet (19.7% of NRA), of which there is approximately 51,000 square feet of Class 100 clean room area across two fabrication spaces. In addition, the Skorpios Industrial Property includes 246,398 square feet (54.8% of NRA) of support space that houses infrastructure to support the fabrication and lab facilities, 18.1% office buildout, 4.5% warehouse/shipping space and a central utility plant representing approximately 2.9% of the NRA.
The Skorpios Industrial Property was acquired by affiliates of CMP Management, LLC in April 2023, coinciding with the commencement of the Skorpios lease on April 10, 2023. On August 1, 2023, the membership interests in the owner of the Skorpios Industrial Property were transferred to the borrower sponsor for a total consideration of $190,000,000, resulting in a loan-to-purchase price ratio of 39.5%.
Sole Tenant. Skorpios Technologies, Inc. (450,000 square feet; 100.0% NRA; 100.0% of underwritten base rent): Based in Albuquerque, New Mexico, Skorpios is a vertically integrated semiconductor and chip developer and manufacturer that has developed differentiated technology in support of the opto-electronic communications ecosystem. Skorpios delivers specialized optical modules and subsystems based upon its proprietary and patented, wafer-scale, heterogeneous integration process known as Tru-SiPhTM. Skorpios’ platform can be used to address a wide range of applications including high speed video, data and voice communications for networking, cloud computing, consumer, and medical. The Skorpios Industrial Property is the sole manufacturing facility for Skorpios and the clean room capabilities that the Skorpios Industrial Property possesses are of limited availability in the market. Skorpios leases 100.0% of the net rentable area via a lease that commenced April 10, 2023, and expires September 10, 2038, with one, 10-year extension option and one, nine-year and six-month extension option. The lease contains no early termination options.
Environmental. According to the Phase I environmental assessment dated July 31, 2023, there was no evidence of any recognized environmental conditions at the Skorpios Industrial Property.
The following table presents certain information relating to the historical and current occupancy of the Skorpios Industrial Property:
| Historical and Current Occupancy | |||
| 2020(1) | 2021(1) | 2022(1) | Current(2) |
| NAV | NAV | NAV | 100.0% |
| (1) | Historical occupancies are not available due to the acquisition of the Skorpios Industrial Property at origination of the Skorpios Industrial Whole Loan. |
| (2) | Current occupancy is based on the underwritten rent roll dated as of August 1, 2023. |
| THE INFORMATION IN THIS STRUCTURAL AND COLLATERAL TERM SHEET IS NOT COMPLETE AND MAY BE AMENDED PRIOR TO THE TIME OF SALE. THIS TERM SHEET IS NOT AN OFFER TO SELL THESE SECURITIES AND IT IS NOT A SOLICITATION OF AN OFFER TO BUY THESE SECURITIES IN ANY JURISDICTION WHERE THE OFFER OR SALE IS NOT PERMITTED. | ||
| 23 | ||
| Structural and Collateral Term Sheet | BMO 2023-C6 | |
| No. 2 – Skorpios Industrial | ||
The following table presents certain information relating to the sole tenant at the Skorpios Industrial Property:
| Top Tenant Summary(1) | ||||||||
| Tenant | Ratings Moody’s/S&P/Fitch | Net Rentable Area (SF) | % of Total NRA | UW Base Rent PSF(2) | UW Base Rent(2) | % of Total UW Base Rent(2) | Lease Exp. Date | |
| Skorpios | NR/NR/NR | 450,000 | 100.0% | $28.01 | $12,604,625 | 100.0% | 9/10/2038(3) | |
| Occupied Collateral Total / Wtd. Avg. | 450,000 | 100.0% | $28.01 | $12,604,625 | 100.0% | |||
| Vacant Space | 0 | 0.0% | ||||||
| Collateral Total | 450,000 | 100.0% | ||||||
| (1) | Based on underwritten rent roll dated as of August 1, 2023. |
| (2) | UW Base Rent PSF, UW Base Rent and % of Total UW Base Rent include contractual rent steps per the tenant’s lease term through March 2024 totaling $367,125. |
| (3) | Skorpios has one, 10-year extension option and one, nine-year and six-month extension option. |
The following table presents certain information relating to the tenant lease expirations at the Skorpios Industrial Property:
| Lease Rollover Schedule(1) | |||||||||||||
| Year | Number of Leases Expiring | Net Rentable Area Expiring | % of NRA Expiring | UW Base Rent Expiring(2) | % of UW Base Rent Expiring(2) | Cumulative Net Rentable Area Expiring | Cumulative % of NRA Expiring | Cumulative UW Base Rent Expiring(2) | Cumulative % of UW Base Rent Expiring(2) | ||||
| Vacant | NAP | 0 | 0.0 | % | NAP | NAP | 0 | 0.0% | NAP | NAP | |||
| 2023 & MTM | 0 | 0 | 0.0 | $0 | 0.0 | % | 0 | 0.0% | $0 | 0.0% | |||
| 2024 | 0 | 0 | 0.0 | 0 | 0.0 | 0 | 0.0% | $0 | 0.0% | ||||
| 2025 | 0 | 0 | 0.0 | 0 | 0.0 | 0 | 0.0% | $0 | 0.0% | ||||
| 2026 | 0 | 0 | 0.0 | 0 | 0.0 | 0 | 0.0% | $0 | 0.0% | ||||
| 2027 | 0 | 0 | 0.0 | 0 | 0.0 | 0 | 0.0% | $0 | 0.0% | ||||
| 2028 | 0 | 0 | 0.0 | 0 | 0.0 | 0 | 0.0% | $0 | 0.0% | ||||
| 2029 | 0 | 0 | 0.0 | 0 | 0.0 | 0 | 0.0% | $0 | 0.0% | ||||
| 2030 | 0 | 0 | 0.0 | 0 | 0.0 | 0 | 0.0% | $0 | 0.0% | ||||
| 2031 | 0 | 0 | 0.0 | 0 | 0.0 | 0 | 0.0% | $0 | 0.0% | ||||
| 2032 | 0 | 0 | 0.0 | 0 | 0.0 | 0 | 0.0% | $0 | 0.0% | ||||
| 2033 | 0 | 0 | 0.0 | 0 | 0.0 | 0 | 0.0% | $0 | 0.0% | ||||
| 2034 & Beyond | 1 | 450,000 | 100.0 | 12,604,625 | 100.0 | 450,000 | 100.0% | $12,604,625 | 100.0% | ||||
| Total | 1 | 450,000 | 100.0 | % | $12,604,625 | 100.0 | % | ||||||
| (1) | Based on underwritten rent roll dated as of August 1, 2023. |
| (2) | UW Base Rent Expiring, % of UW Base Rent Expiring, Cumulative UW Base Rent Expiring and Cumulative % of UW Base Rent Expiring include contractual rent steps per the tenant’s lease through March 2024 totaling $367,125. |
| THE INFORMATION IN THIS STRUCTURAL AND COLLATERAL TERM SHEET IS NOT COMPLETE AND MAY BE AMENDED PRIOR TO THE TIME OF SALE. THIS TERM SHEET IS NOT AN OFFER TO SELL THESE SECURITIES AND IT IS NOT A SOLICITATION OF AN OFFER TO BUY THESE SECURITIES IN ANY JURISDICTION WHERE THE OFFER OR SALE IS NOT PERMITTED. | ||
| 24 | ||
| Structural and Collateral Term Sheet | BMO 2023-C6 | |
| No. 2 – Skorpios Industrial | ||
The following table presents certain information relating to the operating history and underwritten cash flows of the Skorpios Industrial Property:
| Operating History and Underwritten Net Cash Flow(1) | ||||||
| Underwritten | Per Square Foot | % | (2) | |||
| Rents in Place(3) | $12,604,625 | $28.01 | 72.0 | % | ||
| Vacant Income | 0 | 0.00 | 0.0 | |||
| Gross Potential Rent | $12,604,625 | $28.01 | 72.0 | % | ||
| Total Reimbursements | 4,892,451 | 10.87 | 28.0 | |||
| Net Rental Income | $17,497,076 | $38.88 | 100.0 | % | ||
| (Vacancy / Credit Loss) | (874,854) | (1.94) | (5.0 | ) | ||
| Effective Gross Income | $16,622,222 | $36.94 | 95.0 | % | ||
| Total Expenses | $4,892,451 | $10.87 | 29.4 | % | ||
| Net Operating Income | $11,729,772 | $26.07 | 70.6 | % | ||
| Total TI/LC, Capex / RR(4) | 1,871,000 | 4.16 | 11.3 | |||
| Net Cash Flow | $9,858,772 | $21.91 | 59.3 | % | ||
| (1) | Historical financial information is not available due to the acquisition of the Skorpios Industrial Property at origination of the Skorpios Industrial Whole Loan. |
| (2) | % column represents percent of Net Rental Income for all revenue lines and represents percent of Effective Gross Income for the remainder of fields. |
| (3) | Underwritten Rents in Place includes contractual rent steps per the tenant’s lease through March 2024 totaling $367,125. |
| (4) | Total TI/LC, Capex / RR includes a credit of $325,000 (approximately $0.72 per square foot) associated with the upfront TI/LC reserve and replacement reserve deposits in the aggregate amount of $3,250,000 (approximately $7.22 per square foot). |
The Market. The Skorpios Industrial Property is located in Temecula, Riverside County, California within the Riverside-San Bernardino-Ontario, CA metropolitan statistical area, also known as the Inland Empire. The Inland Empire has developed into one of the largest industrial markets in the United States, largely due to the growing demand for logistics inventory. The city of Temecula offers a central location within the Inland Empire, with downtown San Diego approximately 58 miles to the south and downtown Los Angeles approximately 85 miles to the northwest. Interstate 15 is accessed approximately one half mile from the Skorpios Industrial Property, providing linkages to the surrounding area, including directly to San Diego to the south. Tourism is an additional driver for the Temecula economy, with tourist attractions such as the Temecula Valley Wine County and Old Town Temecula. The three largest employers in Riverside County as of June 30, 2022, are the Temecula Valley Unified School District, Abbott Laboratories and Temecula Valley Hospital.
The Skorpios Industrial Property is located within the South Riverside industrial submarket of the Inland Empire industrial market. According to a third-party market research report, as of the second quarter of 2023, the Inland Empire industrial market had an inventory of approximately 731.7 million square feet, overall vacancy in the market of approximately 3.7% and average asking rent of $13.98 per square foot. As of the second quarter of 2023, the South Riverside industrial submarket had an inventory of approximately 24.1 million square feet, overall vacancy of approximately 5.3% and average asking rent of $16.14 per square foot. According to the appraisal, the estimated 2022 population within a one-, three- and five-mile radius of the Skorpios Industrial Property was 2,907, 43,264 and 153,200, respectively. The estimated 2022 median household income within the same radii was $57,986, $82,813 and $98,870, respectively.
| THE INFORMATION IN THIS STRUCTURAL AND COLLATERAL TERM SHEET IS NOT COMPLETE AND MAY BE AMENDED PRIOR TO THE TIME OF SALE. THIS TERM SHEET IS NOT AN OFFER TO SELL THESE SECURITIES AND IT IS NOT A SOLICITATION OF AN OFFER TO BUY THESE SECURITIES IN ANY JURISDICTION WHERE THE OFFER OR SALE IS NOT PERMITTED. | ||
| 25 | ||
| Structural and Collateral Term Sheet | BMO 2023-C6 | |
| No. 2 – Skorpios Industrial | ||
The following table presents certain information relating to comparable industrial leases for the Skorpios Industrial Property:
| Comparable Rental Summary(1) | ||||||||
| Property Name/Location | Year Built | NRA (SF) | Tenant Name | Lease Size (SF) | Rent PSF | Commencement | Lease Term (Years) | Lease Type |
Skorpios Industrial 41915 Business Park Drive Temecula, CA | 1987 | 450,000(2) | Skorpios(2) | 450,000(2) | $28.01(2) | Apr-23(2) | 15.4(2) | NNN(2) |
Research & Development 1730 Technology Drive San Jose, CA | 1977 | 87,125 | QuantumScape | 87,125 | $27.00 | Feb-23 | 9.6 | NNN |
Baytech Business Park 150-160 Baytech Drive San Jose, CA | 1997 | 158,221 | Procept Biorobotics Corporation | 158,221 | $27.12 | Jan-23 | 10.2 | NNN |
Ionis Center 2850 Gazelle Court Carlsbad, CA | 2011, 2021 | 246,000 | Ionis | 69,000 | $63.48 | Sep-22 | 15.0 | NNN |
Zanker Office/R&D 3151 Zanker Road San Jose, CA | 1990 | 201,500 | Nio | 201,500 | $31.80 | Jul-22 | 10.0 | NNN |
Automation Parkway 1768 Automation Parkway San Jose, CA | 1991 | 118,488 | Foxconn Corporation | 118,488 | $26.04 | May-22 | 8.0 | NNN |
| (1) | Information obtained from the appraisal unless otherwise indicated. |
| (2) | Based on the underwritten rent roll dated as of August 1, 2023. |
The following table presents certain information relating to comparable industrial sales for the Skorpios Industrial Property:
| Comparable Industrial Sales(1) | ||||||||||
| Property / Location | NRA (SF) | Year Built | Occupancy | Sale Date | Sale Price | Sale Price PSF | Adjusted Sale Price PSF | |||
Skorpios Industrial Temecula, CA | 450,000(2) | 1987 | 100.0 | %(2) | Aug-23 (3) | $190,000,000 | (3) | $422 | (3) | NAP |
Ionis Center Carlsbad, CA | 246,000 | 2011, 2021 | 100.0 | % | Oct-22 | $258,400,000 | $1,050 | $408 | ||
Rancho Vista Center San Diego, CA | 809,769 | 1981 | 100.0 | % | Jul-22 | $445,000,000 | $550 | $423 | ||
Research & Development Property San Jose, CA | 196,647 | 1997 | 100.0 | % | Apr-22 | $103,829,000 | $528 | $347 | ||
Palomar R&D Building Carlsbad, CA | 205,000 | 1981 | 45.5 | % | Apr-22 | $68,000,000 | $332 | $312 | ||
| (1) | Information obtained from the appraisal unless otherwise indicated. |
| (2) | Based on the underwritten rent roll dated as of August 1, 2023. |
| (3) | Based on the title settlement statement. |
The Borrower. The borrower is NexPoint Life Sciences III DST, a Delaware statutory trust with a signatory trustee that has two independent managers that satisfy the requirements of an independent director. The borrower has master leased the Skorpios Industrial Property to a master tenant affiliated with the guarantor. The master tenant’s interest in all tenant rents was assigned to the borrower and the borrower then assigned its interest in all tenant rents to the lender pursuant to a tenant landlord subordination agreement (the “Tenant Subordination Agreement”). The master lease is subordinate to the Skorpios Industrial Whole Loan and, upon an event of default under the Skorpios Industrial Whole Loan documents, the lender has the right to cause the termination of the master lease. Counsel to the borrowers provided a non-consolidation opinion in connection with the origination of the Skorpios Industrial Whole Loan. See “Description of the Mortgage Pool—Statistical Characteristics of the Mortgage Pool—Delaware Statutory Trusts” in the Preliminary Prospectus.
| THE INFORMATION IN THIS STRUCTURAL AND COLLATERAL TERM SHEET IS NOT COMPLETE AND MAY BE AMENDED PRIOR TO THE TIME OF SALE. THIS TERM SHEET IS NOT AN OFFER TO SELL THESE SECURITIES AND IT IS NOT A SOLICITATION OF AN OFFER TO BUY THESE SECURITIES IN ANY JURISDICTION WHERE THE OFFER OR SALE IS NOT PERMITTED. | ||
| 26 | ||
| Structural and Collateral Term Sheet | BMO 2023-C6 | |
| No. 2 – Skorpios Industrial | ||
The Borrower Sponsor. The nonrecourse carve-out guarantor is The Dugaboy Investment Trust, a Delaware irrevocable trust which owns 50% interest in and manages the borrower. The borrower sponsor is NexPoint Real Estate Advisors, L.P. (“NexPoint”), an alternative investment platform comprised of a group of investment advisors and sponsors, a broker-dealer, and other related investment vehicles. NexPoint has over $13.5 billion in assets under management and has been involved in $18.6 billion in real estate transactions. NexPoint’s real estate investment expertise includes experience across a range of property types, including multifamily, single-tenant rental, office and retail, self-storage, and hospitality.
Property Management. The Skorpios Industrial Property is managed by CMP Management, LLC, a third-party property management company.
Escrows and Reserves. At origination, the borrower deposited into escrow $3,000,000 for tenant improvements and leasing commissions, $1,019,792 for a rent abatement for Skorpios, and $250,000 for replacement reserves.
Tax Escrows – On a monthly basis, the borrower is required to escrow 1/12th of the annual estimated tax payments; provided that the monthly escrow for taxes will be waived so long as (i) no Cash Sweep Period (as defined below) has occurred and is continuing, (ii) the Major Tenant (as defined below) is obligated to pay all taxes directly, (iii) the borrower has provided satisfactory evidence of the Major Tenant’s full compliance with such obligation, and (iv) the Major Tenant lease remains in full force and effect.
Insurance Escrows – On a monthly basis, the borrower is required to escrow 1/12th of the premiums payable during the next 12 months; provided that the monthly escrow for insurance will be waived so long as (i) the borrower maintains a blanket insurance policy or (ii) the Major Tenant provides insurance satisfying the requirements of the Skorpios Industrial Whole Loan documents, provided that the following conditions are met: (a) no event of default exists under the Major Tenant lease, (b) the Major Tenant lease is not expired or terminated and is in effect, (c) no event of default exists under the Skorpios Industrial Whole Loan documents, (d) the guarantor under the Major Tenant lease, if any, remains fully liable for the obligations and liabilities under such lease, and (e) the borrower provides satisfactory evidence of all required insurance as required under the Skorpios Industrial Whole Loan documents.
Replacement Reserve – On the next ensuing payment date after the balance of the replacement reserve falls below $250,000 and on each payment date thereafter until the balance of the replacement reserve is at least $250,000, the borrower will pay (or cause the master tenant to pay) into escrow monthly the amount of approximately $9,375 for replacement reserves (equal to approximately $0.25 per square foot annually).
TI/LC Reserve – On the next ensuing payment date after Skorpios reports a year-over-year decline in revenue of 30% or greater and on each payment date thereafter, the borrower will pay (or cause the master tenant to pay) into escrow monthly the amount of $173,625 for TI/LC reserves (equal to approximately $4.63 per square foot annually).
Security Deposit Reserve – Pursuant to the Skorpios lease, Skorpios was required to deposit with the landlord a security deposit, and in the event that Skorpios is in default under its lease, the landlord may draw upon a portion of such security deposit. Upon the lender’s receipt of evidence that the borrower is entitled to draw upon any portion of the Skorpios security deposit and Skorpios no longer has an interest in, or right to, such amount pursuant to the terms of the Skorpios lease, the borrower is required to deposit such amount with the lender.
Lockbox / Cash Management. The Skorpios Industrial Whole Loan is structured with a hard lockbox and in-place cash management. In connection with the origination of the Skorpios Industrial Whole Loan, the borrower delivered a tenant instruction letter requiring the master tenant to deposit all rents payable under the master lease into the clearing account controlled by the lender. The borrower is required to deposit, or cause to be deposited, all revenues otherwise received in connection with the Skorpios Industrial Property into the clearing account within two business days of receipt. All sums on deposit in the clearing account are required to be transferred on each business day to a cash management account controlled by the lender and are required to be applied and disbursed in accordance with the Skorpios Industrial Whole Loan documents. Upon the occurrence and during the continuance of a Cash Sweep Period, any excess cash is required to be held by the lender as additional security for the Skorpios Industrial Whole Loan. Pursuant to the Tenant Subordination Agreement, upon the occurrence of an event of default under the Skorpios Industrial Whole Loan documents, the lender is entitled to mandate the use of lockbox accounts or other depository accounts in the name of the master tenant to be maintained under the control and supervision of the lender, for all income of the Skorpios Industrial Property, including all rents, service charges and insurance payments.
| THE INFORMATION IN THIS STRUCTURAL AND COLLATERAL TERM SHEET IS NOT COMPLETE AND MAY BE AMENDED PRIOR TO THE TIME OF SALE. THIS TERM SHEET IS NOT AN OFFER TO SELL THESE SECURITIES AND IT IS NOT A SOLICITATION OF AN OFFER TO BUY THESE SECURITIES IN ANY JURISDICTION WHERE THE OFFER OR SALE IS NOT PERMITTED. | ||
| 27 | ||
| Structural and Collateral Term Sheet | BMO 2023-C6 | |
| No. 2 – Skorpios Industrial | ||
A “Cash Sweep Period” will commence upon: (i) the occurrence of an event of default under the Skorpios Industrial Whole Loan documents and will continue until such event of default is cured; (ii) the occurrence of any bankruptcy action of the borrower or principal (which is the signatory trustee while the borrower is a Delaware statutory trust) (in no event can a Cash Sweep Period due to a bankruptcy action of the borrower or principal be cured); (iii) the occurrence of any bankruptcy action of the property manager, and will continue until the borrower replaces the property manager with a qualified manager under a replacement management agreement within 60 days of such bankruptcy action and such parties simultaneously enter into a replacement assignment of management agreement; (iv) the date on which the amortizing debt service coverage ratio as calculated in accordance with the Skorpios Industrial Whole Loan documents based on the trailing three-month period is less than 1.20x and will continue until the amortizing debt service coverage ratio based on the trailing three-month period is at least 1.25x for two consecutive quarters; or (v) the occurrence of a Major Tenant Cash Sweep Period (as defined below) and will continue until such Major Tenant Cash Sweep Period is cured.
A “Major Tenant Cash Sweep Period” will commence upon the occurrence of any of the following: (i) any bankruptcy action of (1) Skorpios or any subsequent tenant under a replacement lease (each, a “Major Tenant”) or (2) a lease guarantor under any Major Tenant lease (if applicable); (ii) the continuation of any default by a Major Tenant under its lease beyond any applicable notice and cure period; (iii) the date on which any Major Tenant gives actual or constructive notice that it intends to discontinue its business at its premises; (iv) the date any Major Tenant lease (or any material portion thereof) is surrendered, cancelled or terminated prior to its then current expiration date; (v) the date 12 months prior to the expiration date of the Major Tenant lease (provided any remaining extension option has not been properly exercised under the Major Tenant lease); or (vi) the date a Go Dark Trigger (as defined below) has occurred. A Major Tenant Cash Sweep Period will end upon the following: (A) a Lease Replacement Event (as defined below); (B) with respect to clause (i) above, the date that the applicable Major Tenant is no longer insolvent or subject to any bankruptcy or insolvency proceedings and has affirmed the applicable Major Tenant lease pursuant to final non-appealable order of a court of competent jurisdiction; (C) with respect to clause (ii) above, the borrower providing the lender with evidence that such default has been cured and no other default under the applicable Major Tenant lease exists; (D) with respect to clause (iii) above, the applicable Major Tenant has rescinded its notice, resumed and maintained operations for not less than 30 days, and provided to the lender an acceptable tenant estoppel; (E) with respect to clause (v) above, the applicable Major Tenant has renewed its lease on terms reasonably satisfactory to the lender (but not for a term of less than five years or for rent below the then market rental rate) and borrower has delivered to the lender all other requirements under the Skorpios Industrial Whole Loan documents (a “Lease Renewal Event”); or (F) with respect to clause (vi) above, the Go Dark Trigger is cured.
A “Lease Replacement Event” means, with respect to any Major Tenant lease, the date on which (x) the borrower or master tenant has (A) entered into a replacement lease for the entire Major Tenant premises with a satisfactory replacement tenant and on terms acceptable to the lender, (B) delivered to the lender all requirements under the Skorpios Industrial Whole Loan documents, and (C) paid all leasing brokerage commissions and tenant improvement costs in connection with the applicable replacement lease and (y) the replacement tenant has taken possession of and is occupying all of the space demised under the replacement lease, is in occupancy, and is paying unabated base rent.
A “Go Dark Trigger” means any Major Tenant (i) is dark in, or removes, equipment and operations from, 53,745 square feet or more of the 80,215 square feet of clean room, lab and manufacturing space located on the second floor of the Skorpios Industrial Property, or (ii) is dark in 50% or more of the office space located on the first floor of the Skorpios Industrial Property. A Go Dark Trigger will end upon applicable Major Tenant resuming ordinary course business operations during customary hours in substantially all of the leased premises.
Subordinate Debt. None.
Mezzanine Debt. None.
Partial Release. Not permitted.
Ground Lease. None.
| THE INFORMATION IN THIS STRUCTURAL AND COLLATERAL TERM SHEET IS NOT COMPLETE AND MAY BE AMENDED PRIOR TO THE TIME OF SALE. THIS TERM SHEET IS NOT AN OFFER TO SELL THESE SECURITIES AND IT IS NOT A SOLICITATION OF AN OFFER TO BUY THESE SECURITIES IN ANY JURISDICTION WHERE THE OFFER OR SALE IS NOT PERMITTED. | ||
| 28 | ||
| Structural and Collateral Term Sheet | BMO 2023-C6 | |
| No. 3 – Fashion Valley Mall | ||

| THE INFORMATION IN THIS STRUCTURAL AND COLLATERAL TERM SHEET IS NOT COMPLETE AND MAY BE AMENDED PRIOR TO THE TIME OF SALE. THIS TERM SHEET IS NOT AN OFFER TO SELL THESE SECURITIES AND IT IS NOT A SOLICITATION OF AN OFFER TO BUY THESE SECURITIES IN ANY JURISDICTION WHERE THE OFFER OR SALE IS NOT PERMITTED. | ||
| 29 | ||
| Structural and Collateral Term Sheet | BMO 2023-C6 | |
| No. 3 – Fashion Valley Mall | ||
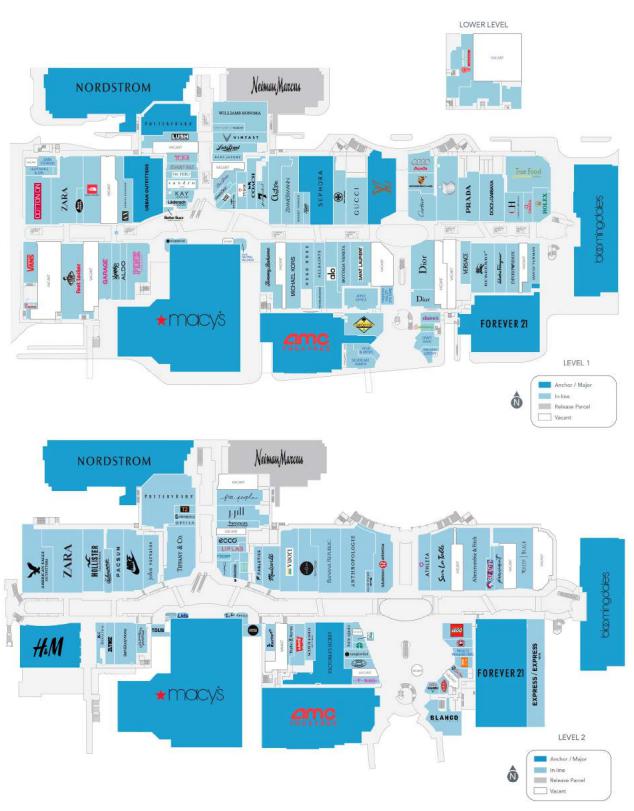
| THE INFORMATION IN THIS STRUCTURAL AND COLLATERAL TERM SHEET IS NOT COMPLETE AND MAY BE AMENDED PRIOR TO THE TIME OF SALE. THIS TERM SHEET IS NOT AN OFFER TO SELL THESE SECURITIES AND IT IS NOT A SOLICITATION OF AN OFFER TO BUY THESE SECURITIES IN ANY JURISDICTION WHERE THE OFFER OR SALE IS NOT PERMITTED. | ||
| 30 | ||
| Structural and Collateral Term Sheet | BMO 2023-C6 | |
| No. 3 – Fashion Valley Mall | ||
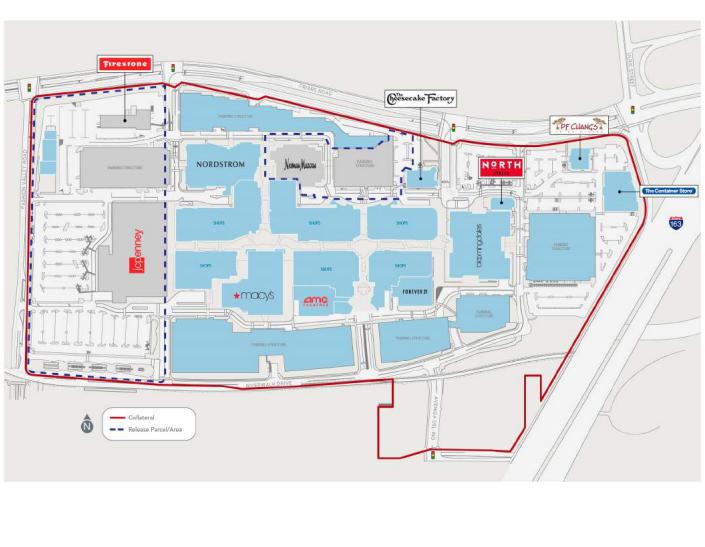
| THE INFORMATION IN THIS STRUCTURAL AND COLLATERAL TERM SHEET IS NOT COMPLETE AND MAY BE AMENDED PRIOR TO THE TIME OF SALE. THIS TERM SHEET IS NOT AN OFFER TO SELL THESE SECURITIES AND IT IS NOT A SOLICITATION OF AN OFFER TO BUY THESE SECURITIES IN ANY JURISDICTION WHERE THE OFFER OR SALE IS NOT PERMITTED. | ||
| 31 | ||
| Structural and Collateral Term Sheet | BMO 2023-C6 | |
| No. 3 – Fashion Valley Mall | ||
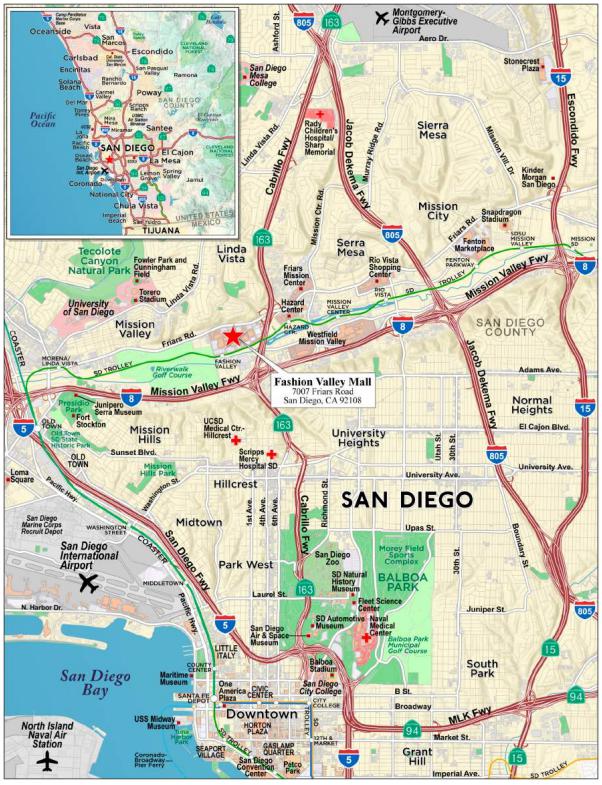
| THE INFORMATION IN THIS STRUCTURAL AND COLLATERAL TERM SHEET IS NOT COMPLETE AND MAY BE AMENDED PRIOR TO THE TIME OF SALE. THIS TERM SHEET IS NOT AN OFFER TO SELL THESE SECURITIES AND IT IS NOT A SOLICITATION OF AN OFFER TO BUY THESE SECURITIES IN ANY JURISDICTION WHERE THE OFFER OR SALE IS NOT PERMITTED. | ||
| 32 | ||
| Structural and Collateral Term Sheet | BMO 2023-C6 | |
| No. 3 – Fashion Valley Mall | ||
| Mortgage Loan Information | Property Information | |||
| Mortgage Loan Seller: | BMO | Single Asset / Portfolio: | Single Asset | |
| Original Principal Balance(1): | $50,000,000 | Title: | Fee | |
| Cut-off Date Principal Balance(1): | $50,000,000 | Property Type – Subtype: | Retail – Super Regional Mall | |
| % of IPB: | 8.3% | Net Rentable Area (SF): | 1,377,155 | |
| Loan Purpose: | Refinance | Location: | San Diego, CA | |
| Borrower: | Fashion Valley Mall, LLC | Year Built / Renovated(5): | 1969 / 2023 | |
| Borrower Sponsor: | Simon Property Group, L.P. | Occupancy(6): | 94.0% | |
| Interest Rate: | 5.73000% | Occupancy Date: | 5/15/2023 | |
| Note Date: | 5/25/2023 | 4th Most Recent NOI (As of)(7): | $82,934,141 (12/31/2019) | |
| Maturity Date: | 6/1/2033 | 3rd Most Recent NOI (As of)(7): | $72,772,653 (12/31/2020) | |
| Interest-only Period: | 120 months | 2nd Most Recent NOI (As of)(7): | $79,065,945 (12/31/2021) | |
| Original Term: | 120 months | Most Recent NOI (As of)(7): | $80,846,012 (TTM 12/31/2022) | |
| Original Amortization Term: | None | UW Economic Occupancy(8): | 89.9% | |
| Amortization Type: | Interest Only | UW Revenues(8): | $103,974,716 | |
| Call Protection(2): | L(26),D(88),O(6) | UW Expenses(8): | $19,972,427 | |
| Lockbox / Cash Management: | Hard / Springing | UW NOI(8): | $84,002,289 | |
| Additional Debt(1)(3): | Yes | UW NCF(8): | $82,302,958 | |
| Additional Debt Balance(1): | $400,000,000 | Appraised Value / Per SF(9): | $1,430,000,000 / $1,038 | |
| Additional Debt Type(1): | Pari Passu | Appraisal Date: | 4/5/2023 | |
| Escrows and Reserves(4) | Financial Information(1) | |||||
| Initial | Monthly | Initial Cap | Cut-off Date Loan / SF: | $327 | ||
| Taxes: | $0 | Springing | N/A | Maturity Date Loan / SF: | $327 | |
| Insurance: | $0 | Springing | N/A | Cut-off Date LTV(9): | 31.5% | |
| Replacement Reserves: | $0 | Springing | N/A | Maturity Date LTV(9): | 31.5% | |
| TI/LC Reserve: | $0 | Springing | N/A | UW NCF DSCR(8): | 3.15x | |
| Gap Rent Reserve: | $4,458,079 | $0 | N/A | UW NOI Debt Yield(8): | 18.7% | |
| Outstanding TI/LC: | $24,345,615 | $0 | N/A | |||
| Sources and Uses | ||||||||
| Sources | Proceeds | % of Total | Uses | Proceeds | % of T | otal | ||
| Whole Loan(1) | $450,000,000 | 100.0 | % | Loan Payoff | $417,362,939 | 92.7 | % | |
| Upfront Reserves | 28,803,694 | 6.4 | ||||||
| Return of Equity | 2,571,188 | 0.6 | ||||||
| Closing Costs | 1,262,178 | 0.3 | ||||||
| Total Sources | $450,000,000 | 100.0 | % | Total Uses | $450,000,000 | 100.0 | % | |
| (1) | The Fashion Valley Mall Mortgage Loan (as defined below) is part of a whole loan evidenced by 21 pari passu notes with an aggregate outstanding principal balance as of the Cut-off Date of $450.0 million (the “Fashion Valley Mall Whole Loan”). The Financial Information in the chart above reflects the Fashion Valley Mall Whole Loan. |
| (2) | The lockout period will be at least 26 months beginning with and including the first payment date on July 1, 2023. Defeasance of the Fashion Valley Mall Whole Loan is permitted after the date that is the earlier of (i) two years from the closing date of the securitization that includes the last note to be securitized (the “REMIC Prohibition Period”) and (ii) May 25, 2026 (the “Permitted Release Date”). The assumed lockout period is based on the expected BMO 2023-C6 closing date in August 2023. The actual lockout period may be longer. If the Permitted Release Date has occurred but the REMIC Prohibition Period has not occurred, the borrower may prepay the Fashion Valley Mall Whole Loan in whole (but not in part) provided that such prepayment includes an amount equal to the yield maintenance premium. |
| (3) | The borrower utilized an approximately $2.5 million property assessed clean energy (“PACE”) loan to complete energy efficient upgrades at the Fashion Valley Mall Property (as defined below). The PACE loan has a ten-year term with final payment occurring in September 2025. The annual debt service is $312,351 and the remaining balance as of March 2023 was approximately $866,043. The debt service is included as an assessment on the Fashion Valley Mall Property’s real estate tax bills and is a recoverable expense. In addition to the existing PACE loan, the related Mortgage Loan agreement permits the borrower to enter into an additional PACE Loan (as defined below) for an amount not to exceed $5,000,000. |
| (4) | For a full description of Escrows and Reserves, please refer to “Escrows and Reserves” below. |
| (5) | The Fashion Valley Mall Property is undergoing a renovation that is planned to be completed by the end of 2023. |
| (6) | Occupancy includes all tenants in place and excludes all Release Parcels (as defined below). As of May 15, 2023, the Fashion Valley Mall Property was 96.0% occupied inclusive of Retail Development Program (“RDP”) tenants. These RDP tenants have been excluded from the underwriting as RDP lease terms are for less than a year and can be terminated by the landlord at any time with 30 days’ notice. |
| (7) | The Release Parcels are included in the information regarding the most recent NOIs. |
| (8) | The Release Parcels are not included in the UW Economic Occupancy, UW Revenues, UW expenses, UW NOI or UW NCF. |
| (9) | The Appraised Value represents the hypothetical as-is value, which excludes the value attributed to Release Parcels. The actual as-is value of the Fashion Valley Mall Property including the Release Parcels is $1,450,000,000, which results in the Cut-off Date LTV and Maturity Date LTV of 31.0% and 31.0%, respectively. See “Partial Release” below. |
| THE INFORMATION IN THIS STRUCTURAL AND COLLATERAL TERM SHEET IS NOT COMPLETE AND MAY BE AMENDED PRIOR TO THE TIME OF SALE. THIS TERM SHEET IS NOT AN OFFER TO SELL THESE SECURITIES AND IT IS NOT A SOLICITATION OF AN OFFER TO BUY THESE SECURITIES IN ANY JURISDICTION WHERE THE OFFER OR SALE IS NOT PERMITTED. | ||
| 33 | ||
| Structural and Collateral Term Sheet | BMO 2023-C6 | |
| No. 3 – Fashion Valley Mall | ||
The Loan. The third largest mortgage loan (the “Fashion Valley Mall Mortgage Loan”) is part of a fixed rate whole loan secured by the borrower’s fee interest in a super regional mall in San Diego, California (the “Fashion Valley Mall Property”). The Fashion Valley Mall Whole Loan consists of 21 pari passu notes and accrues interest at a rate of 5.73000% per annum. The Fashion Valley Mall Whole Loan has a ten-year term and is interest-only for the entire term. The Fashion Valley Mall Whole Loan was co-originated on May 25, 2023 by Bank of America, N.A. (“BANA”), JPMorgan Chase Bank, National Association (“JPMCB”), Barclays Capital Real Estate Inc. (“Barclays”) and Bank of Montreal (“BMO”). The non-controlling Notes A-3-1, A-3-4 and A-3-5, with an aggregate original principal balance of $50,000,000, will be included in the BMO 2023-C6 securitization trust. The remaining notes are currently held by BANA, JPMCB, BMO, Barclays or their respective affiliates and are expected to be contributed to one or more future securitization trust(s). The Fashion Valley Mall Whole Loan is currently being serviced pursuant to the pooling and servicing agreement for the BBCMS 2023-C20 trust until the controlling Note A-1-1 is securitized, whereupon the Fashion Valley Mall Whole Loan will be serviced pursuant to the pooling and servicing agreement for such future securitization. See “Description of the Mortgage Pool—The Whole Loans—The Non-Serviced Pari Passu Whole Loans” and “Pooling and Servicing Agreement” in the Preliminary Prospectus.
| Whole Loan Summary | |||||||
| Note | Original Balance | Cut-off Date Balance | Note Holder | Controlling Piece | |||
| A-1-1(1) | $60,000,000 | $60,000,000 | BANA | Yes | |||
| A-1-2 | $55,000,000 | $55,000,000 | BANK 2023-BNK46(2) | No | |||
| A-1-3 | $25,000,000 | $25,000,000 | BBCMS 2023-C20(3) | No | |||
| A-1-4(1) | $10,000,000 | $10,000,000 | BANA | No | |||
| A-2-1-1 | $30,000,000 | $30,000,000 | Benchmark 2023-B39 | No | |||
| A-2-1-2(1) | $5,000,000 | $5,000,000 | BANK 2023-BNK46(2) | No | |||
| A-2-2 | $30,000,000 | $30,000,000 | Benchmark 2023-B39 | No | |||
| A-2-3 | $25,000,000 | $25,000,000 | Benchmark 2023-B39 | No | |||
| A-2-4(1) | $10,000,000 | $10,000,000 | BANK 2023-BNK46(2) | No | |||
| A-3-1 | $22,500,000 | $22,500,000 | BMO 2023-C6 | No | |||
| A-3-2(1) | $20,000,000 | $20,000,000 | BMO | No | |||
| A-3-3 | $17,500,000 | $17,500,000 | BBCMS 2023-C20(3) | No | |||
| A-3-4 | $15,000,000 | $15,000,000 | BMO 2023-C6 | No | |||
| A-3-5 | $12,500,000 | $12,500,000 | BMO 2023-C6 | No | |||
| A-3-6(1) | $12,500,000 | $12,500,000 | BMO | No | |||
| A-4-1(1) | $35,000,000 | $35,000,000 | Barclays | No | |||
| A-4-2 | $25,000,000 | $25,000,000 | BBCMS 2023-C20(3) | No | |||
| A-4-3 | $15,000,000 | $15,000,000 | BBCMS 2023-C20(3) | No | |||
| A-4-4(1) | $10,000,000 | $10,000,000 | Barclays | No | |||
| A-4-5(1) | $10,000,000 | $10,000,000 | Barclays | No | |||
| A-4-6(1) | $5,000,000 | $5,000,000 | Barclays | No | |||
| Whole Loan | $450,000,000 | $450,000,000 | |||||
| (1) | Expected to be contributed to one or more future securitization(s). |
| (2) | The BANK 2023-BNK46 securitization transaction is expected to close on or prior to the closing of the BMO 2023-C6 securitization transaction. |
| (3) | The Fashion Valley Mall Whole Loan will be initially serviced under the BBCMS 2023-C20 pooling and servicing agreement until the securitization of note A-1-1, and on or after the closing date of the securitization of note A-1-1, the Fashion Valley Whole Loan will be serviced under the pooling and servicing agreement for the securitization of note A-1-1. |
The Property. The Fashion Valley Mall Property is a Class A, open-air, super-regional mall that was constructed in 1969 on an 81.44-acre plot of land in the Mission Valley section of San Diego, California. The Fashion Valley Mall Property consists of 1,377,155 square feet of net rentable area and provides parking via 7,512 surface parking and parking garage spaces (approximately 5.5 spaces per 1,000 square feet). The Fashion Valley Mall Property is home to six anchor department stores, including Neiman Marcus (excluded from underwriting), Bloomingdale’s, Nordstrom, Macy’s and JCPenney (excluded from underwriting), and an 18-screen AMC Theatres.
| THE INFORMATION IN THIS STRUCTURAL AND COLLATERAL TERM SHEET IS NOT COMPLETE AND MAY BE AMENDED PRIOR TO THE TIME OF SALE. THIS TERM SHEET IS NOT AN OFFER TO SELL THESE SECURITIES AND IT IS NOT A SOLICITATION OF AN OFFER TO BUY THESE SECURITIES IN ANY JURISDICTION WHERE THE OFFER OR SALE IS NOT PERMITTED. | ||
| 34 | ||
| Structural and Collateral Term Sheet | BMO 2023-C6 | |
| No. 3 – Fashion Valley Mall | ||
The parcels relating to the Neiman Marcus and JCPenney stores (each, a “Release Parcel”), including their related parking structures and spaces, are permitted to be freely released by the borrower without any payment of a release price, therefore all square footage and any rent for those tenants has been excluded in the lender’s underwriting and no value has been given to either parcel in the “hypothetical as-is” appraised value. The information relating to the Fashion Valley Mall Property (other than the information regarding the historical cash flow and the tenant sales) in this term sheet does not include the Release Parcels, unless otherwise expressly stated herein. See “Partial Release” below. The information regarding the historical cash flow and the tenant sales with respect to the Fashion Valley Mall Property in this term sheet includes the Release Parcels
As of May 15, 2023, the Fashion Valley Mall Property was 94.0% leased by over 150 tenants (excluding three additional RDP tenants) and 96.0% leased including three additional RDP tenants. 859,488 square feet (62.4% of net rentable area) is occupied by the 14 anchor tenants, three of which are subject to ground leases under which the tenants own their improvements. As of the trailing 12-month period ending March 2023, the Fashion Valley Mall Property generated over $1.06 billion in total sales, and in-line sales of $1,424 per square foot (excluding Apple whose lease commenced on February 1, 2023 and Tesla whose lease expired on January 31, 2022). The Fashion Valley Mall Property is the only full-price location in the San Diego market for many retailers and restaurants, including Armani Exchange, Bloomingdale’s, Burberry, Cartier, Coach, Dior, Gucci, Hugo Boss, Neiman Marcus, Omega, Prada, Rolex, Saint Laurent, Salvatore Ferragamo and Tory Burch.
The Fashion Valley Mall Property is currently undergoing an estimated $84.9 million cosmetic renovation that is expected to include removal of outdated architectural elements, installing additional landscaping and an experiential water feature, replacing and relocating escalators and elevators, renovating restrooms, adding outdoor cabana rooms, and building a landscaped park at the food court. The borrower sponsor has spent approximately $34.0 million to date, and the renovation is expected to be fully complete by year-end 2023. We cannot assure you whether such renovations will be completed as expected or at all.
Major Tenants.
Nordstrom (220,486 square feet, 16.0% of NRA, 0.0% of underwritten base rent): Nordstrom (Moody’s/S&P/Fitch: Ba1/BB+/BBB-) was founded in 1901 as a retail shoe business in Seattle, Washington. Nordstrom offers an extensive selection of brand-name and private label merchandise for women, men, young adults and children focused on apparel, shoes, beauty, accessories and home goods. The Nordstrom lease at the Fashion Valley Mall Property has an original commencement date of August 28, 1981 and ground lease expiration date of December 31, 2080. Nordstrom does not pay base rent but is responsible for Common Area and Maintenance (“CAM”) charges. Nordstrom’s reported sales at the Fashion Valley Mall Property were $147,000,000 for year-end 2022.
Bloomingdale’s (201,502 square feet, 14.6% of NRA, 0.05% of underwritten base rent): Founded in 1872 and headquartered in New York, New York, Bloomingdale’s (Moody’s/S&P/Fitch: Ba2/BB+/BBB-) is a department store chain with over 2,500 employees and 60 stores in the United States. Bloomingdale’s offers a variety of shopping services including stylists, beauty, gift shopping, tailoring and wedding registry. The Bloomingdale’s store at the Fashion Valley Mall Property is an original tenant at the Fashion Valley Mall Property from 1969. Bloomingdale’s has a ground lease expiration date of January 31, 2035 with three 15-year renewal options. Bloomingdale’s reported sales at the Fashion Valley Mall Property were $40,400,000 for year-end 2022.
Macy’s (196,120 square feet, 14.2% of NRA, 0.05% of underwritten base rent): Founded in 1858 and headquartered in New York, New York, Macy’s (Moody’s/S&P/Fitch: Ba2/BB+/BBB-) is a department store chain that operates approximately 725 stores in the United States and Washington, D.C., as well as Guam and Puerto Rico. Macy’s has three banners that include Macy’s, bluemercury, and Bloomingdale’s (and accompanying e-commerce sites), that sell men's, women's, and children's apparel and accessories, cosmetics, and home furnishings, among other merchandise. The Macy’s store at the Fashion Valley Mall Property is an original tenant at the Fashion Valley Mall Property since 1969. Macy’s has a ground lease expiration date of January 31, 2026 with two, 21-year renewal options remaining so long as there is no event of default. Macy’s reported sales at the Fashion Valley Mall Property were $51,000,000 for year-end 2022.
| THE INFORMATION IN THIS STRUCTURAL AND COLLATERAL TERM SHEET IS NOT COMPLETE AND MAY BE AMENDED PRIOR TO THE TIME OF SALE. THIS TERM SHEET IS NOT AN OFFER TO SELL THESE SECURITIES AND IT IS NOT A SOLICITATION OF AN OFFER TO BUY THESE SECURITIES IN ANY JURISDICTION WHERE THE OFFER OR SALE IS NOT PERMITTED. | ||
| 35 | ||
| Structural and Collateral Term Sheet | BMO 2023-C6 | |
| No. 3 – Fashion Valley Mall | ||
The following table presents certain information relating to the historical and current occupancy of the Fashion Valley Mall Property:
| Historical and Current Occupancy(1) | |||
| 2020(2) | 2021(2) | 2022(2) | Current(3) |
| 96.1% | 98.0% | 96.7% | 94.0% |
| (1) | Occupancy does not include the Release Parcels. |
| (2) | Historical occupancies are as of December 31 for each respective year and are inclusive of RDP tenants. |
| (3) | Current Occupancy is as of May 15, 2023 and includes all tenants in place and tenants with signed leases as of the reporting period. The Fashion Valley Mall Property was 96.0% occupied inclusive of RDP tenants. These RDP tenants have been excluded from the underwriting as RDP lease terms are for less than a year and can be terminated by the landlord at any time with 30 days’ notice. |
The following table presents certain information relating to the largest tenants at the Fashion Valley Mall Property:
| Top Tenant Summary(1) | ||||||||||||
| Tenant | Ratings Moody’s/S&P/Fitch(2) | Net Rentable Area (SF) | % of Total NRA | UW Base Rent PSF(1) | UW Base Rent(1) | % of Total UW Base Rent(1) |
TTM March 2023 Sales $(3) |
Sales PSF/Screen(3) |
Occ Cost | Lease Expiration Date | ||
| Major Anchor Tenants | ||||||||||||
| Nordstrom(4) | Ba1/BB+/BBB- | 220,486 | 16.0% | $0.00 | $0 | 0.0 | % | $147,000,000 | $667 | 0.1% | 12/31/2080 | |
| Bloomingdale's(4) | Ba2/BB+/BBB- | 201,502 | 14.6 | $0.17 | 33,450 | 0.05 | $40,400,000 | $200 | 0.4% | 1/31/2035 | ||
| Macy's(4) | Ba2/BB+/BBB- | 196,120 | 14.2 | $0.17 | 33,866 | 0.05 | $51,000,000 | $260 | 0.3% | 1/31/2026 | ||
| Major Anchor Tenants Subtotal / Wtd. Avg. | 618,108 | 44.9% | $0.11 | $67,316 | 0.1 | % | ||||||
| Other Anchor Tenants | ||||||||||||
| Forever 21 | NR/NR/NR | 53,787 | 3.9% | $34.32 | $1,845,796 | 2.5 | % | $7,558,543 | $141 | 25.3% | 1/31/2026 | |
| AMC Theatres | Caa2/CCC+/NR | 51,610 | 3.7 | $30.25 | 1,561,203 | 2.1 | $8,674,735 | $481,930(5) | 23.6% | 12/31/2024 | ||
| The Container Store | NR/B/NR | 24,432 | 1.8 | $40.00 | 977,280 | 1.3 | $10,946,269 | $448 | 12.3% | 5/31/2030 | ||
| Zara(6) | NR/NR/NR | 21,726 | 1.6 | $104.38 | 2,267,760 | 3.1 | $27,873,804 | $1,283 | 12.5% | 9/30/2022 | ||
| Pottery Barn | NR/NR/NR | 19,920 | 1.4 | $55.81 | 1,111,639 | 1.5 | $9,321,064 | $468 | 22.7% | 1/31/2024 | ||
| H&M(6) | NR/BBB/NR | 14,106 | 1.0 | $67.13 | 946,934 | 1.3 | $8,576,263 | $608 | 21.6% | 1/31/2023 | ||
| Victoria's Secret | B1/BB-/NR | 12,559 | 0.9 | $159.88 | 2,007,925 | 2.8 | $9,921,287 | $790 | 27.4% | 1/31/2025 | ||
| Other Anchor Tenants Subtotal / Wtd. Avg. | 198,140 | 14.4% | $54.10 | $10,718,536 | 14.7 | % | ||||||
| Remaining Occupied(7) | 478,320 | 34.7% | $129.72 | 62,046,033 | 85.2 | % | ||||||
| Occupied Collateral Total / Wtd. Avg. | 1,294,568 | 94.0% | $56.26 | $72,831,885 | 100.0 | % | ||||||
| Vacant Space | 82,587 | 6.0% | ||||||||||
| Collateral Total | 1,377,155 | 100.0% | ||||||||||
| (1) | Based on the underwritten rent roll dated May 15, 2023 inclusive of rent steps through May 2024 and overage and percent in lieu rent as of the 12 months ended March 2023 sales for certain tenants. |
| (2) | In certain instances, ratings provided are those of the parent company of the entity shown, whether or not the parent company guarantees the lease. |
| (3) | All sales information presented herein with respect to the Fashion Valley Mall Property is based upon information provided by the borrower sponsor. In certain instances, sales figures represent estimates because the tenants are not required to report, or otherwise may not have reported sales information on a timely basis. Further, because sales are self-reported, such information is not independently verified by the borrower sponsor. Sales for anchor tenants are as of year end 2022. |
| (4) | The Nordstrom, Bloomingdale’s and Macy’s tenants are subject to ground leases. Nordstrom does not pay base rent but is responsible for CAM charges. |
| (5) | Based on AMC Theatres’ 18 screens. |
| (6) | Leases for both Zara and H&M are subject to renewal. Both tenants continue to pay rent. We cannot assure you whether or when either lease will be renewed. |
| (7) | Includes four anchor tenants (Urban Outfitters, Sephora, Louis Vuitton and Anthropologie). |
| THE INFORMATION IN THIS STRUCTURAL AND COLLATERAL TERM SHEET IS NOT COMPLETE AND MAY BE AMENDED PRIOR TO THE TIME OF SALE. THIS TERM SHEET IS NOT AN OFFER TO SELL THESE SECURITIES AND IT IS NOT A SOLICITATION OF AN OFFER TO BUY THESE SECURITIES IN ANY JURISDICTION WHERE THE OFFER OR SALE IS NOT PERMITTED. | ||
| 36 | ||
| Structural and Collateral Term Sheet | BMO 2023-C6 | |
| No. 3 – Fashion Valley Mall | ||
The following table presents certain information relating to the tenant sales of the Fashion Valley Mall Property:
| Tenant Sales(1) | |||||||
| 2017 | 2018 | 2019 | 2020(2) | 2021 | 2022 | TTM March 2023 | |
| Gross Mall Sales | $608,514,305 | $682,415,790 | $1,085,890,001 | $717,229,387 | $983,426,151 | $1,050,104,045 | $1,055,000,320 |
| Gross Mall Sales (Ex-Apple / Tesla)(3) | $490,756,985 | $501,039,180 | $812,226,260 | $629,072,676 | $890,646,999 | $979,138,467 | $978,542,475 |
| Sales PSF (Inline < 10,000 SF) | $1,235 | $1,410 | $1,675 | $1,095 | $1,503 | $1,534 | $1,599 |
| Sales PSF (Inline < 10,000 SF, Ex-Apple / Tesla)(3) | $966 | $989 | $998 | $895 | $1,297 | $1,378 | $1,424 |
| Occupancy Cost (Inline < 10,000 SF)(4) | 13.1% | 11.9% | 10.3% | 15.8% | 11.7% | 11.5% | 11.1% |
| Occupancy Cost (Inline < 10,000 SF, Ex-Apple / Tesla)(3)(4) | 16.8% | 17.0% | 17.3% | 19.4% | 13.6% | 12.8% | 12.5% |
| (1) | All sales information presented herein with respect to the Fashion Valley Mall Property is based upon information provided by the borrower sponsor. In certain instances, sales figures represent estimates because the tenants are not required to report, or otherwise may not have reported sales information on a timely basis. Further, because sales are self-reported, such information is not independently verified by the borrower sponsor. The sales information in this table includes the Release Parcels. Sales for anchor tenants were only provided between 2019-2022 and TTM March 2023 anchor sales are for year-end 2022. |
| (2) | The Fashion Valley Mall Property was closed due to the COVID-19 pandemic from March 29, 2020 through May 23, 2020. |
| (3) | The Apple lease commenced on February 1, 2023. The Tesla lease expired on January 31, 2022. |
| (4) | Occupancy Cost is calculated by the sum of rent, percentage rent, CAM and taxes divided by annual sales. |
The following table presents certain information relating to the major tenant sales of the Fashion Valley Mall Property:
| Major Tenant Sales(1) | ||||||||
| Tenant Name | 2017 | 2018 | 2019 | 2020(2) | 2021 | 2022 | TTM March 2023 | TTM March 2023 Sales PSF/Screen |
| Nordstrom | N/A | N/A | $140,200,000 | $98,100,000 | $135,600,000 | $147,000,000 | $147,000,000 | $667 |
| Bloomingdale's | N/A | N/A | $39,200,000 | $23,500,000 | $39,200,000 | $40,400,000 | $40,400,000 | $200 |
| Macy's | N/A | N/A | $57,000,000 | $31,400,000 | $51,300,000 | $51,000,000 | $51,000,000 | $260 |
| Forever 21 | $11,925,965 | $11,976,850 | $10,716,695 | $5,952,591 | $10,081,242 | $8,133,078 | $7,558,543 | $141 |
| AMC Theatres | $10,517,462 | $12,823,064 | $11,531,806 | $4,257,851 | $4,274,855 | $8,769,754 | $8,674,735 | $481,930(3) |
| The Container Store | $10,450,544 | $9,597,623 | $9,861,732 | $7,571,965 | $11,483,773 | $11,346,954 | $10,946,269 | $448 |
| Zara | $14,422,358 | $14,978,373 | $17,324,258 | $12,031,385 | $19,974,922 | $27,250,373 | $27,873,804 | $1,283 |
| Pottery Barn | $7,453,111 | $6,644,660 | $6,762,824 | $5,612,810 | $7,815,960 | $9,311,118 | $9,321,064 | $468 |
| H&M | $8,601,793 | $7,292,426 | $7,681,442 | $5,924,805 | $7,965,235 | $8,670,202 | $8,576,263 | $608 |
| Victoria's Secret | $10,524,915 | $10,079,554 | $9,918,003 | $6,919,209 | $9,686,990 | $10,372,731 | $9,921,287 | $790 |
| (1) | All sales information presented herein with respect to the Fashion Valley Mall Property is based upon information provided by the borrower sponsor. In certain instances, sales figures represent estimates because the tenants are not required to report, or otherwise may not have reported sales information on a timely basis. Further, because sales are self-reported, such information is not independently verified by the borrower sponsor. TTM March 2023 anchor sales are for year-end 2022. |
| (2) | The Fashion Valley Mall Property was closed due to the COVID-19 pandemic from March 29, 2020 through May 23, 2020. |
| (3) | Based on AMC Theatres’ 18 screens. |
| THE INFORMATION IN THIS STRUCTURAL AND COLLATERAL TERM SHEET IS NOT COMPLETE AND MAY BE AMENDED PRIOR TO THE TIME OF SALE. THIS TERM SHEET IS NOT AN OFFER TO SELL THESE SECURITIES AND IT IS NOT A SOLICITATION OF AN OFFER TO BUY THESE SECURITIES IN ANY JURISDICTION WHERE THE OFFER OR SALE IS NOT PERMITTED. | ||
| 37 | ||
| Structural and Collateral Term Sheet | BMO 2023-C6 | |
| No. 3 – Fashion Valley Mall | ||
The following table presents certain information relating to the tenant lease expirations of the Fashion Valley Mall Property:
| Lease Rollover Schedule(1)(2) | ||||||||||||||
| Year | Number of Leases Expiring | Net Rentable Area Expiring | % of NRA Expiring | UW Base Rent Expiring(1) | % of UW Base Rent Expiring(1) | Cumulative Net Rentable Area Expiring | Cumulative % of NRA Expiring | Cumulative UW Base Rent Expiring(1) | Cumulative % of UW Base Rent Expiring(1) | |||||
| Vacant | NAP | 82,587 | 6.0 | % | NAP | NAP | 82,587 | 6.0% | NAP | NAP | ||||
| 2023 & MTM | 16 | 65,119 | 4.7 | $7,383,543 | 10.1 | % | 147,706 | 10.7% | $7,383,543 | 10.1% | ||||
| 2024 | 21 | 138,793 | 10.1 | 9,777,149 | 13.4 | 286,499 | 20.8% | $17,160,692 | 23.6% | �� | ||||
| 2025 | 10 | 40,591 | 2.9 | 5,789,837 | 7.9 | 327,090 | 23.8% | $22,950,529 | 31.5% | |||||
| 2026 | 8 | 268,169 | 19.5 | 4,432,342 | 6.1 | 595,259 | 43.2% | $27,382,871 | 37.6% | |||||
| 2027 | 13 | 52,290 | 3.8 | 6,395,710 | 8.8 | 647,549 | 47.0% | $33,778,581 | 46.4% | |||||
| 2028 | 16 | 56,510 | 4.1 | 7,440,994 | 10.2 | 704,059 | 51.1% | $41,219,574 | 56.6% | |||||
| 2029 | 16 | 36,387 | 2.6 | 4,722,754 | 6.5 | 740,446 | 53.8% | $45,942,329 | 63.1% | |||||
| 2030 | 17 | 89,563 | 6.5 | 9,430,718 | 12.9 | 830,009 | 60.3% | $55,373,047 | 76.0% | |||||
| 2031 | 8 | 19,726 | 1.4 | 2,091,762 | 2.9 | 849,735 | 61.7% | $57,464,809 | 78.9% | |||||
| 2032 | 8 | 24,906 | 1.8 | 2,871,986 | 3.9 | 874,641 | 63.5% | $60,336,795 | 82.8% | |||||
| 2033 | 18 | 62,768 | 4.6 | 10,362,452 | 14.2 | 937,409 | 68.1% | $70,699,248 | 97.1% | |||||
| 2034 & Thereafter | 7 | 439,746 | 31.9 | 2,132,637 | 2.9 | 1,377,155 | 100.0% | $72,831,885 | 100.0% | |||||
| Total | 158 | 1,377,155 | 100.0 | % | $72,831,885 | 100.0 | % | |||||||
| (1) | Based on the underwritten rent roll dated May 15, 2023 inclusive of rent steps through May 2024 and overage and percent in lieu rent as of the 12 months ended March 2023 sales for certain tenants. |
| (2) | Certain tenants may have lease termination options that are exercisable prior to the originally stated expiration date of the subject lease and that are not considered in the Lease Rollover Schedule. |
Environmental. The Phase I environmental assessment dated April 10, 2023 identified a recognized environmental condition (the “REC”) at the Fashion Valley Mall Property in connection with a building used for automotive repair located at 6977 Friars Road, which is a part of the Release Parcels. The REC was identified based on the duration of hazardous waste generation pertaining to automotive repair, limitations during the property inspection in which observation of the tenant space was not allotted, observations during 2020 reconnaissance, the potential of an unregistered gasoline underground storage tank and violations reported under compliance inspections from the San Diego County Department of Environmental Health (which have been cured). The lender obtained a remedial cost estimate ranging from $157,603-$1,579,956 to assess and remediate the auto service center for potential impacts. See “Description of the Mortgage Pool—Environmental Considerations” in the Preliminary Prospectus.
| THE INFORMATION IN THIS STRUCTURAL AND COLLATERAL TERM SHEET IS NOT COMPLETE AND MAY BE AMENDED PRIOR TO THE TIME OF SALE. THIS TERM SHEET IS NOT AN OFFER TO SELL THESE SECURITIES AND IT IS NOT A SOLICITATION OF AN OFFER TO BUY THESE SECURITIES IN ANY JURISDICTION WHERE THE OFFER OR SALE IS NOT PERMITTED. | ||
| 38 | ||
| Structural and Collateral Term Sheet | BMO 2023-C6 | |
| No. 3 – Fashion Valley Mall | ||
The following table presents certain information relating to the historical and underwritten cash flows of the Fashion Valley Mall Property:
| Operating History and Underwritten Net Cash Flow(1) | |||||||
| 2019 | 2020(2) | 2021 | 2022 | Underwritten(3) | Per SF | %(4) | |
| Base Rent | $65,244,678 | $62,076,239 | $55,990,692 | $56,783,656 | $62,582,702 | $45.44 | 55.8% |
| Contractual Rent Steps(5) | 0 | 0 | 0 | 0 | 1,475,982 | 1.07 | 1.3 |
| Gross Up Vacancy | 0 | 0 | 0 | 0 | 9,925,306 | 7.21 | 8.9 |
| Overage Rent(6) | 2,964,021 | 2,858,448 | 7,036,298 | 8,776,710 | 6,515,626 | 4.73 | 5.8 |
| Percentage Rent in Lieu(6) | 18,238 | 1,817,988 | 3,439,192 | 2,870,199 | 2,257,576 | 1.64 | 2.0 |
| Expense Reimbursement | 28,751,732 | 28,054,338 | 26,714,510 | 26,406,200 | 29,319,699 | 21.29 | 26.2 |
| Net Rental Income | $96,978,669 | $94,807,013 | $93,180,692 | $94,836,765 | $112,076,890 | $81.38 | 100.0% |
| Vacancy / Credit Loss | 427,991 | 8,190,545 | 614,970 | 219,541 | 11,319,487 | 8.22 | 10.1 |
| Temporary Tenant Income | 2,674,141 | 1,598,280 | 2,629,279 | 3,201,937 | 1,227,157 | 0.89 | 1.1 |
| Other Income(7) | 2,478,795 | 1,414,802 | 1,823,959 | 2,325,352 | 1,990,156 | 1.45 | 1.8 |
| Effective Gross Income | $101,703,614 | $89,629,550 | $97,018,960 | $100,144,513 | $103,974,716 | $75.50 | 92.8% |
| Total Expenses(8) | 18,769,473 | 16,856,897 | 17,953,015 | 19,298,501 | 19,972,427 | 14.50 | 19.2 |
| Net Operating Income | $82,934,141 | $72,772,653 | $79,065,945 | $80,846,012 | $84,002,289 | $61.00 | 80.8% |
| Capital Expenditures | 0 | 0 | 0 | 0 | 195,237 | 0.14 | 0.2 |
| TI/LC | 0 | 0 | 0 | 0 | 1,504,094 | 1.09 | 1.4 |
| Net Cash Flow | $82,934,141 | $72,772,653 | $79,065,945 | $80,846,012 | $82,302,958 | $59.76 | 79.2% |
| (1) | Based on the underwritten rent roll dated May 15, 2023 with adjustments made for executed leases, pending renewals and tenants that have given notice to vacate. |
| (2) | The Fashion Valley Mall Property was closed due to the COVID-19 pandemic from March 29, 2020 through May 23, 2020. |
| (3) | Underwritten financials exclude all income and expense related to the Release Parcels, which are included in the historical financial information. |
| (4) | % column represents percentage of Net Rental Income for all revenue lines and represents percentage of Effective Gross Income for the remaining fields. |
| (5) | Contractual Rent Steps were taken through May 2024. |
| (6) | Underwritten Overage Rent and Underwritten Percentage Rent in Lieu are based on the terms of applicable leases using TTM March 2023 sales figures. |
| (7) | Other Income is based on the borrower sponsor's projections. Includes Media Participation, Simon Ad panels, and miscellaneous income. Underwritten parking income excludes $400,000 of projected gross parking income from the Neiman Marcus garage. $80,000 of projected parking income expenses are excluded from underwritten expenses too. |
| (8) | Total Expenses includes debt service for the existing PACE loan to complete energy efficient upgrades at the Fashion Valley Mall Property, which is a recoverable expense. The existing PACE loan has a ten-year term with final payment occurring in September 2025. The annual debt service is $312,351 and the remaining balance as of March 2023 was approximately $866,043. The borrower is permitted to obtain an additional PACE loan up to $5,000,000, subject to the lender’s approval and delivery of a rating agency confirmation. |
The Market. The Fashion Valley Mall Property is located in San Diego, California, within the San Diego metropolitan statistical area (the “San Diego MSA”) and the West San Diego Beach submarket. The San Diego MSA is the second largest metropolitan area in California, behind Los Angeles, with a population of over three million people. The Fashion Valley Mall Property is located in a high-traffic corridor near Interstate 8 and Highway 163. It is the only true luxury center in San Diego County and draws affluent shoppers from a 20-mile radius, as well as tourists and international shoppers from Mexico.
According to the appraisal, the vacancy rate as of year-end 2022 was 6.2% for the San Diego retail market, and 3.4% for the West San Diego Beach submarket. The average asking rental rate for the same period was $32.39 per square foot for the San Diego retail market and $37.88 per square foot for the West San Diego Beach submarket. According to the appraisal, the estimated 2022 population within a five-, seven- and ten-mile radius was 526,945, 807,687 and 1,219,300, respectively. Additionally, for the same period, the average household income within the same radii was $107,685, $111,999 and $109,418, respectively.
| THE INFORMATION IN THIS STRUCTURAL AND COLLATERAL TERM SHEET IS NOT COMPLETE AND MAY BE AMENDED PRIOR TO THE TIME OF SALE. THIS TERM SHEET IS NOT AN OFFER TO SELL THESE SECURITIES AND IT IS NOT A SOLICITATION OF AN OFFER TO BUY THESE SECURITIES IN ANY JURISDICTION WHERE THE OFFER OR SALE IS NOT PERMITTED. | ||
| 39 | ||
| Structural and Collateral Term Sheet | BMO 2023-C6 | |
| No. 3 – Fashion Valley Mall | ||
The following table presents certain information relating to comparable retail centers for the Fashion Valley Mall Property:
| Competitive Retail Center Summary(1) | ||||||
| Property | Year Built / Renovated or Expanded | Total NRA (SF) | Total Occupancy | Distance to Subject | Sales PSF | Major Tenants |
Fashion Valley Mall
| 1969 / 2023 | 1,377,155(2) | 94.0%(2) | NAP | $1,424(3) | Macy’s Bloomingdale’s Nordstrom Forever 21 |
| Westfield UTC | 1977 / 1997 | 1,189,411 | 96.0% | 6.0 miles | $970 | Macy’s Nordstrom Tesla |
| Westfield Mission Valley | 1960 / 2004 | 1,216,321 | 90.0% | 1.0 mile | $600 | Bloomingdale’s Outlet Macy’s Backstage Nordstrom Rack Target |
| Grossmont Center | 1961 / N/A | 939,000 | 88.0% | 9.0 miles | $473 | CVS Macy’s Target Walmart |
| Plaza Bonita | 1981 / 2007 | 1,029,029 | 85.0% | 10.0 miles | $593 | JCPenney Macy’s Nordstrom Rack |
| Chula Vista Center | 1962 / 2012 | 862,620 | 64.0% | 11.0 miles | $496 | Burlington JCPenney Macy’s |
| (1) | Based on a third party report, unless otherwise indicated. |
| (2) | Based on the underwritten rent roll dated May 15, 2023. |
| (3) | Represents sales per square foot as of TTM March 31, 2023 for in-line tenants (excluding Apple and Tesla). All sales information presented herein with respect to the Fashion Valley Mall Property is based upon information provided by the borrower sponsor. In certain instances, sales figures represent estimates because the tenants are not required to report, or otherwise may not have reported sales information on a timely basis. Further, because sales are self-reported, such information is not independently verified by the borrower sponsor. Sales PSF inclusive of tenants that have been open for 12 months or more. |
The Borrower. The borrowing entity for the Fashion Valley Mall Whole Loan is Fashion Valley Mall, LLC, a Delaware limited liability company and single purpose entity with two independent directors. Legal counsel to the Fashion Valley Mall borrower delivered a non-consolidation opinion in connection with the origination of the Fashion Valley Mall Whole Loan.
The Borrower Sponsors. The borrower sponsor is Simon Property Group, L.P. (“Simon”) and the non-recourse carveout guarantors are Simon and PPF Retail, LLC (“PPF”). Simon and PPF’s liability as the non-recourse carveout guarantor (or if any affiliate of Simon Property Group, L.P. is the non-recourse carveout guarantor) is limited to 20% ($90,000,000) of the original principal amount of the Fashion Valley Mall Whole Loan, plus all reasonable out-of-pocket costs and expenses incurred in the enforcement of the guaranty or preservation of the lender’s rights under the guaranty. There is no separate environmental indemnity for the Fashion Valley Mall Whole Loan; however, environmental losses are a recourse carveout which is guaranteed by Simon.
Simon is the operating partnership of Simon Property Group Inc. (NYSE: SPG / Moody’s: A3, S&P: A-), which is a global leader in the ownership of shopping, dining, entertainment and mixed-use destinations and an S&P 100 company. As of December 31, 2022, Simon owned or had an interest in 230 properties comprising over 184 million square feet in North America, Asia and Europe. Simon also owns an 80% interest in The Taubman Realty Group, or TRG, which owns 24 regional, super-regional, and outlet malls in the U.S. and Asia. Additionally, as of December 31, 2022, Simon had a 22.4% ownership interest in Klépierre, a publicly traded, Paris-based real estate company, which owns shopping centers in 14 European countries. As of June 2023, Simon had an equity market capitalization of over $41 billion.
PPF is a real estate core fund managed by Morgan Stanley Real Estate Advisors. The fund is located in New York, NY and invests across the United States and targets investments in the retail, multi-family, office and industrial sectors. As of March 31, 2022, Prime Property Fund managed 526 investments, with a total value of more than $44.4 billion in gross real estate assets.
Property Management. The Fashion Valley Mall Property is managed by Simon Management Associates, LLC, an affiliate of the borrower.
| THE INFORMATION IN THIS STRUCTURAL AND COLLATERAL TERM SHEET IS NOT COMPLETE AND MAY BE AMENDED PRIOR TO THE TIME OF SALE. THIS TERM SHEET IS NOT AN OFFER TO SELL THESE SECURITIES AND IT IS NOT A SOLICITATION OF AN OFFER TO BUY THESE SECURITIES IN ANY JURISDICTION WHERE THE OFFER OR SALE IS NOT PERMITTED. | ||
| 40 | ||
| Structural and Collateral Term Sheet | BMO 2023-C6 | |
| No. 3 – Fashion Valley Mall | ||
Escrows and Reserves. At origination, the borrower was required to deposit into escrow (i) $24,345,615 for outstanding tenant improvement allowances and leasing commissions and (ii) $4,458,079 for outstanding gap rent.
Tax Escrows – On a monthly basis after the occurrence of a Control Event (as defined below) or during the continuance of a Lockbox Event Period (as defined below) or at any time taxes are not paid by the borrower prior to the assessment of any penalty, the borrower is required to escrow 1/12th of the annual estimated tax payments payable during the next ensuing 12 months.
Insurance Escrows – After the occurrence of a Control Event, or during the continuance of a Lockbox Event Period, except if the Fashion Valley Mall Property is insured under an acceptable blanket policy, the borrower is required to escrow 1/12th of the annual estimated insurance payments on a monthly basis.
Replacement Reserves – After the occurrence of a Control Event or during the continuance of a Lockbox Event Period, the borrower is required to escrow approximately $16,270 on a monthly basis for replacements and repairs to be made at the Fashion Valley Mall Property.
Rollover Reserves – After the occurrence of a Control Event or during the continuance of a Lockbox Event Period, the borrower is required to escrow approximately $125,341 on a monthly basis for ongoing leasing reserves.
A “Lockbox Event Period” means the period commencing upon the occurrence of (i) an event of default, (ii) bankruptcy action of the borrower or property manager (if the property manager is an affiliate) and the property manager is not replaced within 60 days with a qualified manager, or (iii) the debt yield based on the trailing four calendar quarters is less than 12.0% for two consecutive calendar quarters. A Lockbox Event Period will end (a) with respect to clause (i) above, if the event of default has been accepted by the lender, (b) with respect to clause (ii) above, if the property manager is replaced with 60 days or the bankruptcy action with respect to the borrower or property manager is dismissed within 90 days without adverse consequences to the Fashion Valley Mall Property, or (c) with respect to clause (iii) above, the debt yield based on the trailing four calendar quarters is greater than or equal to 12.0% for two consecutive calendar quarters; provided, however, that (A) no event of default or other Lockbox Event Period is continuing, (B) the borrower has paid all of the lender’s reasonable expenses incurred in connection with the cure of such Lockbox Event Period, including reasonable attorney’s fees and expenses, (C) the borrower may not cure a Lockbox Event Period more than a total of five times in the aggregate during the term of the Fashion Valley Mall Whole Loan, and (D) in no event may the borrower cure a Lockbox Event Period caused by a bankruptcy action of the borrower.
A “Control Event” means if one or more of (i) Simon Property Group, Inc. and (ii) Simon Property Group, L.P. does not own at least 50% of the direct or indirect interests in the borrower or does not control the borrower.
Lockbox / Cash Management. The Fashion Valley Mall Whole Loan is structured with a hard lockbox and springing cash management. The borrower and property manager are required to direct the tenants to pay rent directly into the lockbox account, and to deposit any rents otherwise received in such account within two business days after receipt. During the continuance of a Lockbox Event Period, all funds in the lockbox account are required to be swept on a weekly basis to a lender-controlled cash management account. Funds in the cash management account are required to be applied to debt service and the reserves and escrows described above, with any excess funds (i) to be deposited into an excess cash flow reserve account held by the lender as cash collateral for the Fashion Valley Mall Whole Loan, or if (ii) no Lockbox Event Period is continuing, disbursed to the borrower.
Subordinate and Mezzanine Debt. None. However, the related Mortgaged Property is encumbered by an existing PACE loan in an original principal amount of $2,523,562.95 with the California Statewide Communities Development Authority to the borrower. As of the origination date of the Fashion Valley Mall Mortgage Loan, the amount outstanding on the existing PACE loan including all interest and administrative expenses was $866,043.38. In addition, the Fashion Valley Mall Mortgage Loan agreement permits the borrower to obtain an additional PACE loan or similar loan for an amount not to exceed $5,000,000, subject to the lender’s approval and delivery of a rating agency confirmation. The lien resulting from any unpaid and delinquent PACE loan payments would have property tax lien status. See “Description of the Mortgage Pool—Additional Indebtedness” in the Preliminary Prospectus.
| THE INFORMATION IN THIS STRUCTURAL AND COLLATERAL TERM SHEET IS NOT COMPLETE AND MAY BE AMENDED PRIOR TO THE TIME OF SALE. THIS TERM SHEET IS NOT AN OFFER TO SELL THESE SECURITIES AND IT IS NOT A SOLICITATION OF AN OFFER TO BUY THESE SECURITIES IN ANY JURISDICTION WHERE THE OFFER OR SALE IS NOT PERMITTED. | ||
| 41 | ||
| Structural and Collateral Term Sheet | BMO 2023-C6 | |
| No. 3 – Fashion Valley Mall | ||
Partial Release. The borrower may obtain a release of one or more Release Parcel (as defined above) for no consideration, subject to the satisfaction of certain conditions including, but not limited to, (i) no loan event of default has occurred and is continuing, (ii) a Control Event has not occurred, (iii) the borrower delivers to the lender evidence reasonably satisfactory to a prudent lender that the Release Parcel has been (or will be upon recordation of the applicable transfer documentation which will occur contemporaneously with the release of the Release Parcel) legally subdivided from the remainder of the Fashion Valley Mall Property and constitutes one or more separate tax lots, (iv) the Fashion Valley Mall Property will comply with all zoning laws and be serviced by adequate parking and access, (v) the borrower certifies to the lender that the remaining property with all easements appurtenant and other permitted encumbrances thereto will not, strictly as a result of such transfer and release of the Release Parcel, be in violation of certain reciprocal easement agreements or any then applicable law, statute, rule or regulation, (vi) if the Release Parcel is conveyed to or owned by an affiliate of the borrower, the borrower will be required to satisfy certain affiliate Release Parcel conditions with respect to relocation and re-tenanting, and (vii) satisfaction of any REMIC release conditions.
Ground Lease. None.
| THE INFORMATION IN THIS STRUCTURAL AND COLLATERAL TERM SHEET IS NOT COMPLETE AND MAY BE AMENDED PRIOR TO THE TIME OF SALE. THIS TERM SHEET IS NOT AN OFFER TO SELL THESE SECURITIES AND IT IS NOT A SOLICITATION OF AN OFFER TO BUY THESE SECURITIES IN ANY JURISDICTION WHERE THE OFFER OR SALE IS NOT PERMITTED. | ||
| 42 | ||
| Structural and Collateral Term Sheet | BMO 2023-C6 | |
| No. 4 – CX – 250 Water Street | ||
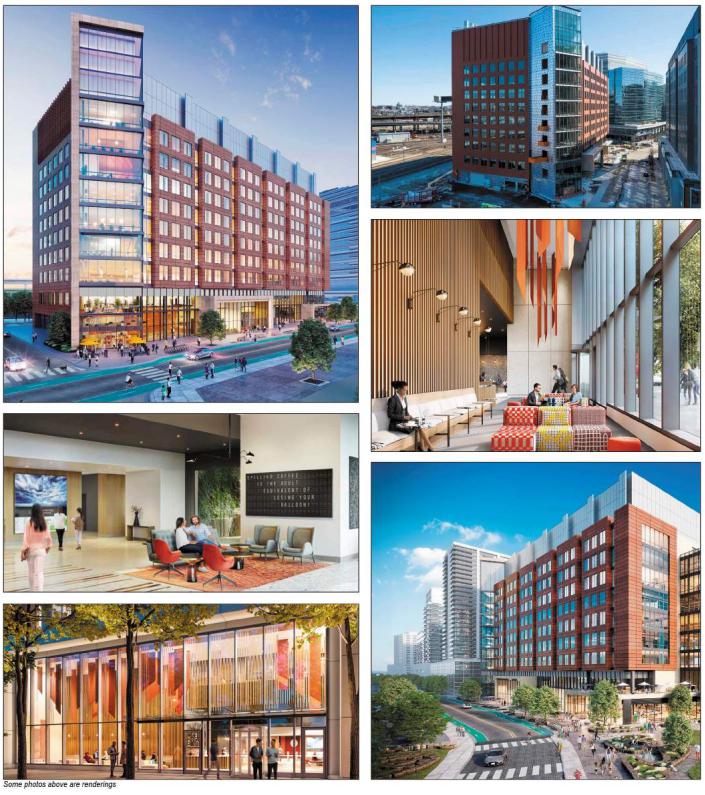
| THE INFORMATION IN THIS STRUCTURAL AND COLLATERAL TERM SHEET IS NOT COMPLETE AND MAY BE AMENDED PRIOR TO THE TIME OF SALE. THIS TERM SHEET IS NOT AN OFFER TO SELL THESE SECURITIES AND IT IS NOT A SOLICITATION OF AN OFFER TO BUY THESE SECURITIES IN ANY JURISDICTION WHERE THE OFFER OR SALE IS NOT PERMITTED. | ||
| 43 | ||
| Structural and Collateral Term Sheet | BMO 2023-C6 | |
| No. 4 – CX – 250 Water Street | ||
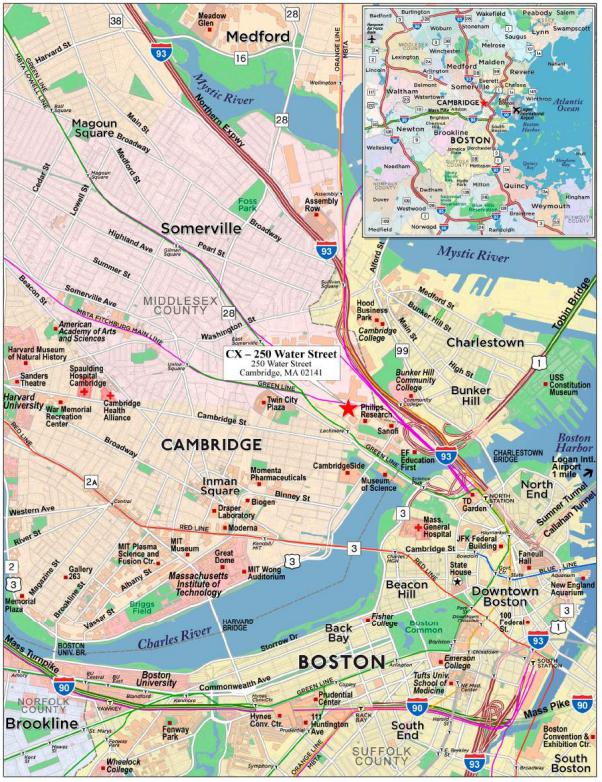
| THE INFORMATION IN THIS STRUCTURAL AND COLLATERAL TERM SHEET IS NOT COMPLETE AND MAY BE AMENDED PRIOR TO THE TIME OF SALE. THIS TERM SHEET IS NOT AN OFFER TO SELL THESE SECURITIES AND IT IS NOT A SOLICITATION OF AN OFFER TO BUY THESE SECURITIES IN ANY JURISDICTION WHERE THE OFFER OR SALE IS NOT PERMITTED. | ||
| 44 | ||
| Structural and Collateral Term Sheet | BMO 2023-C6 | |
| No. 4 – CX – 250 Water Street | ||
| Mortgage Loan Information | Property Information | |||
| Mortgage Loan Seller(1): | WFB | Single Asset / Portfolio: | Single Asset | |
| Original Principal Balance(1): | $46,200,000 | Title: | Fee | |
| Cut-off Date Principal Balance(1): | $46,200,000 | Property Type – Subtype: | Mixed Use – Lab / Office | |
| % of IPB: | 7.6% | Net Rentable Area (SF): | 479,004 | |
| Loan Purpose: | Refinance | Location: | Cambridge, MA | |
| Borrower: | DW Propco EF, LLC | Year Built / Renovated: | 2022 / NAP | |
| Occupancy: | 98.7% | |||
| Borrower Sponsors: | DivcoWest Real Estate Services, LLC, California State Teachers’ Retirement System and Teacher Retirement System of Texas | Occupancy Date: | 1/27/2023 | |
| 4th Most Recent NOI (As of)(6): | NAV | |||
| Interest Rate(2): | 5.50950% | 3rd Most Recent NOI (As of)(6): | NAV | |
| Note Date: | 1/27/2023 | 2nd Most Recent NOI (As of)(6): | NAV | |
| Anticipated Repayment Date(2): | 2/10/2033 | Most Recent NOI (As of)(6): | NAV | |
| Interest-only Period(2): | 120 months | UW Economic Occupancy: | 99.0% | |
| Original Term(2): | 120 months | UW Revenues: | $62,561,733 | |
| Original Amortization Term: | None | UW Expenses: | $13,277,931 | |
| Amortization Type(2): | Interest Only – ARD | UW NOI: | $49,283,802 | |
| Call Protection(3): | L(24),YM1(6),DorYM1(83),O(7) | UW NCF: | $49,164,051 | |
| Lockbox / Cash Management: | Hard / Springing | Appraised Value / Per SF(7): | $1,090,000,000 / $2,276 | |
| Additional Debt(1): | Yes | Appraisal Date: | 1/1/2023 | |
| Additional Debt Balance(1): | $485,300,000 | |||
| Additional Debt Type(1): | Pari Passu | |||
| Escrows and Reserves(4) | Financial Information(1) | |||||
| Initial | Monthly | Initial Cap | ||||
| Taxes: | $0 | Springing | N/A | Cut-off Date Loan / SF: | $1,110 | |
| Insurance: | $0 | Springing | N/A | Maturity Date Loan / SF: | $1,110 | |
| Replacement Reserves: | $0 | $0 | N/A | Cut-off Date LTV(7): | 48.8% | |
| TI/LC: | $0 | Springing | N/A | Maturity Date LTV(2)(7): | 48.8% | |
| Other Reserves(5): | $17,593,844 | $0 | N/A | UW NCF DSCR: | 1.66x | |
| UW NOI Debt Yield: | 9.3% | |||||
| Sources and Uses | ||||||||
| Sources | Proceeds | % of Total | Uses | Proceeds | % of Total | |||
| Whole Loan(1) | $531,500,000 | 98. | 6% | Loan Payoff | $473,876,626 | 87.9 | % | |
| Borrower Sponsor Equity | 7,497,903 | 1. | 4 | Outstanding TI Payment(8) | 44,192,678 | 8.2 | ||
| Reserves | 17,593,844 | 3.3 | ||||||
| Closing Costs | 3,334,755 | 0.6 | ||||||
| Total Sources | $538,997,903 | 100. | 0% | Total Uses | $538,997,903 | 100.0 | % | |
| (1) | The CX – 250 Water Street Mortgage Loan (as defined below) is part of the CX – 250 Water Street Whole Loan (as defined below) which is comprised of 21 pari passu promissory notes with an aggregate original balance of $531,500,000. The CX – 250 Water Street Whole Loan was co-originated by Bank of America, N.A. (“BANA”), Wells Fargo Bank, National Association (“WFB”), Goldman Sachs Banks USA (“GS”) and 3650 Real Estate Investment Trust 2 LLC (“3650”). |
| (2) | The CX – 250 Water Street Whole Loan is structured with an anticipated repayment date (the “ARD”) of February 10, 2033 and a final maturity date of February 10, 2038. The initial interest rate for the CX – 250 Water Street Whole Loan is 5.50950% per annum. After the ARD, the interest rate will increase to a per annum rate equal to the greater of (i) 7.50950% and (ii) the sum of the swap rate in effect on the ARD plus 4.28000%. The metrics presented above are calculated based on the ARD. |
| (3) | The CX – 250 Water Street Whole Loan may be voluntarily prepaid in whole beginning on the payment date in March 2025 with the payment of a yield maintenance premium if such prepayment occurs prior to the payment date in August 2032. In addition, the CX – 250 Water Street Whole Loan may be defeased in whole at any time after the earlier to occur of (i) January 27, 2026 or (ii) the date that is two years from the closing date of the securitization that includes the last pari passu note to be securitized. The assumed defeasance lockout period is based on the expected BMO 2023-C6 closing date in August 2023. The actual defeasance lockout period may be longer. |
| (4) | For a full description of Escrows and Reserves, please refer to “Escrows and Reserves” below. |
| (5) | The Other Reserves represents a Base Building Work Reserve ($5,932,952), an Outstanding TI/LC Reserve ($7,160,274.31) and an Outstanding Linkage Fees Reserve ($4,500,617.42). |
| THE INFORMATION IN THIS STRUCTURAL AND COLLATERAL TERM SHEET IS NOT COMPLETE AND MAY BE AMENDED PRIOR TO THE TIME OF SALE. THIS TERM SHEET IS NOT AN OFFER TO SELL THESE SECURITIES AND IT IS NOT A SOLICITATION OF AN OFFER TO BUY THESE SECURITIES IN ANY JURISDICTION WHERE THE OFFER OR SALE IS NOT PERMITTED. | ||
| 45 | ||
| Structural and Collateral Term Sheet | BMO 2023-C6 | |
| No. 4 – CX – 250 Water Street | ||
| (6) | Historical financial information is not applicable because the CX – 250 Water Street Property (as defined below) was built in 2022. |
| (7) | Appraised Value represents the “Prospective Market Value Upon Completion & Stabilization” as of January 1, 2023, which assumes that remaining construction balances are paid, outstanding tenant improvements are paid to the tenant, the tenant has commenced rent payments, and retail space leasing costs are paid, all of which have occurred other than payment of $5,932,952 for base building work, $7,160,274 for tenant improvements and future retail leasing costs. Such amounts for base building work and tenant improvements were fully reserved by the lender at loan origination. The appraisal concluded to an “as-is” appraised value of $960,000,000 as of May 4, 2022. The “as-is” appraised value results in a Cut-off Date LTV Ratio and LTV Ratio at Maturity of 55.4% for the CX – 250 Water Street Whole Loan. The appraisal concluded to an “as dark” appraised value of $920,000,000 as of May 4, 2022. The “as dark” appraised value results in a Cut-off Date LTV Ratio and LTV Ratio at Maturity of 57.8% for the CX – 250 Water Street Whole Loan. |
| (8) | Outstanding tenant improvements were paid directly to E.R. Squibb & Sons LLC by the borrower sponsors at origination. |
The Loan. The fourth largest mortgage loan (the “CX – 250 Water Street Mortgage Loan”) is part of a whole loan (the “CX – 250 Water Street Whole Loan”) that is evidenced by 21 pari passu promissory notes in the aggregate original principal amount of $531,500,000 and secured by a first priority fee mortgage encumbering a 479,004 SF mixed-use, life sciences laboratory and office property located in Cambridge, Massachusetts (the “CX – 250 Water Street Property”). The CX – 250 Water Street Whole Loan was co-originated by BANA, WFB, GS and 3650. The CX – 250 Water Street Mortgage Loan, with an aggregate original principal amount of $46,200,000, is evidenced by the non-controlling Notes A-9-2, A-13, A-15, and A-16, originated by WFB. The remaining promissory notes comprising the CX – 250 Water Street Whole Loan are summarized in the below table. The CX – 250 Water Street Whole Loan will be serviced pursuant to the pooling and servicing agreement for the BANK 2023-BNK45 trust until the securitization of the controlling Note A-1, whereupon the CX – 250 Water Street Whole Loan will be serviced pursuant to the pooling and servicing agreement for such future securitization. The relationship between the holders of the CX – 250 Water Street Whole Loan is governed by a co-lender agreement as described under “Description of the Mortgage Pool—The Whole Loans—The Non-Serviced Pari Passu Whole Loans” in the Preliminary Prospectus.
The CX - 250 Water Street Whole Loan has a 10-year interest-only term through the ARD of February 10, 2033 and a final maturity date of February 10, 2038. After the ARD, the interest rate will increase to the greater of (i) 7.50950%, and (ii) the sum of the swap rate in effect on the ARD plus 4.28000% (the “Adjusted Interest Rate”), however, interest accrued at the excess of the Adjusted Interest Rate over the initial interest rate will be deferred as described below under “Lockbox and Cash Management” below. From the origination date through the ARD, the CX - 250 Water Street Whole Loan accrues interest at the rate of 5.50950% per annum.
| Whole Loan Summary | ||||
| Note | Original Balance | Cut-off Date Balance | Note Holder | Controlling Piece |
| A-1 | $56,250,000 | $56,250,000 | BANA(1) | Yes |
| A-5, A-9-1 | 72,000,000 | 72,000,000 | BANK 2023-BNK46 | No |
| A-2, A-6, A-8 | 75,125,000 | 75,125,000 | BBCMS 2023-C20 | No |
| A-3, A-7 | 55,000,000 | 55,000,000 | BANA(1) | No |
| A-4, A-12 | 55,000,000 | 55,000,000 | BANK 2023-BNK45 | No |
| A-10, A-11, A-14 | 65,625,000 | 65,625,000 | MSWF 2023-1 | No |
| A-9-2, A-13, A-15, A-16 | 46,200,000 | 46,200,000 | BMO 20203-C6 | No |
| A-17, A-18 | 53,150,000 | 53,150,000 | Benchmark 2023-B38 | No |
| A-19, A-20 | 53,150,000 | 53,150,000 | 3650(1) | No |
| Whole Loan | $531,500,000 | $531,500,000 | ||
| (1) | Expected to be contributed to one or more securitization trust(s). |
The Property. The CX - 250 Water Street Property consists of a Class A, LEED Gold (targeted), mixed-use, life sciences laboratory and office building located in Cambridge, Massachusetts that was recently developed by the borrower sponsors. The CX - 250 Water Street Property is a part of Cambridge Crossing, a 43-acre, mixed-use, master-planned area located in East Cambridge, which is being developed by Divco, which owns all but four parcels. Cambridge Crossing broke ground in May 2017 and upon completion is expected to include over 16 buildings, 2.1 million square feet of science and technology space, 2.4 million square feet of residential space, 100,000 square feet of dining and retail space and 11 acres of green and open space. Major tenants at the development include Philips, Sanofi and Bristol Myers Squibb. Cambridge Crossing is at the intersection of Cambridge, Somerville and Boston, and is accessible to all parts of the greater Boston area via two MBTA stations (Green and Orange lines), nearby commuter and Amtrak trains, an on-site shuttle, and dedicated bike lanes throughout. Cambridge Crossing is approximately 3.5 miles from Boston Logan International Airport.
| THE INFORMATION IN THIS STRUCTURAL AND COLLATERAL TERM SHEET IS NOT COMPLETE AND MAY BE AMENDED PRIOR TO THE TIME OF SALE. THIS TERM SHEET IS NOT AN OFFER TO SELL THESE SECURITIES AND IT IS NOT A SOLICITATION OF AN OFFER TO BUY THESE SECURITIES IN ANY JURISDICTION WHERE THE OFFER OR SALE IS NOT PERMITTED. | ||
| 46 | ||
| Structural and Collateral Term Sheet | BMO 2023-C6 | |
| No. 4 – CX – 250 Water Street | ||
The CX – 250 Water Street Property was designed by Jacobs and Ennead and construction was completed in 2022. The CX - 250 Water Street Property is a nine-story building with post-COVID design features and includes laboratory space (approximately 60.0% NRA), office space (approximately 40.0% NRA), ground floor retail (6,424 square feet), two penthouse mechanical levels, three below-grade parking levels with 355 parking spaces (0.74 spaces per 1,000 SF), bike storage, a fitness center and an indoor solarium. The CX - 250 Water Street Property has 15’ - 20’ ceiling heights and five passenger elevators. Adjacent to the building is open green space with a playing field and a plaza to host food trucks. The CX - 250 Water Street Property is 98.7% leased to E.R. Squibb & Sons LLC (wholly owned by Bristol Myers Squibb (“BMY”).
Sole Tenant.
E.R. Squibb & Sons LLC (472,580 square feet, 98.7% of NRA, 100.0% of underwritten base rent): E.R. Squibb & Sons LLC is a wholly-owned subsidiary of BMY (rated A2/A+ by Moody’s/S&P), which is the guarantor under the E.R. Squibb & Sons LLC leases. Founded in 1887, BMY is a global biopharmaceutical company headquartered in New York, New York. BMY focuses on making critical advances in oncology, hematology, immunology, and cardiovascular disease among other fields. BMY has had several high-profile drugs successfully receive approval, with notable recent releases and current pipeline drugs including Abecma (approved: multiple myeloma), Zeposia (approved: multiple sclerosis) and Breyanzi (approved: lymphoma). BMY (NYSE: BMY) is publicly traded and had revenues of $46.2 billion in 2022. As of August 1, 2023, BMY had a market capitalization of approximately $128.5 billion.
The CX - 250 Water Street Property is expected to serve as BMY’s research and early development center, where it is expected to consolidate approximately 550 employees from multiple locations in the Boston area. BMY is entitled to receive an approximate $106.3 million ($225 PSF) tenant improvement allowance, of which approximately $7.2 million remained outstanding as of the origination date and was fully reserved by the lender. In addition to such tenant improvement allowance, BMY reportedly is investing an additional $169.0 million ($358 PSF) toward the buildout of its space. The tenant is currently completing its work and is anticipated to take occupancy in the third quarter of 2023. There can be no assurance that the tenant will complete such work or take occupancy as expected.
E.R. Squibb & Sons LLC leases all of the laboratory and office space at the CX – 250 Water Street Property through October 31, 2037, with two, 10-year renewal options and no termination option. E.R. Squibb & Sons LLC’s original lease was for 415,900 SF (floors 1-8) before expanding to lease the remaining 56,680 square feet on floor 9. The rent commencement dates of the BMY leases at the CX - 250 Water Street Property were July 1, 2022 (for floor 9) and November 1, 2022 (for all other floors). The blended starting base rent for the E.R. Squibb & Sons LLC leases is $90.48 PSF (NNN). Base rent for floors 1-8 is $88.50 PSF and base rent for floor 9 is $105.00 PSF, with both leases including approximately 2.5% and 2.75% annual rent steps, respectively. E.R. Squibb & Sons LLC did not receive any free rent as part of its lease. The blended in-place rent at the CX - 250 Water Street Property is approximately 27.1% below the appraisal’s concluded market rent of $115.00 PSF (NNN).
E.R. Squibb & Sons LLC has a contraction option for its floor 9 space, which, if exercised, would be effective October 31, 2032, upon 18-30 months’ notice and payment of a contraction fee equal to an estimated $8.3 million. E.R. Squibb & Sons LLC has subleased a portion of the floor 9 space (45,500 square feet, 9.6% of E.R. Squibb & Sons LLC’s leased NRA or 9.5% of the total building NRA) to Eterna Therapeutics Inc. (NASDAQ: ERNA) at a sublease rent of $120 PSF with 3.0% annual increases, which sublease is coterminous with the effective date of E.R. Squibb & Sons LLC’s contraction option. Eterna Therapeutics Inc. received a tenant improvement allowance of $190 PSF from E.R. Squibb & Sons LLC to build out its space. Eterna Therapeutics Inc. has a termination option in year 7 of the sublease term and has one 5-year extension option.
Environmental. The Phase I environmental assessment (“ESA”) dated May 24, 2022 identified a controlled recognized environmental condition at the CX - 250 Water Street Property resulting from former industrial and rail yard use (primarily lead and petroleum impacts to soil) and the presence of urban fill, which is common in the area surrounding Boston. Remedial actions are anticipated to be completed in connection with the completion of construction at the CX - 250 Water Street Property, and when completed, are expected to result in regulatory closure for the CX - 250 Water Street Property, according to the ESA. See “Description of the Mortgage Pool—Mortgage Pool Characteristics—Environmental Considerations” in the Preliminary Prospectus.
| THE INFORMATION IN THIS STRUCTURAL AND COLLATERAL TERM SHEET IS NOT COMPLETE AND MAY BE AMENDED PRIOR TO THE TIME OF SALE. THIS TERM SHEET IS NOT AN OFFER TO SELL THESE SECURITIES AND IT IS NOT A SOLICITATION OF AN OFFER TO BUY THESE SECURITIES IN ANY JURISDICTION WHERE THE OFFER OR SALE IS NOT PERMITTED. | ||
| 47 | ||
| Structural and Collateral Term Sheet | BMO 2023-C6 | |
| No. 4 – CX – 250 Water Street | ||
The following table presents certain information relating to the historical and current occupancy of the CX – 250 Water Street Property:
| Historical and Current Occupancy(1) | ||||
| 2019 | 2020 | 2021 | 2022 | Current(2) |
| NAV | NAV | NAV | NAV | 98.7% |
| (1) | Historical occupancies are not applicable because the CX – 250 Water Street Property was built in 2022. |
| (2) | Current Occupancy is based on the underwritten rent roll dated as of January 27, 2023. |
The following table presents certain information relating to the sole tenant based on underwritten base rent at the CX – 250 Water Street Property:
| Top Tenant Summary(1) | |||||||||
| Tenant | Ratings Moody’s/S&P/Fitch(2) | Net Rentable Area (SF) | % of Total NRA | UW Base Rent PSF | UW Base Rent | % of Total UW Base Rent | Lease Expiration Date | ||
| E.R. Squibb & Sons LLC | A2/A+/NR | 415,900 | 86.8 | % | $88.50 | $36,807,150 | 86.1 | % | 10/31/2037 |
| E.R. Squibb & Sons LLC(3) | A2/A+/NR | 56,680 | 11.8 | % | $105.00 | $5,951,400 | 13.9 | % | 10/31/2037 |
| Largest Tenants | 472,580 | 98.7 | % | $90.48 | $42,758,550 | 100.0 | % | ||
| Remaining Tenants | 0 | 0.0 | $0.00 | 0 | 0.0 | ||||
| Total Occupied | 472,580 | 98.7 | % | $90.48 | $42,758,550 | 100.0 | % | ||
| Vacant Space | 6,424 | 1.3 | |||||||
| Total / Wtd. Avg. | 479,004 | 100.0 | % | ||||||
| (1) | Based on the underwritten rent roll dated January 27, 2023. |
| (2) | The credit ratings are those of the direct parent company, BMY, which is the guarantor under the leases. |
| (3) | E.R. Squibb & Sons LLC has a contraction option for its floor 9 space on the last day of the 10th lease year (October 31, 2032) with 18-30 months’ notice and a contraction payment equal to an estimated $8.3 million. E.R. Squibb & Sons LLC has subleased a portion of the floor 9 space (45,500 square feet) to Eterna Therapeutics Inc. through October 31, 2032. Eterna Therapeutics Inc. has a termination option in year 7 of the sublease term and has one 5-year extension option. |
| THE INFORMATION IN THIS STRUCTURAL AND COLLATERAL TERM SHEET IS NOT COMPLETE AND MAY BE AMENDED PRIOR TO THE TIME OF SALE. THIS TERM SHEET IS NOT AN OFFER TO SELL THESE SECURITIES AND IT IS NOT A SOLICITATION OF AN OFFER TO BUY THESE SECURITIES IN ANY JURISDICTION WHERE THE OFFER OR SALE IS NOT PERMITTED. | ||
| 48 | ||
| Structural and Collateral Term Sheet | BMO 2023-C6 | |
| No. 4 – CX – 250 Water Street | ||
The following table presents certain information relating to tenant lease expirations at the CX – 250 Water Street Property:
| Lease Rollover Schedule(1)(2) | ||||||||||||||
| Year | Number of Leases Expiring | Net Rentable Area Expiring | % of NRA Expiring | UW Base Rent Expiring | % of UW Base Rent Expiring | Cumulative Net Rentable Area Expiring | Cumulative % of NRA Expiring | Cumulative UW Base Rent Expiring | Cumulative % of UW Base Rent Expiring | |||||
| Vacant | NAP | 6,424 | 1.3 | % | NAP | NAP | 6,424 | 1.3% | NAP | NAP | ||||
| 2023 & MTM | 0 | 0 | 0.0 | $0 | 0.0 | % | 6,424 | 1.3% | $0 | 0.0% | ||||
| 2024 | 0 | 0 | 0.0 | 0 | 0.0 | 6,424 | 1.3% | $0 | 0.0% | |||||
| 2025 | 0 | 0 | 0.0 | 0 | 0.0 | 6,424 | 1.3% | $0 | 0.0% | |||||
| 2026 | 0 | 0 | 0.0 | 0 | 0.0 | 6,424 | 1.3% | $0 | 0.0% | |||||
| 2027 | 0 | 0 | 0.0 | 0 | 0.0 | 6,424 | 1.3% | $0 | 0.0% | |||||
| 2028 | 0 | 0 | 0.0 | 0 | 0.0 | 6,424 | 1.3% | $0 | 0.0% | |||||
| 2029 | 0 | 0 | 0.0 | 0 | 0.0 | 6,424 | 1.3% | $0 | 0.0% | |||||
| 2030 | 0 | 0 | 0.0 | 0 | 0.0 | 6,424 | 1.3% | $0 | 0.0% | |||||
| 2031 | 0 | 0 | 0.0 | 0 | 0.0 | 6,424 | 1.3% | $0 | 0.0% | |||||
| 2032 | 0 | 0 | 0.0 | 0 | 0.0 | 6,424 | 1.3% | $0 | 0.0% | |||||
| 2033 | 0 | �� 0 | 0.0 | 0 | 0.0 | 6,424 | 1.3% | $0 | 0.0% | |||||
| 2034 & Beyond | 2 | 472,580 | 98.7 | 42,758,550 | 100.0 | 479,004 | 100.0% | $42,758,550 | 100.0% | |||||
| Total | 2 | 479,004 | 100.0 | % | $42,758,550 | 100.0 | % | |||||||
| (1) | Based on the underwritten rent roll dated January 27, 2023. |
| (2) | Certain tenants may have lease termination options that are exercisable prior to the originally stated expiration date of the subject lease and that are not considered in the Lease Expiration Schedule |
The following table presents certain information relating to operating history and underwritten cash flows at the CX – 250 Water Street Property:
| Operating History and Underwritten Net Cash Flow(1) | ||||
| Underwritten | Per Square Foot | %(2) | ||
| Rents in Place(3) | $43,079,750 | $89.94 | 68.2 | % |
| Straight Line Rent(4) | 5,689,409 | 11.88 | 9.0 | |
| Total Reimbursements | 12,827,911 | 26.78 | 20.3 | |
| Parking Income | 1,596,600 | 3.33 | 2.5 | |
| Gross Potential Rent | $63,193,670 | $131.93 | 100.0 | % |
| (Vacancy/Credit Loss) | (631,937) | (1.32) | (1.3 | ) |
| Effective Gross Income | $62,561,733 | $130.61 | 99.0 | % |
| Real Estate Taxes | 6,619,604 | 13.82 | 10.6 | |
| Insurance | 355,155 | 0.74 | 0.6 | |
| Management Fee | 1,564,043 | 3.27 | 2.5 | |
| Other Operating Expenses | 4,739,129 | 9.89 | 7.6 | |
| Total Expenses | $13,277,931 | $27.72 | 21.2 | % |
| Net Operating Income | $49,283,802 | $102.89 | 78.8 | % |
| Replacement Reserves | 119,751 | 0.25 | 0.2 | |
| TI/LC | 0 | 0.00 | 0.0 | |
| Net Cash Flow | $49,164,051 | $102.64 | 78.6 | % |
| (1) | Historical financial information is not available because the CX - 250 Water Street Property was built in 2022. |
| (2) | % column represents percent of Gross Potential Rent for all revenue lines and represents percent of Effective Gross Income for the remainder of fields. |
| (3) | Based on the in-place rent roll dated January 27, 2023 for contractual leases. |
| (4) | Straight Line Rent credit was taken for the E.R. Squibb & Sons LLC leases (BMY is the investment grade rated parent company) through the loan term. |
| THE INFORMATION IN THIS STRUCTURAL AND COLLATERAL TERM SHEET IS NOT COMPLETE AND MAY BE AMENDED PRIOR TO THE TIME OF SALE. THIS TERM SHEET IS NOT AN OFFER TO SELL THESE SECURITIES AND IT IS NOT A SOLICITATION OF AN OFFER TO BUY THESE SECURITIES IN ANY JURISDICTION WHERE THE OFFER OR SALE IS NOT PERMITTED. | ||
| 49 | ||
| Structural and Collateral Term Sheet | BMO 2023-C6 | |
| No. 4 – CX – 250 Water Street | ||
The Market. The CX - 250 Water Street Property is located within the Boston core-based statistical area, directly north of the City of Boston and separated from Boston’s central business district by the Charles River. Cambridge is bordered by Somerville to the north and Watertown to the west. Cambridge is acclaimed for its mix of venture capital, National Institutes of Health (“NIH”) funding and state investments. In recent years, Cambridge has become a life sciences and biotechnology hub not only for the Northeast, but for the entire United States. 18 of the top 20 life sciences companies are in East Cambridge. Cambridge is home to over 5,000 private business establishments, including Watson Health, Amgen, Facebook and Apple, among others.
The Cambridge market is best known for its innovation and high concentration of research and development operations. Cambridge has one of the highest densities of college educated people in the world, with three major NIH hospitals and 42 colleges, universities and community colleges in the Boston/Cambridge area, including Harvard University and Massachusetts Institute of Technology. There are over 11,000 undergraduate students and over 11,000 graduate students living in Cambridge.
The following table presents the submarket statistics for the laboratory space in the Cambridge market:
| Submarket | Inventory (SF) | Overall Vacancy Rate | YTD Overall Absorptions (SF) | Under Construction (SF) | Direct Avg. Rent | Direct Avg. Rent (Class A) |
| East Cambridge | 8,159,000 | 3.5% | 0 | 2,169,000 | $102.78 | $110.00 |
| Mid Cambridge | 2,951,620 | 1.0% | (29,562) | 0 | $115.00 | $115.00 |
| West Cambridge | 1,406,102 | 0.0% | 1,589 | 326,616 | $96.18 | $100.00 |
| Total/Wtd. Avg. | 12,516,722 | 2.5% | (27,973) | 2,495,616 | $104.92 | $110.06 |
| THE INFORMATION IN THIS STRUCTURAL AND COLLATERAL TERM SHEET IS NOT COMPLETE AND MAY BE AMENDED PRIOR TO THE TIME OF SALE. THIS TERM SHEET IS NOT AN OFFER TO SELL THESE SECURITIES AND IT IS NOT A SOLICITATION OF AN OFFER TO BUY THESE SECURITIES IN ANY JURISDICTION WHERE THE OFFER OR SALE IS NOT PERMITTED. | ||
| 50 | ||
| Structural and Collateral Term Sheet | BMO 2023-C6 | |
| No. 4 – CX – 250 Water Street | ||
The following table presents certain information relating to comparable office leases in the surrounding market:
| Property | Year Built |
Tenant Name | Lease Start Date | Term (yrs.) | Lease Type | Tenant Size (SF) | Base Rent PSF | Rent Steps/yr | TI PSF |
CX - 250 Water Street(1)(2) Cambridge, MA | 2022 | E.R. Squibb & Sons LLC | Jul/Nov-22 | 15.0 | NNN | 472,580 | $90.48 | 2.53% | $225.00 |
325 Binney Cambridge, MA | 2024 | Moderna Therapeutics | Jan-24 | 15.0 | NNN | 462,000 | $117.00 | 3.00% | $225.00 |
Lab Building Somerville, MA | 2021 | Generate Biomedicines, Inc. | Apr-22 | 10.1 | NNN | 71,330 | $82.30 | 2.75% | $250.00 |
One Rogers/Charles Park Cambridge, MA | 1984 | Flagship Entities | Nov-23 | 10.0 | NNN | 388,000 | $115.00 | 3.00% | $200.00 |
The Richards Building Cambridge, MA | 1989 | Vericel Corporation | Mar-22 | 10.0 | NNN | 57,159 | $102.00 | 3.00% | $75.00 |
University Park Cambridge, MA | 2000 | Brigham and Women's | Feb-21 | 5.0 | NNN | 112,410 | $100.00 | 3.00% | $0.00 |
| Average(3) | 10.0 | 218,180 | $103.26 | $150.00 |
Source: Appraisal.
| (1) | Information is based on the underwritten rent roll dated January 27, 2023. |
| (2) | The information is based on the weighted average of the E.R. Squibb & Sons LLC leases and includes both office and lab spaces. The lease to E.R. Squibb & Sons LLC for floors 1-8 started on November 1, 2022 for 415,900 square feet at a base rent PSF of $88.50 with 2.5% annual increases. The lease to E.R. Squibb & Sons LLC for floor 9 started on July 1, 2022 for 56,680 square feet at a base rent PSF of $105.00 with 2.75% annual increases. |
| (3) | Average excludes the CX - 250 Water Street Property. |
The Borrower. The borrowing entity for the CX - 250 Water Street Whole Loan is DW Propco EF, LLC, a Delaware limited liability company and single purpose entity with two independent directors. There is no non-recourse carveout guarantor or environmental indemnitor for the CX - 250 Water Street Whole Loan separate from the borrower.
The Borrower Sponsors. The borrower sponsors are a joint venture between DivcoWest Real Estate Services, LLC (“Divco”), California State Teachers’ Retirement System (“CalSTRS”) and Teacher Retirement System of Texas (“TRS”).
Founded in 1993, Divco is a multidisciplinary investment firm headquartered in San Francisco, California, with over 190 employees across seven investment offices. Divco is a developer, owner and operator of real estate throughout the United States, with expertise in Boston, having invested in and managed over 22 commercial properties in the area, including offices in the Seaport, Financial District, and East Cambridge submarkets. Most notably, Divco owned and operated One Kendall Square, a life sciences office campus in the Kendall Square submarket. As of March 31, 2023, Divco had over $17.9 billion in assets under management. Since inception, Divco has acquired approximately 60.0 million square feet.
CalSTRS is reported to be the nation’s second largest public pension fund, with assets totaling approximately $315.6 billion as of June 30, 2023. CalSTRS’ investment portfolio is diversified into nine asset categories, including nearly 16.1% (approximately $50.8 billion as of June 30, 2023) allocated to real estate investments in institutional Class A commercial assets across the United States. Divco and CalSTRS have a 20-year history working together, with over $1.5 billion co-invested into various Divco-sponsored investment vehicles.
Established in 1937, TRS provides retirement and related benefits for those employed by the public schools, colleges and universities supported by the State of Texas. As of August 31, 2022, the agency was serving approximately 1.9 million participants and had assets under management of nearly $184 billion. TRS is the largest public retirement system in Texas in both membership and assets.
Property Management. The CX - 250 Water Street Property is managed by DivcoWest Real Estate Services, Inc., an affiliate of the borrower.
Escrows and Reserves. At origination, the borrower was required to deposit into escrow (i) $7,160,274 for a reserve with respect to outstanding tenant improvement allowances and leasing commissions, (ii) $5,932,952 for a base building reserve with respect to construction of the CX - 250 Water Street Property, and (iii) $4,500,617 for a reserve with respect to outstanding linkage fees. The borrower is required to pay the Somerville Affordable Housing Trust Fund linkage fees in the amount of $2,250,309 on August 18, 2023 and August 18, 2024, pursuant to the Project Mitigation Agreement, between the City of Somerville and the borrower.
Tax Escrows – During a Trigger Period (as defined below), the borrower is required to deposit into a real estate tax reserve, on a monthly basis, 1/12th of the estimated annual real estate taxes.
| THE INFORMATION IN THIS STRUCTURAL AND COLLATERAL TERM SHEET IS NOT COMPLETE AND MAY BE AMENDED PRIOR TO THE TIME OF SALE. THIS TERM SHEET IS NOT AN OFFER TO SELL THESE SECURITIES AND IT IS NOT A SOLICITATION OF AN OFFER TO BUY THESE SECURITIES IN ANY JURISDICTION WHERE THE OFFER OR SALE IS NOT PERMITTED. | ||
| 51 | ||
| Structural and Collateral Term Sheet | BMO 2023-C6 | |
| No. 4 – CX – 250 Water Street | ||
Insurance Escrows – During a Trigger Period, or if the borrower fails to maintain a blanket insurance policy, the borrower is required to deposit into an insurance reserve, on a monthly basis, 1/12th of estimated annual insurance premiums.
TI/LC Reserves – During a Lease Sweep Period (as defined below), all excess cash will be swept into the TI/LC reserve.
A “Trigger Period” will occur:
| (i) | commencing upon the ARD (with no cure or end date); |
| (ii) | commencing upon the occurrence of an event of default under the CX - 250 Water Street Whole Loan until such event of default is waived or cured; |
| (iii) | commencing when the debt service coverage ratio is less than 1.45x based on the CX - 250 Water Street Whole Loan for two consecutive calendar quarters, and ending upon the earlier to occur of (x) the debt service coverage ratio based on the CX - 250 Water Street Whole Loan being equal to or greater than 1.45x for two consecutive calendar quarters and (y) funds on deposit in the cash collateral account (without regard to prior disbursements from such account) equaling or exceeding $23,950,200; or |
| (iv) | during a Lease Sweep Period. |
A “Lease Sweep Period” will commence (prior to the ARD) upon:
(i) the earliest to occur of:
(a) the date that is 12 months prior to the earliest stated expiration of the Lease Sweep Lease (as defined below);
(b) the last date under such Lease Sweep Lease that the tenant has the right to give notice of its exercise of a renewal option; or
(c) with respect to any Lease Sweep Lease that is a Short Term Qualifying Lease (as defined below), the date that is 12 months prior to the ARD or the date that the lender reasonably determines that a Lease Sweep Period should commence in order for the aggregate amount of projected deposits into the rollover account for the period commencing on such date through the ARD to equal the Lease Sweep Deposit Amount (as defined below);
(ii) the date of the early termination, early cancellation or early surrender of a Lease Sweep Lease (or any material portion thereof) prior to its then current expiration date or the receipt by the borrower or manager of written notice from the tenant under a Lease Sweep Lease of its intent to effect an early termination, early cancellation or early surrender of such Lease Sweep Lease prior to its then current expiration date;
(iii) solely with respect to any Lease Sweep Lease under which neither the applicable tenant, nor any lease guarantor is an investment-grade entity, if such tenant has ceased operating its business (i.e., “goes dark”) in a majority of its leased space at the CX – 250 Water Street Property and the same has not been subleased in accordance with the terms of the CX – 250 Water Street Whole Loan documents, pursuant to a sublease on the same or substantially similar or better terms as the applicable Lease Sweep Lease;
(iv) a monetary or material non-monetary default under a Lease Sweep Lease by the tenant; or
(v) the occurrence of an insolvency proceeding with respect to the tenant under a Lease Sweep Lease, its parent company or any lease guarantor.
A Lease Sweep Period will end upon:
| (A) | if triggered in the case of clause (i), (ii), (iii) and (iv) above, the entirety of the Lease Sweep Lease space is leased pursuant to one or more qualified leases and in the lender’s reasonable judgment, sufficient funds have been accumulated in the rollover account; |
| (B) | if triggered in the case of clause (i) above, the date on which the tenant under the Lease Sweep Lease irrevocably exercises its renewal or extension option or otherwise extends its Lease Sweep Lease in accordance with the terms of the CX – 250 Water Street Whole Loan documents with respect to all of its Lease Sweep Lease space, and, in the lender’s reasonable judgment, sufficient funds have been accumulated in the rollover account; |
| (C) | if triggered in the case of clause (ii) above, if the tenant under the applicable Lease Sweep Lease rescinds in writing the exercise of its notice exercising its early termination, cancellation or surrender right or option; |
| (D) | if triggered in the case of clause (iii) above, the circumstances giving rise to a Lease Sweep Period under clause (iii) no longer exist; |
| THE INFORMATION IN THIS STRUCTURAL AND COLLATERAL TERM SHEET IS NOT COMPLETE AND MAY BE AMENDED PRIOR TO THE TIME OF SALE. THIS TERM SHEET IS NOT AN OFFER TO SELL THESE SECURITIES AND IT IS NOT A SOLICITATION OF AN OFFER TO BUY THESE SECURITIES IN ANY JURISDICTION WHERE THE OFFER OR SALE IS NOT PERMITTED. | ||
| 52 | ||
| Structural and Collateral Term Sheet | BMO 2023-C6 | |
| No. 4 – CX – 250 Water Street | ||
| (E) | if triggered in the case of clause (iv) above, the date on which the subject default has been cured; |
| (F) | if triggered in the case of clause (v) above, either (1) the applicable insolvency proceeding has terminated and the applicable Lease Sweep Lease has been affirmed, assumed or assigned in a manner reasonably satisfactory to the lender or (2) the applicable Lease Sweep Lease has been assumed or assumed and assigned to a third party in a manner reasonably satisfactory to the lender; |
| (G) | if triggered in the case of clauses (i), (ii), (iii), (iv) and/or (v) above, the CX - 250 Water Street Property has achieved a debt yield of not less than 7.5% and, in the lender’s reasonable judgment, sufficient funds have been accumulated in the rollover account; or |
| (H) | if triggered in the case of clauses (i), (ii), (iii), (iv) and/or (v) above, the date on which funds in the rollover account collected with respect to the Lease Sweep Lease space in question is equal to the Lease Sweep Deposit Amount applicable to such Lease Sweep Lease space. |
A “Lease Sweep Lease” means (i) the E.R. Squibb & Sons, LLC leases at the CX - 250 Water Street Property and (ii) any replacement lease that, either individually or when taken together with any other lease with the same tenant or its affiliates, covers the majority of the Lease Sweep Lease space.
A “Lease Sweep Tenant” means any tenant under a Lease Sweep Lease.
A “Lease Sweep Deposit Amount” means an amount equal to the total rentable square feet of the applicable Lease Sweep Lease space that is the subject of a Lease Sweep Period multiplied by $50.00.
A “Short Term Qualifying Lease” means any “qualified lease” that has an initial term which does not extend at least two years beyond the ARD.
Lockbox / Cash Management. The CX - 250 Water Street Whole Loan is structured with a hard lockbox and springing cash management. All rents are required to be deposited directly into a lender-controlled lockbox account. During a Trigger Period, funds on deposit in the lockbox account are required to be swept on a daily basis into a lender-controlled cash management account. Prior to the ARD (except during the continuance of an event of default under the CX – 250 Water Street Whole Loan), all excess cash is required to be transferred to a lender-controlled account as additional collateral for the CX - 250 Water Street Whole Loan, subject to certain permitted uses by the borrower described in the CX – 250 Water Street Whole Loan documents, and except as described with respect to a Lease Sweep Period. If the CX - 250 Water Street Whole Loan is not paid by the ARD, from and after the ARD, the CX - 250 Water Street Whole Loan will accrue interest at the Adjusted Interest Rate; however, interest accrued at the excess of the Adjusted Interest Rate over the initial interest rate will be deferred.
On and after the ARD (except during the continuance of an event of default under the CX – 250 Water Street Whole Loan), all amounts on deposit in the cash management account after payment of debt service, required reserves and budgeted operating expenses will be required to be applied to the prepayment of the outstanding principal balance of the CX - 250 Water Street Whole Loan until the outstanding principal balance has been reduced to zero and then to any excess interest until the excess interest has been reduced to zero.
Subordinate Debt. None.
Mezzanine Debt. None.
Partial Release. Not Permitted.
Ground Lease. None.
| THE INFORMATION IN THIS STRUCTURAL AND COLLATERAL TERM SHEET IS NOT COMPLETE AND MAY BE AMENDED PRIOR TO THE TIME OF SALE. THIS TERM SHEET IS NOT AN OFFER TO SELL THESE SECURITIES AND IT IS NOT A SOLICITATION OF AN OFFER TO BUY THESE SECURITIES IN ANY JURISDICTION WHERE THE OFFER OR SALE IS NOT PERMITTED. | ||
| 53 | ||
| Structural and Collateral Term Sheet | BMO 2023-C6 | |
| No. 5 – Marriott Philadelphia West | ||

| THE INFORMATION IN THIS STRUCTURAL AND COLLATERAL TERM SHEET IS NOT COMPLETE AND MAY BE AMENDED PRIOR TO THE TIME OF SALE. THIS TERM SHEET IS NOT AN OFFER TO SELL THESE SECURITIES AND IT IS NOT A SOLICITATION OF AN OFFER TO BUY THESE SECURITIES IN ANY JURISDICTION WHERE THE OFFER OR SALE IS NOT PERMITTED. | ||
| 54 | ||
| Structural and Collateral Term Sheet | BMO 2023-C6 | |
| No. 5 – Marriott Philadelphia West | ||

| THE INFORMATION IN THIS STRUCTURAL AND COLLATERAL TERM SHEET IS NOT COMPLETE AND MAY BE AMENDED PRIOR TO THE TIME OF SALE. THIS TERM SHEET IS NOT AN OFFER TO SELL THESE SECURITIES AND IT IS NOT A SOLICITATION OF AN OFFER TO BUY THESE SECURITIES IN ANY JURISDICTION WHERE THE OFFER OR SALE IS NOT PERMITTED. | ||
| 55 | ||
| Structural and Collateral Term Sheet | BMO 2023-C6 | |
| No. 5 – Marriott Philadelphia West | ||
| Mortgage Loan Information | Property Information | |||
| Mortgage Loan Seller: | WFB, AREF2 | Single Asset / Portfolio: | Single Asset | |
| Original Principal Balance(1): | $34,000,000 | Title: | Fee | |
| Cut-off Date Principal Balance(1): | $33,979,723 | Property Type - Subtype: | Hospitality – Full Service | |
| % of Pool by IPB: | 5.6% | Net Rentable Area (Rooms): | 289 | |
| Loan Purpose: | Refinance | Location: | West Conshohocken, PA | |
| Borrower: | CP Philly West, LLC | Year Built / Renovated: | 1991 / 2021 | |
| Borrower Sponsors: | William J. Yung III, Martha Yung, | Occupancy / ADR / RevPAR: | 55.1% / $193.78 / $106.76 | |
| William J. Yung IV, Joseph A. Yung, | Occupancy / ADR / RevPAR Date: | TTM 3/31/2023 | ||
| Julie A. Haught, Judith A. Yung, | 4th Most Recent NOI (As of)(3): | $70,585 (12/31/2020) | ||
| Jennifer A. Yung, Michelle M. | 3rd Most Recent NOI (As of)(3): | $2,859,922 (12/31/2021) | ||
| Christensen and Scott A. Yung | 2nd Most Recent NOI (As of)(3): | $5,347,365 (12/31/2022) | ||
| Interest Rate: | 7.15400% | Most Recent NOI (As of): | $5,579,727 (TTM 3/31/2023) | |
| Note Date: | 6/28/2023 | UW Occupancy / ADR / RevPAR: | 55.1% / $193.78 / $106.76 | |
| Maturity Date: | 7/11/2033 | UW Revenues: | $15,006,239 | |
| Interest-only Period: | None | UW Expenses: | $9,450,393 | |
| Original Term: | 120 months | UW NOI: | $5,555,846 | |
| Original Amortization Term: | 360 months | UW NCF: | $4,805,534 | |
| Amortization Type: | Amortizing Balloon | Appraised Value / Per Room: | $78,400,000 / $271,280 | |
| Call Protection(2): | L(25),D(91),O(4) | Appraisal Date: | 4/28/2023 | |
| Lockbox / Cash Management: | Hard / Springing | |||
| Additional Debt(1): | Yes | |||
| Additional Debt Balance(1): | $4,997,018 | |||
| Additional Debt Type(1): | Pari Passu | |||
| Escrows and Reserves(4) | Financial Information(1) | |||||
| Initial | Monthly | Initial Cap | Cut-off Date Loan / Room: | $134,868 | ||
| Taxes: | $63,756 | $31,878 | N/A | Maturity Date Loan / Room: | $118,215 | |
| Insurance: | $0 | Springing | N/A | Cut-off Date LTV: | 49.7% | |
| FF&E Reserve: | $0 | $62,526 | N/A | Maturity Date LTV: | 43.6% | |
| Other Reserves(5): | $311,000 | Springing | $311,000 | UW NCF DSCR: | 1.52x | |
| UW NOI Debt Yield: | 14.3% | |||||
| Sources and Uses | |||||||
| Sources | Proceeds | % of Total | Uses | Proceeds | % of Total | ||
| Whole Loan | $39,000,000 | 100.0% | Loan Payoff | $33,348,176 | 85.5 | % | |
| Return of Equity | 4,923,168 | 12.6 | |||||
| Upfront Reserves | 374,756 | 1.0 | |||||
| Closing Costs | 353,900 | 0.9 | |||||
| Total Sources | $39,000,000 | 100.0% | Total Uses | $39,000,000 | 100.0 | % | |
| (1) | The Marriott Philadelphia West Mortgage Loan (as defined below) is part of the Marriott Philadelphia West Whole Loan (as defined below), which is comprised of three pari passu promissory notes with an aggregate original balance of $39,000,000. The Marriott Philadelphia West Whole Loan was originated by Wells Fargo Bank, National Association (“WFB”). For additional information, see “The Loan” below. The financial information presented above is calculated based on the Marriott Philadelphia West Whole Loan |
| (2) | Defeasance of the Marriott Philadelphia West Whole Loan is permitted at any time after the earlier to occur of (a) the end of the two-year period commencing on the closing date of the securitization of the last promissory note representing a portion of the Marriott Philadelphia West Whole Loan to be securitized and (b) July 11, 2026. The assumed defeasance lockout period of 25 payments is based on the anticipated closing date of the BMO 2023-C6 securitization trust in August 2023. The actual lockout period may be longer. |
| (3) | The increase in NOI from 2020 to 2021 and from 2021 to 2022 was primarily due to the effect of the novel coronavirus on the hospitality industry in 2020, and the subsequent recovery in 2021, as well as a 20.5% increase in ADR and 13.2% increase in occupancy from 2021 to 2022 and increased Food & Beverage revenue. |
| (4) | For full description of Escrows and Reserves, see “Escrows and Reserves” below. |
| (5) | Other Reserves include an initial seasonality reserve of $311,000 and a springing monthly seasonality reserve of $44,430. See “Escrows and Reserves” below. |
| THE INFORMATION IN THIS STRUCTURAL AND COLLATERAL TERM SHEET IS NOT COMPLETE AND MAY BE AMENDED PRIOR TO THE TIME OF SALE. THIS TERM SHEET IS NOT AN OFFER TO SELL THESE SECURITIES AND IT IS NOT A SOLICITATION OF AN OFFER TO BUY THESE SECURITIES IN ANY JURISDICTION WHERE THE OFFER OR SALE IS NOT PERMITTED. | ||
| 56 | ||
| Structural and Collateral Term Sheet | BMO 2023-C6 | |
| No. 5 – Marriott Philadelphia West | ||
The Loan. The fifth largest mortgage loan (the “Marriott Philadelphia West Mortgage Loan”) is part of a whole loan (the “Marriott Philadelphia West Whole Loan”) evidenced by three pari passu promissory notes in the aggregate original principal amount of $39,000,000 secured by a first lien mortgage on the borrower’s fee interest in a 289-room full-service hospitality property located in West Conshohocken, Pennsylvania (the “Marriott Philadelphia West Property”). The Marriott Philadelphia West Whole Loan was originated on June 28, 2023 by Wells Fargo Bank, National Association (“WFB”) and has a 10-year term that amortizes on a 30-year amortization schedule and accrues interest at a fixed rate of 7.15400% per annum. The non-controlling Notes A-2-1 and -A-2-2, which had an original principal balance of $12,500,000, was sold to Argentic Real Estate Finance 2, LLC (“AREF2”) on June 30, 2023. The scheduled maturity date of the Marriott Philadelphia West Whole Loan is July 11, 2033. The Marriott Philadelphia West Mortgage Loan is evidenced by the controlling Note A-1 and the non-controlling Note A-2-2, with an aggregate outstanding principal balance as of the Cut-off Date of $33,979,723. The Marriott Philadelphia West Whole Loan will be serviced pursuant to the pooling and servicing agreement for the BMO 2023-C6 securitization. See “Description of the Mortgage Pool—The Whole Loans—The Serviced Pari Passu Whole Loans” in the Preliminary Prospectus.
| Whole Loan Summary | ||||
| Note | Original Balance | Cut-off Date Balance | Note Holder | Controlling Piece |
| A-1 | $26,500,000 | $26,484,196 | BMO 2023-C6 | Yes |
| A-2-1 | $7,500,000 | $7,495,527 | BMO 2023-C6 | No |
| A-2-2 | $5,000,000 | $4,997,018 | AREF2(1) | No |
| Whole Loan | $39,000,000 | $38,976,741 | ||
| (1) | Expected to be contributed to one or more future securitization transactions. |
The Property. The Marriott Philadelphia West Property is a 17-story, 289-room, full-service hotel located in West Conshohocken, Pennsylvania. The Marriott Philadelphia West Property was originally constructed in 1991 and the sponsor has invested approximately $6.2 million ($21,594 per key) on capital expenditures between 2018 and 2022. Renovations included upgrades to guestroom bathrooms and soft goods as well as improvements to meeting space.
The Marriott Philadelphia West Property contains 185 king guestrooms, 97 double queen guestrooms, three queen guestrooms and four double guestrooms. Amenities at the Marriott Philadelphia West Property include approximately 7,600 square feet of meeting space, a restaurant (Legends Bar & Grill/170 seats), two rewards member lounges, an indoor pool, fitness center, and business center. In addition, the Marriott Philadelphia West Property includes 351 parking spaces via a four-story parking garage located adjacent to the east side of the hotel as well as surface parking.
The franchise agreement between the borrower and Marriott International, Inc. (“Marriott”), commenced on January 9, 2018 and expires on January 9, 2038. Among other things, the franchise agreement requires the borrower to pay Marriott, on a monthly basis, a royalty fee of 6.0% of gross room revenue and 3.0% of gross food and beverage revenue.
The Marriott Philadelphia West Property is the only full service hotel in the Conshohocken submarket. According to the appraisal, the estimated demand segmentation for the Marriott Philadelphia West Property consisted of 50.0% commercial, 30.0% meeting and group, and 20.0% leisure.
The following table presents certain information relating to the demand analysis with respect to the Marriott Philadelphia West Property based on market segmentation, as provided by the appraisal:
| Demand Segmentation(1) | |||||
| Property | Rooms | Meeting & Group | Leisure | Commercial | |
| Marriott Philadelphia West | 289 | 30% | 20% | 50% | |
| (1) | Source: Appraisal |
| THE INFORMATION IN THIS STRUCTURAL AND COLLATERAL TERM SHEET IS NOT COMPLETE AND MAY BE AMENDED PRIOR TO THE TIME OF SALE. THIS TERM SHEET IS NOT AN OFFER TO SELL THESE SECURITIES AND IT IS NOT A SOLICITATION OF AN OFFER TO BUY THESE SECURITIES IN ANY JURISDICTION WHERE THE OFFER OR SALE IS NOT PERMITTED. | ||
| 57 | ||
| Structural and Collateral Term Sheet | BMO 2023-C6 | |
| No. 5 – Marriott Philadelphia West | ||
The following tables present certain information relating to the current and historical occupancy, ADR and RevPAR at the Marriott Philadelphia West Property and its competitors:
| Historical Occupancy, ADR, RevPAR(1)(2) | |||||||||
| Competitive Set | Marriott Philadelphia West(3) | Penetration Factor | |||||||
| Year | Occupancy | ADR | RevPAR | Occupancy | ADR | RevPAR | Occupancy | ADR | RevPAR |
| 2019 | 66.5% | $136.05 | $90.54 | 60.5% | $187.70 | $113.58 | 90.9% | 138.0% | 125.4% |
| 2020 | 31.9% | $112.36 | $35.82 | 24.3% | $155.84 | $37.94 | 76.4% | 138.7% | 105.9% |
| 2021 | 42.8% | $123.78 | $53.04 | 40.7% | $157.19 | $63.95 | 94.9% | 127.0% | 120.6% |
| 2022 | 52.6% | $145.98 | $76.82 | 53.9% | $189.48 | $102.09 | 102.4% | 129.8% | 132.9% |
| TTM(4) | 56.0% | $150.21 | $84.17 | 54.3% | $198.23 | $107.73 | 97.0% | 132.0% | 128.0% |
| (1) | Variances between the underwriting, the appraisal and the above table with respect to Occupancy, ADR and RevPAR at the Marriott Philadelphia West Property are attributable to variances in reporting methodologies and/or timing differences. |
| (2) | Occupancy, ADR and RevPAR for the Competitive Set and the Marriott Philadelphia West Property TTM are based on data provided by a third-party hospitality research report. The Competitive Set includes Crowne Plaza Philadelphia King of Prussia, DoubleTree by Hilton Hotel Suites Hotel Philadelphia West, Embassy Suites by Hilton Philadelphia Valley Forge, Hyatt House Philadelphia Plymouth Meeting, Residence Inn Philadelphia Conshohocken, Hyatt House King of Prussia, DoubleTree by Hilton, the Alloy King of Prussia and Sheraton Hotel Valley Forge. |
| (3) | 2019-2022 Occupancy, ADR and RevPAR for the Marriott Philadelphia West Property are based on the underwritten cash flow. |
| (4) | TTM represents the trailing 12-month period ending June 30, 2023. |
Environmental. According to the Phase I environmental assessment dated May 4, 2023, there was no evidence of any recognized environmental conditions at the Marriott Philadelphia West Property.
The following table presents certain information relating to the operating history and underwritten cash flows of the Marriott Philadelphia West Property:
| Operating History and Underwritten Net Cash Flow | |||||||||
| 2019 | 2020 | 2021 | 2022 | TTM(1) | Underwritten | Per Room(2) | %(3) | ||
| Occupancy | 60.5% | 24.3% | 40.7% | 53.9% | 55.1% | 55.1% | |||
| ADR | $187.70 | $155.84 | $157.19 | $189.48 | $193.78 | $193.78 | |||
| RevPAR | $113.58 | $37.94 | $63.95 | $102.09 | $106.76 | $106.76 | |||
| Room Revenue | $11,980,954 | $4,012,740 | $6,745,622 | $10,768,482 | $11,261,755 | $11,261,755 | $38,968 | 75.0 | % |
| Food & Beverage Revenue | 4,361,506 | 821,926 | 1,912,290 | 3,122,469 | 3,300,335 | 3,300,335 | 11,420 | 22.0 | |
| Other Revenue(4) | 472,471 | 311,058 | 417,283 | 442,573 | 444,149 | 444,149 | 1,537 | 3.0 | |
| Total Revenue | $16,814,931 | $5,145,725 | $9,075,195 | $14,333,524 | $15,006,239 | $15,006,239 | $51,925 | 100.0 | % |
| Room Expense | $2,708,296 | $1,197,512 | $1,787,227 | $2,650,319 | $2,790,059 | $2,790,059 | $9,654 | 24.8 | % |
| Food & Beverage Expense | 2,620,528 | 597,696 | 947,831 | 1,541,935 | 1,654,174 | 1,654,174 | 5,724 | 50.1 | |
| Other Departmental Expenses | 22,571 | 9,151 | 11,350 | 17,091 | 17,522 | 17,522 | 61 | 3.9 | |
| Departmental Expenses | $5,351,395 | $1,804,360 | $2,746,409 | $4,209,345 | $4,461,755 | $4,461,755 | $15,439 | 29.7 | % |
| Departmental Profit | $11,463,536 | $3,341,365 | $6,328,786 | $10,124,179 | $10,544,484 | $10,544,484 | $36,486 | 70.3 | % |
| Management Fee | $487,365 | $151,420 | $265,208 | $418,089 | $437,395 | $450,187 | $1,558 | 3.0 | % |
| Marketing and Franchise Fee | 2,268,903 | 731,381 | 952,099 | 1,452,502 | 1,537,904 | 1,537,904 | 5,321 | 10.2 | |
| Other Undistributed Expenses | 2,229,165 | 1,526,861 | 1,567,923 | 2,101,921 | 2,174,245 | 2,174,245 | 7,523 | 14.5 | |
| Total Undistributed Expenses | $4,985,434 | $2,409,662 | $2,785,230 | $3,972,512 | $4,149,544 | $4,162,336 | $14,403 | 27.7 | % |
| Real Estate Taxes | $485,972 | $494,380 | $275,052 | $355,452 | $360,670 | $371,759 | $1,286 | 2.5 | % |
| Property Insurance | 391,452 | 366,739 | 408,582 | 448,850 | 454,543 | 454,543 | 1,573 | 3.0 | |
| Net Operating Income(5) | $5,600,678 | $70,585 | $2,859,922 | $5,347,365 | $5,579,727 | $5,555,846 | $19,224 | 37.0 | % |
| FF&E | 0 | 0 | 0 | 0 | 0 | 750,312 | 2,596 | 5.0 | |
| Net Cash Flow | $5,600,678 | $70,585 | $2,859,922 | $5,347,365 | $5,579,727 | $4,805,534 | $16,628 | 32.0 | % |
| (1) | TTM represents the trailing 12-month period ending March 31, 2023. |
| (2) | Per Room values are based on 289 rooms. |
| (3) | % column represents percent of Total Revenue except for Room Expense, Food & Beverage Expense and Other Departmental Expenses which are based on their corresponding revenue line items. |
| (4) | Other Revenue includes primarily rental income (rooftop) and telephone/internet revenue. |
| (5) | The decrease in Net Operating Income (“NOI”) from 2019 to 2020 and the increase in NOI from 2020 to 2021 and from 2021 to 2022 was primarily due to the effect of the novel coronavirus on the hospitality industry in 2020, and the subsequent recovery in 2021, as well as a 20.5% increase in ADR and 13.2% increase in occupancy from 2021 to 2022 and increased Food & Beverage revenue. |
| THE INFORMATION IN THIS STRUCTURAL AND COLLATERAL TERM SHEET IS NOT COMPLETE AND MAY BE AMENDED PRIOR TO THE TIME OF SALE. THIS TERM SHEET IS NOT AN OFFER TO SELL THESE SECURITIES AND IT IS NOT A SOLICITATION OF AN OFFER TO BUY THESE SECURITIES IN ANY JURISDICTION WHERE THE OFFER OR SALE IS NOT PERMITTED. | ||
| 58 | ||
| Structural and Collateral Term Sheet | BMO 2023-C6 | |
| No. 5 – Marriott Philadelphia West | ||
The Market. The Marriott Philadelphia West Property is located on the corner of Crawford Avenue and Front Street in downtown West Conshohocken, Pennsylvania, approximately 14.2 miles northwest of Philadelphia. The Marriott Philadelphia West Property is located along the Schuykill River and is in an area primarily comprised of residential and commercial uses including hotel, retail, office, and restaurants. Villanova University is located 3.3 miles south of the Marriott Philadelphia West Property and King of Prussia Mall is approximately 5 miles west of the Marriott Philadelphia West Property. The Marriott Philadelphia West Property benefits from access to Interstate 76 and the Philadelphia International Airport, which is approximately 21.0 miles south of the Marriott Philadelphia West Property. According to the appraisal, the Marriott Philadelphia West Property is located in an affluent area with estimated 2022 average household income of $162,299 within the 3.0 mile radius.
According to the appraisal, there are no directly competitive properties that are either proposed or under construction in the subject area.
The following table presents certain information relating to the primary competition for the Marriott Philadelphia West Property:
| Competitive Set(1) | |||||
| Property | Number of Rooms | Year Built | Estimated 2022 Occupancy | Estimated 2022 ADR | Estimated 2022 RevPAR |
| Marriott Philadelphia West(2) | 289 | 1991 | 55.1% | $193.78 | $106.76 |
| Courtyard Philadelphia City Avenue | 333 | 1986 | 45.0% - 50.0% | $130.00 - $140.00 | $60.00 - $70.00 |
| Hilton Philadelphia City Avenue | 207 | N/A | 45.0% - 50.0% | $180.00 - $190.00 | $80.00 - $90.00 |
| Crowne Plaza Philadelphia King of Prussia | 227 | 1969 | 50.0% - 55.0% | $140.00 - $150.00 | $70.00 - $80.00 |
| DoubleTree by Hilton the Alloy King of Prussia | 327 | 1971 | 45.0% - 50.0% | $140.00 - $150.00 | $60.00 - $70.00 |
| Sheraton Hotel Valley Forge | 180 | 1973 | 55.0% - 60.0% | $170.00 - $180.00 | $90.00 - $100.00 |
| Residence Inn Philadelphia Conshohocken | 137 | 2001 | 50.0% - 55.0% | $180.00 - $190.00 | $100.00 - $110.00 |
| DoubleTree by Hilton Hotel Suites Hotel Philadelphia West | 253 | 1994 | 45.0% - 50.0% | $130.00 - $140.00 | $50.00 - $60.00 |
| Total Avg. Competitive Set | 49.2% | $159.82 | $78.66 | ||
| (1) | Source: Appraisal. |
| (2) | Occupancy, ADR and RevPAR are based on operating statements provided by the borrower dated as of March 31, 2023. |
The Borrower. The borrower is CP Philly West, LLC a Delaware limited liability company and single-purpose entity with one independent director in its organizational structure. Legal counsel to the borrower delivered a non-consolidation opinion in connection with the origination of the Marriott Philadelphia West Whole Loan.
The Borrower Sponsors. The borrower sponsors are William J. Yung III, Martha Yung, William J. Yung IV, Joseph A. Yung, Julie A. Haught, Judith A. Yung, Jennifer A. Yung, Michelle M. Christensen and Scott A. Yung. The non-recourse carveout guarantor is CSC Holdings, LLC, an affiliate of Columbia Sussex Corporation (“CSC”). Founded in 1972, CSC is a privately-owned hospitality company headquartered in Crestview Hills, Kentucky. CSC currently owns 41 hotels across 18 states with major hospitality brands including Marriott, Hilton, and Hyatt.
CSC has had numerous properties subject to foreclosures and deeds in lieu of foreclosure since 2009. For additional information please see “Description of the Mortgage Pool - Default History, Bankruptcy Issues and Other Proceedings” in the Preliminary Prospectus.
Property Management. The Marriott Philadelphia West Property is currently managed by Crestview Management, LLC, an affiliate of the borrower sponsors.
Escrows and Reserves. At origination of the Marriott Philadelphia West Whole Loan, the borrower deposited approximately (i) $63,756 into a real estate tax reserve account and (ii) $311,000 into a seasonality reserve account.
Tax Escrows – The borrower is required to deposit into a real estate tax reserve, on a monthly basis, 1/12th of the taxes that the lender reasonably estimates will be payable over the next-ensuing 12-month period (initially estimated to be $31,878).
Insurance Reserve – The borrower is required to deposit into an insurance reserve, on a monthly basis, 1/12th of the amount which would be sufficient to pay the insurance premiums due for the renewal of coverage afforded by such policies; provided, however, such insurance reserve has been conditionally waived provided (i) no event of default is continuing and (ii) the
| THE INFORMATION IN THIS STRUCTURAL AND COLLATERAL TERM SHEET IS NOT COMPLETE AND MAY BE AMENDED PRIOR TO THE TIME OF SALE. THIS TERM SHEET IS NOT AN OFFER TO SELL THESE SECURITIES AND IT IS NOT A SOLICITATION OF AN OFFER TO BUY THESE SECURITIES IN ANY JURISDICTION WHERE THE OFFER OR SALE IS NOT PERMITTED. | ||
| 59 | ||
| Structural and Collateral Term Sheet | BMO 2023-C6 | |
| No. 5 – Marriott Philadelphia West | ||
insurance policies maintained by borrower are part of a blanket or umbrella policy approved by the lender in its reasonable discretion. At origination of the Marriott Philadelphia West Whole Loan, an acceptable blanket policy was in place.
FF&E Reserve – The borrower is required to deposit into a furniture, fixtures and equipment (“FF&E”) reserve, on a monthly basis, an amount equal to the greater of (i) the then-existing FF&E Reserve monthly deposit for the prior period or (ii) greater of 1/12th or 5% of the underwritten revenue for the prior fiscal year or the amount required pursuant to the terms of the franchise agreement (initially estimated to be approximately $62,526).
Seasonality Reserve – The borrower is required to deposit ongoing monthly deposits in certain months in an amount equal to 1/7th of the Seasonality Reserve Required Annual Balance (as defined below) to cover any debt service shortfalls in the months of January, February, and/or March, provided however, that the borrowers are only required to make these deposits if the funds on deposit in the Seasonality Reserve are less than $311,000 (the “Seasonality Reserve Required Annual Balance”). For the monthly payments dates occurring in May, June, July, August, September, October, and November, the borrowers are required to deposit $44,430 into the Seasonality Reserve account.
PIP Reserve – If, at any time, any Property Improvement Plan (“PIP”) work is required by the franchisor under the franchise agreement, within 15 days after receipt of notice from the franchisor with respect to such PIP work, the Marriott Philadelphia West Whole Loan documents require a springing deposit in an amount equal to 110% of the estimated costs to complete such additional PIP work, as reasonably determined by the lender.
Lockbox / Cash Management. The Marriott Philadelphia West Whole Loan is structured with a hard lockbox and springing cash management. The borrower is required to deliver direction letters to each of the credit card companies with which borrower has entered into a merchant’s or other credit card agreement directing them to pay to the lender-controlled lockbox account all payments which would otherwise be paid to borrower under the applicable credit card processing agreement. The borrower is required to (or cause the property manager to) deposit all revenue generated by the Marriott Philadelphia West Property into the lender-controlled lockbox account within one business day. All funds deposited into the lockbox are required to be transferred on each business day to or at the direction of the borrower unless a Marriott Philadelphia West Trigger Period (as defined below) exists. Upon the occurrence and during the continuance of an Marriott Philadelphia West Trigger Period, all funds in the lockbox account are required to be swept on each business day to a cash management account under the control of the lender to be applied and disbursed in accordance with the Marriott Philadelphia West Whole Loan documents, and all excess cash flow funds remaining in the cash management account after the application of such funds in accordance with the Marriott Philadelphia West Whole Loan documents may be held by the lender in an excess cash flow reserve account as additional collateral for the Marriott Philadelphia West Whole Loan.
An “Marriott Philadelphia West Trigger Period” means a period (A) commencing upon the occurrence of any of the following: (i) the occurrence of an event of default, or (ii) the debt service coverage ratio falling below 1.30x (tested quarterly), and (B) expiring upon the occurrence (i) with respect to any Marriott Philadelphia West Trigger Period caused solely by the events described in clause (i) above, the acceptance by lender of a cure of such event of default, or (ii) with regard to any Marriott Philadelphia West Trigger Period caused solely by the events described in clause (ii) above, the debt service coverage ratio being equal to or greater than 1.30x for one calendar quarter.
Subordinate Debt. None.
Mezzanine Debt. None.
Partial Release. Not Permitted.
Ground Lease. None.
| THE INFORMATION IN THIS STRUCTURAL AND COLLATERAL TERM SHEET IS NOT COMPLETE AND MAY BE AMENDED PRIOR TO THE TIME OF SALE. THIS TERM SHEET IS NOT AN OFFER TO SELL THESE SECURITIES AND IT IS NOT A SOLICITATION OF AN OFFER TO BUY THESE SECURITIES IN ANY JURISDICTION WHERE THE OFFER OR SALE IS NOT PERMITTED. | ||
| 60 | ||
| Structural and Collateral Term Sheet | BMO 2023-C6 | |
| No. 6 – Maple Creek Village | ||
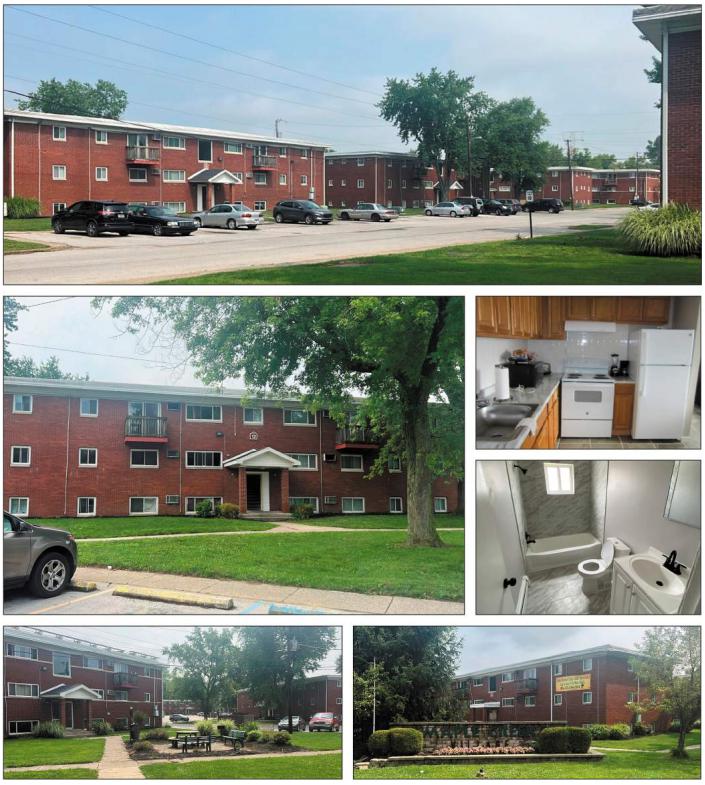
| THE INFORMATION IN THIS STRUCTURAL AND COLLATERAL TERM SHEET IS NOT COMPLETE AND MAY BE AMENDED PRIOR TO THE TIME OF SALE. THIS TERM SHEET IS NOT AN OFFER TO SELL THESE SECURITIES AND IT IS NOT A SOLICITATION OF AN OFFER TO BUY THESE SECURITIES IN ANY JURISDICTION WHERE THE OFFER OR SALE IS NOT PERMITTED. | ||
| 61 | ||
| Structural and Collateral Term Sheet | BMO 2023-C6 | |
| No. 6 – Maple Creek Village | ||
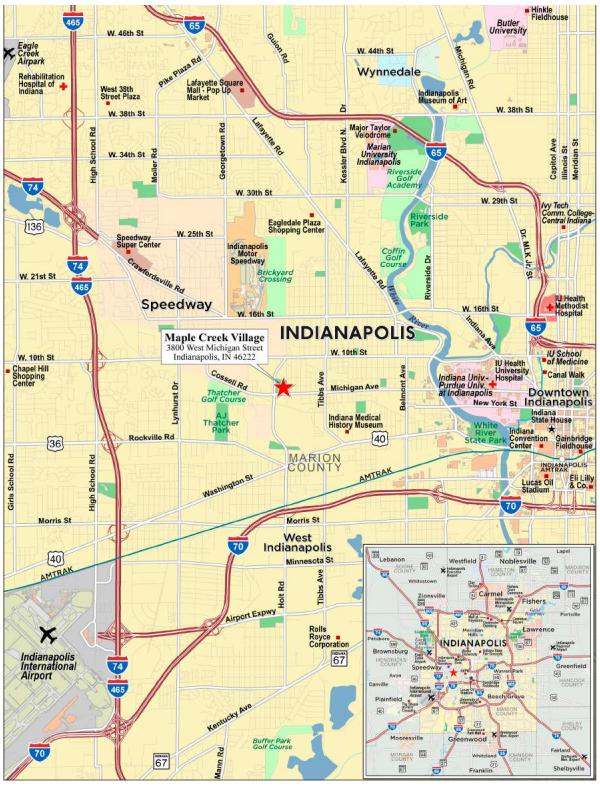
| THE INFORMATION IN THIS STRUCTURAL AND COLLATERAL TERM SHEET IS NOT COMPLETE AND MAY BE AMENDED PRIOR TO THE TIME OF SALE. THIS TERM SHEET IS NOT AN OFFER TO SELL THESE SECURITIES AND IT IS NOT A SOLICITATION OF AN OFFER TO BUY THESE SECURITIES IN ANY JURISDICTION WHERE THE OFFER OR SALE IS NOT PERMITTED. | ||
| 62 | ||
| Structural and Collateral Term Sheet | BMO 2023-C6 | |
| No. 6 – Maple Creek Village | ||
| Mortgage Loan Information | Property Information | |||
| Mortgage Loan Seller: | BMO | Single Asset / Portfolio: | Single Asset | |
| Original Principal Balance: | $28,200,000 | Title: | Fee | |
| Cut-off Date Principal Balance: | $28,200,000 | Property Type – Subtype: | Multifamily – Garden | |
| % of IPB: | 4.7% | Net Rentable Area (Units): | 247 | |
| Loan Purpose: | Recapitalization | Location: | Indianapolis, IN | |
| Borrower: | 3800 W Michigan LLC | Year Built / Renovated: | 1965 / 2022 | |
| Borrower Sponsor(1): | Mendel Steiner | Occupancy: | 98.0% | |
| Interest Rate: | 7.15000% | Occupancy Date: | 6/15/2023 | |
| Note Date: | 8/1/2023 | 4th Most Recent NOI (As of)(3): | NAV | |
| Maturity Date: | 8/6/2033 | 3rd Most Recent NOI (As of)(3): | NAV | |
| Interest-only Period: | 120 months | 2nd Most Recent NOI (As of): | $2,680,328 (12/31/2022) | |
| Original Term: | 120 months | Most Recent NOI (As of): | $2,868,264 (TTM 5/31/2023) | |
| Original Amortization Term: | None | UW Economic Occupancy: | 97.0% | |
| Amortization Type: | Interest Only | UW Revenues: | $3,815,030 | |
| Call Protection: | L(24),D(92),O(4) | UW Expenses: | $839,261 | |
| Lockbox / Cash Management: | Springing | UW NOI: | $2,975,769 | |
| Additional Debt: | No | UW NCF: | $2,926,369 | |
| Additional Debt Balance: | N/A | Appraised Value / Per Unit: | $41,000,000 / $165,992 | |
| Additional Debt Type: | N/A | Appraisal Date: | 7/11/2023 | |
| Escrows and Reserves(2) | Financial Information | |||||
| Initial | Monthly | Initial Cap | Cut-off Date Loan / Unit: | $114,170 | ||
| Taxes: | $56,706 | $14,176 | N/A | Maturity Date Loan / Unit: | $114,170 | |
| Insurance: | $70,212 | $8,777 | N/A | Cut-off Date LTV: | 68.8% | |
| Replacement Reserve: | $222,300 | Springing | $222,300 | Maturity Date LTV: | 68.8% | |
| Deferred Maintenance: | $50,830 | $0 | N/A | UW NCF DSCR: | 1.43x | |
| UW NOI Debt Yield: | 10.6% | |||||
| Sources and Uses | |||||||
| Sources | Proceeds | % of Total | Uses | Proceeds | % of Total | ||
| Mortgage Loan | $28,200,000 | 100.0% | Partnership Buyout | $15,435,000 | 54.7 | % | |
| Loan Payoff | 8,945,047 | 31.7 | |||||
| Sponsor Equity Repatriation | 2,786,751 | 9.9 | |||||
| Closing Costs | 633,603 | 2.2 | |||||
| Required Reserves | 399,598 | 1.4 | |||||
| Total Sources | $28,200,000 | 100.0% | Total Uses | $28,200,000 | 100.0 | % | |
| (1) | The Maple Creek Village Mortgage Loan (as defined below) shares the same borrower sponsor as the Cincinnati Multifamily Portfolio II Mortgage Loan, which is also being contributed to the BMO 2023-C6 transaction. |
| (2) | For a full description of Escrows and Reserves, please refer to “Escrows and Reserves” below. |
| (3) | Historical underwriting is not available because the Maple Creek Village Property (as defined below) was acquired by the sponsor in January 2022. |
The Loan. The sixth largest mortgage loan (the “Maple Creek Village Mortgage Loan”) is secured by a first lien mortgage on the borrower’s fee simple interest in a garden multifamily complex totaling 247-units known as Maple Creek Village (the “Maple Creek Village Property”) located in Indianapolis, Indiana. The Maple Creek Village Mortgage Loan was originated on August 1, 2023 by Bank of Montreal and has an outstanding principal balance as of the Cut-off Date of $28.2 million. The Maple Creek Village Mortgage Loan has a 10-year term and is interest only for the full term of the loan and accrues interest on an actual/360 basis.
The Property. The Maple Creek Village Property is a 247-unit garden multifamily complex situated on a 13.09-acre site located at 3800 West Michigan Street in Indianapolis, Indiana. The Maple Creek Village Property is comprised of 22, three-story multifamily buildings and was developed in 1965. The improvements are brick construction and some units have balconies. The Maple Creek Village Property was constructed with amenities including a swimming pool, laundry facilities,
| THE INFORMATION IN THIS STRUCTURAL AND COLLATERAL TERM SHEET IS NOT COMPLETE AND MAY BE AMENDED PRIOR TO THE TIME OF SALE. THIS TERM SHEET IS NOT AN OFFER TO SELL THESE SECURITIES AND IT IS NOT A SOLICITATION OF AN OFFER TO BUY THESE SECURITIES IN ANY JURISDICTION WHERE THE OFFER OR SALE IS NOT PERMITTED. | ||
| 63 | ||
| Structural and Collateral Term Sheet | BMO 2023-C6 | |
| No. 6 – Maple Creek Village | ||
pet play area, storage space, sundeck, playground, grills and a picnic area. The local area consists primarily of residential and multifamily uses and parks generally located along secondary roadways with retail and commercial uses located along primary roadways. Fourteen of the units representing 5.7% of the total units at the Maple Creek Village Property are affordable housing units that are subject to rent limitations as set by the Indiana Housing and Community Development Authority.
The Maple Creek Village Property is 98.0% occupied and features studio, one-, two-, three and four-bedroom units with a average unit size of 740 square feet. The Maple Creek Village Property has a total of 352 surface parking spaces resulting in a parking ratio of approximately 1.4 spaces per unit.
The following table presents detailed information with respect to the occupied units at the Maple Creek Village Property:
| Unit Summary(1) | ||||||||
| Unit Type(2) | No. of Units | % of Total | Average Unit Size (SF) | Average Monthly Rental Rate(3) | Average Monthly Rental Rate per SF(3) | Average Monthly Market Rental Rate | Average Monthly Market Rental Rate per SF(3) | |
| Studio S | 8 | 3.2 | % | 358 | $1,125 | $2.75 | $1,125 | $3.14 |
| Studio L | 2 | 0.8 | 448 | $1,138 | $2.54 | $1,140 | $2.54 | |
| 1BR / 1BA S | 90 | 36.4 | 604 | $1,123 | $1.84 | $1,125 | $1.86 | |
| 1BR / 1BA L | 9 | 3.6 | 694 | $1,243 | $1.79 | $1,250 | $1.80 | |
| 2BR / 1BA S | 98 | 39.7 | 794 | $1,311 | $1.60 | $1,325 | $1.67 | |
| 2BR / 1BA S | 12 | 4.9 | 884 | $1,328 | $1.50 | $1,350 | $1.53 | |
| 3BR / 1.5BA | 22 | 8.9 | 927 | $1,344 | $1.45 | $1,400 | $1.51 | |
| 4BR / 2BA | 6 | 2.4 | 1,588 | $1,480 | $0.93 | $1,500 | $0.94 | |
| Total/Wtd. Avg. | 247 | 100.0 | % | 740 | $1,240 | $1.64 | $1,254 | $1.69 |
| (1) | Based on the underwritten rent roll as of June 15, 2023. |
| (2) | 14 units are affordable housing units and are subject to rent limitations as set by the Indiana Housing and Community Development Authority. |
| (3) | Based only on occupied units. |
Environmental. According to the Phase I environmental report dated July 17, 2023, there is no evidence of any recognized environmental conditions at the Maple Creek Village Property.
The following table presents certain information relating to the historical and current occupancy of the Maple Creek Village Property:
| Historical and Current Multifamily Occupancy(1) | |||
| 2020(2) | 2021(2) | 2022 | Current(3) |
| NAV | NAV | 82.6% | 98.0% |
| (1) | Historical occupancies are as of December 31 for each respective year. |
| (2) | Historical occupancy for 2020 and 2021 is unavailable because the Maple Creek Village Property was acquired by the borrower sponsor in September 2021. |
| (3) | Current occupancy is as of June 15, 2023. |
| THE INFORMATION IN THIS STRUCTURAL AND COLLATERAL TERM SHEET IS NOT COMPLETE AND MAY BE AMENDED PRIOR TO THE TIME OF SALE. THIS TERM SHEET IS NOT AN OFFER TO SELL THESE SECURITIES AND IT IS NOT A SOLICITATION OF AN OFFER TO BUY THESE SECURITIES IN ANY JURISDICTION WHERE THE OFFER OR SALE IS NOT PERMITTED. | ||
| 64 | ||
| Structural and Collateral Term Sheet | BMO 2023-C6 | |
| No. 6 – Maple Creek Village | ||
The following table presents certain information relating to the operating history and underwritten cash flows of the Maple Creek Village Property:
| Operating History and Underwritten Net Cash Flow | ||||||||||
| 2022 | TTM(1) | Underwritten | Per Unit | % | (3) | |||||
| Base Rent(2) | $3,783,900 | $3,783,900 | $3,676,548 | $14,885 | 103.1 | % | ||||
| Gross Potential Rent | $3,783,900 | $3,783,900 | $3,676,548 | $14,885 | 103.1 | % | ||||
| (Vacancy/Credit Loss) | (464,542) | (362,588) | (111,465) | (451) | (3.1 | ) | ||||
| Net Rental Income | $3,319,358 | $3,421,312 | $3,565,083 | $14,434 | 100.0 | % | ||||
| Other Income | 228,160 | 233,579 | 249,947 | 1,012 | 7.0 | |||||
| Effective Gross Income | $3,547,518 | $3,654,891 | $3,815,030 | $15,445 | 107.0 | % | ||||
| Total Expenses | 867,191 | 786,628 | 839,261 | 3,398 | 22.0 | |||||
| Net Operating Income | $2,680,328 | $2,868,264 | $2,975,769 | $12,048 | 78.0 | % | ||||
| Replacement Reserves | 0 | 0 | 49,400 | 200 | 1.3 | |||||
| Net Cash Flow | $2,680,328 | $2,868,264 | $2,926,369 | $11,848 | 76.7 | % | ||||
| (1) | TTM represents the trailing 12 months ending May 31, 2023. |
| (2) | Base Rent is based on the underwritten rent roll dated June 15, 2023. |
| (3) | % column represents percent of Net Rental Income for all revenue lines and represents percent of Effective Gross Income for the remainder of the fields. |
The Market. The Maple Creek Village Property is located in Indianapolis within Marion County, benefitting from its location among the population centers of the Midwestern United States. A major demand generator for the entire Indianapolis MSA (as defined below) includes Indiana University-Purdue University, located two miles east of the Maple Creek Village Property in downtown Indianapolis. Located one mile north of the Maple Creek Village Property, the Indianapolis Motor Speedway is an automobile racing circuit and is the home of the Indianapolis 500 and the Verizon 200 and formerly the home of the United States Grand Prix. It is the largest sports venue in the world and is located on the corner of 16th Street and Georgetown Road.
According to the appraisal, the Maple Creek Village Property is located within the Indianapolis-Carmel-Anderson Metropolitan Statistical Area (the “Indianapolis MSA”). The largest employers in the Indianapolis MSA include Indiana University Health (23,187 employees), St. Vincent Hospitals & Health Services (17,398 employees), Community HealthNetwork (11,328 employees), Eli Lilly and Co. (10,845 employees) and Walmart Inc. (8,926 employees).
According to the appraisal, as of the first quarter of 2023, the Indianapolis multifamily market contains 161,835 rental units with a vacancy rate of 8.46%, up from year-end 2022 vacancy of 7.83%. A total of 600 units were completed and delivered in the first quarter of 2023. The quoted rental rate in the market stood at $1,197 per unit per month in the first quarter of 2023, an increase from $1,176 as of the previous quarter. The market experienced a negative net absorption of 468 units in the first quarter of 2023.
According to the appraisal, the estimated 2023 population within a one-, three- and five-mile radius of the Maple Creek Village Property is 9,077, 91,520 and 237,259, respectively. The estimated 2023 median household income within the same radii is $36,017, $44,245 and $48,224, respectively.
| THE INFORMATION IN THIS STRUCTURAL AND COLLATERAL TERM SHEET IS NOT COMPLETE AND MAY BE AMENDED PRIOR TO THE TIME OF SALE. THIS TERM SHEET IS NOT AN OFFER TO SELL THESE SECURITIES AND IT IS NOT A SOLICITATION OF AN OFFER TO BUY THESE SECURITIES IN ANY JURISDICTION WHERE THE OFFER OR SALE IS NOT PERMITTED. | ||
| 65 | ||
| Structural and Collateral Term Sheet | BMO 2023-C6 | |
| No. 6 – Maple Creek Village | ||
The following table presents certain information relating to comparable multifamily rental properties to the Maple Creek Village Property:
| Comparable Rental Summary(1) | ||||||
| Property Address | Year Built | Occupancy | # of Units | Unit Mix | Average SF per Unit | Average Rent per Unit |
Maple Creek Village (2) 3800 West Michigan Street Indianapolis, IN 46222 | 1965 | 98.0% | 247 | Studio S Studio L 1BR / 1BA S 1BR / 1BA L 2BR / 1BA S 2BR / 1BA L 3BR / 1.5BA 4BR / 2BA | 358 448 604 694 794 884 927 1,588 | $1,125 $1,138 $1,123 $1,243 $1,311 $1,328 $1,344 $1,480 |
| Brickyard Flats | 1 Bed/1 Bath 2 Bed/1 Bath | 690-931 868 | $861-$1,121 $1,119 | |||
| 6363 Hollister Drive | 1968 | 95.0% | 410 | 2 Bed/1.5 Bath 2 Bed/2 Bath | 1,098 1,002-1,151 | $1,098 $1,167-$1,297 |
| Speedway, IN 46224 | 3 Bed/1.5 Bath | 1,398 | $1,384 | |||
| The Boardwalk at Westlake | Studio 1 Bed/1 Bath | 441-467 516-750 | $1,005-$1,090 $925-$1,300 | |||
| 6000 WestLake Drive | 1965 | 98.0% | 1,382 | 2 Bed/1 Bath 2 Bed/1.5 Bath | 780-840 1300 | $1,350-$1,525 $1,380 |
| Indianapolis, IN 46224 | 2 Bed/2 Bath 3 Bed/1.5 Bath | 1,134 1,200 | $1,755 $1,730 | |||
| The Oasis | 1 Bed/1 Bath | 671-856 | $974-$1,209 | |||
| 4900 Edinborough Lane | 1973 | 96.0% | 312 | 2 Bed/1 Bath 2 Bed/2 Bath | 930 903 | $1,239 $1,329 |
| Indianapolis, IN 46241 | 3 Bed/2 Bath | 1,024 | $1,599 | |||
| Ashton Pointe | 1 Bed/1 Bath | 700 | $989 | |||
| 42 N Lawndale Avenue | 1968 | 94.0% | 250 | 2 Bed/1 Bath 2 Bed/1.5 Bath | 930 1,000 | $1,310 $1,425 |
| Indianapolis, IN 46224 | 3 Bed/1.5 Bath | 1,112 | $1,560 | |||
| (1) | Source: Appraisal, unless otherwise indicated. |
| (2) | Based on underwritten rent roll dated as of June 15, 2023. Average Rent per Unit reflects average monthly in-place rent for occupied units. |
The Borrower. The borrower is 3800 W Michigan LLC, a single-purpose limited liability company with one independent director.
The Borrower Sponsor. The borrower sponsor and guarantor is Mendel Steiner. The Maple Creek Village Mortgage Loan shares the same borrower sponsor as the Cincinnati Multifamily Portfolio II Mortgage Loan, which is also being contributed to the BMO 2023-C6 transaction.
Property Management. The Maple Creek Village Property is managed by Aven Realty 1 LLC, a third-party property management company.
| THE INFORMATION IN THIS STRUCTURAL AND COLLATERAL TERM SHEET IS NOT COMPLETE AND MAY BE AMENDED PRIOR TO THE TIME OF SALE. THIS TERM SHEET IS NOT AN OFFER TO SELL THESE SECURITIES AND IT IS NOT A SOLICITATION OF AN OFFER TO BUY THESE SECURITIES IN ANY JURISDICTION WHERE THE OFFER OR SALE IS NOT PERMITTED. | ||
| 66 | ||
| Structural and Collateral Term Sheet | BMO 2023-C6 | |
| No. 6 – Maple Creek Village | ||
Escrows and Reserves. At origination of the Maple Creek Village Mortgage Loan, the borrower deposited $50,380 into a deferred maintenance reserve, approximately $56,706 into the tax reserve, approximately $70,212 into the insurance reserve and $222,300 into a replacement reserve.
Tax Escrows – The borrower is required to deposit into a real estate tax reserve, on a monthly basis, 1/12th of the taxes that the lender estimates will be payable over the next-ensuing 12-month period (initially estimated to be approximately $14,176).
Insurance Escrows – The borrower is required to deposit into an insurance reserve, on a monthly basis, 1/12th of the amount which will be sufficient to pay the insurance premiums due for the renewal of coverage afforded by such policies (initially estimated to be approximately $8,777).
Replacement Reserve – Commencing on the date when the balance of the replacement reserve falls below $75,000, the borrower will be required to deposit approximately $5,353 into a replacement reserve on a monthly basis until the balance of the replacement reserve reaches $222,300, at which the borrower will cease monthly payments.
Lockbox / Cash Management. The Maple Creek Village Mortgage Loan is structured with a springing lockbox and springing cash management. Upon the occurrence of a Trigger Period (as defined below), the borrower is required to establish a lender-controlled lockbox account and to cause all rents to be directly deposited into the lender-controlled cash management account within two days of receipt. Upon the occurrence and during the continuance of a Trigger Period, all funds in the lockbox account are required to be swept on each business day to a cash management account under the control of the borrower to be applied and disbursed in accordance with the Maple Creek Village Mortgage Loan documents, and all excess cash flow funds remaining in the cash management account after the application of such funds in accordance with the Maple Creek Village Mortgage Loan documents are required to disbursed to an excess cash reserve.
A “Trigger Period” will commence upon the occurrence of any of the following: (i) an event of default under the Maple Creek Village Mortgage Loan documents and (ii) the debt service coverage ratio for the Maple Creek Village Mortgage Loan is less than 1.25x; and expires upon: (a) with regard to clause (i), upon the cure of such event of default, (b) with regard to clause (ii), the debt service coverage ratio for the Maple Creek Village Mortgage Loan is greater than or equal to 1.25x for two consecutive calendar quarters.
Subordinate Debt. None.
Mezzanine Debt. None.
Partial Release. Not permitted.
Ground Lease. None.
| THE INFORMATION IN THIS STRUCTURAL AND COLLATERAL TERM SHEET IS NOT COMPLETE AND MAY BE AMENDED PRIOR TO THE TIME OF SALE. THIS TERM SHEET IS NOT AN OFFER TO SELL THESE SECURITIES AND IT IS NOT A SOLICITATION OF AN OFFER TO BUY THESE SECURITIES IN ANY JURISDICTION WHERE THE OFFER OR SALE IS NOT PERMITTED. | ||
| 67 | ||
| Structural and Collateral Term Sheet | BMO 2023-C6 | |
| No. 7 – 11 West 42nd Street | ||
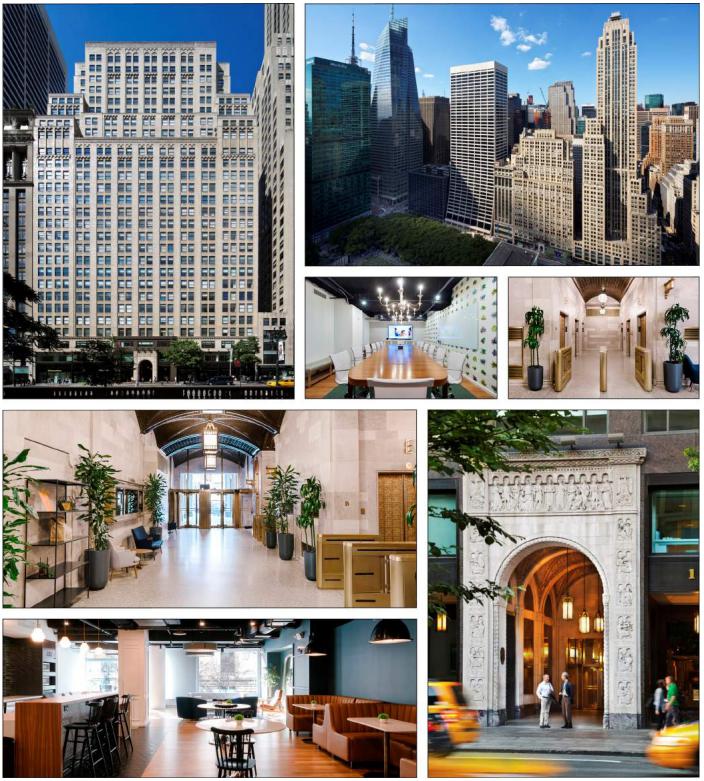
| THE INFORMATION IN THIS STRUCTURAL AND COLLATERAL TERM SHEET IS NOT COMPLETE AND MAY BE AMENDED PRIOR TO THE TIME OF SALE. THIS TERM SHEET IS NOT AN OFFER TO SELL THESE SECURITIES AND IT IS NOT A SOLICITATION OF AN OFFER TO BUY THESE SECURITIES IN ANY JURISDICTION WHERE THE OFFER OR SALE IS NOT PERMITTED. | ||
| 68 | ||
| Structural and Collateral Term Sheet | BMO 2023-C6 | |
| No. 7 – 11 West 42nd Street | ||
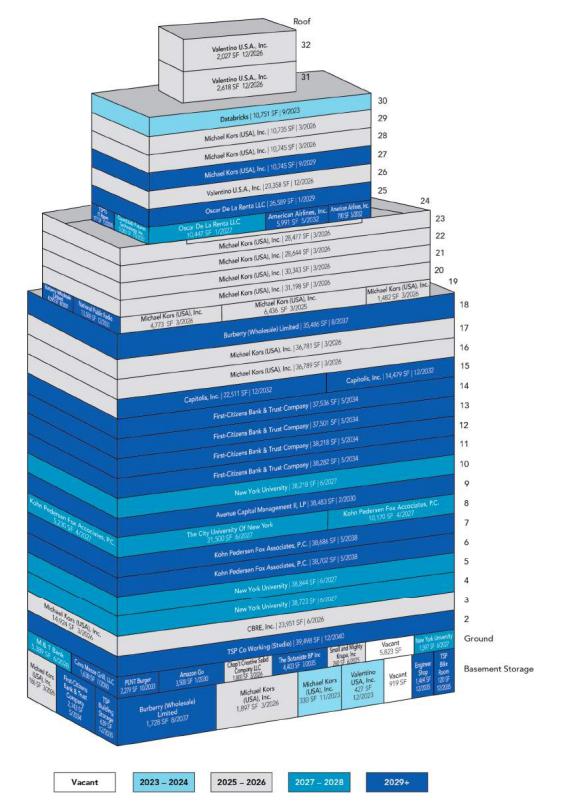
| THE INFORMATION IN THIS STRUCTURAL AND COLLATERAL TERM SHEET IS NOT COMPLETE AND MAY BE AMENDED PRIOR TO THE TIME OF SALE. THIS TERM SHEET IS NOT AN OFFER TO SELL THESE SECURITIES AND IT IS NOT A SOLICITATION OF AN OFFER TO BUY THESE SECURITIES IN ANY JURISDICTION WHERE THE OFFER OR SALE IS NOT PERMITTED. | ||
| 69 | ||
| Structural and Collateral Term Sheet | BMO 2023-C6 | |
| No. 7 – 11 West 42nd Street | ||
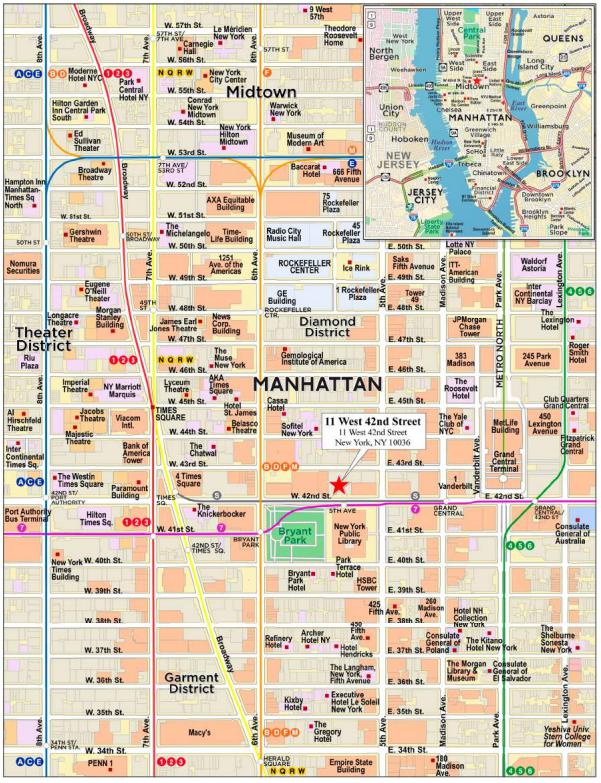
| THE INFORMATION IN THIS STRUCTURAL AND COLLATERAL TERM SHEET IS NOT COMPLETE AND MAY BE AMENDED PRIOR TO THE TIME OF SALE. THIS TERM SHEET IS NOT AN OFFER TO SELL THESE SECURITIES AND IT IS NOT A SOLICITATION OF AN OFFER TO BUY THESE SECURITIES IN ANY JURISDICTION WHERE THE OFFER OR SALE IS NOT PERMITTED. | ||
| 70 | ||
| Structural and Collateral Term Sheet | BMO 2023-C6 | |
| No. 7 – 11 West 42nd Street | ||
| Mortgage Loan Information | Property Information | |||
| Mortgage Loan Seller: | UBS AG, LMF | Single Asset / Portfolio: | Single Asset | |
| Original Principal Balance(1): | $25,000,000 | Title: | Fee | |
| Cut-off Date Principal Balance(1): | $25,000,000 | Property Type – Subtype: | Office - CBD | |
| % of IPB: | 4.1% | Net Rentable Area (SF): | 960,568 | |
| Loan Purpose: | Refinance | Location: | New York, NY | |
| Borrower: | 11 West 42 Realty Investors, L.L.C. | Year Built / Renovated: | 1927 / 2018 | |
| Borrower Sponsors(2): | Tishman Speyer Properties, L.P. and Silverstein Properties, LLC | Occupancy: | 98.6% | |
| Interest Rate: | 7.44000% | Occupancy Date: | 5/1/2023 | |
| Note Date: | 6/30/2023 | 4th Most Recent NOI (As of): | $27,010,956 (12/31/2020) | |
| Maturity Date: | 7/6/2028 | 3rd Most Recent NOI (As of): | $26,436,280 (12/31/2021) | |
| Interest-only Period: | 60 months | 2nd Most Recent NOI (As of): | $26,673,211 (12/31/2022) | |
| Original Term: | 60 months | Most Recent NOI (As of)(6): | $26,697,022 (TTM 3/31/2023) | |
| Original Amortization Term: | None | UW Economic Occupancy: | 95.0% | |
| Amortization Type: | Interest Only | UW Revenues: | $70,904,067 | |
| Call Protection(3): | L(23),YM1(2),DorYM1(28),O(7) | UW Expenses: | $39,203,449 | |
| Lockbox / Cash Management: | Hard / Springing | UW NOI(6): | $31,700,618 | |
| Additional Debt(1): | Yes | UW NCF: | $28,626,800 | |
| Additional Debt Balance(1): | $249,000,000 / $56,000,000 | Appraised Value / Per SF: | $555,000,000 / $578 | |
| Additional Debt Type(1)(4): | Pari Passu / Mezzanine | Appraisal Date: | 4/19/2023 | |
| Escrows and Reserves(5) | Financial Information(7) | ||||||
| Initial | Monthly | Initial Cap | Whole Loan | Total Debt | |||
| Taxes: | $0 | Springing | N/A | Cut-off Date Loan / SF: | $285 | $344 | |
| Insurance: | $0 | Springing | N/A | Maturity Date Loan / SF: | $285 | $344 | |
| Replacement Reserves: | $0 | Springing | $288,170 | Cut-off Date LTV: | 49.4% | 59.5% | |
| TI/LC Reserve: | $10,000,000 | $240,142 | N/A | Maturity Date LTV: | 49.4% | 59.5% | |
| Free Rent Reserve: | $5,685,544 | $0 | N/A | UW NCF DSCR: | 1.39x | 1.00x | |
| Outstanding TI / LC Reserve: | $13,479,707 | $0 | N/A | UW NOI Debt Yield: | 11.6% | 9.6% | |
| Sources and Uses | ||||||||
| Sources | Proceeds | % of Total | Uses | Proceeds | % of Total | |||
| Whole Loan | $274,000,000 | 79.7 | % | Loan Payoff | $301,013,950 | 87.5 | % | |
| Mezzanine Loan | 56,000,000 | 16.3 | Reserves | 29,165,251 | 8.5 | |||
| Borrower Sponsor Equity | 13,988,916 | 4.1 | Closing Costs: | 13,809,715 | 4.0 | |||
| Total Sources | $343,988,916 | 100.0 | % | Total Uses | $343,988,916 | 100.0 | % | |
| (1) | The 11 West 42nd Street Mortgage Loan (as defined below) is part of a whole loan evidenced by 24 pari passu notes with an aggregate original principal balance as of the Cut-off Date of $274.0 million (the “11 West 42nd Street Whole Loan”). In addition, there is a $56,000,000 mezzanine loan secured by 100% of the equity interests in the borrower. For a full description of the mezzanine loan see “Mezzanine Debt” below. |
| (2) | There is no non-recourse carveout guarantor or environmental indemnitor for the 11 West 42nd Street Whole Loan separate from the borrower. |
| (3) | The borrower has the option to prepay the 11 West 42nd Street Whole Loan in whole but not in part (i) on or after the payment date occurring in January 2028 without the payment of any prepayment premium or (ii) beginning on the payment date in July 2025 with the payment of a yield maintenance premium. Defeasance of the 11 West 42nd Street Whole Loan in whole but not in part is permitted after the date that is the earlier of (i) two years from the closing date of the securitization that includes the last note of the 11 West 42nd Street Whole Loan to be securitized and (ii) August 6, 2026. The assumed defeasance lockout period of 25 payments is based on the anticipated closing date of the BMO 2023-C6 securitization trust in August 2023. The actual lockout period may be longer. |
| (4) | For a full description of the mezzanine loan see “Mezzanine Debt” below. |
| (5) | For a full description of Escrows and Reserves, see “Escrows and Reserves” below. |
| (6) | The increased UW NOI compared to the Most Recent NOI is mainly due to recent leasing activities. |
| (7) | The information presented under the Financial Information chart above reflects the Cut-off Date balance of the 11 West 42nd Street Whole Loan and the aggregate of the Cut-off Date balance of the 11 West 42nd Street Whole Loan and a $56.0 million mezzanine loan. |
The Loan. The seventh largest mortgage loan (the “11 West 42nd Street Mortgage Loan”) is part of a fixed rate whole loan secured by the borrower’s fee interest in a 960,568 square foot office property located in New York, New York (the “11 West 42nd Street Property”). The 11 West 42nd Street Whole Loan consists of twenty-four pari passu notes and accrues interest at a rate of 7.44000% per annum. The 11 West 42nd Street Whole Loan has a five-year term and is interest-only for the term of the loan. The 11 West 42nd Street Whole Loan was co-originated on June 30, 2023 by Bank of America, N.A. (“BANA”), UBS AG, by and through its branch office at 1285 Avenue
| THE INFORMATION IN THIS STRUCTURAL AND COLLATERAL TERM SHEET IS NOT COMPLETE AND MAY BE AMENDED PRIOR TO THE TIME OF SALE. THIS TERM SHEET IS NOT AN OFFER TO SELL THESE SECURITIES AND IT IS NOT A SOLICITATION OF AN OFFER TO BUY THESE SECURITIES IN ANY JURISDICTION WHERE THE OFFER OR SALE IS NOT PERMITTED. | ||
| 71 | ||
| Structural and Collateral Term Sheet | BMO 2023-C6 | |
| No. 7 – 11 West 42nd Street | ||
of the Americas, New York, New York (“UBS AG”) and LMF Commercial, LLC (“LMF”). On July 7, 2023, LMF transferred Notes A-3-2, A-3-4, A-3-6 and A-3-8, in the aggregate original principal amount of $45,666,666, to Bank of Montreal (“BMO”). The non-controlling Notes A-2-2 and A-3-5 will be included in the BMO 2023-C6 securitization trust. The remaining notes are currently held by BMO, BANA, LMF and UBS AG or their respective affiliates and are expected to be contributed to one or more securitization trust(s). The 11 West 42nd Street Whole Loan is currently being serviced pursuant to the pooling and servicing agreement for the BMO 2023-5C1 securitization trust until the controlling Note A-1-1 is securitized, whereupon the 11 West 42nd Street Whole Loan will be serviced pursuant to the pooling and servicing agreement for such future securitization. See “Description of the Mortgage Pool—The Whole Loans—The Serviced Pari Passu Whole Loans” and “Pooling and Servicing Agreement” in the Preliminary Prospectus.
| Whole Loan Summary | ||||
| Note | Original Balance | Cut-off Date Balance | Note Holder | Controlling Piece |
| A-1-1 | $30,000,000 | $30,000,000 | BANA | Yes |
| A-1-2 | $25,000,000 | $25,000,000 | BANA | No |
| A-1-3 | $15,000,000 | $15,000,000 | BANA | No |
| A-1-4 | $11,333,334 | $11,333,334 | BANA | No |
| A-1-5 | $10,000,000 | $10,000,000 | BANA | No |
| A-2-1 | $6,333,333 | $6,333,333 | UBS AG | No |
| A-2-2 | $20,000,000 | $20,000,000 | BMO 2023-C6 | No |
| A-2-3 | $10,000,000 | $10,000,000 | UBS AG | No |
| A-2-4 | $10,000,000 | $10,000,000 | UBS AG | No |
| A-2-5 | $10,000,000 | $10,000,000 | UBS AG | No |
| A-2-6 | $10,000,000 | $10,000,000 | UBS AG | No |
| A-2-7 | $5,000,000 | $5,000,000 | UBS AG | No |
| A-2-8 | $5,000,000 | $5,000,000 | UBS AG | No |
| A-2-9 | $5,000,000 | $5,000,000 | UBS AG | No |
| A-2-10 | $5,000,000 | $5,000,000 | UBS AG | No |
| A-2-11 | $5,000,000 | $5,000,000 | UBS AG | No |
| A-3-1 | $25,000,000 | $25,000,000 | BMO 2023-5C1 | No |
| A-3-2 | $27,500,000 | $27,500,000 | BMO 2023-5C1 | No |
| A-3-3 | $10,000,000 | $10,000,000 | BMO 2023-5C1 | No |
| A-3-4 | $7,500,000 | $7,500,000 | BMO | No |
| A-3-5 | $5,000,000 | $5,000,000 | BMO 2023-C6 | No |
| A-3-6 | $5,000,000 | $5,000,000 | BMO | No |
| A-3-7 | $5,666,667 | $5,666,667 | LMF | No |
| A-3-8 | $5,666,666 | $5,666,666 | BMO | No |
| Whole Loan | $274,000,000 | $274,000,000 | ||
The Property. The 11 West 42nd Street Property is a 32-story, LEED Silver certified, Class A- office tower located in New York, New York totaling 960,568 square feet. Originally constructed in 1927, the 11 West 42nd Street Property is located two blocks west of Grand Central Station and overlooks the New York Public Library and Bryant Park. The 11 West 42nd Street Property features a unique H-shaped layout, which allows for eight corner offices per floor and an abundance of natural light. Since 2018, the borrower sponsors have spent approximately $38.2 million in renovations which include improvements to the lobby, elevators, entrances and windows. Since 2021, the borrower sponsors have executed a total of 321,255 square feet in lease renewals, extensions and new leases. The 11 West 42nd Street Property is 98.6% leased as of May 1, 2023 to a diverse roster of tenants and has a weighted average remaining lease term of over seven years.
The 11 West 42nd Street Property consists of 891,270 square feet of office space, 20,866 square feet of retail space, 39,498 square feet of co-working space, and 8,934 square feet of storage space. Most of the retail tenants at the 11 West 42nd Street Property are fast casual food chains. In May 2021, the borrower sponsors began their offering of the Studio by Tishman co-working space (the “Studio”) at the 11 West 42nd Street Property (4.1% of NRA). The Studio is a flexible and modern co-working space that caters to both individual professionals and corporate clients. Owned and operated by Tishman, the Studio offers a wide range of options for its members, including private offices, customized suites and hot desks. The Studio has 14 different locations with approximately 400 desks, which were 87.7% occupied as of April 2023, with 98% of occupied desks belonging to corporate clients.
The 11 West 42nd Street Property has maintained strong occupancy levels over the past five years, averaging 93.4% occupancy. Investment-grade rated tenants or their affiliates occupy 64.3% of NRA at the 11 West 42nd Street Property and contribute 66.5% of underwritten base rent. Major tenants at the 11 West 42nd Street Property include Michael Kors (USA), Inc. (“Michael Kors”), First-
| THE INFORMATION IN THIS STRUCTURAL AND COLLATERAL TERM SHEET IS NOT COMPLETE AND MAY BE AMENDED PRIOR TO THE TIME OF SALE. THIS TERM SHEET IS NOT AN OFFER TO SELL THESE SECURITIES AND IT IS NOT A SOLICITATION OF AN OFFER TO BUY THESE SECURITIES IN ANY JURISDICTION WHERE THE OFFER OR SALE IS NOT PERMITTED. | ||
| 72 | ||
| Structural and Collateral Term Sheet | BMO 2023-C6 | |
| No. 7 – 11 West 42nd Street | ||
Citizens Bank & Trust Company (“First-Citizens Bank”) and New York University (“NYU”). In addition, several tenants use the 11 West 42nd Street Property as headquarters space and have made significant investments in their spaces. The 11 West 42nd Street Property is the corporate headquarters for Michael Kors, Kohn Pedersen Fox Associates, P.C. (“KPF”), Avenue Capital Management II, LP (“Avenue Capital”), Oscar De La Renta LLC and Capitolis, Inc. (“Capitolis”).
Major Tenants.
Michael Kors (USA), Inc (254,485 square feet; 26.5% of NRA; 27.4% of underwritten base rent; Ba1/BBB-/BBB-; Moody’s/S&P/Fitch) is a luxury fashion brand founded by designer Michael Kors in 1981. The Michael Kors brand has a global reach, with a strong presence in major fashion markets around the world and is popular among celebrities and fashion-conscious consumers. The 11 West 42nd Street Property serves as the worldwide headquarters for Michael Kors. The Michael Kors lease is guaranteed by the publicly traded parent company, Capri Holdings Limited, which also manages other brands such as Versace and Jimmy Choo. As of August 2023, Capri Holdings had an equity market capitalization of approximately $4.3 billion.
Michael Kors currently occupies 252,072 square feet of office and 2,413 square feet of storage space. Michael Kors first leased space at the 11 West 42nd Street Property in 2003 and since has expanded into 16 suites. The tenant has no non-standard termination options, outstanding allowances or free rent. Michael Kors has 236,974 square feet expiring on March 31, 2026, 10,745 square feet expiring on September 30, 2029, 6,436 square feet expiring on March 31, 2025 and 330 square feet expiring on November 30, 2023. The tenant has two, five-year options or one, 10-year renewal option on all non-basement suites, with a notice of renewal no later than 20 months prior to March 31, 2037 varying across suites. Michael Kors currently subleases three spaces (totaling 28,107 square feet, 11.0% of Michael Kors’ NRA) to Aston Martin Lagonda of North America, Inc., ExpandEd Schools, Inc. and National Public Radio, Inc. (“NPR”). According to the borrower sponsors, if a proposed lease amendment between the borrower and NPR is executed, NPR will directly lease at least an additional 4,888 square feet of the Michael Kors subleased space and add it to their existing leased premises (13,580 square feet), all with a lease expiration of December 2031. We cannot assure you that this amendment will be signed as expected or at all.
According to the borrower sponsors, Michael Kors is currently renovating its space at the tenant’s sole cost and is in discussions with the borrower sponsors for an early renewal of a portion of its lease. If this proposed lease amendment is executed, Michael Kors would renew 204,481 square feet of its expiring space (202,068 square feet of office and 2,413 square feet of storage), terminate the non-subleased portion of its lease on the 22nd floor (19,238 square feet), vacate 14,924 square feet on the third floor in March 2026, vacate 6,436 square feet on the 19th floor in March 2025 (at least 4,888 square feet of the 6,436 square feet will switch to a direct lease to NPR), and vacate 9,406 square feet of subleased space on the 22nd floor in March 2026. We cannot assure you that this amendment will be signed as expected or at all.
First-Citizens Bank & Trust Company (153,680 square feet; 16.0% of NRA; 16.0% of underwritten base rent; Baa2/BBB/NR; Moody’s/S&P/Fitch) is a financial institution that provides a wide range of banking and financial services to individuals, businesses and organizations. Founded in 1898, First-Citizens Bank is a full-service bank that offers a variety of products and services. First-Citizens Bank has a strong presence in the southeastern United States, with branches located in North Carolina, South Carolina, Virginia, Tennessee and Georgia, as well as 18 other states. As of August 2023, First-Citizens Bank had an equity market capitalization of approximately $20.5 billion.
First Citizens Bank currently occupies 151,537 square feet of office and 2,143 square feet of storage space, with a lease expiration date of May 31, 2034 and two, five-year renewal options (or one 10-year renewal option) on all of its suites with a 16-month notice period. First-Citizens Bank first leased space at the 11 West 42nd Street Property in 2006 and since has expanded into five suites. The tenant has no non-standard termination options, outstanding allowances or free rent.
New York University (117,382 square feet; 12.2% of NRA; 11.4% of underwritten base rent; Aa2/AA-/NR; Moody’s/S&P/Fitch) was established in 1831 and is one of the largest and most prestigious universities in the United States, with a student body of over 65,000 students and an endowment of over $5.3 billion as of August 2022. The NYU Midtown Center, located at the 11 West 42nd Street Property, is home to many graduate programs within the School of Professional Studies. The 11 West 42nd Street Property provides access for NYU students, faculty and staff to the Jack Brause Library, one of NYU’s most coveted libraries, a computer science lab, design labs and classrooms for its students. Additionally, NYU added its own entrance on the 43rd Street side of the 11 West 42nd Street Property to help regulate ingress and egress of the student base.
NYU currently occupies 115,785 square feet of office and 1,597 square feet of retail space, with a lease expiration of June 30, 2027 and one, five-year renewal option on all of its suites with a 22-month notice period at 2% rent increases per annum. NYU has leased space at the 11 West 42nd Street Property since the 1970s and has renewed multiple times. NYU is currently occupying four suites, and most recently renewed its lease in October 2021. The tenant has no non-standard termination options. NYU has approximately $1.65 million in outstanding landlord obligations and two months of free rent totaling approximately $1,125,423 ($557,140 in December 2023 and $568,283 in December 2024). All outstanding landlord obligations and free rent was reserved at origination.
See “Description of the Mortgage Pool—Tenant Issues” in the Preliminary Prospectus.
| THE INFORMATION IN THIS STRUCTURAL AND COLLATERAL TERM SHEET IS NOT COMPLETE AND MAY BE AMENDED PRIOR TO THE TIME OF SALE. THIS TERM SHEET IS NOT AN OFFER TO SELL THESE SECURITIES AND IT IS NOT A SOLICITATION OF AN OFFER TO BUY THESE SECURITIES IN ANY JURISDICTION WHERE THE OFFER OR SALE IS NOT PERMITTED. | ||
| 73 | ||
| Structural and Collateral Term Sheet | BMO 2023-C6 | |
| No. 7 – 11 West 42nd Street | ||
Environmental. According to the Phase I environmental assessment dated April 24, 2023, there was no evidence of any recognized environmental conditions at the 11 West 42nd Street Property.
The following table presents certain information relating to the historical and current occupancy of the 11 West 42nd Street Property:
| Historical and Current Occupancy | |||
| 2020(1) | 2021(1) | 2022(1) | Current(2) |
| 88.0% | 89.6% | 98.9% | 98.6% |
| (1) | Historical occupancies are as of December 31 of each respective year. |
| (2) | Current occupancy is as of May 1, 2023. |
The following table presents certain information relating to the largest tenants at of the 11 West 42nd Street Property:
| Tenant Summary(1) | ||||||||
| Tenant | Ratings Moody’s/S&P/Fitch(2) | Net Rentable Area (SF) | % of Total NRA | UW Base Rent PSF | UW Base Rent | % of Total UW Base Rent | Lease Expiration Date | |
| Michael Kors (USA), Inc(3) | Ba1/BBB-/BBB- | 254,485 | 26.5 | % | $62.89 | $16,003,389 | 27.4% | Various(3) |
| First-Citizens Bank & Trust Company | Baa2/BBB/NR | 153,680 | 16.0 | $60.80 | 9,343,789 | 16.0 | 5/31/2034 | |
| New York University | Aa2/AA-/NR | 117,382 | 12.2 | $56.95 | 6,685,426 | 11.4 | 6/30/2027 | |
| Kohn Pedersen Fox Associates, P.C.(4) | NR/NR/NR | 92,788 | 9.7 | $61.13 | 5,672,095 | 9.7 | Various(4) | |
| Burberry (Wholesale) Limited(5) | Baa2/NR/NR | 45,509 | 4.7 | $62.78 | 2,857,280 | 4.9 | 8/31/2037 | |
| Major Tenants | 663,844 | 69.1 | % | $61.10 | $40,561,979 | 69.3% | ||
| Other Tenants(6) | 283,752 | 29.5 | $63.20 | 17,932,301 | 30.7 | |||
| Occupied Collateral Total / Wtd. Avg. | 947,596 | 98.6 | % | $61.73 | $58,494,280 | 100.0% | ||
| Vacant Space | 12,972 | 1.4 | ||||||
| Collateral Total | 960,568 | 100.0 | % | |||||
| (1) | Information is based on the underwritten rent roll dated May 1, 2023 and is inclusive of rent steps through August 2024. |
| (2) | In certain instances, ratings provided are those of the parent company of the entity shown, whether or not the parent company guarantees the lease. |
| (3) | Michael Kors leases 236,974 square feet expiring on March 31, 2026, 10,745 square feet expiring on September 30, 2029, 6,436 square feet expiring on March 31, 2025 and 330 square feet expiring on November 30, 2023. Michael Kors currently subleases three spaces (totaling 28,107 square feet) to Aston Martin Lagonda of North America, Inc., ExpandEd Schools, Inc. and NPR. According to the borrower sponsors, Michael Kors is currently renovating its space at the tenant's sole cost and is in discussions with the borrower sponsors for an early renewal of a portion of its lease. See "Major Tenants" above. |
| (4) | KPF leases 77,388 square feet expiring on May 31, 2038 and 15,400 square feet expiring on April 30, 2027. |
| (5) | Burberry (Wholesale) Limited has the option to terminate its lease on December 31, 2033, upon 20 months’ notice and payment of a termination fee. |
| (6) | Other Tenants is inclusive of 39,498 square feet of space operated by Tishman as the Studio and 297 square feet of office space (IT room and bike room) for which no rent is associated or underwritten. |
| THE INFORMATION IN THIS STRUCTURAL AND COLLATERAL TERM SHEET IS NOT COMPLETE AND MAY BE AMENDED PRIOR TO THE TIME OF SALE. THIS TERM SHEET IS NOT AN OFFER TO SELL THESE SECURITIES AND IT IS NOT A SOLICITATION OF AN OFFER TO BUY THESE SECURITIES IN ANY JURISDICTION WHERE THE OFFER OR SALE IS NOT PERMITTED. | ||
| 74 | ||
| Structural and Collateral Term Sheet | BMO 2023-C6 | |
| No. 7 – 11 West 42nd Street | ||
The following table presents certain information relating to the tenant lease expirations of the 11 West 42nd Street Property:
| Lease Rollover Schedule(1)(2) | |||||||||||||||
| Year | Number of Leases Expiring(3) | Net Rentable Area Expiring(3) | % of NRA Expiring | UW Base Rent Expiring | % of UW Base Rent Expiring | Cumulative Net Rentable Area Expiring | Cumulative % of NRA Expiring | Cumulative UW Base Rent Expiring | Cumulative % of UW Base Rent Expiring | ||||||
| Vacant | NAP | 12,972 | 1.4 | % | NAP | NA | P | 12,972 | 1.4% | NAP | NAP | ||||
| 2023 & MTM | 3 | 11,508 | 1.2 | $980,400 | 1.7 | % | 24,480 | 2.5% | $980,400 | 1.7% | |||||
| 2024 | 0 | 0 | 0.0 | 0 | 0.0 | 24,480 | 2.5% | $980,400 | 1.7% | ||||||
| 2025 | 2 | 6,696 | 0.7 | 434,430 | 0.7 | 31,176 | 3.2% | $1,414,830 | 2.4% | ||||||
| 2026 | 18 | 290,728 | 30.3 | 19,008,777 | 32.5 | 321,904 | 33.5% | $20,423,607 | 34.9% | ||||||
| 2027 | 9 | 169,812 | 17.7 | 9,621,168 | 16.4 | 491,716 | 51.2% | $30,044,775 | 51.4% | ||||||
| 2028 | 1 | 5,389 | 0.6 | 1,141,927 | 2.0 | 497,105 | 51.8% | $31,186,702 | 53.3% | ||||||
| 2029 | 2 | 37,334 | 3.9 | 2,268,817 | 3.9 | 534,439 | 55.6% | $33,455,519 | 57.2% | ||||||
| 2030 | 3 | 43,621 | 4.5 | 4,016,068 | 6.9 | 578,060 | 60.2% | $37,471,587 | 64.1% | ||||||
| 2031 | 1 | 13,580 | 1.4 | 570,360 | 1.0 | 591,640 | 61.6% | $38,041,947 | 65.0% | ||||||
| 2032 | 4 | 43,771 | 4.6 | 2,556,130 | 4.4 | 635,411 | 66.1% | $40,598,077 | 69.4% | ||||||
| 2033 | 1 | 2,279 | 0.2 | 414,299 | 0.7 | 637,690 | 66.4% | $41,012,376 | 70.1% | ||||||
| 2034 & Beyond | 18 | 322,878 | 33.6 | 17,481,904 | 29.9 | 960,568 | 100.0% | $58,494,280 | 100.0% | ||||||
| Total | 62 | 960,568 | 100.0 | % | $58,494,280 | 100.0 | % | ||||||||
| (1) | Based on the underwritten rent roll dated May 1, 2023. |
| (2) | The 11 West 42nd Property has 24 tenants in total, and certain tenants are subject to more than one lease. Certain tenants may have lease termination options that are exercisable prior to the originally stated expiration date of the subject lease and that are not considered in the lease rollover schedule. |
| (3) | Number of Leases Expiring and Net Rentable Area Expiring includes 39,498 square feet of space operated by Tishman as the Studio, 4,636 square feet of storage space and 2,034 square feet of retail (NYU entrance and Small and Mighty Krupa, Inc.) and office space (IT room) all for which no rent is associated or underwritten. |
The following table presents certain information relating to the underwritten cash flows of the 11 West 42nd Street Property:
| Operating History and Underwriting Net Cash Flow | ||||||||||
| 2019 | 2020 | 2021 | 2022 | T12 March 2023 | Underwritten | Per Square Foot | %(1) | |||
| In Place Rent(2) | $45,151,694 | $51,735,865 | $49,799,980 | $50,036,067 | $50,307,751 | $58,494,280 | $60.90 | 86.3 | % | |
| Vacancy Gross Up | 0 | 0 | 0 | 0 | 0 | 928,565 | 0.97 | 1.4 | ||
| Straight Line Rent(3) | 0 | 0 | 0 | 0 | 0 | 291,133 | 0.30 | 0.4 | ||
| Percentage Rent | 0 | 0 | 0 | 0 | 0 | 12,675 | 0.01 | 0.0 | ||
| Gross Potential Rent | $45,151,694 | $51,735,865 | $49,799,980 | $50,036,067 | $50,307,751 | $59,726,653 | $62.18 | 88.1 | % | |
| Total Reimbursements | 6,811,606 | 9,169,515 | 7,612,544 | 5,612,853 | 6,247,574 | 8,092,259 | 8.42 | 11.9 | ||
| Total Gross Income | $51,963,300 | $60,905,380 | $57,412,524 | $55,648,921 | $56,555,325 | $67,818,913 | $70.60 | 100.0 | % | |
| Other Income(4) | 4,035,185 | 2,906,507 | 3,547,401 | 5,519,818 | 6,127,949 | 6,476,088(5) | 6.74 | 9.5 | ||
| (Vacancy/Credit Loss) | 0 | 0 | 0 | 0 | 0 | (3,390,934) | (3.53) | (5.0 | ) | |
| Effective Gross Income | $55,998,485 | $63,811,888 | $60,959,925 | $61,168,739 | $62,683,274 | $70,904,067 | $73.81 | 104.5 | % | |
| Total Expenses | $32,041,491 | $36,800,932 | $34,523,645 | $34,495,528 | $35,986,252 | $39,203,449 | $40.81 | 55.3 | % | |
| Net Operating Income | $23,956,994 | $27,010,956 | $26,436,280 | $26,673,211 | $26,697,022 | $31,700,618 | $33.00 | 44.7 | % | |
| Capital Expenditures | 0 | 0 | 0 | 0 | 0 | 192,114 | 0.20 | 0.3 | ||
| TI/LC | 0 | 0 | 0 | 0 | 0 | 2,881,704 | 3.00 | 4.1 | ||
| Net Cash Flow | $23,956,994 | $27,010,956 | $26,436,280 | $26,673,211 | $26,697,022 | $28,626,800 | $29.80 | 40.4 | % | |
| (1) | % column represents percent of Total Gross Income for all revenue lines and represents percent of Effective Gross Income for the remainder of fields. |
| (2) | Underwritten In Place Rent includes rent steps through August 1, 2024. |
| (3) | Includes straight-lined rent for investment-grade tenants or their affiliates averaged to earlier of lease expiration or loan maturity. |
| (4) | Other Income includes income and fees from various sources such as concierge, licensing, HVAC, amenity space, cleaning, special events, tenant water and condenser, etc. |
| (5) | Underwritten Other Income includes $3,424,954 of income from the Studio that is based on the borrower sponsors’ budget. The Studio is a Tishman owned co-working space that was incorporated in 2021. The Studio has approximately 400 desks, which were 87.7% occupied as of April 2023, with 98.0% of occupied desks belonging to corporate tenants. The rest of the Underwritten Other Income includes income and fees from various sources such as concierge, licensing, HVAC, amenity space, cleaning, special events, tenant water and condenser, etc. |
| THE INFORMATION IN THIS STRUCTURAL AND COLLATERAL TERM SHEET IS NOT COMPLETE AND MAY BE AMENDED PRIOR TO THE TIME OF SALE. THIS TERM SHEET IS NOT AN OFFER TO SELL THESE SECURITIES AND IT IS NOT A SOLICITATION OF AN OFFER TO BUY THESE SECURITIES IN ANY JURISDICTION WHERE THE OFFER OR SALE IS NOT PERMITTED. | ||
| 75 | ||
| Structural and Collateral Term Sheet | BMO 2023-C6 | |
| No. 7 – 11 West 42nd Street | ||
The Market. The 11 West 42nd Street Property is situated on the north side of West 42nd Street between Fifth Avenue and Avenue of the Americas, in the Grand Central office submarket of Midtown Manhattan. The 11 West 42nd Street Property is located across from the New York Public Library and Bryant Park and has accessibility to a large transportation network comprised of subways, railroads and buses. Bryant Park is accessible from several major Manhattan commuter transportation hubs. Nearby subway stations include the Bryant Park station that provides access to five different subway lines (7, B, D, F, and M trains), the Times Square/42nd Street/Eighth Avenue station that provides access to 12 different subway lines (1, 2, 3, 7, A, C, E, N, Q, R, S and W trains) and Grand Central Terminal that provides access to five different subway lines (4, 5, 6, 7 and S trains), providing for accessible commutes from all five boroughs. Metro North railroad at Grand Central Terminal also provides access to New York suburbs and Connecticut.
According to the appraisal, leasing activity has been strong in the Grand Central office submarket and properties near regional transportation nodes have experienced an increase in demand and positive leasing. The 11 West 42nd Street Property presents a lower-cost alternative to other Class A space in the Grand Central office submarket. As of the first quarter of 2023, the Grand Central office submarket had 81.7% of Class A space, with an inventory of 37,423,446 square feet, a vacancy rate of 17.6% and weighted average rental rate of $75.87 per square foot.
The 11 West 42nd Street Property benefits from the area’s population density. According to the appraisal, the estimated 2022 population in New York City was approximately 8,130,800. The estimated 2022 average household income in New York City was $110,634.
The following table presents certain information relating to comparable office properties to the 11 West 42nd Street Property:
| Competitive Building Summary(1) | ||||||
Property Name | Year Built / Renovated | Rentable Area (SF) | Stories | Occupancy | Asking Rent Low PSF | Asking Rent High PSF |
| 11 West 42nd Street | 1927 / 2018 | 960,568(2) | 32 | 98.6%(2) | $42.00(2)(3) | $90.00(2)(3) |
| 4 Bryant Park | 1920 / NAP | 150,000 | 12 | 100.0% | NAV | NAV |
| 1065 Avenue of the Americas | 1958 / NAP | 536,524 | 34 | 75.2% | $72.00 | $105.00 |
| 1120 Avenue of the Americas | 1951 / 2005 | 400,000 | 21 | 98.1% | NAV | NAV |
| 500 Fifth Avenue | 1938 / NAP | 721,702 | 59 | 85.8% | $79.00 | $92.00 |
| 125 Park Avenue | 1923 / 2004 | 445,437 | 26 | 99.2% | NAV | NAV |
| 420 Lexington Avenue | 1927 / 1999 | 1,112,424 | 31 | 78.5% | $62.00 | $65.00 |
| (1) | Source: Appraisal. |
| (2) | Information is based on the underwritten rent roll dated May 1, 2023. |
| (3) | Asking Rent Low PSF and Asking Rent High PSF are based on the underwritten rent per square foot range for office tenants at the 11 West 42nd Street Property. |
The following table presents certain information relating to comparable office rental properties for the 11 West 42nd Street Property:
| Comparable Office Rental Summary(1) | |||||||||
| Property Name/Location | Year Built/ Renovated | Rentable Area (SF) | Tenant | Lease Type | Suite Size (SF) | Commencement | Rent (PSF) | TIs (PSF) / Free Rent (Months) | Escalations |
11 West 42nd Street New York, NY | 1927/2018 | 960,568(2) | Burberry (Wholesale) Limited(2) | Modified Gross | 45,509(2) | Sep-22(2) | $62.78(2) | $140 / 15(3) | $5 Every 5 Years(3) |
10 East 40th Street New York, NY | 1929/2008 | 347,000 | Alpha Square Group | Modified Gross | 8,770 | Apr-23 | $71.00 | $0 / 8.5 | Flat |
10 East 40th Street New York, NY | 1929/2008 | 347,000 | Hart Howerton | Modified Gross | 27,211 | Feb-23 | $70.00 | $120 / 18 | $75 PSF in year 7 |
60 East 42nd Street New York, NY | 1929/NAP | 1,110,005 | Morici & Morici LLP | Modified Gross | 5,717 | Jul-22 | $71.00 | $135 / 5 | Flat |
530 Fifth Avenue New York, NY | 1957/NAP | 484,152 | APFM, Inc. | Modified Gross | 7,803 | Jan-23 | $79.00 | $150 / 6 | N/A |
535 Fifth Avenue New York, NY | 1926/2014 | 255,455 | Prima Gems USA | Modified Gross | 4,848 | Jan-23 | $60.00 | $40 / 6 | $1.50 / year |
340 Madison Avenue New York, NY | 1920/NAP | 714,869 | Carlyle Group | Modified Gross | 40,542 | Sep-22 | $66.00 | $152 / 9 | $71 PSF in year 6 |
521 Fifth Avenue New York, NY | 1929/NAP | 339,901 | Genpact | Modified Gross | 17,796 | Sep-22 | $74.00 | $150 / 8 | $79 PSF in year 7 |
292 Madison Avenue New York, NY | 1923/NAP | 178,097 | Lightbox OOH Video Network | Modified Gross | 11,113 | Jul-22 | $65.00 | $110 / 1 | $70 PSF in year 5 |
| (1) | Source: Appraisal. |
| (2) | Based on the underwritten rent roll dated May 1, 2023. |
| (3) | Information is provided by the borrower sponsors. |
| THE INFORMATION IN THIS STRUCTURAL AND COLLATERAL TERM SHEET IS NOT COMPLETE AND MAY BE AMENDED PRIOR TO THE TIME OF SALE. THIS TERM SHEET IS NOT AN OFFER TO SELL THESE SECURITIES AND IT IS NOT A SOLICITATION OF AN OFFER TO BUY THESE SECURITIES IN ANY JURISDICTION WHERE THE OFFER OR SALE IS NOT PERMITTED. | ||
| 76 | ||
| Structural and Collateral Term Sheet | BMO 2023-C6 | |
| No. 7 – 11 West 42nd Street | ||
The following table presents certain information relating to comparable retail rental properties for the 11 West 42nd Street Property:
| Comparable Retail Rental Summary(1) | |||||||
| Property Name/Location | Year Built/ Renovated | Size (SF) | Tenant | Suite Size (SF) | Rent PSF | Commencement | Lease Term (Months) |
11 West 42nd Street New York, NY | 1927/2018 | 960,568(2) | M&T Bank(2) | 5,389(2) | $211.90(2) | Dec-07(2) | 246(2) |
445 Fifth Avenue New York, NY | NAV | NAV | Caffe Italia | 1,100 | $202.00 | Feb-23 | 120 |
1 Vanderbilt Avenue New York, NY | NAV | NAV | Watches of Switzerland | 2,875 | $260.00 | Feb-23 | 120 |
130 West 42nd Street New York, NY | NAV | NAV | NY Gifts | 4,180 | $159.00 | Jan-23 | 84 |
1166 Avenue of the Americas New York, NY | NAV | NAV | Citibank | 3,637 | $375.00 | Sep-22 | 60 |
475 Fifth Avenue New York, NY | NAV | NAV | Penske Media Corporation | 3,375 | $296.00 | May-22 | 143 |
| (1) | Source: Appraisal. |
| (2) | Based on the underwritten rent roll dated May 1, 2023. |
The following table presents certain information relating to the appraisal’s market rent conclusion for the 11 West 42nd Street Property:
| Market Rent Summary(1) | ||||
| Type (Floors) | Market Rent PSF | Lease Term (Years) | Rent Increase Projection | Lease Type |
| Major Office (2-7): | $59.00 | 15 plus free rent | 10.0% every 5 years | Modified Gross |
| Minor Office (2-7): | $59.00 | 10 plus free rent | 10.0% every 5 years | Modified Gross |
| Major Office (8-12): | $61.00 | 15 plus free rent | 10.0% every 5 years | Modified Gross |
| Minor Office (8-12): | $61.00 | 10 plus free rent | 10.0% every 5 years | Modified Gross |
| Major Office (13-19): | $65.00 | 15 plus free rent | 10.0% every 5 years | Modified Gross |
| Minor Office (13-19): | $65.00 | 10 plus free rent | 10.0% every 5 years | Modified Gross |
| Major Office (20-26): | $69.00 | 15 plus free rent | 10.0% every 5 years | Modified Gross |
| Minor Office (20-26): | $69.00 | 10 plus free rent | 10.0% every 5 years | Modified Gross |
| Major Office (27-30): | $71.00 | 15 plus free rent | 10.0% every 5 years | Modified Gross |
| Minor Office (27-30): | $71.00 | 10 plus free rent | 10.0% every 5 years | Modified Gross |
| Major Office (31-32): | $62.00 | 15 plus free rent | 10.0% every 5 years | Modified Gross |
| Minor Office (31-32): | $62.00 | 10 plus free rent | 10.0% every 5 years | Modified Gross |
| (1) | Source: Appraisal. |
| THE INFORMATION IN THIS STRUCTURAL AND COLLATERAL TERM SHEET IS NOT COMPLETE AND MAY BE AMENDED PRIOR TO THE TIME OF SALE. THIS TERM SHEET IS NOT AN OFFER TO SELL THESE SECURITIES AND IT IS NOT A SOLICITATION OF AN OFFER TO BUY THESE SECURITIES IN ANY JURISDICTION WHERE THE OFFER OR SALE IS NOT PERMITTED. | ||
| 77 | ||
| Structural and Collateral Term Sheet | BMO 2023-C6 | |
| No. 7 – 11 West 42nd Street | ||
The following table presents certain information relating to comparable sales for the 11 West 42nd Street Property:
| Comparable Sales(1) | |||||||
| Name / Property Location | Sale Date | Total NRA (SF) | Total Occupancy | Sale Price | Sale Price PSF | Adjusted Sales Price PSF | |
11 West 42nd Street 11 West 42nd Street New York, NY | NAP | 960,568 | (2) | 98.6%(2) | NAP | NAP | NAP |
Tower 56 126 East 56th Street New York, NY | Apr-2023 | 186,884 | 80.0% | $113,000,000 | $604.65 | $634.89 | |
1330 Sixth Avenue 1330 Avenue of the Americas New York, NY | Nov-2022 | 534,203 | 81.0% | $310,278,784 | $580.83 | $667.95 | |
830 3rd Avenue 830 3rd Avenue New York, NY | Sep-2022 | 147,068 | 33.0% | $72,000,000 | $489.57 | $550.77 | |
Farmers Loan & Trust Co. Building 475 Fifth Avenue New York, NY | May-2022 | 276,078 | 94.0% | $291,000,000 | $1,054.05 | $592.90 | |
110 East 42nd Street 110 East 42nd Street New York, NY | Dec-2021 | 222,935 | 89.0% | $117,075,000 | $525.15 | $578.98 | |
Springs Building 104 West 40th Street New York, NY | Aug-2021 | 210,428 | 72.0% | $127,500,000 | $605.91 | $640.75 | |
| (1) | Source: Appraisal. |
| (2) | Based on the underwritten rent roll dated May 1, 2023. |
The Borrower. The borrower is 11 West 42 Realty Investors, L.L.C., a Delaware limited liability company and single purpose entity with two independent directors. Legal counsel to the borrower delivered a non-consolidation opinion in connection with the origination of the 11 West 42nd Street Whole Loan. There is no non-recourse carveout guarantor or environmental indemnitor for the 11 West 42nd Street Whole Loan separate from the borrower. See “Description of the Mortgage Pool—Non-Recourse Carveout Limitations” in the Preliminary Prospectus.
The Borrower Sponsors. The borrower sponsors are a joint venture between Tishman Speyer Properties, L.P. (“Tishman”) and Silverstein Properties, LLC (“Silverstein”). The borrower sponsors have owned the 11 West 42nd Street Property since 1978.
Tishman is a leading owner, developer, operator and fund manager of real estate around the world. Founded in 1978, Tishman is active across the United States, Europe, Latin America and Asia, building and managing office, residential, life science and retail space in 33 key global markets. Tishman’s signature assets include New York City's Rockefeller Center, São Paulo's Torre Norte, The Springs in Shanghai, Paris Bourse in Paris, and Frankfurt’s OpernTurm and TaunusTurm. Tishman operates and owns a portfolio of over 170 million square feet, worth over $89 billion.
Silverstein, founded in 1957, is a privately held, vertically integrated, full-service real estate development, investment and management firm based in New York City. Silverstein has developed, owned and managed over 40 million square feet of office, residential, hotel, retail and mixed-use properties. Silverstein owns and operates a portfolio of assets valued at over $10 billion, with nearly 16 million square feet of commercial, residential and retail space across ten office towers, a luxury hotel and two luxury rental buildings.
Property Management. The 11 West 42nd Street Property is managed by Tishman Speyer Properties, L.L.C., an affiliate of the borrower.
Escrows and Reserves. At origination, the borrower deposited into escrow $10,000,000 for TI/LC reserves, approximately $5,685,544 for free rent reserves, and approximately $13,479,707 for outstanding TI / LC reserves consisting of (i) tenant improvements of approximately $12,478,243 and (ii) qualified leasing commissions of approximately $1,001,464 relating to specified tenants.
Tax Escrows – The borrower is required to deposit monthly to a real estate tax reserve 1/12 of the annual estimated real estate taxes (i) during a Cash Sweep Period (as defined below), or (ii) upon the borrower’s failure to provide the lender evidence of timely payment of taxes.
Insurance Escrows – The borrower is required to deposit monthly 1/12 of the annual estimated insurance premiums to the insurance reserve (i) during a Cash Sweep Period, or (ii) upon the borrower’s failure to provide the lender evidence of the renewal of a blanket policy to the extent the borrower maintains insurance pursuant to a blanket policy.
Replacement Reserves – During a Cash Sweep Period, the borrower is required to deposit monthly amounts of approximately $16,009 into a reserve for replacements for the 11 West 42nd Street Property, subject to a cap of approximately $288,170.
| THE INFORMATION IN THIS STRUCTURAL AND COLLATERAL TERM SHEET IS NOT COMPLETE AND MAY BE AMENDED PRIOR TO THE TIME OF SALE. THIS TERM SHEET IS NOT AN OFFER TO SELL THESE SECURITIES AND IT IS NOT A SOLICITATION OF AN OFFER TO BUY THESE SECURITIES IN ANY JURISDICTION WHERE THE OFFER OR SALE IS NOT PERMITTED. | ||
| 78 | ||
| Structural and Collateral Term Sheet | BMO 2023-C6 | |
| No. 7 – 11 West 42nd Street | ||
TI/LC Reserve – The borrower is required to deposit monthly amounts of approximately $240,142 into the TI/LC reserve, and during a Leasing True-Up Period (as defined below), the borrower is required to deposit monthly all excess cash flows into the TI/LC reserve.
Lockbox / Cash Management. The 11 West 42nd Street Whole Loan is structured with a hard lockbox and springing cash management. All rents from the 11 West 42nd Street Property are required to be deposited directly to the lockbox account and, so long as a Cash Sweep Period is not continuing, the borrower is permitted to use the lockbox account as borrower’s operating account. During a Cash Sweep Period, the borrower will not have access to the funds in the lockbox account and such funds will be transferred to the lender-controlled cash management account and disbursed according to the 11 West 42nd Street Whole Loan documents. During a Cash Sweep Period, all excess cash is required to be (a) if a Leasing True-Up Period (as defined below) is continuing, deposited into the leasing reserve or (b) otherwise, held by the lender as additional security for the 11 West 42nd Street Whole Loan; provided that so long as no event of default exists, excess cash will be available to the borrower to fund shortfalls in debt service on the 11 West 42nd Street Whole Loan or 11 West 42nd Street Mezzanine Loan, shortfalls in required reserve deposits, qualified leasing expenses, operating expenses and capital expenditures set forth in the annual budget, extraordinary expenses, payment of default interest or late fees and certain other amounts as set forth in the 11 West 42nd Street Whole Loan documents. During a Cash Sweep Period, the borrower may post cash or an acceptable letter of credit or utilize excess cash in an amount necessary to achieve the applicable debt yield or debt service coverage ratio if drawn and hypothetically applied to reduce principal. Such cash or letter of credit will be released to the borrower following the discontinuance of a Cash Sweep Period.
A “Cash Sweep Period” will commence upon the earlier to occur of (i) an event of default under the 11 West 42nd Street Whole Loan documents or the 11 West 42nd Street Mezzanine Loan (as defined below) documents, (ii) the debt yield falling below 9.25% on a trailing 12 month basis (tested quarterly), (iii) after July 6, 2024, the debt service coverage ratio falling below 1.10x on a trailing 12 month basis (tested quarterly), (iv) the commencement of a Lease Sweep Period (as defined below), or (v) the commencement of a Leasing True-Up Period and will terminate upon (a) with respect to clause (i) the cure of such event of default, (b) with respect to clause (ii), the debt yield being at least 9.25% on a trailing 12 month basis (tested quarterly for two consecutive quarters), (c) with respect to clause (iii), the debt service coverage ratio being at least 1.10x on a trailing 12 month basis (tested quarterly for two consecutive quarters), (d) with respect to clause (iv), the occurrence of a Lease Sweep Period Cure Event (as defined below), and (e) with respect to clause (v), the cessation of the Leasing True-Up Period.
A “Lease Sweep Period” will occur upon the earliest to occur of (i) the date that is the earlier of (a) 12 months prior to the expiration of the applicable Lease Sweep Lease (as defined below), (b) the expiration date of any extension option contained within any such Lease Sweep Lease, and (c) the date the subject Lease Sweep Tenant (as defined below) gives notice, in accordance with the applicable Lease Sweep Lease, of its intention not to extend the applicable Lease Sweep Lease as to more than 50% of the total rentable square feet of the subject Lease Sweep Lease, in each case of (a), (b), and (c), unless the subject Lease Sweep Tenant has given notice of renewal or extension of the applicable Lease Sweep Lease in accordance with the terms thereof; (ii) the date on which a Lease Sweep Tenant terminates or gives a valid notice to terminate as to more than 50% of the total rentable square feet of the subject Lease Sweep Lease and such termination is to occur within 12 months thereafter; provided, however, that no Lease Sweep Period will occur if the borrower simultaneously or theretofore enters into one or more replacement leases in accordance with the 11 West 42nd Street Whole Loan documents covering all or substantially all of the terminated space (or an equivalent amount of space elsewhere in the building); (iii) the date on which a Lease Sweep Tenant goes dark (unless such Lease Sweep Tenant or any replacement tenant is investment-grade rated) as to more than 50% of its total rentable square footage; (iv) a monetary default or material non-monetary default by a Lease Sweep Tenant under its lease; or (v) a Lease Sweep Tenant or guarantor becomes subject to insolvency proceedings.
A "Lease Sweep Lease” means any lease which, individually or when aggregated with all other leases with the same tenant or its affiliates demises more than 115,000 square feet of the 11 West 42nd Street Property’s net rentable area (excluding any unexercised expansion rights or unexercised preferential rights to lease additional space contained in such lease).
A “Lease Sweep Tenant” means each tenant under a Lease Sweep Lease.
A “Lease Sweep Period Cure Event” will occur upon the earliest of, (a) with respect to clauses (i),(ii), (iii), (iv) and (v) of the definition of Lease Sweep Period, entry into one or more replacement leases in accordance with the 11 West 42nd Street Whole Loan documents covering substantially all of the applicable square feet (or an equivalent amount of space elsewhere in the 11 West 42nd Street Property) and the lease sweep cure conditions have been satisfied; (b) with respect to clause (iii) of the definition of Lease Sweep Period, the date on which the Lease Sweep Tenant re-opens within at least 50% of its total rentable square feet for a period of not less than three months, (c) with respect to clause (iv) of the definition of Lease Sweep Period, the date on which the default has been cured; or (d) with respect to clause (v) of the definition of Lease Sweep Period, the Lease Sweep Tenant or guarantor insolvency proceedings have terminated and the Lease Sweep Lease or the applicable guaranty has been affirmed, assumed, or assigned in a manner satisfactory to the lender. The amounts collected during a Cash Sweep Period for a Lease Sweep Period will be capped at $75 per square feet of affected space (and upon first achieving the same, the applicable Cash Sweep Period shall cease assuming no other Cash Sweep Period is continuing).
A “Leasing True-Up Period” means a period (A) commencing if, at any point after July 6, 2026, (x) the anticipated amount of qualified leasing expenses to be incurred by the borrower during the remainder of the 11 West 42nd Street Whole Loan term (tested on July 6, 2026, and every 12th month anniversary thereafter, as determined by the borrower in the exercise of commercially reasonable judgment
| THE INFORMATION IN THIS STRUCTURAL AND COLLATERAL TERM SHEET IS NOT COMPLETE AND MAY BE AMENDED PRIOR TO THE TIME OF SALE. THIS TERM SHEET IS NOT AN OFFER TO SELL THESE SECURITIES AND IT IS NOT A SOLICITATION OF AN OFFER TO BUY THESE SECURITIES IN ANY JURISDICTION WHERE THE OFFER OR SALE IS NOT PERMITTED. | ||
| 79 | ||
| Structural and Collateral Term Sheet | BMO 2023-C6 | |
| No. 7 – 11 West 42nd Street | ||
and approved by the lender, such approval not to be unreasonably withheld, conditioned, or delayed by the lender so long as such determination is supported by market data provided by the borrower to the lender (such anticipated amount, the “Remaining Leasing Expense Amount”) is in excess of (y) the sum of (i) the amount of funds then on deposit in the TI/LC reserve plus (ii) the aggregate amount of scheduled monthly deposits remaining to be made to the TI/LC reserve during the remainder of the 11 West 42nd Street Whole Loan term (the sum of the foregoing (i) and (ii) as of any given date, the “Available Leasing Reserve Funds”) and (B) terminating upon the date upon which the amount of Available Leasing Reserve Funds equals the Remaining Leasing Expense Amount.
In addition to the foregoing cash management provisions, due to the failure of the borrower to execute the amendment to the Michael Kors lease described in “Major Tenants” (above) on or before July 30, 2023, the borrower is presently prohibited from distributing any excess cash after payment of debt service and property-level operating expenses to any member or other direct or indirect owner of the borrower until the earlier of (i) the execution of such amendment to the Michael Kors lease or (ii) the execution of one or more replacement leases covering at least 200,000 square feet on lease terms at least as favorable to the borrower as the proposed amendment to the Michael Kors lease
Subordinate Debt. None. However, the borrower will be permitted to enter into a single (x) “property-assessed clean energy loan” or (y) any other indebtedness, without regard to the name given to such indebtedness, which is (i) incurred for improvements to the 11 West 42nd Street Property for the purpose of increasing energy efficiency, increasing use of renewable energy sources, resource conservation, or a combination of the foregoing, and (ii) repaid through multi-year tax assessments against the 11 West 42nd Street Property in an amount not to exceed $10,000,000, subject to the lender’s prior written approval of the terms and structure (which approval may be conditioned upon receipt of a rating agency confirmation). See “Description of the Mortgage Pool—Additional Indebtedness” in the Preliminary Prospectus.
Mezzanine Debt. Concurrently with the funding of the 11 West 42nd Street Whole Loan, BANA originated a mezzanine loan in the amount of $56.0 million (the “11 West 42nd Street Mezzanine Loan”). The 11 West 42nd Street Mezzanine Loan is secured by the direct equity interests in the borrower and is coterminous with the 11 West 42nd Street Whole Loan. The 11 West 42nd Street Mezzanine Loan accrues interest at a rate of 14.00000% per annum. A mezzanine intercreditor agreement was executed at loan origination. Subsequent to loan origination, the mezzanine loan was sold by BANA to an affiliate of Taconic Capital.
| 11 West 42nd Street Mezzanine Loan Summary | ||||||||
| Original Principal Balance | Interest Rate | Original Term (mos) | Original Amortization Term (mos) | Original IO Term (mos) | Total Debt UW NCF DSCR(1) | Total Debt UW NOI Debt Yield(1) | Total Debt Cut-off Date LTV(1) | |
| 11 West 42nd Street Mezzanine Loan | $56,000,000 | 14.0000% | 60 | 0 | 60 | 1.00x | 9.6% | 59.5% |
| (1) | Total Debt UW NCF DSCR, Total Debt UW NOI Debt Yield and Total Debt Cut-off Date LTV reflect the aggregate of the Cut-off Date balance of the 11 West 42nd Street Whole Loan and the 11 West 42nd Street Mezzanine Loan. |
Partial Release. Not permitted.
Ground Lease. None.
| THE INFORMATION IN THIS STRUCTURAL AND COLLATERAL TERM SHEET IS NOT COMPLETE AND MAY BE AMENDED PRIOR TO THE TIME OF SALE. THIS TERM SHEET IS NOT AN OFFER TO SELL THESE SECURITIES AND IT IS NOT A SOLICITATION OF AN OFFER TO BUY THESE SECURITIES IN ANY JURISDICTION WHERE THE OFFER OR SALE IS NOT PERMITTED. | ||
| 80 | ||
| Structural and Collateral Term Sheet | BMO 2023-C6 | |
| No. 8 – Back Bay Office | ||
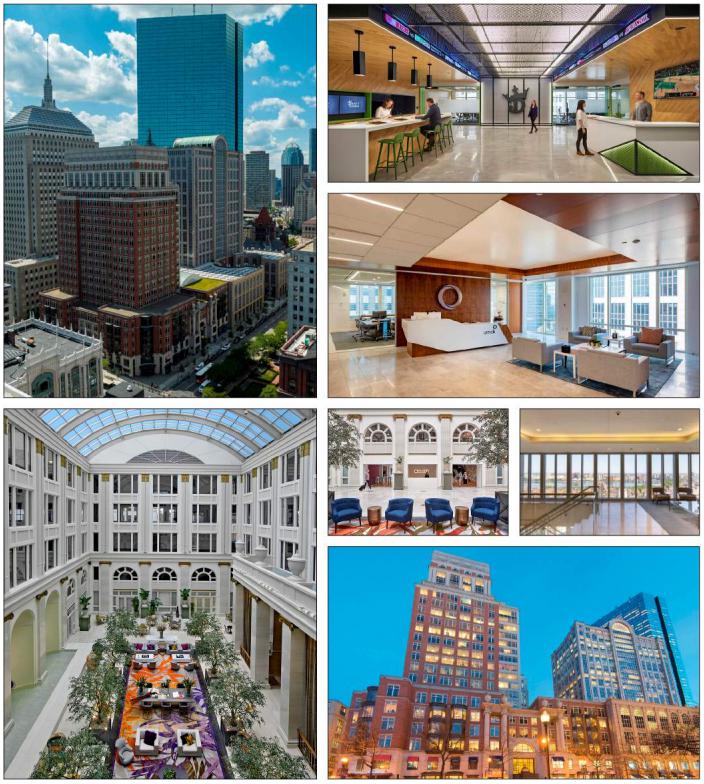
| THE INFORMATION IN THIS STRUCTURAL AND COLLATERAL TERM SHEET IS NOT COMPLETE AND MAY BE AMENDED PRIOR TO THE TIME OF SALE. THIS TERM SHEET IS NOT AN OFFER TO SELL THESE SECURITIES AND IT IS NOT A SOLICITATION OF AN OFFER TO BUY THESE SECURITIES IN ANY JURISDICTION WHERE THE OFFER OR SALE IS NOT PERMITTED. | ||
| 81 | ||
| Structural and Collateral Term Sheet | BMO 2023-C6 | |
| No. 8 – Back Bay Office | ||

| THE INFORMATION IN THIS STRUCTURAL AND COLLATERAL TERM SHEET IS NOT COMPLETE AND MAY BE AMENDED PRIOR TO THE TIME OF SALE. THIS TERM SHEET IS NOT AN OFFER TO SELL THESE SECURITIES AND IT IS NOT A SOLICITATION OF AN OFFER TO BUY THESE SECURITIES IN ANY JURISDICTION WHERE THE OFFER OR SALE IS NOT PERMITTED. | ||
| 82 | ||
| Structural and Collateral Term Sheet | BMO 2023-C6 | |
| No. 8 – Back Bay Office | ||
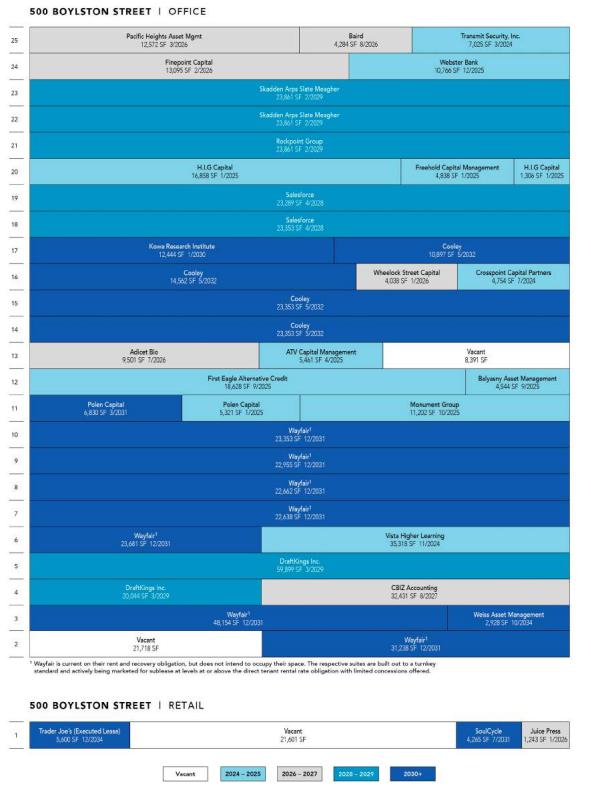
| THE INFORMATION IN THIS STRUCTURAL AND COLLATERAL TERM SHEET IS NOT COMPLETE AND MAY BE AMENDED PRIOR TO THE TIME OF SALE. THIS TERM SHEET IS NOT AN OFFER TO SELL THESE SECURITIES AND IT IS NOT A SOLICITATION OF AN OFFER TO BUY THESE SECURITIES IN ANY JURISDICTION WHERE THE OFFER OR SALE IS NOT PERMITTED. | ||
| 83 | ||
| Structural and Collateral Term Sheet | BMO 2023-C6 | |
| No. 8 – Back Bay Office | ||
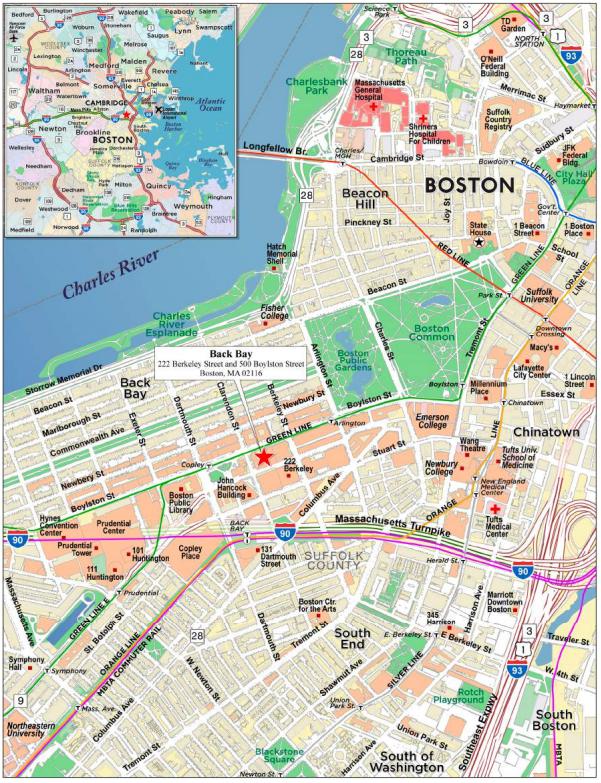
| THE INFORMATION IN THIS STRUCTURAL AND COLLATERAL TERM SHEET IS NOT COMPLETE AND MAY BE AMENDED PRIOR TO THE TIME OF SALE. THIS TERM SHEET IS NOT AN OFFER TO SELL THESE SECURITIES AND IT IS NOT A SOLICITATION OF AN OFFER TO BUY THESE SECURITIES IN ANY JURISDICTION WHERE THE OFFER OR SALE IS NOT PERMITTED. | ||
| 84 | ||
| Structural and Collateral Term Sheet | BMO 2023-C6 | |
| No. 8 – Back Bay Office | ||
| Mortgage Loan Information | Property Information | |||
| Mortgage Loan Seller(1): | ZBNA | Single Asset / Portfolio: | Single Asset | |
| Original Principal Balance(1)(2): | $25,000,000 | Title: | Fee | |
| Cut-off Date Principal Balance(1)(2): | $25,000,000 | Property Type – Subtype: | Office – CBD | |
| % of IPB: | 4.1% | Net Rentable Area (SF): | 1,283,670 | |
| Loan Purpose: | Refinance | Location: | Boston, MA | |
| Borrower: | 500 Boylston & 222 Berkeley Owner (DE) LLC | Year Built / Renovated: | 1987, 1991 / 2016-2022 | |
| Borrower Sponsors: | JPMorgan Chase Bank, N.A., J.P. Morgan Investment Management Inc., OMERS Administration Corporation and OPG Investment Holdings (US), LLC | Occupancy: | 95.8% | |
| Interest Rate(3): | 6.29800% | Occupancy Date: | 4/30/2023 | |
| Note Date: | 6/7/2023 | 4th Most Recent NOI (As of): | $51,254,278 (12/31/2020) | |
| Maturity Date: | 7/6/2028 | 3rd Most Recent NOI (As of): | $61,539,300 (12/31/2021) | |
| Interest-only Period: | 60 months | 2nd Most Recent NOI (As of): | $62,722,256 (12/31/2022) | |
| Original Term: | 60 months | Most Recent NOI (As of): | $63,014,340 (TTM 3/31/2023) | |
| Original Amortization Term: | None | UW Economic Occupancy: | 93.6% | |
| Amortization Type: | Interest Only | UW Revenues: | $115,015,445 | |
| Call Protection(4): | L(25),DorYM1(28),O(7) | UW Expenses: | $37,554,805 | |
| Lockbox / Cash Management: | Hard / Springing | UW NOI: | $77,460,640 | |
| Additional Debt(2): | Yes | UW NCF: | $77,203,906 | |
| Additional Debt Balance(2): | $450,000,000 / $65,000,000 / $40,000,000 | Appraised Value / Per SF(7): | $1,410,000,000 / $1,098 | |
| Additional Debt Type(2): | Pari Passu / Subordinate/ Mezzanine | Appraisal Date(7): | 10/19/2022 | |
| Escrows and Reserves | Financial Information(2) | ||||||||||
| Initial | Monthly | Initial Cap | Senior Loan | Whole Loan | Total Debt | ||||||
| Taxes: | $0 | Springing | N/A | Cut-off Date Loan / SF: | $370 | $421 | $452 | ||||
| Insurance: | $0 | Springing | N/A | Maturity Date Loan / SF: | $370 | $421 | $452 | ||||
| Replacement Reserves: | $0 | Springing | N/A | Cut-off Date LTV(7): | 33.7% | 38.3% | 41.1% | ||||
| TI/LC Reserve(5): | $26,723,400 | Springing | N/A | Maturity Date LTV(7): | 33.7% | 38.3% | 41.1% | ||||
| Other(6): | $31,137,229 | $0 | N/A | UW NCF DSCR: | 2.55x | 2.16x | 1.94x | ||||
| UW NOI Debt Yield: | 16.3% | 14.3% | 13.4% | ||||||||
| Sources and Uses | ||||||||
| Sources | Proceeds | % of Total | Uses | Proceeds | % of Total | |||
| Senior Loan(2) | $475,000,000 | 76.4 | % | Payoff Existing Debt(8) | $546,966,371 | 88.0 | % | |
| Subordinate Loan(2) | 65,000,000 | 10.5 | Reserves | 57,860,629 | 9.3 | % | ||
| Borrower Sponsor Equity | 41,583,604 | 6.7 | Closing Costs | 16,756,604 | 2.7 | % | ||
| Mezzanine Loan(2) | 40,000,000 | 6.4 | ||||||
| Total Sources | $621,583,604 | 100.0 | % | Total Uses | $621,583,604 | 100.0 | % | |
| (1) | The Back Bay Office Whole Loan (as defined below) was co-originated by Deutsche Bank AG, acting through its New York Branch (“DBNY”), Goldman Sachs Bank USA (“GSBI”), Wells Fargo Bank, National Association (“WFBNA”), New York Life Insurance Company (“New York Life”), and Teachers Insurance and Annuity Association of America (“TIAA”). The Cut-off Date Balance of $25,000,000 represents the non-controlling note A-4-2 contributed by Zions Bancorporation, N.A. |
| (2) | The Back Bay Office Mortgage Loan (as defined below) is part of the Back Bay Office Whole Loan which has an original aggregate principal balance of $540,000,000, which is comprised of 15 senior pari passu promissory notes with an aggregate outstanding principal balance as of the Cut-off Date of $475,000,000 and two subordinate promissory notes with an aggregate outstanding principal balance as of the Cut-off Date of $65,000,000. Additionally, a mezzanine loan was originated with an outstanding principal balance as of the Cut-off Date of $40,000,000 (the “Back Bay Office Mezzanine Loan,” and together with the Back Bay Office Whole Loan, the “Back Bay Office Total Debt”). The Financial Information in the chart above reflects the Back Bay Office Senior Loan (as defined below), the Back Bay Office Whole Loan and the Back Bay Office Total Debt. For additional information, see “The Loan” below. |
| (3) | Represents the interest rate of the Back Bay Office Senior Loan. The interest rate of the Back Bay Office Subordinate Companion Loan (as defined below) is 8.2000% per annum. |
| (4) | Defeasance, or prepayment of the Back Bay Office Whole Loan (together with, if prior to the payment date in January 2028, a prepayment fee equal to the greater of 1% of the unpaid principal balance and a yield maintenance premium) in whole, but not in part, is permitted at any time after the earlier of (i) June 7, 2026 and (ii) the second |
| THE INFORMATION IN THIS STRUCTURAL AND COLLATERAL TERM SHEET IS NOT COMPLETE AND MAY BE AMENDED PRIOR TO THE TIME OF SALE. THIS TERM SHEET IS NOT AN OFFER TO SELL THESE SECURITIES AND IT IS NOT A SOLICITATION OF AN OFFER TO BUY THESE SECURITIES IN ANY JURISDICTION WHERE THE OFFER OR SALE IS NOT PERMITTED. | ||
| 85 | ||
| Structural and Collateral Term Sheet | BMO 2023-C6 | |
| No. 8 – Back Bay Office | ||
| anniversary of the date on which the entire Back Bay Office Whole Loan (other than Note A-1, Note A-2, Note B-1 and Note B-2) has been securitized. The assumed lockout period of 25 months is based on the closing date of the BMO 2023-C6 securitization transaction in August 2023. The actual lockout period may be longer. |
| (5) | The borrower is not required to make monthly deposits into the TI/LC reserve account until the first monthly payment date in which the undisbursed portion of the Upfront TI/LC Reserve of $26,723,400 is less than or equal to $15,000,000. Upon such event, the borrower will be required to deposit $213,969 on a monthly basis. See “—Escrows and Reserves” below. |
| (6) | Other reserves include an upfront outstanding TI/LC reserve of approximately $21,283,070 and a free rent reserve of approximately $9,854,159. See “—Escrows and Reserves” below. |
| (7) | Based on the “as is (extraordinary assumption)“ appraised value of $1,410,000,000 as of October 19, 2022, which is subject to the extraordinary assumption that approximately $67,600,000 has been reserved for leasing costs. Due to the time passed since the appraisal date, the leasing cost escrow amount under the loan agreement is $57,860,629. All outstanding leasing costs at the time of loan origination were reserved upfront. Based on the “as-is” appraised value of $1,345,000,000, the Cut-off Date LTV and Maturity Date LTV for the Back Bay Office Senior Loan, the Back Bay Office Whole Loan and the Back Bay Office Total Debt are equal to 35.3%, 40.1% and 43.1%, respectively. |
| (8) | Prior financing was originally $660,000,000 which was reduced by approximately $48.2 million of amortization prior to December 2022. In addition, in December 2022, the borrower sponsor executed an approximately $59.9 million paydown in conjunction with a short term loan extension. |
The Loan. The eighth largest mortgage loan (the “Back Bay Office Mortgage Loan”) is part of a whole loan (the “Back Bay Office Whole Loan”) that is evidenced by (i) the Back Bay Office Mortgage Loan, (ii) 14 senior pari passu promissory notes, which, along with the Back Bay Office Mortgage Loan, have an aggregate original principal amount of $475,000,000 (the “Back Bay Office Pari Passu Companion Loans”, and together with the Back Bay Office Mortgage Loan, the “Back Bay Office Senior Loan”), (iii) two subordinate promissory notes in the original principal amount of $65,000,000 (the “Back Bay Office Subordinate Companion Loan”), and (iv) a mezzanine loan in the original principal amount of $40,000,000 (the “Back Bay Office Mezzanine Loan”). The Back Bay Office Whole Loan was co-originated on June 7, 2023 by DBNY, GSBI, WFBNA, New York Life and TIAA. The Back Bay Office Whole Loan is secured by a first priority mortgage on the borrower’s fee simple interest in a 1,283,670 square foot office property located in Boston, Massachusetts (the “Back Bay Office Property”). The Back Bay Office Mortgage Loan is evidenced by the non-controlling note A-4-2 with an original and outstanding principal balance of $25,000,000, which Zions Bancorporation, N.A. acquired from DBNY on July 13, 2023. See “Description of the Mortgage Pool—The Whole Loans—The Back Bay Pari Passu-AB Whole Loan” and “The Pooling and Servicing Agreement—Servicing of the Outside Serviced Mortgage Loans” in the Preliminary Prospectus.
The Back Bay Office Senior Loan accrues interest at a fixed rate of 6.29800% per annum and the Back Bay Office Subordinate Companion Loan accrues interest at a fixed rate of 8.20000% per annum. The Back Bay Office Whole Loan has an initial term of 60 months, a remaining term of 59 months and is interest-only for the full term. The scheduled maturity date of the Back Bay Office Whole Loan is the payment date that occurs in July 2028. The proceeds of the Back Bay Office Whole Loan were used to refinance the Back Bay Office Property, pay origination costs, and fund upfront reserves.
Defeasance or prepayment (together with, if prior to the payment date in January 2028, a prepayment fee equal to the greater of 1% of the unpaid principal balance and a yield maintenance premium) of the Back Bay Office Whole Loan in whole (but not in part) is permitted at any time after the earlier of (i) June 7, 2026 and (ii) the second anniversary of the date on which the entire Back Bay Office Whole Loan (other than note A-1, note A-2, note B-1 and note B-2) has been securitized. The assumed lockout period of 25 months is based on the expected BMO 2023-C6 securitization closing date in August 2023. The actual lockout period may be longer. Voluntary prepayment of the Back Bay Office Whole Loan in whole (but not in part), without payment of any prepayment fee or yield maintenance premium is permitted on and after the payment date occurring in January 2028.
The table below summarizes the promissory notes that comprise the Back Bay Office Whole Loan. The relationship between the holders of the Back Bay Office Whole Loan is governed by a co-lender agreement as described under “Description of the Mortgage Pool—The Whole Loans—The Back Bay Office Pari Passu-AB Whole Loan” in the Preliminary Prospectus. The Back Bay Office Whole Loan will be serviced under the Benchmark 2023-B39 pooling and servicing agreement. See “Description of the Mortgage Pool—The Whole Loans—The Back Bay Office Pari Passu-AB Whole Loan” and “The Pooling and Servicing Agreement—Servicing of the Outside Serviced Mortgage Loans” in the Preliminary Prospectus.
| THE INFORMATION IN THIS STRUCTURAL AND COLLATERAL TERM SHEET IS NOT COMPLETE AND MAY BE AMENDED PRIOR TO THE TIME OF SALE. THIS TERM SHEET IS NOT AN OFFER TO SELL THESE SECURITIES AND IT IS NOT A SOLICITATION OF AN OFFER TO BUY THESE SECURITIES IN ANY JURISDICTION WHERE THE OFFER OR SALE IS NOT PERMITTED. | ||
| 86 | ||
| Structural and Collateral Term Sheet | BMO 2023-C6 | |
| No. 8 – Back Bay Office | ||
| Whole Loan Summary | |||||
| Note | Original Balance | Cut-off Date Balance | Note Holder | Controlling Piece | |
| A-1 | $137,500,000 | $137,500,000 | New York Life | No(2) | |
| A-2 | $100,000,000 | $100,000,000 | TIAA | No(2) | |
| A-3 | $22,500,000 | $22,500,000 | Benchmark 2023-V3 | No | |
| A-4-1 | $30,000,000 | $30,000,000 | Benchmark 2023-B39 | No(2) | |
| A-4-2 | $25,000,000 | $25,000,000 | BMO 2023-C6 | No | |
| A-4-3 | $5,000,000 | $5,000,000 | Benchmark 2023-V3 | No | |
| A-5-1 | $17,500,000 | $17,500,000 | BMO 2023-5C1 | No | |
| A-5-2 | $12,500,000 | $12,500,000 | DBRI or its affiliate(1) | No | |
| A-6 | $50,000,000 | $50,000,000 | BANK5 2023-5YR2 | No | |
| A-7-A | $15,000,000 | $15,000,000 | WFBNA(1) | No | |
| A-7-B | $10,000,000 | $10,000,000 | BANK5 2023-5YR2 | No | |
| A-8-1 | $20,000,000 | $20,000,000 | Benchmark 2023-B39 | No | |
| A-8-2-A | $17,500,000 | $17,500,000 | Benchmark 2023-V3 | No | |
| A-8-2-B | $2,500,000 | $2,500,000 | BMO 2023-5C1 | No | |
| A-8-3 | $10,000,000 | $10,000,000 | BMO 2023-5C1 | No | |
| Total Senior Loan | $475,000,000 | $475,000,000 | |||
| B-1 | $39,000,000 | $39,000,000 | SM Finance (GoReLux) LLC, an entity managed by Affinius Capital Management LLC | Yes(2) | |
| B-2 | $26,000,000 | $26,000,000 | SM Finance (GoReLux) LLC, an entity managed by Affinius Capital Management LLC | No | |
| Whole Loan | $540,000,000 | $540,000,000 | |||
| (1) | Expected to be contributed to one or more future securitizations. |
| (2) | The Back Bay Office Whole Loan is a Pari Passu-AB whole loan, and the controlling note as of the date hereof is the Note B-1. Upon the occurrence of certain trigger events specified in the co-lender agreement, however, control will generally shift first, to the Note A-1, then to the Note A-2 and then to the Note A-4-1, in each case, following certain trigger events under the co-lender agreement. See “Description of the Mortgage Pool—The Whole Loans—The Back Bay Office Pari Passu-AB Whole Loan” in the Preliminary Prospectus for more information regarding the manner in which control shifts under the Back Bay Office Whole Loan. |
The Property. The Back Bay Office Property is a 1,283,670 square foot Class A property located on a full square block at the intersection of Berkeley and Boylston Streets in the Back Bay neighborhood of Boston, Massachusetts. The Back Bay Office Property is made up of two interconnected buildings, developed by architects Philip Johnson and Robert A.M. Stern, with 500 Boylston Street built in 1987 and 222 Berkeley Street built in 1991. The Back Bay Office Property includes amenity-forward ground floor retail and proximity to major Boston transportation arteries. The Back Bay Office Property features flexible floor plates ranging from 14,000 to 100,000 square feet, 12’-13’ slab-to-slab ceiling heights and a retail mix of restaurants and fitness tenants. Since acquiring the Back Bay Office Property in 2015, the borrower sponsor has invested approximately $192 million ($150 per square foot) on leasing costs and renovation capital. Recent initiatives include renovations to the central courtyard and improvements to building common areas including a rejuvenated lobby atrium common space. The Back Bay Office Property consists of two of only 13 buildings in Boston to achieve LEED Platinum status. As of April 30, 2023, the Back Bay Office Property was 95.8% leased to 46 tenants with the largest tenant accounting for 27.8% of NRA.
The Back Bay Office Property is currently 95.8% occupied as of April 30, 2023, by a granular collection of technology, finance, and law tenants. The largest tenant is Wayfair (356,312 square feet | 19.5% of underwritten base rent | lease expiration: December 31, 2031), an online platform focused exclusively on the approximately $800 billion home goods market (see further information under “Major Tenants”). Additional top tenants include: DraftKings Inc. (125,104 square feet | 7.3% of underwritten base rent | lease expiration: March 31, 2029); Summit Partners (78,587 square feet | 7.4% of underwritten base rent | lease expiration: November 30, 2033); Cooley (72,165 square feet | 6.6% of underwritten base rent | lease expiration: May 31, 2032 | AM Law 2022 #16); and Skadden Arps Slate Meagher (47,722 square feet | 3.8% of underwritten base rent | lease expiration: February 28, 2029 | AM Law 2022 #5). While the Back Bay Office Property is 95.8% occupied, as of April 30, 2023, and only 26.4% of NRA is scheduled to roll during the five-year loan term, Wayfair is currently dark in its space but is currently paying full unabated rent.
Major Tenants. The three largest tenants based on underwritten base rent are Wayfair, Summit Partners and DraftKings Inc. (“Draft Kings”).
Wayfair (356,312 square feet; 27.8% NRA; 19.5% of underwritten base rent, Moody’s/S&P/Fitch: NR/NR/NR): Wayfair is a large online platform focused exclusively on the home goods market. Wayfair provides approximately 33 million furniture, home décor, houseware, and home improvement products to customers in the United States and internationally, under various brands through its websites including Wayfair, Joss & Main, All Modern, Birch Lane, and Perigold. Headquartered in Boston, Massachusetts with operations throughout North America and Europe, Wayfair employs approximately 18,000 people. Wayfair is currently dark in its space, however as of the origination date Wayfair was paying full unabated rent. We cannot assure you whether Wayfair will continue to pay rent as expected or at all. Wayfair’s lease expires on December 31, 2031. Wayfair has subleased 19,523 square feet of space on the 7th floor to Drift.com at $57.50 per square foot, full-service gross, with a lease expiration of December 31, 2024. Wayfair is currently marketing 156,436 square feet of its remaining space for sublease.
| THE INFORMATION IN THIS STRUCTURAL AND COLLATERAL TERM SHEET IS NOT COMPLETE AND MAY BE AMENDED PRIOR TO THE TIME OF SALE. THIS TERM SHEET IS NOT AN OFFER TO SELL THESE SECURITIES AND IT IS NOT A SOLICITATION OF AN OFFER TO BUY THESE SECURITIES IN ANY JURISDICTION WHERE THE OFFER OR SALE IS NOT PERMITTED. | ||
| 87 | ||
| Structural and Collateral Term Sheet | BMO 2023-C6 | |
| No. 8 – Back Bay Office | ||
Summit Partners (78,587 square feet; 6.1% NRA; 7.4% of underwritten base rent, Moody’s/S&P/Fitch: B3/B/B-): Founded in 1984, Summit Partners is a global alternative investment firm that is currently managing more than $35 billion in capital dedicated to growth equity, fixed income and public equity opportunities. Summit Partners has invested in more than 500 companies in technology, healthcare and other growth industries. Summit Partners has backed many fintech and software service companies, including Calypso Technology, Clearwater Analytics (NYSE: CWAN), EngageSmart (NYSE: ESMT), Gainsight, Jamf (NYSE: JAMF), Klaviyo, RightNow and Smartsheet (NYSE: SMAR). Summit Partners maintains offices in North America and Europe and invests in companies around the world. Summit Partners’ lease expires on November 30, 2033. Summit Partners is in a free rent period for 54,416 square feet through November 2023, which was reserved in full at origination. We cannot assure you that Summit Partners will commence paying rent as expected or at all.
Draft Kings (125,104 square feet; 9.7% NRA; 7.3% of underwritten base rent, Moody’s/S&P/Fitch: NR/NR/NR): DraftKings Inc. is a digital sports entertainment and gaming company with products that range across daily fantasy, regulated gaming and digital media. Headquartered in Boston, and launched in 2012 by Jason Robins, Matt Kalish and Paul Liberman, DraftKings Inc. is a multi-channel provider of sports betting and gaming technologies, powering sports and gaming entertainment for operators in 17 countries. DraftKings Inc.’s lease at the Back Bay Office Property commenced in December 2017 and expires in March 2029 followed by two, five-year extension options. DraftKings Inc. has the right to terminate its lease as of the last day of the 7th lease year from the rent commencement date (March 10, 2026), with between 18 to 21 months’ written notice and the payment of a termination fee equal to three months of base rent for the period immediately following the termination date and the unamortized transaction costs.
Environmental. According to a Phase I environmental assessment dated November 15, 2022, there was no evidence of any recognized environmental conditions at the Back Bay Office Property.
The following table presents certain information relating to the historical occupancy of the Back Bay Office Property:
| Historical and Current Occupancy | |||
| 2020(1) | 2021(1) | 2022(1) | Current(2) |
| 96.0% | 97.0% | 96.8% | 95.8% |
| (1) | Historical Occupancies are as of December 31 of each respective year. |
| (2) | Current Occupancy is as of April 30, 2023. |
| THE INFORMATION IN THIS STRUCTURAL AND COLLATERAL TERM SHEET IS NOT COMPLETE AND MAY BE AMENDED PRIOR TO THE TIME OF SALE. THIS TERM SHEET IS NOT AN OFFER TO SELL THESE SECURITIES AND IT IS NOT A SOLICITATION OF AN OFFER TO BUY THESE SECURITIES IN ANY JURISDICTION WHERE THE OFFER OR SALE IS NOT PERMITTED. | ||
| 88 | ||
| Structural and Collateral Term Sheet | BMO 2023-C6 | |
| No. 8 – Back Bay Office | ||
The following table presents certain information relating to the largest tenants based on underwritten base rent of the Back Bay Office Property:
| Top Tenant Summary(1) | ||||||||||
| Tenant | Ratings Moody’s/S&P/Fitch(2) | Net Rentable Area (SF) | % of Total NRA | UW Base Rent PSF | UW Base Rent | % of Total UW Base Rent | Lease Exp. Date | |||
| Wayfair(3)(4) | NR/NR/NR | 356,312 | 27.8 | % | $38.00 | $13,539,856 | 19.5 | % | 12/31/2031 | |
| Summit Partners(5) | B3/B/B- | 78,587 | 6.1 | $65.04 | 5,111,125 | 7.4 | 11/30/2033 | |||
| DraftKings Inc.(6) | NR/NR/NR | 125,104 | 9.7 | $40.67 | 5,087,655 | 7.3 | 3/31/2029 | |||
| Cooley(7) | NR/NR/NR | 72,165 | 5.6 | $63.51 | 4,583,500 | 6.6 | 5/31/2032 | |||
| Salesforce(8) | A2/A+/NR | 46,642 | 3.6 | $83.00 | 3,871,286 | 5.6 | 4/30/2028 | |||
| GW&K Investment Management | A3/BBB+/NR | 47,304 | 3.7 | $72.00 | 3,405,888 | 4.9 | 2/28/2033 | |||
| Weiss Asset Management(9)(10) | NR/NR/NR | 37,688 | 2.9 | $71.22 | 2,684,320 | 3.9 | Various | |||
| Skadden Arps Slate Meagher | NR/NR/NR | 47,722 | 3.7 | $55.00 | 2,624,710 | 3.8 | 2/28/2029 | |||
| Abrams Capital Management(11) | NR/NR/NR | 28,074 | 2.2 | $79.00 | 2,217,846 | 3.2 | 4/30/2033 | |||
| Orrick Herrington & Sutcliffe | NR/NR/NR | 23,635 | 1.8 | $75.12 | 1,775,542 | 2.6 | 3/31/2030 | |||
| Largest Tenants | 863,233 | 67.2 | % | $52.02 | $44,901,728 | 64.7 | % | |||
| Other Tenants(12) | 366,842 | 28.6 | $66.65 | 24,449,836 | 35.3 | |||||
| Occupied Collateral Total / Wtd. Avg. | 1,230,075 | 95.8 | % | $56.38 | $69,351,564 | 100.0 | % | |||
| Vacant Space | 53,595 | 4.2 | ||||||||
| Total / Wtd. Avg. All Owned Tenants | 1,283,670 | 100.0 | % | |||||||
| (1) | Based on the underwritten rent roll dated April 30, 2023. |
| (2) | Credit Ratings are those of the parent company whether or not the parent guarantees the lease. |
| (3) | Wayfair is currently dark in its space, but as of the origination date was paying unabated rent. We cannot assure you whether Wayfair will continue paying rent as expected or at all. |
| (4) | Wayfair has subleased 19,523 square feet of space on the 7th floor to Drift.com at $57.50 per square foot, full-service gross, with a lease expiration of December 31, 2024. Wayfair is currently marketing 156,436 square feet of its remaining space for sublease. |
| (5) | Summit Partners is in a free rent period for 54,416 square feet through November 2023, which was reserved in full at origination. We cannot assure you that Summit Partners will commence paying rent as expected or at all. |
| (6) | DraftKings Inc. has the right to terminate its lease as of the last day of the 7th lease year from the rent commencement date (March 10, 2026) with between 18 to 21 months’ written notice and the payment of a termination fee equal to three months of base rent for the period immediately following the termination date and the unamortized transaction costs. |
| (7) | Cooley has the one time right to terminate its space on the 16th floor (14,562 square feet) as of May 31, 2025 with between 12 to 18 months written notice and the payment of a termination fee equal to three months of net rent and operating costs for the period immediately following the termination option, plus the unamortized pro-rata extension transaction cost. |
| (8) | Salesforce has subleased 23,353 square feet of its space to Providence Equity Partners, Aeris Partners at a rate of $80.97 per square foot, which sublease is co-terminous with the prime lease. |
| (9) | According to the underwritten rent roll as of April 30, 2023, two Weiss Asset Management spaces totaling 15,223 square feet have an underwritten lease expiration of October 31, 2025; however, pursuant to the lease amendment dated November 15, 2022, its expected lease expiration is October 31, 2034, which would result in a weighted average remaining term of 11.2 years for Weiss Asset Management. |
| (10) | Weiss Asset Management is currently in a free rent period for 19,537 square feet until August 1, 2024, which was reserved in full at origination. We cannot assure you that Weiss Asset Management will commence paying rent as expected or at all. |
| (11) | Abrams Capital Management is currently in a free rent period until December 15, 2023, which was reserved in full at origination. We cannot assure you that Abrams Capital Management will commence paying rent as expected or at all. |
| (12) | Other Tenants includes two tenants (Trader Joe’s and STK), totaling 1.8% of net rentable area that have not yet taken occupancy. STK is expected to take occupancy in December 2023 and Trader Joe’s is expected to take occupancy in June 2024. We cannot assure you that either tenant will take occupancy of its respective space as expected or at all. |
| THE INFORMATION IN THIS STRUCTURAL AND COLLATERAL TERM SHEET IS NOT COMPLETE AND MAY BE AMENDED PRIOR TO THE TIME OF SALE. THIS TERM SHEET IS NOT AN OFFER TO SELL THESE SECURITIES AND IT IS NOT A SOLICITATION OF AN OFFER TO BUY THESE SECURITIES IN ANY JURISDICTION WHERE THE OFFER OR SALE IS NOT PERMITTED. | ||
| 89 | ||
| Structural and Collateral Term Sheet | BMO 2023-C6 | |
| No. 8 – Back Bay Office | ||
The following table presents certain information relating to the tenant lease expirations of the Back Bay Office Property:
| Lease Rollover Schedule(1)(2) | |||||||||||||||
| Year | Number of Leases Expiring | Net Rentable Area Expiring | % of NRA Expiring | UW Base Rent Expiring | % of UW Base Rent Expiring | Cumulative Net Rentable Area Expiring | Cumulative % of NRA Expiring | Cumulative UW Base Rent Expiring | Cumulative % of UW Base Rent Expiring | ||||||
| Vacant | NAP | 53,595 | 4.2 | % | NAP | NA | P | 53,595 | 4.2% | NAP | NAP | ||||
| 2023 | 0 | 0 | 0.0 | $0 | 0.0 | % | 53,595 | 4.2% | $0 | 0.0% | |||||
| 2024 | 7 | 65,939 | 5.1 | 3,413,905 | 4.9 | 119,534 | 9.3% | $3,413,905 | 4.9% | ||||||
| 2025(3) | 12 | 120,770 | 9.4 | 8,093,017 | 11.7 | 240,304 | 18.7% | $11,506,922 | 16.6% | ||||||
| 2026 | 9 | 60,390 | 4.7 | 5,060,933 | 7.3 | 300,694 | 23.4% | $16,567,855 | 23.9% | ||||||
| 2027 | 1 | 32,431 | 2.5 | 1,167,516 | 1.7 | 333,125 | 26.0% | $17,735,371 | 25.6% | ||||||
| 2028 | 2 | 59,172 | 4.6 | 5,133,946 | 7.4 | 392,297 | 30.6% | $22,869,317 | 33.0% | ||||||
| 2029 | 4 | 211,067 | 16.4 | 10,217,124 | 14.7 | 603,364 | 47.0% | $33,086,441 | 47.7% | ||||||
| 2030 | 2 | 36,079 | 2.8 | 2,847,592 | 4.1 | 639,443 | 49.8% | $35,934,034 | 51.8% | ||||||
| 2031 | 4 | 371,905 | 29.0 | 15,324,573 | 22.1 | 1,011,348 | 78.8% | $51,258,607 | 73.9% | ||||||
| 2032 | 1 | 72,165 | 5.6 | 4,583,500 | 6.6 | 1,083,513 | 84.4% | $55,842,107 | 80.5% | ||||||
| 2033 | 3 | 153,965 | 12.0 | 10,734,859 | 15.5 | 1,237,478 | 96.4% | $66,576,966 | 96.0% | ||||||
| 2034 & Thereafter(3) | 3 | 46,192 | 3.6 | 2,774,598 | 4.0 | 1,283,670 | 100.0% | $69,351,564 | 100.0% | ||||||
| Total | 48 | 1,283,670 | 100.0 | % | $69,351,564 | 100.0 | % | ||||||||
| (1) | Certain tenants may have termination or contraction options that may become exercisable prior to the originally stated expiration date of the tenant lease that are not considered in this lease expiration schedule. |
| (2) | Based on the underwritten rent roll dated April 30, 2023. |
| (3) | According to the underwritten rent roll as of April 30, 2023, two Weiss Asset Management spaces totaling 15,223 square feet have an underwritten lease expiration of October 31, 2025; however, pursuant to the lease amendment dated November 15, 2022, their expected lease expiration is October 31, 2034, which would result in a weighted average remaining term of 11.2 years for Weiss Asset Management. |
The following table presents certain information relating to the underwritten cash flows of the Back Bay Office Property:
| Operating History and Underwritten Net Cash Flow(1) | |||||||||
| 2020 | 2021 | 2022 | TTM(2) | Underwritten | Per Square Foot | %(3) | |||
| Base Rent | $51,526,277 | $59,949,889 | $59,804,916 | $58,642,289 | $69,351,564 | $54.03 | 64.2 | % | |
| Step Rent(4) | 0 | 0 | 0 | 0 | 1,362,984 | 1.06 | 1.3 | ||
| Step Rent Credit(5) | 0 | 0 | 0 | 0 | 521,804 | 0.41 | 0.5 | ||
| Value of Vacant Space | 0 | 0 | 0 | 0 | 4,911,403 | 3.83 | 4.5 | ||
| Gross Potential Rent | $51,526,277 | $59,949,889 | $59,804,916 | $58,642,289 | $76,147,755 | $59.32 | 70.4 | % | |
| Total Reimbursements | 24,669,444 | 27,067,738 | 28,017,620 | 28,290,450 | 31,949,642 | 24.89 | 29.6 | ||
| Net Rental Income | $76,195,721 | $87,017,627 | $87,822,536 | $86,932,739 | $108,097,396 | $84.21 | 100.0 | % | |
| Other Income | 7,723,812 | 8,115,682 | 11,231,780 | 13,140,165 | 11,829,452 | 9.22 | 10.9 | ||
| (Vacancy/Credit Loss)(6) | (633,236) | (359,541) | (80,985) | (80,987) | (4,911,403) | (3.83) | (4.5 | ) | |
| Effective Gross Income | $83,286,297 | $94,773,768 | $98,973,331 | $99,991,917 | $115,015,445 | $89.60 | 106.4 | % | |
| Total Expenses | 32,032,019 | 33,234,468 | 36,251,075 | 36,977,577 | 37,554,805 | 29.26 | 32.7 | ||
| Net Operating Income(7)(8) | $51,254,278 | $61,539,300 | $62,722,256 | $63,014,340 | $77,460,640 | $60.34 | 67.3 | % | |
| Total TI/LC, Capex/RR | 0 | 0 | 0 | 0 | 256,734 | 0.20 | 0.2 | ||
| Net Cash Flow | $51,254,278 | $61,539,300 | $62,722,256 | $63,014,340 | $77,203,906 | $60.14 | 67.1 | % | |
| (1) | Based on the underwritten rent roll dated April 30, 2023. |
| (2) | TTM reflects the trailing 12 month period ending on March 31, 2023. |
| (3) | % column represents percent of Net Rental Income for all revenue lines and represents percent of Effective Gross Income for the remainder of fields. |
| (4) | Represents contractual rent steps through April 1, 2024. |
| (5) | Represents straight-line rent average through each tenant’s lease expiration for investment-grade tenants and tenants included in a legal industry magazine listing of the top 100 United States law firms by revenues (“Top 100 Law Firms”). |
| (6) | Vacancy also encompasses bad debt, which includes provisions made for COVID-19 abatements in 2020 and credits for unused provisions in 2021. |
| (7) | The increase in Net Operating Income from 2020 to 2021 was primarily driven by nine tenants, representing 6.6% of net rentable area with leases that began or renewed/extended in 2021, rent increases for tenants in place, and an increase in total recoveries. |
| (8) | The increase from TTM 3/31/2023 to Underwritten Net Operating Income was primarily driven by including credit for six leases which began in October 2022 or later, representing 11.6% of the net rentable area, the rent average benefit for investment-grade and Top 100 Law Firm tenants, contractual rent steps, and an increase in recoveries. |
| THE INFORMATION IN THIS STRUCTURAL AND COLLATERAL TERM SHEET IS NOT COMPLETE AND MAY BE AMENDED PRIOR TO THE TIME OF SALE. THIS TERM SHEET IS NOT AN OFFER TO SELL THESE SECURITIES AND IT IS NOT A SOLICITATION OF AN OFFER TO BUY THESE SECURITIES IN ANY JURISDICTION WHERE THE OFFER OR SALE IS NOT PERMITTED. | ||
| 90 | ||
| Structural and Collateral Term Sheet | BMO 2023-C6 | |
| No. 8 – Back Bay Office | ||
The Market. The Back Bay Office Property is located in Boston, Suffolk County, Massachusetts, in the Back Bay office submarket. The Back Bay office submarket, one of nine distinct geographic concentrations within Boston, contains 14.3 million market rate rental square feet of office space, or 10.3% of the Boston metro's total inventory of office space. In the ten-year period beginning with the third quarter of 2012, new additions to the submarket totaled 884,000 square feet, while 58,000 square feet were removed by developer activity. The net total gain of 826,000 square feet equates to an annualized inventory growth rate of 0.6%, trailing slightly the Boston metropolitan growth rate of 1.0% over the same period. The Back Bay office submarket consists of approximately 17,357,250 square feet of rentable office space as of May 6, 2023. The average market rent for the Back Bay office submarket is $59.09 per square foot and the average vacancy rate is 9.4%.
| Comparable Office Leases(1) | ||||||
| Property Name/Location | Tenant | Lease Size (SF) | Rent PSF | Commencement | Lease Term (Years) | Lease Type |
Back Bay Office Boston, MA | Various | Various | $56.38(2) | Various | Various | NNN |
John Hancock Tower Boston, MA | Versanis Bio, Inc. | 5,190 | $80.00 | Jun-23 | 5.0 Yrs | NNN |
Prudential Center Boston, MA | Foley & Lardner | 99,644 | $96.90 | Mar-24 | 5.0 Yrs | Gross + TE |
Prudential Tower Boston, MA | Federal Home Loan Bank | 39,185 | $57.00 | Jan-24 | 15.0 Yrs | Gross + TE |
One Exeter Plaza Boston, MA | Cerulli Associates | 10,917 | $82.00 | Nov-22 | 10.5 Yrs | Gross + TE |
101 Huntington Boston, MA | Audax Management | 101,815 | $78.00 | Nov-22 | 14.2 Yrs | Gross + TE |
| (1) | Source: Appraisal. |
| (2) | Represents total weighted average of all tenants at the Back Bay Office Property based on the underwritten rent roll dated April 30, 2023. |
The Borrower. The borrower is 500 Boylston & 222 Berkeley Owner (DE) LLC, a Delaware limited liability company, structured to be a single purpose bankruptcy-remote entity with two independent directors. Legal counsel to the borrower delivered a non-consolidation opinion in connection with the origination of the Back Bay Office Whole Loan.
The Borrower Sponsors. The borrower sponsors are JPMorgan Chase Bank, N.A., J.P. Morgan Investment Management Inc., OMERS Administration Corporation (“OMERS”), and OPG Investment Holdings (US), LLC, and the non-recourse carveout guarantor is OPG Investment Holdings (US), LLC. The borrower is owned by a joint venture between J.P. Morgan Asset Management (“JPMAM”) and Oxford Properties (“Oxford”). JPMAM, with assets under management of $2.2 trillion as of September 30, 2022, is a global investment manager. JPMAM’s clients include institutions, retail investors and high-net worth individuals. JPMAM offers global investment management in equities, fixed income, real estate, hedge funds, private equity and liquidity.
Oxford is a global real estate investor, asset manager, and builder. It builds, buys, and grows defined real estate operating businesses. Established in 1960, Oxford and its portfolio companies reported that they manage approximately $80 billion (CAD) of assets across four continents on behalf of their investment partners. Oxford’s owned portfolio encompasses office, logistics, retail, multifamily residential, life sciences and hotels; it spans nearly 164 million square feet. Oxford is owned by OMERS, the Canadian defined benefit pension plan for Ontario’s municipal employees. OPG Investment Holdings (US), LLC, the non-recourse carveout guarantor, is owned by OMERs, and does not have an ownership interest in the borrower.
Property Management. The Back Bay Office Property is managed by Oxford I Asset Management USA Inc., a Delaware corporation, an affiliate of the borrower sponsor.
Escrows and Reserves. At origination of the Back Bay Office Whole Loan, the borrower deposited (i) $26,723,400 (the “Upfront Rollover Deposit”) into a TI/LC rollover reserve, (ii) $21,283,070 into an outstanding TI/LC reserve and (iii) $9,854,159 into a free rent reserve.
Tax Escrows – On each monthly payment date during a Trigger Period (as defined below), the borrower is required to deposit into a real estate tax reserve 1/12th of the taxes that the lender estimates will be payable by the borrower over the next-ensuing 12-month period.
Insurance Escrows – On each monthly payment date during a Trigger Period, the borrower is required to deposit into an insurance reserve an amount equal to 1/12th of the insurance premiums that the lender reasonably estimates will be required for the renewal of coverage. The borrower does not need to deposit payments on each monthly payment date into the insurance reserve if an acceptable blanket policy is in effect.
Replacement Reserve – The borrower is required to deposit into a replacement reserve, on a monthly basis during the continuance of a Trigger Period, an amount equal to $21,397.
| THE INFORMATION IN THIS STRUCTURAL AND COLLATERAL TERM SHEET IS NOT COMPLETE AND MAY BE AMENDED PRIOR TO THE TIME OF SALE. THIS TERM SHEET IS NOT AN OFFER TO SELL THESE SECURITIES AND IT IS NOT A SOLICITATION OF AN OFFER TO BUY THESE SECURITIES IN ANY JURISDICTION WHERE THE OFFER OR SALE IS NOT PERMITTED. | ||
| 91 | ||
| Structural and Collateral Term Sheet | BMO 2023-C6 | |
| No. 8 – Back Bay Office | ||
TI/LC Reserve – The borrower is required to deposit into a TI/LC reserve, on a monthly basis, an amount equal to $213,969; provided, however, such monthly deposits will not commence until the Upfront Rollover Deposit becomes equal to or less than $15,000,000.
Lockbox / Cash Management. The Back Bay Office Whole Loan is structured with a hard lockbox and springing cash management. The borrower is required to cause all rents of the Back Bay Office Property to be transmitted directly by the tenants into a lockbox account controlled by the lender. The borrower and property manager are required to deposit all revenues otherwise received relating to the Back Bay Office Property (other than tenant security deposits) into the lockbox account within two business days following receipt. All funds deposited into the lockbox are required to be transferred on a daily basis to or at the direction of the borrower unless a Trigger Period exists. Upon the occurrence and during the continuance of a Trigger Period, all funds in the lockbox account are required to be swept on a daily basis to a cash management account under the control of the lender to be applied and disbursed in accordance with the Back Bay Office Whole Loan documents, and all excess cash flow funds remaining in the cash management account after the application of such funds in accordance with the Back Bay Office Whole Loan documents are required to (i) to the extent that any Trigger Period exists other than solely as the result of a Lease Sweep Period (as defined below), be deposited into an excess cash flow reserve account as additional collateral for the Back Bay Office Whole Loan, or (ii) during a Trigger Period continuing due to a Lease Sweep Period (regardless of whether any other Trigger Period is continuing), to be deposited into the lease sweep account.
A “Trigger Period” means a period that commences (i) upon the occurrence of an event of default under the Back Bay Office Whole Loan documents until cured, (ii) upon the debt yield falling below (a) 8.50% based on the combined outstanding principal balance of the Back Bay Office Whole Loan and the Back Bay Office Mezzanine Loan or (b) 9.10% based on the outstanding principal balance of the Back Bay Office Whole Loan, as of the last day of any quarter (a “Low Debt Yield Period”) until the debt yield is equal to or greater than 8.50% for one calendar quarter for the Back Bay Office Whole Loan and Back Bay Office Mezzanine Loan or the debt yield is equal to or greater than 9.10% for one calendar quarter for the Back Bay Office Whole Loan (provided that the borrower may cure or avoid a Low Debt Yield Period by delivering to the lender cash or a letter of credit in the amount by which the outstanding principal balance of the Back Bay Office Whole Loan and/or the Back Bay Office Mezzanine Loan, as applicable, would need to be reduced for the applicable debt yield test to be satisfied), (iii) if a property manager is an affiliate of the borrower or guarantor and becomes insolvent or a debtor in any bankruptcy or insolvency proceeding, unless such property manager is replaced within 30 days until the manager is replaced with a non-affiliated manager in accordance with the terms of the Back Bay Office Whole Loan, (iv) upon the occurrence of an event of default under the Back Bay Office Mezzanine Loan documents until the mezzanine lender sends the lender a notice that such event of default has been cured or waived, or (v) upon the commencement of a Lease Sweep Period until such Lease Sweep Period ceases pursuant to the terms of the Back Bay Office Whole Loan documents.
A “Lease Sweep Period” means a period commencing on the first monthly payment date following the occurrence of any of the following: (a) with respect to each Lease Sweep Lease (as defined below), the earlier to occur of: (x) 12 months prior to the earliest stated expiration (including the stated expiration of any renewal term) of a Lease Sweep Lease; and (y) the date required under a Lease Sweep Lease by which the tenant thereunder is required to give notice of its exercise of a renewal option thereunder (and such renewal has not been so exercised); (b) the receipt by the borrower or property manager of notice from any tenant under a Lease Sweep Lease exercising its right to terminate its Lease Sweep Lease; (c) the date that a Lease Sweep Lease is surrendered, cancelled or terminated prior to its then current expiration date or the receipt by the borrower or property manager of notice from any tenant under a Lease Sweep Lease of its intent to surrender, cancel or terminate the Lease Sweep Lease prior to its then current expiration date; (d) the date that any tenant under a Lease Sweep Lease (other than Wayfair and any investment grade tenant) discontinues its business (i.e., “goes dark”) in its space at the Back Bay Office Property or gives notice that it intends to do any of the foregoing; (e) upon a default under a Lease Sweep Lease by the tenant thereunder that continues beyond any applicable notice and cure period; or (f) the occurrence of any of the following (A) any Lease Sweep Lease party is unable to pay its debts generally, or institutes any proceeding seeking to adjudicate it insolvent or seeking a liquidation or dissolution, or (B) the instituting of any proceeding against or with respect to any Lease Sweep Lease party seeking liquidation of its assets or the appointment of a receiver, liquidator, conservator, trustee or similar official in respect of it or the whole or any substantial part of its properties or assets or the taking of any corporate, partnership or limited liability company action in furtherance of any of the foregoing.
A Lease Sweep Period will end upon the following: (i) with regard to clauses (a) through (d) above, the entirety of the Lease Sweep Lease space is leased to a satisfactory replacement tenant or tenants, and in the lender’s reasonable judgment sufficient funds have been accumulated in the lease sweep account to cover all anticipated approved lease sweep space leasing expenses, free rent periods, and/or rent abatements, and any shortfalls in required payments under the loan documents or operating expenses as a result of anticipated downtime prior to the commencement of payments under the lease or leases, which funds on deposit in the lease sweep account may not exceed $125 per square foot of the lease sweep space, provided that all anticipated approved lease sweep space leasing expenses will not, in lender’s reasonable judgement, exceed $125 per square foot, (ii) with regard to clauses (a) through (f), funds collected in the lease sweep account are equal to $75 per square foot for the applicable tenant’s space (“Lease Sweep Deposit Amount”), unless the lender determines that anticipated leasing expenses will exceed the Lease Sweep Deposit Amount, in which case the sweep will continue until the lender is satisfied that there are sufficient funds in the lease sweep account; (iii) with regard to clause (a), the tenant of the Lease Sweep Lease space has irrevocably exercised its renewal or extension option with respect to all of its space, and sufficient funds have been accumulated to cover all anticipated leasing costs; (iv) with regard to clauses (b) and (c), such termination option is not validly exercised by the tenant or is otherwise validly and irrevocably waived in writing; (v) with regard to clause (e), the date the default has been cured; or (vi) with regard to clause (f), either the Lease Sweep Lease has been affirmed or assumed in the tenant insolvency, without
| THE INFORMATION IN THIS STRUCTURAL AND COLLATERAL TERM SHEET IS NOT COMPLETE AND MAY BE AMENDED PRIOR TO THE TIME OF SALE. THIS TERM SHEET IS NOT AN OFFER TO SELL THESE SECURITIES AND IT IS NOT A SOLICITATION OF AN OFFER TO BUY THESE SECURITIES IN ANY JURISDICTION WHERE THE OFFER OR SALE IS NOT PERMITTED. | ||
| 92 | ||
| Structural and Collateral Term Sheet | BMO 2023-C6 | |
| No. 8 – Back Bay Office | ||
modification of such lease or guaranty, in a manner reasonably satisfactory to the lender, pursuant to a final, non-appealable order of the bankruptcy court, and the tenant is in full occupancy and paying full unabated rent, and adequate assurance of the future performance under the Lease Sweep Lease, as determined by the lender, has been provided, or the Lease Sweep Deposit Amount has been met.
A “Lease Sweep Lease” means (i) the Wayfair lease or (ii) any replacement lease from a different tenant that leases at least 235,000 rentable square feet.
Subordinate and Mezzanine Debt. The $65,000,000 Back Bay Office Subordinate Companion Loan was funded concurrently with the origination of the Back Bay Office Senior Loan and comprises part of the Back Bay Office Whole Loan. The Back Bay Office Subordinate Companion Loan accrues interest at a rate of 8.2000% per annum. The holders of the Back Bay Office Mortgage Loan, the Back Bay Office Pari Passu Companion Loans and the Back Bay Office Subordinate Companion Loan have entered into a co-lender agreement that governs their relationship, as described under “Description of the Mortgage Pool—The Whole Loans—The Back Bay Pari Passu-AB Whole Loan” in the Preliminary Prospectus. Additionally, the $40,000,000 Back Bay Office Mezzanine Loan was funded by RICP V Holdings, LLC concurrently with the origination of the Back Bay Office Whole Loan and is secured by the direct equity ownership in the borrower of the Back Bay Office Whole Loan. The Back Bay Office Mezzanine Loan accrues interest at a rate of 10.12500% per annum, interest only, and matures on July 6, 2028. The lenders of the Back Bay Office Whole Loan and the Back Bay Office Mezzanine Loan have entered into an intercreditor agreement that governs their relationship.
Partial Release. Not permitted.
Ground Lease. None.
| THE INFORMATION IN THIS STRUCTURAL AND COLLATERAL TERM SHEET IS NOT COMPLETE AND MAY BE AMENDED PRIOR TO THE TIME OF SALE. THIS TERM SHEET IS NOT AN OFFER TO SELL THESE SECURITIES AND IT IS NOT A SOLICITATION OF AN OFFER TO BUY THESE SECURITIES IN ANY JURISDICTION WHERE THE OFFER OR SALE IS NOT PERMITTED. | ||
| 93 | ||
| Structural and Collateral Term Sheet | BMO 2023-C6 | |
| No. 9 – Four Springs Net Lease Portfolio | ||
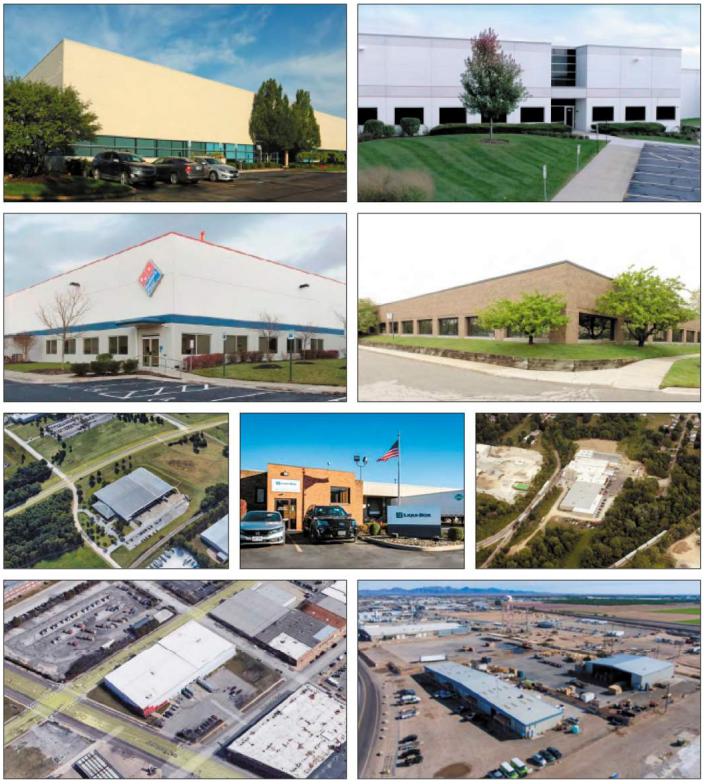
| THE INFORMATION IN THIS STRUCTURAL AND COLLATERAL TERM SHEET IS NOT COMPLETE AND MAY BE AMENDED PRIOR TO THE TIME OF SALE. THIS TERM SHEET IS NOT AN OFFER TO SELL THESE SECURITIES AND IT IS NOT A SOLICITATION OF AN OFFER TO BUY THESE SECURITIES IN ANY JURISDICTION WHERE THE OFFER OR SALE IS NOT PERMITTED. | ||
| 94 | ||
| Structural and Collateral Term Sheet | BMO 2023-C6 | |
| No. 9 – Four Springs Net Lease Portfolio | ||
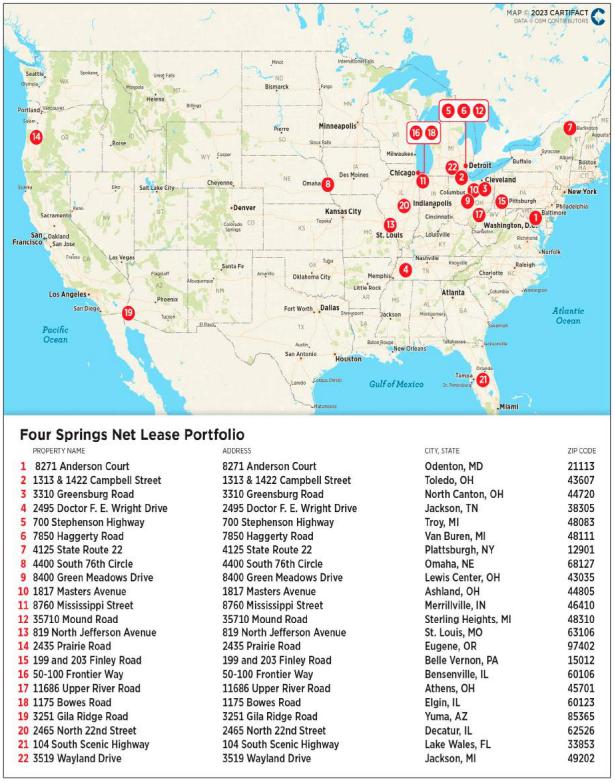
| THE INFORMATION IN THIS STRUCTURAL AND COLLATERAL TERM SHEET IS NOT COMPLETE AND MAY BE AMENDED PRIOR TO THE TIME OF SALE. THIS TERM SHEET IS NOT AN OFFER TO SELL THESE SECURITIES AND IT IS NOT A SOLICITATION OF AN OFFER TO BUY THESE SECURITIES IN ANY JURISDICTION WHERE THE OFFER OR SALE IS NOT PERMITTED. | ||
| 95 | ||
| Structural and Collateral Term Sheet | BMO 2023-C6 | |
| No. 9 – Four Springs Net Lease Portfolio | ||
| Mortgage Loan Information | Property Information | |||
| Mortgage Loan Seller: | GACC | Single Asset / Portfolio: | Portfolio | |
| Original Principal Balance(1): | $22,200,000 | Title: | Fee | |
| Cut-off Date Principal Balance(1): | $22,200,000 | Property Type – Subtype(3): | Industrial – Various | |
| % of IPB: | 3.7% | Net Rentable Area (SF): | 1,316,654 | |
| Loan Purpose: | Refinance | Location(3): | Various, Various | |
| Borrowers(2): | Various | Year Built / Renovated(3): | Various / Various | |
| Borrowers’ Sponsor: | Four Springs Capital Trust | Occupancy: | 100.0% | |
| Interest Rate: | 5.93500% | Occupancy Date: | 6/14/2023 | |
| Note Date: | 6/14/2023 | 4th Most Recent NOI (As of): | NAV | |
| Maturity Date: | 7/6/2033 | 3rd Most Recent NOI (As of): | $6,052,815 (12/31/2021) | |
| Interest-only Period: | 120 months | 2nd Most Recent NOI (As of): | $8,295,352 (12/31/2022) | |
| Original Term: | 120 months | Most Recent NOI (As of): | $8,302,293 (TTM 3/31/2023) | |
| Original Amortization Term: | None | UW Economic Occupancy: | 95.0% | |
| Amortization Type: | Interest Only | UW Revenues: | $11,122,214 | |
| Call Protection: | L(25),D(88),O(7) | UW Expenses: | $2,960,371 | |
| Lockbox / Cash Management: | Hard / Springing | UW NOI: | $8,161,843 | |
| Additional Debt(1): | Yes | UW NCF: | $8,161,843 | |
| Additional Debt Balance(1): | $50,000,000 | Appraised Value / Per SF(3)(4): | $132,057,000 / $100 | |
| Additional Debt Type(1): | Pari Passu | Appraisal Date(4): | 3/15/2023 | |
| Escrows and Reserves(5) | Financial Information(1) | |||||
| Initial | Monthly | Initial Cap | Whole Loan | |||
| Taxes: | $0 | Springing | N/A | Cut-off Date Loan / SF: | $55 | |
| Insurance: | $0 | Springing | N/A | Maturity Date Loan / SF: | $55 | |
| Replacement Reserves: | $0 | Springing | N/A | Cut-off Date LTV(4): | 54.7% | |
| TI/LC Reserve: | $2,000,000 | Springing | N/A | Maturity Date LTV(4): | 54.7% | |
| Low DSCR Cure Deposit Reserve: | $0 | Springing | N/A | UW NCF DSCR: | 1.88x | |
| UW NOI Debt Yield: | 11.3% | |||||
| Sources and Uses | |||||||
| Sources | Proceeds | % of Total | Uses | Proceeds | % of Total | ||
| Whole Loan(1) | $72,200,000 | 100.0% | Payoff Existing Debt | $37,374,922 | 51.8 | % | |
| Return of Equity | 27,935,740 | 38.7 | |||||
| Closing Costs | 4,889,338 | 6.8 | |||||
| Upfront Reserves | 2,000,000 | 2.8 | |||||
| Total Sources | $72,200,000 | 100.0% | Total Uses | $72,200,000 | 100.0 | % | |
| (1) | The Four Springs Net Lease Portfolio Mortgage Loan (as defined below) is part of the Four Springs Net Lease Portfolio Whole Loan (as defined below), which is evidenced by two pari passu notes with an aggregate outstanding principal balance of $72.2 million. Financial Information in the chart above reflects the Four Springs Net Lease Portfolio Whole Loan. For additional information, see “The Loan” below. |
| (2) | The borrowers are FSC AT Master, DST, FSC BGL Toledo OH, DST, FSC CFSR Master, DST, FSC CG Athens OH, DST, FSC CON Jackson MI, DST, FSC CON Sterling Heights MI, DST, FSC CON Troy MI, DST, FSC CON Van Buren MI, DST, FSC DOM Odenton MD, DST, FSC EQS Master, DST, FSC IP Omaha NE, DST, FSC LBC Master, DST, FSC MCO St. Louis MO, DST, FSC MDSA Jackson TN, DST, FSC Plattsburgh NY, DST, FSC SP Merrillville IN, DST and FSC STU North Canton OH, DST, each a Delaware statutory trust. |
| (3) | See the "Portfolio Summary" chart below for Location (City / State), Property subtype, Year Built / Latest Renovation and Appraised Values of the individual Four Springs Net Lease Portfolio Properties (as defined below). |
| (4) | The Appraised Value represents the “as is portfolio” value of $132,057,000, which includes a portfolio premium of 4.20342460348773%. Based on the aggregate “as-is” appraised value of the individual Four Springs Net Lease Portfolio Properties of $126,730,000, the Cut-off Date LTV Ratio and Maturity Date LTV Ratio are 57.0% and 57.0%, respectively. The Appraised Value for the 4125 State Route 22 property represents the “as is" appraised value of the property ($5,020,000) as well as the excess land value of the property ($1,720,000). |
| (5) | For a full description of Escrows and Reserves, please refer to “Escrows and Reserves” below. |
| THE INFORMATION IN THIS STRUCTURAL AND COLLATERAL TERM SHEET IS NOT COMPLETE AND MAY BE AMENDED PRIOR TO THE TIME OF SALE. THIS TERM SHEET IS NOT AN OFFER TO SELL THESE SECURITIES AND IT IS NOT A SOLICITATION OF AN OFFER TO BUY THESE SECURITIES IN ANY JURISDICTION WHERE THE OFFER OR SALE IS NOT PERMITTED. | ||
| 96 | ||
| Structural and Collateral Term Sheet | BMO 2023-C6 | |
| No. 9 – Four Springs Net Lease Portfolio | ||
The Loan. The ninth largest mortgage loan (the “Four Springs Net Lease Portfolio Mortgage Loan”) is part of a whole loan (the “Four Springs Net Lease Portfolio Whole Loan”) with an aggregate principal balance as of the Cut-off Date of $72,200,000, which is secured by first mortgage liens encumbering the borrowers’ fee interests in a portfolio of 22 industrial properties totaling 1,316,654 square feet located in 13 states (each a “Four Springs Net Lease Portfolio Property,” and collectively the “Four Springs Net Lease Portfolio” or the “Four Springs Net Lease Portfolio Properties”). The Four Springs Net Lease Portfolio Mortgage Loan is evidenced by the non-controlling note A-2 with an outstanding principal balance as of the Cut-off Date of $22,200,000, representing approximately 3.7% of the Initial Pool Balance.
The Four Springs Net Lease Portfolio Whole Loan was originated by German American Capital Corporation (“GACC”) on June 14, 2023. The Four Springs Net Lease Portfolio Whole Loan requires interest-only payments during its entire term and accrues interest at a rate of 5.93500% per annum. The Four Springs Net Lease Portfolio Whole Loan proceeds were used to pay off approximately $37.4 million of existing debt, fund reserves, pay origination costs and return equity to the borrower sponsor. The table below summarizes the promissory notes that comprise the Four Springs Net Lease Portfolio Whole Loan. The relationship between the holders of the Four Springs Net Lease Portfolio Whole Loan is governed by a co-lender agreement as described under “Description of the Mortgage Pool—The Whole Loans—The Serviced Pari Passu Whole Loans” in the Preliminary Prospectus. The Four Springs Net Lease Portfolio Whole Loan will be serviced pursuant to the pooling and servicing agreement for the BMO 2023-C6 trust. See “The Pooling and Servicing Agreement” in the Preliminary Prospectus.
| Whole Loan Summary | |||||
| Note | Original Balance | Cut-off Date Balance | Note Holder | Controlling Piece | |
| A-1 | $50,000,000 | $50,000,000 | Benchmark 2023-B39 | Yes | |
| A-2 | 22,200,000 | 22,200,000 | BMO 2023-C6 | No | |
| Whole Loan | $72,200,000 | $72,200,000 | |||
The Properties. The Four Springs Net Lease Portfolio is a 1,316,654 square foot portfolio of 22 industrial properties located throughout the United States. The Four Springs Net Lease Portfolio Properties range from 6,566 square feet to 227,028 square feet, with an average size of 59,848 square feet. No single Four Springs Net Lease Portfolio Property accounts for more than 17.2% of the Four Springs Net Lease Portfolio’s net rentable area. The Four Springs Net Lease Portfolio Properties were built between 1958 and 2020. As of June 14, 2023, the Four Springs Net Lease Portfolio is 100.0% occupied under 22 leases, with nine Four Springs Net Lease Portfolio Properties under four master leases with Equipment Share (3251 Gila Ridge Road, 2435 Prairie Road, 199 and 203 Finley Road), LiquiBox (1817 Masters Avenue and 104 South Scenic Highway), Commercial Food Service Repair (50-100 Frontier Way and 2465 North 22nd Street) and Abrasive Tech (1175 Bowes Road and 8400 Green Meadows Drive). Additionally, Continental Services is a tenant at the 7850 Haggerty Road, 35710 Mound Road, 3519 Wayland Drive and 700 Stephenson Highway properties. All tenants have triple net lease structures, and the weighted average lease term based on square feet is 18.8 years with a weighted average remaining lease term of 11.7 years. The three largest properties by net rentable area account for 38.7% of the total square feet and no additional Four Springs Net Lease Portfolio Property comprises more than 7.8% of the total square feet.
The following table presents certain information relating to the individual Four Springs Net Lease Portfolio Properties:
Portfolio Summary | |||||||||||||
Property Name | City, State | Property Sub-Type | Year Built / Renovated | SF(1) | Allocated Whole Loan Cut-off Date Balance | % of Allocated Whole Loan Cut-off Date Balance | Appraised Value(2) | % of Appraised Value(2) | UW Base Rent(1) | % of UW Base Rent(1) | |||
| 8271 Anderson Court | Odenton, MD | Cold Storage | 2001 / NAP | 70,000 | $7,748,100 | 10.7 | % | $13,600,000 | 10.7 | % | $890,400 | 10.4 | % |
| 1313 & 1422 Campbell Street | Toledo, OH | Warehouse / Distribution | 1958 / 2020 | 227,028 | 7,007,500 | 9.7 | 12,300,000 | 9.7 | 828,600 | 9.7 | |||
| 3310 Greensburg Road | North Canton, OH | Warehouse / Manufacturing | 2019 / NAP | 119,856 | 6,380,800 | 8.8 | 11,200,000 | 8.8 | 726,776 | 8.5 | |||
| 2495 Doctor F. E. Wright Drive | Jackson, TN | Warehouse / Distribution | 1992 / 2017 | 163,000 | 6,096,000 | 8.4 | 10,700,000 | 8.4 | 751,717 | 8.8 | |||
| 700 Stephenson Highway | Troy, MI | Flex | 1980 / 2014 | 29,179 | 4,409,600 | 6.1 | 7,740,000 | 6.1 | 595,475 | 7.0 | |||
| 7850 Haggerty Road | Van Buren, MI | Warehouse / Distribution | 1994 / 2017 | 68,499 | 3,936,700 | 5.5 | 6,910,000 | 5.5 | 472,374 | 5.5 | |||
| 4125 State Route 22(2) | Plattsburgh, NY | Warehouse / Distribution | 1980 / NAP | 59,029 | 3,839,900 | 5.3 | 6,740,000 | 5.3 | 319,805 | 3.7 | |||
| 4400 South 76th Circle | Omaha, NE | Warehouse / Distribution | 1964 / 2019 | 80,000 | 3,760,100 | 5.2 | 6,600,000 | 5.2 | 437,110 | 5.1 | |||
| 8400 Green Meadows Drive | Lewis Center, OH | Manufacturing / Warehouse | 1983-1988 / 2016 | 85,548 | 3,549,300 | 4.9 | 6,230,000 | 4.9 | 438,741 | 5.1 | |||
| 1817 Masters Avenue | Ashland, OH | Warehouse | 1962 / 2015 | 102,500 | 3,532,200 | 4.9 | 6,200,000 | 4.9 | 409,030 | 4.8 | |||
| 8760 Mississippi Street | Merrillville, IN | Manufacturing / Warehouse | 2020 / NAP | 26,500 | 2,956,800 | 4.1 | 5,190,000 | 4.1 | 385,993 | 4.5 | |||
| 35710 Mound Road | Sterling Heights, MI | Warehouse / Distribution | 2000 / NAP | 43,750 | 2,643,500 | 3.7 | 4,640,000 | 3.7 | 314,109 | 3.7 | |||
| 819 North Jefferson Avenue | St. Louis, MO | Warehouse / Distribution | 1997 / 2016 | 47,840 | 2,375,700 | 3.3 | 4,170,000 | 3.3 | 282,256 | 3.3 | |||
| 2435 Prairie Road | Eugene, OR | Warehouse | 1978, 1983 / 2021 | 27,868 | 2,250,400 | 3.1 | 3,950,000 | 3.1 | 262,027 | 3.1 | |||
| 199 and 203 Finley Road | Belle Vernon, PA | Warehouse | 1972, 1986 / 2021 | 21,026 | 2,221,900 | 3.1 | 3,900,000 | 3.1 | 254,945 | 3.0 | |||
| 50-100 Frontier Way | Bensenville, IL | Warehouse | 1989 / NAP | 27,153 | 1,851,600 | 2.6 | 3,250,000 | 2.6 | 213,205 | 2.5 | |||
| 11686 Upper River Road | Athens, OH | Warehouse | 2019 / NAP | 6,566 | 1,766,100 | 2.4 | 3,100,000 | 2.4 | 222,000 | 2.6 | |||
| 1175 Bowes Road | Elgin, IL | Warehouse / Manufacturing | 1999 / NAP | 40,860 | 1,692,100 | 2.3 | 2,970,000 | 2.3 | 209,326 | 2.4 | |||
| 3251 Gila Ridge Road | Yuma, AZ | Warehouse / Distribution | 1992 / 2021 | 10,900 | 1,395,800 | 1.9 | 2,450,000 | 1.9 | 191,209 | 2.2 | |||
| 2465 North 22nd Street | Decatur, IL | Flex | 2006 / NAP | 16,912 | 997,000 | 1.4 | 1,750,000 | 1.4 | 130,674 | 1.5 | |||
| 104 South Scenic Highway | Lake Wales, FL | Warehouse | 1973 / 2015 | 27,000 | 911,500 | 1.3 | 1,600,000 | 1.3 | 107,788 | 1.3 | |||
| 3519 Wayland Drive | Jackson, MI | Warehouse / Distribution | 1970 / 2018 | 15,640 | 877,400 | 1.2 |
| 1,540,000 | 1.2 |
| 110,040 | 1.3 |
|
| Total | 1,316,654 | $72,200,000 | 100.0 | % | $126,730,000 | 100.0 | % | $8,553,601 | 100.0 | % | |||
| (1) | Based on the underwritten rent roll as of June 14, 2023. |
| (2) | The Appraised Value represents the “as is portfolio” value of $132,057,000, which includes a portfolio premium of 4.20342460348773%. The Appraised Value and % of Appraised Value shown above is based on the aggregate “as-is” appraised values of the individual Four Springs Net Lease Portfolio Properties of $126,730,000. The Appraised Value for the 4125 State Route 22 property represents the “as-is" appraised value of the property ($5,020,000) as well as the excess land value of the property ($1,720,000). |
| THE INFORMATION IN THIS STRUCTURAL AND COLLATERAL TERM SHEET IS NOT COMPLETE AND MAY BE AMENDED PRIOR TO THE TIME OF SALE. THIS TERM SHEET IS NOT AN OFFER TO SELL THESE SECURITIES AND IT IS NOT A SOLICITATION OF AN OFFER TO BUY THESE SECURITIES IN ANY JURISDICTION WHERE THE OFFER OR SALE IS NOT PERMITTED. | ||
| 97 | ||
| Structural and Collateral Term Sheet | BMO 2023-C6 | |
| No. 9 – Four Springs Net Lease Portfolio | ||
Largest Properties. The three largest properties based on allocated loan amount are 8271 Anderson Court, 1313 & 1422 Campbell Street and 3310 Greensburg Road.
8271 Anderson Court (10.7% of Allocated Whole Loan Cut-off Date Balance): The property is an industrial cold storage warehouse containing 70,000 square feet located in the Arundel Crossing West Industrial Park in Odenton, Maryland. The improvements were originally constructed in 2001, and features include an estimated 37.0% cooler/freezer space, 18.0% office finish, clear heights of 23 feet, and 17 exterior dock doors. The improvements are situated on a site containing 11.67 acres, or 508,345 square feet of land area. The sole tenant at the property is Domino’s (70,000 square feet, 5.3% of portfolio GLA, 10.4% of portfolio UW Base Rent), which has been a tenant since 2001 and has a lease expiring in August 2037 with two, 5-year renewal options and no termination options. Founded in 1960, Domino’s is a multinational pizza restaurant chain with over 5,600 locations in the United States. As of 2022, Domino’s reported sales of approximately $4.5 billion worldwide.
1313 & 1422 Campbell Street (9.7% of Allocated Whole Loan Cut-off Date Balance): The property is a distribution warehouse that was originally developed in 1958, underwent significant renovations in 2020, and contains 227,028 square feet of gross building area. The building features an estimated 2,270 square feet or 1.0% of office space, 20-foot clear heights, 14 loading dock doors and one drive-in door. The improvements are situated on 22.48 acres, or 979,267 square feet of land, located in Toledo, Lucas County, Ohio. The sole tenant at the property is Brenntag SE (“Brenntag”) (227,028 square feet, 17.2% of portfolio GLA, 9.7% of portfolio UW Base Rent), which signed an approximately 15-year lease in 2019 and has two, 5-year renewal options. Founded in 1874, Brenntag is a global market leader in chemicals and ingredients distribution. The company manages complex supply chains for both chemical manufacturers and consumers by simplifying market access to thousands of products and services. Brenntag is headquartered in Essen, Germany and has operations in more than 78 countries worldwide.
3310 Greensburg Road (8.8% of Allocated Whole Loan Cut-off Date Balance): The property is a manufacturing warehouse that was built-to-suit for the current tenant in 2019 and contains 119,856 square feet. The building features an estimated 10,787 square feet or 9.0% office/lab space, 16- to 28-foot clear heights, four loading dock doors and two drive-in doors. The improvements are situated on 12.02 acres located in North Canton, Summit County, Ohio in the southeast corner of Mayfair and Greensburg Roads, east of I-77 and Akron-Canton Airport. The sole tenant at the property is A. Stucki Company (“Stucki”) (119,856 square feet, 9.1% of portfolio GLA, 8.5% of portfolio UW Base Rent). Stucki has been at the property since 2019 with a lease expiring in August 2034 and no renewal or termination options. Stucki is a leading supplier of highly engineered parts and services for the rail industry. Founded in 1911, Stucki has grown and diversified over the years to supply dynamic control products, brake system components, springs, bearings and track infrastructure and other products, as well as remanufacturing, repair, direct-to-locomotive refueling and additional services. Headquartered in Moon Township, the company operates 21 facilities throughout the United States, Mexico and Brazil. Stucki was recapitalized in late 2022 through an investment led by Stellex Capital Management.
Environmental. According to the Phase I environmental reports dated March 27, 2023, the environmental consultant identified controlled recognized environmental conditions at the following Four Springs Net Lease Portfolio Properties: 1313 & 1422 Campbell Street, 199 and 203 Finley Road and 819 North Jefferson Avenue and identified a business environmental risk at the 8400 Green Meadows Drive property. See “Description of the Mortgage Pool—Environmental Considerations” in the Preliminary Prospectus.
The following table presents certain information relating to the historical occupancy of the Four Springs Net Lease Portfolio:
| Historical and Current Occupancy | |||
| 2020(1) | 2021(1) | 2022(1) | Current(2) |
| 100.0% | 100.0% | 100.0% | 100.0% |
| (1) | As provided by the borrowers and reflects year-end occupancy for the indicated year ended December 31 unless specified otherwise. |
| (2) | Based on the underwritten rent roll as of June 14, 2023. |
| THE INFORMATION IN THIS STRUCTURAL AND COLLATERAL TERM SHEET IS NOT COMPLETE AND MAY BE AMENDED PRIOR TO THE TIME OF SALE. THIS TERM SHEET IS NOT AN OFFER TO SELL THESE SECURITIES AND IT IS NOT A SOLICITATION OF AN OFFER TO BUY THESE SECURITIES IN ANY JURISDICTION WHERE THE OFFER OR SALE IS NOT PERMITTED. | ||
| 98 | ||
| Structural and Collateral Term Sheet | BMO 2023-C6 | |
| No. 9 – Four Springs Net Lease Portfolio | ||
The following table presents certain information relating to the largest tenants based on underwritten base rent of the Four Springs Net Lease Portfolio:
| Top Tenant Summary(1) | ||||||||||
| Tenant | Property | Ratings Moody’s/S&P/Fitch(2) | Net Rentable Area (SF) | % of Total NRA | UW Base Rent PSF | UW Base Rent | % of Total UW Base Rent | Lease Exp. Date | ||
| Continental Services | Various(3) | NR/NR/NR | 157,068 | 11.9 | % | $9.50 | $1,491,999 | 17.4 | % | Various(4) |
| Dominos | 8271 Anderson Court | NR/NR/NR | 70,000 | 5.3 | $12.72 | 890,400 | 10.4 | 8/31/2037 | ||
| Brenntag | 1313 & 1422 Campbell Street | NR/NR/NR | 227,028 | 17.2 | $3.65 | 828,600 | 9.7 | 9/30/2035 | ||
| Mighty Distributing | 2495 Doctor F. E. Wright Drive | NR/NR/NR | 163,000 | 12.4 | $4.61 | 751,717 | 8.8 | 12/23/2034 | ||
| Stucki | 3310 Greensburg Road | NR/NR/NR | 119,856 | 9.1 | $6.06 | 726,776 | 8.5 | 8/31/2034 | ||
| Equipment Share | Various(5) | NR/NR/NR | 59,794 | 4.5 | $11.84 | 708,181 | 8.3 | 9/27/2036(6) | ||
| Abrasive Tech | Various(7) | NR/NR/NR | 126,408 | 9.6 | $5.13 | 648,067 | 7.6 | 9/30/2041 | ||
| LiquiBox | Various(8) | NR/NR/NR | 129,500 | 9.8 | $3.99 | 516,818 | 6.0 | 2/28/2041 | ||
| International Paper | 4400 South 76th Circle | NR/NR/NR | 80,000 | 6.1 | $5.46 | 437,110 | 5.1 | 2/28/2029 | ||
| Super Products | 8760 Mississippi Street | NR/NR/NR | 26,500 | 2.0 | $14.57 | 385,993 | 4.5 | 12/31/2030 | ||
| Major Tenants | 1,159,154 | 88.0 | % | $6.37 | $7,385,661 | 86.3 | % | |||
| Other Tenants | 157,500 | 12.0 | % | $7.42 | $1,167,940 | 13.7 | % | |||
| Occupied Collateral Total / Wtd. Avg. | 1,316,654 | 100.0 | % | $6.50 | $8,553,601 | 100.0 | % | |||
| Vacant Space | 0 | 0.0 | % | |||||||
| Collateral Total | 1,316,654 | 100.0 | % | |||||||
| (1) | Based on the underwritten rent roll as of June 14, 2023. |
| (2) | In some instances, ratings provided are those of the parent company of the entity shown, whether or not the parent company guarantees the lease. |
| (3) | Continental Services is a tenant at the 7850 Haggerty Road, 35710 Mound Road, 3519 Wayland Drive and 700 Stephenson Highway properties. |
| (4) | Continental Services has 112,249 square feet expiring in May 2030 and 44,819 square feet expiring in April 2032. |
| (5) | Equipment Share is a tenant at the 3251 Gila Ridge Road, 2435 Prairie Road, 199 and 203 Finley Road properties. |
| (6) | Equipment Share has 10,900 square feet expiring on September 28, 2036, the remaining square feet expires September 27, 2036. |
| (7) | Abrasive Tech is a tenant at the 8400 Green Meadows Drive and 1175 Bowes Road properties. |
| (8) | LiquiBox is a tenant at the 1817 Masters Avenue and 104 South Scenic Highway properties. |
The following table presents certain information relating to the tenant lease expirations of the Four Springs Net Lease Portfolio:
| Lease Rollover Schedule(1)(2) | |||||||||||||||
| Year | Number of Leases Expiring | Net Rentable Area Expiring | % of NRA Expiring | UW Base Rent Expiring | % of UW Base Rent Expiring | Cumulative Net Rentable Area Expiring | Cumulative % of NRA Expiring | Cumulative UW Base Rent Expiring | Cumulative % of UW Base Rent Expiring | ||||||
| Vacant | NAP | 0 | 0.0 | % | NAP | NAP | 0 | 0.0 | % | NAP | NAP | ||||
| 2023 | 0 | 0 | 0.0 | $0 | 0.0 | % | 0 | 0.0 | $0 | 0.0% | |||||
| 2024 | 0 | 0 | 0.0 | 0 | 0.0 | 0 | 0.0 | $0 | 0.0% | ||||||
| 2025 | 0 | 0 | 0.0 | 0 | 0.0 | 0 | 0.0 | $0 | 0.0% | ||||||
| 2026 | 0 | 0 | 0.0 | 0 | 0.0 | 0 | 0.0 | $0 | 0.0% | ||||||
| 2027 | 1 | 47,840 | 3.6 | 282,256 | 3.3 | 47,840 | 3.6 | $282,256 | 3.3% | ||||||
| 2028 | 0 | 0 | 0.0 | 0 | 0.0 | 47,840 | 3.6 | $282,256 | 3.3% | ||||||
| 2029 | 1 | 80,000 | 6.1 | 437,110 | 5.1 | 127,840 | 9.7 | $719,366 | 8.4% | ||||||
| 2030 | 4 | 197,778 | 15.0 | 1,492,281 | 17.4 | 325,618 | 24.7 | $2,211,647 | 25.9% | ||||||
| 2031 | 0 | 0 | 0.0 | 0 | 0.0 | 325,618 | 24.7 | $2,211,647 | 25.9% | ||||||
| 2032 | 2 | 44,819 | 3.4 | 705,515 | 8.2 | 370,437 | 28.1 | $2,917,163 | 34.1% | ||||||
| 2033 | 0 | 0 | 0.0 | 0 | 0.0 | 370,437 | 28.1 | $2,917,163 | 34.1% | ||||||
| 2034 & Thereafter | 14 | 946,217 | 71.9 | 5,636,438 | 65.9 | 1,316,654 | 100.0 | 8,553,601 | 100.0% | ||||||
| Total | 22 | 1,316,654 | 100.0 | % | $8,553,601 | 100.0 | % | ||||||||
| (1) | Based on the underwritten rent roll as of June 14, 2023. |
| (2) | Certain tenants may have termination or contraction options (which may become exercisable prior to the originally stated expiration date of the tenant lease) that are not considered in the above Lease Expiration Schedule. |
| THE INFORMATION IN THIS STRUCTURAL AND COLLATERAL TERM SHEET IS NOT COMPLETE AND MAY BE AMENDED PRIOR TO THE TIME OF SALE. THIS TERM SHEET IS NOT AN OFFER TO SELL THESE SECURITIES AND IT IS NOT A SOLICITATION OF AN OFFER TO BUY THESE SECURITIES IN ANY JURISDICTION WHERE THE OFFER OR SALE IS NOT PERMITTED. | ||
| 99 | ||
| Structural and Collateral Term Sheet | BMO 2023-C6 | |
| No. 9 – Four Springs Net Lease Portfolio | ||
The following table presents certain information relating to the operating history and underwritten cash flows of the Four Springs Net Lease Portfolio:
| Operating History and Underwritten Net Cash Flow | |||||||
| 2021 | 2022 | TTM(1) | Underwritten | Per Square Foot | %(2) | ||
| Base Rent | $6,034,230 | $8,320,319 | $8,335,718 | $8,553,601 | $6.50 | 73.1% | |
| Rent Steps(3) | 0 | 0 | 0 | 198,993 | 0.15 | 1.7 | |
| Value of Vacant Space | 0 | 0 | 0 | 0 | 0.00 | 0.0 | |
| Gross Potential Rent | $6,034,230 | $8,320,319 | $8,335,718 | $8,752,594 | $6.65 | 74.8% | |
| Total Reimbursements | 346,320 | 424,115 | 434,860 | 2,955,000 | 2.24 | 25.2 | |
| Net Rental Income | $6,380,550 | $8,744,434 | $8,770,578 | $11,707,594 | $8.89 | 100.0% | |
| Other Income | 36,495 | 9,600 | 2,510 | 0 | 0.00 | 0.0 | |
| (Vacancy/Credit Loss) | 0 | 0 | 0 | (585,380) | (0.44) | (5.0) | |
| Effective Gross Income | $6,417,045 | $8,754,035 | $8,773,088 | $11,122,214 | $8.45 | 95.0% | |
| Total Expenses | $364,230 | $458,683 | $470,795 | $2,960,371 | $2.25 | 26.6% | |
| Net Operating Income | $6,052,815 | $8,295,352 | $8,302,293 | $8,161,843 | $6.20 | 73.4% | |
| Total TI/LC, Capex/RR | 0 | 0 | 0 | 0 | 0.00 | 0.0 | |
| Net Cash Flow | $6,052,815 | $8,295,352 | $8,302,293 | $8,161,843 | $6.20 | 73.4% | |
| (1) | Based on the underwritten rent roll as of June 14, 2023. |
| (2) | % column represents percent of Net Rental Income for all revenue lines and represents percent of Effective Gross Income for the remainder of fields. |
| (3) | Rent Steps include contractual rent steps through May 1, 2024 totaling approximately $170,051 and credit rent steps through the loan term totaling approximately $28,942. |
The Markets. The Four Springs Net Lease Portfolio is located across 22 different MSAs in 13 states. The following highlights key statistics for each relevant market based on year end 2022 statistics. Overall, the average submarket vacancy for the Four Springs Net Lease Portfolio is 3.3% with an average rent of $7.89 per square foot.
| THE INFORMATION IN THIS STRUCTURAL AND COLLATERAL TERM SHEET IS NOT COMPLETE AND MAY BE AMENDED PRIOR TO THE TIME OF SALE. THIS TERM SHEET IS NOT AN OFFER TO SELL THESE SECURITIES AND IT IS NOT A SOLICITATION OF AN OFFER TO BUY THESE SECURITIES IN ANY JURISDICTION WHERE THE OFFER OR SALE IS NOT PERMITTED. | ||
| 100 | ||
| Structural and Collateral Term Sheet | BMO 2023-C6 | |
| No. 9 – Four Springs Net Lease Portfolio | ||
| Market Overview(1) | |||||||||||
Property Name | Industrial Submarket | Submarket Rentable Building Area | Net Absorption | Vacancy Rate | Market Rent | 12 Month Rent Growth | |||||
| 7850 Haggerty Road | Airport District Detroit - MI | 56,140,000 | 2,189,000 | 2.1% | $8.08 | 7.0% | |||||
| 3310 Greensburg Road | Akron - OH | 72,981,000 | 538,000 | 3.3% | $5.91 | 6.9% | |||||
| 1817 Masters Avenue | Ashland - OH | 6,144,050 | 20,000 | 2.9% | $4.25 | 13.3% | |||||
| 11686 Upper River Road | Athens County – OH | 650,098 | 98,000 | 0.8% | $9.00 | -25.0% | |||||
| 8271 Anderson Court | BWI/Anne Arundel - MD | 16,204,000 | -56,000 | 5.9% | $11.16 | 9.8% | |||||
| 4125 State Route 22 | Clinton County - NY | 5,370,856 | 261,559 | 10.9% | $10.00 | 0.0% | |||||
| 8400 Green Meadows Drive | Delaware County Columbus – OH | 15,880,000 | -68,000 | 2.7% | $9.27 | 15.4% | |||||
| 2435 Prairie Road | Eugene - OR | 30,954,000 | -25,000 | 0.4% | $8.94 | 6.9% | |||||
| 8760 Mississippi Street | Indiana Chicago - IL | 46,912,000 | 548,000 | 6.4% | $7.67 | 8.2% | |||||
| 2495 Doctor F. E. Wright Drive | Jackson – TN | 18,684,000 | -108,000 | 3.9% | $4.83 | 12.6% | |||||
| 3519 Wayland Drive | Jackson – MI | 16,893,000 | -117,000 | 6.4% | $5.43 | 6.9% | |||||
| 104 South Scenic Highway | Lakeland – FL | 79,216,000 | 1,958,000 | 4.1% | $7.79 | 13.2% | |||||
| 2465 North 22nd Street | Macon County – IL | 10,382,294 | 232,576 | 2.9% | $4.03 | 5.0% | |||||
| 1175 Bowes Road | North Kane/I-90 - IL | 43,847,000 | 2,372,000 | 3.8% | $9.14 | 9.1% | |||||
| 50-100 Frontier Way | O’Hare – IL | 111,403,000 | 727,000 | 2.9% | $10.08 | 9.2% | |||||
| 4400 South 76th Circle | South Central Omaha – NE | 21,803,000 | 546,000 | 2.2% | $7.44 | 6.7% | |||||
| 1313 & 1422 Campbell Street | South/Southwest Toledo – OH | 21,107,000 | 137,000 | 0.4% | $5.61 | 6.9% | |||||
| 819 North Jefferson Avenue | Saint Louis City North – MO | 37,716,000 | 984,000 | 2.0% | $5.13 | 7.8% | |||||
| 700 Stephenson Highway | Troy Area Central Detroit – MI | 9,211,000 | 203,000 | 2.4% | $8.58 | 7.4% | |||||
| 35710 Mound Road | West of Van Dyke/Macomb – MI | 65,235,000 | 1,273,000 | 2.2% | $9.00 | 7.4% | |||||
| 199 and 203 Finley Road | Westmoreland County Pittsburgh – PA | 37,217,000 | 596,000 | 5.6% | $7.30 | 4.1% | |||||
3251 Gila Ridge Road | Yuma – AZ | 5,309,000 |
| -10,000 |
| 0.5% |
| $8.56 |
| 5.6% |
|
| Total / Wtd. Avg.(2) | 729,259,298 | 938,162 | 3.3% | $7.89 | 8.4% | ||||||
| (1) | Source: Appraisals. |
| (2) | Weighted based on Submarket Rentable Building Area. |
The Borrowers. The borrowers are FSC AT Master, DST, FSC BGL Toledo OH, DST, FSC CFSR Master, DST, FSC CG Athens OH, DST, FSC CON Jackson MI, DST, FSC CON Sterling Heights MI, DST, FSC CON Troy MI, DST, FSC CON Van Buren MI, DST, FSC DOM Odenton MD, DST, FSC EQS Master, DST, FSC IP Omaha NE, DST, FSC LBC Master, DST, FSC MCO St. Louis MO, DST, FSC MDSA Jackson TN, DST, FSC Plattsburgh NY, DST, FSC SP Merrillville IN, DST, FSC STU North Canton OH, DST, each a Delaware statutory trust (a “DST”), wholly owned by FSC Industrial Portfolio 27, DST, a newly formed DST (the “Parent DST”). Each of the 22 properties is owned by one of the individual DSTs, except several of the properties, which are owned by the same individual DST on leases for multiple properties. Each of the properties on a multiple-property lease is owned by one individual DST per multiple-property lease. The 22 properties are located in 13 states: Arizona, Florida, Illinois, Indiana, Maryland, Michigan, Missouri, Nebraska, New York, Ohio, Oregon, Pennsylvania and Tennessee. In Florida, Illinois, Indiana, Maryland, Missouri, Nebraska, New York and Tennessee, Delaware statutory trusts cannot directly hold fee title to real property. In those states, the signatory trustee for each of the individual borrower DSTs, FSC Industrial Portfolio Manager, LLC, a Delaware limited liability company (the “Signatory Trustee”), holds title on behalf of the related borrower DSTs in its capacity as such DST’s signatory trustee. Legal counsel to the borrowers delivered a non-consolidation opinion in connection with the origination of the Four Springs Net Lease Portfolio Whole Loan.
The Borrower Sponsor. The borrower sponsor and nonrecourse carve-out guarantor is Four Springs Capital Trust. Four Springs Capital Trust currently owns 100% of the Parent DST and plans to syndicate 100% of its ownership to investors, ultimately expecting to retain 0% ownership. Four Springs Capital Trust seeks to acquire single-tenant net lease properties throughout the United States that are leased to quality tenants and have remaining lease terms in excess of 10 years with contractual rent increases. Four Springs Capital Trust has a current portfolio (inclusive of the Four Springs Net Lease Portfolio Properties) of 158 properties across 30 states, which is 99.9% occupied by 70 different tenants and totals 7,000,000 square feet. Coby Johnson and William Dioguardi serve as managers for the DSTs.
The Four Springs Net Lease Portfolio borrowers have master leased all of the Four Springs Net Lease Portfolio Properties pursuant to a master lease (the “Four Springs Master Lease”) to one master tenant, FSC IP27 LeaseCo, LLC, a Delaware limited liability company (the “Four Springs Master Tenant”), which is in turn owned by the guarantor. The Four Springs Master Tenant is a Delaware limited liability company structured to be bankruptcy-remote, with one independent director. The Four Springs Master Lease generally imposes responsibility on the Four Springs Master Tenant for the operation, maintenance and management of the Four Springs Net Lease Portfolio Properties and payment of all expenses incurred in the maintenance and repair of the Four Springs Net Lease Portfolio Properties, other than capital expenses. The Four Springs Master Tenant’s interests in all tenant rents have been assigned to the Four Springs Net Lease Portfolio borrowers pursuant to certain Tenant/Landlord Subordination and Assignment Agreements (Unrecorded Master Lease) by and between the Four Springs Master Tenant and each borrower, which the borrowers in turn collaterally assigned to the lender. The Four Springs Master Lease is subordinate to the Four Springs Net Lease Portfolio Whole Loan and, upon an event of default under the Four
| THE INFORMATION IN THIS STRUCTURAL AND COLLATERAL TERM SHEET IS NOT COMPLETE AND MAY BE AMENDED PRIOR TO THE TIME OF SALE. THIS TERM SHEET IS NOT AN OFFER TO SELL THESE SECURITIES AND IT IS NOT A SOLICITATION OF AN OFFER TO BUY THESE SECURITIES IN ANY JURISDICTION WHERE THE OFFER OR SALE IS NOT PERMITTED. | ||
| 101 | ||
| Structural and Collateral Term Sheet | BMO 2023-C6 | |
| No. 9 – Four Springs Net Lease Portfolio | ||
Springs Net Lease Portfolio Whole Loan, the lender has the right to cause the borrowers to terminate the Four Springs Master Lease. A default under the Four Springs Master Lease is an event of default under the Four Springs Net Lease Portfolio Whole Loan.
The lender has the right to require the Four Springs Net Lease Portfolio borrowers to convert from DSTs to Delaware limited liability companies upon (i) notice from the lender that an event of default is continuing under the Four Springs Net Lease Portfolio Whole Loan, or (ii) 30 days prior to the maturity date of the Four Springs Net Lease Portfolio Whole Loan, if an executed commitment to refinance the Four Springs Net Lease Portfolio Whole Loan or an executed contract of sale with a closing date prior to the maturity date is not delivered to the lender.
Property Management. The Four Springs Net Lease Portfolio is currently self-managed by the Four Springs Master Tenant.
Escrows and Reserves. At origination, the borrowers deposited $2,000,000 into a TI/LC reserve.
Tax Escrows – On each monthly payment date during the continuance of a Trigger Period (as defined below), the borrowers are required to deposit an amount equal to 1/12th of the estimated annual real estate taxes into a tax reserve account; provided that such deposits are waived for any of the Four Springs Net Lease Portfolio Properties so long as (i) no event of default is continuing, (ii) an Approved Triple Net Lease (as defined below) is in full force and effect at such property, (iii) the Approved Triple Net Lease obligates the related tenant to pay all taxes with respect to such property directly to the applicable governmental authorities, and (iv) there is no default under the Approved Triple Net Lease.
Insurance Escrows – On each monthly payment date during the continuance of a Trigger Period, the borrowers are required to deposit 1/12th of estimated annual insurance premiums into an insurance reserve account, except if the Four Springs Net Lease Portfolio is insured under an acceptable blanket policy; provided that such deposits are waived for any of the Four Springs Net Lease Portfolio Properties so long as (i) no event of default is continuing, (ii) an Approved Triple Net Lease is in full force and effect at such Four Springs Net Lease Portfolio Property, (iii) the tenant under the Approved Triple Net Lease maintains insurance that satisfies the terms and provisions set forth in the Four Springs Net Lease Portfolio Whole Loan documents, and (iv) there is no default under the Approved Triple Net Lease.
TI/LC Reserve – On each monthly payment date during the continuance of a Trigger Period, the borrowers are required to deposit an amount that the lender reasonably determines will be needed (in equal monthly deposits) in order to accumulate sufficient funds to pay all anticipated tenant improvements and leasing commissions that may be incurred at the Four Springs Net Lease Portfolio Properties.
Replacement Reserve – On each monthly payment date during the continuance of a Trigger Period, the borrowers are required to deposit an amount that the lender reasonably determines will be needed (in equal monthly deposits) in order to accumulate sufficient funds to pay all approved capital expenditures. The requirement to deposit into this reserve will be waived for any of the Four Springs Net Lease Portfolio Properties so long as (i) no event of default is continuing, (ii) an Approved Triple Net Lease is in full force and effect at such Four Springs Net Lease Portfolio Property, (iii) the Approved Triple Net Lease obligates the related tenant to pay all costs and expenses of a capital nature relating to the improvements and such Four Springs Net Lease Portfolio Property and such tenant thereunder performs the same, and (iv) there is no default under the Approved Triple Net Lease.
Lockbox / Cash Management. The Four Springs Net Lease Portfolio Whole Loan is structured with a hard lockbox and springing cash management. The borrowers are required to cause the Four Springs Master Tenant to cause all revenue to be deposited directly by the non-residential subtenants of each of the Four Springs Net Lease Portfolio Properties into a lockbox account. Funds deposited into the lockbox account will be swept by the lockbox bank on a daily basis into the borrowers’ operating account, unless a Trigger Period is continuing, in which case such funds are required to be swept on a daily basis into a lender-controlled cash management account and applied and disbursed in accordance with the terms of the Four Springs Net Lease Portfolio Whole Loan documents. Provided no event of default is continuing under the Four Springs Net Lease Portfolio Whole Loan, amounts in the cash management account will be applied to make required deposits (if any) to the tax and insurance reserves, pay debt service on the Four Springs Net Lease Portfolio Whole Loan, make required deposits (if any) to the replacement and TI/LC reserves, pay operating expenses and extraordinary operating expenses, pay any other amounts due under Four Springs Net Lease Portfolio Whole Loan documents and then to an excess cash flow account, to be held as additional collateral during such Trigger Period.
A “Trigger Period” means the period commencing upon the occurrence of (a) an event of default, (b) if the debt service coverage ratio as of any calculation date for the Four Springs Net Lease Portfolio Whole Loan is less than 1.20x or (c) if the property manager is an affiliate of the borrowers or the guarantor and such property manager becomes insolvent or a debtor in any bankruptcy or insolvency proceeding.
A Trigger Period may be cured upon the occurrence of the following: (A) with respect to a Trigger Period continuing pursuant to clause (a), the event of default commencing the Trigger Period has been cured and such cure has been accepted by the lender, (ii) with respect to a Trigger Period continuing due to clause (b), the debt service coverage ratio is at least 1.25x, for two consecutive quarters or (iii) with respect to a Trigger Period continuing due to clause (c), if the property manager is replaced with a non-affiliated property manager in accordance with all of the applicable requirements of the Four Springs Net Lease Portfolio Whole Loan documents. In addition, the
| THE INFORMATION IN THIS STRUCTURAL AND COLLATERAL TERM SHEET IS NOT COMPLETE AND MAY BE AMENDED PRIOR TO THE TIME OF SALE. THIS TERM SHEET IS NOT AN OFFER TO SELL THESE SECURITIES AND IT IS NOT A SOLICITATION OF AN OFFER TO BUY THESE SECURITIES IN ANY JURISDICTION WHERE THE OFFER OR SALE IS NOT PERMITTED. | ||
| 102 | ||
| Structural and Collateral Term Sheet | BMO 2023-C6 | |
| No. 9 – Four Springs Net Lease Portfolio | ||
borrowers may avoid a Trigger Period caused by a decline in the debt service coverage ratio by depositing cash or a letter of credit with the lender in an amount that, if applied to reduce the outstanding principal balance of the Four Springs Net Lease Portfolio Whole Loan would result in the debt service coverage ratio being greater than or equal to 1.25x.
“Approved Triple Net Lease” means (x) each lease in effect as of the origination date of the Four Springs Net Lease Portfolio Whole Loan, and/or (y) any lease entered into after the origination date of the Four Springs Net Lease Portfolio Whole Loan in accordance with the provisions of the Four Springs Net Lease Portfolio Whole Loan documents which (i) is approved in writing by the lender, (ii) replaces any existing Approved Triple Net Lease, (iii) covers the entire Four Springs Net Lease Portfolio Property being replaced by another Approved Triple Net Lease, (iv) is a triple net lease (i.e., leases pursuant to which the tenant agrees to pay all real estate taxes, building insurance, and maintenance expenses in addition to other customary costs and expenses associated with leasing space at the Four Springs Net Lease Portfolio Property owned by any borrower), and (v) otherwise contains provisions substantially similar to the lease it is replacing; provided that, in no event will a lease with a guarantor or a person that is an affiliate of any borrower or a guarantor be an Approved Triple Net Lease. For the avoidance of doubt, the Four Springs Master Lease is not an Approved Triple Net Lease.
Subordinate Debt. None.
Mezzanine Debt. None.
Partial Release. In connection with an arm’s length sale of an individual Four Springs Net Lease Portfolio Property to an unrelated third party, the related borrower may obtain the release of such Four Springs Net Lease Portfolio Property from the Four Springs Net Lease Portfolio Whole Loan following the expiration of the defeasance lockout period, provided each of the following conditions, among others, is satisfied: (i) the borrowers defease an amount of principal equal to the greater of 100% of the net sales proceeds of the applicable Four Springs Net Lease Portfolio Property or 125% of the allocated loan amount for the applicable Four Springs Net Lease Portfolio Property and the borrowers satisfy all of the requirements set forth in the Four Springs Net Lease Portfolio Whole Loan documents with respect to such partial defeasance; (ii) each remaining borrower will remain a special purpose bankruptcy remote entity and the borrower owning the Four Springs Net Lease Portfolio Property being released will dissolve and liquidate, (iii) after giving effect to such sale and defeasance, the debt service coverage ratio for all of the Four Springs Net Lease Portfolio Properties then remaining subject to the Four Springs Net Lease Portfolio Whole Loan documents will be no less than the greater of (1) the debt service coverage ratio immediately preceding such sale and (2) 1.47x, (iv) after giving effect to such sale and defeasance, the loan-to-value ratio for all of the Four Springs Net Lease Portfolio Properties then remaining subject to the Four Springs Net Lease Portfolio Whole Loan documents will be no greater than the lesser of (1) the loan-to-value ratio immediately preceding such sale and (2) 54.67%, and (v) satisfaction of REMIC related conditions.
Ground Lease. None.
| THE INFORMATION IN THIS STRUCTURAL AND COLLATERAL TERM SHEET IS NOT COMPLETE AND MAY BE AMENDED PRIOR TO THE TIME OF SALE. THIS TERM SHEET IS NOT AN OFFER TO SELL THESE SECURITIES AND IT IS NOT A SOLICITATION OF AN OFFER TO BUY THESE SECURITIES IN ANY JURISDICTION WHERE THE OFFER OR SALE IS NOT PERMITTED. | ||
| 103 | ||
| Structural and Collateral Term Sheet | BMO 2023-C6 | |
| No. 10 – Cincinnati Multifamily Portfolio II | ||
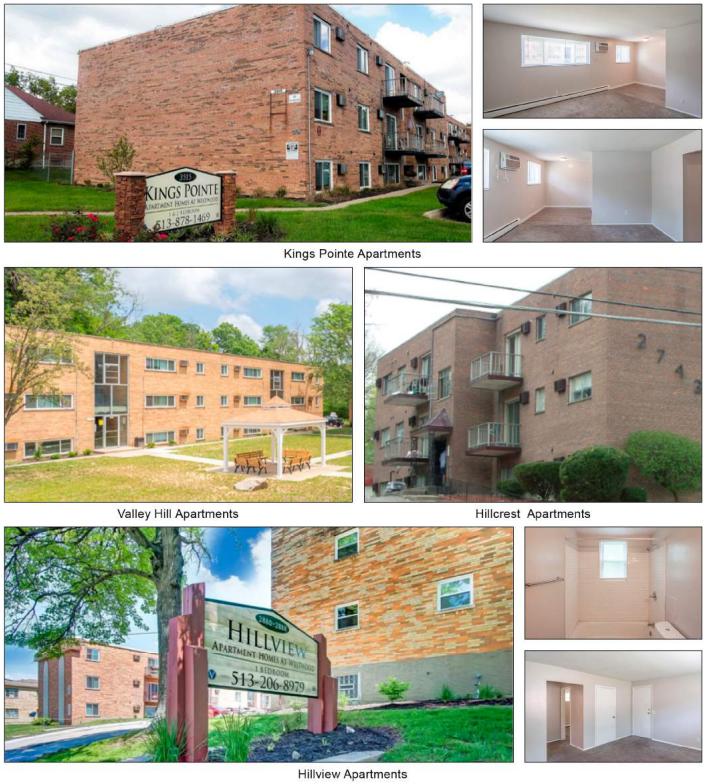
| THE INFORMATION IN THIS STRUCTURAL AND COLLATERAL TERM SHEET IS NOT COMPLETE AND MAY BE AMENDED PRIOR TO THE TIME OF SALE. THIS TERM SHEET IS NOT AN OFFER TO SELL THESE SECURITIES AND IT IS NOT A SOLICITATION OF AN OFFER TO BUY THESE SECURITIES IN ANY JURISDICTION WHERE THE OFFER OR SALE IS NOT PERMITTED. | ||
| 104 | ||
| Structural and Collateral Term Sheet | BMO 2023-C6 | |
| No. 10 – Cincinnati Multifamily Portfolio II | ||

| THE INFORMATION IN THIS STRUCTURAL AND COLLATERAL TERM SHEET IS NOT COMPLETE AND MAY BE AMENDED PRIOR TO THE TIME OF SALE. THIS TERM SHEET IS NOT AN OFFER TO SELL THESE SECURITIES AND IT IS NOT A SOLICITATION OF AN OFFER TO BUY THESE SECURITIES IN ANY JURISDICTION WHERE THE OFFER OR SALE IS NOT PERMITTED. | ||
| 105 | ||
| Structural and Collateral Term Sheet | BMO 2023-C6 | |
| No. 10 – Cincinnati Multifamily Portfolio II | ||
| Mortgage Loan Information | Property Information | |||
| Mortgage Loan Seller: | BMO | Single Asset / Portfolio: | Portfolio | |
| Original Principal Balance: | $21,000,000 | Title: | Fee | |
| Cut-off Date Principal Balance: | $21,000,000 | Property Type – Subtype: | Multifamily – Garden | |
| % of IPB: | 3.5% | Net Rentable Area (Units): | 212 | |
| Loan Purpose: | Recapitalization | Location: | Cincinnati, OH | |
| Borrower: | 212 Cincinnati LLC | Year Built / Renovated: | Various / 2020-2022 | |
| Borrower Sponsor(1): | Mendel Steiner | Occupancy: | 97.6% | |
| Interest Rate: | 7.03000% | Occupancy Date: | 5/31/2023 | |
| Note Date: | 6/16/2023 | 4th Most Recent NOI (As of): | $1,470,719 (12/31/2020) | |
| Maturity Date: | 7/6/2033 | 3rd Most Recent NOI (As of): | $1,788,021 (12/31/2021) | |
| Interest-only Period: | 120 months | 2nd Most Recent NOI (As of): | $2,030,131 (12/31/2022) | |
| Original Term: | 120 months | Most Recent NOI (As of): | $2,088,294 (TTM 3/31/2023) | |
| Original Amortization Term: | None | UW Economic Occupancy: | 97.5% | |
| Amortization Type: | Interest Only | UW Revenues: | $2,830,352 | |
| Call Protection: | L(25),D(91),O(4) | UW Expenses: | $652,732 | |
| Lockbox / Cash Management: | Springing | UW NOI: | $2,177,620 | |
| Additional Debt: | No | UW NCF: | $2,135,220 | |
| Additional Debt Balance: | N/A | Appraised Value / Per Unit(3): | $32,150,000 / $151,651 | |
| Additional Debt Type: | N/A | Appraisal Date: | 6/5/2023 | |
| Escrows and Reserves(2) | Financial Information | |||||
| Initial | Monthly | Initial Cap | ||||
| Taxes: | $17,233 | $8,617 | N/A | Cut-off Date Loan / Unit: | $99,057 | |
| Insurance: | $0 | Springing | N/A | Maturity Date Loan / Unit: | $99,057 | |
| Replacement Reserve: | $212,000 | Springing | $212,000 | Cut-off Date LTV(3): | 65.3% | |
| Deferred Maintenance: | $45,700 | $0 | N/A | Maturity Date LTV(3): | 65.3% | |
| Other: | $61,250 | $0 | N/A | UW NCF DSCR: | 1.43x | |
| UW NOI Debt Yield: | 10.4% | |||||
| Sources and Uses | ||||||||
| Sources | Proceeds | % of Total | Uses | Proceeds | % of Total | |||
| Mortgage Loan | $21,000,000 | 78.5 | % | Loan Payoff | $12,424,480 | 46.4 | % | |
| Equity Contribution | 5,750,000 | 21.5 | Sponsor Equity Repatriation(3) | 7,640,376 | 28.6 | |||
| Partnership Buyout | 5,750,000 | 21.5 | ||||||
| Closing Costs | 598,961 | 2.2 | ||||||
| Upfront Reserves | 336,183 | 1.3 | ||||||
| Total Sources | $26,750,000 | 100.0 | % | Total Uses | $26,750,000 | 100.0 | % | |
| (1) | The Cincinnati Multifamily Portfolio II Mortgage Loan shares the same borrower sponsor as the Maple Creek Village Mortgage Loan, which is also being contributed to the BMO 2023-C6 transaction. |
| (2) | For a full description of Escrows and Reserves, see “Escrows and Reserves” below. |
| (3) | The Cut-off Date LTV and Maturity Date LTV are based on the aggregate sum of the individual "as-is" appraised value of the four properties of $32,150,000. |
| (4) | Approximately $3.82 million of the equity repatriation was used to effectuate a partnership buyout, with the sponsor receiving the remaining $3.82 million resulting in a net equity contribution of approximately $1.93 million by the borrower sponsor. |
The Loan. The tenth largest mortgage loan (the “Cincinnati Multifamily Portfolio II Mortgage Loan”) is secured by the borrower’s fee interest in four garden-style multifamily properties located in Cincinnati, Ohio (the “Cincinnati Multifamily Portfolio II Properties”). The Cincinnati Multifamily Portfolio II Mortgage Loan was originated on June 16, 2023 by Bank of Montreal (“BMO”). The Cincinnati Multifamily Portfolio II Mortgage Loan accrues interest at a fixed rate of 7.03000% per annum. The Cincinnati Multifamily Portfolio II Mortgage Loan has an original term of 120 months, has a remaining term of 119 months as of the Cut-off Date and is interest only for the entire term. The scheduled maturity date of the Cincinnati Multifamily Portfolio II Mortgage Loan is the monthly payment date that occurs on July 6, 2033.
| THE INFORMATION IN THIS STRUCTURAL AND COLLATERAL TERM SHEET IS NOT COMPLETE AND MAY BE AMENDED PRIOR TO THE TIME OF SALE. THIS TERM SHEET IS NOT AN OFFER TO SELL THESE SECURITIES AND IT IS NOT A SOLICITATION OF AN OFFER TO BUY THESE SECURITIES IN ANY JURISDICTION WHERE THE OFFER OR SALE IS NOT PERMITTED. | ||
| 106 | ||
| Structural and Collateral Term Sheet | BMO 2023-C6 | |
| No. 10 – Cincinnati Multifamily Portfolio II | ||
The Properties. The Cincinnati Multifamily Portfolio II Properties are comprised of the following four multifamily garden-style properties located in Cincinnati, Ohio that were built between 1956 and 1973 and renovated between 2020 and 2022, the “Valley Hill Apartments Property”, the “Hillview Apartments Property”, the “Kings Pointe Apartments Property”, and the “Hillcrest Apartments Property”. All of the units at the Cincinnati Multifamily Portfolio II Properties are residential units, and there are no rent-controlled or rent-stabilized units at the Cincinnati Multifamily Portfolio II Properties.
The following table presents certain information relating to the Cincinnati Multifamily Portfolio II Properties:
| Portfolio Summary(1) | ||||||||||||
| Property Name | Year Built / Renovated | Units(2) | Occupancy %(2) | Allocated Cut-off Date Loan Amount (“ALA”) | % of ALA | Appraised Value | % of Appraised Value | UW NOI(2) | % of UW NOI(2) | |||
| Valley Hill Apartments | 1966 / 2020-2022 | 81 | 97.5 | % | $8,883,359 | 42.3 | % | $13,600,000 | 42.3 | % | NAV | NAV |
| Hillview Apartments | 1961, 1973 / 2020-2022 | 63 | 98.4 | % | 4,800,933 | 22.9 | 7,350,000 | 22.9 | NAV | NAV | ||
| Kings Pointe Apartments | 1971 / 2020-2022 | 36 | 97.2 | % | 4,245,723 | 20.2 | 6,500,000 | 20.2 | NAV | NAV | ||
| Hillcrest Apartments | 1956, 1971 / 2020-2022 | 32 | 96.9 | % | 3,069,984 | 14.6 | 4,700,000 | 14.6 | NAV | NAV | ||
| Total/Wtd. Avg. | 212 | 97.6 | % | $21,000,000 | 100.0 | % | $32,150,000 | 100.0 | % | $2,177,620 | 100.0% | |
| (1) | Source: Appraisal unless otherwise indicated. |
| (2) | Based on the underwritten rent roll dated as of May 31, 2023. |
Valley Hill Apartments Property. As of May 31, 2023, the Valley Hill Apartments Property was 97.5% occupied. The 6.76-acre parcel is improved with 6 three-story apartment buildings. The improvements are brick construction. The Valley Hill Apartments Property features 81 units in total with one-, two- and three-bedroom layouts ranging in size from 550 to 805 square feet. Market rents range from $850 to $1,460 per month, with an average market rent of approximately $1,119 and an average unit size of 663 square feet. Unit features include laminate countertops, wood cabinets and an appliance package.
The following table presents detailed information with respect to the units at the Valley Hill Apartments Property:
| Unit Summary(1) | ||||||||
| Unit Type | No. of Units | % of Total | Average Unit Size (SF) | Average Monthly Rental Rate(2) | Average Monthly Rental Rate per SF(2) | Average Monthly Market Rental Rate(3) | Average Monthly Market Rental Rate per SF(3) | |
| 1 Bedroom | 42 | 51.9 | % | 550 | $829 | $1.51 | $850 | $1.55 |
| 2 Bedroom | 5 | 6.2 | 645 | $1,054 | $1.63 | $1,055 | $1.64 | |
| 3 Bedroom | 34 | 42.0 | 805 | $1,456 | $1.81 | $1,460 | $1.81 | |
| Total/Wtd. Avg. | 81 | 100.0 | % | 663 | $1,105 | $1.67 | $1,119 | $1.69 |
| (1) | Based on the underwritten rent roll dated as of May 31, 2023. |
| (2) | Based only on occupied units. |
| (3) | Source: Appraisal. |
Hillview Apartments Property. As of May 31, 2023, the Hillview Apartments Property was 98.4% occupied. The 1.54-acre parcel is improved with 2 three-story apartment buildings. The improvements are brick construction. The Hillview Apartments Property features 63 one-bedroom units in total, each of which is 550 square feet in size. Market rent for this unit type is $850. Unit features include laminate countertops, wood cabinets and an appliance package. Community amenities include on-site laundry and attached garages.
| THE INFORMATION IN THIS STRUCTURAL AND COLLATERAL TERM SHEET IS NOT COMPLETE AND MAY BE AMENDED PRIOR TO THE TIME OF SALE. THIS TERM SHEET IS NOT AN OFFER TO SELL THESE SECURITIES AND IT IS NOT A SOLICITATION OF AN OFFER TO BUY THESE SECURITIES IN ANY JURISDICTION WHERE THE OFFER OR SALE IS NOT PERMITTED. | ||
| 107 | ||
| Structural and Collateral Term Sheet | BMO 2023-C6 | |
| No. 10 – Cincinnati Multifamily Portfolio II | ||
The following table presents detailed information with respect to the units at the Hillview Apartments Property:
| Unit Summary(1) | ||||||||
| Unit Type | No. of Units | % of Total | Average Unit Size (SF) | Average Monthly Rental Rate(2) | Average Monthly Rental Rate per SF(2) | Average Monthly Market Rental Rate(3) | Average Monthly Market Rental Rate per SF(3) | |
| 1 Bedroom | 63 | 100.0 | % | 550 | $831 | $1.51 | $850 | $1.55 |
| Total/Wtd. Avg. | 63 | 100.0 | % | 550 | $831 | $1.51 | $850 | $1.55 |
| (1) | Based on the underwritten rent roll dated as of May 31, 2023. |
| (2) | Based only on occupied units. |
| (3) | Source: Appraisal. |
Kings Pointe Apartments Property. As of May 31, 2023, the Kings Pointe Apartments Property was 97.2% occupied. The 1.69-acre parcel is improved with a three-story apartment building. The improvements are brick construction. The Kings Pointe Apartments Property features 36 units in total, with one-, two- and three-bedroom layouts ranging in size from 550 to 805 square feet. Market rents range from $850 to $1,450 per month, with an average market rent of $1,184 and an average unit size of 693 square feet. Unit features include laminate countertops, wood cabinets and an appliance package.
The following table presents detailed information with respect to the units at the Kings Pointe Apartments Property:
| Unit Summary(1) | ||||||||
| Unit Type | No. of Units | % of Total | Average Unit Size (SF) | Average Monthly Rental Rate(2) | Average Monthly Rental Rate per SF(2) | Average Monthly Market Rental Rate(3) | Average Monthly Market Rental Rate per SF(3) | |
| 1 Bedroom | 14 | 38.9 | % | 550 | $833 | $1.51 | $850 | $1.55 |
| 2 Bedroom | 3 | 8.3 | 645 | $1,053 | $1.63 | $1,055 | $1.64 | |
| 3 Bedroom | 19 | 52.8 | 805 | $1,450 | $1.80 | $1,450 | $1.80 | |
| Total/Wtd. Avg. | 36 | 100.0 | % | 693 | $1,169 | $1.70 | $1,184 | $1.71 |
| (1) | Based on the underwritten rent roll dated as of May 31, 2023. |
| (2) | Based only on occupied units. |
| (3) | Source: Appraisal. |
Hillcrest Apartments Property. As of May 31, 2023, the Hillcrest Apartments Property was 96.9% occupied. The 0.67-acre parcel is improved with 3 three-story apartment buildings. The improvements are brick construction. The Hillcrest Apartments Property features 32 units in total, with one-, two- and three-bedroom layouts ranging in size from 550 to 805 square feet. Market rents range from $850 to $1,460 per month, with an average market rent of $1,015 and an average unit size of 620 square feet. Unit features include laminate countertops, wood cabinets and an appliance package.
The following table presents detailed information with respect to the units at the Hillcrest Apartments Property:
| Unit Summary(1) | ||||||||
| Unit Type | No. of Units | % of Total | Average Unit Size (SF) | Average Monthly Rental Rate(2) | Average Monthly Rental Rate per SF(2) | Average Monthly Market Rental Rate(3) | Average Monthly Market Rental Rate per SF(3) | |
| 1 Bedroom | 22 | 68.8 | % | 550 | $833 | $1.51 | $850 | $1.55 |
| 2 Bedroom | 2 | 6.3 | 645 | $1,057 | $1.64 | $1,055 | $1.64 | |
| 3 Bedroom | 8 | 25.0 | 805 | $1,450 | $1.80 | $1,460 | $1.81 | |
| Total/Wtd. Avg. | 32 | 100.0 | % | 620 | $1,006 | $1.62 | $1,015 | $1.64 |
| (1) | Based on the underwritten rent roll dated as of May 31, 2023. |
| (2) | Based only on occupied units. |
| (3) | Source: Appraisal. |
Environmental. According to the Phase I environmental assessments dated June 6, 2023, there was no evidence of any recognized environmental conditions at the Cincinnati Multifamily Portfolio II Properties. However, the Cincinnati Multifamily Portfolio II Properties are located in a zone with predicted elevated radon levels and accordingly, the Phase I environmental assessments recommended further testing, and if there are in fact elevated radon levels after such testing, the borrower is required to take certain mitigation actions under the Cincinnati Multifamily Portfolio II loan documents.
| THE INFORMATION IN THIS STRUCTURAL AND COLLATERAL TERM SHEET IS NOT COMPLETE AND MAY BE AMENDED PRIOR TO THE TIME OF SALE. THIS TERM SHEET IS NOT AN OFFER TO SELL THESE SECURITIES AND IT IS NOT A SOLICITATION OF AN OFFER TO BUY THESE SECURITIES IN ANY JURISDICTION WHERE THE OFFER OR SALE IS NOT PERMITTED. | ||
| 108 | ||
| Structural and Collateral Term Sheet | BMO 2023-C6 | |
| No. 10 – Cincinnati Multifamily Portfolio II | ||
The following table presents certain information relating to the historical and current occupancy of the Cincinnati Multifamily Portfolio II Properties:
| Historical and Current Occupancy(1) | ||||
| Property | 2020 | 2021 | 2022 | Current(2) |
| Valley Hill Apartments | 86.4% | 88.9% | 97.5% | 97.5% |
| Hillview Apartments | 90.5% | 88.9% | 95.2% | 98.4% |
| Kings Pointe Apartments | 80.6% | 88.9% | 91.7% | 97.2% |
| Hillcrest Apartments | 84.4% | 90.6% | 96.9% | 96.9% |
| (1) | Historical occupancy is as of December 31 of each respective year. |
| (2) | Current Occupancy is as of May 31, 2023. |
The following table presents certain information relating to the operating history and underwritten cash flows of the Cincinnati Multifamily Portfolio II Properties:
| Operating History and Underwritten Net Cash Flow | ||||||||
| 2020 | 2021 | 2022 | TTM(1) | Underwritten | Per Unit | %(2) | ||
| Gross Potential Rent | $2,318,280 | $2,534,093 | $2,585,550 | $2,644,500 | $2,597,484 | $12,252 | 102.6 | % |
| (Vacancy/Credit Loss) | (348,000) | (252,000) | (190,308) | (221,024) | (66,000) | (311) | (2.6 | ) |
| Net Rental Income | $1,970,280 | $2,282,093 | $2,395,242 | $2,423,476 | $2,531,484 | $11,941 | 100.0 | % |
| Other Income | 179,927 | 192,050 | 275,339 | 281,388 | 298,868 | 1,410 | 11.8 | |
| Effective Gross Income | $2,150,207 | $2,474,143 | $2,670,580 | $2,704,864 | $2,830,352 | $13,351 | 111.8 | % |
| Total Expenses | 679,488 | 686,122 | 640,449 | 616,570 | 652,732 | 3,079 | 23.1 | |
| Net Operating Income | $1,470,719 | $1,788,021 | $2,030,131 | $2,088,294 | $2,177,620 | $10,272 | 76.9 | % |
| Total Capex/RR | 0 | 0 | 0 | 0 | 42,400 | 200 | 1.5 | |
| Net Cash Flow | $1,470,719 | $1,788,021 | $2,030,131 | $2,088,294 | $2,135,220 | $10,072 | 75.4 | % |
| (1) | TTM reflects the trailing 12 months ending March 31, 2023. |
| (2) | % column represents percent of Net Rental Income for revenue fields and represents percent of Effective Gross Income for the remainder of fields. |
The Markets. According to the appraisals, the Cincinnati Multifamily Portfolio II Properties are located in the Cincinnati multifamily market. According to the appraisals, as of the fourth quarter of 2022, the Cincinnati multifamily market average monthly asking rent per unit was $1,158 and the average vacancy rate was 5.4%. According to the appraisals, the Cincinnati Multifamily Portfolio II Properties are located in the Northwest Cincinnati submarket. As of the fourth quarter of 2022, the Northwest Cincinnati multifamily submarket average monthly asking rent per unit was $852 and the average vacancy rate was 4.9%.
According to the appraisals, the estimated 2023 population within a one-, three- and five-mile radius of the Valley Hill Apartments Property, the Hillview Apartments Property and the Hillcrest Apartments Property is 20,850, 114,295 and 267,783, respectively. The estimated 2023 median household income within the same radii is $42,774, $47,699 and $53,072, respectively.
According to the appraisal, the estimated 2023 population within a one-, three- and five-mile radius of the Kings Pointe Apartments Property is 11,520, 115,440 and 306,042, respectively. The estimated 2023 median household income within the same radii is $23,263, $42,697 and $50,960, respectively.
| THE INFORMATION IN THIS STRUCTURAL AND COLLATERAL TERM SHEET IS NOT COMPLETE AND MAY BE AMENDED PRIOR TO THE TIME OF SALE. THIS TERM SHEET IS NOT AN OFFER TO SELL THESE SECURITIES AND IT IS NOT A SOLICITATION OF AN OFFER TO BUY THESE SECURITIES IN ANY JURISDICTION WHERE THE OFFER OR SALE IS NOT PERMITTED. | ||
| 109 | ||
| Structural and Collateral Term Sheet | BMO 2023-C6 | |
| No. 10 – Cincinnati Multifamily Portfolio II | ||
The following table presents certain information relating to comparable multifamily rental properties to the Cincinnati Multifamily Portfolio II Properties:
| Comparable Rental Summary(1) | |||||||
| Property Name / Property Address | Year Built / Renovated | Occupancy | # of Units | Unit Mix | Average SF per Unit | Average Rent per SF | Average Rent per Unit |
Valley Hill Apartments(2) 2156-2175 Karla Drive Cincinnati, OH | 1966 / 2020-2022 | 97.5% | 81 |
1 Bedroom 2 Bedroom 3 Bedroom
| 550 645 805
| $1.51 $1.63 $1.81
|
$829 $1,054 $1,456
|
Hillview Apartments(2) 2880-2888 Harrison Avenue Cincinnati, OH | 1961, 1973 / 2020-2022 | 98.4% | 63 |
1 Bedroom
|
550
|
$1.51
|
$831
|
Kings Pointe Apartments(2) 3515 McHenry Avenue Cincinnati, OH | 1971 / 2020-2022 | 97.2% | 36 |
1 Bedroom 2 Bedroom 3 Bedroom
|
550 645 805
|
$1.51 $1.63 $1.80
|
$833 $1,053 $1,450
|
Hillcrest Apartments(2) 2743-2749 Harrison Avenue Cincinnati, OH | 1956, 1971 / 2020-2022 | 96.9% | 32 |
1 Bedroom 2 Bedroom 3 Bedroom
| 550 645 805 | $1.51 $1.64 $1.80 | $833 $1,057 $1,450 |
Candlewood Apartments 2400 Harrison Avenue Cincinnati, OH | 1961 / NAP | 97.0% | 110 | 1BR / 1BA 2BR / 1BA 3BR / 1BA | 750 950 950 | $1.13 $1.11 $1.55 | $850 $1,055 $1,477 |
Mayridge Apartments 3153-3225 Mayridge Court Cincinnati, OH | 1964 / NAP | 95.0% | 107 | Studio 1BR / 1BA 2BR / 1BA 3BR / 2BA | 450 565 - 690 735 - 998 1,045 |
$1.33 $1.09 - $1.24 $1.00 - $1.12 $1.15
| $600 $700 - $750 $825 - $1,000 $1,200 |
| (1) | Source: Appraisal, unless otherwise indicated. |
| (2) | Based on the underwritten rent roll dated as of May 31, 2023. |
The Borrower. The borrower is 212 Cincinnati LLC, an Ohio limited liability company and special purpose entity with one independent director. Legal counsel to the borrower provided a non-consolidation opinion in connection with the origination of the Cincinnati Multifamily Portfolio II Mortgage Loan.
The Borrower Sponsor. The borrower sponsor and guarantor is Mendel Steiner. The Cincinnati Multifamily Portfolio II Mortgage Loan shares the same borrower sponsor as the Maple Creek Village Mortgage Loan, which is also being contributed to the BMO 2023-C6 transaction.
Property Management. The Cincinnati Multifamily Portfolio II Properties are managed by Aven Realty 1 LLC, a third-party property management company.
Escrows and Reserves. At origination, the borrower was required to deposit into escrow (i) approximately $17,233 for real estate taxes, (ii) $212,000 for replacement reserves, (iii) approximately $45,700 for deferred maintenance and (iv) $61,250 for a radon testing reserve.
Tax Escrows – On a monthly basis, the borrower is required to escrow 1/12th of the annual estimated tax payments on a monthly basis, which currently equates to approximately $8,617.
| THE INFORMATION IN THIS STRUCTURAL AND COLLATERAL TERM SHEET IS NOT COMPLETE AND MAY BE AMENDED PRIOR TO THE TIME OF SALE. THIS TERM SHEET IS NOT AN OFFER TO SELL THESE SECURITIES AND IT IS NOT A SOLICITATION OF AN OFFER TO BUY THESE SECURITIES IN ANY JURISDICTION WHERE THE OFFER OR SALE IS NOT PERMITTED. | ||
| 110 | ||
| Structural and Collateral Term Sheet | BMO 2023-C6 | |
| No. 10 – Cincinnati Multifamily Portfolio II | ||
Insurance Escrows – On a monthly basis, the borrower is required to escrow 1/12th of the annual insurance premium payments on a monthly basis, which currently equates to approximately $7,066, and is currently waived due to the borrower maintaining a blanket policy acceptable to the lender.
Replacement Reserves – On a monthly basis, after funds in the replacement reserve initially fall below $50,000, the borrower is required to escrow approximately $4,581 for replacement reserves, so long as there is no event of default and funds in the replacement reserve do not exceed $212,000.
Lockbox / Cash Management. The Cincinnati Multifamily Portfolio II Mortgage Loan is structured with a springing lockbox and springing cash management. Upon the occurrence of a Trigger Period (as defined below), the borrower or property manager is required to deposit all revenues relating to the Cincinnati Multifamily Portfolio II Properties into a lender-controlled lockbox account within two business days of receipt. Upon the occurrence and during the continuance of a Trigger Period, all funds in the lockbox account are required to be swept on a daily basis to a cash management account under the control of the lender to be applied and disbursed in accordance with the Cincinnati Multifamily Portfolio II Mortgage Loan documents, and all excess cash flow funds remaining in the cash management account after the application of such funds in accordance with the Cincinnati Multifamily Portfolio II Mortgage Loan documents may be held by the lender in an excess cash flow reserve account as additional collateral for the Cincinnati Multifamily Portfolio II Mortgage Loan.
A “Trigger Period” will commence upon the earliest of the following: (i) the occurrence of an event of default under the Cincinnati Multifamily Portfolio II Mortgage Loan documents or (ii) the debt service coverage ratio for the Cincinnati Multifamily Portfolio II Mortgage Loan being less than 1.25x and will be cured when (A) with regard to clause (i) above, upon the cure of such event of default and (B) with regard to clause (ii) above, upon the debt service coverage ratio for the Cincinnati Multifamily Portfolio II Mortgage Loan being greater than or equal to 1.25x for two consecutive calendar quarters.
Subordinate Debt. None.
Mezzanine Debt. None.
Partial Release. None permitted.
Ground Lease. None.
| THE INFORMATION IN THIS STRUCTURAL AND COLLATERAL TERM SHEET IS NOT COMPLETE AND MAY BE AMENDED PRIOR TO THE TIME OF SALE. THIS TERM SHEET IS NOT AN OFFER TO SELL THESE SECURITIES AND IT IS NOT A SOLICITATION OF AN OFFER TO BUY THESE SECURITIES IN ANY JURISDICTION WHERE THE OFFER OR SALE IS NOT PERMITTED. | ||
| 111 | ||