UNITED STATES
SECURITIES AND EXCHANGE COMMISSION
Washington, D.C. 20549
FORM N-CSR
CERTIFIED SHAREHOLDER REPORT OF REGISTERED MANAGEMENT INVESTMENT COMPANIES
| Investment Company Act file number: | 811-23894 | |||
| Exact name of registrant as specified in charter: | PGIM Credit Income Fund | |||
| Address of principal executive offices: | 655 Broad Street, 6th Floor | |||
| Newark, New Jersey 07102 | ||||
| Name and address of agent for service: | Andrew R. French | |||
| 655 Broad Street, 6th Floor | ||||
| Newark, New Jersey 07102 | ||||
| Registrant’s telephone number, including area code: | 800-225-1852 | |||
| Date of fiscal year end: | 12/31/2024 | |||
| Date of reporting period: | 12/31/2024 | |||
Item 1 – Reports to Stockholders
| (a) | Report transmitted to stockholders pursuant to Rule 30e-1 under the Act (17 CFR 270.30e-1). |

PGIM CREDIT INCOME FUND
|
ANNUAL REPORT
DECEMBER 31, 2024

To enroll in e-delivery, go to pgim.com/investments/resource/edelivery
| 3 | ||||
| 4 | ||||
| 5 | ||||
| 7 | ||||
| 11 | ||||
This report is not authorized for distribution to prospective investors unless preceded or accompanied by a current prospectus.
The views expressed in this report and information about the Fund’s portfolio holdings are for the period covered by this report and are subject to change thereafter.
Mutual funds and certain closed-end funds are distributed by Prudential Investment Management Services LLC (PIMS), member SIPC. PGIM Fixed Income is a unit of PGIM, Inc. (PGIM), a registered investment adviser. PIMS and PGIM are Prudential Financial companies. © 2025 Prudential Financial, Inc. and its related entities. PGIM and the PGIM logo are service marks of Prudential Financial, Inc. and its related entities, registered in many jurisdictions worldwide.
2 Visit our website at pgim.com/investments
 | Dear Shareholder:
We hope you find the annual report for the PGIM Credit Income Fund informative and useful. The report covers performance for the 12-month period that ended December 31, 2024.
Financial markets rallied and the global economy remained resilient throughout the period as inflation cooled and recession fears faded. Employers kept hiring, consumers continued spending, and home prices maintained their upward trajectory. |
With inflation falling, the US Federal Reserve (Fed) began reducing the federal funds rate, implementing a 50-basis-point cut in September and two additional 25-basis-point cuts in November and December. Investor enthusiasm for artificial intelligence-related stocks led equities markets to record highs during the period, with equities in the US posting robust gains while the international markets showed moderate returns. In the US, real estate, energy and utilities lagged most other sectors, with real estate under pressure from elevated interest rates and reduced demand for office space.
Bond markets faced greater challenges during the period as fixed income investors responded to shifts in monetary policy and ongoing, though easing, inflation. US and global investment-grade bonds, along with emerging market debt, produced mixed returns during the period, while high yield corporate bonds outperformed.
Regarding your investments with PGIM, we believe it is important to maintain a diversified portfolio of funds consistent with your tolerance for risk, time horizon, and financial goals. Your financial advisor can help you create a diversified investment plan that may include funds covering a broad spectrum of asset classes and that reflects your personal investor profile and risk tolerance. However, diversification and asset allocation strategies do not assure a profit or protect against loss in declining markets.
At PGIM Investments, we provide access to active investment strategies across the global markets in the pursuit of consistent outperformance for investors. PGIM is the world’s 14th-largest investment manager with more than $1.4 trillion in assets under management. Our scale and investment expertise allow us to deliver a diversified suite of actively managed solutions across a broad spectrum of asset classes and investment styles.
Thank you for choosing our family of funds.
Sincerely,

Stuart S. Parker, President and Principal Executive Officer
PGIM Credit Income Fund
February 14, 2025
PGIM Credit Income Fund 3
Your Fund’s Performance (unaudited)
Performance data quoted represent past performance. Past performance does not guarantee future results. The investment return and principal value of an investment will fluctuate so that an investor’s shares, when redeemed, may be worth more or less than their original cost. Current performance may be lower or higher than the past performance data quoted. An investor may obtain performance data as of the most recent month-end by visiting our website at pgim.com/investments or by calling (800) 225-1852.
Average Annual One Year (%) | Total Returns as of 12/31/24 Since Inception (%) | |||
Class A | ||||
(with sales charges) | 8.50 | 9.31(12/11/2023) | ||
(without sales charges) | 11.28 | 11.95(12/11/2023) | ||
Class C | ||||
(with sales charges) | 9.40 | 11.07(12/11/2023) | ||
(without sales charges) | 10.40 | 11.07(12/11/2023) | ||
Class Z | ||||
(without sales charges) | 11.55 | 12.22(12/11/2023) | ||
ICE BofA US 3-Month Treasury Bill Index | ||||
| 5.25 | 5.29 | |||
Bloomberg 1-5 Year US Credit Index | ||||
| 4.72 | 6.09 | |||
Since Inception returns are provided since the Fund has less than 10 fiscal years of returns. Without waiver of fees and/or expense reimbursements, if any, the returns would have been lower. Total returns are based on changes in net asset value. Net asset value total return assumes the reinvestment of all distributions, including returns of capital, if any.
Since Inception returns for the Indexes are measured from the closest month-end to the Fund’s inception date. All returns exclude the impact of redemption fees on shares purchased and held less than 12 months.
4 Visit our website at pgim.com/investments
Growth of a $10,000 Investment (unaudited)
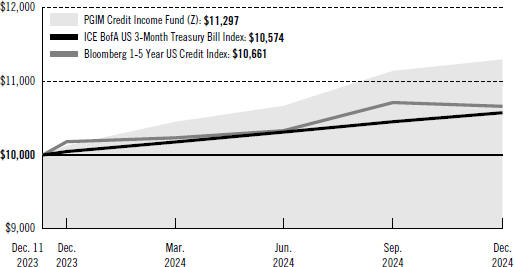
The graph compares a $10,000 investment in the Fund’s Class Z shares with a similar investment in the ICE BofA US 3-Month Treasury Bill Index and Bloomberg 1-5 Year US Credit Index by portraying the initial account values at the beginning of the 10-year period for Class Z shares (December 11, 2023) and the account values at the end of the current fiscal year (December 31, 2024) as measured on a quarterly basis. For purposes of the graph, and unless otherwise indicated, it has been assumed that (a) all recurring fees (including management fees) were deducted and (b) all dividends and distributions were reinvested. The line graph provides information for Class Z shares only. As indicated in the table provided earlier, performance for other share classes will vary, due to the differing charges and expenses applicable to each share class (as indicated in the following paragraphs). Without waiver of fees and/or expense reimbursements, if any, the returns would have been lower.
Past performance does not predict future performance. Total returns and the ending account values in the graph include changes in share price and reinvestment of dividends and capital gains distributions in a hypothetical investment for the periods shown. The Fund’s total returns in the table and the graph do not reflect the deduction of income taxes on an individual’s investment. Taxes may reduce your actual investment returns on income or gains paid by the Fund or any gains you may realize if you sell your shares.
The returns in the table do not reflect the deduction of taxes that a shareholder would pay on Fund distributions or following the redemption of Fund shares.
PGIM Credit Income Fund 5
Your Fund’s Performance (continued)
The Fund’s applicable sales charges, redemption fees, and distribution and service fees are described for each share class in the table below.
| Class A | Class C | Class Z | ||||
Maximum initial sales charge | 2.50% Prior to July 1, 2024: 3.25% of the public offering price | None | None | |||
Contingent Deferred Sales Charge (CDSC) | 1.50% on shares purchased without a sales charge if the shares are repurchased during the first 12 months after purchase Prior to July 1, 2024: None | 1.00% on shares repurchased during the first 12 months after purchase Prior to July 1, 2024: None | None | |||
Redemption Fee | None | None | None | |||
Annual distribution or distribution and service (12b-1) fees (shown as a percentage of average daily net assets) | 0.75% Prior to July 1, 2024: 0.25% | 1.00% | None | |||
Benchmark Definitions
ICE BofA US 3-Month Treasury Bill Index—The ICE BofA US 3-Month Treasury Bill Index is an unmanaged index which is comprised of a single issue purchased at the beginning of the month and held for a full month. At the end of the month, that issue is sold and rolled into a newly selected issue. The issue selected at each month-end rebalancing is the outstanding Treasury bill that matures closest to, but not beyond, three months from the rebalancing date. To qualify for selection, an issue must have settled on or before the month-end rebalancing date.
Bloomberg 1-5 Year US Credit Index—The Bloomberg 1-5 Year US Credit Index is an unmanaged index of publicly issued US corporate and specified foreign debentures and secured notes that meet specific maturity (between one and five years), liquidity, and quality requirements. It gives an indication of how short- and intermediate-term bonds have performed.
Investors cannot invest directly in an index. The returns for the Indexes would be lower if they included the effects of sales charges, operating expenses, or taxes that may be paid by an investor.
6 Visit our website at pgim.com/investments
Strategy and Performance Overview* (unaudited)
How did the Fund perform?
The PGIM Credit Income Fund (the Fund) returned 11.55%, based on net asset value, in the 12-month reporting that ended December 31, 2024, outperforming the 5.25% return of the ICE BofA US 3-Month Treasury Bill Index (the Index).
What Were the Market Conditions?
| · | During the reporting period, market expectations for both the timing and number of rate cuts fluctuated significantly as inflation slowed and employment data showed some signs of softening. The US Federal Reserve’s (Fed) easing cycle—which began in September 2024 with a 50-basis-point (bp) rate cut and was followed by two separate 25-bp cuts—was preceded by a re-steepening of the US Treasury curve and greater market volatility due to both election and fiscal uncertainty. (One basis point equals 0.01%.) Nevertheless, as demand for yield remained robust, credit spreads largely tightened, and performance across fixed income sectors was mostly positive. |
| · | US high yield bonds produced positive total and excess returns over the period, as spreads tightened amid resilient economic growth, stable corporate earnings, and strong technicals. That stated, yields rose to a four-month high in December, as the Fed delivered a hawkish cut amid a combination of firmer growth and inflation data. |
| · | US bank loans also posted positive total returns, amid a lack of net new supply, ongoing collateralized loan obligation (CLO) demand, inflows into bank loan exchange-traded funds, and high all-in coupons. |
| · | Securitized credit spreads tightened over the period, with US CLO spreads seeing material tightening across the capital structure and high-quality commercial mortgage-backed securities (CMBS) trading wide to comparable corporate bonds. |
| · | Emerging-markets debt spread performance was mixed, with most emerging-markets sectors posting negative total returns for the reporting period. Notably, within emerging-markets hard currency, emerging-markets high yield outperformed. Meanwhile, emerging-markets foreign exchange (FX) and local rates lagged, impacted by the strong US dollar, Fed policy repricing, and country-specific fundamental factors. |
What Worked?
| · | Overall security selection and sector allocation contributed to performance. Within security selection, selection in US high yield corporates, non-agency CMBS AA-and-below, US Treasuries, US bank loans, non-agency MBS, and US investment grade corporates contributed the most. Within sector allocation, overweights to emerging market high yield, British pound high yield corporates, and non-agency CMBS AA-and-below contributed the most. |
| · | Within credit, positioning in retailers & restaurants, chemicals, technology, gaming/lodging/leisure, and consumer non-cyclical contributed the most to performance. |
PGIM Credit Income Fund 7
Strategy and Performance Overview* (continued)
| · | In aggregate, the Fund’s duration and tactical yield curve positioning also contributed to performance, as the US Treasury curve re-steepened. (Duration measures the sensitivity of the price—the value of principal—of a bond to a change in interest rates.) (A yield curve is a line graph that illustrates the relationship between the yields and maturities of fixed income securities. It is created by plotting the yields of different maturities for the same type of bonds.) |
What Didn’t Work?
| · | While overall security selection contributed, selection in British pound high yield corporates and European high yield corporates detracted from performance. |
| · | While sector allocation contributed, overweights to the US high yield corporate, BBB CLO, US bank loan, and emerging market investment grade sectors detracted the most. |
| · | Within credit, positioning in telecom detracted the most. |
Did the Fund Use Derivatives?
| · | During the period, the Fund used credit default swaps, total return swaps, financial futures, and FX forwards to hedge credit risk and help manage the overall beta of the portfolio. (Beta is a measure of the volatility or risk of a security or portfolio compared to the market or index.) Credit default swaps contributed to performance, while financial futures, total return swaps, and FX forwards positions detracted from performance. |
What was the impact of the Fund’s distribution policy?
| · | The Fund has a practice of seeking to maintain a relatively stable level of distributions to shareholders. This practice has no impact on the Fund’s investment strategy. PGIM Fixed Income believes the practice helps maintain the Fund’s competitiveness. For the fiscal year ended December 2024, the tax character of dividends paid included an ordinary income distribution of $9,984,397, which had no material impact on the next asset value (NAV) during the reporting period. There was no tax return of capital distribution during the fiscal year ended December 31, 2024. |
Current Outlook
| · | The Fed’s rate path now appears far shallower than when it launched last September. The most recent Summary of Economic Projections, released alongside the December Federal Open Market Committee (FOMC) meeting, indicated improving labor stability (with 2024’s unemployment rate projection falling slightly from 4.4% in September to 4.3% in December) and lingering inflation pressures (with the 2025 core PCE inflation projection rising from 2.2% to 2.5%). |
| · | At the December FOMC meeting, the Fed halved its expected rate cuts for 2025 to only 50 bps, amid terminal rate and neutral rate projections that rose to 3.1% and 3.0%, respectively. Additional increases may follow in 2025. As conditions unfold, PGIM Fixed Income thinks three 25-bp cuts by the Fed is a reasonable expectation. |
8 Visit our website at pgim.com/investments
| · | While historically tight credit spreads and the experience of the past 20 years point to caution when it comes to credit exposure, this may not be the right approach in the current environment. Given the prospects for continued moderate economic growth, generally benign credit fundamentals, and strong demand for fixed income, PGIM Fixed Income thinks an extended period of narrow spreads is a more likely outcome. This could manifest as a slightly more volatile version of the 1992–1997 or 2004– 2007 periods, in which case credit product may continue to deliver positive excess returns. |
| · | High yield bond spreads remain within striking distance of the all-time tights achieved prior to the Global Financial Crisis (GFC) of 2007–2009. Moreover, a net-supply deficit, attractive absolute yields, and an overall robust credit environment provide a supportive backdrop for the market entering 2025. However, certain notable risks (e.g., geopolitics) are not sufficiently reflected in current spreads. As such, PGIM Fixed Income is maintaining a close-to-home defensive positioning with an underweight to spread duration, but a spread-carry at, or close to, benchmarks. |
| · | Bank loans continue to be supported by high all-in current coupons and yields, strong CLO formation, and continued inflows into bank loan funds. PGIM Fixed Income continues to favor public BB- and high single-B loans over sponsor-owned, low single-B and CCC loans, as PGIM Fixed Income expects those lower-quality loans to be most impacted by the challenging fundamental backdrop. |
| · | In securitized products, credit curves appear very flat, and the downside risks to indiscriminately allocating down the capital stack outweigh the potential rewards. PGIM Fixed Income expects spreads to remain around historical averages, making carry the dominant theme. |
| · | In a macroeconomic environment of on-trend (or potentially below-trend) growth and fairly valued US Treasury yields, carry is likely to be the primary driver of dollar-denominated returns for emerging-markets debt. Despite material spread tightening, elevated emerging markets yields still offer among the highest yields across public fixed income. In addition, performance dispersion within and between emerging-markets sectors provide opportunities to generate alpha. (Alpha is a measure of an investment’s active return compared to a market or index.) With that stated, PGIM Fixed Income remains measured in overall risk taking, considering the macro uncertainties, and continues to favor a barbell of emerging-markets credit across the ratings spectrum where it finds value. In emerging-markets rates and emerging-markets FX, PGIM Fixed Income is more selective, focusing on relative value, and remains focused on fundamentals—particularly fiscal, FX, and financing vulnerabilities. |
*This strategy and performance overview, which discusses what strategies or holdings (including derivatives, if applicable) affected the Fund’s performance, is compiled based on how the Fund performed relative to the Index and is viewed for performance attribution purposes at the aggregate Fund level, which in most instances will not
PGIM Credit Income Fund 9
Strategy and Performance Overview* (continued)
directly correlate to the amounts disclosed in the Statement of Operations which conform to US generally accepted accounting principles.
10 Visit our website at pgim.com/investments
as of December 31, 2024
| Description | Interest Rate | Maturity Date | Principal Amount (000)# | Value | ||||||||||||
LONG-TERM INVESTMENTS 120.9% | ||||||||||||||||
ASSET-BACKED SECURITIES 23.8% | ||||||||||||||||
Automobiles 0.3% | ||||||||||||||||
Huntington Bank Auto Credit-Linked Notes, | ||||||||||||||||
Series 2024-01, Class D, 144A, 30 Day Average SOFR + 5.250% (Cap N/A, Floor 0.000%) | 9.855%(c) | 05/20/32 | 307 | $ | 314,068 | |||||||||||
Collateralized Loan Obligations 21.8% | ||||||||||||||||
Atlas Senior Loan Fund Ltd. (Cayman Islands), | ||||||||||||||||
Series 2021-16A, Class D, 144A, 3 Month SOFR + 3.962% (Cap N/A, Floor 3.700%) | 8.579(c) | 01/20/34 | 1,100 | 1,106,346 | ||||||||||||
Barings Euro CLO DAC (Ireland), | ||||||||||||||||
Series 2024-01A, Class D, 144A, 3 Month EURIBOR + 4.500% (Cap N/A, Floor 4.500%) | 8.161(c) | 07/20/37 | EUR | 1,000 | 1,039,568 | |||||||||||
Barrow Hanley CLO Ltd. (Cayman Islands), | ||||||||||||||||
Series 2024-03A, Class D, 144A, 3 Month SOFR + 4.150% (Cap N/A, Floor 4.150%) | 8.767(c) | 04/20/37 | 1,000 | 1,020,810 | ||||||||||||
Carlyle Euro CLO DAC (Ireland), | ||||||||||||||||
Series 2022-05A, Class CR, 144A, 3 Month EURIBOR + 4.150% (Cap N/A, Floor 4.150%) | 7.236(c) | 04/25/37 | EUR | 1,000 | 1,040,300 | |||||||||||
CQS US CLO Ltd. (United Kingdom), | ||||||||||||||||
Series 2023-03A, Class D, 144A, 3 Month SOFR + 4.200% (Cap N/A, Floor 4.200%) | 8.826(c) | 01/25/37 | 1,500 | 1,531,112 | ||||||||||||
Elevation CLO Ltd. (Cayman Islands), | ||||||||||||||||
Series 2021-12A, Class D2R, 144A, 3 Month SOFR + 5.360% (Cap N/A, Floor 5.360%) | 9.977(c) | 04/20/37 | 1,000 | 1,025,413 | ||||||||||||
Harvest CLO DAC (Ireland), | ||||||||||||||||
Series 32A, Class D, 144A, 3 Month EURIBOR + 3.600% (Cap N/A, Floor 3.600%) | 7.298(c) | 07/25/37 | EUR | 1,000 | 1,048,786 | |||||||||||
Hayfin Emerald CLO DAC (Ireland), | ||||||||||||||||
Series 05A, Class DR, 144A, 3 Month EURIBOR + 4.160% (Cap N/A, Floor 4.160%) | 6.925(c) | 11/17/37 | EUR | 1,000 | 1,035,339 | |||||||||||
Invesco Euro CLO DAC (Ireland), | ||||||||||||||||
Series 03A, Class DR, 144A, 3 Month EURIBOR + 3.850% (Cap N/A, Floor 3.850%) | 7.293(c) | 10/30/38 | EUR | 1,000 | 1,028,011 | |||||||||||
KKR CLO Ltd. (United Kingdom), | ||||||||||||||||
Series 2022-43A, Class DR, 144A, 3 Month SOFR + 4.950% (Cap N/A, Floor 4.950%) | 9.606(c) | 01/15/36 | 2,000 | 2,050,211 | ||||||||||||
Monument CLO DAC (Ireland), | ||||||||||||||||
Series 01A, Class D, 144A, 3 Month EURIBOR + 4.350% (Cap N/A, Floor 4.350%) | 8.092(c) | 05/15/37 | EUR | 1,500 | 1,589,762 | |||||||||||
Nassau Euro CLO DAC (Ireland), | ||||||||||||||||
Series 04A, Class D, 144A, 3 Month EURIBOR + 3.950% (Cap N/A, Floor 3.950%) | 7.661(c) | 07/20/38 | EUR | 1,000 | 1,045,457 | |||||||||||
See Notes to Financial Statements.
PGIM Credit Income Fund 11
Schedule of Investments (continued)
as of December 31, 2024
| Description | Interest Rate | Maturity Date | Principal (000)# | Value | ||||||||
ASSET-BACKED SECURITIES (Continued) | ||||||||||||
Collateralized Loan Obligations (cont’d.) | ||||||||||||
Northwoods Capital Ltd. (Cayman Islands), | ||||||||||||
Series 2017-15A, Class DR, 144A, 3 Month SOFR +4.012% (Cap N/A, Floor 4.012%) | 8.366%(c) | 06/20/34 | 2,000 | $ | 2,004,991 | |||||||
Series 2020-22A, Class DRR, 144A, 3 Month SOFR + 4.950% (Cap N/A, Floor 4.950%) | 9.309(c) | 09/16/31 | 950 | 973,826 | ||||||||
OFSI BSL CLO Ltd. (Cayman Islands), | ||||||||||||
Series 2024-13A, Class D1, 144A, 3 Month SOFR +4.500% (Cap N/A, Floor 4.500%) | 9.117(c) | 04/20/37 | 1,000 | 1,021,041 | ||||||||
Silver Rock CLO (Cayman Islands), | ||||||||||||
Series 2023-03A, Class D, 144A, 3 Month SOFR + 5.050% (Cap N/A, Floor 5.050%) | 9.667(c) | 01/20/36 | 1,000 | 1,025,149 | ||||||||
Tikehau US CLO Ltd. (Bermuda), | ||||||||||||
Series 2022-02A, Class D1R, 144A, 3 Month SOFR + 5.150% (Cap N/A, Floor 5.150%) | 9.767(c) | 01/20/36 | 2,000 | 2,050,404 | ||||||||
Trinitas CLO Ltd. (Bermuda), | ||||||||||||
Series 2023-26A, Class D, 144A, 3 Month SOFR + 4.500% (Cap N/A, Floor 4.500%) | 9.117(c) | 01/20/35 | 1,000 | 1,005,752 | ||||||||
Z Capital Credit Partners BSL CLO Ltd. (Cayman Islands), | ||||||||||||
Series 2024-01A, Class C, 144A, 3 Month SOFR + 3.650% (Cap N/A, Floor 3.650%) | 8.297(c) | 04/16/36 | 1,500 | 1,524,360 | ||||||||
|
| |||||||||||
| 24,166,638 | ||||||||||||
Consumer Loans 0.8% | ||||||||||||
Affirm Asset Securitization Trust, | ||||||||||||
Series 2024-A, Class 1E, 144A | 9.170 | 02/15/29 | 850 | 865,918 | ||||||||
Credit Cards 0.9% | ||||||||||||
Genesis Sales Finance Master Trust, | ||||||||||||
Series 2024-B, Class B, 144A | 6.260 | 12/20/32 | 1,000 | 999,513 | ||||||||
|
| |||||||||||
TOTAL ASSET-BACKED SECURITIES | 26,346,137 | |||||||||||
|
| |||||||||||
COMMERCIAL MORTGAGE-BACKED SECURITIES 7.9% | ||||||||||||
Benchmark Mortgage Trust, | ||||||||||||
Series 2024-V05, Class XD, IO, 144A | 2.973(cc) | 01/10/57 | 8,000 | 823,102 | ||||||||
Series 2024-V06, Class XD, IO | 3.260(cc) | 03/15/57 | 6,000 | 701,035 | ||||||||
Series 2024-V12, Class A3 | 5.738 | 12/15/57 | 230 | 235,777 | ||||||||
BFLD Mortgage Trust, | ||||||||||||
Series 2024-VICT, Class B, 144A, 1 Month SOFR +2.589% (Cap N/A, Floor 2.589%) | 6.986(c) | 07/15/41 | 700 | 700,438 | ||||||||
See Notes to Financial Statements.
12
| Description | Interest Rate | Maturity Date | Principal (000)# | Value | ||||||||
COMMERCIAL MORTGAGE-BACKED SECURITIES (Continued) | ||||||||||||
BFLD Mortgage Trust, (cont’d.) | ||||||||||||
Series 2024-WRHS, Class E, 144A, 1 Month SOFR +3.689% (Cap N/A, Floor 3.689%) | 8.086%(c) | 08/15/26 | 946 | $ | 950,835 | |||||||
BMO Mortgage Trust, | ||||||||||||
Series 2024-05C03, Class XD, IO, 144A | 2.859(cc) | 02/15/57 | 7,250 | 728,963 | ||||||||
Series 2024-05C05, Class XD, IO, 144A | 2.477(cc) | 02/15/57 | 3,975 | 371,798 | ||||||||
BPR Trust, | ||||||||||||
Series 2021-TY, Class D, 144A, 1 Month SOFR + 2.464% (Cap N/A, Floor 2.350%) | 6.862(c) | 09/15/38 | 1,000 | 992,656 | ||||||||
ONE Mortgage Trust, | ||||||||||||
Series 2021-PARK, Class D, 144A, 1 Month SOFR +1.614% (Cap N/A, Floor 1.500%) | 6.011(c) | 03/15/36 | 1,000 | 954,373 | ||||||||
ROCK Trust, | ||||||||||||
Series 2024-CNTR, Class E, 144A | 8.819 | 11/13/41 | 1,000 | 1,033,935 | ||||||||
Wells Fargo Commercial Mortgage Trust, | ||||||||||||
Series 2021-FCMT, Class C, 144A, 1 Month SOFR +2.514% (Cap N/A, Floor 2.400%) | 6.912(c) | 05/15/31 | 1,300 | 1,264,606 | ||||||||
|
| |||||||||||
TOTAL COMMERCIAL MORTGAGE-BACKED SECURITIES | 8,757,518 | |||||||||||
|
| |||||||||||
CORPORATE BONDS 55.9% | ||||||||||||
Aerospace & Defense 1.9% | ||||||||||||
Bombardier, Inc. (Canada), | ||||||||||||
Sr. Unsec’d. Notes, 144A(v) | 8.750 | 11/15/30 | 2,000 | 2,147,500 | ||||||||
Airlines 0.2% | ||||||||||||
United Airlines, Inc., | ||||||||||||
Sr. Sec’d. Notes, 144A | 4.375 | 04/15/26 | 200 | 196,576 | ||||||||
Apparel 0.8% | ||||||||||||
Wolverine World Wide, Inc., | ||||||||||||
Gtd. Notes, 144A | 4.000 | 08/15/29 | 975 | 854,962 | ||||||||
Auto Parts & Equipment 0.8% | ||||||||||||
Tenneco, Inc., | ||||||||||||
Sr. Sec’d. Notes, 144A(v) | 8.000 | 11/17/28 | 900 | 837,213 | ||||||||
Banks 6.6% | ||||||||||||
Bank of America Corp., | ||||||||||||
Jr. Sub. Notes, Series MM(v) | 4.300(ff) | 01/28/25(oo) | 2,550 | 2,541,377 | ||||||||
Cassa Depositi e Prestiti SpA (Italy), | ||||||||||||
Sr. Unsec’d. Notes, 144A(v) | 5.875 | 04/30/29 | 200 | 202,897 | ||||||||
See Notes to Financial Statements.
PGIM Credit Income Fund 13
Schedule of Investments (continued)
as of December 31, 2024
| Description | Interest Rate | Maturity Date | Principal (000)# | Value | ||||||||||||
CORPORATE BONDS (Continued) | ||||||||||||||||
Banks (cont’d.) | ||||||||||||||||
Citigroup, Inc., | ||||||||||||||||
Jr. Sub. Notes, Series CC(v) | 7.125%(ff) | 08/15/29(oo) | 470 | $ | 478,454 | |||||||||||
Jr. Sub. Notes, Series X(v) | 3.875(ff) | 02/18/26(oo) | 1,233 | 1,194,312 | ||||||||||||
Goldman Sachs Group, Inc. (The), | ||||||||||||||||
Jr. Sub. Notes, Series U | 3.650(ff) | 08/10/26(oo) | 1,000 | 955,007 | ||||||||||||
Royal Bank of Canada (Canada), | ||||||||||||||||
Jr. Sub. Notes | 7.500(ff) | 05/02/84 | 750 | 776,250 | ||||||||||||
Toronto-Dominion Bank (The) (Canada), | ||||||||||||||||
Jr. Sub. Notes | 7.250(ff) | 07/31/84 | 785 | 795,794 | ||||||||||||
Wells Fargo & Co., | ||||||||||||||||
Jr. Sub. Notes | 6.850(ff) | 09/15/29(oo) | 335 | 344,942 | ||||||||||||
|
| |||||||||||||||
| 7,289,033 | ||||||||||||||||
Chemicals 2.7% | ||||||||||||||||
Ashland, Inc., | ||||||||||||||||
Sr. Unsec’d. Notes, 144A(v) | 3.375 | 09/01/31 | 300 | 255,064 | ||||||||||||
Braskem Netherlands Finance BV (Brazil), | ||||||||||||||||
Gtd. Notes | 8.500 | 01/12/31 | 400 | 399,400 | ||||||||||||
Herens Midco Sarl (Luxembourg), | ||||||||||||||||
Gtd. Notes | 5.250 | 05/15/29 | EUR | 710 | 606,014 | |||||||||||
Monitchem HoldCo 3 SA (Luxembourg), | ||||||||||||||||
Sr. Sec’d. Notes | 8.750 | 05/01/28 | EUR | 1,345 | 1,440,358 | |||||||||||
OCP SA (Morocco), | ||||||||||||||||
Sr. Unsec’d. Notes, 144A(v) | 6.750 | 05/02/34 | 260 | 264,810 | ||||||||||||
|
| |||||||||||||||
| 2,965,646 | ||||||||||||||||
Coal 0.5% | ||||||||||||||||
Coronado Finance Pty Ltd. (Australia), | ||||||||||||||||
Sr. Sec’d. Notes, 144A(v) | 9.250 | 10/01/29 | 550 | 554,125 | ||||||||||||
Commercial Services 0.3% | ||||||||||||||||
Alta Equipment Group, Inc., | ||||||||||||||||
Sec’d. Notes, 144A | 9.000 | 06/01/29 | 45 | 42,927 | ||||||||||||
Autopistas del Sol SA (Costa Rica), | ||||||||||||||||
Sr. Sec’d. Notes | 7.375 | 12/30/30 | 257 | 253,417 | ||||||||||||
DCLI Bidco LLC, | ||||||||||||||||
Second Mortgage, 144A | 7.750 | 11/15/29 | 20 | 20,438 | ||||||||||||
|
| |||||||||||||||
| 316,782 | ||||||||||||||||
See Notes to Financial Statements.
14
| Description | Interest Rate | Maturity Date | Principal (000)# | Value | ||||||||
CORPORATE BONDS (Continued) | ||||||||||||
Computers 0.5% | ||||||||||||
McAfee Corp., | ||||||||||||
Sr. Unsec’d. Notes, 144A | 7.375% | 02/15/30 | 575 | $ | 559,662 | |||||||
Diversified Financial Services 0.8% | ||||||||||||
Nationstar Mortgage Holdings, Inc., | ||||||||||||
Gtd. Notes, 144A(v) | 5.750 | 11/15/31 | 500 | 477,714 | ||||||||
OneMain Finance Corp., | ||||||||||||
Gtd. Notes | 6.625 | 05/15/29 | 150 | 151,836 | ||||||||
PennyMac Financial Services, Inc., | ||||||||||||
Gtd. Notes, 144A(v) | 5.750 | 09/15/31 | 250 | 237,983 | ||||||||
|
| |||||||||||
| 867,533 | ||||||||||||
Electric 4.9% | ||||||||||||
Aydem Yenilenebilir Enerji A/S (Turkey), | ||||||||||||
Sr. Sec’d. Notes | 7.750 | 02/02/27 | 210 | 209,015 | ||||||||
Calpine Corp., | ||||||||||||
Sr. Unsec’d. Notes, 144A(v) | 4.625 | 02/01/29 | 575 | 542,300 | ||||||||
Eskom Holdings SOC Ltd. (South Africa), | ||||||||||||
Sr. Unsec’d. Notes, MTN | 8.450 | 08/10/28 | 404 | 423,695 | ||||||||
NRG Energy, Inc., | ||||||||||||
Jr. Sub. Notes, 144A(v) | 10.250(ff) | 03/15/28(oo) | 1,800 | 1,989,386 | ||||||||
Vistra Corp., | ||||||||||||
Jr. Sub. Notes, 144A(v) | 7.000(ff) | 12/15/26(oo) | 2,300 | 2,299,777 | ||||||||
|
| |||||||||||
| 5,464,173 | ||||||||||||
Engineering & Construction 0.5% | ||||||||||||
Mexico City Airport Trust (Mexico), | ||||||||||||
Sr. Sec’d. Notes | 5.500 | 07/31/47 | 400 | 321,124 | ||||||||
Sr. Sec’d. Notes, 144A | 5.500 | 07/31/47 | 300 | 240,843 | ||||||||
|
| |||||||||||
| 561,967 | ||||||||||||
Entertainment 2.3% | ||||||||||||
Caesars Entertainment, Inc., | ||||||||||||
Gtd. Notes, 144A(v) | 4.625 | 10/15/29 | 1,100 | 1,030,521 | ||||||||
Jacobs Entertainment, Inc., | ||||||||||||
Sr. Unsec’d. Notes, 144A | 6.750 | 02/15/29 | 150 | 144,693 | ||||||||
Penn Entertainment, Inc., | ||||||||||||
Sr. Unsec’d. Notes, 144A | 5.625 | 01/15/27 | 200 | 196,907 | ||||||||
See Notes to Financial Statements.
PGIM Credit Income Fund 15
Schedule of Investments (continued)
as of December 31, 2024
| Description | Interest Rate | Maturity Date | Principal Amount (000)# | Value | ||||||||||||||||
CORPORATE BONDS (Continued) | ||||||||||||||||||||
Entertainment (cont’d.) | ||||||||||||||||||||
Scientific Games Holdings LP/Scientific Games US FinCo, Inc., | ||||||||||||||||||||
Sr. Unsec’d. Notes, 144A | 6.625% | 03/01/30 | 500 | $ | 479,187 | |||||||||||||||
Wynn Resorts Finance LLC/Wynn Resorts Capital Corp., | ||||||||||||||||||||
Gtd. Notes, 144A(v) | 5.125 | 10/01/29 | 675 | 646,525 | ||||||||||||||||
|
| |||||||||||||||||||
| 2,497,833 | ||||||||||||||||||||
Foods 2.8% | ||||||||||||||||||||
B&G Foods, Inc., | ||||||||||||||||||||
Gtd. Notes | 5.250 | 09/15/27 | 225 | 213,597 | ||||||||||||||||
Bellis Acquisition Co. PLC (United Kingdom), | ||||||||||||||||||||
Sr. Sec’d. Notes, 144A | 8.125 | 05/14/30 | GBP | 825 | 996,535 | |||||||||||||||
Bellis Finco PLC (United Kingdom), | ||||||||||||||||||||
Gtd. Notes | 4.000 | 02/16/27 | GBP | 1,325 | 1,561,315 | |||||||||||||||
Lamb Weston Holdings, Inc., | ||||||||||||||||||||
Gtd. Notes, 144A | 4.125 | 01/31/30 | 200 | 182,967 | ||||||||||||||||
Post Holdings, Inc., | ||||||||||||||||||||
Sr. Sec’d. Notes, 144A | 6.250 | 02/15/32 | 140 | 139,030 | ||||||||||||||||
|
| |||||||||||||||||||
| 3,093,444 | ||||||||||||||||||||
Forest Products & Paper 0.2% | ||||||||||||||||||||
LD Celulose International GmbH (Brazil), | ||||||||||||||||||||
Sr. Sec’d. Notes, 144A | 7.950 | 01/26/32 | 200 | 200,062 | ||||||||||||||||
Healthcare-Services 1.2% | ||||||||||||||||||||
Chrome Holdco SAS (France), | ||||||||||||||||||||
Gtd. Notes | 5.000 | 05/31/29 | EUR | 750 | 430,201 | |||||||||||||||
DaVita, Inc., | ||||||||||||||||||||
Gtd. Notes, 144A(v) | 3.750 | 02/15/31 | 975 | 842,838 | ||||||||||||||||
|
| |||||||||||||||||||
| 1,273,039 | ||||||||||||||||||||
Home Builders 0.3% | ||||||||||||||||||||
Brookfield Residential Properties, Inc./Brookfield Residential US LLC (Canada), | ||||||||||||||||||||
Gtd. Notes, 144A | 6.250 | 09/15/27 | 100 | 98,750 | ||||||||||||||||
Sr. Unsec’d. Notes, 144A | 5.000 | 06/15/29 | 300 | 278,250 | ||||||||||||||||
|
| |||||||||||||||||||
| 377,000 | ||||||||||||||||||||
See Notes to Financial Statements.
16
| Description | Interest Rate | Maturity Date | Principal Amount (000)# | Value | ||||||||||||
CORPORATE BONDS (Continued) |
| |||||||||||||||
Household Products/Wares 0.1% | ||||||||||||||||
Kronos Acquisition Holdings, Inc. (Canada), | ||||||||||||||||
Sr. Unsec’d. Notes, 144A | 10.750% | 06/30/32 | 100 | $ | 91,545 | |||||||||||
Housewares 0.2% | ||||||||||||||||
Scotts Miracle-Gro Co. (The), | ||||||||||||||||
Gtd. Notes | 4.375 | 02/01/32 | 250 | 217,867 | ||||||||||||
Iron/Steel 0.5% | ||||||||||||||||
Mineral Resources Ltd. (Australia), | ||||||||||||||||
Sr. Unsec’d. Notes, 144A | 9.250 | 10/01/28 | 500 | 523,426 | ||||||||||||
Leisure Time 1.5% | ||||||||||||||||
Carnival Corp., | ||||||||||||||||
Gtd. Notes, 144A | 6.000 | 05/01/29 | 450 | 449,114 | ||||||||||||
NCL Corp. Ltd., | ||||||||||||||||
Sr. Sec’d. Notes, 144A(v) | 8.125 | 01/15/29 | 650 | 683,312 | ||||||||||||
Viking Cruises Ltd., | ||||||||||||||||
Gtd. Notes, 144A | 5.875 | 09/15/27 | 525 | 520,406 | ||||||||||||
|
| |||||||||||||||
| 1,652,832 | ||||||||||||||||
Lodging 1.3% | ||||||||||||||||
MGM Resorts International, | ||||||||||||||||
Gtd. Notes(v) | 4.750 | 10/15/28 | 1,075 | 1,028,854 | ||||||||||||
Wynn Macau Ltd. (Macau), | ||||||||||||||||
Sr. Unsec’d. Notes, 144A(v) | 5.625 | 08/26/28 | 425 | 408,000 | ||||||||||||
|
| |||||||||||||||
| 1,436,854 | ||||||||||||||||
Machinery-Diversified 0.6% | ||||||||||||||||
Chart Industries, Inc., | ||||||||||||||||
Sr. Sec’d. Notes, 144A | 7.500 | 01/01/30 | 225 | 233,996 | ||||||||||||
Maxim Crane Works Holdings Capital LLC, | ||||||||||||||||
Sec’d. Notes, 144A | 11.500 | 09/01/28 | 400 | 423,036 | ||||||||||||
|
| |||||||||||||||
| 657,032 | ||||||||||||||||
Media 5.4% | ||||||||||||||||
CCO Holdings LLC/CCO Holdings Capital Corp., | ||||||||||||||||
Sr. Unsec’d. Notes, 144A(v) | 4.250 | 02/01/31 | 548 | 477,339 | ||||||||||||
DISH DBS Corp., | ||||||||||||||||
Gtd. Notes | 5.125 | 06/01/29 | 25 | 15,873 | ||||||||||||
See Notes to Financial Statements.
PGIM Credit Income Fund 17
Schedule of Investments (continued)
as of December 31, 2024
| Description | Interest Rate | Maturity Date | Principal Amount (000)# | Value | ||||||||||||||||
CORPORATE BONDS (Continued) | ||||||||||||||||||||
Media (cont’d.) | ||||||||||||||||||||
DISH DBS Corp., (cont’d.) | ||||||||||||||||||||
Gtd. Notes | 7.375% | 07/01/28 | 25 | $ | 17,842 | |||||||||||||||
Gtd. Notes | 7.750 | 07/01/26 | 125 | 105,056 | ||||||||||||||||
DISH Network Corp., | ||||||||||||||||||||
Sr. Sec’d. Notes, 144A | 11.750 | 11/15/27 | 1,525 | 1,612,917 | ||||||||||||||||
Globo Comunicacao e Participacoes SA (Brazil), | ||||||||||||||||||||
Sr. Unsec’d. Notes | 4.875 | 01/22/30 | 250 | 222,515 | ||||||||||||||||
Summer BidCo BV (Slovenia), | ||||||||||||||||||||
Sr. Unsec’d. Notes, 144A, Cash coupon 10.000% or PIK 10.750% | 10.000 | 02/15/29 | EUR | 434 | 456,392 | |||||||||||||||
Univision Communications, Inc., | ||||||||||||||||||||
Sr. Sec’d. Notes, 144A | 6.625 | 06/01/27 | 525 | 523,297 | ||||||||||||||||
Virgin Media Secured Finance PLC (United Kingdom), | ||||||||||||||||||||
Sr. Sec’d. Notes | 4.250 | 01/15/30 | GBP | 2,275 | 2,496,657 | |||||||||||||||
|
| |||||||||||||||||||
| 5,927,888 | ||||||||||||||||||||
Mining 1.7% | ||||||||||||||||||||
First Quantum Minerals Ltd. (Zambia), | ||||||||||||||||||||
Gtd. Notes, 144A | 6.875 | 10/15/27 | 200 | 198,938 | ||||||||||||||||
Hudbay Minerals, Inc. (Canada), | ||||||||||||||||||||
Gtd. Notes, 144A(v) | 6.125 | 04/01/29 | 1,050 | 1,048,688 | ||||||||||||||||
New Gold, Inc. (Canada), | ||||||||||||||||||||
Gtd. Notes, 144A(v) | 7.500 | 07/15/27 | 675 | 677,531 | ||||||||||||||||
|
| |||||||||||||||||||
| 1,925,157 | ||||||||||||||||||||
Oil & Gas 4.9% | ||||||||||||||||||||
Ascent Resources Utica Holdings LLC/ARU Finance Corp., | ||||||||||||||||||||
Gtd. Notes, 144A | 9.000 | 11/01/27 | 75 | 90,598 | ||||||||||||||||
Ecopetrol SA (Colombia), | ||||||||||||||||||||
Sr. Unsec’d. Notes | 7.750 | 02/01/32 | 380 | 369,170 | ||||||||||||||||
Sr. Unsec’d. Notes(v) | 8.875 | 01/13/33 | 350 | 355,323 | ||||||||||||||||
Energean Israel Finance Ltd. (Israel), | ||||||||||||||||||||
Sr. Sec’d. Notes, 144A | 5.375 | 03/30/28 | 85 | 79,002 | ||||||||||||||||
Expand Energy Corp., | ||||||||||||||||||||
Gtd. Notes(v) | 4.750 | 02/01/32 | 850 | 789,571 | ||||||||||||||||
Hilcorp Energy I LP/Hilcorp Finance Co., | ||||||||||||||||||||
Sr. Unsec’d. Notes, 144A(v) | 8.375 | 11/01/33 | 975 | 995,512 | ||||||||||||||||
See Notes to Financial Statements.
18
| Description | Interest Rate | Maturity Date | Principal (000)# | Value | ||||||||||||||||
CORPORATE BONDS (Continued) | ||||||||||||||||||||
Oil & Gas (cont’d.) | ||||||||||||||||||||
New Generation Gas Gathering LLC, | ||||||||||||||||||||
Sr. Sec’d. Notes, 144A, 3 Month SOFR + 5.750% (Cap N/A, Floor 2.000%)^ | 10.335%(c) | 09/30/29 | 230 | $ | 226,284 | |||||||||||||||
Petroleos Mexicanos (Mexico), | ||||||||||||||||||||
Gtd. Notes, MTN | 8.750 | 06/02/29 | 300 | 300,188 | ||||||||||||||||
Preem Holdings AB (Sweden), | ||||||||||||||||||||
Sr. Unsec’d. Notes | 12.000 | 06/30/27 | EUR | 1,536 | 1,684,541 | |||||||||||||||
Wintershall Dea Finance 2 BV (Germany), | ||||||||||||||||||||
Gtd. Notes, Series NC8 | 3.000(ff) | 07/20/28(oo) | EUR | 600 | 577,920 | |||||||||||||||
|
| |||||||||||||||||||
| 5,468,109 | ||||||||||||||||||||
Packaging & Containers 0.2% | ||||||||||||||||||||
Pactiv Evergreen Group Issuer, Inc./Pactiv Evergreen Group Issuer LLC, | ||||||||||||||||||||
Sr. Sec’d. Notes, 144A | 4.000 | 10/15/27 | 225 | 223,368 | ||||||||||||||||
Pharmaceuticals 1.3% | ||||||||||||||||||||
AdaptHealth LLC, | ||||||||||||||||||||
Gtd. Notes, 144A(v) | 6.125 | 08/01/28 | 850 | 833,055 | ||||||||||||||||
Grifols SA (Spain), | ||||||||||||||||||||
Sr. Sec’d. Notes, 144A | 7.125 | 05/01/30 | EUR | 580 | 617,495 | |||||||||||||||
|
| |||||||||||||||||||
| 1,450,550 | ||||||||||||||||||||
Pipelines 0.2% | ||||||||||||||||||||
Venture Global LNG, Inc., | ||||||||||||||||||||
Jr. Sub. Notes, 144A | 9.000(ff) | 09/30/29(oo) | 260 | 271,898 | ||||||||||||||||
Real Estate 0.5% | ||||||||||||||||||||
Howard Hughes Corp. (The), | ||||||||||||||||||||
Gtd. Notes, 144A(v) | 4.125 | 02/01/29 | 575 | 530,604 | ||||||||||||||||
Real Estate Investment Trusts (REITs) 0.5% | ||||||||||||||||||||
MPT Operating Partnership LP/MPT Finance Corp., | ||||||||||||||||||||
Gtd. Notes | 3.500 | 03/15/31 | 225 | 142,778 | ||||||||||||||||
Gtd. Notes | 5.000 | 10/15/27 | 100 | 84,515 | ||||||||||||||||
See Notes to Financial Statements.
PGIM Credit Income Fund 19
Schedule of Investments (continued)
as of December 31, 2024
| Description | Interest Rate | Maturity Date | Principal (000)# | Value | ||||||||||||||||
CORPORATE BONDS (Continued) | ||||||||||||||||||||
Real Estate Investment Trusts (REITs) (cont’d.) | ||||||||||||||||||||
RHP Hotel Properties LP/RHP Finance Corp., | ||||||||||||||||||||
Gtd. Notes, 144A | 6.500% | 04/01/32 | 190 | $ | 190,889 | |||||||||||||||
Uniti Group LP/Uniti Group Finance 2019, Inc./CSL Capital LLC, | ||||||||||||||||||||
Sr. Sec’d. Notes, 144A | 10.500 | 02/15/28 | 150 | 159,894 | ||||||||||||||||
|
| |||||||||||||||||||
| 578,076 | ||||||||||||||||||||
Retail 3.9% | ||||||||||||||||||||
Brinker International, Inc., | ||||||||||||||||||||
Gtd. Notes, 144A(v) | 8.250 | 07/15/30 | 975 | 1,029,379 | ||||||||||||||||
Carvana Co., | ||||||||||||||||||||
Sr. Sec’d. Notes, 144A, Cash coupon 9.000% or PIK 12.000% | 9.000 | 12/01/28 | 86 | 91,746 | ||||||||||||||||
Sr. Sec’d. Notes, 144A, Cash coupon 11.000% or PIK 13.000% | 13.000 | 06/01/30 | 275 | 302,864 | ||||||||||||||||
Constellation Automotive Financing PLC (United Kingdom), | ||||||||||||||||||||
Sr. Sec’d. Notes | 4.875 | 07/15/27 | GBP | 250 | 296,224 | |||||||||||||||
eG Global Finance PLC (United Kingdom), | ||||||||||||||||||||
Sr. Sec’d. Notes | 11.000 | 11/30/28 | EUR | 1,085 | 1,259,653 | |||||||||||||||
Sr. Sec’d. Notes, 144A | 11.000 | 11/30/28 | EUR | 625 | 725,613 | |||||||||||||||
Fertitta Entertainment LLC/Fertitta Entertainment Finance Co., Inc., | ||||||||||||||||||||
Sr. Sec’d. Notes, 144A(v) | 4.625 | 01/15/29 | 625 | 578,531 | ||||||||||||||||
Sally Holdings LLC/Sally Capital, Inc., | ||||||||||||||||||||
Gtd. Notes | 6.750 | 03/01/32 | 25 | 25,049 | ||||||||||||||||
|
| |||||||||||||||||||
| 4,309,059 | ||||||||||||||||||||
Telecommunications 3.3% | ||||||||||||||||||||
Colombia Telecomunicaciones SA ESP (Colombia), | ||||||||||||||||||||
Sr. Unsec’d. Notes | 4.950 | 07/17/30 | 250 | 207,250 | ||||||||||||||||
Eutelsat SA (France), | ||||||||||||||||||||
Sr. Unsec’d. Notes, 144A | 9.750 | 04/13/29 | EUR | 500 | 487,479 | |||||||||||||||
Frontier Communications Holdings LLC, | ||||||||||||||||||||
Sec’d. Notes, 144A | 6.750 | 05/01/29 | 200 | 200,949 | ||||||||||||||||
Level 3 Financing, Inc., | ||||||||||||||||||||
Sr. Sec’d. Notes, 144A(v) | 10.500 | 05/15/30 | 525 | 571,598 | ||||||||||||||||
Sr. Sec’d. Notes, 144A(v) | 11.000 | 11/15/29 | 1,100 | 1,238,195 | ||||||||||||||||
Lorca Telecom Bondco SA (Spain), | ||||||||||||||||||||
Sr. Sec’d. Notes, 144A | 5.750 | 04/30/29 | EUR | 100 | 108,825 | |||||||||||||||
See Notes to Financial Statements.
20
| Description | Interest Rate | Maturity Date | Principal (000)# | Value | ||||||||||||
CORPORATE BONDS (Continued) | ||||||||||||||||
Telecommunications (cont’d.) | ||||||||||||||||
TalkTalk Telecom Group Ltd. (United Kingdom), | ||||||||||||||||
Gtd. Notes, 144A | 8.250% | 09/01/27 | GBP 646 | $ | 677,360 | |||||||||||
Gtd. Notes, 144A | 11.750 | 03/01/28 | GBP 382 | 135,687 | ||||||||||||
Windstream Services LLC/Windstream Escrow Finance Corp., | ||||||||||||||||
Sr. Sec’d. Notes, 144A | 8.250 | 10/01/31 | 70 | 72,288 | ||||||||||||
|
| |||||||||||||||
| 3,699,631 | ||||||||||||||||
Transportation 2.5% | ||||||||||||||||
GN Bondco LLC, | ||||||||||||||||
Sr. Sec’d. Notes, 144A(v) | 9.500 | 10/15/31 | 1,450 | 1,523,628 | ||||||||||||
XPO, Inc., | ||||||||||||||||
Gtd. Notes, 144A(v) | 7.125 | 02/01/32 | 1,225 | 1,254,271 | ||||||||||||
|
| |||||||||||||||
| 2,777,899 | ||||||||||||||||
|
| |||||||||||||||
TOTAL CORPORATE BONDS | 61,798,345 | |||||||||||||||
|
| |||||||||||||||
FLOATING RATE AND OTHER LOANS 27.3% | ||||||||||||||||
Aerospace & Defense 0.2% | ||||||||||||||||
Azorra Soar TLB Finance Limited (Cayman Islands), | ||||||||||||||||
Initial Term Loan, 3 Month SOFR + 3.500%^ | 7.859(c) | 10/18/29 | 249 | 247,505 | ||||||||||||
Agriculture 0.3% | ||||||||||||||||
Alltech, Inc., | ||||||||||||||||
Term B Loan, 1 Month SOFR + 4.114% | 8.471(c) | 10/13/28 | 274 | 275,407 | ||||||||||||
Auto Parts & Equipment 1.0% | ||||||||||||||||
First Brands Group LLC, | ||||||||||||||||
2022-Ii Incremental Term Loan, 3 Month SOFR + 5.262% | 9.847(c) | 03/30/27 | 207 | 193,515 | ||||||||||||
Second Lien 2021 Term Loan, 3 Month SOFR + 8.762% | 13.347(c) | 03/30/28 | 500 | 450,000 | ||||||||||||
Tenneco, Inc., | ||||||||||||||||
Term A Loan, 3 Month SOFR + 4.850% | 9.371(c) | 11/17/28 | 198 | 191,144 | ||||||||||||
Term B Loan, 3 Month SOFR + 5.100% | 9.525(c) | 11/17/28 | 250 | 242,031 | ||||||||||||
|
| |||||||||||||||
| 1,076,690 | ||||||||||||||||
See Notes to Financial Statements.
PGIM Credit Income Fund 21
Schedule of Investments (continued)
as of December 31, 2024
| Description | Interest Rate | Maturity Date | Principal (000)# | Value | ||||||||||||
FLOATING RATE AND OTHER LOANS (Continued) | ||||||||||||||||
Beverages 0.2% | ||||||||||||||||
Pegasus Bidco BV (Netherlands), | ||||||||||||||||
2024-2 Dollar Term Loan, 3 Month SOFR + 3.250% | 7.774%(c) | 07/12/29 | 193 | $ | 193,049 | |||||||||||
Building Materials 0.6% | ||||||||||||||||
Emerald Debt Merger Sub LLC, | ||||||||||||||||
Second Amendment Incremental Term Loan, 3 Month SOFR + 2.500% | 6.829(c) | 08/04/31 | 474 | 475,293 | ||||||||||||
Vector WP HoldCo, Inc., | ||||||||||||||||
Initial Term B Loan, 1 Month SOFR + 5.114% | 9.471(c) | 10/12/28 | 198 | 196,729 | ||||||||||||
|
| |||||||||||||||
| 672,022 | ||||||||||||||||
Chemicals 1.3% | ||||||||||||||||
A-Ap Buyer, Inc., | ||||||||||||||||
Initial Term Loan, 1 Month SOFR + 3.250% | 7.607(c) | 09/09/31 | 175 | 176,021 | ||||||||||||
Consolidated Energy Finance SA (Switzerland), | ||||||||||||||||
2024 Incremental Term Loan, 3 Month SOFR + 4.500% | 9.014(c) | 11/15/30 | 273 | 264,749 | ||||||||||||
Geon Performance Solutions LLC, | ||||||||||||||||
2024 Refinancing Term Loan, 3 Month SOFR + 4.512% | 8.840(c) | 08/18/28 | 347 | 346,600 | ||||||||||||
Iris Holdings Ltd., | ||||||||||||||||
Initial Term Loan, 3 Month SOFR + 4.850% | 9.435(c) | 06/28/28 | 212 | 204,021 | ||||||||||||
LSF11 A5 HoldCo, LLC, | ||||||||||||||||
2024 Refinancing Term Loan, 1 Month SOFR + 3.614% | 7.971(c) | 10/15/28 | 197 | 198,338 | ||||||||||||
Nouryon Finance BV (Netherlands), | ||||||||||||||||
November 2024 B-1 Dollar Term Loan, 3 Month SOFR + 3.250% | 7.657(c) | 04/03/28 | 191 | 192,082 | ||||||||||||
Paint Intermediate III LLC, | ||||||||||||||||
Paint Intermediate/Wesco Group Cov-Lite Term B Loan, 3 Month SOFR + 3.000% | 7.522(c) | 09/11/31 | 100 | 100,438 | ||||||||||||
|
| |||||||||||||||
| 1,482,249 | ||||||||||||||||
Commercial Services 2.2% | ||||||||||||||||
Belron Finance US LLC, | ||||||||||||||||
2031 Dollar Incremental Term Loan, 3 Month SOFR + 2.750% | 7.273(c) | 10/01/31 | 324 | 326,889 | ||||||||||||
Catawba Nation Gaming Authority, | ||||||||||||||||
Term B Loan, 1 Month SOFR + 4.750% | 9.125(c) | 02/28/32 | 150 | 150,282 | ||||||||||||
See Notes to Financial Statements.
22
| Description | Interest Rate | Maturity Date | Principal (000)# | Value | ||||||||||||
FLOATING RATE AND OTHER LOANS (Continued) | ||||||||||||||||
Commercial Services (cont’d.) | ||||||||||||||||
CoreLogic, Inc., | ||||||||||||||||
First Lien Initial Term Loan, 1 Month SOFR + 3.614% | 7.971%(c) | 06/02/28 | 266 | $ | 262,690 | |||||||||||
Crisis Prevention Institute, Inc., | ||||||||||||||||
2024 Term Loan, 1 Month SOFR + 4.000% | 8.428(c) | 04/09/31 | 200 | 200,000 | ||||||||||||
DS Parent, Inc., | ||||||||||||||||
Term B Loan, 3 Month SOFR + 5.500% | 9.829(c) | 01/31/31 | 149 | 141,539 | ||||||||||||
Grant Thornton LLP, | ||||||||||||||||
Initial Term Loan, 1 Month SOFR + 3.250% | 7.607(c) | 06/02/31 | 150 | 149,500 | ||||||||||||
Jupiter Buyer, Inc., | ||||||||||||||||
Initial Term Loan, 1 Month SOFR + 4.750% | 9.303(c) | 10/10/31 | 202 | 202,796 | ||||||||||||
MavisTire Express Services Topco Corp., | ||||||||||||||||
Term Loan, 1 Month SOFR + 3.500% | 7.857(c) | 05/04/28 | 50 | 50,040 | ||||||||||||
Neon Maple Purchaser, Inc., | ||||||||||||||||
Tranche B-1 Term Loan, 1 Month SOFR + 3.000% | 7.444(c) | 11/17/31 | 625 | 625,391 | ||||||||||||
TruGreen LP, | ||||||||||||||||
Second Refinancing Term Loan (First Lien), 1 Month SOFR + 4.100% | 8.457(c) | 11/02/27 | 202 | 196,631 | ||||||||||||
Verde Purchaser, LLC, | ||||||||||||||||
Initial Term Loan, 1 Month SOFR + 4.500% | 9.104(c) | 11/30/30 | 150 | 149,858 | ||||||||||||
|
| |||||||||||||||
| 2,455,616 | ||||||||||||||||
Computers 2.0% | ||||||||||||||||
Fortress Intermediate, | ||||||||||||||||
Initial Term Loan, 1 Month SOFR + 3.500% | 7.857(c) | 06/27/31 | 479 | 480,296 | ||||||||||||
Indy US Bidco, LLC, | ||||||||||||||||
Ninth Amend Dollar Term Loan, 1 Month SOFR + 4.750% | 9.107(c) | 03/06/28 | 207 | 206,301 | ||||||||||||
McAfee Corp., | ||||||||||||||||
Tranche B-1 Term Loan, 1 Month SOFR + 3.250% | 7.803(c) | 03/01/29 | 482 | 482,474 | ||||||||||||
NCR Atleos Corp., | ||||||||||||||||
Term B Loan, 3 Month SOFR + 3.750% | 8.397(c) | 04/16/29 | 143 | 142,979 | ||||||||||||
Peraton Corp., | ||||||||||||||||
First Lien Term B Loan, 1 Month SOFR + 3.850% | 8.207(c) | 02/01/28 | 247 | 229,198 | ||||||||||||
Sandisk Corporation, | ||||||||||||||||
Term B Loan | — (p) | 03/31/32 | 450 | 443,250 | ||||||||||||
Synechron, Inc., | ||||||||||||||||
Initial Term Loan, 1 Month SOFR + 3.750%^ | 8.107(c) | 09/26/31 | 250 | 250,000 | ||||||||||||
|
| |||||||||||||||
| 2,234,498 | ||||||||||||||||
See Notes to Financial Statements.
PGIM Credit Income Fund 23
Schedule of Investments (continued)
as of December 31, 2024
| Description | Interest Rate | Maturity Date | Principal (000)# | Value | ||||||||||||
FLOATING RATE AND OTHER LOANS (Continued) | ||||||||||||||||
Diversified Financial Services 1.5% | ||||||||||||||||
Blackhawk Network Holdings, Inc., | ||||||||||||||||
Term B Loan, 1 Month SOFR + 5.000% | 9.357%(c) | 03/12/29 | 249 | $ | 251,548 | |||||||||||
CPI Holdco B, LLC, | ||||||||||||||||
Incremental Term B Loan | — (p) | 05/19/31 | 275 | 274,484 | ||||||||||||
Hudson River Trading LLC, | ||||||||||||||||
Term B-1 Loan, 1 Month SOFR + 3.000% | 7.483(c) | 03/18/30 | 771 | 772,944 | ||||||||||||
Jefferies Finance LLC, | ||||||||||||||||
Initial Term Loan 2024, 1 Month SOFR + 3.000% | 7.356(c) | 10/21/31 | 300 | 300,938 | ||||||||||||
|
| |||||||||||||||
| 1,599,914 | ||||||||||||||||
Education 0.2% | ||||||||||||||||
Dukes Education Group Ltd. (United Kingdom), | ||||||||||||||||
Accordion Facility, SONIA + 5.500%^ | 10.703(c) | 11/27/28 | GBP 68 | 84,580 | ||||||||||||
Acquisition/Capex Facility 1, SONIA + 5.500%^ | 10.350(c) | 11/27/28 | GBP 61 | 76,257 | ||||||||||||
Acquisition/Capex Facility 5, 6 Month EURIBOR + 6.500%^ | 6.693(c) | 11/27/28 | EUR 3 | 4,269 | ||||||||||||
Facility B, SONIA + 5.500%^ | 10.209(c) | 11/27/28 | GBP 25 | 31,520 | ||||||||||||
Term Loan, 6 Month EURIBOR + 5.500%^ | 8.587(c) | 11/27/28 | EUR 34 | 35,661 | ||||||||||||
Term Loan, 6 Month EURIBOR + 5.500%^ | 8.775(c) | 11/27/28 | EUR 18 | 18,826 | ||||||||||||
|
| |||||||||||||||
| 251,113 | ||||||||||||||||
Electric 0.2% | ||||||||||||||||
Discovery Energy Holding Corp., | ||||||||||||||||
Initial Dollar Term Loan, 1 Month SOFR + 3.750% | 8.107(c) | 05/01/31 | 252 | 251,414 | ||||||||||||
Electronics 0.4% | ||||||||||||||||
Indicor, | ||||||||||||||||
Tranche D Dollar Term Loan, 3 Month SOFR + 2.750% | 7.079(c) | 11/22/29 | 198 | 198,706 | ||||||||||||
Ingram Micro, Inc., | ||||||||||||||||
2024 Term B Loan, 3 Month SOFR + 2.750% | 7.077(c) | 09/22/31 | 240 | 240,615 | ||||||||||||
|
| |||||||||||||||
| 439,321 | ||||||||||||||||
See Notes to Financial Statements.
24
| Description | Interest Rate | Maturity Date | Principal (000)# | Value | ||||||||||||
FLOATING RATE AND OTHER LOANS (Continued) | ||||||||||||||||
Engineering & Construction 0.3% | ||||||||||||||||
Azuria Water Solutions, Inc., | ||||||||||||||||
2024 Second Additional Replacement Term Loan, 1 Month SOFR + 3.750% | 8.107%(c) | 05/17/28 | 248 | $ | 248,868 | |||||||||||
Brown Group Holding LLC, | ||||||||||||||||
Initial Term Loan, 1 Month SOFR + 2.500% | 6.857(c) | 07/01/31 | 99 | 99,807 | ||||||||||||
|
| |||||||||||||||
| 348,675 | ||||||||||||||||
Entertainment 1.1% | ||||||||||||||||
AP Gaming I LLC, | ||||||||||||||||
Term B Loan, 1 Month SOFR + 3.750% | 8.107(c) | 02/15/29 | 148 | 149,471 | ||||||||||||
Caesars Entertainment, Inc., | ||||||||||||||||
Incremental Term B-1 Loan, 1 Month SOFR + 2.250% | 6.607(c) | 02/06/31 | 347 | 348,330 | ||||||||||||
Cinemark USA, Inc., | ||||||||||||||||
Term B Loan, 3 Month SOFR + 2.750% | 7.100(c) | 05/24/30 | 248 | 248,493 | ||||||||||||
ECL Entertainment LLC, | ||||||||||||||||
Term B Loan, 1 Month SOFR + 3.528% | 7.857(c) | 08/31/30 | 75 | 74,998 | ||||||||||||
Entain PLC (United Kingdom), | ||||||||||||||||
Facility B3, 3 Month SOFR + 2.750% | 7.079(c) | 10/31/29 | 348 | 348,903 | ||||||||||||
|
| |||||||||||||||
| 1,170,195 | ||||||||||||||||
Environmental Control 0.8% | ||||||||||||||||
Action Environmental Group, Inc. (The), | ||||||||||||||||
2024 Term B Loan 4th Amendment, 3 Month SOFR + 3.750%^ | 8.079(c) | 10/24/30 | 414 | 416,515 | ||||||||||||
Term Loan, 1 Month SOFR + 4.000%^ | 2.471(c) | 10/24/30 | 6 | 5,668 | ||||||||||||
JFL-Tiger Acquisition Co., Inc., | ||||||||||||||||
Initial Term Loan, 3 Month SOFR + 4.000% | 8.337(c) | 10/17/30 | 75 | 75,208 | ||||||||||||
Madison Iaq LLC, | ||||||||||||||||
Initial Term Loan, 6 Month SOFR + 2.750% | 7.889(c) | 06/21/28 | 197 | 198,148 | ||||||||||||
Tidal Waste & Recycling Holdings LLC, | ||||||||||||||||
Term B Loan, 3 Month SOFR + 3.500% | 7.829(c) | 10/03/31 | 200 | 201,126 | ||||||||||||
|
| |||||||||||||||
| 896,665 | ||||||||||||||||
Forest Products & Paper 0.1% | ||||||||||||||||
Magnera Corp., | ||||||||||||||||
New Term Loan, 3 Month SOFR + 4.250% | 8.764(c) | 10/31/31 | 150 | 150,187 | ||||||||||||
See Notes to Financial Statements.
PGIM Credit Income Fund 25
Schedule of Investments (continued)
as of December 31, 2024
| Description | Interest Rate | Maturity Date | Principal (000)# | Value | ||||||||||||
FLOATING RATE AND OTHER LOANS (Continued) | ||||||||||||||||
Hand/Machine Tools 0.5% | ||||||||||||||||
Alliance Laundry Systems LLC, | ||||||||||||||||
Initial Term B Loan, 1 Month SOFR + 3.500% | 7.837%(c) | 08/19/31 | 350 | $ | 351,914 | |||||||||||
Madison Safety & Flow LLC, | ||||||||||||||||
Initial Term Loan, 1 Month SOFR + 3.250% | 7.607(c) | 09/26/31 | 150 | 150,607 | ||||||||||||
|
| |||||||||||||||
| 502,521 | ||||||||||||||||
Healthcare-Services 0.5% | ||||||||||||||||
LifePoint Health, Inc., | ||||||||||||||||
Term B Loan, 3 Month SOFR + 3.750% | 8.406(c) | 05/16/31 | 249 | 250,061 | ||||||||||||
Phoenix Guarantor Inc, | ||||||||||||||||
Tranche B5 Term Loan, 1 Month SOFR + 2.500% | 6.857(c) | 02/21/31 | 248 | 248,709 | ||||||||||||
|
| |||||||||||||||
| 498,770 | ||||||||||||||||
Holding Companies-Diversified 0.5% | ||||||||||||||||
Belfor Holdings, Inc., | ||||||||||||||||
Initial Tranche B-1 Term Loan, 1 Month SOFR + 3.750%^ | 8.107(c) | 11/01/30 | 256 | 258,800 | ||||||||||||
Clue OpCo LLC, | ||||||||||||||||
Term B Loan, 3 Month SOFR + 4.500% | 9.085(c) | 12/19/30 | 314 | 315,476 | ||||||||||||
|
| |||||||||||||||
| 574,276 | ||||||||||||||||
Home Furnishings 0.2% | ||||||||||||||||
TGP Holdings III LLC, | ||||||||||||||||
First Lien Closing Date Term Loan, PRIME + 3.350% | 7.707(c) | 06/29/28 | 250 | 242,818 | ||||||||||||
Household Products/Wares 0.2% | ||||||||||||||||
Kronos Acquisition Holdings, Inc. (Canada), | ||||||||||||||||
2024 Initial Loan, 3 Month SOFR + 4.000% | 8.584(c) | 07/08/31 | 198 | 186,165 | ||||||||||||
Insurance 0.7% | ||||||||||||||||
Acrisure LLC, | ||||||||||||||||
2024 Repricing Term B-6 Loan, 1 Month SOFR + 3.000% | 7.357(c) | 11/06/30 | 273 | 272,777 | ||||||||||||
Assured Partners, Inc., | ||||||||||||||||
2024 Term Loan, 1 Month SOFR + 3.500% | 7.857(c) | 02/14/31 | 267 | 267,068 | ||||||||||||
Asurion LLC, | ||||||||||||||||
New B-11 Term Loan, 1 Month SOFR + 4.350% | 8.707(c) | 08/21/28 | 197 | 197,549 | ||||||||||||
|
| |||||||||||||||
| 737,394 | ||||||||||||||||
See Notes to Financial Statements.
26
| Description | Interest Rate | Maturity Date | Principal (000)# | Value | ||||||||||||
FLOATING RATE AND OTHER LOANS (Continued) | ||||||||||||||||
Internet 0.2% | ||||||||||||||||
MH Sub I LLC, | ||||||||||||||||
2023 May New Term Loan, 1 Month SOFR + 4.250% | 8.823%(c) | 05/03/28 | 262 | $ | 262,453 | |||||||||||
Investment Companies 1.5% | ||||||||||||||||
AAL Delaware Holdco, Inc., | ||||||||||||||||
Initial Term Loan, 1 Month SOFR + 3.500% | 7.857(c) | 07/30/31 | 100 | 100,374 | ||||||||||||
Hurricane CleanCo Ltd. (United Kingdom), | ||||||||||||||||
Facility A, 3 Month LIBOR + 6.250% (Cap N/A, Floor 0.000%)^ | 6.250(c) | 10/31/29 | 1,260 | 1,577,375 | ||||||||||||
|
| |||||||||||||||
| 1,677,749 | ||||||||||||||||
Leisure Time 0.6% | ||||||||||||||||
International Park Holdings BV (Netherlands), | ||||||||||||||||
Term Loan^ | — (p) | 12/31/31 | 500 | 507,566 | ||||||||||||
Recess Holdings, Inc., | ||||||||||||||||
Initial Term Loan, 3 Month SOFR + 4.500% | 9.085(c) | 02/21/30 | 149 | 150,240 | ||||||||||||
|
| |||||||||||||||
| 657,806 | ||||||||||||||||
Lodging 0.2% | ||||||||||||||||
Travel Leisure Co, | ||||||||||||||||
Term B Loan, 3 Month SOFR + 2.500% | 6.927(c) | 12/14/29 | 200 | 200,500 | ||||||||||||
Machinery-Diversified 0.9% | ||||||||||||||||
Hyster-Yale Group, Inc., | ||||||||||||||||
Term B Loan Facility, 1 Month SOFR + 3.614% | 7.971(c) | 05/26/28 | 346 | 345,977 | ||||||||||||
Innio Group Holding GmbH., | ||||||||||||||||
Amended Facility B (USD), 3 Month SOFR + 3.250% | 7.897(c) | 11/02/28 | 124 | 124,528 | ||||||||||||
TK Elevator US Newco, Inc. (Germany), | ||||||||||||||||
Facility B2 (USD), 6 Month SOFR + 3.500% | 8.588(c) | 04/30/30 | 519 | 522,462 | ||||||||||||
|
| |||||||||||||||
| 992,967 | ||||||||||||||||
Media 1.0% | ||||||||||||||||
Altice Financing SA (Luxembourg), | ||||||||||||||||
2022 Dollar Loan, 3 Month SOFR + 5.000% | 9.656(c) | 10/31/27 | 248 | 210,063 | ||||||||||||
CSC Holdings LLC, | ||||||||||||||||
2022 Refinancing Term Loan, 1 Month SOFR + 4.500% | 8.897(c) | 01/18/28 | 247 | 241,758 | ||||||||||||
See Notes to Financial Statements.
PGIM Credit Income Fund 27
Schedule of Investments (continued)
as of December 31, 2024
| Description | Interest Rate | Maturity Date | Principal (000)# | Value | ||||||||||||
FLOATING RATE AND OTHER LOANS (Continued) | ||||||||||||||||
Media (cont’d.) | ||||||||||||||||
Univision Communications, Inc., | ||||||||||||||||
2022 Incremental First-Lien Term Loan, 3 Month SOFR + 4.250% | 8.579%(c) | 06/24/29 | 193 | $ | 193,094 | |||||||||||
2024 Replacement First-Lien Term Loan, 1 Month SOFR + 3.614% | 7.972(c) | 01/31/29 | 398 | 398,746 | ||||||||||||
|
| |||||||||||||||
| 1,043,661 | ||||||||||||||||
Metal Fabricate/Hardware 1.0% | ||||||||||||||||
Crosby US Acquisition Corp, | ||||||||||||||||
Amendment No. 4 Replacement Term Loan, 1 Month SOFR + 3.500% | 7.857(c) | 08/16/29 | 297 | 299,553 | ||||||||||||
Doncasters US Finance LLC (United Kingdom), | ||||||||||||||||
Initial Term Loan, 3 Month SOFR + 6.500%^ | 10.829(c) | 04/23/30 | 268 | 265,295 | ||||||||||||
Grinding Media, Inc., | ||||||||||||||||
2024 Term B Loan, 3 Month SOFR + 3.500% | 8.021(c) | 10/12/28 | 299 | 299,998 | ||||||||||||
Trulite Glass & Aluminum Solutions LLC, | ||||||||||||||||
Initial Term Loan, 3 Month SOFR + 6.000%^ | 10.604(c) | 03/01/30 | 221 | 220,230 | ||||||||||||
|
| |||||||||||||||
| 1,085,076 | ||||||||||||||||
Mining 0.2% | ||||||||||||||||
Arsenal Aic Parent LLC, | ||||||||||||||||
2024 Term B Loan, 1 Month SOFR + 3.250% | 7.607(c) | 08/18/30 | 267 | 268,742 | ||||||||||||
Miscellaneous Manufacturing 0.2% | ||||||||||||||||
AMG Advanced Metallurgical Group NV (Netherlands), | ||||||||||||||||
2021 Term Loan, 1 Month SOFR + 3.614% | 7.971(c) | 11/30/28 | 248 | 247,307 | ||||||||||||
Oil & Gas 0.2% | ||||||||||||||||
Apro LLC, | ||||||||||||||||
Initial Term Loan, 3 Month SOFR + 3.750% | 8.272(c) | 07/09/31 | 200 | 201,079 | ||||||||||||
Oil & Gas Services 0.1% | ||||||||||||||||
MRC Global (US) Inc., | ||||||||||||||||
Term Loan, 6 Month SOFR + 3.500%^ | 7.931(c) | 10/24/31 | 100 | 100,000 | ||||||||||||
Packaging & Containers 0.4% | ||||||||||||||||
Closure Systems International Group, | ||||||||||||||||
Amendment No. 5 Term Loan, 1 Month SOFR + 3.500% | 7.857(c) | 03/22/29 | 75 | 75,325 | ||||||||||||
See Notes to Financial Statements.
28
| Description | Interest Rate | Maturity Date | Principal (000)# | Value | ||||||||||||
FLOATING RATE AND OTHER LOANS (Continued) | ||||||||||||||||
Packaging & Containers (cont’d.) | ||||||||||||||||
Mauser Packaging Solutions Holding Company, | ||||||||||||||||
Initial Term Loan, 3 Month SOFR + 3.000% | 7.589%(c) | 04/15/27 | 193 | $ | 194,054 | |||||||||||
Trident TPI Holdings, Inc., | ||||||||||||||||
Tranche B-7 Term Loan, 6 Month SOFR + 3.750% | 8.188(c) | 09/15/28 | 198 | 199,928 | ||||||||||||
|
| |||||||||||||||
| 469,307 | ||||||||||||||||
Pharmaceuticals 0.4% | ||||||||||||||||
Gainwell Acquisition Corp., | ||||||||||||||||
Term B Loan, 3 Month SOFR + 4.100% | 8.429(c) | 10/01/27 | 252 | 243,227 | ||||||||||||
Sharp Services LLC, | ||||||||||||||||
Tranche D Term Loan, 3 Month SOFR + 3.250% | 7.579(c) | 12/31/28 | 193 | 193,520 | ||||||||||||
|
| |||||||||||||||
| 436,747 | ||||||||||||||||
Pipelines 0.3% | ||||||||||||||||
CPPIB OVM Member U.S. LLC, | ||||||||||||||||
Initial Term Loan, 3 Month SOFR + 3.250% | 7.579(c) | 08/20/31 | 150 | 150,560 | ||||||||||||
Rockpoint Gas Storage Partners LP (Canada), | ||||||||||||||||
Initial Term Loan, 3 Month SOFR + 3.500% | 7.985(c) | 09/12/31 | 206 | 207,333 | ||||||||||||
|
| |||||||||||||||
| 357,893 | ||||||||||||||||
Real Estate Investment Trusts (REITs) 0.6% | ||||||||||||||||
Blackstone Mortgage Trust, Inc., | ||||||||||||||||
Term B-4 Loan, 1 Month SOFR + 3.500% | 7.845(c) | 05/09/29 | 360 | 360,830 | ||||||||||||
Starwood Property Mortgage LLC, | ||||||||||||||||
Term B-3 Loan, 1 Month SOFR + 3.350%^ | 7.707(c) | 07/24/26 | 247 | 247,120 | ||||||||||||
|
| |||||||||||||||
| 607,950 | ||||||||||||||||
Retail 1.3% | ||||||||||||||||
Dave & Buster’s, Inc., | ||||||||||||||||
2024 Incremental Term B Loan, 1 Month SOFR + 3.260% | 7.813(c) | 11/01/31 | 400 | 391,500 | ||||||||||||
Great Outdoors Group LLC, | ||||||||||||||||
Term B-2 Loan, 1 Month SOFR + 3.864% | 8.221(c) | 03/06/28 | 177 | 177,906 | ||||||||||||
Harbor Freight Tools USA, Inc., | ||||||||||||||||
Initial Term Loan, 1 Month SOFR + 2.500% | 7.049(c) | 06/11/31 | 499 | 491,394 | ||||||||||||
See Notes to Financial Statements.
PGIM Credit Income Fund 29
Schedule of Investments (continued)
as of December 31, 2024
| Description | Interest Rate | Maturity Date | Principal (000)# | Value | ||||||||||||
FLOATING RATE AND OTHER LOANS (Continued) | ||||||||||||||||
Retail (cont’d.) | ||||||||||||||||
Johnstone Supply LLC, | ||||||||||||||||
Term B Loan, 1 Month SOFR + 2.500% | 6.875%(c) | 06/09/31 | 125 | $ | 124,973 | |||||||||||
White Cap Buyer LLC, | ||||||||||||||||
Tranche C Term Loan, 1 Month SOFR + 3.250% | 7.607(c) | 10/19/29 | 300 | 300,031 | ||||||||||||
|
| |||||||||||||||
| 1,485,804 | ||||||||||||||||
Shipbuilding 0.2% | ||||||||||||||||
LSF11 Trinity Bidco, Inc., | ||||||||||||||||
Term B Loan, 1 Month SOFR + 3.000% | 7.370(c) | 06/14/30 | 248 | 248,361 | ||||||||||||
Software 2.1% | ||||||||||||||||
athenahealth, Inc., | ||||||||||||||||
Initial Term Loan, 1 Month SOFR + 3.250% | 7.607(c) | 02/15/29 | 276 | 276,900 | ||||||||||||
Boxer Parent Co., Inc., | ||||||||||||||||
2031 New First Lien Dollar Term Loan, 3 Month SOFR + 3.750% | 8.335(c) | 07/30/31 | 322 | 324,290 | ||||||||||||
Bracket Intermediate Holding Corp., | ||||||||||||||||
2024 Repriced Term B Loan, 3 Month SOFR + 4.250% | 8.579(c) | 05/08/28 | 247 | 248,803 | ||||||||||||
Cotiviti Inc, | ||||||||||||||||
Initial Floating Rate Term Loan, 1 Month SOFR + 2.750% | 7.303(c) | 05/01/31 | 347 | 349,768 | ||||||||||||
Dun & Bradstreet Corporation (The), | ||||||||||||||||
Incremental Term B-2, 1 Month SOFR + 2.250% | 6.588(c) | 01/18/29 | 323 | 322,764 | ||||||||||||
Inmar, Inc., | ||||||||||||||||
Initial Term Loan, 3 Month SOFR + 5.000% | 9.400(c) | 10/30/31 | 274 | 274,151 | ||||||||||||
Renaissance Holding Corp, | ||||||||||||||||
2024-2 Term Loan, 1 Month SOFR + 4.000% | 8.357(c) | 04/05/30 | 248 | 246,572 | ||||||||||||
Weld North Education LLC, | ||||||||||||||||
2024 Term Loan, 1 Month SOFR + 3.500% | 7.857(c) | 12/21/29 | 248 | 248,258 | ||||||||||||
|
| |||||||||||||||
| 2,291,506 | ||||||||||||||||
Telecommunications 0.9% | ||||||||||||||||
Patagonia Holdco LLC, | ||||||||||||||||
Initial Term Loan, 3 Month SOFR + 5.750% | 10.272(c) | 08/01/29 | 311 | 273,700 | ||||||||||||
Qualitytech, LP, | ||||||||||||||||
Term Loan, 1 Month SOFR + 3.500%^ | 8.024(c) | 10/30/31 | 400 | 401,000 | ||||||||||||
See Notes to Financial Statements.
30
| Description | Interest Rate | Maturity Date | Principal (000)# | Value | ||||||||||||
FLOATING RATE AND OTHER LOANS (Continued) | ||||||||||||||||
Telecommunications (cont’d.) | ||||||||||||||||
Windstream Services LLC, | ||||||||||||||||
2024 Term Loan, 1 Month SOFR + 4.850%^ | 9.207%(c) | 10/01/31 | 75 | $ | 75,563 | |||||||||||
Zegona Holdco Ltd., | ||||||||||||||||
Facility B (USD), 6 Month SOFR + 4.250% | 9.401(c) | 07/17/29 | 274 | 274,312 | ||||||||||||
|
| |||||||||||||||
| 1,024,575 | ||||||||||||||||
Transportation 0.0% | ||||||||||||||||
Kenan Advantage Group, Inc. (The), | ||||||||||||||||
Term B-4 Loan, 1 Month SOFR + 3.250% | 7.607(c) | 01/25/29 | 25 | 24,890 | ||||||||||||
|
| |||||||||||||||
TOTAL FLOATING RATE AND OTHER LOANS | 30,170,837 | |||||||||||||||
|
| |||||||||||||||
RESIDENTIAL MORTGAGE-BACKED SECURITIES 3.9% | ||||||||||||||||
Lugo Funding DAC (Spain), | ||||||||||||||||
Series 2024-01A, Class C, 144A, 3 Month | ||||||||||||||||
EURIBOR + 2.000% (Cap N/A, Floor 0.000%) | 4.992(c) | 05/26/66 | EUR 600 | 599,238 | ||||||||||||
PMT Credit Risk Transfer Trust, | ||||||||||||||||
Series 2024-01R, Class A, 144A, 30 Day Average | ||||||||||||||||
SOFR + 3.500% (Cap N/A, Floor 0.000%) | 8.069(c) | 05/25/33 | 1,855 | 1,877,201 | ||||||||||||
Series 2024-02R, Class A, 144A, 30 Day Average | ||||||||||||||||
SOFR + 3.350% (Cap N/A, Floor 0.000%) | 7.910(c) | 03/29/27 | 1,865 | 1,883,434 | ||||||||||||
|
| |||||||||||||||
TOTAL RESIDENTIAL MORTGAGE-BACKED SECURITIES | 4,359,873 | |||||||||||||||
|
| |||||||||||||||
SOVEREIGN BONDS 1.2% | ||||||||||||||||
Angolan Government International Bond (Angola), | ||||||||||||||||
Sr. Unsec’d. Notes | 8.250 | 05/09/28 | 300 | 282,093 | ||||||||||||
Ivory Coast Government International Bond (Ivory Coast), | ||||||||||||||||
Sr. Unsec’d. Notes | 5.250 | 03/22/30 | EUR 201 | 196,689 | ||||||||||||
Sr. Unsec’d. Notes | 5.875 | 10/17/31 | EUR 400 | 387,926 | ||||||||||||
Serbia International Bond (Serbia), | ||||||||||||||||
Sr. Unsec’d. Notes, 144A | 6.000 | 06/12/34 | 200 | 196,750 | ||||||||||||
Turkiye Government International Bond (Turkey), | ||||||||||||||||
Sr. Unsec’d. Notes, Series 10Y | 7.625 | 05/15/34 | 200 | 203,250 | ||||||||||||
|
| |||||||||||||||
TOTAL SOVEREIGN BONDS | 1,266,708 | |||||||||||||||
|
| |||||||||||||||
See Notes to Financial Statements.
PGIM Credit Income Fund 31
Schedule of Investments (continued)
as of December 31, 2024
| Description | Interest Rate | Maturity Date | Principal Amount (000)# | Value | ||||||||||||
U.S. TREASURY OBLIGATION(k) 0.8% | ||||||||||||||||
U.S. Treasury Notes | 3.625% | 08/31/29 | 915 | $ | 886,192 | |||||||||||
|
| |||||||||||||||
| Shares | ||||||||||||||||
COMMON STOCK 0.1% | ||||||||||||||||
Gas Utilities | ||||||||||||||||
Ferrellgas Partners LP (Class B Stock) | 1,029 | 129,082 | ||||||||||||||
|
| |||||||||||||||
PREFERRED STOCK 0.0% | ||||||||||||||||
Electronic Equipment, Instruments & Components | ||||||||||||||||
Ferrellgas Escrow LLC, 8.956%, Maturing 03/30/31^ | 25 | 25,000 | ||||||||||||||
|
| |||||||||||||||
TOTAL LONG-TERM INVESTMENTS | 133,739,692 | |||||||||||||||
|
| |||||||||||||||
SHORT-TERM INVESTMENT 3.8% | ||||||||||||||||
AFFILIATED MUTUAL FUND | ||||||||||||||||
PGIM Core Ultra Short Bond Fund | 4,177,562 | 4,177,562 | ||||||||||||||
|
| |||||||||||||||
TOTAL INVESTMENTS 124.7% | 137,917,254 | |||||||||||||||
Liabilities in excess of other assets(z) (24.7)% | (27,327,106 | ) | ||||||||||||||
|
| |||||||||||||||
NET ASSETS 100.0% | $ | 110,590,148 | ||||||||||||||
|
| |||||||||||||||
Below is a list of the abbreviation(s) used in the annual report:
EUR—Euro
GBP—British Pound
USD—US Dollar
144A—Security was purchased pursuant to Rule 144A under the Securities Act of 1933 and, pursuant to the requirements of Rule 144A, may not be resold except to qualified institutional buyers.
BARC—Barclays Bank PLC
BNP—BNP Paribas S.A.
BOA—Bank of America, N.A.
CDX—Credit Derivative Index
CGM—Citigroup Global Markets, Inc.
See Notes to Financial Statements.
32
CLO—Collateralized Loan Obligation
CPI—Consumer Price Index
DAC—Designated Activity Company
EURIBOR—Euro Interbank Offered Rate
GSI—Goldman Sachs International
IO—Interest Only (Principal amount represents notional)
JPS—J.P. Morgan Securities LLC
LIBOR—London Interbank Offered Rate
LP—Limited Partnership
M—Monthly payment frequency for swaps
MSI—Morgan Stanley & Co International PLC
MTN—Medium Term Note
N/A—Not Applicable
OTC—Over-the-counter
PIK—Payment-in-Kind
Q—Quarterly payment frequency for swaps
REITs—Real Estate Investment Trust
SOFR—Secured Overnight Financing Rate
SONIA—Sterling Overnight Index Average
T—Swap payment upon termination
TD—The Toronto-Dominion Bank
| # | Principal or notional amount is shown in U.S. dollars unless otherwise stated. |
| ^ | Indicates a Level 3 instrument. The aggregate value of Level 3 instruments is $5,073,989 and 4.6% of net assets. |
| (c) | Variable rate instrument. The interest rate shown reflects the rate in effect at December 31, 2024. |
| (cc) | Variable rate instrument. The rate shown is based on the latest available information as of December 31, 2024. Certain variable rate securities are not based on a published reference rate and spread but are determined by the issuer or agent and are based on current market conditions. These securities do not indicate a reference rate and spread in their description. |
| (ff) | Variable rate security. Security may be issued at a fixed coupon rate, which converts to a variable rate at a specified date. Rate shown is the rate in effect as of period end. |
| (k) | Represents security, or a portion thereof, segregated as collateral for centrally cleared/exchange-traded derivatives. |
| (oo) | Perpetual security. Maturity date represents next call date. |
| (p) | Represents a security with a delayed settlement and therefore the interest rate is not available until settlement which is after the period end. |
| (v) | Represents security, or a portion thereof, segregated as collateral for reverse repurchase agreements. |
| (wb) | Represents an investment in a Fund affiliated with the Manager. |
| (z) | Includes net unrealized appreciation/(depreciation) and/or market value of the below holdings which are excluded from the Schedule of Investments: |
Unfunded corporate bond commitment outstanding at December 31, 2024:
Issuer | Principal Amount (000)# | Current Value | Unrealized Appreciation | Unrealized Depreciation | ||||||||
New Generation Gas Gathering LLC, Sr. Sec’d. Notes, 144A, | 620 | $610,966 | $— | $— | ||||||||
|
|
|
|
| ||||||||
See Notes to Financial Statements.
PGIM Credit Income Fund 33
Schedule of Investments (continued)
as of December 31, 2024
Unfunded loan commitments outstanding at December 31, 2024:
Borrower | Principal Amount (000)# | Current Value | Unrealized Appreciation | Unrealized Depreciation | ||||||||||||
Action Environmental Group, Inc. (The), 2024-1 Incremental | 23 | $ | 22,672 | $ | 113 | $ | — | |||||||||
Doncasters US Finance LLC, Delayed Draw Term Loan, 1.500%, | 27 | 26,730 | 7 | — | ||||||||||||
Dukes Education Group Ltd., Acquisition/Capex Facility 5, | 4 | 4,997 | — | (28 | ) | |||||||||||
Dukes Education Group Ltd., Term Loan, 1.000%, Maturity Date | 544 | 680,448 | — | (3,919 | ) | |||||||||||
Jupiter Buyer, Inc.,Initial Delayed Draw Term Loan, —%(p), | 23 | 23,399 | 239 | — | ||||||||||||
|
|
|
|
|
| |||||||||||
| $ | 758,246 | $ | 359 | $ | (3,947 | ) | ||||||||||
|
|
|
|
|
| |||||||||||
Futures contracts outstanding at December 31, 2024:
| Number of Contracts | Type | Expiration Date | Current Notional Amount | Value / Unrealized Appreciation (Depreciation) | |||||||||||||||||
| Long Positions: | |||||||||||||||||||||
41 2 Year U.S. Treasury Notes | Mar. 2025 | $ | 8,429,984 | $ | (1,439 | ) | |||||||||||||||
90 5 Year U.S. Treasury Notes | Mar. 2025 | 9,567,422 | (45,458 | ) | |||||||||||||||||
|
| ||||||||||||||||||||
| $ | (46,897 | ) | |||||||||||||||||||
|
| ||||||||||||||||||||
Forward foreign currency exchange contracts outstanding at December 31, 2024:
Purchase Contracts | Counterparty | Notional Amount (000) | Value at Settlement Date | Current Value | Unrealized Appreciation | Unrealized Depreciation | ||||||||||||||||||||||||||
OTC Forward Foreign Currency Exchange Contracts: |
| |||||||||||||||||||||||||||||||
British Pound, | ||||||||||||||||||||||||||||||||
Expiring 01/10/25 | BOA | GBP | 33 | $ | 42,419 | $ | 41,919 | $ | — | $ | (500 | ) | ||||||||||||||||||||
Euro, | ||||||||||||||||||||||||||||||||
Expiring 01/10/25 | BOA | EUR | 192 | 202,903 | 199,044 | — | (3,859 | ) | ||||||||||||||||||||||||
Expiring 01/10/25 | BOA | EUR | 113 | 118,740 | 116,920 | — | (1,820 | ) | ||||||||||||||||||||||||
|
|
|
|
|
|
|
| |||||||||||||||||||||||||
| $ | 364,062 | $ | 357,883 | — | (6,179 | ) | ||||||||||||||||||||||||||
|
|
|
|
|
|
|
| |||||||||||||||||||||||||
See Notes to Financial Statements.
34
Forward foreign currency exchange contracts outstanding at December 31, 2024 (continued):
Sale Contracts | Counterparty | Notional Amount (000) | Value at Settlement Date | Current Value | Unrealized Appreciation | Unrealized Depreciation | ||||||||||||||||||||||||||
OTC Forward Foreign Currency Exchange Contracts: |
| |||||||||||||||||||||||||||||||
British Pound, | ||||||||||||||||||||||||||||||||
Expiring 01/10/25 | BOA | GBP | 97 | $ | 124,173 | $ | 121,710 | $ | 2,463 | $ | — | |||||||||||||||||||||
Expiring 01/10/25 | MSI | GBP | 6,868 | 8,598,820 | 8,597,301 | 1,519 | — | |||||||||||||||||||||||||
Expiring 01/10/25 | MSI | GBP | 33 | 41,889 | 41,743 | 146 | — | |||||||||||||||||||||||||
Euro, | ||||||||||||||||||||||||||||||||
Expiring 01/10/25 | BNP | EUR | 233 | 244,606 | 241,164 | 3,442 | — | |||||||||||||||||||||||||
Expiring 01/10/25 | BOA | EUR | 17,031 | 17,909,780 | 17,648,785 | 260,995 | — | |||||||||||||||||||||||||
Expiring 01/10/25 | GSI | EUR | 166 | 175,377 | 171,773 | 3,604 | — | |||||||||||||||||||||||||
Expiring 01/10/25 | TD | EUR | 160 | 166,235 | 166,307 | — | (72 | ) | ||||||||||||||||||||||||
|
|
|
|
|
|
|
| |||||||||||||||||||||||||
| $ | 27,260,880 | $ | 26,988,783 | 272,169 | (72 | ) | ||||||||||||||||||||||||||
|
|
|
|
|
|
|
| |||||||||||||||||||||||||
| $ | 272,169 | $ | (6,251 | ) | ||||||||||||||||||||||||||||
|
|
|
| |||||||||||||||||||||||||||||
Credit default swap agreements outstanding at December 31, 2024:
Reference Entity/ Obligation | Termination Date | Fixed Rate | Notional Amount (000)#(3) | Implied Credit Spread at December 31, 2024(4) | Fair Value | Upfront Premiums Paid (Received) | Unrealized Appreciation (Depreciation) | Counterparty | ||||||||||||||||||||||
OTC Credit Default Swap Agreement on asset-backed and/or mortgage-backed securities - Sell Protection(2)^: | ||||||||||||||||||||||||||||||
| GS_24-PCA†† | 08/02/27 | 1.650 | %(M) | 1,979 | * | $ | 2,782 | $ | (138 | ) | $ | 2,920 | GSI | |||||||||||||||||
|
|
|
|
|
| |||||||||||||||||||||||||
| †† | The value of the contract, GS_24-PCA is derived from the aggregate credit performance of a pool of senior prime jumbo mortgages. The pool of prime jumbo mortgages is reset monthly. |
Reference Entity/ Obligation | Termination Date | Fixed Rate | Notional Amount (000)#(3) | Implied Credit Spread at December 31, 2024(4) | Fair Value | Upfront Premiums Paid (Received) | Unrealized Appreciation (Depreciation) | Counterparty | ||||||||||||||||||||||||
OTC Credit Default Swap Agreements on corporate and/or sovereign issues - Sell Protection(2): |
| |||||||||||||||||||||||||||||||
Pakistan | 09/20/25 | 1.000 | %(Q) | 1,400 | 6.758 | % | $ | (55,405 | ) | $ | (70,214 | ) | $ | 14,809 | BARC | |||||||||||||||||
Petroleos | 06/20/25 | 1.000%(Q) | 250 | 2.259% | (1,379) | (635) | (744) | MSI | ||||||||||||||||||||||||
See Notes to Financial Statements.
PGIM Credit Income Fund 35
Schedule of Investments (continued)
as of December 31, 2024
Credit default swap agreements outstanding at December 31, 2024 (continued):
Reference Entity/ Obligation | Termination Date | Fixed Rate | Notional | Implied Credit Spread at December 31, 2024(4) | Fair Value | Upfront Premiums Paid (Received) | Unrealized Appreciation (Depreciation) | Counterparty | ||||||||||||||||||||||||||||||||
OTC Credit Default Swap Agreements on corporate and/or sovereign issues - Sell Protection(2)(cont’d.): |
| |||||||||||||||||||||||||||||||||||||||
Petroleos Mexicanos | 12/20/25 | 1.000 | %(Q) | 280 | 2.738% | $ | (4,495 | ) | $ | (4,344 | ) | $ | (151 | ) | MSI | |||||||||||||||||||||||||
Petroleos Mexicanos | 12/24/25 | 3.750 | %(Q) | 400 | 2.747% | 4,157 | — | 4,157 | GSI | |||||||||||||||||||||||||||||||
|
|
|
|
|
| |||||||||||||||||||||||||||||||||||
| $ | (57,122 | ) | $ | (75,193 | ) | $ | 18,071 | |||||||||||||||||||||||||||||||||
|
|
|
|
|
| |||||||||||||||||||||||||||||||||||
Reference Entity/ Obligation | Termination Date | Fixed Rate | Notional Amount (000)#(3) | Implied Credit Spread at December 31, 2024(4) | Value at Trade Date | Value at December 31, 2024 | Unrealized Appreciation (Depreciation) | ||||||||||||||||||||||||||||
Centrally Cleared Credit Default Swap Agreement on credit indices - Sell Protection(2): |
| ||||||||||||||||||||||||||||||||||
CDX.NA.HY.43.V1 | 12/20/29 | 5.000 | %(Q) | 6,680 | 3.117 | % | $ | 503,331 | $ | 525,216 | $ | 21,885 | |||||||||||||||||||||||
|
|
|
|
|
| ||||||||||||||||||||||||||||||
The Fund entered into credit default swaps (“CDS”) to provide a measure of protection against defaults or to take an active long or short position with respect to the likelihood of a particular issuer’s default or the reference entity’s credit soundness. CDS contracts generally trade based on a spread which represents the cost a protection buyer has to pay the protection seller. The protection buyer is said to be short the credit as the value of the contract rises the more the credit deteriorates. The value of the CDS contract increases for the protection buyer if the spread increases.
| (1) | If the Fund is a buyer of protection, it pays the fixed rate. When a credit event occurs, as defined under the terms of that particular swap agreement, the Fund will either (i) receive from the seller of protection an amount equal to the notional amount of the swap and make delivery of the referenced obligation or underlying securities comprising the referenced index or (ii) receive a net settlement amount in the form of cash or securities equal to the notional amount of the swap less the recovery value of the referenced obligation or underlying securities comprising the referenced index. |
| (2) | If the Fund is a seller of protection, it receives the fixed rate. When a credit event occurs, as defined under the terms of that particular swap agreement, the Fund will either (i) pay to the buyer of protection an amount equal to the notional amount of the swap and take delivery of the referenced obligation or underlying securities comprising the referenced index or (ii) pay a net settlement amount in the form of cash or securities equal to the notional amount of the swap less the recovery value of the referenced obligation or underlying securities comprising the referenced index. |
| (3) | Notional amount represents the maximum potential amount the Fund could be required to pay as a seller of credit protection or receive as a buyer of credit protection if a credit event occurs as defined under the terms of that particular swap agreement. |
| (4) | Implied credit spreads, represented in absolute terms, utilized in determining the fair value of credit default swap |
See Notes to Financial Statements.
36
agreements where the Fund is the seller of protection as of the reporting date serve as an indicator of the current status of the payment/ performance risk and represent the likelihood of risk of default for the credit derivative. The implied credit spread of a particular referenced entity reflects the cost of buying/selling protection and may include up-front payments required to be made to enter into the agreement. Wider credit spreads represent a deterioration of the referenced entity’s credit soundness and a greater likelihood of risk of default or other credit event occurring as defined under the terms of the agreement. |
| * | When an implied credit spread is not available, reference the fair value of credit default swap agreements on credit indices and asset-backed securities. Where the Fund is the seller of protection, it serves as an indicator of the current status of the payment/performance risk and represents the likelihood of an expected liability (or profit) for the credit derivative should the notional amount of the swap agreement be closed/sold as of the reporting date. Increasing fair value in absolute terms, when compared to the notional amount of the swap, represents a deterioration of the referenced entity’s credit soundness and a greater likelihood of risk of default or other credit event occurring as defined under the terms of the agreement. |
Total return swap agreements outstanding at December 31, 2024:
Reference Entity | Financing Rate | Counterparty | Termination Date | Long (Short) Notional Amount (000)#(1) | Fair Value | Upfront Premiums Paid (Received) | Unrealized Appreciation (Depreciation)(2) | ||||||||||||||||||||||||||||
OTC Total Return Swap Agreements: |
| ||||||||||||||||||||||||||||||||||
Bloomberg U.S. Treasury 5-10 Year Index(T) | | 1 Day SOFR +10bps(T)/ 4.590% |
| BARC | 01/15/25 | (8,680) | $ | 229,561 | $— | $ | 229,561 | ||||||||||||||||||||||||
U.S. Treasury Bond(T) | | 1 Day SOFR +23bps(T)/ 4.720% |
| BARC | 01/15/25 | 29,000 | (694,293 | ) | — | (694,293 | ) | ||||||||||||||||||||||||
|
|
|
|
|
| ||||||||||||||||||||||||||||||
| $ | (464,732 | ) | $— | $ | (464,732 | ) | |||||||||||||||||||||||||||||
|
|
|
|
|
| ||||||||||||||||||||||||||||||
| (1) | On a long total return swap, the Fund receives payments for any positive return on the reference entity (makes payments for any negative return) and pays the financing rate. On a short total return swap, the Fund makes payments for any positive return on the reference entity (receives payments for any negative return) and receives the financing rate. |
| (2) | Upfront/recurring fees or commissions, as applicable, are included in the net unrealized appreciation (depreciation). |
Reverse repurchase agreements outstanding at December 31, 2024:
| Value at | ||||||||||||||
| Interest | Trade | Maturity | December 31, | |||||||||||
Broker | Rate(cc) | Date | Cost | Date | 2024 | |||||||||
BNP Paribas S.A | 4.590% | 06/28/24 | $ 475,000 | Open | $ 475,000 | |||||||||
BNP Paribas S.A | 4.650% | 02/12/24 | 1,825,000 | Open | 1,825,000 | |||||||||
BNP Paribas S.A | 4.680% | 05/14/24 | 766,125 | Open | 766,125 | |||||||||
BNP Paribas S.A | 4.680% | 05/14/24 | 711,750 | Open | 711,750 | |||||||||
BNP Paribas S.A | 4.700% | 10/15/24 | 539,844 | Open | 539,844 | |||||||||
BNP Paribas S.A | 4.700% | 10/15/24 | 220,313 | Open | 220,313 | |||||||||
See Notes to Financial Statements.
PGIM Credit Income Fund 37
Schedule of Investments (continued)
as of December 31, 2024
Reverse repurchase agreements outstanding at December 31, 2024 (continued):
| Value at | |||||||||||||||||||||||||
| Interest | Trade | Maturity | December 31, | ||||||||||||||||||||||
Broker | Rate(cc) | Date | Cost | Date | 2024 | ||||||||||||||||||||
BNP Paribas S.A | 4.700% | 10/15/24 | $ | 256,750 | Open | $ | 256,750 | ||||||||||||||||||
BNP Paribas S.A | 4.700% | 10/15/24 | 488,125 | Open | 488,125 | ||||||||||||||||||||
BNP Paribas S.A | 4.720% | 06/11/24 | 621,844 | Open | 621,844 | ||||||||||||||||||||
BNP Paribas S.A | 4.720% | 11/13/24 | 1,150,875 | Open | 1,150,875 | ||||||||||||||||||||
BNP Paribas S.A | 4.720% | 11/13/24 | 526,313 | Open | 526,313 | ||||||||||||||||||||
BNP Paribas S.A | 4.750% | 02/23/24 | 907,031 | Open | 907,031 | ||||||||||||||||||||
BNP Paribas S.A | 4.750% | 02/23/24 | 1,148,437 | Open | 1,148,437 | ||||||||||||||||||||
BNP Paribas S.A | 4.750% | 03/04/24 | 933,562 | Open | 933,562 | ||||||||||||||||||||
BNP Paribas S.A | 4.750% | 03/04/24 | 608,344 | Open | 608,344 | ||||||||||||||||||||
BNP Paribas S.A | 4.770% | 08/28/24 | 475,063 | Open | 475,063 | ||||||||||||||||||||
BNP Paribas S.A | 4.770% | 08/28/24 | 436,250 | Open | 436,250 | ||||||||||||||||||||
BNP Paribas S.A | 4.790% | 02/12/24 | 743,750 | Open | 743,750 | ||||||||||||||||||||
BNP Paribas S.A | 4.790% | 02/12/24 | 1,012,781 | Open | 1,012,781 | ||||||||||||||||||||
BNP Paribas S.A | 4.790% | 03/19/24 | 1,685,250 | Open | 1,685,250 | ||||||||||||||||||||
BNP Paribas S.A | 4.790% | 03/19/24 | 2,072,875 | Open | 2,072,875 | ||||||||||||||||||||
BNP Paribas S.A | 4.790% | 03/21/24 | 2,085,000 | Open | 2,085,000 | ||||||||||||||||||||
BNP Paribas S.A | 4.790% | 04/04/24 | 1,314,250 | Open | 1,314,250 | ||||||||||||||||||||
BNP Paribas S.A | 4.790% | 04/04/24 | 637,812 | Open | 637,812 | ||||||||||||||||||||
BNP Paribas S.A | 4.790% | 06/28/24 | 383,400 | Open | 383,400 | ||||||||||||||||||||
BNP Paribas S.A | 4.790% | 07/17/24 | 415,363 | Open | 415,363 | ||||||||||||||||||||
BNP Paribas S.A | 4.790% | 07/17/24 | 235,500 | Open | 235,500 | ||||||||||||||||||||
BNP Paribas S.A | 4.790% | 07/17/24 | 470,063 | Open | 470,063 | ||||||||||||||||||||
BNP Paribas S.A | 4.790% | 07/17/24 | 607,725 | Open | 607,725 | ||||||||||||||||||||
BNP Paribas S.A | 4.790% | 08/06/24 | 181,750 | Open | 181,750 | ||||||||||||||||||||
BNP Paribas S.A | 4.790% | 08/06/24 | 315,875 | Open | 315,875 | ||||||||||||||||||||
BNP Paribas S.A | 4.800% | 07/15/24 | 734,187 | Open | 734,187 | ||||||||||||||||||||
BNP Paribas S.A | 4.820% | 04/11/24 | 915,750 | Open | 915,750 | ||||||||||||||||||||
BNP Paribas S.A | 4.820% | 04/11/24 | 363,906 | Open | 363,906 | ||||||||||||||||||||
BNP Paribas S.A | 4.820% | 04/11/24 | 836,250 | Open | 836,250 | ||||||||||||||||||||
|
|
|
| ||||||||||||||||||||||
| $ | 27,102,113 | $ | 27,102,113 | ||||||||||||||||||||||
|
|
|
| ||||||||||||||||||||||
Open maturity dates - Certain agreements have no stated maturity and can be terminated by either party at any time.
The gross obligations for secured borrowing by the type of collateral pledged and remaining time to maturity on reverse repurchase contracts is as follows:
Remaining Contractual Maturity of the Agreements | |||||||||||||||||||||||||
Reverse Repurchase Agreements | Overnight and Continuous | Less than 30 Days | 30-90 Days | More than 90 Days | Total | ||||||||||||||||||||
Corporate Bonds | $— | $— | $— | $27,102,113 | $27,102,113 | ||||||||||||||||||||
|
|
|
|
|
|
|
|
|
| ||||||||||||||||
Total Borrowings | $— | $— | $— | $27,102,113 | $27,102,113 | ||||||||||||||||||||
|
|
|
|
|
|
|
|
|
| ||||||||||||||||
See Notes to Financial Statements.
38
During the year ended December 31, 2024, the Fund held reverse repurchase agreements during the period with an average value of $19,774,666 and a daily weighted average interest rate of 5.485%. In addition, corporate bonds with a market value of $29,896,119 have been segregated as collateral to cover the requirement for the reverse repurchase agreements outstanding at period end.
Balances Reported in the Statement of Assets and Liabilities for OTC Swap Agreements:
| Premiums Paid | Premiums Received | Unrealized Appreciation | Unrealized Depreciation | |||||||||||||||||
OTC Swap Agreements | $— | $(75,331) | $251,447 | $(695,188) | ||||||||||||||||
Summary of Collateral for Centrally Cleared/Exchange-traded Derivatives:
Cash and securities segregated as collateral, including pending settlement for closed positions, to cover requirements for centrally cleared/exchange-traded derivatives are listed by broker as follows:
Broker | Cash and/or Foreign Currency | Securities Market Value | ||||||||||
CGM | $295,000 | $624,693 | ||||||||||
JPS | — | 261,499 | ||||||||||
|
| |||||||||||
Total | $295,000 | $886,192 | ||||||||||
|
| |||||||||||
Fair Value Measurements:
Various inputs are used in determining the value of the Fund’s investments. These inputs are summarized in the three broad levels listed below.
Level 1—unadjusted quoted prices generally in active markets for identical securities.
Level 2—quoted prices for similar securities, interest rates and yield curves, prepayment speeds, foreign currency exchange rates and other observable inputs.
Level 3—unobservable inputs for securities valued in accordance with Board approved fair valuation procedures.
The following is a summary of the inputs used as of December 31, 2024 in valuing such portfolio securities:
| Level 1 | Level 2 | Level 3 | ||||||||||
Investments in Securities | ||||||||||||
Assets | ||||||||||||
Long-Term Investments | ||||||||||||
Asset-Backed Securities | ||||||||||||
Automobiles. | $ | — | $ | 314,068 | $ | — | ||||||
Collateralized Loan Obligations | — | 24,166,638 | — | |||||||||
Consumer Loans. | — | 865,918 | — | |||||||||
Credit Cards | — | 999,513 | — | |||||||||
Commercial Mortgage-Backed Securities | — | 8,757,518 | — | |||||||||
Corporate Bonds | — | 61,572,061 | 226,284 | |||||||||
Floating Rate and Other Loans. | — | 25,347,087 | 4,823,750 | |||||||||
Residential Mortgage-Backed Securities | — | 4,359,873 | — | |||||||||
See Notes to Financial Statements.
PGIM Credit Income Fund 39
Schedule of Investments (continued)
as of December 31, 2024
| Level 1 | Level 2 | Level 3 | |||||||||||||
Investments in Securities (continued) | |||||||||||||||
Assets (continued) | |||||||||||||||
Sovereign Bonds | $ | — | $ | 1,266,708 | $ | — | |||||||||
U.S. Treasury Obligation. | — | 886,192 | — | ||||||||||||
Common Stock | — | 129,082 | — | ||||||||||||
Preferred Stock. | — | — | 25,000 | ||||||||||||
Short-Term Investment | |||||||||||||||
Affiliated Mutual Fund | 4,177,562 | — | — | ||||||||||||
|
|
|
|
|
| ||||||||||
Total | $ | 4,177,562 | $ | 128,664,658 | $ | 5,075,034 | |||||||||
|
|
|
|
|
| ||||||||||
Other Financial Instruments* | |||||||||||||||
Assets | |||||||||||||||
Unfunded Corporate Bond Commitment | $ | — | $ | — | $ | — | ** | ||||||||
Unfunded Loan Commitments | — | 239 | 120 | ||||||||||||
OTC Forward Foreign Currency Exchange Contracts | — | 272,169 | — | ||||||||||||
Centrally Cleared Credit Default Swap Agreement | — | 21,885 | — | ||||||||||||
OTC Credit Default Swap Agreements | — | 4,157 | 2,782 | ||||||||||||
OTC Total Return Swap Agreement | — | 229,561 | — | ||||||||||||
|
|
|
|
|
| ||||||||||
Total | $ | — | $ | 528,011 | $ | 2,902 | |||||||||
|
|
|
|
|
| ||||||||||
Liabilities | |||||||||||||||
Unfunded Loan Commitments | $ | — | $ | — | $ | (3,947 | ) | ||||||||
Futures Contracts | (46,897 | ) | — | — | |||||||||||
OTC Forward Foreign Currency Exchange Contracts | — | (6,251 | ) | — | |||||||||||
OTC Credit Default Swap Agreements | — | (61,279 | ) | — | |||||||||||
OTC Total Return Swap Agreement | — | (694,293 | ) | — | |||||||||||
|
|
|
|
|
| ||||||||||
Total | $ | (46,897 | ) | $ | (761,823 | ) | $ | (3,947 | ) | ||||||
|
|
|
|
|
| ||||||||||
| * | Other financial instruments are derivative instruments, with the exception of unfunded corporate bond commitments and unfunded loan commitments, and are not reflected in the Schedule of Investments. Futures, forwards, centrally cleared swap contracts, unfunded corporate bond commitments and unfunded loan commitments are recorded at unrealized appreciation (depreciation) and OTC swap contracts are recorded at fair value. |
| ** | Includes Level 3 investments with an aggregate value of $0. |
The following is a reconciliation of assets in which unobservable inputs (Level 3) were used in determining fair value:
| Floating Rate | |||||||||||||||
| Corporate Bonds | and Other Loans | Preferred Stock | ||||||||||||
Balance as of 12/31/23 | $ — | $1,458,164 | $ — | ||||||||||||
Realized gain (loss) | — | 3,058 | — | ||||||||||||
Change in unrealized appreciation (depreciation) | (135 | ) | (480,529 | ) | (250 | ) | |||||||||
Purchases/Exchanges/Issuances | 226,284 | 4,955,678 | 25,250 | ||||||||||||
Sales/Paydowns | — | (1,284,226 | ) | — | |||||||||||
Accrued discount/premium | 135 | 6,793 | — | ||||||||||||
See Notes to Financial Statements.
40
Floating Rate | |||||||||||||||
| Corporate Bonds | and Other Loans | Preferred Stock | ||||||||||||
Transfers into Level 3* | $ | — | $ | 525,250 | $ | — | |||||||||
Transfers out of Level 3* | — | (360,438 | ) | — | |||||||||||
|
|
|
|
|
| ||||||||||
Balance as of 12/31/24 | $ | 226,284 | $ | 4,823,750 | $ | 25,000 | |||||||||
|
|
|
|
|
| ||||||||||
Change in unrealized appreciation (depreciation) relating to securities still held at reporting period end. | $ | (135 | ) | $ | (479,698 | ) | $ | (250 | ) | ||||||
|
|
|
|
|
| ||||||||||
| OTC Credit Default Unfunded Corporate Unfunded Loan | |||||||||||||||
| Swap Agreements | Bond Commitment | Commitments | ||||||||||||
Balance as of 12/31/23. | $ | — | $ | — | $ | — | |||||||||
Realized gain (loss) | — | — | — | ||||||||||||
Change in unrealized appreciation (depreciation) | 2,782 | — | (3,827 | ) | |||||||||||
Purchases/Exchanges /Issuances | — | — | — | ||||||||||||
Sales/Paydowns | — | — | — | ||||||||||||
Accrued discount/premium | — | — | — | ||||||||||||
Transfers into Level 3* | — | — | — | ||||||||||||
Transfers out of Level 3* | — | — | — | ||||||||||||
|
|
|
|
|
| ||||||||||
Balance as of 12/31/24. | $ | 2,782 | $ | — | $ | (3,827 | ) | ||||||||
|
|
|
|
|
| ||||||||||
Change in unrealized appreciation (depreciation) relating to securities still held at reporting period end | $ | 2,782 | $ | — | $ | (3,827 | ) | ||||||||
|
|
|
|
|
| ||||||||||
| * | It is the Fund’s policy to recognize transfers in and transfers out at the securities’ fair values as of the beginning of period. Securities transferred between Level 2 and Level 3 are due to changes in the method utilized in valuing the investments. Transfers from Level 2 to Level 3 are typically a result of a change from the use of methods used by independent pricing services (Level 2) to the use of a single broker quote or valuation technique which utilizes significant unobservable inputs due to an absence of current or reliable market quotations (Level 3). Transfers from Level 3 to Level 2 are a result of the availability of current and reliable market data provided by independent pricing services or other valuation techniques which utilize observable inputs. In accordance with the requirements of ASC 820, the amounts of transfers into and out of Level 3, if material, are disclosed in the Notes to the Schedule of Investments of the Fund. |
Level 3 securities as presented in the table above are being fair valued using pricing methodologies approved by the Board, which contain unobservable inputs as follows:
Level 3 Securities** | Fair Value as of December 31, 2024 | Valuation Approach | Valuation Methodology | Unobservable Inputs | Inputs (Range) | ||||||||||||||||||||
Corporate Bonds | $ | 226,284 | Market | | Transaction Based | | Unadjusted Price | NA | |||||||||||||||||
Floating Rate and Other Loans | 1,828,488 | Market | Enterprise Value | EBITDA Multiple | 6.0x - 8.3x | ||||||||||||||||||||
Floating Rate and Other Loans | 507,566 | Market | | Transaction Based | | Unadjusted Price | NA | ||||||||||||||||||
See Notes to Financial Statements.
PGIM Credit Income Fund 41
Schedule of Investments (continued)
as of December 31, 2024
Level 3 Securities** | Fair Value as of December 31, 2024 | Valuation Approach | Valuation Methodology | Unobservable Inputs | Inputs (Range) | ||||||||||||||||||||
Preferred Stocks | $ | 25,000 | Market | | Transaction Based | | Unadjusted Price | NA | |||||||||||||||||
Unfunded Corporate Bond Commitment | — | Market | | Transaction Based | | Unadjusted Price | NA | ||||||||||||||||||
Unfunded Loan Commitments | (3,947 | ) | Market | Enterprise Value | EBITDA Multiple | 6.0x | |||||||||||||||||||
|
| ||||||||||||||||||||||||
| $ | 2,583,391 | ||||||||||||||||||||||||
|
| ||||||||||||||||||||||||
| ** | The table does not include Level 3 securities and/or derivatives that are valued by independent pricing vendors or brokers. As of December 31, 2024, the aggregate value of these securities and/or derivatives was $2,490,598. The unobservable inputs for these investments were not developed by the Fund and are not readily available (e.g. single broker quotes). |
Industry Classification:
The industry classification of investments and liabilities in excess of other assets shown as a percentage of net assets as of December 31, 2024 were as follows:
Collateralized Loan Obligations | 21.8 | % | ||
Commercial Mortgage-Backed Securities | 7.9 | |||
Banks | 6.6 | |||
Media | 6.4 | |||
Retail | 5.2 | |||
Electric | 5.1 | |||
Oil & Gas | 5.1 | |||
Telecommunications | 4.2 | |||
Chemicals | 4.0 | |||
Residential Mortgage-Backed Securities | 3.9 | |||
Affiliated Mutual Fund | 3.8 | |||
Entertainment | 3.4 | |||
Foods | 2.8 | |||
Transportation | 2.5 | |||
Computers | 2.5 | |||
Commercial Services | 2.5 | |||
Diversified Financial Services | 2.3 | |||
Aerospace & Defense | 2.1 | |||
Leisure Time | 2.1 | |||
Software | 2.1 | |||
Mining | 1.9 | |||
Auto Parts & Equipment | 1.8 | |||
Pharmaceuticals | 1.7 | |||
Healthcare-Services | 1.7 | |||
Investment Companies | 1.5 | |||
Machinery-Diversified | 1.5 | |||
Lodging | 1.5 | |||
Sovereign Bonds | 1.2 | |||
Real Estate Investment Trusts (REITs) | 1.1 | % | ||
Metal Fabricate/Hardware | 1.0 | |||
Credit Cards | 0.9 | |||
Engineering & Construction | 0.8 | |||
Environmental Control | 0.8 | |||
U.S. Treasury Obligation | 0.8 | |||
Consumer Loans | 0.8 | |||
Apparel | 0.8 | |||
Insurance | 0.7 | |||
Packaging & Containers | 0.6 | |||
Building Materials | 0.6 | |||
Pipelines | 0.5 | |||
Holding Companies-Diversified | 0.5 | |||
Coal | 0.5 | |||
Real Estate | 0.5 | |||
Iron/Steel | 0.5 | |||
Hand/Machine Tools | 0.5 | |||
Electronics | 0.4 | |||
Home Builders | 0.3 | |||
Forest Products & Paper | 0.3 | |||
Automobiles | 0.3 | |||
Household Products/Wares | 0.3 | |||
Agriculture | 0.3 | |||
Internet | 0.2 | |||
Education | 0.2 | |||
Shipbuilding | 0.2 | |||
Miscellaneous Manufacturing | 0.2 | |||
Home Furnishings | 0.2 | |||
See Notes to Financial Statements.
42
Industry Classification (continued):
Housewares | 0.2 | % | ||
Airlines | 0.2 | |||
Beverages | 0.2 | |||
Gas Utilities | 0.1 | |||
Oil & Gas Services | 0.1 | |||
Electronic Equipment, Instruments & Components | 0.0 | * | ||
|
| |||
| 124.7 | ||||
Liabilities in excess of other assets | (24.7 | ) | ||
|
| |||
| 100.0 | % | |||
|
| |||
| * | Less than 0.05% |
Effects of Derivative Instruments on the Financial Statements and Primary Underlying Risk Exposure:
The Fund invested in derivative instruments during the reporting period. The primary types of risk associated with these derivative instruments are credit risk, foreign exchange risk and interest rate risk. See the Notes to Financial Statements for additional detail regarding these derivative instruments and their risks. The effect of such derivative instruments on the Fund’s financial position and financial performance as reflected in the Statement of Assets and Liabilities and Statement of Operations is presented in the summary below.
Fair values of derivative instruments as of December 31, 2024 as presented in the Statement of Assets and Liabilities:
Asset Derivatives | Liability Derivatives | |||||||||||
Derivatives not accounted for as hedging instruments, carried at fair value | Statement of Assets and Liabilities Location | Fair Value | Statement of Assets and Liabilities Location | Fair Value | ||||||||
Credit contracts | Due from/to broker-variation margin swaps | $ | 21,885* | — | $ | — | ||||||
Credit contracts | — | — | Premiums received for OTC swap agreements | 75,331 | ||||||||
Credit contracts | Unrealized appreciation on OTC swap agreements | 21,886 | Unrealized depreciation on OTC swap agreements | 895 | ||||||||
Foreign exchange contracts | Unrealized appreciation on OTC forward foreign currency exchange contracts | 272,169 | Unrealized depreciation on OTC forward foreign currency exchange contracts | 6,251 | ||||||||
Interest rate contracts | — | — | Due from/to broker-variation margin futures | 46,897* | ||||||||
See Notes to Financial Statements.
PGIM Credit Income Fund 43
Schedule of Investments (continued)
as of December 31, 2024
Asset Derivatives | Liability Derivatives | |||||||||||
Derivatives not accounted for as hedging instruments, carried at fair value | Statement of Assets and Liabilities Location | Fair Value | Statement of Assets and Liabilities Location | Fair Value | ||||||||
Interest rate contracts | Unrealized appreciation on OTC swap agreements | $ | 229,561 | Unrealized depreciation on OTC swap agreements | $ | 694,293 | ||||||
|
|
|
| |||||||||
| $ | 545,501 | $ | 823,667 | |||||||||
|
|
|
| |||||||||
| * | Includes cumulative appreciation (depreciation) as reported in the schedule of open futures and centrally cleared swap contracts. Only unsettled variation margin receivable (payable) is reported within the Statement of Assets and Liabilities. |
The effects of derivative instruments on the Statement of Operations for the year ended December 31, 2024 are as follows:
| Amount of Realized Gain (Loss) on Derivatives Recognized in Income | |||||||||||||||
Derivatives not accounted for as hedging instruments, carried at fair value | Futures | Forward Currency Exchange Contracts | Swaps | ||||||||||||
Credit contracts | $ | — | $ | — | $ | 604,897 | |||||||||
Foreign exchange contracts | — | 970,778 | — | ||||||||||||
Interest rate contracts | (532,463 | ) | — | 1,118,579 | |||||||||||
|
|
|
|
|
| ||||||||||
Total | $ | (532,463 | ) | $ | 970,778 | $ | 1,723,476 | ||||||||
|
|
|
|
|
| ||||||||||
| Change in Unrealized Appreciation (Depreciation) on Derivatives Recognized in Income | |||||||||||||||
Derivatives not accounted for as hedging instruments, carried at fair value | Futures | Forward Currency Exchange Contracts | Swaps | ||||||||||||
Credit contracts | $ | — | $ | — | $ | 13,888 | |||||||||
Foreign exchange contracts | — | 523,747 | — | ||||||||||||
Interest rate contracts | (46,897 | ) | — | (464,732 | ) | ||||||||||
|
|
|
|
|
| ||||||||||
Total | $ | (46,897 | ) | $ | 523,747 | $ | (450,844 | ) | |||||||
|
|
|
|
|
| ||||||||||
For the year ended December 31, 2024, the Fund’s average volume of derivative activities is as follows:
| Derivative Contract Type | Average Volume of Derivative Activities* | ||||
Futures Contracts - Long Positions (1) | $ | 7,625,059 | |||
Forward Foreign Currency Exchange Contracts - Purchased (2) | 15,117,064 | ||||
Forward Foreign Currency Exchange Contracts - Sold (2) | 37,873,113 | ||||
Credit Default Swap Agreements - Sell Protection (1) | 8,730,705 | ||||
See Notes to Financial Statements.
44
| Derivative Contract Type | Average Volume of Derivative Activities* | ||||
Total Return Swap Agreements (1) | $ | 18,883,315 | |||
| * | Average volume is based on average quarter end balances for the year ended December 31, 2024. |
| (1) | Notional Amount in USD. |
| (2) | Value at Settlement Date. |
Financial Instruments/Transactions—Summary of Offsetting and Netting Arrangements:
The Fund invested in OTC derivatives and entered into financial instruments/transactions during the reporting period that are either offset in accordance with current requirements or are subject to enforceable master netting arrangements or similar agreements that permit offsetting. The information about offsetting and related netting arrangements for OTC derivatives and financial instruments/transactions where the legal right to set-off exists is presented in the summary below.
| Description | Counterparty | Gross Market Value of Recognized Assets/(Liabilities) | Collateral Pledged/ (Received)(2) | Net Amount | ||||
Reverse Repurchase Agreement | BNP Paribas S.A. | $(27,102,113) | $27,102,113 | $— | ||||
Offsetting of OTC derivative assets and liabilities:
Counterparty | Gross Amounts of Recognized Assets(1) | Gross Amounts of Recognized Liabilities(1) | Net Amounts of Recognized Assets/(Liabilities) | Collateral Pledged/(Received)(2) | Net Amount | ||||||||||||||||||||
BARC | $ | 244,370 | $ | (764,507 | ) | $ | (520,137 | ) | $ | — | $ | (520,137 | ) | ||||||||||||
BNP | 3,442 | — | 3,442 | — | 3,442 | ||||||||||||||||||||
BOA | 263,458 | (6,179 | ) | 257,279 | — | 257,279 | |||||||||||||||||||
GSI | 10,681 | (138 | ) | 10,543 | — | 10,543 | |||||||||||||||||||
MSI | 1,665 | (5,874 | ) | (4,209 | ) | — | (4,209 | ) | |||||||||||||||||
TD | — | (72 | ) | (72 | ) | — | (72 | ) | |||||||||||||||||
|
|
|
|
|
|
|
|
|
| ||||||||||||||||
| $ | 523,616 | $ | (776,770 | ) | $ | (253,154 | ) | $ | — | $ | (253,154 | ) | |||||||||||||
|
|
|
|
|
|
|
|
|
| ||||||||||||||||
| (1) | Includes unrealized appreciation/(depreciation) on swaps and forwards, premiums paid/(received) on swap agreements and market value of purchased and written options, as represented on the Statement of Assets and Liabilities. |
| (2) | Collateral amount disclosed by the Fund is limited to the market value of financial instruments/transactions and the Fund’s OTC derivative exposure by counterparty. |
See Notes to Financial Statements.
PGIM Credit Income Fund 45
Statement of Assets and Liabilities
as of December 31, 2024
Assets | |||||||||||||||
Investments at value: | |||||||||||||||
Unaffiliated investments (cost $132,402,188) | $ | 133,739,692 | |||||||||||||
Affiliated investments (cost $4,177,562) | 4,177,562 | ||||||||||||||
Cash | 37,426 | ||||||||||||||
Foreign currency, at value (cost $807,261) | 800,572 | ||||||||||||||
Cash segregated for counterparty - reverse repurchase agreements | 873,000 | ||||||||||||||
Dividends and interest receivable | 1,828,881 | ||||||||||||||
Receivable for investments sold | 796,675 | ||||||||||||||
Deposit with broker for centrally cleared/exchange-traded derivatives | 295,000 | ||||||||||||||
Unrealized appreciation on OTC forward foreign currency exchange contracts | 272,169 | ||||||||||||||
Unrealized appreciation on OTC swap agreements | 251,447 | ||||||||||||||
Due from broker—variation margin swaps | 4,958 | ||||||||||||||
Unrealized appreciation on unfunded loan commitments | 359 | ||||||||||||||
Prepaid expenses | 20,701 | ||||||||||||||
|
| ||||||||||||||
Total Assets | 143,098,442 | ||||||||||||||
|
| ||||||||||||||
Liabilities | |||||||||||||||
Reverse repurchase agreements (cost $27,102,113) | 27,102,113 | ||||||||||||||
Payable for investments purchased | 2,247,826 | ||||||||||||||
Dividends payable | 1,180,720 | ||||||||||||||
Interest payable | 984,000 | ||||||||||||||
Unrealized depreciation on OTC swap agreements | 695,188 | ||||||||||||||
Accrued expenses and other liabilities | 159,206 | ||||||||||||||
Premiums received for OTC swap agreements | 75,331 | ||||||||||||||
Management fee payable | 40,457 | ||||||||||||||
Due to broker—variation margin futures | 9,078 | ||||||||||||||
Unrealized depreciation on OTC forward foreign currency exchange contracts | 6,251 | ||||||||||||||
Affiliated transfer agent fee payable | 4,167 | ||||||||||||||
Unrealized depreciation on unfunded loan commitment | 3,947 | ||||||||||||||
Distribution fee payable | 10 | ||||||||||||||
|
| ||||||||||||||
Total Liabilities | 32,508,294 | ||||||||||||||
|
| ||||||||||||||
Commitment and Contingencies (Note 3) | — | ||||||||||||||
|
| ||||||||||||||
Net Assets | $ | 110,590,148 | |||||||||||||
|
| ||||||||||||||
Net assets were comprised of: | |||||||||||||||
Common shares, at par | $ | 4,319 | |||||||||||||
Paid-in capital in excess of par | 108,047,736 | ||||||||||||||
Total distributable earnings (loss) | 2,538,093 | ||||||||||||||
|
| ||||||||||||||
Net assets, December 31, 2024 | $ | 110,590,148 | |||||||||||||
|
| ||||||||||||||
See Notes to Financial Statements.
46
Class A | |||||||
Net asset value and redemption price per share, ($ 10,718 ÷ 419 of common shares issued and outstanding) | $ | 25.60 | |||||
Maximum sales charge (2.50% of offering price) | 0.66 | ||||||
|
| ||||||
Maximum offering price to public | $ | 26.26 | |||||
|
| ||||||
Class C | |||||||
Net asset value, offering price and redemption price per share, ($ 10,674 ÷ 417 of common shares issued and outstanding) | $ | 25.60 | |||||
|
| ||||||
Class Z | |||||||
Net asset value, offering price and redemption price per share, ($ 110,568,756 ÷ 4,318,215 of common shares issued and outstanding) | $ | 25.61 | |||||
|
| ||||||
Net asset value per share may not recalculate due to rounding.
See Notes to Financial Statements.
PGIM Credit Income Fund 47
Statement of Operations
Year Ended December 31, 2024
Net Investment Income (Loss) | ||||||||||||
Income | ||||||||||||
Interest income (net of $4,184 foreign withholding tax) | $ | 10,946,970 | ||||||||||
Affiliated dividend income | 178,524 | |||||||||||
|
| |||||||||||
Total income | 11,125,494 | |||||||||||
|
| |||||||||||
Expenses | ||||||||||||
Management fee | 1,383,249 | |||||||||||
Distribution fee(a) | 158 | |||||||||||
Interest expense | 1,084,664 | |||||||||||
Offering fees | 842,536 | |||||||||||
Professional fees | 244,507 | |||||||||||
Directors’ fees | 176,000 | |||||||||||
Transfer agent’s fees and expenses (including affiliated expense of $25,053)(a) | 128,421 | |||||||||||
Audit fee | 82,500 | |||||||||||
Custodian and accounting fees | 54,454 | |||||||||||
Registration fees | 35,456 | |||||||||||
Shareholders’ reports | 17,456 | |||||||||||
SEC registration fees | 10,400 | |||||||||||
Miscellaneous | 72,466 | |||||||||||
|
| |||||||||||
Total expenses | 4,132,267 | |||||||||||
Less: Expense reimbursement(a) | (1,131,863 | ) | ||||||||||
Management fee waiver | (1,278,886 | ) | ||||||||||
|
| |||||||||||
Net expenses | 1,721,518 | |||||||||||
|
| |||||||||||
Net investment income (loss) | 9,403,976 | |||||||||||
|
| |||||||||||
Realized And Unrealized Gain (Loss) On Investment And Foreign Currency Transactions | ||||||||||||
Net realized gain (loss) on: | ||||||||||||
Investment transactions | (387,215 | ) | ||||||||||
Futures transactions | (532,463 | ) | ||||||||||
Forward currency contract transactions | 970,778 | |||||||||||
Swap agreement transactions | 1,723,476 | |||||||||||
Foreign currency transactions | (36,200 | ) | ||||||||||
|
| |||||||||||
| 1,738,376 | ||||||||||||
|
| |||||||||||
Net change in unrealized appreciation (depreciation) on: | ||||||||||||
Investments | 498,666 | |||||||||||
Futures | (46,897 | ) | ||||||||||
Forward currency contracts | 523,747 | |||||||||||
Swap agreements | (450,844 | ) | ||||||||||
Foreign currencies | 7,193 | |||||||||||
Unfunded loan commitment | (3,588 | ) | ||||||||||
|
| |||||||||||
| 528,277 | ||||||||||||
|
| |||||||||||
Net gain (loss) on investment and foreign currency transactions | 2,266,653 | |||||||||||
|
| |||||||||||
Net Increase (Decrease) In Net Assets Resulting From Operations | $ | 11,670,629 | ||||||||||
|
| |||||||||||
See Notes to Financial Statements.
48
| (a) | Class specific expenses and waivers were as follows: |
| Class A | Class C | Class Z | ||||||||||
Distribution fee | 53 | 105 | — | |||||||||
Transfer agent’s fees and expenses | 45,212 | 41,818 | 41,391 | |||||||||
Expense reimbursement | (45,337) | (41,916) | (1,044,610 | ) | ||||||||
See Notes to Financial Statements.
PGIM Credit Income Fund 49
Statements of Changes in Net Assets
| Year Ended December 31, 2024 | December 11, 2023* through December 31, 2023 | ||||||||||||||||||||||||
Increase (Decrease) in Net Assets | |||||||||||||||||||||||||
Operations | |||||||||||||||||||||||||
Net investment income (loss) | $ | 9,403,976 | $ | 269,021 | |||||||||||||||||||||
Net realized gain (loss) on investment and foreign currency transactions | 1,738,376 | 13,673 | |||||||||||||||||||||||
Net change in unrealized appreciation (depreciation) on investments and foreign currencies | 528,277 | 616,612 | |||||||||||||||||||||||
|
|
|
| ||||||||||||||||||||||
Net increase (decrease) in net assets resulting from operations | 11,670,629 | 899,306 | |||||||||||||||||||||||
|
|
|
| ||||||||||||||||||||||
Dividends and Distributions | |||||||||||||||||||||||||
Distributions from distributable earnings | |||||||||||||||||||||||||
Class A | (967 | ) | (7 | ) | |||||||||||||||||||||
Class C | (883 | ) | (5 | ) | |||||||||||||||||||||
Class Z | (9,982,547 | ) | (47,433 | ) | |||||||||||||||||||||
|
|
|
| ||||||||||||||||||||||
| (9,984,397 | ) | (47,445 | ) | ||||||||||||||||||||||
|
|
|
| ||||||||||||||||||||||
Tax return of capital distributions | |||||||||||||||||||||||||
Class A | — | (43 | ) | ||||||||||||||||||||||
Class C | — | (40 | ) | ||||||||||||||||||||||
Class Z | — | (312,475 | ) | ||||||||||||||||||||||
|
|
|
| ||||||||||||||||||||||
| — | (312,558 | ) | |||||||||||||||||||||||
|
|
|
| ||||||||||||||||||||||
Fund share transactions | |||||||||||||||||||||||||
Net proceeds from shares sold | 30,002,669 | 70,000,000 | |||||||||||||||||||||||
Net asset value of shares issued in reinvestment of dividends and distributions | 7,901,237 | 360,003 | |||||||||||||||||||||||
Cost of shares purchased | (296 | ) | — | ||||||||||||||||||||||
|
|
|
| ||||||||||||||||||||||
Net increase (decrease) in net assets from Fund share transactions | 37,903,610 | 70,360,003 | |||||||||||||||||||||||
|
|
|
| ||||||||||||||||||||||
Total increase (decrease) | 39,589,842 | 70,899,306 | |||||||||||||||||||||||
Net Assets: | |||||||||||||||||||||||||
Beginning of period | 71,000,306 | 101,000 | |||||||||||||||||||||||
|
|
|
| ||||||||||||||||||||||
End of period | $ | 110,590,148 | $ | 71,000,306 | |||||||||||||||||||||
|
|
|
| ||||||||||||||||||||||
| * | Commencement of operations. |
See Notes to Financial Statements.
50
Statement of Cash Flows
For Year Ended December 31, 2024
Cash Flows Provided By / (Used For) Operating Activities: | ||||
Net increase (decrease) in net assets resulting from operations | $ | 11,670,629 | ||
|
| |||
Adjustments To Reconcile Net Increase (Decrease) In Net Assets Resulting From Operations To Net Cash Provided By / (Used For) Operating Activities: | ||||
Proceeds from disposition of long-term portfolio investments, net of amounts receivable | 72,072,284 | |||
Purchases of long-term portfolio investments, net of amounts payable | (157,589,283 | ) | ||
Net proceeds (purchases) of short-term portfolio investments | 18,490,657 | |||
Net premiums (paid) received for swap agreements | 1,791,704 | |||
Amortization of premium and accretion of discount on portfolio investments | (1,008,226 | ) | ||
Net realized (gain) loss on investment transactions | 387,215 | |||
Net realized (gain) loss on futures transactions | 532,463 | |||
Net realized (gain) loss on forward currency contract transactions | (970,778 | ) | ||
Net realized (gain) loss on swap agreement transactions | (1,723,476 | ) | ||
Net realized (gain) loss on foreign currency transactions | 36,200 | |||
Net change in unrealized (appreciation) depreciation on investments | (498,666 | ) | ||
Net change in unrealized (appreciation) depreciation on futures | 46,897 | |||
Net change in unrealized (appreciation) depreciation on forward currency contracts | (523,747 | ) | ||
Net change in unrealized (appreciation) depreciation on swap agreements | 450,844 | |||
Net change in unrealized (appreciation) depreciation on foreign currencies | (7,193 | ) | ||
Net change in unrealized (appreciation) depreciation on unfunded loan commitment | 3,588 | |||
(Increase) Decrease In Assets: | ||||
Dividends and interest receivable | (1,132,240 | ) | ||
Prepaid expenses | 593,459 | |||
Due from Manager | 575,936 | |||
Increase (Decrease) In Liabilities: | ||||
Interest payable | 984,000 | |||
Dividends payable | 1,180,720 | |||
Accrued expenses and other liabilities | (382,151 | ) | ||
Management fee payable | 40,457 | |||
Due to broker - variation margin futures | 9,078 | |||
Affiliated transfer agent fee payable | 2,073 | |||
Distribution fee payable | 3 | |||
Due to broker - variation margin swaps | (1,908 | ) | ||
|
| |||
Total adjustments | (66,640,090 | ) | ||
|
| |||
Net cash provided by (used for) operating activities | (54,969,461 | ) | ||
|
| |||
Effect of exchange rate changes on cash | 362,411 | |||
|
| |||
Cash Flows Provided By (Used For) Financing Activities: | ||||
Proceeds from Fund shares sold | 30,002,669 | |||
Payment of Fund shares repurchased | (296 | ) | ||
Reverse repurchase agreements | 27,102,113 | |||
Net asset value of shares issued in reinvestment of dividends | 7,901,237 | |||
Cash paid on distributions from distributable earnings | (9,984,397 | ) | ||
|
| |||
Net cash provided by (used for) financing activities | 55,021,326 | |||
|
| |||
Net increase (decrease) in cash and restricted cash, including foreign currency | 414,276 | |||
|
| |||
Cash and restricted cash at beginning of year, including foreign currency | 1,596,680 | |||
|
| |||
See Notes to Financial Statements.
PGIM Credit Income Fund 51
Statement of Cash Flows
For Year Ended December 31, 2024
Cash And Restricted Cash At End Of Year, Including Foreign Currency | $ | 2,010,956 | ||
|
| |||
Supplemental Disclosure of Cash Flow Information | ||||
Cash paid during the year for interest expense | $ | 100,664 | ||
|
|
Reconciliation Of Cash And Restricted Cash Reported With The Statement Of Assets And Liabilities To The Statement Of Cash Flows:
| December 31, 2024 | |||||
Cash | $ | 37,426 | |||
Foreign currency, at value | 800,572 | ||||
Restricted cash: | |||||
Cash segregated for counterparty - reverse repurchase agreements | 873,000 | ||||
Deposit with broker for centrally cleared/exchange-traded derivatives | 295,000 | ||||
Due from broker-variation margin swaps | 4,958 | ||||
|
| ||||
Total Cash and Restricted Cash, Including Foreign Currency | $ | 2,010,956 | |||
|
| ||||
See Notes to Financial Statements.
52
Financial Highlights
Class A Shares | ||||||||||||
| Year Ended December 31, 2024 | December 11, 2023(a) through December 31, 2023 | |||||||||||
Per Share Operating Performance(b): | ||||||||||||
Net Asset Value, Beginning of Period | $25.19 | $25.00 | ||||||||||
Income (loss) from investment operations: | ||||||||||||
Net investment income (loss) | 2.20 | 0.09 | ||||||||||
Net realized and unrealized gain (loss) on investments and foreign currency transactions | 0.54 | 0.22 | ||||||||||
Total from investment operations | 2.74 | 0.31 | ||||||||||
Less Dividends and Distributions: | ||||||||||||
Dividends from net investment income | (2.33) | -(c) | ||||||||||
Tax return of capital distributions | - | (0.11) | ||||||||||
Distributions from net realized gains | - | (0.01) | ||||||||||
Total dividends and distributions | (2.33) | (0.12) | ||||||||||
Net asset value, end of period | $25.60 | $25.19 | ||||||||||
Total Return(d): | 11.28% | 1.26% | ||||||||||
Ratios/Supplemental Data: | ||||||||||||
Net assets, end of year (000) | $11 | $10 | ||||||||||
Average net assets (000) | $11 | $10 | ||||||||||
Ratios to average net assets(e): | ||||||||||||
Expenses after waivers and/or expense reimbursement | 1.86%(f) | 0.75%(g) | ||||||||||
Expenses before waivers and/or expense reimbursement | 430.32%(f) | 13.72%(g) | ||||||||||
Net investment income (loss) | 8.59% | 6.39%(g) | ||||||||||
Portfolio turnover rate(h) | 55% | 1% | ||||||||||
Reverse repurchase agreements (000) | $27,102 | $- | ||||||||||
Reverse repurchase agreements asset coverage ratio(i) | 508% | —% | ||||||||||
Reverse repurchase agreements asset coverage per $1,000 of principal(i) | $5,080 | $- | ||||||||||
| (a) | Commencement of operations. |
| (b) | Calculated based on average shares outstanding during the period. |
| (c) | Amount rounds to zero. |
| (d) | Total return does not consider the effects of sales loads or redemption fees, if any. Total return is calculated assuming a purchase of a share on the first day and a sale on the last day of each period reported and includes reinvestment of dividends and distributions, if any. Total returns may reflect adjustments to conform to GAAP. Total returns for periods less than one full year are not annualized. |
| (e) | Does not include expenses of the underlying funds in which the Fund invests. |
| (f) | Includes interest expense on reverse repurchase agreements of 1.01% for the year ended December 31, 2024. |
| (g) | Annualized, with the exception of certain non-recurring expenses. |
| (h) | The Fund’s portfolio turnover rate is calculated in accordance with regulatory requirements, without regard to transactions involving short-term investments, certain derivatives and in-kind transactions (if any). If such transactions were included, the Fund’s portfolio turnover rate may be higher. |
| (i) | Represents value of net assets plus reverse repurchase agreements, if any, at the end of the period divided by the reverse repurchase agreements, if any, at the end of the period. |
See Notes to Financial Statements.
53
Financial Highlights (continued)
Class C Shares | ||||||||||||
| Year Ended December 31, 2024 | December 11, 2023(a) through December 31, 2023 | |||||||||||
Per Share Operating Performance(b): | ||||||||||||
Net Asset Value, Beginning of Period | $25.19 | $25.00 | ||||||||||
Income (loss) from investment operations: | ||||||||||||
Net investment income (loss) | 2.01 | 0.08 | ||||||||||
Net realized and unrealized gain (loss) on investments and foreign currency transactions | 0.54 | 0.22 | ||||||||||
Total from investment operations | 2.55 | 0.30 | ||||||||||
Less Dividends and Distributions: | ||||||||||||
Dividends from net investment income | (2.14) | -(c) | ||||||||||
Tax return of capital distributions | - | (0.11) | ||||||||||
Distributions from net realized gains | - | (-)(c) | ||||||||||
Total dividends and distributions | (2.14) | (0.11) | ||||||||||
Net asset value, end of period | $25.60 | $25.19 | ||||||||||
Total Return(d): | 10.40% | 1.22% | ||||||||||
Ratios/Supplemental Data: | ||||||||||||
Net assets, end of year (000) | $11 | $10 | ||||||||||
Average net assets (000) | $11 | $10 | ||||||||||
Ratios to average net assets(e): | ||||||||||||
Expenses after waivers and/or expense reimbursement | 2.61%(f) | 1.50%(g) | ||||||||||
Expenses before waivers and/or expense reimbursement | 400.40%(f) | 14.47%(g) | ||||||||||
Net investment income (loss) | 7.83% | 5.65%(g) | ||||||||||
Portfolio turnover rate(h) | 55% | 1% | ||||||||||
Reverse repurchase agreements (000) | $27,102 | $- | ||||||||||
Reverse repurchase agreements asset coverage ratio(i) | 508% | —% | ||||||||||
Reverse repurchase agreements asset coverage per $1,000 of principal(i) | $5,080 | $- | ||||||||||
| (a) | Commencement of operations. |
| (b) | Calculated based on average shares outstanding during the period. |
| (c) | Amount rounds to zero. |
| (d) | Total return does not consider the effects redemption fees, if any. Total return is calculated assuming a purchase of a share on the first day and a sale on the last day of each period reported and includes reinvestment of dividends and distributions, if any. Total returns may reflect adjustments to conform to GAAP. Total returns for periods less than one full year are not annualized. |
| (e) | Does not include expenses of the underlying funds in which the Fund invests. |
| (f) | Includes interest expense on reverse repurchase agreements of 1.01% for the year ended December 31, 2024. |
| (g) | Annualized, with the exception of certain non-recurring expenses. |
| (h) | The Fund’s portfolio turnover rate is calculated in accordance with regulatory requirements, without regard to transactions involving short-term investments, certain derivatives and in-kind transactions (if any). If such transactions were included, the Fund’s portfolio turnover rate may be higher. |
| (i) | Represents value of net assets plus reverse repurchase agreements, if any, at the end of the period divided by the reverse repurchase agreements, if any, at the end of the period. |
See Notes to Financial Statements.
54
Class Z Shares | ||||||||||||
| Year Ended December 31, 2024 | December 11, 2023(a) through December 31, 2023 | |||||||||||
Per Share Operating Performance(b): | ||||||||||||
Net Asset Value, Beginning of Period | $25.19 | $25.00 | ||||||||||
Income (loss) from investment operations: | ||||||||||||
Net investment income (loss) | 2.27 | 0.10 | ||||||||||
Net realized and unrealized gain (loss) on investments and foreign currency transactions | 0.54 | 0.22 | ||||||||||
Total from investment operations | 2.81 | 0.32 | ||||||||||
Less Dividends and Distributions: | ||||||||||||
Dividends from net investment income | (2.39) | (0.01) | ||||||||||
Tax return of capital distributions | - | (0.11) | ||||||||||
Distributions from net realized gains | - | (0.01) | ||||||||||
Total dividends and distributions | (2.39) | (0.13) | ||||||||||
Net asset value, end of period | $25.61 | $25.19 | ||||||||||
Total Return(c): | 11.55% | 1.27% | ||||||||||
Ratios/Supplemental Data: | ||||||||||||
Net assets, end of year (000) | $110,569 | $70,980 | ||||||||||
Average net assets (000) | $106,451 | $70,609 | ||||||||||
Ratios to average net assets(d): | ||||||||||||
Expenses after waivers and/or expense reimbursement | 1.62%(e) | 0.50%(f) | ||||||||||
Expenses before waivers and/or expense reimbursement | 3.80%(e) | 4.86%(f) | ||||||||||
Net investment income (loss) | 8.83% | 6.62%(f) | ||||||||||
Portfolio turnover rate(g) | 55% | 1% | ||||||||||
Reverse repurchase agreements (000) | $27,102 | $- | ||||||||||
Reverse repurchase agreements asset coverage ratio(h) | 508% | —% | ||||||||||
Reverse repurchase agreements asset coverage per $1,000 of principal(h) | $5,080 | $- | ||||||||||
| (a) | Commencement of operations. |
| (b) | Calculated based on average shares outstanding during the period. |
| (c) | Total return does not consider the effects redemption fees, if any. Total return is calculated assuming a purchase of a share on the first day and a sale on the last day of each period reported and includes reinvestment of dividends and distributions, if any. Total returns may reflect adjustments to conform to GAAP. Total returns for periods less than one full year are not annualized. |
| (d) | Does not include expenses of the underlying funds in which the Fund invests. |
| (e) | Includes interest expense on reverse repurchase agreements of 1.02% for the year ended December 31, 2024. |
| (f) | Annualized, with the exception of certain non-recurring expenses. |
| (g) | The Fund’s portfolio turnover rate is calculated in accordance with regulatory requirements, without regard to transactions involving short-term investments, certain derivatives and in-kind transactions (if any). If such transactions were included, the Fund’s portfolio turnover rate may be higher. |
| (h) | Represents value of net assets plus reverse repurchase agreements, if any, at the end of the period divided by the reverse repurchase agreements, if any, at the end of the period. |
See Notes to Financial Statements.
55
Notes to Financial Statements
| 1. | Organization |
PGIM Credit Income Fund, a Delaware statutory trust (the “Fund”), is a recently organized, diversified, closed-end management investment company registered under the Investment Company Act of 1940, as amended (the “1940 Act”) that continuously offers its common shares of beneficial interest, par value $0.001 per share (“Common Shares”), and is operated as an “interval fund.” The Fund elected to be treated for federal income tax purposes, and intends to qualify annually thereafter, as a regulated investment company (“RIC”) as defined under Subchapter M of the Internal Revenue Code of 1986, as amended (the “Code”). The Fund commenced operations on December 11, 2023.
The Fund does not currently intend to list its Common Shares for trading on any securities exchange or any other trading market in the near future. There is currently no secondary market for its Common Shares and the Fund does not expect any secondary market to develop for its Common Shares. Shareholders of the Fund are not able to have their Common Shares redeemed or otherwise sell their Common Shares on a daily basis because the Fund is an unlisted closed-end fund. In order to provide liquidity to shareholders, the Fund is structured as an “interval fund” and conducts periodic repurchase offers for a portion of its outstanding Common Shares.
The Fund’s investment objective is to seek total return, through a combination of current income and capital appreciation.
During the reporting period, the Fund adopted FASB Accounting Standards Update 2023-07, Segment Reporting (Topic 280) - Improvements to Reportable Segment Disclosures (“ASU 2023-07”). Adoption of ASU 2023-07 exclusively impacted financial statement disclosures only and did not affect the Fund’s financial position or performance. The intent of ASU 2023-07 is, through improved segment disclosures, to enable investors to better understand an entity’s overall performance. PGIM Investments LLC (“PGIM Investments” or the “Manager”) acts as the Fund’s chief operating decision maker (“CODM”). The CODM has determined that the Fund has a single operating segment as the CODM monitors the operating results of the Fund as a whole and the Fund’s long-term strategic asset allocation is pre-determined in accordance with the terms of its respective prospectus, based on a defined investment strategy which is executed by the Fund’s sub-advisor.
The CODM allocates resources and assesses performance based on the operating results of the Fund, which is consistent with the results presented in the Fund’s Schedule of Investments, Statement of Changes in Net Assets and Financial Highlights.
56
| 2. | Accounting Policies |
The Fund follows the investment company accounting and reporting guidance of the Financial Accounting Standards Board (“FASB”) Accounting Standard Codification (“ASC”) Topic 946 Financial Services — Investment Companies. The following is a summary of significant accounting policies followed by the Fund in the preparation of its financial statements. The policies conform to U.S. generally accepted accounting principles (“GAAP”). The Fund consistently follows such policies in the preparation of its financial statements.
Securities Valuation: The Fund holds securities and other assets and liabilities that are fair valued as of the close of each day (generally, 4:00 PM Eastern time) the New York Stock Exchange (“NYSE”) is open for trading. As described in further detail below, the Fund’s investments are valued daily based on a number of factors, including the type of investment and whether market quotations are readily available. The Fund’s Board of Trustees (the “Board”) has approved the Fund’s valuation policies and procedures for security valuation and designated PGIM Investments LLC (“PGIM Investments” or the “Manager”) as the “Valuation Designee,” as defined by Rule 2a-5(b) under the 1940 Act, to perform the fair value determination relating to all Fund investments. Pursuant to the Board’s oversight, the Valuation Designee has established a Valuation Committee to perform the duties and responsibilities of the Valuation Designee under Rule 2a-5. The valuation procedures permit the Fund to utilize independent pricing vendor services, quotations from market makers, and alternative valuation methods when market quotations are either not readily available or not deemed representative of fair value. Fair value is the estimated price that would be received to sell an asset or paid to transfer a liability in an orderly transaction between market participants on the measurement date.
For the fiscal reporting year-end, securities and other assets and liabilities were fair valued at the close of the last U.S. business day. Trading in certain foreign securities may occur when the NYSE is closed (including weekends and holidays). Because such foreign securities trade in markets that are open on weekends and U.S. holidays, the values of some of the Fund’s foreign investments may change on days when investors cannot purchase or sell Fund shares.
Various inputs determine how the Fund’s investments are valued, all of which are categorized according to the three broad levels (Level 1, 2, or 3) detailed in the Schedule of Investments and referred to herein as the “fair value hierarchy” in accordance with FASB ASC Topic 820 Fair Value Measurement.
Common or preferred stocks, exchange-traded funds (“ETFs”) and derivative instruments, if applicable, that are traded on a national securities exchange are valued at the last sale price as of the close of trading on the applicable exchange where the security principally trades. Securities traded via NASDAQ are valued at the NASDAQ official closing price. To the extent these securities are valued at the last sale price or NASDAQ official closing price, they are classified as Level 1 in the fair value hierarchy. In the event that no sale or official closing price on a valuation date exists, these securities are generally valued at the mean between
PGIM Credit Income Fund 57
Notes to Financial Statements (continued)
the last reported bid and ask prices, or at the last bid price in the absence of an ask price. These securities are classified as Level 2 in the fair value hierarchy.
Investments in open-end funds (other than ETFs) are valued at their net asset values as of the close of the NYSE on the date of valuation. These securities are classified as Level 1 in the fair value hierarchy since they may be purchased or sold at their net asset values on the date of valuation.
Fixed income securities traded in the over-the-counter (“OTC”) market are generally classified as Level 2 in the fair value hierarchy. Such fixed income securities are typically valued using the market approach which generally involves obtaining data from an approved independent third-party vendor source. The Fund utilizes the market approach as the primary method to value securities when market prices of identical or comparable instruments are available. The third-party vendors’ valuation techniques used to derive the evaluated bid price are based on evaluating observable inputs, including but not limited to, yield curves, yield spreads, credit ratings, deal terms, tranche level attributes, default rates, cash flows, prepayment speeds, broker/dealer quotations and reported trades. Certain Level 3 securities are also valued using the market approach when obtaining a single broker quote or when utilizing transaction prices for identical securities that have been used in excess of five business days. During the reporting period, there were no changes to report with respect to the valuation approach and/or valuation techniques discussed above.
Floating rate and other loans are generally valued at prices provided by approved independent pricing vendors. The pricing vendors utilize broker/dealer quotations and provide prices based on the average of such quotations. Floating rate and other loans valued using such vendor prices are generally classified as Level 2 in the fair value hierarchy. Floating rate and other loans valued based on a single broker quote or at the original transaction price in excess of five business days are classified as Level 3 in the fair value hierarchy.
OTC and centrally cleared derivative instruments are generally classified as Level 2 in the fair value hierarchy. Such derivative instruments are typically valued using the market approach and/or income approach which generally involves obtaining data from an approved independent third-party vendor source. The Fund utilizes the market approach when quoted prices in broker-dealer markets are available but also includes consideration of alternative valuation approaches, including the income approach. In the absence of reliable market quotations, the income approach is typically utilized for purposes of valuing derivatives such as interest rate swaps based on a discounted cash flow analysis whereby the value of the instrument is equal to the present value of its future cash inflows or outflows. Such analysis includes projecting future cash flows and determining the discount rate (including the present value factors that affect the discount rate) used to discount the future
58
cash flows. In addition, the third-party vendors’ valuation techniques used to derive the evaluated derivative price is based on evaluating observable inputs, including but not limited to, underlying asset prices, indices, spreads, interest rates and exchange rates. Certain derivatives may be classified as Level 3 when valued using the market approach by obtaining a single broker quote or when utilizing unobservable inputs in the income approach. During the reporting period, there were no changes to report with respect to the valuation approach and/or valuation techniques discussed above.
Securities and other assets that cannot be priced according to the methods described above are valued based on policies and procedures approved by the Board. In the event that unobservable inputs are used when determining such valuations, the securities will be classified as Level 3 in the fair value hierarchy. Altering one or more unobservable inputs may result in a significant change to a Level 3 security’s fair value measurement.
When determining the fair value of securities, some of the factors influencing the valuation include: the nature of any restrictions on disposition of the securities; assessment of the general liquidity of the securities; the issuer’s financial condition and the markets in which it does business; the cost of the investment; the size of the holding and the capitalization of the issuer; the prices of any recent transactions or bids/offers for such securities or any comparable securities; and any available analyst media or other reports or information deemed reliable by the Valuation Designee regarding the issuer or the markets or industry in which it operates. Using fair value to price securities may result in a value that is different from a security’s most recent closing price and from the price used by other unaffiliated mutual funds to calculate their net asset values.
Foreign Currency Translation: The books and records of the Fund are maintained in U.S. dollars. Foreign currency amounts are translated into U.S. dollars on the following basis:
(i) market value of investment securities, other assets and liabilities — at the exchange rate as of the valuation date;
(ii) purchases and sales of investment securities, income and expenses — at the rates of exchange prevailing on the respective dates of such transactions.
Although the net assets of the Fund are presented at the foreign exchange rates and market values at the close of the period, the Fund does not generally isolate that portion of the results of operations arising as a result of changes in the foreign exchange rates from the fluctuations arising from changes in the market prices of long-term portfolio securities held at the end of the period. Similarly, the Fund does not isolate the effect of changes in foreign exchange rates from the fluctuations arising from changes in the market prices of long-term portfolio securities sold during the period. Accordingly, holding period unrealized and realized foreign currency gains (losses) are included in the reported net change in unrealized appreciation (depreciation) on investments and net realized gains (losses) on investment transactions on the Statements of Operations.
PGIM Credit Income Fund 59
Notes to Financial Statements (continued)
Net realized gains (losses) on foreign currency transactions represent net foreign exchange gains (losses) from the disposition of holdings of foreign currencies, currency gains (losses) realized between the trade and settlement dates on investment transactions, and the difference between the amounts of interest, dividends and foreign withholding taxes recorded on the Fund’s books and the U.S. dollar equivalent amounts actually received or paid. Net unrealized currency gains (losses) arise from valuing foreign currency denominated assets and liabilities (other than investments) at period end exchange rates.
Forward and Cross Currency Contracts: A forward currency contract is a commitment to purchase or sell a foreign currency at a future date at a negotiated forward rate. The Fund enters into forward currency contracts, as defined in the prospectus, in order to hedge its exposure to changes in foreign currency exchange rates on its foreign portfolio holdings or on specific receivables and payables denominated in a foreign currency and to gain exposure to certain currencies. The contracts are valued daily at current forward exchange rates and any unrealized gain (loss) is included in net unrealized appreciation or depreciation on forward and cross currency contracts. Gain (loss) is realized on the settlement date of the contract equal to the difference between the settlement value of the original and negotiated forward contracts. This gain (loss), if any, is included in net realized gain (loss) on forward and cross currency contract transactions. Risks may arise upon entering into these contracts from the potential inability of the counterparties to meet the terms of their contracts. Forward currency contracts involve risks from currency exchange rate and credit risk in excess of the amounts reflected on the Statement of Assets and Liabilities. The Fund’s maximum risk of loss from counterparty credit risk is the net value of the cash flows to be received from the counterparty at the end of the contract’s life. A cross currency contract is a forward contract where a specified amount of one foreign currency will be exchanged for a specified amount of another foreign currency.
Financial Futures Contracts: A financial futures contract is an agreement to purchase (long) or sell (short) an agreed amount of securities at a set price for delivery on a future date. Upon entering into a financial futures contract, the Fund is required to deposit collateral with a futures commission merchant an amount of cash and/or other assets equal to a certain percentage of the contract amount. This amount is known as the “initial margin.” Subsequent payments, known as “variation margin,” are made or received by the Fund each day, equal to the change in the mark-to-market value of the futures contract. Such variation margin is recorded for financial statement purposes on a daily basis as unrealized gain (loss). When the contract expires or is closed, the gain (loss) is realized and is presented in the Statement of Operations as net realized gain (loss) on futures transactions.
The Fund invested in financial futures contracts in order to hedge its existing portfolio securities, or securities the Fund intends to purchase, against fluctuations in value caused by changes in prevailing interest rates. Should interest rates move unexpectedly, the Fund
60
may not achieve the anticipated benefits of the financial futures contracts and may realize a loss. The use of futures transactions involves the risk of imperfect correlation in movements in the price of futures contracts, interest rates and the underlying hedged assets. Since futures contracts are exchange-traded, there is minimal counterparty credit risk to the Fund since the exchanges’ clearinghouse acts as counterparty to all exchange-traded futures and guarantees the futures contracts against default.
Swap Agreements: The Fund entered into certain types of swap agreements detailed in the disclosures below. A swap agreement is an agreement to exchange the return generated by one instrument for the return generated by another instrument. Swap agreements are negotiated in the OTC market and may be executed either directly with a counterparty (“OTC-traded”) or through a central clearing facility, such as a registered exchange. Swap agreements are valued daily at current market value and any change in value is included in the net unrealized appreciation or depreciation on swap agreements. Centrally cleared swaps pay or receive an amount known as “variation margin”, based on daily changes in the valuation of the swap contract. For OTC-traded, upfront premiums paid and received are shown as swap premiums paid and swap premiums received in the Statement of Assets and Liabilities. Risk of loss may exceed amounts recognized on the Statement of Assets and Liabilities. Swap agreements outstanding at period end, if any, are listed on the Schedule of Investments.
Credit Default Swaps (“CDS”): CDS involve one party (the protection buyer) making a stream of payments to another party (the protection seller) in exchange for the right to receive a specified payment in the event of a default or as a result of a default (collectively, a “credit event”) for the referenced entity (typically corporate issues or sovereign issues of an emerging country) on its obligation; or in the event of a write-down, principal shortfall, interest shortfall or default of all or part of the referenced entities comprising a credit index.
The Fund is subject to credit risk in the normal course of pursuing its investment objectives, and as such, has entered into CDS contracts to provide a measure of protection against defaults or to take an active long or short position with respect to the likelihood of a particular issuer’s default or the reference entity’s credit soundness. CDS contracts generally trade based on a spread which represents the cost a protection buyer has to pay the protection seller. The protection buyer is said to be “short the credit” because the higher the contract value rises, the more the credit deteriorates. The value of the CDS contract increases for the protection buyer if the spread increases. The Fund’s maximum risk of loss from counterparty credit risk for purchased CDS is the inability of the counterparty to honor the contract up to the notional value due to a credit event.
As a seller of protection on credit default swap agreements, the Fund generally receives an agreed upon payment from the buyer of protection throughout the term of the swap, provided no credit event occurs. As the seller, the Fund effectively increases its investment risk because, in addition to its total net assets, the Fund may be subject to investment exposure on the notional amount of the swap.
PGIM Credit Income Fund 61
Notes to Financial Statements (continued)
The maximum amount of the payment that the Fund, as a seller of protection, could be required to make under a credit default swap agreement would be equal to the notional amount of the underlying security or index contract as a result of a credit event. This potential amount will be partially offset by any recovery values of the respective referenced obligations or net amounts received from the settlement of buy protection credit default swap agreements which the Fund entered into for the same referenced entity or index. As a buyer of protection, the Fund generally receives an amount up to the notional value of the swap if a credit event occurs.
Implied credit spreads, represented in absolute terms, utilized in determining the market value of credit default swap agreements where the Fund is the seller of protection as of period end are disclosed in the footnotes to the Schedule of Investments, if applicable. These spreads serve as indicators of the current status of the payment/performance risk and represent the likelihood of default risk for the credit derivative. The implied credit spread of a particular referenced entity reflects the cost of buying/selling protection and may include upfront payments required to enter into the agreement. Wider credit spreads and increased market value in absolute terms, when compared to the notional amount of the swap, represent a deterioration of the referenced entity’s credit soundness and a greater likelihood of risk of default or other credit event occurring as defined under the terms of the agreement.
Total Return Swaps: In a total return swap, one party receives payments based on the market value of the security or the commodity involved, or total return of a specific referenced asset, such as an equity, index or bond, and in return pays a defined amount. The Fund is subject to risk exposures associated with the referenced asset in the normal course of pursuing its investment objectives. The Fund entered into total return swaps to manage its exposure to a security or an index. The Fund’s maximum risk of loss from counterparty credit risk is the change in the value of the security, in the Fund’s favor, from the point of entering into the contract.
Floating Rate and Other Loans: The Fund invested in floating rate and other loans. Floating rate and other loans include loans that are privately negotiated between a corporate borrower and one or more financial institutions, including, but not limited to, term loans, revolvers, and other instruments issued in the floating rate and other loans market. The Fund acquires interests in loans directly (by way of assignment from the selling institution) and/or indirectly (by way of the purchase of a participation interest from the selling institution). Under a floating rate and other loans assignment, the Fund generally will succeed to all the rights and obligations of an assigning lending institution and become a lender under the loan agreement with the relevant borrower in connection with that loan. Under a floating rate and other loans participation, the Fund generally will have a contractual relationship only with the lender, not with the relevant borrower. As a result, the
62
Fund generally will have the right to receive payments of principal, interest, and any fees to which they are entitled only from the lender selling the participation and only upon receipt by the lender of the payments from the relevant borrower. The Fund may not directly benefit from the collateral supporting the debt obligation in which they have purchased the participation. As a result, the Fund will assume the credit risk of both the borrower and the institution selling the participation to the Fund.
Reverse Repurchase Agreements: The Fund enters reverse repurchase agreements with qualified third-party broker-dealers in which the Fund sells securities to a bank or broker-dealer and agrees to repurchase the same securities at a mutually agreed upon date and price. The Fund receives securities and/or cash as collateral with a market value in-excess of the repurchase price to be paid by the Fund upon the maturity of the transaction. During the term of the agreement, the Fund continues to receive the principal and interest payments on the securities sold. Certain agreements have no stated maturity and can be terminated by either party at any time. Due to the short-term nature of reverse repurchase agreements, face value approximates fair value. Cash received in exchange for securities delivered plus accrued interest due to the counterparty is recorded as a liability in the Statement of Assets and Liabilities. Interest payments made by the Fund to the counterparties are recorded as a component of interest expense in the Statement of Operations.
Mortgage-Backed and Asset-Backed Securities: Mortgage-backed securities are pass-through securities, meaning that principal and interest payments made by the borrower on the underlying mortgages are passed through to the Fund. Asset-backed securities directly or indirectly represent a participation interest in, or are secured by and payable from, a stream of payments generated by particular assets such as motor vehicle or credit card receivables. Asset-backed securities may be classified as pass-through certificates or collateralized obligations, such as collateralized bond obligations, collateralized loan obligations and other similarly structured securities. The value of mortgage-backed and asset-backed securities varies with changes in interest rates and may be affected by changes in credit quality or value of the mortgage loans or other assets that support the securities.
Stripped mortgage-backed securities are usually structured with two classes that receive different proportions of the interest (“IO”) and principal (“PO”) distributions on a pool of mortgage assets. Payments received for IOs are included in interest income on the Statements of Operations. Because no principal will be received at the maturity of an IO, adjustments are made to the cost of the security on a monthly basis until maturity. These adjustments are included in interest income on the Statements of Operations. Payments received for POs are treated as reductions to the cost and par value of the securities.
Master Netting Arrangements: The Fund is subject to various Master Agreements, or netting arrangements, with select counterparties. These are agreements which a subadviser may have negotiated and entered into on behalf of all or a portion of the Fund. A master netting arrangement between the Fund and the counterparty permits the Fund to offset amounts
PGIM Credit Income Fund 63
Notes to Financial Statements (continued)
payable by the Fund to the same counterparty against amounts to be received and by the receipt of collateral from the counterparty by the Fund to cover the Fund’s exposure to the counterparty. However, there is no assurance that such mitigating factors are easily enforceable. In addition to master netting arrangements, the right to set-off exists when all the conditions are met such that each of the parties owes the other determinable amounts, the reporting party has the right to set-off the amount owed with the amount owed by the other party, the reporting party intends to set-off and the right of set-off is enforceable by law.
The Fund is a party to International Swaps and Derivatives Association, Inc. (“ISDA”) Master Agreements with certain counterparties that govern OTC derivative and foreign exchange contracts entered into from time to time. The Master Agreements may contain provisions regarding, among other things, the parties’ general obligations, representations, agreements, collateral requirements, events of default and early termination. With respect to certain counterparties, in accordance with the terms of the Master Agreements, collateral posted to the Fund is held in a segregated account by the Fund’s custodian and with respect to those amounts which can be sold or re-pledged, is presented in the Schedule of Investments. Collateral pledged by the Fund is segregated by the Fund’s custodian and identified in the Schedule of Investments. Collateral can be in the form of cash or debt securities issued by the U.S. Government or related agencies or other securities as agreed to by the Fund and the applicable counterparty. Collateral requirements are determined based on the Fund’s net position with each counterparty. Termination events applicable to the Fund may occur upon a decline in the Fund’s net assets below a specified threshold over a certain period of time. Termination events applicable to counterparties may occur upon a decline in the counterparty’s long-term and short-term credit ratings below a specified level. In each case, upon occurrence, the other party may elect to terminate early and cause settlement of all derivative and foreign exchange contracts outstanding, including the payment of any losses and costs resulting from such early termination, as reasonably determined by the terminating party. Any decision by one or more of the Fund’s counterparties to elect early termination could impact the Fund’s future derivative activity.
In addition to each instrument’s primary underlying risk exposure (e.g. interest rate, credit, equity or foreign exchange, etc.), swap agreements involve, to varying degrees, elements of credit, market and documentation risk. Such risks involve the possibility that no liquid market for these agreements will exist, the counterparty to the agreement may default on its obligation to perform or disagree on the contractual terms of the agreement, and changes in net interest rates will be unfavorable. In connection with these agreements, securities in the portfolio may be identified or received as collateral from the counterparty in accordance with the terms of the respective swap agreements to provide or receive assets of value and to serve as recourse in the event of default or bankruptcy/insolvency of either party. Such OTC derivative agreements include conditions which, when materialized, give the counterparty
64
the right to cause an early termination of the transactions under those agreements. Any election by the counterparty for early termination of the contract(s) may impact the amounts reported on financial statements.
Short sales and OTC contracts, including forward foreign currency exchange contracts, swaps, forward rate agreements and written options involve elements of both market and credit risk in excess of the amounts reflected on the Statement of Assets and Liabilities, if applicable. Such risks may be mitigated by engaging in master netting arrangements.
Delayed-Delivery Transactions: The Fund purchased or sold securities on a when-issued or delayed-delivery and forward commitment basis, including TBA securities. These transactions involve a commitment by the Fund to purchase or sell securities for a predetermined price or yield, with payment and delivery taking place beyond the customary settlement period. When delayed-delivery purchases are outstanding, the Fund will set aside and maintain an amount of liquid assets sufficient to meet the purchase price in a segregated account until the settlement date. When purchasing a security on a delayed-delivery basis, the Fund assumes the rights and risks of ownership of the security, including the risk of price and yield fluctuations, and takes such fluctuations into account when determining its net asset value (“NAV”). The Fund may dispose of or renegotiate a delayed-delivery transaction subsequent to establishment, and may sell when-issued securities before they are delivered, which may result in a realized gain (loss). When selling a security on a delayed-delivery basis, the Fund forfeits its eligibility to realize future gains (losses) with respect to the security.
Securities Transactions and Net Investment Income: Securities transactions are recorded on the trade date. Realized gains (losses) from investment and currency transactions are calculated on the specific identification method. Dividend income is recorded on the ex-date, or for certain foreign securities, when the Fund becomes aware of such dividends. Interest income, including amortization of premium and accretion of discount on debt securities, as required, is recorded on the accrual basis. Expenses are recorded on an accrual basis, which may require the use of certain estimates by management that may differ from actual expense amounts. Net investment income or loss (other than class specific expenses and waivers, which are allocated as noted below) and unrealized and realized gains (losses) are allocated daily to each class of shares based upon the relative proportion of adjusted net assets of each class at the beginning of the day. Class specific expenses and waivers, where applicable, are charged to the respective share classes. Such class specific expenses and waivers include distribution fees and distribution fee waivers, shareholder servicing fees, transfer agent’s fees and expenses, and fee waivers and/or expense reimbursements, as applicable.
Offering and Organization Costs: Offering costs paid in connection with the initial offering of shares of the Fund are being amortized on a straight-line basis over twelve months from the date of commencement of operations. Organization costs paid in connection with the organization of the Fund were expensed as incurred.
PGIM Credit Income Fund 65
Notes to Financial Statements (continued)
Taxes: It is the Fund’s policy to continue to meet the requirements of the Code applicable to RICs and to distribute all of its taxable net investment income and capital gains, if any, to its shareholders. Therefore, no federal income tax provision is required. Withholding taxes on foreign dividends, interest and capital gains, if any, are recorded, net of reclaimable amounts, at the time the related income is earned.
Cash and Cash Equivalents: Cash represents cash deposits held at financial institutions, which at times may exceed U.S. federally insured limits. The Fund’s deposits are held at financial institutions with high credit-quality to minimize credit risk exposure. Cash equivalents consist of other highly liquid investments, such as money market funds. Cash and cash equivalents are carried at cost, which approximates fair value.
Dividends and Distributions: Dividends and distributions to shareholders, which are determined in accordance with federal income tax regulations and which may differ from GAAP, are recorded on the ex-date. Permanent book/tax differences relating to income and gain (loss) are reclassified between total distributable earnings (loss) and paid-in capital in excess of par, as appropriate. The chart below sets forth the expected frequency of dividend and capital gains distributions to shareholders. Various factors may impact the frequency of dividend distributions to shareholders, including but not limited to adverse market conditions or portfolio holding-specific events.
| Expected Distribution Schedule to Shareholders* | Frequency | |||
Net Investment Income | Monthly | |||
Short-Term Capital Gains | Annually | |||
Long-Term Capital Gains | Annually | |||
| * | Under certain circumstances, the Fund may make more than one distribution of short-term and/or long-term capital gains during a fiscal year. |
Estimates: The preparation of financial statements requires management to make estimates and assumptions that affect the reported amounts and disclosures in the financial statements. Actual results could differ from those estimates.
| 3. | Agreements |
The Fund has entered into a management agreement (the “Management Agreement”) with the Manager pursuant to which it has responsibility for all investment advisory services, including supervision of the subadviser’s performance of such services, and for rendering administrative services.
66
The Manager has entered into a subadvisory agreement with PGIM, Inc., which provides subadvisory services to the Fund through its business unit PGIM Fixed Income, and PGIM Limited (collectively, the “subadviser”). The Manager pays for the services of the subadviser.
Fees payable under the Management Agreement are computed daily and paid monthly. For the reporting period ended December 31, 2024, the contractual and effective management fee rates were as follows:
| Contractual Management Rate | Effective Management Fee, before any waivers and/or expense reimbursements | |
| 1.10% of average daily total managed assets | 1.10% | |
“Total managed assets” means total assets of the Fund (including any assets attributable to any reverse repurchase agreements, dollar rolls, borrowings and any preferred shares that may be outstanding, if issued) minus the sum of (i) accrued liabilities of the Fund (other than liabilities for money borrowed, including the liquidation preference of any outstanding preferred shares, and principal on notes and other debt securities issued by the Fund), (ii) any accrued and unpaid interest on money borrowed and (iii) accumulated dividends on any outstanding common shares and preferred shares issued by the Fund. For purposes of this calculation, average daily value of the Fund’s total managed assets is determined at the end of each month on the basis of the average value of the Fund’s total managed assets of the Fund for each day during the month.
The Manager had contractually agreed to waive its Management Fee (as defined below) until December 6, 2024, one year from the effective date of the Fund’s registration statement (the “Waiver Period”). Following the Waiver Period, the Manager began to receive a Management Fee (the “Management Fee”), payable at the end of each month, at an annual rate of 1.10% of the average daily value of the Fund’s total managed assets.
Pursuant to an Expense Limitation and Reimbursement Agreement, for three years from effectiveness of the Fund’s registration statement (the “ELRA Period”), the Manager has contractually agreed to waive its fees and/or reimburse expenses of the Fund so that the Fund’s Specified Expenses (as defined below) will not exceed 0.50% of net assets (annualized). The Fund has agreed to repay these amounts, when and if requested by the Manager, but only if and to the extent that Specified Expenses are less than 0.50% of net assets (annualized) (or, if a lower expense limit is then in effect, such lower limit) within three years after the date the Manager waived or reimbursed such fees or expenses. In no event will the Fund’s Specified Expenses exceed 0.50% of net assets (annualized) during the ELRA Period notwithstanding any repayment made by the Fund pursuant to the ELRA. This arrangement cannot be terminated without the consent of the Fund’s Board prior to the
PGIM Credit Income Fund 67
Notes to Financial Statements (continued)
end of the ELRA Period. As of December 31, 2024, under the ELRA, the amount eligible for potential recoupment with respective expiration dates are as follows:
| Expiration Date | Recoupment Amount | |
December 31, 2026 | $ 575,936 | |
December 31, 2027 | 1,131,863 | |
Total fee waivers/expense reimbursements subject to recapture | $1,707,799 | |
“Specified Expenses” includes all expenses incurred in the business of the Fund, including organizational and offering costs, with the exception of: (i) the Management Fee, (ii) the distribution and servicing fee (the “Distribution and Service Fee”), (iii) brokerage costs or other investment-related out-of-pocket expenses, including with respect to unconsummated investments, (iv) dividend/interest payments (including any dividend payments, interest expenses, commitment fees, or other expenses related to any leverage incurred by the Fund), (v) taxes, and (vi) extraordinary expenses (as determined in the sole discretion of the Manager).
The Fund has a distribution agreement with Prudential Investment Management Services LLC (“PIMS”), which acts as the distributor of the Class A, Class C and Class Z shares of the Fund. The Fund compensates PIMS for distributing and servicing the Fund’s Class A and Class C shares, pursuant to the plans of distribution (the “Distribution Plans”), regardless of expenses actually incurred by PIMS.
Pursuant to the Distribution Plans, the Fund compensates PIMS for distribution related activities at an annual rate based on average daily net assets per class. The distribution fees are accrued daily and payable monthly.
The Fund’s annual gross and net distribution rates, where applicable, are as follows:
| Class | Gross Distribution Fee | Net Distribution Fee | ||||||||
| A* | 0.75 | % | 0.75% | |||||||
| C | 1.00 | 1.00 | ||||||||
| Z | N/A | N/A | ||||||||
| * | Prior to July 1, 2024, the Fund’s Class A Shares were subject to a Distribution and Servicing Fee of 0.25%. |
For the year ended December 31, 2024, PIMS did not receive any front-end sales charges resulting from sales of Class A shares, contingent deferred sales charges (“CDSC”) imposed upon redemptions by certain shareholders, or early redemption fees resulting from redemptions of certain share classes.
PGIM Investments, PGIM, Inc., PGIM Limited, and PIMS are indirect, wholly-owned
68
subsidiaries of Prudential Financial, Inc. (“Prudential”).
| 4. | Other Transactions with Affiliates |
Prudential Mutual Fund Services LLC (“PMFS”), an affiliate of PGIM Investments and an indirect, wholly-owned subsidiary of Prudential, serves as the Fund’s transfer agent and shareholder servicing agent. Transfer agent’s fees and expenses in the Statement of Operations include certain out-of-pocket expenses paid to non-affiliates, where applicable.
The Fund may invest its overnight sweep cash in the PGIM Core Ultra Short Bond Fund (the “Core Fund”), a series of Prudential Investment Portfolios 2, registered under the 1940 Act and managed by PGIM Investments. PGIM Investments and/or its affiliates are paid fees or reimbursed for providing their services to the Core Fund. In addition to the realized and unrealized gains on investments in the Core Fund, earnings from such investments are disclosed on the Statement of Operations as “Affiliated dividend income”. Effective July 2024, the Fund changed its overnight cash sweep vehicle from the PGIM Core Government Money Market Fund, a series of Prudential Government Money Market Fund, Inc., registered under the 1940 Act and managed by PGIM Investments.
The Fund may enter into certain securities purchase or sale transactions under Board approved Rule 17a-7 procedures. Rule 17a-7 is an exemptive rule under the 1940 Act that, subject to certain conditions, permits purchase and sale transactions among affiliated investment companies, or between an investment company and a person that is affiliated solely by reason of having a common (or affiliated) investment adviser, common directors/trustees, and/or common officers. For the year ended December 31, 2024, no Rule 17a-7 transactions were entered into by the Fund.
| 5. | Portfolio Securities |
The aggregate cost of purchases and proceeds from sales of portfolio securities (excluding short-term investments and U.S. Government securities) for the year ended December 31, 2024, were as follows:
| Cost of Purchases | Proceeds from Sales | |
$138,772,009 | $67,836,589 | |
A summary of the cost of purchases and proceeds from sales of shares of affiliated mutual funds for the year ended December 31, 2024, is presented as follows:
| Value, Beginning of Year | Cost of Purchases | Proceeds from Sales | Change in Gain (Loss) | Realized Gain (Loss) | Value, End of Year | Shares, End of Year | Income | |||||||||
| Short-Term Investments - Affiliated Mutual Funds: |
| |||||||||||||||
| PGIM Core Government Money Market Fund (7-day effective yield 4.604%)(1)(wb) |
| |||||||||||||||
| $22,668,219 | $57,779,210 | $80,447,429 | $— | $— | $ — | — | $162,257 | |||||||||
| ||||||||||||||||
PGIM Credit Income Fund 69
Notes to Financial Statements (continued)
| Value, Beginning of Year | Cost of Purchases | Proceeds from Sales | Change in Gain (Loss) | Realized Gain (Loss) | Value, End of Year | Shares, End of Year | Income | |||||||||
| PGIM Core Ultra Short Bond Fund(1)(wb) |
| |||||||||||||||
| $ — | $16,919,398 | $12,741,836 | $— | $— | $4,177,562 | 4,177,562 | $ 16,267 | |||||||||
| $22,668,219 | $74,698,608 | $93,189,265 | $— | $— | $4,177,562 | $178,524 | ||||||||||
| ||||||||||||||||
| (1) | The Fund did not have any capital gain distributions during the reporting period. |
| (wb) | Represents an investment in a Fund affiliated with the Manager. |
| 6. | Distributions and Tax Information |
Distributions to shareholders, which are determined in accordance with federal income tax regulations and which may differ from GAAP, are recorded on the ex-date.
For the year ended December 31, 2024, the tax character of dividends paid as reflected in the Statement of Changes in Net Assets were as follows:
| Ordinary Income | Long-Term Capital Gains | Tax Return of Capital | Total Dividends and Distributions | |||
$9,984,397 | $— | $— | $9,984,397 | |||
For the reporting period ended December 31, 2023, the tax character of dividends paid as reflected in the Statement of Changes in Net Assets were as follows:
| Ordinary Income | Long-Term Capital Gains | Tax Return of Capital | Total Dividends and Distributions | |||
$47,445 | $— | $312,558 | $360,003 | |||
For the year ended December 31, 2024, the Fund had the following amounts of accumulated undistributed earnings on a tax basis:
| Undistributed Ordinary Income | Undistributed Long-Term Capital Gains | |
$2,763,526 | $— | |
The United States federal income tax basis of the Fund’s investments and the net unrealized appreciation as of December 31, 2024 were as follows:
| Tax Basis | Gross Unrealized Appreciation | Gross Unrealized Depreciation | Net Unrealized Appreciation | |||
$136,265,860 | $3,855,073 | $(2,485,433) | $1,369,640 | |||
70
The difference between GAAP and tax basis were primarily attributable to deferred losses on wash sale, swap income accruals, difference in the treatment of premium amortization and mark-to-market of futures and forwards contracts.
For federal income tax purposes, the Fund had an approximated capital loss carryforward as of December 31, 2024 which can be carried forward for an unlimited period. No capital gains distributions are expected to be paid to shareholders until net gains have been realized in excess of such losses.
| Capital Loss Carryforward | Capital Loss Carryforward Utilized | |
$494,000 | $— | |
The Manager has analyzed the Fund’s tax positions taken on federal, state and local income tax returns for all open tax years and has concluded that no provision for income tax is required in the Fund’s financial statements for the current reporting period. Since tax authorities can examine previously filed tax returns, the Fund’s U.S. federal and state tax returns for each of the two fiscal years up to the most recent fiscal year ended December 31, 2024 are subject to such review.
| 7. | Capital and Ownership |
The Fund offers three classes of its common shares on a continuous basis: Class A Common Shares (“Class A Shares”), Class C Common Shares (“Class C Shares”), and Class Z Common Shares (“Class Z Shares”). The Fund may offer additional classes of its Common Shares in the future.
Prior to July 1, 2024, Class A Shares were subject to a sales load of up to 3.25% of the total offering price (including sales load) and Class C Shares were not subject to a sales load. Also, prior to July 1, 2024, shares redeemed prior to 12 months from the date of issue were subject to a 2% early redemption fee. The redemption fee was accounted for as an addition to paid-in capital.
Effective July 1, 2024, Class A Shares are subject to a sales load of up to 2.50% of the total offering price (including sales load). The Fund’s early redemption fee on shares repurchased within one year is eliminated.
Effective July 1, 2024, the Fund’s Class A Share sales load schedule is modified so that investors who purchase $250,000 or more of Class A Shares (or otherwise qualify through utilization of the Rights of Accumulation, Letter of Intent or 90-Day Repurchase Privilege) will not be subject to a sales load. However, a contingent deferred sales charge (“CDSC”) of 1.50% will be assessed on Class A Shares purchased without a sales charge if the shares are repurchased during the first 12 months after their purchase. In addition, a CDSC of 1.00% will be assessed on Class C Shares if the shares are repurchased during the first 12 months after their purchase.
PGIM Credit Income Fund 71
Notes to Financial Statements (continued)
Class Z Shares are not subject to a sales load.
The Fund is authorized to issue an unlimited number of shares, $0.001 par value per share.
As of December 31, 2024, Prudential, through its affiliated entities, including affiliated funds (if applicable), owned shares of the Fund as follows:
| Class | Number of Shares | Percentage of Outstanding Shares | ||||||||
A | 419 | 100.0% | ||||||||
C | 417 | 100.0 | ||||||||
Z | 4,318,215 | 100.0 | ||||||||
At the reporting period end, the number of shareholders holding greater than 5% of the Fund are as follows:
| Number of Shareholders | Percentage of Outstanding Shares | |||
Affiliated | 1 | 99.9% | ||
Unaffiliated | — | — | ||
Transactions in shares of were as follows:
| Share Class | Shares | Amount | ||||||
Class A
| ||||||||
Year ended December 31, 2024: | ||||||||
Shares issued in reinvestment of dividends and distributions | 17 | $ | 422 | |||||
Net increase (decrease) in shares outstanding | 17 | $ | 422 | |||||
Period ended December 31, 2023*: | ||||||||
Shares sold | 400 | ** | $ | — | ||||
Shares issued in reinvestment of dividends and distributions | 2 | 50 | ||||||
Net increase (decrease) in shares outstanding | 402 | $ | 50 | |||||
Class C | ||||||||
Year ended December 31, 2024: | ||||||||
Shares issued in reinvestment of dividends and distributions | 15 | $ | 384 | |||||
Net increase (decrease) in shares outstanding | 15 | $ | 384 | |||||
Period ended December 31, 2023*: | ||||||||
Shares sold | 400 | ** | $ | — | ||||
Shares issued in reinvestment of dividends and distributions | 2 | 45 | ||||||
Net increase (decrease) in shares outstanding | 402 | $ | 45 | |||||
72
| Share Class
| Shares
| Amount
| ||||||
Class Z
| ||||||||
Year ended December 31, 2024: | ||||||||
Shares sold | 1,192,000 | $ | 30,002,669 | |||||
Shares issued in reinvestment of dividends and distributions | 308,693 | 7,900,431 | ||||||
Shares purchased | (11 | ) | (296 | ) | ||||
Net increase (decrease) in shares outstanding | 1,500,682 | $ | 37,902,804 | |||||
Period ended December 31, 2023*: | ||||||||
Shares sold | 2,803,240 | ** | $ | 70,000,000 | ||||
Shares issued in reinvestment of dividends and distributions | 14,293 | 359,908 | ||||||
Net increase (decrease) in shares outstanding | 2,817,533 | $ | 70,359,908 | |||||
| * | Commencement of operations was December 11, 2023. |
| ** | Includes seed capital. Prior to the Fund’s commencement of operations, the Fund was seeded with a capital investment from PGIM Strategic Investments, Inc., of $10,000, $10,000, and $81,000, respectively, in Class A, Class C and Class Z Common Shares. |
Repurchase Offers: The Fund is an interval fund, a type of fund which, in order to provide liquidity to shareholders, has adopted a fundamental investment policy to make quarterly offers to repurchase between 5% and 25% of its outstanding Common Shares at NAV, reduced by any applicable redemption fee. Subject to applicable law and approval of the Board, for each quarterly repurchase offer, the Fund currently expects to offer to repurchase 5% of the Fund’s outstanding Common Shares at NAV on the repurchase request deadline at the net asset value per Common Share as of the repurchase pricing date. Written notification of each quarterly repurchase offer (the “Repurchase Offer Notice”) will be sent to shareholders at least 21 days before the repurchase request deadline (i.e., the date by which shareholders can tender their Common Shares in response to a repurchase offer) (the “Repurchase Request Deadline”). The Fund may impose a redemption fee of 2.00% to Class A, Class C and Class Z Common Shares that are accepted for repurchase by the Fund and have been held by the investor for less than twelve months. Effective July 1, 2024, the Fund’s early redemption fee on shares repurchased within one year is eliminated. The results of the repurchase offers are as follows:
| Commencement Date | Deadline Date | Pricing Date | Shares Repurchased | Amount Repurchased | ||||
June 27, 2024 | July 26, 2024 | July 26, 2024 | 11 | $296 | ||||
| 8. | Risks of Investing in the Fund |
The Fund’s risks include, but are not limited to, some or all of the risks discussed below. For further information on the Fund’s risks, please refer to the Fund’s Prospectus and Statement of Additional Information.
Limited History of Operations: The Fund is a recently organized, diversified, closed-end management investment company with limited history of operations or public trading and is subject to all of the business risks and uncertainties associated with any new business. As a
PGIM Credit Income Fund 73
Notes to Financial Statements (continued)
result, prospective investors have limited track record or history on which to base their investment decision.
General, Market and Economic Risks: Investing in the Fund involves certain risks and the Fund may not be able to achieve its intended results for a variety of reasons, including, among others, the possibility that the Fund may not be able to successfully implement its investment strategy because of market, economic, regulatory, geopolitical and other conditions. International wars or conflicts (such as those in the Middle East and Ukraine) and geopolitical developments in foreign countries, along with instability in regions such as Asia, Eastern Europe, and the Middle East, possible terrorist attacks in the U.S. or around the world, public health epidemics and pandemics such as the outbreak of infectious diseases like the COVID-19 pandemic, and other similar events could adversely affect the U.S. and foreign financial markets, including increases in market volatility, reduced liquidity in the securities markets and government intervention, and may cause further long-term economic uncertainties in the United States and worldwide generally. The extent and duration of such events and resulting market disruptions cannot be predicted, but could be substantial and could magnify the impact of other risks to the Fund. These and other similar events could adversely affect the U.S. and foreign financial markets and lead to increased market volatility, reduced liquidity in the securities markets, significant negative impacts on issuers and the markets for certain securities and commodities and/or government intervention. They may also cause short- or long-term economic uncertainties in the United States and worldwide. As a result, whether or not the Fund invests in securities of issuers located in or with significant exposure to the countries directly affected, the value and liquidity of the Fund’s investments may be negatively impacted. Further, due to closures of certain markets and restrictions on trading certain securities, the value of certain securities held by the Fund could be significantly impacted, which could lead to such securities being valued at zero. Relatively reduced liquidity in credit and fixed income markets could adversely affect issuers worldwide. U.S. and foreign governments have taken a number of unprecedented actions designed to support certain financial institutions and segments of the financial markets that have experienced extreme volatility, and in some cases a lack of liquidity. The impact of these measures, as well as any additional future regulatory actions, is not yet known and cannot be predicted. Legislation or regulation may also change the way in which the Fund itself is regulated and could limit or preclude the Fund’s ability to achieve its investment objectives. Because the NAV of the Common Shares will fluctuate, there is a risk that you will lose money. Your investment will decline in value if, among other things, the NAV of the Common Shares decreases. As with any security, a complete loss of your investment is possible.
Repurchase Offers Risk: Repurchase offers and the need to fund repurchase obligations may affect the ability of the Fund to be fully invested or force the Fund to maintain a higher percentage of its assets in liquid investments, which may harm the Fund’s investment
74
performance. Moreover, diminution in the size of the Fund through repurchases may result in untimely sales of portfolio securities (with associated imputed transaction costs, which may be significant), and may limit the ability of the Fund to participate in new investment opportunities or to achieve its investment objective. The Fund may accumulate cash by holding back (i.e., not reinvesting) payments received in connection with the Fund’s investments. The Fund believes that payments received in connection with the Fund’s investments will generate sufficient cash to meet the maximum potential amount of the Fund’s repurchase obligations. If at any time cash and other cash equivalents held by the Fund are not sufficient to meet the Fund’s repurchase obligations, the Fund intends, if necessary, to sell investments. If, as expected, the Fund employs investment leverage, repurchases of Common Shares would compound the adverse effects of leverage in a declining market. In addition, if the Fund borrows to finance repurchases, interest on that borrowing will negatively affect Common Shareholders who do not tender their Common Shares by increasing the Fund’s expenses and reducing any net investment income.
In the event that shareholders tender more than the repurchase offer amount plus 2% of the Fund’s outstanding shares as of the date of the Repurchase Request Deadline, the Fund will repurchase the Common Shares tendered on a pro rata basis, and shareholders will have to wait until the next repurchase offer to make another repurchase request. As a result, shareholders may be unable to liquidate all or a given percentage of their investment in the Fund during a particular repurchase offer. A shareholder may be subject to market and other risks, and the NAV of Common Shares tendered in a repurchase offer may decline between the Repurchase Request Deadline and the date on which the NAV for tendered Common Shares is determined.
Illiquid Investment Risk: To the extent consistent with the applicable liquidity requirements for interval funds under Rule 23c-3 of the 1940 Act, the Fund may invest without limit in illiquid securities. The Fund generally considers “illiquid securities” to be securities that cannot be sold within seven days in the ordinary course of business at approximately the value used by the Fund in determining its NAV. The Fund may not be able to readily dispose of such securities at prices that approximate those at which the Fund could sell the securities if they were more widely traded and, as a result of that illiquidity, the Fund may have to sell such securities at a loss or sell other investments or engage in borrowing transactions if necessary to raise cash to meet its obligations. Limited liquidity can also affect the market price of securities, thereby adversely affecting the Fund’s NAV and ability to make dividend distributions. The Fund may invest in privately-held companies, below-investment-grade instruments (“junk” bonds), securities which are at risk of default as to the repayment of principal and/or interest at the time of acquisition by the fund or are rated in the lower rating categories or are unrated, which may be difficult to value and may be illiquid. The Fund may also invest in securities that have not been registered for public sale in the U.S. or relevant non-U.S. jurisdiction, including, without limitation, securities eligible for purchase and sale pursuant to Rule 144A under the Securities Act of 1933, as amended (the “Securities Act”). Rule 144A permits certain qualified institutional buyers, such as the Fund, to trade in privately placed securities that have not been registered for
PGIM Credit Income Fund 75
Notes to Financial Statements (continued)
sale under the Securities Act. Rule 144A securities may be deemed illiquid, although the Fund may determine that certain Rule 144A securities are liquid.
Distributions Risk: There can be no assurance that the Fund will achieve investment results that will allow the Fund to make a specified level of cash distributions or maintain certain levels of cash distributions. All distributions will be paid at the discretion of the Board and may depend on the Fund’s earnings, the Fund’s net investment income, the Fund’s financial condition, compliance with applicable regulations and such other factors as the Board may deem relevant from time to time. The distributions for any full or partial calendar year might not be made in equal amounts, and one distribution may be larger than others. The Fund will make a distribution only if authorized by the Board and declared by the Fund out of assets legally available for these distributions. This distribution policy may, under certain circumstances, have certain adverse consequences to the Fund and its shareholders because it may result in a return of capital, which would reduce the Fund’s NAV and, over time, potentially increase the Fund’s expense ratio. If the Fund distributes a return of capital, it means that the Fund is returning to shareholders a portion of their investment rather than making a distribution that is funded from the Fund’s earned income or other profits. The Fund’s distribution policy may be changed by the Board at any time without shareholder approval.
Liquidity Risk: In order to provide liquidity to shareholders, the Fund is structured as an “interval fund” and conducts periodic repurchase offers for a portion of its outstanding Common Shares, as described herein. The Fund is designed primarily for long-term investors and an investment in the Common Shares should be considered illiquid. The Common Shares are not currently listed for trading on any securities exchange. There is currently no public market for the Common Shares and none is expected to develop. Although the Fund may offer to repurchase Common Shares from shareholders, no assurance can be given that these repurchases will occur as scheduled or at all.
Valuation Risk: The value of certain of the Fund’s investments will be difficult to determine and the valuation determinations made by the Manager and Subadvisers with respect to such investments will likely vary from the amounts the Fund would receive upon sale or disposition of such investments. It is possible that the fair value determined for a security may differ materially from the value that could be realized upon the sale of the security.
Loans Risk: The Fund’s ability to receive payments of principal and interest and other amounts in connection with loans (whether through participations, assignments or otherwise) will depend primarily on the financial condition of the borrower. The failure by the Fund to receive scheduled interest or principal payments on a loan because of a default, bankruptcy or any other reason would adversely affect the income of the Fund and would likely reduce the value of its assets. Even with loans secured by collateral, there is the risk
76
that the value of the collateral may decline, may be insufficient to meet the obligations of the borrower, or be difficult to liquidate. In the event of a default, the Fund may have difficulty collecting on any collateral and would not have the ability to collect on any collateral for an uncollateralized loan. Further, the Fund’s access to collateral, if any, may be limited by bankruptcy laws.
In some instances, loans and loan participations are not rated by independent credit rating agencies; in such instances, a decision by the Fund to invest in a particular loan or loan participation could depend exclusively on the Subadvisers’ credit analysis of the borrower, or in the case of a loan participation, of the intermediary holding the portion of the loan that the Fund has purchased. To the extent the Fund invests in loans of non-U.S. issuers, the risks of investing in non-U.S. issuers are applicable.
Mortgage-Backed and Asset-Backed Securities Risk: Mortgage-backed and asset-backed securities tend to increase in value less than other debt securities when interest rates decline, but are subject to similar risk of decline in market value during periods of rising interest rates. The values of mortgage-backed and asset-backed securities become more volatile as interest rates rise. In a period of declining interest rates, the Fund may be required to reinvest more frequent prepayments on mortgage-backed and asset-backed securities in lower-yielding investments.
Structured Products Risk: Holders of structured product securities bear risks of the underlying investments, index or reference obligation. Certain structured products may be thinly traded or have a limited trading market, and as a result may be characterized as illiquid. The possible lack of a liquid secondary market for structured securities and the resulting inability of the Fund to sell a structured security could expose the Fund to losses and could make structured securities more difficult for the Fund to value accurately, which may also result in additional costs. Structured products are also subject to credit risk; the assets backing the structured product may be insufficient to pay interest or principal. In addition to the general risks associated with investments in fixed income, structured products carry additional risks, including, but not limited to: the possibility that distributions from collateral securities will not be adequate to make interest or other payments; the quality of the collateral may decline in value or default; and the possibility that the structured products are subordinate to other classes.
Fixed Income Instruments Risk: In addition to the other risks described herein, fixed income instruments are also subject to certain risks, including:
| ● | Issuer Risk: The value of the Fund’s fixed income instruments may decline for a number of reasons that directly relate to the issuer, such as management performance, financial leverage and reduced demand for the issuer’s goods and services. |
| ● | Interest Rate Risk: The value of the Fund’s investments may go down when interest rates rise. A rise in rates tends to have a greater impact on the prices of longer term or duration debt securities. When interest rates fall, the issuers of debt obligations may |
PGIM Credit Income Fund 77
Notes to Financial Statements (continued)
prepay principal more quickly than expected, and the Fund may be required to reinvest the proceeds at a lower interest rate. This is referred to as “prepayment risk.” When interest rates rise, debt obligations may be repaid more slowly than expected, and the value of the Fund’s holdings may fall sharply. This is referred to as “extension risk.” The Fund may face a heightened level of interest rate risk as a result of the U.S. Federal Reserve Board’s rate-setting policies. The Fund may utilize certain strategies, including investments in derivatives, for the purpose of reducing the interest rate sensitivity of the portfolio and decreasing the Fund’s exposure to interest rate risk, although there is no assurance that it will do so or that such strategies, if utilized, will be successful.
| ● | Duration Risk: Duration measures the time-weighted expected cash flows of a security, which can determine the security’s sensitivity to changes in the general level of interest rates (or yields). Securities with longer durations tend to be more sensitive to interest rate (or yield) changes than securities with shorter durations. Various techniques may be used to shorten or lengthen the Fund’s duration. The duration of a security will be expected to change over time with changes in market factors and time to maturity. |
| ● | Floating-Rate and Fixed-to-Floating-Rate Securities Risk: The market value of floating-rate securities is a reflection of discounted expected cash flows based on expectations for future interest rate resets. The market value of such securities may fall in a declining interest rate environment and may also fall in a rising interest rate environment if there is a lag between the rise in interest rates and the reset. This risk may also be present with respect to fixed-to-floating-rate securities in which the Fund may invest. A secondary risk associated with declining interest rates is the risk that income earned by the Fund on floating-rate and fixed-to-floating-rate securities will decline due to lower coupon payments on floating-rate securities. |
| ● | Prepayment Risk: During periods of declining interest rates, the issuer of an instrument may exercise its option to prepay principal earlier than scheduled, forcing the Fund to reinvest the proceeds from such prepayment in lower yielding instruments, which may result in a decline in the Fund’s income and distributions to shareholders. This is known as prepayment or “call” risk. Fixed income instruments frequently have call features that allow the issuer to redeem the instrument at dates prior to its stated maturity at a specified price (typically greater than par) only if certain prescribed conditions are met (“call protection”). An issuer may choose to redeem a fixed income instrument if, for example, the issuer can refinance the instrument at a lower cost due to declining interest rates or an improvement in the credit standing of the issuer. For premium bonds (bonds acquired at prices that exceed their par or principal value) purchased by the Fund, prepayment risk may be enhanced. |
78
| ● | Extension Risk: During periods of rising interest rates, an issuer could exercise its right to pay principal on an obligation held by the Fund later than expected. Under these circumstances, the value of the obligation will decrease, and the Fund may be prevented from reinvesting in higher yielding securities. |
| ● | Reinvestment Risk: Reinvestment risk is the risk that income from the Fund’s portfolio will decline if and when the Fund invests the proceeds from matured, traded or called fixed income instruments at market interest rates that are below the portfolio’s current earnings rate. |
| ● | Spread Risk: Wider credit spreads and decreasing market values typically represent a deterioration of the fixed income instrument’s credit soundness and a perceived greater likelihood or risk of default by the issuer. Fixed income instruments generally compensate for greater credit risk by paying interest at a higher rate. The difference (or “spread”) between the yield of a security and the yield of a benchmark, such as a U.S. Treasury security with a comparable maturity, measures the additional interest paid for credit risk. As the spread on a security held by the Fund widens (or increases), the price (or value) of the security generally falls. Spread widening may occur, among other reasons, as a result of market concerns over the stability of the market, excess supply, general credit concerns in other markets, security- or market-specific credit concerns or general reductions in risk tolerance. |
| ● | Refinancing Risk: This is the risk that one or more issuers of fixed income instruments in the Fund’s portfolio may not be able to pay off their debt upon maturity. During times of extreme market stress, even creditworthy companies can have temporary trouble accessing the markets to refinance their outstanding debt, potentially leading to an inability to pay off existing bondholders, including the Fund. This could negatively affect the Fund’s NAV or overall return. |
| ● | Credit Risk: Credit risk is the risk that one or more fixed income instruments in the Fund’s portfolio will decline in price or fail to pay interest or principal when due because the issuer, the guarantor or the insurer of the instrument or any applicable counterparty may be unable or unwilling to make timely principal and interest payments or to otherwise honor its obligations. Additionally, the instruments could lose value due to a loss of confidence in the ability of the issuer, guarantor, insurer or counterparty to pay back debt. The longer the maturity and the lower the credit quality of a bond, the more sensitive it is to credit risk. |
Below Investment Grade (High Yield or Junk Bond) Instruments Risk: The Fund’s investments in below investment grade quality securities and instruments are regarded as having predominantly speculative characteristics with respect to the issuer’s capacity to pay interest and repay principal in accordance with the terms of the obligations and involve major risk exposure to adverse conditions. Below investment grade instruments are often issued in connection with a corporate reorganization or restructuring or as part of a merger, acquisition, takeover or similar event. They are also
PGIM Credit Income Fund 79
Notes to Financial Statements (continued)
issued by less established companies seeking to expand. Such issuers are often highly leveraged and generally less able than more established or less leveraged entities to make scheduled payments of principal and interest in the event of adverse developments or business conditions.
Fixed income instruments rated below investment grade generally offer a higher current yield than that available from higher grade issues, but typically involve greater risk. These investments are especially sensitive to adverse changes in general economic conditions, to changes in the financial condition of their issuers and to price fluctuation in response to changes in interest rates. During periods of economic downturn or rising interest rates, issuers of below investment grade instruments may experience financial stress that could adversely affect their ability to make payments of principal and interest on their obligations and increase the possibility of default.
The secondary market for high yield instruments may not be as liquid as the secondary market for more highly rated instruments, a factor that may have an adverse effect on the Fund’s ability to dispose of a particular security. Under continuing adverse market or economic conditions, the secondary market for high yield instruments could contract further, independent of any specific adverse changes in the condition of a particular issuer, and these instruments may become illiquid.
Default, or the market’s perception that an issuer is likely to default, could reduce the value and liquidity of instruments held by the Fund, which could have a material adverse impact on the Fund’s business, financial condition and results of operations. In addition, default may cause the Fund to incur expenses in seeking recovery of principal and/or interest on its portfolio holdings.
Lower rated high yield instruments generally present the same type of risks as investments in higher rated high yield instruments. However, in most cases, these risks are of a greater magnitude because of the uncertainties of investing in an issuer undergoing financial distress.
Distressed and Defaulted Obligations Risk: The Fund may invest in “below investment grade” securities (commonly referred to as “high yield” securities or “junk bonds”) and obligations of issuers in weak financial condition, experiencing poor operating results, having substantial capital needs or negative net worth, facing special competitive or product obsolescence problems (including companies involved in bankruptcy or other reorganization and liquidation proceedings). Below investment grade securities in which the Fund may invest also include defaulted and partially defaulted loans. Such investments are likely to be particularly risky although they also may offer the potential for correspondingly high returns. Any one or all of the issuers of the securities in which
80
the Fund may invest may be unsuccessful or not show any return for a considerable period of time.
Among the risks inherent in investments in troubled entities is the risk that it frequently may be difficult to obtain information as to the true condition of such issuers. Such investments may also be adversely affected by laws relating to, among other things, fraudulent transfers and other voidable transfers or payments, lender liability and the bankruptcy court’s power to disallow, reduce, subordinate, recharacterize debt as equity or disenfranchise particular claims. Such companies’ obligations may be considered speculative, and the ability of such companies to pay their debts on schedule could be affected by adverse interest rate movements, changes in the general economic climate, economic factors affecting a particular industry or specific developments within such companies. There is no assurance that value of the assets collateralizing the Fund’s investments will be sufficient or that prospects for a successful reorganization or similar action will become available.
In liquidation (both in and out of bankruptcy) and other forms of corporate reorganization, there exists the risk that the reorganization either will be unsuccessful (due to, for example, failure to obtain requisite approvals), will be delayed (for example, until various liabilities, actual or contingent, have been satisfied) or will result in a distribution of cash or a new investment the value of which will be less than the purchase price to the Fund of the investment in respect to which such distribution was made.
Subprime Risk: Loans, and debt instruments collateralized by loans acquired by the Fund may be subprime in quality, or may become subprime in quality. Although there is no specific legal or market definition of “subprime,” subprime loans are generally understood to refer to loans made to borrowers that display poor credit histories and other characteristics that correlate with a higher default risk. Accordingly, subprime loans, and debt instruments secured by such loans, have speculative characteristics and are subject to heightened risks, including the risk of nonpayment of interest or repayment of principal, and the risks associated with investments in high yield securities.
Inflation Risk: Globally, inflation and rapid fluctuations in inflation rates have in the past had negative effects on economies and financial markets, particularly in emerging economies, and may do so in the future. Wages and prices of inputs increase during periods of inflation, which can negatively impact returns on the Fund’s investments. In an attempt to stabilize inflation, governments may impose wage and price controls, or otherwise intervene in the economy. Governmental efforts to curb inflation often have negative effects on levels of economic activity.
In the U.S., inflation has accelerated in recent years as a result of global supply chain disruptions, a rise in energy prices, strong consumer demand as economies continue to reopen following the COVID-19 pandemic, and other factors. Inflationary pressures
PGIM Credit Income Fund 81
Notes to Financial Statements (continued)
have increased the costs of labor, energy, and raw materials, and have adversely affected consumer spending, economic growth, and the operations of companies in the U.S. and globally, and have resulted in a tightening of monetary policy by the U.S. Federal Reserve. Although inflation has generally been reduced in the U.S. in recent months, inflation may continue in the near to medium-term, particularly in the U.S., with the possibility that monetary policy may tighten further in response. Inflation could become a serious problem in the future and have an adverse impact on the Fund’s returns.
Derivatives Risk: The Fund’s investments in derivative transactions may subject the Fund to increased risk of principal loss due to imperfect correlation between the values of the derivatives and the underlying securities or unexpected price or interest rate movements. The use of derivatives may subject the Fund to risks, including, but not limited to:
| ● | Counterparty Risk: The risk that the counterparty in a derivative transaction will be unable to honor its financial obligation to the Fund, or the risk that the reference entity in a credit default swap or similar derivative will not be able to honor its financial obligations. If the Fund’s counterparty to a derivative transaction experiences a loss of capital, or is perceived to lack adequate capital or access to capital, it may experience margin calls or other regulatory requirements to increase equity. Under such circumstances, the risk that a counterparty will be unable to honor its financial obligations may be substantially increased. |
| ● | Currency Risk: The risk that changes in the exchange rate between two currencies will adversely affect the value (in U.S. dollar terms) of a Fund investment. |
| ● | Leverage Risk: The Fund may use, among other things, reverse repurchase agreements and/or dollar rolls to add leverage to its portfolio. The risk associated with certain types of derivative strategies that relatively small market movements may result in large changes in the value of an investment. Certain investments or trading strategies that involve leverage can result in losses that greatly exceed the amount originally invested. |
| ● | Liquidity Risk: The risk that certain derivative positions may be difficult or impossible to close out at the time that the Fund would like or at the price that the Fund believes the position is currently worth. This risk is heightened to the extent the Fund engages in over-the-counter derivative transactions, which are generally less liquid than exchange-traded instruments. |
| ● | Correlation Risk: The risk that changes in the value of a derivative will not match the changes in the value of the portfolio holdings that are being hedged or of the particular |
82
market or security to which the Fund seeks exposure. Furthermore, the ability to successfully use derivative instruments depend in part on the ability of the Manager and Subadvisers to predict pertinent market movements, which cannot be assured.
| ● | Index Risk: If the derivative is linked to the performance of an index, it will be subject to the risks associated with changes in that index. If the index changes, the Fund could receive lower interest payments or experience a reduction in the value of the derivative to below what the Fund paid. Certain indexed derivatives may create leverage, to the extent that they increase or decrease in value at a rate that is a multiple of the changes in the applicable index. |
| ● | Regulatory Risk: Derivative contracts, including, without limitation, swaps, currency forwards, and non-deliverable forwards, are subject to regulation under the Dodd-Frank Wall Street Reform and Consumer Protection Act (“Dodd-Frank Act”) in the U.S. and under comparable regimes in Europe, Asia and other non-U.S. jurisdictions. Swaps, non-deliverable forwards and certain other derivatives traded in the OTC market are subject to variation margin requirements, and initial margining requirements have recently been phased in. Implementation of the margining and other provisions of the Dodd-Frank Act regarding clearing, mandatory trading, reporting and documentation of swaps and other derivatives have impacted and may continue to impact the costs to the Fund of trading these instruments and, as a result, may affect returns to investors in the Fund. |
| ● | Credit Default Swaps Risk: Credit default swaps involve greater risks than if the Fund had invested in the reference obligation directly. In addition to general market risks, credit default swaps are subject to liquidity risk and credit risk. A buyer of credit protection also may lose its investment and recover nothing should no credit event occur. If a credit event were to occur, the value of the reference obligation received by the seller, coupled with the periodic payments previously received, may be less than the full notional value it pays to the buyer, resulting in a loss of value to the Fund. Further, in certain circumstances, the buyer can receive the notional value of a credit default swap only by delivering a physical security to the seller, and is at risk if such deliverable security is unavailable or illiquid. Such a delivery “crunch” is a distinct risk of these investments. |
Leverage Risk: Although the Fund may utilize leverage, there can be no assurance that the Fund will do so, or that, if utilized, it will be successful during any period in which it is employed. Leverage is a speculative technique that exposes the Fund to greater risk and higher costs than if it were not implemented.
The Fund anticipates that any money borrowed from a bank or other financial institution for investment purposes will accrue interest based on shorter-term interest rates that would be periodically reset. So long as the Fund’s portfolio provides a higher rate of return, net of expenses, than the interest rate on borrowed money, as reset periodically, the leverage may cause the Fund to receive a higher current rate of return than if the Fund were not
PGIM Credit Income Fund 83
Notes to Financial Statements (continued)
leveraged. If, however, short-term rates rise, the interest rate on borrowed money could exceed the rate of return on instruments held by the Fund, reducing returns to the Fund and the level of income available for dividends or distributions made by the Fund. Developments in the credit markets may adversely affect the ability of the Fund to borrow for investment purposes and may increase the costs of such borrowings, which would also reduce returns to the Fund. There is no assurance that a leveraging strategy will be successful. The use of leverage to purchase additional investments creates special risks and considerations for Common Shareholders, including:
| ● | the likelihood of greater volatility of NAV of Common Shares than a comparable fund without leverage; |
| ● | the risk that fluctuations in interest rates on borrowings and short-term debt or in dividend payments on, principal proceeds distributed to, or redemption of any preferred shares and/or notes or other debt securities that the Fund has issued will reduce the return to the Fund; |
| ● | magnified interest rate risk, which is the risk that the prices of certain of the portfolio investments will fall (or rise) if market interest rates for those types of investments rise (or fall). As a result, leverage may cause greater changes in the Fund’s NAV, which could have a material adverse impact on the Fund’s business, financial condition and results of operations; |
| ● | the effect of leverage in a declining market, which is likely to cause a greater decline in the NAV of the Common Shares than if the Fund were not leveraged; and |
| ● | leverage may increase expenses (which will be borne entirely by the Shareholders), which may reduce the Fund’s NAV and the total return to Shareholders. |
Allocation of Investment Opportunities Risk: Certain other existing or future funds, investment vehicles and accounts managed by the Manager and its affiliates and PGIM affiliated proprietary entities invest in securities, properties and other assets in which the Fund may seek to invest. Allocation of identified investment opportunities among the Fund, the Manager and other PGIM affiliated investment vehicles presents inherent conflicts of interest where demand exceeds available supply. While the Manager believes it is likely that there will be some overlap of investment opportunities for the Fund and other PGIM affiliated investment vehicles and PGIM affiliated proprietary accounts from time to time, the Fund’s stock of investment opportunities may be materially affected by competition from other PGIM affiliated investment vehicles and PGIM affiliated proprietary entities. Shareholders should note that the conflicts inherent in making such allocation decisions will not always be resolved in favor of the Fund.
84
Non-U.S. Investment Risks: The Fund may invest in non-U.S. investments, which may include investments denominated in U.S. dollars or in non-U.S. currencies, to the extent permitted by the 1940 Act. Such investments may involve a broad range of economic, non-U.S. currency and exchange rate, political, legal, tax and financial risks not typically associated with investments in U.S. companies. Prior government approval for non-U.S. investments may be required under certain circumstances in some countries, and the process of obtaining these approvals may require a significant expenditure of time and resources. Additionally, certain countries depend heavily on exports to the U.S. Accordingly, these countries may be sensitive to fluctuations in U.S. demand and changes in U.S. market conditions. The foregoing factors may increase transaction costs and adversely impact the value of the Fund’s investments in non-U.S. portfolio companies.
“Covenant-Lite” Risk: Some of the debt obligations, loans or other securities in which the Fund may invest or get exposure to may be “covenant-lite”, which means the loans or obligations contain fewer financial maintenance covenants than other loans or obligations (in some cases, none) and do not include terms which allow the lender to monitor the borrower’s performance and declare a default if certain criteria are breached. An investment by the Fund in a covenant-lite loan may potentially hinder the ability to reprice credit risk associated with the issuer and reduce the ability to restructure a problematic loan and mitigate potential loss. The Fund may also experience difficulty, expenses or delays in enforcing its rights on its holdings of covenant-lite loans or obligations. As a result of these risks, the Fund’s exposure to losses may be increased, which could result in an adverse impact on the Fund’s net income and NAV.
Senior Debt Risk: The Fund may be subject to greater levels of credit risk than funds that do not invest in below investment grade senior debt. The Fund may also be subject to greater levels of liquidity risk than funds that do not invest in senior debt. Restrictions on transfers in loan agreements, a lack of publicly available information and other factors may, in certain instances, make senior debt more difficult to sell at an advantageous time or price than other types of securities or instruments. Additionally, if the issuer of senior debt prepays, the Fund will have to consider reinvesting the proceeds in other senior debt or similar instruments that may pay lower interest rates.
Confidential Information Access Risk: In managing the Fund (and other PGIM clients), PGIM may from time to time have the opportunity to receive material, non-public information (“Confidential Information”) about the issuers of certain investments, including, without limitation, senior floating rate loans, other loans and related investments being considered for acquisition by the Fund or held in the Fund’s portfolio. Pursuant to applicable policies and procedures, PGIM may (but is not required to) seek to avoid receipt of Confidential Information from the issuer so as to avoid possible restrictions on its ability to purchase and sell investments on behalf of the Fund and other clients to which such Confidential Information relates. PGIM may also determine to receive such Confidential Information in certain circumstances under its applicable policies and procedures. If PGIM intentionally or unintentionally comes into possession of Confidential Information, it may be unable, potentially for a substantial period of time, to purchase or sell investments to which
PGIM Credit Income Fund 85
Notes to Financial Statements (continued)
such Confidential Information relates.
| 9. | Subsequent Events |
The Fund’s management evaluated subsequent events through the date of issuance of the financial statements. There have been no subsequent events that occurred during such period that would require disclosure in, or would be required to be recognized in, the financial statements as of December 31, 2024 except as discussed below.
On January 29, 2025, the Fund declared monthly dividends of $0.11202 per share for Class A, $0.10092 per share for Class C, and $0.11553 per share for Class Z, payable on January 31, 2025, to shareholders of record on January 30, 2025. The ex-date is January 31, 2025.
86
Report of Independent Registered Public Accounting Firm
To the Board of Trustees of PGIM Credit Income Fund and Shareholders of PGIM Credit Income Fund
Opinion on the Financial Statements
We have audited the accompanying statement of assets and liabilities, including the schedule of investments, of PGIM Credit Income Fund (the “Fund”) as of December 31, 2024, the related statements of operations and cash flows for the year ended December 31, 2024 and the statements of changes in net assets and the financial highlights for the year ended December 31, 2024 and for the period December 11, 2023 (commencement of operations) through December 31, 2023, including the related notes (collectively referred to as the “financial statements”). In our opinion, the financial statements present fairly, in all material respects, the financial position of the Fund as of December 31, 2024, the results of its operations and its cash flows for the year ended December 31, 2024, and the changes in its net assets and the financial highlights for the year ended December 31, 2024 and for the period December 11, 2023 (commencement of operations) through December 31, 2023 in conformity with accounting principles generally accepted in the United States of America.
Basis for Opinion
These financial statements are the responsibility of the Fund’s management. Our responsibility is to express an opinion on the Fund’s financial statements based on our audits. We are a public accounting firm registered with the Public Company Accounting Oversight Board (United States) (PCAOB) and are required to be independent with respect to the Fund in accordance with the U.S. federal securities laws and the applicable rules and regulations of the Securities and Exchange Commission and the PCAOB.
We conducted our audits of these financial statements in accordance with the standards of the PCAOB. Those standards require that we plan and perform the audit to obtain reasonable assurance about whether the financial statements are free of material misstatement, whether due to error or fraud.
Our audits included performing procedures to assess the risks of material misstatement of the financial statements, whether due to error or fraud, and performing procedures that respond to those risks. Such procedures included examining, on a test basis, evidence regarding the amounts and disclosures in the financial statements. Our audits also included evaluating the accounting principles used and significant estimates made by management, as well as evaluating the overall presentation of the financial statements. Our procedures included confirmation of securities owned as of December 31, 2024 by correspondence with the custodian, transfer agent, agent banks and brokers; when replies were not received from agent banks, we performed other auditing procedures. We believe that our audits provide a reasonable basis for our opinion.
/s/ PricewaterhouseCoopers LLP
New York, New York
February 24, 2025
We have served as the auditor of one or more investment companies in the PGIM Retail Funds complex since 2020.
PGIM Credit Income Fund 87
Tax Information (unaudited)
For the year ended December 31, 2024, the PGIM Credit Income Fund (the “Fund”) reports the maximum amount allowable under Section 854 of the Internal Revenue Code, but not less than, the following percentages of the ordinary income distributions paid as: 1) qualified dividend income in accordance with Section 854 of the Internal Revenue Code (QDI); 2) eligible for the corporate dividends received deduction in accordance with Section 854 of the Internal Revenue Code (DRD); 3) interest-related dividends in accordance with Section 871(k)(1) and 881(e)(1) of the Internal Revenue Code (IRD); and 4) interest dividends that are eligible to be treated as interest income in accordance with Section 163(j):
| Fund | QDI | DRD | IRD | 163(j) | ||||
PGIM Credit Income Fund | 3.57% | 1.64% | 16.53% | 82.31% | ||||
88
Other Information
DISTRIBUTION REINVESTMENT PLAN
OF
PGIM CREDIT INCOME FUND
PGIM Credit Income Fund, a Delaware statutory trust (the “Fund”), hereby adopts the following plan (the “Plan”) with respect to income dividends or capital gains or other distributions (each, a “Distribution” and collectively, “Distributions”), declared by its Board of Trustees on its common shares of beneficial interest (the “Common Shares”):
1. Unless a shareholder specifically elects to receive cash as set forth below, all Distributions hereafter declared by the Board of Trustees shall be payable in Common Shares of the Fund, and no action shall be required on such shareholder’s part to receive a Distribution in Common Shares.
2. Such Distributions shall be payable on such date or dates as may be fixed from time to time by the Board of Trustees to shareholders of record at the close of business on the record date(s) established by the Board of Trustees for the Distribution involved.
3. Prudential Mutual Fund Services LLC, the plan administrator (the “Plan Administrator”), will set up an account for the Common Shares acquired pursuant to the Plan for each shareholder who has not elected to receive Distributions in cash (each a “Participant”). The Plan Administrator may hold each Participant’s shares, together with the shares of other Participants, in non-certificated form in the Plan Administrator’s name or that of its nominee. In the case of shareholders such as banks, brokers or nominees that hold the Common Shares of the Fund for others who are the beneficial owners, the Plan Administrator will administer the Plan on the basis of the number of Common Shares certified by the record shareholders as representing the total amount registered in such shareholder’s name and held for the account of Participants.
4. When the Fund declares a Distribution, the Plan Administrator, on the shareholder’s behalf, will receive additional authorized Common Shares from the Fund. The number of shares to be received when Distributions are reinvested will be determined by dividing the amount of the Distribution by the Fund’s net asset value per share. There will be no sales load charged on Common Shares issued to a shareholder under the Plan. All Common Shares purchased under the Plan will be held in the name of each Participant.
5. The Fund expects to issue Common Shares pursuant to the Plan, immediately following each Distribution payment date and the Plan Administrator will make every reasonable effort to reinvest all Distributions on the day the Distribution is paid (except where necessary to comply with applicable securities laws) by the Fund. If, for any reason beyond
PGIM Credit Income Fund 89
Other Information (continued)
the control of the Plan Administrator, reinvestment of the Distributions cannot be completed within 30 days after the applicable Distribution payment date, funds held by the Plan Administrator on behalf of a Participant will be distributed to that Participant.
6. A shareholder may, however, elect to receive Distributions in cash. To exercise this option, such shareholder must notify the Plan Administrator, in writing so that such notice is received by the Plan Administrator three (3) days prior to the distribution date fixed by the Board of Trustees for the Distribution involved.
7. The Plan Administrator will confirm to each Participant each acquisition made pursuant to the Plan as soon as practicable. Each Participant may from time to time have an undivided fractional interest (computed to three decimal places) of Common Shares of the Fund. Distributions on fractional shares will be credited to each Participant’s account. In the event of termination of a Participant’s account under the Plan, the Plan Administrator will adjust for any such undivided fractional interest in cash at the net asset value of the Fund’s shares at the time of termination.
8. There will be no direct expenses to Participants for the administration of the Plan. There is no direct service charge to Participants with regard to purchases under the Plan; however, the Fund reserves the right to amend the Plan to include a service charge payable by the Participants. All fees associated with the Plan will be paid by the Fund.
9. Common Shares issued pursuant to the Plan will have the same voting rights as the Common Shares issued pursuant to the Fund’s continuous offering.
10. Each Participant may terminate the Participant’s account under the Plan by so notifying the Plan Administrator via the Plan Administrator’s website at www.pgim.com/investments, by filling out the transaction request form located at the bottom of the Participant’s Statement and sending it to the Plan Administrator at PGIM Investments, PO Box 219929, Kansas City, MO 64121-9929 or by calling the Plan Administrator at (844) 753-6354. Such termination will be effective immediately if the Participant’s notice is received by the Plan Administrator prior to any distribution record date. Upon any withdrawal or termination, the Plan Administrator will cause to be delivered to each terminating Participant a statement of holdings for the appropriate number of the Fund’s whole book-entry Common Shares and a check for the cash adjustment of any fractional share at the market value of the Fund’s Common Shares as of the close of business on the date the termination is effective less any applicable fees. In the event a Participant’s notice of termination is on or after a record date (but before payment date) for an account whose dividends are reinvested, the Plan Administrator, in its sole discretion, may either distribute such dividends in cash or reinvest them in Common Shares on behalf of the terminating Participant. In the event reinvestment
90
is made, the Plan Administrator will process the termination as soon as practicable, but in no event later than five business days after the reinvestment is completed. The Plan may be terminated by the Fund upon notice in writing mailed to each Participant at least 30 days prior to any record date for the payment of any dividend or distribution by the Fund.
11. These terms and conditions may be amended or supplemented by the Fund at any time but, except when necessary or appropriate to comply with applicable law or the rules or policies of the Securities and Exchange Commission or any other regulatory authority, only by mailing to each Participant appropriate written notice at least 30 days prior to the effective date thereof. The amendment or supplement shall be deemed to be accepted by each Participant unless, prior to the effective date thereof, the Plan Administrator receives written notice of the termination of the Participant’s account under the Plan. Any such amendment may include an appointment by the Plan Administrator in its place and stead of a successor agent under these terms and conditions, with full power and authority to perform all or any of the acts to be performed by the Plan Administrator under these terms and conditions. Upon any such appointment of any agent for the purpose of receiving Distributions, the Fund will be authorized to pay to such successor agent, for each Participant’s account, all dividends and distributions payable on shares of the Fund held in the Participant’s name or under the Plan for retention or application by such successor agent as provided in these terms and conditions.
12. The Plan Administrator will at all times act in good faith and use its best efforts within reasonable limits to ensure its full and timely performance of all services to be performed by it under this Plan and to comply with applicable law, but assumes no responsibility and shall not be liable for loss or damage due to errors unless such error is caused by the Plan Administrator’s negligence, bad faith, or willful misconduct or that of its employees or agents.
13. The automatic reinvestment of dividends does not relieve Participants of any taxes which may be payable on dividends. Participants will receive tax information annually for their personal records and to help them prepare their federal income tax return. Specific cost basis information will also be included on a Participant’s statement in accordance with applicable law.
14. These terms and conditions of the Plan shall be governed by applicable federal securities laws and the laws of the State of New York.
Adopted: November 9, 2023
Amended: July 31, 2024
PGIM Credit Income Fund 91
Trustees and Officers
The Fund’s Board of Trustees (the “Board of Trustees” or the “Board” and the members thereof, the “Trustees”) is responsible for the overall supervision of the business and affairs of the Fund and performs the various duties imposed on the trustees of investment companies by the Investment Company Act and applicable Delaware law. The Board in turn elects the officers, who are responsible for administering the day-to-day operations of the Fund. Information about the Board of Trustees and officers is set forth below. Trustees who are not deemed to be “interested persons” of the Fund, as defined in the Investment Company Act, are referred to as “Independent Trustees.” Trustees who are not deemed to be Independent Trustees are referred to as “Interested Trustees.”
The Fund’s executive officers are elected by the Board to hold office until their respective successors are duly elected and qualify. Unless noted otherwise, the address of all Trustees and Officers is c/o PGIM Investments LLC, 655 Broad Street, Newark, New Jersey 07102-4410.
Biographical Information of the Board of Trustees. Certain biographical and other information relating to the Trustees of the Fund is set out below.
Independent Trustees
| ||||||
Name Year of Birth Position(s) Portfolios Overseen | Principal Occupation(s) During Past Five Years | Other Directorships Held During Past Five Years | Length of Board Service | |||
Morris L. McNair, III 1968 Trustee Portfolios Overseen: 46 | Chairman of SG Credit Partners, Inc. (lower middle market lender) (August 2019-Present); Chief Executive Officer of MidMark Financial Group, Inc. (specialty finance business) (February 2019-Present); formerly, Founding Partner of Virgo Investment Group (middle- market opportunistic private equity fund) (2010-2019); formerly, Investment Professional, Silver Point Capital (2007-2009); formerly, Senior Managing Director at CIT (2001-2007); formerly, Vice President Wachovia’s Corporate Banking Group (1993-2001). | Formerly, Director, Lease Corporation of America (2013- 2022); formerly, Director, Stonegate Capital (Co-Chairman) (2017-2019); formerly, Director; AgResource Management/ Agrifund (Chairman) (2016- 2019); formerly, Director, NOW Account Network Corporation (2014-2019); formerly, Director, HPF Service (Chairman) (2013- 2019); formerly, Director, Zippy Shell Incorporated (Chairman) (2015-2018); formerly, Director, Ygrene Energy Fund (2014-2018). | Since September 2023 | |||
PGIM Credit Income Fund
Trustees and Officers (continued)
Independent Trustees
| ||||||
Name Year of Birth Position(s) Portfolios Overseen | Principal Occupation(s) During Past Five Years | Other Directorships Held During Past Five Years | Length of Board Service | |||
Mary Lee Schneider 1962 Trustee Portfolios Overseen: 46 | Formerly, President & Chief Executive Officer of SG360° (direct marketing communications) (2015-2018); formerly, President & Chief Executive Officer of Follett Corp. (PreK-12 Educational Technology & Services) (2012-2015); formerly, President, Digital Solutions & Chief Technology Officer for RR Donnelley (communications company for marketing, commercial printing and related services) (1992-2012); formerly, McGraw Hill’s Business Week Magazine (1987-1992); formerly, Time Warner (1985-1987). | Independent Director, SGS & Co. (a global brand agency) (2023-Present); Independent Director, The Larry H. Miller Company (holding company comprised of real estate, senior healthcare, sports/ entertainment businesses and various minority/ majority investments) (2015-Present); Trustee, Penn State University’s Board of Trustees (2015-Present); Member, Penn State Investment Council (2023-Present); Member/ Co-Chair, Mercy Home for Boys & Girls’ Leader Council (2014-Present). | Since September 2023 | |||
Thomas M. Turpin 1960 Trustee Portfolios Overseen: 46 | Formerly, Chief Operating Officer at Heitman LLC (global real estate investment firm) (2013-2018); formerly, Chief Operating Officer and Chief Executive Officer of Old Mutual US Asset Management (institutional and retail asset management business) (2002-2010); formerly, Managing Director and Head of Defined Contribution Plans, Putnam (2000-2001); formerly, Managing Director and Chief Administrative Officer of the Institutional, Retail and Defined Contributions Business; Putnam Investments (1993-1999); formerly, Trust Accountant, Financial Analyst, Controller of Institutional group; formerly, Manager, Global Cash and Securities Processing Group The Boston Company (now part of BNY Mellon) (1982-1993). | Formerly, Director, Old Mutual Asset Management Trust Co. (2009-2010); formerly, Trustee, Old Mutual Advisors Fund II (2008-2010); formerly, Board Member of numerous investment boutiques majority owned by Old Mutual Asset Management (2004-2010). | Since September 2023 | |||
Visit our website at pgim.com/investments
Interested Trustees
| ||||||
Name Year of Birth Position(s) Portfolios Overseen | Principal Occupation(s) During Past Five Years | Other Directorships Held During Past Five Years | Length of Board Service | |||
Scott E. Benjamin 1973 Trustee & Vice President Portfolios Overseen: 150 | Executive Vice President (since May 2009) of PGIM Investments LLC; Vice President (since June 2012) of Prudential Investment Management Services LLC; Executive Vice President (since September 2009) of AST Investment Services, Inc.; Senior Vice President of Global Product Management and Marketing, PGIM Investments LLC (since February 2006); Vice President (since March 2022) of the PGIM Alternatives Funds and (since March 2010) of the PGIM Retail Funds; formerly Vice President of Product Development and Product Management, PGIM Investments LLC (2003-2006). | None | Since September 2023 | |||
Biographical Information of the Officers of the Fund. Certain biographical and other information relating to the officers of the Fund is set out below.
Fund Officers(a)
| ||||
Name Year of Birth Position | Principal Occupation(s) During Past Five Years | Length of Service as Fund Officer | ||
Stuart S. Parker 1962 President and Principal Executive Officer | President, Chief Executive Officer and Officer in Charge of PGIM Investments LLC (since January 2012); President and Principal Executive Officer (PEO) (since March 2022) of the PGIM Alternatives Funds and (since January 2012) of the PGIM Retail Funds; formerly Chief Operating Officer for PGIM Investments LLC (January 2012-January 2024); formerly Executive Vice President of Jennison Associates LLC and Head of Retail Distribution of PGIM Investments LLC (June 2005-December 2011); Investment Company Institute-Board of Governors (since May 2012). | Since September 2023 |
PGIM Credit Income Fund
Trustees and Officers (continued)
Fund Officers(a)
| ||||
Name Year of Birth Position | Principal Occupation(s) During Past Five Years | Length of Service as Fund Officer | ||
Claudia DiGiacomo 1974 Chief Legal Officer | Chief Legal Officer, Executive Vice President and Secretary of PGIM Investments LLC (since August 2020); Chief Legal Officer (since January 2024) of PGIM DC Solutions LLC, (since July 2022) of the PGIM Alternatives Funds and (since August 2020) of the PGIM Retail Funds, Prudential Annuities Funds, Prudential Mutual Fund Services LLC, and PIFM Holdco, LLC; Vice President and Corporate Counsel (since January 2005) of Prudential; and Corporate Counsel of AST Investment Services, Inc. (since August 2020); formerly Vice President and Assistant Secretary of PGIM Investments LLC (2005-2020); formerly Associate at Sidley Austin Brown & Wood LLP (1999-2004). | Since September 2023 | ||
Dino Capasso 1974 Chief Compliance Officer | Vice President, PGIM Investments LLC (since June 2024); Chief Compliance Officer (since July 2024) of the PGIM Retail Funds, Prudential Annuities Funds and PGIM Alternatives Funds; formerly Chief Compliance Officer and Vice President, T. Rowe Price Associates, Inc., T. Rowe Price Investment Management, Inc., and the T. Rowe Price mutual fund complex (from May 2022 to May 2024); formerly Chief Compliance Officer, PGIM Investments LLC and AST Investment Services, Inc. (ASTIS) (September 2019 to April 2022); formerly Chief Compliance Officer (July 2019-April 2022) of the PGIM Retail Funds and Prudential Annuities Funds and (March 2022-April 2022) of PGIM Private Real Estate Fund, Inc.; formerly Vice President and Deputy Chief Compliance Officer, PGIM Investments LLC and ASTIS (from June 2017 to September 2019). | Since July 2024 | ||
Andrew R. French 1962 Secretary | Vice President and Assistant Secretary (since January 2007) of PGIM Investments LLC; Secretary (since March 2022) of the PGIM Alternatives Funds and (since December 2018) of the PGIM Retail Funds and Prudential Annuities Funds; Vice President and Assistant Secretary (since January 2007) of Prudential Mutual Fund Services LLC; formerly Vice President and Corporate Counsel (2010-2018) of Prudential; formerly Director and Corporate Counsel (2006-2010) of Prudential. | Since September 2023 | ||
Melissa Gonzalez 1980 Assistant Secretary | Vice President and Corporate Counsel (since September 2018) of Prudential; Vice President and Assistant Secretary (since August 2020) of PGIM Investments LLC; Assistant Secretary (since March 2022) of the PGIM Alternatives Funds, (since March 2020) of the PGIM Retail Funds and (since March 2019) of the Prudential Annuities Funds; formerly Director and Corporate Counsel (March 2014-September 2018) of Prudential. | Since September 2023 | ||
Visit our website at pgim.com/investments
Fund Officers(a)
| ||||
Name Year of Birth Position | Principal Occupation(s) During Past Five Years | Length of Service as Fund Officer | ||
Patrick E. McGuinness 1986 Assistant Secretary | Vice President and Assistant Secretary (since August 2020) of PGIM Investments LLC; Director and Corporate Counsel (since February 2017) of Prudential; Assistant Secretary (since March 2022) of the PGIM Alternatives Funds and (since June 2020) of the PGIM Retail Funds and Prudential Annuities Funds. | Since September 2023 | ||
Debra Rubano 1975 Assistant Secretary | Vice President and Corporate Counsel (since November 2020) of Prudential; Assistant Secretary (since March 2022) of the PGIM Alternatives Funds and (since December 2020) of the PGIM Retail Funds and (since November 2020) of the Prudential Annuities Funds; formerly Director and Senior Counsel of Allianz Global Investors U.S. Holdings LLC (2010-2020) and Assistant Secretary of numerous funds in the Allianz fund complex (2015-2020). | Since September 2023 | ||
George Hoyt 1965 Assistant Secretary | Vice President and Corporate Counsel of Prudential (since September 2023); Assistant Secretary (since March 2024) of the Prudential Annuities Funds, (since December 2023) of the PGIM Retail Funds, and (since September 2023) of the PGIM Alternatives Funds; formerly Associate General Counsel of Franklin Templeton and Secretary and Chief Legal Officer of certain funds in the Franklin Templeton complex (2020-2023) and Managing Director (2016-2020) and Associate General Counsel for Legg Mason, Inc. and its predecessors (2004-2020). | Since September 2023 | ||
Devan Goolsby 1991 Assistant Secretary | Vice President and Corporate Counsel of Prudential (since May 2023); Assistant Secretary (since March 2024) of the Prudential Annuities Funds, (since December 2023) of the PGIM Retail Funds and (since September 2023) of the PGIM Alternatives Funds; formerly Associate at Eversheds Sutherland (US) LLP (2021-2023); Compliance Officer at Bloomberg LP (2019-2021); and an Examiner at the Financial Industry Regulatory Authority (2015-2019). | Since September 2023 | ||
Kelly A. Coyne 1968 Assistant Secretary | Director, Investment Operations of Prudential Mutual Fund Services LLC (since 2010); Assistant Secretary (since March 2022) of the PGIM Alternatives Funds and (since March 2015) of the PGIM Retail Funds. | Since September 2023 | ||
PGIM Credit Income Fund
Trustees and Officers (continued)
Fund Officers(a) | ||||
Name Year of Birth Position | Principal Occupation(s) During Past Five Years | Length of Service as Fund Officer | ||
Christian J. Kelly 1975 Chief Financial Officer | Vice President, Global Head of Investment Operations of PGIM Investments LLC (since November 2018); Chief Financial Officer (since March 2023) of the PGIM Retail Funds and Prudential Annuities Funds and (since July 2022) of the PGIM Alternatives Funds; formerly Treasurer and Principal Financial Officer (January 2019- March 2023) of the PGIM Retail Funds and Prudential Annuities Funds; formerly Treasurer and Principal Financial Officer (March 2022-July 2022) of the PGIM Private Real Estate Fund, Inc.; formerly Director of Fund Administration of Lord Abbett & Co. LLC (2009-2018), Treasurer and Principal Accounting Officer of the Lord Abbett Family of Funds (2017-2018); Director of Accounting, Avenue Capital Group (2008-2009); Senior Manager, Investment Management Practice of Deloitte & Touche LLP (1998-2007). | Since September 2023 | ||
Russ Shupak 1973 Treasurer and Principal Accounting Officer | Vice President (since 2017) within PGIM Investments Fund Administration; Treasurer and Principal Accounting Officer (since September 2023) of the PGIM Credit Income Fund, (since March 2023) of the PGIM Retail Funds, and (since July 2022) of the PGIM Private Real Estate Fund, Inc.; Assistant Treasurer (since September 2023) of the PGIM Rock ETF Trust, (since September 2022) of the PGIM Private Credit Fund, and (since October 2019) of the Prudential Annuities Funds; formerly Assistant Treasurer (March 2022-July 2022) of the PGIM Private Real Estate Fund, Inc.; formerly Director (2013-2017) within PGIM Investments Fund Administration. | Since September 2023 | ||
Elyse M. McLaughlin 1974 Assistant Treasurer | Vice President (since 2017) within PGIM Investments Fund Administration; Treasurer and Principal Accounting Officer (since September 2023) of the PGIM Rock ETF Trust, (since March 2023) of the Prudential Annuities Funds, and (since September 2022) of the PGIM Private Credit Fund; Assistant Treasurer (since September 2023) of the PGIM Credit Income Fund, (since March 2022) of the PGIM Private Real Estate Fund, Inc., and (since October 2019) of the PGIM Retail Funds; Assistant Treasurer; formerly Director (2011-2017) within PGIM Investments Fund Administration. | Since September 2023 | ||
Visit our website at pgim.com/investments
Fund Officers(a) | ||||
Name Year of Birth Position | Principal Occupation(s) During Past Five Years | Length of Service as Fund Officer | ||
Robert W. McCormack 1973 Assistant Treasurer | Vice President (since 2019) within PGIM Investments Fund Administration; Assistant Treasurer (since March 2023) of the PGIM Retail Funds and Prudential Annuities Funds and (since March 2022) of the PGIM Alternatives Funds; formerly Director (2016-2019) within PGIM Investments Fund Administration; formerly Vice President within Goldman, Sachs & Co. Investment Management Controllers (2008-2016), Assistant Treasurer of Goldman Sachs Family of Funds (2015-2016). | Since September 2023 | ||
| (a) | Excludes Mr. Benjamin, Interested Trustee of the Fund, who also serves as Vice President of the Fund. See biography above. |
Explanatory Notes to Tables:
| · | Trustees are deemed to be “interested,” as defined in the Investment Company Act, by reason of his or her affiliation with PGIM Investments LLC (“PGIM Investments”) and/or an affiliate of PGIM Investments. |
| · | Unless noted otherwise, the address of all Trustees and Officers is c/o PGIM Investments LLC, 655 Broad Street, Newark, New Jersey 07102-4410. |
| · | “Other Directorship Held” includes only Directorships of companies required to register or file reports with the SEC under the Securities Exchange Act of 1934, as amended (the “Exchange Act”) (that is, “public companies”), or other investment companies registered under the Investment Company Act. |
| · | “Portfolios Overseen” includes such applicable investment companies managed by PGIM Investments LLC and overseen by the Trustee. The investment companies for which PGIM Investments LLC serves as manager include: |
| · | The “PGIM Retail Funds” (currently consisting of the PGIM Retail Mutual Funds, PGIM ETF Trust, PGIM High Yield Bond Fund, Inc., PGIM Global High Yield Fund, Inc. and PGIM Short Duration High Yield Opportunities Fund); |
| · | The “Prudential Annuities Funds” (currently consisting of The Prudential Series Fund, Prudential’s Gibraltar Fund, Inc. and the Advanced Series Trust); and |
| · | The “PGIM Alternatives Funds” (currently consisting of PGIM Rock ETF Trust, PGIM Private Real Estate Fund, Inc., PGIM Private Credit Fund, and PGIM Credit Income Fund). |
| · | As used in the Fund Officers table “Prudential” means The Prudential Insurance Company of America. |
PGIM Credit Income Fund
US Consumer Privacy Notice
Prudential values your business and your trust. We respect the privacy of your personal information and take our responsibility to protect it seriously. This privacy notice is provided on behalf of the Prudential companies listed at the end of this notice and applies to our current and former customers. This notice describes how we treat the information we receive about you, including the ways in which we will disclose your personal information within Prudential and your right to opt out of such disclosing.
Protecting Your Personal Information
We maintain physical, electronic, and procedural safeguards to protect your personal information. The people authorized to access your personal information need it to do their jobs, and we require that they keep your information secure and confidential.
Personal Information We Collect
We collect your personal information from you, such as when you fill out applications and other forms, when you visit or enter personal details on our websites, when you respond to our emails, and when you provide information over the telephone. We also collect personal information about you that others give to us. Collectively, this personal information includes, for example:
| ● | Name |
| ● | Address, email address, telephone number, and other contact information |
| ● | Employment and occupation, demographic, income, and financial information |
| ● | Government ID |
| ● | Transaction history |
| ● | Medical information for insurance applications & products |
| ● | Consumer reports from consumer reporting agencies |
| ● | Participant information from organizations that purchase products or services from us for the benefit of their members or employees |
| ● | Video and audio recordings, and biometric data |
| ● | Information gathered from your internet or network activity |
| ● | Information gathered as part of internal investigations |
Using Your Information
We use your personal information for various business purposes, including:
| ● | Normal everyday business purposes, such as providing services to you and administrating your account or policy |
| ● | Strategic planning and effectuating certain business relationships and partnerships |
| ● | Business research and analysis |
| ● | Data analytics, modeling (such as predictive modeling), the deployment of automated tools, and in certain instances, artificial intelligence in accordance with applicable law or other regulatory guidance |
| ● | Marketing products and services of Prudential and other companies that may interest you |
| ● | Detecting and preventing identity theft, fraud, or misuse of your accounts |
| ● | As required by law |
Disclosing Your Information
We may disclose your personal information, including information about your transactions and experiences:
| ● | Among Prudential companies and with other non-Prudential companies that perform services for us or on our behalf for our everyday business purposes, such as providing services to you, administering your account or policy, and marketing products and services of Prudential and other companies that may interest you. |
| ● | As necessary in connection with business operations, limited information may be disclosed to certain business partners and their service providers in order to effectuate and manage business partnerships. |
| ● | With another financial institution if you agree that your account or policy can be transferred to that company. |
| ● | As permitted or required by law, including, for example, to law enforcement officials and regulators, in response to subpoenas, and to prevent fraud. |
| ● | For those customers who have one of our products through a plan sponsored by an employer or other organization, we will disclose your personal information in a manner consistent with the terms of the plan agreement or consistent with our agreement with you. |
| ● | We may also disclose consumer report information among Prudential companies, which may include information about you from credit reports and certain information that we receive from you and from consumer reporting agencies or other third parties. You can limit this disclosing by following the instructions described in this notice. |
Unless you agree otherwise, we do not disclose your personal information with non-Prudential companies for them to market their products or services to you. We may tell you about a product or service that other companies offer and, if you respond, that company will know that we selected you to receive the information. We will not disclose your phone number with non-Prudential companies for the purposes of text messaging. Only Prudential companies who have obtained your prior express written consent will be able to contact you via text messaging.
Note: PGIM, Inc. and its affiliates comprising Prudential’s global investment management businesses do not sell or share Personal Information. PGIM does disclose information internally and with certain third parties. These third parties are our business partners and contractors, and they are bound by contracts, agreements, and monitoring to ensure that your data is treated with utmost protection and respect. Each third-party is carefully vetted, to ensure that they have adequate protection in place to protect your data before we agree to work with them.
Limiting Our Sharing – Opt Out/Privacy Choice
You may tell us not to share your personal information among Prudential companies for marketing purposes, and not to share consumer report information among Prudential companies, by “opting out” of such sharing. To limit our sharing for these purposes:
| ● | Visit us online at: https://www.prudential.com/links/privacy-center. |
| ● | Call us at: 1-877-248-4019 |
Note that you are not able to limit our ability to disclose your personal information among Prudential companies and with other non-Prudential companies for servicing and administration purposes.
Questions?
If you have any questions or concerns about how we protect, use, and disclose your personal information or about this privacy notice, please call us. The toll-free number is 1-877-248-4019. We reserve the right to modify this notice at any time. This notice is also available anytime at www.prudential.com.
Prudential companies include the following:
Insurance Companies and Insurance Company Separate Accounts:
The Prudential Insurance Company of America; Pruco Life Insurance Company; Pruco Life Insurance Company of New Jersey; Prudential Legacy Insurance Company of New Jersey; Insurance company separate accounts that include the following names or are otherwise identified as maintained by an entity that includes the following names: Prudential or Pruco (except for insurance company separate accounts sponsored by Prudential Retirement Insurance and Annuity Company (PRIAC), which were transferred to Empower as part of the sale of PRIAC to Empower Annuity Insurance Company of America and are no longer affiliated with Prudential)
Insurance Agencies:
Prudential Insurance Agency, LLC;
Broker-Dealers and Registered Investment Advisers:
AST Investment Services, Inc.; Prudential Annuities Distributors, Inc.; Pruco Securities, LLC; PGIM, Inc.; Prudential Investment Management Services LLC; PGIM Investments LLC; PGIM Private Placement Investors, L.P.; Prudential Select Strategies LLC; PGIM Quantitative Solutions LLC; Jennison Associates LLC; PGIM Custom Harvest LLC; ; PGIM DC Solutions, LLC ; PGIM Multi-Asset Solutions, LLC, PGIM Real Estate Advisors LLC; Deerpath Capital Management LP; Montana Capital Partners AG
Bank and Trust Companies:
Prudential Trust Company
Investment Companies and Other Investment Vehicles:
PGIM Funds; Prudential Insurance Funds; All funds that include the following names: Prudential, PCP, PGIM, PEP, PCEP, or PSLO
Other Companies:
Prudential Workplace Solutions Group Services, LLC; Prudential Mutual Fund Services LLC; PGIM Real Estate Finance, LLC
Vermont Residents: We will not disclose information about your creditworthiness among Prudential companies, other than as permitted by Vermont law, unless you authorize us to make those disclosures.

Prudential, the Prudential logo, and the Rock symbol are service marks of Prudential Financial, Inc. and its related entities, registered in many jurisdictions worldwide.
Privacy Ed 1/2025
D6021
655 Broad Street Newark, NJ 07102 | ∎ TELEPHONE (800)225-1852 | ∎ WEBSITE pgim.com/investments |
PROXY VOTING
The Board of Trustees of the Fund has delegated to the Fund’s subadvisers the responsibility for voting any proxies and maintaining proxy recordkeeping with respect to the Fund. A description of these proxy voting policies and procedures is available without charge, upon request, by calling (800) 225-1852 or by visiting the Securities and Exchange Commission’s website at sec.gov. Information regarding how the Fund voted proxies relating to portfolio securities during the most recent 12-month period ended June 30 is available on the Fund’s website and on the Securities and Exchange Commission’s website.
TRUSTEES
Morris L. McNair III · Mary Lee Schneider · Thomas M. Turpin · Scott E. Benjamin
OFFICERS
Stuart S. Parker, President and Principal Executive Officer · Scott E. Benjamin, Vice President · Christian J. Kelly, Chief Financial Officer · Claudia DiGiacomo, Chief Legal Officer · Dino Capasso, Chief Compliance Officer · Russ Shupak, Treasurer and Principal Accounting Officer · Andrew R. French, Secretary · Melissa Gonzalez, Assistant Secretary · Kelly A. Coyne, Assistant Secretary · Patrick E. McGuinness, Assistant Secretary · Debra Rubano, Assistant Secretary · George Hoyt, Assistant Secretary · Devan Goolsby, Assistant Secretary · Elyse M. McLaughlin, Assistant Treasurer · Robert W. McCormack, Assistant Treasurer
| MANAGER | PGIM Investments LLC | 655 Broad Street Newark, NJ 07102 | ||||
| SUBADVISERS | PGIM Fixed Income | 655 Broad Street Newark, NJ 07102 | ||||
| PGIM Limited | Grand Buildings, 1-3 Strand Trafalgar Square London, WC2N 5HR United Kingdom | |||||
| DISTRIBUTOR | Prudential Investment Management Services LLC | 655 Broad Street Newark, NJ 07102 | ||||
| CUSTODIAN | The Bank of New York Mellon | 240 Greenwich Street New York, NY 10286 | ||||
| TRANSFER AGENT | Prudential Mutual Fund Services LLC | PO Box 219929 Kansas City, MO 64121 | ||||
INDEPENDENT REGISTERED PUBLIC ACCOUNTING FIRM | PricewaterhouseCoopers LLP | 300 Madison Avenue New York, NY 10017 | ||||
| FUND COUNSEL | Simpson Thacher & Bartlett LLP | 425 Lexington Avenue New York, NY 10017 | ||||
An investor should consider the investment objectives, risks, charges, and expenses of the Fund carefully before investing. The prospectus and summary prospectus contain this and other information about the Fund. An investor may obtain the prospectus and summary prospectus by visiting our website at pgim.com/investments or by calling (800) 225-1852. The prospectus and summary prospectus should be read carefully before investing.
E-DELIVERY
To receive your fund documents online, go to pgim.com/investments/resource/edelivery and enroll. Instead of receiving printed documents by mail, you will receive notification via email when new materials are available. You can cancel your enrollment or change your email address at any time by visiting the website address above.
SHAREHOLDER COMMUNICATIONS WITH TRUSTEES
Shareholders can communicate directly with the Board of Trustees by writing to the Chair of the Board, PGIM Credit Income Fund, PGIM Investments, Attn: Board of Trustees, 655 Broad Street, Newark, NJ 07102. Shareholders can communicate directly with an individual Trustee by writing to that Trustee at the same address. Communications are not screened before being delivered to the addressee.
AVAILABILITY OF PORTFOLIO HOLDINGS
The Fund files its complete schedule of portfolio holdings with the Securities and Exchange Commission for the first and third quarters of each fiscal year as an exhibit to its reports on Form N-PORT. The Fund’s Form N-PORT filings are available on the Commission’s website at sec.gov.
Notice is hereby given in accordance with Section 23(c) of the Investment Company Act of 1940 and the rules promulgated thereunder that the Fund may purchase, from time to time, its shares at net asset value.
Mutual Funds and Closed-End Funds:
ARE NOT INSURED BY THE FDIC OR ANY FEDERAL GOVERNMENT AGENCY | MAY LOSE VALUE | ARE NOT A DEPOSIT OF OR GUARANTEED BY ANY BANK OR ANY BANK AFFILIATE | ||
PGIM CREDIT INCOME FUND
SHARE CLASS | A | C | Z | |||
NASDAQ | PGIZX | PGAJX | PGIWX | |||
CUSIP | 69434A207 | 69434A306 | 69434A108 | |||
MF253E
| (b) | Copy of each notice transmitted to stockholders in reliance on Rule 30e-3 under the Act (17 CFR 270.30e-3) that contains disclosures specified by paragraph (c)(3) of that rule – Not applicable. |
Item 2 – Code of Ethics — See Exhibit (a)(1) of Item 19
As of the end of the period covered by this report, the registrant has adopted a code of ethics (the “Section 406 Standards for Investment Companies – Ethical Standards for Principal Executive and Financial Officers”) that applies to the registrant’s Principal Executive Officer and Principal Financial Officer; the registrant’s Principal Financial Officer also serves as the Principal Accounting Officer.
The registrant hereby undertakes to provide any person, without charge, upon request, a copy of the code of ethics. To request a copy of the code of ethics, contact the registrant 800-225-1852, and ask for a copy of the Section 406 Standards for Investment Companies - Ethical Standards for Principal Executive and Financial Officers.
Item 3 – Audit Committee Financial Expert –
The registrant’s Board has determined that Mr. Morris L. McNair, III, member of the Board’s Audit Committee is an “audit committee financial expert,” and that he is “independent,” for purposes of this item.
Item 4 – Principal Accountant Fees and Services –
(a) Audit Fees
For the fiscal years ended December 31, 2024 and December 31, 2023, PricewaterhouseCoopers LLP (“PwC”), the Registrant’s principal accountant, billed the Registrant $75,000 and $95,000, respectively, for professional services rendered for the audit of the Registrant’s annual financial statements or services that are normally provided in connection with statutory and regulatory filings.
(b) Audit-Related Fees
For the fiscal years ended December 31, 2024 and December 31, 2023: none.
(c) Tax Fees
For the fiscal years ended December 31, 2024 and December 31, 2023: none.
(d) All Other Fees
For the fiscal years ended December 31, 2024 and December 31, 2023: none.
(e) (1) Audit Committee Pre-Approval Policies and Procedures
THE PGIM MUTUAL FUNDS
AUDIT COMMITTEE POLICY
on
Pre-Approval of Services Provided by the Independent
Accountants
The Audit Committee of each PGIM Mutual Fund is charged with the responsibility to monitor the independence of the Fund’s independent accountants. As part of this responsibility, the Audit Committee must pre-approve the independent accounting firm’s engagement to render audit and/or permissible non-audit services, as required by law. In evaluating a proposed engagement of the independent accountants, the Audit Committee will assess the effect that the engagement might reasonably be expected to have on the accountant’s independence. The Committee’s evaluation will be based on:
| • | a review of the nature of the professional services expected to be provided, |
| • | a review of the safeguards put into place by the accounting firm to safeguard independence, and |
| • | periodic meetings with the accounting firm. |
Policy for Audit and Non-Audit Services Provided to the Funds
On an annual basis, the scope of audits for each Fund, audit fees and expenses, and audit-related and non-audit services (and fees proposed in respect thereof) proposed to be performed by the Fund’s independent accountants will be presented by the Treasurer and the independent accountants to the Audit Committee for review and, as appropriate, approval prior to the initiation of such services. Such presentation shall be accompanied by confirmation by both the Treasurer and the independent accountants that the proposed non-audit services will not adversely affect the independence of the independent accountants. Such proposed non-audit services shall be described in sufficient detail to enable the Audit Committee to assess the appropriateness of such services and fees, and the compatibility of the provision of such services with the auditor’s independence. The Committee shall receive periodic reports on the progress of the audit and other services which are approved by the Committee or by the Committee Chair pursuant to authority delegated in this Policy.
The categories of services enumerated under “Audit Services”, “Audit-related Services”, and “Tax Services” are intended to provide guidance to the Treasurer and the independent accountants as to those categories of services which the Committee believes are generally consistent with the independence of the independent accountants and which the Committee (or the Committee Chair) would expect upon the presentation of specific proposals to pre-approve. The enumerated categories are not intended as an exclusive list of audit, audit-related or tax services, which the Committee (or the Committee Chair) would consider for pre-approval.
Audit Services
The following categories of audit services are considered to be consistent with the role of the Fund’s independent accountants:
| • | Annual Fund financial statement audits |
| • | Seed audits (related to new product filings, as required) |
| • | SEC and regulatory filings and consents |
Audit-related Services
The following categories of audit-related services are considered to be consistent with the role of the Fund’s independent accountants:
| • | Accounting consultations |
| • | Fund merger support services |
| • | Agreed Upon Procedure Reports |
| • | Attestation Reports |
| • | Other Internal Control Reports |
Individual audit-related services that fall within one of these categories (except for fund merger support services) and are not presented to the Audit Committee as part of the annual pre-approval process are subject to an authorized pre-approval by the Audit Committee so long as the estimated fee for those services does not exceed $30,000. Any services provided under such pre-approval will be reported to the Audit Committee at its next regular meeting. Should the amount of such services exceed $30,000 any additional fees will be subject to pre-approval by the Committee Chair (or any other Committee member on whom this responsibility has been delegated). Fees related to fund merger support services are subject to a separate authorized pre-approval by the Audit Committee with fees determined on a per occurrence and merger complexity basis.
Tax Services
The following categories of tax services are considered to be consistent with the role of the Fund’s independent accountants:
| • | Tax compliance services related to the filing or amendment of the following: |
| • | Federal, state and local income tax compliance; and, |
| • | Sales and use tax compliance |
| • | Timely RIC qualification reviews |
| • | Tax distribution analysis and planning |
| • | Tax authority examination services |
| • | Tax appeals support services |
| • | Accounting methods studies |
| • | Fund merger support services |
| • | Tax consulting services and related projects |
Individual tax services that fall within one of these categories and are not presented to the Audit Committee as part of the annual pre-approval process are subject to an authorized pre-approval by the Audit Committee so long as the estimated fee for those services does not exceed $30,000. Any services provided under such pre-approval will be reported to the Audit Committee at its next regular meeting. Should the amount of such services exceed $30,000 any additional fees will be subject to pre-approval by the Committee Chair (or any other Committee member on whom this responsibility has been delegated).
Other Non-Audit Services
Certain non-audit services that the independent accountants are legally permitted to render will be subject to pre-approval by the Committee or by one or more Committee members to whom the Committee has delegated this authority and who will report to the full Committee any pre-approval decisions made pursuant to this Policy. Non-audit services presented for pre-approval pursuant to this paragraph will be accompanied by a confirmation from both the Treasurer and the independent accountants that the proposed services will not adversely affect the independence of the independent accountants.
Proscribed Services
The Fund’s independent accountants will not render services in the following categories of non-audit services:
| • | Bookkeeping or other services related to the accounting records or financial statements of the Fund |
| • | Financial information systems design and implementation |
| • | Appraisal or valuation services, fairness opinions, or contribution-in-kind reports |
| • | Actuarial services |
| • | Internal audit outsourcing services |
| • | Management functions or human resources |
| • | Broker or dealer, investment adviser, or investment banking services |
| • | Legal services and expert services unrelated to the audit |
| • | Any other service that the Public Company Accounting Oversight Board determines, by regulation, is impermissible. |
Pre-approval of Non-Audit Services Provided to Other Entities Within the PGIM Fund Complex
Certain non-audit services provided to PGIM Investments LLC or any of its affiliates that also provide ongoing services to the PGIM Mutual Funds will be subject to pre-approval by the Audit Committee. The only non-audit services provided to these entities that will require pre-approval are those related directly to the operations and financial reporting of the Funds. Individual projects that are not presented to the Audit Committee as part of the annual pre-approval process will be subject to pre-approval by the Committee Chair (or any other Committee member on whom this responsibility has been delegated) so long as the estimated fee for those services does not exceed $30,000. Services presented for pre-approval pursuant to this paragraph will be accompanied by a confirmation from both the Treasurer and the independent accountants that the proposed services will not adversely affect the independence of the independent accountants.
Although the Audit Committee will not pre-approve all services provided to PGIM Investments LLC and its affiliates, the Committee will receive an annual report from the Fund’s independent accounting firm showing the aggregate fees for all services provided to PGIM Investments and its affiliates.
(e) (2) Percentage of services described in each of paragraphs (b) through (d) of this Item that were approved by the audit committee pursuant to paragraph (c)(7)(i)(C) of Rule 2-01 of Regulation S-X –
| Fiscal Year Ended December 31, 2024 | Fiscal Year Ended December 31, 2023 | |||
| 4(b) | Not applicable. | Not applicable. | ||
| 4(c) | Not applicable. | Not applicable. | ||
| 4(d) | Not applicable. | Not applicable. | ||
(f) Percentage of hours expended attributable to work performed by other than full time employees of principal accountant if greater than 50%.
The percentage of hours expended on the principal accountant’s engagement to audit the registrant’s financial statements for the most recent fiscal year that were attributed to work performed by persons other than the principal accountant’s full-time, permanent employees was 0%.
(g) Non-Audit Fees
The aggregate non-audit fees billed by the Registrant’s principal accountant for services rendered to the registrant’s investment adviser and any entity controlling, controlled by, or under common control with the investment adviser that provides ongoing services to the registrant for the fiscal years ended December 31, 2024 and December 31, 2023 was $0 and $0, respectively.
(h) Principal Accountant’s Independence
Not applicable as the Registrant’s principal accountant has not provided non-audit services to the registrant’s investment adviser and any entity controlling, controlled by, or under common control with the investment adviser that provides ongoing services to the registrant that were not pre-approved pursuant to Rule 2-01(c)(7)(ii) of Regulation S-X.
(i) Not applicable.
(j) Not applicable.
Item 5 – Audit Committee of Listed Registrants –
The registrant has a separately designated standing audit committee (the “Audit Committee”) established in accordance with Section 3(a)(58)(A) of the Securities Exchange Act of 1934. The members of the Audit Committee are Morris L. McNair, III (Chair), Mary Lee Schneider, and Thomas M. Turpin.
Item 6 – Investments – The registrant’s Schedule of Investments is included in the financial statements filed under Item 1 of this Form.
Item 7 – Financial Statements and Financial Highlights for Open-End Management Investment Companies – Not applicable.
Item 8 – Changes in and Disagreements with Accountants for Open-End Management Investment Companies – Not applicable.
Item 9 – Proxy Disclosures for Open-End Management Investment Companies – Not applicable.
Item 10 – Remuneration Paid to Directors, Officers, and Others of Open-End Management Investment Companies – Not applicable.
Item 11 – Statement Regarding Basis for Approval of Investment Advisory Contract - None.
Item 12 – Disclosure of Proxy Voting Policies and Procedures for Closed-End Management Investment Companies
PGIM Fixed Income
PGIM Fixed Income is a business unit of PGIM. PGIM Fixed Income’s policy is to vote proxies in the best interests of its clients. In the case of pooled accounts, the policy is to vote proxies in the best interests of the pooled account. The proxy voting policy contains detailed voting guidelines on a wide variety of issues commonly voted upon by shareholders. These guidelines reflect PGIM Fixed Income’s judgment of how to further the best interests of its clients through the shareholder or debt-holder voting process.
PGIM Fixed Income invests primarily in debt securities, thus there are few traditional proxies voted by it. PGIM Fixed Income generally votes with management on routine matters such as the appointment of accountants or the election of directors. From time to time, ballot issues arise that are not addressed by the policy or circumstances may suggest a vote not in accordance with the established guidelines. In these cases, voting decisions are made on a case-by-case basis by the applicable portfolio manager taking into consideration the potential economic impact of the proposal. Not all ballots are received by PGIM Fixed Income in advance of voting deadlines, but when ballots are received in a timely fashion, PGIM Fixed Income strives to meet its voting obligations. It cannot, however, guarantee that every proxy will be voted prior to its deadline.
With respect to non-U.S. holdings, PGIM Fixed Income takes into account additional restrictions in some countries that might impair its ability to trade those securities or have other potentially adverse economic consequences. PGIM Fixed Income generally votes non-U.S. securities on a best efforts basis if it determines that voting is in the best interests of its clients.
Occasionally, a conflict of interest may arise in connection with proxy voting. For example, the issuer of the securities being voted may also be a client of PGIM Fixed Income. When PGIM Fixed Income identifies an actual or potential material conflict of interest between the firm and its clients with respect to proxy voting, the matter is presented to senior management who will resolve such issue in consultation with the compliance and legal departments. Proxy voting is reviewed by the trade management oversight committee.
Any client may obtain a copy of PGIM Fixed Income’s proxy voting policy, guidelines and procedures, as well as the proxy voting records for that client’s securities, by contacting the account management representative responsible for the client’s account.
Item 13 – Portfolio Managers of Closed-End Management Investment Companies
As of December 31, 2024, the following individuals are jointly and primarily responsible for the day-to-day management of the Fund.
Richard Piccirillo is a Managing Director and one of the co-heads on the Multi-Sector Team at PGIM Fixed Income. Mr. Piccirillo had specialized in mortgage-and asset-backed securities since joining the Firm in 1993. Before joining the Firm, Mr. Piccirillo was a fixed income analyst with Fischer Francis Trees & Watts. Mr. Piccirillo started his career as a financial analyst at Smith Barney. He received a BBA in Finance from George Washington University and an MBA in Finance and International Business from New York University. Mr. Piccirillo was named a 2019 winner of the Pension and Investment Provider Award for Global Multi-Asset Credit.
Tyler Thorn is a Principal and a portfolio manager on the Multi-Sector Team at PGIM Fixed Income. Mr. Thorn joined the Firm in 2015 and previously was an analyst in the Portfolio Analysis Group. He has also worked on the Quantitative Modeling and Strategies team. Mr. Thorn received a BS in business administration with concentrations in finance, economics, and computer science from Boston College.
Edwin Wilches, CFA, is a Managing Director and Co-Head of PGIM Fixed Income’s Securitized Products team. Mr. Wilches is also a portfolio manager for dedicated CLO Tranche portfolios as well other dedicated securitized products funds. Mr. Wilches oversees securitized product security selection across the firm’s multi-sector, investment grade, high yield, LDI, money market and general account strategies. He plays an active leadership role in PGIM’s Racial Equity Initiative via participation in multiple workstreams, and is a member of the Latinx Executive Leadership Team for both PGIM and PGIM Fixed Income. Mr. Wilches is an active member in multiple trade associations across the US and European markets seeking to represent our client’s best interests and to help promote a functioning market structure. Prior to assuming his current responsibilities, Mr. Wilches was responsible for managing and trading the Firm’s investments in CLO tranches, supporting the Dryden CLO platform’s business development and investor relations efforts, and analyzing off-the-run alternative fixed income opportunities. Earlier, Mr. Wilches was a member of PGIM Fixed Income’s CDO analyst team, Business and Product Development Team and Fixed Income Operations team. Mr. Wilches joined the Firm in 2003. He received a BA in Economics from Rutgers University and an MBA from New York University. He holds the Chartered Financial Analyst (CFA) designation.
Brian Juliano is a Managing Director and Head of the U.S. Leveraged Loan Team for PGIM Fixed Income. He is also the Co-Head of PGIM Fixed Income’s U.S. CLO business and is a portfolio manager for the Firm’s investments in CLO tranches. Before joining the Bank Loan Team in 2003, Mr. Juliano was a CDO analyst and member of the CDO Business Team for the Firm and a manager in financial analysis in the Finance Group, where he was responsible for the finance function of various investment subsidiaries. Mr. Juliano joined the Firm in 2000. Previously, he was a consultant at Deloitte & Touche, where he worked on investment strategy and tax compliance of high net worth individuals. Mr. Juliano received a BS in Finance and an MBA in Finance and Accounting from New York University.
Other Accounts Managed by the Portfolio Managers. The following table sets forth certain information with respect to the portfolio managers for the Fund. Unless noted otherwise, all information is provided as of December 31, 2024.
The following table identifies, as of December 31, 2024: (i) the other registered investment companies, pooled investment vehicles and other accounts managed by an investment committee (or equivalent body) on which the corresponding portfolio manager serves and (ii) the total assets under management (“AUM”) of such companies, vehicles and accounts, and (iii) the number and total AUM of such companies, vehicles and accounts with respect to which the advisory fee is based on performance.
Richard Piccirillo
(in USD Millions, Unless Otherwise Mentioned) | Account(s) Managed | Assets of Accounts | Number of Accounts Subject to a Performance Fee | Assets Subject to a Performance Fee | ||||||
Registered Investment Companies | 50 | $ 110,299 | 0 | $ 0 | ||||||
Pooled Investment Vehicles Other Than Registered Investment Companies | 23 | $ 40,920 | 1 | $ 76 | ||||||
Other Accounts | 138 | $ 105,814 | 7 | $ 4,184 |
Tyler Thorn
(in USD Millions, Unless Otherwise Mentioned) | Account(s) Managed | Assets of Accounts | Number of Accounts Subject to a Performance Fee | Assets Subject to a Performance Fee | ||||||||
Registered Investment Companies | 41 | $ | 102,479 | 0 | $ 0 | |||||||
Pooled Investment Vehicles Other Than Registered Investment Companies | 16 | $ | 29,910 | 1 | $ 76 | |||||||
Other Accounts | 103 | $ | 88,112 | 2 | $ 641 | |||||||
Edwin Wilches
(in USD Millions, Unless Otherwise Mentioned) | Account(s) Managed | Assets of Accounts | Number of Accounts Subject to a Performance Fee | Assets Subject to a Performance Fee | ||||||
Registered Investment Companies | 68 | $ 45,826 | 0 | $ 0 | ||||||
Pooled Investment Vehicles Other Than Registered Investment Companies | 33 | $ 11,134 | 0 | $ 0 | ||||||
Other Accounts | 341 | $ 67,559 | 11 | $ 834 |
Brian Juliano
(in USD Millions, Unless Otherwise Mentioned) | Account(s) Managed | Assets of Accounts | Number of Accounts Subject to a Performance Fee | Assets Subject to a Performance Fee | ||||||
Registered Investment Companies | 30 | $ 21,695 | 0 | $ 0 | ||||||
Pooled Investment Vehicles Other Than Registered Investment Companies | 76 | $ 29,614 | 1 | $ 287 | ||||||
Other Accounts | 114 | $ 23,032 | 3 | $ 320 |
Compensation and Conflicts Disclosure:
PGIM, Inc. (PGIM)
Compensation
The base salary of an investment professional in the PGIM Fixed Income unit of PGIM is primarily based on market data relative to similar positions as well as the past performance, years of experience and scope of responsibility of the individual. PGIM Fixed Income is allocated an overall incentive pool based on the investment and financial performance of the business. Incentive compensation for investment professionals, including the annual cash bonus, the long-term equity grant and grants under PGIM Fixed Income’s long-term incentive plans, is primarily based on such person’s contribution to PGIM Fixed Income’s goal of providing investment performance to clients consistent with portfolio objectives, guidelines, risk parameters, and its compliance risk management and other policies, as well as market-based data such as compensation trends and levels of overall compensation for similar positions in the asset management industry. In addition, an investment professional’s qualitative contributions to the organization and its commercial success are considered in determining incentive compensation. Incentive compensation is not solely based on the performance of, or value of assets in, any single account or group of client accounts.
The PGIM Fixed Income unit within PGIM Limited (“PGIM Fixed Income (U.K.)”) has adopted a remuneration
policy in relation to activities conducted through the entities authorized and regulated by the FCA in the United Kingdom. The remuneration policy is intended to be compliant with the United Kingdom’s Investment Firms Prudential Regime (“IFPR”) and governs the remuneration of PGIM Fixed Income (U.K.) staff and “material risk takers” of PGIM Fixed Income (U.K.) including those that are based outside the United Kingdom.
An investment professional’s annual cash bonus is paid from an annual incentive pool. The pool is developed as a percentage of PGIM Fixed Income’s operating income and the percentage used to calculate the pool may be refined by factors such as:
| ● | business initiatives; |
| ● | the number of investment professionals receiving a bonus and related peer group compensation; |
| ● | financial metrics of the business relative to those of appropriate peer groups; and |
| ● | investment performance of portfolios: relative to appropriate peer groups; and/or as measured against relevant investment indices. |
Long-term compensation consists of Prudential Financial, Inc. restricted stock and grants under the long-term incentive plan and targeted long-term incentive plan. The long-term incentive plan is intended to align compensation with investment performance. The targeted long-term incentive plan is intended to align the interests of certain of PGIM Fixed Income’s investment professionals with the performance of the particular alternative investment strategies or commingled investment vehicles they manage. Grants under the long-term incentive plan and targeted long-term incentive plan are participation interests in notional accounts with a beginning value of a specified dollar amount. For the long-term incentive plan, the value attributed to these notional accounts increases or decreases over a defined period of time based on the performance of investment composites representing a number of PGIM Fixed Income’s investment strategies. With respect to targeted long-term incentive awards, the value attributed to the notional accounts increases or decreases over a defined period of time based (as applicable) on the performance of either a composite of particular alternative investment strategies or a commingled investment vehicle. An investment composite is an aggregation of accounts with similar investment strategies. The CEO of PGIM Fixed Income also receives performance shares which represent the right to receive shares of Prudential Financial, Inc. common stock conditioned upon, and subject to, the achievement of specified financial performance goals by Prudential Financial, Inc. Each of the restricted stock, grants under the long-term incentive plans, and performance shares is subject to vesting requirements.
Securities Ownership of Portfolio Managers
As of the date of this annual report, none of the portfolio managers beneficially owned any securities issued by the Fund.
Conflicts of Interest
Like other investment advisers, PGIM Fixed Income is subject to various conflicts of interest in the ordinary course of its business. PGIM Fixed Income strives to identify potential risks, including conflicts of interest, that are inherent in its business, and PGIM Fixed Income conducts annual conflict of interest reviews. However, it is not possible to identify every potential conflict that can arise. When actual or potential conflicts of interest are identified, PGIM Fixed Income seeks to address such conflicts through one or more of the following methods:
| ● | elimination of the conflict; |
| ● | disclosure of the conflict; or |
| ● | management of the conflict through the adoption of appropriate policies, procedures or other mitigants. |
PGIM Fixed Income follows the policies of Prudential Financial, Inc. on business ethics, personal securities trading, and information barriers. PGIM Fixed Income has adopted a code of ethics, allocation policies and conflicts of interest policies, among others, and has adopted supervisory procedures to monitor compliance with its policies. PGIM Fixed Income cannot guarantee, however, that its policies and procedures will detect and prevent, or result in the disclosure of, each and every situation in which a conflict arises or could potentially arise.
Side-by-Side Management of Accounts and Related Conflicts of Interest. PGIM Fixed Income’s side-by-side management of multiple accounts can create conflicts of interest. Examples are detailed below, followed by a discussion of how PGIM Fixed Income addresses these conflicts.
| ● | Performance Fees - PGIM Fixed Income manages accounts with asset-based fees alongside accounts with performance-based fees. This side-by-side management creates an incentive for PGIM Fixed Income and its investment professionals to favor one account over another. Specifically, PGIM Fixed Income or its affiliates have an incentive to favor accounts for which PGIM Fixed Income or an affiliate receives performance fees, and possibly take greater investment risks in those accounts, in order to bolster performance and increase its fees. |
| ● | Affiliated accounts - PGIM Fixed Income manages accounts on behalf of its affiliates as well as unaffiliated accounts. PGIM Fixed Income has an incentive to favor accounts of affiliates over others. Additionally, at times, PGIM Fixed Income’s affiliates provide initial funding or otherwise invest in vehicles managed by it, for example by providing “seed capital” for a fund or account. Managing “seeded” accounts alongside “non-seeded” accounts creates an incentive to favor the “seeded” accounts to establish a track record for a new strategy or product and possibly earn a higher return for our affiliate. Additionally, PGIM Fixed Income’s affiliated investment advisers from time to time allocate their asset allocation clients’ assets to PGIM Fixed Income. PGIM Fixed Income has an incentive to favor accounts used by its affiliates for their asset allocation clients to receive more assets from its affiliates. |
| ● | Larger accounts/higher fee strategies - larger accounts and clients typically generate more revenue than do smaller accounts or clients and certain of PGIM Fixed Income’s strategies have higher fees than others. As a result, a portfolio manager could have an incentive when allocating scarce investment opportunities to favor accounts that pay a higher fee or generate more income for PGIM Fixed Income (or which it believes would generate more revenue in the future). |
| ● | Long only and long/short accounts - PGIM Fixed Income manages accounts that only allow it to hold securities long as well as accounts that permit short selling. As a result, there are times when PGIM Fixed Income sells a security short in some client accounts while holding the same security long in other client accounts. These short sales could reduce the value of the securities held in the long only accounts. Conversely, purchases for long only accounts could have a negative impact on the short positions in long/short accounts. Consequently, PGIM Fixed Income has conflicts of interest in determining the timing and direction of investments. |
| ● | Securities of the same kind or class - PGIM Fixed Income sometimes buys or sells, or direct or recommend that a client buy or sell, securities of the same kind or class that are purchased or sold for another client at prices that may be different. Although such pricing differences could appear as preferences for one client over another, PGIM Fixed Income’s trade execution in each case is driven by its consideration of a variety of factors consistent with its duty to seek best execution. There are times when PGIM Fixed Income executes trades in securities of the same kind or class in one direction for an account and in the opposite direction for another account, or it determines not to trade securities in one or more accounts while trading for others. While such trades (or a decision not to trade) could appear inconsistent in how PGIM Fixed Income views or treats a security for one client versus another, they generally result from differences in investment strategy, portfolio composition or client direction. |
| ● | Investment at different levels of an issuer’s capital structure - There are times when PGIM Fixed Income invests client assets in the same issuer, but at different levels in the issuer’s capital structure. This could occur, for instance, when a client holds private securities or loans of an issuer and other clients hold publicly traded securities of the same issuer. In addition, there are times when PGIM Fixed Income invest client assets in a class or tranche of securities of a securitized finance vehicle (such as a collateralized loan obligation, asset-backed security or mortgage-backed security) and also, at the same or different time, invests the assets of another client (including affiliated clients) in a different class or tranche of securities of the same vehicle. These different securities can have different voting rights, dividend or repayment priorities, rights in bankruptcy or other features that conflict with one another. For some of these securities or other investments (particularly private securitized product investments for which clients own all or a significant portion of the outstanding securities or obligations), PGIM Fixed Income has had, input regarding the characteristics and the relative rights and priorities of the various classes or tranches. |
When PGIM Fixed Income invests client assets in different levels of an issuer’s capital structure, it is permitted to take actions with respect to the assets held by one client (including affiliated clients) that are potentially adverse to other clients, for example, by foreclosing on loans or by putting an issuer into default. In negotiating the terms and conditions of any such investments, or any subsequent amendments or waivers, PGIM Fixed Income could find that the interests of a client and the interests of one or more other clients (including affiliated clients) could conflict. In these situations, decisions over proxy voting, corporate
reorganizations, how to exit an investment, bankruptcy matters (including, for example, whether to trigger an event of default or the terms of any workout) or other actions or inactions can result in conflicts of interest. Similarly, if an issuer in which a client and one or more other clients directly or indirectly hold different classes of securities encounters financial problems, decisions over the terms of any workout will raise conflicts of interest (including potential conflicts over proposed waivers and amendments to debt covenants). For example, a senior bond holder or lender might prefer a liquidation of the issuer in which it could be paid in full, whereas an equity or junior bond holder might prefer a reorganization that holds the potential to create value for the equity holders or junior bond holders. There will be times where PGIM Fixed Income refrains from taking certain actions (including participating in workouts and restructurings) or making investments on behalf of certain clients or where PGIM Fixed Income determine to sell investments for certain clients, in each case in order to mitigate conflicts of interest or legal, regulatory or other risks to PGIM Fixed Income This could potentially disadvantage the clients on whose behalf the actions are not taken, investments are not made, or investments are sold. Conversely, in other cases, PGIM Fixed Income will not refrain from taking such actions or making investments on behalf of some clients (including affiliated clients), which could potentially disadvantage other clients. Any of the foregoing (or similar) conflicts of interest will be resolved or managed on a case-by-case basis (including, where determined to be required, by escalating matters to, and seeking direction and guidance from, senior management). Any such resolution will take into consideration the interests of the relevant clients, the circumstances giving rise to the conflict and applicable laws.
| ● | Financial interests of investment professionals - PGIM Fixed Income investment professionals from time to time invest in certain investment vehicles that it manages, including exchanged-traded funds (“ETFs”), mutual funds and (through a retirement plan) collective investment trusts. Also, certain of these investment vehicles are options under the 401(k) and deferred compensation plans offered by Prudential Financial, Inc. In addition, the value of grants under PGIM Fixed Income’s long-term incentive plan and targeted long-term incentive plan is affected by the performance of certain client accounts. As a result, PGIM Fixed Income investment professionals have financial interests in accounts managed by PGIM Fixed Income and/or that are related to the performance of certain client accounts. |
| ● | Non-discretionary/limited discretion accounts - PGIM Fixed Income provides non-discretionary and limited discretion investment advice to some clients and manages others on a fully discretionary basis. Trades in non-discretionary accounts or accounts where discretion is limited could occur before, in concert with, or after PGIM Fixed Income executes similar trades in its discretionary accounts. The non-discretionary/limited discretion clients may be disadvantaged if PGIM Fixed Income delivers investment advice to them after it initiates trading for the discretionary clients, or vice versa. Furthermore, a non-discretionary/limited discretion client may not be able to participate in trades if there is a delay in receiving such client’s direction or consent. In some cases, when such a client requests additional information prior to giving its direction or consent, PGIM Fixed Income is prohibited from sharing information because, for example, the information is non-public. |
How PGIM Fixed Income Addresses These Conflicts of Interest. PGIM Fixed Income has developed policies and procedures reasonably designed to address the conflicts of interest with respect to its different types of side-by-side management described above.
| ● | Each quarter, one or both of PGIM Fixed Income’s co-chief investment officers hold a series of meetings with the senior portfolio manager and team responsible for the management of each of PGIM Fixed Income’s investment strategies. During these meetings, they review and discuss the investment performance and performance attribution for client accounts managed in the strategy. These meetings generally are also attended by the CEO of PGIM Fixed Income, the head of quantitative analysis and risk management or his designee and a member of the compliance group, among others. |
| ● | In keeping with PGIM Fixed Income’s fiduciary obligations, its policy with respect to trade allocation is to treat all of its client accounts fairly and equitably over time. PGIM Fixed Income’s trade management oversight committee, which generally meets quarterly, is responsible for providing oversight with respect to trade aggregation and allocation. Its compliance group periodically reviews a sampling of new issue allocations and related documentation to confirm compliance with the trade allocation policy. In addition, the compliance and investment risk management groups review forensic reports regarding new issue and secondary trade activity on a quarterly basis. This forensic analysis includes such data as the: number of new issues allocated in the strategy; size of new issue allocations to each portfolio in the strategy; profitability of new issue transactions; portfolio turnover; and metrics related to large trade activity, which includes block |
trades. The results of these analyses are reviewed and discussed at PGIM Fixed Income’s trade management oversight committee meetings. The procedures above are designed to detect patterns and anomalies in PGIM Fixed Income’s side-by-side management and trading so that it may assess and improve its processes. |
| ● | PGIM Fixed Income has procedures that specifically address conflicts related to its side-by-side management of certain long/short and long only portfolios. These procedures address potential conflicts that could arise from differing positions between long/short and long only portfolios. In addition, lending opportunities with respect to securities for which the market is demanding a slight premium rate over normal market rates are allocated to long only accounts prior to allocating the opportunities to long/short accounts. |
Conflicts Related to PGIM Fixed Income’s Affiliations. As a business unit of PGIM, Inc., an indirect wholly-owned subsidiary of Prudential Financial, Inc., PGIM Fixed Income is part of a diversified, global financial services organization. PGIM Fixed Income is affiliated with many types of U.S. and non-U.S. financial service providers, including insurance companies, broker-dealers, commodity trading advisors, commodity pool operators and other investment advisers. Some of its employees are officers of and/or provide services to some of these affiliates.
| ● | Conflicts Related to Investment of Client Assets in Affiliated Funds PGIM Fixed Income invests client assets in funds that it manages or sub-advises for one or more affiliates. In choosing to invest client assets in such affiliated funds, PGIM Fixed Income could be considered to have a financial incentive to prefer investing client assets in such funds instead of in funds, investments or products managed or sponsored by parties that are not affiliated with PGIM Fixed Income. Investments in affiliated funds may, for example, benefit PGIM Fixed Income and/or its affiliates through increasing assets under management and/or fees. Under certain conditions, PGIM Fixed Income may offset, rebate or otherwise reduce its fees or other compensation with respect to investments in affiliated funds; however, this offset, reduction or rebate, if available, will not necessarily eliminate conflicts, as PGIM Fixed Income could nevertheless be considered to have a financial incentive to favor investing client assets in affiliated funds (because, for example, the fee applicable to the affiliated fund is higher than the amount of any fee waiver, investing in such funds would increase assets under management of such funds or could be viewed as being undertaken solely for the purposes of supporting the commercial growth of PGIM Fixed Income or its affiliates’ funds, products or lines of business). Further, if PGIM Fixed Income’s affiliates provide initial funding to or otherwise invest in affiliated funds, PGIM Fixed Income is incentivized to invest client assets in such funds in order to facilitate the redemption of all or part of its affiliates’ interest in such affiliated fund. PGIM Fixed Income also invests cash collateral from securities lending transactions in some of these funds. These investments benefit PGIM Fixed Income and/or its affiliate through increasing assets under management and/or fees. |
| ● | Conflicts Related to Referral Fees to Affiliates. From time to time, PGIM Fixed Income has arrangements where PGIM Fixed Income compensates affiliated parties for client referrals. PGIM Fixed Income also has arrangements with an affiliated entity which provide for payments to an affiliate if certain investments by others are made in certain of PGIM Fixed Income’s products or if PGIM Fixed Income establishes certain other advisory relationships. These investments benefit both PGIM Fixed Income and its affiliates through increasing assets under management and fees. |
| ● | Conflicts Related to Co- investment by Affiliates. PGIM Fixed Income affiliates provide initial funding to or otherwise invest in certain vehicles it manages. When certain of its affiliates provide “seed capital” or other capital for a fund, they generally do so with the intention of redeeming all or part of their interest at a future point in time or when they deem that sufficient additional capital has been invested in that fund. |
| ● | The timing of a redemption by an affiliate could benefit the affiliate. For example, the fund may be more liquid at the time of the affiliate’s redemption than it is at times when other investors may wish to withdraw all or part of their interests. |
| ● | In addition, a consequence of any withdrawal of a significant amount, including by an affiliate, is that investors remaining in the fund will bear a proportionately higher share of fund expenses following the redemption |
| ● | PGIM Fixed Income could also face a conflict if the interests of an affiliated investor in a fund it manages diverge from those of the fund or other investors. For example, PGIM Fixed Income affiliates, from time to time, hedge some or all of the risks associated with their investments in certain funds PGIM Fixed Income manages. PGIM Fixed Income may provide assistance in connection with this hedging activity. |
| ● | Insurance Affiliate General Accounts. Because of the substantial size of the general accounts of PGIM Fixed Income’s affiliated insurance companies (the “Insurance Affiliates”), trading by these general accounts, including PGIM Fixed Income’s trades on behalf of the accounts, may |
affect the market prices or limit the availability of the securities or instruments transacted. Although PGIM Fixed Income does not expect that the general accounts of affiliated insurers will execute transactions that will move a market frequently, and generally only in response to unusual market or issuer events, the execution of these transactions could have an adverse effect on transactions for or positions held by other clients. |
PGIM Fixed Income believes that the conflicts related to its affiliations described above are mitigated by its allocation policies and procedures, its supervisory review of accounts and its procedures with respect to side-by-side management, including of long only and long/short accounts.
Conflicts Related to Financial Interests and the Financial Interests of Affiliates
Prudential Financial, the general accounts of the Insurance Affiliates, PGIM Fixed Income and other affiliates of PGIM at times have financial interests in, or relationships with, companies whose securities or related instruments PGIM Fixed Income holds, purchases or sells in its client accounts. Certain of these interests and relationships are material to PGIM Fixed Income or to the Prudential enterprise. At any time, these interests and relationships could be inconsistent or in potential or actual conflict with positions held or actions taken by PGIM Fixed Income on behalf of PGIM Fixed Income’s client accounts. For example:
| ● | PGIM Fixed Income invests in the securities of one or more clients for the accounts of other clients. |
| ● | PGIM Fixed Income’s affiliates sell various products and/or services to certain companies whose securities PGIM Fixed Income purchases and sells for PGIM Fixed Income clients. |
| ● | PGIM Fixed Income invests in the debt securities of companies whose equity is held by its affiliates. |
| ● | PGIM Fixed Income’s affiliates hold public and private debt and equity securities of a large number of issuers. PGIM Fixed Income invests in some of the same issuers for other client accounts. For example: |
| ● | Affiliated accounts have held and can in the future hold the senior debt of an issuer whose subordinated debt is held by PGIM Fixed Income’s clients or hold secured debt of an issuer whose public unsecured debt is held in client accounts. See “Investment at different levels of an issuer’s capital structure” above for additional information regarding conflicts of interest resulting from investment at different levels of an issuer’s capital structure. |
| ● | To the extent permitted by applicable law, PGIM Fixed Income can also invest client assets in offerings of securities the proceeds of which are used to repay debt obligations held in affiliated accounts or other client accounts. PGIM Fixed Income’s interest in having the debt repaid creates a conflict of interest. PGIM Fixed Income has adopted a refinancing policy to address this conflict. |
| ● | Certain of PGIM Fixed Income’s affiliates’ directors or officers are directors or officers of issuers in which PGIM Fixed Income invests from time to time. These issuers could also be service providers to PGIM Fixed Income or its affiliates. |
| ● | In addition, PGIM Fixed Income can invest client assets in securities backed by commercial mortgage loans that were originated or are serviced by an affiliate. |
In general, conflicts related to the financial interests described above are addressed by the fact that PGIM Fixed Income makes investment decisions for each client independently considering the best economic interests of such client, under the circumstances.
Conflicts Arising Out of Legal and Regulatory Restrictions.
| ● | At times, PGIM Fixed Income is restricted by law, regulation, executive order, contract or other constraints as to how much, if any, of a particular security it can purchase or sell on behalf of a client, and as to the timing of such purchase or sale. Sometimes these restrictions apply as a result of its relationship with Prudential Financial and other affiliates. For example, PGIM Fixed Income does not purchase securities issued by Prudential Financial or other affiliates for client accounts. |
| ● | In certain instances, PGIM Fixed Income’s ability to buy or sell or transact for one or more client accounts will be constrained as a result of its voluntary or involuntary receipt of material non-public information |
(“MNPI”), various insider trading laws and related legal requirements. For example, PGIM Fixed Income would generally be unable to invest in, divest securities of or share investment analyses regarding companies for which it possesses MNPI, and such inability (which could last for an uncertain period of time until the information is no longer deemed material or non-public) can result in it being unable to buy, sell or transact for one or more client accounts or to take other actions that would otherwise be to the benefit of one or more clients. |
| ● | PGIM Fixed Income faces conflicts of interest in determining whether to accept MNPI. For example, PGIM Fixed Income has sought with respect to the management of investments in certain loans for clients, to retain the ability to purchase and sell other securities in the borrower’s capital structure by remaining “public” on the loan. In such cases, PGIM Fixed Income will seek to avoid receiving MNPI about the borrowers to which an account can or expects to lend or has lent (through assignments, participations or otherwise), which could place an account at an information disadvantage relative to other accounts and lenders. Conversely, PGIM Fixed Income has chosen to receive MNPI about certain borrowers/issuers for its clients that invest in bank loans or private debt instruments, which has restricted its ability to trade in other securities of the borrowers/issuers for its clients that invest in corporate bonds or other public securities. |
| ● | PGIM Fixed Income’s holdings of a security on behalf of its clients are required, under certain regulations, to be aggregated with the holdings of that security by other Prudential Financial affiliates. These holdings could, on an aggregate basis, exceed certain reporting or ownership thresholds. These aggregated holdings are centrally tracked and PGIM Fixed Income or Prudential Financial can choose to restrict purchases, sell existing positions, or otherwise restrict, forgo, or limit the exercise of rights to avoid crossing such thresholds because of the potential consequences to PGIM Fixed Income or Prudential Financial if such thresholds are exceeded. |
Conflicts Related to Investment Consultants. Many of PGIM Fixed Income’s clients and prospective clients retain investment consultants (including discretionary investment managers and OCIO providers) to advise them on the selection and review of investment managers (including with respect to the selection of investment funds). PGIM Fixed Income has dealings with these investment consultants in their roles as discretionary managers or non-discretionary advisers to their clients. PGIM Fixed Income also has independent business relationships with investment consultants.
PGIM Fixed Income provides investment consultants with information about accounts that it manages for the consultant’s clients (and similarly, PGIM Fixed Income provides information about funds in which such clients are invested), in each case pursuant to authorization from the clients. PGIM Fixed Income also provides information regarding its investment strategies to investment consultants, who use that information in connection with searches that they conduct for their clients. PGIM Fixed Income often responds to requests for proposals in connection with those searches.
Other interactions PGIM Fixed Income has with investment consultants include the following:
| ● | it provides advisory services to the proprietary accounts of investment consultants and/or their affiliates, and advisory services to funds offered by investment consultants and/or their affiliates; |
| ● | it invites investment consultants to events or other entertainment hosted by PGIM Fixed Income; |
| ● | it purchases software applications, market data, access to databases, technology services and other products or services from certain investment consultants; and |
| ● | it sometimes pays for the opportunity to participate in conferences organized by investment consultants. |
PGIM Fixed Income will provide clients with information about its relationship with the client’s investment consultant upon request. In general, PGIM Fixed Income relies on the investment consultant to make the appropriate disclosure to its clients of any conflict that the investment consultant believes to exist due to its business relationships with PGIM Fixed Income.
A client’s relationship with an investment consultant could result in restrictions in the eligible securities or trading counterparties for the client’s account. For example, accounts of certain clients (including clients that are subject to ERISA) can be restricted from investing in securities issued by the client’s consultant or its affiliates and from trading with, or participating in transactions involving, counterparties that are affiliated with the investment consultant. In some cases, these restrictions could have a material impact on account performance.
Conflicts Related to Service Providers. PGIM Fixed Income retains third party advisors and other service providers to provide various services for PGIM Fixed Income as well as for funds that PGIM Fixed Income manages or sub-advises. Some service providers provide services to PGIM Fixed Income or one of PGIM Fixed Income’s funds while also providing services to other PGIM units, other PGIM-advised funds, or affiliates of PGIM, and negotiate rates in the context of the overall relationship. PGIM Fixed Income can benefit from negotiated fee rates offered to its funds and vice versa. There is no assurance, however, that PGIM Fixed Income will be able to obtain or maintain advantageous fee rates from a given service provider negotiated by its affiliates based on their relationship with the service provider, or that PGIM Fixed Income will know of such negotiated fee rates.
Conflicts Related to Valuation and Fees. When client accounts hold illiquid or difficult to value investments, PGIM Fixed Income faces a conflict of interest when it makes recommendations regarding the value of such investments since its fees are generally based on the value of assets under management. PGIM Fixed Income could be viewed as having an incentive to value investments at higher valuations. PGIM Fixed Income has valuation policies and procedures that it believes mitigate this conflict effectively and enable it to value client assets fairly and in a manner that is consistent with the client’s best interests. This conflict generally does not exist and is further mitigated or eliminated in circumstances where fees are calculated from custodian and/or administrator pricing and not PGIM Fixed Income’s internal valuations.
Conflicts Related to Securities Lending and Reverse Repurchase Fees. In certain cases, when PGIM Fixed Income manages a client account and also serves as securities lending agent and/or engages in reverse repurchase transactions for the account, PGIM Fixed Income is compensated for its securities lending and reverse repurchase services by receiving a portion of the proceeds generated from the securities lending and reverse repurchase activities of the account. In cases where PGIM Fixed Income is compensated in this manner, it could be considered to have an incentive to invest in securities that would generate higher securities lending and reverse repurchase returns, even if these investments were not otherwise in the best interest of the client account. In addition, if PGIM Fixed Income is acting as securities lending agent and providing reverse repurchase services for the same client, PGIM Fixed Income may be incented to select the option that generates higher proceeds for itself.
Conflicts Related to Long-Term Compensation. As a result of the long-term incentive plan and targeted long-term incentive plan, PGIM Fixed Income’s portfolio managers from time to time have financial interests related to the investment performance of some, but not all, of the accounts they manage. For example, the performance of some client accounts is not reflected in the calculation of changes in the value of participation interests under PGIM Fixed Income’s long-term incentive plan. This may be because the composite representing the strategy in which the account is managed is not one of the composites included in the calculation or because the account is excluded from a specified composite due to guideline restrictions or other factors. In addition, the performance of only a small number of its investment strategies is covered under PGIM Fixed Income’s targeted long-term incentive plan. Further, for certain PGIM Fixed Income investment professionals, participation interests in the targeted long-term incentive plan constitute a significant percentage of their total long-term compensation. To address potential conflicts related to these financial interests, PGIM Fixed Income has procedures, including trade allocation and supervisory review procedures, designed to confirm that each of its client accounts is managed in a manner that is consistent with PGIM Fixed Income’s fiduciary obligations, as well as with the account’s investment objectives, investment strategies and restrictions. For example, one or both of PGIM Fixed Income’s co-chief investment officers review performance among similarly managed accounts on a quarterly basis during a series of meetings with the senior portfolio manager and team responsible for the management of each investment strategy. These quarterly investment strategy review meetings generally are also attended by the CEO of PGIM Fixed Income, the head of quantitative analysis and risk management or his designee and a member of the compliance group, among others.
Conflicts Related to the Offer and Sale of Securities. Certain of PGIM Fixed Income’s employees offer and sell securities of, and interests in, commingled funds that it manages. Employees offer and sell securities in connection with their roles as registered representatives of an affiliated broker-dealer, officers of an affiliated trust company, agents of the Insurance Affiliates, approved persons of an affiliated investment adviser or other roles related to such commingled funds. There is an incentive for PGIM Fixed Income’s employees to offer these securities to investors regardless of whether the investment is appropriate for such investor since increased assets in these vehicles will result in increased advisory fees to it. In addition, such sales could result in increased compensation to the employee.
Conflicts Related to Employee/Investment Professional Trading. Personal trading by PGIM Fixed Income employees creates a conflict when they are trading the same securities or types of securities as PGIM Fixed Income
trades on behalf of its clients. This conflict is mitigated by PGIM Fixed Income’s personal trading standards and procedures.
Conflicts Related to Outside Business Activity. From time to time, certain of PGIM Fixed Income employees or officers engage in outside business activity, including outside directorships. Any outside business activity is subject to prior approval pursuant to PGIM Fixed Income’s personal conflicts of interest and outside business activities policy. Actual and potential conflicts of interest are analyzed during such approval process. PGIM Fixed Income could be restricted in trading the securities of certain issuers in client portfolios in the unlikely event that an employee or officer, as a result of outside business activity, obtains material, non-public information regarding an issuer.
Item 14 – Purchases of Equity Securities by Closed-End Management Investment Company and Affiliated Purchasers – None.
Item 15 – Submission of Matters to a Vote of Security Holders – There have been no material changes to the procedures by which shareholders may recommend nominees to the registrant’s Board of Trustees.
Item 16 – Controls and Procedures
| (a) | It is the conclusion of the registrant’s principal executive officer and principal financial officer that the effectiveness of the registrant’s current disclosure controls and procedures (such disclosure controls and procedures having been evaluated within 90 days of the date of this filing) provide reasonable assurance that the information required to be disclosed by the registrant has been recorded, processed, summarized and reported within the time period specified in the Commission’s rules and forms and that the information required to be disclosed by the registrant has been accumulated and communicated to the registrant’s principal executive officer and principal financial officer in order to allow timely decisions regarding required disclosure. |
| (b) | There has been no significant change in the registrant’s internal control over financial reporting (as defined in Rule 30a-3(d) under the Act (17 CFR 270.30a-3(d)) that occurred during the period covered by this report that has materially affected, or is reasonably likely to materially affect, the registrant’s internal control over financial reporting. |
Item 17 – Disclosure of Securities Lending Activities for Closed-End Management Investment Companies – Not applicable.
Item 18 – Recovery of Erroneously Awarded Compensation – Not applicable
Item 19 – Exhibits
(a)(1) Code of Ethics – Attached hereto as Exhibit EX-99.CODE-ETH.
(a)(2) Policy required by the listing standards adopted pursuant to Rule 10D-1 under the Securities Exchange Act of 1934 – Not applicable.
(a)(4)Any written solicitation to purchase securities under Rule 23c-1 under the Investment Company Act of 1940 – Not applicable.
(a)(5) Change in the registrant’s independent public accountant – Not applicable.
SIGNATURES
Pursuant to the requirements of the Securities Exchange Act of 1934 and the Investment Company Act of 1940, the registrant has duly caused this report to be signed on its behalf by the undersigned, thereunto duly authorized.
| Registrant: | PGIM Credit Income Fund |
| By: | /s/Andrew R. French | |
| Andrew R. French | ||
| Secretary | ||
| Date: | February 24, 2025 | |
Pursuant to the requirements of the Securities Exchange Act of 1934 and the Investment Company Act of 1940, this report has been signed below by the following persons on behalf of the registrant and in the capacities and on the dates indicated.
| By: | /s/Stuart S. Parker | |
| Stuart S. Parker | ||
| President and Principal Executive Officer | ||
| Date: | February 24, 2025 | |
| By: | /s/Christian J. Kelly | |
| Christian J. Kelly | ||
| Chief Financial Officer (Principal Financial Officer) | ||
| Date: | February 24, 2025 | |