UNITED STATES
SECURITIES AND EXCHANGE COMMISSION
Washington, D.C. 20549
FORM N-CSR
CERTIFIED SHAREHOLDER REPORT OF REGISTERED
MANAGEMENT INVESTMENT COMPANIES
Investment Company Act file number (811-23893)
SP Funds Trust
(Exact name of registrant as specified in charter)
1331 S. International Parkway, Suite 2291
Lake Mary, FL 32746
(Address of principal executive offices) (Zip code)
The Corporate Trust Company
Corporation Trust Center
1209 Orange Street
Wilmington, DE 19801
(Name and address of agent for service)
With a Copy to:
Deborah Bielicke Eades
Vedder Price P.C.
222 North LaSalle Street
Chicago, Illinois 60601
(321) 275-5125
Registrant’s telephone number, including area code
Date of fiscal year end: October 31
Date of reporting period: October 31, 2024
Item 1. Reports to Stockholders.
SP Funds 2030 Target Date Fund Tailored Shareholder Report
annual Shareholder Report October 31, 2024 SP Funds 2030 Target Date Fund Ticker: SPTAX - Investor Shares |
This contains important information about the SP Funds 2030 Target Date Fund (the "Fund") for the period June 28, 2024 to October 31, 2024. You can find additional information about the Fund at www.sp-funds.com. You can also request this information by contacting us at (425) 409‑9500 or by contacting the Fund at ShariaPortfolio, 1331 S. International Pkwy Ste 2291, Lake Mary, FL 32746.
What were the Fund costs for the past year?
(based on a hypothetical $10,000 investment)
Fund Name | Costs of a $10,000 investment | Costs paid as a percentage of a $10,000 investment |
|---|---|---|
SP Funds 2030 Target Date Fund - Investor Shares | $29 | 0.85% |
Cumulative Performance
(Initial Investment of $10,000)
Date | SP Funds 2030 Target Date Fund (Investor Shares) - $9,880 | Dow Jones Target 2030 Index - $10,380 |
6/28/2024 | 10000 | 10000 |
7/31/2024 | 9885 | 10204 |
8/31/2024 | 9970 | 10357 |
9/30/2024 | 10050 | 10517 |
10/31/2024 | 9880 | 10380 |

Annual Performance
Annualized Returns for the Periods Ended October 31, 2024 | Since Inception (6/28/2024) |
|---|---|
SP Funds 2030 Target Date Fund - Investor Shares | -1.20% |
Dow Jones Target 2030 Index | 3.80% |
The Fund's past performance is not a good indicator of how the Fund will perform in the future. The graph and table do not reflect the deduction of taxes that a shareholder would pay on fund distributions or redemption of fund shares.
Visit www.sp-funds.com for more recent performance information.
Fund Performance Overview
For the period ending October 31, 2024, the SP Funds 2030 Target Date ETF sought a high level of total return in line with its target date of 2030. The fund’s performance was primarily driven by its diversified allocation across global equities and fixed income, adjusting its risk exposure as it approaches the target date. Despite volatility in global markets due to rising interest rates and inflation concerns, the fund maintained steady performance with a focus on long-term growth, benefiting from the strong performance of equities in technology and consumer sectors.
Factors Influencing Performance
The performance of the fund was influenced by the broad market dynamics, including macroeconomic factors such as higher interest rates and persistent inflation, which impacted bond prices. The fund's equity portion benefitted from strong performance in select growth sectors, while its bond exposure faced headwinds due to the rising interest rate environment. As the fund’s target date approaches, the asset allocation gradually shifted toward more conservative investments to reduce volatility, which helped cushion the impact of market fluctuations.
SP Funds 2030 Target Date Fund Tailored Shareholder Report
SP Funds 2030 Target Date Fund Tailored Shareholder Report
Key Fund Statistics
(as of October 31, 2024)
|
|
|---|---|
Fund Size (Thousands) | $2,186 |
Number of Holdings | 6 |
Total Advisory Fee Paid | $2,464 |
Annual Portfolio Turnover | 13% |
What did the Fund invest in?
(as of October 31, 2024)
Sector Breakdown
(% of net assets)
Sector | % |
Exchange Traded Funds | |
Cash & Cash Equivalents |

Percentages are based on total net assets. Cash & Cash Equivalents represents other assets in excess of liabilities.
Top Holdings | (% of net assets) |
|---|---|
SP Funds Dow Jones Global Sukuk ETF | |
SP Funds S&P 500 Sharia Industry Exclusions ETF | |
SP Funds S&P Global REIT Sharia ETF | |
SP Funds S&P Global Technology ETF | |
SP Funds S&P World (ex-US) ETF | |
SPDR Gold Shares |
How has the Fund changed?
There were no material changes during the reporting period.
Changes in and Disagreements with Accountants
There were no changes in or disagreements with accountants.
Householding
Householding is an option available to certain investors of the Fund. Householding is a method of delivery, based on the preference of the individual investor, in which a single copy of certain shareholder documents can be delivered to investors who share the same address, even if their accounts are registered under different names. Householding for the Fund is available through certain broker-dealers. If you are interested in enrolling in householding and receiving a single copy of prospectuses and other shareholder documents, please contact your broker-dealer. If you are currently enrolled in householding and wish to change your householding status, please contact your broker-dealer.
For additional information about the Fund, including its prospectus, financial information, holdings and proxy voting information, visit www.sp-funds.com .
SP Funds 2030 Target Date Fund Tailored Shareholder Report
SP Funds 2030 Target Date Fund Tailored Shareholder Report
annual Shareholder Report October 31, 2024 SP Funds 2030 Target Date Fund Ticker: SPTMX - Institutional Shares |
This contains important information about the SP Funds 2030 Target Date Fund (the "Fund") for the period August 29, 2024 to October 31, 2024. You can find additional information about the Fund at www.sp-funds.com. You can also request this information by contacting us at (425) 409‑9500 or by contacting the Fund at ShariaPortfolio, 1331 S. International Pkwy Ste 2291, Lake Mary, FL 32746.
What were the Fund costs for the past year?
(based on a hypothetical $10,000 investment)
Fund Name | Costs of a $10,000 investment | Costs paid as a percentage of a $10,000 investment |
|---|---|---|
SP Funds 2030 Target Date Fund - Institutional Shares | $45 | 0.45% |
Cumulative Performance
(Initial Investment of $10,000)
Date | SP Funds 2030 Target Date Fund (Institutional Shares) - $9,920 | Dow Jones Target 2030 Index - $10,043 |
8/29/2024 | 10000 | 10000 |
8/31/2024 | 9995 | 10021 |
9/30/2024 | 10085 | 10176 |
10/31/2024 | 9920 | 10043 |

Annual Performance
Annualized Returns for the Periods Ended October 31, 2024 | Since Inception (8/29/2024) |
|---|---|
SP Funds 2030 Target Date Fund - Institutional Shares | -0.80% |
Dow Jones Target 2030 Index | 0.43% |
The Fund's past performance is not a good indicator of how the Fund will perform in the future. The graph and table do not reflect the deduction of taxes that a shareholder would pay on fund distributions or redemption of fund shares.
Visit www.sp-funds.com for more recent performance information.
Fund Performance Overview
For the period ending October 31, 2024, the SP Funds 2030 Target Date ETF sought a high level of total return in line with its target date of 2030. The fund’s performance was primarily driven by its diversified allocation across global equities and fixed income, adjusting its risk exposure as it approaches the target date. Despite volatility in global markets due to rising interest rates and inflation concerns, the fund maintained steady performance with a focus on long-term growth, benefiting from the strong performance of equities in technology and consumer sectors.
Factors Influencing Performance
The performance of the fund was influenced by the broad market dynamics, including macroeconomic factors such as higher interest rates and persistent inflation, which impacted bond prices. The fund's equity portion benefitted from strong performance in select growth sectors, while its bond exposure faced headwinds due to the rising interest rate environment. As the fund’s target date approaches, the asset allocation gradually shifted toward more conservative investments to reduce volatility, which helped cushion the impact of market fluctuations.
SP Funds 2030 Target Date Fund Tailored Shareholder Report
SP Funds 2030 Target Date Fund Tailored Shareholder Report
Key Fund Statistics
(as of October 31, 2024)
|
|
|---|---|
Fund Size (Thousands) | $1,526 |
Number of Holdings | 6 |
Total Advisory Fee Paid | $2,464 |
Annual Portfolio Turnover | 13% |
What did the Fund invest in?
(as of October 31, 2024)
Sector Breakdown
(% of net assets)
Sector | % |
Exchange Traded Funds | |
Cash & Cash Equivalents |

Percentages are based on total net assets. Cash & Cash Equivalents represents other assets in excess of liabilities.
Top Holdings | (% of net assets) |
|---|---|
SP Funds Dow Jones Global Sukuk ETF | |
SP Funds S&P 500 Sharia Industry Exclusions ETF | |
SP Funds S&P Global REIT Sharia ETF | |
SP Funds S&P Global Technology ETF | |
SP Funds S&P World (ex-US) ETF | |
SPDR Gold Shares |
How has the Fund changed?
There were no material changes during the reporting period.
Changes in and Disagreements with Accountants
There were no changes in or disagreements with accountants.
Householding
Householding is an option available to certain investors of the Fund. Householding is a method of delivery, based on the preference of the individual investor, in which a single copy of certain shareholder documents can be delivered to investors who share the same address, even if their accounts are registered under different names. Householding for the Fund is available through certain broker-dealers. If you are interested in enrolling in householding and receiving a single copy of prospectuses and other shareholder documents, please contact your broker-dealer. If you are currently enrolled in householding and wish to change your householding status, please contact your broker-dealer.
For additional information about the Fund, including its prospectus, financial information, holdings and proxy voting information, visit www.sp-funds.com .
SP Funds 2030 Target Date Fund Tailored Shareholder Report
SP Funds 2040 Target Date Fund Tailored Shareholder Report
annual Shareholder Report October 31, 2024 SP Funds 2040 Target Date Fund Ticker: SPTBX - Investor Shares |
This contains important information about the SP Funds 2040 Target Date Fund (the "Fund") for the period June 28, 2024 to October 31, 2024. You can find additional information about the Fund at www.sp-funds.com. You can also request this information by contacting us at (425) 409‑9500 or by contacting the Fund at ShariaPortfolio, 1331 S. International Pkwy Ste 2291, Lake Mary, FL 32746.
What were the Fund costs for the past year?
(based on a hypothetical $10,000 investment)
Fund Name | Costs of a $10,000 investment | Costs paid as a percentage of a $10,000 investment |
|---|---|---|
SP Funds 2040 Target Date Fund - Investor Shares | $29 | 0.85% |
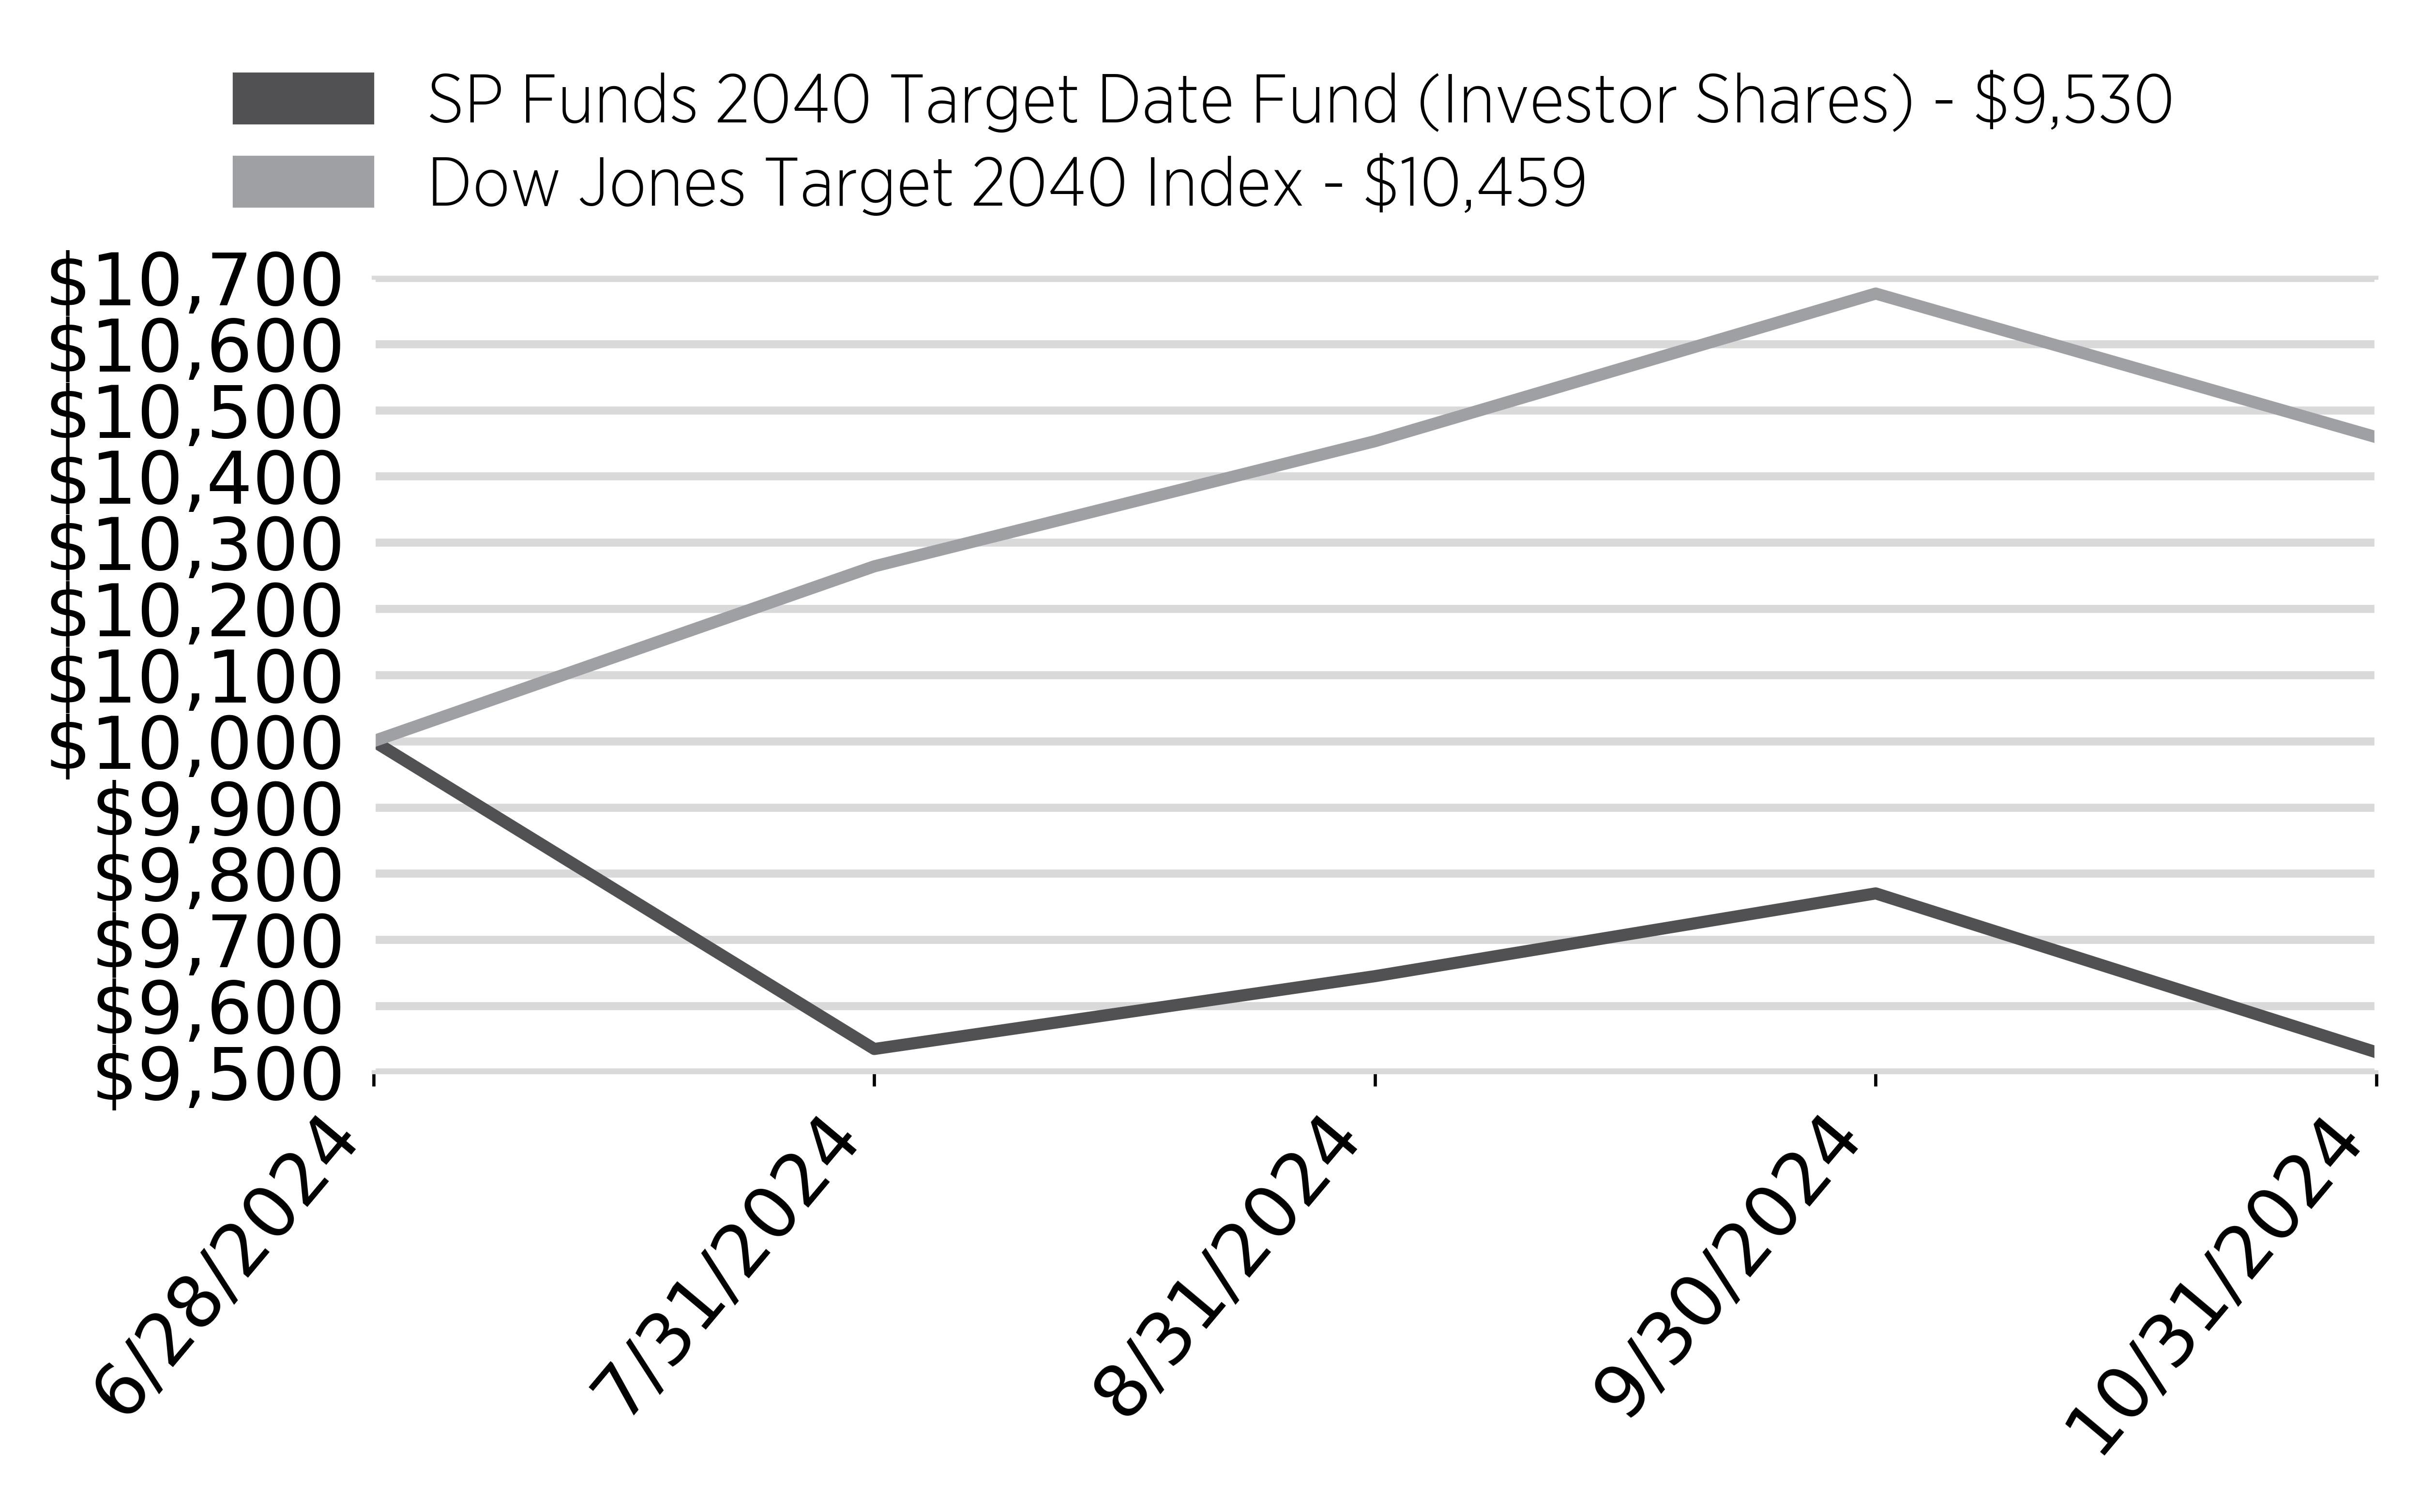
Cumulative Performance
(Initial Investment of $10,000)
Date | SP Funds 2040 Target Date Fund (Investor Shares) - $9,530 | Dow Jones Target 2040 Index - $10,459 |
6/28/2024 | 10000 | 10000 |
7/31/2024 | 9535 | 10264 |
8/31/2024 | 9645 | 10453 |
9/30/2024 | 9770 | 10676 |
10/31/2024 | 9530 | 10459 |
Annual Performance
Annualized Returns for the Periods Ended October 31, 2024 | Since Inception (6/28/2024) |
|---|---|
SP Funds 2040 Target Date Fund - Investor Shares | -4.70% |
Dow Jones Target 2040 Index | 4.39% |
The Fund's past performance is not a good indicator of how the Fund will perform in the future. The graph and table do not reflect the deduction of taxes that a shareholder would pay on fund distributions or redemption of fund shares.
Visit www.sp-funds.com for more recent performance information.
Fund Performance Overview
For the period ending October 31, 2024, the SP Funds 2040 Target Date ETF pursued its goal of high total return through its 2040 target date. The fund’s performance was influenced by global equity market trends, including robust growth in technology and healthcare sectors, which positively contributed to its overall returns. However, challenges such as inflationary pressures, rising interest rates, and geopolitical uncertainties created periods of volatility. The fund’s diversified portfolio balanced equities with fixed-income assets to manage risk while seeking long-term growth.
Factors Influencing Performance
Performance was impacted by a mix of strong returns from global equity markets, particularly in developed markets, and the challenges presented by the global economic landscape, including rising interest rates and inflation. The equity portion of the fund saw growth in technology and healthcare, while the fixed-income allocation faced headwinds as bond yields rose. The fund's asset allocation continued to shift toward more conservative investments, mitigating some of the risks associated with the more volatile equity markets. The strategic shift aimed to manage risk as the fund moves closer to its 2040 target date.
SP Funds 2040 Target Date Fund Tailored Shareholder Report
SP Funds 2040 Target Date Fund Tailored Shareholder Report
Key Fund Statistics
(as of October 31, 2024)
|
|
|---|---|
Fund Size (Thousands) | $1,087 |
Number of Holdings | 5 |
Total Advisory Fee Paid | $976 |
Annual Portfolio Turnover | 0% |
What did the Fund invest in?
(as of October 31, 2024)
Sector Breakdown
(% of net assets)
Sector | % |
Exchange Traded Funds | |
Cash & Cash Equivalents |

Percentages are based on total net assets. Cash & Cash Equivalents represents other assets in excess of liabilities.
Top Holdings | (% of net assets) |
|---|---|
SP Funds S&P 500 Sharia Industry Exclusions ETF | |
SP Funds S&P Global Technology ETF | |
SP Funds S&P World (ex-US) ETF | |
SP Funds Dow Jones Global Sukuk ETF | |
SP Funds S&P Global REIT Sharia ETF |
How has the Fund changed?
There were no material changes during the reporting period.
Changes in and Disagreements with Accountants
There were no changes in or disagreements with accountants.
Householding
Householding is an option available to certain investors of the Fund. Householding is a method of delivery, based on the preference of the individual investor, in which a single copy of certain shareholder documents can be delivered to investors who share the same address, even if their accounts are registered under different names. Householding for the Fund is available through certain broker-dealers. If you are interested in enrolling in householding and receiving a single copy of prospectuses and other shareholder documents, please contact your broker-dealer. If you are currently enrolled in householding and wish to change your householding status, please contact your broker-dealer.
For additional information about the Fund, including its prospectus, financial information, holdings and proxy voting information, visit www.sp-funds.com .
SP Funds 2040 Target Date Fund Tailored Shareholder Report
SP Funds 2040 Target Date Fund Tailored Shareholder Report
annual Shareholder Report October 31, 2024 SP Funds 2040 Target Date Fund Ticker: SPTNX - Institutional Shares |
This contains important information about the SP Funds 2040 Target Date Fund (the "Fund") for the period August 29, 2024 to October 31, 2024. You can find additional information about the Fund at www.sp-funds.com. You can also request this information by contacting us at (425) 409‑9500 or by contacting the Fund at ShariaPortfolio, 1331 S. International Pkwy Ste 2291, Lake Mary, FL 32746.
What were the Fund costs for the past year?
(based on a hypothetical $10,000 investment)
Fund Name | Costs of a $10,000 investment | Costs paid as a percentage of a $10,000 investment |
|---|---|---|
SP Funds 2040 Target Date Fund - Institutional Shares | $8 | 0.45% |
Cumulative Performance
(Initial Investment of $10,000)
Date | SP Funds 2040 Target Date Fund (Institutional Shares) - $9,907 | Dow Jones Target 2040 Index - $10,041 |
8/29/2024 | 10000 | 10000 |
8/31/2024 | 10021 | 10036 |
9/30/2024 | 10156 | 10249 |
10/31/2024 | 9907 | 10041 |

Annual Performance
Annualized Returns for the Periods Ended October 31, 2024 | Since Inception (8/29/2024) |
|---|---|
SP Funds 2040 Target Date Fund - Institutional Shares | -0.93% |
Dow Jones Target 2040 Index | 0.41% |
The Fund's past performance is not a good indicator of how the Fund will perform in the future. The graph and table do not reflect the deduction of taxes that a shareholder would pay on fund distributions or redemption of fund shares.
Visit www.sp-funds.com for more recent performance information.
Fund Performance Overview
For the period ending October 31, 2024, the SP Funds 2040 Target Date ETF pursued its goal of high total return through its 2040 target date. The fund’s performance was influenced by global equity market trends, including robust growth in technology and healthcare sectors, which positively contributed to its overall returns. However, challenges such as inflationary pressures, rising interest rates, and geopolitical uncertainties created periods of volatility. The fund’s diversified portfolio balanced equities with fixed-income assets to manage risk while seeking long-term growth.
Factors Influencing Performance
Performance was impacted by a mix of strong returns from global equity markets, particularly in developed markets, and the challenges presented by the global economic landscape, including rising interest rates and inflation. The equity portion of the fund saw growth in technology and healthcare, while the fixed-income allocation faced headwinds as bond yields rose. The fund's asset allocation continued to shift toward more conservative investments, mitigating some of the risks associated with the more volatile equity markets. The strategic shift aimed to manage risk as the fund moves closer to its 2040 target date.
SP Funds 2040 Target Date Fund Tailored Shareholder Report
SP Funds 2040 Target Date Fund Tailored Shareholder Report
Key Fund Statistics
(as of October 31, 2024)
|
|
|---|---|
Fund Size (Thousands) | $459 |
Number of Holdings | 5 |
Total Advisory Fee Paid | $976 |
Annual Portfolio Turnover | 0% |
What did the Fund invest in?
(as of October 31, 2024)
Sector Breakdown
(% of net assets)
Sector | % |
Exchange Traded Funds | |
Cash & Cash Equivalents |
Percentages are based on total net assets. Cash & Cash Equivalents represents other assets in excess of liabilities.
Top Holdings | (% of net assets) |
|---|---|
SP Funds S&P 500 Sharia Industry Exclusions ETF | |
SP Funds S&P Global Technology ETF | |
SP Funds S&P World (ex-US) ETF | |
SP Funds Dow Jones Global Sukuk ETF | |
SP Funds S&P Global REIT Sharia ETF |
How has the Fund changed?
There were no material changes during the reporting period.
Changes in and Disagreements with Accountants
There were no changes in or disagreements with accountants.
Householding
Householding is an option available to certain investors of the Fund. Householding is a method of delivery, based on the preference of the individual investor, in which a single copy of certain shareholder documents can be delivered to investors who share the same address, even if their accounts are registered under different names. Householding for the Fund is available through certain broker-dealers. If you are interested in enrolling in householding and receiving a single copy of prospectuses and other shareholder documents, please contact your broker-dealer. If you are currently enrolled in householding and wish to change your householding status, please contact your broker-dealer.
For additional information about the Fund, including its prospectus, financial information, holdings and proxy voting information, visit www.sp-funds.com .
SP Funds 2040 Target Date Fund Tailored Shareholder Report
SP Funds 2050 Target Date Fund Tailored Shareholder Report
annual Shareholder Report October 31, 2024 SP Funds 2050 Target Date Fund Ticker: SPTCX - Investor Shares |
This contains important information about the SP Funds 2050 Target Date Fund (the "Fund") for the period June 28, 2024 to October 31, 2024. You can find additional information about the Fund at www.sp-funds.com. You can also request this information by contacting us at (425) 409‑9500 or by contacting the Fund at ShariaPortfolio, 1331 S. International Pkwy Ste 2291, Lake Mary, FL 32746.
What were the Fund costs for the past year?
(based on a hypothetical $10,000 investment)
Fund Name | Costs of a $10,000 investment | Costs paid as a percentage of a $10,000 investment |
|---|---|---|
SP Funds 2050 Target Date Fund - Investor Shares | $28 | 0.85% |
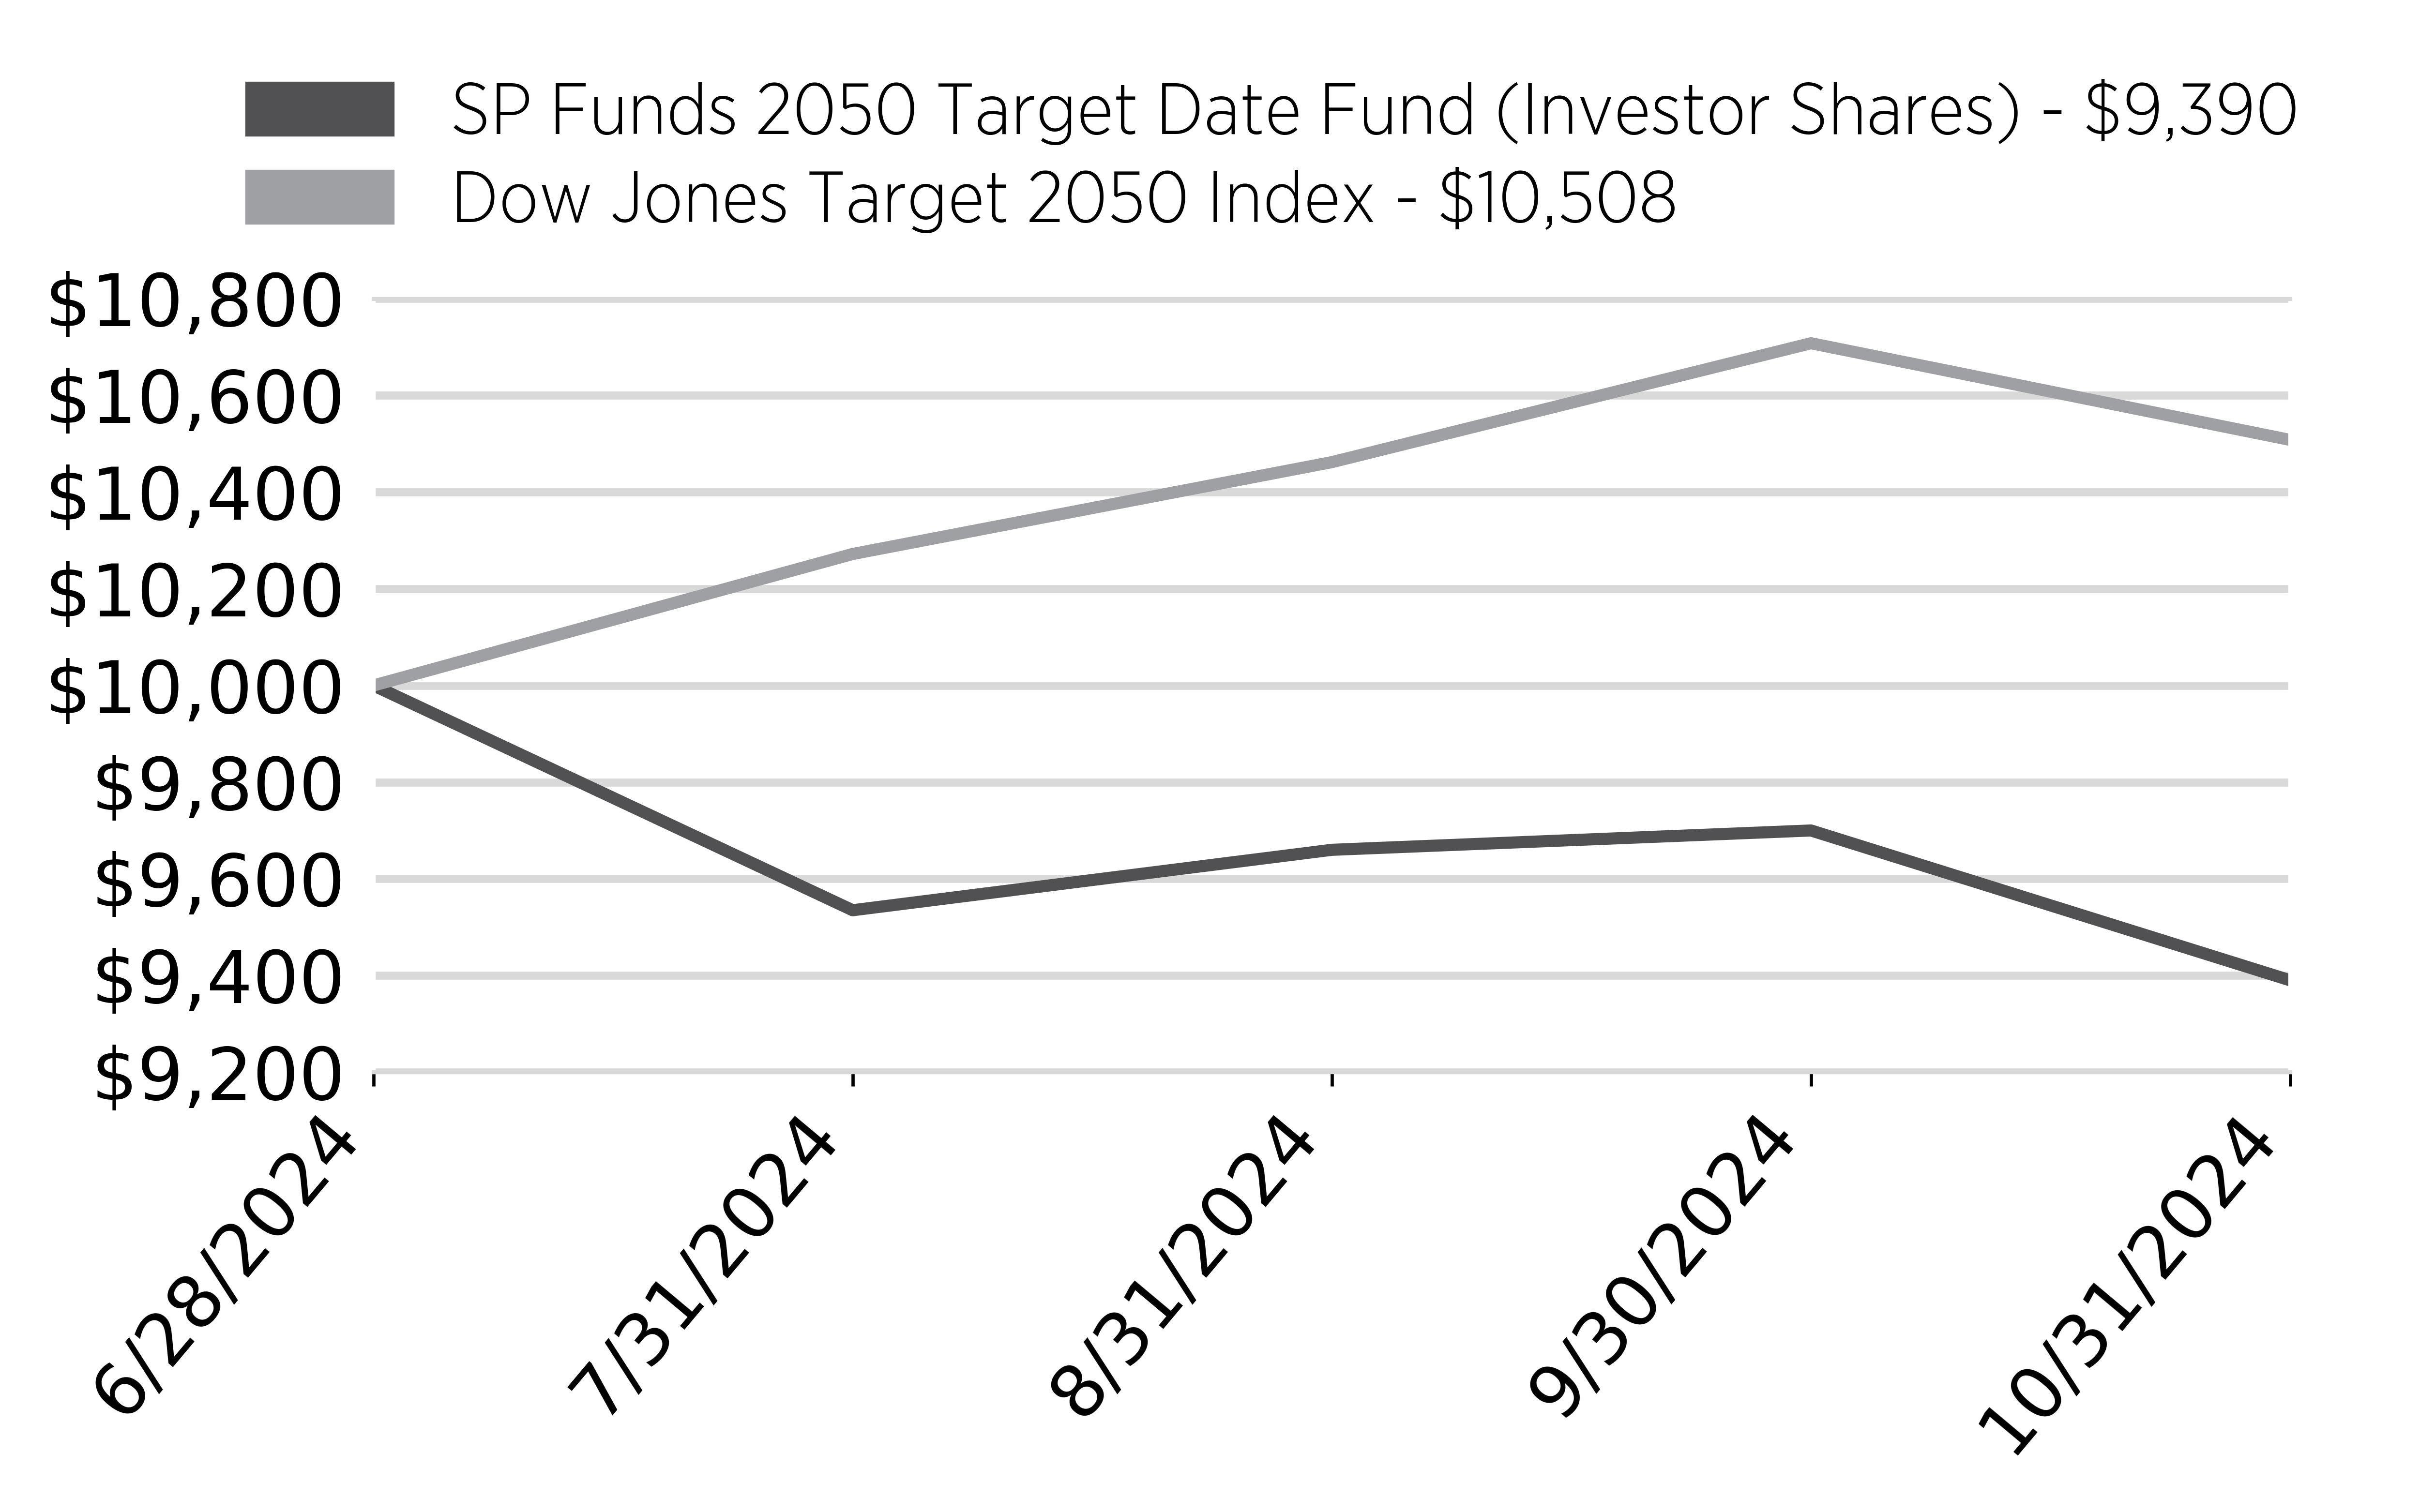
Cumulative Performance
(Initial Investment of $10,000)
Date | SP Funds 2050 Target Date Fund (Investor Shares) - $9,390 | Dow Jones Target 2050 Index - $10,508 |
6/28/2024 | 10000 | 10000 |
7/31/2024 | 9535 | 10272 |
8/31/2024 | 9660 | 10462 |
9/30/2024 | 9700 | 10708 |
10/31/2024 | 9390 | 10508 |
Annual Performance
Annualized Returns for the Periods Ended October 31, 2024 | Since Inception (6/28/2024) |
|---|---|
SP Funds 2050 Target Date Fund - Investor Shares | -6.10% |
Dow Jones Target 2050 Index | 4.83% |
The Fund's past performance is not a good indicator of how the Fund will perform in the future. The graph and table do not reflect the deduction of taxes that a shareholder would pay on fund distributions or redemption of fund shares.
Visit www.sp-funds.com for more recent performance information.
Fund Performance Overview
For the period ending October 31, 2024, the SP Funds 2050 Target Date ETF focused on achieving high total returns in line with its 2050 target date. The fund’s performance was characterized by a more growth-oriented approach, with a larger allocation to equities, which benefitted from strong market performance in the technology and energy sectors. However, the global economic environment, including concerns about inflation, interest rate hikes, and geopolitical risks, created some volatility. Despite this, the fund maintained an emphasis on long-term growth potential, taking advantage of market opportunities in global equities.
Factors Influencing Performance
The performance of the fund was driven by the strong performance of global equity markets, especially in technology and energy sectors, which contributed to growth. On the other hand, inflationary pressures and rising interest rates created challenges, particularly in the fixed-income portion of the portfolio, where bond prices were negatively impacted. As a more growth-oriented target date fund, the 2050 ETF maintained a higher equity allocation, which helped to capitalize on long-term growth trends despite short-term market volatility. The asset allocation strategy remained focused on maximizing growth potential while managing risk as the fund continues to evolve toward its 2050 target date.
SP Funds 2050 Target Date Fund Tailored Shareholder Report
SP Funds 2050 Target Date Fund Tailored Shareholder Report
Key Fund Statistics
(as of October 31, 2024)
|
|
|---|---|
Fund Size (Thousands) | $403 |
Number of Holdings | 5 |
Total Advisory Fee Paid | $220 |
Annual Portfolio Turnover | 12% |
What did the Fund invest in?
(as of October 31, 2024)
Sector Breakdown
(% of net assets)
Sector | % |
Exchange Traded Funds | |
Cash & Cash Equivalents |
Percentages are based on total net assets. Cash & Cash Equivalents represents other assets in excess of liabilities.
Top Holdings | (% of net assets) |
|---|---|
SP Funds S&P 500 Sharia Industry Exclusions ETF | |
SP Funds S&P Global Technology ETF | |
SP Funds S&P World (ex-US) ETF | |
SP Funds Dow Jones Global Sukuk ETF | |
SP Funds S&P Global REIT Sharia ETF |
How has the Fund changed?
There were no material changes during the reporting period.
Changes in and Disagreements with Accountants
There were no changes in or disagreements with accountants.
Householding
Householding is an option available to certain investors of the Fund. Householding is a method of delivery, based on the preference of the individual investor, in which a single copy of certain shareholder documents can be delivered to investors who share the same address, even if their accounts are registered under different names. Householding for the Fund is available through certain broker-dealers. If you are interested in enrolling in householding and receiving a single copy of prospectuses and other shareholder documents, please contact your broker-dealer. If you are currently enrolled in householding and wish to change your householding status, please contact your broker-dealer.
For additional information about the Fund, including its prospectus, financial information, holdings and proxy voting information, visit www.sp-funds.com .
SP Funds 2050 Target Date Fund Tailored Shareholder Report
SP Funds S&P Global Technology ETF Tailored Shareholder Report
annual Shareholder Report October 31, 2024 SP Funds S&P Global Technology ETF Ticker: SPTE (Listed on NYSE Arca, Inc.) |
This contains important information about the SP Funds S&P Global Technology ETF (the "Fund") for the period November 30, 2023 to October 31, 2024. You can find additional information about the Fund at www.sp-funds.com. You can also request this information by contacting us at (425) 409‑9500 or by contacting the Fund at ShariaPortfolio, 1331 S. International Pkwy Ste 2291, Lake Mary, FL 32746.
What were the Fund costs for the past year?
(based on a hypothetical $10,000 investment)
Fund Name | Costs of a $10,000 investment | Costs paid as a percentage of a $10,000 investment |
|---|---|---|
SP Funds S&P Global Technology ETF | $59 | 0.55% |
Cumulative Performance
(Initial Investment of $10,000)
Date | SP Funds S&P Global Technology ETF - $13,434 | S&P Global 1200 Shariah Information Technology Capped Index - $12,912 |
11/30/2023 | 10000 | 10000 |
12/31/2023 | 10569 | 10578 |
1/31/2024 | 11090 | 10932 |
2/29/2024 | 11955 | 11674 |
3/31/2024 | 12249 | 12105 |
4/30/2024 | 11569 | 11383 |
5/31/2024 | 12495 | 12186 |
6/30/2024 | 13580 | 13290 |
7/31/2024 | 13200 | 12952 |
8/31/2024 | 13434 | 13094 |
9/30/2024 | 13585 | 13125 |
10/31/2024 | 13434 | 12912 |

Annual Performance
Annualized Returns for the Periods Ended October 31, 2024 | Since Inception (11/30/2023) |
|---|---|
SP Funds S&P Global Technology ETF | 34.34% |
S&P Global 1200 Shariah Information Techology Capped Index | 29.12% |
The Fund's past performance is not a good indicator of how the Fund will perform in the future. The graph and table do not reflect the deduction of taxes that a shareholder would pay on fund distributions or redemption of fund shares.
Visit www.sp-funds.com for more recent performance information.
Fund Performance Overview
For the period ending October 31, 2024, the S&P 500 Global Technology ETF (SPTE) sought to track the performance of the S&P Global 1200 Shariah Information Technology Capped Index. The fund’s performance was impacted by a combination of global market conditions and sector-specific trends. Strong demand for technology services and products, particularly in areas like artificial intelligence, cloud computing, and cybersecurity, contributed to positive returns. However, broader macroeconomic factors, such as interest rate fluctuations and geopolitical tensions, created volatility, which somewhat restrained the fund’s performance during the period.
Factors Influencing Performance
Key factors influencing the fund’s performance included the technology sector’s resilience amidst economic uncertainty, supported by the rapid expansion of AI and tech innovation. However, inflation concerns, rising interest rates, and global trade challenges led to volatility. The fund’s Shariah-compliant investment strategy also guided its exposure to companies in line with ethical guidelines, which may have limited its exposure to certain high-growth technology stocks. The investment adviser employed a passive management strategy, aiming to closely track the performance of the underlying index while maintaining sector-specific diversification.
SP Funds S&P Global Technology ETF Tailored Shareholder Report
SP Funds S&P Global Technology ETF Tailored Shareholder Report
Key Fund Statistics
(as of October 31, 2024)
|
|
|---|---|
Fund Size (Thousands) | $39,539 |
Number of Holdings | 97 |
Total Advisory Fee Paid | $143,710 |
Annual Portfolio Turnover | 15% |
What did the Fund invest in?
(as of October 31, 2024)
Sector Breakdown (% of net assets)
Sector | % |
Technology | |
Communications | |
Industrial | |
Consumer, Non-cyclical | |
Energy | |
Cash & Cash Equivalents |

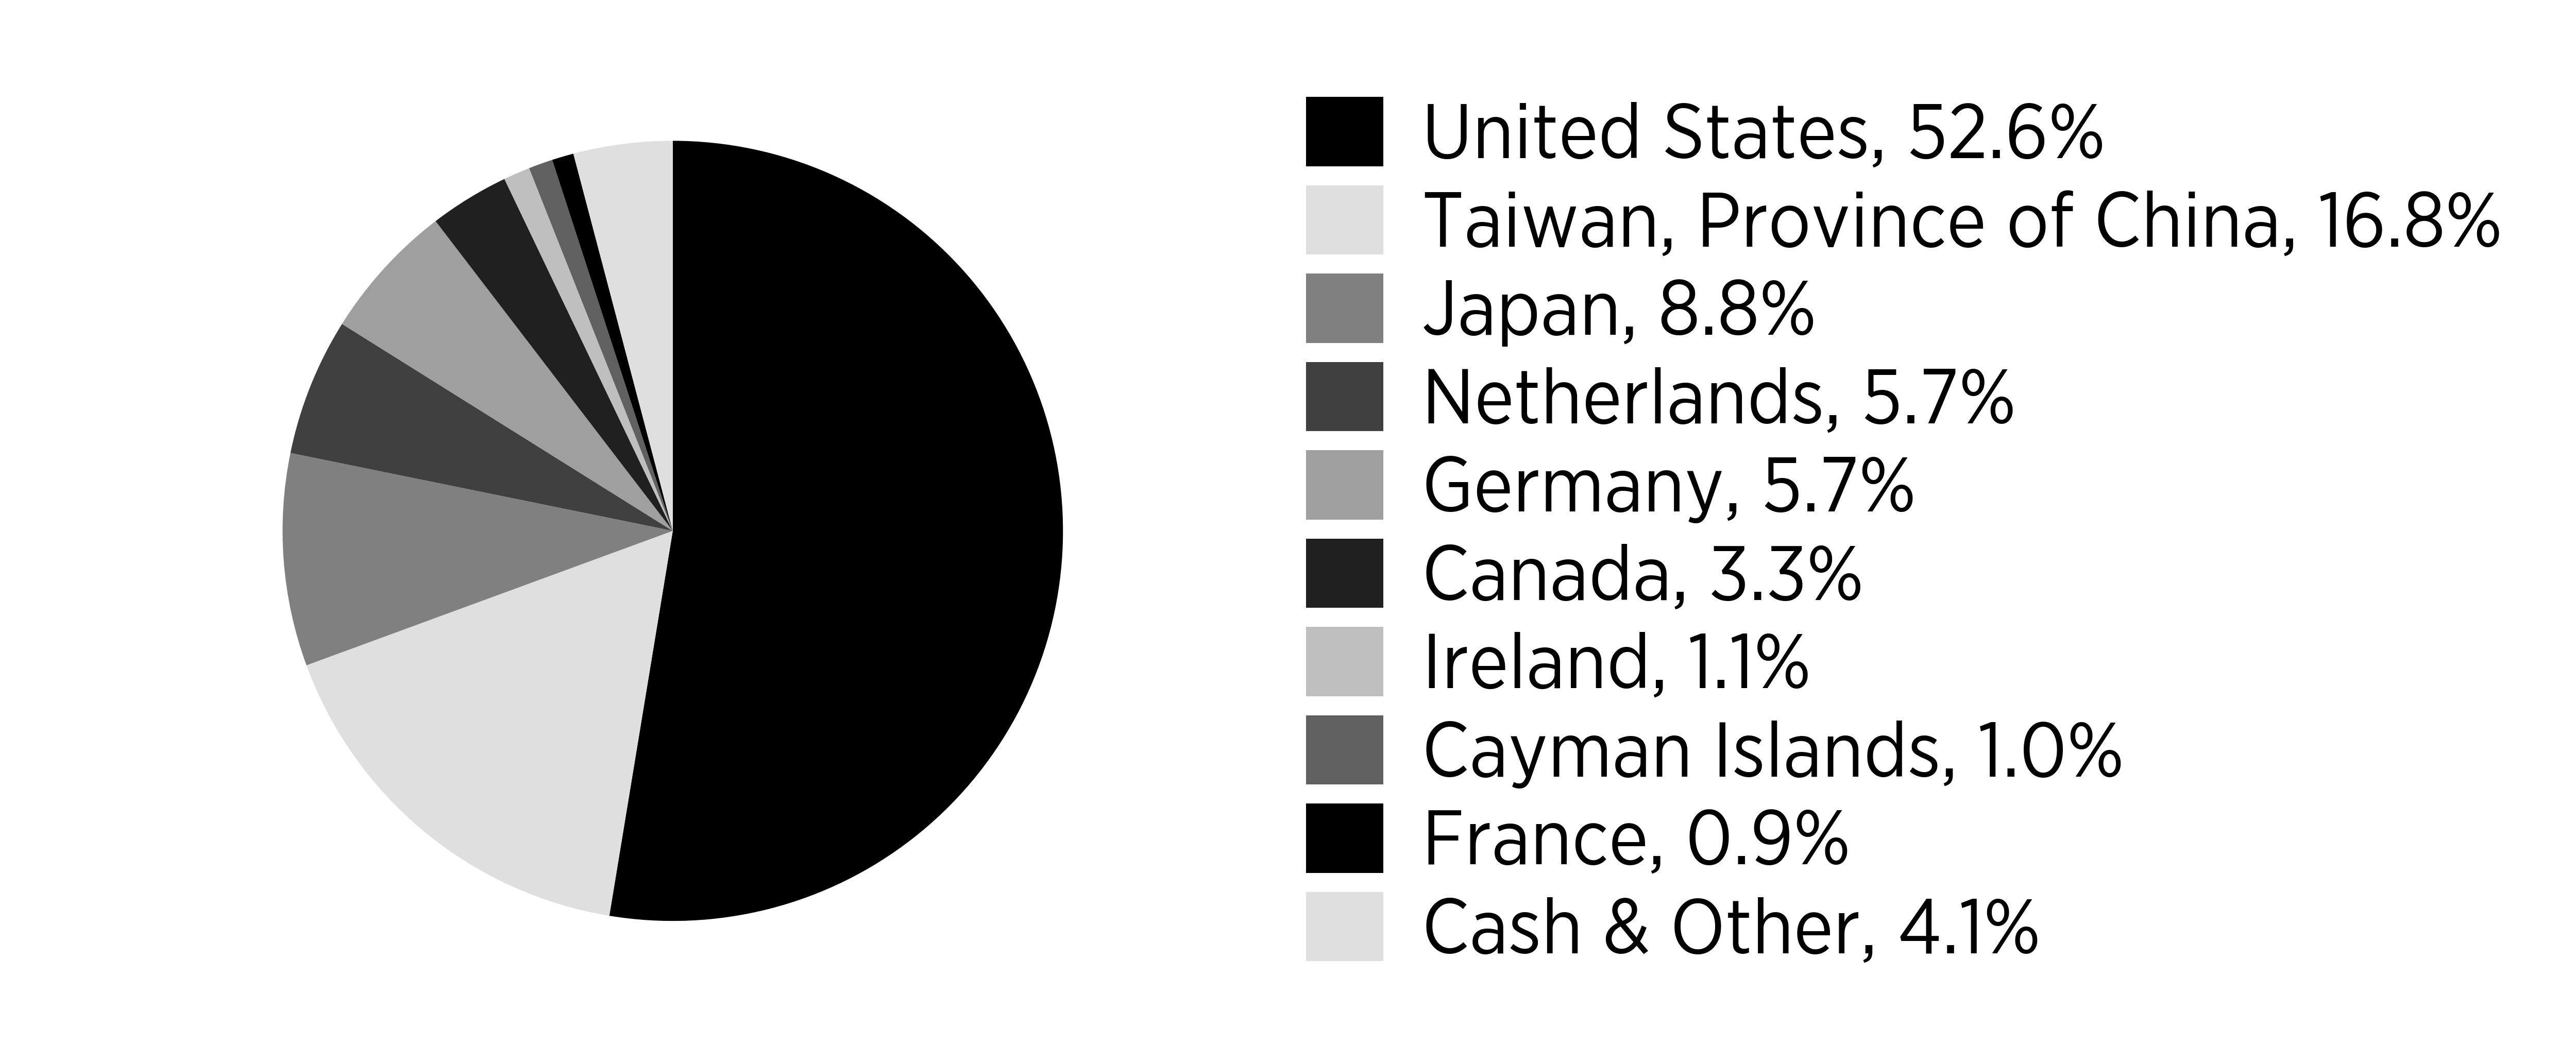
Geographic Breakdown (% of net assets)
Sector | % |
United States | |
Taiwan, Province of China | |
Japan | |
Netherlands | |
Germany | |
Canada | |
Ireland | |
Cayman Islands | |
France | |
Cash & Other |
Percentages are based on total net assets. Cash & Cash Equivalents represents other assets in excess of liabilities.
Top Ten Holdings | (% of net assets) |
|---|---|
Taiwan Semiconductor Manufacturing Co Ltd. | |
NVIDIA Corp. | |
Apple, Inc. | |
Microsoft Corp. | |
SAP SE | |
ASML Holding NV | |
Broadcom, Inc. | |
Shopify, Inc. - Class A | |
Keyence Corp. | |
Tokyo Electron Ltd. |
How has the Fund changed?
There were no material changes during the reporting period.
Changes in and Disagreements with Accountants
There were no changes in or disagreements with accountants.
Householding
Householding is an option available to certain investors of the Fund. Householding is a method of delivery, based on the preference of the individual investor, in which a single copy of certain shareholder documents can be delivered to investors who share the same address, even if their accounts are registered under different names. Householding for the Fund is available through certain broker-dealers. If you are interested in enrolling in householding and receiving a single copy of prospectuses and other shareholder documents, please contact your broker-dealer. If you are currently enrolled in householding and wish to change your householding status, please contact your broker-dealer.
For additional information about the Fund, including its prospectus, financial information, holdings and proxy voting information, visit www.sp-funds.com .
SP Funds S&P Global Technology ETF Tailored Shareholder Report
SP Funds S&P World (ex-US) ETF Tailored Shareholder Report
annual Shareholder Report October 31, 2024 SP Funds S&P World (ex-US) ETF Ticker: SPWO (Listed on NYSE Arca, Inc.) |
This contains important information about the SP Funds S&P World (ex-US) ETF (the "Fund") for the period December 19, 2023 to October 31, 2024. You can find additional information about the Fund at www.sp-funds.com. You can also request this information by contacting us at (425) 409‑9500 or by contacting the Fund at ShariaPortfolio, 1331 S. International Pkwy Ste 2291, Lake Mary, FL 32746.
What were the Fund costs for the past year?
(based on a hypothetical $10,000 investment)
Fund Name | Costs of a $10,000 investment | Costs paid as a percentage of a $10,000 investment |
|---|---|---|
SP Funds S&P World (ex-US) ETF | $51 | 0.55% |
Cumulative Performance
(Initial Investment of $10,000)
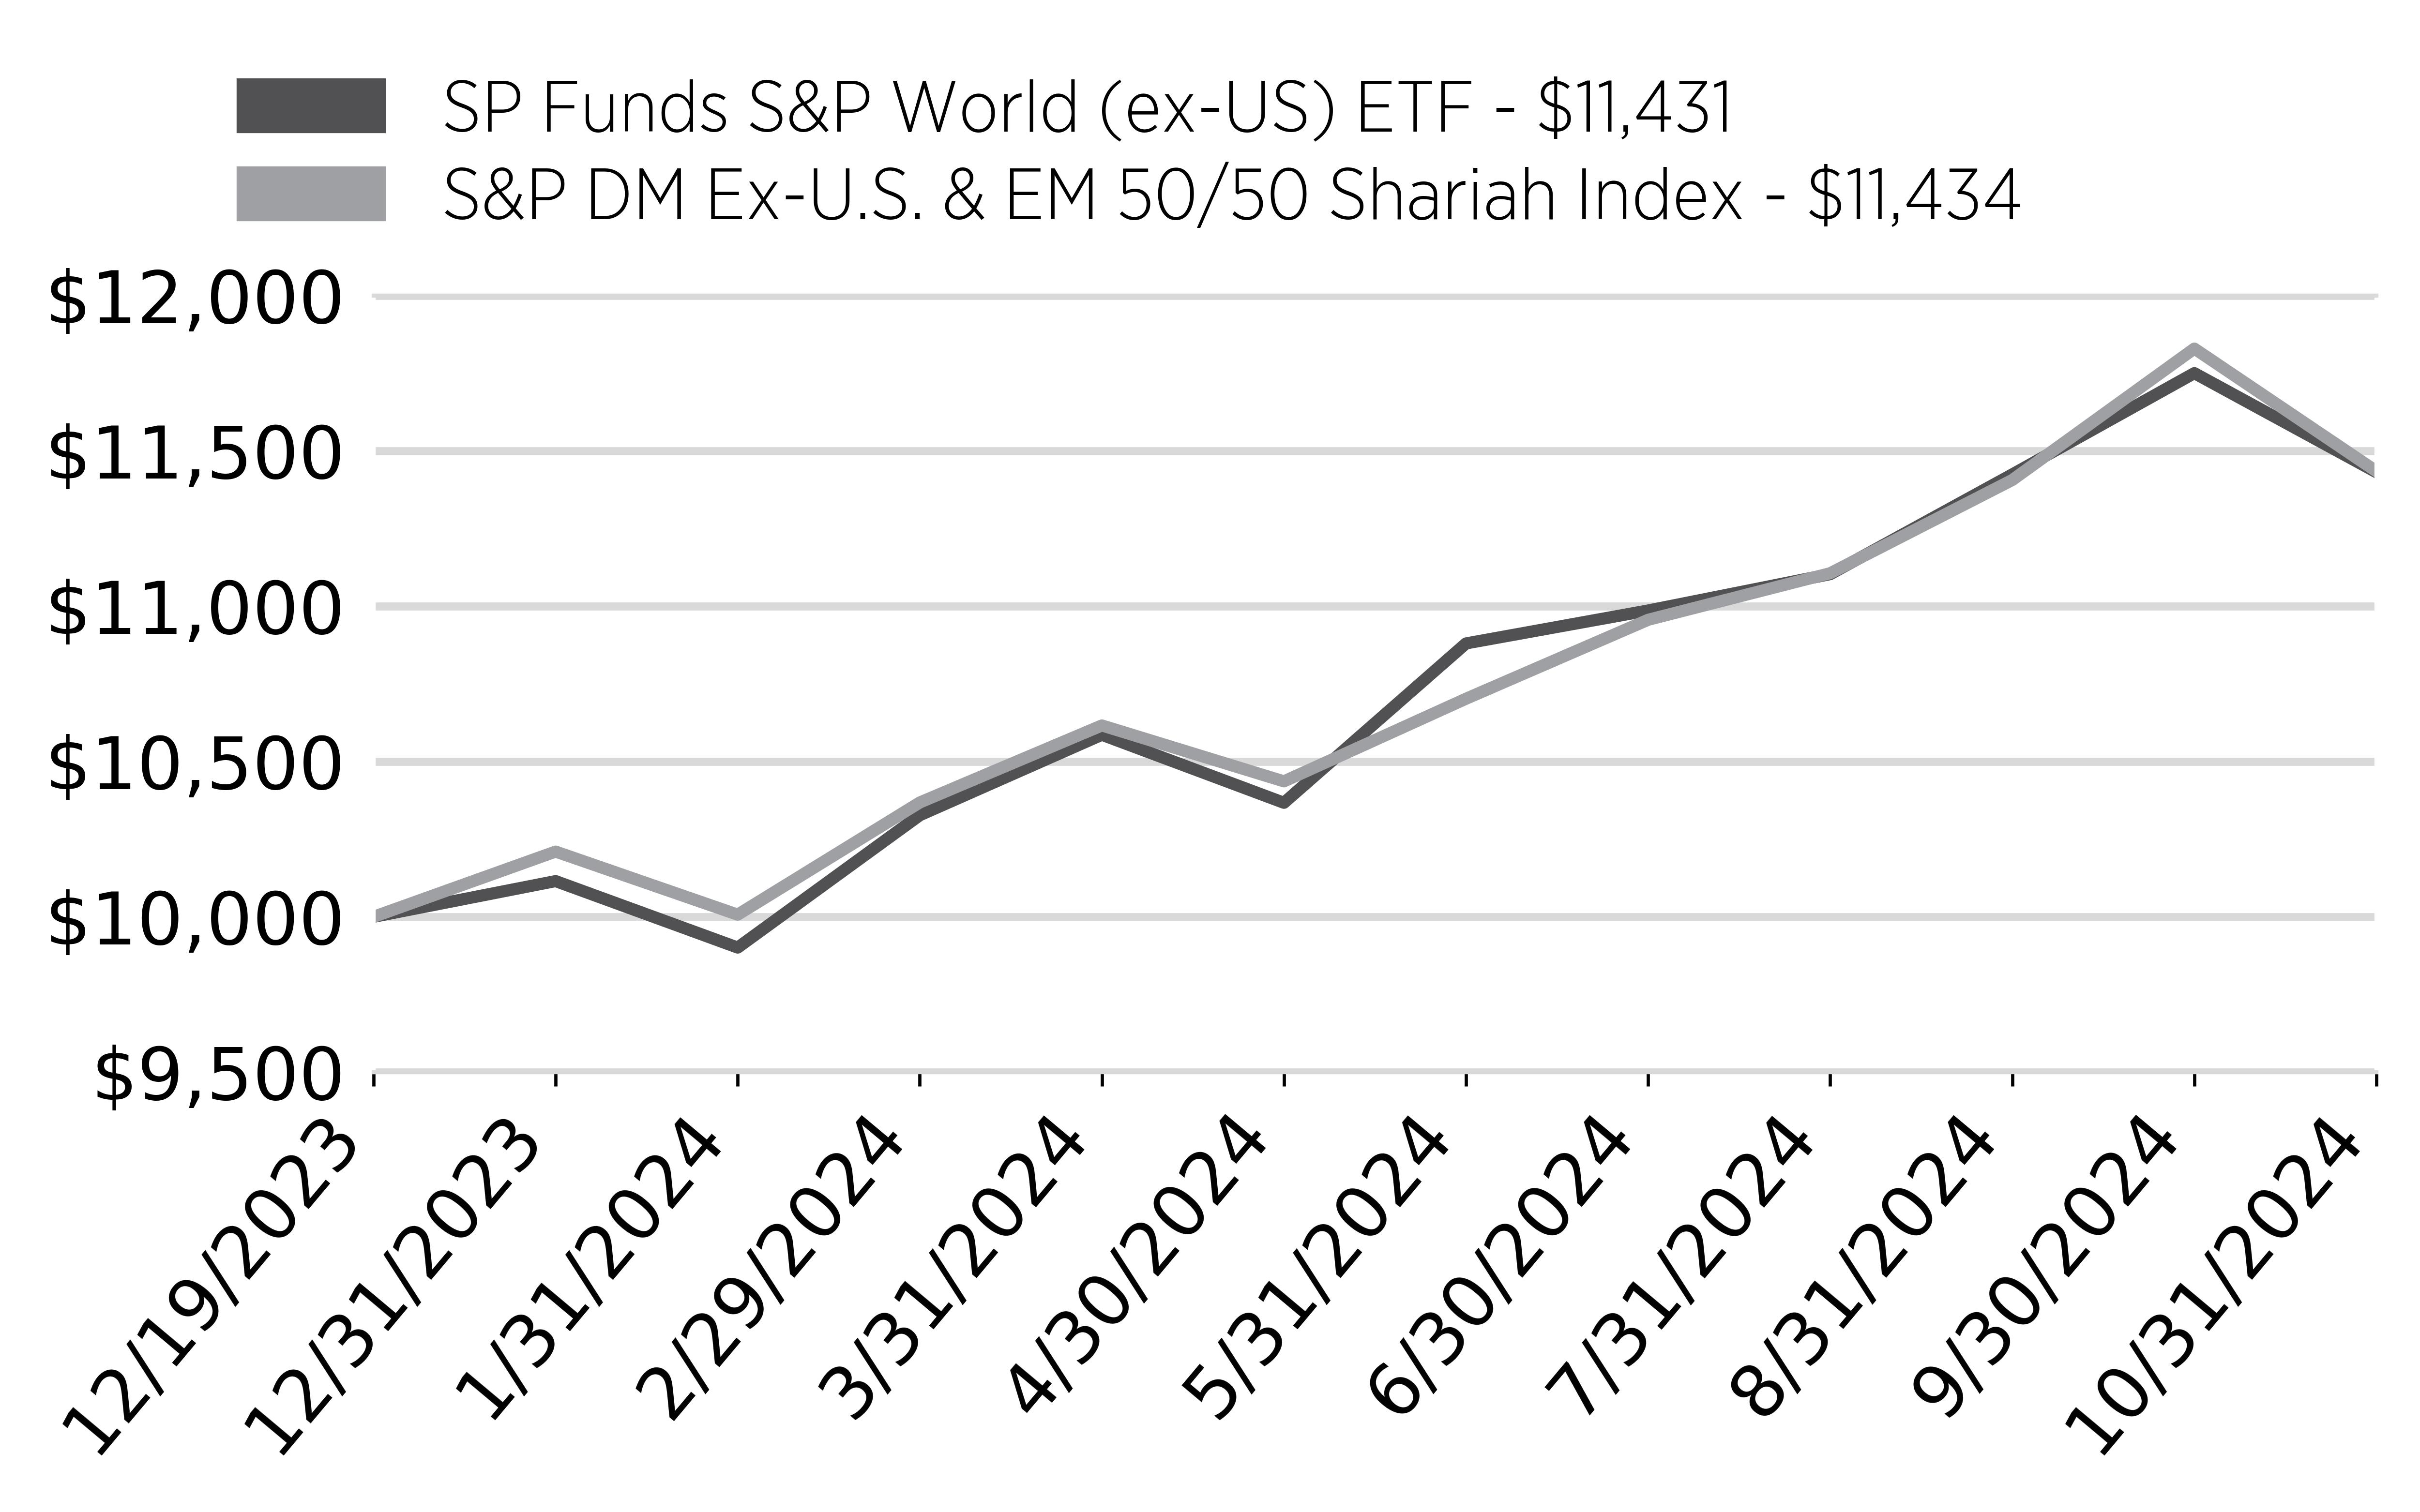
Date | SP Funds S&P World (ex-US) ETF - $11,431 | S&P DM Ex-U.S. & EM 50/50 Shariah Index - $11,434 |
12/19/2023 | 10000 | 10000 |
12/31/2023 | 10115 | 10210 |
1/31/2024 | 9901 | 10007 |
2/29/2024 | 10327 | 10368 |
3/31/2024 | 10586 | 10616 |
4/30/2024 | 10367 | 10436 |
5/31/2024 | 10880 | 10702 |
6/30/2024 | 10986 | 10956 |
7/31/2024 | 11103 | 11106 |
8/31/2024 | 11424 | 11406 |
9/30/2024 | 11750 | 11829 |
10/31/2024 | 11431 | 11434 |
Annual Performance
Annualized Returns for the Periods Ended October 31, 2024 | Since Inception (12/19/2023) |
|---|---|
SP Funds S&P World (ex-US) ETF | 14.31% |
S&P DM Ex-U.S. & EM 50/50 Shariah Index | 14.34% |
The Fund's past performance is not a good indicator of how the Fund will perform in the future. The graph and table do not reflect the deduction of taxes that a shareholder would pay on fund distributions or redemption of fund shares.
Visit www.sp-funds.com for more recent performance information.
Fund Performance Overview
For the period ending October 31, 2024, the SP Funds S&P World (ex-US) ETF aimed to track the performance of the S&P DM Ex-U.S. & EM 50/50 Shariah Index. The fund’s performance was influenced by both positive and negative global market trends. While developed markets (ex-U.S.) experienced moderate growth, emerging markets faced headwinds due to economic instability and geopolitical concerns. The fund’s Shariah-compliant strategy guided its exposure to regions and companies adhering to ethical investment principles, which provided a unique risk and return profile relative to traditional global equity indices.
Factors Influencing Performance
The fund’s performance was impacted by a combination of global economic factors, including fluctuating interest rates, inflationary pressures, and regional political instability. Developed markets saw steady performance, driven by strong corporate earnings in Europe and Asia. However, emerging markets faced challenges such as slower economic growth and rising geopolitical risks, which affected overall performance. The Shariah investment strategy led to selective exposure to sectors and companies that met ethical guidelines, which may have constrained the fund’s participation in some high-growth but non-compliant sectors. The fund's passive management approach aimed to track the underlying index, balancing exposure to both developed and emerging markets while adhering to Shariah principles.
SP Funds S&P World (ex-US) ETF Tailored Shareholder Report
SP Funds S&P World (ex-US) ETF Tailored Shareholder Report
Key Fund Statistics
(as of October 31, 2024)
|
|
|---|---|
Fund Size (Thousands) | $26,593 |
Number of Holdings | 342 |
Total Advisory Fee Paid | $76,318 |
Annual Portfolio Turnover | 30% |
What did the Fund invest in?
(as of October 31, 2024)
Sector Breakdown (% of net assets)
Sector | % |
Technology | |
Consumer, Non-cyclical | |
Industrial | |
Communications | |
Consumer, Cyclical | |
Basic Materials | |
Energy | |
Financial | |
Utilities | |
Cash & Cash Equivalents |

Geographic Breakdown (% of net assets)
Sector | % |
Taiwan, Province of China | |
Japan | |
Cayman Islands | |
Switzerland | |
United Kingdom | |
Canada | |
France | |
Netherlands | |
Australia | |
Cash & Other |
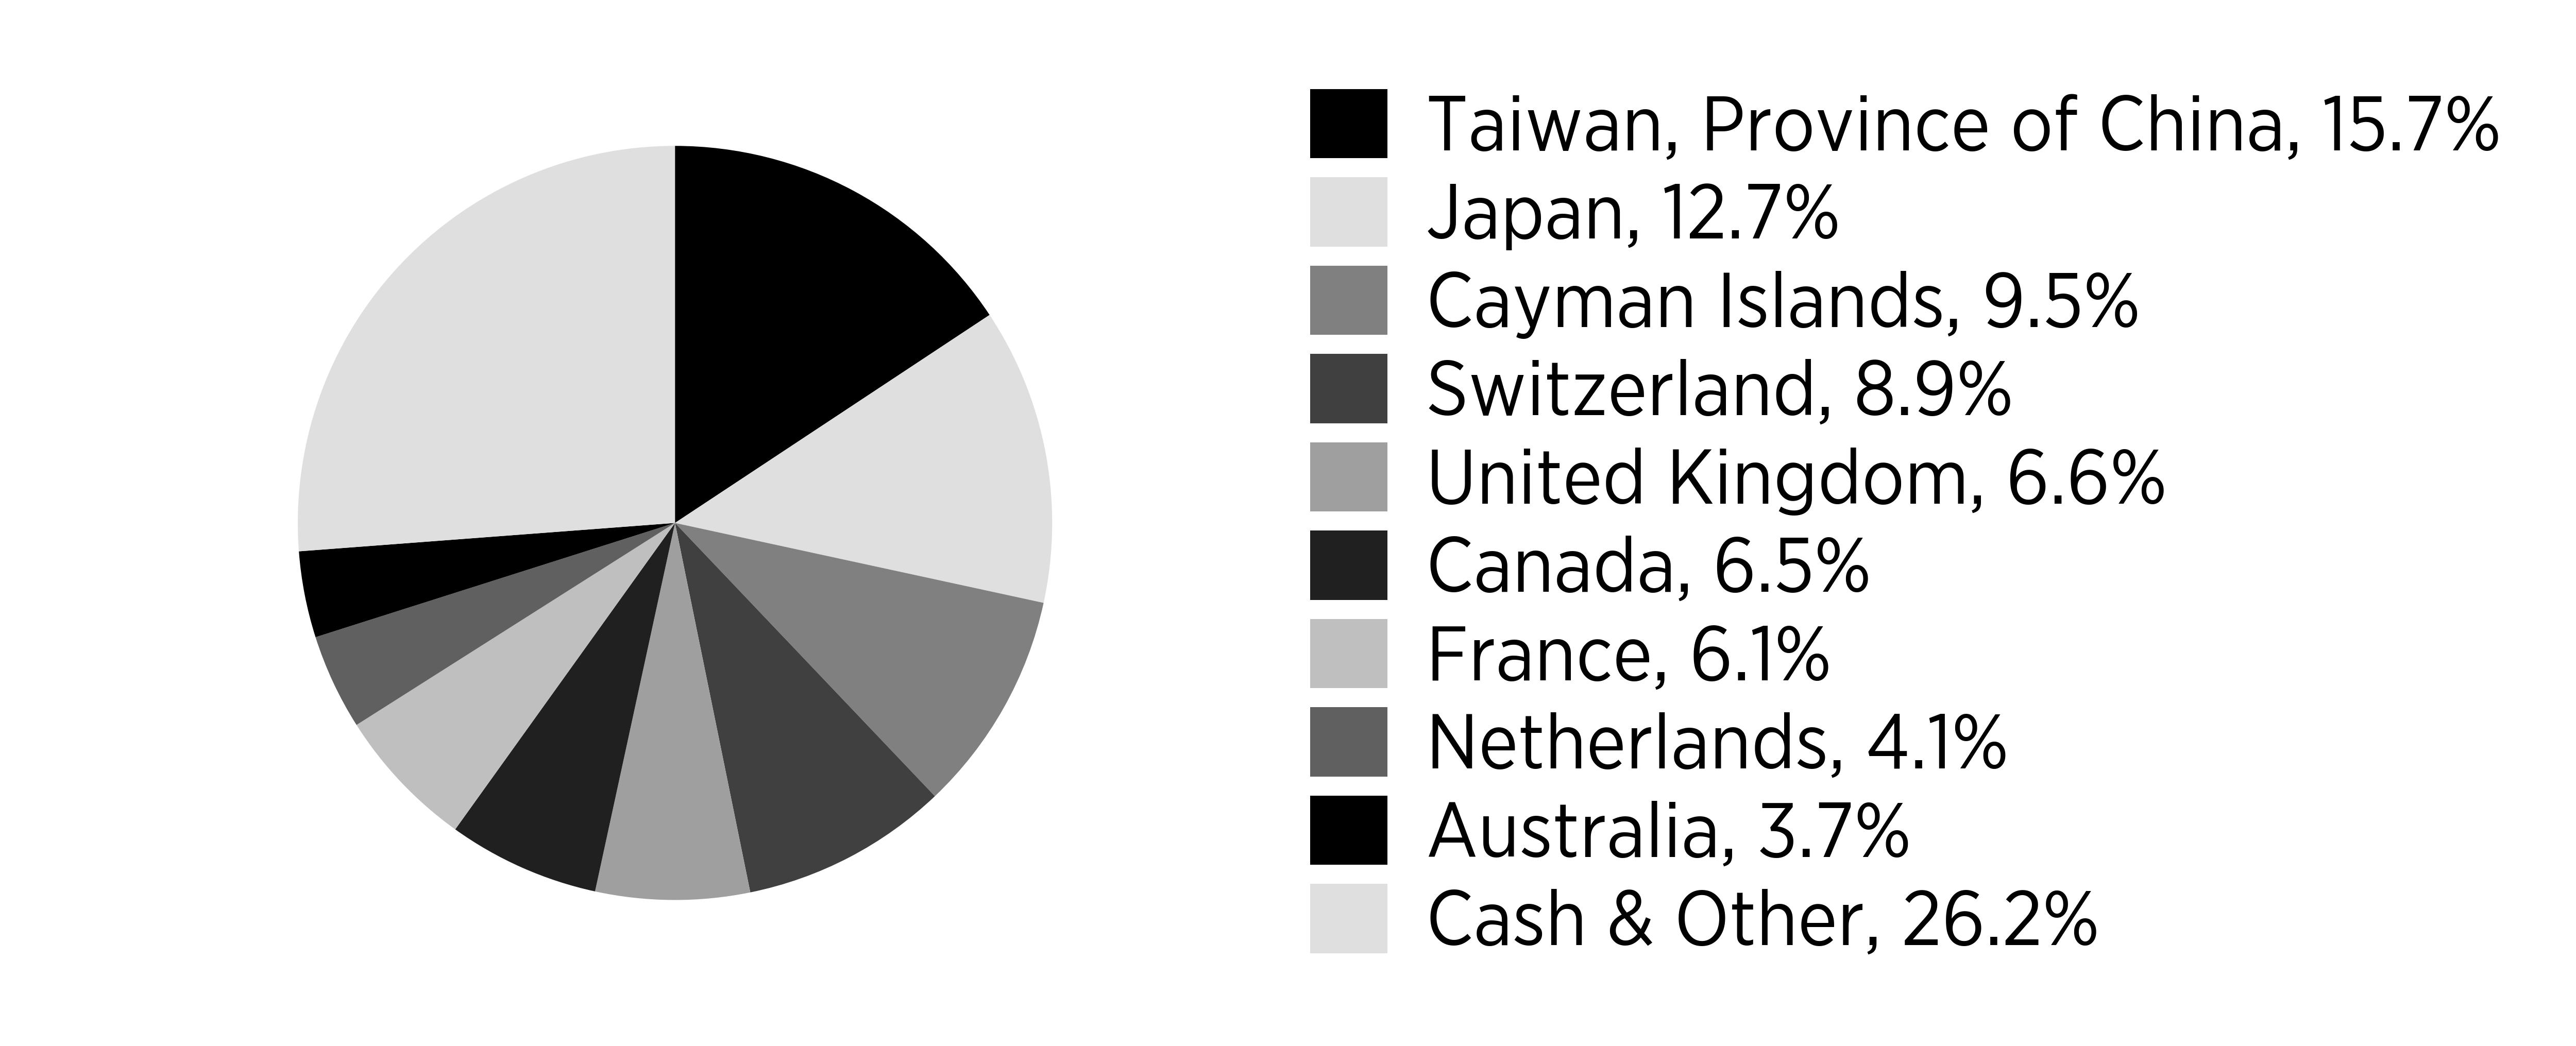
Percentages are based on total net assets. Cash & Cash Equivalents represents other assets in excess of liabilities.
Top Ten Holdings | (% of net assets) |
|---|---|
Taiwan Semiconductor Manufacturing Co Ltd. | |
Meituan | |
Novo Nordisk A/S | |
ASML Holding NV | |
Nestle SA | |
SAP SE | |
PDD Holdings, Inc. | |
Roche Holding AG | |
AstraZeneca Plc | |
Novartis AG |
How has the Fund changed?
There were no material changes during the reporting period.
Changes in and Disagreements with Accountants
There were no changes in or disagreements with accountants.
Householding
Householding is an option available to certain investors of the Fund. Householding is a method of delivery, based on the preference of the individual investor, in which a single copy of certain shareholder documents can be delivered to investors who share the same address, even if their accounts are registered under different names. Householding for the Fund is available through certain broker-dealers. If you are interested in enrolling in householding and receiving a single copy of prospectuses and other shareholder documents, please contact your broker-dealer. If you are currently enrolled in householding and wish to change your householding status, please contact your broker-dealer.
For additional information about the Fund, including its prospectus, financial information, holdings and proxy voting information, visit www.sp-funds.com .
SP Funds S&P World (ex-US) ETF Tailored Shareholder Report
Item 2. Code of Ethics.
Not applicable for semi-annual reports.
Item 3. Audit Committee Financial Expert.
Not applicable for semi-annual reports.
Item 4. Principal Accountant Fees and Services.
Not applicable for semi-annual reports.
Item 5. Audit Committee of Listed Registrants.
Not applicable for semi-annual reports.
Item 6. Investments.
| (a) | Schedule of Investments is included within the financial statements filed under Item 7 of this Form. |
| (b) | Not applicable. |
1
Item 7. Financial Statements and Financial Highlights for Open-End Investment Companies.
| (a) |

SP Funds 2030 Target Date Fund
Investor Class Ticker: SPTAX
Institutional Class Ticker: SPTMX
SP Funds 2040 Target Date Fund
Investor Class Ticker: SPTBX
Institutional Class Ticker: SPTNX
SP Funds 2050 Target Date Fund
Investor Class Ticker: SPTCX
SP Funds S&P Global Technology ETF
Ticker: SPTE
SP Funds World ex-US ETF
Ticker: SPWO
Financial Statements
October 31, 2024
SP Funds 2030 Target Date Fund
Schedule of Investments
October 31, 2024
| EXCHANGE TRADED FUNDS - 90.8% | Shares | Value | ||||||
| SP Funds Dow Jones Global Sukuk ETF (a)(b) | 85,355 | $ | 1,548,340 | |||||
| SP Funds S&P 500 Sharia Industry Exclusions ETF (b) | 21,152 | 867,655 | ||||||
| SP Funds S&P Global REIT Sharia ETF (b) | 16,862 | 349,212 | ||||||
| SP Funds S&P Global Technology ETF (b) | 12,693 | 340,766 | ||||||
| SP Funds S&P World (ex-US) ETF (b) | 7,554 | 172,035 | ||||||
| SPDR Gold Shares (c) | 366 | 92,785 | ||||||
| TOTAL EXCHANGE TRADED FUNDS (Cost $3,387,268) | 3,370,793 | |||||||
| TOTAL INVESTMENTS - 90.8% (Cost $3,387,268) | 3,370,793 | |||||||
| Other Assets in Excess of Liabilities - 9.2% | 341,034 | |||||||
| TOTAL NET ASSETS - 100.0% | $ | 3,711,827 | ||||||
Percentages are stated as a percent of net assets.
| (a) | Fair value of this security exceeds 25% of the Fund’s net assets. Additional information for this security, including the financial statements, is available from the SEC’s EDGAR database at www.sec.gov. |
| (b) | Affiliated company as defined by the Investment Company Act of 1940. |
| (c) | Non-income producing security. |
The accompanying notes are an integral part of these financial statements.
1
SP Funds 2040 Target Date Fund
Schedule of Investments
October 31, 2024
| EXCHANGE TRADED FUNDS - 95.8% | Shares | Value | ||||||
| SP Funds Dow Jones Global Sukuk ETF (a) | 4,257 | $ | 77,222 | |||||
| SP Funds S&P 500 Sharia Industry Exclusions ETF (a)(b) | 14,687 | 602,461 | ||||||
| SP Funds S&P Global REIT Sharia ETF (a) | 3,658 | 75,757 | ||||||
| SP Funds S&P Global Technology ETF (a)(b) | 21,484 | 576,777 | ||||||
| SP Funds S&P World (ex-US) ETF (a) | 6,556 | 149,307 | ||||||
| TOTAL EXCHANGE TRADED FUNDS (Cost $1,497,864) | 1,481,524 | |||||||
| TOTAL INVESTMENTS - 95.8% (Cost $1,497,864) | 1,481,524 | |||||||
| Other Assets in Excess of Liabilities - 4.2% | 64,632 | |||||||
| TOTAL NET ASSETS - 100.0% | $ | 1,546,156 | ||||||
Percentages are stated as a percent of net assets.
| (a) | Affiliated company as defined by the Investment Company Act of 1940. |
| (b) | Fair value of this security exceeds 25% of the Fund’s net assets. Additional information for this security, including the financial statements, is available from the SEC’s EDGAR database at www.sec.gov. |
The accompanying notes are an integral part of these financial statements.
2
SP Funds 2050 Target Date Fund
Schedule of Investments
October 31, 2024
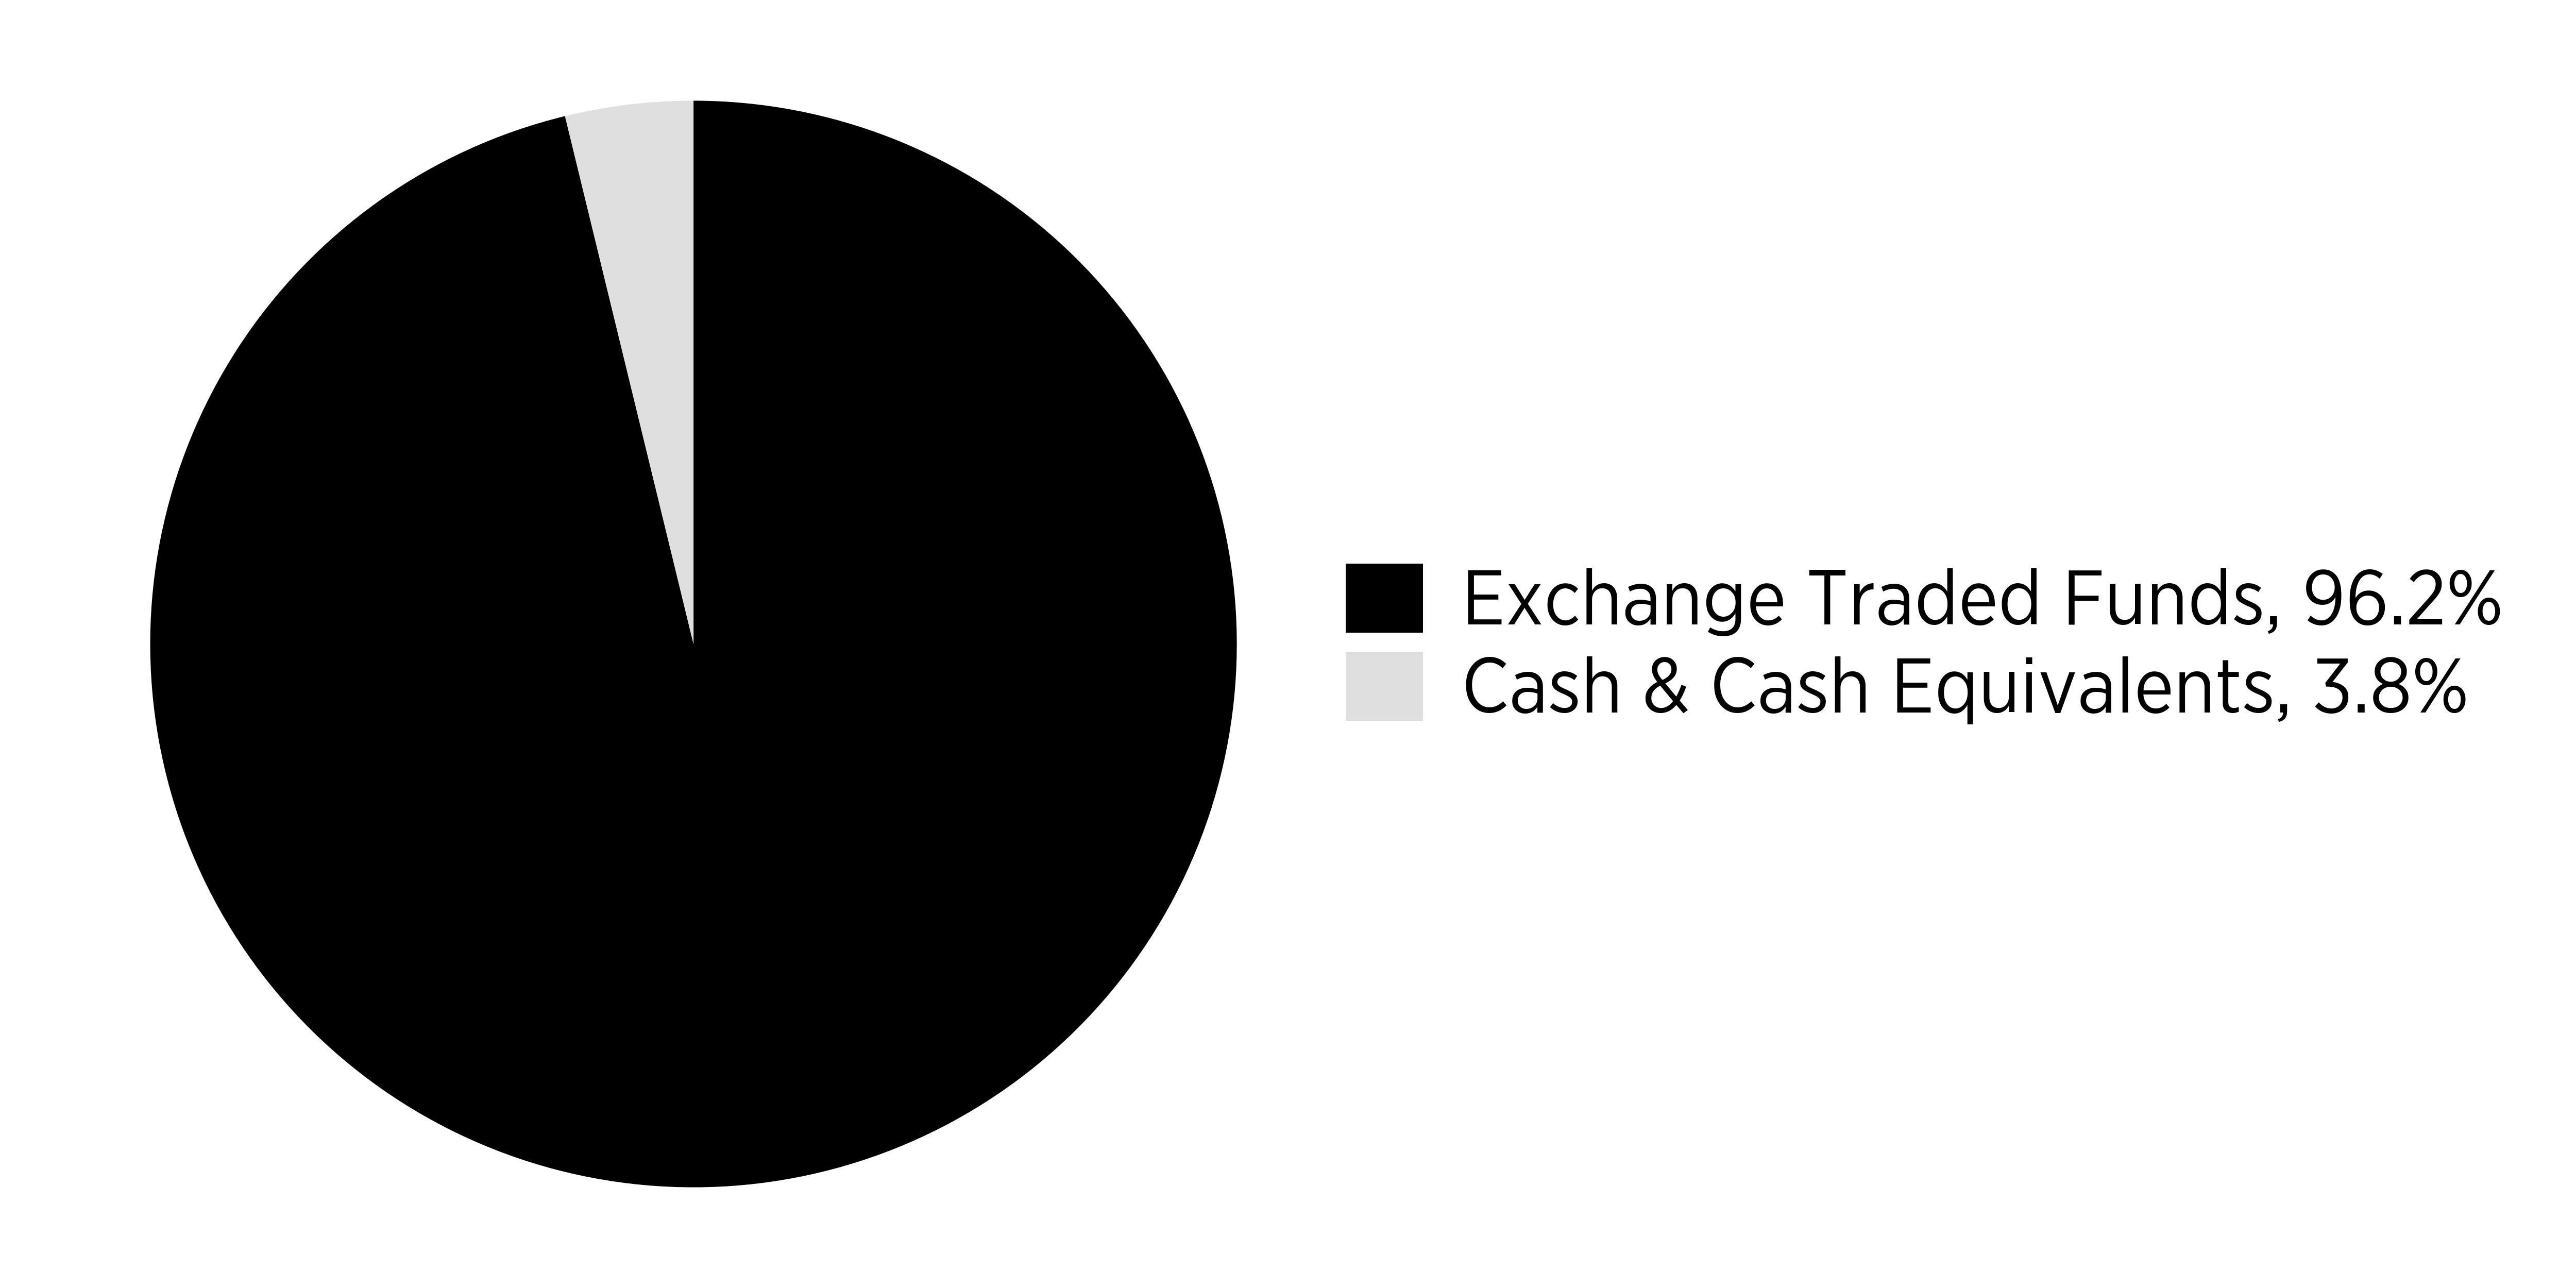
| EXCHANGE TRADED FUNDS - 96.2% | Shares | Value | ||||||
| SP Funds Dow Jones Global Sukuk ETF (a) | 1,113 | $ | 20,190 | |||||
| SP Funds S&P 500 Sharia Industry Exclusions ETF (a)(b) | 3,842 | 157,599 | ||||||
| SP Funds S&P Global REIT Sharia ETF (a) | 957 | 19,819 | ||||||
| SP Funds S&P Global Technology ETF (a)(b) | 5,620 | 150,879 | ||||||
| SP Funds S&P World (ex-US) ETF (a) | 1,715 | 39,058 | ||||||
| TOTAL EXCHANGE TRADED FUNDS (Cost $397,053) | 387,545 | |||||||
| TOTAL INVESTMENTS - 96.2% (Cost $397,053) | 387,545 | |||||||
| Other Assets in Excess of Liabilities - 3.8% | 15,447 | |||||||
| TOTAL NET ASSETS - 100.0% | $ | 402,992 | ||||||
Percentages are stated as a percent of net assets.
| (a) | Affiliated company as defined by the Investment Company Act of 1940. |
| (b) | Fair value of this security exceeds 25% of the Fund’s net assets. Additional information for this security, including the financial statements, is available from the SEC’s EDGAR database at www.sec.gov. |
The accompanying notes are an integral part of these financial statements.
3
SP Funds S&P Global Technology ETF
Schedule of Investments
October 31, 2024
| COMMON STOCKS - 98.9% | Shares | Value | ||||||
| Computers - 15.7% | ||||||||
| Accenture PLC - Class A | 1,078 | $ | 371,716 | |||||
| Apple, Inc. | 19,034 | 4,299,971 | ||||||
| Capgemini SE - ADR | 5,918 | 204,171 | ||||||
| CGI, Inc. (a) | 1,417 | 156,790 | ||||||
| Cognizant Technology Solutions Corp. - Class A | 958 | 71,457 | ||||||
| Crowdstrike Holdings, Inc. - Class A (a) | 418 | 124,092 | ||||||
| EPAM Systems, Inc. (a) | 118 | 22,261 | ||||||
| Fortinet, Inc. (a) | 1,133 | 89,122 | ||||||
| Fujitsu Ltd. - ADR | 12,744 | 237,675 | ||||||
| Gartner, Inc. (a) | 136 | 68,340 | ||||||
| HP, Inc. | 1,594 | 56,619 | ||||||
| Logitech International SA | 1,126 | 92,143 | ||||||
| NEC Corp. | 2,030 | 176,380 | ||||||
| NetApp, Inc. | 413 | 47,623 | ||||||
| Nomura Research Institute Ltd. - ADR | 3,363 | 100,789 | ||||||
| Obic Co. Ltd. | 2,360 | 77,326 | ||||||
| 6,196,475 | ||||||||
| Electronics - 2.0% | ||||||||
| Amphenol Corp. - Class A | 2,071 | 138,799 | ||||||
| Halma PLC - ADR | 1,306 | 83,042 | ||||||
| Jabil, Inc. | 205 | 25,234 | ||||||
| Keysight Technologies, Inc. (a) | 300 | 44,703 | ||||||
| Kyocera Corp. - ADR | 10,384 | 105,086 | ||||||
| Murata Manufacturing Co Ltd. - ADR | 27,979 | 244,816 | ||||||
| SCREEN Holdings Co. Ltd. | 740 | 48,726 | ||||||
| TE Connectivity Ltd. | 546 | 80,491 | ||||||
| Trimble, Inc. (a) | 374 | 22,627 | ||||||
| 793,524 | ||||||||
| Energy-Alternate Sources - 0.1% | ||||||||
| Enphase Energy, Inc. (a) | 183 | 15,196 | ||||||
| First Solar, Inc. (a) | 194 | 37,729 | ||||||
| 52,925 | ||||||||
| Healthcare-Products - 0.6% | ||||||||
| FUJIFILM Holdings Corp. - ADR | 18,768 | 223,715 | ||||||
| Internet - 2.7% | ||||||||
| CDW Corp. | 227 | 42,728 | ||||||
| F5, Inc. (a) | 118 | 27,598 | ||||||
| GoDaddy, Inc. - Class A (a) | 253 | 42,201 | ||||||
| Palo Alto Networks, Inc. (a) | 566 | 203,947 | ||||||
| Shopify, Inc. - Class A (a) | 9,206 | 719,335 | ||||||
| VeriSign, Inc. (a) | 149 | 26,349 | ||||||
| 1,062,158 | ||||||||
| Machinery-Diversified - 2.2% | ||||||||
| Hexagon AB - ADR | 16,225 | 150,568 | ||||||
| Keyence Corp. | 1,464 | 670,658 | ||||||
| Omron Corp. - ADR | 1,421 | 56,101 | ||||||
| 877,327 | ||||||||
| Miscellaneous Manufacturing - 0.1% | ||||||||
| Teledyne Technologies, Inc. (a) | 78 | 35,515 | ||||||
SP Funds S&P Global Technology ETF
Schedule of Investments
October 31, 2024
| Office-Business Equipment - 0.7% | ||||||||
| Canon, Inc. - ADR | 7,449 | 239,783 | ||||||
| Zebra Technologies Corp. - Class A (a) | 66 | 25,210 | ||||||
| 264,993 | ||||||||
| Semiconductors - 46.9%(b) | ||||||||
| Advanced Micro Devices, Inc. (a) | 2,827 | 407,286 | ||||||
| Advantest Corp. - ADR | 5,856 | 338,360 | ||||||
| Analog Devices, Inc. | 896 | 199,907 | ||||||
| Applied Materials, Inc. | 1,437 | 260,930 | ||||||
| ASM International NV | 346 | 192,400 | ||||||
| ASML Holding NV | 2,798 | 1,886,982 | ||||||
| BE Semiconductor Industries NV | 542 | 57,630 | ||||||
| Broadcom, Inc. | 7,703 | 1,307,738 | ||||||
| Disco Corp. - ADR | 7,113 | 203,290 | ||||||
| Infineon Technologies AG - ADR | 9,900 | 313,335 | ||||||
| KLA Corp. | 241 | 160,561 | ||||||
| Lam Research Corp. | 2,370 | 176,210 | ||||||
| Microchip Technology, Inc. | 1,006 | 73,810 | ||||||
| Micron Technology, Inc. | 1,921 | 191,428 | ||||||
| Monolithic Power Systems, Inc. | 77 | 58,466 | ||||||
| NVIDIA Corp. | 32,938 | 4,372,849 | ||||||
| NXP Semiconductors NV | 472 | 110,684 | ||||||
| ON Semiconductor Corp. (a) | 717 | 50,541 | ||||||
| Qorvo, Inc. (a) | 236 | 16,817 | ||||||
| QUALCOMM, Inc. | 1,916 | 311,867 | ||||||
| Renesas Electronics Corp. - ADR | 25,845 | 175,229 | ||||||
| Skyworks Solutions, Inc. | 296 | 25,924 | ||||||
| STMicroelectronics NV | 4,566 | 124,075 | ||||||
| Taiwan Semiconductor Manufacturing Co Ltd. - ADR | 32,152 | 6,126,242 | ||||||
| Teradyne, Inc. | 239 | 25,384 | ||||||
| Texas Instruments, Inc. | 1,571 | 319,164 | ||||||
| Tokyo Electron Ltd. - ADR | 7,469 | 556,216 | ||||||
| United Microelectronics Corp. - ADR | 76,369 | 522,364 | ||||||
| 18,565,689 | ||||||||
| Software - 24.0% | ||||||||
| Adobe, Inc. (a) | 772 | 369,078 | ||||||
| Akamai Technologies, Inc. (a) | 295 | 29,819 | ||||||
| ANSYS, Inc. (a) | 178 | 57,033 | ||||||
| Autodesk, Inc. (a) | 368 | 104,438 | ||||||
| Cadence Design Systems, Inc. (a) | 475 | 131,157 | ||||||
| Constellation Software, Inc. | 150 | 451,850 | ||||||
| Dassault Systemes SE - ADR | 4,957 | 168,835 | ||||||
| Fair Isaac Corp. (a) | 40 | 79,724 | ||||||
| Microsoft Corp. | 10,466 | 4,252,859 | ||||||
| Oracle Corp. | 2,644 | 443,769 | ||||||
| PTC, Inc. (a) | 236 | 43,738 | ||||||
| Roper Technologies, Inc. | 193 | 103,782 | ||||||
| Sage Group PLC - ADR | 2,008 | 100,380 | ||||||
| Salesforce, Inc. | 1,683 | 490,376 | ||||||
| SAP SE - ADR | 8,235 | 1,924,025 | ||||||
| ServiceNow, Inc. (a) | 350 | 326,547 | ||||||
| Synopsys, Inc. (a) | 263 | 135,079 | ||||||
| Temenos AG - ADR | 472 | 32,783 | ||||||
| Tyler Technologies, Inc. (a) | 72 | 43,602 | ||||||
| WiseTech Global Ltd. | 1,264 | 97,926 | ||||||
| Xero Ltd. (a) | 968 | 94,789 | ||||||
| 9,481,589 | ||||||||
SP Funds S&P Global Technology ETF
Schedule of Investments
October 31, 2024
| Telecommunications - 3.9% | ||||||||
| Arista Networks, Inc. (a) | 438 | 169,261 | ||||||
| Cisco Systems, Inc. | 6,922 | 379,118 | ||||||
| Corning, Inc. | 1,361 | 64,770 | ||||||
| Juniper Networks, Inc. | 708 | 27,541 | ||||||
| Motorola Solutions, Inc. | 295 | 132,558 | ||||||
| Nokia OYJ - ADR | 41,541 | 195,658 | ||||||
| Telefonaktiebolaget LM Ericsson - ADR | 24,427 | 204,699 | ||||||
| Xiaomi Corp. - ADR (a) | 22,666 | 387,815 | ||||||
| 1,561,420 | ||||||||
| TOTAL COMMON STOCKS (Cost $32,442,008) | 39,115,330 | |||||||
| TOTAL INVESTMENTS - 98.9% (Cost $32,442,008) | 39,115,330 | |||||||
| Other Assets in Excess of Liabilities - 1.1% | 423,228 | |||||||
| TOTAL NET ASSETS - 100.0% | $ | 39,538,558 | ||||||
Percentages are stated as a percent of net assets.
AB - Aktiebolag
ADR - American Depositary Receipt
AG - Aktiengesellschaft
NV - Naamloze Vennootschap
OYJ - Julkinen Asakeyhtio
PLC - Public Limited Company
SA - Sociedad Anónima
SE - Societas Europeae
| (a) | Non-income producing security. |
| (b) | To the extent that the Fund invests more heavily in a particular industry or sector of the economy, its performance will be especially sensitive to developments that significantly affect those industries or sectors. |
SP Funds S&P World (ex-US) ETF
Schedule of Investments
October 31, 2024
| COMMON STOCKS - 99.5% | Shares | Value | ||||||
| Aerospace/Defense - 1.8% | ||||||||
| Airbus SE - ADR | 5,029 | $ | 191,354 | |||||
| Melrose Industries PLC | 2,934 | 17,917 | ||||||
| MTU Aero Engines AG - ADR | 206 | 33,718 | ||||||
| Rheinmetall AG - ADR | 445 | 45,808 | ||||||
| Saab AB - ADR | 1,329 | 13,689 | ||||||
| Safran SA - ADR | 2,744 | 155,201 | ||||||
| Thales SA - ADR | 911 | 29,352 | ||||||
| 487,039 | ||||||||
| Agriculture - 0.1% | ||||||||
| IOI Corp. Bhd | 18,747 | 16,140 | ||||||
| Kuala Lumpur Kepong Bhd | 3,434 | 16,782 | ||||||
| 32,922 | ||||||||
| Airlines - 0.1% | ||||||||
| Ryanair Holdings PLC - ADR | 405 | 17,925 | ||||||
| Apparel - 1.4% | ||||||||
| adidas AG - ADR | 671 | 80,211 | ||||||
| Asics Corp. - ADR | 1,525 | 26,687 | ||||||
| Hermes International SCA - ADR | 720 | 162,454 | ||||||
| Kering SA - ADR | 1,561 | 38,744 | ||||||
| LPP SA | 5 | 18,100 | ||||||
| Shenzhou International Group Holdings Ltd. - ADR | 4,517 | 34,691 | ||||||
| 360,887 | ||||||||
| Auto Manufacturers - 2.3% | ||||||||
| BYD Co. Ltd. - ADR | 2,855 | 207,701 | ||||||
| Ferrari NV | 225 | 107,430 | ||||||
| Geely Automobile Holdings Ltd. - ADR | 1,606 | 56,113 | ||||||
| Great Wall Motor Co. Ltd. - ADR | 1,054 | 16,395 | ||||||
| Kia Corp. | 378 | 25,173 | ||||||
| Li Auto, Inc. - Class A (a) | 6,694 | 92,475 | ||||||
| Subaru Corp. - ADR | 2,777 | 24,910 | ||||||
| Suzuki Motor Corp. - ADR | 997 | 39,710 | ||||||
| XPeng, Inc. - Class A (a) | 6,254 | 36,320 | ||||||
| 606,227 | ||||||||
| Auto Parts & Equipment - 0.7% | ||||||||
| Bridgestone Corp. - ADR | 2,450 | 43,659 | ||||||
| Denso Corp. - ADR | 4,276 | 60,719 | ||||||
| Fuyao Glass Industry Group Co. Ltd. - Class H | 3,529 | 25,034 | ||||||
| Hyundai Mobis Co. Ltd. | 92 | 16,633 | ||||||
| LG Energy Solution Ltd. (a) | 63 | 18,603 | ||||||
| Samsung SDI Co. Ltd. | 77 | 18,246 | ||||||
| 182,894 | ||||||||
| Banks - 0.2% | ||||||||
| Abu Dhabi Islamic Bank PJSC | 6,030 | 20,686 | ||||||
| Computershare Ltd. - ADR | 1,150 | 19,895 | ||||||
| Dubai Islamic Bank PJSC | 12,021 | 20,455 | ||||||
| 61,036 | ||||||||
| Beverages - 0.3% | ||||||||
| Arca Continental SAB de CV | 2,400 | 20,446 | ||||||
| Coca-Cola Femsa SAB de CV - ADR | 298 | 24,844 | ||||||
| Nongfu Spring Co. Ltd. - Class H | 9,638 | 35,828 | ||||||
| 81,818 | ||||||||
7
SP Funds S&P World (ex-US) ETF
Schedule of Investments
October 31, 2024
| Biotechnology - 1.2% | ||||||||
| Akeso, Inc. (a) | 3,417 | 27,602 | ||||||
| BeiGene Ltd. - ADR (a) | 384 | 77,814 | ||||||
| CSL Ltd. - ADR | 1,967 | 184,434 | ||||||
| Samsung Biologics Co. Ltd. (a) | 28 | 20,330 | ||||||
| 310,180 | ||||||||
| Building Materials - 1.2% | ||||||||
| Anhui Conch Cement Co. Ltd. - ADR | 1,468 | 21,345 | ||||||
| Daikin Industries Ltd. - ADR | 5,959 | 71,448 | ||||||
| Geberit AG - ADR | 717 | 44,963 | ||||||
| James Hardie Industries PLC - ADR (a) | 913 | 29,125 | ||||||
| Kingspan Group PLC - ADR | 334 | 29,118 | ||||||
| Nibe Industrier AB - Class B (a) | 3,354 | 16,124 | ||||||
| Sika AG - ADR | 3,480 | 96,814 | ||||||
| Svenska Cellulosa AB SCA - Class B | 1,320 | 17,376 | ||||||
| 326,313 | ||||||||
| Chemicals - 2.7% | ||||||||
| Air Liquide SA - ADR | 5,895 | 210,982 | ||||||
| Chandra Asri Pacific Tbk PT | 73,051 | 40,726 | ||||||
| Croda International PLC - ADR | 481 | 11,828 | ||||||
| DSM-Firmenich AG | 430 | 50,931 | ||||||
| Givaudan SA - ADR | 808 | 76,671 | ||||||
| Nippon Paint Holdings Co Ltd. | 2,357 | 18,166 | ||||||
| Nitto Denko Corp. - ADR | 1,432 | 23,456 | ||||||
| Novonesis (Novozymes) B - ADR | 760 | 47,682 | ||||||
| Petronas Chemicals Group Bhd | 17,026 | 21,073 | ||||||
| Shin-Etsu Chemical Co. Ltd. - ADR | 8,161 | 150,326 | ||||||
| Sociedad Quimica y Minera de Chile SA - ADR | 757 | 29,061 | ||||||
| Symrise AG - ADR | 1,101 | 33,069 | ||||||
| 713,971 | ||||||||
| Coal - 0.3% | ||||||||
| China Shenhua Energy Co Ltd. - ADR | 4,708 | 80,730 | ||||||
| Commercial Services - 2.8% | ||||||||
| Brambles Ltd. - ADR | 1,422 | 34,270 | ||||||
| Dai Nippon Printing Co. Ltd. - ADR | 1,852 | 16,001 | ||||||
| Experian PLC - ADR | 1,854 | 90,512 | ||||||
| Intertek Group PLC - ADR | 297 | 17,796 | ||||||
| New Oriental Education & Technology Group, Inc. - ADR | 711 | 44,509 | ||||||
| Recruit Holdings Co. Ltd. - ADR | 16,863 | 206,066 | ||||||
| RELX PLC - ADR | 3,806 | 175,913 | ||||||
| Secom Co. Ltd. - ADR | 3,212 | 28,490 | ||||||
| SGS SA - ADR | 3,212 | 33,887 | ||||||
| TOPPAN Holdings, Inc. - ADR | 1,055 | 15,551 | ||||||
| Wolters Kluwer NV - ADR | 509 | 85,090 | ||||||
| 748,085 | ||||||||
| Computers - 3.1% | ||||||||
| Capgemini SE - ADR | 1,787 | 61,652 | ||||||
| CGI, Inc. (a) | 433 | 47,911 | ||||||
| Check Point Software Technologies Ltd. (a) | 194 | 33,603 | ||||||
| CyberArk Software Ltd. (a) | 88 | 24,334 | ||||||
| Fujitsu Ltd. - ADR | 3,491 | 65,107 | ||||||
| Infosys Ltd. - ADR | 20,315 | 424,787 | ||||||
| LG Corp. | 139 | 7,625 |
8
SP Funds S&P World (ex-US) ETF
Schedule of Investments
October 31, 2024
| NEC Corp. | 555 | 48,222 | ||||||
| Nomura Research Institute Ltd. - ADR | 941 | 28,202 | ||||||
| Obic Co. Ltd. | 800 | 26,212 | ||||||
| Wipro Ltd. - ADR | 7,855 | 50,900 | ||||||
| 818,555 | ||||||||
| Cosmetics/Personal Care - 2.7% | ||||||||
| Beiersdorf AG - ADR | 849 | 22,880 | ||||||
| Essity AB - Class B | 1,230 | 34,578 | ||||||
| Haleon PLC - ADR | 7,113 | 68,925 | ||||||
| Kao Corp. - ADR | 5,408 | 47,374 | ||||||
| L’Oreal SA - ADR | 2,447 | 183,109 | ||||||
| Shiseido Co. Ltd. - ADR | 1,100 | 23,397 | ||||||
| Unicharm Corp. - ADR | 4,751 | 30,739 | ||||||
| Unilever PLC - ADR | 5,000 | 304,550 | ||||||
| 715,552 | ||||||||
| Distribution/Wholesale - 0.3% | ||||||||
| AddTech AB - Class B | 529 | 14,604 | ||||||
| Bunzl PLC - ADR | 680 | 30,148 | ||||||
| Pop Mart International Group Ltd. | 3,483 | 31,584 | ||||||
| Toromont Industries Ltd. | 162 | 14,295 | ||||||
| 90,631 | ||||||||
| Electric - 0.2% | ||||||||
| Dubai Electricity & Water Authority PJSC | 38,304 | 25,967 | ||||||
| Origin Energy Ltd. | 3,510 | 22,140 | ||||||
| 48,107 | ||||||||
| Electrical Components & Equipment - 1.3% | ||||||||
| Ecopro BM Co. Ltd. (a) | 79 | 9,760 | ||||||
| Legrand SA - ADR | 2,680 | 60,300 | ||||||
| Schneider Electric SE - ADR | 5,375 | 277,834 | ||||||
| 347,894 | ||||||||
| Electronics - 2.6% | ||||||||
| ABB Ltd. | 3,358 | 186,016 | ||||||
| Assa Abloy AB - ADR | 4,613 | 71,871 | ||||||
| BYD Electronic International Co. Ltd. | 4,327 | 18,645 | ||||||
| Delta Electronics Thailand PCL | 27,405 | 112,073 | ||||||
| Halma PLC | 813 | 25,869 | ||||||
| Hoya Corp. - ADR | 715 | 96,003 | ||||||
| Kyocera Corp. - ADR | 2,972 | 30,077 | ||||||
| Murata Manufacturing Co. Ltd. - ADR | 7,558 | 66,132 | ||||||
| NIDEC Corp. - ADR | 9,048 | 44,969 | ||||||
| Samsung Electro-Mechanics Co. Ltd. | 83 | 7,121 | ||||||
| SCREEN Holdings Co. Ltd. | 207 | 13,630 | ||||||
| Shimadzu Corp. | 611 | 18,259 | ||||||
| 690,665 | ||||||||
| Energy-Alternate Sources - 0.2% | ||||||||
| Vestas Wind Systems AS - ADR (a) | 7,066 | 43,950 | ||||||
| Engineering & Construction - 0.7% | ||||||||
| Airports of Thailand PCL | 24,074 | 43,696 | ||||||
| Grupo Aeroportuario del Pacifico SAB de CV - ADR | 205 | 35,689 | ||||||
| Grupo Aeroportuario del Sureste SAB de CV - ADR | 115 | 30,967 | ||||||
| Samsung C&T Corp. | 112 | 9,496 | ||||||
| Stantec, Inc. | 240 | 19,445 | ||||||
| WSP Global, Inc. | 249 | 44,455 | ||||||
| 183,748 |
9
SP Funds S&P World (ex-US) ETF
Schedule of Investments
October 31, 2024
| Environmental Control - 0.3% | ||||||||
| Waste Connections, Inc. | 526 | 92,876 | ||||||
| Food - 2.9% | ||||||||
| Ajinomoto Co., Inc. - ADR | 978 | 37,624 | ||||||
| Bid Corp Ltd. | 2,162 | 51,011 | ||||||
| BIM Birlesik Magazalar AS | 2,327 | 31,658 | ||||||
| Chocoladefabriken Lindt & Spruengli AG | 2 | 23,523 | ||||||
| Kerry Group PLC - ADR | 297 | 29,652 | ||||||
| Mowi ASA - ADR | 895 | 15,430 | ||||||
| Nestle SA - ADR | 5,235 | 494,812 | ||||||
| Nissin Foods Holdings Co. Ltd. | 533 | 14,416 | ||||||
| Orkla ASA - ADR | 1,468 | 13,726 | ||||||
| SD Guthrie Bhd | 21,544 | 22,631 | ||||||
| Sumber Alfaria Trijaya Tbk PT | 85,834 | 18,157 | ||||||
| Want Want China Holdings Ltd. | 32,472 | 20,216 | ||||||
| Yakult Honsha Co. Ltd. | 389 | 8,473 | ||||||
| 781,329 | ||||||||
| Food Service - 0.4% | ||||||||
| Compass Group PLC - ADR | 3,397 | 112,407 | ||||||
| Forest Products & Paper - 0.1% | ||||||||
| Mondi PLC - ADR | 346 | 11,131 | ||||||
| UPM-Kymmene Oyj - ADR | 987 | 28,870 | ||||||
| 40,001 | ||||||||
| Hand/Machine Tools - 0.4% | ||||||||
| Fuji Electric Co Ltd. | 359 | 18,737 | ||||||
| Makita Corp. - ADR | 527 | 17,217 | ||||||
| Schindler Holding AG | 67 | 19,479 | ||||||
| Techtronic Industries Co. Ltd. - ADR | 572 | 41,516 | ||||||
| 96,949 | ||||||||
| Healthcare-Products - 2.3% | ||||||||
| Alcon AG | 992 | 91,296 | ||||||
| Cochlear Ltd. - ADR | 310 | 29,084 | ||||||
| Coloplast A/S - ADR | 2,179 | 27,281 | ||||||
| EssilorLuxottica SA - ADR | 1,192 | 139,333 | ||||||
| Fisher & Paykel Healthcare Corp Ltd. | 1,275 | 27,310 | ||||||
| FUJIFILM Holdings Corp. - ADR | 5,284 | 62,985 | ||||||
| Olympus Corp. | 2,396 | 42,635 | ||||||
| Siemens Healthineers AG - ADR | 1,224 | 31,824 | ||||||
| Smith & Nephew PLC - ADR | 803 | 20,147 | ||||||
| Sonova Holding AG - ADR | 519 | 37,918 | ||||||
| Straumann Holding AG - ADR | 2,404 | 31,516 | ||||||
| Sysmex Corp. - ADR | 859 | 15,909 | ||||||
| Terumo Corp. - ADR | 3,480 | 66,190 | ||||||
| 623,428 | ||||||||
| Healthcare-Services - 1.0% | ||||||||
| Bangkok Dusit Medical Services PCL | 27,515 | 22,423 | ||||||
| Bumrungrad Hospital PCL | 1,376 | 11,091 | ||||||
| ICON PLC (a) | 190 | 42,201 | ||||||
| IHH Healthcare Bhd | 13,946 | 23,089 | ||||||
| Lonza Group AG - ADR | 1,612 | 99,412 | ||||||
| Sonic Healthcare Ltd. - ADR | 849 | 14,858 | ||||||
| Wuxi Biologics Cayman, Inc. - ADR (a) | 11,007 | 46,229 | ||||||
| 259,303 |
10
SP Funds S&P World (ex-US) ETF
Schedule of Investments
October 31, 2024
| Home Builders - 0.1% | ||||||||
| Sekisui Chemical Co. Ltd. | 527 | 7,508 | ||||||
| Taylor Wimpey PLC - ADR | 705 | 13,402 | ||||||
| 20,910 | ||||||||
| Home Furnishings - 0.2% | ||||||||
| Haier Smart Home Co. Ltd. - ADR | 3,396 | 49,140 | ||||||
| Household Products/Wares - 0.4% | ||||||||
| Henkel AG & Co. KGaA - ADR | 665 | 12,901 | ||||||
| Reckitt Benckiser Group PLC - ADR | 7,066 | 85,428 | ||||||
| 98,329 | ||||||||
| Internet - 7.9% | ||||||||
| Allegro.eu SA (a) | 2,589 | 22,685 | ||||||
| Auto Trader Group PLC - ADR | 6,081 | 16,540 | ||||||
| CAR Group Ltd. | 768 | 19,005 | ||||||
| Coupang, Inc. (a) | 2,409 | 62,128 | ||||||
| GoTo Gojek Tokopedia Tbk PT (a) | 3,990,444 | 17,289 | ||||||
| JD.com, Inc. - ADR | 8,018 | 325,691 | ||||||
| Kanzhun Ltd. - ADR | 1,560 | 22,698 | ||||||
| MakeMyTrip Ltd. (a) | 320 | 32,477 | ||||||
| Meituan - ADR (a) | 15,484 | 732,393 | ||||||
| PDD Holdings, Inc. - ADR (a) | 3,966 | 478,260 | ||||||
| Prosus NV - ADR | 14,071 | 118,478 | ||||||
| Shopify, Inc. - Class A (a) | 2,465 | 192,609 | ||||||
| Trend Micro, Inc.- ADR | 295 | 15,420 | ||||||
| Vipshop Holdings Ltd. - ADR | 1,238 | 17,877 | ||||||
| Wix.com Ltd. (a) | 113 | 18,884 | ||||||
| 2,092,434 | ||||||||
| Iron/Steel - 1.1% | ||||||||
| BlueScope Steel Ltd. | 997 | 13,263 | ||||||
| Fortescue Ltd. - ADR | 1,939 | 48,417 | ||||||
| Vale SA - ADR | 21,279 | 227,685 | ||||||
| 289,365 | ||||||||
| Leisure Time - 0.4% | ||||||||
| Amadeus IT Group SA - ADR | 1,037 | 75,048 | ||||||
| Shimano, Inc. - ADR | 1,468 | 21,579 | ||||||
| 96,627 | ||||||||
| Lodging - 0.1% | ||||||||
| H World Group Ltd. - ADR | 803 | 29,462 | ||||||
| Machinery-Construction & Mining - 1.6% | ||||||||
| Epiroc AB - ADR | 1,146 | 22,221 | ||||||
| Hitachi Ltd. - ADR | 4,697 | 237,199 | ||||||
| Metso Oyj | 895 | 8,459 | ||||||
| Mitsubishi Electric Corp. - ADR | 2,188 | 75,595 | ||||||
| Sandvik AB - ADR | 2,538 | 49,567 | ||||||
| Siemens Energy AG - ADR (a) | 1,054 | 43,035 | ||||||
| 436,076 | ||||||||
| Machinery-Diversified - 2.3% | ||||||||
| Atlas Copco AB - ADR | 3,634 | 52,766 | ||||||
| Atlas Copco AB - ADR | 5,220 | 85,556 |
11
SP Funds S&P World (ex-US) ETF
Schedule of Investments
October 31, 2024
| Daifuku Co. Ltd. - ADR | 1,559 | 14,670 | ||||||
| FANUC Corp. - ADR | 3,867 | 51,392 | ||||||
| Hexagon AB - ADR | 4,993 | 46,335 | ||||||
| Keyence Corp. | 407 | 186,446 | ||||||
| Kone Oyj - ADR | 1,846 | 50,470 | ||||||
| Omron Corp. - ADR | 389 | 15,358 | ||||||
| SMC Corp. - ADR | 2,837 | 60,768 | ||||||
| Spirax Group PLC | 151 | 12,531 | ||||||
| Wartsila OYJ Abp - ADR | 4,904 | 18,998 | ||||||
| Yaskawa Electric Corp. - ADR | 205 | 11,794 | ||||||
| 607,084 | ||||||||
| Media - 0.3% | ||||||||
| Informa PLC - ADR | 1,238 | 25,305 | ||||||
| Pearson PLC - ADR | 1,238 | 18,075 | ||||||
| Thomson Reuters Corp. | 275 | 44,962 | ||||||
| 88,342 | ||||||||
| Metal Fabricate/Hardware - 0.2% | ||||||||
| Prysmian SpA - ADR | 1,209 | 42,388 | ||||||
| SKF AB - ADR | 573 | 10,830 | ||||||
| Tenaris SA - ADR | 389 | 12,790 | ||||||
| 66,008 | ||||||||
| Mining - 4.8% | ||||||||
| Agnico Eagle Mines Ltd. | 1,042 | 89,836 | ||||||
| Amman Mineral Internasional PT (a) | 69,400 | 40,570 | ||||||
| Antofagasta PLC | 703 | 15,654 | ||||||
| Barrick Gold Corp. | 3,570 | 68,918 | ||||||
| BHP Group Ltd. - ADR | 5,068 | 281,071 | ||||||
| Boliden AB - ADR | 205 | 12,714 | ||||||
| Cameco Corp. | 994 | 51,884 | ||||||
| Franco-Nevada Corp. | 395 | 52,372 | ||||||
| Gold Fields Ltd. - ADR | 5,002 | 82,433 | ||||||
| Grupo Mexico SAB de CV - Class B | 18,410 | 96,470 | ||||||
| Impala Platinum Holdings Ltd. - ADR (a) | 5,462 | 36,705 | ||||||
| Ivanhoe Mines Ltd. - Class A (a) | 1,457 | 19,243 | ||||||
| Kinross Gold Corp. | 2,501 | 25,208 | ||||||
| Norsk Hydro ASA - ADR | 2,363 | 14,414 | ||||||
| Pan American Silver Corp. | 739 | 17,262 | ||||||
| Pilbara Minerals Ltd. (a) | 3,493 | 6,520 | ||||||
| Press Metal Aluminium Holdings Bhd | 18,896 | 20,497 | ||||||
| Rio Tinto Ltd. | 767 | 59,939 | ||||||
| Rio Tinto PLC - ADR | 2,170 | 140,811 | ||||||
| South32 Ltd. - ADR | 1,790 | 21,337 | ||||||
| Southern Copper Corp. | 452 | 49,517 | ||||||
| Wheaton Precious Metals Corp. | 997 | 65,766 | ||||||
| 1,269,141 | ||||||||
| Miscellaneous Manufacturing - 0.3% | ||||||||
| Alfa Laval AB - ADR | 683 | 30,127 | ||||||
| Indutrade AB | 542 | 14,619 | ||||||
| Smiths Group PLC - ADR | 619 | 12,244 | ||||||
| Sunny Optical Technology Group Co. Ltd. - ADR | 297 | 19,406 | ||||||
| 76,396 | ||||||||
| Office-Business Equipment - 0.2% | ||||||||
| Canon, Inc. | 1,954 | 64,190 |
12
SP Funds S&P World (ex-US) ETF
Schedule of Investments
October 31, 2024
| Oil & Gas - 1.9% | ||||||||
| ADNOC Drilling Co. PJSC | 10,625 | 14,666 | ||||||
| ARC Resources Ltd. | 1,335 | 22,085 | ||||||
| Canadian Natural Resources Ltd. | 4,334 | 147,218 | ||||||
| Cenovus Energy, Inc. | 2,647 | 42,517 | ||||||
| Imperial Oil Ltd. | 343 | 25,566 | ||||||
| Neste Oyj - ADR | 1,790 | 14,195 | ||||||
| PTT Exploration & Production PCL | 8,086 | 30,312 | ||||||
| Suncor Energy, Inc. | 2,588 | 97,583 | ||||||
| Tourmaline Oil Corp. | 660 | 30,392 | ||||||
| Turkiye Petrol Rafinerileri AS | 5,104 | 21,523 | ||||||
| Woodside Energy Group Ltd. - ADR | 3,895 | 61,346 | ||||||
| 507,403 | ||||||||
| Pharmaceuticals - 11.5% | ||||||||
| Astellas Pharma, Inc. - ADR | 3,918 | 45,762 | ||||||
| AstraZeneca PLC - ADR | 6,158 | 438,142 | ||||||
| Celltrion, Inc. | 215 | 28,433 | ||||||
| Chugai Pharmaceutical Co Ltd. - ADR | 2,611 | 62,220 | ||||||
| CSPC Pharmaceutical Group Ltd. | 46,219 | 34,184 | ||||||
| Daiichi Sankyo Co. Ltd. - ADR | 3,918 | 127,609 | ||||||
| Dr Reddy’s Laboratories Ltd. - ADR | 672 | 49,661 | ||||||
| Eisai Co. Ltd. | 624 | 21,212 | ||||||
| GSK PLC - ADR | 4,216 | 154,980 | ||||||
| Merck KGaA - ADR | 1,513 | 49,989 | ||||||
| Novartis AG - ADR | 3,920 | 424,928 | ||||||
| Novo Nordisk A/S - ADR | 6,313 | 706,740 | ||||||
| Ono Pharmaceutical Co. Ltd. - ADR | 3,212 | 13,266 | ||||||
| Otsuka Holdings Co. Ltd. - ADR | 2,225 | 67,328 | ||||||
| Roche Holding AG | 61 | 20,684 | ||||||
| Roche Holding AG - ADR | 11,327 | 439,601 | ||||||
| Sandoz Group AG - ADR | 881 | 40,182 | ||||||
| Sanofi SA - ADR | 4,378 | 231,509 | ||||||
| Shionogi & Co. Ltd. - ADR | 2,992 | 21,273 | ||||||
| Sino Biopharmaceutical Ltd. | 57,115 | 25,933 | ||||||
| UCB SA - ADR | 481 | 46,162 | ||||||
| 3,049,798 | ||||||||
| Pipelines - 0.2% | ||||||||
| Adnoc Gas PLC | 31,855 | 28,707 | ||||||
| Petronas Gas Bhd | 5,698 | 22,485 | ||||||
| 51,192 | ||||||||
| Real Estate - 0.8% | ||||||||
| Aldar Properties PJSC | 15,664 | 32,497 | ||||||
| Daito Trust Construction Co. Ltd. - ADR | 481 | 13,081 | ||||||
| Emaar Properties PJSC | 25,679 | 60,754 | ||||||
| FirstService Corp. | 84 | 15,535 | ||||||
| KE Holdings, Inc. - ADR | 3,771 | 82,698 | ||||||
| 204,565 | ||||||||
| Retail - 3.4% | ||||||||
| Abu Dhabi National Oil Co. for Distribution PJSC | 11,932 | 11,727 | ||||||
| ANTA Sports Products Ltd. - ADR | 247 | 66,186 | ||||||
| Associated British Foods PLC - ADR | 527 | 15,077 | ||||||
| Cie Financiere Richemont SA - ADR | 11,423 | 165,291 | ||||||
| Clicks Group Ltd. - ADR | 559 | 24,233 | ||||||
| Dollarama, Inc. | 584 | 60,702 | ||||||
| Fast Retailing Co. Ltd. - ADR | 4,215 | 134,669 | ||||||
| H & M Hennes & Mauritz AB - ADR | 5,002 | 14,506 | ||||||
| Industria de Diseno Textil SA - ADR | 4,749 | 136,344 | ||||||
13
SP Funds S&P World (ex-US) ETF
Schedule of Investments
October 31, 2024
| JD Health International, Inc. (a) | 5,840 | 20,883 | ||||||
| JUMBO SA | 440 | 11,703 | ||||||
| Li Ning Co. Ltd. - ADR | 531 | 27,347 | ||||||
| MatsukiyoCocokara & Co. | 435 | 5,969 | ||||||
| Moncler SpA | 434 | 24,001 | ||||||
| Mr Price Group Ltd. | 1,448 | 20,953 | ||||||
| Nitori Holdings Co. Ltd. - ADR | 1,514 | 18,986 | ||||||
| Pan Pacific International Holdings Corp. - ADR | 1,087 | 26,990 | ||||||
| Raia Drogasil SA | 5,346 | 22,580 | ||||||
| Wesfarmers Ltd. - ADR | 4,657 | 102,501 | ||||||
| 910,648 | ||||||||
| Semiconductors - 20.7% | ||||||||
| Advantest Corp. - ADR | 1,661 | 95,973 | ||||||
| ARM Holdings PLC - ADR (a) | 235 | 33,206 | ||||||
| ASM International NV | 94 | 52,270 | ||||||
| ASML Holding NV | 801 | 540,197 | ||||||
| Disco Corp. - ADR | 1,983 | 56,674 | ||||||
| Infineon Technologies AG - ADR | 2,882 | 91,215 | ||||||
| Lasertec Corp. - ADR | 807 | 22,168 | ||||||
| Renesas Electronics Corp. - ADR | 6,683 | 45,311 | ||||||
| Samsung Electronics Co. Ltd. | 7,258 | 311,358 | ||||||
| STMicroelectronics NV | 1,375 | 37,364 | ||||||
| Taiwan Semiconductor Manufacturing Co. Ltd. - ADR | 21,000 | 4,001,340 | ||||||
| Tokyo Electron Ltd. - ADR | 1,917 | 142,759 | ||||||
| United Microelectronics Corp. - ADR | 13,083 | 89,488 | ||||||
| 5,519,323 | ||||||||
| Shipbuilding - 0.2% | ||||||||
| Kongsberg Gruppen ASA - ADR | 345 | 17,975 | ||||||
| Yangzijiang Shipbuilding Holdings Ltd. | 15,235 | 29,712 | ||||||
| 47,687 | ||||||||
| Software - 2.9% | ||||||||
| Constellation Software, Inc. | 39 | 117,481 | ||||||
| Dassault Systemes SE - ADR | 1,520 | 51,771 | ||||||
| Descartes Systems Group, Inc. (a) | 174 | 18,056 | ||||||
| Nice Ltd. - ADR (a) | 115 | 19,976 | ||||||
| Sage Group PLC - ADR | 532 | 26,595 | ||||||
| SAP SE - ADR | 2,055 | 480,130 | ||||||
| WiseTech Global Ltd. | 389 | 30,137 | ||||||
| Xero Ltd. (a) | 294 | 28,789 | ||||||
| 772,935 | ||||||||
| Telecommunications - 2.6% | ||||||||
| Celcomdigi Bhd | 20,304 | 15,811 | ||||||
| Chunghwa Telecom Co Ltd. - ADR | 2,311 | 87,102 | ||||||
| Elisa Oyj | 381 | 18,100 | ||||||
| Emirates Telecommunications Group Co. PJSC | 14,438 | 69,655 | ||||||
| Hellenic Telecommunications Organization SA - ADR | 1,974 | 16,246 | ||||||
| Nokia Oyj - ADR | 12,463 | 58,701 | ||||||
| Singapore Telecommunications Ltd. - ADR | 1,330 | 31,122 | ||||||
| Telefonaktiebolaget LM Ericsson - ADR | 6,598 | 55,291 | ||||||
| Telekom Malaysia Bhd | 12,244 | 18,147 | ||||||
| Vodacom Group Ltd. - ADR | 3,442 | 21,581 | ||||||
| Xiaomi Corp. - Class B (a) | 84,225 | 289,258 | ||||||
| 681,014 | ||||||||
| Transportation - 1.8% | ||||||||
| Canadian National Railway Co. | 1,128 | 121,665 |
14
SP Funds S&P World (ex-US) ETF
Schedule of Investments
October 31, 2024
| Canadian Pacific Kansas City Ltd. | 1,900 | 146,403 | ||||||
| DSV AS - ADR | 725 | 79,069 | ||||||
| InPost SA (a) | 1,240 | 24,137 | ||||||
| J&T Global Express Ltd. (a) | 29,148 | 23,058 | ||||||
| Kawasaki Kisen Kaisha Ltd. | 1,374 | 19,172 | ||||||
| Kuehne + Nagel International AG - ADR | 585 | 29,227 | ||||||
| SITC International Holdings Co. Ltd. | 4,434 | 12,547 | ||||||
| TFI International, Inc. | 158 | 21,120 | ||||||
| 476,398 | ||||||||
| TOTAL COMMON STOCKS (Cost $24,429,473) | 26,459,189 | |||||||
| REAL ESTATE INVESTMENT TRUSTS - 0.4% | Shares | Value | ||||||
| Goodman Group | 3,560 | 85,437 | ||||||
| Prologis Property Mexico SA de CV | 5,331 | 17,827 | ||||||
| TOTAL REAL ESTATE INVESTMENT TRUSTS (Cost $105,435) | 103,264 | |||||||
| PREFERRED STOCKS - 0.1% | Shares | Value | ||||||
| Iron/Steel - 0.1% | ||||||||
| Gerdau SA - ADR | 7,728 | 24,111 | ||||||
| TOTAL PREFERRED STOCKS (Cost $27,719) | 24,111 | |||||||
| TOTAL INVESTMENTS - 100.0% (Cost $24,562,627) | 26,586,564 | |||||||
| Other Assets in Excess of Liabilities - 0.0% (b) | 6,826 | |||||||
| TOTAL NET ASSETS - 100.0% | $ | 26,593,390 | ||||||
Percentages are stated as a percent of net assets.
AB - Aktiebolag
ADR - American Depositary Receipt
AG - Aktiengesellschaft
AS - Aksjeselskap
ASA - Advanced Subscription Agreement
KGaA - Kommanditgesellschaft auf Aktien
NV - Naamloze Vennootschap
Oyj - Julkinen Asakeyhtio
PCL - Public Company Limited
PJSC - Public Joint Stock Company
SA - Sociedad Anónima
SA de CV - Sociedad Anónima de Capital Variable
SAB de CV - Sociedad Anónima Bursátil de Capital Variable
SE - Societas Europeae
SpA - Societa per Azioni
| (a) | Non-income producing security. |
| (b) | Represents less than 0.05% of net assets. |
15
Statements of Assets and Liabilities
October 31, 2024
| SP Funds 2030 Target Date Fund | SP Funds 2040 Target Date Fund | SP Funds 2050 Target Date Fund | SP Funds S&P Global Technology ETF | SP Funds S&P World (ex-US) ETF | ||||||||||||||||
| ASSETS: | ||||||||||||||||||||
| Unaffiliated investments, at value (Note 2) | $ | 92,785 | $ | — | $ | — | $ | 39,115,330 | $ | 26,586,564 | ||||||||||
| Affiliated investments, at value | 3,278,008 | 1,481,524 | 387,545 | — | — | |||||||||||||||
| Cash | 337,513 | 62,936 | 15,165 | 426,277 | 2,350 | |||||||||||||||
| Receivable for fund shares sold | — | 266 | — | — | — | |||||||||||||||
| Dividends receivable | — | — | — | 15,402 | 17,241 | |||||||||||||||
| Prepaid expenses and other assets | 6,033 | 2,574 | 634 | — | — | |||||||||||||||
| Total assets | 3,714,339 | 1,547,300 | 403,344 | 39,557,009 | 26,606,155 | |||||||||||||||
| LIABILITIES: | ||||||||||||||||||||
| Payable to adviser (Note 4) | 1,381 | 597 | 156 | 18,451 | 12,765 | |||||||||||||||
| Payable for distribution and shareholder servicing fees | 1,131 | 547 | 196 | — | — | |||||||||||||||
| Total liabilities | 2,512 | 1,144 | 352 | 18,451 | 12,765 | |||||||||||||||
| NET ASSETS | $ | 3,711,827 | $ | 1,546,156 | $ | 402,992 | $ | 39,538,558 | $ | 26,593,390 | ||||||||||
| NET ASSETS CONSISTS OF: | ||||||||||||||||||||
| Paid-in capital | $ | 3,722,950 | $ | 1,559,715 | $ | 412,514 | $ | 32,825,018 | $ | 24,694,857 | ||||||||||
| Total distributable earnings/(accumulated losses) | (11,123 | ) | (13,559 | ) | (9,522 | ) | 6,713,540 | 1,898,533 | ||||||||||||
| Total net assets | $ | 3,711,827 | $ | 1,546,156 | $ | 402,992 | $ | 39,538,558 | $ | 26,593,390 | ||||||||||
| Net assets | $ | — | $ | — | $ | — | $ | 39,538,558 | $ | 26,593,390 | ||||||||||
| Shares issued and outstanding(a) | — | — | — | 1,475,000 | 1,175,000 | |||||||||||||||
| Net asset value per share | $ | — | $ | — | $ | — | $ | 26.81 | $ | 22.63 | ||||||||||
| Institutional Class | ||||||||||||||||||||
| Net assets | $ | 1,525,627 | $ | 459,429 | $ | — | $ | — | $ | — | ||||||||||
| Shares issued and outstanding(a) | 77,106 | 24,097 | — | — | — | |||||||||||||||
| Net asset value per share | $ | 19.79 | $ | 19.07 | $ | — | $ | — | $ | — | ||||||||||
| Investor Class | ||||||||||||||||||||
| Net assets | $ | 2,186,200 | $ | 1,086,727 | $ | 402,992 | $ | — | $ | — | ||||||||||
| Shares issued and outstanding(a) | 110,635 | 57,029 | 21,458 | — | — | |||||||||||||||
| Net asset value per share | $ | 19.76 | $ | 19.06 | $ | 18.78 | $ | — | $ | — | ||||||||||
| COST: | ||||||||||||||||||||
| Unaffiliated investments, at cost | $ | 85,903 | $ | — | $ | — | $ | 32,442,008 | $ | 24,562,627 | ||||||||||
| Affiliated investments, at cost | 3,301,365 | 1,497,864 | 397,053 | — | — | |||||||||||||||
| (a) | Unlimited shares authorized without par value. |
The accompanying notes are an integral part of these financial statements.
16
Statements of Operations
For the Period Ended October 31, 2024
| SP Funds 2030 Target Date Fund | SP Funds 2040 Target Date Fund | SP Funds 2050 Target Date Fund | SP Funds S&P Global Technology ETF | SP Funds S&P World (ex-US) ETF | ||||||||||||||||
| INVESTMENT INCOME: | ||||||||||||||||||||
| Dividend income from unaffiliated investments | $ | — | $ | — | $ | — | $ | 240,531 | $ | 268,776 | ||||||||||
| Dividend income from affiliated investments | 8,849 | 1,730 | 369 | — | — | |||||||||||||||
| Less: Dividend withholding taxes | — | — | — | (26,721 | ) | (29,039 | ) | |||||||||||||
| Less: Issuance fees | — | — | — | (4,968 | ) | (9,324 | ) | |||||||||||||
| Total investment income | 8,849 | 1,730 | 369 | 208,842 | 230,413 | |||||||||||||||
| EXPENSES: | ||||||||||||||||||||
| Investment advisory fee (Note 4) | 2,464 | 976 | 220 | 143,710 | 76,318 | |||||||||||||||
| Distribution expenses – Investor Class | 706 | 342 | 122 | — | — | |||||||||||||||
| Shareholder service costs – Investor Class | 424 | 205 | 73 | — | — | |||||||||||||||
| Income tax expense | — | — | — | 57 | 10 | |||||||||||||||
| Total expenses | 3,594 | 1,523 | 415 | 143,767 | 76,328 | |||||||||||||||
| NET INVESTMENT INCOME/(LOSS) | 5,255 | 207 | (46 | ) | 65,075 | 154,085 | ||||||||||||||
| REALIZED AND UNREALIZED GAIN/(LOSS) | ||||||||||||||||||||
| Net realized gain/(loss) from: | ||||||||||||||||||||
| Unaffiliated investments | 5,997 | 2,574 | 634 | 50,579 | (92,081 | ) | ||||||||||||||
| Affiliated investments | (5,900 | ) | — | (602 | ) | — | — | |||||||||||||
| Foreign currency translation | — | — | — | (1,407 | ) | (7,853 | ) | |||||||||||||
| Net realized gain/(loss) | 97 | 2,574 | 32 | 49,172 | (99,934 | ) | ||||||||||||||
| Net change in unrealized appreciation/(depreciation) on: | ||||||||||||||||||||
| Unaffiliated investments | 6,882 | — | — | 6,673,322 | 2,023,937 | |||||||||||||||
| Affiliated investments | (23,357 | ) | (16,340 | ) | (9,508 | ) | ||||||||||||||
| Foreign currency translation | — | — | — | (198 | ) | (151 | ) | |||||||||||||
| Net change in unrealized appreciation/(depreciation) | (16,475 | ) | (16,340 | ) | (9,508 | ) | 6,673,124 | 2,023,786 | ||||||||||||
| Net realized and unrealized gain/(loss) | (16,378 | ) | (13,766 | ) | (9,476 | ) | 6,722,296 | 1,923,852 | ||||||||||||
| NET INCREASE/(DECREASE) IN NET ASSETS RESULTING FROM OPERATIONS | $ | (11,123 | ) | $ | (13,559 | ) | $ | (9,522 | ) | $ | 6,787,371 | $ | 2,077,937 | |||||||
The accompanying notes are an integral part of these financial statements.
17
Statements of Changes in Net Assets
| SP Funds 2030 Target Date Fund | SP Funds 2040 Target Date Fund | SP Funds 2050 Target Date Fund | SP Funds S&P Global Technology ETF | |||||||||||||
| Period ended October 31, 2024(a) | Period ended October 31, 2024(a) | Period ended October 31, 2024(a) | Period ended October 31, 2024(b) | |||||||||||||
| OPERATIONS: | ||||||||||||||||
| Net investment income/(loss) | $ | 5,255 | $ | 207 | $ | (46 | ) | $ | 65,075 | |||||||
| Net realized gain | 97 | 2,574 | 32 | 49,172 | ||||||||||||
| Net change in unrealized appreciation/(depreciation) | (16,475 | ) | (16,340 | ) | (9,508 | ) | 6,673,124 | |||||||||
| Net increase/(decrease) in net assets from operations | (11,123 | ) | (13,559 | ) | (9,522 | ) | 6,787,371 | |||||||||
| DISTRIBUTIONS TO SHAREHOLDERS: | ||||||||||||||||
| Distributions to shareholders | — | — | — | (73,888 | ) | |||||||||||
| Total distributions to shareholders | — | — | — | (73,888 | ) | |||||||||||
| CAPITAL TRANSACTIONS: | ||||||||||||||||
| Subscriptions - ETF | — | — | — | 32,825,053 | ||||||||||||
| ETF transaction fees (Note 8) | — | — | — | 22 | ||||||||||||
| Subscriptions – Institutional Class | 1,538,180 | 464,352 | — | — | ||||||||||||
| Subscriptions – Investor Class | 2,184,770 | 1,098,236 | 412,712 | — | ||||||||||||
| Redemptions – Investor Class | — | (2,873 | ) | (198 | ) | — | ||||||||||
| Net increase in net assets from capital transactions | 3,722,950 | 1,559,715 | 412,514 | 32,825,075 | ||||||||||||
| NET INCREASE IN NET ASSETS | 3,711,827 | 1,546,156 | 402,992 | 39,538,558 | ||||||||||||
| NET ASSETS: | ||||||||||||||||
| Beginning of the period | — | — | — | — | ||||||||||||
| End of the period | $ | 3,711,827 | $ | 1,546,156 | $ | 402,992 | $ | 39,538,558 | ||||||||
| SHARES TRANSACTIONS | ||||||||||||||||
| Subscriptions - ETF | — | — | — | 1,475,000 | ||||||||||||
| Subscriptions – Institutional Class | 77,106 | 24,097 | — | — | ||||||||||||
| Subscriptions – Investor Class | 110,635 | 57,177 | 21,468 | — | ||||||||||||
| Redemptions – Investor Class | — | (148 | ) | (10 | ) | — | ||||||||||
| Total increase in shares outstanding | 187,741 | 81,126 | 21,458 | 1,475,000 | ||||||||||||
| (a) | Inception date of the Fund was June 28, 2024. |
| (b) | Inception date of the Fund was November 30, 2023. |
The accompanying notes are an integral part of these financial statements.
18
Statements of Changes in Net Assets
| SP Funds S&P World (ex-US) ETF | ||||
| Period ended October 31, 2024(c) | ||||
| OPERATIONS: | ||||
| Net investment income | $ | 154,085 | ||
| Net realized loss | (99,934 | ) | ||
| Net change in unrealized appreciation | 2,023,786 | |||
| Net increase in net assets from operations | 2,077,937 | |||
| DISTRIBUTIONS TO SHAREHOLDERS: | ||||
| Distributions to shareholders | (183,813 | ) | ||
| Total distributions to shareholders | (183,813 | ) | ||
| CAPITAL TRANSACTIONS: | ||||
| Subscriptions - ETF | 24,693,858 | |||
| ETF transaction fees (See Note 8) | 5,408 | |||
| Net increase in net assets from capital transactions | 24,699,266 | |||
| NET INCREASE IN NET ASSETS | 26,593,390 | |||
| NET ASSETS: | ||||
| Beginning of the period | — | |||
| End of the period | $ | 26,593,390 | ||
| SHARES TRANSACTIONS | ||||
| Subscriptions - ETF | 1,175,000 | |||
| Total increase in shares outstanding | 1,175,000 | |||
| (c) | Inception date of the Fund was December 19, 2023. |
19
Financial Highlights
| SP Funds 2030 Target Date Fund | Institutional Class | |
| For a Share Outstanding throughout the period presented. | ||
| Period ended October 31, 2024(a) | ||
| PER SHARE DATA: | ||
| Net asset value, beginning of period | $19.95 | |
| INVESTMENT OPERATIONS: | ||
| Net investment income(b)(c) | 0.03 | |
| Net realized and unrealized gain (loss) on investments(d) | (0.19) | |
| Total from investment operations | (0.16) | |
| LESS DISTRIBUTIONS FROM: | ||
| Total distributions | — | |
| Net asset value, end of period | $19.79 | |
| TOTAL RETURN(e) | -0.80% | |
| SUPPLEMENTAL DATA AND RATIOS: | ||
| Net assets, end of year or period (in thousands) | $1,526 | |
| Ratio of expenses to average net assets(f)(g) | 0.45% | |
| Ratio of net investment income to average net assets(f)(g) | 0.96% | |
| Portfolio turnover rate(e) | 13% |
| (a) | Inception date of the Class was August 29, 2024. |
| (b) | Net investment income per share has been calculated based on average shares outstanding during the period. |
| (c) | Recognition of net investment income by the Fund is affected by the timing of the declaration of dividends by the underlying exchange traded funds in which the Fund invests. The ratio does not include net investment income of the exchange traded funds in which the Fund invests. |
| (d) | Realized and unrealized gains and losses per share in the caption are balancing amounts necessary to reconcile the change in net asset value per share for the period, and may not reconcile with the aggregate gains and losses in the Statements of Operations due to share transactions for the period. |
| (e) | Not annualized for periods less than one year. |
| (f) | Annualized for periods less than one year. |
| (g) | These ratios exclude the impact of expenses of the underlying exchange traded funds as represented in the Schedule of Investments. Recognition of net investment income by the Fund is affected by the timing of the underlying exchange traded funds in which the Fund invests. |
| SP Funds 2030 Target Date Fund | Investor Class | |
| For a Share Outstanding throughout the period presented. | ||
| Period ended October 31, 2024(a) | ||
| PER SHARE DATA: | ||
| Net asset value, beginning of period | $20.00 | |
| INVESTMENT OPERATIONS: | ||
| Net investment income(b)(c) | 0.07 | |
| Net realized and unrealized gain (loss) on investments(d) | (0.31) | |
| Total from investment operations | (0.24) | |
| LESS DISTRIBUTIONS FROM: | ||
| Total distributions | — | |
| Net asset value, end of year | $19.76 | |
| TOTAL RETURN(e) | -1.20% | |
| SUPPLEMENTAL DATA AND RATIOS: | ||
| Net assets, end of period (in thousands) | $2,186 | |
| Ratio of expenses to average net assets(f)(g) | 0.85% | |
| Ratio of net investment income to average net assets(f)(g) | 0.96% | |
| Portfolio turnover rate(e) | 13% |
The accompanying notes are an integral part of these financial statements.
20
| (a) | Inception date of the Fund was June 28, 2024. |
| (b) | Net investment income per share has been calculated based on average shares outstanding during the period. |
| (c) | Recognition of net investment income by the Fund is affected by the timing of the declaration of dividends by the underlying exchange traded funds in which the Fund invests. The ratio does not include net investment income of the exchange traded funds in which the Fund invests. |
| (d) | Realized and unrealized gains and losses per share in the caption are balancing amounts necessary to reconcile the change in net asset value per share for the period, and may not reconcile with the aggregate gains and losses in the Statements of Operations due to share transactions for the period. |
| (e) | Not annualized for periods less than one year. |
| (f) | Annualized for periods less than one year. |
| (g) | These ratios exclude the impact of expenses of the underlying exchange traded funds as represented in the Schedule of Investments. Recognition of net investment income by the Fund is affected by the timing of the underlying exchange traded funds in which the Fund invests. |
| Financial Highlights | ||
| SP Funds 2040 Target Date Fund | Institutional Class | |
| For a Share Outstanding throughout the period presented. | ||
| Period ended October 31, 2024(a) | ||
| PER SHARE DATA: | ||
| Net asset value, beginning of period | $19.25 | |
| INVESTMENT OPERATIONS: | ||
| Net investment income(b)(c) | 0.01 | |
| Net realized and unrealized gain (loss) on investments(d) | (0.19) | |
| Total from investment operations | (0.18) | |
| LESS DISTRIBUTIONS FROM: | ||
| Total distributions | — | |
| Net asset value, end of period | $19.07 | |
| TOTAL RETURN(e) | -0.93% | |
| SUPPLEMENTAL DATA AND RATIOS: | ||
| Net assets, end of period (in thousands) | $459 | |
| Ratio of expenses to average net assets(f)(g) | 0.45% | |
| Ratio of net investment income to average net assets(f)(g) | 0.20% | |
| Portfolio turnover rate(e) | —% |
| (a) | Inception date of the Class was August 29, 2024. |
| (b) | Net investment income per share has been calculated based on average shares outstanding during the period. |
| (c) | Recognition of net investment income by the Fund is affected by the timing of the declaration of dividends by the underlying exchange traded funds in which the Fund invests. The ratio does not include net investment income of the exchange traded funds in which the Fund invests. |
| (d) | Realized and unrealized gains and losses per share in the caption are balancing amounts necessary to reconcile the change in net asset value per share for the period, and may not reconcile with the aggregate gains and losses in the Statements of Operations due to share transactions for the period. |
| (e) | Not annualized for periods less than one year. |
| (f) | Annualized for periods less than one year. |
| (g) | These ratios exclude the impact of expenses of the underlying exchange traded funds as represented in the Schedule of Investments. Recognition of net investment income by the Fund is affected by the timing of the underlying exchange traded funds in which the Fund invests. |
| SP Funds 2040 Target Date Fund | Investor Class | |
| For a Share Outstanding throughout the period presented. | ||
| Period ended October 31, 2024(a) | ||
| PER SHARE DATA: | ||
| Net asset value, beginning of period | $20.00 | |
| INVESTMENT OPERATIONS: | ||
| Net investment income(b)(c) | 0.00(d) | |
| Net realized and unrealized gain on investments(e) | (0.94) | |
| Total from investment operations | (0.94) |
21
| SP Funds 2040 Target Date Fund | Investor Class | |
| For a Share Outstanding throughout the period presented. | ||
| Period ended October 31, 2024(a) | ||
| LESS DISTRIBUTIONS FROM: | ||
| Total distributions | — | |
| Net asset value, end of period | $19.06 | |
| TOTAL RETURN(f) | -4.70% | |
| SUPPLEMENTAL DATA AND RATIOS: | ||
| Net assets, end of period (in thousands) | $1,087 | |
| Ratio of expenses to average net assets(g)(h) | 0.85% | |
| Ratio of net investment income to average net assets(g)(h) | 0.04% | |
| Portfolio turnover rate(f) | —% |
| (a) | Inception date of the Fund was June 28, 2024. |
| (b) | Net investment income per share has been calculated based on average shares outstanding during the period. |
| (c) | Recognition of net investment income by the Fund is affected by the timing of the declaration of dividends by the underlying exchange traded funds in which the Fund invests. The ratio does not include net investment income of the exchange traded funds in which the Fund invests. |
| (d) | Represents less than $0.005 per share. |
| (e) | Realized and unrealized gains and losses per share in the caption are balancing amounts necessary to reconcile the change in net asset value per share for the period, and may not reconcile with the aggregate gains and losses in the Statements of Operations due to share transactions for the period. |
| (f) | |
| Not annualized for periods less than one year. | |
| (g) | Annualized for periods less than one year. |
| (h) | These ratios exclude the impact of expenses of the underlying exchange traded funds as represented in the Schedule of Investments. Recognition of net investment income by the Fund is |
| affected by the timing of the underlying exchange traded funds in which the Fund invests. |
| Financial Highlights | ||
| SP Funds 2050 Target Date Fund | Investor Class | |
| For a Share Outstanding throughout the period presented. | ||
| Period ended October 31, 2024(a) | ||
| PER SHARE DATA: | ||
| Net asset value, beginning of period | $20.00 | |
| INVESTMENT OPERATIONS: | ||
| Net investment income(b)(c) | (0.01) | |
| Net realized and unrealized gain (loss) on investments(d) | (1.21) | |
| Total from investment operations | (1.22) | |
| LESS DISTRIBUTIONS FROM: | ||
| Total distributions | — | |
| Net asset value, end of period | $18.78 | |
| TOTAL RETURN(e) | -6.10% | |
| SUPPLEMENTAL DATA AND RATIOS: | ||
| Net assets, end of period (in thousands) | $403 | |
| Ratio of expenses to average net assets(f)(g) | 0.85% | |
| Ratio of net investment income to average net assets(f)(g) | -0.09% | |
| Portfolio turnover rate(e) | 12% |
| (a) | Inception date of the Fund was June 28, 2024. |
| (b) | Net investment income per share has been calculated based on average shares outstanding during the period. |
| (c) | Recognition of net investment income by the Fund is affected by the timing of the declaration of dividends by the underlying exchange traded funds in which the Fund invests. The ratio does not include net investment income of the exchange traded funds in which the Fund invests. |
| (d) | Realized and unrealized gains and losses per share in the caption are balancing amounts necessary to reconcile the change in net asset value per share for the period, and may not reconcile with the aggregate gains and losses in the Statements of Operations due to share transactions for the period. |
| (e) | Not annualized for periods less than one year. |
| (f) | Annualized for periods less than one year. |
| (g) | These ratios exclude the impact of expenses of the underlying exchange traded funds as represented in the Schedule of Investments. Recognition of net investment income by the Fund is affected by the timing of the underlying exchange traded funds in which the Fund invests. |
22
Financial Highlights
SP Funds S&P Global Technology ETF
| For a Share Outstanding throughout the period presented. | ||
| Period ended October 31, 2024(a) | ||
| PER SHARE DATA: | ||
| Net asset value, beginning of period | $20.00 | |
| INVESTMENT OPERATIONS: | ||
| Net investment income(b) | 0.06 | |
| Net realized and unrealized gain (loss) on investments(c) | 6.81 | |
| Total from investment operations | 6.87 | |
| LESS DISTRIBUTIONS FROM: | ||
| Net investment income | (0.06) | |
| Total distributions | (0.06) | |
| ETF transaction fees per share | 0.00(d) | |
| Net asset value, end of period | $26.81 | |
| TOTAL RETURN(e) | 34.34% | |
| SUPPLEMENTAL DATA AND RATIOS: | ||
| Net assets, end of period (in thousands) | $39,539 | |
| Ratio of expenses to average net assets(f) | 0.55%(g) | |
| Ratio of net investment income to average net assets(f) | 0.25% | |
| Portfolio turnover rate(e)(h) | 15% |
| (a) | Inception date of the Fund was November 30, 2023. |
| (b) | Net investment income per share has been calculated based on average shares outstanding during the period. |
| (c) | Realized and unrealized gains and losses per share in the caption are balancing amounts necessary to reconcile the change in net asset value per share for the period, and may not reconcile with the aggregate gains and losses in the Statements of Operations due to share transactions for the period. |
| (d) | Amount represents less than $0.005 per share. |
| (e) | Not annualized for periods less than one year. |
| (f) | Annualized for periods less than one year. |
| (g) | The ratio of expense to average net assets includes tax expense. The expense ratio excluding tax expense is 0.55% for the period ended October 31, 2024. |
| (h) | Portfolio turnover rate excludes in-kind transactions. |
| Financial Highlights | ||
| SP Funds S&P World (ex-US) ETF | ||
| For a Share Outstanding throughout the period presented. | ||
| Period ended October 31, 2024(a) | ||
| PER SHARE DATA: | ||
| Net asset value, beginning of period | $20.00 | |
| INVESTMENT OPERATIONS: | ||
| Net investment income(b) | 0.21 | |
| Net realized and unrealized gain on investments(c) | 2.63 | |
| Total from investment operations | 2.84 | |
| LESS DISTRIBUTIONS FROM: | ||
| Net investment income | (0.22) | |
| Total distributions | (0.22) | |
| ETF transaction fees per share | 0.01 | |
| Net asset value, end of period | $22.63 | |
| TOTAL RETURN(d) | 14.31% | |
| SUPPLEMENTAL DATA AND RATIOS: | ||
| Net assets, end of period (in thousands) | $26,593 | |
| Ratio of expenses to average net assets(e) | 0.55%(f) | |
| Ratio of net investment income to average net assets(e) | 1.11% | |
| Portfolio turnover rate(d)(g) | 30% |
23
| (a) | Inception date of the Fund was December 19, 2023. |
| (b) | Net investment income per share has been calculated based on average shares outstanding during the period. |
| (c) | Realized and unrealized gains and losses per share in the caption are balancing amounts necessary to reconcile the change in net asset value per share for the period, and may not reconcile with the aggregate gains and losses in the Statements of Operations due to share transactions for the period. |
| (d) | Not annualized for periods less than one year. |
| (e) | Annualized for periods less than one year. |
| (f) | The ratio of expenses to average net assets includes tax expense. The expense ratio excluding tax expense is 0.55% for the period ended October 31, 2024. |
| (g) | Portfolio turnover rate excludes in-kind transactions. |
24
| NOTE 1 – ORGANIZATION |
SP Funds Trust (the “Trust”) consists of five series, SP Funds 2030 Target Date Fund (the “2030 Target Date Fund”), SP Funds 2040 Target Date Fund (the “2040 Target Date Fund”), SP Funds 2050 Target Date Fund (the “2050 Target Date Fund”), SP Funds S&P Global Technology ETF (the “Global Technology ETF”) and SP Funds S&P World (ex-US) ETF (the “World ETF”), (each a “Fund”, and collectively, the “Funds”). The Funds are all a non-diversified series of the Trust. The Trust was organized as a Delaware statutory trust on July 6, 2023, and is registered with the SEC under the Investment Company Act of 1940, as amended (the “1940 Act”), as an open- end management investment company and the offering of each Fund’s shares (“Shares”) is registered under the Securities Act of 1933, as amended. The Trust is governed by the Board of Trustees (the “Board”). ShariaPortfolio, Inc. (the “Adviser”) serves as investment adviser to the Funds and Tidal Investments LLC (“Tidal Investments” or “Sub-Adviser”) serves as sub-adviser to the Funds. Each Fund is an investment company and accordingly follows the investment company accounting and reporting guidance of the Financial Accounting Standards Board (“FASB”) Accounting Standards Codification Topic 946 “Financial Services—Investment Companies.” Please see the table below for a summary of commencement and class specific information:
| Ticker | Commencement of Operations | 12b-1 Fees | Shareholder Servicing Fees | |
| 2030 Target Date Fund | ||||
| Investor Class | SPTAX | 06/28/2024 | 0.25% | 0.15% |
| Institutional Class | SPTMX | 08/29/2024 | N/A | N/A |
| 2040 Target Date Fund | ||||
| Investor Class | SPTBX | 06/28/2024 | 0.25% | 0.15% |
| Institutional Class | SPTNX | 08/29/2024 | N/A | N/A |
| 2050 Target Date Fund | ||||
| Investor Class | SPTCX | 06/28/2024 | 0.25% | 0.15% |
| Institutional Class | SPTOX | N/A | N/A | N/A |
| Global Technology ETF | ||||
| SPTE | 11/30/2023 | N/A | N/A | |
| World ETF | ||||
| SPWO | 12/19/2023 | N/A | N/A |
The investment objective of the 2030 Target Date Fund, 2040 Target Date Fund, and 2050 Target Date Fund is to seek a high level of total return through its target date. Thereafter, the Fund primarily seeks high current income and secondarily capital appreciation. The investment objective of the Global Technology ETF is to seek to track the performance, before fees and expenses, of the S&P Global 1200 Shariah Information Technology Capped Index (the “Shariah Technology Index”). The investment objective of the World ETF is to seek to track the performance, before fees and expenses, of the S&P DM Ex-U.S. & EM 50/50 Shariah Index (the “Shariah World Index”).
| NOTE 2 – SIGNIFICANT ACCOUNTING POLICIES |
The following is a summary of significant accounting policies consistently followed by the Funds. These policies are in conformity with accounting principles generally accepted in the United States of America (“GAAP”).
| A. | Security Valuation. Equity securities, listed on a securities exchange, market or automated quotation system for which quotations are readily available (except for securities traded on Nasdaq Stock Market, LLC (the “NASDAQ”)), including securities traded over-the-counter, are valued at the last quoted sale price on the primary exchange or market (foreign or domestic) on which they are traded on the valuation date (or at approximately 4:00 p.m. EST if a security’s primary exchange is normally open at that time), or, if there is no such reported sale on the valuation date, at the most recent quoted bid price or mean between the most recent quoted bid and ask prices for long and short positions. For a security that trades on multiple exchanges, the primary exchange will generally be considered the exchange on which the security is generally most actively traded. For securities traded on NASDAQ, the NASDAQ Official Closing Price will be used. Prices of securities traded on the securities exchange will be obtained from recognized independent pricing agents each day that the Funds are open for business. |
Under Rule 2a-5 of the 1940 Act, a fair value will be determined for securities for which quotations are not readily available by the Valuation Designee (as defined in Rule 2a-5) in accordance with the Pricing and Valuation Policy and Fair Value Procedures, as applicable, of the Adviser, subject to oversight by the Board. When a security is “fair valued,” consideration is given to the facts and circumstances relevant to the particular situation, including a review of various factors set forth in the Adviser’s Pricing and Valuation Policy and Fair Value Procedures, as applicable. Fair value pricing is an inherently subjective process, and no single standard exists for determining fair value. Different funds could reasonably arrive at different values for the same security.
25
The use of fair value pricing by a fund may cause the net asset value (“NAV”) of its shares to differ significantly from the NAV that would be calculated without regard to such considerations.
As described above, the Funds utilize various methods to measure the fair value of their investments on a recurring basis. GAAP establishes a hierarchy that prioritizes inputs to valuation methods. The three levels of inputs are:
| Level 1 – | Unadjusted quoted prices in active markets for identical assets or liabilities that the Funds have the ability to access. |
| Level 2 – | Observable inputs other than quoted prices included in Level 1 that are observable for the asset or liability, either directly or indirectly. These inputs may include quoted prices for the identical instrument on an inactive market, prices for similar instruments, interest rates, prepayment speeds, credit risk, yield curves, default rates and similar data. |
| Level 3 – | Unobservable inputs for the asset or liability, to the extent relevant observable inputs are not available; representing the Funds’ own assumptions about the assumptions a market participant would use in valuing the asset or liability and would be based on the best information available. |
The availability of observable inputs can vary from security to security and is affected by a wide variety of factors, including, for example, the type of security, whether the security is new and not yet established in the marketplace, the liquidity of markets, and other characteristics particular to the security. To the extent that valuation is based on models or inputs that are less observable or unobservable in the market, the determination of fair value requires more judgment. Accordingly, the degree of judgment exercised in determining fair value is greatest for instruments categorized in Level 3.
The inputs used to measure fair value may fall into different levels of the fair value hierarchy. In such cases, for disclosure purposes, the level in the fair value hierarchy within which the fair value measurement falls in its entirety, is determined based on the lowest level input that is significant to the fair value measurement in its entirety.
The following is a summary of the inputs used to value each Fund’s investments as of October 31, 2024:
| SP Funds 2030 Target Date Fund | ||||||||||||||||
| Level 1 | Level 2 | Level 3 | Total | |||||||||||||
| Assets: | ||||||||||||||||
| Exchange Traded Funds | $ | 3,370,793 | $ | — | $ | — | $ | 3,370,793 | ||||||||
| Total Assets | $ | 3,370,793 | $ | — | $ | — | $ | 3,370,793 | ||||||||
| SP Funds 2040 Target Date Fund | ||||||||||||||||
| Level 1 | Level 2 | Level 3 | Total | |||||||||||||
| Assets: | ||||||||||||||||
| Exchange Traded Funds | $ | 1,481,524 | $ | — | $ | — | $ | 1,481,524 | ||||||||
| Total Assets | $ | 1,481,524 | $ | — | $ | — | $ | 1,481,524 | ||||||||
| SP Funds 2050 Target Date Fund | ||||||||||||||||
| Level 1 | Level 2 | Level 3 | Total | |||||||||||||
| Assets: | ||||||||||||||||
| Exchange Traded Funds | $ | 387,545 | $ | — | $ | — | $ | 387,545 | ||||||||
| Total Assets | $ | 387,545 | $ | — | $ | — | $ | 387,545 | ||||||||
| SP Funds S&P Global Technology ETF | ||||||||||||||||
| Level 1 | Level 2 | Level 3 | Total | |||||||||||||
| Assets: | ||||||||||||||||
| Common Stocks | $ | 39,115,330 | $ | — | $ | — | $ | 39,115,330 | ||||||||
| Total Assets | $ | 39,115,330 | $ | — | $ | — | $ | 39,115,330 | ||||||||
| SP Funds S&P World (ex-US) ETF | ||||||||||||||||
| Level 1 | Level 2 | Level 3 | Total | |||||||||||||
| Assets: | ||||||||||||||||
| Common Stocks | $ | 26,418,561 | $ | 40,628 | $ | — | $ | 26,459,189 | ||||||||
| Real Estate Investment Trusts | 103,264 | — | — | 103,264 | ||||||||||||
| Preferred Stocks | 24,111 | — | — | 24,111 | ||||||||||||
| Total Assets | $ | 26,545,936 | $ | 40,628 | $ | — | $ | 26,586,564 | ||||||||
Refer to the Schedule of Investments for industry classifications.
26
| B. | Federal Income Taxes. Each Fund has elected to be taxed as a “regulated investment company” as defined in Subtitle A, Chapter 1, Subchapter M of the Internal Revenue Code, as amended. No provision has been made for federal income taxes as it is the intention of the Funds to comply with the provisions of the Code applicable to regulated investment companies and to make distributions of income and realized gains sufficient to relieve it from all or substantially all excise and income taxes. |
In order to avoid imposition of the excise tax applicable to regulated investment companies, the Funds intend to declare as dividends in each calendar year at least 98 .0% of their net investment income (earned during the calendar year) and at least 98.2% of their net realized capital gains (earned during the twelve months ended October 31) plus undistributed amounts, if any, from prior years. As a registered investment company, the Funds are subject to a 4% excise tax that is imposed if the Funds do not distribute by the end of any calendar year at least the sum of (i) 98% of its ordinary income (not taking into account any capital gain or loss) for the calendar year and (ii) 98 .2% of its capital gain in excess of its capital loss (adjusted for certain ordinary losses) for a one year period generally ending on October 31 of the calendar year (unless an election is made to use the fund’s fiscal year) . The Funds generally intend to distribute income and capital gains in the manner necessary to minimize (but not necessarily eliminate) the imposition of such excise tax. The Funds may retain income or capital gains and pay excise tax when it is determined that doing so is in the best interest of shareholders. Management, in consultation with the Board, evaluates the costs of the excise tax relative to the benefits of retaining income and capital gains, including that such undistributed amounts (net of the excise tax paid) remain available for investment by the Funds and are available to supplement future distributions. Tax expense is disclosed in the Statements of Operations, if applicable.
As of October 31, 2024, the Funds did not have any tax positions that did not meet the threshold of being sustained by the applicable tax authority. Generally, tax authorities can examine all the tax returns filed for the last three years. The Funds identify their major tax jurisdiction as U.S. Federal and the Commonwealth of Delaware; however, the Funds are not aware of any tax positions for which it is reasonably possible that the total amounts of unrecognized tax benefits will change materially.
| C. | Securities Transactions and Investment Income. Investment securities transactions are accounted for on the trade date. Gains and losses realized on sales of securities are determined on a specific identification basis. Discounts/premiums on debt securities purchased are accreted/amortized over the life of the respective securities using the effective interest method. Dividend income is recorded on the ex-dividend date. Dividends received from REITs generally are comprised of ordinary income, capital gains, and may include return of capital. Debt income is recorded on an accrual basis. Other non-cash dividends are recognized as investment income at the fair value of the property received. Withholding taxes on foreign dividends have been provided for in accordance with the Funds’ understanding of the applicable country’s tax rules and rates. |
| D. | Foreign Currency. Investment securities and other assets and liabilities denominated in foreign currencies are translated into U.S. dollar amounts at the date of valuation. Purchases and sales of investment securities and income and expense items denominated in foreign currencies are translated into U.S. dollar amounts on the respective dates of such transactions. |
The Funds do not isolate that portion of the results of operations resulting from changes in foreign exchange rates on investments from the fluctuations arising from changes in market prices of securities held. Such fluctuations are included with the net realized and unrealized gain or loss from investments.
The Funds report net realized foreign exchange gains or losses that arise from sales of foreign currencies, currency gains or losses realized between the trade and settlement dates on securities transactions, and the difference between the amounts of dividends, interest, and foreign withholding taxes recorded on the Funds’ books and the U.S. dollar equivalent of the amounts actually received or paid. Net unrealized foreign exchange gains and losses arise from changes in the fair values of assets and liabilities, other than investments in securities at period end, resulting from changes in exchange rates.
| E. | Distributions to Shareholders. Distributions to shareholders from net investment income, if any, for the Funds are declared and paid at least monthly. Distributions to shareholders from net realized gains on securities, if any, for the Funds normally are declared and paid on an annual basis. Distributions are recorded on the ex-dividend date. |
| F. | Use of Estimates. The preparation of financial statements in conformity with GAAP requires management to make estimates and assumptions that affect the reported amounts of assets and liabilities and disclosure of contingent assets and liabilities at the date of the financial statements. Actual results could differ from those estimates. |
| G. | Share Valuation. The NAV per share of each Fund is calculated by dividing the sum of the value of the securities held by the Fund, plus cash or other assets, minus all liabilities by the total number of shares outstanding for the Fund, rounded to the nearest cent. The Funds’ shares will not be priced on the days on which the New York Stock Exchange (“NYSE”) is closed for trading. |
| H. | Guarantees and Indemnifications. In the normal course of business, the Funds enter into contracts that contain a variety of representations which provide general indemnifications. The Funds’ maximum exposure under these arrangements cannot be known; however, the Funds expect the risk of loss to be remote. |
27
| I. | Cash. Cash includes non-interest bearing and non-restricted cash with one institution. |
| J. | Illiquid Securities. Pursuant to Rule 22e-4 under the 1940 Act, the Funds have adopted a Board-approved Liquidity Risk Management Program (the “Program”) that requires, among other things, that each Fund limit its illiquid investments that are assets to no more than 15% of the value of the Fund’s net assets. An illiquid investment is any investment that a Fund reasonably expects cannot be sold or disposed of in current market conditions in seven calendar days or less without the sale or disposition significantly changing the market value of the investment. If a Fund should be in a position where the value of illiquid investments held by the Fund exceeds 15% of the Fund’s net assets, the Fund will take such steps as set forth in the Program. |
| K. | Reclassification of Capital Accounts. Accounting principles generally accepted in the United States of America require that certain components of net assets relating to permanent differences be reclassified between financial and tax reporting. These reclassifications have no effect on net assets or net asset value per share. These differences are primarily due to excise tax and distributions in excess. For the period ended October 31, 2024, the following adjustments were made: |
| Fund | Paid-In Capital | Total Distributable Earnings/(Accumulated Losses) |
| 2030 Target Date Fund | $— | $— |
| 2040 Target Date Fund | — | — |
| 2050 Target Date Fund | — | — |
| Global Technology ETF | (57) | 57 |
| World ETF | (4,409) | 4,409 |
| L. | Organizational and Offering Costs. All organizational and offering costs for the Trust and the Funds will be borne by the Adviser. The Trust and the Funds do not have an obligation to reimburse the Adviser for organization and offering costs paid on their behalf. |
| NOTE 3 – PRINCIPAL INVESTMENT RISKS |
| A. | Concentration Risk (only applicable to the World ETF). Each Fund’s investments will be concentrated in an industry or group of industries to the extent the Index is so concentrated. Accordingly, the value of shares of the Funds may rise and fall more than the value of shares that invest in securities of companies in a broader range of industries. |
| B. | Currency Risk. Because the Funds’ NAVs are determined in U.S. dollars, the Funds’ NAVs could decline if the currency of a non-U.S. market in which the Funds invest depreciates against the U.S. dollar or if there are delays or limits on repatriation of such currency. Currency exchange rates can be very volatile and can change quickly and unpredictably. As a result, the Funds’ NAVs may change quickly and without warning. |
| C. | Emerging Markets Risk. Investments in emerging market securities impose risks different from, or greater than, risks of investing in foreign developed countries, including smaller market capitalization; significant price volatility; and restrictions on foreign investment. Emerging market countries may have relatively unstable governments and may present the risk of nationalization of businesses, expropriation, and confiscatory taxation, or, in certain instances, reversion to closed market, centrally planned economies. Emerging market economies may also experience more severe downturns. The currencies of emerging market countries may experience significant declines against the U.S. dollar, and devaluation may occur subsequent to investments in these currencies by the Funds. Inflation and rapid fluctuations in inflation rates have had, and may continue to have, negative effects on the economies and securities markets of certain emerging market countries. In addition, less information may be available about companies in emerging markets than in developed markets because such emerging markets companies may not be subject to accounting, auditing and financial reporting standards or to other regulatory practices required by U.S. companies which may lead to potential errors in index data, index computation and/or index construction. Such conditions may impact the ability of the Funds to buy, sell or otherwise transfer securities; adversely affect the trading market and price for such securities; and/or cause the Funds to decline in value. |
| D. | Equity Securities Risk. Equity securities are subject to changes in value, and their values may be more volatile than those of other assets classes. The Index is composed of common stocks, which generally subject their holders to more risks than preferred stocks and debt securities because common stockholders’ claims are subordinated to those of holders of preferred stocks and debt securities upon the bankruptcy of the issuer. |
| E. | Exchange Traded Fund (“ETF”) Risks (only applicable to the ETFs). |
| • | Authorized Participants, Market Makers, and Liquidity Providers Concentration Risk. The Funds have a limited number of financial institutions that are authorized to purchase and redeem shares of the Funds (“Shares”) directly from the Funds (known as “Authorized Participants” or “APs”). In addition, there may be a limited number of market makers and/or liquidity providers in the marketplace. To the extent either of the following events occur, Shares may trade at a material discount to NAV and possibly face delisting: (i) APs exit the business or otherwise become unable to process creation and/or redemption orders and no other APs step forward to perform these services; or (ii) market makers and/or liquidity providers exit the business or significantly reduce their business activities and no other entities step forward to perform their functions. |
28
| • | Cash Redemption Risk. Each Fund’s investment strategy may require it to redeem Shares for cash or to otherwise include cash as part of its redemption proceeds. For example, the Fund may not be able to redeem in-kind certain securities held by the Fund. In such a case, the Fund may be required to sell or unwind portfolio investments to obtain the cash needed to distribute redemption proceeds. This may cause the Fund to recognize a capital gain that it might not have recognized if it had made a redemption in-kind. As a result, the Fund may pay out higher annual capital gain distributions than if the in-kind redemption process was used. Additionally, purchases and redemptions of Shares for cash may cause the Fund to incur brokerage costs and those costs could be imposed on the Funds, thus decreasing the Funds’ NAV to the extent that the costs are not offset by a transaction fee payable by an authorized participant. |
| • | Costs of Buying or Selling Shares. Due to the costs of buying or selling Shares, including brokerage commissions imposed by brokers and bid-ask spreads, frequent trading of Shares of the Funds may significantly reduce investment results and an investment in shares of the Funds may not be advisable for investors who anticipate regularly making small investments. |
| • | Shares May Trade at Prices Other Than NAV. As with all ETFs, Shares may be bought and sold in the secondary market at market prices. Although it is expected that the market price of Shares will approximate a Fund’s NAV, there may be times when the market price of Shares is more than the NAV intra-day (premium) or less than the NAV intra-day (discount) due to supply and demand of Shares or during periods of market volatility. This risk is heightened in times of market volatility, periods of steep market declines, and periods when there is limited trading activity for Shares in the secondary market, in which case such premiums or discounts may be significant. Because securities held by the Funds may trade on foreign exchanges that are closed when the Fund’s primary listing exchange is open, the Fund is likely to experience premiums and discounts greater than those of ETFs holding only domestic securities. |
| • | Trading. Although Shares are listed on a national securities exchange, such as the NYSE Arca, Inc. (the “Exchange”), and may be traded on U.S. exchanges other than the Exchange, there can be no assurance that Shares will trade with any volume, or at all, on any stock exchange. In stressed market conditions, the liquidity of Shares may begin to mirror the liquidity of the Funds’ underlying portfolio holdings, which can be significantly less liquid than Shares. Also, in stressed market conditions, the market for Shares may become less liquid in response to deteriorating liquidity in the markets for the Fund’s underlying portfolio holdings. These adverse effects on liquidity for Shares, in turn, could lead to wider bid/ask spreads and differences between the market price of Shares and the underlying value of those Shares. |
| F. | Foreign Securities Risks. Certain foreign countries may impose exchange control regulations, restrictions on repatriation of profit on investments or of capital invested, local taxes on investments, and restrictions on the ability of issuers of non-U.S. securities to make payments of principal and interest to investors located outside the country, whether from currency blockage or otherwise. In addition, the Funds will be subject to risks associated with adverse political and economic developments in foreign countries, including seizure or nationalization of foreign deposits, the imposition of economic sanctions, different legal systems and laws relating to bankruptcy and creditors’ rights, and the potential inability to enforce legal judgments, all of which could cause the Funds to lose money on their investments in non-U.S. securities. The cost of servicing external debt will also generally be adversely affected by rising international interest rates, as many external debt obligations bear interest at rates which are adjusted based upon international interest rates. Because non-U.S. securities may trade on days when Shares are not priced, NAVs may change at times when Shares cannot be sold. |
| G. | General Market Risk. Securities markets and individual securities may increase or decrease in value. Security prices may fluctuate widely over short or extended periods in response to market or economic news and conditions, and securities markets also tend to move in cycles. If there is a general decline in the securities markets, it is possible your investment may lose value regardless of the individual results of the companies in which the Funds invest. The magnitude of up and down price or market fluctuations over time is sometimes referred to as “volatility,” and it can be significant. In addition, different asset classes and geographic markets may experience periods of significant correlation with each other. As a result of this correlation, the securities and markets in which the Funds invest may experience volatility due to market, economic, political or social events and conditions that may not readily appear to directly relate to such securities, the securities’ issuer or the markets in which they trade. |
| H. | Geographic Investment Risk. To the extent the Funds invest a significant portion of their assets in the securities of companies of a single country or region, they are more likely to be impacted by events or conditions affecting that country or region. |
| I. | Large-Capitalization Companies Risk. Large-capitalization companies may be less able than smaller capitalization companies to adapt to changing market conditions. Large-capitalization companies may be more mature and subject to more limited growth potential compared with smaller capitalization companies. During different market cycles, the performance of large capitalization companies has trailed the overall performance of the broader securities markets. |
29
| J. | Models and Data Risk. The composition of the Shariah World Index and Shariah Technology Index (each an “Index”, and collectively, the “Indices”) are heavily dependent on proprietary quantitative models as well as information and data supplied by third parties (“Models and Data”). When Models and Data prove to be incorrect or incomplete, any decisions made in reliance thereon may lead to the inclusion or exclusion of securities from the Index universe that would have been excluded or included had the Models and Data been correct and complete. If the composition of the Indices reflects such errors, the Funds’ portfolio can be expected to also reflect the errors. |
| K. | Non-Diversified Fund Risk. Each fund is a non-diversified fund. In general, a non-diversified fund may invest a greater percentage of its assets in a particular issuer and may own fewer securities than other funds. Accordingly, a non-diversified fund is generally subject to the risk that a large loss in an individual security will cause a greater loss for the fund than it would if the fund was required to hold a larger number of securities or smaller positions. |
| L. | Passive Investment Risk (only applicable to the ETFs). The Funds invest in the securities included in, or representative of, its respective Index regardless of their investment merit. Each Fund does not attempt to outperform its respective Index or take defensive positions in declining markets. As a result, a Fund’s performance may be adversely affected by a general decline in the market segments relating to its Index. |
| M. | Recently Organized Fund Risk. The Funds are recently organized management investment companies with limited operating history. As a result, prospective investors have a limited track record or history on which to base their investment decision. There can be no assurance that the Funds will grow to or maintain an economically viable size. |
| N. | Sharia-Compliant Investing Risk. Islamic religious law, commonly known as “Shariah,” has certain restrictions regarding finance and commercial activities permitted for Muslims, including interest restrictions and prohibited industries, which reduces the size of the overall universe in which the Funds can invest. The strategy to reduce the investable universe may limit investment opportunities and adversely affect each Fund’s performance, especially in comparison to a more diversified fund. Because Shariah principles preclude the use of interest-paying instruments, cash reserves do not earn income. To the extent that securities become non-compliant following purchase, such securities may be held for a temporary period of time. Additionally, certain companies that meet Shariah screens may nevertheless generate dividend income that is subject to purification. |
| O. | Tracking Error Risk. As with all index funds, the performance of the Funds and its Index may differ from each other for a variety of reasons. For example, the Funds incur operating expenses and portfolio transaction costs not incurred by the Index. In addition, the Funds may not be fully invested in the securities of the Index at all times, including during its initial investment period, or may hold securities not included in the Index. |
| P. | Underlying Index Risk (only applicable to the ETFs). Neither the Adviser nor the Index Provider is able to guarantee the continuous availability or timeliness of the production of the Index. The calculation and dissemination of the Index values may be delayed if the information technology or other facilities of the Index Provider, calculation agent, data providers and/or relevant stock exchange malfunction for any reason. A significant delay may cause trading in shares of a Fund to be suspended. Errors in Index data, computation and/or the construction in accordance with its methodology may occur from time to time and may not be identified and corrected by the Index Provider, calculation agent or other applicable party for a period of time or at all, which may have an adverse impact on the Funds and their shareholders. |
| NOTE 4 – COMMITMENTS AND OTHER RELATED PARTY TRANSACTIONS |
The Adviser serves as investment adviser to the Funds pursuant to an investment advisory agreement between the Trust and the Adviser with respect to the Funds (the “Advisory Agreement”) and, pursuant to the Advisory Agreement, has overall responsibility for the general management and administration of the Funds, subject to the direction and oversight of the Board. The Adviser provides oversight of the Sub-Adviser and review of the Sub-Adviser’s performance. The Adviser is also responsible for trading portfolio securities on behalf of the Funds, including selecting broker-dealers to execute purchase and sale transactions, subject to the supervision of the Board. The Adviser provides oversight of the Sub-Adviser.
Pursuant to the Advisory Agreement, each Fund pays the Adviser a unitary management fee (the “Investment Advisory Fee”) based on the average daily net assets of the Fund as follows:
30
| Fund | Investment Advisory Fee | |
| 2030 Target Date Fund | 0.45% | |
| 2040 Target Date Fund | 0.45% | |
| 2050 Target Date Fund | 0.45% | |
| Global Technology ETF | 0.55% | |
| World ETF | 0.55% | |
Out of each Investment Advisory Fee, the Adviser is obligated to pay or arrange for the payment of substantially all expenses of the Funds, including the cost of transfer agency, custody, fund administration, and all other related services necessary for the Funds to operate. Under the Advisory Agreement, the Adviser has agreed to pay, or require the Sub-Adviser to pay, all expenses incurred by the Funds except for interest charges on any borrowings, dividends and other expenses on securities sold short, taxes, brokerage commissions and other expenses incurred in placing orders for the purchase and sale of securities and other investment instruments, acquired fund fees and expenses, accrued deferred tax liability, extraordinary expenses, distribution fees and expenses paid by the Funds under any distribution plan adopted pursuant to Rule 12b-1 under the 1940 Act (collectively, “Excluded Expenses”). The Investment Advisory Fees incurred are paid monthly to the Adviser. Investment Advisory Fees for the period ended October 31, 2024, are disclosed in the Statements of Operations.
The Sub-Adviser serves as the investment sub-adviser to the Funds, pursuant to a sub-advisory agreement between the Adviser and the Sub-Adviser with respect to the Funds (the “Sub-Advisory Agreement”) . Pursuant to the Sub -Advisory Agreement, the Sub-Adviser is responsible for ensuring the Funds follow the character of each applicable Index and providing advice with regard to the interpretation of and compliance with Sharia principles.
Pursuant to the Sub-Advisory Agreement, the Adviser pays the Sub-Adviser a fee for the services and facilities the Sub-Adviser provides (the “Sub-Advisory Fee”) based on the average daily net assets of each Fund as follows:
| Fund | Sub-Advisory Fee | |
| 2030 Target Date Fund | 0.03% | |
| 2040 Target Date Fund | 0.03% | |
| 2050 Target Date Fund | 0.03% | |
| Global Technology ETF | 0.03% | |
| World ETF | 0.03% |
The Sub-Advisory Fees incurred are paid monthly to the Sub-Adviser by the Adviser.
Tidal ETF Services LLC (“Tidal”), a Tidal Financial Group company, serves as the Funds’ administrator and, in that capacity, performs various administrative and management services for the Funds. Tidal coordinates the payment of Fund-related expenses and manages the Trust’s relationships with its various service providers.
U.S. Bancorp Fund Services, LLC, doing business as U.S. Bank Global Fund Services (“Fund Services”), serves as the Funds’ sub-administrator, fund accountant and transfer agent. In those capacities, Fund Services performs various administrative and accounting services for the Funds. Fund Services prepares various federal and state regulatory filings, reports and returns for the Funds, including regulatory compliance monitoring and financial reporting; prepares reports and materials to be supplied to the Board; and monitors the activities of the Funds’ custodian. U.S. Bank N.A. (the “Custodian”), an affiliate of Fund Services, serves as the Funds’ custodian.
Foreside Fund Services, LLC (the “Distributor”) acts as the Funds’ principal underwriter in a continuous public offering of the Funds’ shares.
The Board has adopted a Distribution (Rule 12b-1) Plan (the "Plan") pursuant to Rule 12b-1 under the 1940 Act. In accordance with the Plan, each Fund is authorized to pay an amount up to 0.25% of its Investor Class average daily net assets each year to pay distribution fees for the sale and distribution of its Shares. The Plan for the Global Technology and World ETF has not been activated, and there are no plans to impose these fees. However, in the event Rule 12b-1 fees are charged in the future, because the fees are paid out of the Funds' assets on an ongoing basis, over time these fees will increase the cost of your investment and may cost you more than certain other types of sales charges. No distribution fees are paid by Institutional Class shares.
The Funds have adopted a shareholder services plan on behalf of their Investor Class Shares. Under a shareholder services plan, the Funds’ Investor Class shares may pay an authorized firm up to 0.25% on an annualized basis of average daily net assets attributable to its customers who are shareholders. For this fee, the authorized firms may provide a variety of services, including but not limited to: (i) maintaining accounts relating to Clients that invest in Shares; (ii) arranging for bank wires; (iii) responding to Client inquiries relating to the services performed by Service Providers; (iv) responding to inquiries from Clients concerning their investment in Shares; (v) assisting Clients in changing dividend options, account designations and addresses; (vi) providing information periodically to Clients showing their position in Shares; (vii) forwarding shareholder communications from the Funds such as proxies, shareholder reports, annual reports, and dividend distribution and tax notices to Clients; (viii) processing purchase, exchange and redemption requests from Clients and placing orders with the Funds or their service providers; (ix) providing sub-accounting with respect to Shares beneficially owned by Clients; and (x) processing dividend payments from the Funds on behalf of Clients. Service Providers may also use this fee for payments to financial institutions and intermediaries such as banks, savings and loan associations, insurance companies and investment counselors, broker-dealers, mutual fund supermarkets and the Service Providers’ affiliates and subsidiaries as compensation for such services as are described herein.
31
Certain officers and trustees of the Trust are affiliated with the Adviser. Neither the affiliated trustee nor the Trust’s officers receive compensation from the Funds.
| NOTE 5 – PURCHASES AND SALES OF SECURITIES |
For the period ended October 31, 2024, the cost of purchases and proceeds from the sales or maturities of securities, excluding short- term investments, U.S. government securities, and in-kind transactions were as follows:
| Fund | Purchases | Sales | ||||||
| 2030 Target Date Fund | $ | 3,675,501 | $ | 282,297 | ||||
| 2040 Target Date Fund | 1,497,864 | — | ||||||
| 2050 Target Date Fund | 415,208 | 17,553 | ||||||
| Global Technology ETF | 5,298,907 | 4,080,911 | ||||||
| World ETF | 10,529,752 | 4,884,851 | ||||||
There were no purchases or sales of long-term U.S. Government securities for the period ended October 31, 2024.
For the period ended October 31, 2024, in-kind transactions associated with creations and redemptions for the Funds were as follows:
| Fund | Purchases | Sales | ||||||
| 2030 Target Date Fund | $ | — | $ | — | ||||
| 2040 Target Date Fund | — | — | ||||||
| 2050 Target Date Fund | — | — | ||||||
| Global Technology ETF | 31,173,428 | — | ||||||
| World ETF | 19,010,429 | — | ||||||
| NOTE 6 – TRANSACTIONS WITH AFFILIATES |
The 2030 Target Date Fund had the following investments in affiliates during the period ended October 31, 2024:
| Security Name | Market Value as of October 31, 2023 | Purchases | Purchases In-Kind | Sales | Sales In-Kind | Market Value as of October 31, 2024 | Share Balance as of October 31, 2024 | Dividends | Net Change in Unrealized Appreciation/ (Depreciation) on Affiliated Investments | Net Realized Gain/(Loss) on Affiliated Investments | ||||||||||||||||||||||||||||||
| SP Funds S&P Global Technology ETF | $ | — | $ | 362,545 | $ | — | $ | (23,258 | ) | $ | — | $ | 340,766 | 12,693 | $ | 161 | $ | 2,900 | $ | (1,421 | ) | |||||||||||||||||||
| SP Funds S&P World (ex-US) ETF | — | 183,885 | — | (12,298 | ) | — | 172,035 | 7,554 | 375 | 877 | (429 | ) | ||||||||||||||||||||||||||||
| SP Funds Dow Jones Global Sukuk ETF | — | 1,714,869 | — | (136,665 | ) | — | 1,548,340 | 85,355 | 5,150 | (27,991 | ) | (1,873 | ) | |||||||||||||||||||||||||||
| SP Funds S&P Global REIT Sharia ETF | — | 396,644 | — | (34,100 | ) | — | 349,212 | 16,862 | 2,099 | (13,297 | ) | (35 | ) | |||||||||||||||||||||||||||
| SP Funds S&P 500 Sharia Industry Exclusions ETF | — | 923,748 | — | (68,105 | ) | — | 867,655 | 21,152 | 1,064 | 14,154 | (2,142 | ) | ||||||||||||||||||||||||||||
| Total | $ | — | $ | 3,581,691 | $ | — | $ | (274,426 | ) | $ | — | $ | 3,278,008 | 143,616 | $ | 8,849 | $ | (23,357 | ) | $ | (5,900 | ) | ||||||||||||||||||
32
The 2040 Target Date Fund had the following investments in affiliates during the period ended October 31, 2024:
| Security Name | Market Value as of October 31, 2023 | Purchases | Purchases In-Kind | Sales | Sales In-Kind | Market Value as of October 31, 2024 | Share Balance as of October 31, 2024 | Dividends | Net Change in Unrealized Appreciation/ (Depreciation) on Affiliated Investments | Net Realized Gain/(Loss) on Affiliated Investments | ||||||||||||||||||||||||||||||
| SP Funds S&P Global Technology ETF | $ | — | $ | 586,079 | $ | — | $ | — | $ | — | $ | 576,777 | 21,484 | $ | 229 | $ | (9,302 | ) | $ | — | ||||||||||||||||||||
| SP Funds S&P World (ex-US) ETF | — | 151,534 | — | — | — | 149,307 | 6,556 | 274 | (2,227 | ) | — | |||||||||||||||||||||||||||||
| SP Funds S&P 500 Sharia Industry Exclusions ETF | — | 603,850 | — | — | — | 602,461 | 14,687 | 622 | (1,389 | ) | — | |||||||||||||||||||||||||||||
| SP Funds Dow Jones Global Sukuk ETF | — | 78,186 | — | — | — | 77,222 | 4,257 | 217 | (964 | ) | — | |||||||||||||||||||||||||||||
| SP Funds S&P Global REIT Sharia ETF | — | 78,215 | — | — | — | 75,757 | 3,658 | 388 | (2,458 | ) | — | |||||||||||||||||||||||||||||
| Total | $ | — | $ | 1,497,864 | $ | — | $ | — | $ | — | $ | 1,481,524 | 50,642 | $ | 1,730 | $ | (16,340 | ) | $ | — | ||||||||||||||||||||
The 2050 Target Date Fund had the following investments in affiliates during the period ended October 31, 2024:
| Security Name | Market Value as of October 31, 2023 | Purchases | Purchases In-Kind | Sales | Sales In-Kind | Market Value as of October 31, 2024 | Share Balance as of October 31, 2024 | Dividends | Net Change in Unrealized Appreciation/ (Depreciation) on Affiliated Investments | Net Realized Gain/(Loss) on Affiliated Investments | ||||||||||||||||||||||||||||||
| SP Funds S&P Global Technology ETF | $ | — | $ | 162,756 | $ | — | $ | (6,485 | ) | $ | — | $ | 150,879 | 5,620 | $ | 49 | $ | (5,058 | ) | $ | (334 | ) | ||||||||||||||||||
| SP Funds S&P World (ex-US) ETF | — | 42,053 | — | (1,880 | ) | — | 39,058 | 1,715 | 58 | (1,057 | ) | (58 | ) | |||||||||||||||||||||||||||
| SP Funds S&P 500 Sharia Industry Exclusions ETF | — | 167,467 | — | (7,142 | ) | — | 157,599 | 3,842 | 132 | (2,525 | ) | (201 | ) | |||||||||||||||||||||||||||
| SP Funds Dow Jones Global Sukuk ETF | — | 21,398 | — | (985 | ) | — | 20,190 | 1,113 | 47 | (221 | ) | (2 | ) | |||||||||||||||||||||||||||
| SP Funds S&P Global REIT Sharia ETF | — | 21,535 | — | (1,062 | ) | — | 19,819 | 957 | 83 | (647 | ) | (7 | ) | |||||||||||||||||||||||||||
| Total | $ | — | $ | 415,209 | $ | — | $ | (17,554 | ) | $ | — | $ | 387,545 | 13,247 | $ | 369 | $ | (9,508 | ) | $ | (602 | ) | ||||||||||||||||||
| NOTE 7 – INCOME TAXES AND DISTRIBUTIONS TO SHAREHOLDERS |
The tax character of distributions paid during the period ended October 31, 2024, was as follows:
| Distributions paid | 2030 Target | 2040 Target | 2050 Target | Global | ||||||||||||||||
| from: | Date Fund | Date Fund | Date Fund | Technology ETF | World ETF | |||||||||||||||
| Ordinary income | $— | $— | $— | $73,888 | $183,813 | |||||||||||||||
| Long-term capital gain | — | — | — | — | — | |||||||||||||||
| Return of capital | — | — | — | — | — | |||||||||||||||
| Total distributions paid | $— | $— | $— | $73,888 | $183,813 | |||||||||||||||
As of October 31, 2024, the components of distributable earnings/(accumulated losses) on a tax basis were as follows:
| 2030 Target | 2040 Target | 2050 Target | Global | |||||||
| Date Fund | Date Fund | Date Fund | Technology ETF | World ETF | ||||||
| Investments, at cost | $3,392,074 | $1,497,556 | $397,592 | $32,502,874 | $24,687,880 | |||||
| Gross tax unrealized appreciation | 29,675 | 9,496 | 1,963 | 8,075,672 | 3,304,156 | |||||
| Gross tax unrealized depreciation | (50,956) | (25,528) | (12,010) | (1,463,216) | (1,405,472) | |||||
| Net tax unrealized appreciation (depreciation) | (21,281) | (16,032) | (10,047) | 6,612,456 | 1,898,684 | |||||
| Undistributed ordinary income | 10,158 | 2,473 | 525 | 101,282 | — | |||||
| Undistributed long-term capital gain (loss) | — | — | — | — | — | |||||
| Total distributable earnings/(accumulated losses) | 10,158 | 2,473 | 525 | 101,282 | — | |||||
| Other accumulated gain (loss) | — | — | — | (198) | (151) | |||||
| Total distributable earnings/(accumulated losses) | $(11,123) | $(13,559) | $(9,522) | $6,713,540 | $1,898,533 |
33
The temporary differences between book basis and tax basis in the Funds was primarily attributable to the treatment of wash sales, non-REIT return of capital, and PFIC mark to markets.
Net capital losses incurred after November 30 and net investment losses incurred after December 31 (late year losses), and within the taxable year, may be elected to be deferred to the first business day of each Fund’s next taxable year. As of the most recent fiscal period ended October 31, 2024, the Funds did not defer any post-October losses.
As of October 31, 2024, the Funds did not have any unused capital loss carryforward.
| NOTE 8 – BENEFICIAL OWNERSHIP |
The beneficial ownership, either directly or indirectly, of 25% or more of the voting securities of a fund creates a presumption of control of a fund, under Section 2(a)(9) of the 1940 Act. At October 31, 2024, Charles Schwab owned, as record shareholder, 100% of the outstanding shares of the 2030 Target Date Fund, 2040 Target Date Fund, and 2050 Target Date Fund. It is not known whether any underlying beneficial owners owned or controlled 25% or more of the voting securities of the Funds.
| NOTE 9 – SHARE TRANSACTIONS |
The SP Funds S&P Global Technology ETF and SP Funds S&P World (ex- US) ETF (each an “ETF” and collectively the “ETFs”) list and trade their shares on the Exchange. Market prices for the shares may be different from their NAV. The ETFs issue and redeem shares on a continuous basis at NAV generally in large blocks of shares, called (“Creation Units”). Creation Units are issued and redeemed principally in-kind for securities included in a specified universe. Once created, shares generally trade in the secondary market at market prices that change throughout the day. Except when aggregated in Creation Units, shares are not redeemable securities of the ETFs. Creation Units may only be purchased or redeemed by Authorized Participants. An Authorized Participant is either (i) a broker-dealer or other participant in the clearing process through the Continuous Net Settlement System of the National Securities Clearing Corporation or (ii) a Depository Trust Company participant and, in each case, must have executed a Participant Agreement with the Distributor. Most retail investors do not qualify as Authorized Participants nor have the resources to buy and sell whole Creation Units. Therefore, they are unable to purchase or redeem the shares directly from the ETFs. Rather, most retail investors may purchase shares in the secondary market with the assistance of a broker and are subject to customary brokerage commissions or fees.
Each ETF currently offers one class of shares, which has no front- end sales load, no deferred sales charge, and no redemption fee. A fixed transaction fee is imposed for the transfer and other transaction costs associated with the purchase or sale of Creation Units. The standard fixed transaction fee is $300 for the Global Technology ETF and $14,500 for the World ETF, payable to the Custodian. The fixed transaction fee may be waived on certain orders if the ETFs’ Custodian has determined to waive some or all of the costs associated with the order or another party, such as the Adviser, has agreed to pay such fee. In addition, a variable fee may be charged on all cash transactions or substitutes for Creation Units of up to a maximum of 2% of the value of the Creation Units subject to the transaction. Variable fees are imposed to compensate the ETFs for transaction costs associated with the cash transactions. Variable fees received by the ETFs, if any, are disclosed in the capital shares transactions section of the Statements of Changes in Net Assets. The ETFs may issue an unlimited number of shares of beneficial interest, with no par value. All shares of the ETFs have equal rights and privileges.
| NOTE 10 – RECENT MARKET EVENTS |
U.S. and international markets have experienced and may continue to experience significant periods of volatility in recent years and months due to a number of economic, political and global macro factors including rising inflation, uncertainty regarding central banks’ interest rates, the possibility of a national or global recession, trade tensions, political events, the war between Russia and Ukraine, and significant conflict between Israel and Hamas in the Middle East. As a result of continuing political tensions and armed conflicts, including the war between Ukraine and Russia, the U.S. and the European Union imposed sanctions on certain Russian individuals and companies, including certain financial institutions, and have limited certain exports and imports to and from Russia. The war has contributed to recent market volatility and may continue to do so. The Middle East conflict has led to significant loss of life, damaged infrastructure and escalated tensions both in the region and globally. These developments, as well as other events, could result in further market volatility and negatively affect financial asset prices, the liquidity of certain securities and the normal operations of securities exchanges and other markets, despite government efforts to address market disruptions. As a result, the risk environment remains elevated. The Adviser and Sub-Adviser will monitor developments and seek to manage the Funds in a manner consistent with achieving the Fund’s investment objective, but there can be no assurance that they will be successful in doing so.
| NOTE 11 – SUBSEQUENT EVENTS |
In preparing these financial statements, management has evaluated events and transactions for potential recognition or disclosure through the date the financial statements were issued. Management has determined that there are no subsequent events that would need to be disclosed in the Funds’ financial statements.
34

REPORT OF INDEPENDENT REGISTERED PUBLIC ACCOUNTING FIRM
To the Shareholders of
SP Funds 2030 Target Date Fund, SP Funds 2040 Target Date Fund, SP Funds 2050 Target Date Fund,
SP Funds S&P Global Technology ETF, SP Funds World ex-US ETF and
The Board of Trustees of
SP Funds Trust
Opinion on the Financial Statements
We have audited the accompanying statements of assets and liabilities of SP Funds 2030 Target Date Fund, SP Funds 2040 Target Date Fund, SP Funds 2050 Target Date Fund, SP Funds S&P Global Technology ETF and SP Funds World ex-US ETF (collectively the “Funds”), each a series of SP Funds Trust (the “Trust”), including the schedules of investments, as of October 31, 2024, the related statements of operations, statements of changes in net assets, and the financial highlights for each of the periods indicated in the table below, and the related notes (collectively referred to as the “financial statements”). In our opinion, the financial statements present fairly, in all material respects, the financial position of the Funds as of October 31, 2024, and the results of their operations, the changes in their net assets and the financial highlights for the periods indicated in the table below, in conformity with accounting principles generally accepted in the United States of America.
| Individual Funds Constituting SP Funds Trust | Statement Of Operations | Statements Of Changes In Net Assets | Financial Highlights | |||
| SP Funds 2030 Target Date Fund, SP Funds 2040 Target Date Fund, SP Funds 2050 Target Date Fund | For the period June 28, 2024 (commencement of operations) to October 31, 2024 | For the period June 28, 2024 (commencement of operations) to October 31, 2024 | For the period June 28, 2024 (commencement of operations) to October 31, 2024 | |||
| SP Funds S&P Global Technology ETF | For the period November 30, 2023 (commencement of operations) to October 31, 2024 | For the period November 30, 2023 (commencement of operations) to October 31, 2024 | For the period November 30, 2023 (commencement of operations) to October 31, 2024 | |||
| SP Funds World ex-US ETF | For the period December 19, 2023 (commencement of operations) to October 31, 2024 | For the period December 19, 2023 (commencement of operations) to October 31, 2024 | For the period December 19, 2023 (commencement of operations) to October 31, 2024 |
Basis for Opinion
These financial statements are the responsibility of the Funds’ management. Our responsibility is to express an opinion on the Funds’ financial statements based on our audits. We are a public accounting firm registered with the Public Company Accounting Oversight Board (United States) (“PCAOB”) and are required to be independent with respect to the Funds in accordance with the U.S. federal securities laws and the applicable rules and regulations of the Securities and Exchange Commission and the PCAOB. We have served as the auditor of one or more of the funds in the Trust since 2023.
We conducted our audits in accordance with the standards of the PCAOB. Those standards require that we plan and perform the audits to obtain reasonable assurance about whether the financial statements are free of material misstatement, whether due to error or fraud. The Funds are not required to have, nor were we engaged to perform, an audit of their internal control over financial reporting. As part of our audits, we are required to obtain an understanding of internal control over financial reporting, but not for the purpose of expressing an opinion on the effectiveness of the Funds’ internal control over financial reporting. Accordingly, we express no such opinion.
35
Our audits included performing procedures to assess the risks of material misstatement of the financial statements, whether due to error or fraud, and performing procedures that respond to those risks. Such procedures included examining, on a test basis, evidence regarding the amounts and disclosures in the financial statements. Our audits also included evaluating the accounting principles used and significant estimates made by management, as well as evaluating the overall presentation of the financial statements. Our procedures included confirmation of securities owned as of October 31, 2024 by correspondence with the custodian. We believe that our audits provide a reasonable basis for our opinion.
 | |
| TAIT, WELLER & BAKER LLP |
Philadelphia, Pennsylvania
December 30, 2024
36
| QUALIFIED DIVIDEND INCOME/DIVIDENDS RECEIVED DEDUCTION (Unaudited) |
For the period ended October 31, 2024, certain dividends paid by the Funds may be subject to a maximum tax rate of 23.8%, as provided for by the Tax Cuts and Jobs Act of 2017. The percentage of dividends declared from ordinary income designated as qualified dividend income was as follows:
| 2030 Target Date Fund | 0.00% |
| 2040 Target Date Fund | 0.00% |
| 2050 Target Date Fund | 0.00% |
| Global ETF | 100.00% |
| World ETF | 100.00% |
For corporate shareholders, the percent of ordinary income distributions qualifying for the corporate dividends received deduction for the period ended October 31, 2024, was as follows:
| 2030 Target Date Fund | 0.00% |
| 2040 Target Date Fund | 0.00% |
| 2050 Target Date Fund | 0.00% |
| Global ETF | 44.70% |
| World ETF | 0.20% |
The percentage of taxable ordinary income distributions that are designated as short-term capital gain distributions under Internal Revenue Section 871(k)(2)(c) for the period ended October 31, 2024, was as follows:
| 2030 Target Date Fund | 0.00% |
| 2040 Target Date Fund | 0.00% |
| 2050 Target Date Fund | 0.00% |
| Global ETF | 13.75% |
| World ETF | 16.29% |
Pursuant to Section 853 of the Internal Revenue Code, the Funds designate the following amounts as foreign taxes paid for the period ended October 31, 2024. Foreign taxes paid for purposes of Section 853 may be less than actual foreign taxes paid for financial statement purposes.
| Portion of Ordinary Income | |||
| Creditable Foreign | Distribution Derived from | ||
| World ETF | Tax Credit Paid | Per Share Amount | Foreign Sourced Income |
| 29,015 | 0.024693991 | 99.851% |
37
| (b) | Financial Highlights are included within the financial statements filed under Item 7(a) of this Form.” |
Item 8. Changes in and Disagreements with Accountants for Open-End Investment Companies.
There have been no changes in or disagreements with the Funds’ accountants.
Item 9. Proxy Disclosure for Open-End Investment Companies.
There were no matters submitted to a vote of shareholders during the period covered by the report.
Item 10. Remuneration Paid to Directors, Officers, and Others of Open-End Investment Companies.
See Item 7(a). Under the Investment Advisory Agreement, in exchange for a single unitary management fee from each Fund, the Adviser has agreed to pay all expenses incurred by the Funds, including Trustee compensation, except for certain excluded expenses.
Item 11. Statement Regarding Basis for Approval of Investment Advisory and Sub-Advisory Contracts.
The Board of Trustees (the “Board” or the “Trustees”) of SP Funds Trust (the “Trust”) met on March 28, 2024 (the “Meeting”) to consider the initial approval of the investment advisory agreement between ShariaPortfolio, Inc. (“ShariaPortfolio” or the “Adviser”) and the Trust, on behalf of the SP Funds 2030 Target Date Fund, SP Funds 2040 Target Date Fund and SP Funds 2050 Target Date Fund (each, a “Fund” and collectively, the “Funds”). In addition, on March 28, 2024, the Trustees who are not “interested persons” of the Trust within the meaning of the Investment Company Act of 1940 (the “Independent Trustees”), and who constitute a majority of the Board, met with their legal counsel to consider the investment advisory agreement.
In connection with its consideration of the investment advisory agreement, the Board reviewed and discussed various information that had been provided prior to the Meeting, including the investment advisory agreement, a memorandum provided by the Independent Trustees’ legal counsel summarizing the guidelines relevant to the Board’s consideration of the approval of the investment advisory agreement, a memorandum and other information provided by the Adviser (including the Adviser’s Form ADV Part 1A and select financial information of the Adviser), information regarding the expected profitability of the Funds, the performance of comparable funds, management fees and expense ratios (including comparative fee and expense information), best execution and trading information and other pertinent information. Based on its evaluation of this information, the Board, including all of the Independent Trustees, approved the investment advisory agreement for the Funds for an initial two-year period.
In considering the investment advisory agreement and reaching its conclusions, the Board reviewed and analyzed various factors that it determined were relevant, including the factors below. In deciding to approve the investment advisory agreement for each Fund, the Board did not identify any single factor as determinative but considered all factors together.
Nature, Extent and Quality of Services to Be Provided to the Funds
The Board considered the nature, extent and quality of the services to be provided by the Adviser to the Funds. The Board discussed the experience and resources of ShariaPortfolio, as well as the depth and qualifications of the professional personnel of the Adviser, including the Funds’ sole portfolio manager, Naushad Virji. The Board also considered other services the Adviser would provide the Funds, such as overseeing the Funds’ other service providers. The Board concluded that the nature, extent and quality of the services to be provided by the Adviser to the Funds were appropriate and that the Funds were likely to benefit from services provided under the investment advisory agreement.
Investment Performance
Because the Funds had not yet commenced operations, the Board did not consider any performance information with respect to the Funds. The Board did consider the performance of other funds managed by the Adviser, pursuant to a Sharia-based investment strategy.
Expense Information
The Board examined the proposed fee and expense information for the Funds, including a comparison of such information to other similar funds. Based on their review of the industry data, the Trustees found that the proposed unitary fee would be competitive as it relates to the applicable category.
Costs of Services Provided and Profitability
The Board considered information about the financial condition of the Adviser and its parent company and determined that the Adviser’s financial condition was sound and that the Adviser has maintained adequate profit levels to support its proposed services to the Funds from the revenue of its overall investment advisory business. The Board also considered information regarding the Adviser’s expected profitability ratio across the entire Fund complex and concluded that the Adviser’s expected profitability was reasonable.
In light of all of the information that it received and considered, the Board concluded that the proposed unitary fee of each Fund was reasonable.
Economies of Scale and Fee Levels Reflecting Those Economies
Because the Funds had not yet commenced operations, the Board did not consider whether any alternative fee structures, such as breakpoint fees, would be appropriate to reflect any economies of scale that may result from increases in a Fund’s assets. The Board considered information discussed at the Meeting regarding break-even levels.
Benefits to Be Derived from the Relationship with the Funds
The Board considered other potential benefits to the Adviser from serving as adviser to the Funds (in addition to the advisory fee), including greater name recognition. The Board noted that the Adviser’s affiliated entities may experience indirect benefits from the Adviser’s association with the Funds. The Board concluded that other benefits that may be realized by the Adviser from its relationship with the Funds were appropriate.
Based on their evaluation of the above factors, as well as other factors relevant to their consideration of the investment advisory agreement, the Trustees, including all of the Independent Trustees, concluded that the approval of the investment advisory agreement was in the best interests of each Fund and its shareholders.
Item 12. Disclosure of Proxy Voting Policies and Procedures for Closed-End Management Investment Companies.
Not applicable to open-end investment companies.
Item 13. Portfolio Managers of Closed-End Management Investment Companies.
Not applicable to open-end investment companies.
Item 14. Purchases of Equity Securities by Closed-End Management Investment Company and Affiliated Purchasers.
Not applicable to open-end investment companies.
Item 15. Submission of Matters to a Vote of Security Holders.
Not Applicable.
Item 16. Controls and Procedures.
| (a) | The Registrant’s President/Principal Executive Officer and Treasurer/Principal Financial Officer have reviewed the Registrant's disclosure controls and procedures (as defined in Rule 30a-3(c) under the Investment Company Act of 1940 (the “Act”)) as of a date within 90 days of the filing of this report, as required by Rule 30a-3(b) under the Act and Rules 13a-15(b) or 15d-15(b) under the Securities Exchange Act of 1934. Based on their review, such officers have concluded that the disclosure controls and procedures are effective in ensuring that information required to be disclosed in this report is appropriately recorded, processed, summarized and reported and made known to them by others within the Registrant and by the Registrant’s service provider. |
| (b) | There were no changes in the Registrant's internal control over financial reporting (as defined in Rule 30a-3(d) under the Act) that occurred during the period covered by this report that have materially affected, or are reasonably likely to materially affect, the Registrant's internal control over financial reporting. |
Item 17. Disclosure of Securities Lending Activities for Closed-End Management Investment Companies.
Not applicable to open-end investment companies.
Item 18. Recovery of Erroneously Awarded Compensation.
(a) Not Applicable
(b) Not Applicable
Item 19. Exhibits.
(2) Any policy required by the listing standards adopted pursuant to Rule 10D-1 under the Exchange Act (17 CFR 240.10D-1) by the registered national securities exchange or registered national securities association upon which the registrant’s securities are listed. Not applicable.
(4) Any written solicitation to purchase securities under Rule 23c-1 under the Act sent or given during the period covered by the report by or on behalf of the registrant to 10 or more persons. Not applicable.
(5) Change in the registrant’s independent public accountant. Provide the information called for by Item 4 of Form 8-K under the Exchange Act (17 CFR 249.308). Unless otherwise specified by Item 4, or related to and necessary for a complete understanding of information not previously disclosed, the information should relate to events occurring during the reporting period. Not applicable.
| (b) | Certifications pursuant to Section 906 of the Sarbanes-Oxley Act of 2002. Furnished herewith. |
SIGNATURES
Pursuant to the requirements of the Securities Exchange Act of 1934 and the Investment Company Act of 1940, the registrant has duly caused this report to be signed on its behalf by the undersigned, thereunto duly authorized.
| (Registrant) | SP Funds Trust | |
| By (Signature and Title)* | /s/ Irfan Chaudhry | |
| Irfan Chaudhry, President/Principal Executive Officer | ||
| Date | January 6, 2025 |
Pursuant to the requirements of the Securities Exchange Act of 1934 and the Investment Company Act of 1940, this report has been signed below by the following persons on behalf of the registrant and in the capacities and on the dates indicated.
| By (Signature and Title)* | /s/ Irfan Chaudhry | |
| Irfan Chaudhry, President/Principal Executive Officer | ||
| Date | January 6, 2025 |
| By (Signature and Title)* | /s/ Glenn Vitale | |
| Glenn Vitale, Treasurer/Principal Financial Officer | ||
| Date | January 6, 2025 |
* Print the name and title of each signing officer under his or her signature.