Filed Pursuant to Rule 433
Registration Statement Nos. 333-265473 and 333-265473-04
1 Ford Credit Auto Lease Trust Series 2023-B S E P T E M B E R 2 0 2 3 2024 Ford Ranger |
Secret Free Writing Prospectus Registration Statement No. 333-265473 Ford Credit Auto Lease Two LLC (the “depositor”) Ford Credit Auto Lease Trust 2023-B (the “issuer”) This document constitutes a free writing prospectus for purposes of the Securities Act of 1933. The depositor has filed a registration statement (including a prospectus) with the SEC for any offering to which this communication relates. Before you invest, you should read the prospectus in that registration statement and other documents the depositor has filed with the SEC for more complete information about the depositor, the issuer and such offering. You may get these documents for free by visiting EDGAR on the SEC website at www.sec.gov. Alternatively, you may request that a copy of the prospectus be sent to you by calling toll-free 1-888-603-5847. 2 F C A L T 2 0 2 3 - B R O A D S H O W |
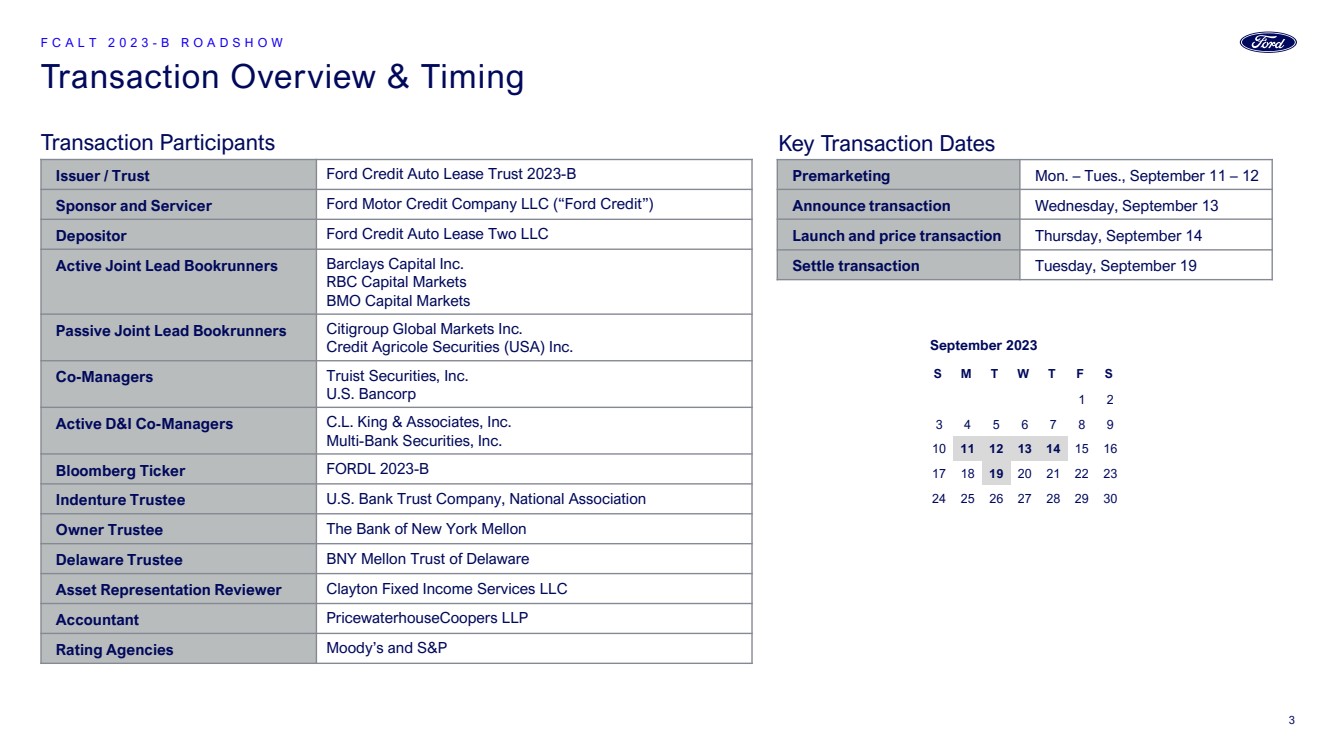
Transaction Overview & Timing F C A L T 2 0 2 3 - B R O A D S H O W Issuer / Trust Ford Credit Auto Lease Trust 2023-B Sponsor and Servicer Ford Motor Credit Company LLC (“Ford Credit”) Depositor Ford Credit Auto Lease Two LLC Active Joint Lead Bookrunners Barclays Capital Inc. RBC Capital Markets BMO Capital Markets Passive Joint Lead Bookrunners Citigroup Global Markets Inc. Credit Agricole Securities (USA) Inc. Co-Managers Truist Securities, Inc. U.S. Bancorp Active D&I Co-Managers C.L. King & Associates, Inc. Multi-Bank Securities, Inc. Bloomberg Ticker FORDL 2023-B Indenture Trustee U.S. Bank Trust Company, National Association Owner Trustee The Bank of New York Mellon Delaware Trustee BNY Mellon Trust of Delaware Asset Representation Reviewer Clayton Fixed Income Services LLC Accountant PricewaterhouseCoopers LLP Rating Agencies Moody’s and S&P September 2023 S M T W T F S 1 2 3 4 5 6 7 8 9 10 11 12 13 14 15 16 17 18 19 20 21 22 23 24 25 26 27 28 29 30 Key Transaction Dates Premarketing Mon. – Tues., September 11 – 12 Announce transaction Wednesday, September 13 Launch and price transaction Thursday, September 14 Settle transaction Tuesday, September 19 Transaction Participants 3 |
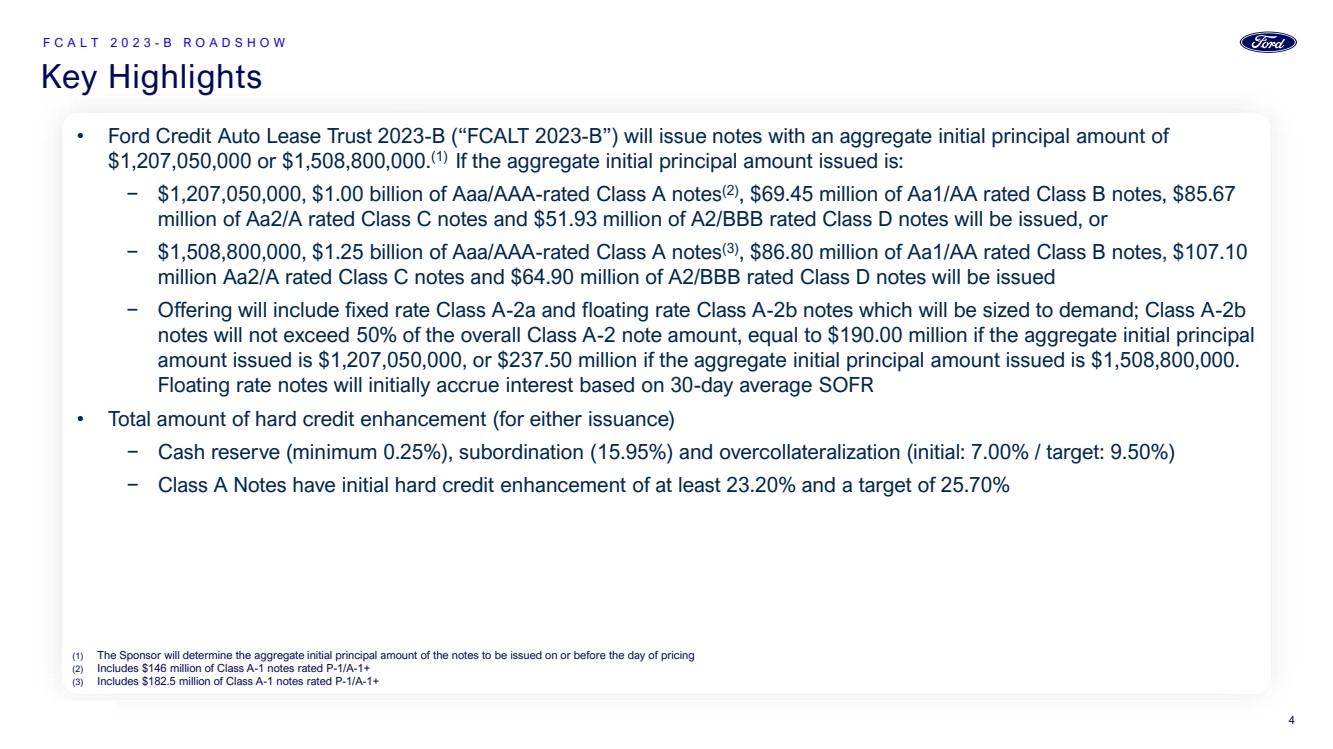
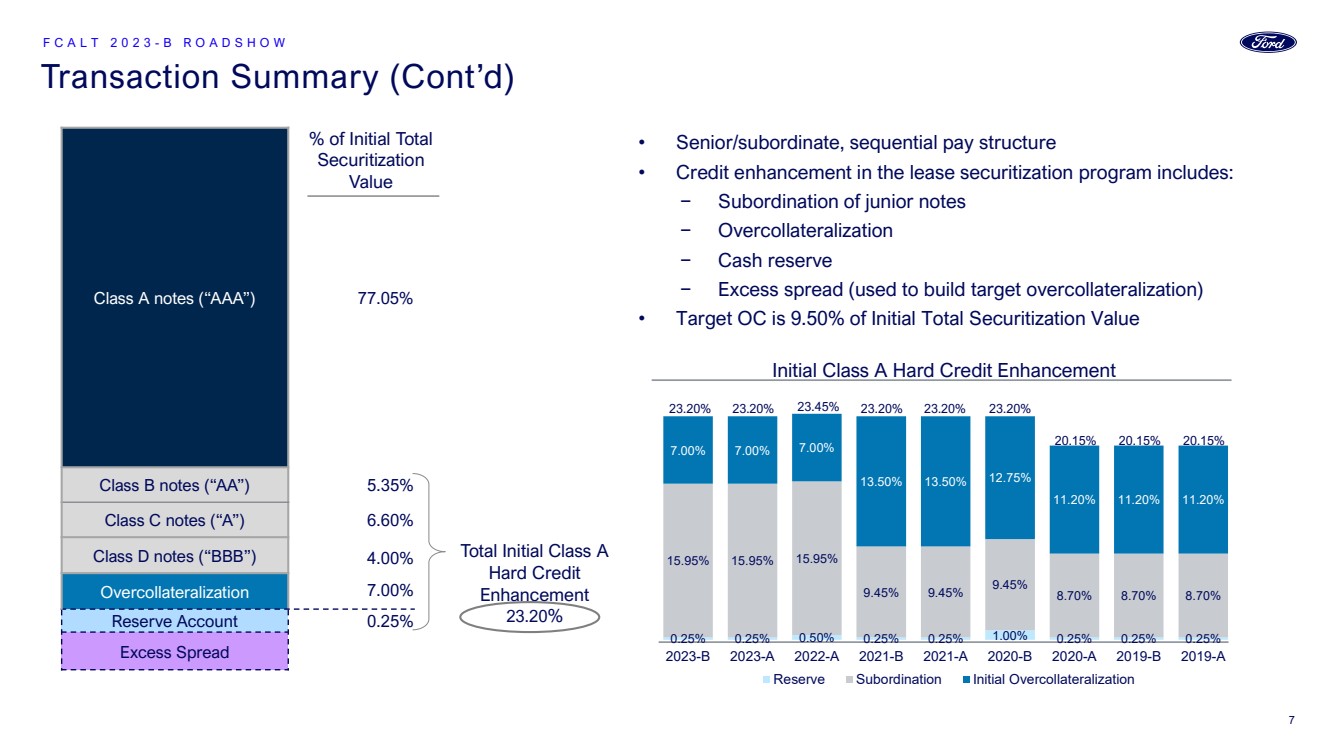
Secret • Ford Credit Auto Lease Trust 2023-B (“FCALT 2023-B”) will issue notes with an aggregate initial principal amount of $1,207,050,000 or $1,508,800,000.(1) If the aggregate initial principal amount issued is: − $1,207,050,000, $1.00 billion of Aaa/AAA-rated Class A notes(2), $69.45 million of Aa1/AA rated Class B notes, $85.67 million of Aa2/A rated Class C notes and $51.93 million of A2/BBB rated Class D notes will be issued, or − $1,508,800,000, $1.25 billion of Aaa/AAA-rated Class A notes(3), $86.80 million of Aa1/AA rated Class B notes, $107.10 million Aa2/A rated Class C notes and $64.90 million of A2/BBB rated Class D notes will be issued − Offering will include fixed rate Class A-2a and floating rate Class A-2b notes which will be sized to demand; Class A-2b notes will not exceed 50% of the overall Class A-2 note amount, equal to $190.00 million if the aggregate initial principal amount issued is $1,207,050,000, or $237.50 million if the aggregate initial principal amount issued is $1,508,800,000. Floating rate notes will initially accrue interest based on 30-day average SOFR • Total amount of hard credit enhancement (for either issuance) − Cash reserve (minimum 0.25%), subordination (15.95%) and overcollateralization (initial: 7.00% / target: 9.50%) − Class A Notes have initial hard credit enhancement of at least 23.20% and a target of 25.70% Key Highlights F C A L T 2 0 2 3 - B R O A D S H O W (1) The Sponsor will determine the aggregate initial principal amount of the notes to be issued on or before the day of pricing (2) Includes $146 million of Class A-1 notes rated P-1/A-1+ (3) Includes $182.5 million of Class A-1 notes rated P-1/A-1+ 4 |
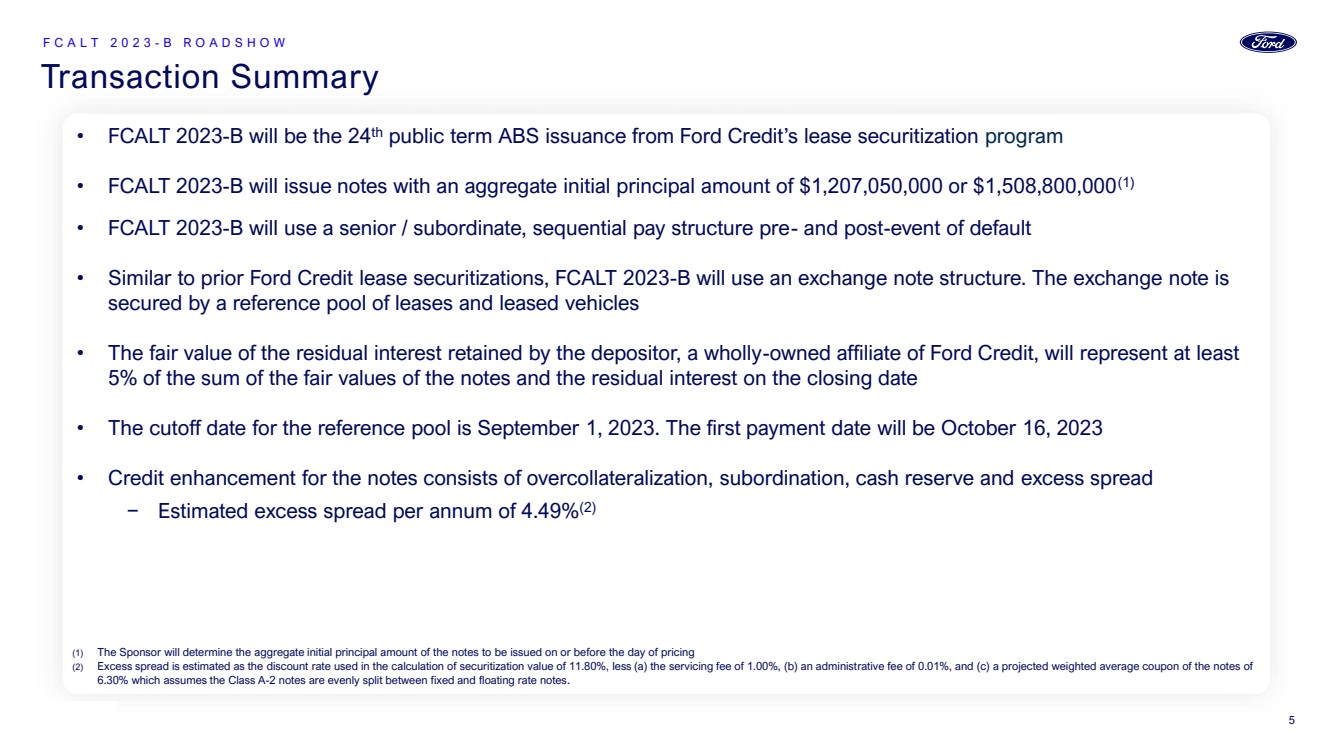
Secret • FCALT 2023-B will be the 24th public term ABS issuance from Ford Credit’s lease securitization program • FCALT 2023-B will issue notes with an aggregate initial principal amount of $1,207,050,000 or $1,508,800,000(1) • FCALT 2023-B will use a senior / subordinate, sequential pay structure pre- and post-event of default • Similar to prior Ford Credit lease securitizations, FCALT 2023-B will use an exchange note structure. The exchange note is secured by a reference pool of leases and leased vehicles • The fair value of the residual interest retained by the depositor, a wholly-owned affiliate of Ford Credit, will represent at least 5% of the sum of the fair values of the notes and the residual interest on the closing date • The cutoff date for the reference pool is September 1, 2023. The first payment date will be October 16, 2023 • Credit enhancement for the notes consists of overcollateralization, subordination, cash reserve and excess spread − Estimated excess spread per annum of 4.49%(2) Transaction Summary F C A L T 2 0 2 3 - B R O A D S H O W (1) The Sponsor will determine the aggregate initial principal amount of the notes to be issued on or before the day of pricing (2) Excess spread is estimated as the discount rate used in the calculation of securitization value of 11.80%, less (a) the servicing fee of 1.00%, (b) an administrative fee of 0.01%, and (c) a projected weighted average coupon of the notes of 6.30% which assumes the Class A-2 notes are evenly split between fixed and floating rate notes. 5 |
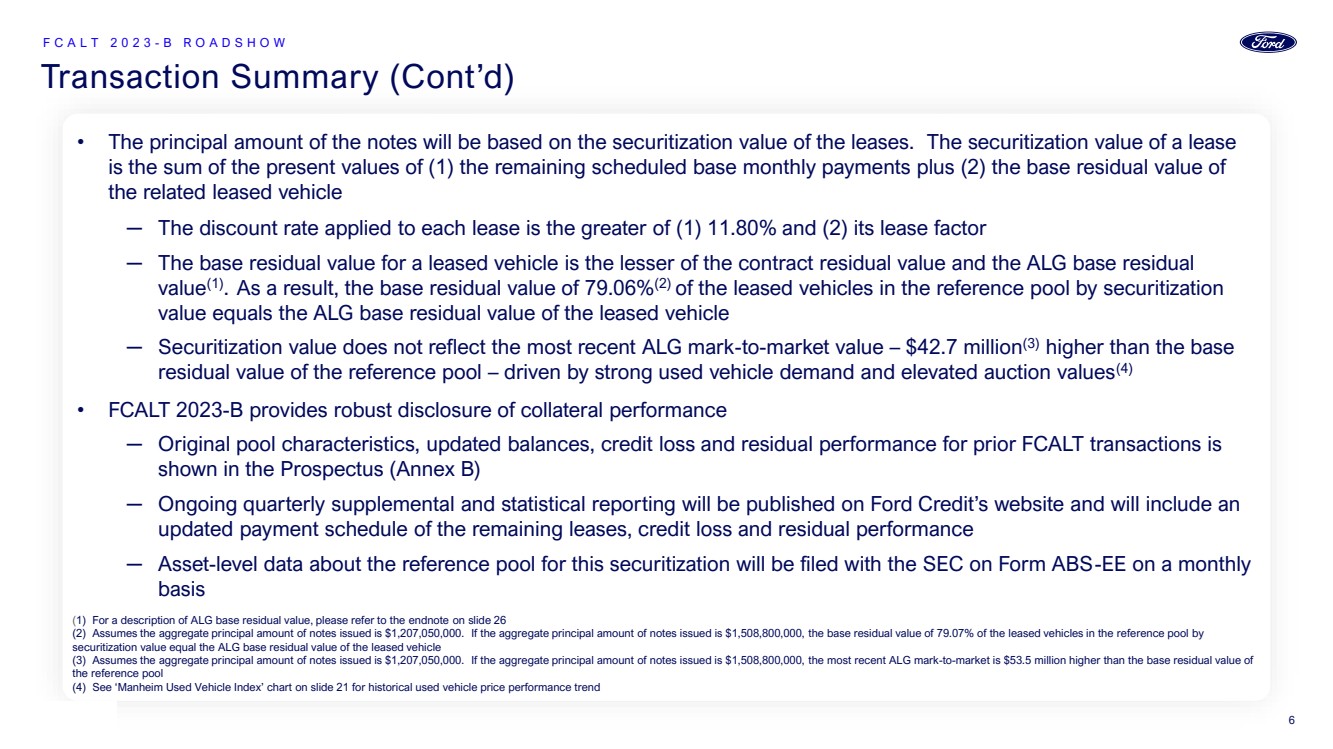
Secret • The principal amount of the notes will be based on the securitization value of the leases. The securitization value of a lease is the sum of the present values of (1) the remaining scheduled base monthly payments plus (2) the base residual value of the related leased vehicle ─ The discount rate applied to each lease is the greater of (1) 11.80% and (2) its lease factor ─ The base residual value for a leased vehicle is the lesser of the contract residual value and the ALG base residual value(1) .. As a result, the base residual value of 79.06%(2) of the leased vehicles in the reference pool by securitization value equals the ALG base residual value of the leased vehicle ─ Securitization value does not reflect the most recent ALG mark-to-market value – $42.7 million(3) higher than the base residual value of the reference pool – driven by strong used vehicle demand and elevated auction values(4) • FCALT 2023-B provides robust disclosure of collateral performance ─ Original pool characteristics, updated balances, credit loss and residual performance for prior FCALT transactions is shown in the Prospectus (Annex B) ─ Ongoing quarterly supplemental and statistical reporting will be published on Ford Credit’s website and will include an updated payment schedule of the remaining leases, credit loss and residual performance ─ Asset-level data about the reference pool for this securitization will be filed with the SEC on Form ABS-EE on a monthly basis Transaction Summary (Cont’d) F C A L T 2 0 2 3 - B R O A D S H O W (1) For a description of ALG base residual value, please refer to the endnote on slide 26 (2) Assumes the aggregate principal amount of notes issued is $1,207,050,000. If the aggregate principal amount of notes issued is $1,508,800,000, the base residual value of 79.07% of the leased vehicles in the reference pool by securitization value equal the ALG base residual value of the leased vehicle (3) Assumes the aggregate principal amount of notes issued is $1,207,050,000. If the aggregate principal amount of notes issued is $1,508,800,000, the most recent ALG mark-to-market is $53.5 million higher than the base residual value of the reference pool (4) See ‘Manheim Used Vehicle Index’ chart on slide 21 for historical used vehicle price performance trend 6 |
0.25% 0.25% 0.50% 0.25% 0.25% 1.00% 0.25% 0.25% 0.25% 15.95% 15.95% 15.95% 9.45% 9.45% 9.45% 8.70% 8.70% 8.70% 7.00% 7.00% 7.00% 13.50% 13.50% 12.75% 11.20% 11.20% 11.20% 2023-B 2023-A 2022-A 2021-B 2021-A 2020-B 2020-A 2019-B 2019-A Reserve Subordination Initial Overcollateralization Transaction Summary (Cont’d) F C A L T 2 0 2 3 - B R O A D S H O W Class A notes (“AAA”) 77.05% Class B notes (“AA”) 5.35% Class C notes (“A”) 6.60% Class D notes (“BBB”) 4.00% Overcollateralization 7.00% Reserve Account 0.25% Excess Spread • Senior/subordinate, sequential pay structure • Credit enhancement in the lease securitization program includes: − Subordination of junior notes − Overcollateralization − Cash reserve − Excess spread (used to build target overcollateralization) • Target OC is 9.50% of Initial Total Securitization Value % of Initial Total Securitization Value Total Initial Class A Hard Credit Enhancement 23.20% Initial Class A Hard Credit Enhancement 7 23.20% 23.20% 23.45% 23.20% 23.20% 23.20% 20.15% 20.15% 20.15% |
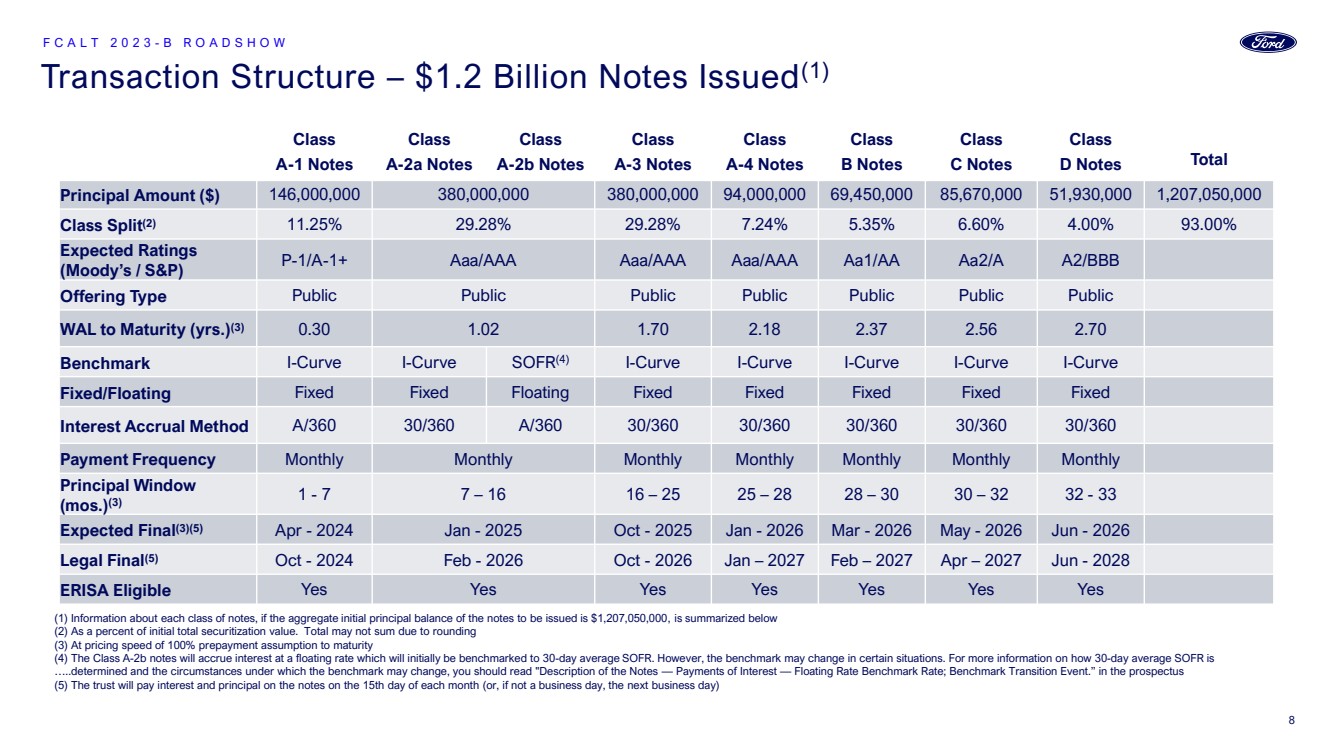
Transaction Structure – $1.2 Billion Notes Issued(1) F C A L T 2 0 2 3 - B R O A D S H O W Class A-1 Notes Class A-2a Notes Class A-2b Notes Class A-3 Notes Class A-4 Notes Class B Notes Class C Notes Class D Notes Total Principal Amount ($) 146,000,000 380,000,000 380,000,000 94,000,000 69,450,000 85,670,000 51,930,000 1,207,050,000 Class Split(2) 11.25% 29.28% 29.28% 7.24% 5.35% 6.60% 4.00% 93.00% Expected Ratings (Moody’s / S&P) P-1/A-1+ Aaa/AAA Aaa/AAA Aaa/AAA Aa1/AA Aa2/A A2/BBB Offering Type Public Public Public Public Public Public Public WAL to Maturity (yrs.)(3) 0.30 1.02 1.70 2.18 2.37 2.56 2.70 Benchmark I-Curve I-Curve SOFR(4) I-Curve I-Curve I-Curve I-Curve I-Curve Fixed/Floating Fixed Fixed Floating Fixed Fixed Fixed Fixed Fixed Interest Accrual Method A/360 30/360 A/360 30/360 30/360 30/360 30/360 30/360 Payment Frequency Monthly Monthly Monthly Monthly Monthly Monthly Monthly Principal Window (mos.)(3) 1 - 7 7 – 16 16 – 25 25 – 28 28 – 30 30 – 32 32 - 33 Expected Final(3)(5) Apr - 2024 Jan - 2025 Oct - 2025 Jan - 2026 Mar - 2026 May - 2026 Jun - 2026 Legal Final(5) Oct - 2024 Feb - 2026 Oct - 2026 Jan – 2027 Feb – 2027 Apr – 2027 Jun - 2028 ERISA Eligible Yes Yes Yes Yes Yes Yes Yes (1) Information about each class of notes, if the aggregate initial principal balance of the notes to be issued is $1,207,050,000, is summarized below (2) As a percent of initial total securitization value. Total may not sum due to rounding (3) At pricing speed of 100% prepayment assumption to maturity (4) The Class A-2b notes will accrue interest at a floating rate which will initially be benchmarked to 30-day average SOFR. However, the benchmark may change in certain situations. For more information on how 30-day average SOFR is …..determined and the circumstances under which the benchmark may change, you should read "Description of the Notes — Payments of Interest — Floating Rate Benchmark Rate; Benchmark Transition Event.” in the prospectus (5) The trust will pay interest and principal on the notes on the 15th day of each month (or, if not a business day, the next business day) 8 |
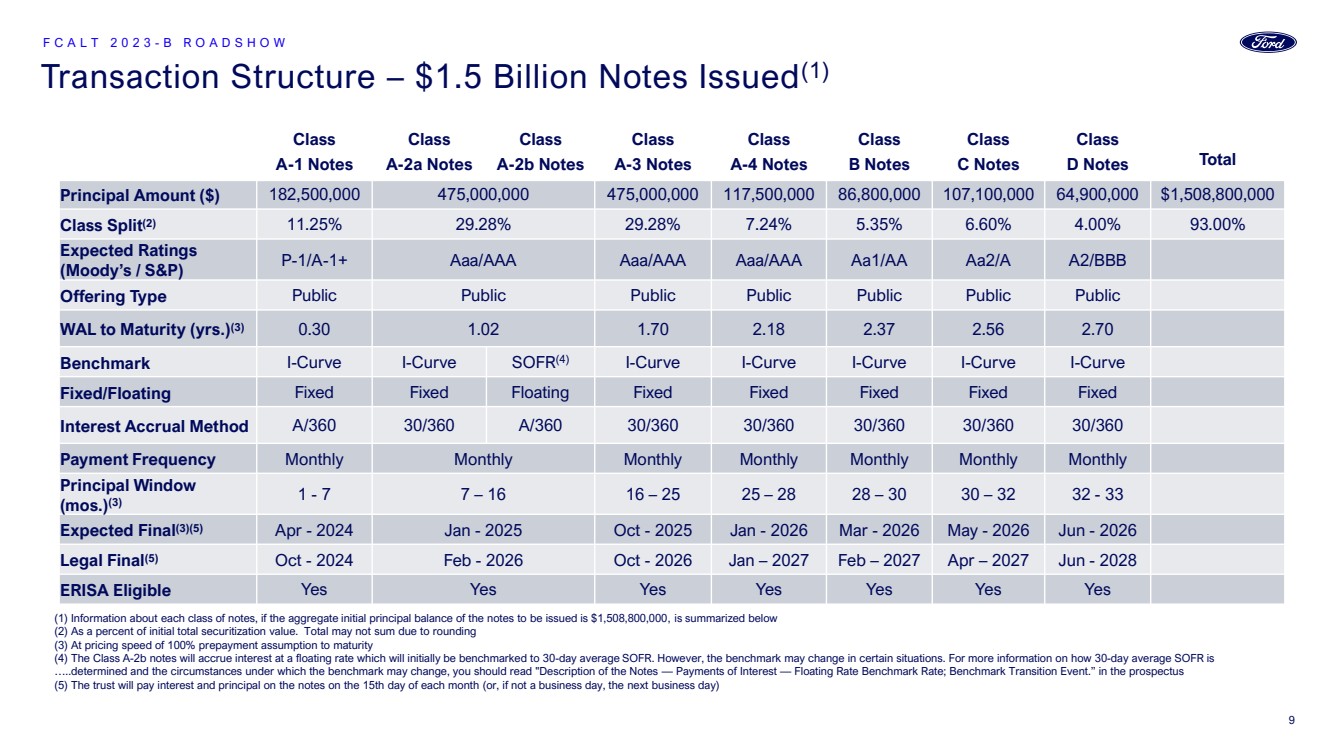
Transaction Structure – $1.5 Billion Notes Issued(1) F C A L T 2 0 2 3 - B R O A D S H O W (1) Information about each class of notes, if the aggregate initial principal balance of the notes to be issued is $1,508,800,000, is summarized below (2) As a percent of initial total securitization value. Total may not sum due to rounding (3) At pricing speed of 100% prepayment assumption to maturity (4) The Class A-2b notes will accrue interest at a floating rate which will initially be benchmarked to 30-day average SOFR. However, the benchmark may change in certain situations. For more information on how 30-day average SOFR is …..determined and the circumstances under which the benchmark may change, you should read "Description of the Notes — Payments of Interest — Floating Rate Benchmark Rate; Benchmark Transition Event.” in the prospectus (5) The trust will pay interest and principal on the notes on the 15th day of each month (or, if not a business day, the next business day) Class A-1 Notes Class A-2a Notes Class A-2b Notes Class A-3 Notes Class A-4 Notes Class B Notes Class C Notes Class D Notes Total Principal Amount ($) 182,500,000 475,000,000 475,000,000 117,500,000 86,800,000 107,100,000 64,900,000 $1,508,800,000 Class Split(2) 11.25% 29.28% 29.28% 7.24% 5.35% 6.60% 4.00% 93.00% Expected Ratings (Moody’s / S&P) P-1/A-1+ Aaa/AAA Aaa/AAA Aaa/AAA Aa1/AA Aa2/A A2/BBB Offering Type Public Public Public Public Public Public Public WAL to Maturity (yrs.)(3) 0.30 1.02 1.70 2.18 2.37 2.56 2.70 Benchmark I-Curve I-Curve SOFR(4) I-Curve I-Curve I-Curve I-Curve I-Curve Fixed/Floating Fixed Fixed Floating Fixed Fixed Fixed Fixed Fixed Interest Accrual Method A/360 30/360 A/360 30/360 30/360 30/360 30/360 30/360 Payment Frequency Monthly Monthly Monthly Monthly Monthly Monthly Monthly Principal Window (mos.)(3) 1 - 7 7 – 16 16 – 25 25 – 28 28 – 30 30 – 32 32 - 33 Expected Final(3)(5) Apr - 2024 Jan - 2025 Oct - 2025 Jan - 2026 Mar - 2026 May - 2026 Jun - 2026 Legal Final(5) Oct - 2024 Feb - 2026 Oct - 2026 Jan – 2027 Feb – 2027 Apr – 2027 Jun - 2028 ERISA Eligible Yes Yes Yes Yes Yes Yes Yes 9 |
Secret • Subject to demand, FCALT 2023-B will issue a fixed rate Class A-2a note and a floating rate Class A-2b note • The Class A-2a and Class A-2b notes are collectively referred to as the "Class A-2 notes" and constitute a single class and have equal rights to payments of principal and interest, which will be made on a pro rata basis • The allocation of the principal amount of the Class A-2 notes between the Class A-2a notes and the Class A-2b notes will be determined on or before the day of pricing ― Class A-2a and Class A-2b notes will each be sized to demand with the Class A-2b notes not to exceed 50% of the overall Class A-2 note amount, equal to $190.00 million if the aggregate initial principal amount issued is $1,207,050,000, or $237.50 million if the aggregate initial principal amount issued is $1,508,800,000 • The Class A-2b notes will accrue interest at a floating rate based on a benchmark, which will initially be the 30-day average SOFR ― The benchmark may change in certain situations. For more information on how 30-day average SOFR is determined and the circumstances under which the benchmark may change, you should read "Description of the Notes — Payments of Interest — Floating Rate Benchmark Rate; Benchmark Transition Event" in the Prospectus Class A-2a Fixed Rate And Class A-2b Floating Rate Notes F C A L T 2 0 2 3 - B R O A D S H O W 10 |
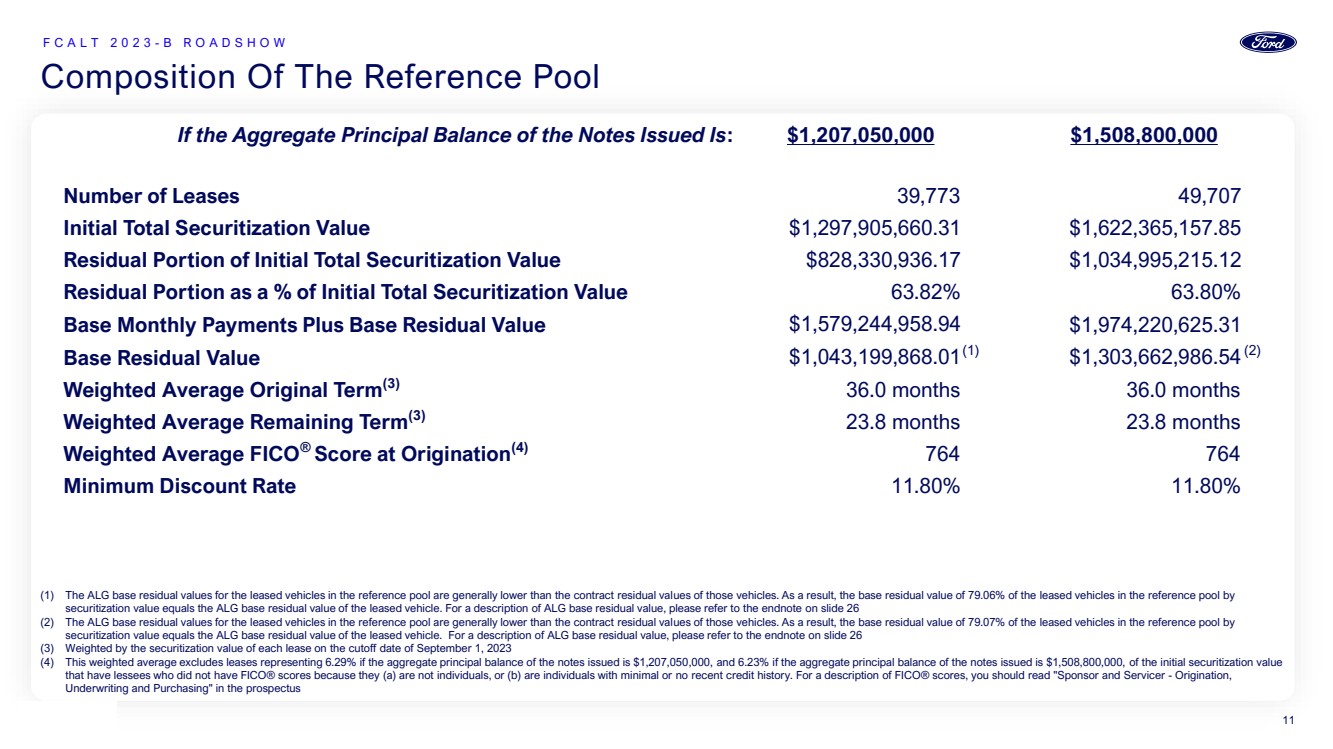
Secret Composition Of The Reference Pool F C A L T 2 0 2 3 - B R O A D S H O W (1) The ALG base residual values for the leased vehicles in the reference pool are generally lower than the contract residual values of those vehicles. As a result, the base residual value of 79.06% of the leased vehicles in the reference pool by securitization value equals the ALG base residual value of the leased vehicle. For a description of ALG base residual value, please refer to the endnote on slide 26 (2) The ALG base residual values for the leased vehicles in the reference pool are generally lower than the contract residual values of those vehicles. As a result, the base residual value of 79.07% of the leased vehicles in the reference pool by securitization value equals the ALG base residual value of the leased vehicle. For a description of ALG base residual value, please refer to the endnote on slide 26 (3) Weighted by the securitization value of each lease on the cutoff date of September 1, 2023 (4) This weighted average excludes leases representing 6.29% if the aggregate principal balance of the notes issued is $1,207,050,000, and 6.23% if the aggregate principal balance of the notes issued is $1,508,800,000, of the initial securitization value that have lessees who did not have FICO® scores because they (a) are not individuals, or (b) are individuals with minimal or no recent credit history. For a description of FICO® scores, you should read "Sponsor and Servicer - Origination, Underwriting and Purchasing" in the prospectus If the Aggregate Principal Balance of the Notes Issued Is: $1,207,050,000 $1,508,800,000 Number of Leases 39,773 49,707 Initial Total Securitization Value $1,297,905,660.31 $1,622,365,157.85 Residual Portion of Initial Total Securitization Value $828,330,936.17 $1,034,995,215.12 Residual Portion as a % of Initial Total Securitization Value 63.82% 63.80% Base Monthly Payments Plus Base Residual Value $1,579,244,958.94 $1,974,220,625.31 Base Residual Value $1,043,199,868.01 (1) $1,303,662,986.54(2) Weighted Average Original Term(3) 36.0 months 36.0 months Weighted Average Remaining Term(3) 23.8 months 23.8 months Weighted Average FICO® Score at Origination(4) 764 764 Minimum Discount Rate 11.80% 11.80% 11 |
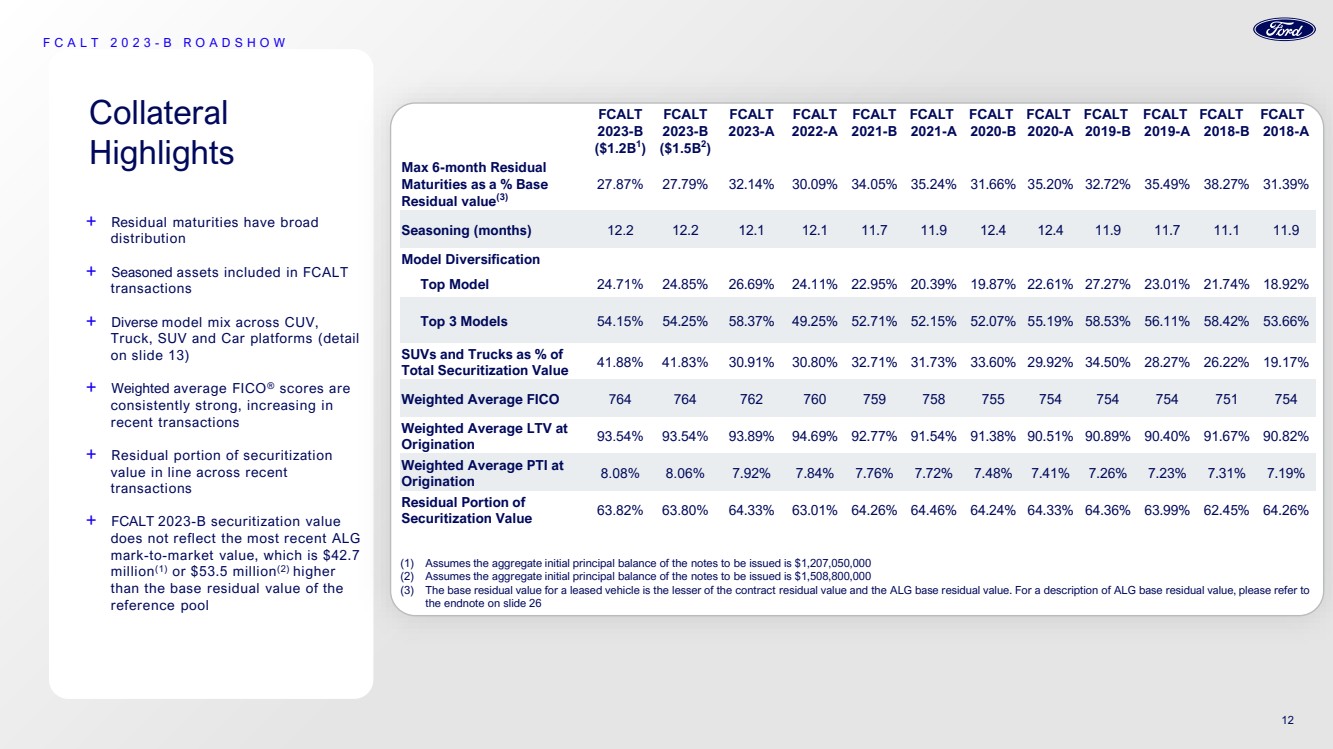
Collateral Highlights + Residual maturities have broad distribution + Seasoned assets included in FCALT transactions + Diverse model mix across CUV, Truck, SUV and Car platforms (detail on slide 13) + Weighted average FICO® scores are consistently strong, increasing in recent transactions + Residual portion of securitization value in line across recent transactions + FCALT 2023-B securitization value does not reflect the most recent ALG mark-to-market value, which is $42.7 million(1) or $53.5 million(2) higher than the base residual value of the reference pool F C A L T 2 0 2 3 - B R O A D S H O W FCALT 2023-B ($1.2B1 ) FCALT 2023-B ($1.5B2 ) FCALT 2023-A FCALT 2022-A FCALT 2021-B FCALT 2021-A FCALT 2020-B FCALT 2020-A FCALT 2019-B FCALT 2019-A FCALT 2018-B FCALT 2018-A Max 6-month Residual Maturities as a % Base Residual value(3) 27.87% 27.79% 32.14% 30.09% 34.05% 35.24% 31.66% 35.20% 32.72% 35.49% 38.27% 31.39% Seasoning (months) 12.2 12.2 12.1 12.1 11.7 11.9 12.4 12.4 11.9 11.7 11.1 11.9 Model Diversification Top Model 24.71% 24.85% 26.69% 24.11% 22.95% 20.39% 19.87% 22.61% 27.27% 23.01% 21.74% 18.92% Top 3 Models 54.15% 54.25% 58.37% 49.25% 52.71% 52.15% 52.07% 55.19% 58.53% 56.11% 58.42% 53.66% SUVs and Trucks as % of Total Securitization Value 41.88% 41.83% 30.91% 30.80% 32.71% 31.73% 33.60% 29.92% 34.50% 28.27% 26.22% 19.17% Weighted Average FICO 764 764 762 760 759 758 755 754 754 754 751 754 Weighted Average LTV at Origination 93.54% 93.54% 93.89% 94.69% 92.77% 91.54% 91.38% 90.51% 90.89% 90.40% 91.67% 90.82% Weighted Average PTI at Origination 8.08% 8.06% 7.92% 7.84% 7.76% 7.72% 7.48% 7.41% 7.26% 7.23% 7.31% 7.19% Residual Portion of Securitization Value 63.82% 63.80% 64.33% 63.01% 64.26% 64.46% 64.24% 64.33% 64.36% 63.99% 62.45% 64.26% (1) Assumes the aggregate initial principal balance of the notes to be issued is $1,207,050,000 (2) Assumes the aggregate initial principal balance of the notes to be issued is $1,508,800,000 (3) The base residual value for a leased vehicle is the lesser of the contract residual value and the ALG base residual value. For a description of ALG base residual value, please refer to the endnote on slide 26 12 |
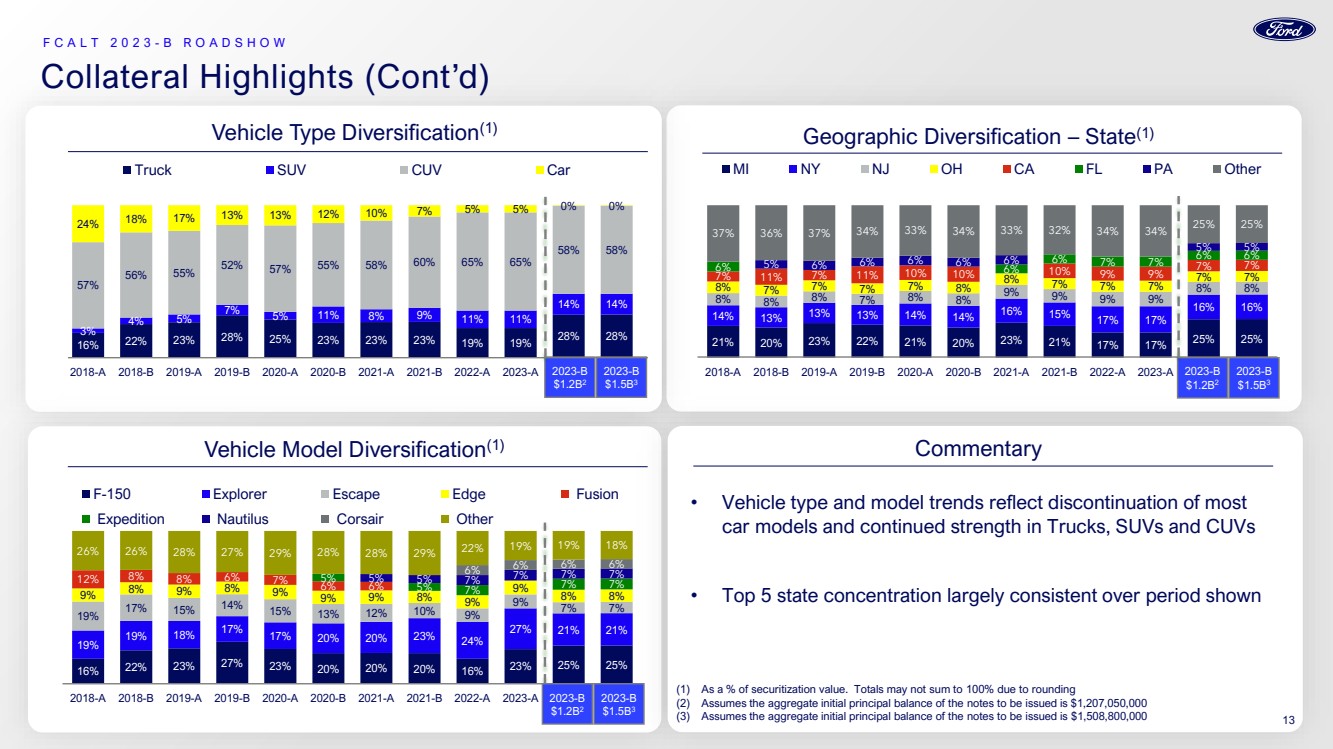
Secret 21% 20% 23% 22% 21% 20% 23% 21% 17% 17% 25% 25% 14% 13% 13% 13% 14% 14% 16% 15% 17% 17% 16% 16% 8% 8% 8% 7% 8% 8% 9% 9% 9% 9% 8% 7% 7% 7% 7% 8% 8% 8% 8% 7% 7% 7% 7% 11% 7% 11% 10% 10% 7% 7% 10% 9% 9% 6% 6% 7% 7% 6% 7% 7% 6% 6% 5% 6% 6% 6% 6% 6% 5% 5% 37% 36% 37% 34% 33% 34% 33% 32% 34% 34% 25% 25% 2018-A 2018-B 2019-A 2019-B 2020-A 2020-B 2021-A 2021-B 2022-A 2023-A 2023-B Base 2023-B Upsize MI NY NJ OH CA FL PA Other 16% 22% 23% 28% 25% 23% 23% 23% 19% 19% 28% 28% 3% 4% 5% 7% 5% 11% 8% 9% 11% 11% 14% 14% 57% 56% 55% 52% 57% 55% 58% 60% 65% 65% 58% 58% 24% 18% 17% 13% 13% 12% 10% 7% 5% 5% 0% 0% 2018-A 2018-B 2019-A 2019-B 2020-A 2020-B 2021-A 2021-B 2022-A 2023-A 2023-B Base(2) 2023-B Upsize Truck SUV CUV Car F C A L T 2 0 2 3 - B R O A D S H O W Collateral Highlights (Cont’d) Vehicle Type Diversification(1) Geographic Diversification – State(1) Vehicle Model Diversification(1) • Vehicle type and model trends reflect discontinuation of most car models and continued strength in Trucks, SUVs and CUVs • Top 5 state concentration largely consistent over period shown Commentary 2023-B $1.2B2 2023-B $1.5B3 (1) As a % of securitization value. Totals may not sum to 100% due to rounding (2) Assumes the aggregate initial principal balance of the notes to be issued is $1,207,050,000 (3) Assumes the aggregate initial principal balance of the notes to be issued is $1,508,800,000 16% 22% 23% 27% 23% 20% 20% 20% 16% 23% 25% 25% 19% 19% 18% 17% 17% 20% 20% 23% 24% 27% 21% 21% 19% 17% 15% 14% 15% 13% 12% 10% 9% 9% 7% 7% 9% 8% 9% 8% 9% 9% 9% 8% 9% 9% 8% 8% 12% 8% 8% 6% 7% 6% 6% 5% 5% 7% 7% 7% 5% 5% 7% 6% 7% 7% 7% 6% 6% 6% 26% 26% 28% 27% 29% 28% 28% 29% 22% 19% 19% 18% 2018-A 2018-B 2019-A 2019-B 2020-A 2020-B 2021-A 2021-B 2022-A 2023-A 2023-B Base 2023-B Upsize F-150 Explorer Escape Edge Fusion Expedition Nautilus Corsair Other 2023-B $1.2B2 2023-B $1.5B3 2023-B $1.2B2 2023-B $1.5B3 13 |
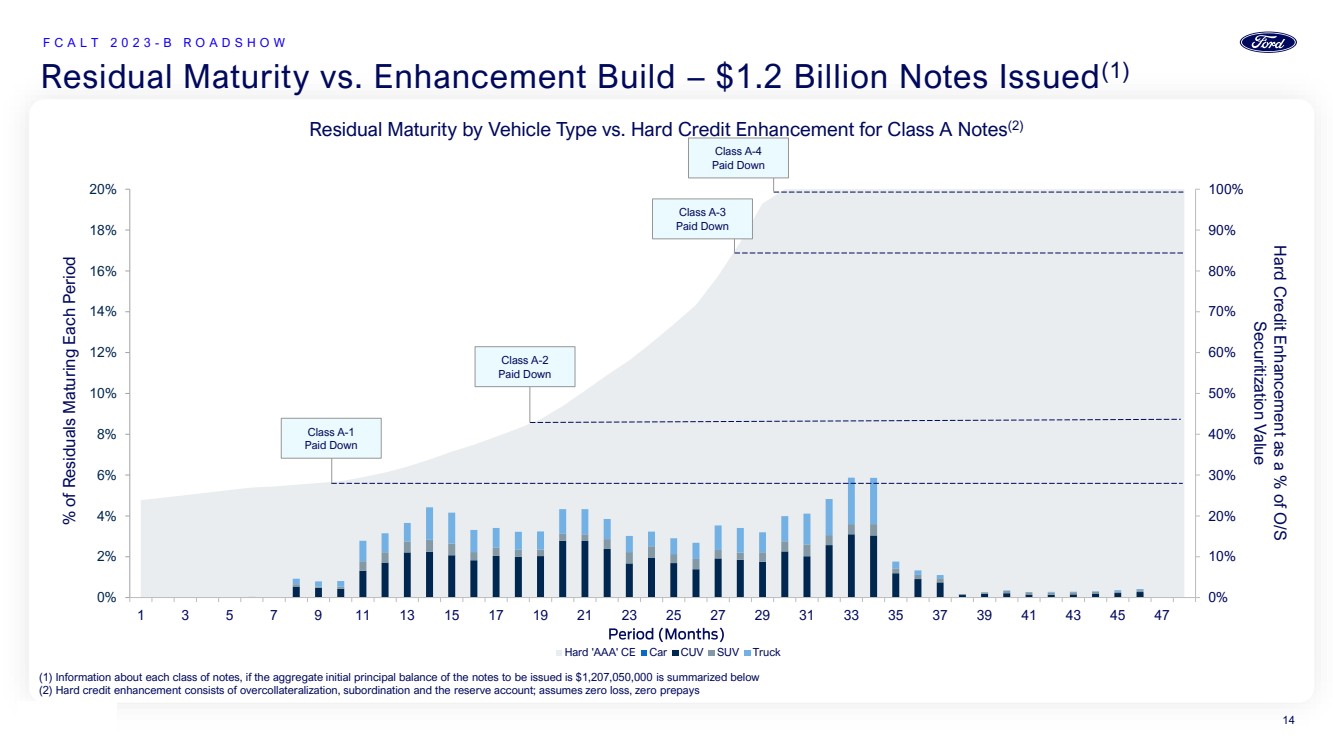
Secret Residual Maturity vs. Enhancement Build – $1.2 Billion Notes Issued(1) F C A L T 2 0 2 3 - B R O A D S H O W (1) Information about each class of notes, if the aggregate initial principal balance of the notes to be issued is $1,207,050,000 is summarized below (2) Hard credit enhancement consists of overcollateralization, subordination and the reserve account; assumes zero loss, zero prepays 0% 10% 20% 30% 40% 50% 60% 70% 80% 90% 100% 0% 2% 4% 6% 8% 10% 12% 14% 16% 18% 20% 1 3 5 7 9 11 13 15 17 19 21 23 25 27 29 31 33 35 37 39 41 43 45 47 Hard 'AAA' CE Car CUV SUV Truck % of Residuals Maturing Each Period Hard Credit Enhancement as a % of O/S Securitization Value Residual Maturity by Vehicle Type vs. Hard Credit Enhancement for Class A Notes(2) Class A-1 Paid Down Class A-4 Paid Down Class A-2 Paid Down Class A-3 Paid Down 14 |
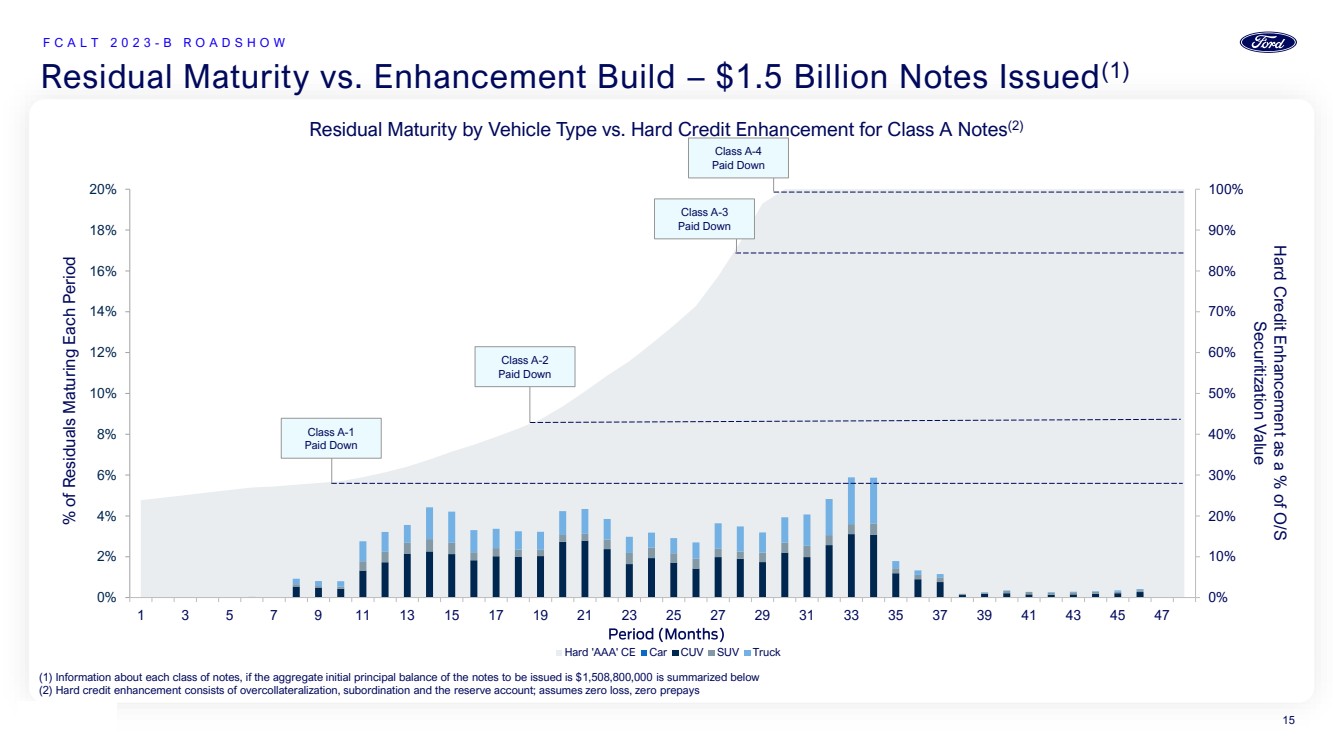
Secret Residual Maturity vs. Enhancement Build – $1.5 Billion Notes Issued(1) F C A L T 2 0 2 3 - B R O A D S H O W (1) Information about each class of notes, if the aggregate initial principal balance of the notes to be issued is $1,508,800,000 is summarized below (2) Hard credit enhancement consists of overcollateralization, subordination and the reserve account; assumes zero loss, zero prepays 0% 10% 20% 30% 40% 50% 60% 70% 80% 90% 100% 0% 2% 4% 6% 8% 10% 12% 14% 16% 18% 20% 1 3 5 7 9 11 13 15 17 19 21 23 25 27 29 31 33 35 37 39 41 43 45 47 Hard 'AAA' CE Car CUV SUV Truck % of Residuals Maturing Each Period Hard Credit Enhancement as a % of O/S Securitization Value Residual Maturity by Vehicle Type vs. Hard Credit Enhancement for Class A Notes(2) Class A-1 Paid Down Class A-4 Paid Down Class A-2 Paid Down Class A-3 Paid Down 15 |
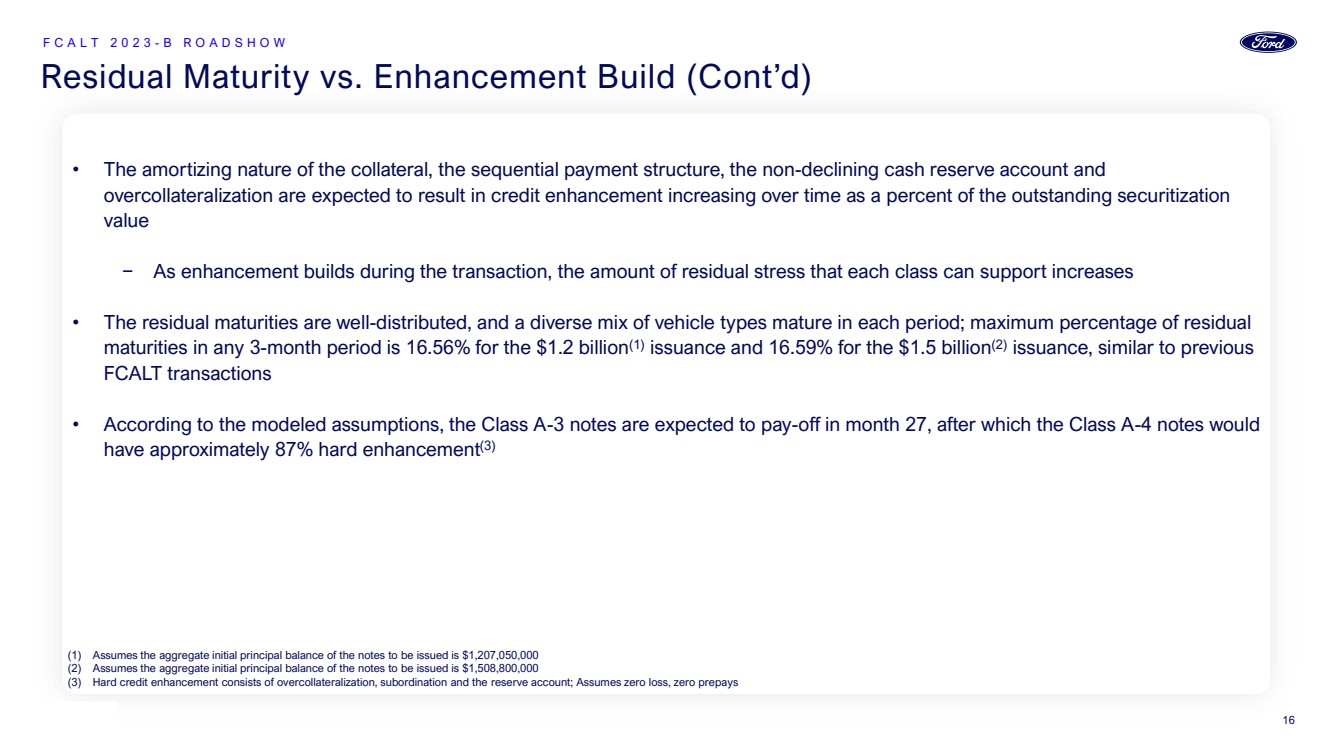
Secret Residual Maturity vs. Enhancement Build (Cont’d) F C A L T 2 0 2 3 - B R O A D S H O W • The amortizing nature of the collateral, the sequential payment structure, the non-declining cash reserve account and overcollateralization are expected to result in credit enhancement increasing over time as a percent of the outstanding securitization value − As enhancement builds during the transaction, the amount of residual stress that each class can support increases • The residual maturities are well-distributed, and a diverse mix of vehicle types mature in each period; maximum percentage of residual maturities in any 3-month period is 16.56% for the $1.2 billion(1) issuance and 16.59% for the $1.5 billion(2) issuance, similar to previous FCALT transactions • According to the modeled assumptions, the Class A-3 notes are expected to pay-off in month 27, after which the Class A-4 notes would have approximately 87% hard enhancement(3) (1) Assumes the aggregate initial principal balance of the notes to be issued is $1,207,050,000 (2) Assumes the aggregate initial principal balance of the notes to be issued is $1,508,800,000 (3) Hard credit enhancement consists of overcollateralization, subordination and the reserve account; Assumes zero loss, zero prepays 16 |
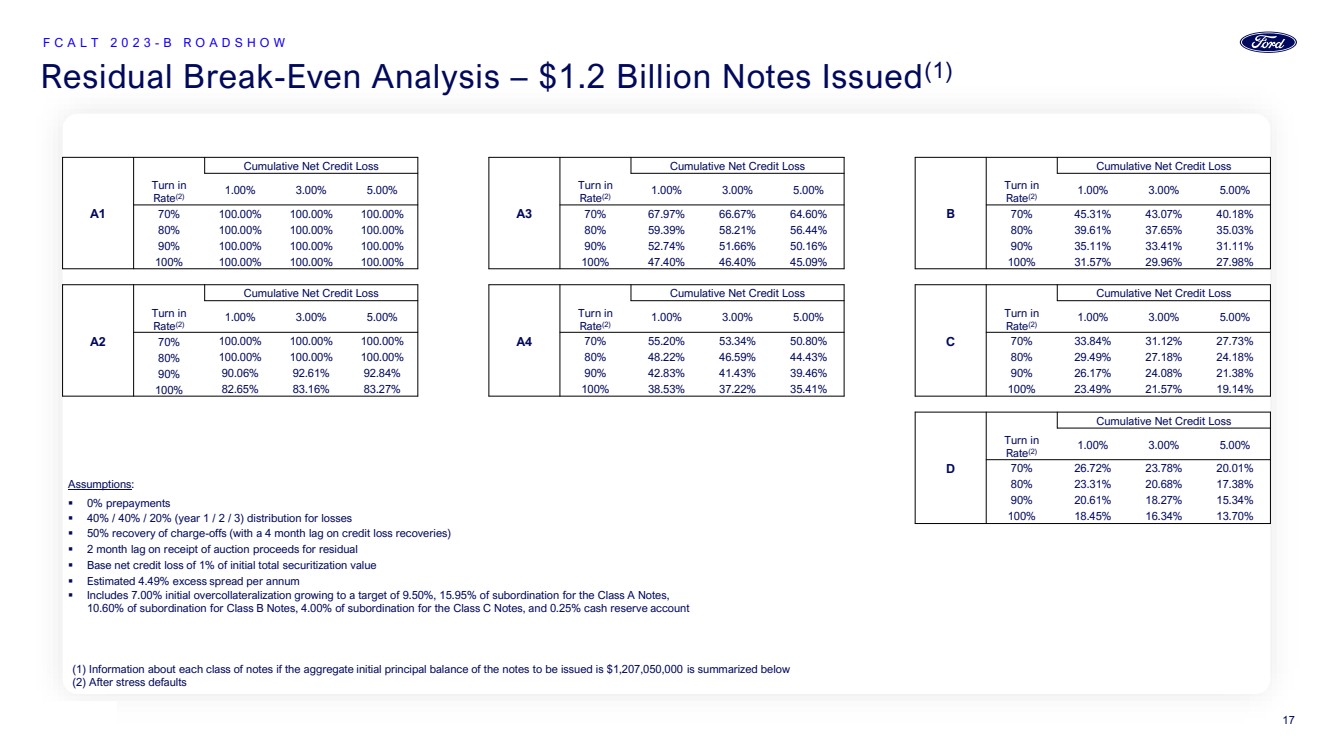
Secret Residual Break-Even Analysis – $1.2 Billion Notes Issued(1) F C A L T 2 0 2 3 - B R O A D S H O W (1) Information about each class of notes if the aggregate initial principal balance of the notes to be issued is $1,207,050,000 is summarized below (2) After stress defaults Assumptions: ▪ 0% prepayments ▪ 40% / 40% / 20% (year 1 / 2 / 3) distribution for losses ▪ 50% recovery of charge-offs (with a 4 month lag on credit loss recoveries) ▪ 2 month lag on receipt of auction proceeds for residual ▪ Base net credit loss of 1% of initial total securitization value ▪ Estimated 4.49% excess spread per annum ▪ Includes 7.00% initial overcollateralization growing to a target of 9.50%, 15.95% of subordination for the Class A Notes, 10.60% of subordination for Class B Notes, 4.00% of subordination for the Class C Notes, and 0.25% cash reserve account A1 Cumulative Net Credit Loss A3 Cumulative Net Credit Loss B Cumulative Net Credit Loss Turn in Rate(2) 1.00% 3.00% 5.00% Turn in Rate(2) 1.00% 3.00% 5.00% Turn in Rate(2) 1.00% 3.00% 5.00% 70% 100.00% 100.00% 100.00% 70% 67.97% 66.67% 64.60% 70% 45.31% 43.07% 40.18% 80% 100.00% 100.00% 100.00% 80% 59.39% 58.21% 56.44% 80% 39.61% 37.65% 35.03% 90% 100.00% 100.00% 100.00% 90% 52.74% 51.66% 50.16% 90% 35.11% 33.41% 31.11% 100% 100.00% 100.00% 100.00% 100% 47.40% 46.40% 45.09% 100% 31.57% 29.96% 27.98% A2 Cumulative Net Credit Loss A4 Cumulative Net Credit Loss C Cumulative Net Credit Loss Turn in Rate(2) 1.00% 3.00% 5.00% Turn in Rate(2) 1.00% 3.00% 5.00% Turn in Rate(2) 1.00% 3.00% 5.00% 70% 100.00% 100.00% 100.00% 70% 55.20% 53.34% 50.80% 70% 33.84% 31.12% 27.73% 80% 100.00% 100.00% 100.00% 80% 48.22% 46.59% 44.43% 80% 29.49% 27.18% 24.18% 90% 90.06% 92.61% 92.84% 90% 42.83% 41.43% 39.46% 90% 26.17% 24.08% 21.38% 100% 82.65% 83.16% 83.27% 100% 38.53% 37.22% 35.41% 100% 23.49% 21.57% 19.14% D Cumulative Net Credit Loss Turn in Rate(2) 1.00% 3.00% 5.00% 70% 26.72% 23.78% 20.01% 80% 23.31% 20.68% 17.38% 90% 20.61% 18.27% 15.34% 100% 18.45% 16.34% 13.70% 17 |
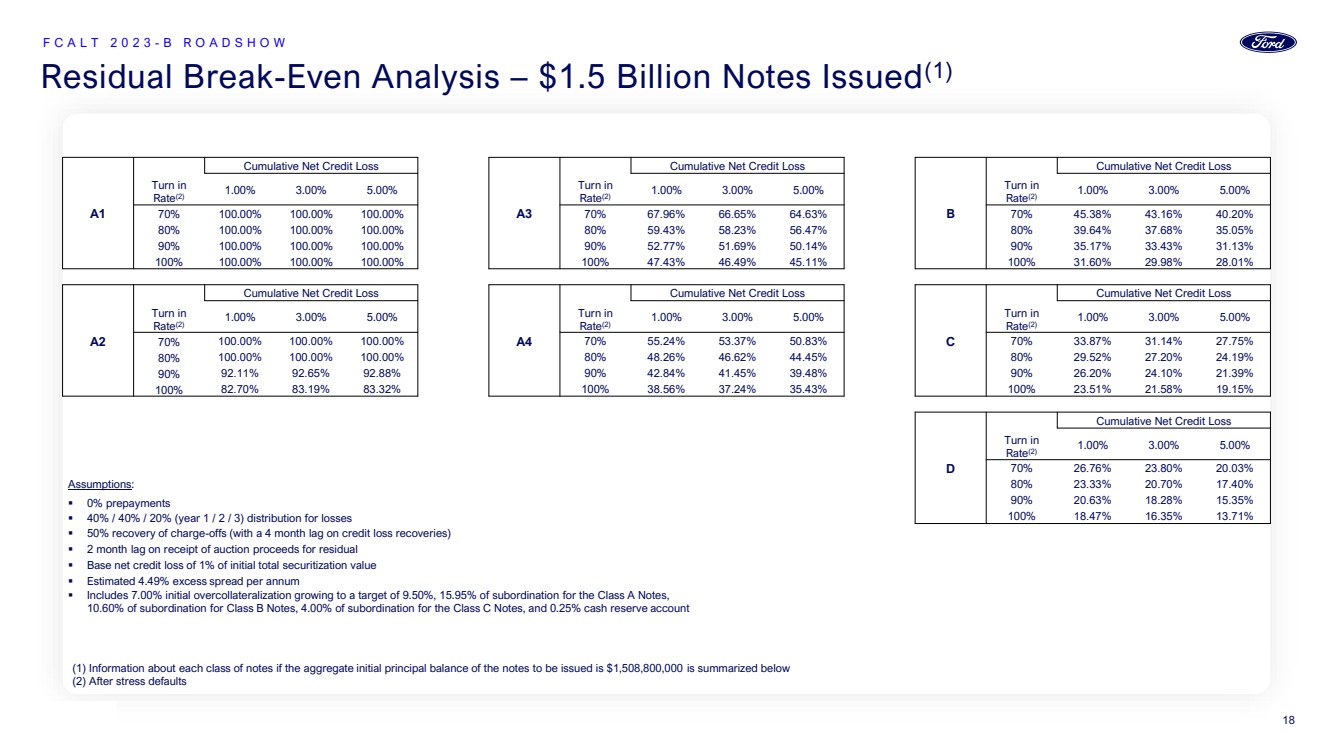
Secret Residual Break-Even Analysis – $1.5 Billion Notes Issued(1) F C A L T 2 0 2 3 - B R O A D S H O W (1) Information about each class of notes if the aggregate initial principal balance of the notes to be issued is $1,508,800,000 is summarized below (2) After stress defaults Assumptions: ▪ 0% prepayments ▪ 40% / 40% / 20% (year 1 / 2 / 3) distribution for losses ▪ 50% recovery of charge-offs (with a 4 month lag on credit loss recoveries) ▪ 2 month lag on receipt of auction proceeds for residual ▪ Base net credit loss of 1% of initial total securitization value ▪ Estimated 4.49% excess spread per annum ▪ Includes 7.00% initial overcollateralization growing to a target of 9.50%, 15.95% of subordination for the Class A Notes, 10.60% of subordination for Class B Notes, 4.00% of subordination for the Class C Notes, and 0.25% cash reserve account A1 Cumulative Net Credit Loss A3 Cumulative Net Credit Loss B Cumulative Net Credit Loss Turn in Rate(2) 1.00% 3.00% 5.00% Turn in Rate(2) 1.00% 3.00% 5.00% Turn in Rate(2) 1.00% 3.00% 5.00% 70% 100.00% 100.00% 100.00% 70% 67.96% 66.65% 64.63% 70% 45.38% 43.16% 40.20% 80% 100.00% 100.00% 100.00% 80% 59.43% 58.23% 56.47% 80% 39.64% 37.68% 35.05% 90% 100.00% 100.00% 100.00% 90% 52.77% 51.69% 50.14% 90% 35.17% 33.43% 31.13% 100% 100.00% 100.00% 100.00% 100% 47.43% 46.49% 45.11% 100% 31.60% 29.98% 28.01% A2 Cumulative Net Credit Loss A4 Cumulative Net Credit Loss C Cumulative Net Credit Loss Turn in Rate(2) 1.00% 3.00% 5.00% Turn in Rate(2) 1.00% 3.00% 5.00% Turn in Rate(2) 1.00% 3.00% 5.00% 70% 100.00% 100.00% 100.00% 70% 55.24% 53.37% 50.83% 70% 33.87% 31.14% 27.75% 80% 100.00% 100.00% 100.00% 80% 48.26% 46.62% 44.45% 80% 29.52% 27.20% 24.19% 90% 92.11% 92.65% 92.88% 90% 42.84% 41.45% 39.48% 90% 26.20% 24.10% 21.39% 100% 82.70% 83.19% 83.32% 100% 38.56% 37.24% 35.43% 100% 23.51% 21.58% 19.15% D Cumulative Net Credit Loss Turn in Rate(2) 1.00% 3.00% 5.00% 70% 26.76% 23.80% 20.03% 80% 23.33% 20.70% 17.40% 90% 20.63% 18.28% 15.35% 100% 18.47% 16.35% 13.71% 18 |
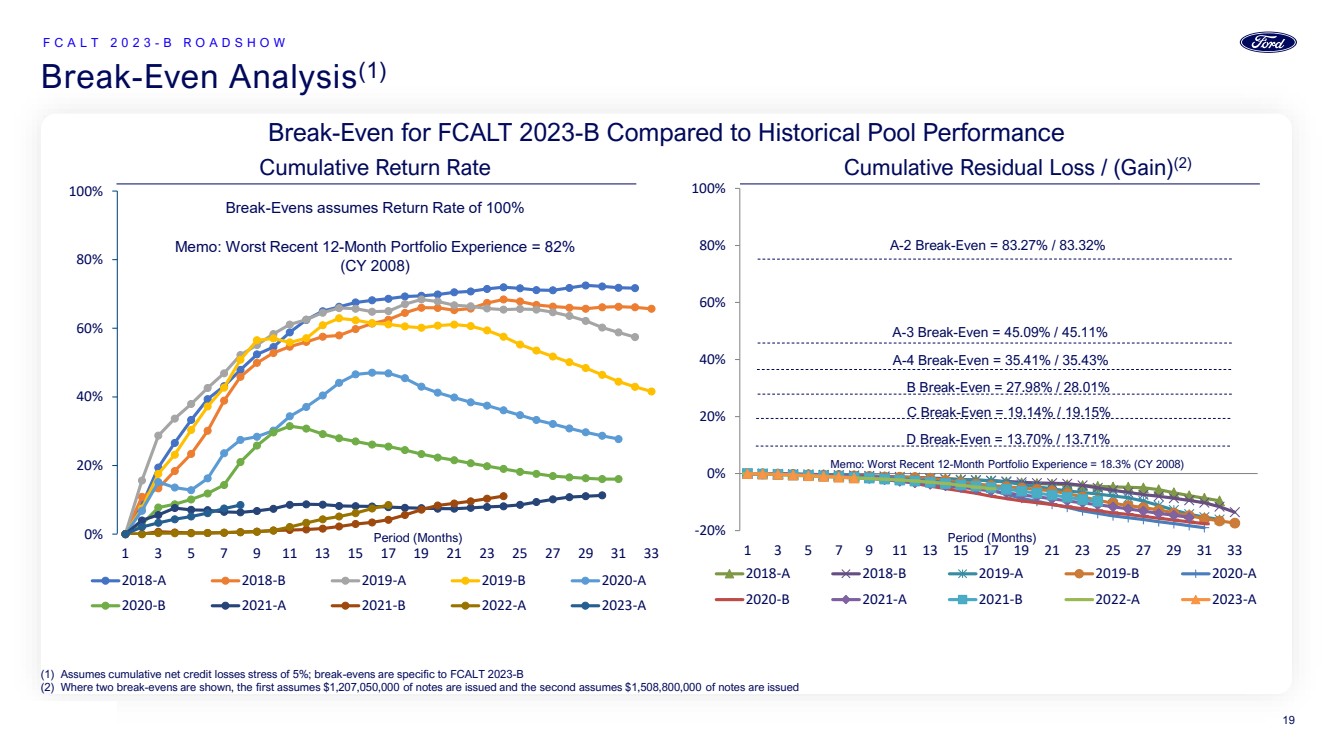
Secret Break-Even Analysis(1) F C A L T 2 0 2 3 - B R O A D S H O W Break-Even for FCALT 2023-B Compared to Historical Pool Performance (1) Assumes cumulative net credit losses stress of 5%; break-evens are specific to FCALT 2023-B (2) Where two break-evens are shown, the first assumes $1,207,050,000 of notes are issued and the second assumes $1,508,800,000 of notes are issued 0% 20% 40% 60% 80% 100% 1 3 5 7 9 11 13 15 17 19 21 23 25 27 29 31 33 2018-A 2018-B 2019-A 2019-B 2020-A 2020-B 2021-A 2021-B 2022-A 2023-A -20% 0% 20% 40% 60% 80% 100% 1 3 5 7 9 11 13 15 17 19 21 23 25 27 29 31 33 2018-A 2018-B 2019-A 2019-B 2020-A 2020-B 2021-A 2021-B 2022-A 2023-A Cumulative Return Rate Cumulative Residual Loss / (Gain)(2) Memo: Worst Recent 12-Month Portfolio Experience = 18.3% (CY 2008) Memo: Worst Recent 12-Month Portfolio Experience = 82% (CY 2008) Break-Evens assumes Return Rate of 100% A-2 Break-Even = 83.27% / 83.32% A-3 Break-Even = 45.09% / 45.11% A-4 Break-Even = 35.41% / 35.43% B Break-Even = 27.98% / 28.01% C Break-Even = 19.14% / 19.15% D Break-Even = 13.70% / 13.71% Period (Months) Period (Months) 19 |
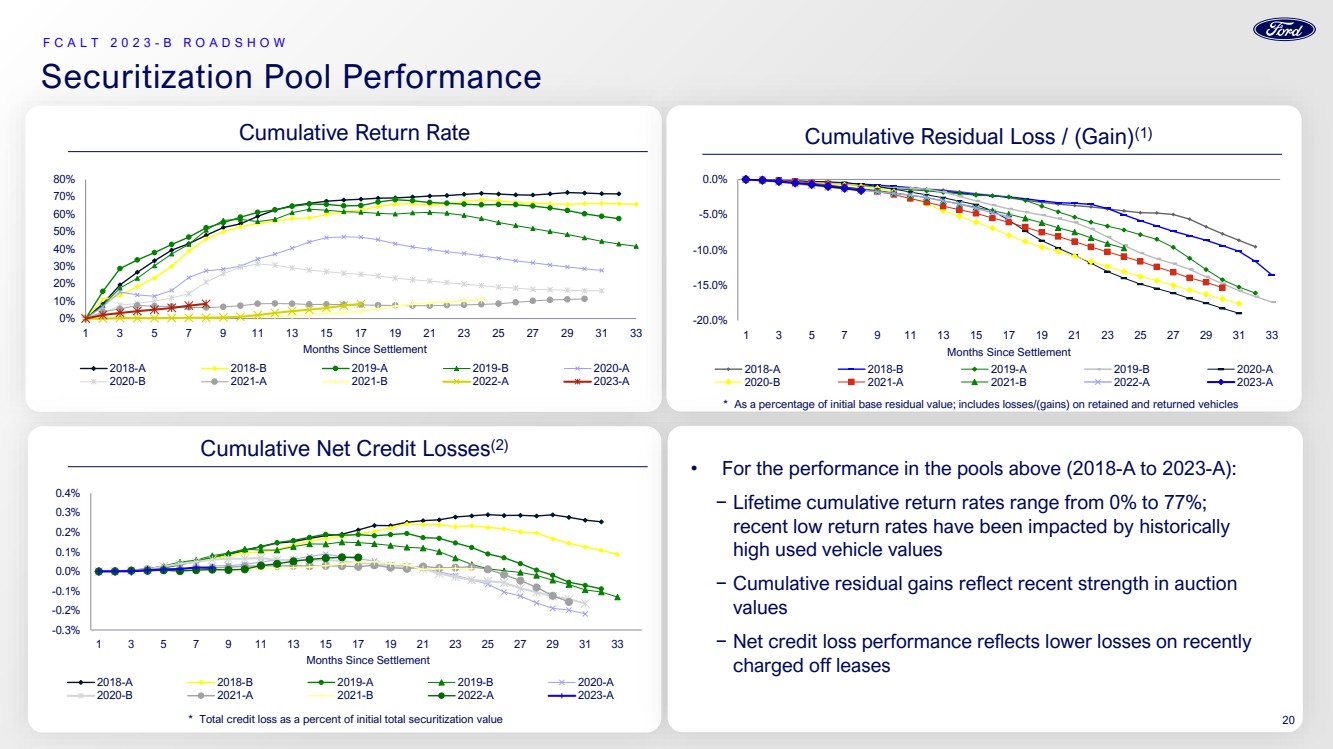
Secret F C A L T 2 0 2 3 - B R O A D S H O W Securitization Pool Performance Cumulative Return Rate Cumulative Residual Loss / (Gain)(1) Cumulative Net Credit Losses(2) 0% 10% 20% 30% 40% 50% 60% 70% 80% 1 3 5 7 9 11 13 15 17 19 21 23 25 27 29 31 33 Months Since Settlement 2018-A 2018-B 2019-A 2019-B 2020-A 2020-B 2021-A 2021-B 2022-A 2023-A -20.0% -15.0% -10.0% -5.0% 0.0% 1 3 5 7 9 11 13 15 17 19 21 23 25 27 29 31 33 Months Since Settlement 2018-A 2018-B 2019-A 2019-B 2020-A 2020-B 2021-A 2021-B 2022-A 2023-A -0.3% -0.2% -0.1% 0.0% 0.1% 0.2% 0.3% 0.4% 1 3 5 7 9 11 13 15 17 19 21 23 25 27 29 31 33 Months Since Settlement 2018-A 2018-B 2019-A 2019-B 2020-A 2020-B 2021-A 2021-B 2022-A 2023-A * As a percentage of initial base residual value; includes losses/(gains) on retained and returned vehicles * Total credit loss as a percent of initial total securitization value • For the performance in the pools above (2018-A to 2023-A): − Lifetime cumulative return rates range from 0% to 77%; recent low return rates have been impacted by historically high used vehicle values − Cumulative residual gains reflect recent strength in auction values − Net credit loss performance reflects lower losses on recently charged off leases 20 |
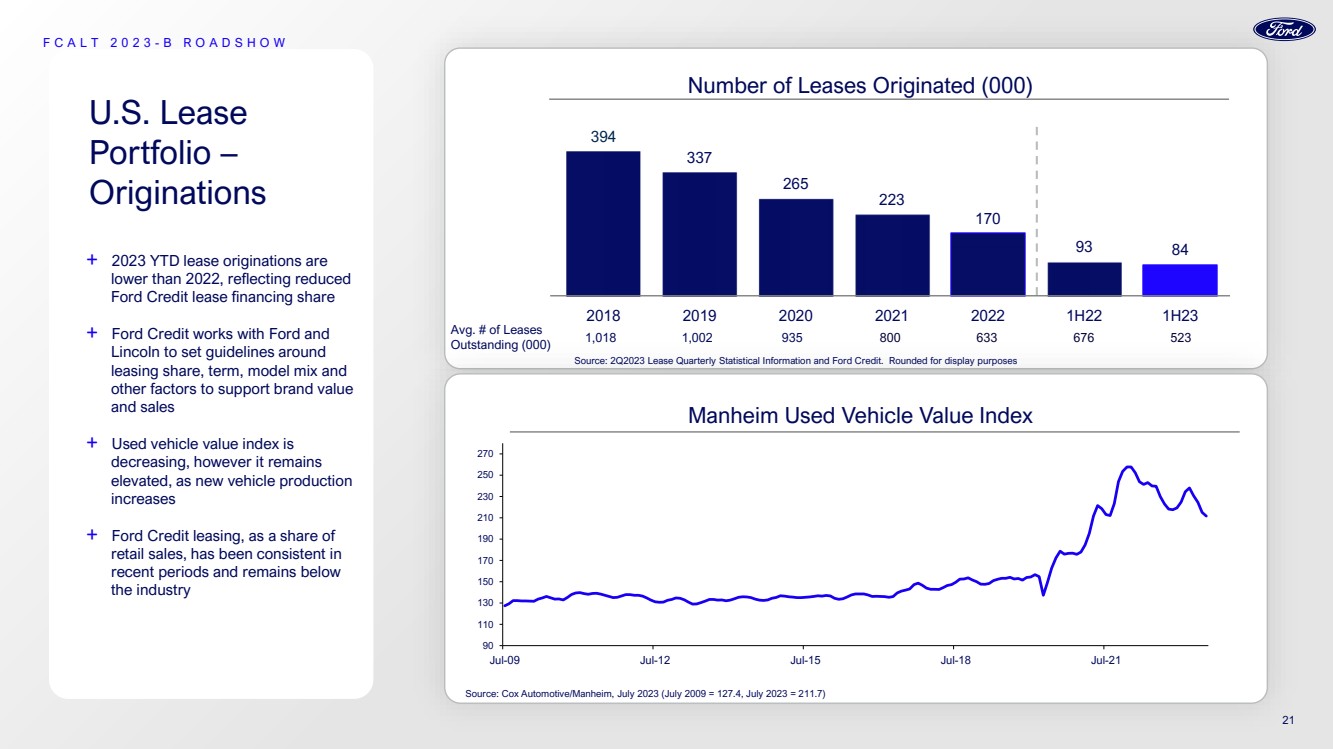
U.S. Lease Portfolio – Originations + 2023 YTD lease originations are lower than 2022, reflecting reduced Ford Credit lease financing share + Ford Credit works with Ford and Lincoln to set guidelines around leasing share, term, model mix and other factors to support brand value and sales + Used vehicle value index is decreasing, however it remains elevated, as new vehicle production increases + Ford Credit leasing, as a share of retail sales, has been consistent in recent periods and remains below the industry 394 337 265 223 170 93 84 2018 2019 2020 2021 2022 1H22 1H23 Number of Leases Originated (000) Avg. # of Leases Outstanding (000) 1,018 1,002 935 800 633 676 523 90 110 130 150 170 190 210 230 250 270 Jul-09 Jul-12 Jul-15 Jul-18 Jul-21 Source: Cox Automotive/Manheim, July 2023 (July 2009 = 127.4, July 2023 = 211.7) Manheim Used Vehicle Value Index F C A L T 2 0 2 3 - B R O A D S H O W Source: 2Q2023 Lease Quarterly Statistical Information and Ford Credit. Rounded for display purposes 21 |
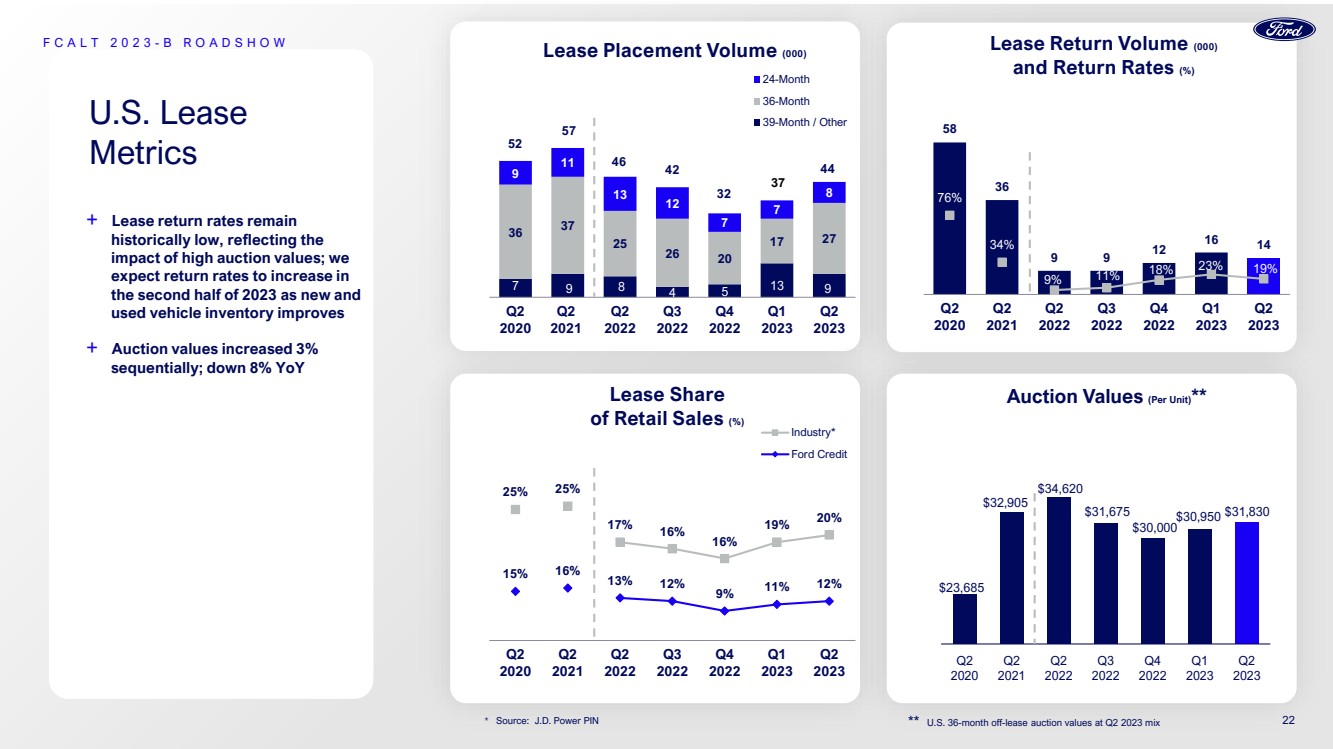
7 9 8 4 5 13 9 36 37 25 26 20 17 27 9 11 13 12 7 7 8 Q2 2020 Q2 2021 Q2 2022 Q3 2022 Q4 2022 Q1 2023 Q2 2023 Lease Placement Volume (000) 24-Month 36-Month 39-Month / Other 32 37 15% 16% 13% 12% 9% 11% 12% 25% 25% 17% 16% 16% 19% 20% Q2 2020 Q2 2021 Q2 2022 Q3 2022 Q4 2022 Q1 2023 Q2 2023 Lease Share of Retail Sales (%) Industry* Ford Credit * Source: J.D. Power PIN 58 36 9 9 12 16 14 76% 34% 9% 11% 18% 23% 19% Q2 2020 Q2 2021 Q2 2022 Q3 2022 Q4 2022 Q1 2023 Q2 2023 Lease Return Volume (000) and Return Rates (%) U.S. Lease Metrics + Lease return rates remain historically low, reflecting the impact of high auction values; we expect return rates to increase in the second half of 2023 as new and used vehicle inventory improves + Auction values increased 3% sequentially; down 8% YoY 52 57 46 42 44 $23,685 $32,905 $34,620 $31,675 $30,000 $30,950 $31,830 Q2 2020 Q2 2021 Q2 2022 Q3 2022 Q4 2022 Q1 2023 Q2 2023 Auction Values (Per Unit) ** ** U.S. 36-month off-lease auction values at Q2 2023 mix F C A L T 2 0 2 3 - B R O A D S H O W 22 |
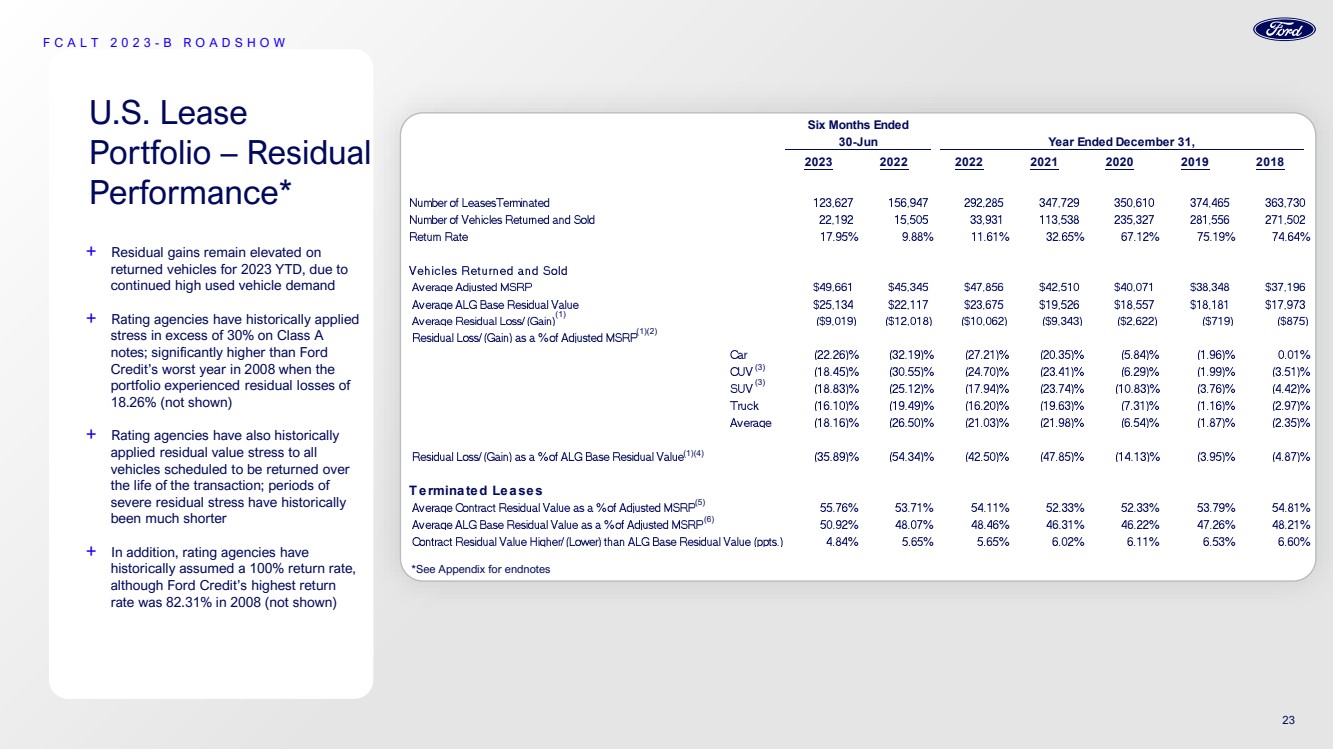
2023 2022 2022 2021 2020 2019 2018 T erminated Leases Year Ended December 31, Six Months Ended 30-Jun U.S. Lease Portfolio – Residual Performance* + Residual gains remain elevated on returned vehicles for 2023 YTD, due to continued high used vehicle demand + Rating agencies have historically applied stress in excess of 30% on Class A notes; significantly higher than Ford Credit’s worst year in 2008 when the portfolio experienced residual losses of 18.26% (not shown) + Rating agencies have also historically applied residual value stress to all vehicles scheduled to be returned over the life of the transaction; periods of severe residual stress have historically been much shorter + In addition, rating agencies have historically assumed a 100% return rate, although Ford Credit’s highest return rate was 82.31% in 2008 (not shown) F C A L T 2 0 2 3 - B R O A D S H O W *See Appendix for endnotes (1)(2) (3) (1)(4) (5) (6) (1) (3) 23 |
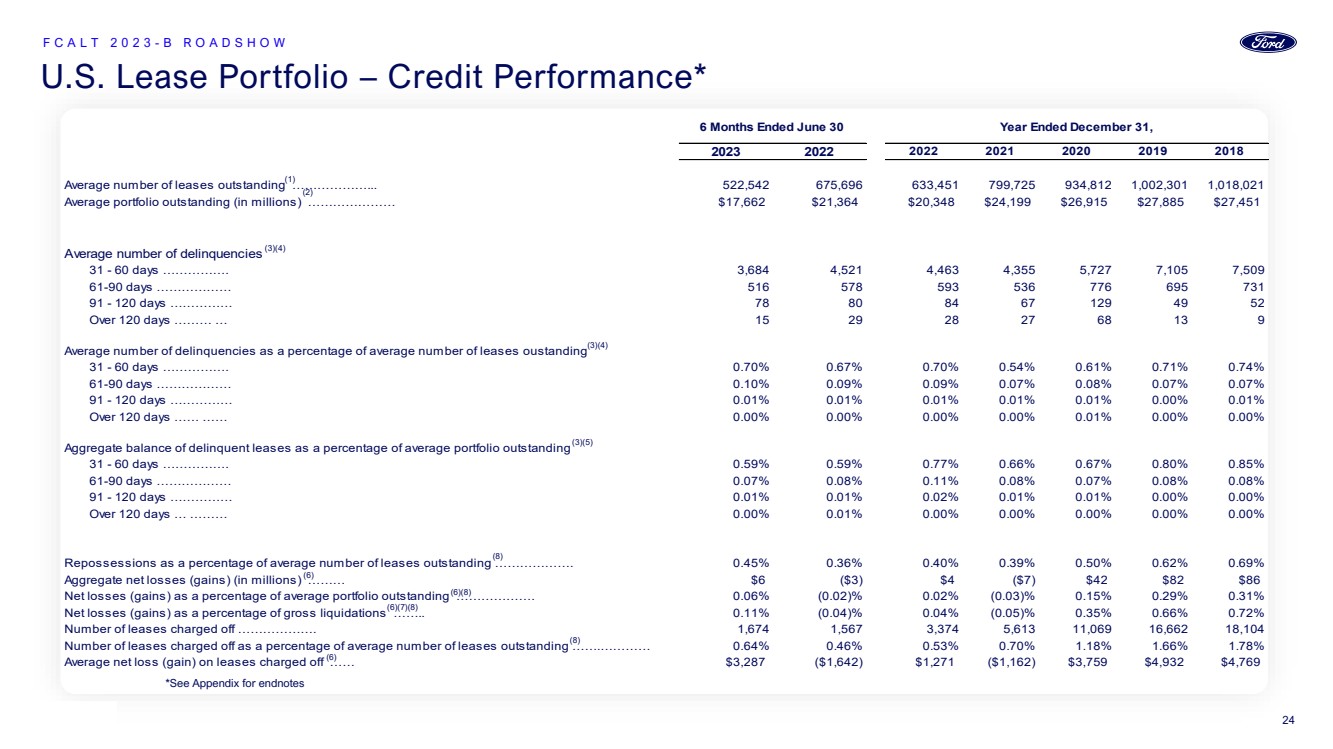
Secret 2023 2022 2022 2021 2020 2019 2018 Average number of leases outstanding ………………... 522,542 675,696 633,451 799,725 934,812 1,002,301 1,018,021 Average portfolio outstanding (in millions) ………………… $17,662 $21,364 $20,348 $24,199 $26,915 $27,885 $27,451 Average number of delinquencies 31 - 60 days ……………. 3,684 4,521 4,463 4,355 5,727 7,105 7,509 61-90 days ……………… 516 578 593 536 776 695 731 91 - 120 days …………… 7 8 8 0 8 4 6 7 129 4 9 5 2 Over 120 days ……… … 1 5 2 9 2 8 2 7 6 8 1 3 9 31 - 60 days ……………. 0.70% 0.67% 0.70% 0.54% 0.61% 0.71% 0.74% 61-90 days ……………… 0.10% 0.09% 0.09% 0.07% 0.08% 0.07% 0.07% 91 - 120 days …………… 0.01% 0.01% 0.01% 0.01% 0.01% 0.00% 0.01% Over 120 days …… …… 0.00% 0.00% 0.00% 0.00% 0.01% 0.00% 0.00% 31 - 60 days ……………. 0.59% 0.59% 0.77% 0.66% 0.67% 0.80% 0.85% 61-90 days ……………… 0.07% 0.08% 0.11% 0.08% 0.07% 0.08% 0.08% 91 - 120 days …………… 0.01% 0.01% 0.02% 0.01% 0.01% 0.00% 0.00% Over 120 days … ……… 0.00% 0.01% 0.00% 0.00% 0.00% 0.00% 0.00% Repossessions as a percentage of average number of leases outstanding ………………. 0.45% 0.36% 0.40% 0.39% 0.50% 0.62% 0.69% Aggregate net losses (gains) (in millions) ……… $ 6 ($3) $ 4 ($7) $42 $82 $86 Net losses (gains) as a percentage of average portfolio outstanding ………………. 0.06% (0.02)% 0.02% (0.03)% 0.15% 0.29% 0.31% Net losses (gains) as a percentage of gross liquidations …….. 0.11% (0.04)% 0.04% (0.05)% 0.35% 0.66% 0.72% Number of leases charged off ………………. 1,674 1,567 3,374 5,613 11,069 16,662 18,104 Number of leases charged off as a percentage of average number of leases outstanding …….………… 0.64% 0.46% 0.53% 0.70% 1.18% 1.66% 1.78% Average net loss (gain) on leases charged off …… $3,287 ($1,642) $1,271 ($1,162) $3,759 $4,932 $4,769 Aggregate balance of delinquent leases as a percentage of average portfolio outstanding 6 Months Ended June 30 Year Ended December 31, Average number of delinquencies as a percentage of average number of leases oustanding U.S. Lease Portfolio – Credit Performance* F C A L T 2 0 2 3 - B R O A D S H O W *See Appendix for endnotes (6)(7)(8) (6)(8) (1) (2) (3)(5) (3)(4) (3)(4) (6) (6) (8) (8) 24 |
Secret Appendix 25 |
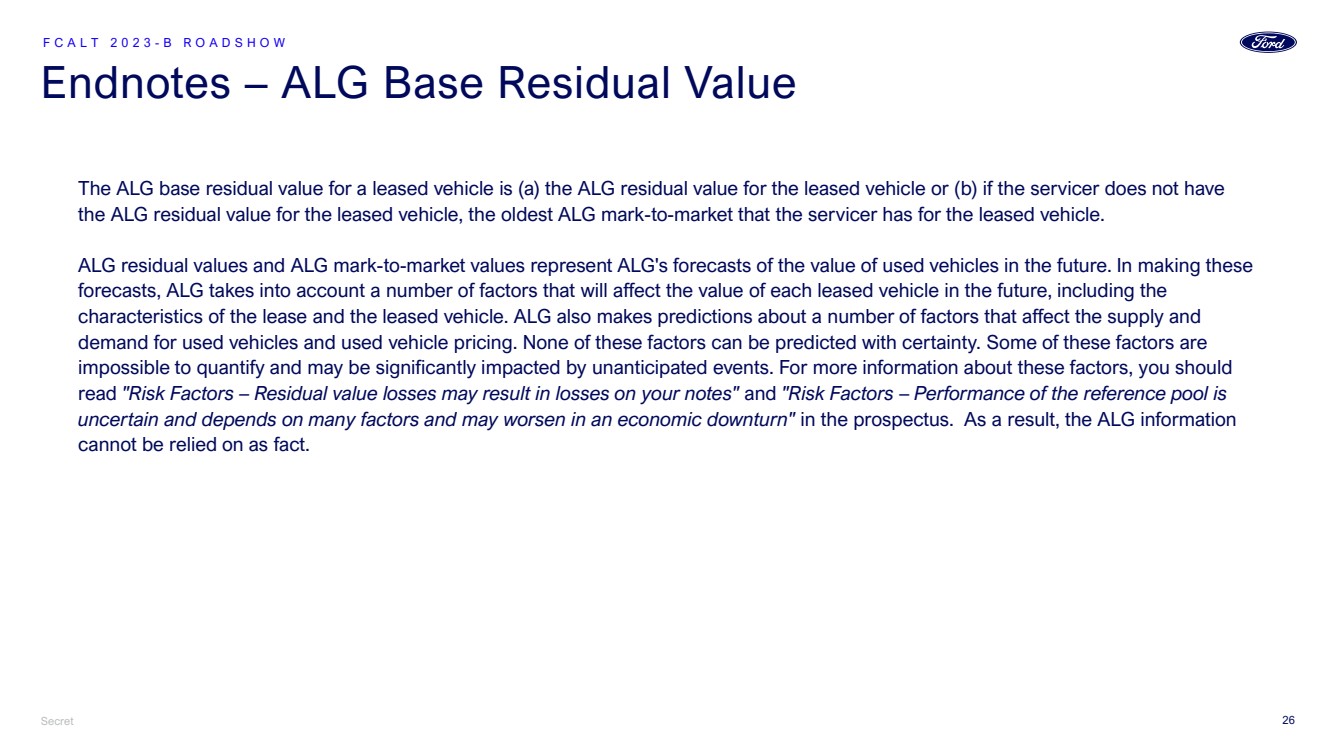
Secret Endnotes – ALG Base Residual Value F C A L T 2 0 2 3 - B R O A D S H O W The ALG base residual value for a leased vehicle is (a) the ALG residual value for the leased vehicle or (b) if the servicer does not have the ALG residual value for the leased vehicle, the oldest ALG mark-to-market that the servicer has for the leased vehicle. ALG residual values and ALG mark-to-market values represent ALG's forecasts of the value of used vehicles in the future. In making these forecasts, ALG takes into account a number of factors that will affect the value of each leased vehicle in the future, including the characteristics of the lease and the leased vehicle. ALG also makes predictions about a number of factors that affect the supply and demand for used vehicles and used vehicle pricing. None of these factors can be predicted with certainty. Some of these factors are impossible to quantify and may be significantly impacted by unanticipated events. For more information about these factors, you should read "Risk Factors – Residual value losses may result in losses on your notes" and "Risk Factors – Performance of the reference pool is uncertain and depends on many factors and may worsen in an economic downturn" in the prospectus. As a result, the ALG information cannot be relied on as fact. 26 |
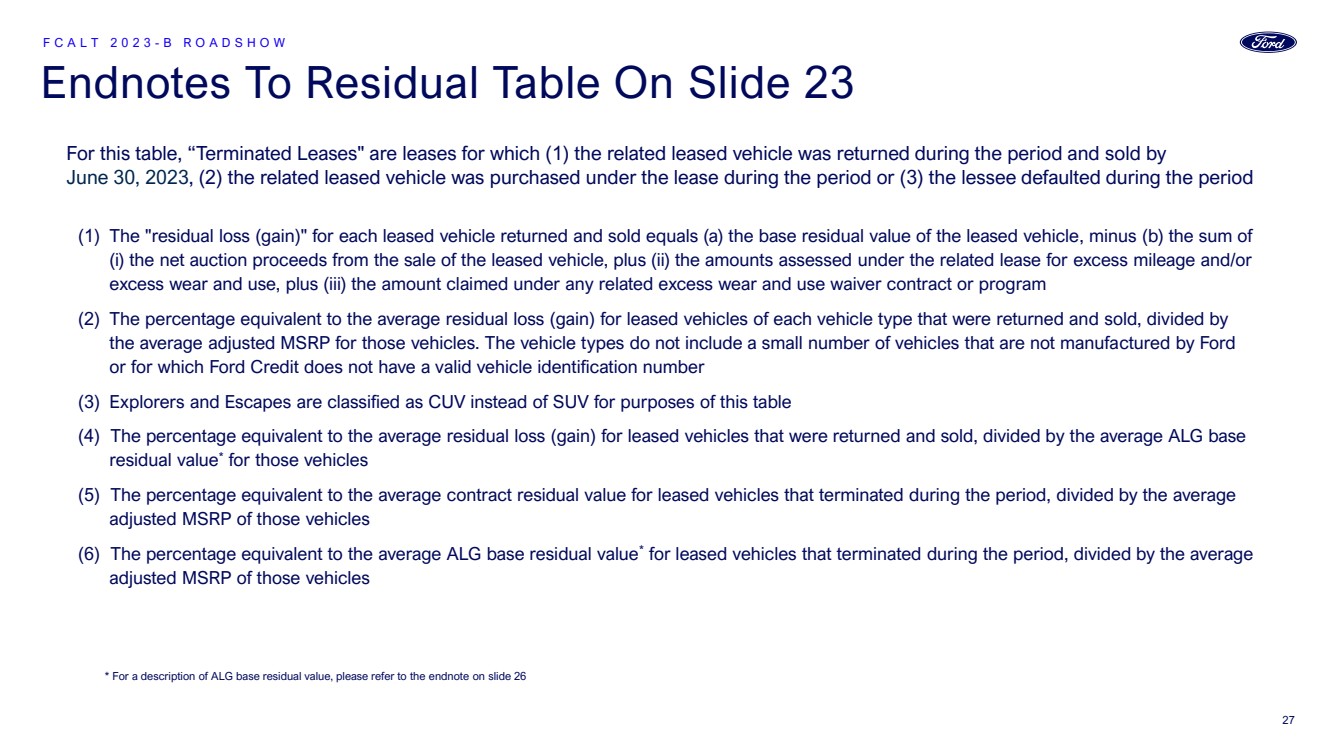
Endnotes To Residual Table On Slide 23 F C A L T 2 0 2 3 - B R O A D S H O W (1) The "residual loss (gain)" for each leased vehicle returned and sold equals (a) the base residual value of the leased vehicle, minus (b) the sum of (i) the net auction proceeds from the sale of the leased vehicle, plus (ii) the amounts assessed under the related lease for excess mileage and/or excess wear and use, plus (iii) the amount claimed under any related excess wear and use waiver contract or program (2) The percentage equivalent to the average residual loss (gain) for leased vehicles of each vehicle type that were returned and sold, divided by the average adjusted MSRP for those vehicles. The vehicle types do not include a small number of vehicles that are not manufactured by Ford or for which Ford Credit does not have a valid vehicle identification number (3) Explorers and Escapes are classified as CUV instead of SUV for purposes of this table (4) The percentage equivalent to the average residual loss (gain) for leased vehicles that were returned and sold, divided by the average ALG base residual value* for those vehicles (5) The percentage equivalent to the average contract residual value for leased vehicles that terminated during the period, divided by the average adjusted MSRP of those vehicles (6) The percentage equivalent to the average ALG base residual value* for leased vehicles that terminated during the period, divided by the average adjusted MSRP of those vehicles For this table, “Terminated Leases" are leases for which (1) the related leased vehicle was returned during the period and sold by June 30, 2023, (2) the related leased vehicle was purchased under the lease during the period or (3) the lessee defaulted during the period * For a description of ALG base residual value, please refer to the endnote on slide 26 27 |
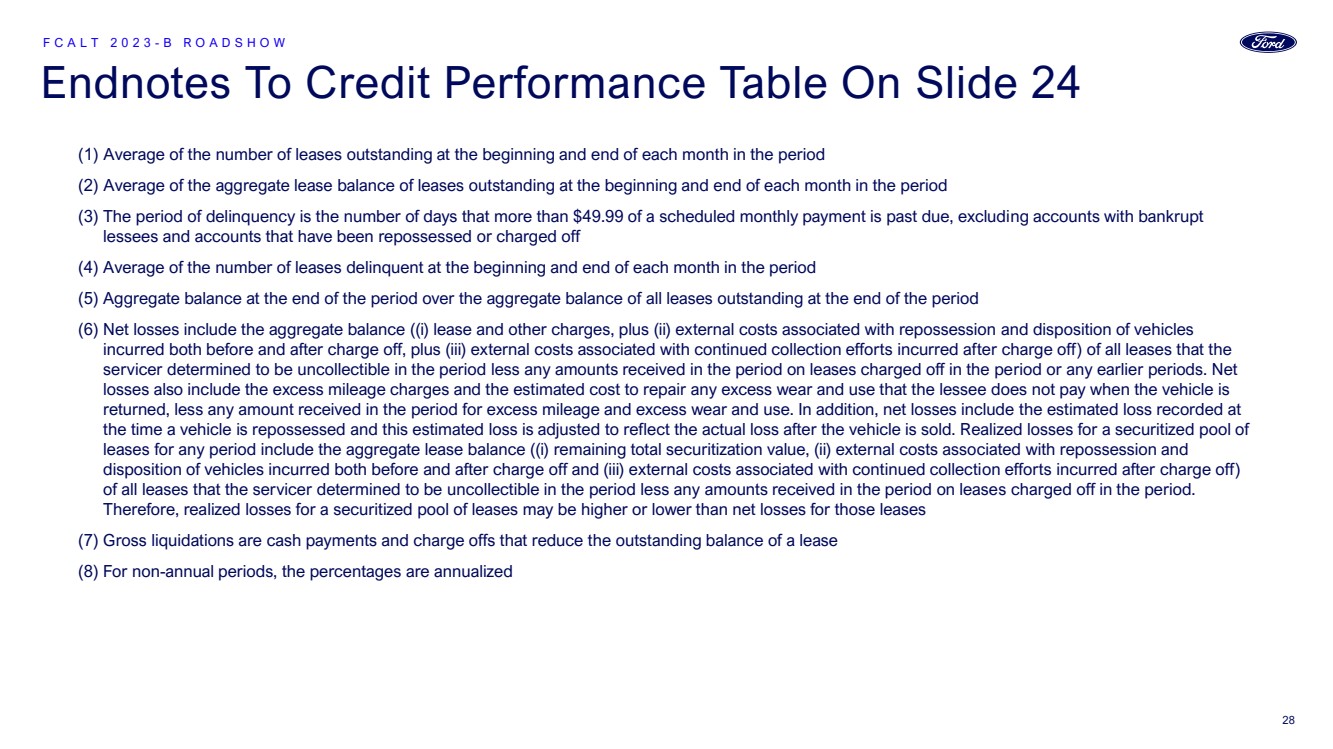
Endnotes To Credit Performance Table On Slide 24 F C A L T 2 0 2 3 - B R O A D S H O W (1) Average of the number of leases outstanding at the beginning and end of each month in the period (2) Average of the aggregate lease balance of leases outstanding at the beginning and end of each month in the period (3) The period of delinquency is the number of days that more than $49.99 of a scheduled monthly payment is past due, excluding accounts with bankrupt lessees and accounts that have been repossessed or charged off (4) Average of the number of leases delinquent at the beginning and end of each month in the period (5) Aggregate balance at the end of the period over the aggregate balance of all leases outstanding at the end of the period (6) Net losses include the aggregate balance ((i) lease and other charges, plus (ii) external costs associated with repossession and disposition of vehicles incurred both before and after charge off, plus (iii) external costs associated with continued collection efforts incurred after charge off) of all leases that the servicer determined to be uncollectible in the period less any amounts received in the period on leases charged off in the period or any earlier periods. Net losses also include the excess mileage charges and the estimated cost to repair any excess wear and use that the lessee does not pay when the vehicle is returned, less any amount received in the period for excess mileage and excess wear and use. In addition, net losses include the estimated loss recorded at the time a vehicle is repossessed and this estimated loss is adjusted to reflect the actual loss after the vehicle is sold. Realized losses for a securitized pool of leases for any period include the aggregate lease balance ((i) remaining total securitization value, (ii) external costs associated with repossession and disposition of vehicles incurred both before and after charge off and (iii) external costs associated with continued collection efforts incurred after charge off) of all leases that the servicer determined to be uncollectible in the period less any amounts received in the period on leases charged off in the period. Therefore, realized losses for a securitized pool of leases may be higher or lower than net losses for those leases (7) Gross liquidations are cash payments and charge offs that reduce the outstanding balance of a lease (8) For non-annual periods, the percentages are annualized 28 |