
1 2024 Year-End Earnings Webcast February 13, 2025 8-K February 13, 2025

NorthWestern Energy 2 Forward Looking Statements During the course of this presentation, there will be forward-looking statements within the meaning of the “safe harbor” provisions of the Private Securities Litigation Reform Act of 1995. Forward-looking statements often address our expected future business and financial performance, and often contain words such as “expects,” “anticipates,” “intends,” “plans,” “believes,” “seeks,” or “will.” The information in this presentation is based upon our current expectations as of the date of this document unless otherwise noted. Our actual future business and financial performance may differ materially and adversely from our expectations expressed in any forward-looking statements. We undertake no obligation to revise or publicly update our forward-looking statements or this presentation for any reason. Although our expectations and beliefs are based on reasonable assumptions, actual results may differ materially. The factors that may affect our results are listed in certain of our press releases and disclosed in the Company’s 10-K and 10-Q along with other public filings with the SEC.
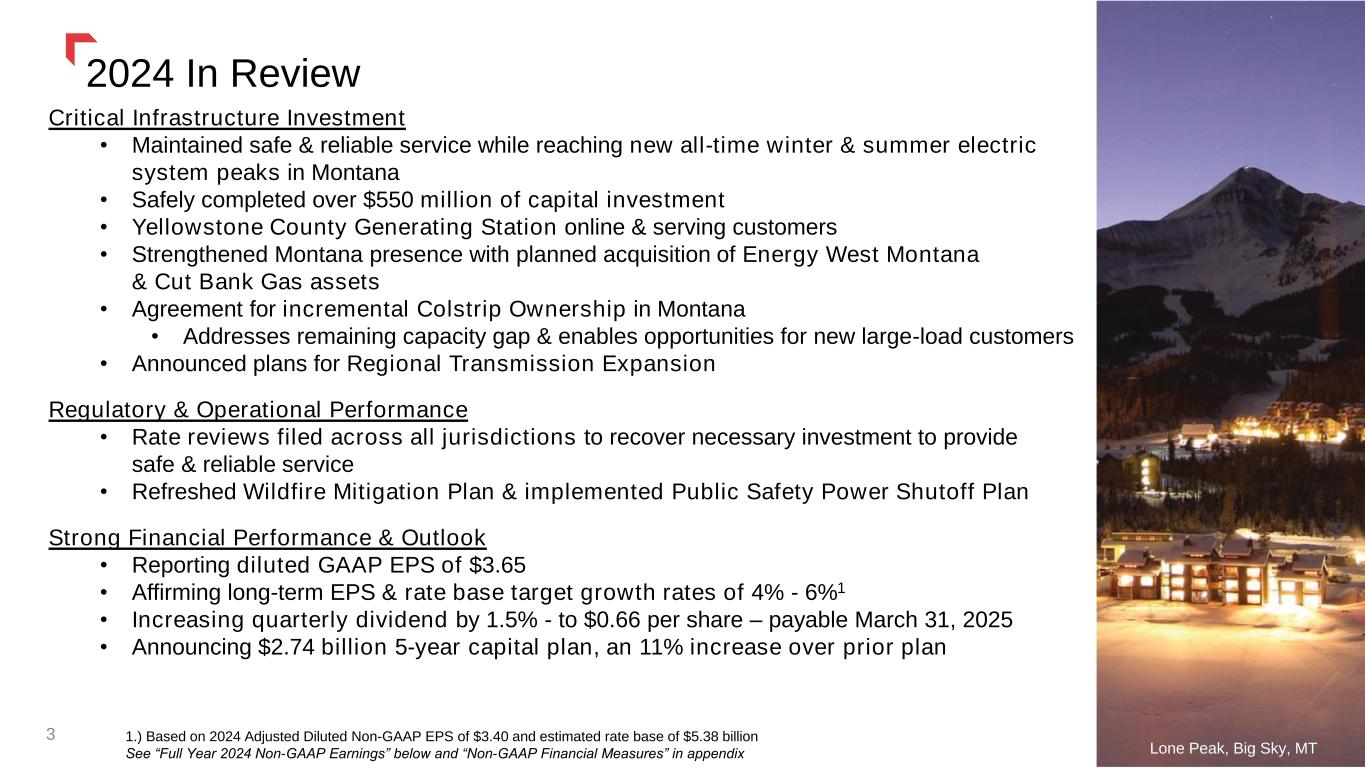
2024 In Review Critical Infrastructure Investment • Maintained safe & reliable service while reaching new all-time winter & summer electric system peaks in Montana • Safely completed over $550 million of capital investment • Yellowstone County Generating Station online & serving customers • Strengthened Montana presence with planned acquisition of Energy West Montana & Cut Bank Gas assets • Agreement for incremental Colstrip Ownership in Montana • Addresses remaining capacity gap & enables opportunities for new large-load customers • Announced plans for Regional Transmission Expansion Regulatory & Operational Performance • Rate reviews filed across all jurisdictions to recover necessary investment to provide safe & reliable service • Refreshed Wildfire Mitigation Plan & implemented Public Safety Power Shutoff Plan Strong Financial Performance & Outlook • Reporting diluted GAAP EPS of $3.65 • Affirming long-term EPS & rate base target growth rates of 4% - 6%1 • Increasing quarterly dividend by 1.5% - to $0.66 per share – payable March 31, 2025 • Announcing $2.74 billion 5-year capital plan, an 11% increase over prior plan 3 Lone Peak, Big Sky, MT 1.) Based on 2024 Adjusted Diluted Non-GAAP EPS of $3.40 and estimated rate base of $5.38 billion See “Full Year 2024 Non-GAAP Earnings” below and “Non-GAAP Financial Measures” in appendix

9%-11% Total Growth >11% Total Growth Incremental Opportunities: > 6% EPS Growth ~5% Dividend Yield Base Capital Plan: 4%-6% EPS Growth ✓ Data centers & new large- load opportunities ✓ FERC Regional Transmission ✓ Incremental generating capacity (subject to successful resource procurement bids) $2.74 billion of highly executable and low-risk capital investment forecasted over the next five years. This investment is expected to drive annualized earnings and rate base growth of approximately 4% - 6%. See slide titled “Strong Growth Outlook” for additional information. + The NorthWestern Value Proposition + 4 = = 2025-2029 Capital Investment ($ Millions)

2024 Financial Results 5 1.) See “Fourth Quarter 2024 Non-GAAP Earnings” and “Full Year 2024 Non-GAAP Earnings” below and “Non-GAAP Financial Measures” in appendix. Fourth Quarter 2024 EPS vs Prior Period • GAAP: $0.06 or (4.4%) • Non-GAAP1: $0.25 or (18.1%) Full Year 2024 EPS vs Prior Period • GAAP: $0.43 or 13.4% • Non-GAAP1: $0.13 or 4.0% Fourth Quarter Earnings Per Share Full Year Earnings Per Share
Thank youFourth Quarter Financial Review 6

Fourth Quarter Earnings Drivers 7 The decrease in diluted EPS was primarily driven by higher operating, depreciation, interest, and income tax expenses, partially offset by increased utility margin and income tax benefits. After-tax EPS vs Prior Year 1.) Utility Margin is a non-GAAP Measure. See appendix slide titled “Reconciling Gross Margin to Utility Margin” for additional disclosure. 2.) See “Fourth Quarter 2024 Non-GAAP Earnings” below and “Non-GAAP Financial Measures” in appendix. 3.) Release of a $16.9 million Unrecognized Tax Benefit in 2024 as compared to a $3.2 million release of an Unrecognized Tax Benefit in 2023.
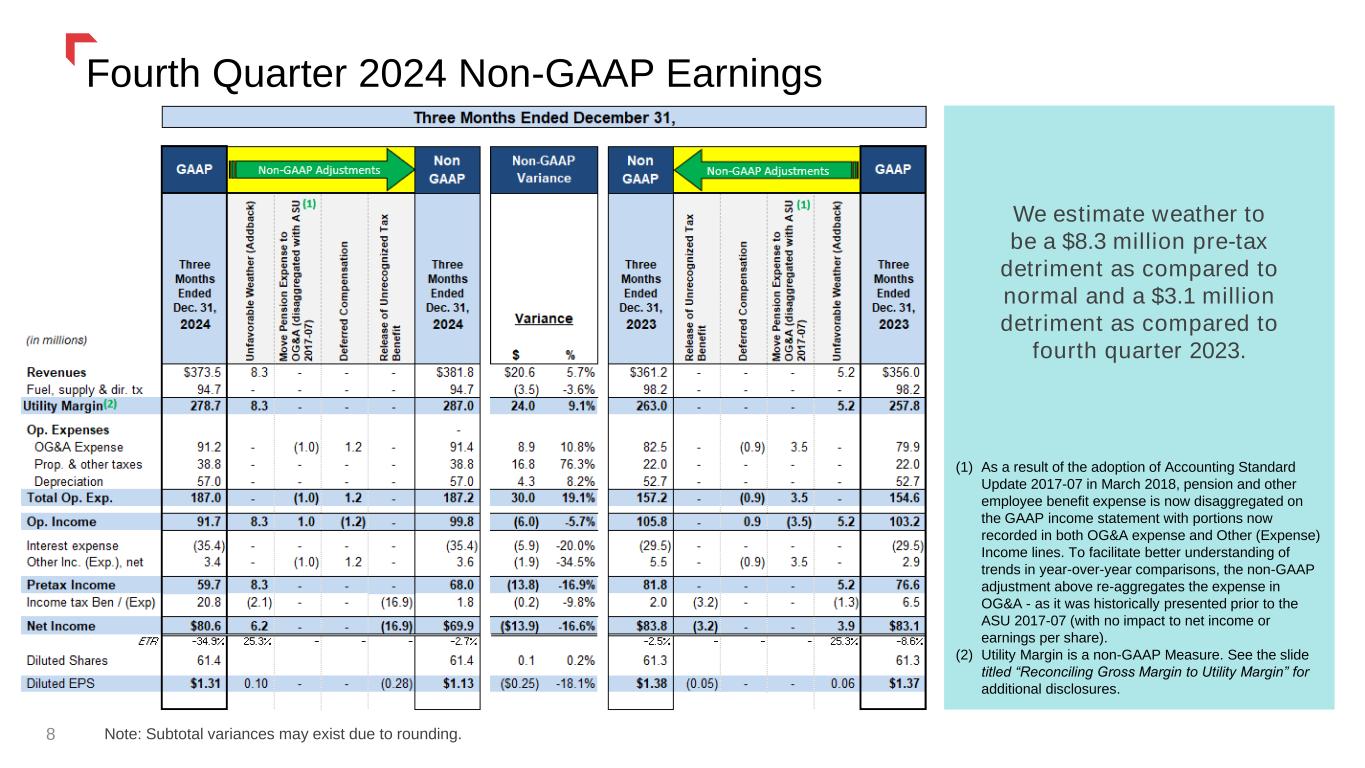
We estimate weather to be a $8.3 million pre-tax detriment as compared to normal and a $3.1 million detriment as compared to fourth quarter 2023. (1) As a result of the adoption of Accounting Standard Update 2017-07 in March 2018, pension and other employee benefit expense is now disaggregated on the GAAP income statement with portions now recorded in both OG&A expense and Other (Expense) Income lines. To facilitate better understanding of trends in year-over-year comparisons, the non-GAAP adjustment above re-aggregates the expense in OG&A - as it was historically presented prior to the ASU 2017-07 (with no impact to net income or earnings per share). (2) Utility Margin is a non-GAAP Measure. See the slide titled “Reconciling Gross Margin to Utility Margin” for additional disclosures. Fourth Quarter 2024 Non-GAAP Earnings 8 Note: Subtotal variances may exist due to rounding.

Thank youFull Year Financial Review 9

Year-Over-Year Earnings Drivers 10 The increase in diluted EPS was primarily driven by higher base rates, increased transmission revenues, and income tax benefits, partially offset by higher operating, interest, and depreciation expenses. After-tax EPS vs Prior Year 1.) Utility Margin is a non-GAAP Measure. See appendix slide titled “Reconciling Gross Margin to Utility Margin” for additional disclosure. 2.) See “Full Year 2024 Non-GAAP Earnings” below and “Non-GAAP Financial Measures” in appendix. 3.) $23.9 million benefit in 2024 ($16.9 million release of an Unrecognized Tax Benefit plus $7.0 million related to a natural gas Safe Harbor method change) as compared to a $3.2 million benefit related to the release of an Unrecognized Tax Benefit in 2023.
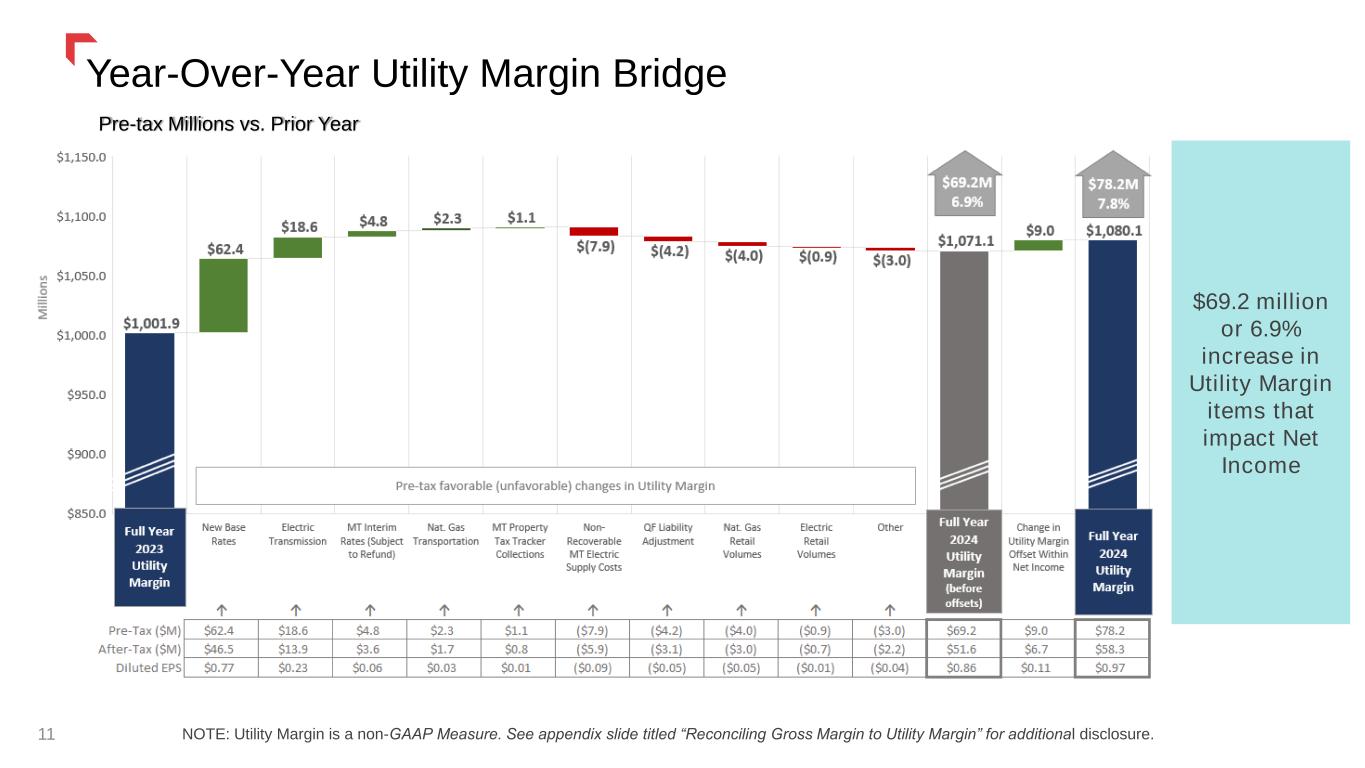
Year-Over-Year Utility Margin Bridge Pre-tax Millions vs. Prior Year $69.2 million or 6.9% increase in Utility Margin items that impact Net Income NOTE: Utility Margin is a non-GAAP Measure. See appendix slide titled “Reconciling Gross Margin to Utility Margin” for additional disclosure. 11
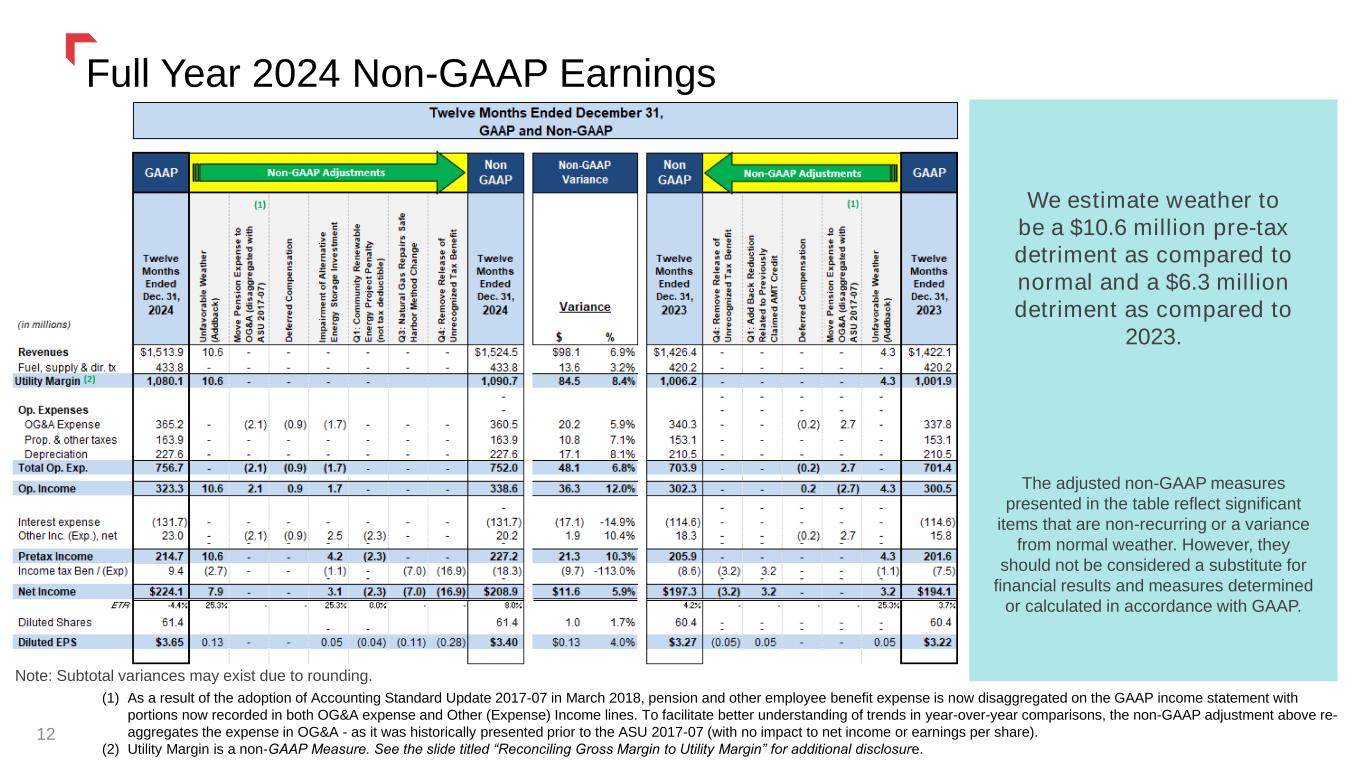
(1) As a result of the adoption of Accounting Standard Update 2017-07 in March 2018, pension and other employee benefit expense is now disaggregated on the GAAP income statement with portions now recorded in both OG&A expense and Other (Expense) Income lines. To facilitate better understanding of trends in year-over-year comparisons, the non-GAAP adjustment above re- aggregates the expense in OG&A - as it was historically presented prior to the ASU 2017-07 (with no impact to net income or earnings per share). (2) Utility Margin is a non-GAAP Measure. See the slide titled “Reconciling Gross Margin to Utility Margin” for additional disclosure. Full Year 2024 Non-GAAP Earnings 12 We estimate weather to be a $10.6 million pre-tax detriment as compared to normal and a $6.3 million detriment as compared to 2023. The adjusted non-GAAP measures presented in the table reflect significant items that are non-recurring or a variance from normal weather. However, they should not be considered a substitute for financial results and measures determined or calculated in accordance with GAAP. Note: Subtotal variances may exist due to rounding.
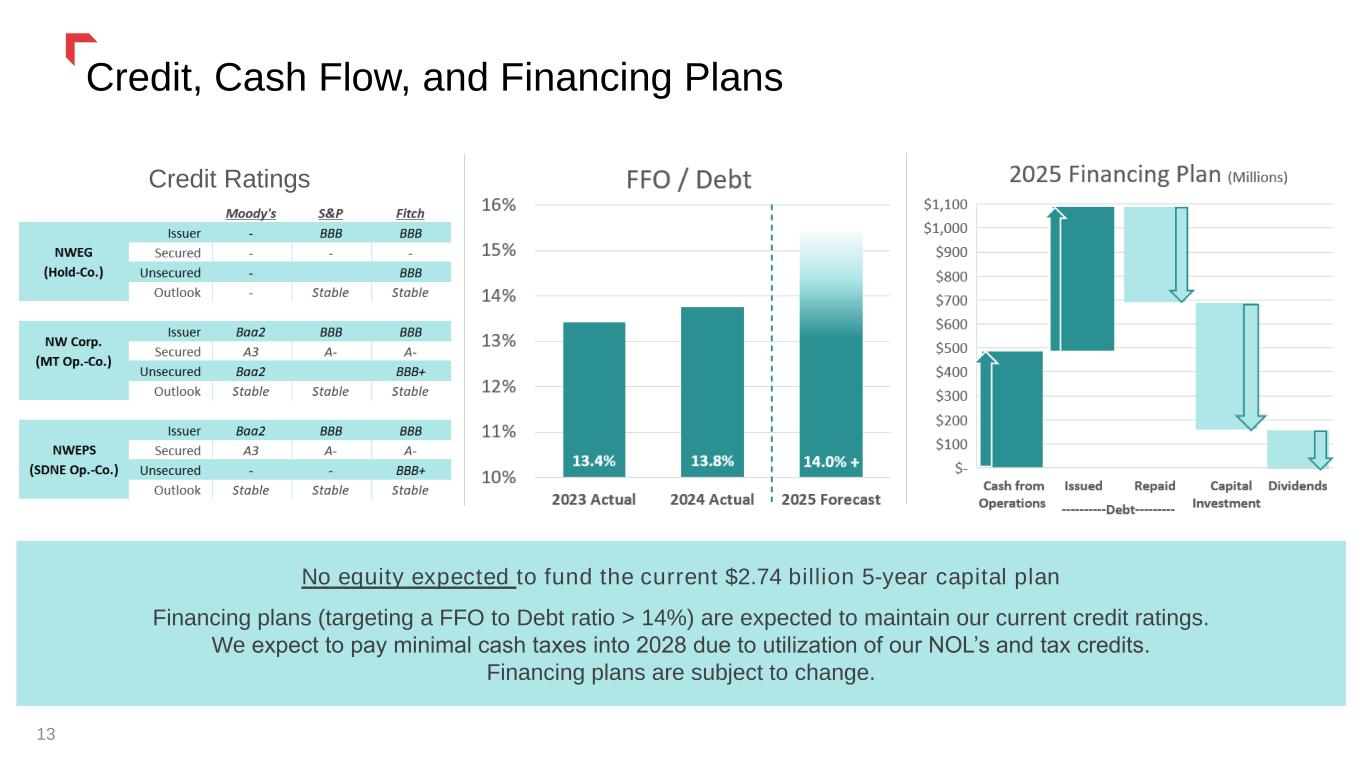
Credit, Cash Flow, and Financing Plans 13 Credit Ratings No equity expected to fund the current $2.74 billion 5-year capital plan Financing plans (targeting a FFO to Debt ratio > 14%) are expected to maintain our current credit ratings. We expect to pay minimal cash taxes into 2028 due to utilization of our NOL’s and tax credits. Financing plans are subject to change.

Thank youLooking Forward 14

Strong Growth Outlook 15 ✓ 2025 EPS guidance expected to be provided following the outcome of our pending Montana rate review ✓ Affirming long-term growth rates from 2024 base1 • EPS growth of 4% to 6% • Rate base growth of 4% to 6% • Continued focus on closing the gap between earned & authorized returns ✓ No equity expected to fund the current 5-year | $2.74 billion capital plan • Capital plan sized to be funded by cash from operations, aided by net operating losses, and secured debt • Incremental capital opportunities may result in equity financing ✓ Expect to maintain FFO / Debt > 14% in 2025 and beyond ✓ Earnings growth is expected to exceed dividend growth until we return to our targeted 60% to 70% payout ratio 1.) Based on 2024 Adjusted Diluted Non-GAAP EPS of $3.40 and estimated rate base of $5.38 billion See “Full Year 2024 Non-GAAP Earnings” above and “Non-GAAP Financial Measures” in appendix

11% increase in 5-year capital investment plan $2.74 billion of highly-executable and low-risk critical capital investment Regulated Utility Five-Year Capital Forecast (millions) 16
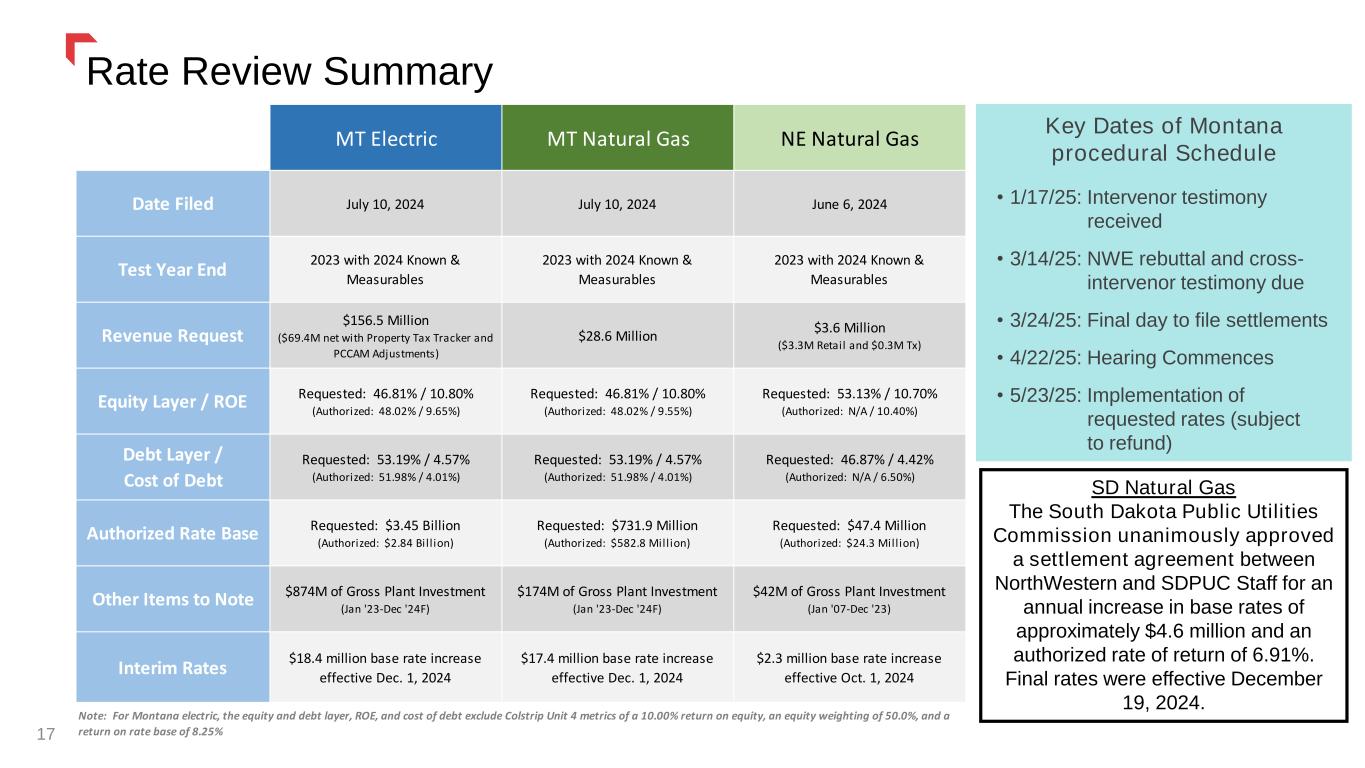
17 Rate Review Summary Key Dates of Montana procedural Schedule • 1/17/25: Intervenor testimony received • 3/14/25: NWE rebuttal and cross- intervenor testimony due • 3/24/25: Final day to file settlements • 4/22/25: Hearing Commences • 5/23/25: Implementation of requested rates (subject to refund) SD Natural Gas The South Dakota Public Utilities Commission unanimously approved a settlement agreement between NorthWestern and SDPUC Staff for an annual increase in base rates of approximately $4.6 million and an authorized rate of return of 6.91%. Final rates were effective December 19, 2024. MT Electric MT Natural Gas NE Natural Gas Date Filed July 10, 2024 July 10, 2024 June 6, 2024 Test Year End 2023 with 2024 Known & Measurables 2023 with 2024 Known & Measurables 2023 with 2024 Known & Measurables Revenue Request $156.5 Million ($69.4M net with Property Tax Tracker and PCCAM Adjustments) $28.6 Million $3.6 Million ($3.3M Retail and $0.3M Tx) Equity Layer / ROE Requested: 46.81% / 10.80% (Authorized: 48.02% / 9.65%) Requested: 46.81% / 10.80% (Authorized: 48.02% / 9.55%) Requested: 53.13% / 10.70% (Authorized: N/A / 10.40%) Debt Layer / Cost of Debt Requested: 53.19% / 4.57% (Authorized: 51.98% / 4.01%) Requested: 53.19% / 4.57% (Authorized: 51.98% / 4.01%) Requested: 46.87% / 4.42% (Authorized: N/A / 6.50%) Authorized Rate Base Requested: $3.45 Billion (Authorized: $2.84 Bill ion) Requested: $731.9 Million (Authorized: $582.8 Mill ion) Requested: $47.4 Million (Authorized: $24.3 Mill ion) Other Items to Note $874M of Gross Plant Investment (Jan '23-Dec '24F) $174M of Gross Plant Investment (Jan '23-Dec '24F) $42M of Gross Plant Investment (Jan '07-Dec '23) Interim Rates $18.4 million base rate increase effective Dec. 1, 2024 $17.4 million base rate increase effective Dec. 1, 2024 $2.3 million base rate increase effective Oct. 1, 2024 Note: For Montana electric, the equity and debt layer, ROE, and cost of debt exclude Colstrip Unit 4 metrics of a 10.00% return on equity, an equity weighting of 50.0%, and a return on rate base of 8.25%
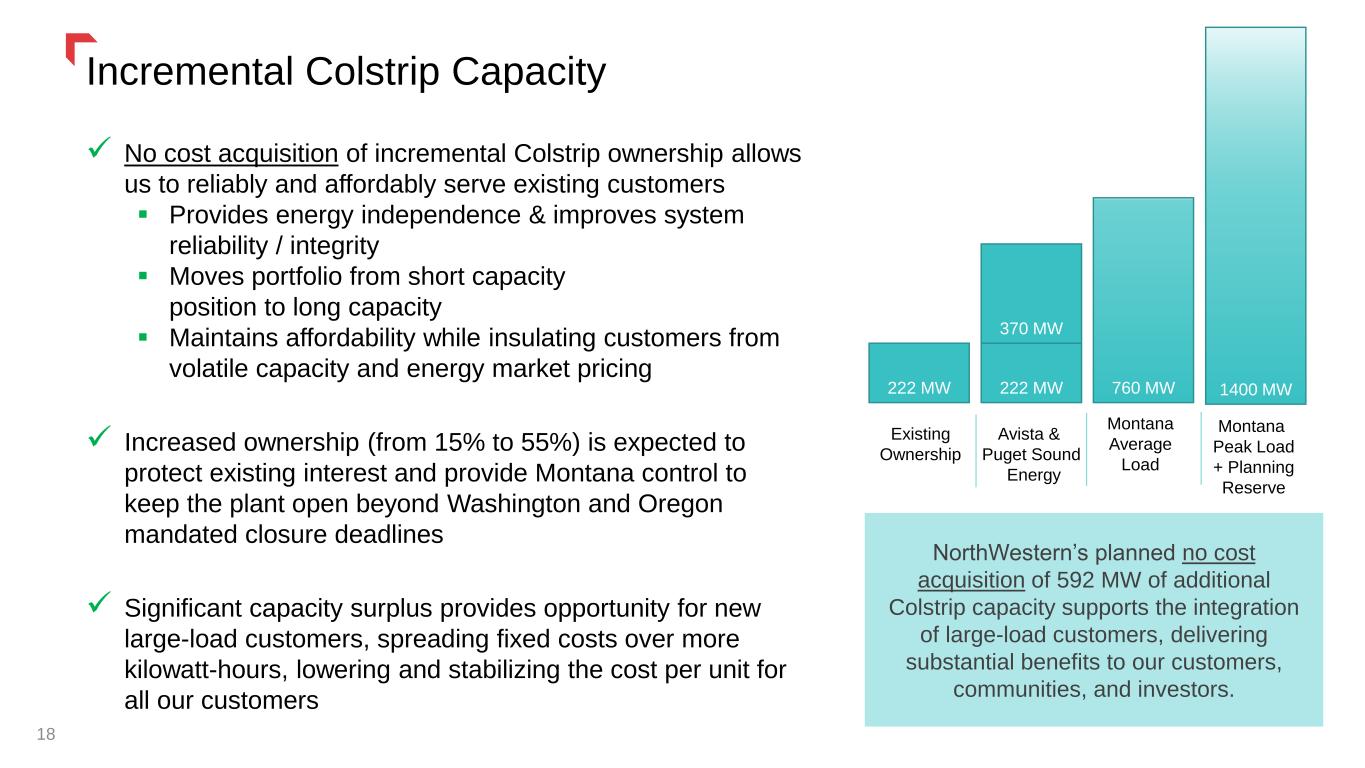
18 Incremental Colstrip Capacity NorthWestern’s planned no cost acquisition of 592 MW of additional Colstrip capacity supports the integration of large-load customers, delivering substantial benefits to our customers, communities, and investors. 760 MW Existing Ownership Montana Average Load ✓ No cost acquisition of incremental Colstrip ownership allows us to reliably and affordably serve existing customers ▪ Provides energy independence & improves system reliability / integrity ▪ Moves portfolio from short capacity position to long capacity ▪ Maintains affordability while insulating customers from volatile capacity and energy market pricing ✓ Increased ownership (from 15% to 55%) is expected to protect existing interest and provide Montana control to keep the plant open beyond Washington and Oregon mandated closure deadlines ✓ Significant capacity surplus provides opportunity for new large-load customers, spreading fixed costs over more kilowatt-hours, lowering and stabilizing the cost per unit for all our customers 222 MW 222 MW 370 MW Avista & Puget Sound Energy 1400 MW Montana Peak Load + Planning Reserve
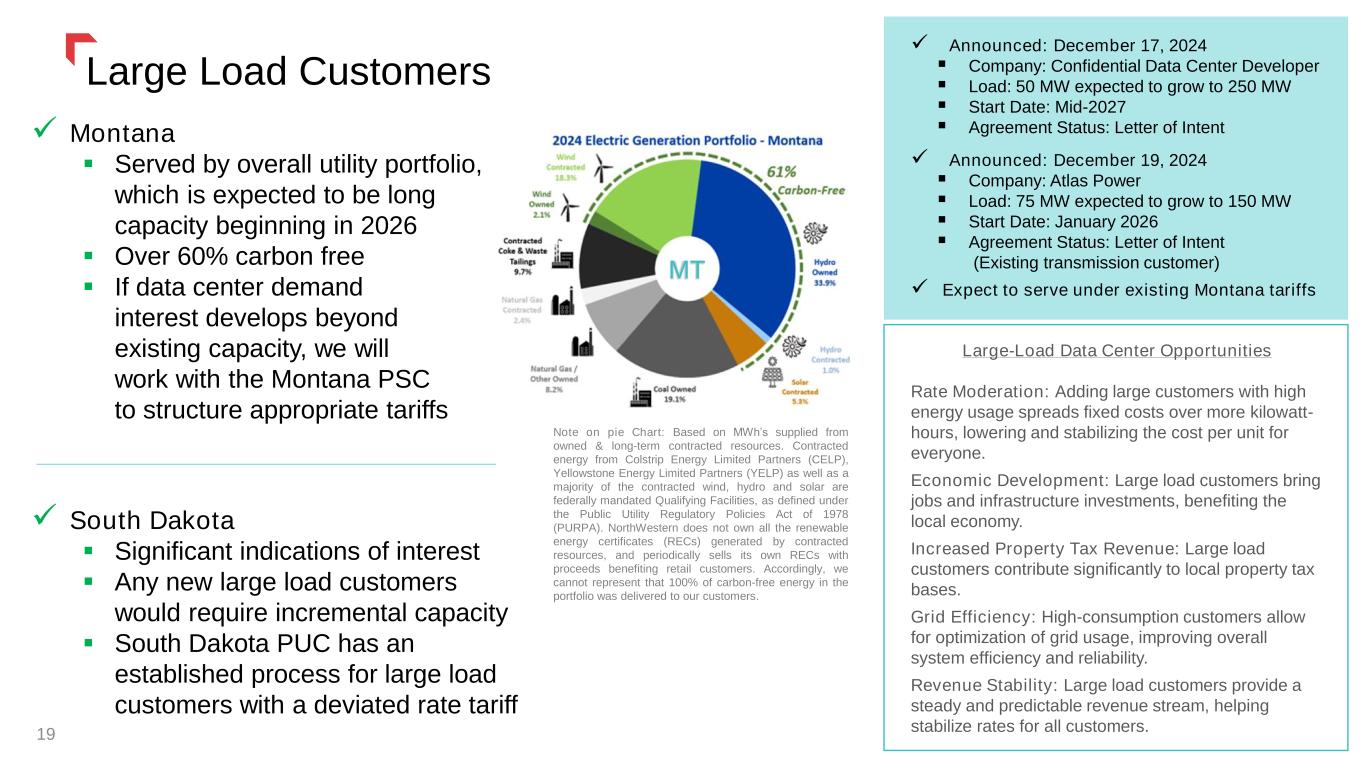
MT ✓ Montana ▪ Served by overall utility portfolio, which is expected to be long capacity beginning in 2026 ▪ Over 60% carbon free ▪ If data center demand interest develops beyond existing capacity, we will work with the Montana PSC to structure appropriate tariffs ✓ South Dakota ▪ Significant indications of interest ▪ Any new large load customers would require incremental capacity ▪ South Dakota PUC has an established process for large load customers with a deviated rate tariff 19 Large Load Customers Large-Load Data Center Opportunities Rate Moderation: Adding large customers with high energy usage spreads fixed costs over more kilowatt- hours, lowering and stabilizing the cost per unit for everyone. Economic Development: Large load customers bring jobs and infrastructure investments, benefiting the local economy. Increased Property Tax Revenue: Large load customers contribute significantly to local property tax bases. Grid Efficiency: High-consumption customers allow for optimization of grid usage, improving overall system efficiency and reliability. Revenue Stability: Large load customers provide a steady and predictable revenue stream, helping stabilize rates for all customers. ✓ Announced: December 17, 2024 ▪ Company: Confidential Data Center Developer ▪ Load: 50 MW expected to grow to 250 MW ▪ Start Date: Mid-2027 ▪ Agreement Status: Letter of Intent ✓ Announced: December 19, 2024 ▪ Company: Atlas Power ▪ Load: 75 MW expected to grow to 150 MW ▪ Start Date: January 2026 ▪ Agreement Status: Letter of Intent (Existing transmission customer) ✓ Expect to serve under existing Montana tariffs Note on pie Chart: Based on MWh’s supplied from owned & long-term contracted resources. Contracted energy from Colstrip Energy Limited Partners (CELP), Yellowstone Energy Limited Partners (YELP) as well as a majority of the contracted wind, hydro and solar are federally mandated Qualifying Facilities, as defined under the Public Utility Regulatory Policies Act of 1978 (PURPA). NorthWestern does not own all the renewable energy certificates (RECs) generated by contracted resources, and periodically sells its own RECs with proceeds benefiting retail customers. Accordingly, we cannot represent that 100% of carbon-free energy in the portfolio was delivered to our customers.
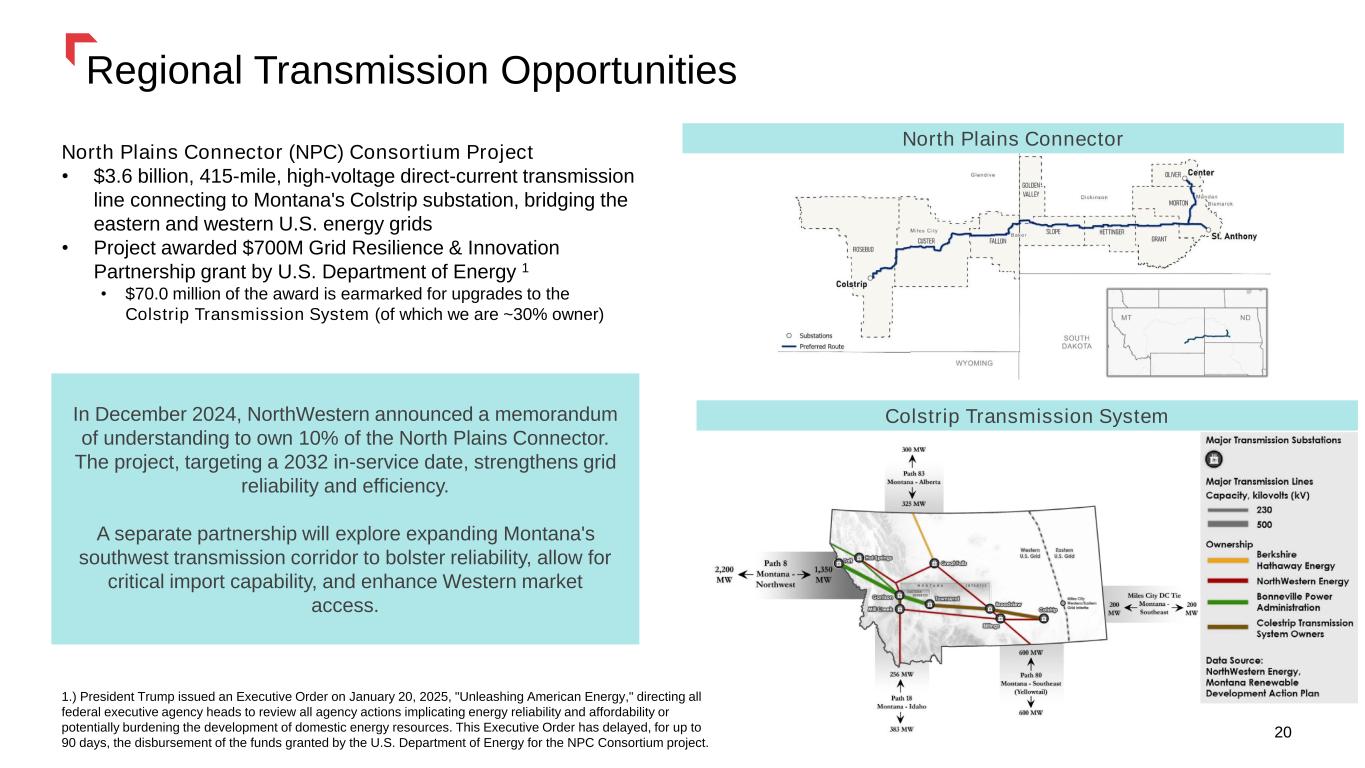
20 Regional Transmission Opportunities 20 Colstrip Transmission System North Plains Connector (NPC) Consortium Project • $3.6 billion, 415-mile, high-voltage direct-current transmission line connecting to Montana's Colstrip substation, bridging the eastern and western U.S. energy grids • Project awarded $700M Grid Resilience & Innovation Partnership grant by U.S. Department of Energy 1 • $70.0 million of the award is earmarked for upgrades to the Colstrip Transmission System (of which we are ~30% owner) North Plains Connector In December 2024, NorthWestern announced a memorandum of understanding to own 10% of the North Plains Connector. The project, targeting a 2032 in-service date, strengthens grid reliability and efficiency. A separate partnership will explore expanding Montana's southwest transmission corridor to bolster reliability, allow for critical import capability, and enhance Western market access. 1.) President Trump issued an Executive Order on January 20, 2025, "Unleashing American Energy," directing all federal executive agency heads to review all agency actions implicating energy reliability and affordability or potentially burdening the development of domestic energy resources. This Executive Order has delayed, for up to 90 days, the disbursement of the funds granted by the U.S. Department of Energy for the NPC Consortium project.

Conclusion Pure Electric & Gas Utility Solid Utility Foundation Best Practices Corporate Governance Attractive Future Growth Prospects Strong Earnings & Cash Flows 21 NorthWestern Energy Group, Inc. dba: NorthWestern Energy Ticker: NWE (Nasdaq) www.northwesternenergy.com Corporate Support Office 3010 West 69th Street Sioux Falls, SD 57108 (605) 978-2900 Investor Relations Officer Travis Meyer 605-978-2967 travis.meyer@northwestern.com

Thank youAppendix: 22
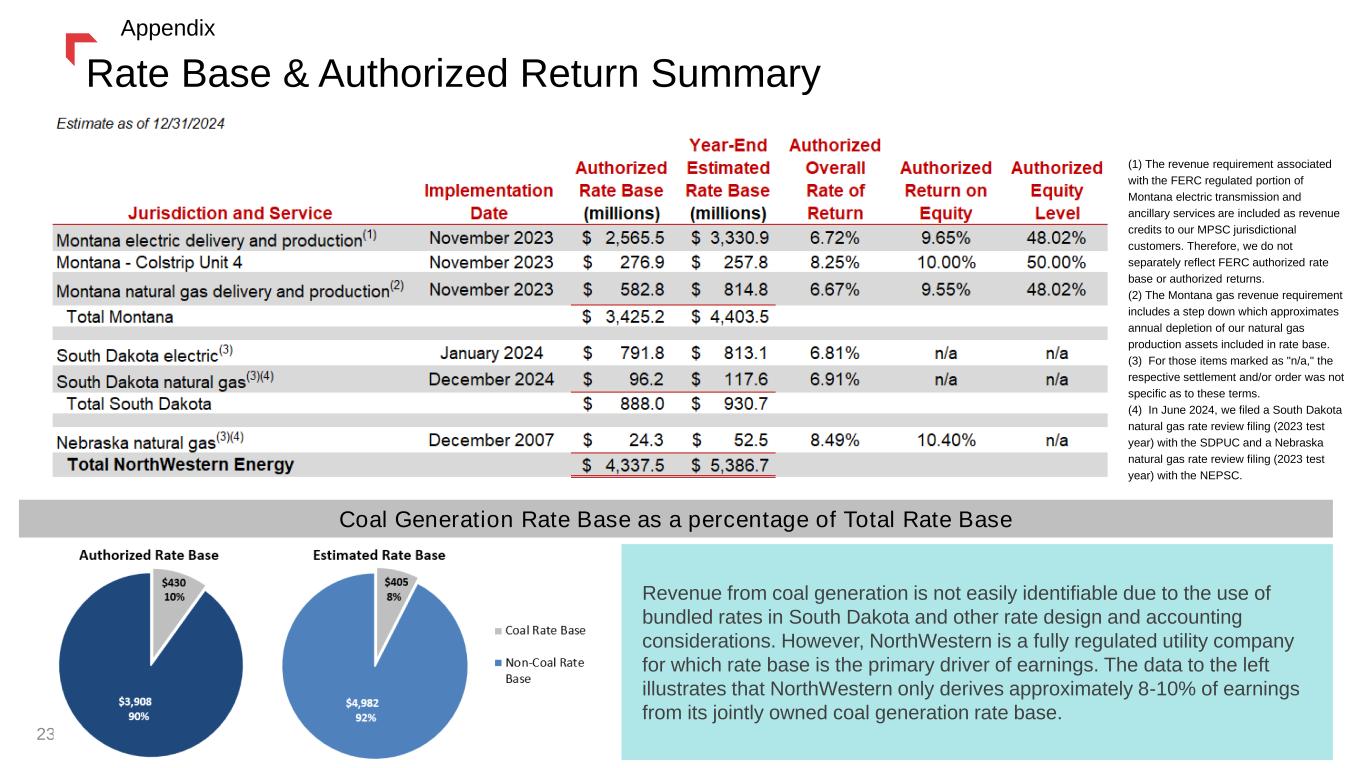
(1) The revenue requirement associated with the FERC regulated portion of Montana electric transmission and ancillary services are included as revenue credits to our MPSC jurisdictional customers. Therefore, we do not separately reflect FERC authorized rate base or authorized returns. (2) The Montana gas revenue requirement includes a step down which approximates annual depletion of our natural gas production assets included in rate base. (3) For those items marked as "n/a," the respective settlement and/or order was not specific as to these terms. (4) In June 2024, we filed a South Dakota natural gas rate review filing (2023 test year) with the SDPUC and a Nebraska natural gas rate review filing (2023 test year) with the NEPSC. Coal Generation Rate Base as a percentage of Total Rate Base Revenue from coal generation is not easily identifiable due to the use of bundled rates in South Dakota and other rate design and accounting considerations. However, NorthWestern is a fully regulated utility company for which rate base is the primary driver of earnings. The data to the left illustrates that NorthWestern only derives approximately 8-10% of earnings from its jointly owned coal generation rate base. Rate Base & Authorized Return Summary Appendix 23

Thank youFull Ye r Appendix 24

Full Year Financial Results 25 1.) Utility Margin is a non- GAAP Measure. See appendix slide titled “Reconciling Gross Margin to Utility Margin” for additional disclosure. Note: Subtotal variances may exist due to rounding. Appendix (in millions except per share amounts) 2024 2023 Variance % Variance Operating Revenues $1,513.9 $1,422.1 $91.8 6.5% 433.8 420.2 13.6 3.2% Utility Margin 1,080.1 1,001.9 78.2 7.8% Operating Expenses Operating and maintenance 227.8 220.5 7.3 3.3% Administrative and general 137.4 117.3 20.1 17.1% Property and other taxes 163.9 153.1 10.8 7.1% Depreciation and depletion 227.6 210.5 17.1 8.1% Total Operating Expenses 756.7 701.4 55.3 7.9% Operating Income 323.3 300.5 22.8 7.6% Interest Expense, net (131.7) (114.6) (17.1) (14.9%) Other Income, net 23.0 15.8 7.2 45.6% Income Before Income Taxes 214.7 201.6 13.1 6.5% Income Tax Benefit (Expense) 9.4 (7.5) 16.9 225.3% Net Income $224.1 $194.1 $30.0 15.5% Effective Tax Rate (4.4%) 3.7% (8.1%) Diluted Average Shares Outstanding 61.4 60.4 1.0 1.7% Diluted Earnings Per Share $3.65 $3.22 $0.43 13.4% Dividends Paid per Common Share $2.60 $2.56 0.04$ 1.6% Twelve Months Ended December 31, Fuel, purchased supply & direct transmission expense (exclusive of depreciation and depletion) 1
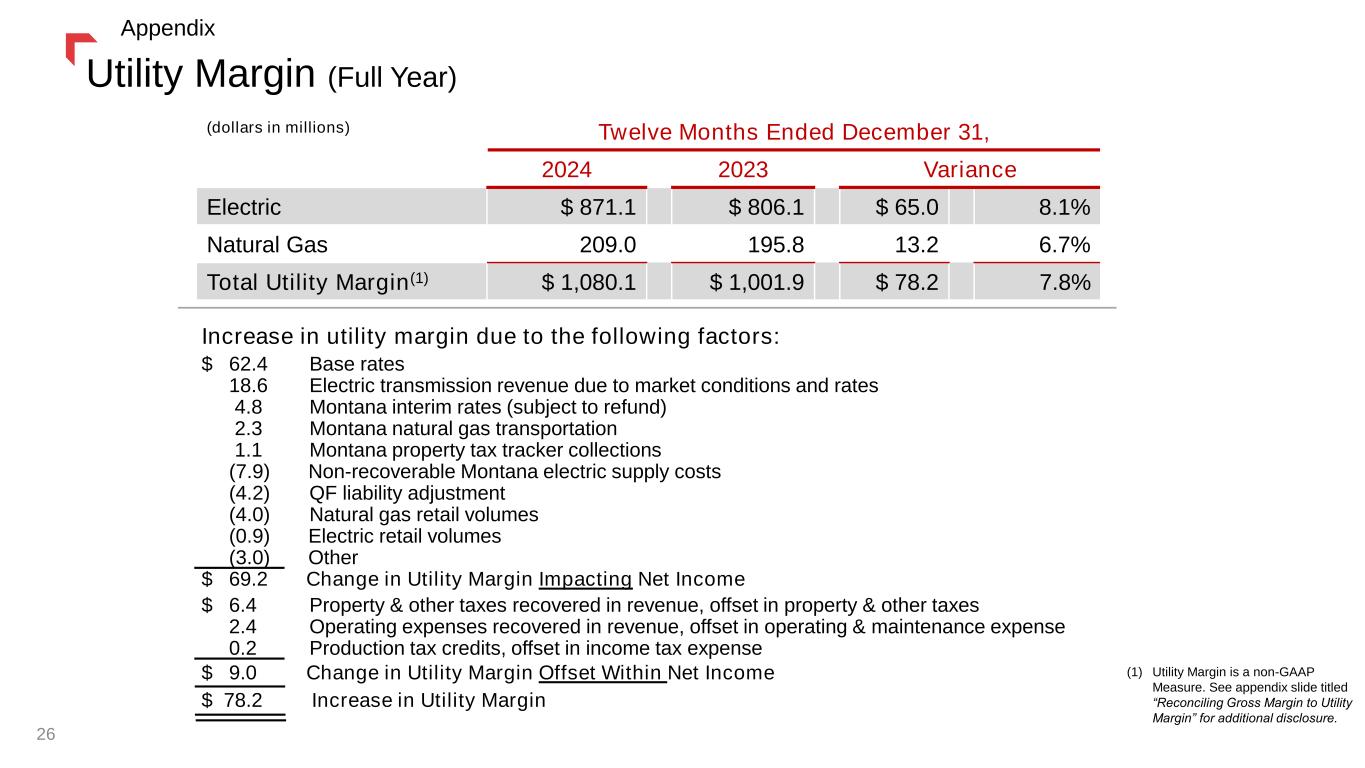
Utility Margin (Full Year) (dollars in millions) Twelve Months Ended December 31, 2024 2023 Variance Electric $ 871.1 $ 806.1 $ 65.0 8.1% Natural Gas 209.0 195.8 13.2 6.7% Total Utility Margin(1) $ 1,080.1 $ 1,001.9 $ 78.2 7.8% Increase in utility margin due to the following factors: $ 62.4 Base rates 18.6 Electric transmission revenue due to market conditions and rates 4.8 Montana interim rates (subject to refund) 2.3 Montana natural gas transportation 1.1 Montana property tax tracker collections (7.9) Non-recoverable Montana electric supply costs (4.2) QF liability adjustment (4.0) Natural gas retail volumes (0.9) Electric retail volumes (3.0) Other $ 69.2 Change in Utility Margin Impacting Net Income $ 6.4 Property & other taxes recovered in revenue, offset in property & other taxes 2.4 Operating expenses recovered in revenue, offset in operating & maintenance expense 0.2 Production tax credits, offset in income tax expense $ 9.0 Change in Utility Margin Offset Within Net Income $ 78.2 Increase in Utility Margin 26 Appendix (1) Utility Margin is a non-GAAP Measure. See appendix slide titled “Reconciling Gross Margin to Utility Margin” for additional disclosure.
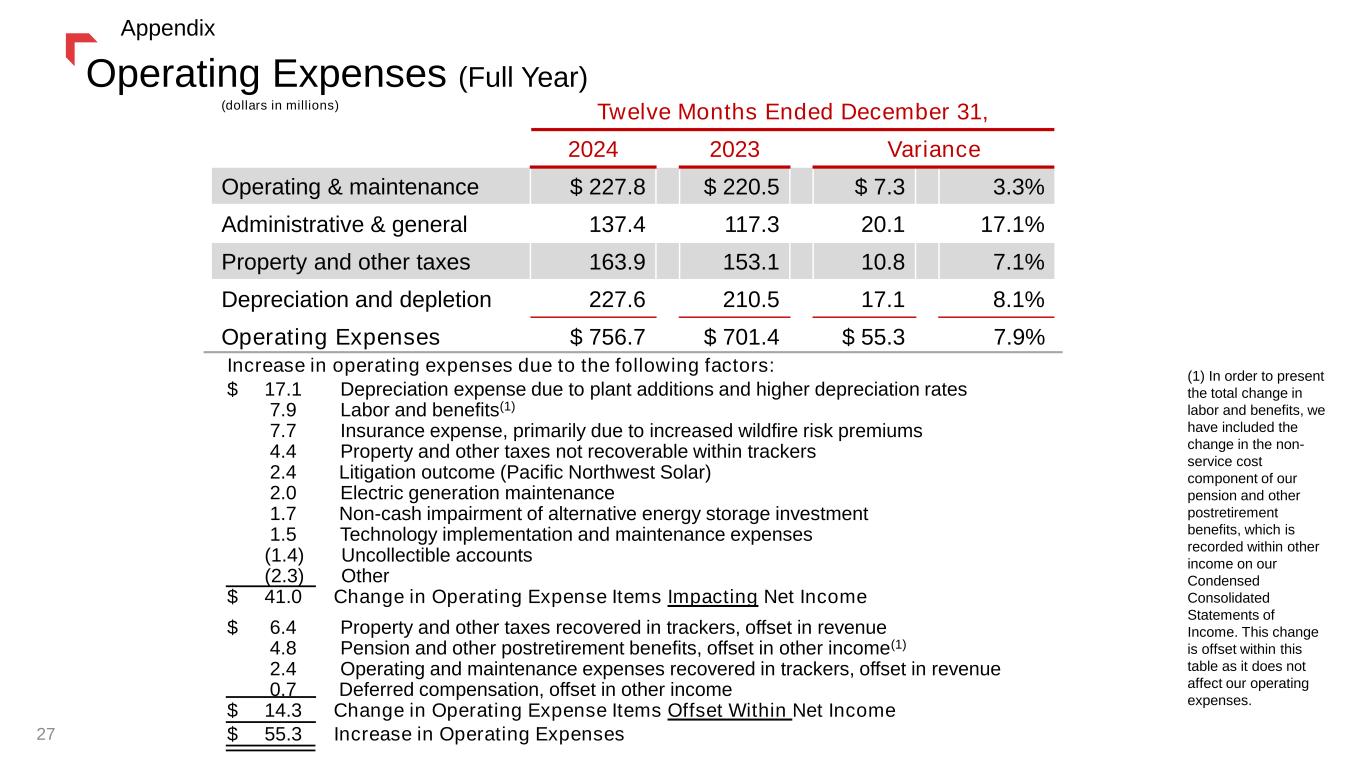
(dollars in millions) Twelve Months Ended December 31, 2024 2023 Variance Operating & maintenance $ 227.8 $ 220.5 $ 7.3 3.3% Administrative & general 137.4 117.3 20.1 17.1% Property and other taxes 163.9 153.1 10.8 7.1% Depreciation and depletion 227.6 210.5 17.1 8.1% Operating Expenses $ 756.7 $ 701.4 $ 55.3 7.9% Increase in operating expenses due to the following factors: $ 17.1 Depreciation expense due to plant additions and higher depreciation rates 7.9 Labor and benefits(1) 7.7 Insurance expense, primarily due to increased wildfire risk premiums 4.4 Property and other taxes not recoverable within trackers 2.4 Litigation outcome (Pacific Northwest Solar) 2.0 Electric generation maintenance 1.7 Non-cash impairment of alternative energy storage investment 1.5 Technology implementation and maintenance expenses (1.4) Uncollectible accounts (2.3) Other $ 41.0 Change in Operating Expense Items Impacting Net Income $ 6.4 Property and other taxes recovered in trackers, offset in revenue 4.8 Pension and other postretirement benefits, offset in other income(1) 2.4 Operating and maintenance expenses recovered in trackers, offset in revenue 0.7 Deferred compensation, offset in other income $ 14.3 Change in Operating Expense Items Offset Within Net Income $ 55.3 Increase in Operating Expenses Operating Expenses (Full Year) (1) In order to present the total change in labor and benefits, we have included the change in the non- service cost component of our pension and other postretirement benefits, which is recorded within other income on our Condensed Consolidated Statements of Income. This change is offset within this table as it does not affect our operating expenses. 27 Appendix
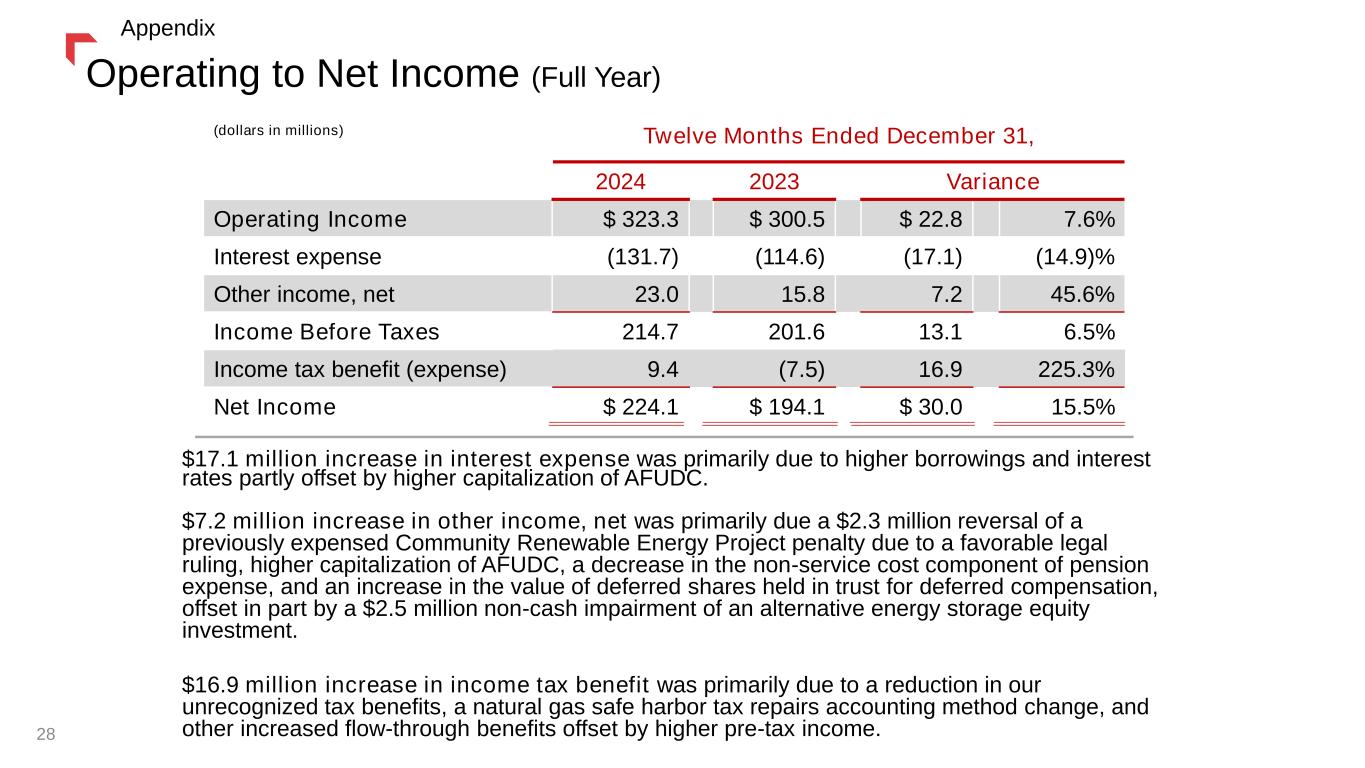
Operating to Net Income (Full Year) (dollars in millions) Twelve Months Ended December 31, 2024 2023 Variance Operating Income $ 323.3 $ 300.5 $ 22.8 7.6% Interest expense (131.7) (114.6) (17.1) (14.9)% Other income, net 23.0 15.8 7.2 45.6% Income Before Taxes 214.7 201.6 13.1 6.5% Income tax benefit (expense) 9.4 (7.5) 16.9 225.3% Net Income $ 224.1 $ 194.1 $ 30.0 15.5% $17.1 million increase in interest expense was primarily due to higher borrowings and interest rates partly offset by higher capitalization of AFUDC. $7.2 million increase in other income, net was primarily due a $2.3 million reversal of a previously expensed Community Renewable Energy Project penalty due to a favorable legal ruling, higher capitalization of AFUDC, a decrease in the non-service cost component of pension expense, and an increase in the value of deferred shares held in trust for deferred compensation, offset in part by a $2.5 million non-cash impairment of an alternative energy storage equity investment. $16.9 million increase in income tax benefit was primarily due to a reduction in our unrecognized tax benefits, a natural gas safe harbor tax repairs accounting method change, and other increased flow-through benefits offset by higher pre-tax income.28 Appendix
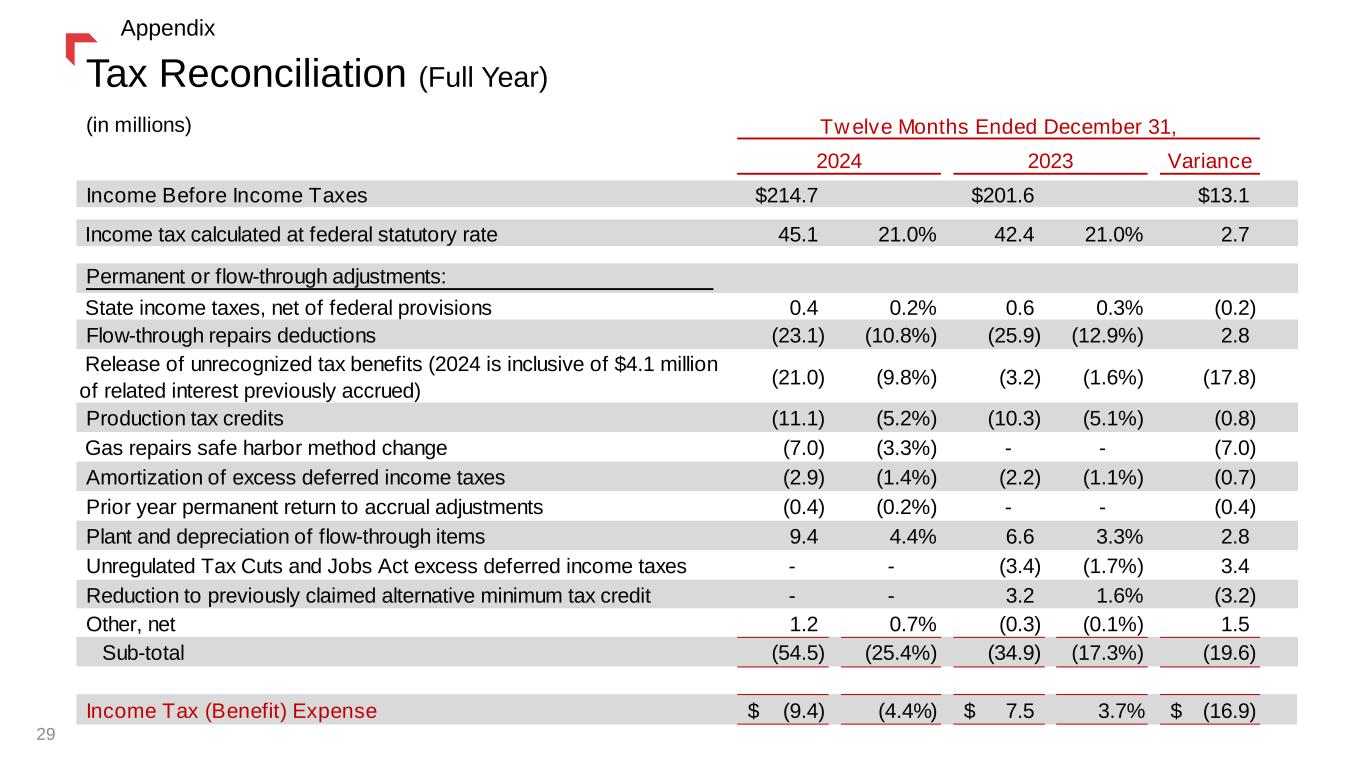
Tax Reconciliation (Full Year) 29 Appendix (in millions) Variance Income Before Income Taxes $214.7 $201.6 $13.1 Income tax calculated at federal statutory rate 45.1 21.0% 42.4 21.0% 2.7 Permanent or flow-through adjustments: State income taxes, net of federal provisions 0.4 0.2% 0.6 0.3% (0.2) Flow-through repairs deductions (23.1) (10.8%) (25.9) (12.9%) 2.8 Release of unrecognized tax benefits (2024 is inclusive of $4.1 million of related interest previously accrued) (21.0) (9.8%) (3.2) (1.6%) (17.8) Production tax credits (11.1) (5.2%) (10.3) (5.1%) (0.8) Gas repairs safe harbor method change (7.0) (3.3%) - - (7.0) Amortization of excess deferred income taxes (2.9) (1.4%) (2.2) (1.1%) (0.7) Prior year permanent return to accrual adjustments (0.4) (0.2%) - - (0.4) Plant and depreciation of flow-through items 9.4 4.4% 6.6 3.3% 2.8 Unregulated Tax Cuts and Jobs Act excess deferred income taxes - - (3.4) (1.7%) 3.4 Reduction to previously claimed alternative minimum tax credit - - 3.2 1.6% (3.2) Other, net 1.2 0.7% (0.3) (0.1%) 1.5 Sub-total (54.5) (25.4%) (34.9) (17.3%) (19.6) Income Tax (Benefit) Expense (9.4)$ (4.4%) 7.5$ 3.7% (16.9)$ 2024 2023 Twelve Months Ended December 31,
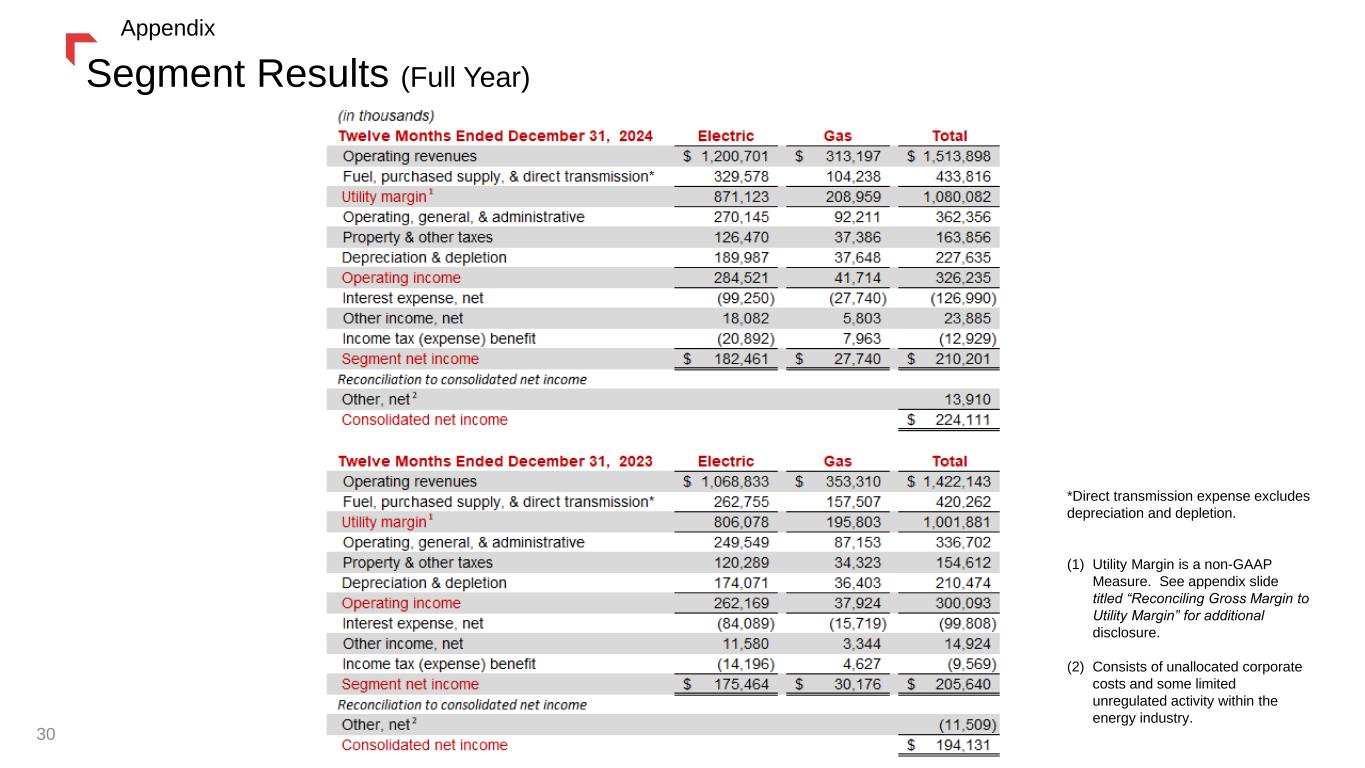
Segment Results (Full Year) *Direct transmission expense excludes depreciation and depletion. (1) Utility Margin is a non-GAAP Measure. See appendix slide titled “Reconciling Gross Margin to Utility Margin” for additional disclosure. (2) Consists of unallocated corporate costs and some limited unregulated activity within the energy industry. 30 Appendix
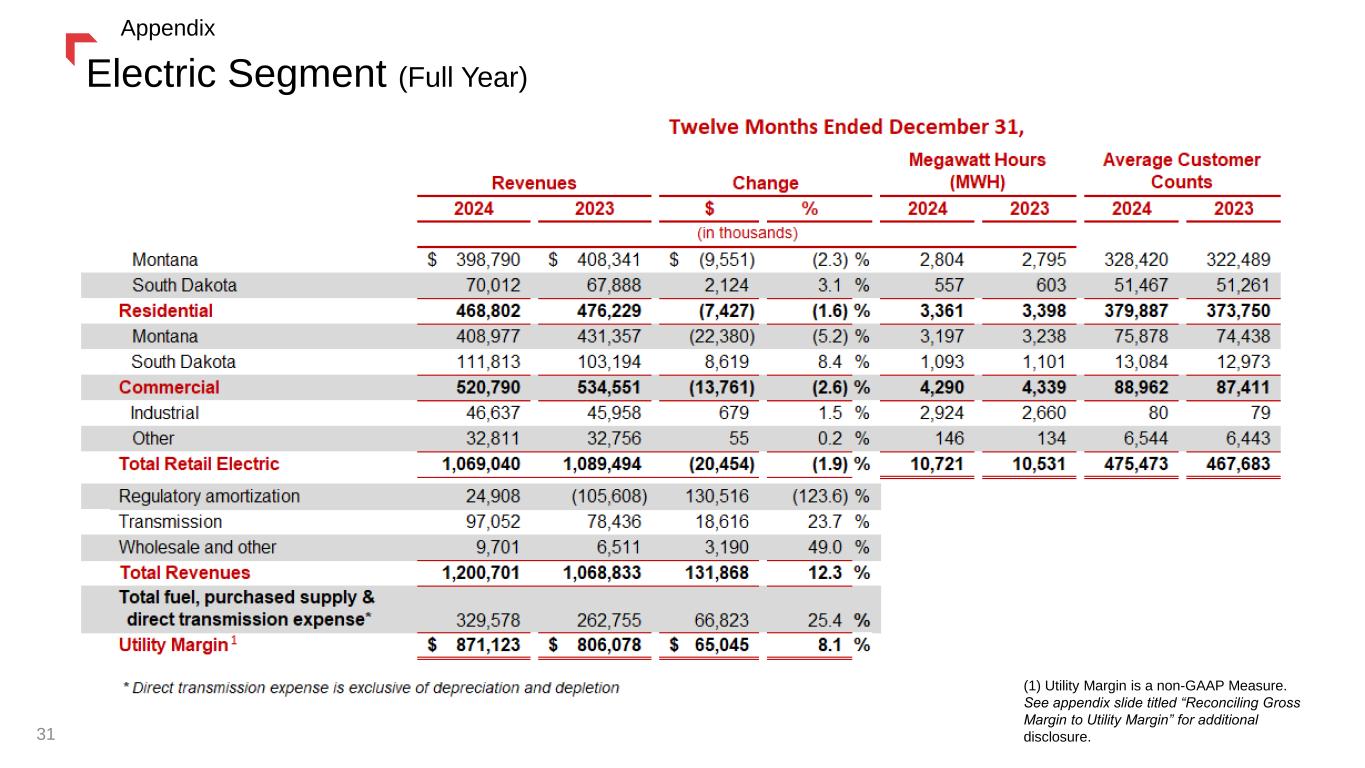
Electric Segment (Full Year) (1) Utility Margin is a non-GAAP Measure. See appendix slide titled “Reconciling Gross Margin to Utility Margin” for additional disclosure. 31 Appendix
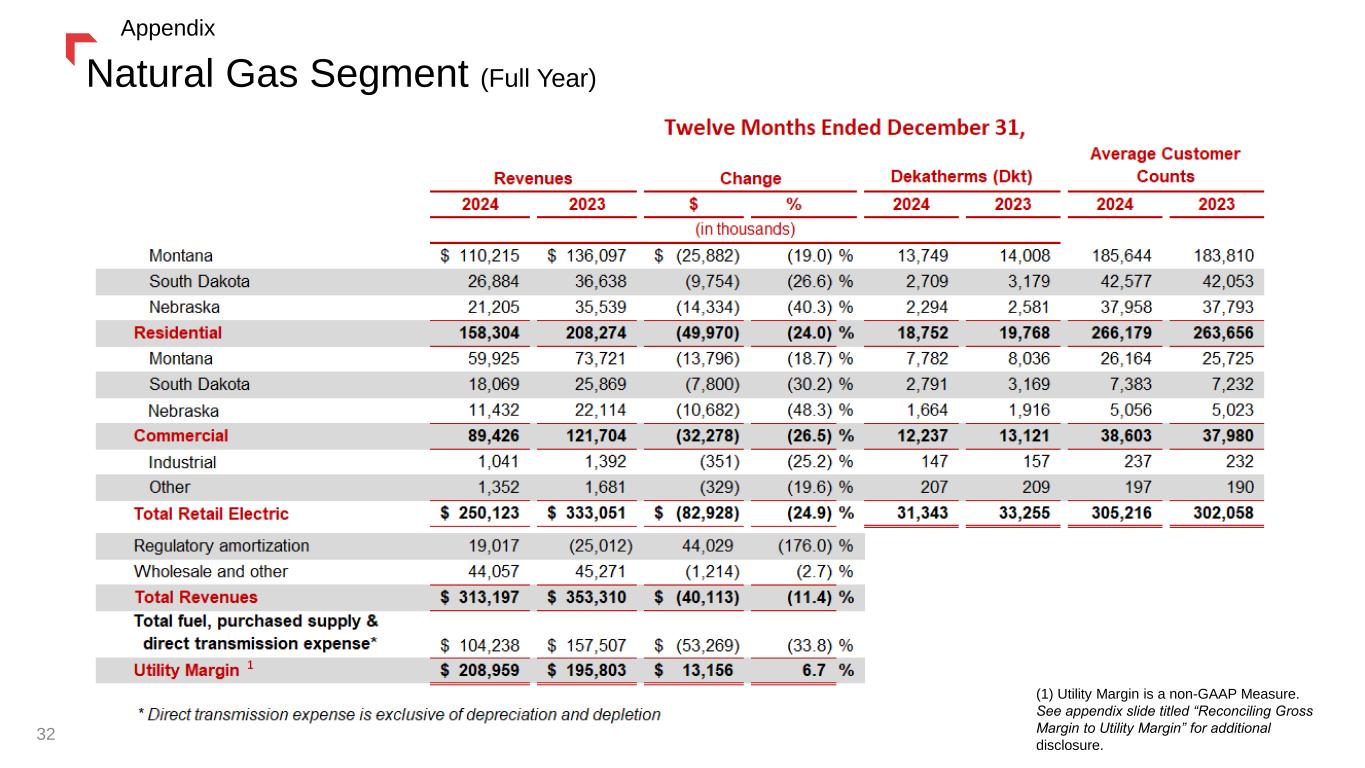
Natural Gas Segment (Full Year) 32 Appendix (1) Utility Margin is a non-GAAP Measure. See appendix slide titled “Reconciling Gross Margin to Utility Margin” for additional disclosure.

(dollars in millions) As of December 31, As of December 31, 2024 2023 Cash and cash equivalents 4.3$ 9.2$ Restricted cash 24.7 16.0 Accounts receivable, net 187.8 212.3 Inventories 122.9 114.5 Other current assets 78.5 55.0 Goodwill 357.6 357.6 PP&E and other non-current assets 7,221.8 6,836.1 Total Assets 7,997.5$ 7,600.7$ Payables 111.8 124.3 Current Maturities - debt and leases 403.5 103.3 Other current liabilities 286.9 307.3 Long-term debt & capital leases 2,697.2 2,690.1 Other non-current liabilities 1,640.4 1,590.3 Shareholders' equity 2,857.7 2,785.3 Total Liabilities and Equity 7,997.5$ 7,600.7$ Capitalization: Short-Term Debt & Short-Term Finance Leases 403.5 103.3 Long-Term Debt & Long-Term Finance Leases 2,697.2 2,690.1 Less: Basin Creek Finance Lease (5.5) (8.8) Shareholders' Equity 2,857.7 2,785.3 Total Capitalization 5,953.0$ 5,569.9$ Ratio of Debt to Total Capitalization 52.0% 50.0% Balance Sheet 33 Appendix Debt to Total Capitalization up from last year and inside our targeted 50% - 55% range.
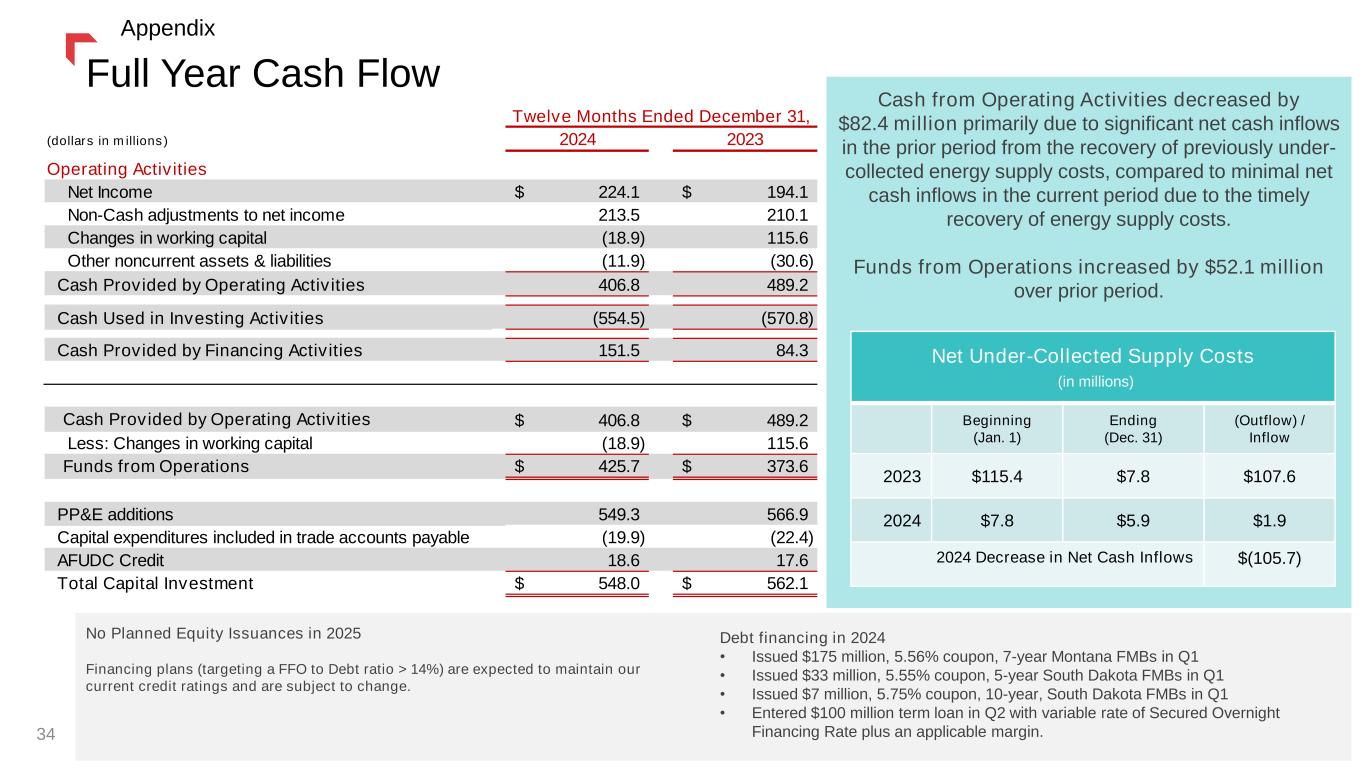
(dollars in millions) 2024 2023 Operating Activities Net Income 224.1$ 194.1$ Non-Cash adjustments to net income 213.5 210.1 Changes in working capital (18.9) 115.6 Other noncurrent assets & liabilities (11.9) (30.6) Cash Provided by Operating Activities 406.8 489.2 Cash Used in Investing Activities (554.5) (570.8) Cash Provided by Financing Activities 151.5 84.3 Cash Provided by Operating Activities 406.8$ 489.2$ Less: Changes in working capital (18.9) 115.6 Funds from Operations 425.7$ 373.6$ PP&E additions 549.3 566.9 Capital expenditures included in trade accounts payable (19.9) (22.4) AFUDC Credit 18.6 17.6 Total Capital Investment 548.0$ 562.1$ Twelve Months Ended December 31, Cash from Operating Activities decreased by $82.4 million primarily due to significant net cash inflows in the prior period from the recovery of previously under- collected energy supply costs, compared to minimal net cash inflows in the current period due to the timely recovery of energy supply costs. Funds from Operations increased by $52.1 million over prior period. Net Under-Collected Supply Costs (in millions) Beginning (Jan. 1) Ending (Dec. 31) (Outflow) / Inflow 2023 $115.4 $7.8 $107.6 2024 $7.8 $5.9 $1.9 2024 Decrease in Net Cash Inflows $(105.7) Full Year Cash Flow 34 No Planned Equity Issuances in 2025 Financing plans (targeting a FFO to Debt ratio > 14%) are expected to maintain our current credit ratings and are subject to change. Debt financing in 2024 • Issued $175 million, 5.56% coupon, 7-year Montana FMBs in Q1 • Issued $33 million, 5.55% coupon, 5-year South Dakota FMBs in Q1 • Issued $7 million, 5.75% coupon, 10-year, South Dakota FMBs in Q1 • Entered $100 million term loan in Q2 with variable rate of Secured Overnight Financing Rate plus an applicable margin. Appendix

Reconciling Gross Margin to Utility Margin Management believes that Utility Margin provides a useful measure for investors and other financial statement users to analyze our financial performance in that it excludes the effect on total revenues caused by volatility in energy costs and associated regulatory mechanisms. This information is intended to enhance an investor's overall understanding of results. Under our various state regulatory mechanisms, as detailed below, our supply costs are generally collected from customers. In addition, Utility Margin is used by us to determine whether we are collecting the appropriate amount of energy costs from customers to allow recovery of operating costs, as well as to analyze how changes in loads (due to weather, economic or other conditions), rates and other factors impact our results of operations. Our Utility Margin measure may not be comparable to that of other companies' presentations or more useful than the GAAP information provided elsewhere in this report. (1) Utility Margin is a non-GAAP Measure. 35 Appendix 2024 2023 2024 2023 2024 2023 (in millions) Reconciliation of gross margin to utility margin Operating Revenues 290.9$ 264.2$ 82.6$ 91.8$ 373.5$ 356.0$ Less: Fuel, purchased supply and direct transmission expense (exclusive of depreciation and depletion shown separately below) 72.6 64.2 22.1 34.0 94.7 98.2 Less: Operating & maintenance expense 45.4 42.2 15.0 14.4 60.4 56.6 Less: Property and other tax expense 29.9 17.3 9.0 4.7 38.9 22.0 Less: Depreciation and depletion expense 47.6 43.6 9.4 9.1 57.0 52.7 Gross Margin 95.4 96.9 27.1 29.6 122.5 126.5 Plus: Operating & maintenance expense 45.4 42.2 15.0 14.4 60.4 56.6 Plus: Property and other tax expense 29.9 17.3 9.0 4.7 38.9 22.0 Plus: Depreciation and depletion 47.6 43.6 9.4 9.1 57.0 52.7 Utility Margin 218.3$ 200.0$ 60.5$ 57.8$ 278.8$ 257.8$ 2024 2023 2024 2023 2024 2023 (in millions) Reconciliation of gross margin to utility margin Operating Revenues 1,200.7$ 1,068.8$ 313.2$ 353.3$ 1,513.9$ 1,422.1$ Less: Fuel, purchased supply and direct transmission expense (exclusive of depreciation and depletion shown separately below) 329.6 262.7 104.2 157.5 433.8 420.2 Less: Operating & maintenance expense 171.7 166.0 56.1 54.5 227.8 220.5 Less: Property and other tax expense 126.5 120.3 37.4 34.3 163.9 154.6 Less: Depreciation and depletion expense 190.0 174.1 37.6 36.4 227.6 210.5 Gross Margin 382.9 345.7 77.9 70.6 460.8 416.3 Plus: Operating & maintenance expense 171.7 166.0 56.1 54.5 227.8 220.5 Plus: Property and other tax expense 126.5 120.3 37.4 34.3 163.9 154.6 Plus: Depreciation and depletion 190.0 174.1 37.6 36.4 227.6 210.5 Utility Margin 871.1$ 806.1$ 209.0$ 195.8$ 1,080.1$ 1,001.9$ Reconciliation of Gross Margin to Utility Margin for the Three Months Ended December 31, Reconciliation of Gross Margin to Utility Margin for the Twelve Months Ended December 31, Electric Natural Gas Total Electric Natural Gas Total (1) (1)
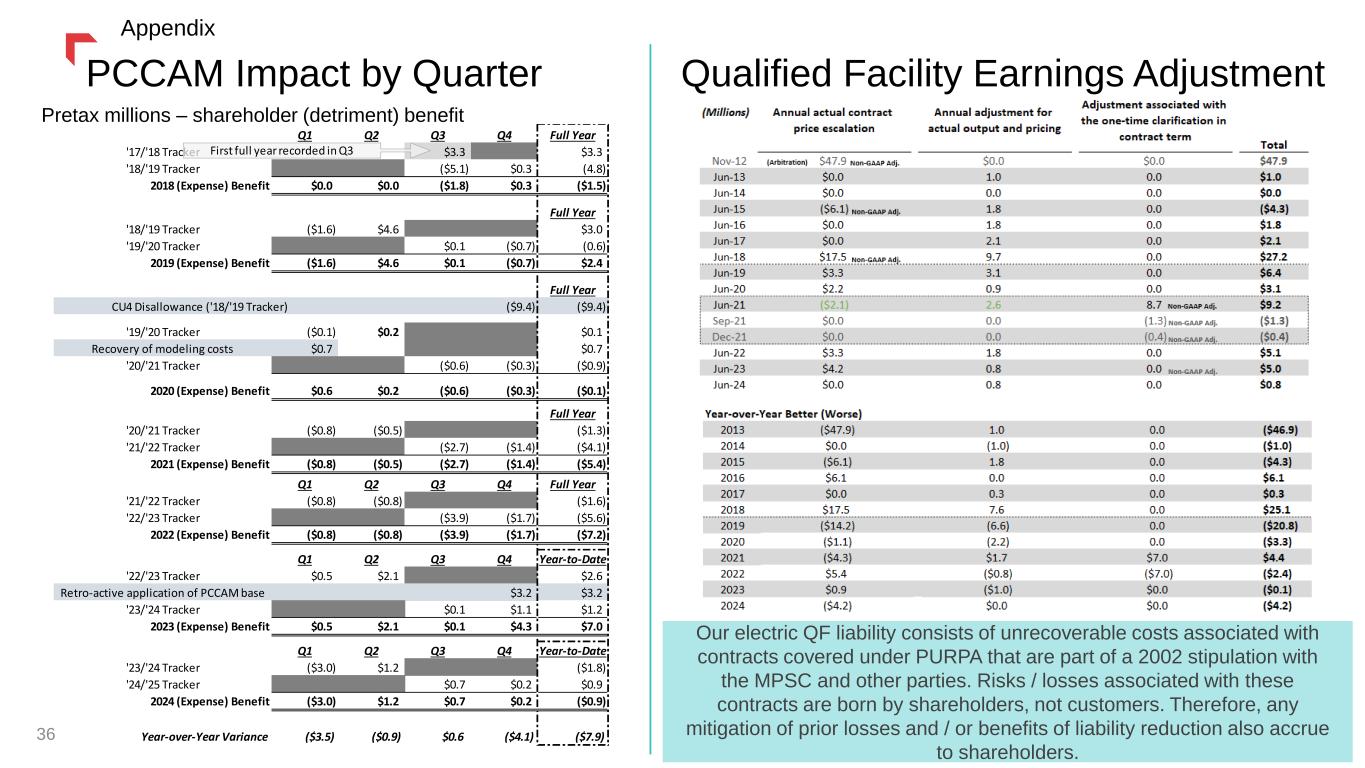
Q1 Q2 Q3 Q4 Full Year '17/'18 Tracker $3.3 $3.3 '18/'19 Tracker ($5.1) $0.3 (4.8) 2018 (Expense) Benefit $0.0 $0.0 ($1.8) $0.3 ($1.5) Full Year '18/'19 Tracker ($1.6) $4.6 $3.0 '19/'20 Tracker $0.1 ($0.7) (0.6) 2019 (Expense) Benefit ($1.6) $4.6 $0.1 ($0.7) $2.4 Full Year ($9.4) ($9.4) '19/'20 Tracker ($0.1) $0.2 $0.1 Recovery of modeling costs $0.7 $0.7 '20/'21 Tracker ($0.6) ($0.3) ($0.9) 2020 (Expense) Benefit $0.6 $0.2 ($0.6) ($0.3) ($0.1) Full Year '20/'21 Tracker ($0.8) ($0.5) ($1.3) '21/'22 Tracker ($2.7) ($1.4) ($4.1) 2021 (Expense) Benefit ($0.8) ($0.5) ($2.7) ($1.4) ($5.4) Q1 Q2 Q3 Q4 Full Year '21/'22 Tracker ($0.8) ($0.8) ($1.6) '22/'23 Tracker ($3.9) ($1.7) ($5.6) 2022 (Expense) Benefit ($0.8) ($0.8) ($3.9) ($1.7) ($7.2) Q1 Q2 Q3 Q4 Year-to-Date '22/'23 Tracker $0.5 $2.1 $2.6 Retro-active application of PCCAM base $3.2 $3.2 '23/'24 Tracker $0.1 $1.1 $1.2 2023 (Expense) Benefit $0.5 $2.1 $0.1 $4.3 $7.0 Q1 Q2 Q3 Q4 Year-to-Date '23/'24 Tracker ($3.0) $1.2 ($1.8) '24/'25 Tracker $0.7 $0.2 $0.9 2024 (Expense) Benefit ($3.0) $1.2 $0.7 $0.2 ($0.9) Year-over-Year Variance ($3.5) ($0.9) $0.6 ($4.1) ($7.9) CU4 Disallowance ('18/'19 Tracker) First full year recorded in Q3 PCCAM Impact by Quarter Qualified Facility Earnings Adjustment Our electric QF liability consists of unrecoverable costs associated with contracts covered under PURPA that are part of a 2002 stipulation with the MPSC and other parties. Risks / losses associated with these contracts are born by shareholders, not customers. Therefore, any mitigation of prior losses and / or benefits of liability reduction also accrue to shareholders. 36 Appendix Pretax millions – shareholder (detriment) benefit

Thank youFourth Quarter Appendix 37

Fourth Quarter Financial Results 38 1.) Utility Margin is a non-GAAP Measure. See appendix slide titled “Reconciling Gross Margin to Utility Margin” for additional disclosure. Note: Subtotal variances may exist due to rounding. Appendix (in millions except per share amounts) 2024 2023 Variance % Variance Operating Revenues $373.5 $356.0 $17.5 4.9% 94.7 98.2 (3.5) (3.6%) Utility Margin 278.7 257.8 21.0 8.1% Operating Expenses Operating and maintenance 60.4 56.6 3.8 6.8% Administrative and general 30.8 23.3 7.5 32.1% Property and other taxes 38.8 22.0 16.8 76.3% Depreciation and depletion 57.0 52.7 4.3 8.2% Total Operating Expenses 187.0 154.6 32.4 21.0% Operating Income 91.7 103.2 (11.5) (11.1%) Interest expense, net (35.4) (29.5) (5.9) (20.2%) Other income, net 3.4 2.9 0.5 18.0% Income Before Income Taxes 59.7 76.6 (16.9) (22.1%) Income tax benefit 20.8 6.5 14.3 218.5% Net Income $80.6 $83.1 ($2.6) (3.1%) Effective Tax Rate (34.9%) (8.4%) (26.5%) Diluted Shares Outstanding 61.4 61.3 0.1 0.2% Diluted Earnings Per Share $1.31 $1.37 ($0.06) (4.4%) Dividends Paid per Common Share $0.65 $0.64 $0.01 1.6% Three Months Ended December 31, Fuel, purchased supply & direct transmission expense (exclusive of depreciation and depletion) 1

Utility Margin (Q4) (dollars in millions) Three Months Ended December 31, 2024 2023 Variance Electric $ 218.3 $ 200.0 $ 18.3 9.2% Natural Gas 60.5 57.8 2.7 4.7% Total Utility Margin1 $ 278.8 $ 257.8 $ 21.0 8.1% (1) Utility Margin is a non-GAAP Measure. See appendix slide titled “Reconciling Gross Margin to Utility Margin” for additional disclosure. Increase in utility margin due to the following factors: $ 9.0 Base rates 5.1 Electric transmission revenue due to market conditions and rates 4.8 Montana interim rates (subject to refund) 0.4 Montana natural gas transportation (4.1) Non-recoverable Montana electric supply costs (3.8) Montana property tax tracker collections (1.9) Electric Retail volumes (1.3) Natural gas retail volumes (5.4) Other $ 2.8 Change in Utility Margin Impacting Net Income $ 14.6 Property & other taxes recovered in revenue, offset in property & other taxes 1.9 Operating expenses recovered in revenue, offset in operating & maintenance expense 1.7 Production tax credits, offset in income tax expense $ 18.2 Change in Utility Margin Offset Within Net Income $ 21.0 Increase in Utility Margin 39 Appendix
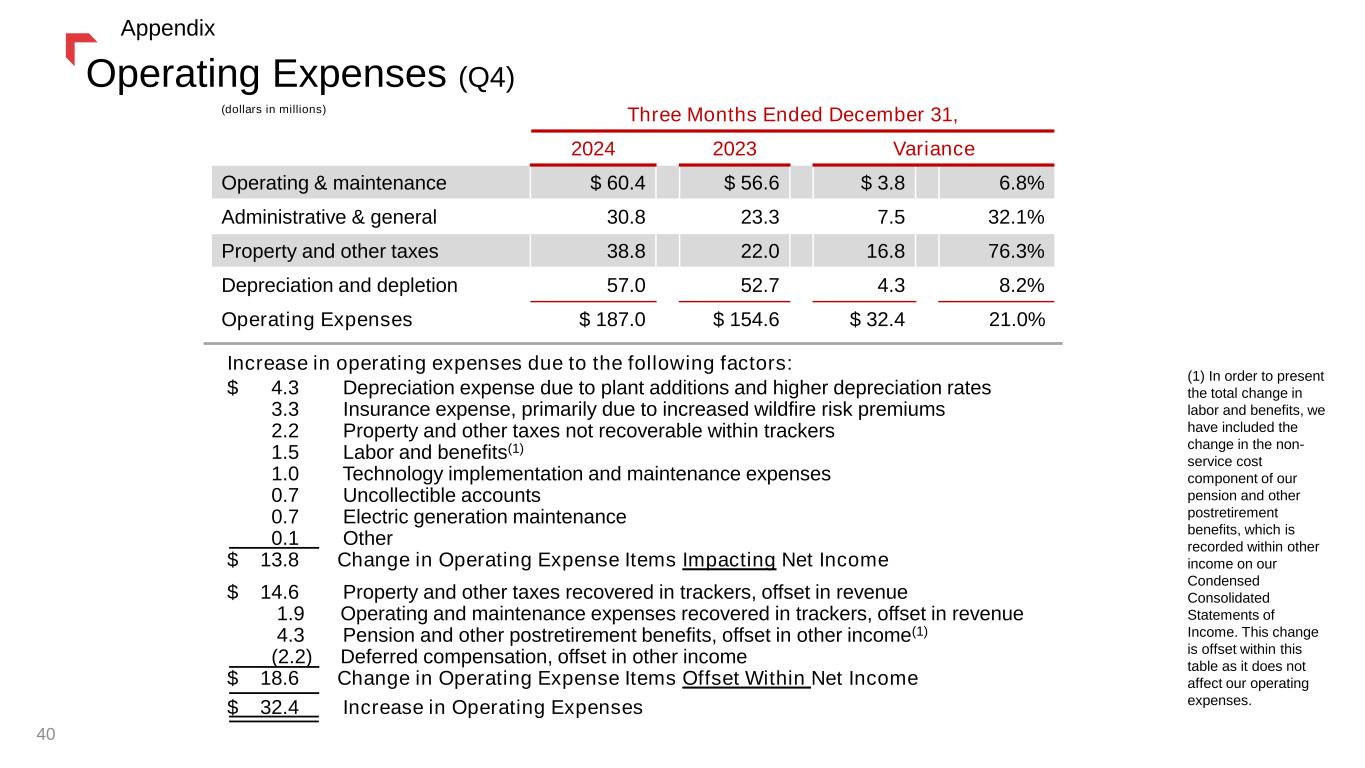
Operating Expenses (Q4) Increase in operating expenses due to the following factors: $ 4.3 Depreciation expense due to plant additions and higher depreciation rates 3.3 Insurance expense, primarily due to increased wildfire risk premiums 2.2 Property and other taxes not recoverable within trackers 1.5 Labor and benefits(1) 1.0 Technology implementation and maintenance expenses 0.7 Uncollectible accounts 0.7 Electric generation maintenance 0.1 Other $ 13.8 Change in Operating Expense Items Impacting Net Income (dollars in millions) Three Months Ended December 31, 2024 2023 Variance Operating & maintenance $ 60.4 $ 56.6 $ 3.8 6.8% Administrative & general 30.8 23.3 7.5 32.1% Property and other taxes 38.8 22.0 16.8 76.3% Depreciation and depletion 57.0 52.7 4.3 8.2% Operating Expenses $ 187.0 $ 154.6 $ 32.4 21.0% $ 14.6 Property and other taxes recovered in trackers, offset in revenue 1.9 Operating and maintenance expenses recovered in trackers, offset in revenue 4.3 Pension and other postretirement benefits, offset in other income(1) (2.2) Deferred compensation, offset in other income $ 18.6 Change in Operating Expense Items Offset Within Net Income $ 32.4 Increase in Operating Expenses (1) In order to present the total change in labor and benefits, we have included the change in the non- service cost component of our pension and other postretirement benefits, which is recorded within other income on our Condensed Consolidated Statements of Income. This change is offset within this table as it does not affect our operating expenses. 40 Appendix
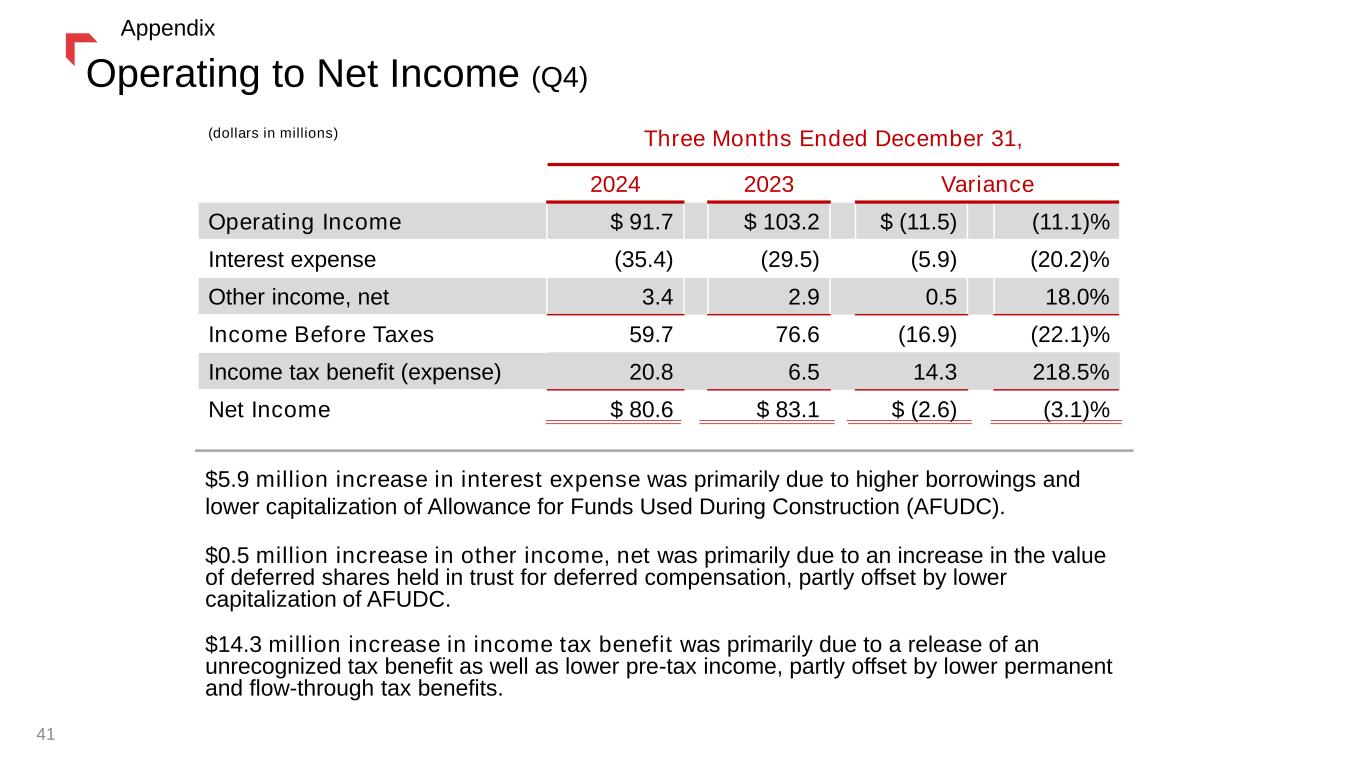
Operating to Net Income (Q4) (dollars in millions) Three Months Ended December 31, 2024 2023 Variance Operating Income $ 91.7 $ 103.2 $ (11.5) (11.1)% Interest expense (35.4) (29.5) (5.9) (20.2)% Other income, net 3.4 2.9 0.5 18.0% Income Before Taxes 59.7 76.6 (16.9) (22.1)% Income tax benefit (expense) 20.8 6.5 14.3 218.5% Net Income $ 80.6 $ 83.1 $ (2.6) (3.1)% $5.9 million increase in interest expense was primarily due to higher borrowings and lower capitalization of Allowance for Funds Used During Construction (AFUDC). $0.5 million increase in other income, net was primarily due to an increase in the value of deferred shares held in trust for deferred compensation, partly offset by lower capitalization of AFUDC. $14.3 million increase in income tax benefit was primarily due to a release of an unrecognized tax benefit as well as lower pre-tax income, partly offset by lower permanent and flow-through tax benefits. 41 Appendix
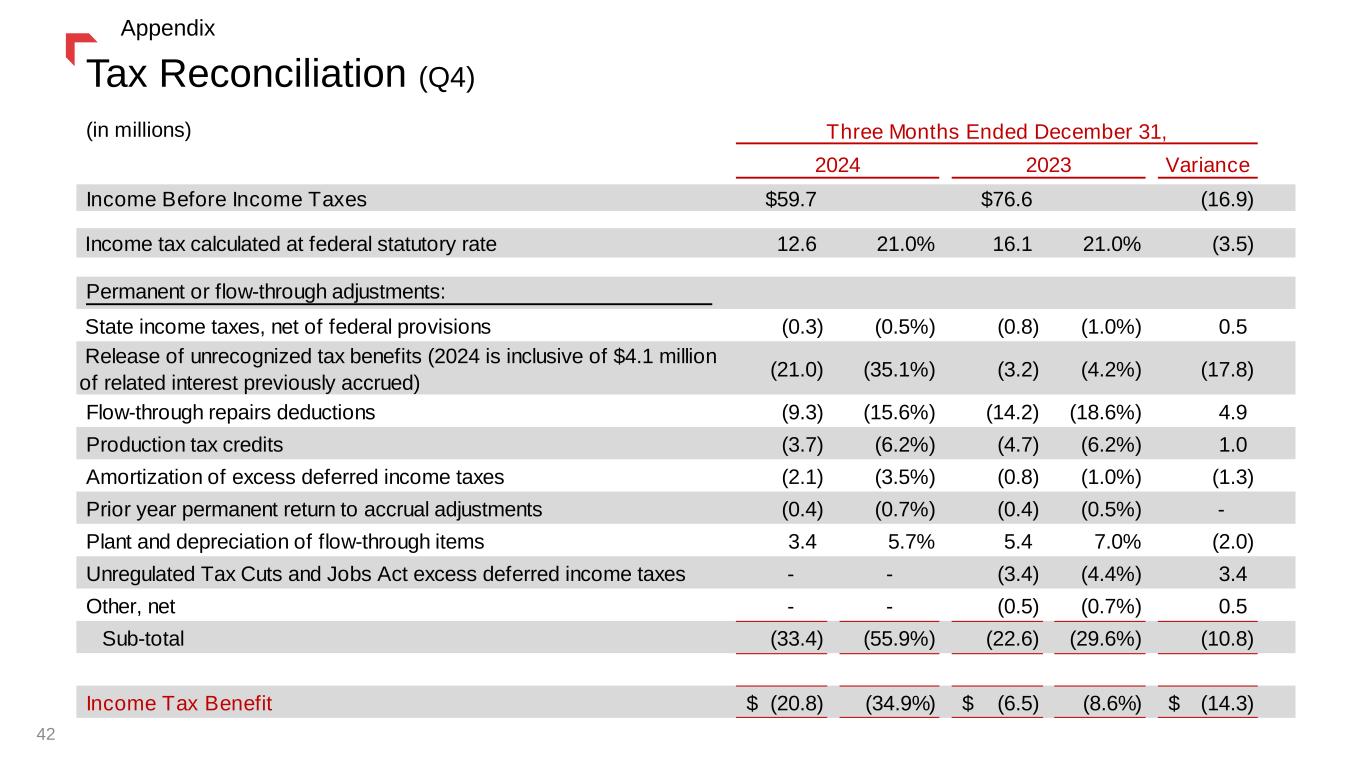
(in millions) Variance Income Before Income Taxes $59.7 $76.6 (16.9) Income tax calculated at federal statutory rate 12.6 21.0% 16.1 21.0% (3.5) Permanent or flow-through adjustments: State income taxes, net of federal provisions (0.3) (0.5%) (0.8) (1.0%) 0.5 Release of unrecognized tax benefits (2024 is inclusive of $4.1 million of related interest previously accrued) (21.0) (35.1%) (3.2) (4.2%) (17.8) Flow-through repairs deductions (9.3) (15.6%) (14.2) (18.6%) 4.9 Production tax credits (3.7) (6.2%) (4.7) (6.2%) 1.0 Amortization of excess deferred income taxes (2.1) (3.5%) (0.8) (1.0%) (1.3) Prior year permanent return to accrual adjustments (0.4) (0.7%) (0.4) (0.5%) - Plant and depreciation of flow-through items 3.4 5.7% 5.4 7.0% (2.0) Unregulated Tax Cuts and Jobs Act excess deferred income taxes - - (3.4) (4.4%) 3.4 Other, net - - (0.5) (0.7%) 0.5 Sub-total (33.4) (55.9%) (22.6) (29.6%) (10.8) Income Tax Benefit (20.8)$ (34.9%) (6.5)$ (8.6%) (14.3)$ Three Months Ended December 31, 2024 2023 Tax Reconciliation (Q4) 42 Appendix
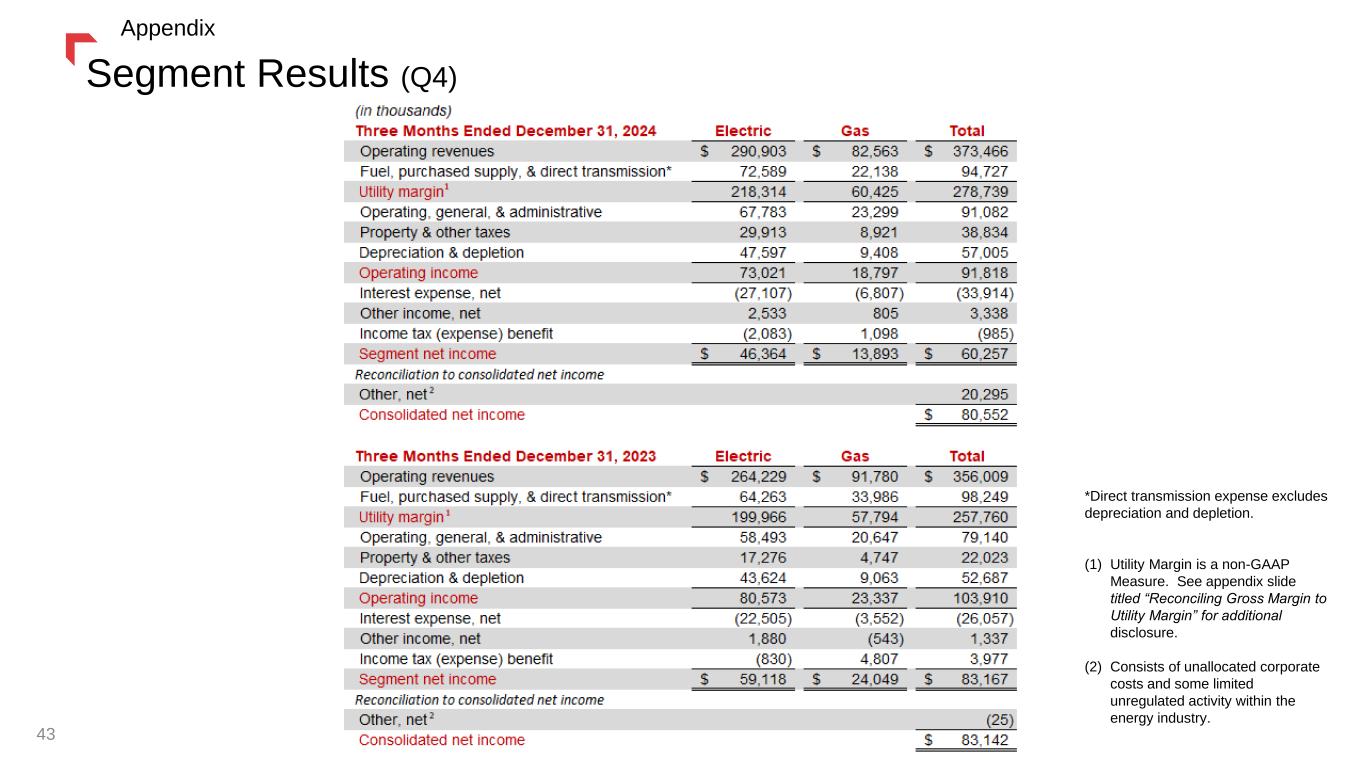
Segment Results (Q4) 43 Appendix *Direct transmission expense excludes depreciation and depletion. (1) Utility Margin is a non-GAAP Measure. See appendix slide titled “Reconciling Gross Margin to Utility Margin” for additional disclosure. (2) Consists of unallocated corporate costs and some limited unregulated activity within the energy industry.

Electric Segment (Q4) (1) Utility Margin is a non-GAAP Measure. See appendix slide titled “Reconciling Gross Margin to Utility Margin” for additional disclosure. 44 Appendix

Natural Gas Segment (Q4) 45 Appendix (1) Utility Margin is a non-GAAP Measure. See appendix slide titled “Reconciling Gross Margin to Utility Margin” for additional disclosure.

Thank youRate Review Appendix 46

Montana Electric Rate Review Montana Electric: • $69.4M Net Request • $874M Plant-in-Service additions (’23-’24F) • Operating Costs 1.1% CAGR (’21-’23) • Typical Residential Bill: 8.3% at full request 47 $156.5 Million Base Rate Increase Requested & $69.4 Million Total Request Typical 750 kWh Residential Electric Bill YCGS Net Customer Impact Appendix Plant in Service Additions Base Rates Flow-Through Costs Typical Res. Monthly Bill Prior Rates $64.33 $45.74 $110.07 Interim Rates $67.42 $28.23 $95.64 $ Change $3.08 ($17.51) ($14.43) % Change +4.8% (38.3%) (13.1%)
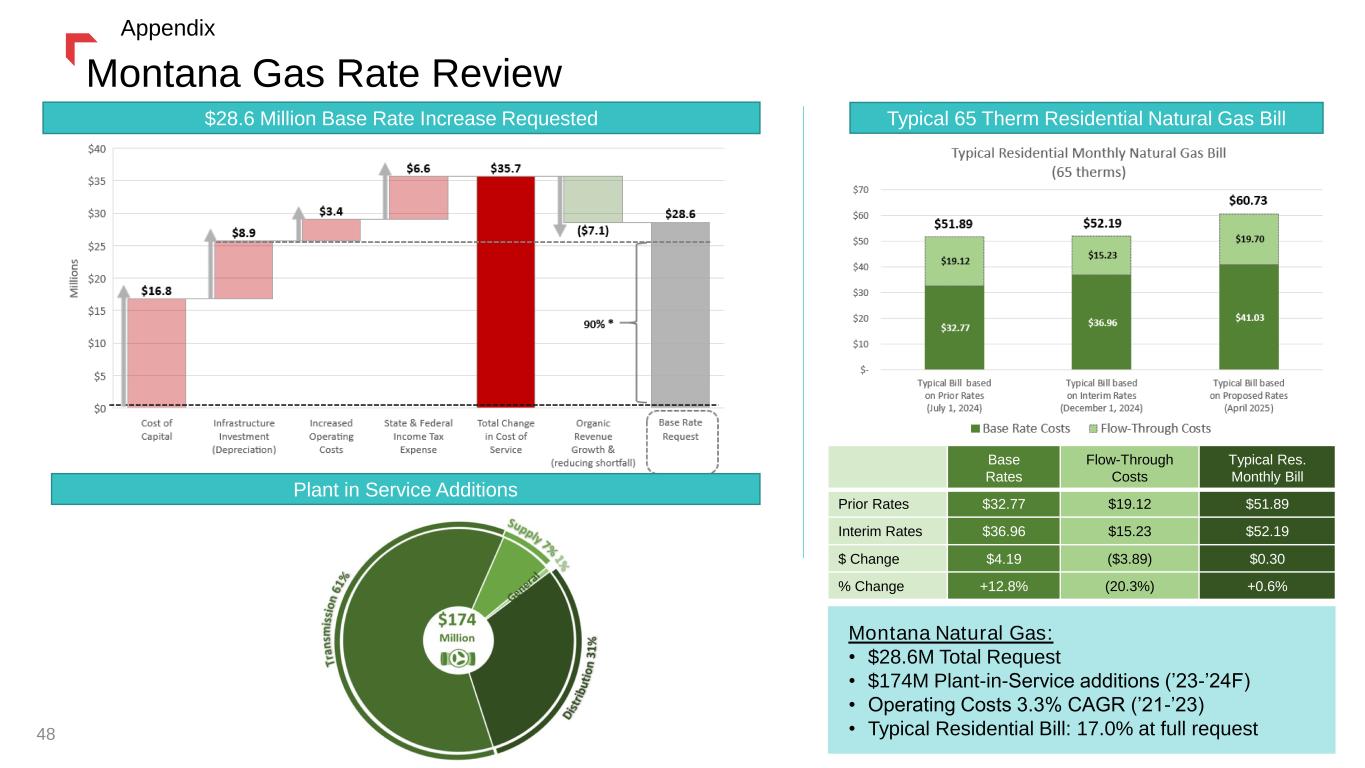
Montana Gas Rate Review 48 $28.6 Million Base Rate Increase Requested Montana Natural Gas: • $28.6M Total Request • $174M Plant-in-Service additions (’23-’24F) • Operating Costs 3.3% CAGR (’21-’23) • Typical Residential Bill: 17.0% at full request Typical 65 Therm Residential Natural Gas Bill Appendix Plant in Service Additions Base Rates Flow-Through Costs Typical Res. Monthly Bill Prior Rates $32.77 $19.12 $51.89 Interim Rates $36.96 $15.23 $52.19 $ Change $4.19 ($3.89) $0.30 % Change +12.8% (20.3%) +0.6%

Nebraska Natural Gas Rate Review 49 $3.6 Million Rate Increase Requested Typical 100 Therm Residential Natural Gas Bill Nebraska Natural Gas: • $3.6M Total Request • $42M Plant-in-Service additions (’07-’23) • Operating Costs 1.3% CAGR (’07-’23) • Typical Residential Bill: 5.8% at full request • Interim rates of $2.3M implemented Oct. 1st, 2024. Appendix
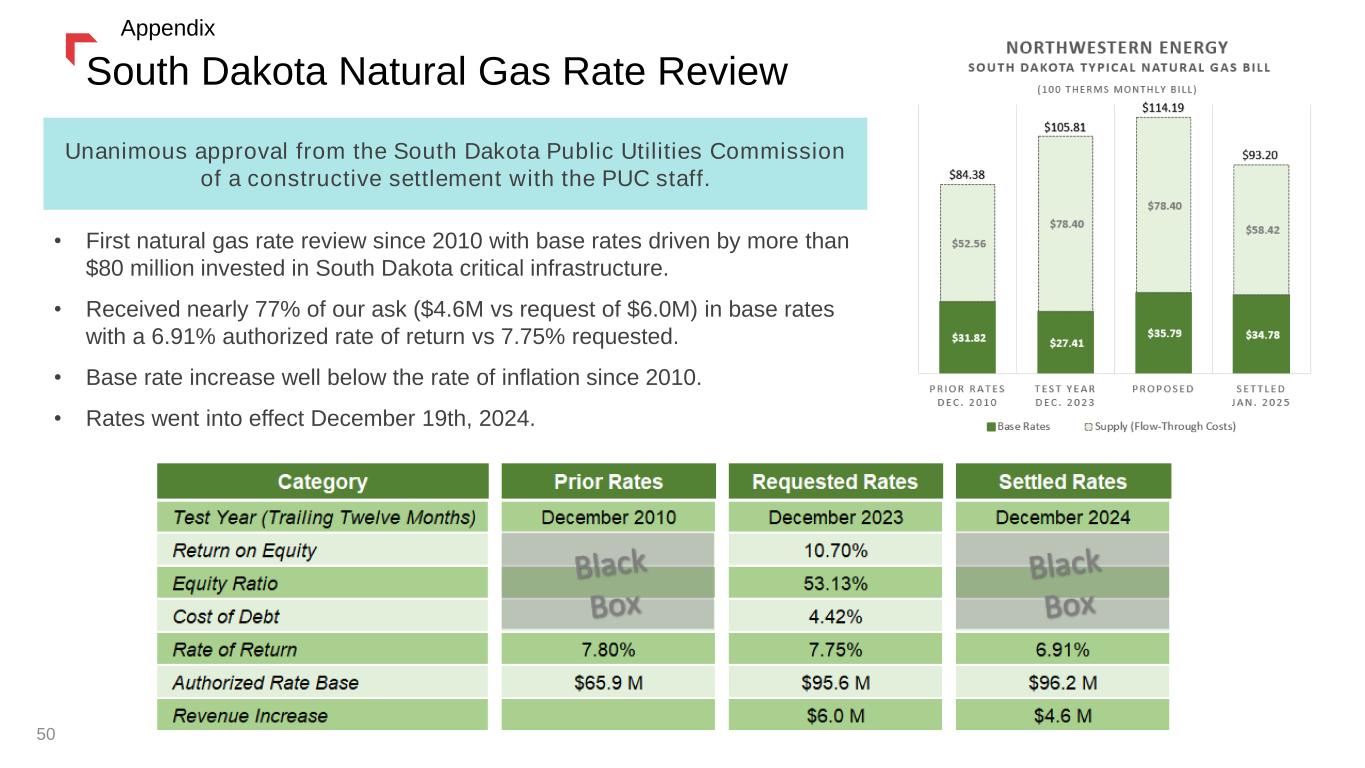
50 South Dakota Natural Gas Rate Review Unanimous approval from the South Dakota Public Utilities Commission of a constructive settlement with the PUC staff. • First natural gas rate review since 2010 with base rates driven by more than $80 million invested in South Dakota critical infrastructure. • Received nearly 77% of our ask ($4.6M vs request of $6.0M) in base rates with a 6.91% authorized rate of return vs 7.75% requested. • Base rate increase well below the rate of inflation since 2010. • Rates went into effect December 19th, 2024. Appendix
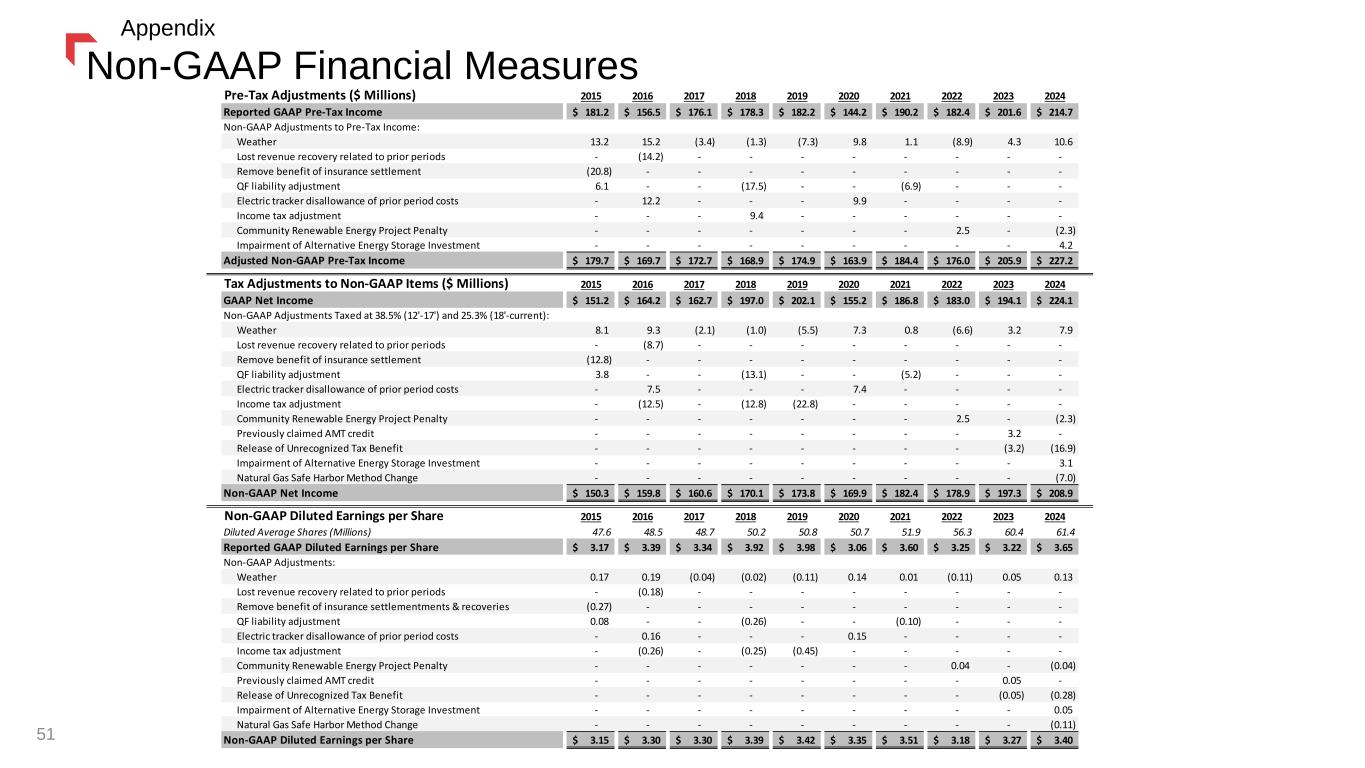
Non-GAAP Financial Measures 51 Appendix Pre-Tax Adjustments ($ Millions) 2015 2016 2017 2018 2019 2020 2021 2022 2023 2024 Reported GAAP Pre-Tax Income 181.2$ 156.5$ 176.1$ 178.3$ 182.2$ 144.2$ 190.2$ 182.4$ 201.6$ 214.7$ Non-GAAP Adjustments to Pre-Tax Income: Weather 13.2 15.2 (3.4) (1.3) (7.3) 9.8 1.1 (8.9) 4.3 10.6 Lost revenue recovery related to prior periods - (14.2) - - - - - - - - Remove benefit of insurance settlement (20.8) - - - - - - - - - QF liability adjustment 6.1 - - (17.5) - - (6.9) - - - Electric tracker disallowance of prior period costs - 12.2 - - - 9.9 - - - - Income tax adjustment - - - 9.4 - - - - - - Community Renewable Energy Project Penalty - - - - - - - 2.5 - (2.3) Impairment of Alternative Energy Storage Investment - - - - - - - - - 4.2 Adjusted Non-GAAP Pre-Tax Income 179.7$ 169.7$ 172.7$ 168.9$ 174.9$ 163.9$ 184.4$ 176.0$ 205.9$ 227.2$ Tax Adjustments to Non-GAAP Items ($ Millions) 2015 2016 2017 2018 2019 2020 2021 2022 2023 2024 GAAP Net Income 151.2$ 164.2$ 162.7$ 197.0$ 202.1$ 155.2$ 186.8$ 183.0$ 194.1$ 224.1$ Non-GAAP Adjustments Taxed at 38.5% (12'-17') and 25.3% (18'-current): Weather 8.1 9.3 (2.1) (1.0) (5.5) 7.3 0.8 (6.6) 3.2 7.9 Lost revenue recovery related to prior periods - (8.7) - - - - - - - - Remove benefit of insurance settlement (12.8) - - - - - - - - - QF liability adjustment 3.8 - - (13.1) - - (5.2) - - - Electric tracker disallowance of prior period costs - 7.5 - - - 7.4 - - - - Income tax adjustment - (12.5) - (12.8) (22.8) - - - - - Community Renewable Energy Project Penalty - - - - - - - 2.5 - (2.3) Previously claimed AMT credit - - - - - - - - 3.2 - Release of Unrecognized Tax Benefit - - - - - - - - (3.2) (16.9) Impairment of Alternative Energy Storage Investment - - - - - - - - - 3.1 Natural Gas Safe Harbor Method Change - - - - - - - - - (7.0) Non-GAAP Net Income 150.3$ 159.8$ 160.6$ 170.1$ 173.8$ 169.9$ 182.4$ 178.9$ 197.3$ 208.9$ Non-GAAP Diluted Earnings per Share 2015 2016 2017 2018 2019 2020 2021 2022 2023 2024 Diluted Average Shares (Millions) 47.6 48.5 48.7 50.2 50.8 50.7 51.9 56.3 60.4 61.4 Reported GAAP Diluted Earnings per Share 3.17$ 3.39$ 3.34$ 3.92$ 3.98$ 3.06$ 3.60$ 3.25$ 3.22$ 3.65$ Non-GAAP Adjustments: Weather 0.17 0.19 (0.04) (0.02) (0.11) 0.14 0.01 (0.11) 0.05 0.13 Lost revenue recovery related to prior periods - (0.18) - - - - - - - - Remove benefit of insurance settlementments & recoveries (0.27) - - - - - - - - - QF liability adjustment 0.08 - - (0.26) - - (0.10) - - - Electric tracker disallowance of prior period costs - 0.16 - - - 0.15 - - - - Income tax adjustment - (0.26) - (0.25) (0.45) - - - - - Community Renewable Energy Project Penalty - - - - - - - 0.04 - (0.04) Previously claimed AMT credit - - - - - - - - 0.05 - Release of Unrecognized Tax Benefit - - - - - - - - (0.05) (0.28) Impairment of Alternative Energy Storage Investment - - - - - - - - - 0.05 Natural Gas Safe Harbor Method Change - - - - - - - - - (0.11) Non-GAAP Diluted Earnings per Share 3.15$ 3.30$ 3.30$ 3.39$ 3.42$ 3.35$ 3.51$ 3.18$ 3.27$ 3.40$
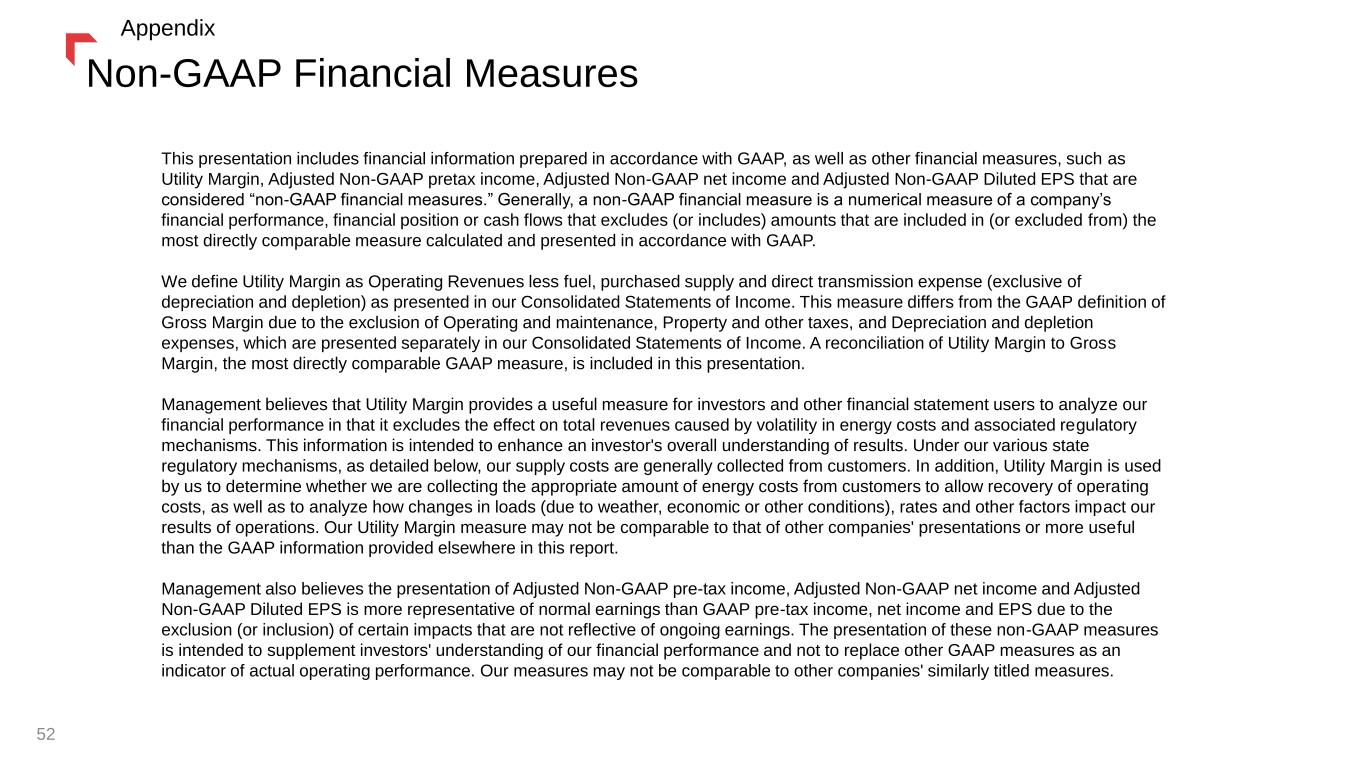
Non-GAAP Financial Measures This presentation includes financial information prepared in accordance with GAAP, as well as other financial measures, such as Utility Margin, Adjusted Non-GAAP pretax income, Adjusted Non-GAAP net income and Adjusted Non-GAAP Diluted EPS that are considered “non-GAAP financial measures.” Generally, a non-GAAP financial measure is a numerical measure of a company’s financial performance, financial position or cash flows that excludes (or includes) amounts that are included in (or excluded from) the most directly comparable measure calculated and presented in accordance with GAAP. We define Utility Margin as Operating Revenues less fuel, purchased supply and direct transmission expense (exclusive of depreciation and depletion) as presented in our Consolidated Statements of Income. This measure differs from the GAAP definition of Gross Margin due to the exclusion of Operating and maintenance, Property and other taxes, and Depreciation and depletion expenses, which are presented separately in our Consolidated Statements of Income. A reconciliation of Utility Margin to Gross Margin, the most directly comparable GAAP measure, is included in this presentation. Management believes that Utility Margin provides a useful measure for investors and other financial statement users to analyze our financial performance in that it excludes the effect on total revenues caused by volatility in energy costs and associated regulatory mechanisms. This information is intended to enhance an investor's overall understanding of results. Under our various state regulatory mechanisms, as detailed below, our supply costs are generally collected from customers. In addition, Utility Margin is used by us to determine whether we are collecting the appropriate amount of energy costs from customers to allow recovery of operating costs, as well as to analyze how changes in loads (due to weather, economic or other conditions), rates and other factors impact our results of operations. Our Utility Margin measure may not be comparable to that of other companies' presentations or more useful than the GAAP information provided elsewhere in this report. Management also believes the presentation of Adjusted Non-GAAP pre-tax income, Adjusted Non-GAAP net income and Adjusted Non-GAAP Diluted EPS is more representative of normal earnings than GAAP pre-tax income, net income and EPS due to the exclusion (or inclusion) of certain impacts that are not reflective of ongoing earnings. The presentation of these non-GAAP measures is intended to supplement investors' understanding of our financial performance and not to replace other GAAP measures as an indicator of actual operating performance. Our measures may not be comparable to other companies' similarly titled measures. 52 Appendix

Thank youDelivering a bright future 53


