Exhibit 99.3
MANAGEMENT’S DISCUSSION AND ANALYSIS OF FINANCIAL CONDITION AND RESULTS OF OPERATIONS OF SCANTECH
You should read the following discussion in conjunction with our financial statements and related notes included elsewhere in this proxy statement/prospectus/consent solicitation. This discussion contains forward-looking statements that involve risks and uncertainties. Our actual results and the timing of selected events could differ materially from those anticipated in these forward-looking statements as a result of various factors, including, but not limited to, those set forth under “Risk Factors” and elsewhere in this proxy statement/prospectus/consent solicitation.
Overview
Our mission is to develop and deploy security screening systems that protect travelers and other members of the public from criminals, terrorists and other bad actors. We have developed a proprietary fixed- gantry Computed Tomography scanning system that detects explosives, weapons, narcotics and other contraband.
Our initial market focus is domestic and international aviation checkpoints. However, we believe a significant global market opportunity also exists for deploying our scanners in (i) other government facilities such as border crossings, seaports, military bases, embassies, federal buildings, prisons and postal facilities and (ii) the private sector at manufacturing plants, entertainment facilities, power plants, petrochemical facilities, convention centers, schools, sports stadiums and other highly-trafficked public buildings or venues.
Our SENTINEL fixed-gantry scanner has already achieved several third-party certifications, including the TSA’s Tier 2 Explosive Detection Certification. Certification to the TSA’s Accessible Property Screening System 6.2.0 Explosive Detection Standard and to the European Civil Aviation Conference Explosive Detection System for Cabin Baggage Certification are in advanced stages.
We believe that our scanner systems and fixed-gantry CT technology have advantages and improved threat detection capacity as compared to traditional rotating-gantry systems.
Our SENTINEL scanners are designed to be deployed at security checkpoints. They can be quickly installed and easily maintained without major infrastructure modifications to existing checkpoints.
Most CT security scanners on the market are based on rotating-gantry technology, which was first developed in the 1970s for use in medical imaging. Rotating gantry involves a single X-ray tube and detectors opposite this tube. These revolve around the object being scanned, generating images which are reconstructed to produce a three-dimensional image.
SENTINEL Scanner Description
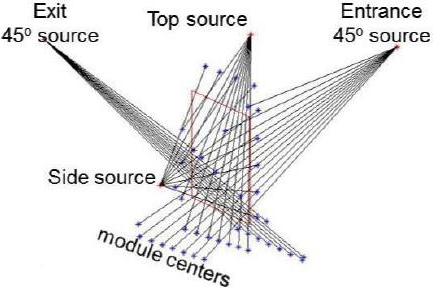
SENTINEL’s fix-gantry CT architecture incorporates four (4) discrete pairs of fixed multi-energy X-ray generators and detector arrays. Each generator/ detector pair is optimally configured to provide non- traditional planar slices significantly expanding the robustness, reliability and repeatability of image data reconstruction and improving the system’s ability to discriminate/interrogate threat materials and hidden objects. The orientation of the generators/detectors yield three (3) discrete slices of the target for interrogation: 1) Perpendicular to the tunnel; 2) 45° angle along the Belt from Entrance to Exit, and; 3) 45° angle backwards along the Belt from Exit to Entrance. The three slices of metadata are used to reconstruct a three- dimensional map of the effective atomic numbers (Zeff) and mass densities of the scanned contents. The projections in this innovative geometry provide three unique planes while the projections of conventional CT systems are essentially in a single plane. Three integrated & interlaced slices through an object versus the typical single plane slice of data in rotating-gantry CT improves spatial recognition, particularly in high clutter situations, as the four (4) X-ray projections are traveling through unique paths for a given area of interest. Coupled with few-view CT reconstruction and advanced threat detection algorithms, SENTINEL’S architecture expands the robustness, reliability and repeatability of the measurement data.
The figure below depicts the SENTINEL’s fixed-gantry projection geometry showing the four X-ray sources tunnel entrance, exit, top and side projections. The red box depicts the traditional 90° planer slice perpendicular to the conveyor. Two additional 45° planar slices (not shown) are also created.
1
SENTINEL Scanner Installation
First and foremost, the SENTINEL has been designed for easy deployment and installation at domestic and international checkpoints. Following production, assembly and factory acceptance testing, SENTINEL systems, simulators and peripheral equipment are packaged and marked in accordance with TSA packaging and marking requirements for transportation security screening equipment. The system is shipped directly to the customer’s site in one piece along with ingress and egress conveyors, primary and auxiliary viewing stations and peripheral equipment in three simple shipping crates. We assign an installation site lead to coordinate system receipt, rigging unloading, installation and start-up. For installed systems, the installation site lead collects data, performs on-site functional testing, and prepares a commissioning report. For each system installed, the commissioning report will document i) Visual Inspection; ii) Operational/ Functional Test; iii) Image Quality Test; and, iv) Explosive Simulant Detection Test. Because the system is delivered to the site in one piece, the installation, setup, startup and functional test process is typically completed in four to six hours if the checkpoint has been prepared for system setting.
SENTINEL Scanner Maintenance
Modular construction of SENTINEL plays a major role in the system’s serviceability and ensures fast field service to get the machine back on line. Furthermore, as system upgrades and enhancements are designed, engineered, tested and approved, respective modules can easily be changed-out in the field. System electrical and control components are mounted on four (4) back-plates that are easy to inspect, basic troubleshoot, and remove & replace if necessary. All modules are individually certified by Underwriter’s Laboratory (UL) in addition to the entire machine being UL certified. The four back-plate modules are located behind the same exterior panel and can easily be accessed by an authorized service technician. If a module is diagnosed with a problem, the entire module is removed by unplugging the wiring harness connectors, unscrewing four (4) nuts, removing the module and simply installing a new module, which takes five to ten minutes to complete. The defective module is then returned to ScanTech for detailed troubleshooting, evaluation and if economical, repair. Likewise, X-ray generators are a modular monoblock design hermetically enclosing the X-ray tube, high-voltage power supply, collimator, and cooling system. The replacement of an X-ray generator takes less than an hour as the monoblock is mounted on a factory laser- aligned mounting frame. The monoblock is removed by unbolting four (4) bolts plus two (2) connectors. Simply remove and replace the unit with a new X-ray monoblock and the system is ready to scan. No alignment of the X-ray monoblock is required because of the pre-aligned precision of the X-ray generator and detector array mounting frames, so an X-ray monoblock change out is simply a ‘pull-plug-scan’ service call. Detector Arrays can also be easily replaced. Each array is a modular unit mounted on a precision mounting bracket or frame. To replace the detector board(s), one must merely remove the access plate(s), unplug the communication & power connectors, remove the array bracket or frame, and repeat the process to reinstall. SENTINEL’s modular design provides a low-cost component upgrade path, reduced system downtime, faster field service and troubleshooting, and lower maintenance costs.
2
SENTINEL Scanner Operation
In similar fashion to current protocols at aviation checkpoint security stations, ‘carry-on’ baggage and other approved ‘carry-on’ items are loaded onto the SENTINEL’s conveyor and queued for scanning through the system’s tunnel. Once loaded onto the conveyor belt, each item passes through the system’s X-ray inspection tunnel, and within a matter of seconds, reappears at the opposite end. Instead of a rotating gantry, SENTINEL’s four fixed independent and synchronized X-ray sources project X-ray images of scanned items onto the system’s four independent arrays of detectors where various signatures associated with the materials the X-rays interact with inside of the tunnel are measured or calculated. Advanced and proprietary algorithms provide highly reliable automatic threat detection, not only differentiating between threatening and non-threatening materials, but also specifically identifying the items as benign (such as face cream,) or dangerous (such as explosives), as well as drugs and other hazardous materials. During a scan, four separate high-definition visual images are generated and displayed on the system’s high definition monitor. Operators can access vertical, horizontal and ±45o snapshots of each item being scanned and will also be able to access a 3D reconstructed image of the scanned item. This supplies the operator with the necessary visual tools to identify threats which otherwise would be difficult to distinguish. During the inspection process, the image scrolls in the direction of conveyor travel to simulate the conveyor moving a target through the inspection tunnel. The system provides real time storage of a selectable number of individual scanned items, which are maintained in a historical memory buffer depicted at the bottom of the screen. Touch screen access allows screeners to easily move back and forth between items in the system’s immediate memory. In addition, item scans can easily be saved to permanent storage and subsequently re-loaded and analyzed as if the scan was just made. SENTINEL also has the ability to wirelessly transmit large bits of data in real time to any number of on- and off-site ancillary locations. Systems can be connected to a network in a matrix networked architecture allowing remote system threat reporting and operation, remote management of diagnostics, remote reporting of operator performance, remote handling of the data of interest and even remote and automatic software upgrades. Any supervisor, manager or regulatory agency, and any number of other off-site personnel can look in on any particular system in action as dictated by conduct of operations.
SENTINEL systems are based on the company’s proprietary fixed-gantry CT technology, which employs four fixed X-ray generators and detector arrays to create a three-dimensional visualization of the object being scanned. Each generator/detector array is optimally configured to provide planar projections that significantly expand the robustness, reliability and repeatability of image data and volumetric reconstruction to improve the discrimination and interrogation of threat materials and hidden objects.
While nearly identical in size and overall appearance to traditional rotating-gantry scanners, we believe that SENTINEL has several important advantages, including modular design, improved image quality, increased throughput, operation on simple 120V power and plug and play installation.
Our proprietary operator-friendly SENTINEL software, which includes modules that we refer to as Automatic Threat Identification and Ray Trace Biopsy, enables SENTINEL to automatically identify materials and substances hidden inside a scanned bag or parcel, by measuring X-ray attenuation data and calculating Zeff number and mass densities by volumetric element and then comparing these calculated values to values of known materials. Potential threat materials are then highlighted on the operator’s screen and flagged for further action by a screener. ATI and RTB data can be provided to the operator or alternatively directed to remote auxiliary viewing or centralized monitoring stations.
SENTINEL successfully completed TSA’s Tier 2 Explosive Detection Standard testing in March 2018. Our application for APSS 6.2 certification is in advanced stages, and we currently anticipate receiving APSS 6.2 certification in the first quarter of 2025. We were invited by ECAC to submit SENTINEL for ECAC certification in 2021, and we expect to commence EDSCB certification testing and receive certification in early 2024. We have applied for certification of our SENTINEL CT scanner for placement on TSA’s Air Cargo Screening Technology List as a small bore air cargo visual inspection system for inspecting small parcels and packages, and expect to receive such certification in late 2025. We are also designing and developing a large bore fixed gantry CT scanner for air cargo screening of break-bulk cargo and larger packages and parcels, and except to receive ACSTL certification of this scanner in 2025.
3
CRITICAL ACCOUNTING POLICIES AND APPLICATION OF CRITICAL ACCOUNTING ESTIMATES AND ASSUMPTIONS
Following is a discussion about the critical accounting estimates and assumptions impacting our consolidated financial statements.
For a description of our significant accounting policies, see Note 3 in our amended and restated audited financial statements for the years ended December 31, 2023 and 2022, and Note 2 in our unaudited financial statements for the period ending June 30, 2024.
Of these policies, the following are considered critical to an understanding of our consolidated financial statements as they require the application of the most subjective and the most complex judgments: Use of estimates, Fair value measurements, Inventories, Revenue recognition and Research and Development.
For a discussion of recently adopted accounting standards, see Note 3 in our amended and restated audited financial statements for the years ended December 31, 2023 and 2022, and Note 2 in our unaudited financial statements for the period ending June 30, 2024.
Use of Estimates
The preparation of financial statements in conformity with U.S. GAAP requires management to make estimates and assumptions that affect the reported amounts of liabilities and disclosure of contingent assets and liabilities at the date of the financial statements. The Company bases its estimates on historical experience, known or expected trends, and various other assumptions that are believed to be reasonable given the quality of information available as of the date of these financial statements. The results of these assumptions provide the basis for making estimates about the carrying amounts of assets and liabilities that are not readily apparent from other sources. Actual results could differ from these estimates.
Fair Value Measurement
Fair value is defined as the exchange price that would be received for an asset or paid to transfer a liability (an exit price) in the principal or most advantageous market for the asset or liability in an orderly transaction between market participants as of the measurement date. Applicable accounting guidance provides an established hierarchy for inputs used in measuring fair value that maximizes the use of observable inputs and minimizes the use of unobservable inputs by requiring that the most observable inputs be used when available. Observable inputs are inputs that market participants would use in valuing the asset or liability and are developed based on market data obtained from sources independent of us. Unobservable inputs are inputs that reflect our assumptions about the factors that market participants would use in valuing the asset or liability. There are three levels of inputs that may be used to measure fair value:
| Level 1 | Quoted prices in active markets for identical assets or liabilities that the entity has the ability to access. |
| Level 2 | Inputs other than Level 1 that are observable, either directly or indirectly, such as quoted prices for similar assets or liabilities, quoted prices in markets that are not active, or other inputs that are observable or can be corroborated by observable market data for substantially the full term of the assets and liabilities. |
| Level 3 | Unobservable inputs that are supported by little or no market activity and that are significant to the fair value of the assets and liabilities. |
Assets and liabilities measured at fair value are classified based on the lowest level of input that is significant to the fair value measurement. The Company reviews the fair value hierarchy classification on an as needed basis. Changes in the observability of valuation inputs may result in a reclassification of levels for certain securities within the fair value hierarchy. The Company recognizes transfers into and out of levels within the fair value hierarchy in the appropriate period in which the actual event or change in circumstances that caused the transfer to occur.
Unless otherwise disclosed, the fair value of the Company’s financial instruments, including cash, prepaid expenses and other current assets, R&D tax credit receivable, accounts and other payables, accrued expenses, related parties payable, short-term bank borrowings, and current finance lease liabilities, approximate their recorded values due to their short-term maturities.
4
Inventories
Inventory is valued at the lower of cost or net realizable value. Costs include materials and direct labor on a first-in-first-out basis. We review inventory quantities on hand and record provisions for estimated excess, slow moving, and obsolete inventory. The evaluation of the carrying value of our inventories takes into consideration such factors as historical and anticipated future sales compared to quantities on hand and the prices we expect to obtain for products. We adjust excess and obsolete inventories to net realizable value, and write-downs of excess and obsolete inventories are recorded as a component of cost of revenues. For more detail on inventories, see Note 3 in our amended and restated audited financial statements for the years ended December 31, 2023 and 2022, and Note 2 in our unaudited financial statements for the period ending June 30, 2024.
Revenue Recognition
The Company’s revenues are derived primarily from the sale of hardware. The Company recognizes its revenues net of any value-added or sales tax.
The Company expects to sell a high proportion of its baggage scanning systems to a limited number of distributor customers. Baggage scanning systems including fixed gantry detector and image-processing units and conveyance systems are sold as a combined baggage scanning system. Training services designed to enable distributor customers to service baggage scanning systems they sell to end users of such systems. Distributor agreements also include a three percent restocking fee which is applicable until control of goods transfers (at shipping point).
The Company determines revenue recognition through the following steps:
| · | Identification of the contract, or contracts, with a customer |
| · | Identification of the performance obligations in the contract |
| · | Determination of the transaction price |
| · | Allocation of the transaction price to the performance obligations in the contract |
| · | Recognition of revenue when, or as, a performance obligation is satisfied. Contracts and Performance Obligations |
The Company accounts for a contract with a customer when there is an approval and commitment from both parties, the rights of the parties are identified, payment terms are identified, the contract has commercial substance and collectability of the consideration is probable. The Company’s performance obligations consist mainly of transferring control of products identified in the contracts or purchase orders. For each contract, the Company considers the obligation to transfer products and services to the customer, which are distinct, to be performance obligations.
Transaction Price and Allocation to Performance Obligation. Transaction prices of products or services are typically based on contracted rates.
If a contract contains a single performance obligation, the entire transaction price is allocated to the single performance obligation. Contracts that contain multiple performance obligations require an allocation of the transaction price based on the estimated relative standalone selling prices of the promised products or services underlying each performance obligation. The Company determines standalone selling prices based on the price at which the performance obligation could be sold separately.
Recognition of Revenue
Revenue is recognized when, or as, obligations under the terms of a contract are satisfied, which occurs when control of the promised products or services is transferred to customers. Revenue is measured as the amount of consideration the Company expects to receive in exchange for transferring products or services to a customer.
5
Product revenue is generally recognized when the customer obtains control of the Company’s product, which occurs at a point in time, upon shipment based on criteria evaluated below:
| · | The customer does not simultaneously receive and consumes the benefits provided by the entity’s performance as the entity performs. |
| · | The Company’s performance does not create or enhance an asset that the customer controls as the asset is created or enhanced. |
| · | The Company’s performance creates an asset with an alternative use to the entity. |
Principal vs. Agent
When our products and services are sold to distributors, during the sales process, we assess whether or not we are acting as a principal or an agent in the arrangement. The assessment is based on whether we control the specified products and services at any time before they are transferred to the customer. We have determined that in our transactions with distributors, we act as a principal based on criteria evaluated below:
| · | The entity is primarily responsible for fulfilling the promise to provide the specified good or service. |
| · | The entity has inventory risk before the specified good or service has been transferred to a customer or after transfer of control to the customer. |
| · | The entity has discretion in establishing the price for the specified good or service. Establishing the price that the customer pays for the specified good or service may indicate that the entity has the ability to direct the use of that good or service and obtain substantially all of the remaining benefits. |
We act as principal in all transactions and thus record the gross amount earned within total revenue.
Restocking fees
Restocking fees for goods expected to be returned are included in the estimate of the transaction price at contract inception and recorded as revenue when control of the good transfers. Restocking costs are recorded as a reduction of the amount of the return asset when control of the good is transferred to the customer. There were no goods expected to be returned at contract inception.
Disaggregation of Revenue
Revenue is disaggregated from contracts between geography and by reportable operating segment, which the Company believes best depicts how the nature, amount, timing, and uncertainty of revenues and cash flows are affected by economic factors.
Contract Balances
Contract liabilities are included within the deferred revenues in the Balance Sheets. The Company does not have any material contract assets.
Deferred revenue represents the Company’s obligation to transfer goods or services to its customers for which it has already received consideration (or the amount is due) from the customer. The Company’s deferred revenue balance primarily relates to contract advances.
Deferred revenue that is estimated to be recognized during the following twelve-month period is recorded as deferred revenues in the Consolidated Balance Sheets.
The Company recorded its first revenue from contracts with customers during the three and six months ended June 30, 2024, and had no revenue from contracts with customers in the three and six months ended June 30, 2023.
The Company did not recognize any revenue from contracts with customers during the years ended December 31, 2023 and 2022.
6
Research and Development
Research and development costs for prototype scanning machines were expensed as incurred because they have no alternative future use beyond their current testing programs and therefore no economic benefit in the future. Labor costs, including salaries, employee benefits, payroll taxes, third-party contractor expenses, were expensed as incurred.
Components of Results of Operations
We have not been profitable since inception, and as of June 30, 2024, our accumulated deficit was $(184.4) million and as of December 31, 2023, our accumulated deficit was $(159.2) million. Since inception, we have financed our operations primarily through different forms of debt, primarily promissory notes.
Operating expenses primarily include general and administrative, which includes payroll, and research and development expense. As of September 30, 2024 and December 31, 2023, the largest component of our operating expenses is general and administrative which has increased meaningfully in the last twelve months resulting primarily from expenses related to capital markets activities for the business combination.
During the three months ended September 30, 2024 and 2023, operating expenses were $2.2 million $2.9 million, respectively, an decrease of 24% during the period.
During the nine months ended September 30, 2024 and 2023, operating expenses were and $6.5 million and $6.0 million, respectively, an increase of 8% during the period.
| Three Months Ended September 30, | ||||||||
| 2024 | 2023 | |||||||
| Operating expenses: | ||||||||
| General and administrative expenses | $ | 1,378,388 | $ | 2,142,618 | ||||
| Research and development expenses | 814,539 | 778,680 | ||||||
| Depreciation and amortization | 8,137 | 8,668 | ||||||
| Total operating expenses | $ | 2,201,064 | $ | 2,929,966 | ||||
| Nine Months Ended September 30, | ||||||||
| 2024 | 2023 | |||||||
| Operating expenses: | ||||||||
| General and administrative expenses | $ | 3,863,403 | $ | 3,523,743 | ||||
| Research and development expenses | 2,604,500 | 2,464,306 | ||||||
| Depreciation and amortization | 24,376 | 28,733 | ||||||
| Total operating expenses | $ | 6,492,279 | $ | 6,016,782 | ||||
| Twelve Months Ended December 31, | ||||||||
| 2023 | 2022 | |||||||
| Operating expenses: | ||||||||
| General and administrative expenses | $ | 6,283,770 | $ | 1,503,506 | ||||
| Research and development expenses | 3,285,925 | 2,894,864 | ||||||
| Depreciation and amortization | 36,634 | 52,545 | ||||||
| Total operating expenses | $ | 9,559,329 | $ | 4,450,915 | ||||
7
Research and Development Expense
Research and development expenses consist primarily of engineering and regulatory activities.
8
We expense R&D costs as incurred. We recognize expenses for certain development activities, such as software and hardware development and manufacturing, based on an evaluation of the progress to completion of specific tasks using data or other information provided to us by our vendors. Payments for these activities are based on the terms of the individual agreements, which may differ from the pattern of expenses incurred. Nonrefundable advance payments for goods or services to be received in the future for use in R&D activities are recorded as prepaid expenses. These amounts are recognized as an expense as the goods are delivered or the related services are performed, or until it is no longer expected that the goods will be delivered, or the services rendered. R&D activities account for a significant portion of our operating expenses. We expect our R&D expenses to increase significantly in future periods as we continue to implement our business strategy, which includes advancing our business plan, expanding our R&D efforts, including hiring additional personnel to support our R&D efforts, and seeking regulatory approvals.
General and Administrative Expense
General and administrative expenses consist primarily of personnel-related expenses for our finance, legal, human resources and administrative personnel, as well as the costs of information technology, professional services, insurance, travel, and other administrative expenses. We expect to invest in our corporate organization and incur additional expenses associated with transitioning to, and operating as, a public company, including increased legal, audit, tax and accounting costs, investor relations costs, higher insurance premiums and compliance costs. As a result, we expect that general and administrative expenses will increase in absolute dollars in future periods. General and administrative expenses consist primarily of personnel-related expenses for our finance, legal, human resources and administrative personnel, as well as the costs of information technology, professional services, insurance, travel, and other administrative expenses.
We expect to invest in our corporate organization and incur additional expenses associated with transitioning to, and operating as, a public company, including increased legal, audit, tax and accounting costs, investor relations costs, higher insurance premiums and compliance costs. As a result, we expect that general and administrative expenses will increase in absolute dollars in future periods.
Interest Expense
Interest expense consists of accrued and unpaid interest, including default interest, due on the Company’s outstanding promissory notes. Interest expense consists of accrued and unpaid interest, including default interest, due on the Company’s outstanding promissory notes.
Results of Operations
The results of operations presented below should be reviewed in conjunction with ScanTech’s unaudited financial statements as of three and six months ended September 30, 2024 and 2023, and audited financial statements for the years ended December 31, 2023 and 2022, and other information included elsewhere in this proxy statement/prospectus/consent solicitation.
The following table sets forth our statement of operations for the three and nine months ended September 30, 2024 and 2023 and the years ended December 31, 2023 and 2022 and the change between the two periods.
During the three months ended September 30, 2024 and 2023, our net loss was $(23.4) million and $(7.9) million, respectively. For the nine months ended September 30, 2024 and 2023, our net loss was $(47.6) million and $(23.1) million, respectively. For the years ended December 31, 2023 and 2022, our net loss was $(35.4) million and $(15.3) million, respectively. Our net losses during the respective periods all widened primarily resulting from an increase in all of our key operating expense line items. Our general and administrative expenses increased year over year primarily resulting from an increase in expenses related to the business combination, as well as additional costs associated with parts and labor associated with our Visiontec order. Changes in interest expense (increases year over year due to more debt and interest) and fair value changes in our warrant and derivative liabilities also impacted year over year results.
9
| Twelve Months Ended December 31, | ||||||||
| 2023 | 2022 | |||||||
| Other income (expense): | ||||||||
| Interest expense | $ | (10,251,094 | ) | $ | (8,682,782 | ) | ||
| Change in fair value of derivative liabilities | 649,244 | (281,845 | ) | |||||
| Change in fair value of warrant liabilities | (16,371,612 | ) | (1,873,658 | ) | ||||
| Gains from extinguishment of debt | — | 9,712 | ||||||
| Total other income (expense): | $ | (25,973,462 | ) | $ | (10,828,573 | ) | ||
| Three Months Ended September 30, | ||||||||
| 2024 | 2023 | |||||||
| Interest expense | $ | (3,249,134 | ) | $ | (2,627,510 | ) | ||
| Change in fair value of derivative liabilities | (529,546 | ) | 281,783 | ) | ||||
| Change in fair value of warrant liabilities | (17,452,684 | ) | (2,638,645 | ) | ||||
| Other income (expense), net | — | ) | — | |||||
| Total other income (expense): | $ | (21,231,364 | ) | $ | (4,984,372 | ) | ||
| Nine Months Ended September 30, | ||||||||
| 2024 | 2023 | |||||||
| Interest expense | $ | (9,106,317 | ) | $ | (7,427,555 | ) | ||
| Change in fair value of derivative liabilities | (1,104,939 | ) | (1,605,819 | ) | ||||
| Change in fair value of warrant liabilities | (13,478,661 | ) | (14,120,580 | ) | ||||
| Other income (expense), net. | (16,176 | ) | — | |||||
| Total other income (expense): | $ | (19,927,413 | ) | $ | (23,153,954 | ) | ||
General and Administrative Expense
During the three months ended September 30, 2024 and 2023, general and administrative costs were $1.3 million and $2.1 million, respectively, a year over year increase of 38%. During the nine months ended September 30, 2024 and 2023, general and administrative costs were $3.9 million and $3.5 million, respectively, an increase of 11% during the period. The increase during these periods was primarily due to an increase in expenses attributable to transaction related expenses in the form of professional services related to the business combination as well as expenses related to the Company’s production and delivery of units under its Visiontec order.
During years ended December 31, 2023 and 2022, general and administrative costs were $6.3 million and $1.5 million, respectively, a year over year increase of 320% during the period.
The increase during the comparable periods ended December 31, 2023 was due primarily to increased salary and overhead adjustments during the period.
In addition, during the years ended December 31, 2023 and 2022, the majority of the increase in expenses is attributable to an increase in transaction related expenses in the form of professional services related to the business combination. During the prior year period the Company was not involved in capital markets activities so our general and administrative expense was primarily for personnel expenses, travel and related costs.
Research and Development Expense
During the three months ended September 30, 2024 and 2023, research and development expenses were $0.8 million and $0.8 million respectively, with not a meaningful change year over year.
10
During the nine months ended September 30, 2024 and 2023, research and development expenses were $2.6 million and $2.4 million, respectively, a 6% increase.
During the years ended December 31, 2023 and 2022, research and development expenses were $3.2 million and $2.9 million, respectively, a 7% increase during the period.
The increase in research and development expense was attributable primarily to an increase in investment in the Company’s artificial intelligence software and continued investment in its proprietary algorithms with the anticipation of filing additional patents in the future.
Depreciation and Amortization
Depreciation and amortization was $0.008 million for the three months ended September 30, 2024 and $0.008 million for the three months ended September 30, 2023, a zero% decrease year over year. The change on an absolute basis was not meaningful.
Depreciation and amortization was $0.024 million and $0.028 million for the nine months ended September 30, 2024 and 2023, respectively, a 7% decrease year over year. The change on an absolute basis was not meaningful.
Depreciation and amortization was $0.04 million for year ended December 31, 2023, which was not a meaningful change compared to the year ended December 31, 2022.
Interest Expense
During the three months ended September 30, 2024 and 2023, interest expense was $(3.2) million and $(2.6) million, respectively, a 20% increase year over year.
During the nine months ended September 30, 2024 and 2023, interest expense was $(9.1) million and $(7.4) million, respectively, a 22% increase year over year.
During the years ended December 31, 2023 and 2022, interest expense was $(10.2) million and $(8.7) million, an increase of 17% during the period.
Interest expense during the periods includes all interest and any penalties — including default interest — accrued on our outstanding promissory notes. Some of our promissory notes that are in default are accruing default interest, which we characterize here as “penalties.” Interest expense in the relevant periods also increased resulting from an increase in the balance of our outstanding principal indebtedness particularly from Seaport during the periods.
Other Expense
Other expense during the three months ended September 30, 2024 and 2023 was $(0.5) million and $(6.9) million, a decrease of 93% during the period. During the period, the change in fair value of the warrant liability decreased 93%, accounting for the majority of the change during the period.
During the nine months ended September 30, 2024 and 2023, other expenses were $(14.1) million and $(13.4) million, a change of 5% during the period.
Other expense during the years ended December 31, 2023 was $(26.0) million and $(10.8) million, respectively, an increase of 142%. During the period, warrant liabilities increased 773%, the primary driver of the increase in other expense.
Trend Information
Other than as disclosed elsewhere in this proxy statement/prospectus/consent solicitation, we are not aware of any trends, uncertainties, demands, commitments or events that are reasonably likely to have a material effect on our revenues, net income, profitability, liquidity or capital resources, or that would cause reported financial information not necessarily to be indicative of future operating results or financial condition.
11
Liquidity and Capital Resources
To date, we have financed our operations primarily through the issuance of debt. Since our inception, we have incurred significant operating losses and negative cash flows. As of September 30, 2024 and December 31, 2023, we had an accumulated deficit of $(184.4) million and $(159.2) million, respectively. As of September 30, 2024 and December 31, 2023, the Company’s liabilities were significantly greater than its assets.
As of September 30, 2024 and December 31, 2023, we had cash of $0.1 million and $0.3 million respectively
We may not receive sufficient proceeds from the Business Combination to fund our operating expenses until at least 12 months after the date of our audited financial statements included in this proxy statement/ prospectus/consent solicitation. As a result of the foregoing, management has determined that there is substantial doubt about our ability to continue as a going concern.
In addition, on May 18, 2023, Catalytic Holdings I LLC was awarded summary judgement against the Company in Company Kings County New York state court. On July 14, 2023, Catalytic noticed ScanTech that it would be presenting the court a proposed order for settlement of its summary judgement, scheduled with the court on August 7, 2023. The proposed order was in the amount of $1,563,796 in satisfaction of Catalytic’s indebtedness with the Company. On September 7, 2023, the court granted Catalytic both the order and judgement amount of $1,563,796 plus accruing interest at a rate of 12% per annum from October 6, 2020. To date, this judgement has not had a meaningful impact on our liquidity or ability to obtain financing, although it could do so in the future.
We expect to incur significant expenses in connection with our ongoing activities as we continue to implement our business strategy. We will need additional funding in connection with these activities. Our future funding requirements, both short-term and long-term, will depend on many factors, including the level of sales, the expansion of our sales and marketing activities, the timing and extent of our spending to support our research and development efforts, investments in infrastructure, operating costs, expansion into other markets, and the costs of operating as a public company (including hiring additional personnel as well as increased director and officer insurance premiums, audit and legal fees, investor relations fees and expenses related to compliance with public company reporting requirements under the Exchange Act and rules implemented by the SEC and Nasdaq).
For the foreseeable future, we expect to continue financing our operations through the sale of equity, debt, borrowings under credit facilities or through potential collaborations with other companies, other strategic transactions or government or other grants. Adequate capital may not be available to us when needed or on acceptable terms. We do not currently have any committed external source of funds beyond the Business Combination. To the extent that we raise additional capital through the sale of equity or convertible debt securities, the ownership interest of our shareholders will be diluted, and the terms of these securities may include liquidation or other preferences that adversely affect the rights of shareholders. Debt financing and preferred equity financing, if available, may involve agreements that include covenants limiting or restricting our ability to take specific actions, such as incurring additional debt, making acquisitions or capital expenditures. Debt financing would also result in fixed payment obligations. If we are unable to raise additional funds through equity or debt financings or other arrangements when needed, we may be required to delay, reduce, suspend or cease our research and development programs or any future commercialization efforts, which would have a negative impact on our business, prospects, operating results and financial condition. See the section entitled “Risk Factors” for additional risks associated with our substantial capital requirements.
Our operating losses raise substantial doubt about our ability to continue as a going concern for one year from the date the financial statements are issued or available to be issued. As a result, our independent registered public accounting firm included an explanatory paragraph in its report on our financial statements as of June 30, 2024 and 2023, and for the years ended December 31, 2023 and 2022 with respect to this uncertainty.
12
We currently have almost no cash resources and significantly greater current liabilities than current assets. For approximately 36 months, the majority of our funding has been advances from Seaport Group SIBS LLC, an affiliate of Seaport Global Asset Management, LLC (“Seaport”). Should Seaport cease to make such advances prior to us obtaining other sources of financing sufficient to pay its expenses and current liabilities, we would be unable to continue in business. Seaport may, at any time, terminate its funding arrangements and/or demand repayment of its advances, which amounted to approximately $14.7 million including accrued interest and principal as of September 30, 2024. Although we expect to enter into a term loan facility with Seaport, there can be no assurance that we will do so. In addition to the loan repayment obligations to Seaport, Seaport has the ability, for a nominal amount, to purchase Series B Units of ScanTech. As of June 30, 2024, Seaport had the right to acquire approximately 70% of the Series B Units of ScanTech as of such date. In addition to the obligation to repay Seaport, the Company has significant other current obligations, including, without limitation, approximately $6.0 million owed to the IRS with respect to unpaid employment taxes.
Seaport has agreed in principle with both Mars and ScanTech to exchange its current secured promissory note for long-term senior secured debt upon the consummation of the business combination. Documentation for the specific terms of this new long-term indebtedness has not yet been prepared and finalized by the parties.
ScanTech has issued several promissory notes to Azure LLC and NACS LLC, entities controlled by John Redmond, chairman of ScanTech’s board of directors. As of June 30, 2024 and December 31, 2023, approximately $57.7 million and $54.3 million of principal and interest was accrued under these notes. Azure and NACS have agreed to convert their existing indebtedness to equity upon the consummation of the Business Combination and to cancel any of their warrants at the time of the consummation, but the specific terms of such conversion have not yet been agreed upon. It is finalizing the terms of a conversion agreement with Catalytic and Bay Point. If ScanTech is unable to secure all of these conversion agreements, it will be difficult to consummate the Business Combination.
Historically, we have financed operations primarily through cash generated from debt offerings and equity raises. Our primary short-term requirements for liquidity and capital are to fund general working capital and capital expenditures. Our principal long-term working capital uses primarily include research and development expenses and operational payroll.
As of June 30, 2024 and December 31, 2023, our cash balance was $0.1 million and $0.3 million, respectively.
Our liquidity needs will be dependent both on the performance of our business and on the amount of proceeds we realize through the Business Combination. If we do not realize sufficient proceeds from the Business Combination to carry out our business plan or if our business does not perform as we expect, we may be required to pursue additional financing or take other measures to improve our liquidity. See “Risk Factors — ScanTech may require substantial additional funding to finance our operations, but adequate additional financing may not be available when we need it, on acceptable terms or at all.”
Comparison of the Three and Six Months Ended June 30, 2024 and 2023 and the Years Ended December 31, 2023 and 2022
The following table shows ScanTech’s cash flows provided by (used in) operating activities, investing activities and financing activities for the stated periods (dollars in millions):
| For the nine months ended September 30, | For the nine months ended September 30, | |||||||||||
| 2024 | 2023 | Variance | ||||||||||
| Operating activities | $ | (5.1 | ) | $ | (4.1 | ) | (25) | % | ||||
| Investing activities | — | — | NM | |||||||||
| Financing activities | 4.9 | 4.0 | 22 | % | ||||||||
13
| For the year ended December 31, | For the year ended December 31, | |||||||||||
| 2023 | 2022 | Variance | ||||||||||
| Operating activities | $ | (5.4 | ) | $ | (3.6 | ) | (50 | )% | ||||
| Investing activities | (.005 | ) | (0.05 | ) | (100 | )% | ||||||
| Financing activities | 5.7 | 3.8 | 50 | % | ||||||||
Operating Activities
Net cash used in operating activities for the six months ended September 30, 2024 and 2023 was $(5.1) million and $(4.0) million, respectively. The increase was primarily due to an $3.0 million decrease in net income, offset by a $2.0 million increase in fair value of warrant liabilities, and $1.5 million change in assets and liabilities in the year over year period.
For the years ended December 31, 2023 and 2022 net cash used in operations was $(5.4) and $(3.6) million changed by $1.8 million, respectively. The increase was primarily due to a $20.0 million decrease in net income, offset by an $14 million change in fair value of the Company’s outstanding warrants, $(0.4) million decrease in inventory $(0.7) million decrease in the change in fair value of other derivatives, and a $4.7 million increase in changes in operating assets and liabilities, which included a $1.2 million increase interest payable to both related and unrelated parties and $1.0 million increase in accounts payable.
Investing Activities
No meaningful cash was used or generated during the September 30, 2024 and 2023 three month periods.
Net cash used in investing activities for the years ended December 31, 2023 and 2022 was $(5,233) and $(53,932), respectively.
Financing Activities
Net cash provided by financing activities for the nine months ended September 30, 2024 and 2023 was $4.9 million and $4.0 million, both driven by proceeds from new financings. These proceeds were used to fund operational cash needs.
Net cash provided by financing activities for the year ended December 31, 2023 was $5.7 million compared to $3.8 million for the year ended December 31, 2022, an increase of $1.9 million due primarily to the same increase in proceeds from new loans.
Indebtedness Conversion
ScanTech is working with its creditors to secure agreements to convert its existing indebtedness to equity upon the consummation of the Business Combination. ScanTech has secured agreements from the majority of its Series A investors, Azure, NACS, but the specific terms of such conversion have not yet been agreed upon. Bay Point has signed a definitive term sheet outlining the terms of its conversion. ScanTech is finalizing the terms of an additional agreement with Catalytic. If ScanTech is unable to secure all of these conversion agreements it may be difficult to consummate the Business Combination.
Seaport has agreed with both Mars and ScanTech to exchange its current secured promissory note for long-term senior secured debt upon the consummation of the business combination. Documentation for the specific terms of this new long-term indebtedness has not yet been finalized by the parties.
Off-Balance Sheet Arrangements
We did not have any off-balance sheet arrangements, as defined in the rules and regulations of the SEC, over the past three fiscal years, as of June 30, 2024 and for the fiscal year ending December 31, 2023.
14