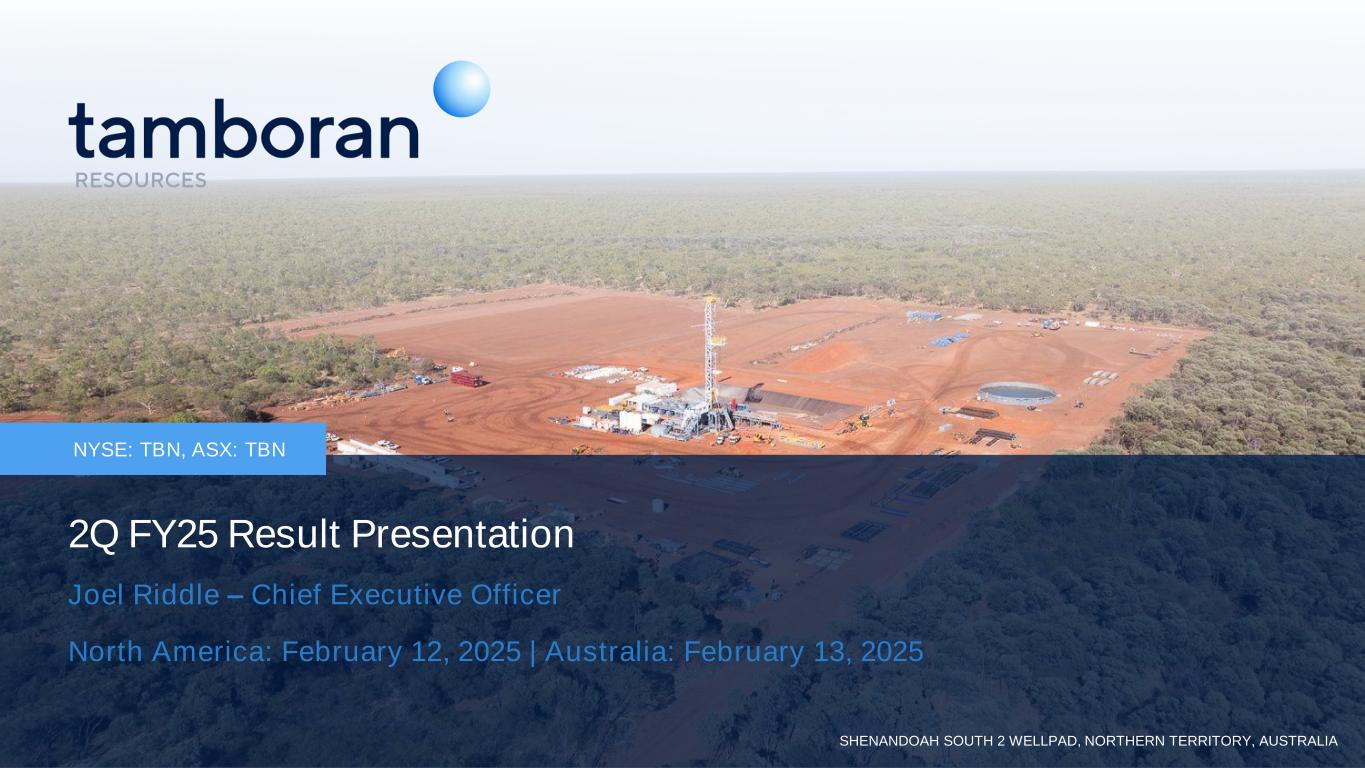
NYSE: TBN, ASX: TBN 2Q FY25 Result Presentation Joel Riddle – Chief Executive Officer North America: February 12, 2025 | Australia: February 13, 2025 SHENANDOAH SOUTH 2 WELLPAD, NORTHERN TERRITORY, AUSTRALIA
The information in this presentation includes “forward-looking statements” within the meaning of Section 27A of the Securities Act of 1933, as amended (the “Securities Act”), and Section 21E of the Securities Exchange Act of 1934, as amended (the “Exchange Act”), which include statements on Tamboran Resources Corporation's ("we", "us" or the "Company") opinions, expectations, beliefs, plans objectives, assumptions or projections regarding future events or future results. All statements, other than statements of historical fact included in this presentation regarding our strategy, present and future operations, financial position, estimated revenues and losses, projected costs, estimated reserves, prospects, plans and objectives of management are forward-looking statements. When used in this presentation, words such as “may,” “assume,” “forecast,” “could,” “should,” “will,” “plan,” “believe,” “anticipate,” “intend,” “estimate,” “expect,” “project,” “budget”, "achieve," "progress," "target," "expand," "deliver“, "potential," "propose," "enter," "provide," "contribute," and similar expressions are used to identify forward-looking statements, although not all forward-looking statements contain such identifying words. These forward-looking statements are based on management’s current belief, based on currently available information, as to the outcome and timing of future events at the time such statement was made. These forward‐looking statements are not a guarantee of our performance, and you should not place undue reliance on such statements. Forward looking statements may include statements about, among other things: our business strategy and the successful implementation of our business strategy; our future reserves; our financial strategy, liquidity and capital required for our development programs; estimated natural gas prices; our dividend policy; the timing and amount of future production of natural gas; our drilling and production plans; competition and government regulation; our ability to obtain and retain permits and governmental approvals; legal, regulatory or environmental matters; marketing of natural gas; business or leasehold acquisitions and integration of acquired businesses; our ability to develop our properties; the availability and cost of developing appropriate infrastructure around and transportation to our properties; the availability and cost of drilling rigs, production equipment, supplies, personnel and oilfield services; costs of developing our properties and of conducting our operations; our ability to reach FID and execute and complete our planned pipeline or planned LNG export projects; our anticipated Scope 1, Scope 2 and Scope 3 emissions from our businesses and our plans to offset our Scope 1, Scope 2 and Scope 3 emissions from our business; our ESG strategy and initiatives, including those relating to the generation and marketing of environmental attributes or new products seeking to benefit from ESG related activities; general economic conditions, including cost inflation; credit markets and the ability to obtain future financing on commercially acceptable terms; our ability to expand our business, including through the recruitment and retention of skilled personnel; our dependence on our key management personnel; our future operating results; and our plans, objectives, expectations and intentions. Except as otherwise required by applicable law, we disclaim any duty to update any forward-looking statements, all of which are expressly qualified by the statements in this section, to reflect events or circumstances after the date of this presentation. Tamboran is subject to known and unknown risks, many of which are beyond the ability of Tamboran to control or predict. These risks may include, for example, movements in oil and gas prices, risks associated with the development and operation of the acreage, exchange rate fluctuations, an inability to obtain funding on acceptable terms or at all, loss of key personnel, an inability to obtain appropriate licenses, permits and or/or other approvals, inaccuracies in resource estimates, share market risks and changes in general economic conditions. Such risks may affect actual and future results of Tamboran and its securities. Maps and diagrams contained in this presentation are provided to assist with the identification and description of Tamboran’s interests. The maps and diagrams may not be drawn to scale. This presentation includes market data and other statistical information from third party sources, including independent industry publications, government publications or other published independent sources. Although we believe these third-party sources are reliable as of their respective dates, we have not independently verified the accuracy or completeness of this information. The industry in which we operate is subject to a high degree of uncertainty and risk due to a variety of factors, which could cause our results to differ materially from those expressed in these third-party publications. Numbers in this report have been rounded. As a result, some figures may differ insignificantly due to rounding and totals reported may differ insignificantly from arithmetic addition of the rounded numbers. All currency amounts are represented as USD unless otherwise stated (AUD/USD exchange rate of 0.62). This presentation does not purport to be all inclusive or to necessarily contain all the information that you may need or desire to perform your analysis. In all cases, you should conduct your own investigation and analysis of the data set forth in this presentation, and should rely solely on your own judgment, review and analysis in evaluating this presentation. This presentation contains trademarks, tradenames and servicemarks of other companies that are the property of their respective owners. We do not intend our use or display of other companies’ trademarks, tradenames and servicemarks to imply relationships with, or endorsement or sponsorship of us by, these other companies. APA Group has not prepared, and was not responsible for the preparation of, this presentation. It does not make any statement contained in it and has not caused or authorised its release. To the maximum extent permitted by law, APA Group expressly disclaims any liability in connection with this presentation, and any statement contained in it. This announcement was approved and authorised for release by Mr. Joel Riddle, the Chief Executive Officer of Tamboran Resources Corporation. Disclaimer 2
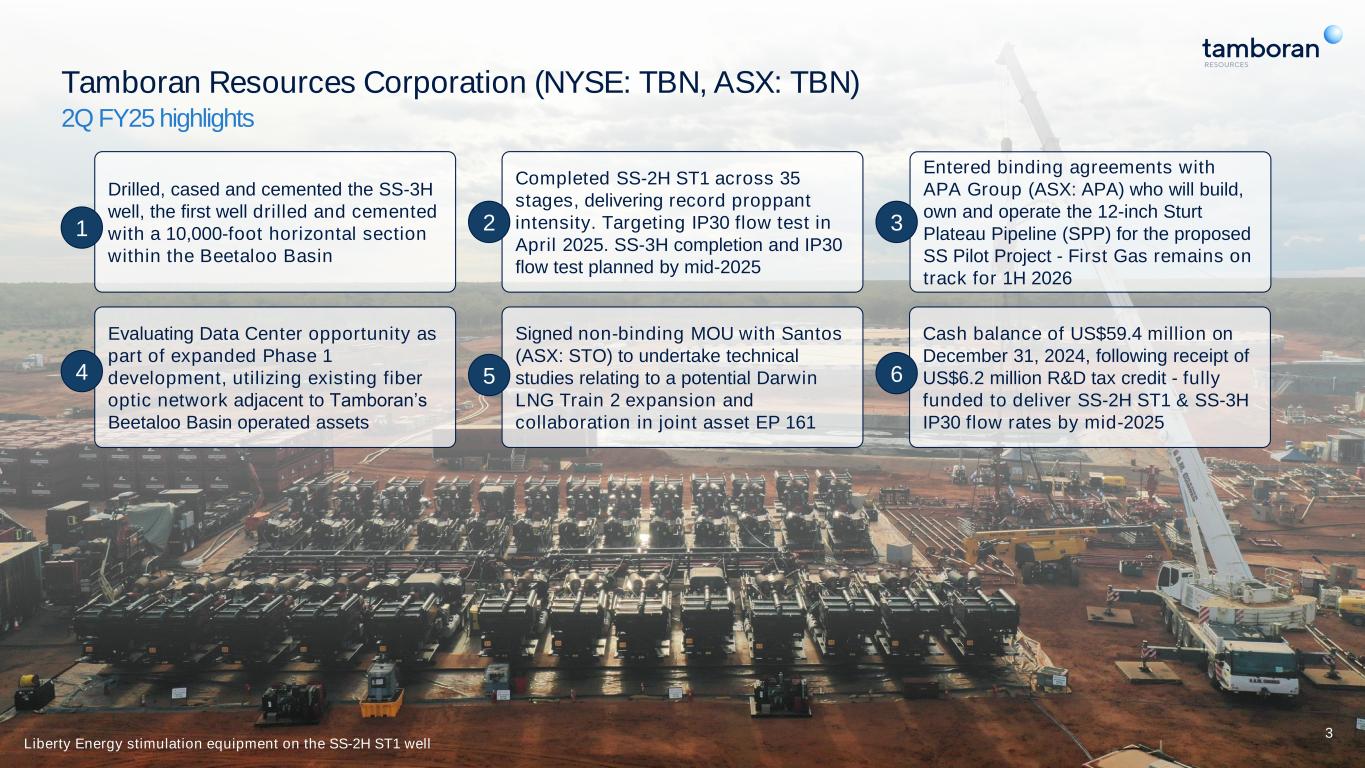
3 Tamboran Resources Corporation (NYSE: TBN, ASX: TBN) 2Q FY25 highlights Drilled, cased and cemented the SS-3H well, the first well drilled and cemented with a 10,000-foot horizontal section within the Beetaloo Basin Completed SS-2H ST1 across 35 stages, delivering record proppant intensity. Targeting IP30 flow test in April 2025. SS-3H completion and IP30 flow test planned by mid-2025 Evaluating Data Center opportunity as part of expanded Phase 1 development, utilizing existing fiber optic network adjacent to Tamboran’s Beetaloo Basin operated assets Entered binding agreements with APA Group (ASX: APA) who will build, own and operate the 12-inch Sturt Plateau Pipeline (SPP) for the proposed SS Pilot Project - First Gas remains on track for 1H 2026 Signed non-binding MOU with Santos (ASX: STO) to undertake technical studies relating to a potential Darwin LNG Train 2 expansion and collaboration in joint asset EP 161 Cash balance of US$59.4 million on December 31, 2024, following receipt of US$6.2 million R&D tax credit - fully funded to deliver SS-2H ST1 & SS-3H IP30 flow rates by mid-2025 Liberty Energy stimulation equipment on the SS-2H ST1 well 1 2 4 3 5 6
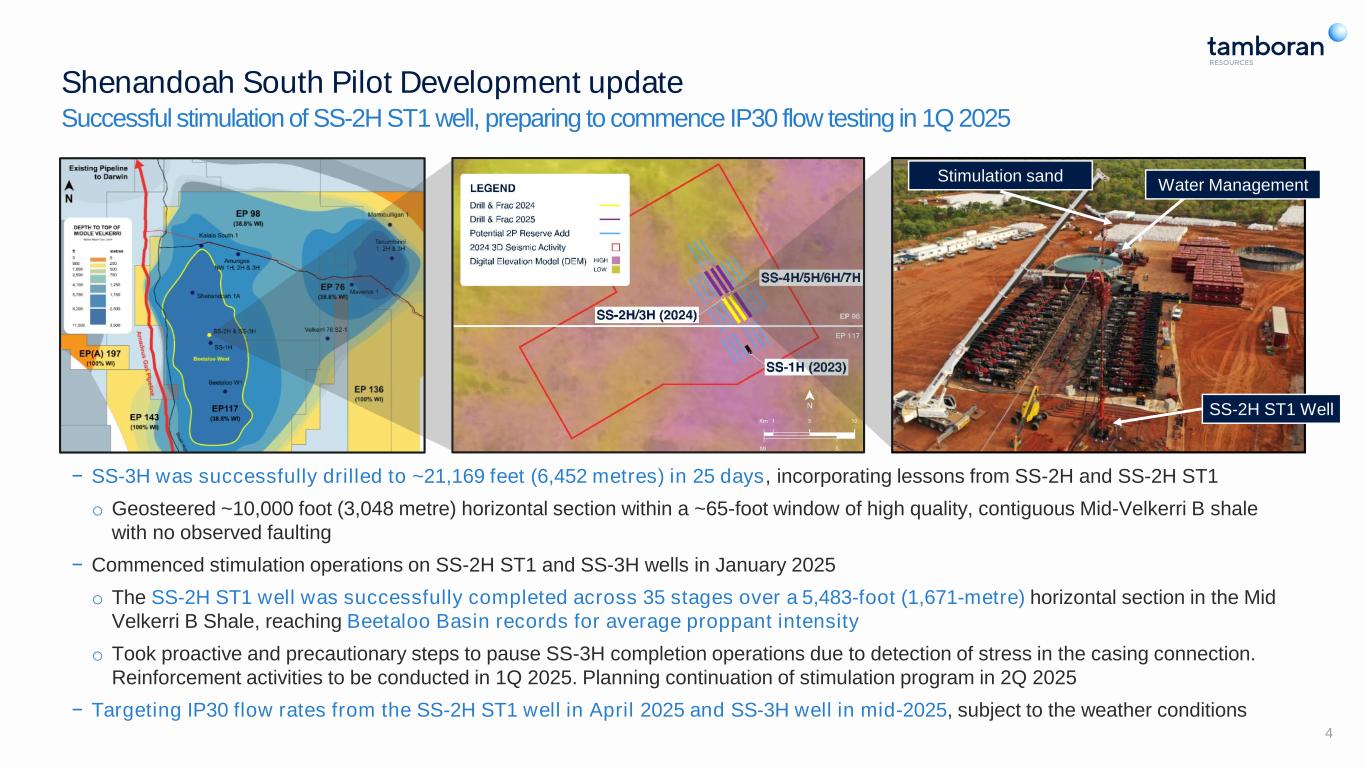
Shenandoah South Pilot Development update Successful stimulation of SS-2H ST1 well, preparing to commence IP30 flow testing in 1Q 2025 − SS-3H was successfully drilled to ~21,169 feet (6,452 metres) in 25 days, incorporating lessons from SS-2H and SS-2H ST1 o Geosteered ~10,000 foot (3,048 metre) horizontal section within a ~65-foot window of high quality, contiguous Mid-Velkerri B shale with no observed faulting − Commenced stimulation operations on SS-2H ST1 and SS-3H wells in January 2025 o The SS-2H ST1 well was successfully completed across 35 stages over a 5,483-foot (1,671-metre) horizontal section in the Mid Velkerri B Shale, reaching Beetaloo Basin records for average proppant intensity o Took proactive and precautionary steps to pause SS-3H completion operations due to detection of stress in the casing connection. Reinforcement activities to be conducted in 1Q 2025. Planning continuation of stimulation program in 2Q 2025 − Targeting IP30 flow rates from the SS-2H ST1 well in April 2025 and SS-3H well in mid-2025, subject to the weather conditions 4 Stimulation sand Water Management SS-2H ST1 Well
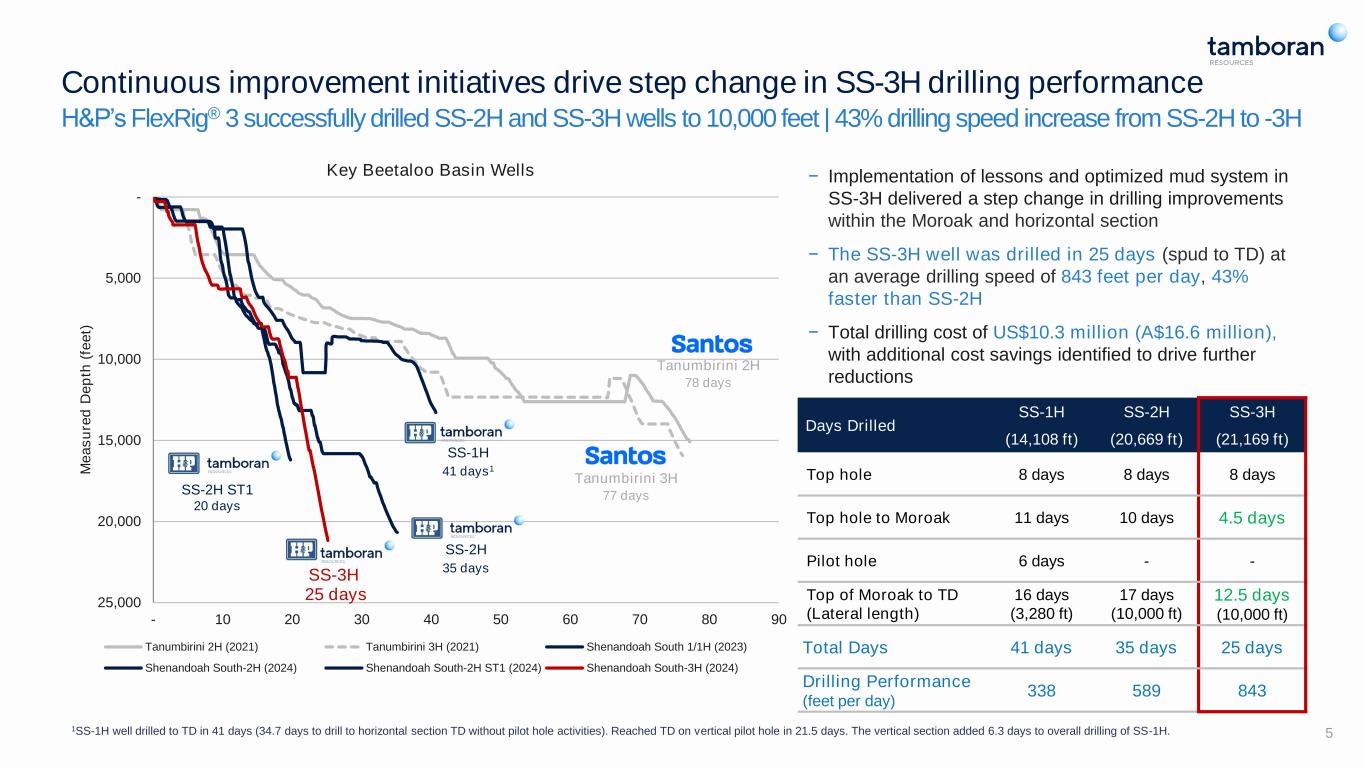
- 5,000 10,000 15,000 20,000 25,000 - 10 20 30 40 50 60 70 80 90 M e a s u re d D e p th ( fe e t) Key Beetaloo Basin Wells Tanumbirini 2H (2021) Tanumbirini 3H (2021) Shenandoah South 1/1H (2023) Shenandoah South-2H (2024) Shenandoah South-2H ST1 (2024) Shenandoah South-3H (2024) SS-3H 5 − Implementation of lessons and optimized mud system in SS-3H delivered a step change in drilling improvements within the Moroak and horizontal section − The SS-3H well was drilled in 25 days (spud to TD) at an average drilling speed of 843 feet per day, 43% faster than SS-2H − Total drilling cost of US$10.3 million (A$16.6 million), with additional cost savings identified to drive further reductions Continuous improvement initiatives drive step change in SS-3H drilling performance H&P’s FlexRig® 3 successfully drilled SS-2H and SS-3H wells to 10,000 feet | 43% drilling speed increase from SS-2H to -3H 1SS-1H well drilled to TD in 41 days (34.7 days to drill to horizontal section TD without pilot hole activities). Reached TD on vertical pilot hole in 21.5 days. The vertical section added 6.3 days to overall drilling of SS-1H. Tanumbirini 2H 78 days SS-2H 35 days Tanumbirini 3H 77 days SS-1H 41 days1 SS-2H ST1 20 days 25 days Days Drilled SS-1H (14,108 ft) SS-2H (20,669 ft) SS-3H (21,169 ft) Top hole 8 days 8 days 8 days Top hole to Moroak 11 days 10 days 4.5 days Pilot hole 6 days - - Top of Moroak to TD (Lateral length) 16 days (3,280 ft) 17 days (10,000 ft) 12.5 days (10,000 ft) Total Days 41 days 35 days 25 days Drilling Performance (feet per day) 338 589 843

6 SS-2H-ST1 Geology remains consistent in SS-2H ST1 and SS-3H after material step out from SS-1H Increased confidence of reservoir continuity of Mid-Velkerri B shale within SS Pilot Development area SS-1H Pilot ~65 ft − Geological rock properties across SS-2H ST1 and SS3H horizontal sections are very consistent in quality as the SS-1H location − Gentle, undulating structure and no faulting observed within Mid Velkerri B Shale − Successfully geosteered with 100% efficiency drilling within 65 ft landing zone − Strong gas shows observed throughout SS-2H ST1 and SS-3H horizontal sections SS-3H ~65 ft 5,483 ft 10,000 ft SS-1H Pilot Gamma Ray Total Gas (ave 7%) Well TD 20 days Gamma Ray Total Gas (ave 8%) Well TD 25 days
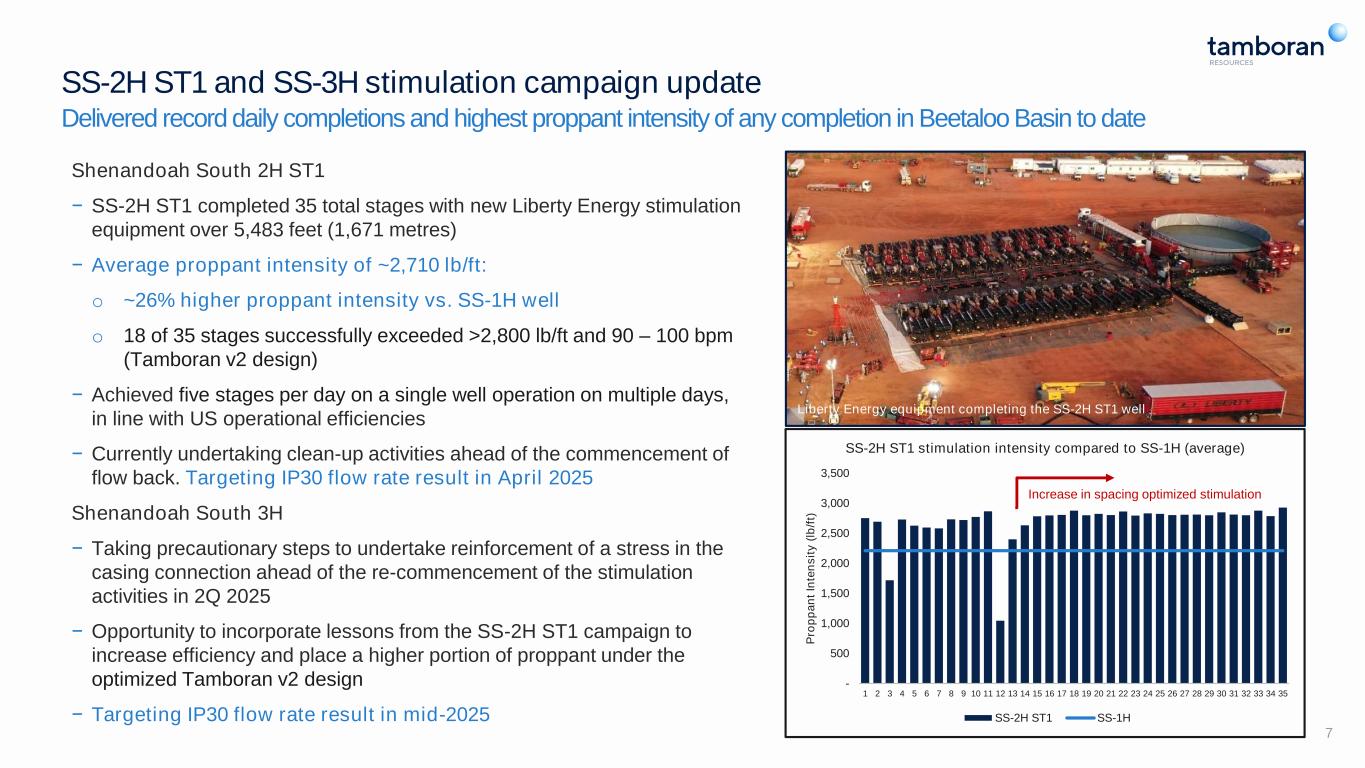
SS-2H ST1 and SS-3H stimulation campaign update Delivered record daily completions and highest proppant intensity of any completion in Beetaloo Basin to date Shenandoah South 2H ST1 − SS-2H ST1 completed 35 total stages with new Liberty Energy stimulation equipment over 5,483 feet (1,671 metres) − Average proppant intensity of ~2,710 lb/ft: o ~26% higher proppant intensity vs. SS-1H well o 18 of 35 stages successfully exceeded >2,800 lb/ft and 90 – 100 bpm (Tamboran v2 design) − Achieved five stages per day on a single well operation on multiple days, in line with US operational efficiencies − Currently undertaking clean-up activities ahead of the commencement of flow back. Targeting IP30 flow rate result in April 2025 Shenandoah South 3H − Taking precautionary steps to undertake reinforcement of a stress in the casing connection ahead of the re-commencement of the stimulation activities in 2Q 2025 − Opportunity to incorporate lessons from the SS-2H ST1 campaign to increase efficiency and place a higher portion of proppant under the optimized Tamboran v2 design − Targeting IP30 flow rate result in mid-2025 7 - 500 1,000 1,500 2,000 2,500 3,000 3,500 1 2 3 4 5 6 7 8 9 10 11 12 13 14 15 16 17 18 19 20 21 22 23 24 25 26 27 28 29 30 31 32 33 34 35 P ro p p a n t In te n s it y ( lb /f t) SS-2H ST1 stimulation intensity compared to SS-1H (average) SS-2H ST1 SS-1H Increase in spacing optimized stimulation Liberty Energy equipment completing the SS-2H ST1 well
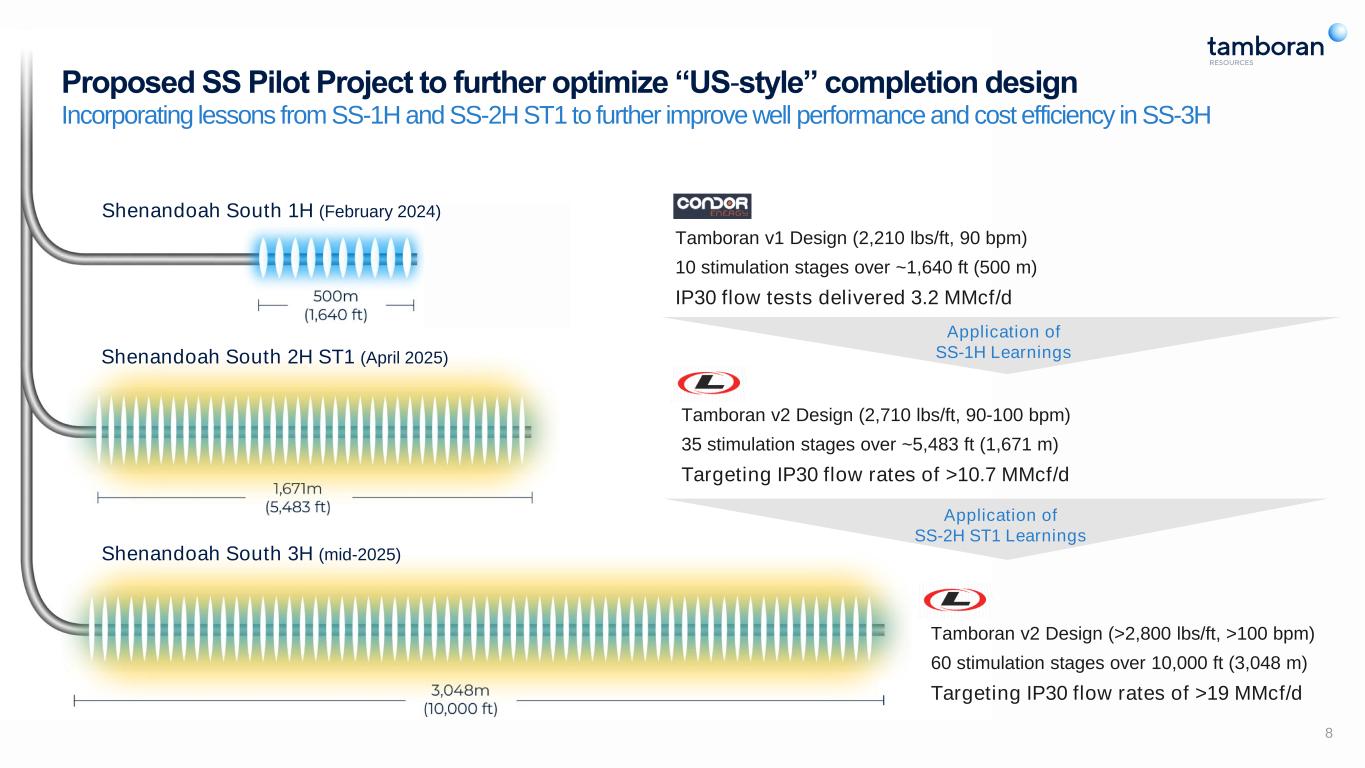
8 Proposed SS Pilot Project to further optimize “US-style” completion design Incorporating lessons from SS-1H and SS-2H ST1 to further improve well performance and cost efficiency in SS-3H Shenandoah South 2H ST1 (April 2025) Tamboran v1 Design (2,210 lbs/ft, 90 bpm) 10 stimulation stages over ~1,640 ft (500 m) IP30 flow tests delivered 3.2 MMcf/d Shenandoah South 3H (mid-2025) Application of SS-1H Learnings Application of SS-2H ST1 Learnings Tamboran v2 Design (2,710 lbs/ft, 90-100 bpm) 35 stimulation stages over ~5,483 ft (1,671 m) Targeting IP30 flow rates of >10.7 MMcf/d Tamboran v2 Design (>2,800 lbs/ft, >100 bpm) 60 stimulation stages over 10,000 ft (3,048 m) Targeting IP30 flow rates of >19 MMcf/d Shenandoah South 1H (February 2024)
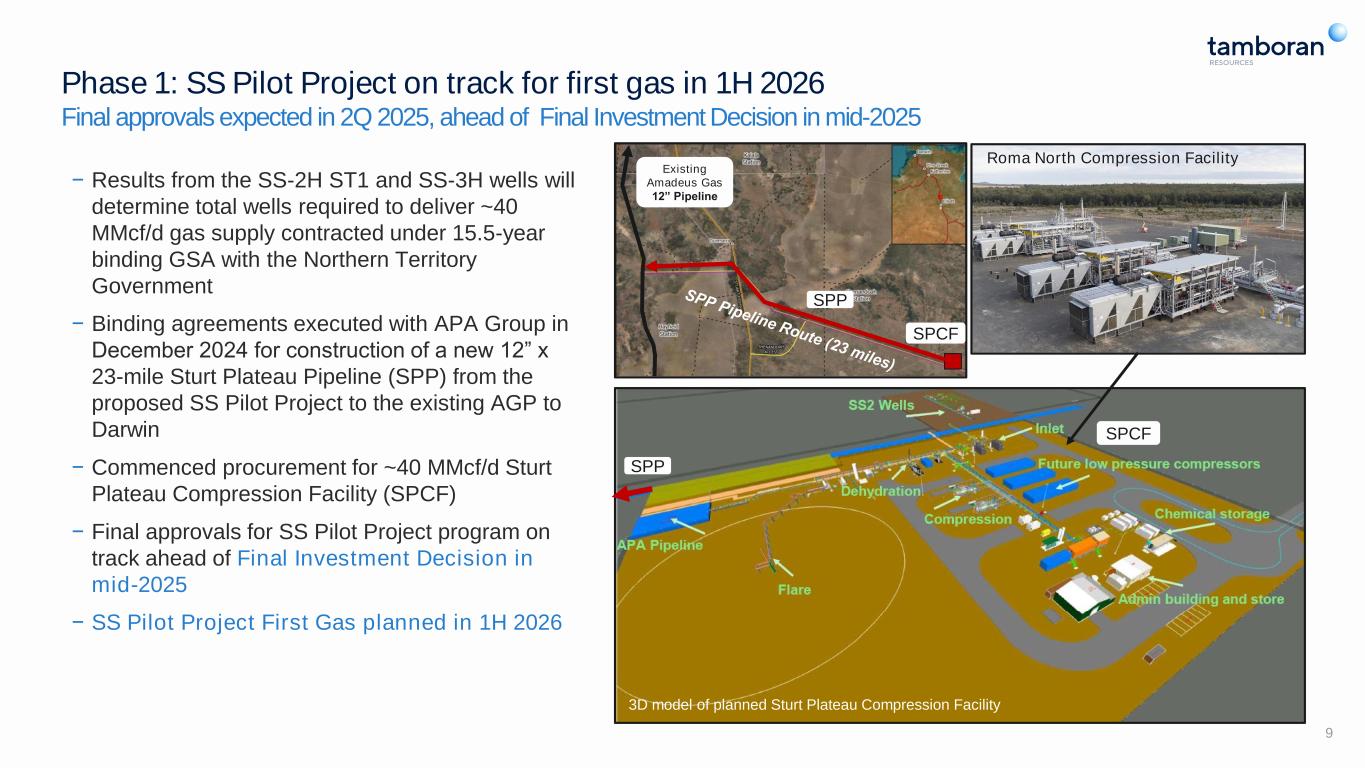
9 Phase 1: SS Pilot Project on track for first gas in 1H 2026 Final approvals expected in 2Q 2025, ahead of Final Investment Decision in mid-2025 − Results from the SS-2H ST1 and SS-3H wells will determine total wells required to deliver ~40 MMcf/d gas supply contracted under 15.5-year binding GSA with the Northern Territory Government − Binding agreements executed with APA Group in December 2024 for construction of a new 12” x 23-mile Sturt Plateau Pipeline (SPP) from the proposed SS Pilot Project to the existing AGP to Darwin − Commenced procurement for ~40 MMcf/d Sturt Plateau Compression Facility (SPCF) − Final approvals for SS Pilot Project program on track ahead of Final Investment Decision in mid-2025 − SS Pilot Project First Gas planned in 1H 2026 3D model of planned Sturt Plateau Compression Facility SPP Roma North Compression Facility SPCF Existing Amadeus Gas 12” Pipeline SPP SPCF
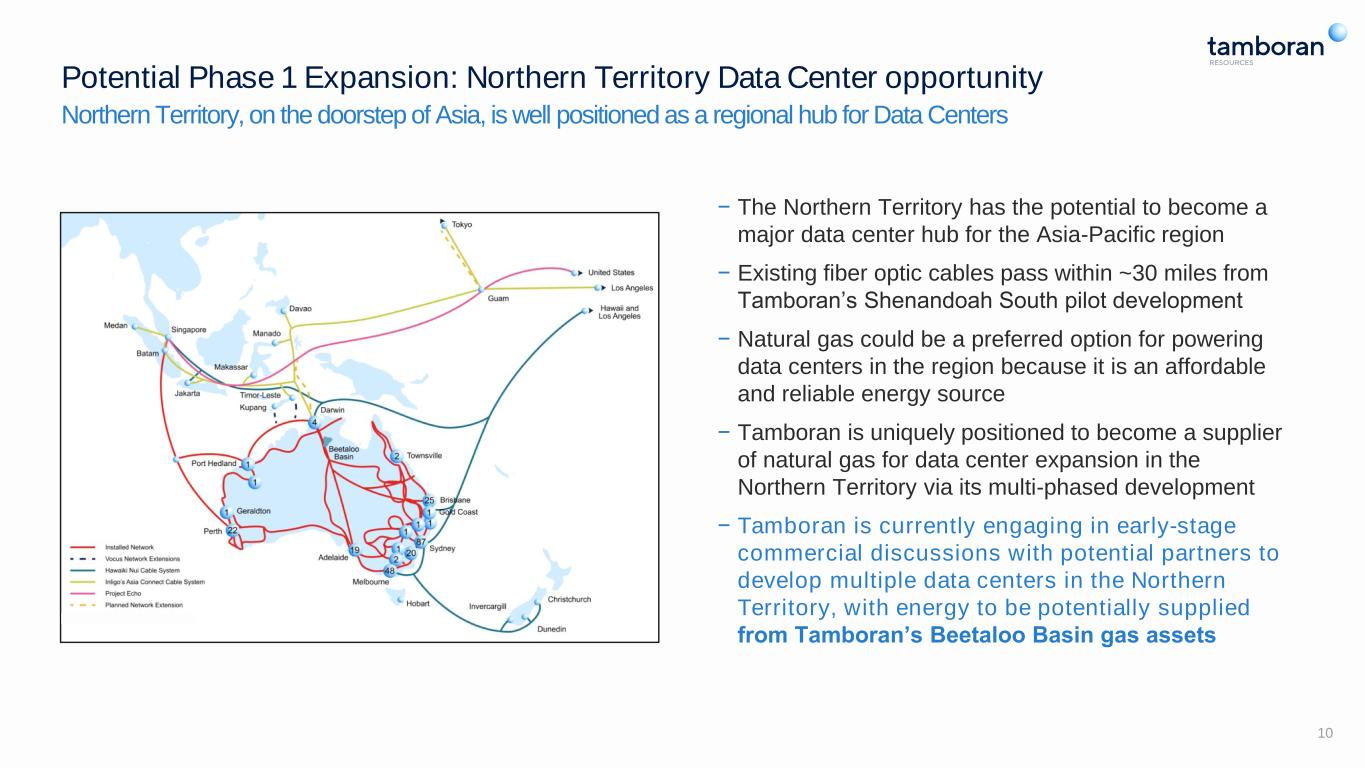
Northern Territory, on the doorstep of Asia, is well positioned as a regional hub for Data Centers 10 − The Northern Territory has the potential to become a major data center hub for the Asia-Pacific region − Existing fiber optic cables pass within ~30 miles from Tamboran’s Shenandoah South pilot development − Natural gas could be a preferred option for powering data centers in the region because it is an affordable and reliable energy source − Tamboran is uniquely positioned to become a supplier of natural gas for data center expansion in the Northern Territory via its multi-phased development − Tamboran is currently engaging in early-stage commercial discussions with potential partners to develop multiple data centers in the Northern Territory, with energy to be potentially supplied from Tamboran’s Beetaloo Basin gas assets Potential Phase 1 Expansion: Northern Territory Data Center opportunity
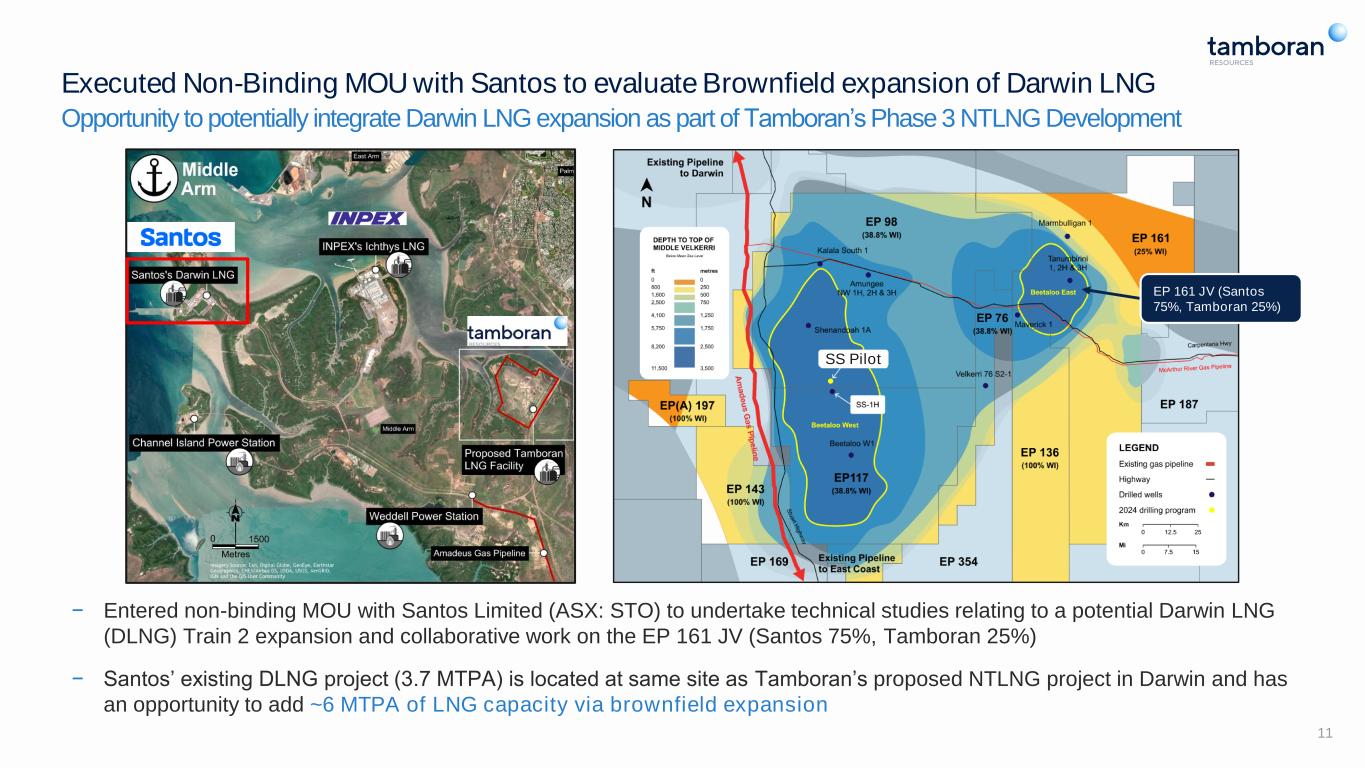
Executed Non-Binding MOU with Santos to evaluate Brownfield expansion of Darwin LNG Opportunity to potentially integrate Darwin LNG expansion as part of Tamboran’s Phase 3 NTLNG Development 11 − Entered non-binding MOU with Santos Limited (ASX: STO) to undertake technical studies relating to a potential Darwin LNG (DLNG) Train 2 expansion and collaborative work on the EP 161 JV (Santos 75%, Tamboran 25%) − Santos’ existing DLNG project (3.7 MTPA) is located at same site as Tamboran’s proposed NTLNG project in Darwin and has an opportunity to add ~6 MTPA of LNG capacity via brownfield expansion SS Pilot EP 161 JV (Santos 75%, Tamboran 25%)
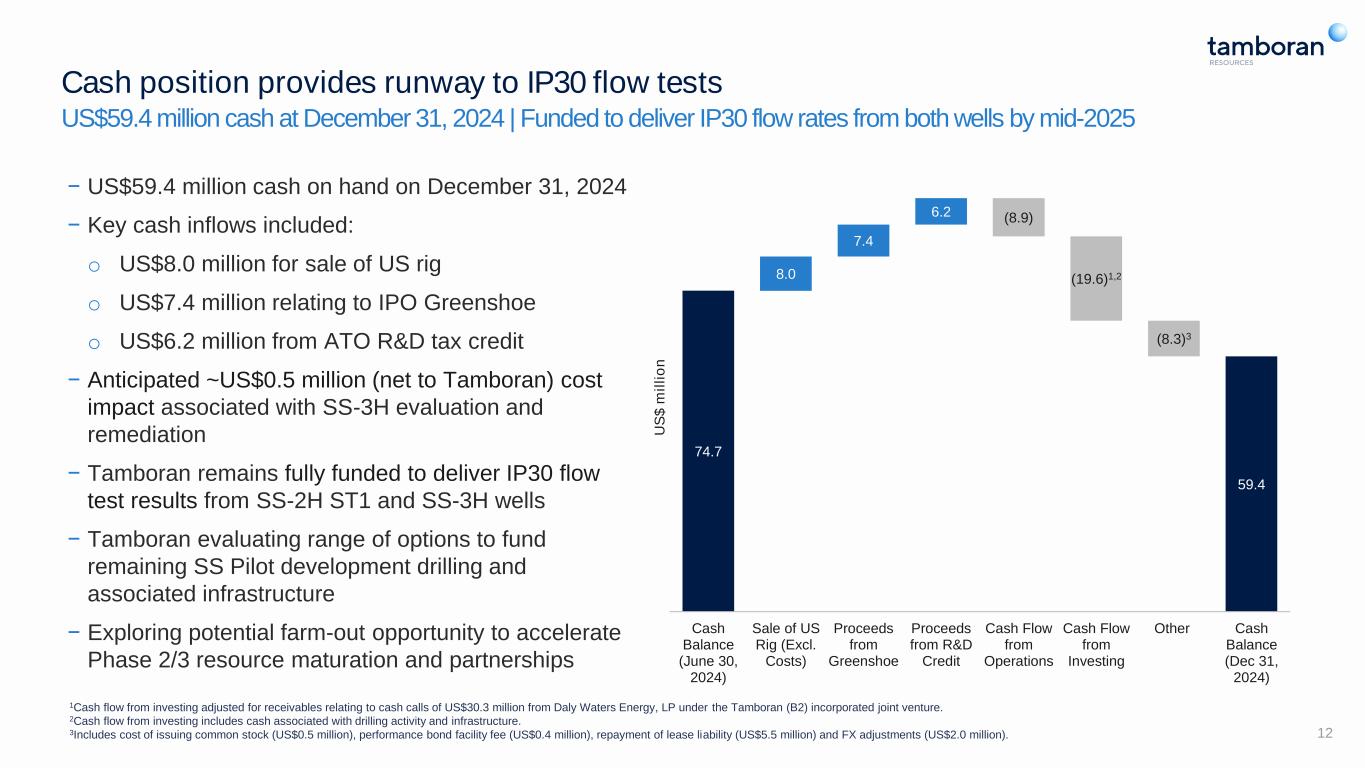
Cash position provides runway to IP30 flow tests US$59.4 million cash at December 31, 2024 | Funded to deliver IP30 flow rates from both wells by mid-2025 − US$59.4 million cash on hand on December 31, 2024 − Key cash inflows included: o US$8.0 million for sale of US rig o US$7.4 million relating to IPO Greenshoe o US$6.2 million from ATO R&D tax credit − Anticipated ~US$0.5 million (net to Tamboran) cost impact associated with SS-3H evaluation and remediation − Tamboran remains fully funded to deliver IP30 flow test results from SS-2H ST1 and SS-3H wells − Tamboran evaluating range of options to fund remaining SS Pilot development drilling and associated infrastructure − Exploring potential farm-out opportunity to accelerate Phase 2/3 resource maturation and partnerships 12 Chris to update once finance finalize the quarterly 1Cash flow from investing adjusted for receivables relating to cash calls of US$30.3 million from Daly Waters Energy, LP under the Tamboran (B2) incorporated joint venture. 2Cash flow from investing includes cash associated with drilling activity and infrastructure. 3Includes cost of issuing common stock (US$0.5 million), performance bond facility fee (US$0.4 million), repayment of lease liability (US$5.5 million) and FX adjustments (US$2.0 million). 59.4 (8.9) (19.6)1,2 (8.3)3 74.7 8.0 7.4 6.2 Cash Balance (June 30, 2024) Sale of US Rig (Excl. Costs) Proceeds from Greenshoe Proceeds from R&D Credit Cash Flow from Operations Cash Flow from Investing Other Cash Balance (Dec 31, 2024) U S $ m il li o n
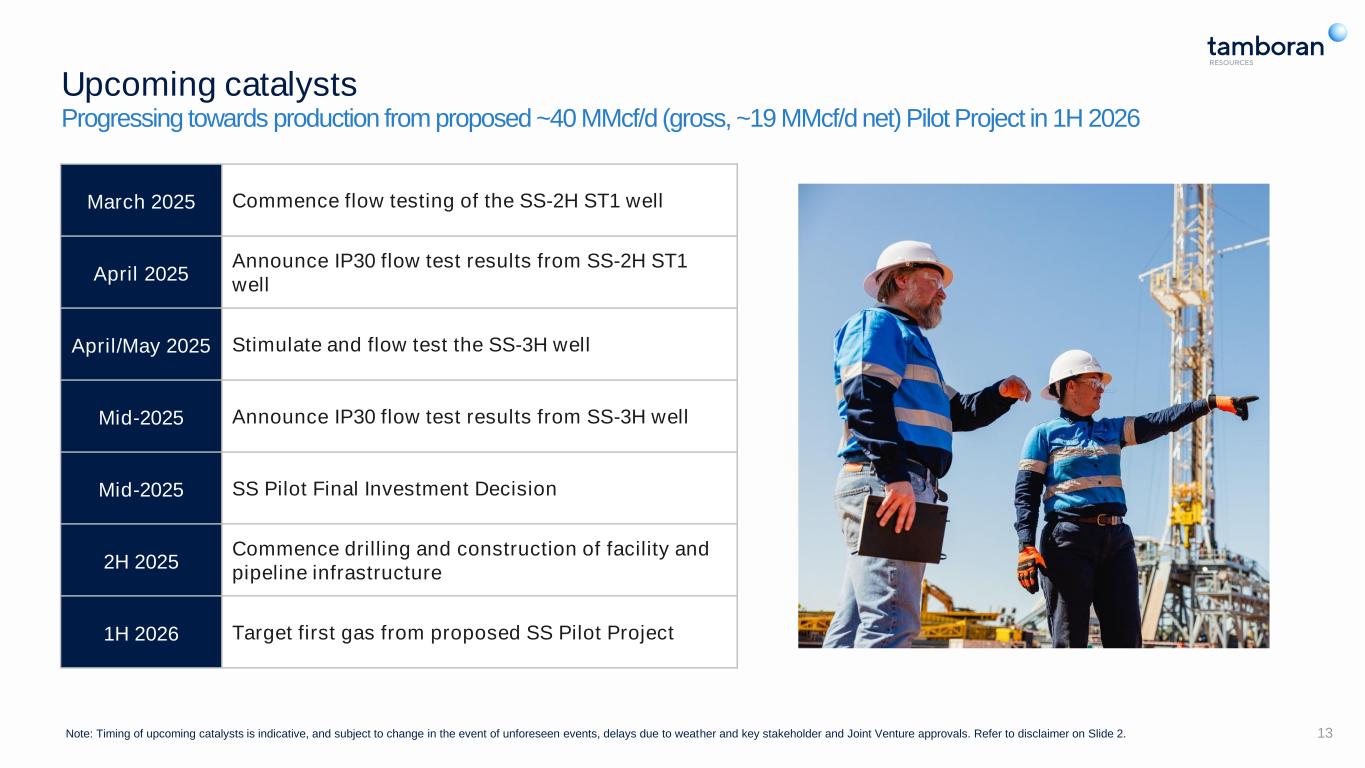
Upcoming catalysts Progressing towards production from proposed ~40 MMcf/d (gross, ~19 MMcf/d net) Pilot Project in 1H 2026 13Note: Timing of upcoming catalysts is indicative, and subject to change in the event of unforeseen events, delays due to weather and key stakeholder and Joint Venture approvals. Refer to disclaimer on Slide 2. March 2025 Commence flow testing of the SS-2H ST1 well April 2025 Announce IP30 flow test results from SS-2H ST1 well April/May 2025 Stimulate and flow test the SS-3H well Mid-2025 Announce IP30 flow test results from SS-3H well Mid-2025 SS Pilot Final Investment Decision 2H 2025 Commence drilling and construction of facility and pipeline infrastructure 1H 2026 Target first gas from proposed SS Pilot Project
14 Appendix A: Additional Information
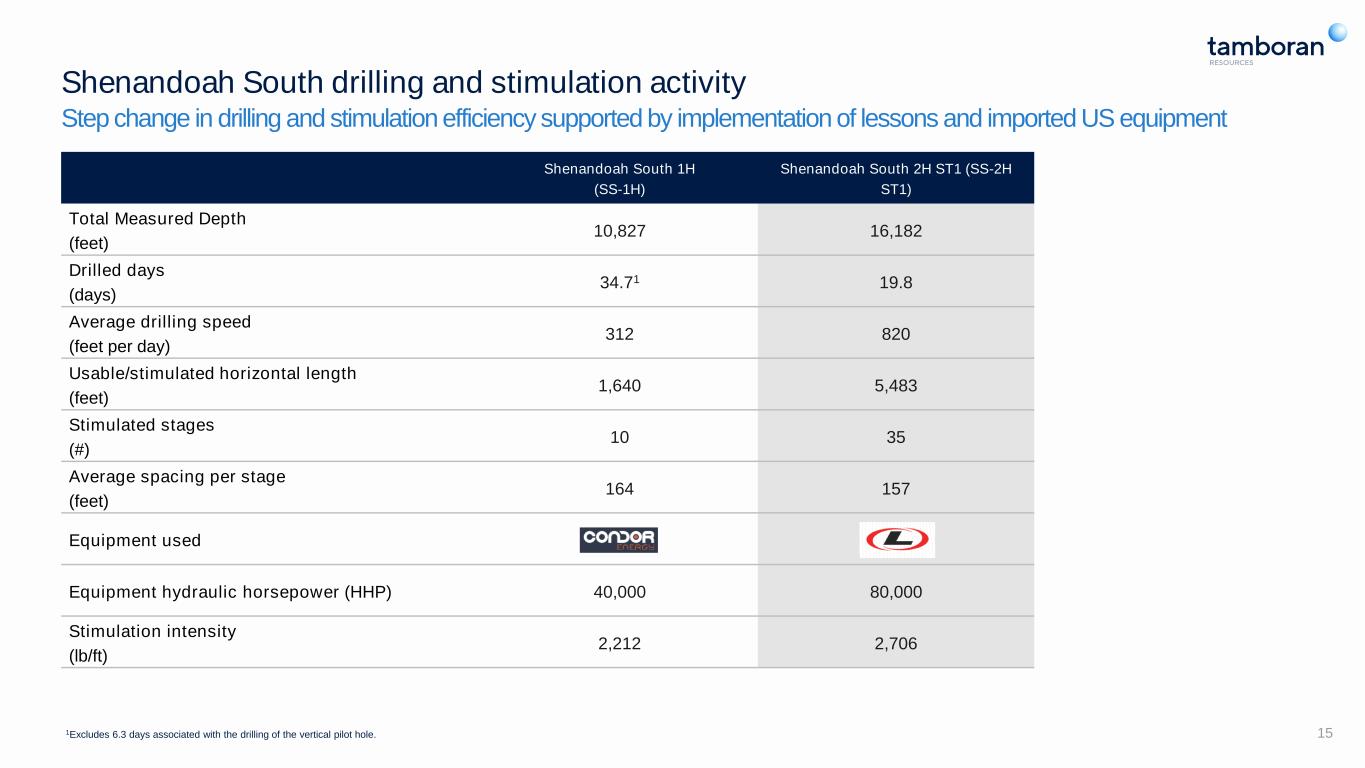
Shenandoah South drilling and stimulation activity Step change in drilling and stimulation efficiency supported by implementation of lessons and imported US equipment 15 Shenandoah South 1H (SS-1H) Shenandoah South 2H ST1 (SS-2H ST1) Total Measured Depth (feet) 10,827 16,182 Drilled days (days) 34.71 19.8 Average drilling speed (feet per day) 312 820 Usable/stimulated horizontal length (feet) 1,640 5,483 Stimulated stages (#) 10 35 Average spacing per stage (feet) 164 157 Equipment used Equipment hydraulic horsepower (HHP) 40,000 80,000 Stimulation intensity (lb/ft) 2,212 2,706 1Excludes 6.3 days associated with the drilling of the vertical pilot hole.
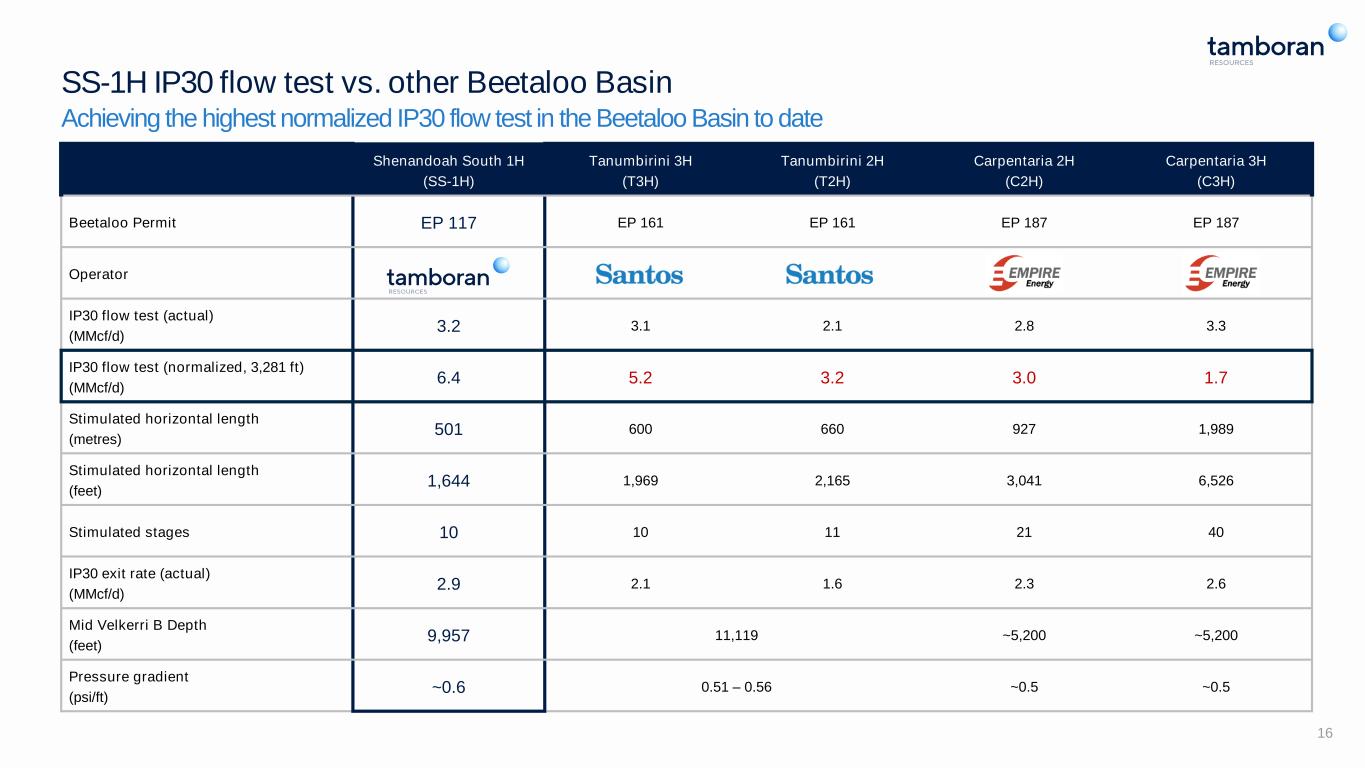
SS-1H IP30 flow test vs. other Beetaloo Basin Achieving the highest normalized IP30 flow test in the Beetaloo Basin to date Shenandoah South 1H (SS-1H) Tanumbirini 3H (T3H) Tanumbirini 2H (T2H) Carpentaria 2H (C2H) Carpentaria 3H (C3H) Beetaloo Permit EP 117 EP 161 EP 161 EP 187 EP 187 Operator IP30 flow test (actual) (MMcf/d) 3.2 3.1 2.1 2.8 3.3 IP30 flow test (normalized, 3,281 ft) (MMcf/d) 6.4 5.2 3.2 3.0 1.7 Stimulated horizontal length (metres) 501 600 660 927 1,989 Stimulated horizontal length (feet) 1,644 1,969 2,165 3,041 6,526 Stimulated stages 10 10 11 21 40 IP30 exit rate (actual) (MMcf/d) 2.9 2.1 1.6 2.3 2.6 Mid Velkerri B Depth (feet) 9,957 11,119 ~5,200 ~5,200 Pressure gradient (psi/ft) ~0.6 0.51 – 0.56 ~0.5 ~0.5 16
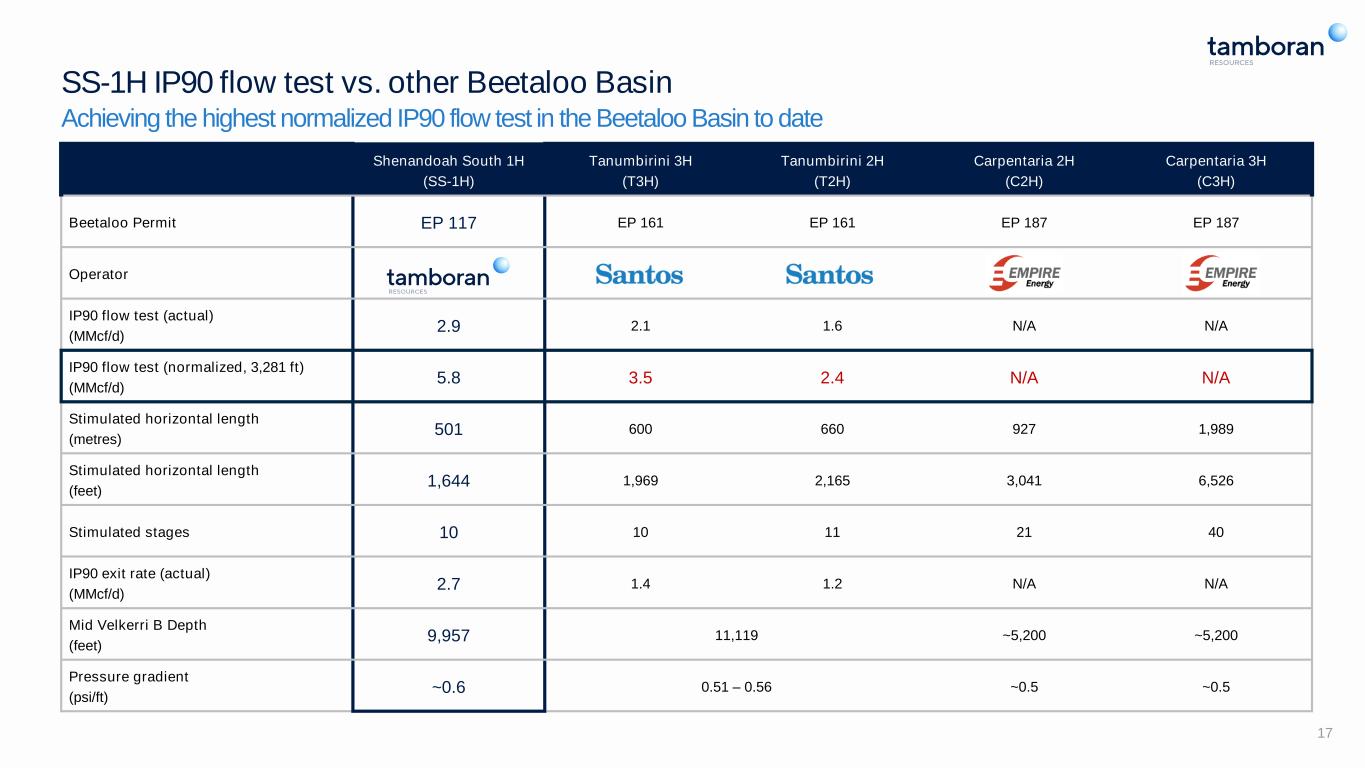
SS-1H IP90 flow test vs. other Beetaloo Basin Achieving the highest normalized IP90 flow test in the Beetaloo Basin to date Shenandoah South 1H (SS-1H) Tanumbirini 3H (T3H) Tanumbirini 2H (T2H) Carpentaria 2H (C2H) Carpentaria 3H (C3H) Beetaloo Permit EP 117 EP 161 EP 161 EP 187 EP 187 Operator IP90 flow test (actual) (MMcf/d) 2.9 2.1 1.6 N/A N/A IP90 flow test (normalized, 3,281 ft) (MMcf/d) 5.8 3.5 2.4 N/A N/A Stimulated horizontal length (metres) 501 600 660 927 1,989 Stimulated horizontal length (feet) 1,644 1,969 2,165 3,041 6,526 Stimulated stages 10 10 11 21 40 IP90 exit rate (actual) (MMcf/d) 2.7 1.4 1.2 N/A N/A Mid Velkerri B Depth (feet) 9,957 11,119 ~5,200 ~5,200 Pressure gradient (psi/ft) ~0.6 0.51 – 0.56 ~0.5 ~0.5 17
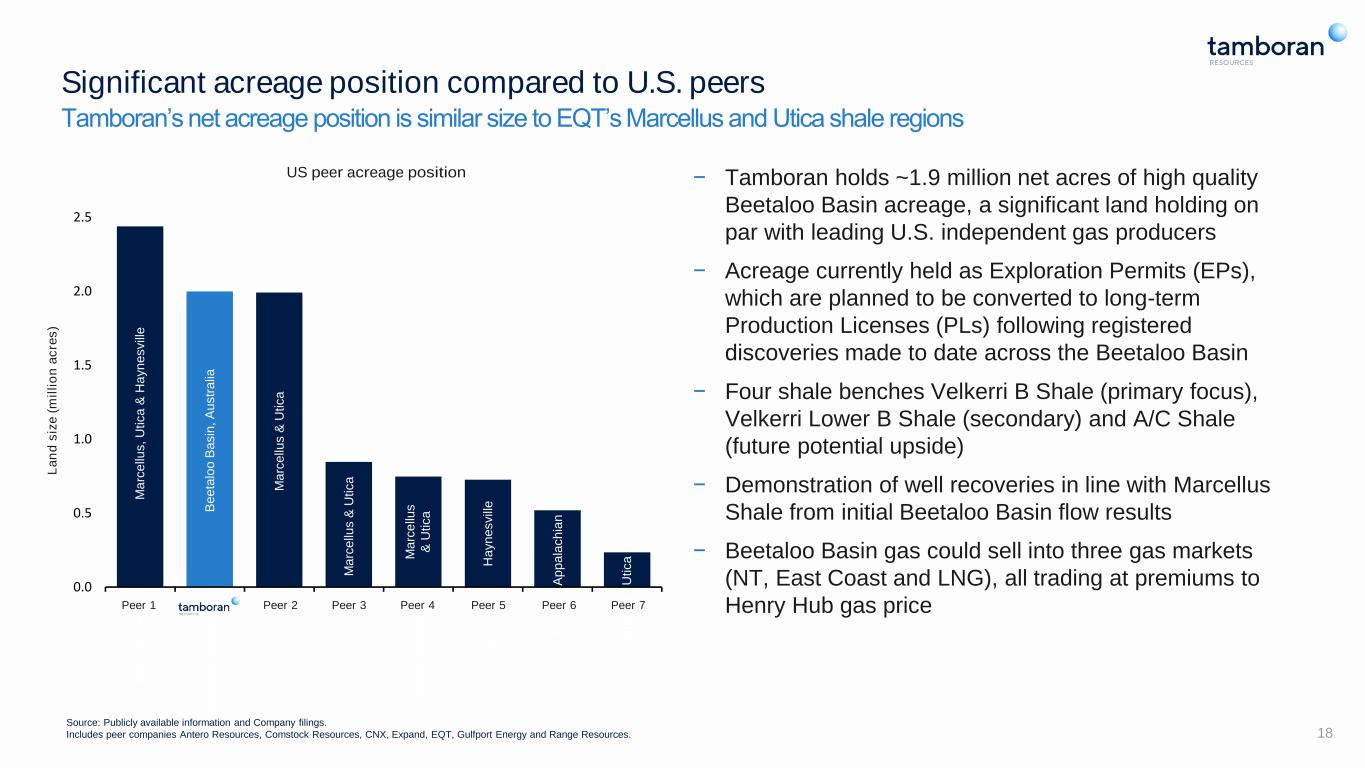
18 Significant acreage position compared to U.S. peers Tamboran’s net acreage position is similar size to EQT’s Marcellus and Utica shale regions Source: Publicly available information and Company filings. Includes peer companies Antero Resources, Comstock Resources, CNX, Expand, EQT, Gulfport Energy and Range Resources. M a rc e llu s & U ti c a M a rc e llu s & U ti c a A p p a la c h ia & H a y n e s v ill e M a rc e llu s & H a y n e s v ill e M a rc e llu s & U ti c a A p p a la c h ia n B e e ta lo o B a s in , A u s tr a lia − Tamboran holds ~1.9 million net acres of high quality Beetaloo Basin acreage, a significant land holding on par with leading U.S. independent gas producers − Acreage currently held as Exploration Permits (EPs), which are planned to be converted to long-term Production Licenses (PLs) following registered discoveries made to date across the Beetaloo Basin − Four shale benches Velkerri B Shale (primary focus), Velkerri Lower B Shale (secondary) and A/C Shale (future potential upside) − Demonstration of well recoveries in line with Marcellus Shale from initial Beetaloo Basin flow results − Beetaloo Basin gas could sell into three gas markets (NT, East Coast and LNG), all trading at premiums to Henry Hub gas price U ti c a H a y n e s v ill e US peer acreage position L a n d s iz e ( m il li o n a c re s ) M a rc e llu s & U ti c a 0.0 0.5 1.0 1.5 2.0 2.5 Ex p an d E n e rg y Ta m b o ra n R es o u rc es EQ T C N X R an ge R e so u rc es C o m st o ck A n te ro G u lf p o rt M a rc e llu s , U ti c a & H a y n e s v ill e B e e ta lo o B a s in , A u s tr a lia M a rc e llu s & U ti c a M a rc e llu s & U ti c a M a rc e llu s & U ti c a H a y n e s v ill e A p p a la c h ia n U ti c a Peer 1 Peer 2 Peer 3 Peer 4 Peer 5 Pee 6 Peer 7
