
Project Accelerate Q3-2024 Earnings Call November 6, 2024

Forward-Looking Statements Some of the statements contained in this report that are not historical in nature are forward-looking statements within the meaning of the federal securities laws, including Section 27A of the Securities Act of 1933, as amended, and Section 21E of the Securities Exchange Act of 1934, as amended, including statements as to our expectations, beliefs, goals and strategies regarding the future. Words such as “anticipate,” “believe,” “create,” “expect,” “future,” “guidance,” “intend,” “plan,” “potential,” “seek,” “synergies,” “target,” “will,” “would,” similar expressions, and variations or negatives of these words identify forward-looking statements. However, the absence of these words does not mean that the statements are not forward-looking. Forward-looking statements by their nature address matters that are, to different degrees, uncertain. These forward-looking statements may involve current plans, estimates, expectations and ambitions that are subject to risks, uncertainties and assumptions that are difficult to predict, may be beyond our control and could cause actual results to differ materially from those described in such statements. Although we believe that the expectations reflected in such forward-looking statements are reasonable, we can give no assurance that such expectations will prove to be correct, that our growth and operational strategies will achieve the target results. Important risk factors that may cause such a difference and could adversely affect attendance at our parks, our future financial performance, and/or our growth strategies, and could cause actual results to differ materially from our expectations or otherwise to fluctuate or decrease, include, but are not limited to: general economic, political and market conditions; the impacts of pandemics or other public health crises, including the effects of government responses on people and economies; adverse weather conditions; competition for consumer leisure time and spending; unanticipated construction delays; changes in our capital investment plans and projects; anticipated tax treatment, unforeseen liabilities, future capital expenditures, revenues, expenses, earnings, synergies, economic performance, indebtedness, financial condition, losses, future prospects, business and management strategies for the management, expansion and growth of the Combined Company’s operations; failure to realize the anticipated benefits of the merger, including difficulty in integrating the businesses of legacy Six Flags and legacy Cedar Fair; failure to realize the expected amount and timing of cost savings and operating synergies related to the merger; legislative, regulatory and economic developments and changes in laws, regulations, and policies affecting the Combined Company; acts of terrorism or outbreak of war, hostilities, civil unrest, and other political or security disturbances; and other factors we discuss under the heading “Risk Factors” within Part II, Item 1A of the Quarterly Report on Form 10-Q for the quarter ended June 30, 2024, in legacy Cedar Fair’s Annual Report on Form 10-K and in the other filings we make from time to time with the SEC. Readers are urged not to place undue reliance on these forward-looking statements, which speak only as of the date of this document and are based on information currently and reasonably known to us. We do not undertake any obligation to publicly update or revise any forward-looking statements to reflect future events, information or circumstances that arise after publication of this document. 2
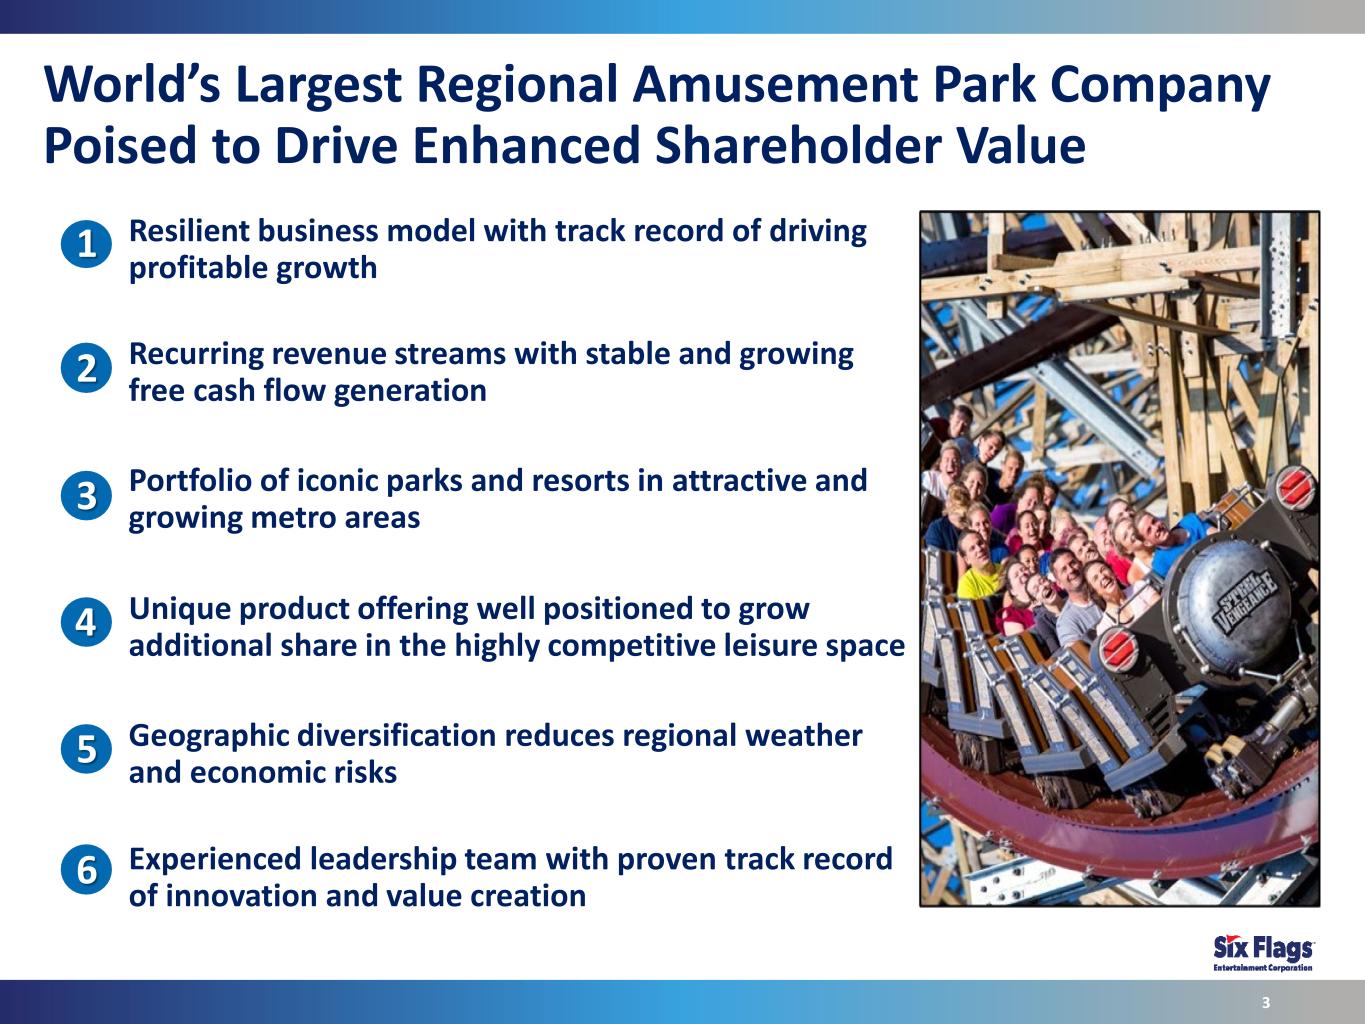
World’s Largest Regional Amusement Park Company Poised to Drive Enhanced Shareholder Value 3 Portfolio of iconic parks and resorts in attractive and growing metro areas Unique product offering well positioned to grow additional share in the highly competitive leisure space Geographic diversification reduces regional weather and economic risks Recurring revenue streams with stable and growing free cash flow generation Resilient business model with track record of driving profitable growth Experienced leadership team with proven track record of innovation and value creation 1 2 5 4 3 6
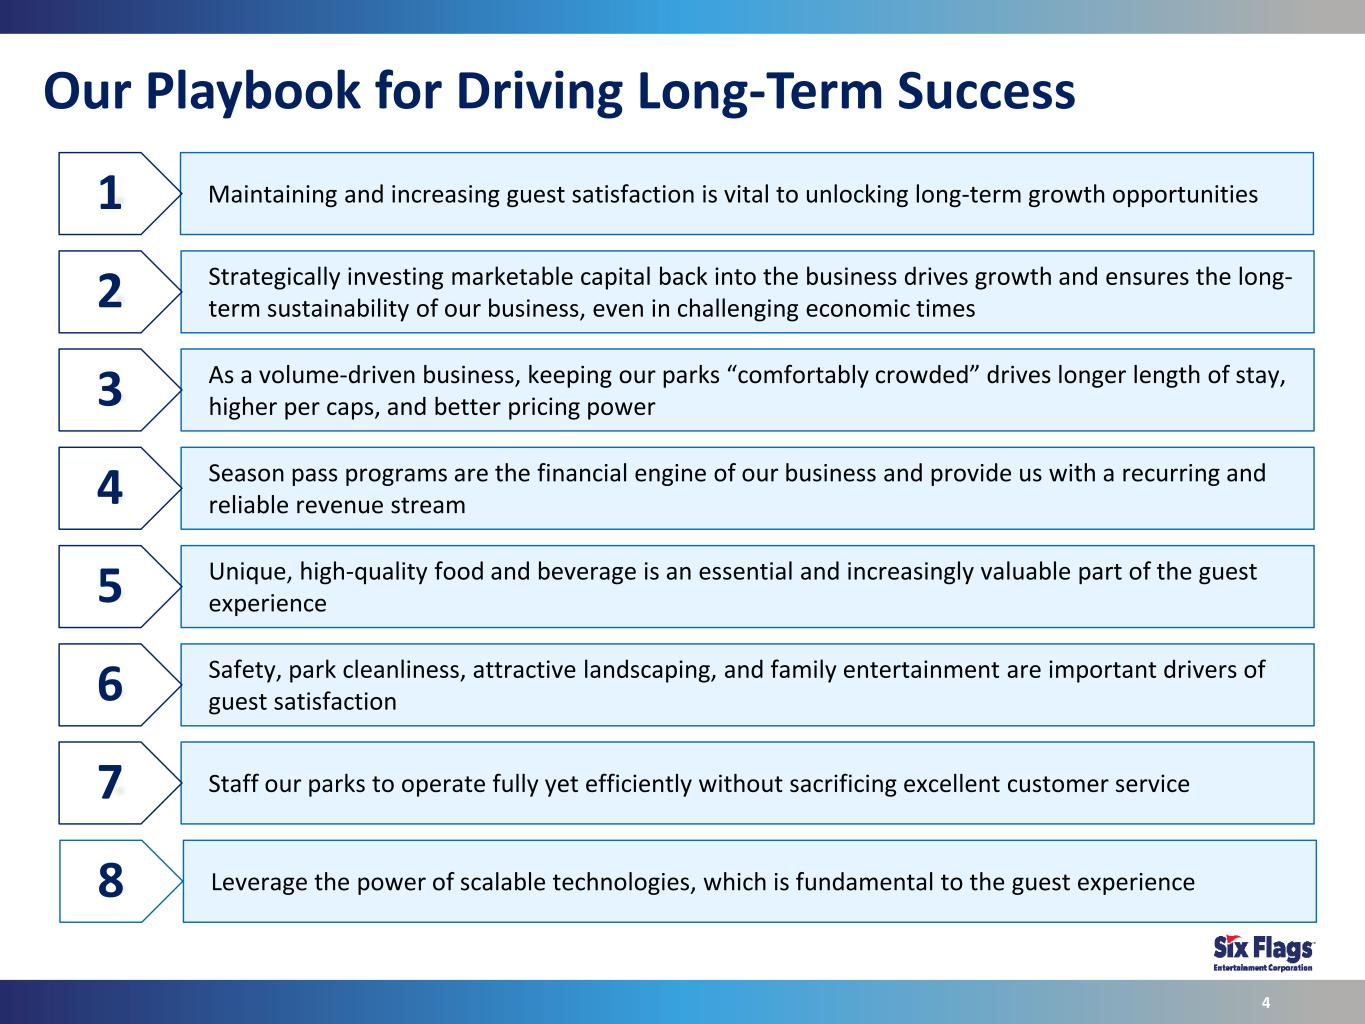
Our Playbook for Driving Long-Term Success 4 Maintaining and increasing guest satisfaction is vital to unlocking long-term growth opportunities1 Strategically investing marketable capital back into the business drives growth and ensures the long- term sustainability of our business, even in challenging economic times2 As a volume-driven business, keeping our parks “comfortably crowded” drives longer length of stay, higher per caps, and better pricing power3 Season pass programs are the financial engine of our business and provide us with a recurring and reliable revenue stream4 Unique, high-quality food and beverage is an essential and increasingly valuable part of the guest experience5 Safety, park cleanliness, attractive landscaping, and family entertainment are important drivers of guest satisfaction6 Staff our parks to operate fully yet efficiently without sacrificing excellent customer service7 Leverage the power of scalable technologies, which is fundamental to the guest experience8
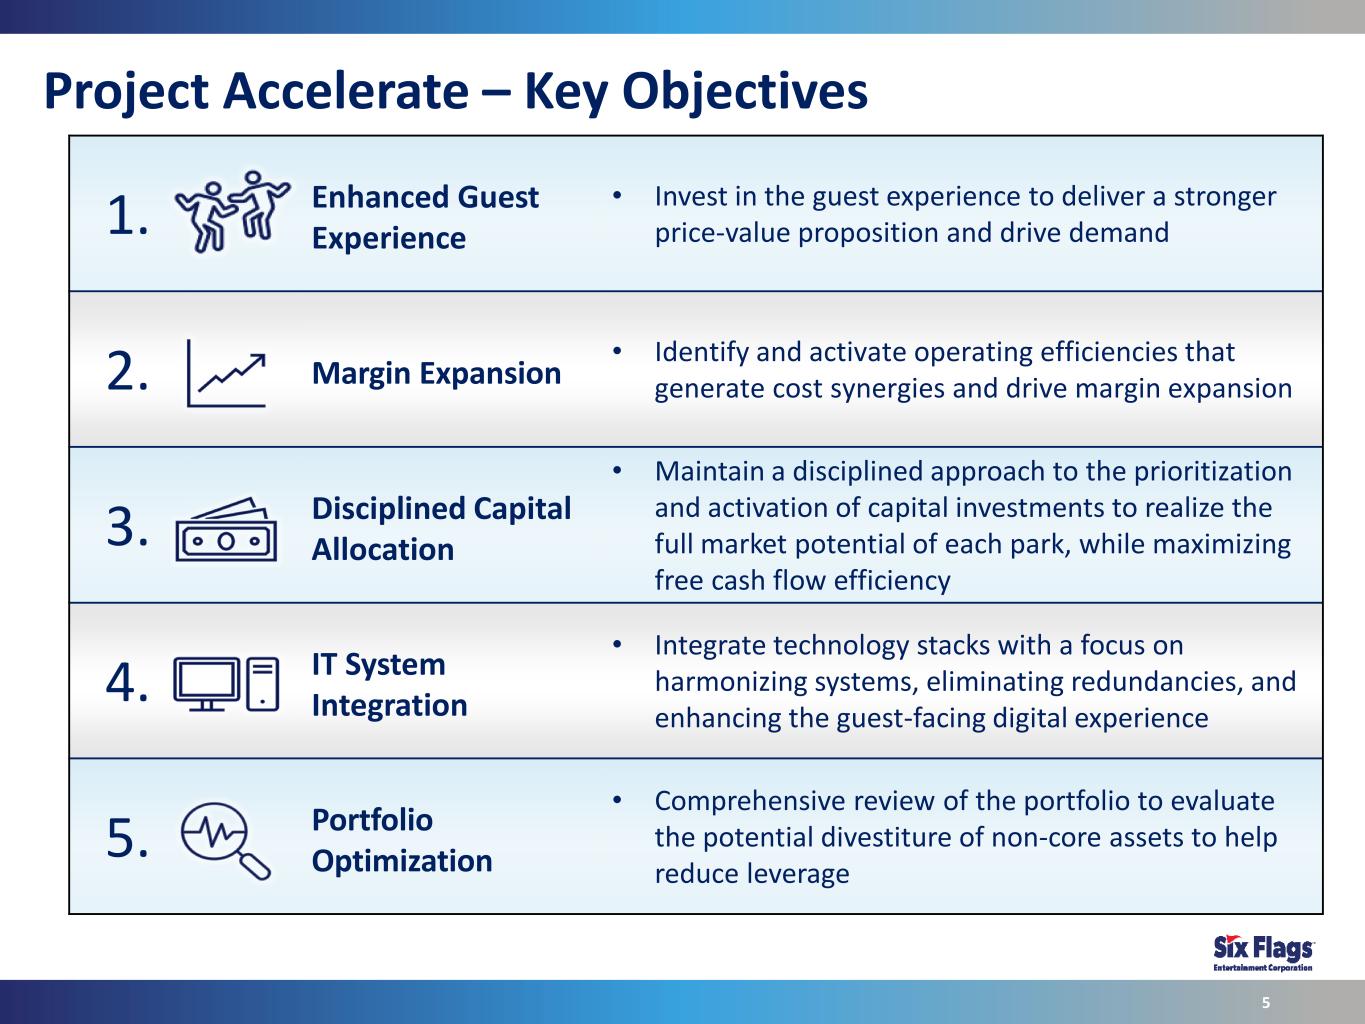
1. Enhanced Guest Experience • Invest in the guest experience to deliver a stronger price-value proposition and drive demand 2. Margin Expansion • Identify and activate operating efficiencies that generate cost synergies and drive margin expansion 3. Disciplined Capital Allocation • Maintain a disciplined approach to the prioritization and activation of capital investments to realize the full market potential of each park, while maximizing free cash flow efficiency 4. IT System Integration • Integrate technology stacks with a focus on harmonizing systems, eliminating redundancies, and enhancing the guest-facing digital experience 5. Portfolio Optimization • Comprehensive review of the portfolio to evaluate the potential divestiture of non-core assets to help reduce leverage Project Accelerate – Key Objectives 5

Disciplined Reinvestment to Drive Top Line Growth 6 Meaningful opportunities to drive revenue growth through higher levels of attendance and guest spending Out-of-Park Revenue Channels • Upgraded and expanded resort offerings • Improved revenue management capabilities aimed at improving resort ADR’s and occupancy rates • Leverage the power of the Six Flags brand with sponsors across a broader footprint of parks and increased attendance base In-Park Guest Spend • Expanded use of revenue management tools to drive dynamic pricing opportunities • Refresh and expand food and beverage offerings and improve transaction efficiency • Improved seasonal staffing levels drive guest satisfaction and increased spending • Higher attendance levels increases demand for premium products • Keeping our parks “comfortably crowded” leads to longer lengths of stay and higher guest spend Attendance • Improved guest experience drives repeat visitation and higher season pass sales • Drive demand urgency through marketable new rides and attractions • Responsibly expand operating calendars as demand levels improve • Improved marketing strategy • Season pass program focused on increasing average visits per season pass and improving renewal rates
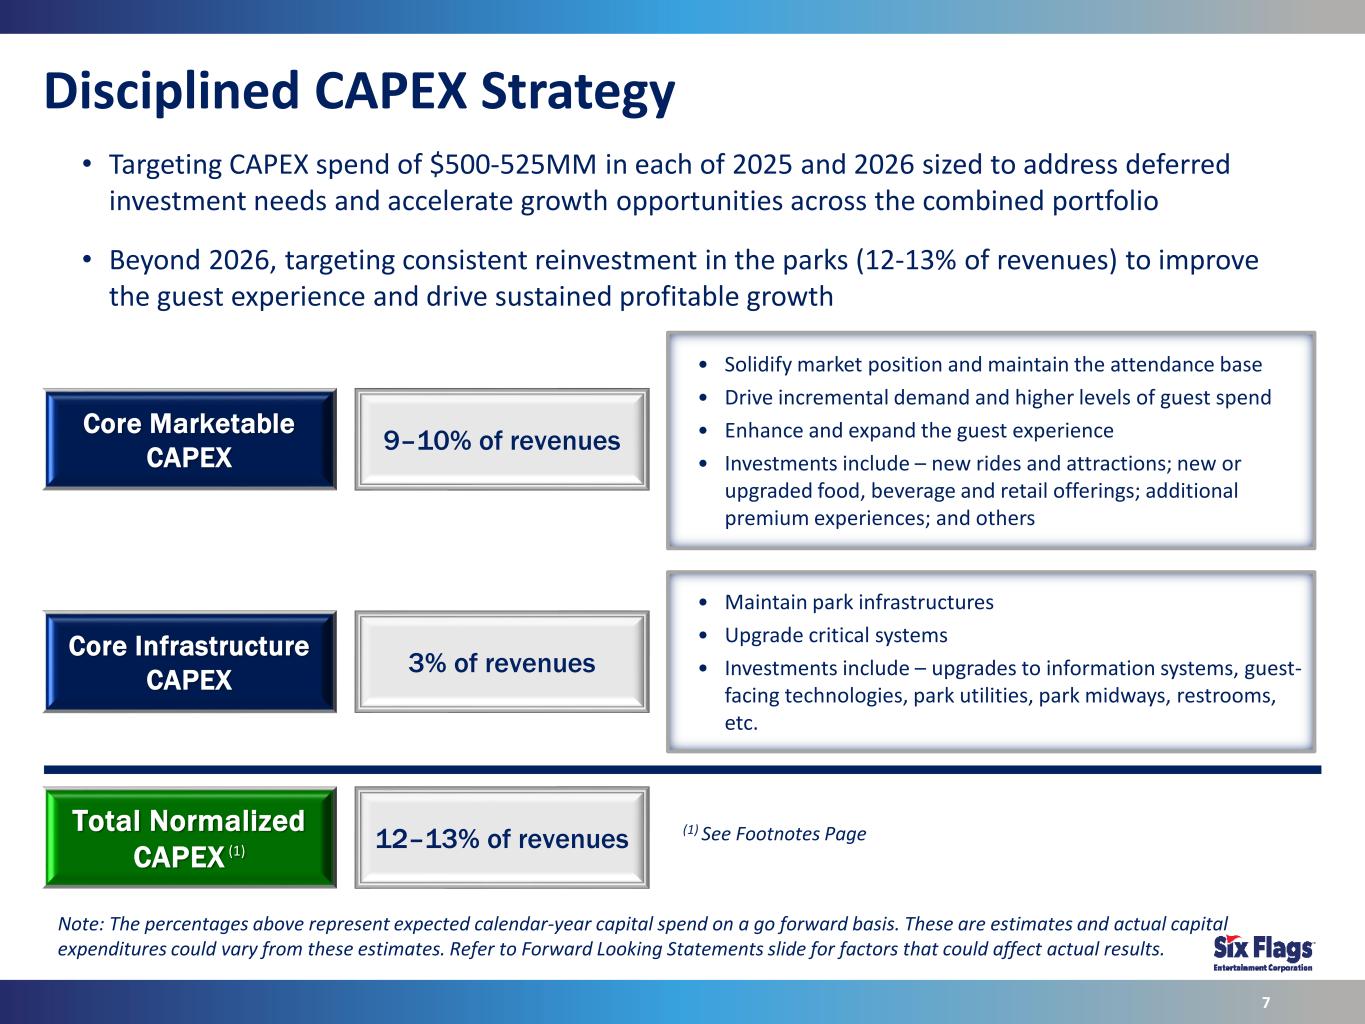
Disciplined CAPEX Strategy 7 Core Marketable CAPEX • Maintain park infrastructures • Upgrade critical systems • Investments include – upgrades to information systems, guest- facing technologies, park utilities, park midways, restrooms, etc. 9–10% of revenues Core Infrastructure CAPEX Total Normalized CAPEX (1) 3% of revenues 12–13% of revenues • Targeting CAPEX spend of $500-525MM in each of 2025 and 2026 sized to address deferred investment needs and accelerate growth opportunities across the combined portfolio • Beyond 2026, targeting consistent reinvestment in the parks (12-13% of revenues) to improve the guest experience and drive sustained profitable growth • Solidify market position and maintain the attendance base • Drive incremental demand and higher levels of guest spend • Enhance and expand the guest experience • Investments include – new rides and attractions; new or upgraded food, beverage and retail offerings; additional premium experiences; and others (1) See Footnotes Page Note: The percentages above represent expected calendar-year capital spend on a go forward basis. These are estimates and actual capital expenditures could vary from these estimates. Refer to Forward Looking Statements slide for factors that could affect actual results.

Timing of Cost Synergies 8 $120MM of merger related cost synergies FY’24 • Standalone operating cost reductions in legacy portfolios • Initial phase of organizational restructurings • Elimination of duplicative overhead costs ~$50MM FY’25 • Elimination of redundant processes / technologies • System integration • Leveraging combined spend for better terms • Rationalization of supplier base • Second phase of organizational restructuring ~$70MM Clear line of sight to achieving $120MM of cost synergies on a run-rate basis by the end of 2025 Note: The synergy targets above represent forward looking statements. Actual synergies could vary from these estimates. Refer to Forward Looking Statements slide for factors that could affect actual results.
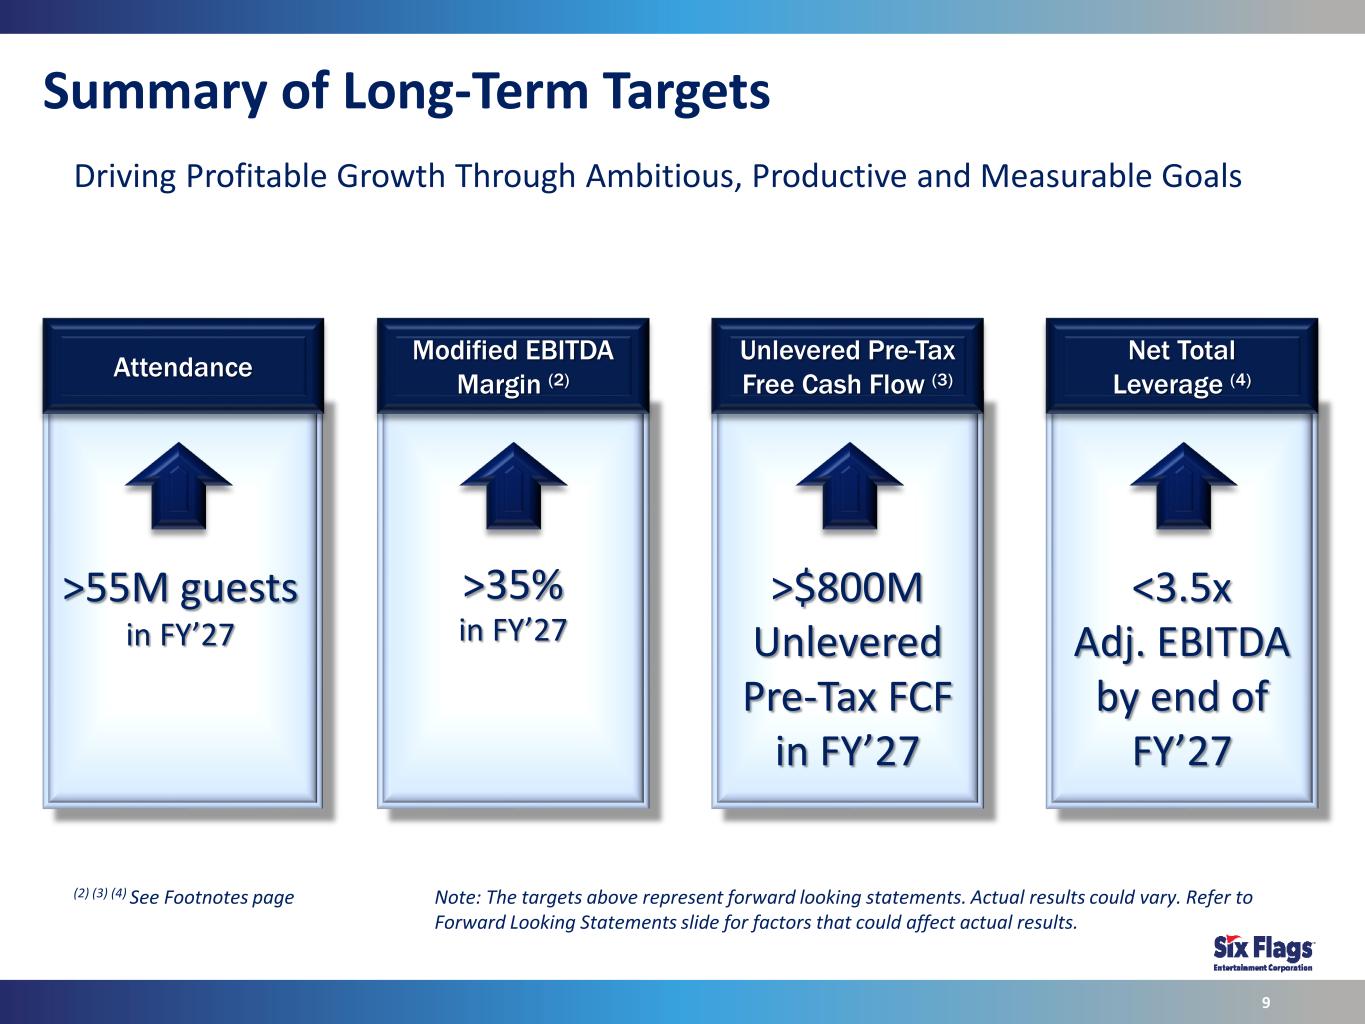
Summary of Long-Term Targets 9 Attendance Modified EBITDA Margin (2) Unlevered Pre-Tax Free Cash Flow (3) Net Total Leverage (4) >35% in FY’27 >$800M Unlevered Pre-Tax FCF in FY’27 <3.5x Adj. EBITDA by end of FY’27 >55M guests in FY’27 Driving Profitable Growth Through Ambitious, Productive and Measurable Goals (2) (3) (4) See Footnotes page Note: The targets above represent forward looking statements. Actual results could vary. Refer to Forward Looking Statements slide for factors that could affect actual results.

Footnotes (1) Normalized CAPEX represents expected calendar-year capital spend on a go forward basis, excluding M&A, and is not necessarily representative of historical CAPEX spending. (2) Modified EBITDA margin is calculated as Modified EBITDA divided by net revenues. Modified EBITDA represents earnings before interest, taxes, depreciation, amortization, other non-cash items, and adjustments as defined in the Combined Company's credit agreement. Modified EBITDA margin and Modified EBITDA are not measurements computed in accordance with generally accepted accounting principles (GAAP) and may not be comparable to similarly titled measures of other companies. Management believes Modified EBITDA margin provides a meaningful metric of operating profitability. Management’s target for Modified EBITDA margin has been provided as opposed to Adjusted EBITDA margin because management believes Modified EBITDA margin more accurately reflects the park operations of the Combined Company as it does not give effect to distributions to non-controlling interests. The Combined Company is not reconciling Modified EBITDA margin targets or guidance to net income margin in reliance on the unreasonable efforts exception provided under Item 10(e)(1)(i)(B) of Regulation S-K. The Combined Company is unable, without unreasonable effort, to forecast certain individual items required to reconcile Modified EBITDA margin targets or guidance with the most directly comparable GAAP financial measure (net income margin). These items include foreign currency (gain) loss, as well as other non-cash and unusual items and other adjustments as defined under the Combined Company’s credit agreement, which are difficult to predict in advance in order to include in a GAAP estimate. (3) Unlevered pre-tax free cash flow is defined as Adjusted EBITDA less capital expenditures. Unlevered pre-tax free cash flow is not computed in accordance with GAAP and may not be comparable to similarly titled measures of other companies. Management believes unlevered pre-tax free cash flow is a meaningful measure because it is used by analysts and investors in the industry to evaluate operating performance on a consistent basis, as well as more easily compare the Combined Company’s results with those of other companies in the industry. Management also uses unlevered pre-tax free cash flows for incentive compensation plans. The Combined Company is not reconciling unlevered pre-tax free cash flow targets or guidance in reliance on the unreasonable efforts exception provided under Item 10(e)(1)(i)(B) of Regulation S-K. The Combined Company is unable, without unreasonable effort, to forecast certain individual items required to reconcile Adjusted EBITDA (a material component of unlevered pre-tax free cash flow) with the most directly comparable GAAP financial measure (net income). These items include foreign currency (gain) loss, as well as other non-cash and unusual items and other adjustments as defined under the Combined Company’s credit agreement, which are difficult to predict in advance in order to include in a GAAP estimate. 10
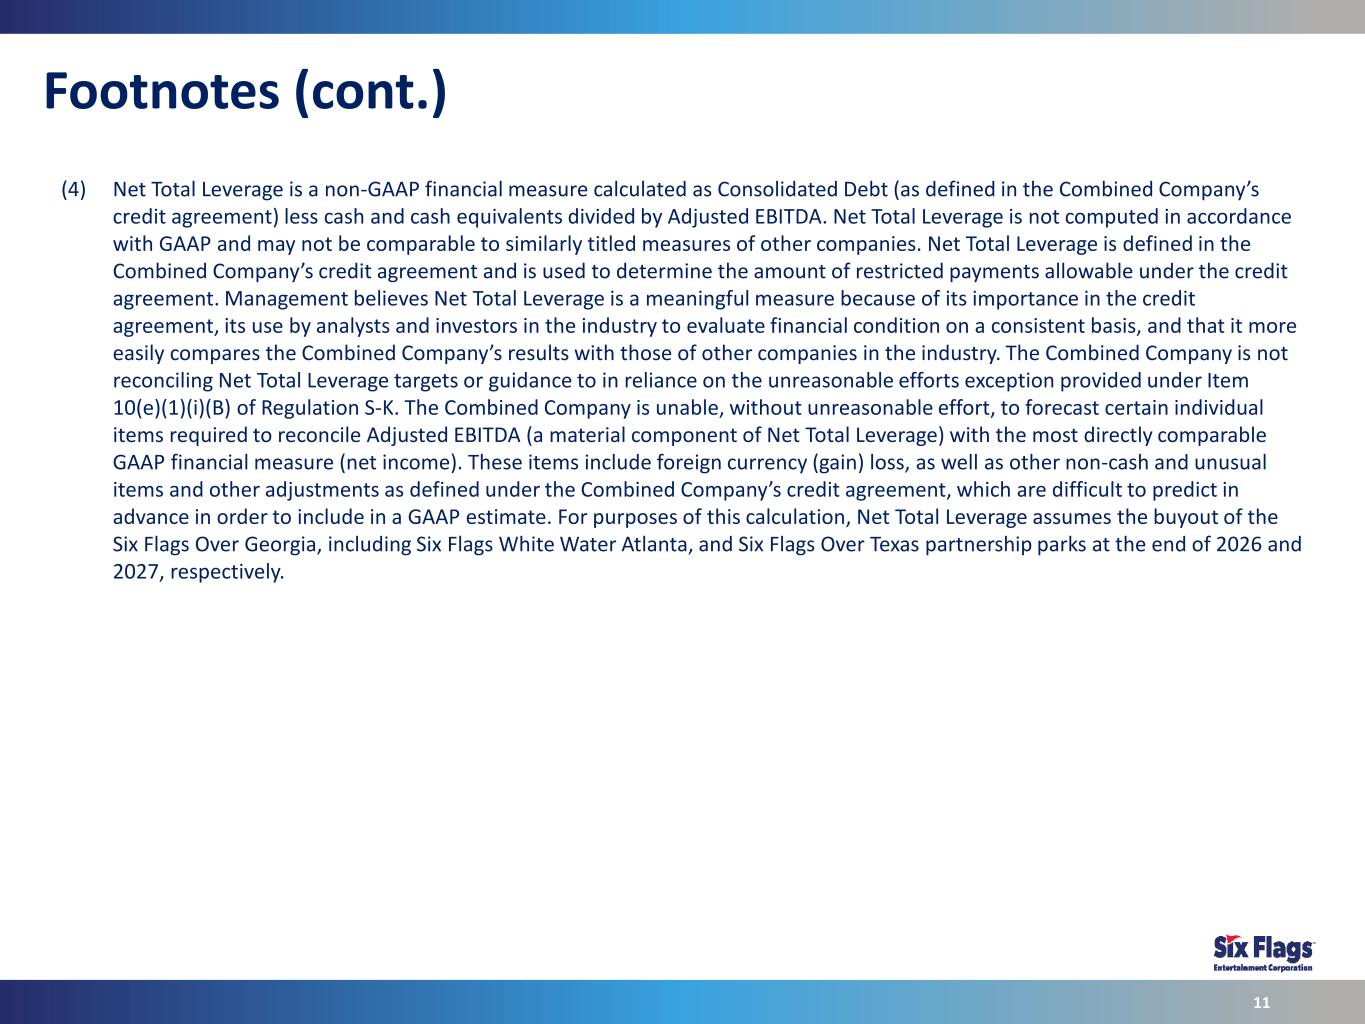
Footnotes (cont.) (4) Net Total Leverage is a non-GAAP financial measure calculated as Consolidated Debt (as defined in the Combined Company’s credit agreement) less cash and cash equivalents divided by Adjusted EBITDA. Net Total Leverage is not computed in accordance with GAAP and may not be comparable to similarly titled measures of other companies. Net Total Leverage is defined in the Combined Company’s credit agreement and is used to determine the amount of restricted payments allowable under the credit agreement. Management believes Net Total Leverage is a meaningful measure because of its importance in the credit agreement, its use by analysts and investors in the industry to evaluate financial condition on a consistent basis, and that it more easily compares the Combined Company’s results with those of other companies in the industry. The Combined Company is not reconciling Net Total Leverage targets or guidance to in reliance on the unreasonable efforts exception provided under Item 10(e)(1)(i)(B) of Regulation S-K. The Combined Company is unable, without unreasonable effort, to forecast certain individual items required to reconcile Adjusted EBITDA (a material component of Net Total Leverage) with the most directly comparable GAAP financial measure (net income). These items include foreign currency (gain) loss, as well as other non-cash and unusual items and other adjustments as defined under the Combined Company’s credit agreement, which are difficult to predict in advance in order to include in a GAAP estimate. For purposes of this calculation, Net Total Leverage assumes the buyout of the Six Flags Over Georgia, including Six Flags White Water Atlanta, and Six Flags Over Texas partnership parks at the end of 2026 and 2027, respectively. 11

Investor Relations investors.sixflags.com Ph. 419.627.2233


