Exhibit 99.10
Strictly Private & Confidential Project Keystone Valuation Report 2023
Strictly Private & Confidential © 2023 KPMG Samjong Accounting Corp., a Korea Limited Liability Company and a member firm of the KPMG global organization of independent member firms affiliated with KPMG International Limited, a private English company limited by guarantee. All rights reserved. 1 ▪ This Valuation Report (this “Material”), references to which and to any information contained herein shall be deemed to include any information, in writing or orally, supplied in connection herewith or in connection with any further enquiries, has been prepared by KPMG Samjong Accounting Corp . (“KPMG”) on behalf of K Enter Holdings Inc . (the “Company”) based on information provided by the Company which has not been independently verified by KPMG . This Material is being made available for informational purposes only and solely for use by certain potential investors (each, an “Investor”) in connection with the consideration of an acquisition of an equity ownership stake in the Company (the “Proposed Transaction”) . ▪ This Material does not purport to contain all the information that an Investor may desire in investigating the Company and is not intended to form the basis of any investment decision by an Investor . Each Investor should carry out its own investigations and analysis of the Company and of the information referred to in this Material and should consult its own advisors before proceeding with any offer . KPMG has not made an independent appraisal of any of the assets and liabilities of the Company in connection with any potential transaction . ▪ Neither the Company or KPMG nor their respective subsidiaries and affiliates, nor any of their respective directors, officers, agents, advisors or employees make any representation or warranty, explicitly or implicitly, nor shall any of them, so far as permitted by law, have any responsibility or liability whatsoever in respect of the accuracy or completeness of, or omissions from, this Material or any other document or information, written or oral, supplied at any time or in respect of any opinions or projections expressed therein or omitted therefrom . No such party is under any obligation to update this Material or correct any inaccuracies in or omissions from it which may exist or become apparent . ▪ No responsibility or liability is accepted, and any and all responsibility and liability is expressly disclaimed, so far as permitted by law, by the Company, KPMG and their respective subsidiaries and affiliates and their respective directors, officers, agents, advisors and employees for any errors, mis - statements or misrepresentations in, or omissions from, this Material or any other such document or information supplied at any time to each Investor or its advisors in the course of each Investor’s evaluation of the Company . ▪ The projected financial information, forecasts, targets, prospects, estimates and other forward - looking statements contained in this Material are based on subjective estimates and assumptions made by the Company and about circumstances and events that have not yet taken place . KPMG has relied upon the accuracy and completeness of these in preparing its analyses . Such projections, estimates, forecasts, targets, prospects and returns are not a reliable indicator of future performance, and such estimates and assumptions involve significant elements of subjective judgment and analysis which may or may not be correct . Accordingly, no representations are made by the Company, KPMG and their respective subsidiaries and affiliates or any of their respective directors, officers, agents, advisors or employees as to the accuracy of such information and there can be no assurance that the projected results are attainable or will be achieved . ▪ This Material does not constitute or form part of any transaction with the Company nor shall it constitute the basis of any contract which may be concluded for such transaction . An Investor must rely only on the representations, warranties and undertakings, if any, contained in a definitive contract and subject to such limitations and exclusions as may be specified therein . This Material is subject to the disclaimer and qualifications specified above and each Investor should make its own investigations and analysis and should not act on the basis of any matter specified, discussed or referred to in this Material . ▪ This Material does not constitute an offer or solicitation in any jurisdiction in which such offer or solicitation is not permitted under applicable law or to any person or entity that does not possess the qualifications described herein . Distribution of this Material in or from certain jurisdictions may be restricted or prohibited by law . Each Investor is required by the Company and KPMG to inform itself of and comply with all restrictions or prohibitions in such jurisdictions . Neither the Company or KPMG nor their respective subsidiaries and affiliates nor any of their respective directors, officers, agents, advisors or employees, so far as permitted by law, accepts any liability to any person in relation to the distribution or possession of this Material in or from any jurisdiction . This Material is provided to each Investor on a personal basis and the right to participate in the Proposed Transaction is personal to each Investor and may not be transferred or assigned to any other person . ▪ By its acceptance hereof, each Investor agrees not to distribute this Material to others, in whole or in part, at any time without the prior written consent of the Company and KPMG and to keep confidential all information contained herein or made available in connection with any further investigation . The contents of this Material and any other information or opinions subsequently supplied may not, without the written consent of the Company and/or KPMG be published, reproduced, copied or disclosed to any person . This Material is being delivered for information purposes only and upon the express understanding that it will be used only for the purpose set forth above . Upon request, each Investor will return promptly all materials received from the Company and KPMG, including this Material, without retaining any copies thereof . Each Investor shall be responsible for any loss suffered by the Company and its shareholders in the event of any unauthorized disclosure . ▪ Neither the issue of this Material nor any part of its contents is to be taken as any form of commitment on the part of the Company or KPMG to proceed with any transaction which may be envisaged by the issue of this Material . The Company and KPMG reserve the right to amend the proposed timetable and procedure, to negotiate with one or more Investors to the exclusion of one or more of any others without giving prior notice thereto, to terminate the procedure and to terminate any discussions and negotiations with any Investor at any time, for any reason and without giving any reasons . ▪ KPMG is a Korean limited liability company and a member firm of the KPMG global organization of independent member firms affiliated with KPMG International Limited (“KPMG International”), a private English company limited by guarantee . KPMG International provides no client services . No member firm has any authority to obligate or bind KPMG International or any other member firm vis - à - vis third parties, nor does KPMG International have any such authority to obligate or bind any member firm . All rights reserved . Printed in Korea . Disclaimer
Strictly Private & Confidential © 2023 KPMG Samjong Accounting Corp., a Korea Limited Liability Company and a member firm of the KPMG global organization of independent member firms affiliated with KPMG International Limited, a private English company limited by guarantee. All rights reserved. 2 Interest Bearing Debt IBD K · Enter Holdings, 7 subsidiaries and K · Enter Drama Team Target Initial Public Offering IPO Actual A Thousand k Average Selling Price ASP Last Twelve Months LTM Break - even Point BEP Merchandise; Fandom - targeted items MD Billion Bn Million Mn Compound Annual Growth Rate CAGR Market Capitalization MKT Cap Capital Expenditure CapEx Non - operating Assets NOA Cost of Goods Sold COGS Net Operating Profit Less Adjusted Less Adjusted Tax NOPLAT Consolidated or Consolidation Consol. Net Working Capital NWC Computer Graphics CG Over the Top; Service providing various types of media contents OTT Consumer Price Index CPI Profit Before Tax PBT Depreciation and Amortization D&A Present Value PV Discounted Cash Flow DCF Print & Advertising Expenses P&A Estimated E Selling, General, and Administrative Expenses SG&A Earnings Before Interest and Tax EBIT Trillion Tn Earnings Before Interest, Tax, Depreciation, and Amortization EBITDA Year on Year YoY Enterprise Value EV Weighted Average Cost of Capital WACC Free Cash Flow to Firm FCFF Visual Effects VFX Fiscal Year FY Glossary
Contents Strictly Private & Confidential 004 Executive Summary I. 005 Valuation Summary 007 DCF Result 026 Multiple Analysis 035 Business Plan Analysis II. 036 Play Company 054 The Lamp 068 Bidangil Pictures 082 Apeitda 096 First Virtual Lab 110 Studio Anseillen 124 Solaire Partners 137 K · Enter Drama Team
Strictly Private & Confidential I. Executive Summary

Strictly Private & Confidential Valuation Summary
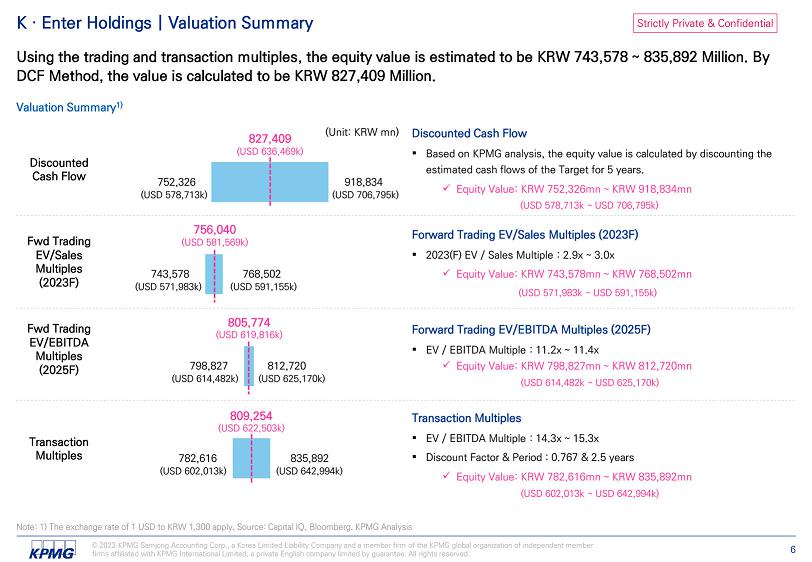
© 2023 KPMG Samjong Accounting Corp., a Korea Limited Liability Company and a member firm of the KPMG global organization of independent member firms affiliated with KPMG International Limited, a private English company limited by guarantee. All rights reserved. Strictly Private & Confidential 6 K · Enter Holdings | Valuation Summary Using the trading and transaction multiples, the equity value is estimated to be KRW 743,578 ~ 835,892 Million. By DCF Method, the value is calculated to be KRW 827,409 Million. Valuation Summary 1) Note: 1) The exchange rate of 1 USD to KRW 1,300 apply, Source: Capital IQ, Bloomberg, KPMG Analysis 782,616 (USD 602,013k) 798,827 (USD 614,482k) 743,578 (USD 571,983k) 752,326 (USD 578,713k) 835,892 (USD 642,994k) 812,720 (USD 625,170k) 768,502 (USD 591,155k) 918,834 (USD 706,795k) Discounted Cash Flow ▪ Based on KPMG analysis, the equity value is calculated by discounting the estimated cash flows of the Target for 5 years. x Equity Value: KRW 752,326mn ~ KRW 918,834mn (USD 578,713k ~ USD 706,795k) Discounted Cash Flow (Unit: KRW mn) Transaction Multiples ▪ EV / EBITDA Multiple : 14.3x ~ 15.3x ▪ Discount Factor & Period : 0.767 & 2.5 years x Equity Value: KRW 782,616mn ~ KRW 835,892mn (USD 602,013k ~ USD 642,994k) Transaction Multiples Fwd Trading EV/EBITDA Multiples (2025F) 827,409 (USD 636,469k) 809,254 (USD 622,503k) 805,774 (USD 619,816k) Forward Trading EV/EBITDA Multiples (2025F) ▪ EV / EBITDA Multiple : 11.2x ~ 11.4x x Equity Value: KRW 798,827mn ~ KRW 812,720mn (USD 614,482k ~ USD 625,170k) Fwd Trading EV/Sales Multiples (2023F) 756,040 (USD 581,569k) Forward Trading EV/Sales Multiples (2023F) ▪ 2023(F) EV / Sales Multiple : 2.9x ~ 3.0x x Equity Value: KRW 743,578mn ~ KRW 768,502mn (USD 571,983k ~ USD 591,155k)
Strictly Private & Confidential DCF Result
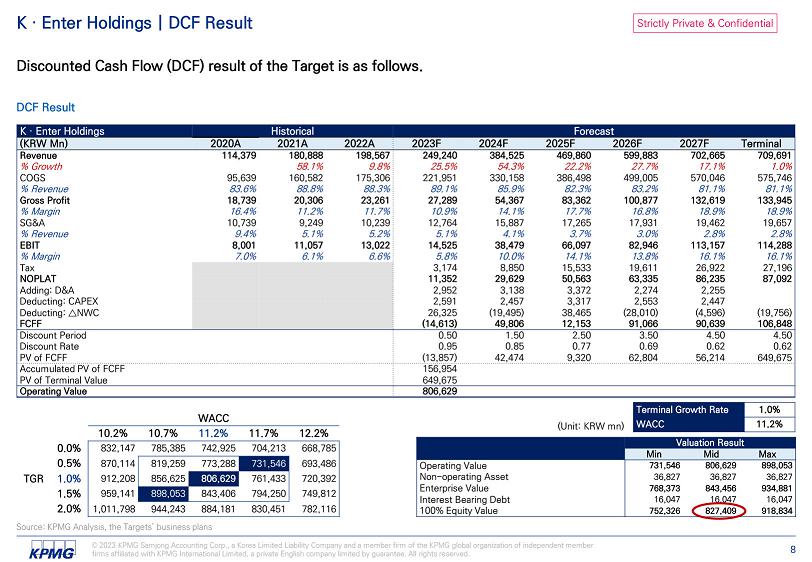
Strictly Private & Confidential K · Enter Holdings | DCF Result Discounted Cash Flow (DCF) result of the Target is as follows. DCF Result Forecast Historical K · Enter Holdings Terminal 2027F 2026F 2025F 2024F 2023F 2022A 2021A 2020A (KRW Mn) 709,691 702,665 599,883 469,860 384,525 249,240 198,567 180,888 114,379 Revenue 1.0% 17.1% 27.7% 22.2% 54.3% 25.5% 9.8% 58.1% % Growth 575,746 570,046 499,005 386,498 330,158 221,951 175,306 160,582 95,639 COGS 81.1% 81.1% 83.2% 82.3% 85.9% 89.1% 88.3% 88.8% 83.6% % Revenue 133,945 132,619 100,877 83,362 54,367 27,289 23,261 20,306 18,739 Gross Profit 18.9% 18.9% 16.8% 17.7% 14.1% 10.9% 11.7% 11.2% 16.4% % Margin 19,657 19,462 17,931 17,265 15,887 12,764 10,239 9,249 10,739 SG&A 2.8% 2.8% 3.0% 3.7% 4.1% 5.1% 5.2% 5.1% 9.4% % Revenue 114,288 113,157 82,946 66,097 38,479 14,525 13,022 11,057 8,001 EBIT 16.1% 16.1% 13.8% 14.1% 10.0% 5.8% 6.6% 6.1% 7.0% % Margin 27,196 26,922 19,611 15,533 8,850 3,174 Tax 87,092 86,235 63,335 50,563 29,629 11,352 NOPLAT 2,255 2,274 3,372 3,138 2,952 Adding: D&A 2,447 2,553 3,317 2,457 2,591 Deducting: CAPEX (19,756) (4,596) (28,010) 38,465 (19,495) 26,325 Deducting: ټ NWC 106,848 90,639 91,066 12,153 49,806 (14,613) FCFF 4.50 4.50 3.50 2.50 1.50 0.50 Discount Period 0.62 0.62 0.69 0.77 0.85 0.95 Discount Rate 649,675 56,214 62,804 9,320 42,474 (13,857) PV of FCFF 156,954 Accumulated PV of FCFF 649,675 PV of Terminal Value 806,629 Operating Value 731,546 773,288 819,259 761,433 806,629 856,625 794,250 843,406 898,053 12.2% 11.7% 11.2% 10.7% 10.2% 668,785 704,213 742,925 785,385 832,147 693,486 870,114 720,392 912,208 749,812 959,141 782,116 830,451 884,181 944,243 1,011,798 WACC 0.0% 0.5% 1.0% TGR 1.5% 2.0% 1.0% Terminal Growth Rate 11.2% WACC Valuation Result Max Mid Min 898,053 806,629 731,546 Operating Value 36,827 36,827 36,827 Non - operating Asset 934,881 843,456 768,373 Enterprise Value 16,047 16,047 16,047 Interest Bearing Debt 918,834 827,409 752,326 100% Equity Value (Unit: KRW mn) Source: KPMG Analysis, the Targets’ business plans © 2023 KPMG Samjong Accounting Corp., a Korea Limited Liability Company and a member firm of the KPMG global organization of independent member firms affiliated with KPMG International Limited, a private English company limited by guarantee. All rights reserved. 8
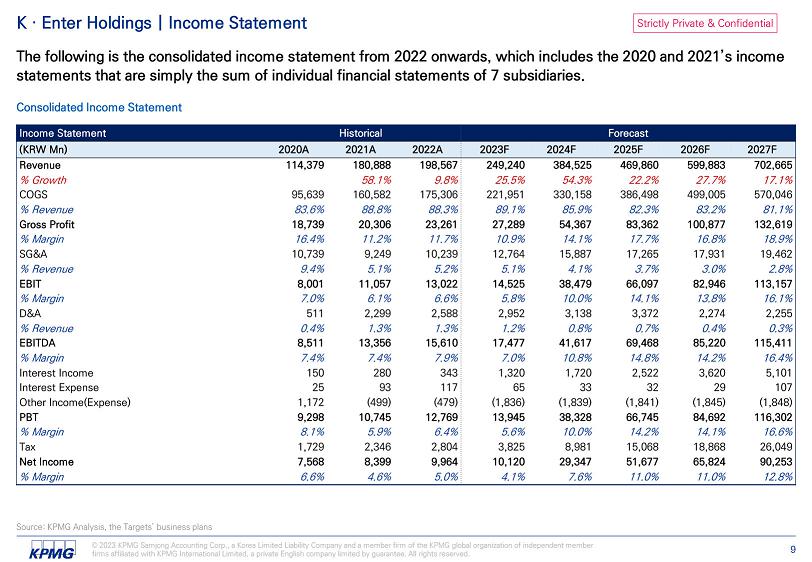
Strictly Private & Confidential Source: KPMG Analysis, the Targets’ business plans © 2023 KPMG Samjong Accounting Corp., a Korea Limited Liability Company and a member firm of the KPMG global organization of independent member firms affiliated with KPMG International Limited, a private English company limited by guarantee. All rights reserved. 9 K · Enter Holdings | Income Statement The following is the consolidated income statement from 2022 onwards, which includes the 2020 and 2021’s income statements that are simply the sum of individual financial statements of 7 subsidiaries. Consolidated Income Statement Forecast Historical Income Statement 2027F 2026F 2025F 2024F 2023F 2022A 2021A 2020A (KRW Mn) 702,665 599,883 469,860 384,525 249,240 198,567 180,888 114,379 Revenue 17.1% 27.7% 22.2% 54.3% 25.5% 9.8% 58.1% % Growth 570,046 499,005 386,498 330,158 221,951 175,306 160,582 95,639 COGS 81.1% 83.2% 82.3% 85.9% 89.1% 88.3% 88.8% 83.6% % Revenue 132,619 100,877 83,362 54,367 27,289 23,261 20,306 18,739 Gross Profit 18.9% 16.8% 17.7% 14.1% 10.9% 11.7% 11.2% 16.4% % Margin 19,462 17,931 17,265 15,887 12,764 10,239 9,249 10,739 SG&A 2.8% 3.0% 3.7% 4.1% 5.1% 5.2% 5.1% 9.4% % Revenue 113,157 82,946 66,097 38,479 14,525 13,022 11,057 8,001 EBIT 16.1% 13.8% 14.1% 10.0% 5.8% 6.6% 6.1% 7.0% % Margin 2,255 2,274 3,372 3,138 2,952 2,588 2,299 511 D&A 0.3% 0.4% 0.7% 0.8% 1.2% 1.3% 1.3% 0.4% % Revenue 115,411 85,220 69,468 41,617 17,477 15,610 13,356 8,511 EBITDA 16.4% 14.2% 14.8% 10.8% 7.0% 7.9% 7.4% 7.4% % Margin 5,101 3,620 2,522 1,720 1,320 343 280 150 Interest Income 107 29 32 33 65 117 93 25 Interest Expense (1,848) (1,845) (1,841) (1,839) (1,836) (479) (499) 1,172 Other Income(Expense) 116,302 84,692 66,745 38,328 13,945 12,769 10,745 9,298 PBT 16.6% 14.1% 14.2% 10.0% 5.6% 6.4% 5.9% 8.1% % Margin 26,049 18,868 15,068 8,981 3,825 2,804 2,346 1,729 Tax 90,253 65,824 51,677 29,347 10,120 9,964 8,399 7,568 Net Income 12.8% 11.0% 11.0% 7.6% 4.1% 5.0% 4.6% 6.6% % Margin

Strictly Private & Confidential Note: 1) The exchange rate of 1 USD to KRW 1,300 apply. Source: KPMG Analysis, the Target’s business plan © 2023 KPMG Samjong Accounting Corp., a Korea Limited Liability Company and a member firm of the KPMG global organization of independent member firms affiliated with KPMG International Limited, a private English company limited by guarantee. All rights reserved. 10 K · Enter Holdings | Income Statement in USD The following is the consolidated income statement from 2022 onwards, which includes the 2020 and 2021’s income statements that are simply the sum of individual financial statements of 7 subsidiaries in USD. Consolidated Income Statement in USD Forecast Historical Income Statement 2027F 2026F 2025F 2024F 2023F 2022A 2021A 2020A (USD k) 540,511 461,448 361,431 295,788 191,723 152,744 139,144 87,984 Revenue 17.1% 27.7% 22.2% 54.3% 25.5% 9.8% 58.1% % Growth 438,497 383,850 297,306 253,968 170,732 134,851 123,525 73,569 COGS 81.1% 83.2% 82.3% 85.9% 89.1% 88.3% 88.8% 83.6% % Revenue 102,014 77,598 64,125 41,821 20,991 17,893 15,620 14,415 Gross Profit 18.9% 16.8% 17.7% 14.1% 10.9% 11.7% 11.2% 16.4% % Margin 14,971 13,793 13,281 12,221 9,818 7,876 7,115 8,261 SG&A 2.8% 3.0% 3.7% 4.1% 5.1% 5.2% 5.1% 9.4% % Revenue 87,043 63,805 50,844 29,600 11,173 10,017 8,505 6,154 EBIT 16.1% 13.8% 14.1% 10.0% 5.8% 6.6% 6.1% 7.0% % Margin 1,734 1,749 2,594 2,414 2,270 1,991 1,769 393 D&A 0.3% 0.4% 0.7% 0.8% 1.2% 1.3% 1.3% 0.4% % Revenue 88,778 65,554 53,437 32,013 13,444 12,008 10,274 6,547 EBITDA 16.4% 14.2% 14.8% 10.8% 7.0% 7.9% 7.4% 7.4% % Margin 3,924 2,784 1,940 1,323 1,016 264 216 116 Interest Income 82 22 24 25 50 90 71 19 Interest Expense (1,422) (1,419) (1,416) (1,414) (1,412) (369) (384) 901 Other Income(Expense) 89,463 65,148 51,343 29,483 10,727 9,822 8,266 7,152 PBT 16.6% 14.1% 14.2% 10.0% 5.6% 6.4% 5.9% 8.1% % Margin 20,038 14,514 11,591 6,909 2,943 2,157 1,805 1,330 Tax 69,425 50,634 39,752 22,574 7,784 7,665 6,461 5,822 Net Income 12.8% 11.0% 11.0% 7.6% 4.1% 5.0% 4.6% 6.6% % Margin
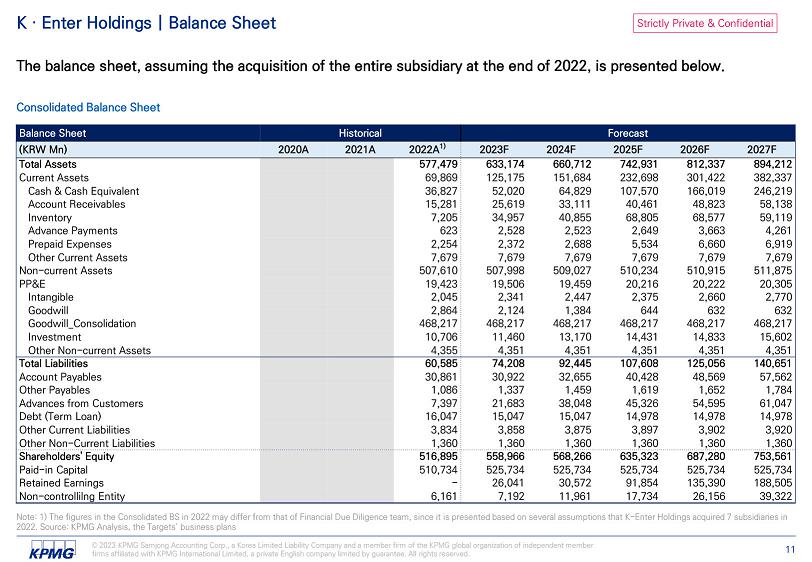
Strictly Private & Confidential Note: 1) The figures in the Consolidated BS in 2022 may differ from that of Financial Due Diligence team, since it is presented based on several assumptions that K - Enter Holdings acquired 7 subsidiaries in 2022. Source: KPMG Analysis, the Targets’ business plans © 2023 KPMG Samjong Accounting Corp., a Korea Limited Liability Company and a member firm of the KPMG global organization of independent member firms affiliated with KPMG International Limited, a private English company limited by guarantee. All rights reserved. 11 K · Enter Holdings | Balance Sheet The balance sheet, assuming the acquisition of the entire subsidiary at the end of 2022, is presented below. Consolidated Balance Sheet Forecast Historical Balance Sheet 2027F 2026F 2025F 2024F 2023F 2022A 1) 2021A 2020A (KRW Mn) 894,212 812,337 742,931 660,712 633,174 577,479 Total Assets 382,337 301,422 232,698 151,684 125,175 69,869 Current Assets 246,219 166,019 107,570 64,829 52,020 36,827 Cash & Cash Equivalent 58,138 48,823 40,461 33,111 25,619 15,281 Account Receivables 59,119 68,577 68,805 40,855 34,957 7,205 Inventory 4,261 3,663 2,649 2,523 2,528 623 Advance Payments 6,919 6,660 5,534 2,688 2,372 2,254 Prepaid Expenses 7,679 7,679 7,679 7,679 7,679 7,679 Other Current Assets 511,875 510,915 510,234 509,027 507,998 507,610 Non - current Assets 20,305 20,222 20,216 19,459 19,506 19,423 PP&E 2,770 2,660 2,375 2,447 2,341 2,045 Intangible 632 632 644 1,384 2,124 2,864 Goodwill 468,217 468,217 468,217 468,217 468,217 468,217 Goodwill_Consolidation 15,602 14,833 14,431 13,170 11,460 10,706 Investment 4,351 4,351 4,351 4,351 4,351 4,355 Other Non - current Assets 140,651 125,056 107,608 92,445 74,208 60,585 Total Liabilities 57,562 48,569 40,428 32,655 30,922 30,861 Account Payables 1,784 1,652 1,619 1,459 1,337 1,086 Other Payables 61,047 54,595 45,326 38,048 21,683 7,397 Advances from Customers 14,978 14,978 14,978 15,047 15,047 16,047 Debt (Term Loan) 3,920 3,902 3,897 3,875 3,858 3,834 Other Current Liabilities 1,360 1,360 1,360 1,360 1,360 1,360 Other Non - Current Liabilities 753,561 687,280 635,323 568,266 558,966 516,895 Shareholders' Equity 525,734 525,734 525,734 525,734 525,734 510,734 Paid - in Capital 188,505 135,390 91,854 30,572 26,041 - Retained Earnings 39,322 26,156 17,734 11,961 7,192 6,161 Non - controllilng Entity
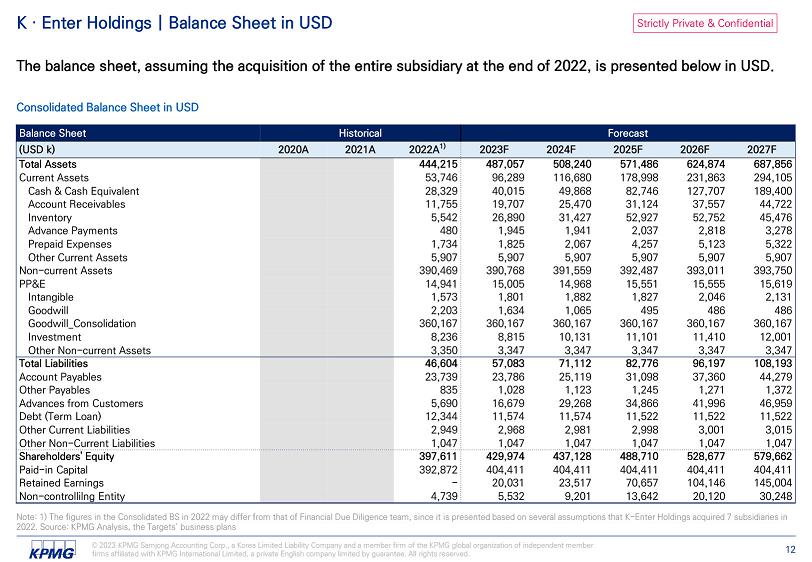
Strictly Private & Confidential Note: 1) The figures in the Consolidated BS in 2022 may differ from that of Financial Due Diligence team, since it is presented based on several assumptions that K - Enter Holdings acquired 7 subsidiaries in 2022. Source: KPMG Analysis, the Targets’ business plans © 2023 KPMG Samjong Accounting Corp., a Korea Limited Liability Company and a member firm of the KPMG global organization of independent member firms affiliated with KPMG International Limited, a private English company limited by guarantee. All rights reserved. 12 K · Enter Holdings | Balance Sheet in USD The balance sheet, assuming the acquisition of the entire subsidiary at the end of 2022, is presented below in USD. Consolidated Balance Sheet in USD Forecast Historical Balance Sheet 2027F 2026F 2025F 2024F 2023F 2022A 1) 2021A 2020A (USD k) 687,856 624,874 571,486 508,240 487,057 444,215 Total Assets 294,105 231,863 178,998 116,680 96,289 53,746 Current Assets 189,400 127,707 82,746 49,868 40,015 28,329 Cash & Cash Equivalent 44,722 37,557 31,124 25,470 19,707 11,755 Account Receivables 45,476 52,752 52,927 31,427 26,890 5,542 Inventory 3,278 2,818 2,037 1,941 1,945 480 Advance Payments 5,322 5,123 4,257 2,067 1,825 1,734 Prepaid Expenses 5,907 5,907 5,907 5,907 5,907 5,907 Other Current Assets 393,750 393,011 392,487 391,559 390,768 390,469 Non - current Assets 15,619 15,555 15,551 14,968 15,005 14,941 PP&E 2,131 2,046 1,827 1,882 1,801 1,573 Intangible 486 486 495 1,065 1,634 2,203 Goodwill 360,167 360,167 360,167 360,167 360,167 360,167 Goodwill_Consolidation 12,001 11,410 11,101 10,131 8,815 8,236 Investment 3,347 3,347 3,347 3,347 3,347 3,350 Other Non - current Assets 108,193 96,197 82,776 71,112 57,083 46,604 Total Liabilities 44,279 37,360 31,098 25,119 23,786 23,739 Account Payables 1,372 1,271 1,245 1,123 1,028 835 Other Payables 46,959 41,996 34,866 29,268 16,679 5,690 Advances from Customers 11,522 11,522 11,522 11,574 11,574 12,344 Debt (Term Loan) 3,015 3,001 2,998 2,981 2,968 2,949 Other Current Liabilities 1,047 1,047 1,047 1,047 1,047 1,047 Other Non - Current Liabilities 579,662 528,677 488,710 437,128 429,974 397,611 Shareholders' Equity 404,411 404,411 404,411 404,411 404,411 392,872 Paid - in Capital 145,004 104,146 70,657 23,517 20,031 - Retained Earnings 30,248 20,120 13,642 9,201 5,532 4,739 Non - controllilng Entity
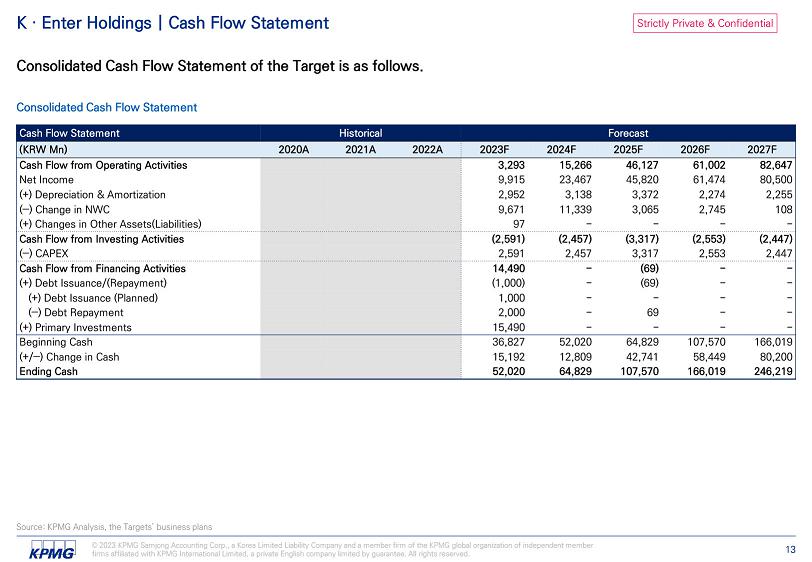
Strictly Private & Confidential Source: KPMG Analysis, the Targets’ business plans © 2023 KPMG Samjong Accounting Corp., a Korea Limited Liability Company and a member firm of the KPMG global organization of independent member firms affiliated with KPMG International Limited, a private English company limited by guarantee. All rights reserved. 13 K · Enter Holdings | Cash Flow Statement Consolidated Cash Flow Statement of the Target is as follows. Consolidated Cash Flow Statement Forecast Historical Cash Flow Statement 2027F 2026F 2025F 2024F 2023F 2022A 2021A 2020A (KRW Mn) 82,647 61,002 46,127 15,266 3,293 Cash Flow from Operating Activities 80,500 61,474 45,820 23,467 9,915 Net Income 2,255 2,274 3,372 3,138 2,952 (+) Depreciation & Amortization 108 2,745 3,065 11,339 9,671 (‒) Change in NWC - - - - 97 (+) Changes in Other Assets(Liabilities) (2,447) (2,553) (3,317) (2,457) (2,591) Cash Flow from Investing Activities 2,447 2,553 3,317 2,457 2,591 (‒) CAPEX - - (69) - 14,490 Cash Flow from Financing Activities - - (69) - (1,000) (+) Debt Issuance/(Repayment) - - - - 1,000 (+) Debt Issuance (Planned) - - 69 - 2,000 (‒) Debt Repayment - - - - 15,490 (+) Primary Investments 166,019 107,570 64,829 52,020 36,827 Beginning Cash 80,200 58,449 42,741 12,809 15,192 (+/‒) Change in Cash 246,219 166,019 107,570 64,829 52,020 Ending Cash
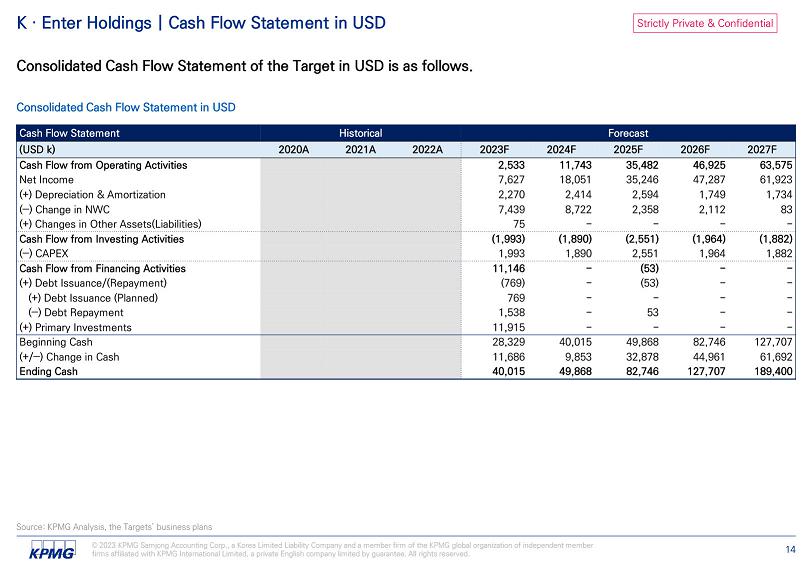
Strictly Private & Confidential Source: KPMG Analysis, the Targets’ business plans © 2023 KPMG Samjong Accounting Corp., a Korea Limited Liability Company and a member firm of the KPMG global organization of independent member firms affiliated with KPMG International Limited, a private English company limited by guarantee. All rights reserved. 14 K · Enter Holdings | Cash Flow Statement in USD Consolidated Cash Flow Statement of the Target in USD is as follows. Consolidated Cash Flow Statement in USD Forecast Historical Cash Flow Statement 2027F 2026F 2025F 2024F 2023F 2022A 2021A 2020A (USD k) 63,575 46,925 35,482 11,743 2,533 Cash Flow from Operating Activities 61,923 47,287 35,246 18,051 7,627 Net Income 1,734 1,749 2,594 2,414 2,270 (+) Depreciation & Amortization 83 2,112 2,358 8,722 7,439 (‒) Change in NWC - - - - 75 (+) Changes in Other Assets(Liabilities) (1,882) (1,964) (2,551) (1,890) (1,993) Cash Flow from Investing Activities 1,882 1,964 2,551 1,890 1,993 (‒) CAPEX - - (53) - 11,146 Cash Flow from Financing Activities - - (53) - (769) (+) Debt Issuance/(Repayment) - - - - 769 (+) Debt Issuance (Planned) - - 53 - 1,538 (‒) Debt Repayment - - - - 11,915 (+) Primary Investments 127,707 82,746 49,868 40,015 28,329 Beginning Cash 61,692 44,961 32,878 9,853 11,686 (+/‒) Change in Cash 189,400 127,707 82,746 49,868 40,015 Ending Cash

Strictly Private & Confidential K · Enter Holdings | Revenue Breakdown Revenue breakdown by business sector of the Target is as follows. 169,053 166,937 204,058 242,198 283,726 12,490 28,074 34,814 43,206 54,592 61,938 132,443 182,183 257,488 301,753 2,981 5,218 6,039 6,516 6,605 2,779 51,853 42,766 50,473 55,990 249,240 384,525 469,860 599,883 702,665 2023E 2024E 2025E 2026E 2027E Revenue Breakdown by Business Sector Synergy Investment Production CG/VFX MD (Unit: KRW mn) Investment Production CG/VFX MD Synergy 2023 - 2027 CAGR 29.6% Source: KPMG Analysis, the Targets’ business plans © 2023 KPMG Samjong Accounting Corp., a Korea Limited Liability Company and a member firm of the KPMG global organization of independent member firms affiliated with KPMG International Limited, a private English company limited by guarantee. All rights reserved. 15
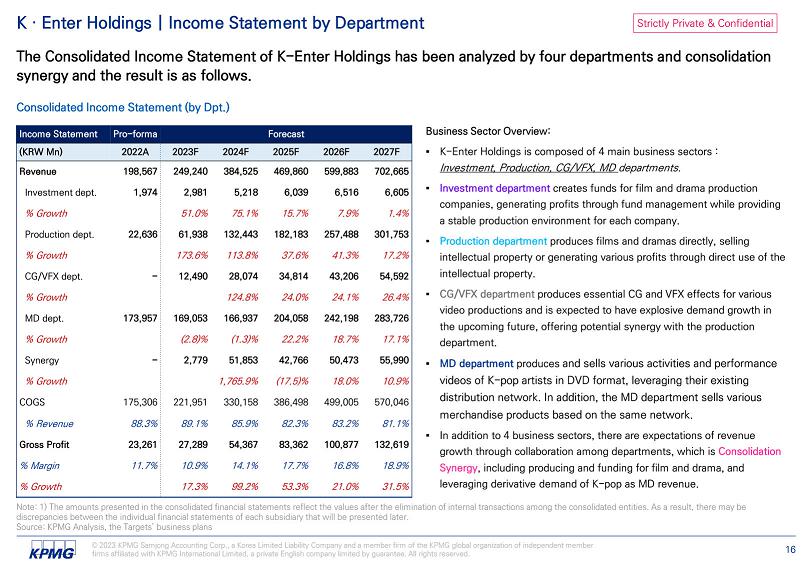
Strictly Private & Confidential ▪ Investment department creates funds for film and drama production companies, generating profits through fund management while providing a stable production environment for each company. ▪ Production department produces films and dramas directly, selling intellectual property or generating various profits through direct use of the intellectual property. ▪ CG/VFX department produces essential CG and VFX effects for various video productions and is expected to have explosive demand growth in the upcoming future, offering potential synergy with the production department. and sells various activities and performance videos of K - pop artists in DVD format, leveraging their existing distribution network. In addition, the MD department sells various merchandise products based on the same network. ▪ In addition to 4 business sectors, there are expectations of revenue growth through collaboration among departments, which is Consolidation Synergy , including producing and funding for film and drama, and leveraging derivative demand of K - pop as MD revenue. Note: 1) The amounts presented in the consolidated financial statements reflect the values after the elimination of internal transactions among the consolidated entities. As a result, there may be discrepancies between the individual financial statements of each subsidiary that will be presented later. Source: KPMG Analysis, the Targets’ business plans © 2023 KPMG Samjong Accounting Corp., a Korea Limited Liability Company and a member firm of the KPMG global organization of independent member firms affiliated with KPMG International Limited, a private English company limited by guarantee. All rights reserved. 16 K · Enter Holdings | Income Statement by Department The Consolidated Income Statement of K - Enter Holdings has been analyzed by four departments and consolidation synergy and the result is as follows. Consolidated Income Statement (by Dpt.) Forecast Pro - forma Income Statement 2027F 2026F 2025F 2024F 2023F 2022A (KRW Mn) 702,665 599,883 469,860 384,525 249,240 198,567 Revenue 6,605 6,516 6,039 5,218 2,981 1,974 Investment dept. 1.4% 7.9% 15.7% 75.1% 51.0% % Growth 301,753 257,488 182,183 132,443 61,938 22,636 Production dept. 17.2% 41.3% 37.6% 113.8% 173.6% % Growth 54,592 43,206 34,814 28,074 12,490 - CG/VFX dept. 26.4% 24.1% 24.0% 124.8% % Growth 283,726 242,198 204,058 166,937 169,053 173,957 MD dept. 17.1% 18.7% 22.2% (1.3)% (2.8)% % Growth 55,990 50,473 42,766 51,853 2,779 - Synergy 10.9% 18.0% (17.5)% 1,765.9% % Growth 570,046 499,005 386,498 330,158 221,951 175,306 COGS 81.1% 83.2% 82.3% 85.9% 89.1% 88.3% % Revenue 132,619 100,877 83,362 54,367 27,289 23,261 Gross Profit 18.9% 16.8% 17.7% 14.1% 10.9% 11.7% % Margin 31.5% 21.0% 53.3% 99.2% 17.3% % Growth

Strictly Private & Confidential K · Enter Holdings | Income Statement by Department (Continued) Forecast Pro - forma Income Statement 2027F 2026F 2025F 2024F 2023F 2022A (KRW Mn) 132,619 100,877 83,362 54,367 27,289 23,261 Gross Profit 18.9% 16.8% 17.7% 14.1% 10.9% 11.7% % Margin 31.5% 21.0% 53.3% 99.2% 17.3% % Growth 6,605 6,516 6,039 5,218 2,981 1,974 Investment dept. 1.4% 7.9% 15.7% 75.1% 51.0% % Growth 58,002 41,740 31,648 9,287 2,188 3,143 Production dept. 39.0% 31.9% 240.8% 324.4% (30.4)% % Growth 10,092 8,483 7,665 8,081 4,599 - CG/VFX dept. 19.0% 10.7% (5.1)% 75.7% % Growth 44,002 37,701 30,454 23,124 17,242 18,143 MD dept. 16.7% 23.8% 31.7% 34.1% (5.0)% % Growth 13,918 6,437 7,556 8,657 280 - Synergy 116.2% (14.8)% (12.7)% 2996.4% % Growth 19,462 17,931 17,265 15,887 12,764 10,239 SG&A 2.8% 3.0% 3.7% 4.1% 5.1% 5.2% % Revenue 113,157 82,946 66,097 38,479 14,525 13,022 EBIT 16.1% 13.8% 14.1% 10.0% 5.8% 6.6% % Margin 115,411 85,220 69,468 41,617 17,477 15,610 EBITDA 16.4% 14.2% 14.8% 10.8% 7.0% 7.9% % Margin The Consolidated Income Statement of K - Enter Holdings has been analyzed by four departments and consolidation synergy and the result is as follows. Consolidated Income Statement (by Dpt.) ▪ It is anticipated that K - Entertainment Holdings' revenue will increase at a CAGR of 28.8% over the next five years, driven by the increase in demand for K - pop, K - dramas, and movies. ▪ In 2023, MD sales will account for 67.8% of total revenue, whereas in 2027 it will only account for 40.4%. This is due to the explosive growth in revenue from production and synergy after 2023, which will account for 50.9% of the total in 2027. ▪ According to the consolidated financial statements, EBIT is expected to grow at a CAGR of 54.1% over the next five years from 2022 to 2027, with an estimated increase from KRW 13.0 billion in 2022 to KRW 113.2 billion in 2027. ▪ EBITDA is projected to increase at a CAGR of 49.2%, from KRW 15.6 billion in 2022 to KRW 115.4 billion in 2027. Note: 1) The amounts presented in the consolidated financial statements reflect the values after the elimination of internal transactions among the consolidated entities. As a result, there may be discrepancies between the individual financial statements of each subsidiary that will be presented later. Source: KPMG Analysis, the Targets’ business plans © 2023 KPMG Samjong Accounting Corp., a Korea Limited Liability Company and a member firm of the KPMG global organization of independent member firms affiliated with KPMG International Limited, a private English company limited by guarantee. All rights reserved. 17

Strictly Private & Confidential K · Enter Holdings | Investment Department Forecast Pro - forma Income Statement 2027F 2026F 2025F 2024F 2023F 2022A (KRW Mn) 6,605 6,516 6,039 5,218 2,981 1,974 Revenue 1.4% 7.9% 15.7% 75.1% 51.0% % Growth - - - - - - COGS - - - - - - % Revenue 6,605 6,516 6,039 5,218 2,981 1,974 Gross Profit 100.0% 100.0% 100.0% 100.0% 100.0% 100.0% % Margin 1.4% 7.9% 15.7% 75.1% 51.0% % Growth 3,257 3,155 3,061 1,966 1,481 1,680 SG&A 49.3% 48.4% 50.7% 37.7% 49.7% 85.1% % Revenue 3,347 3,362 2,978 3,252 1,499 294 EBIT 50.7% 51.6% 49.3% 62.3% 50.3% 14.9% % Margin 3,349 3,364 2,981 3,255 1,502 297 EBITDA 50.7% 51.6% 49.4% 62.4% 50.4% 15.0% % Margin Investment department comprises Solaire Partners, with an anticipated revenue increase at a CAGR of 27.3% and EBITDA increase at a CAGR of 62.4% for the upcoming five years. Investment Department ▪ The Investment department within K - Enter Holdings comprises Solaire Partners and derives its revenue from earning commissions for managing funds. ▪ Solaire Partners is projected to launch 11 new funds during FY23 and FY27, with 27.3% over the next five years. ▪ Commission rates for fund management services will be based on the Target's past experience, ranging from 1.23% to 2.50% depending on the total investment amount. ▪ The Investment department has no cost of goods sold (COGS) since it solely earns commissions, while salaries are classified as selling, general, and administrative (SG&A) expenses. ▪ The EBIT of the Investment department is expected to increase at a CAGR of approximately 62.6% over 5 years, from KRW 0.3 billion in 2022 to KRW 3.3 billion in 2027, while EBITDA is projected to increase at a CAGR of 62.4%, from KRW 0.3 billion in 2022 to KRW 3.3 billion in 2027. Note: 1) The amounts presented in the consolidated financial statements reflect the values after the elimination of internal transactions among the consolidated entities. As a result, there may be discrepancies between the individual financial statements of each subsidiary that will be presented later. Source: KPMG Analysis, the Targets’ business plans © 2023 KPMG Samjong Accounting Corp., a Korea Limited Liability Company and a member firm of the KPMG global organization of independent member firms affiliated with KPMG International Limited, a private English company limited by guarantee. All rights reserved. 18
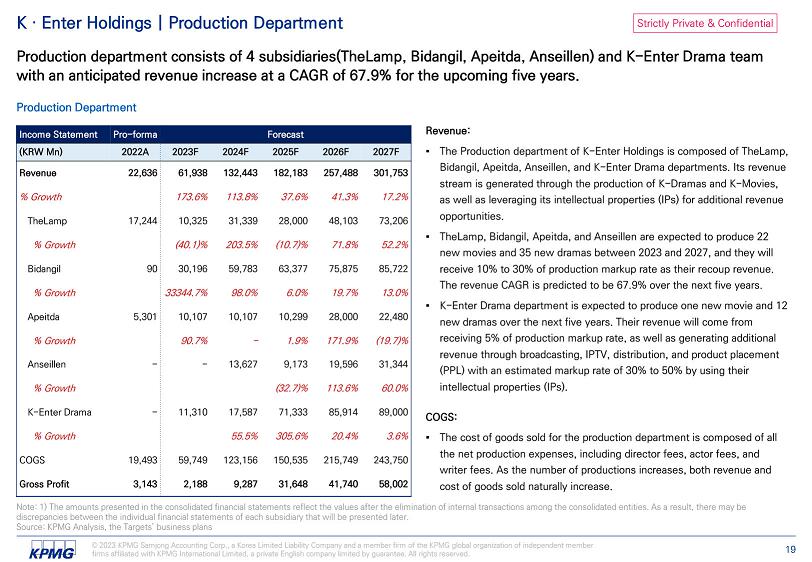
Strictly Private & Confidential K · Enter Holdings | Production Department Forecast Pro - forma Income Statement 2027F 2026F 2025F 2024F 2023F 2022A (KRW Mn) 301,753 257,488 182,183 132,443 61,938 22,636 Revenue 17.2% 41.3% 37.6% 113.8% 173.6% % Growth 73,206 48,103 28,000 31,339 10,325 17,244 TheLamp 52.2% 71.8% (10.7)% 203.5% (40.1)% % Growth 85,722 75,875 63,377 59,783 30,196 90 Bidangil 13.0% 19.7% 6.0% 98.0% 33344.7% % Growth 22,480 28,000 10,299 10,107 10,107 5,301 Apeitda (19.7)% 171.9% 1.9% - 90.7% % Growth 31,344 19,596 9,173 13,627 - - Anseillen 60.0% 113.6% (32.7)% % Growth 89,000 85,914 71,333 17,587 11,310 - K - Enter Drama 3.6% 20.4% 305.6% 55.5% % Growth 243,750 215,749 150,535 123,156 59,749 19,493 COGS 58,002 41,740 31,648 9,287 2,188 3,143 Gross Profit Production department consists of 4 subsidiaries(TheLamp, Bidangil, Apeitda, Anseillen) and K - Enter Drama team with an anticipated revenue increase at a CAGR of 67.9% for the upcoming five years. Production Department ▪ The Production department of K - Enter Holdings is composed of TheLamp, Bidangil, Apeitda, Anseillen, and K - Enter Drama departments. Its revenue stream is generated through the production of K - Dramas and K - Movies, as well as leveraging its intellectual properties (IPs) for additional revenue opportunities. ▪ TheLamp, Bidangil, Apeitda, and Anseillen are expected to produce 22 new movies and 35 new dramas between 2023 and 2027, and they will receive 10% to 30% of production markup rate as their recoup revenue. The revenue CAGR ▪ K - Enter Drama department is expected to produce one new movie and 12 new dramas over the next five years. Their revenue will come from receiving 5% of production markup rate, as well as generating additional revenue through broadcasting, IPTV, distribution, and product placement (PPL) with an estimated markup rate of 30% to 50% by using their intellectual properties (IPs). ▪ The cost of goods sold for the production department is composed of all the net production expenses, including director fees, actor fees, and writer fees. As the number of productions increases, both revenue and cost of goods sold naturally increase. Note: 1) The amounts presented in the consolidated financial statements reflect the values after the elimination of internal transactions among the consolidated entities. As a result, there may be discrepancies between the individual financial statements of each subsidiary that will be presented later. Source: KPMG Analysis, the Targets’ business plans © 2023 KPMG Samjong Accounting Corp., a Korea Limited Liability Company and a member firm of the KPMG global organization of independent member firms affiliated with KPMG International Limited, a private English company limited by guarantee. All rights reserved. 19
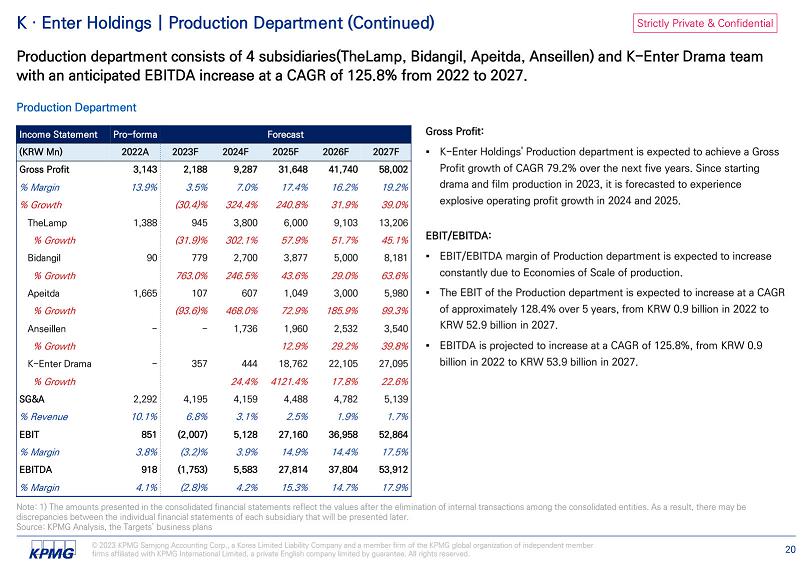
Strictly Private & Confidential K · Enter Holdings | Production Department (Continued) Forecast Pro - forma Income Statement 2027F 2026F 2025F 2024F 2023F 2022A (KRW Mn) 58,002 41,740 31,648 9,287 2,188 3,143 Gross Profit 19.2% 16.2% 17.4% 7.0% 3.5% 13.9% % Margin 39.0% 31.9% 240.8% 324.4% (30.4)% % Growth 13,206 9,103 6,000 3,800 945 1,388 TheLamp 45.1% 51.7% 57.9% 302.1% (31.9)% % Growth 8,181 5,000 3,877 2,700 779 90 Bidangil 63.6% 29.0% 43.6% 246.5% 763.0% % Growth 5,980 3,000 1,049 607 107 1,665 Apeitda 99.3% 185.9% 72.9% 468.0% (93.6)% % Growth 3,540 2,532 1,960 1,736 - - Anseillen 39.8% 29.2% 12.9% % Growth 27,095 22,105 18,762 444 357 - K - Enter Drama 22.6% 17.8% 4121.4% 24.4% % Growth 5,139 4,782 4,488 4,159 4,195 2,292 SG&A 1.7% 1.9% 2.5% 3.1% 6.8% 10.1% % Revenue 52,864 36,958 27,160 5,128 (2,007) 851 EBIT 17.5% 14.4% 14.9% 3.9% (3.2)% 3.8% % Margin 53,912 37,804 27,814 5,583 (1,753) 918 EBITDA 17.9% 14.7% 15.3% 4.2% (2.8)% 4.1% % Margin Production department consists of 4 subsidiaries(TheLamp, Bidangil, Apeitda, Anseillen) and K - Enter Drama team with an anticipated EBITDA increase at a CAGR of 125.8% from 2022 to 2027. Production Department ▪ K - Enter Holdings' Production department is expected to achieve a Gross Profit growth of CAGR 79.2% over the next five years. Since starting drama and film production in 2023, it is forecasted to experience explosive operating profit growth in 2024 and 2025. ▪ EBIT/EBITDA margin of Production department is expected to increase constantly due to Economies of Scale of production. ▪ The EBIT of the Production department is expected to increase at a CAGR of approximately 128.4% over 5 years, from KRW 0.9 billion in 2022 to KRW 52.9 billion in 2027. ▪ EBITDA is projected to increase at a CAGR of 125.8%, from KRW 0.9 billion in 2022 to KRW 53.9 billion in 2027. Note: 1) The amounts presented in the consolidated financial statements reflect the values after the elimination of internal transactions among the consolidated entities. As a result, there may be discrepancies between the individual financial statements of each subsidiary that will be presented later. Source: KPMG Analysis, the Targets’ business plans © 2023 KPMG Samjong Accounting Corp., a Korea Limited Liability Company and a member firm of the KPMG global organization of independent member firms affiliated with KPMG International Limited, a private English company limited by guarantee. All rights reserved. 20

Strictly Private & Confidential K · Enter Holdings | CG/VFX Department Forecast Pro - forma Income Statement 2027F 2026F 2025F 2024F 2023F 2022A (KRW Mn) 54,592 43,206 34,814 28,074 12,490 - Revenue 26.4% 24.1% 24.0% 124.8% % Growth 44,500 34,723 27,149 19,993 7,891 - COGS 81.5% 80.4% 78.0% 71.2% 63.2% % Revenue 10,092 8,483 7,665 8,081 4,599 - Gross Profit 18.5% 19.6% 22.0% 28.8% 36.8% % Margin 19.0% 10.7% (5.1)% 75.7% % Growth 3,602 3,281 2,689 1,839 1,275 728 SG&A 6.6% 7.6% 7.7% 6.6% 10.2% % Revenue 6,490 5,202 4,977 6,242 3,324 (728) EBIT 11.9% 12.0% 14.3% 22.2% 26.6% % Margin 6,490 5,202 4,977 6,242 3,324 (728) EBITDA 11.9% 12.0% 14.3% 22.2% 26.6% % Margin CG/VFX department comprises First Virtual Lab, with an anticipated revenue increase at a CAGR of 44.6% and EBITDA increase at a CAGR of 18.2% between 2023 and 2027. Income Statement (CG/VFX Dpt.) ▪ The CG/VFX department of K - Enter Holdings comprises First Virtual Lab(FVL). The revenue of First Virtual Lab is divided into two categories: CG/VFX and virtual studio construction. ▪ The revenue from CG/VFX is generated through orders from global CG/VFX companies. As the demand for CG continues to rise not only in movies but also in dramas and other video contents, a significant increase in CG/VFX revenue is expected starting from the FY23 Q2. ▪ The revenue from virtual studio construction ▪ According to the consolidated financial statements, EBIT/EBITDA is expected to grow at a CAGR of 18.2% over the next five years from 2023 to 2027, with an estimated increase from KRW 3.3 billion in 2023 to KRW 6.5 billion in 2027. Note: 1) The amounts presented in the consolidated financial statements reflect the values after the elimination of internal transactions among the consolidated entities. As a result, there may be discrepancies between the individual financial statements of each subsidiary that will be presented later. Source: KPMG Analysis, the Targets’ business plans © 2023 KPMG Samjong Accounting Corp., a Korea Limited Liability Company and a member firm of the KPMG global organization of independent member firms affiliated with KPMG International Limited, a private English company limited by guarantee. All rights reserved. 21
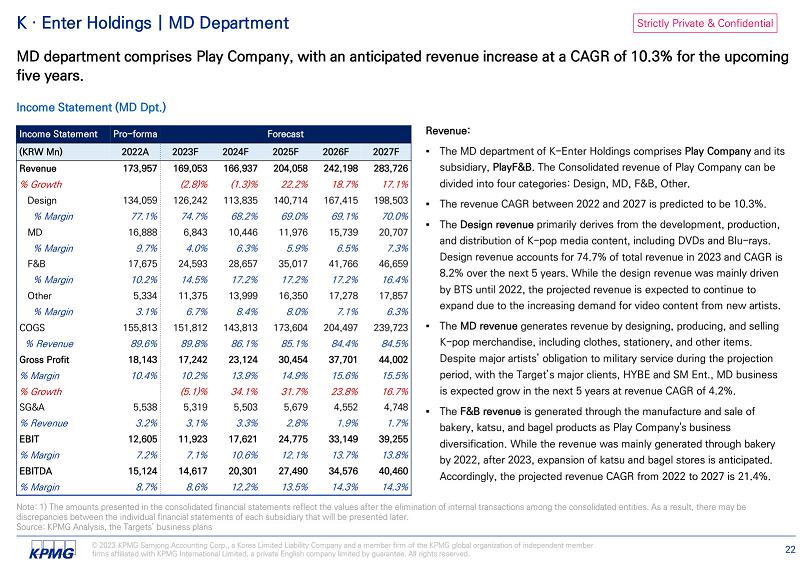
Strictly Private & Confidential MD department comprises Play Company, with an anticipated revenue increase at a CAGR of 10.3% for the upcoming five years. Income Statement (MD Dpt.) ▪ The MD department of K - Enter Holdings comprises Play Company and its subsidiary, PlayF&B. The Consolidated revenue of Play Company can be divided into four categories: Design, MD, F&B, Other. ▪ The Design revenue accounts for 74.7% of total revenue in 2023 and CAGR is 8.2% over the next 5 years. While the design revenue was mainly driven by BTS until 2022, the projected revenue is expected to continue to expand due to the increasing demand for video content from new artists. ▪ The MD revenue generates revenue by designing, producing, and selling K - pop merchandise, including clothes, stationery, and other items ▪ The F&B revenue is generated through the manufacture and sale of bakery, katsu, and bagel products as Play Company's business diversification. While the revenue was mainly generated through bakery by 2022, after 2023, expansion of katsu and bagel stores is anticipated. Accordingly, the projected revenue CAGR from 2022 to 2027 is 21.4%. Note: 1) The amounts presented in the consolidated financial statements reflect the values after the elimination of internal transactions among the consolidated entities. As a result, there may be discrepancies between the individual financial statements of each subsidiary that will be presented later. Source: KPMG Analysis, the Targets’ business plans © 2023 KPMG Samjong Accounting Corp., a Korea Limited Liability Company and a member firm of the KPMG global organization of independent member firms affiliated with KPMG International Limited, a private English company limited by guarantee. All rights reserved. 22 K · Enter Holdings | MD Department Forecast Pro - forma Income Statement 2027F 2026F 2025F 2024F 2023F 2022A (KRW Mn) 283,726 242,198 204,058 166,937 169,053 173,957 Revenue 17.1% 18.7% 22.2% (1.3)% (2.8)% % Growth 198,503 167,415 140,714 113,835 126,242 134,059 Design 70.0% 69.1% 69.0% 68.2% 74.7% 77.1% % Margin 20,707 15,739 11,976 10,446 6,843 16,888 MD 7.3% 6.5% 5.9% 6.3% 4.0% 9.7% % Margin 46,659 41,766 35,017 28,657 24,593 17,675 F&B 16.4% 17.2% 17.2% 17.2% 14.5% 10.2% % Margin 17,857 17,278 16,350 13,999 11,375 5,334 Other 6.3% 7.1% 8.0% 8.4% 6.7% 3.1% % Margin 239,723 204,497 173,604 143,813 151,812 155,813 COGS 84.5% 84.4% 85.1% 86.1% 89.8% 89.6% % Revenue 44,002 37,701 30,454 23,124 17,242 18,143 Gross Profit 15.5% 15.6% 14.9% 13.9% 10.2% 10.4% % Margin 16.7% 23.8% 31.7% 34.1% (5.1)% % Growth 4,748 4,552 5,679 5,503 5,319 5,538 SG&A 1.7% 1.9% 2.8% 3.3% 3.1% 3.2% % Revenue 39,255 33,149 24,775 17,621 11,923 12,605 EBIT 13.8% 13.7% 12.1% 10.6% 7.1% 7.2% % Margin 40,460 34,576 27,490 20,301 14,617 15,124 EBITDA 14.3% 14.3% 13.5% 12.2% 8.6% 8.7% % Margin
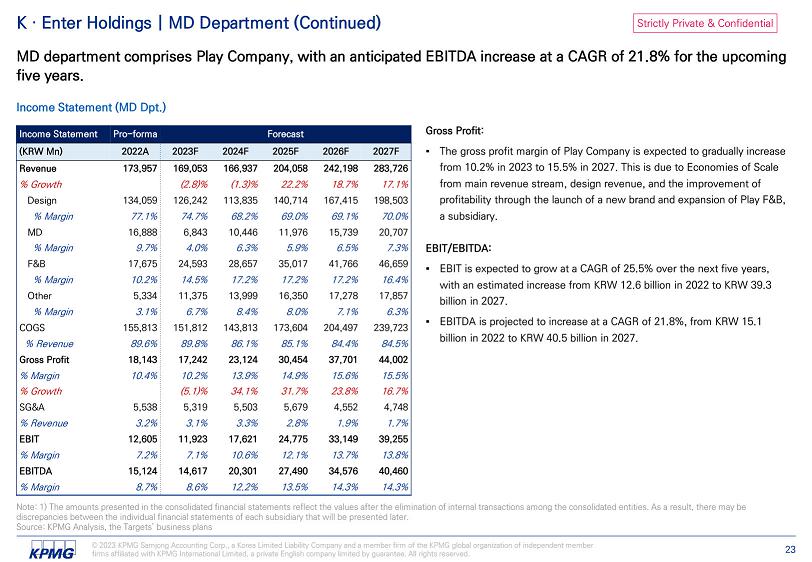
Strictly Private & Confidential K · Enter Holdings | MD Department (Continued) Forecast Pro - forma Income Statement 2027F 2026F 2025F 2024F 2023F 2022A (KRW Mn) 283,726 242,198 204,058 166,937 169,053 173,957 Revenue 17.1% 18.7% 22.2% (1.3)% (2.8)% % Growth 198,503 167,415 140,714 113,835 126,242 134,059 Design 70.0% 69.1% 69.0% 68.2% 74.7% 77.1% % Margin 20,707 15,739 11,976 10,446 6,843 16,888 MD 7.3% 6.5% 5.9% 6.3% 4.0% 9.7% % Margin 46,659 41,766 35,017 28,657 24,593 17,675 F&B 16.4% 17.2% 17.2% 17.2% 14.5% 10.2% % Margin 17,857 17,278 16,350 13,999 11,375 5,334 Other 6.3% 7.1% 8.0% 8.4% 6.7% 3.1% % Margin 239,723 204,497 173,604 143,813 151,812 155,813 COGS 84.5% 84.4% 85.1% 86.1% 89.8% 89.6% % Revenue 44,002 37,701 30,454 23,124 17,242 18,143 Gross Profit 15.5% 15.6% 14.9% 13.9% 10.2% 10.4% % Margin 16.7% 23.8% 31.7% 34.1% (5.1)% % Growth 4,748 4,552 5,679 5,503 5,319 5,538 SG&A 1.7% 1.9% 2.8% 3.3% 3.1% 3.2% % Revenue 39,255 33,149 24,775 17,621 11,923 12,605 EBIT 13.8% 13.7% 12.1% 10.6% 7.1% 7.2% % Margin 40,460 34,576 27,490 20,301 14,617 15,124 EBITDA 14.3% 14.3% 13.5% 12.2% 8.6% 8.7% % Margin MD department comprises Play Company, with an anticipated EBITDA increase at a CAGR of 21.8% for the upcoming five years. Income Statement (MD Dpt.) ▪ The gross profit margin of Play Company is expected to gradually increase from 10.2% in 2023 to 15.5% in 2027. This is due to Economies of Scale from main revenue stream, design revenue, and the improvement of profitability through the launch of a new brand and expansion of Play F&B, a subsidiary. ▪ EBIT is expected to grow at a CAGR of 25 . 5 % over the next five years, with an estimated increase from KRW 12 . 6 billion in 2022 to KRW 39 . 3 billion in 2027 . ▪ EBITDA is projected to increase at a CAGR of 21 . 8 % , from KRW 15 . 1 billion in 2022 to KRW 40 . 5 billion in 2027 . Note: 1) The amounts presented in the consolidated financial statements reflect the values after the elimination of internal transactions among the consolidated entities. As a result, there may be discrepancies between the individual financial statements of each subsidiary that will be presented later. Source: KPMG Analysis, the Targets’ business plans © 2023 KPMG Samjong Accounting Corp., a Korea Limited Liability Company and a member firm of the KPMG global organization of independent member firms affiliated with KPMG International Limited, a private English company limited by guarantee. All rights reserved. 23
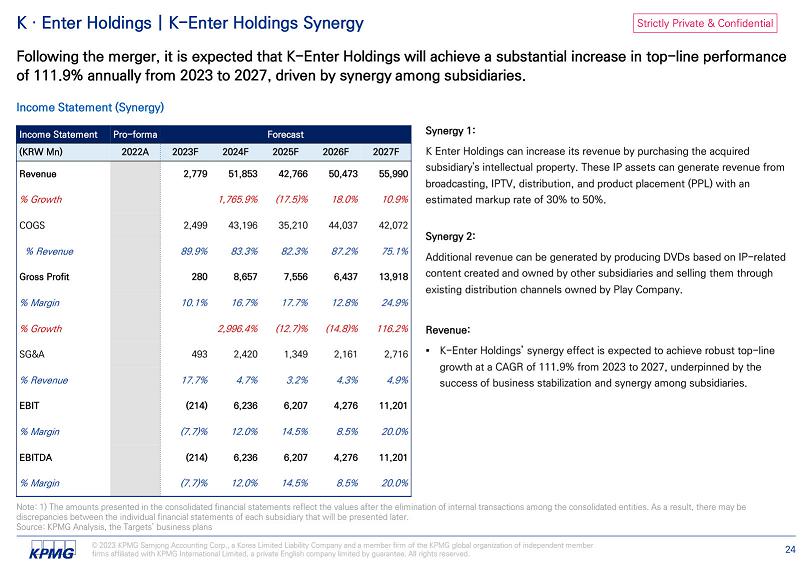
Strictly Private & Confidential K · Enter Holdings | K - Enter Holdings Synergy Forecast Pro - forma Income Statement 2027F 2026F 2025F 2024F 2023F 2022A (KRW Mn) 55,990 50,473 42,766 51,853 2,779 Revenue 10.9% 18.0% (17.5)% 1,765.9% % Growth 42,072 44,037 35,210 43,196 2,499 COGS 75.1% 87.2% 82.3% 83.3% 89.9% % Revenue 13,918 6,437 7,556 8,657 280 Gross Profit 24.9% 12.8% 17.7% 16.7% 10.1% % Margin 116.2% (14.8)% (12.7)% 2,996.4% % Growth 2,716 2,161 1,349 2,420 493 SG&A 4.9% 4.3% 3.2% 4.7% 17.7% % Revenue 11,201 4,276 6,207 6,236 (214) EBIT 20.0% 8.5% 14.5% 12.0% (7.7)% % Margin 11,201 4,276 6,207 6,236 (214) EBITDA 20.0% 8.5% 14.5% 12.0% (7.7)% % Margin Following the merger, it is expected that K - Enter Holdings will achieve a substantial increase in top - line performance of 111.9% annually from 2023 to 2027, driven by synergy among subsidiaries. Income Statement (Synergy) K Enter Holdings can increase its revenue by purchasing the acquired subsidiary's intellectual property. These IP assets can generate revenue from broadcasting, IPTV, distribution, and product placement (PPL) with an estimated markup rate of 30% to 50%. Additional revenue can be generated by producing DVDs based on IP - related content created and owned by other subsidiaries and selling them through existing distribution channels owned by Play Company. ▪ K - Enter Holdings’ synergy effect is expected to achieve robust top - line growth at a CAGR of 111.9% from 2023 to 2027, underpinned by the success of business stabilization and synergy among subsidiaries. Note: 1) The amounts presented in the consolidated financial statements reflect the values after the elimination of internal transactions among the consolidated entities. As a result, there may be discrepancies between the individual financial statements of each subsidiary that will be presented later. Source: KPMG Analysis, the Targets’ business plans © 2023 KPMG Samjong Accounting Corp., a Korea Limited Liability Company and a member firm of the KPMG global organization of independent member firms affiliated with KPMG International Limited, a private English company limited by guarantee. All rights reserved. 24
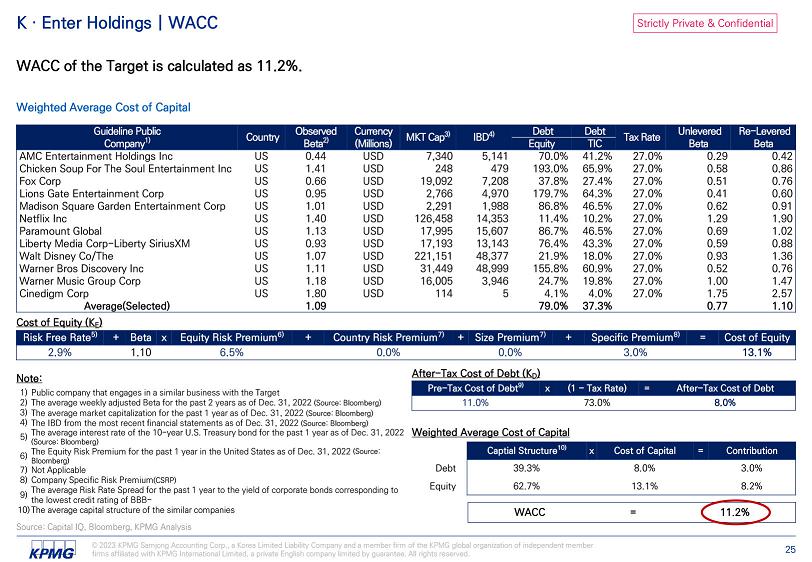
Strictly Private & Confidential K · Enter Holdings | WACC WACC of the Target is calculated as 11.2%. Weighted Average Cost of Capital Re - Levered Beta Unlevered Beta Tax Rate Debt Debt IBD 4) MKT Cap 3) Currency Observed Beta 2) Country Guideline Public TIC Equity (Millions) Company 1) 0.42 0.29 27.0% 41.2% 70.0% 5,141 7,340 USD 0.44 US AMC Entertainment Holdings Inc 0.86 0.58 27.0% 65.9% 193.0% 479 248 USD 1.41 US Chicken Soup For The Soul Entertainment Inc 0.76 0.51 27.0% 27.4% 37.8% 7,208 19,092 USD 0.66 US Fox Corp 0.60 0.41 27.0% 64.3% 179.7% 4,970 2,766 USD 0.95 US Lions Gate Entertainment Corp 0.91 0.62 27.0% 46.5% 86.8% 1,988 2,291 USD 1.01 US Madison Square Garden Entertainment Corp 1.90 1.29 27.0% 10.2% 11.4% 14,353 126,458 USD 1.40 US Netflix Inc 1.02 0.69 27.0% 46.5% 86.7% 15,607 17,995 USD 1.13 US Paramount Global 0.88 0.59 27.0% 43.3% 76.4% 13,143 17,193 USD 0.93 US Liberty Media Corp - Liberty SiriusXM 1.36 0.93 27.0% 18.0% 21.9% 48,377 221,151 USD 1.07 US Walt Disney Co/The 0.76 0.52 27.0% 60.9% 155.8% 48,999 31,449 USD 1.11 US Warner Bros Discovery Inc 1.47 1.00 27.0% 19.8% 24.7% 3,946 16,005 USD 1.18 US Warner Music Group Corp 2.57 1.75 27.0% 4.0% 4.1% 5 114 USD 1.80 US Cinedigm Corp 1.10 0.77 37.3% 79.0% 1.09 Average(Selected) Cost of Equity (K E ) Cost of Equity = Specific Premium 8) + Size Premium 7) + Country Risk Premium 7) + Equity Risk Premium 6) x Beta + Risk Free Rate 5) 13.1% 3.0% 0.0% 0.0% 6.5% 1.10 2.9% After - Tax Cost of Debt (K D ) After - Tax Cost of Debt = (1 - Tax Rate) x Pre - Tax Cost of Debt 9) 8.0% 73.0% 11.0% Weighted Average Cost of Capital Contribution = Cost of Capital x Captial Structure 10) 3.0% 8.0% 39.3% Debt 8.2% 13.1% 62.7% Equity 11.2% = WACC Note: Public company that engages in a similar business with the Target 1) The average weekly adjusted Beta for the past 2 years as of Dec. 31, 2022 (Source: Bloomberg) 2) The average market capitalization for the past 1 year as of Dec. 31, 2022 (Source: Bloomberg) 3) The IBD from the most recent financial statements as of Dec. 31, 2022 (Source: Bloomberg) 4) The average interest rate of the 10 - year U.S. Treasury bond for the past 1 year as of Dec. 31, 2022 (Source: Bloomberg) 5) The Equity Risk Premium for the past 1 year in the United States as of Dec. 31, 2022 (Source: Bloomberg) 6) Not Applicable 7) Company Specific Risk Premium (CSRP) 8) The average Risk Rate Spread for the past 1 year to the yield of corporate bonds corresponding to the lowest credit rating of BBB - 9) The average capital structure of the similar companies 10) Source: Capital IQ, Bloomberg, KPMG Analysis © 2023 KPMG Samjong Accounting Corp., a Korea Limited Liability Company and a member firm of the KPMG global organization of independent member firms affiliated with KPMG International Limited, a private English company limited by guarantee. All rights reserved. 25
Strictly Private & Confidential Multiple Analysis
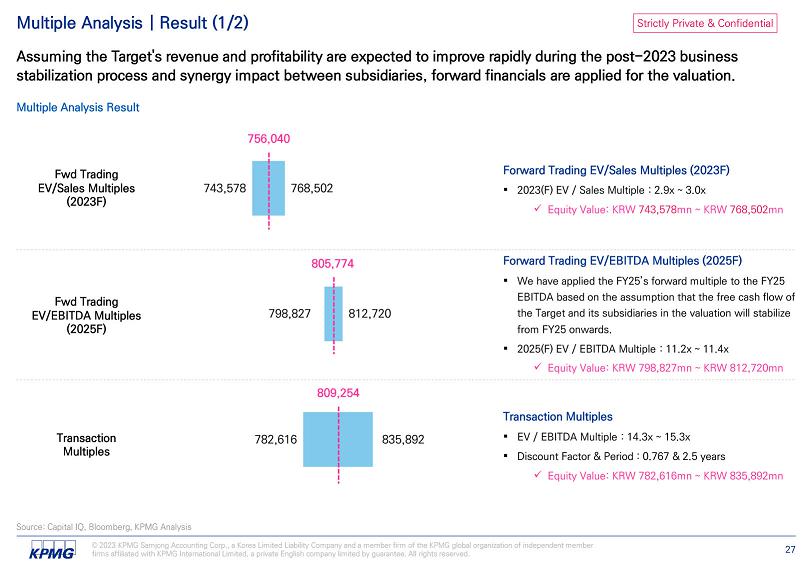
Strictly Private & Confidential 782,616 798,827 743,578 835,892 812,720 768,502 Multiple Analysis | Result (1/2) Source: Capital IQ, Bloomberg, KPMG Analysis Assuming the Target's revenue and profitability are expected to improve rapidly during the post - 2023 business stabilization process and synergy impact between subsidiaries, forward financials are applied for the valuation. Multiple Analysis Result 756,040 Fwd Trading EV/Sales Multiples (2023F) Transaction Multiples Fwd Trading EV/EBITDA Multiples (2025F) 809,254 805,774 Transaction Multiples ▪ EV / EBITDA Multiple : 14.3x ~ 15.3x ▪ Discount Factor & Period : 0.767 & 2.5 years x Equity Value: KRW 782,616mn ~ KRW 835,892mn Forward Trading EV/EBITDA Multiples (2025F) ▪ We have applied the FY25’s forward multiple to the FY25 EBITDA based on the assumption that the free cash flow of the Target and its subsidiaries in the valuation will stabilize from FY25 onwards. ▪ 2025(F) EV / EBITDA Multiple : 11.2x ~ 11.4x x Equity Value: KRW 798,827mn ~ KRW 812,720mn Forward Trading EV/Sales Multiples (2023F) ▪ 2023(F) EV / Sales Multiple : 2.9x ~ 3.0x x Equity Value: KRW 743,578 mn ~ KRW 768,502 mn © 2023 KPMG Samjong Accounting Corp., a Korea Limited Liability Company and a member firm of the KPMG global organization of independent member firms affiliated with KPMG International Limited, a private English company limited by guarantee. All rights reserved. 27
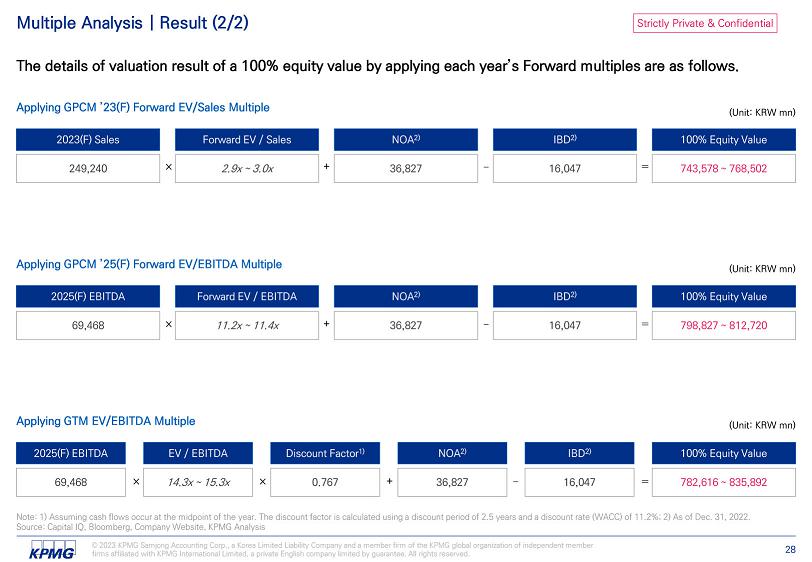
Strictly Private & Confidential Source: Capital IQ, Bloomberg, Company Website, KPMG Analysis © 2023 KPMG Samjong Accounting Corp., a Korea Limited Liability Company and a member firm of the KPMG global organization of independent member firms affiliated with KPMG International Limited, a private English company limited by guarantee. All rights reserved. 28 Multiple Analysis | Result (2/2) The details of valuation result of a 100% equity value by applying each year’s Forward multiples are as follows. Note: 1) Assuming cash flows occur at the midpoint of the year. The discount factor is calculated using a discount period of 2.5 years and a discount rate (WACC) of 11.2%; 2) As of Dec. 31, 2022. Applying GPCM ’23(F) Forward EV/Sales Multiple 100% Equity Value IBD 2) NOA 2) Forward EV / Sales 2023(F) Sales 743,578 ~ 768,502 = 16,047 ‒ 36,827 + 2.9x ~ 3.0x ൈ 249,240 (Unit: KRW mn) Applying GTM EV/EBITDA Multiple 100% Equity Value IBD 2) NOA 2) Discount Factor 1) EV / EBITDA 2025(F) EBITDA 782,616 ~ 835,892 = 16,047 ‒ 36,827 + 0.767 ൈ 14.3x ~ 15.3x ൈ 69,468 (Unit: KRW mn) Applying GPCM ’25(F) Forward EV/EBITDA Multiple 100% Equity Value IBD 2) NOA 2) Forward EV / EBITDA 2025(F) EBITDA 798,827 ~ 812,720 = 16,047 ‒ 36,827 + 11.2x ~ 11.4x ൈ 69,468 (Unit: KRW mn)
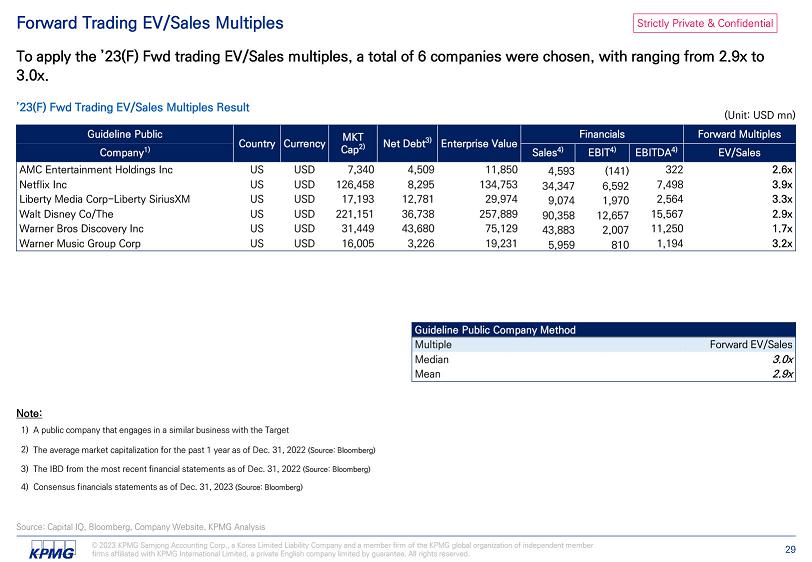
Strictly Private & Confidential Source: Capital IQ, Bloomberg, Company Website, KPMG Analysis © 2023 KPMG Samjong Accounting Corp., a Korea Limited Liability Company and a member firm of the KPMG global organization of independent member firms affiliated with KPMG International Limited, a private English company limited by guarantee. All rights reserved. 29 Forward Trading EV/Sales Multiples To apply the ’23(F) Fwd trading EV/Sales multiples, a total of 6 companies were chosen, with ranging from 2.9x to 3.0x. ’23(F) Fwd Trading EV/Sales Multiples Result Forward Multiples Financials Enterprise Value Net Debt 3) MKT Cap 2) Currency Country Guideline Public EV/Sales EBITDA 4) EBIT 4) Sales 4) Company 1) 2.6x 322 (141) 4,593 11,850 4,509 7,340 USD US AMC Entertainment Holdings Inc 3.9x 7,498 6,592 34,347 134,753 8,295 126,458 USD US Netflix Inc 3.3x 2,564 1,970 9,074 29,974 12,781 17,193 USD US Liberty Media Corp - Liberty SiriusXM 2.9x 15,567 12,657 90,358 257,889 36,738 221,151 USD US Walt Disney Co/The 1.7x 11,250 2,007 43,883 75,129 43,680 31,449 USD US Warner Bros Discovery Inc 3.2x 1,194 810 5,959 19,231 3,226 16,005 USD US Warner Music Group Corp Note: A public company that engages in a similar business with the Target 1) The average market capitalization for the past 1 year as of Dec. 31, 2022 (Source: Bloomberg) 2) The IBD from the most recent financial statements as of Dec. 31, 2022 (Source: Bloomberg) 3) Consensus financials statements as of Dec. 31, 2023 (Source: Bloomberg) 4) Guideline Public Company Method Forward EV/Sales Multiple 3.0x Median 2.9x Mean (Unit: USD mn)
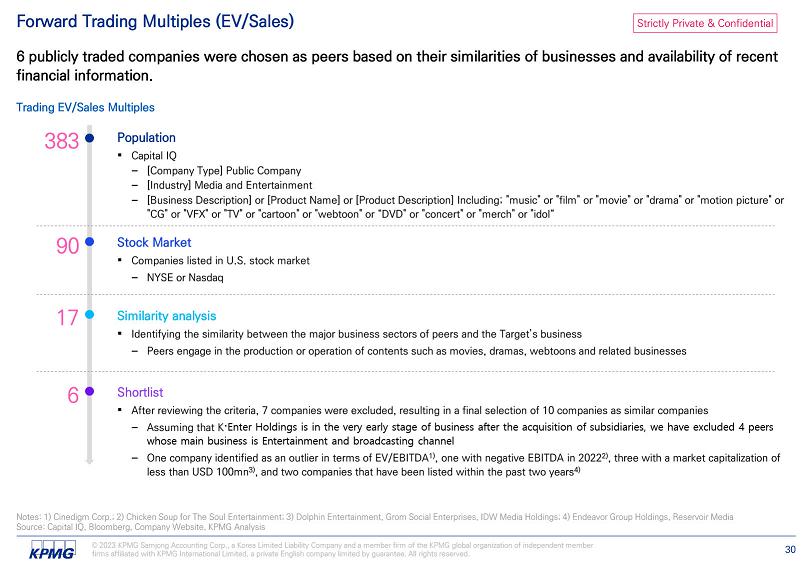
Strictly Private & Confidential Forward Trading Multiples (EV/Sales) Notes: 1) Cinedigm Corp.; 2) Chicken Soup for The Soul Entertainment; 3) Dolphin Entertainment, Grom Social Enterprises, IDW Media Holdings; 4) Endeavor Group Holdings, Reservoir Media 6 publicly traded companies were chosen as peers based on their similarities of businesses and availability of recent financial information. Trading EV/Sales Multiples Population ▪ Capital IQ ‒ [Company Type] Public Company ‒ [Industry] Media and Entertainment ‒ [Business Description] or [Product Name] or [Product Description] Including; "music" or "film" or "movie" or "drama" or "motion picture" or "CG" or "VFX" or "TV" or "cartoon" or "webtoon" or “DVD" or "concert" or "merch" or "idol“ Stock Market ▪ Companies listed in U.S. stock market ‒ NYSE or Nasdaq Similarity analysis ▪ Identifying the similarity between the major business sectors of peers and the Target’s business ‒ Peers engage in the production or operation of contents such as movies, dramas, webtoons and related businesses ▪ After reviewing the criteria, 7 companies were excluded, resulting in a final selection of 10 companies as similar companies – Assuming that K 傸呴 Enter Holdings is in the very early stage of business after the acquisition of subsidiaries , we have excluded 4 peers whose main business is Entertainment and broadcasting channel – One company identified as an outlier in terms of EV/EBITDA 1) , one with negative EBITDA in 2022 2) , three with a market capitalization of less than USD 100mn 3) , and two companies that have been listed within the past two years 4) Source: Capital IQ, Bloomberg, Company Website, KPMG Analysis © 2023 KPMG Samjong Accounting Corp., a Korea Limited Liability Company and a member firm of the KPMG global organization of independent member firms affiliated with KPMG International Limited, a private English company limited by guarantee. All rights reserved. 30
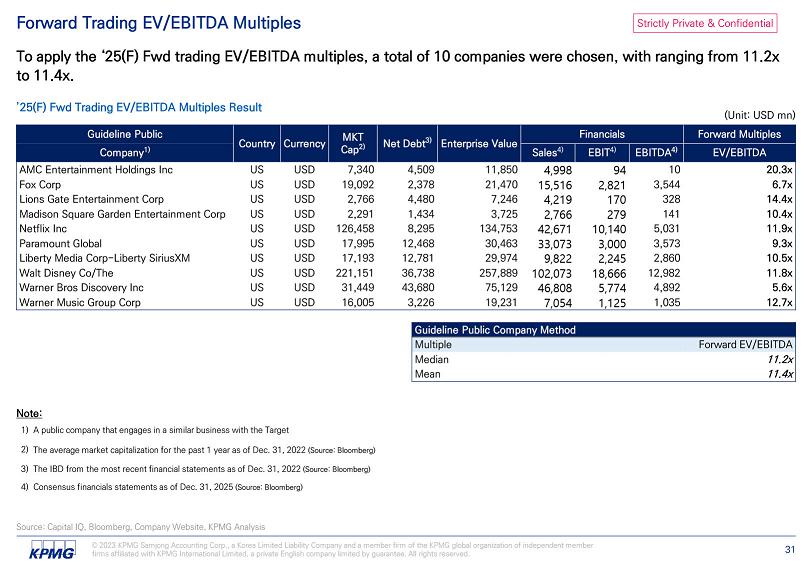
Strictly Private & Confidential Source: Capital IQ, Bloomberg, Company Website, KPMG Analysis © 2023 KPMG Samjong Accounting Corp., a Korea Limited Liability Company and a member firm of the KPMG global organization of independent member firms affiliated with KPMG International Limited, a private English company limited by guarantee. All rights reserved. 31 Forward Trading EV/EBITDA Multiples To apply the ‘25(F) Fwd trading EV/EBITDA multiples, a total of 10 companies were chosen, with ranging from 11.2x to 11.4x. ’25(F) Fwd Trading EV/EBITDA Multiples Result Forward Multiples Financials Enterprise Value Net Debt 3) MKT Cap 2) Currency Country Guideline Public EV/EBITDA EBITDA 4) EBIT 4) Sales 4) Company 1) 20.3x 10 94 4,998 11,850 4,509 7,340 USD US AMC Entertainment Holdings Inc 6.7x 3,544 2,821 15,516 21,470 2,378 19,092 USD US Fox Corp 14.4x 328 170 4,219 7,246 4,480 2,766 USD US Lions Gate Entertainment Corp 10.4x 141 279 2,766 3,725 1,434 2,291 USD US Madison Square Garden Entertainment Corp 11.9x 5,031 10,140 42,671 134,753 8,295 126,458 USD US Netflix Inc 9.3x 3,573 3,000 33,073 30,463 12,468 17,995 USD US Paramount Global 10.5x 2,860 2,245 9,822 29,974 12,781 17,193 USD US Liberty Media Corp - Liberty SiriusXM 11.8x 12,982 18,666 102,073 257,889 36,738 221,151 USD US Walt Disney Co/The 5.6x 4,892 5,774 46,808 75,129 43,680 31,449 USD US Warner Bros Discovery Inc 12.7x 1,035 1,125 7,054 19,231 3,226 16,005 USD US Warner Music Group Corp Note: A public company that engages in a similar business with the Target 1) The average market capitalization for the past 1 year as of Dec. 31, 2022 (Source: Bloomberg) 2) The IBD from the most recent financial statements as of Dec. 31, 2022 (Source: Bloomberg) 3) Consensus financials statements as of Dec. 31, 2025 (Source: Bloomberg) 4) Guideline Public Company Method Forward EV/EBITDA Multiple 11.2x Median 11.4x Mean (Unit: USD mn)
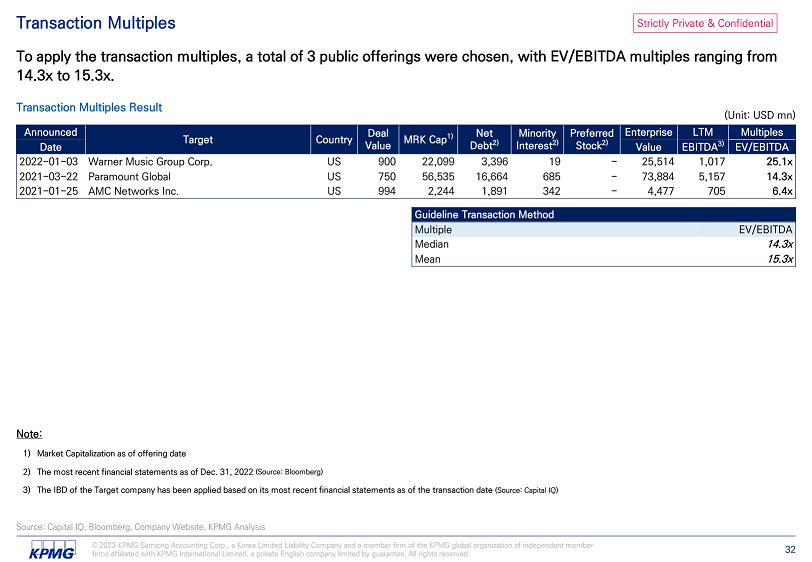
Strictly Private & Confidential Source: Capital IQ, Bloomberg, Company Website, KPMG Analysis © 2023 KPMG Samjong Accounting Corp., a Korea Limited Liability Company and a member firm of the KPMG global organization of independent member firms affiliated with KPMG International Limited, a private English company limited by guarantee. All rights reserved. 32 Transaction Multiples To apply the transaction multiples, a total of 3 public offerings were chosen, with EV/EBITDA multiples ranging from 14.3x to 15.3x. Transaction Multiples Result Multiples LTM Enterprise Preferred Stock 2) Minority Interest 2) Net Debt 2) MRK Cap 1) Deal Value Country Target Announced EV/EBITDA EBITDA 3) Value Date 25.1x 1,017 25,514 - 19 3,396 22,099 900 US Warner Music Group Corp. 2022 - 01 - 03 14.3x 5,157 73,884 - 685 16,664 56,535 750 US Paramount Global 2021 - 03 - 22 6.4x 705 4,477 - 342 1,891 2,244 994 US AMC Networks Inc. 2021 - 01 - 25 Guideline Transaction Method EV/EBITDA Multiple 14.3x Median 15.3x Mean Market Capitalization as of offering date 1) The most recent financial statements as of Dec. 31, 2022 (Source: Bloomberg) 2) The IBD of the Target company has been applied based on its most recent financial statements as of the transaction date (Source: Capital IQ) 3) Note: (Unit: USD mn)
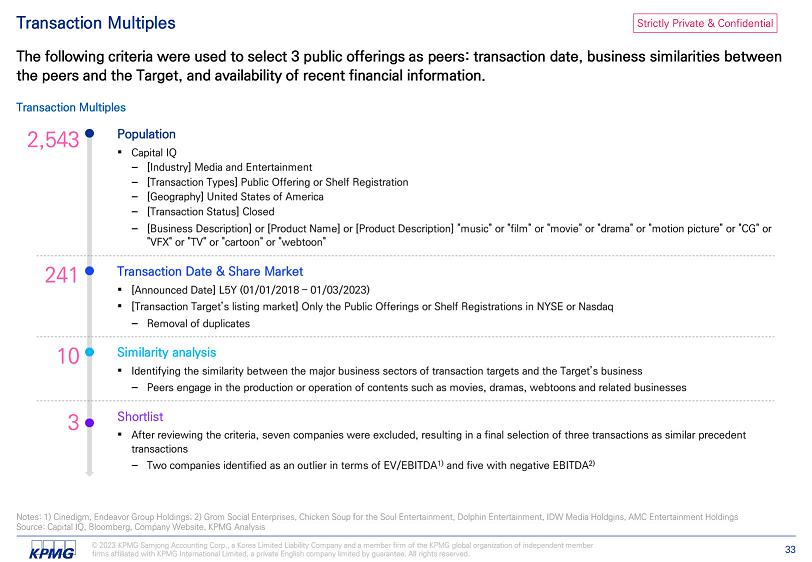
Strictly Private & Confidential Transaction Multiples Notes: 1) Cinedigm, Endeavor Group Holdings; 2) Grom Social Enterprises, Chicken Soup for the Soul Entertainment, Dolphin Entertainment, IDW Media Holdgins, AMC Entertainment Holdings The following criteria were used to select 3 public offerings as peers: transaction date, business similarities between the peers and the Target, and availability of recent financial information. Transaction Multiples Population ▪ Capital IQ ‒ [Industry] Media and Entertainment ‒ [Transaction Types] Public Offering or Shelf Registration ‒ [Geography] United States of America ‒ [Transaction Status] Closed ‒ [Business Description] or [Product Name] or [Product Description] "music" or "film" or "movie" or "drama" or "motion picture" or "CG" or "VFX" or "TV" or "cartoon" or "webtoon" Transaction Date & Share Market ▪ [Announced Date] L5Y (01/01/2018 – 01/03/2023) ▪ [Transaction Target’s listing market] Only the Public Offerings or Shelf Registrations in NYSE or Nasdaq ‒ Removal of duplicates Similarity analysis ▪ Identifying the similarity between the major business sectors of transaction targets and the Target’s business ‒ Peers engage in the production or operation of contents such as movies, dramas, webtoons and related businesses ▪ After reviewing the criteria, seven companies were excluded, resulting in a final selection of three transactions as similar precedent transactions – Two companies identified as an outlier in terms of EV/EBITDA 1) and five with negative EBITDA 2) Source: Capital IQ, Bloomberg, Company Website, KPMG Analysis © 2023 KPMG Samjong Accounting Corp., a Korea Limited Liability Company and a member firm of the KPMG global organization of independent member firms affiliated with KPMG International Limited, a private English company limited by guarantee. All rights reserved. 33

Strictly Private & Confidential II. Business Plan Analysis

Strictly Private & Confidential Play Company
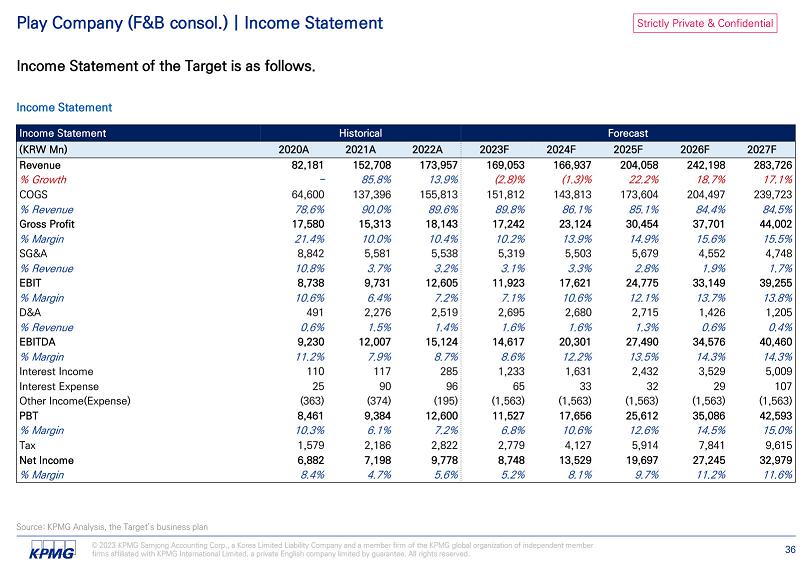
Strictly Private & Confidential © 2023 KPMG Samjong Accounting Corp., a Korea Limited Liability Company and a member firm of the KPMG global organization of independent member firms affiliated with KPMG International Limited, a private English company limited by guarantee. All rights reserved. 36 Play Company (F&B consol.) | Income Statement Income Statement of the Target is as follows. Income Statement Source: KPMG Analysis, the Target’s business plan Forecast Historical Income Statement 2027F 2026F 2025F 2024F 2023F 2022A 2021A 2020A (KRW Mn) 283,726 242,198 204,058 166,937 169,053 173,957 152,708 82,181 Revenue 17.1% 18.7% 22.2% (1.3)% (2.8)% 13.9% 85.8% - % Growth 239,723 204,497 173,604 143,813 151,812 155,813 137,396 64,600 COGS 84.5% 84.4% 85.1% 86.1% 89.8% 89.6% 90.0% 78.6% % Revenue 44,002 37,701 30,454 23,124 17,242 18,143 15,313 17,580 Gross Profit 15.5% 15.6% 14.9% 13.9% 10.2% 10.4% 10.0% 21.4% % Margin 4,748 4,552 5,679 5,503 5,319 5,538 5,581 8,842 SG&A 1.7% 1.9% 2.8% 3.3% 3.1% 3.2% 3.7% 10.8% % Revenue 39,255 33,149 24,775 17,621 11,923 12,605 9,731 8,738 EBIT 13.8% 13.7% 12.1% 10.6% 7.1% 7.2% 6.4% 10.6% % Margin 1,205 1,426 2,715 2,680 2,695 2,519 2,276 491 D&A 0.4% 0.6% 1.3% 1.6% 1.6% 1.4% 1.5% 0.6% % Revenue 40,460 34,576 27,490 20,301 14,617 15,124 12,007 9,230 EBITDA 14.3% 14.3% 13.5% 12.2% 8.6% 8.7% 7.9% 11.2% % Margin 5,009 3,529 2,432 1,631 1,233 285 117 110 Interest Income 107 29 32 33 65 96 90 25 Interest Expense (1,563) (1,563) (1,563) (1,563) (1,563) (195) (374) (363) Other Income(Expense) 42,593 35,086 25,612 17,656 11,527 12,600 9,384 8,461 PBT 15.0% 14.5% 12.6% 10.6% 6.8% 7.2% 6.1% 10.3% % Margin 9,615 7,841 5,914 4,127 2,779 2,822 2,186 1,579 Tax 32,979 27,245 19,697 13,529 8,748 9,778 7,198 6,882 Net Income 11.6% 11.2% 9.7% 8.1% 5.2% 5.6% 4.7% 8.4% % Margin
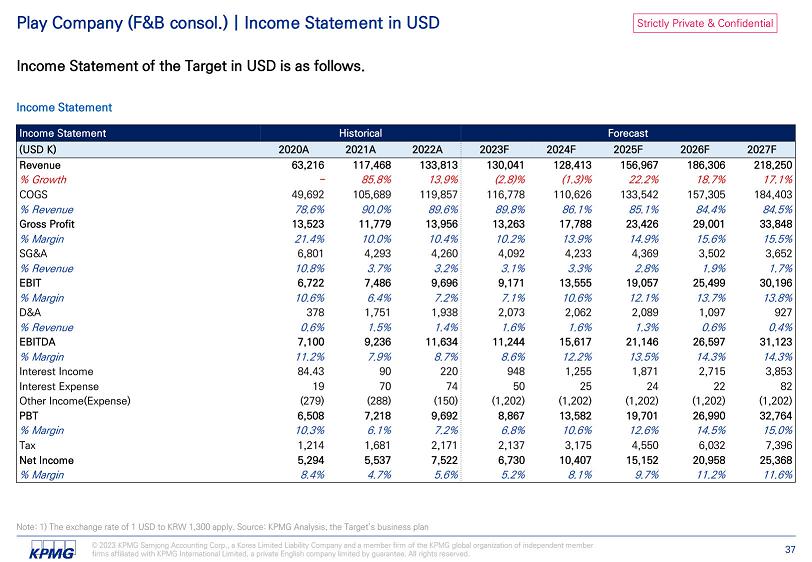
Strictly Private & Confidential © 2023 KPMG Samjong Accounting Corp., a Korea Limited Liability Company and a member firm of the KPMG global organization of independent member firms affiliated with KPMG International Limited, a private English company limited by guarantee. All rights reserved. 37 Play Company (F&B consol.) | Income Statement in USD Income Statement of the Target in USD is as follows. Income Statement Note: 1) The exchange rate of 1 USD to KRW 1,300 apply. Source: KPMG Analysis, the Target’s business plan Forecast Historical Income Statement 2027F 2026F 2025F 2024F 2023F 2022A 2021A 2020A (USD K) 218,250 186,306 156,967 128,413 130,041 133,813 117,468 63,216 Revenue 17.1% 18.7% 22.2% (1.3)% (2.8)% 13.9% 85.8% - % Growth 184,403 157,305 133,542 110,626 116,778 119,857 105,689 49,692 COGS 84.5% 84.4% 85.1% 86.1% 89.8% 89.6% 90.0% 78.6% % Revenue 33,848 29,001 23,426 17,788 13,263 13,956 11,779 13,523 Gross Profit 15.5% 15.6% 14.9% 13.9% 10.2% 10.4% 10.0% 21.4% % Margin 3,652 3,502 4,369 4,233 4,092 4,260 4,293 6,801 SG&A 1.7% 1.9% 2.8% 3.3% 3.1% 3.2% 3.7% 10.8% % Revenue 30,196 25,499 19,057 13,555 9,171 9,696 7,486 6,722 EBIT 13.8% 13.7% 12.1% 10.6% 7.1% 7.2% 6.4% 10.6% % Margin 927 1,097 2,089 2,062 2,073 1,938 1,751 378 D&A 0.4% 0.6% 1.3% 1.6% 1.6% 1.4% 1.5% 0.6% % Revenue 31,123 26,597 21,146 15,617 11,244 11,634 9,236 7,100 EBITDA 14.3% 14.3% 13.5% 12.2% 8.6% 8.7% 7.9% 11.2% % Margin 3,853 2,715 1,871 1,255 948 220 90 84.43 Interest Income 82 22 24 25 50 74 70 19 Interest Expense (1,202) (1,202) (1,202) (1,202) (1,202) (150) (288) (279) Other Income(Expense) 32,764 26,990 19,701 13,582 8,867 9,692 7,218 6,508 PBT 15.0% 14.5% 12.6% 10.6% 6.8% 7.2% 6.1% 10.3% % Margin 7,396 6,032 4,550 3,175 2,137 2,171 1,681 1,214 Tax 25,368 20,958 15,152 10,407 6,730 7,522 5,537 5,294 Net Income 11.6% 11.2% 9.7% 8.1% 5.2% 5.6% 4.7% 8.4% % Margin
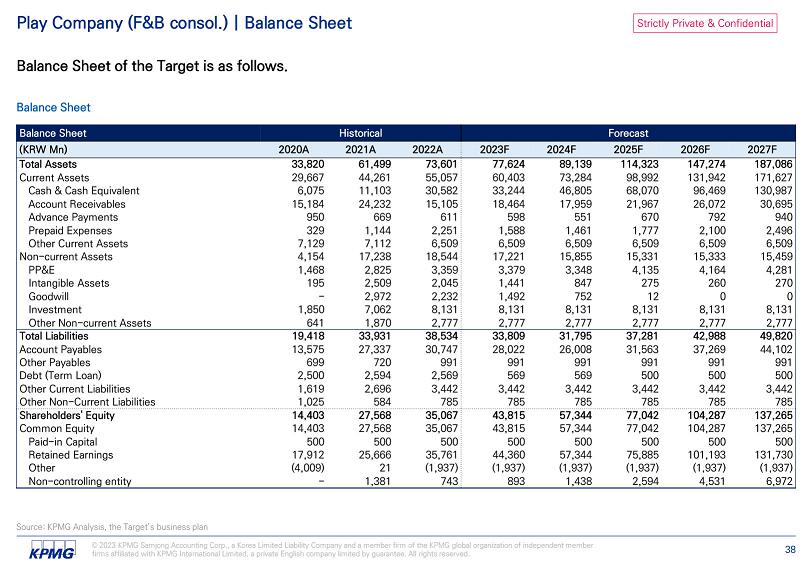
Strictly Private & Confidential Source: KPMG Analysis, the Target’s business plan © 2023 KPMG Samjong Accounting Corp., a Korea Limited Liability Company and a member firm of the KPMG global organization of independent member firms affiliated with KPMG International Limited, a private English company limited by guarantee. All rights reserved. 38 Play Company (F&B consol.) | Balance Sheet Balance Sheet of the Target is as follows. Balance Sheet Forecast Historical Balance Sheet 2027F 2026F 2025F 2024F 2023F 2022A 2021A 2020A (KRW Mn) 187,086 147,274 114,323 89,139 77,624 73,601 61,499 33,820 Total Assets 171,627 131,942 98,992 73,284 60,403 55,057 44,261 29,667 Current Assets 130,987 96,469 68,070 46,805 33,244 30,582 11,103 6,075 Cash & Cash Equivalent 30,695 26,072 21,967 17,959 18,464 15,105 24,232 15,184 Account Receivables 940 792 670 551 598 611 669 950 Advance Payments 2,496 2,100 1,777 1,461 1,588 2,251 1,144 329 Prepaid Expenses 6,509 6,509 6,509 6,509 6,509 6,509 7,112 7,129 Other Current Assets 15,459 15,333 15,331 15,855 17,221 18,544 17,238 4,154 Non - current Assets 4,281 4,164 4,135 3,348 3,379 3,359 2,825 1,468 PP&E 270 260 275 847 1,441 2,045 2,509 195 Intangible Assets 0 0 12 752 1,492 2,232 2,972 - Goodwill 8,131 8,131 8,131 8,131 8,131 8,131 7,062 1,850 Investment 2,777 2,777 2,777 2,777 2,777 2,777 1,870 641 Other Non - current Assets 49,820 42,988 37,281 31,795 33,809 38,534 33,931 19,418 Total Liabilities 44,102 37,269 31,563 26,008 28,022 30,747 27,337 13,575 Account Payables 991 991 991 991 991 991 720 699 Other Payables 500 500 500 569 569 2,569 2,594 2,500 Debt (Term Loan) 3,442 3,442 3,442 3,442 3,442 3,442 2,696 1,619 Other Current Liabilities 785 785 785 785 785 785 584 1,025 Other Non - Current Liabilities 137,265 104,287 77,042 57,344 43,815 35,067 27,568 14,403 Shareholders' Equity 137,265 104,287 77,042 57,344 43,815 35,067 27,568 14,403 Common Equity 500 500 500 500 500 500 500 500 Paid - in Capital 131,730 101,193 75,885 57,344 44,360 35,761 25,666 17,912 Retained Earnings (1,937) (1,937) (1,937) (1,937) (1,937) (1,937) 21 (4,009) Other 6,972 4,531 2,594 1,438 893 743 1,381 - Non - controlling entity
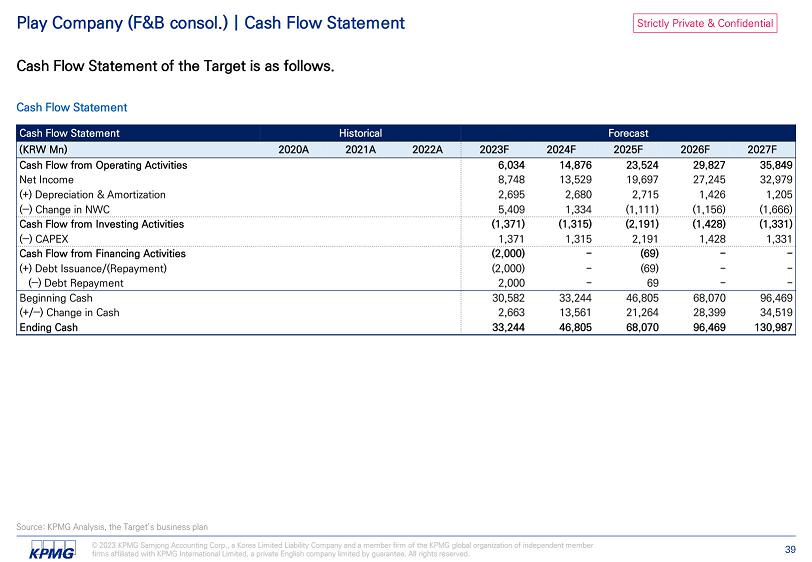
Strictly Private & Confidential Source: KPMG Analysis, the Target’s business plan © 2023 KPMG Samjong Accounting Corp., a Korea Limited Liability Company and a member firm of the KPMG global organization of independent member firms affiliated with KPMG International Limited, a private English company limited by guarantee. All rights reserved. 39 Play Company (F&B consol.) | Cash Flow Statement Cash Flow Statement of the Target is as follows. Cash Flow Statement Forecast Historical Cash Flow Statement 2027F 2026F 2025F 2024F 2023F 2022A 2021A 2020A (KRW Mn) 35,849 29,827 23,524 14,876 6,034 Cash Flow from Operating Activities 32,979 27,245 19,697 13,529 8,748 Net Income 1,205 1,426 2,715 2,680 2,695 (+) Depreciation & Amortization (1,666) (1,156) (1,111) 1,334 5,409 (‒) Change in NWC (1,331) (1,428) (2,191) (1,315) (1,371) Cash Flow from Investing Activities 1,331 1,428 2,191 1,315 1,371 (‒) CAPEX - - (69) - (2,000) Cash Flow from Financing Activities - - (69) - (2,000) (+) Debt Issuance/(Repayment) - - 69 - 2,000 (‒) Debt Repayment 96,469 68,070 46,805 33,244 30,582 Beginning Cash 34,519 28,399 21,264 13,561 2,663 (+/‒) Change in Cash 130,987 96,469 68,070 46,805 33,244 Ending Cash
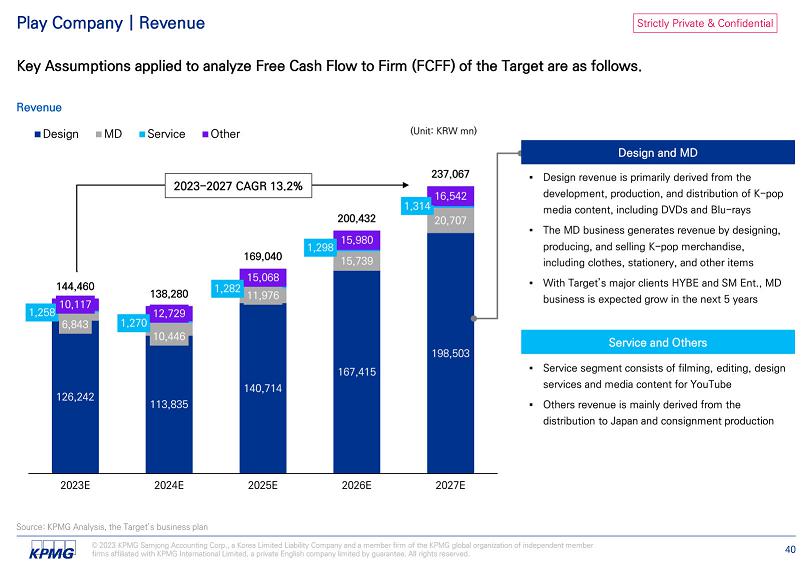
Strictly Private & Confidential Play Company | Revenue Key Assumptions applied to analyze Free Cash Flow to Firm (FCFF) of the Target are as follows. Revenue 126,242 113,835 140,714 167,415 198,503 6,843 10,446 11,976 15,739 20,707 1,258 1,270 1,282 1,298 1,314 10,117 12,729 15,068 15,980 16,542 144,460 138,280 169,040 200,432 237,067 2023E 2024E 2025E 2026E 2027E Design MD Service Other (Unit: KRW mn) ▪ The MD business generates revenue by designing, producing, and selling K - pop merchandise, including clothes, stationery, and other items Design and MD Service and Others 2023 - 2027 CAGR 13.2% Source: KPMG Analysis, the Target’s business plan © 2023 KPMG Samjong Accounting Corp., a Korea Limited Liability Company and a member firm of the KPMG global organization of independent member firms affiliated with KPMG International Limited, a private English company limited by guarantee. All rights reserved. 40
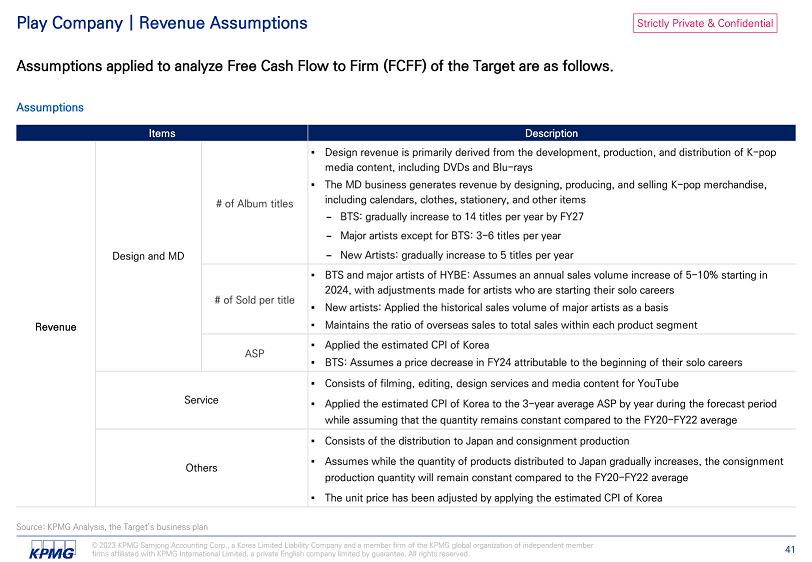
Strictly Private & Confidential Play Company | Revenue Assumptions Assumptions applied to analyze Free Cash Flow to Firm (FCFF) of the Target are as follows. Assumptions ▪ The MD business generates revenue by designing, producing, and selling K - pop merchandise, including calendars, clothes, stationery, and other items − BTS: gradually increase to 14 titles per year by FY27 − Major artists except for BTS: 3 - 6 titles per year − New Artists: gradually increase to 5 titles per year Design and MD Revenue with adjustments made for artists who are starting their solo careers ▪ Maintains the ratio of overseas sales to total sales within each product segment Service ▪ The unit price has been adjusted by applying the estimated CPI of Korea Others Source: KPMG Analysis, the Target’s business plan © 2023 KPMG Samjong Accounting Corp., a Korea Limited Liability Company and a member firm of the KPMG global organization of independent member firms affiliated with KPMG International Limited, a private English company limited by guarantee. All rights reserved. 41
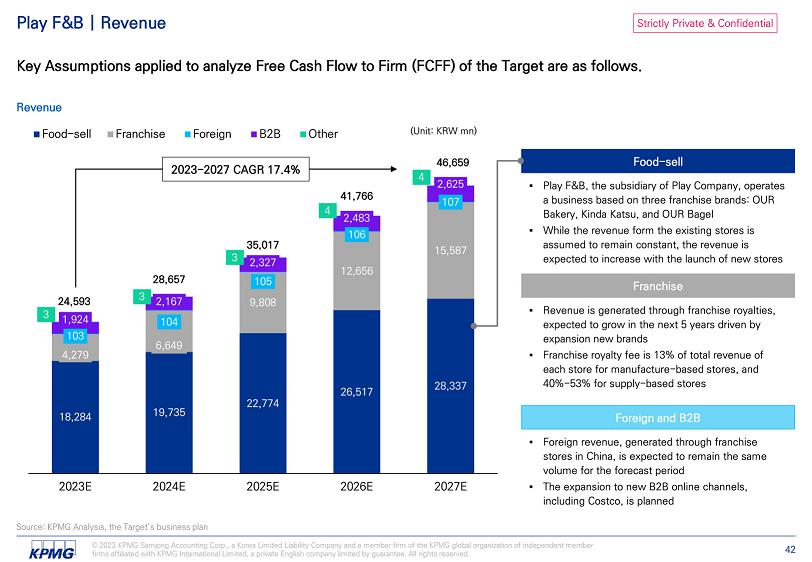
Strictly Private & Confidential Play F&B | Revenue Key Assumptions applied to analyze Free Cash Flow to Firm (FCFF) of the Target are as follows. Revenue 18,284 19,735 22,774 26,517 28,337 4,279 6,649 9,808 12,656 15,587 103 104 105 106 107 1,924 2,167 2,327 2,483 2,625 3 3 3 4 4 24,593 28,657 35,017 41,766 46,659 2023E 2024E 2025E 2026E 2027E Food - sell Franchise Foreign B2B Other (Unit: KRW mn) Franchise Food - sell Foreign and B2B 2023 - 2027 CAGR 17.4% Source: KPMG Analysis, the Target’s business plan © 2023 KPMG Samjong Accounting Corp., a Korea Limited Liability Company and a member firm of the KPMG global organization of independent member firms affiliated with KPMG International Limited, a private English company limited by guarantee. All rights reserved. 42

Strictly Private & Confidential Play F&B | Revenue Assumptions Assumptions applied to analyze Free Cash Flow to Firm (FCFF) of the Target are as follows. Assumptions ▪ Applied the estimated CPI of Korea to the monthly revenue of each store in FY22 Revenue ▪ Applied the estimated CPI of Korea to the monthly revenue of each store in FY22 Source: KPMG Analysis, the Target’s business plan © 2023 KPMG Samjong Accounting Corp., a Korea Limited Liability Company and a member firm of the KPMG global organization of independent member firms affiliated with KPMG International Limited, a private English company limited by guarantee. All rights reserved. 43
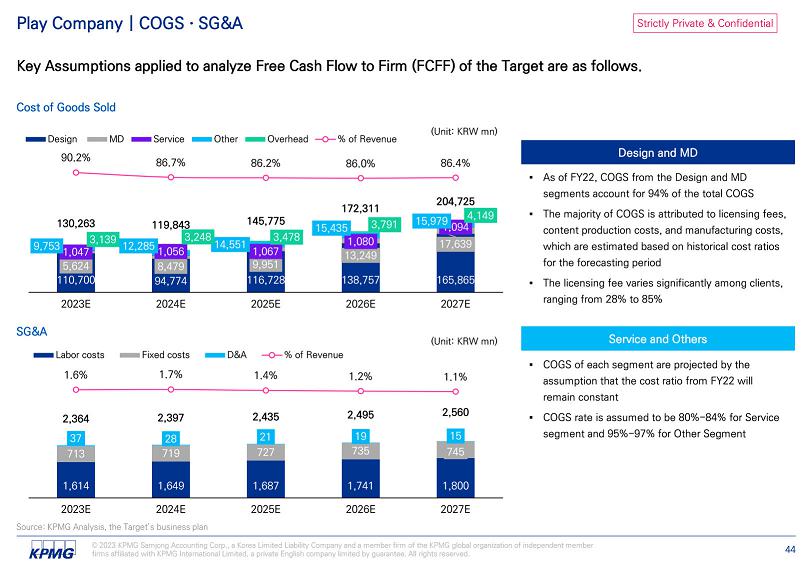
Strictly Private & Confidential Play Company | COGS · SG&A Key Assumptions applied to analyze Free Cash Flow to Firm (FCFF) of the Target are as follows. Cost of Goods Sold 110,700 116,728 138,757 165,865 5,624 8,479 94,774 9,951 13,249 17,639 1,047 1,056 1,067 1,080 1, 094 9,753 15,435 15,979 3,139 12,285 3,248 14,551 3,478 3,791 4,149 130,263 119,843 145,775 172,311 204,725 Design 90.2% 86.7% 86.2% 86.0% 86.4% 2023E 2024E 2025E 2026E 2027E MD Service Other Overhead % of Revenue SG&A 745 735 727 719 713 1,800 1,741 1,687 1,649 1,614 37 28 21 19 15 2,364 2,397 2,435 2,495 2,560 1.6% 1.7% 1.4% 1.2% 1.1% 2023E 2024E 2025E 2026E 2027E Labor costs Fixed costs D&A % of Revenue Design and MD Service and Others (Unit: KRW mn) Source: KPMG Analysis, the Target’s business plan © 2023 KPMG Samjong Accounting Corp., a Korea Limited Liability Company and a member firm of the KPMG global organization of independent member firms affiliated with KPMG International Limited, a private English company limited by guarantee. All rights reserved. 44 (Unit: KRW mn)
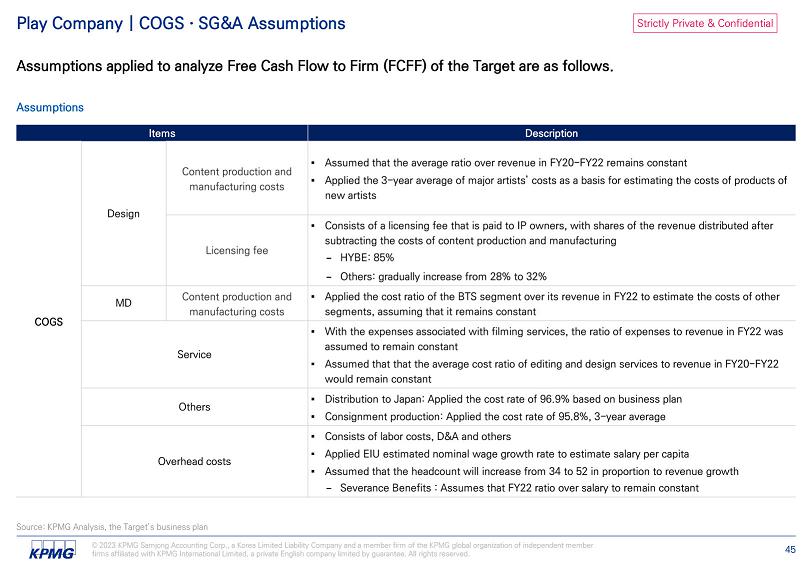
Strictly Private & Confidential Play Company | COGS · SG&A Assumptions Assumptions applied to analyze Free Cash Flow to Firm (FCFF) of the Target are as follows. Assumptions ▪ Assumed that the average ratio over revenue in FY20 - FY22 remains constant Design COGS ▪ Consists of a licensing fee that is paid to IP owners, with shares of the revenue distributed after subtracting the costs of content production and manufacturing − HYBE: 85% − Others: gradually increase from 28% to 32% ▪ Applied the cost ratio of the BTS segment over its revenue in FY22 to estimate the costs of other segments, assuming that it remains constant MD ▪ With the expenses associated with filming services, the ratio of expenses to revenue in FY22 was assumed to remain constant ▪ Assumed that that the average cost ratio of editing and design services to revenue in FY20 - FY22 would remain constant Service Others ▪ Consists of labor costs, D&A and others ▪ Applied EIU estimated nominal wage growth rate to estimate salary per capita ▪ Assumed that the headcount will increase from 34 to 52 in proportion to revenue growth − Severance Benefits : Assumes that FY22 ratio over salary to remain constant Overhead costs Source: KPMG Analysis, the Target’s business plan © 2023 KPMG Samjong Accounting Corp., a Korea Limited Liability Company and a member firm of the KPMG global organization of independent member firms affiliated with KPMG International Limited, a private English company limited by guarantee. All rights reserved. 45
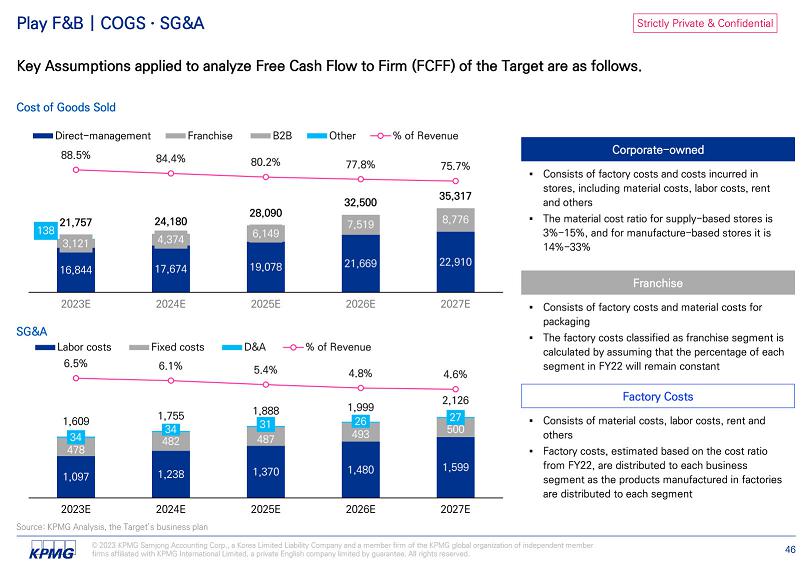
Strictly Private & Confidential Play F&B | COGS · SG&A Key Assumptions applied to analyze Free Cash Flow to Firm (FCFF) of the Target are as follows. Cost of Goods Sold 16,844 17,674 19,078 21,669 22,910 1 3,121 4,374 6,149 7,519 8,776 138 21,757 24,180 28,090 32,500 35,317 88.5% 84.4% 80.2% 77.8% 75.7% 2023E 2024E 2025E 2026E 2027E Direct - management Franchise B2B Other % of Revenue SG&A 1,097 1,238 1,370 1,480 1,599 478 482 487 493 500 34 34 31 1,609 1,755 1,888 1,999 26 2,126 27 Labor costs 6.5% Fixed costs 6.1% 5.4% 4.8% 4.6% 2023E 2024E 2025E 2026E 2027E D&A % of Revenue Franchise Corporate - owned Factory Costs Source: KPMG Analysis, the Target’s business plan © 2023 KPMG Samjong Accounting Corp., a Korea Limited Liability Company and a member firm of the KPMG global organization of independent member firms affiliated with KPMG International Limited, a private English company limited by guarantee. All rights reserved. 46
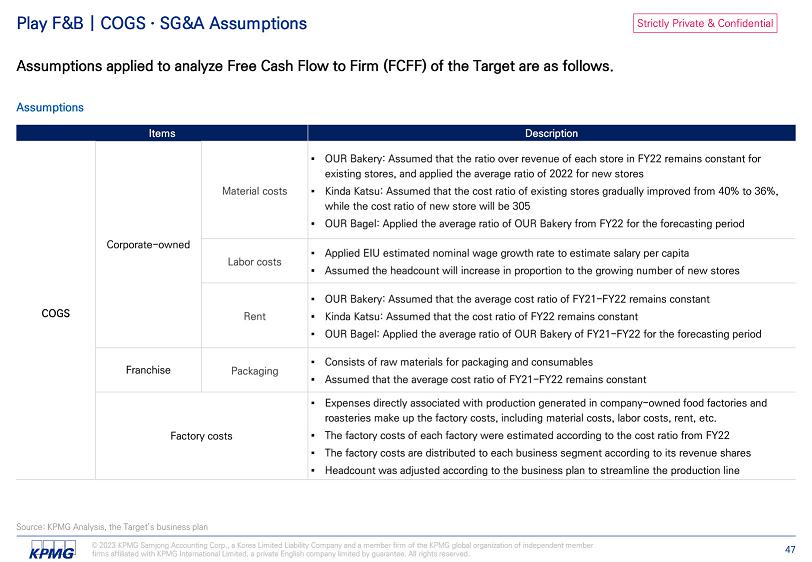
Strictly Private & Confidential Play F&B | COGS · SG&A Assumptions Assumptions applied to analyze Free Cash Flow to Firm (FCFF) of the Target are as follows. Assumptions ▪ OUR Bakery: Assumed that the ratio over revenue of each store in FY22 remains constant for existing stores, and applied the average ratio of 2022 for new stores ▪ Kinda Katsu: Assumed that the cost ratio of existing stores gradually improved from 40% to 36%, while the cost ratio of new store will be 305 ▪ OUR Bagel: Applied the average ratio of OUR Bakery from FY22 for the forecasting period Corporate - owned COGS ▪ Applied EIU estimated nominal wage growth rate to estimate salary per capita ▪ Assumed the headcount will increase in proportion to the growing number of new stores ▪ OUR Bakery: Assumed that the average cost ratio of FY21 - FY22 remains constant ▪ Kinda Katsu: Assumed that the cost ratio of FY22 remains constant ▪ OUR Bagel: Applied the average ratio of OUR Bakery of FY21 - FY22 for the forecasting period ▪ Consists of raw materials for packaging and consumables ▪ Assumed that the average cost ratio of FY21 - FY22 remains constant Franchise ▪ Expenses directly associated with production generated in company - owned food factories and roasteries make up the factory costs, including material costs, labor costs, rent, etc. ▪ The factory costs of each factory were estimated according to the cost ratio from FY22 ▪ The factory costs are distributed to each business segment according to its revenue shares ▪ Headcount was adjusted according to the business plan to streamline the production line Factory costs Source: KPMG Analysis, the Target’s business plan © 2023 KPMG Samjong Accounting Corp., a Korea Limited Liability Company and a member firm of the KPMG global organization of independent member firms affiliated with KPMG International Limited, a private English company limited by guarantee. All rights reserved. 47
Strictly Private & Confidential Play Company (F&B consol.) | COGS · SG&A Assumptions Assumptions applied to analyze Free Cash Flow to Firm (FCFF) of the Target are as follows. Assumptions − Play Company: The headcount for FY22 is assumed to remain constant for the forecast period − Play F&B: Assumed that the headcount will gradually increase from 19 to 26 ▪ Applied EIU estimated nominal wage growth rate to estimate salary and bonus per capita - Employee Benefits and Severance Benefits: Apply the average ratio of benefits over salary in FY22 and assumed that it will remain constant Labor costs SG&A Fixed costs Source: KPMG Analysis, the Target’s business plan © 2023 KPMG Samjong Accounting Corp., a Korea Limited Liability Company and a member firm of the KPMG global organization of independent member firms affiliated with KPMG International Limited, a private English company limited by guarantee. All rights reserved. 48
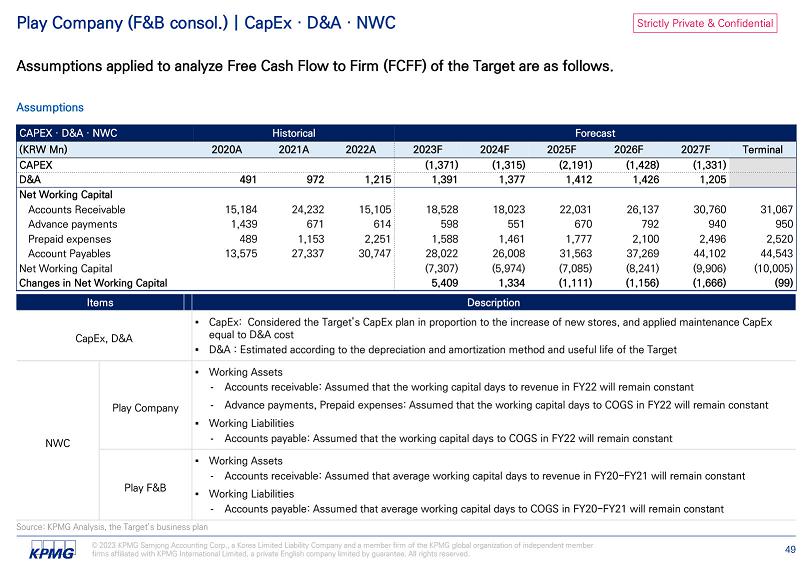
Strictly Private & Confidential Play Company (F&B consol.) | CapEx · D&A · NWC Assumptions applied to analyze Free Cash Flow to Firm (FCFF) of the Target are as follows. Assumptions Forecast Historical CAPEX · D&A · NWC Terminal 2027F 2026F 2025F 2024F 2023F 2022A 2021A 2020A (KRW Mn) (1,331) (1,428) (2,191) (1,315) (1,371) CAPEX 1,205 1,426 1,412 1,377 1,391 1,215 972 491 D&A Net Working Capital 31,067 30,760 26,137 22,031 18,023 18,528 15,105 24,232 15,184 Accounts Receivable 950 940 792 670 551 598 614 671 1,439 Advance payments 2,520 2,496 2,100 1,777 1,461 1,588 2,251 1,153 489 Prepaid expenses 44,543 44,102 37,269 31,563 26,008 28,022 30,747 27,337 13,575 Account Payables (10,005) (9,906) (8,241) (7,085) (5,974) (7,307) Net Working Capital (99) (1,666) (1,156) (1,111) 1,334 5,409 Changes in Net Working Capital CapEx, D&A - Accounts receivable: Assumed that the working capital days to revenue in FY22 will remain constant - Advance payments, Prepaid expenses: Assumed that the working capital days to COGS in FY22 will remain constant - Accounts payable: Assumed that the working capital days to COGS in FY22 will remain constant Play Company NWC - Accounts receivable: Assumed that average working capital days to revenue in FY20 - FY21 will remain constant - Accounts payable: Assumed that average working capital days to COGS in FY20 - FY21 will remain constant Play F&B Source: KPMG Analysis, the Target’s business plan © 2023 KPMG Samjong Accounting Corp., a Korea Limited Liability Company and a member firm of the KPMG global organization of independent member firms affiliated with KPMG International Limited, a private English company limited by guarantee. All rights reserved. 49
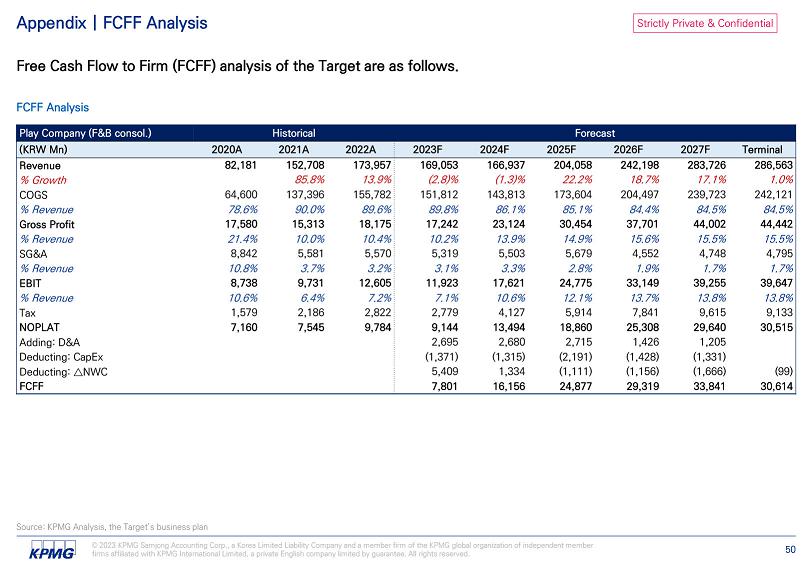
Strictly Private & Confidential Source: KPMG Analysis, the Target’s business plan © 2023 KPMG Samjong Accounting Corp., a Korea Limited Liability Company and a member firm of the KPMG global organization of independent member firms affiliated with KPMG International Limited, a private English company limited by guarantee. All rights reserved. 50 Appendix | FCFF Analysis Free Cash Flow to Firm (FCFF) analysis of the Target are as follows. FCFF Analysis Forecast Historical Play Company (F&B consol.) Terminal 2027F 2026F 2025F 2024F 2023F 2022A 2021A 2020A (KRW Mn) 286,563 283,726 242,198 204,058 166,937 169,053 173,957 152,708 82,181 Revenue 1.0% 17.1% 18.7% 22.2% (1.3)% (2.8)% 13.9% 85.8% % Growth 242,121 239,723 204,497 173,604 143,813 151,812 155,782 137,396 64,600 COGS 84.5% 84.5% 84.4% 85.1% 86.1% 89.8% 89.6% 90.0% 78.6% % Revenue 44,442 44,002 37,701 30,454 23,124 17,242 18,175 15,313 17,580 Gross Profit 15.5% 15.5% 15.6% 14.9% 13.9% 10.2% 10.4% 10.0% 21.4% % Revenue 4,795 4,748 4,552 5,679 5,503 5,319 5,570 5,581 8,842 SG&A 1.7% 1.7% 1.9% 2.8% 3.3% 3.1% 3.2% 3.7% 10.8% % Revenue 39,647 39,255 33,149 24,775 17,621 11,923 12,605 9,731 8,738 EBIT 13.8% 13.8% 13.7% 12.1% 10.6% 7.1% 7.2% 6.4% 10.6% % Revenue 9,133 9,615 7,841 5,914 4,127 2,779 2,822 2,186 1,579 Tax 30,515 29,640 25,308 18,860 13,494 9,144 9,784 7,545 7,160 NOPLAT 1,205 1,426 2,715 2,680 2,695 Adding: D&A (1,331) (1,428) (2,191) (1,315) (1,371) Deducting: CapEx (99) (1,666) (1,156) (1,111) 1,334 5,409 Deducting: ټ NWC 30,614 33,841 29,319 24,877 16,156 7,801 FCFF

Strictly Private & Confidential Appendix | FCFF Key Assumptions Key Assumptions applied to analyze Free Cash Flow to Firm (FCFF) of the Target are as follows. Key Assumptions Analysis Date Forecast Period Cash Flow Key Assumptions Terminal Growth Rate Income Tax Source: KPMG Analysis © 2023 KPMG Samjong Accounting Corp., a Korea Limited Liability Company and a member firm of the KPMG global organization of independent member firms affiliated with KPMG International Limited, a private English company limited by guarantee. All rights reserved. 51 Macroeconomic Indicators
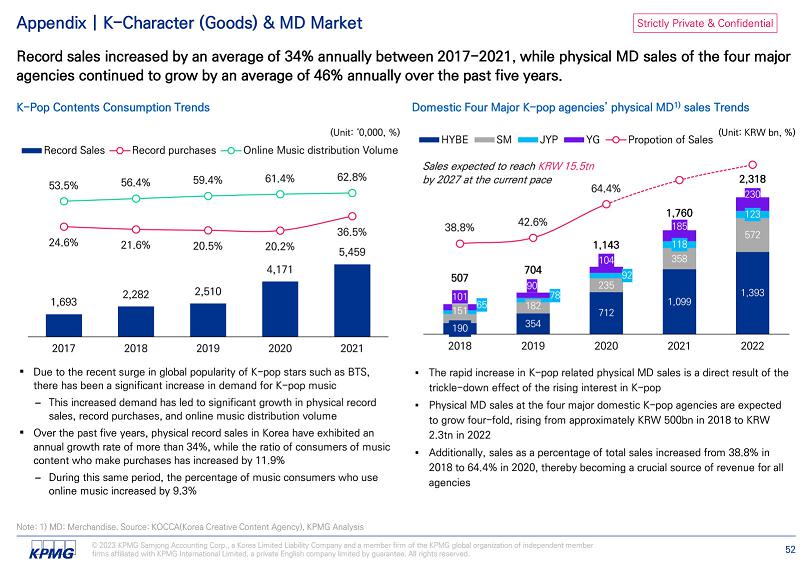
Strictly Private & Confidential 1,693 2,282 2,510 4,171 24.6% 36.5% 5,459 21.6% 20.5% 20.2% 53.5% 56.4% 59.4% 61.4% 62.8% 2017 2018 2019 2020 2021 ▪ Due to the recent surge in global popularity of K - pop stars such as BTS, there has been a significant increase in demand for K - pop music − This increased demand has led to significant growth in physical record sales, record purchases, and online music distribution volume ▪ Over the past five years, physical record sales in Korea have exhibited an annual growth rate of more than 34%, while the ratio of consumers of music content who make purchases has increased by 11.9% − During this same period, the percentage of music consumers who use online music increased by 9.3% Record Sales Record purchases Appendix | K - Character (Goods) & MD Market Record sales increased by an average of 34% annually between 2017 - 2021, while physical MD sales of the four major agencies continued to grow by an average of 46% annually over the past five years. K - Pop Contents Consumption Trends Domestic Four Major K - pop agencies’ physical MD 1) sales Trends 190 354 712 1,099 1,393 151 182 235 358 572 65 78 92 118 123 101 90 104 185 230 507 704 1,143 1,760 2,318 38.8% 42.6% Sales expected to reach KRW 15.5tn by 2027 at the current pace 64.4% 2018 2019 2020 2021 2022 (Unit: ‘0,000, %) (Unit: KRW bn, %) HYBE SM JYP YG Propotion of Sales Online Music distribution Volume Note: 1) MD: Merchandise. Source: KOCCA(Korea Creative Content Agency), KPMG Analysis © 2023 KPMG Samjong Accounting Corp., a Korea Limited Liability Company and a member firm of the KPMG global organization of independent member firms affiliated with KPMG International Limited, a private English company limited by guarantee. All rights reserved. 52
Strictly Private & Confidential The LAMP
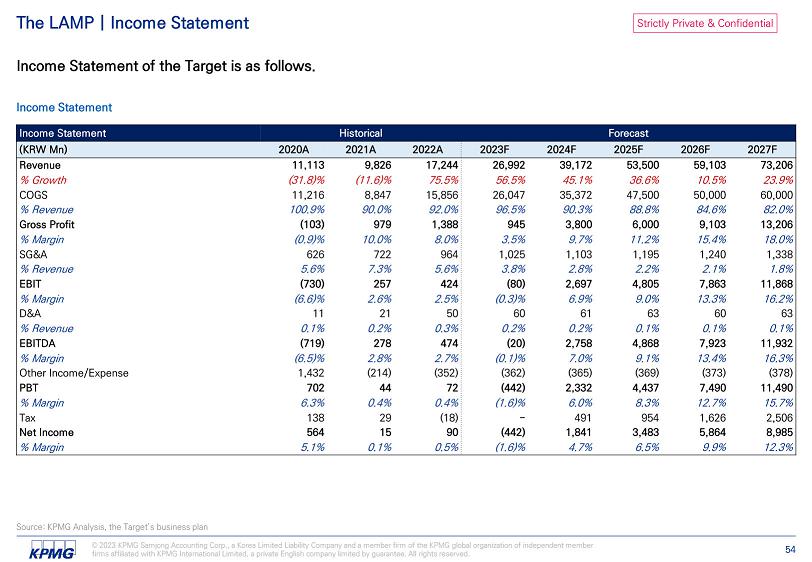
Strictly Private & Confidential © 2023 KPMG Samjong Accounting Corp., a Korea Limited Liability Company and a member firm of the KPMG global organization of independent member firms affiliated with KPMG International Limited, a private English company limited by guarantee. All rights reserved. 54 The LAMP | Income Statement Income Statement of the Target is as follows. Income Statement Source: KPMG Analysis, the Target’s business plan Forecast Historical Income Statement 2027F 2026F 2025F 2024F 2023F 2022A 2021A 2020A (KRW Mn) 73,206 59,103 53,500 39,172 26,992 17,244 9,826 11,113 Revenue 23.9% 10.5% 36.6% 45.1% 56.5% 75.5% (11.6)% (31.8)% % Growth 60,000 50,000 47,500 35,372 26,047 15,856 8,847 11,216 COGS 82.0% 84.6% 88.8% 90.3% 96.5% 92.0% 90.0% 100.9% % Revenue 13,206 9,103 6,000 3,800 945 1,388 979 (103) Gross Profit 18.0% 15.4% 11.2% 9.7% 3.5% 8.0% 10.0% (0.9)% % Margin 1,338 1,240 1,195 1,103 1,025 964 722 626 SG&A 1.8% 2.1% 2.2% 2.8% 3.8% 5.6% 7.3% 5.6% % Revenue 11,868 7,863 4,805 2,697 (80) 424 257 (730) EBIT 16.2% 13.3% 9.0% 6.9% (0.3)% 2.5% 2.6% (6.6)% % Margin 63 60 63 61 60 50 21 11 D&A 0.1% 0.1% 0.1% 0.2% 0.2% 0.3% 0.2% 0.1% % Revenue 11,932 7,923 4,868 2,758 (20) 474 278 (719) EBITDA 16.3% 13.4% 9.1% 7.0% (0.1)% 2.7% 2.8% (6.5)% % Margin (378) (373) (369) (365) (362) (352) (214) 1,432 Other Income/Expense 11,490 7,490 4,437 2,332 (442) 72 44 702 PBT 15.7% 12.7% 8.3% 6.0% (1.6)% 0.4% 0.4% 6.3% % Margin 2,506 1,626 954 491 - (18) 29 138 Tax 8,985 5,864 3,483 1,841 (442) 90 15 564 Net Income 12.3% 9.9% 6.5% 4.7% (1.6)% 0.5% 0.1% 5.1% % Margin

Strictly Private & Confidential © 2023 KPMG Samjong Accounting Corp., a Korea Limited Liability Company and a member firm of the KPMG global organization of independent member firms affiliated with KPMG International Limited, a private English company limited by guarantee. All rights reserved. 55 The LAMP | Income Statement in USD Income Statement of the Target in USD is as follows. Income Statement 1) Note: 1) The exchange rate of 1 USD to KRW 1,300 apply. Source: KPMG Analysis, the Target’s business plan Forecast Historical Income Statement 2027F 2026F 2025F 2024F 2023F 2022A 2021A 2020A (USD k) 56,313 45,464 41,154 30,132 20,763 13,265 7,558 8,548 Revenue 23.9% 10.5% 36.6% 45.1% 56.5% 75.5% (11.6)% (31.8)% % Growth 46,154 38,462 36,538 27,209 20,036 12,197 6,805 8,628 COGS 82.0% 84.6% 88.8% 90.3% 96.5% 92.0% 90.0% 100.9% % Revenue 10,159 7,002 4,615 2,923 727 1,067 753 (80) Gross Profit 18.0% 15.4% 11.2% 9.7% 3.5% 8.0% 10.0% (0.9)% % Margin 1,029 954 919 848 789 741 555 482 SG&A 1.8% 2.1% 2.2% 2.8% 3.8% 5.6% 7.3% 5.6% % Revenue 9,130 6,048 3,697 2,075 (62) 326 198 (561) EBIT 16.2% 13.3% 9.0% 6.9% (0.3)% 2.5% 2.6% (6.6)% % Margin 49 47 48 47 46 38 16 9 D&A 0.1% 0.1% 0.1% 0.2% 0.2% 0.3% 0.2% 0.1% % Revenue 9,178 6,095 3,745 2,121 (15) 364 214 (553) EBITDA 16.3% 13.4% 9.1% 7.0% (0.1)% 2.7% 2.8% (6.5)% % Margin (291) (287) (284) (281) (278) (271) (164) 1,101 Other Income/Expense 8,839 5,762 3,413 1,794 (340) 56 33 540 PBT 15.7% 12.7% 8.3% 6.0% (1.6)% 0.4% 0.4% 6.3% % Margin 1,928 1,251 734 378 - (14) 22 106 Tax 6,911 4,511 2,679 1,416 (340) 69 11 434 Net Income 12.3% 9.9% 6.5% 4.7% (1.6)% 0.5% 0.1% 5.1% % Margin

Strictly Private & Confidential Source: KPMG Analysis, the Target’s business plan © 2023 KPMG Samjong Accounting Corp., a Korea Limited Liability Company and a member firm of the KPMG global organization of independent member firms affiliated with KPMG International Limited, a private English company limited by guarantee. All rights reserved. 56 The LAMP | Balance Sheet Balance Sheet of the Target is as follows. Balance Sheet Forecast Historical Balance Sheet 2027F 2026F 2025F 2024F 2023F 2022A 2021A 2020A (KRW Mn) 43,157 33,385 27,230 22,918 20,386 20,112 17,096 14,263 Total Assets 22,742 13,694 7,723 4,291 2,437 2,443 2,495 5,235 Current Assets 18,070 9,810 4,053 1,552 425 950 1,479 5,197 Cash & Cash Equivalent 615 496 449 329 227 69 221 37 Account Receivables 3,999 3,332 3,166 2,357 1,736 1,373 740 - Inventory 14 11 11 8 6 6 1 1 Advance Payments 44 44 44 44 44 44 54 - Other Current Assets 20,416 19,691 19,507 18,627 17,949 17,669 14,601 9,027 Non - current Assets 15,921 15,924 15,922 15,924 15,924 15,935 13,783 7,870 PP&E 4,365 3,638 3,456 2,574 1,895 1,605 703 1,000 Intangible Assets 129 129 129 129 129 129 115 157 Other Non - current Assets 17,360 16,573 16,282 15,452 14,761 14,045 11,120 8,301 Total Liabilities 3,311 2,673 2,420 1,772 1,221 780 780 2,057 Advances from Customers 790 658 625 466 343 92 326 93 Other Payables 9,158 9,158 9,158 9,158 9,158 9,158 6,402 2,100 Debt (Short Term) 3,400 3,400 3,400 3,400 3,400 3,400 3,400 3,000 Debt (Long Term) 126 107 103 81 64 40 58 431 Other Current Liabilities 575 575 575 575 575 575 154 620 Other Non - Current Liabilities 25,797 16,813 10,948 7,466 5,625 6,067 5,977 5,962 Shareholders' Equity 25,797 16,813 10,948 7,466 5,625 6,067 5,977 5,962 Common Equity 1 1 1 1 1 1 1 1 Paid - in Capital 25,796 16,812 10,947 7,465 5,624 6,066 5,976 5,961 Retained Earnings
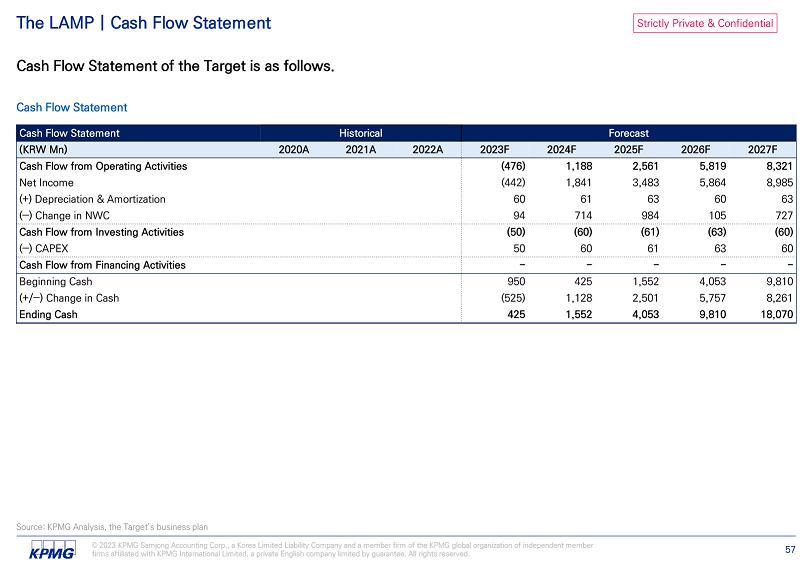
Strictly Private & Confidential Source: KPMG Analysis, the Target’s business plan © 2023 KPMG Samjong Accounting Corp., a Korea Limited Liability Company and a member firm of the KPMG global organization of independent member firms affiliated with KPMG International Limited, a private English company limited by guarantee. All rights reserved. 57 The LAMP | Cash Flow Statement Cash Flow Statement of the Target is as follows. Cash Flow Statement Forecast Historical Cash Flow Statement 2027F 2026F 2025F 2024F 2023F 2022A 2021A 2020A (KRW Mn) 8,321 5,819 2,561 1,188 (476) Cash Flow from Operating Activities 8,985 5,864 3,483 1,841 (442) Net Income 63 60 63 61 60 (+) Depreciation & Amortization 727 105 984 714 94 (‒) Change in NWC (60) (63) (61) (60) (50) Cash Flow from Investing Activities 60 63 61 60 50 (‒) CAPEX - - - - - Cash Flow from Financing Activities 9,810 4,053 1,552 425 950 Beginning Cash 8,261 5,757 2,501 1,128 (525) (+/‒) Change in Cash 18,070 9,810 4,053 1,552 425 Ending Cash
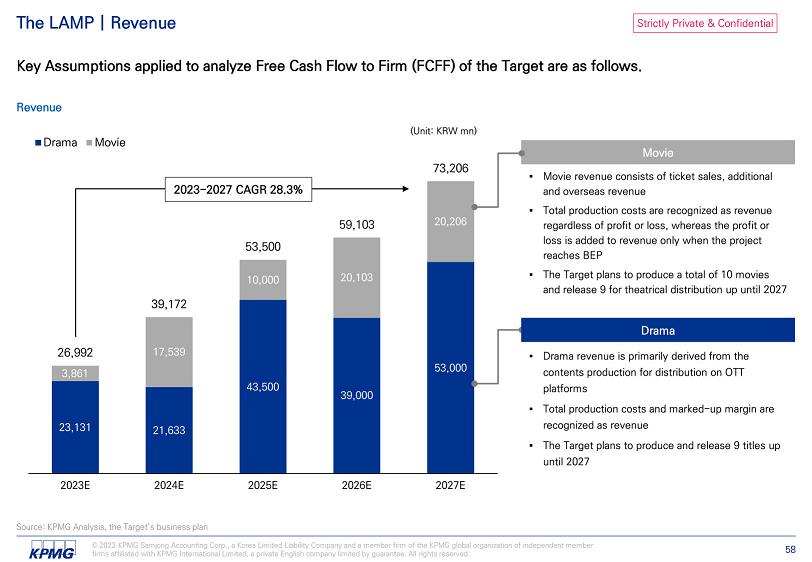
Strictly Private & Confidential The LAMP | Revenue Key Assumptions applied to analyze Free Cash Flow to Firm (FCFF) of the Target are as follows. Revenue 23,131 21,633 43,500 39,000 53,000 3,861 17,539 10,000 20,103 20,206 26,992 39,172 53,500 59,103 73,206 2023E 2024E 2025E 2026E 2027E Drama Movie (Unit: KRW mn) Movie Drama 2023 - 2027 CAGR 28.3% Source: KPMG Analysis, the Target’s business plan © 2023 KPMG Samjong Accounting Corp., a Korea Limited Liability Company and a member firm of the KPMG global organization of independent member firms affiliated with KPMG International Limited, a private English company limited by guarantee. All rights reserved. 58
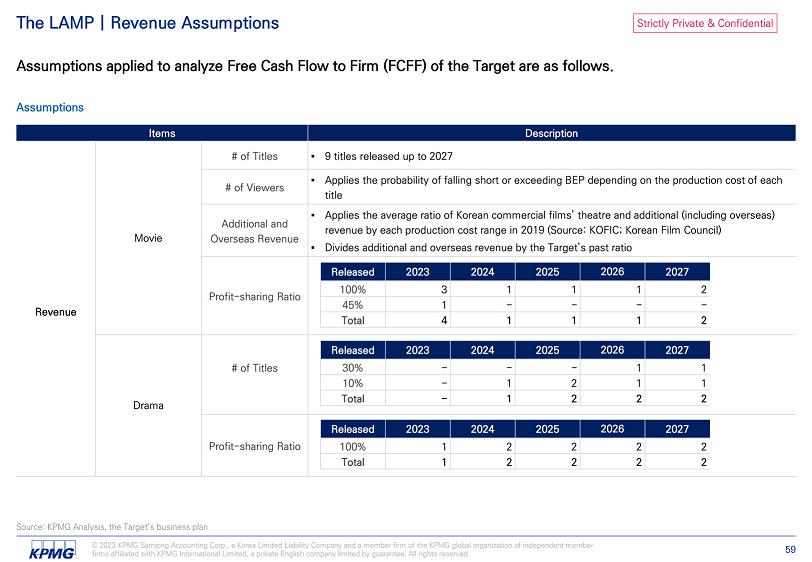
Strictly Private & Confidential The LAMP | Revenue Assumptions Assumptions applied to analyze Free Cash Flow to Firm (FCFF) of the Target are as follows. Assumptions Movie Revenue Drama Source: KPMG Analysis, the Target’s business plan © 2023 KPMG Samjong Accounting Corp., a Korea Limited Liability Company and a member firm of the KPMG global organization of independent member firms affiliated with KPMG International Limited, a private English company limited by guarantee. All rights reserved. 59
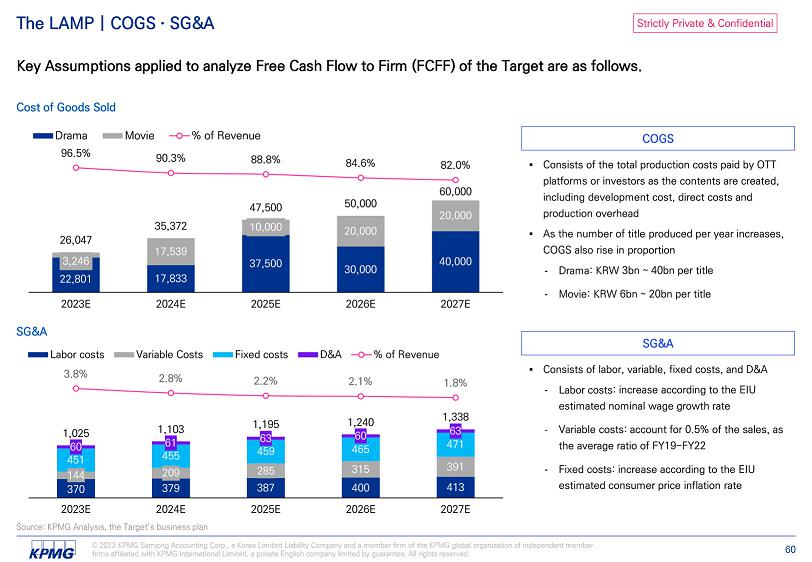
Strictly Private & Confidential The LAMP | COGS · SG&A Key Assumptions applied to analyze Free Cash Flow to Firm (FCFF) of the Target are as follows. Cost of Goods Sold 22,801 17,833 37,500 30,000 40,000 3,246 17,539 10,000 20,000 20,000 26,047 35,372 47,500 50,000 60,000 Drama 96.5% 90.3% 88.8% 84.6% 82.0% 2023E 2024E 2025E 2026E 2027E Movie % of Revenue SG&A 370 379 387 400 413 144 209 285 315 391 455 471 60 451 63 459 60 465 1,025 1,103 61 1,195 1,240 1,338 63 Labor costs 3.8% 2.8% 2.2% 2.1% 1.8% 2023E 2024E 2025E 2026E 2027E Variable Costs Fixed costs D&A % of Revenue COGS SG&A - Drama: KRW - Movie: KRW - Labor costs: - Fixed costs: increase according to the EIU estimated consumer price inflation rate Source: KPMG Analysis, the Target’s business plan © 2023 KPMG Samjong Accounting Corp., a Korea Limited Liability Company and a member firm of the KPMG global organization of independent member firms affiliated with KPMG International Limited, a private English company limited by guarantee. All rights reserved. 60

Strictly Private & Confidential The LAMP | COGS · SG&A Assumptions Assumptions applied to analyze Free Cash Flow to Firm (FCFF) of the Target are as follows. Assumptions Movie COGS Drama - Bonus : Assumes no bonus during forecast period - Employee Benefits, Severance Benefits: Applies the average ratio of salary in FY21 - FY22 Labor costs SG&A Fixed costs D&A Source: KPMG Analysis, the Target’s business plan © 2023 KPMG Samjong Accounting Corp., a Korea Limited Liability Company and a member firm of the KPMG global organization of independent member firms affiliated with KPMG International Limited, a private English company limited by guarantee. All rights reserved. 61

Strictly Private & Confidential The LAMP | CapEx · D&A · NWC Assumptions applied to analyze Free Cash Flow to Firm (FCFF) of the Target are as follows. Assumptions Forecast Historical CAPEX · D&A · NWC Terminal 2027F 2026F 2025F 2024F 2023F 2022A 2021A 2020A (KRW Mn) 60 63 61 60 50 CAPEX 63 60 63 61 60 D&A Net Working Capital 621 615 496 449 329 227 69 221 37 Accounts Receivable 4,039 3,999 3,332 3,166 2,357 1,736 1,373 740 - Inventory 14 14 11 11 8 6 6 1 1 Advance Payments 4,409 4,365 3,638 3,456 2,574 1,895 1,605 703 1,000 Investment 3,344 3,311 2,673 2,420 1,772 1,221 780 780 2,057 Advances from Customers 798 790 658 625 466 343 92 326 93 Other Payable 110 109 91 86 64 47 23 34 27 Accrued Expense 4,830 4,782 4,055 3,950 2,966 2,252 2,158 524 (1,139) Net Working Capital 48 727 105 984 714 94 1,634 1,664 (177) Changes in Net Working Capital CapEx, D&A - Accounts receivable: Assumed that the working capital days to revenue of FY22 will remain constant - Inventory, Advance payments, Investment: Assumed the working capital days to COGS of FY22 will remain constant - Other payable, Accrued expense: Assumed the working capital days to COGS of FY22 will remain constant - Advances from customers: Assumed the working capital days to revenue of FY22 will remain constant NWC Source: KPMG Analysis, the Target’s business plan © 2023 KPMG Samjong Accounting Corp., a Korea Limited Liability Company and a member firm of the KPMG global organization of independent member firms affiliated with KPMG International Limited, a private English company limited by guarantee. All rights reserved. 62
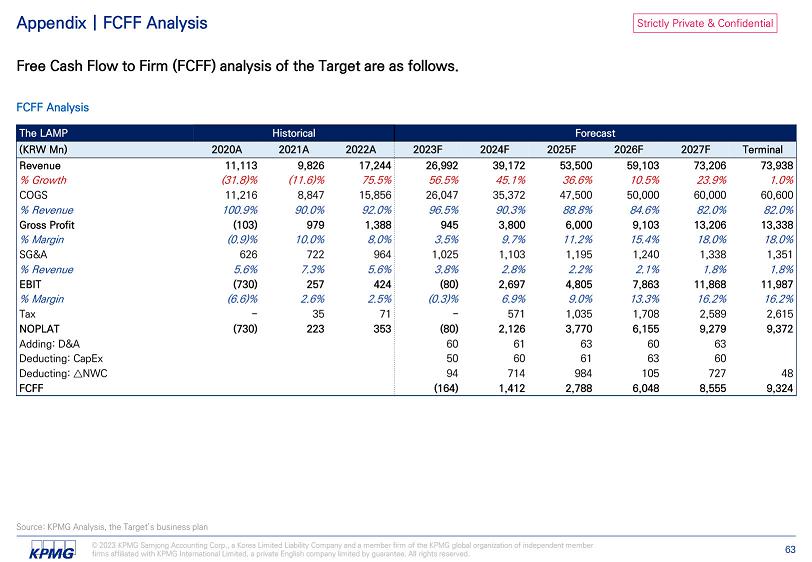
Strictly Private & Confidential Source: KPMG Analysis, the Target’s business plan © 2023 KPMG Samjong Accounting Corp., a Korea Limited Liability Company and a member firm of the KPMG global organization of independent member firms affiliated with KPMG International Limited, a private English company limited by guarantee. All rights reserved. 63 Appendix | FCFF Analysis Free Cash Flow to Firm (FCFF) analysis of the Target are as follows. FCFF Analysis Forecast Historical The LAMP Terminal 2027F 2026F 2025F 2024F 2023F 2022A 2021A 2020A (KRW Mn) 73,938 73,206 59,103 53,500 39,172 26,992 17,244 9,826 11,113 Revenue 1.0% 23.9% 10.5% 36.6% 45.1% 56.5% 75.5% (11.6)% (31.8)% % Growth 60,600 60,000 50,000 47,500 35,372 26,047 15,856 8,847 11,216 COGS 82.0% 82.0% 84.6% 88.8% 90.3% 96.5% 92.0% 90.0% 100.9% % Revenue 13,338 13,206 9,103 6,000 3,800 945 1,388 979 (103) Gross Profit 18.0% 18.0% 15.4% 11.2% 9.7% 3.5% 8.0% 10.0% (0.9)% % Margin 1,351 1,338 1,240 1,195 1,103 1,025 964 722 626 SG&A 1.8% 1.8% 2.1% 2.2% 2.8% 3.8% 5.6% 7.3% 5.6% % Revenue 11,987 11,868 7,863 4,805 2,697 (80) 424 257 (730) EBIT 16.2% 16.2% 13.3% 9.0% 6.9% (0.3)% 2.5% 2.6% (6.6)% % Margin 2,615 2,589 1,708 1,035 571 - 71 35 - Tax 9,372 9,279 6,155 3,770 2,126 (80) 353 223 (730) NOPLAT 63 60 63 61 60 Adding: D&A 60 63 61 60 50 Deducting: CapEx 48 727 105 984 714 94 Deducting: ټ NWC 9,324 8,555 6,048 2,788 1,412 (164) FCFF

Strictly Private & Confidential Appendix | FCFF Key Assumptions Key Assumptions applied to analyze Free Cash Flow to Firm (FCFF) of the Target are as follows. Key Assumptions Analysis Date Forecast Period Cash Flow Key Assumptions Terminal Growth Rate Income Tax Source: KPMG Analysis © 2023 KPMG Samjong Accounting Corp., a Korea Limited Liability Company and a member firm of the KPMG global organization of independent member firms affiliated with KPMG International Limited, a private English company limited by guarantee. All rights reserved. 64 Macroeconomic Indicators

Strictly Private & Confidential Appendix | Korean Film Market Although the film industry experienced a significant slowdown due to COVID - 19, there has been a gradual recovery attributed to an increase in average unit prices per audience and commercial film releases. Korean Film Market Size Profitability of Korean Commercial Films 2) Notes: 1) Including TV VOD, broadcast rights, online, and DVD Blu - ray; 2) calculated based on films with total production cost of more than KRW 3bn and the return is the total sales minus total costs, divided - Four films have achieved high returns of over 100% in the post - pandemic era 2022 2021 2020 2019 2018 2017 36 17 29 45 40 37 Number of films surveyed 0.3% (22.9)% (34.1)% 10.9% (4.8)% 18.0% Rates of Return 7 3 5 20 16 15 Number of titles exceeding BEP 19.4% 17.6% 17.2% 44.4% 40.0% 40.5% % of total titles 1 3 5 10 6 5 BEP ~ 50% 6 - - 5 7 5 50 ~ 100% 4 - - 5 3 5 Above 100% 29 14 24 25 24 22 Number of titles below BEP 80.6% 82.4% 82.8% 55.6% 60.0% 59.5% % of total titles 12 9 9 9 13 11 BEP ~ - 50% 17 5 15 16 11 11 Below - 50% 54 72 161 420 438 293 187 89 86 92 56 92 97 ₩8,286 ₩8,396 ₩8,660 ₩9,518 ₩10,049 1,814 2018A 628 286 388 98 63 664 1,160 585 510 1,914 2027E 2022A 2021A 2020A 2019A (unit: KRW bn) ₩12,787 OTT Overseas Theater sales TV VOD and others 1) Theater sales per audience by total production cost / Source: Press Release, Korean Film Council, KPMG Analysis © 2023 KPMG Samjong Accounting Corp., a Korea Limited Liability Company and a member firm of the KPMG global organization of independent member firms affiliated with KPMG International Limited, a private English company limited by guarantee. All rights reserved. 65

Strictly Private & Confidential Appendix | Korean OTT Contents Market Netflix, the No. 1 OTT platform in Korea, has been successful in domestic and foreign markets through original Korean content, and investment in Korean content, which is more efficient than in other countries, is expected to continue. Investments in Korean Contents by Netflix and Original Titles Korean OTT Contents Market Trend Reorganize to focus on a small number of OTT companies that have successfully invested in bold content ▪ Netflix has secured competitive content by guaranteeing a high margin rate compared to existing distribution channels, and based on this, it has expanded its market share ▪ As the growth of the OTT market slows, companies with weak content and subscriber base will be eliminated and Netflix - oriented OTT content production will be strengthened Netflix's Continuous Investment Expected due to High Investment Efficiency in Korean Content ▪ Netflix announced plans to expand investment in non - English - speaking content, and "Two out of three top - rated non - English - speaking content in 2021 are Korean content." ▪ Korean content production costs are 1/10th that of the United States, and Korean content is expected to benefit from expanding investment in non - English content due to its high efficiency compared to production costs The Limited Expansion of OTT Original Film Production Expected ▪ Drama can expand the content consumption period from weeks to months by dividing the season and releasing one drama every week ▪ On the other hand, the expansion of original contents of the movie is expected to be limited as the consumption period of the movie is short from 1 to 2 days, which is disadvantageous in terms of maintaining the number of subscribers 15 82 92 248 333 550 - 1 1 5 9 20 24 2016 2017 2018 2019 2020 2021 2022 Investment in Korean contents by Netflix The number of Netflix Korean original titles 1) Note: 1) Includes movies, dramas, entertainment shows, documentaries and animations / Source: Press Release, Expert Interview, Netflix, KPMG Analysis © 2023 KPMG Samjong Accounting Corp., a Korea Limited Liability Company and a member firm of the KPMG global organization of independent member firms affiliated with KPMG International Limited, a private English company limited by guarantee. All rights reserved. 66 (Unit: KRW bn, titles)
Strictly Private & Confidential Bidangil Pictures
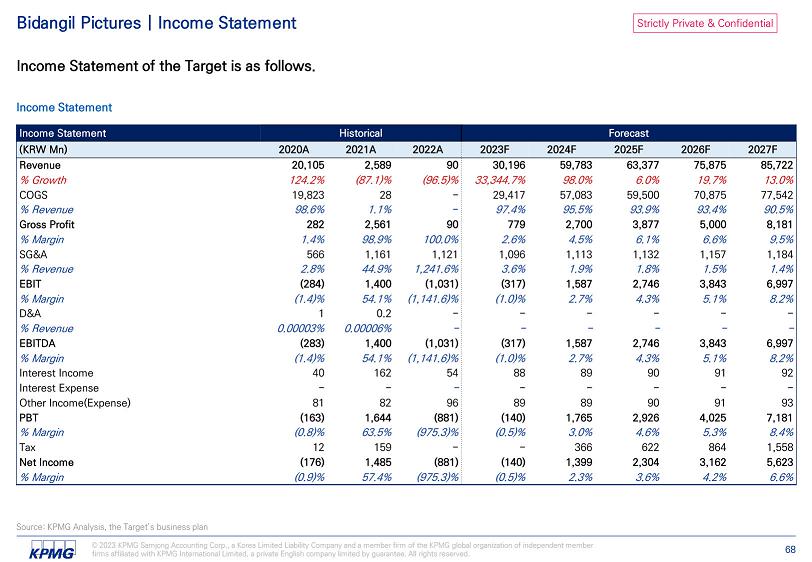
Strictly Private & Confidential © 2023 KPMG Samjong Accounting Corp., a Korea Limited Liability Company and a member firm of the KPMG global organization of independent member firms affiliated with KPMG International Limited, a private English company limited by guarantee. All rights reserved. 68 Bidangil Pictures | Income Statement Income Statement of the Target is as follows. Income Statement Source: KPMG Analysis, the Target’s business plan Forecast Historical Income Statement 2027F 2026F 2025F 2024F 2023F 2022A 2021A 2020A (KRW Mn) 85,722 75,875 63,377 59,783 30,196 90 2,589 20,105 Revenue 13.0% 19.7% 6.0% 98.0% 33,344.7% (96.5)% (87.1)% 124.2% % Growth 77,542 70,875 59,500 57,083 29,417 - 28 19,823 COGS 90.5% 93.4% 93.9% 95.5% 97.4% - 1.1% 98.6% % Revenue 8,181 5,000 3,877 2,700 779 90 2,561 282 Gross Profit 9.5% 6.6% 6.1% 4.5% 2.6% 100.0% 98.9% 1.4% % Margin 1,184 1,157 1,132 1,113 1,096 1,121 1,161 566 SG&A 1.4% 1.5% 1.8% 1.9% 3.6% 1,241.6% 44.9% 2.8% % Revenue 6,997 3,843 2,746 1,587 (317) (1,031) 1,400 (284) EBIT 8.2% 5.1% 4.3% 2.7% (1.0)% (1,141.6)% 54.1% (1.4)% % Margin - - - - - - 0.2 1 D&A - - - - - - 0.00006% 0.00003% % Revenue 6,997 3,843 2,746 1,587 (317) (1,031) 1,400 (283) EBITDA 8.2% 5.1% 4.3% 2.7% (1.0)% (1,141.6)% 54.1% (1.4)% % Margin 92 91 90 89 88 54 162 40 Interest Income - - - - - - - - Interest Expense 93 91 90 89 89 96 82 81 Other Income(Expense) 7,181 4,025 2,926 1,765 (140) (881) 1,644 (163) PBT 8.4% 5.3% 4.6% 3.0% (0.5)% (975.3)% 63.5% (0.8)% % Margin 1,558 864 622 366 - - 159 12 Tax 5,623 3,162 2,304 1,399 (140) (881) 1,485 (176) Net Income 6.6% 4.2% 3.6% 2.3% (0.5)% (975.3)% 57.4% (0.9)% % Margin
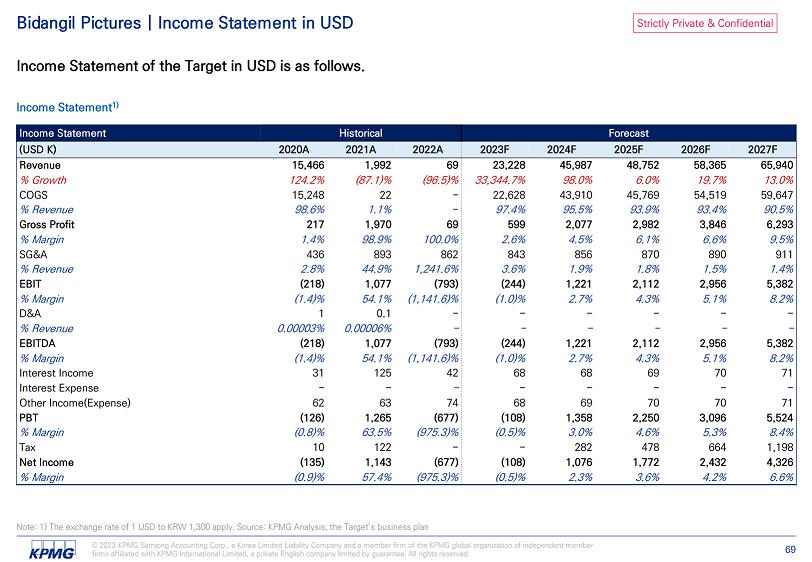
Strictly Private & Confidential © 2023 KPMG Samjong Accounting Corp., a Korea Limited Liability Company and a member firm of the KPMG global organization of independent member firms affiliated with KPMG International Limited, a private English company limited by guarantee. All rights reserved. 69 Bidangil Pictures | Income Statement in USD Income Statement of the Target in USD is as follows. Income Statement 1) Note: 1) The exchange rate of 1 USD to KRW 1,300 apply. Source: KPMG Analysis, the Target’s business plan Forecast Historical Income Statement 2027F 2026F 2025F 2024F 2023F 2022A 2021A 2020A (USD K) 65,940 58,365 48,752 45,987 23,228 69 1,992 15,466 Revenue 13.0% 19.7% 6.0% 98.0% 33,344.7% (96.5)% (87.1)% 124.2% % Growth 59,647 54,519 45,769 43,910 22,628 - 22 15,248 COGS 90.5% 93.4% 93.9% 95.5% 97.4% - 1.1% 98.6% % Revenue 6,293 3,846 2,982 2,077 599 69 1,970 217 Gross Profit 9.5% 6.6% 6.1% 4.5% 2.6% 100.0% 98.9% 1.4% % Margin 911 890 870 856 843 862 893 436 SG&A 1.4% 1.5% 1.8% 1.9% 3.6% 1,241.6% 44.9% 2.8% % Revenue 5,382 2,956 2,112 1,221 (244) (793) 1,077 (218) EBIT 8.2% 5.1% 4.3% 2.7% (1.0)% (1,141.6)% 54.1% (1.4)% % Margin - - - - - - 0.1 1 D&A - - - - - - 0.00006% 0.00003% % Revenue 5,382 2,956 2,112 1,221 (244) (793) 1,077 (218) EBITDA 8.2% 5.1% 4.3% 2.7% (1.0)% (1,141.6)% 54.1% (1.4)% % Margin 71 70 69 68 68 42 125 31 Interest Income - - - - - - - - Interest Expense 71 70 70 69 68 74 63 62 Other Income(Expense) 5,524 3,096 2,250 1,358 (108) (677) 1,265 (126) PBT 8.4% 5.3% 4.6% 3.0% (0.5)% (975.3)% 63.5% (0.8)% % Margin 1,198 664 478 282 - - 122 10 Tax 4,326 2,432 1,772 1,076 (108) (677) 1,143 (135) Net Income 6.6% 4.2% 3.6% 2.3% (0.5)% (975.3)% 57.4% (0.9)% % Margin
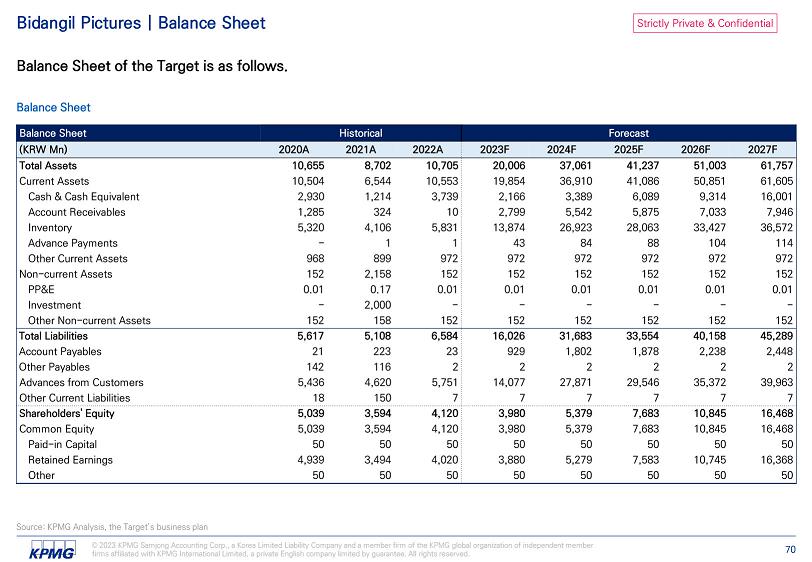
Strictly Private & Confidential Source: KPMG Analysis, the Target’s business plan © 2023 KPMG Samjong Accounting Corp., a Korea Limited Liability Company and a member firm of the KPMG global organization of independent member firms affiliated with KPMG International Limited, a private English company limited by guarantee. All rights reserved. 70 Bidangil Pictures | Balance Sheet Balance Sheet of the Target is as follows. Balance Sheet Forecast Historical Balance Sheet 2027F 2026F 2025F 2024F 2023F 2022A 2021A 2020A (KRW Mn) 61,757 51,003 41,237 37,061 20,006 10,705 8,702 10,655 Total Assets 61,605 50,851 41,086 36,910 19,854 10,553 6,544 10,504 Current Assets 16,001 9,314 6,089 3,389 2,166 3,739 1,214 2,930 Cash & Cash Equivalent 7,946 7,033 5,875 5,542 2,799 10 324 1,285 Account Receivables 36,572 33,427 28,063 26,923 13,874 5,831 4,106 5,320 Inventory 114 104 88 84 43 1 1 - Advance Payments 972 972 972 972 972 972 899 968 Other Current Assets 152 152 152 152 152 152 2,158 152 Non - current Assets 0.01 0.01 0.01 0.01 0.01 0.01 0.17 0.01 PP&E - - - - - - 2,000 - Investment 152 152 152 152 152 152 158 152 Other Non - current Assets 45,289 40,158 33,554 31,683 16,026 6,584 5,108 5,617 Total Liabilities 2,448 2,238 1,878 1,802 929 23 223 21 Account Payables 2 2 2 2 2 2 116 142 Other Payables 39,963 35,372 29,546 27,871 14,077 5,751 4,620 5,436 Advances from Customers 7 7 7 7 7 7 150 18 Other Current Liabilities 16,468 10,845 7,683 5,379 3,980 4,120 3,594 5,039 Shareholders' Equity 16,468 10,845 7,683 5,379 3,980 4,120 3,594 5,039 Common Equity 50 50 50 50 50 50 50 50 Paid - in Capital 16,368 10,745 7,583 5,279 3,880 4,020 3,494 4,939 Retained Earnings 50 50 50 50 50 50 50 50 Other

Strictly Private & Confidential Source: KPMG Analysis, the Target’s business plan © 2023 KPMG Samjong Accounting Corp., a Korea Limited Liability Company and a member firm of the KPMG global organization of independent member firms affiliated with KPMG International Limited, a private English company limited by guarantee. All rights reserved. 71 Bidangil Pictures | Cash Flow Statement Cash Flow Statement of the Target is as follows. Cash Flow Statement Forecast Historical Cash Flow Statement 2027F 2026F 2025F 2024F 2023F 2022A 2021A 2020A (KRW Mn) 6,687 3,225 2,699 1,224 (1,573) Cash Flow from Operating Activities 5,623 3,162 2,304 1,399 (140) Net Income (1,064) (64) (395) 175 1,433 (‒) Change in NWC - - - - - Cash Flow from Investing Activities - - - - - Cash Flow from Financing Activities 9,314 6,089 3,389 2,166 3,739 Beginning Cash 6,687 3,225 2,699 1,224 (1,573) (+/‒) Change in Cash 16,001 9,314 6,089 3,389 2,166 Ending Cash
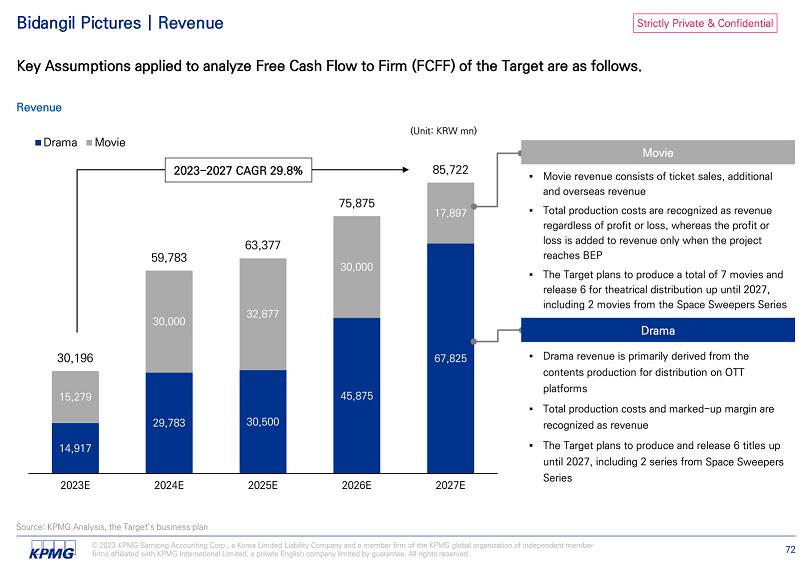
Strictly Private & Confidential Bidangil Pictures | Revenue Key Assumptions applied to analyze Free Cash Flow to Firm (FCFF) of the Target are as follows. Revenue 14,917 29,783 30,500 45,875 67,825 15,279 30,000 32,877 30,000 30,196 59,783 63,377 75,875 17,897 85,722 2023E 2024E 2025E 2026E 2027E Drama Movie (Unit: KRW mn) Space Sweepers Series Movie Drama Space Sweepers Series 2023 - 2027 CAGR 29.8% Source: KPMG Analysis, the Target’s business plan © 2023 KPMG Samjong Accounting Corp., a Korea Limited Liability Company and a member firm of the KPMG global organization of independent member firms affiliated with KPMG International Limited, a private English company limited by guarantee. All rights reserved. 72
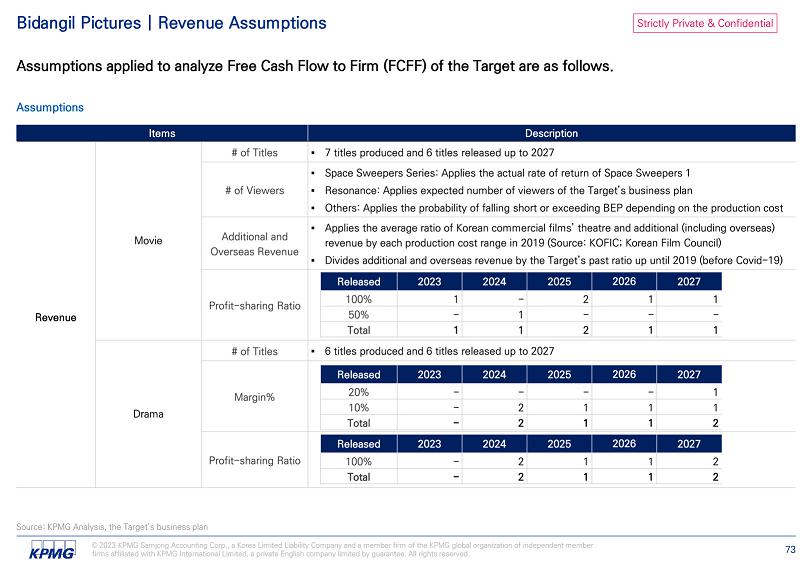
Strictly Private & Confidential Bidangil Pictures | Revenue Assumptions Assumptions applied to analyze Free Cash Flow to Firm (FCFF) of the Target are as follows. Assumptions Revenue Source: KPMG Analysis, the Target’s business plan © 2023 KPMG Samjong Accounting Corp., a Korea Limited Liability Company and a member firm of the KPMG global organization of independent member firms affiliated with KPMG International Limited, a private English company limited by guarantee. All rights reserved. 73 Movie Drama
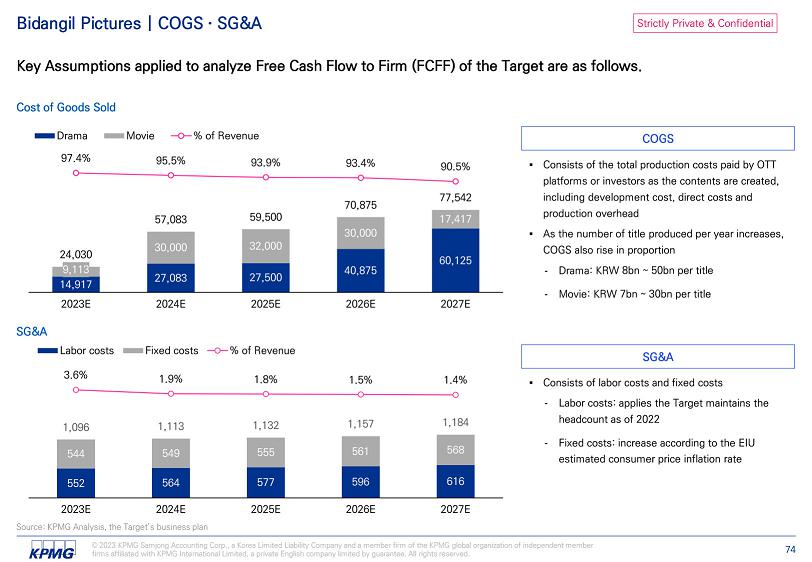
Strictly Private & Confidential Bidangil Pictures | COGS · SG&A Key Assumptions applied to analyze Free Cash Flow to Firm (FCFF) of the Target are as follows. Cost of Goods Sold 14,917 27,083 27,500 40,875 60,125 9,113 30,000 32,000 30,000 17,417 24,030 57,083 59,500 70,875 77,542 97.4% 95.5% 93.9% 93.4% 90.5% 2023E 2024E 2025E 2026E 2027E Drama Movie % of Revenue SG&A 568 561 555 549 544 616 596 577 564 552 2027E 2026E 2025E 2024E 2023E 1,096 1,113 1,132 1,157 1,184 3.6% 1.9% 1.8% 1.5% 1.4% Labor costs Fixed costs % of Revenue - Drama: KRW - Movie: KRW COGS SG&A - Labor costs: - Fixed costs: increase according to the EIU estimated consumer price inflation rate Source: KPMG Analysis, the Target’s business plan © 2023 KPMG Samjong Accounting Corp., a Korea Limited Liability Company and a member firm of the KPMG global organization of independent member firms affiliated with KPMG International Limited, a private English company limited by guarantee. All rights reserved. 74
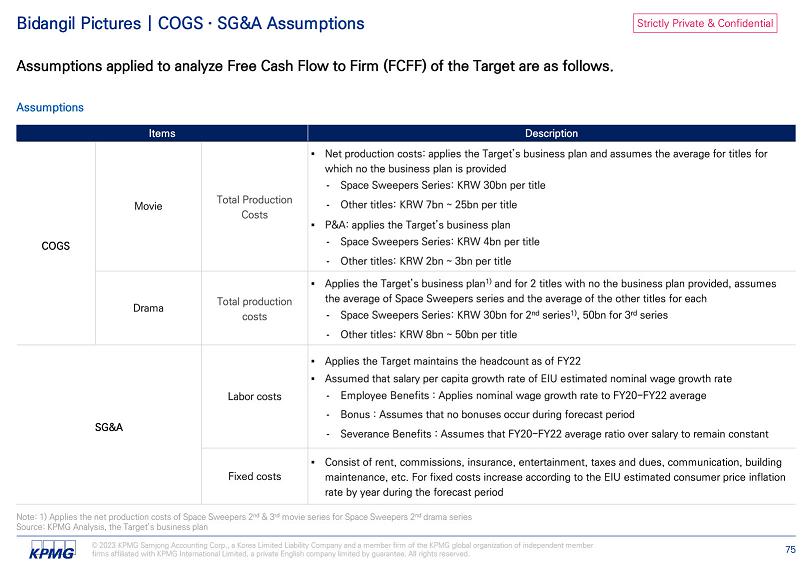
Strictly Private & Confidential Bidangil Pictures | COGS · SG&A Assumptions Assumptions applied to analyze Free Cash Flow to Firm (FCFF) of the Target are as follows. Assumptions Note: 1) Applies the net production costs of Space Sweepers 2 nd & 3 rd movie series for Space Sweepers 2 nd drama series - Space Sweepers Series: KRW 30bn per title - Other titles: KRW 7bn ~ 25bn per title - Space Sweepers Series: KRW 4bn per title - Other titles: KRW 2bn ~ 3bn per title Movie COGS - Space Sweepers Series: KRW 30bn for 2 nd series 1) , 50bn for 3 rd series - Other titles: KRW 8bn ~ 50bn per title Drama - Employee Benefits : Applies nominal wage growth rate to FY20 - FY22 average - Bonus : Assumes that no bonuses occur during forecast period - Severance Benefits : Assumes that FY20 - FY22 average ratio over salary to remain constant Labor costs SG&A Fixed costs Source: KPMG Analysis, the Target’s business plan © 2023 KPMG Samjong Accounting Corp., a Korea Limited Liability Company and a member firm of the KPMG global organization of independent member firms affiliated with KPMG International Limited, a private English company limited by guarantee. All rights reserved. 75
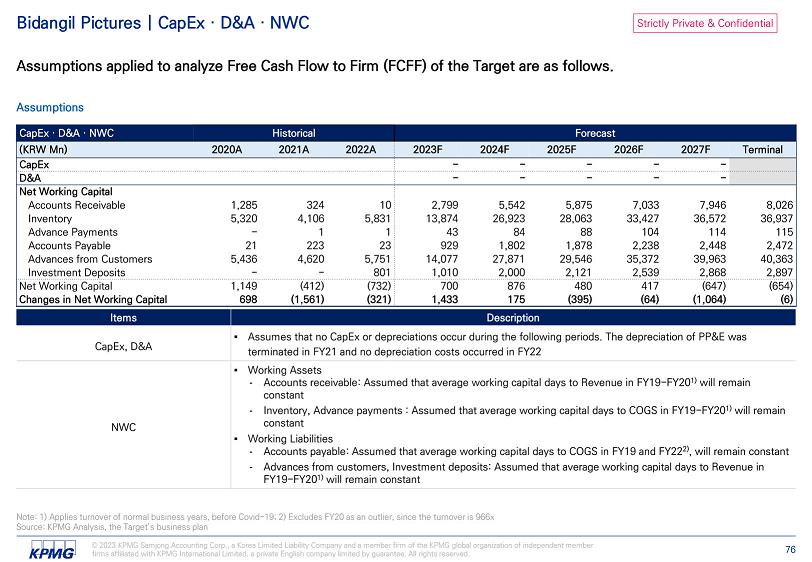
Strictly Private & Confidential Bidangil Pictures | CapEx · D&A · NWC Assumptions applied to analyze Free Cash Flow to Firm (FCFF) of the Target are as follows. Assumptions Note: 1) Applies turnover of normal business years, before Covid - 19; 2) Excludes FY20 as an outlier, since the turnover is 966x Forecast Historical CapEx · D&A · NWC Terminal 2027F 2026F 2025F 2024F 2023F 2022A 2021A 2020A (KRW Mn) - - - - - CapEx - - - - - D&A Net Working Capital 8,026 7,946 7,033 5,875 5,542 2,799 10 324 1,285 Accounts Receivable 36,937 36,572 33,427 28,063 26,923 13,874 5,831 4,106 5,320 Inventory 115 114 104 88 84 43 1 1 - Advance Payments 2,472 2,448 2,238 1,878 1,802 929 23 223 21 Accounts Payable 40,363 39,963 35,372 29,546 27,871 14,077 5,751 4,620 5,436 Advances from Customers 2,897 2,868 2,539 2,121 2,000 1,010 801 - - Investment Deposits (654) (647) 417 480 876 700 (732) (412) 1,149 Net Working Capital (6) (1,064) (64) (395) 175 1,433 (321) (1,561) 698 Changes in Net Working Capital CapEx, D&A - Accounts receivable: Assumed that average working capital days to Revenue in FY19 - FY20 1) will remain constant - Inventory, Advance payments : Assumed that average working capital days to COGS in FY19 - FY20 1) will remain constant - Accounts payable: Assumed that average working capital days to COGS in FY19 and FY22 2) , will remain constant - Advances from customers, Investment deposits: Assumed that average working capital days to Revenue in FY19 - FY20 1) will remain constant NWC Source: KPMG Analysis, the Target’s business plan © 2023 KPMG Samjong Accounting Corp., a Korea Limited Liability Company and a member firm of the KPMG global organization of independent member firms affiliated with KPMG International Limited, a private English company limited by guarantee. All rights reserved. 76

Strictly Private & Confidential Source: KPMG Analysis, the Target’s business plan © 2023 KPMG Samjong Accounting Corp., a Korea Limited Liability Company and a member firm of the KPMG global organization of independent member firms affiliated with KPMG International Limited, a private English company limited by guarantee. All rights reserved. 77 Appendix | FCFF Analysis Free Cash Flow to Firm (FCFF) analysis of the Target are as follows. FCFF Analysis Forecast Historical Bidangil Pictures Terminal 2027F 2026F 2025F 2024F 2023F 2022A 2021A 2020A (KRW Mn) 86,580 85,722 75,875 63,377 59,783 30,196 90 2,589 20,105 Revenue 1.0% 13.0% 19.7% 6.0% 98.0% 33344.7% (96.5)% (87.1)% 124.2% % Growth 78,317 77,542 70,875 59,500 57,083 29,417 - 28 19,823 COGS 90.5% 90.5% 93.4% 93.9% 95.5% 97.4% - 1.1% 98.6% % Revenue 8,263 8,181 5,000 3,877 2,700 779 90 2,561 282 Gross Profit 9.5% 9.5% 6.6% 6.1% 4.5% 2.6% 100.0% 98.9% 1.4% % Margin 1,196 1,184 1,157 1,132 1,113 1,096 1,121 1,161 566 SG&A 1.4% 1.4% 1.5% 1.8% 1.9% 3.6% 1241.6% 44.9% 2.8% % Revenue 7,067 6,997 3,843 2,746 1,587 (317) (1,031) 1,400 (284) EBIT 8.2% 8.2% 5.1% 4.3% 2.7% (1.0)% (1141.6)% 54.1% (1.4)% % Margin 1,533 1,517 824 582 327 - - 286 - Tax 5,534 5,479 3,020 2,164 1,260 (317) (1,031) 1,114 (284) NOPLAT - - - - - Adding: D&A - - - - - Deducting: CapEx (6) (1,064) (64) (395) 175 1,433 Deducting: ټ NWC 5,540 6,543 3,083 2,559 1,085 (1,750) FCFF

Strictly Private & Confidential Appendix | FCFF Key Assumptions Key Assumptions applied to analyze Free Cash Flow to Firm (FCFF) of the Target are as follows. Key Assumptions Analysis Date Forecast Period Cash Flow Key Assumptions Terminal Growth Rate Income Tax Source: KPMG Analysis © 2023 KPMG Samjong Accounting Corp., a Korea Limited Liability Company and a member firm of the KPMG global organization of independent member firms affiliated with KPMG International Limited, a private English company limited by guarantee. All rights reserved. 78 Macroeconomic Indicators

Strictly Private & Confidential Appendix | Korean Film Market Although the film industry experienced a significant slowdown due to COVID - 19, there has been a gradual recovery attributed to an increase in average unit prices per audience and commercial film releases. Korean Film Market Size Profitability of Korean Commercial Films 2) Notes: 1) Including TV VOD, broadcast rights, online, and DVD Blu - ray; 2) calculated based on films with total production cost of more than KRW 3bn and the return is the total sales minus total costs, divided - Four films have achieved high returns of over 100% in the post - pandemic era 54 72 161 420 438 293 187 89 86 92 56 92 97 ₩8,286 ₩8,396 ₩8,660 ₩9,518 ₩10,049 1,814 2018A 628 286 388 98 63 664 1,160 585 510 1,914 2027E 2022A 2021A 2020A 2019A (unit: KRW bn) ₩12,787 OTT Overseas Theater sales TV VOD and others 1) Theater sales per audience by total production cost / Source: Press Release, Korean Film Council, KPMG Analysis © 2023 KPMG Samjong Accounting Corp., a Korea Limited Liability Company and a member firm of the KPMG global organization of independent member firms affiliated with KPMG International Limited, a private English company limited by guarantee. All rights reserved. 79 2022 2021 2020 2019 2018 2017 36 17 29 45 40 37 Number of films surveyed 0.3% (22.9)% (34.1)% 10.9% (4.8)% 18.0% Rates of Return 7 3 5 20 16 15 Number of titles exceeding BEP 19.4% 17.6% 17.2% 44.4% 40.0% 40.5% % of total titles 1 3 5 10 6 5 BEP ~ 50% 6 - - 5 7 5 50 ~ 100% 4 - - 5 3 5 Above 100% 29 14 24 25 24 22 Number of titles below BEP 80.6% 82.4% 82.8% 55.6% 60.0% 59.5% % of total titles 12 9 9 9 13 11 BEP ~ - 50% 17 5 15 16 11 11 Below - 50%

Strictly Private & Confidential Appendix | Korean OTT Contents Market Netflix, the No. 1 OTT platform in Korea, has been successful in domestic and foreign markets through original Korean content, and investment in Korean content, which is more efficient than in other countries, is expected to continue. Investments in Korean Contents by Netflix and Original Titles Korean OTT Contents Market Trend Reorganize to focus on a small number of OTT companies that have successfully invested in bold content ▪ Netflix has secured competitive content by guaranteeing a high margin rate compared to existing distribution channels, and based on this, it has expanded its market share ▪ As the growth of the OTT market slows, companies with weak content and subscriber base will be eliminated and Netflix - oriented OTT content production will be strengthened Netflix's Continuous Investment Expected due to High Investment Efficiency in Korean Content ▪ Netflix announced plans to expand investment in non - English - speaking content, and "Two out of three top - rated non - English - speaking content in 2021 are Korean content." ▪ Korean content production costs are 1/10th that of the United States, and Korean content is expected to benefit from expanding investment in non - English content due to its high efficiency compared to production costs The Limited Expansion of OTT Original Film Production Expected ▪ Drama can expand the content consumption period from weeks to months by dividing the season and releasing one drama every week ▪ On the other hand, the expansion of original contents of the movie is expected to be limited as the consumption period of the movie is short from 1 to 2 days, which is disadvantageous in terms of maintaining the number of subscribers 15 82 92 248 333 550 - 1 1 5 9 20 24 2016 2017 2018 2019 2020 2021 2022 Investment in Korean contents by Netflix The number of Netflix Korean original titles 1) Note: 1) Includes movies, dramas, entertainment shows, documentaries and animations / Source: Press Release, Expert Interview, Netflix, KPMG Analysis © 2023 KPMG Samjong Accounting Corp., a Korea Limited Liability Company and a member firm of the KPMG global organization of independent member firms affiliated with KPMG International Limited, a private English company limited by guarantee. All rights reserved. 80 (Unit: KRW bn, titles)
Strictly Private & Confidential Apeitda
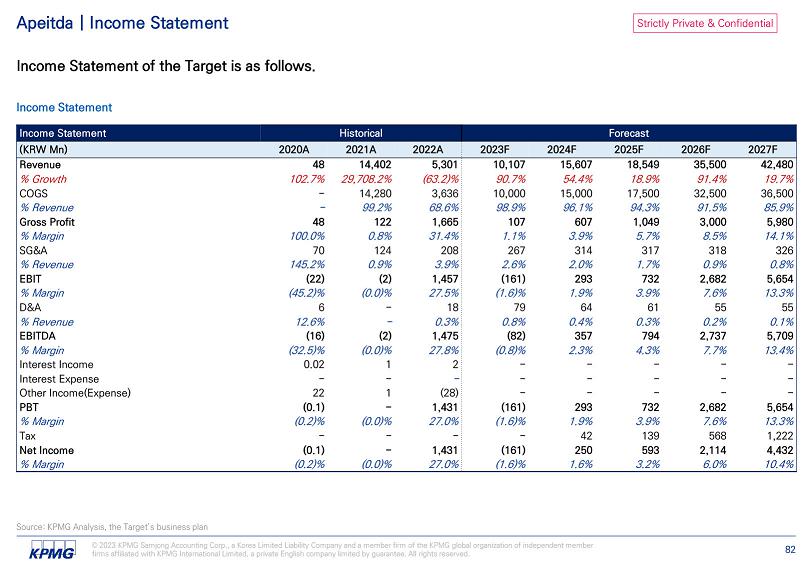
Strictly Private & Confidential © 2023 KPMG Samjong Accounting Corp., a Korea Limited Liability Company and a member firm of the KPMG global organization of independent member firms affiliated with KPMG International Limited, a private English company limited by guarantee. All rights reserved. 82 Apeitda | Income Statement Income Statement of the Target is as follows. Income Statement Source: KPMG Analysis, the Target’s business plan Forecast Historical Income Statement 2027F 2026F 2025F 2024F 2023F 2022A 2021A 2020A (KRW Mn) 42,480 35,500 18,549 15,607 10,107 5,301 14,402 48 Revenue 19.7% 91.4% 18.9% 54.4% 90.7% (63.2)% 29,708.2% 102.7% % Growth 36,500 32,500 17,500 15,000 10,000 3,636 14,280 - COGS 85.9% 91.5% 94.3% 96.1% 98.9% 68.6% 99.2% - % Revenue 5,980 3,000 1,049 607 107 1,665 122 48 Gross Profit 14.1% 8.5% 5.7% 3.9% 1.1% 31.4% 0.8% 100.0% % Margin 326 318 317 314 267 208 124 70 SG&A 0.8% 0.9% 1.7% 2.0% 2.6% 3.9% 0.9% 145.2% % Revenue 5,654 2,682 732 293 (161) 1,457 (2) (22) EBIT 13.3% 7.6% 3.9% 1.9% (1.6)% 27.5% (0.0)% (45.2)% % Margin 55 55 61 64 79 18 - 6 D&A 0.1% 0.2% 0.3% 0.4% 0.8% 0.3% - 12.6% % Revenue 5,709 2,737 794 357 (82) 1,475 (2) (16) EBITDA 13.4% 7.7% 4.3% 2.3% (0.8)% 27.8% (0.0)% (32.5)% % Margin - - - - - 2 1 0.02 Interest Income - - - - - - - - Interest Expense - - - - - (28) 1 22 Other Income(Expense) 5,654 2,682 732 293 (161) 1,431 - (0.1) PBT 13.3% 7.6% 3.9% 1.9% (1.6)% 27.0% (0.0)% (0.2)% % Margin 1,222 568 139 42 - - - - Tax 4,432 2,114 593 250 (161) 1,431 - (0.1) Net Income 10.4% 6.0% 3.2% 1.6% (1.6)% 27.0% (0.0)% (0.2)% % Margin
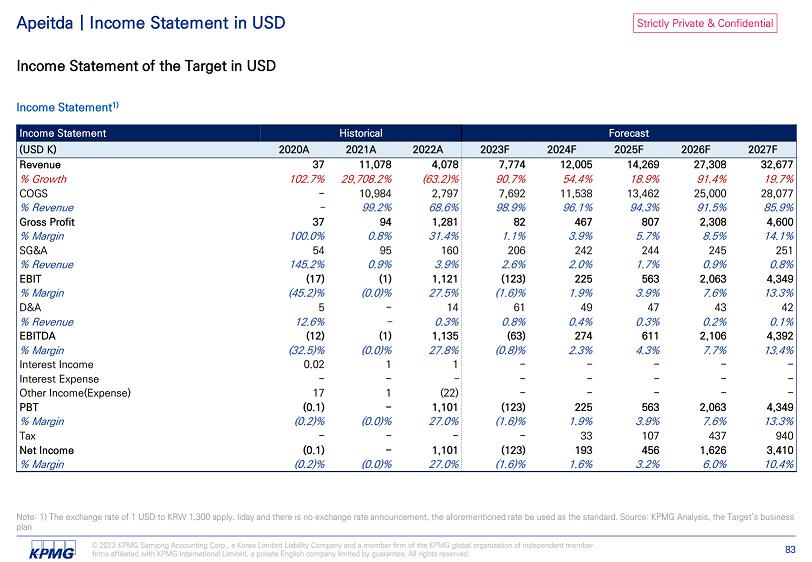
Strictly Private & Confidential © 2023 KPMG Samjong Accounting Corp., a Korea Limited Liability Company and a member firm of the KPMG global organization of independent member firms affiliated with KPMG International Limited, a private English company limited by guarantee. All rights reserved. 83 Apeitda | Income Statement in USD Income Statement of the Target in USD Income Statement 1) Note: 1) The exchange rate of 1 USD to KRW 1,300 apply. liday and there is no exchange rate announcement, the aforementioned rate be used as the standard. Source: KPMG Analysis, the Target’s business plan Forecast Historical Income Statement 2027F 2026F 2025F 2024F 2023F 2022A 2021A 2020A (USD K) 32,677 27,308 14,269 12,005 7,774 4,078 11,078 37 Revenue 19.7% 91.4% 18.9% 54.4% 90.7% (63.2)% 29,708.2% 102.7% % Growth 28,077 25,000 13,462 11,538 7,692 2,797 10,984 - COGS 85.9% 91.5% 94.3% 96.1% 98.9% 68.6% 99.2% - % Revenue 4,600 2,308 807 467 82 1,281 94 37 Gross Profit 14.1% 8.5% 5.7% 3.9% 1.1% 31.4% 0.8% 100.0% % Margin 251 245 244 242 206 160 95 54 SG&A 0.8% 0.9% 1.7% 2.0% 2.6% 3.9% 0.9% 145.2% % Revenue 4,349 2,063 563 225 (123) 1,121 (1) (17) EBIT 13.3% 7.6% 3.9% 1.9% (1.6)% 27.5% (0.0)% (45.2)% % Margin 42 43 47 49 61 14 - 5 D&A 0.1% 0.2% 0.3% 0.4% 0.8% 0.3% - 12.6% % Revenue 4,392 2,106 611 274 (63) 1,135 (1) (12) EBITDA 13.4% 7.7% 4.3% 2.3% (0.8)% 27.8% (0.0)% (32.5)% % Margin - - - - - 1 1 0.02 Interest Income - - - - - - - - Interest Expense - - - - - (22) 1 17 Other Income(Expense) 4,349 2,063 563 225 (123) 1,101 - (0.1) PBT 13.3% 7.6% 3.9% 1.9% (1.6)% 27.0% (0.0)% (0.2)% % Margin 940 437 107 33 - - - - Tax 3,410 1,626 456 193 (123) 1,101 - (0.1) Net Income 10.4% 6.0% 3.2% 1.6% (1.6)% 27.0% (0.0)% (0.2)% % Margin
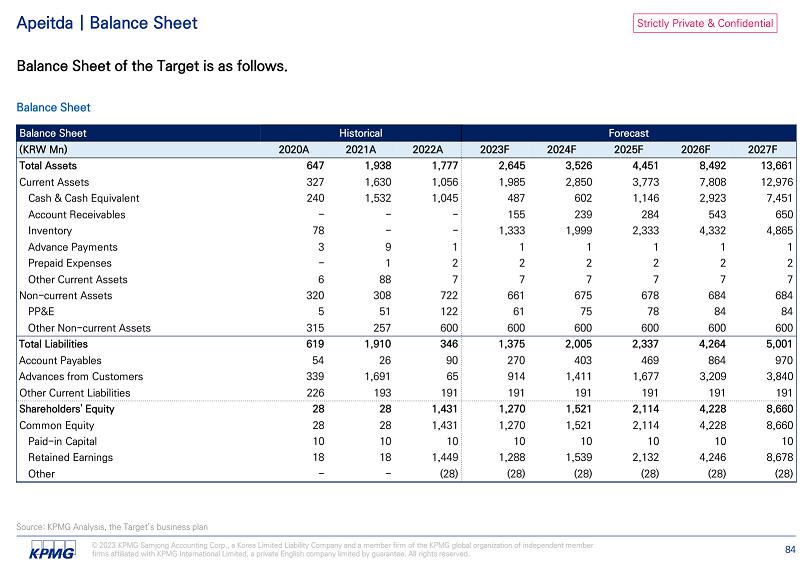
Strictly Private & Confidential Source: KPMG Analysis, the Target’s business plan © 2023 KPMG Samjong Accounting Corp., a Korea Limited Liability Company and a member firm of the KPMG global organization of independent member firms affiliated with KPMG International Limited, a private English company limited by guarantee. All rights reserved. 84 Apeitda | Balance Sheet Balance Sheet of the Target is as follows. Balance Sheet Forecast Historical Balance Sheet 2027F 2026F 2025F 2024F 2023F 2022A 2021A 2020A (KRW Mn) 13,661 8,492 4,451 3,526 2,645 1,777 1,938 647 Total Assets 12,976 7,808 3,773 2,850 1,985 1,056 1,630 327 Current Assets 7,451 2,923 1,146 602 487 1,045 1,532 240 Cash & Cash Equivalent 650 543 284 239 155 - - - Account Receivables 4,865 4,332 2,333 1,999 1,333 - - 78 Inventory 1 1 1 1 1 1 9 3 Advance Payments 2 2 2 2 2 2 1 - Prepaid Expenses 7 7 7 7 7 7 88 6 Other Current Assets 684 684 678 675 661 722 308 320 Non - current Assets 84 84 78 75 61 122 51 5 PP&E 600 600 600 600 600 600 257 315 Other Non - current Assets 5,001 4,264 2,337 2,005 1,375 346 1,910 619 Total Liabilities 970 864 469 403 270 90 26 54 Account Payables 3,840 3,209 1,677 1,411 914 65 1,691 339 Advances from Customers 191 191 191 191 191 191 193 226 Other Current Liabilities 8,660 4,228 2,114 1,521 1,270 1,431 28 28 Shareholders' Equity 8,660 4,228 2,114 1,521 1,270 1,431 28 28 Common Equity 10 10 10 10 10 10 10 10 Paid - in Capital 8,678 4,246 2,132 1,539 1,288 1,449 18 18 Retained Earnings (28) (28) (28) (28) (28) (28) - - Other
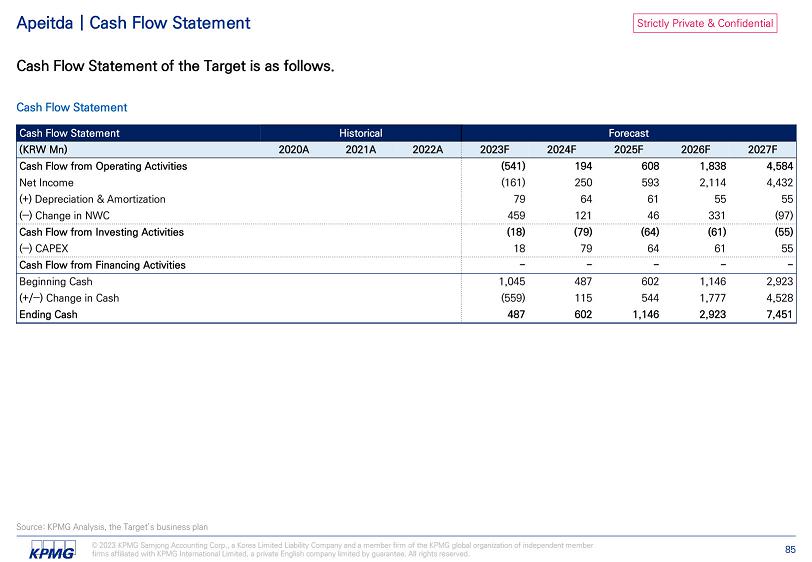
Strictly Private & Confidential Source: KPMG Analysis, the Target’s business plan © 2023 KPMG Samjong Accounting Corp., a Korea Limited Liability Company and a member firm of the KPMG global organization of independent member firms affiliated with KPMG International Limited, a private English company limited by guarantee. All rights reserved. 85 Apeitda | Cash Flow Statement Cash Flow Statement of the Target is as follows. Cash Flow Statement Forecast Historical Cash Flow Statement 2027F 2026F 2025F 2024F 2023F 2022A 2021A 2020A (KRW Mn) 4,584 1,838 608 194 (541) Cash Flow from Operating Activities 4,432 2,114 593 250 (161) Net Income 55 55 61 64 79 (+) Depreciation & Amortization (97) 331 46 121 459 (‒) Change in NWC (55) (61) (64) (79) (18) Cash Flow from Investing Activities 55 61 64 79 18 (‒) CAPEX - - - - - Cash Flow from Financing Activities 2,923 1,146 602 487 1,045 Beginning Cash 4,528 1,777 544 115 (559) (+/‒) Change in Cash 7,451 2,923 1,146 602 487 Ending Cash
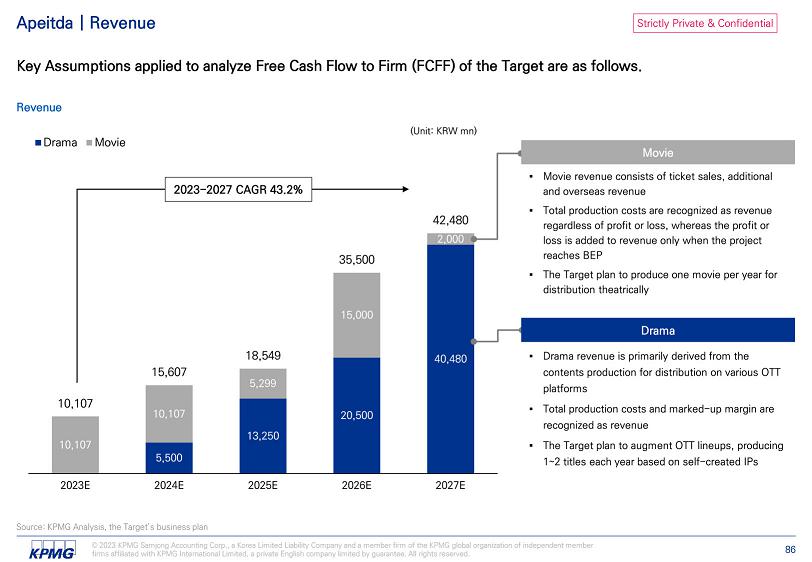
Strictly Private & Confidential Apeitda | Revenue Key Assumptions applied to analyze Free Cash Flow to Firm (FCFF) of the Target are as follows. Revenue 5,500 13,250 20,500 40,480 10,107 10,107 5,299 15,000 10,107 15,607 18,549 42,480 2,000 35,500 2023E 2024E 2025E 2026E 2027E Drama Movie (Unit: KRW mn) Movie Drama 2023 - 2027 CAGR 43.2% Source: KPMG Analysis, the Target’s business plan © 2023 KPMG Samjong Accounting Corp., a Korea Limited Liability Company and a member firm of the KPMG global organization of independent member firms affiliated with KPMG International Limited, a private English company limited by guarantee. All rights reserved. 86
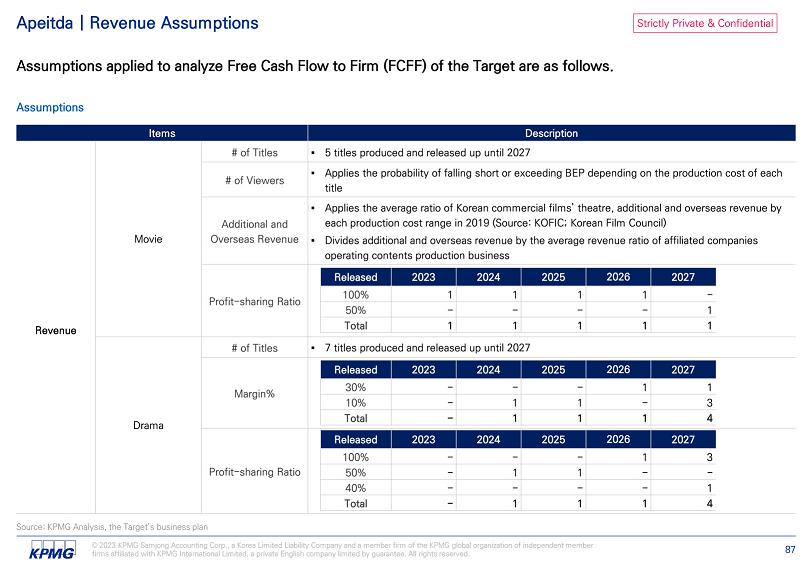
Strictly Private & Confidential Apeitda | Revenue Assumptions Assumptions applied to analyze Free Cash Flow to Firm (FCFF) of the Target are as follows. Assumptions Movie Revenue Drama Source: KPMG Analysis, the Target’s business plan © 2023 KPMG Samjong Accounting Corp., a Korea Limited Liability Company and a member firm of the KPMG global organization of independent member firms affiliated with KPMG International Limited, a private English company limited by guarantee. All rights reserved. 87
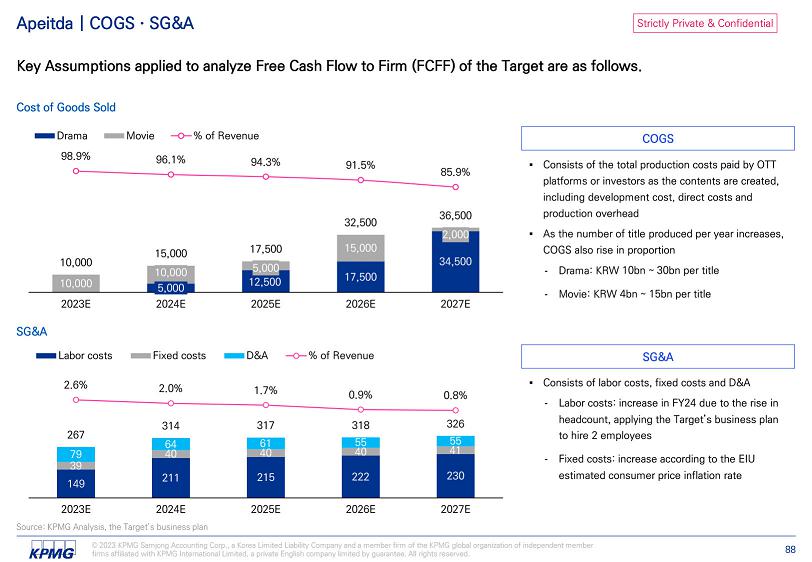
Strictly Private & Confidential Apeitda | COGS · SG&A Key Assumptions applied to analyze Free Cash Flow to Firm (FCFF) of the Target are as follows. Cost of Goods Sold 5,000 12,500 17,500 34,500 10,000 10,000 5,000 15,000 2,000 10,000 15,000 17,500 32,500 36,500 Drama 98.9% 96.1% 94.3% 91.5% 85.9% 2023E 2024E 2025E 2026E 2027E Movie % of Revenue SG&A 149 211 215 222 230 39 40 40 40 41 79 64 61 55 55 267 0.8% 0.9% 1.7% 2.0% 326 318 317 314 2.6% 2023E 2024E 2025E 2026E 2027E Labor costs Fixed costs D&A % of Revenue - Drama: KRW - Movie: KRW COGS SG&A - Labor costs: increase in FY24 due to the rise in headcount, applying the Target’s business plan Source: KPMG Analysis, the Target’s business plan © 2023 KPMG Samjong Accounting Corp., a Korea Limited Liability Company and a member firm of the KPMG global organization of independent member firms affiliated with KPMG International Limited, a private English company limited by guarantee. All rights reserved. 88 to hire 2 employees - Fixed costs: increase according to the EIU estimated consumer price inflation rate
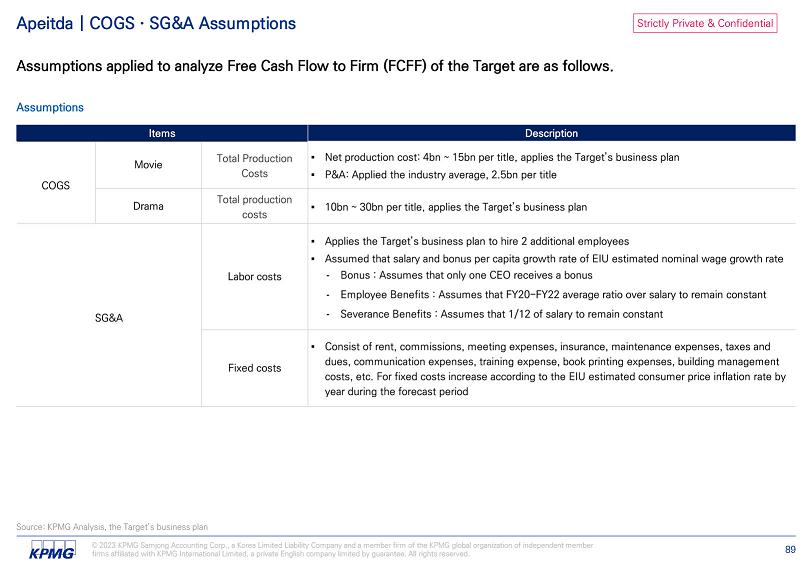
Strictly Private & Confidential Apeitda | COGS · SG&A Assumptions Assumptions applied to analyze Free Cash Flow to Firm (FCFF) of the Target are as follows. Assumptions Movie COGS Drama - Bonus : Assumes that only one CEO receives a bonus - Employee Benefits : Assumes that FY20 - FY22 average ratio over salary to remain constant - Severance Benefits : Assumes that 1/12 of salary to remain constant Labor costs SG&A Fixed costs Source: KPMG Analysis, the Target’s business plan © 2023 KPMG Samjong Accounting Corp., a Korea Limited Liability Company and a member firm of the KPMG global organization of independent member firms affiliated with KPMG International Limited, a private English company limited by guarantee. All rights reserved. 89
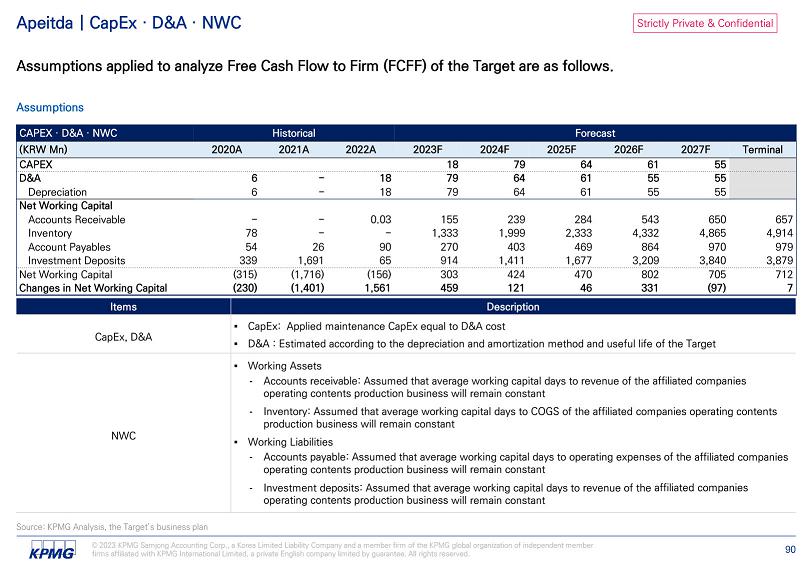
Strictly Private & Confidential Apeitda | CapEx · D&A · NWC Assumptions applied to analyze Free Cash Flow to Firm (FCFF) of the Target are as follows. Assumptions Forecast Historical CAPEX · D&A · NWC Terminal 2027F 2026F 2025F 2024F 2023F 2022A 2021A 2020A (KRW Mn) 55 61 64 79 18 CAPEX 55 55 61 64 79 18 - 6 D&A 55 55 61 64 79 18 - 6 Depreciation Net Working Capital 657 650 543 284 239 155 0.03 - - Accounts Receivable 4,914 4,865 4,332 2,333 1,999 1,333 - - 78 Inventory 979 970 864 469 403 270 90 26 54 Account Payables 3,879 3,840 3,209 1,677 1,411 914 65 1,691 339 Investment Deposits 712 705 802 470 424 303 (156) (1,716) (315) Net Working Capital 7 (97) 331 46 121 459 1,561 (1,401) (230) Changes in Net Working Capital CapEx, D&A - Accounts receivable: Assumed that average working capital days to revenue of the will remain constant - Inventory: Assumed that average working capital days to COGS of the will remain constant - Accounts payable: Assumed that average working capital days to operating expenses of the will remain constant - Investment deposits: Assumed that average working capital days to revenue of the will remain constant NWC Source: KPMG Analysis, the Target’s business plan © 2023 KPMG Samjong Accounting Corp., a Korea Limited Liability Company and a member firm of the KPMG global organization of independent member firms affiliated with KPMG International Limited, a private English company limited by guarantee. All rights reserved. 90

Strictly Private & Confidential Source: KPMG Analysis, the Target’s business plan © 2023 KPMG Samjong Accounting Corp., a Korea Limited Liability Company and a member firm of the KPMG global organization of independent member firms affiliated with KPMG International Limited, a private English company limited by guarantee. All rights reserved. 91 Appendix | FCFF Analysis Free Cash Flow to Firm (FCFF) analysis of the Target are as follows. FCFF Analysis Forecast Historical Apeitda Terminal 2027F 2026F 2025F 2024F 2023F 2022A 2021A 2020A (KRW Mn) 42,905 42,480 35,500 18,549 15,607 10,107 5,301 14,402 48 Revenue 1.0% 19.7% 91.4% 18.9% 54.4% 90.7% (63.2)% 29708.2% 102.7% % Growth 36,865 36,500 32,500 17,500 15,000 10,000 3,636 14,280 - COGS 85.9% 85.9% 91.5% 94.3% 96.1% 98.9% 68.6% 99.2% - % Revenue 6,040 5,980 3,000 1,049 607 107 1,665 122 48 Gross Profit 14.1% 14.1% 8.5% 5.7% 3.9% 1.1% 31.4% 0.8% 100.0% % Margin 329 326 318 317 314 267 208 124 70 SG&A 0.8% 0.8% 0.9% 1.7% 2.0% 2.6% 3.9% 0.9% 145.2% % Revenue 5,711 5,654 2,682 732 293 (161) 1,457 (2) (22) EBIT 13.3% 13.3% 7.6% 3.9% 1.9% (1.6)% 27.5% (0.0)% (45.2)% % Margin 1,234 1,222 568 139 42 - 299 - - Tax 4,476 4,432 2,114 593 250 (161) 1,159 (2) (22) NOPLAT 55 55 61 64 79 Adding: D&A 55 61 64 79 18 Deducting: CapEx 7 (97) 331 46 121 459 Deducting: ټ NWC 4,469 4,528 1,777 544 115 (559) FCFF

Strictly Private & Confidential Appendix | FCFF Key Assumptions Key Assumptions applied to analyze Free Cash Flow to Firm (FCFF) of the Target are as follows. Key Assumptions Analysis Date Forecast Period Cash Flow Key Assumptions Terminal Growth Rate Income Tax Source: KPMG Analysis © 2023 KPMG Samjong Accounting Corp., a Korea Limited Liability Company and a member firm of the KPMG global organization of independent member firms affiliated with KPMG International Limited, a private English company limited by guarantee. All rights reserved. 92 Macroeconomic Indicators
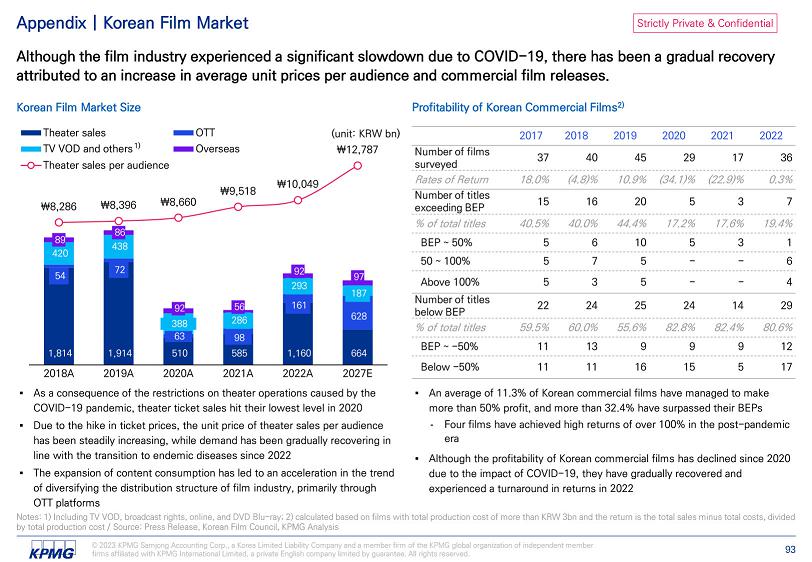
Strictly Private & Confidential Appendix | Korean Film Market Although the film industry experienced a significant slowdown due to COVID - 19, there has been a gradual recovery attributed to an increase in average unit prices per audience and commercial film releases. Korean Film Market Size Profitability of Korean Commercial Films 2) Notes: 1) Including TV VOD, broadcast rights, online, and DVD Blu - ray; 2) calculated based on films with total production cost of more than KRW 3bn and the return is the total sales minus total costs, divided - Four films have achieved high returns of over 100% in the post - pandemic era 54 72 161 420 438 293 187 89 86 92 56 92 97 ₩8,286 ₩8,396 ₩8,660 ₩9,518 ₩10,049 1,814 2018A 628 286 388 98 63 664 1,160 585 510 1,914 2027E 2022A 2021A 2020A 2019A (unit: KRW bn) ₩12,787 OTT Overseas Theater sales TV VOD and others 1) Theater sales per audience by total production cost / Source: Press Release, Korean Film Council, KPMG Analysis © 2023 KPMG Samjong Accounting Corp., a Korea Limited Liability Company and a member firm of the KPMG global organization of independent member firms affiliated with KPMG International Limited, a private English company limited by guarantee. All rights reserved. 93 2022 2021 2020 2019 2018 2017 36 17 29 45 40 37 Number of films surveyed 0.3% (22.9)% (34.1)% 10.9% (4.8)% 18.0% Rates of Return 7 3 5 20 16 15 Number of titles exceeding BEP 19.4% 17.6% 17.2% 44.4% 40.0% 40.5% % of total titles 1 3 5 10 6 5 BEP ~ 50% 6 - - 5 7 5 50 ~ 100% 4 - - 5 3 5 Above 100% 29 14 24 25 24 22 Number of titles below BEP 80.6% 82.4% 82.8% 55.6% 60.0% 59.5% % of total titles 12 9 9 9 13 11 BEP ~ - 50% 17 5 15 16 11 11 Below - 50%

Strictly Private & Confidential Appendix | Korean OTT Contents Market Netflix, the No. 1 OTT platform in Korea, has been successful in domestic and foreign markets through original Korean content, and investment in Korean content, which is more efficient than in other countries, is expected to continue. Investments in Korean Contents by Netflix and Original Titles Korean OTT Contents Market Trend Reorganize to focus on a small number of OTT companies that have successfully invested in bold content ▪ Netflix has secured competitive content by guaranteeing a high margin rate compared to existing distribution channels, and based on this, it has expanded its market share ▪ As the growth of the OTT market slows, companies with weak content and subscriber base will be eliminated and Netflix - oriented OTT content production will be strengthened Netflix's Continuous Investment Expected due to High Investment Efficiency in Korean Content ▪ Netflix announced plans to expand investment in non - English - speaking content, and "Two out of three top - rated non - English - speaking content in 2021 are Korean content." ▪ Korean content production costs are 1/10th that of the United States, and Korean content is expected to benefit from expanding investment in non - English content due to its high efficiency compared to production costs The Limited Expansion of OTT Original Film Production Expected ▪ Drama can expand the content consumption period from weeks to months by dividing the season and releasing one drama every week ▪ On the other hand, the expansion of original contents of the movie is expected to be limited as the consumption period of the movie is short from 1 to 2 days, which is disadvantageous in terms of maintaining the number of subscribers 15 82 92 248 333 550 - 1 1 5 9 20 24 2016 2017 2018 2019 2020 2021 2022 Investment in Korean contents by Netflix The number of Netflix Korean original titles 1) Note: 1) Includes movies, dramas, entertainment shows, documentaries and animations / Source: Press Release, Expert Interview, Netflix, KPMG Analysis © 2023 KPMG Samjong Accounting Corp., a Korea Limited Liability Company and a member firm of the KPMG global organization of independent member firms affiliated with KPMG International Limited, a private English company limited by guarantee. All rights reserved. 94 (Unit: KRW bn, titles)
Strictly Private & Confidential First Virtual Lab
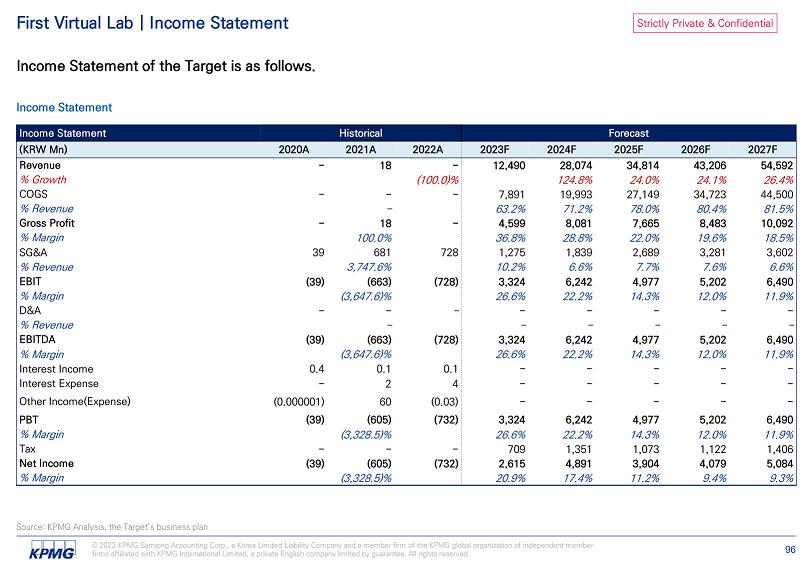
Strictly Private & Confidential © 2023 KPMG Samjong Accounting Corp., a Korea Limited Liability Company and a member firm of the KPMG global organization of independent member firms affiliated with KPMG International Limited, a private English company limited by guarantee. All rights reserved. 96 First Virtual Lab | Income Statement Income Statement of the Target is as follows. Income Statement Source: KPMG Analysis, the Target’s business plan Forecast Historical Income Statement 2027F 2026F 2025F 2024F 2023F 2022A 2021A 2020A (KRW Mn) 54,592 43,206 34,814 28,074 12,490 - 18 - Revenue 26.4% 24.1% 24.0% 124.8% (100.0)% % Growth 44,500 34,723 27,149 19,993 7,891 - - - COGS 81.5% 80.4% 78.0% 71.2% 63.2% - % Revenue 10,092 8,483 7,665 8,081 4,599 - 18 - Gross Profit 18.5% 19.6% 22.0% 28.8% 36.8% 100.0% % Margin 3,602 3,281 2,689 1,839 1,275 728 681 39 SG&A 6.6% 7.6% 7.7% 6.6% 10.2% 3,747.6% % Revenue 6,490 5,202 4,977 6,242 3,324 (728) (663) (39) EBIT 11.9% 12.0% 14.3% 22.2% 26.6% (3,647.6)% % Margin - - - - - - - - D&A - - - - - - % Revenue 6,490 5,202 4,977 6,242 3,324 (728) (663) (39) EBITDA 11.9% 12.0% 14.3% 22.2% 26.6% (3,647.6)% % Margin - - - - - 0.1 0.1 0.4 Interest Income - - - - - 4 2 - Interest Expense - - - - - (0.03) 60 (0.000001) Other Income(Expense) 6,490 5,202 4,977 6,242 3,324 (732) (605) (39) PBT 11.9% 12.0% 14.3% 22.2% 26.6% (3,328.5)% % Margin 1,406 1,122 1,073 1,351 709 - - - Tax 5,084 4,079 3,904 4,891 2,615 (732) (605) (39) Net Income 9.3% 9.4% 11.2% 17.4% 20.9% (3,328.5)% % Margin
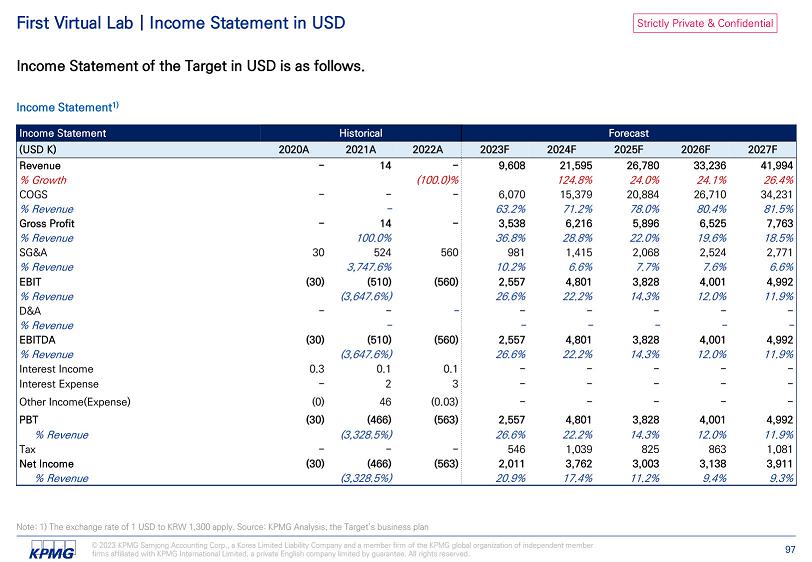
Strictly Private & Confidential © 2023 KPMG Samjong Accounting Corp., a Korea Limited Liability Company and a member firm of the KPMG global organization of independent member firms affiliated with KPMG International Limited, a private English company limited by guarantee. All rights reserved. 97 First Virtual Lab | Income Statement in USD Income Statement of the Target in USD is as follows. Income Statement 1) Note: 1) The exchange rate of 1 USD to KRW 1,300 apply. Source: KPMG Analysis, the Target’s business plan Forecast Historical Income Statement 2027F 2026F 2025F 2024F 2023F 2022A 2021A 2020A (USD K) 41,994 33,236 26,780 21,595 9,608 - 14 - Revenue 26.4% 24.1% 24.0% 124.8% (100.0)% % Growth 34,231 26,710 20,884 15,379 6,070 - - - COGS 81.5% 80.4% 78.0% 71.2% 63.2% - % Revenue 7,763 6,525 5,896 6,216 3,538 - 14 - Gross Profit 18.5% 19.6% 22.0% 28.8% 36.8% 100.0% % Revenue 2,771 2,524 2,068 1,415 981 560 524 30 SG&A 6.6% 7.6% 7.7% 6.6% 10.2% 3,747.6% % Revenue 4,992 4,001 3,828 4,801 2,557 (560) (510) (30) EBIT 11.9% 12.0% 14.3% 22.2% 26.6% (3,647.6%) % Revenue - - - - - - - - D&A - - - - - - % Revenue 4,992 4,001 3,828 4,801 2,557 (560) (510) (30) EBITDA 11.9% 12.0% 14.3% 22.2% 26.6% (3,647.6%) % Revenue - - - - - 0.1 0.1 0.3 Interest Income - - - - - 3 2 - Interest Expense - - - - - (0.03) 46 (0) Other Income(Expense) 4,992 4,001 3,828 4,801 2,557 (563) (466) (30) PBT 11.9% 12.0% 14.3% 22.2% 26.6% (3,328.5%) % Revenue 1,081 863 825 1,039 546 - - - Tax 3,911 3,138 3,003 3,762 2,011 (563) (466) (30) Net Income 9.3% 9.4% 11.2% 17.4% 20.9% (3,328.5%) % Revenue
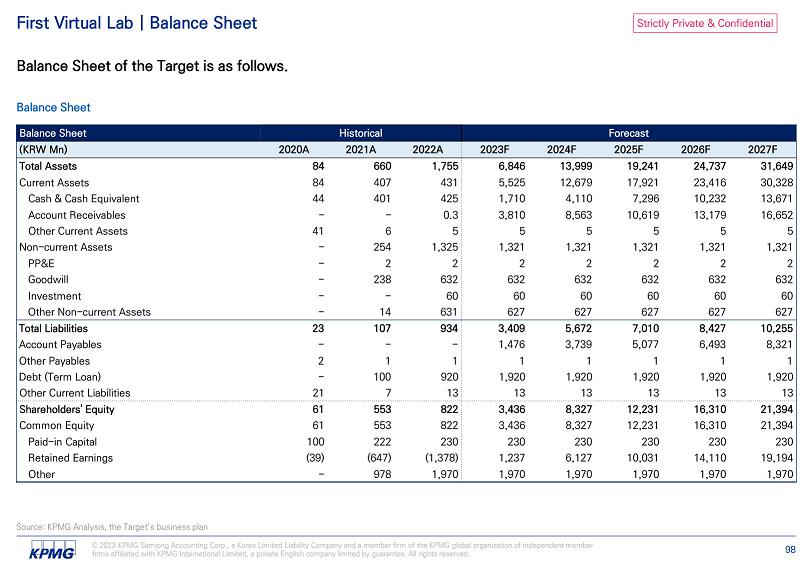
Strictly Private & Confidential Source: KPMG Analysis, the Target’s business plan © 2023 KPMG Samjong Accounting Corp., a Korea Limited Liability Company and a member firm of the KPMG global organization of independent member firms affiliated with KPMG International Limited, a private English company limited by guarantee. All rights reserved. 98 First Virtual Lab | Balance Sheet Balance Sheet of the Target is as follows. Balance Sheet Forecast Historical Balance Sheet 2027F 2026F 2025F 2024F 2023F 2022A 2021A 2020A (KRW Mn) 31,649 24,737 19,241 13,999 6,846 1,755 660 84 Total Assets 30,328 23,416 17,921 12,679 5,525 431 407 84 Current Assets 13,671 10,232 7,296 4,110 1,710 425 401 44 Cash & Cash Equivalent 16,652 13,179 10,619 8,563 3,810 0.3 - - Account Receivables 5 5 5 5 5 5 6 41 Other Current Assets 1,321 1,321 1,321 1,321 1,321 1,325 254 - Non - current Assets 2 2 2 2 2 2 2 - PP&E 632 632 632 632 632 632 238 - Goodwill 60 60 60 60 60 60 - - Investment 627 627 627 627 627 631 14 - Other Non - current Assets 10,255 8,427 7,010 5,672 3,409 934 107 23 Total Liabilities 8,321 6,493 5,077 3,739 1,476 - - - Account Payables 1 1 1 1 1 1 1 2 Other Payables 1,920 1,920 1,920 1,920 1,920 920 100 - Debt (Term Loan) 13 13 13 13 13 13 7 21 Other Current Liabilities 21,394 16,310 12,231 8,327 3,436 822 553 61 Shareholders' Equity 21,394 16,310 12,231 8,327 3,436 822 553 61 Common Equity 230 230 230 230 230 230 222 100 Paid - in Capital 19,194 14,110 10,031 6,127 1,237 (1,378) (647) (39) Retained Earnings 1,970 1,970 1,970 1,970 1,970 1,970 978 - Other
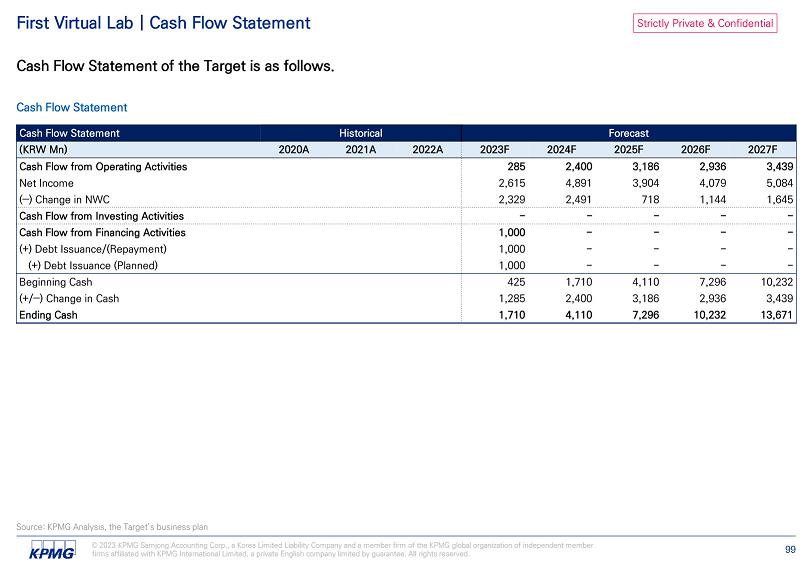
Strictly Private & Confidential Source: KPMG Analysis, the Target’s business plan © 2023 KPMG Samjong Accounting Corp., a Korea Limited Liability Company and a member firm of the KPMG global organization of independent member firms affiliated with KPMG International Limited, a private English company limited by guarantee. All rights reserved. 99 First Virtual Lab | Cash Flow Statement Cash Flow Statement of the Target is as follows. Cash Flow Statement Forecast Historical Cash Flow Statement 2027F 2026F 2025F 2024F 2023F 2022A 2021A 2020A (KRW Mn) 3,439 2,936 3,186 2,400 285 Cash Flow from Operating Activities 5,084 4,079 3,904 4,891 2,615 Net Income 1,645 1,144 718 2,491 2,329 (‒) Change in NWC - - - - - Cash Flow from Investing Activities - - - - 1,000 Cash Flow from Financing Activities - - - - 1,000 (+) Debt Issuance/(Repayment) - - - - 1,000 (+) Debt Issuance (Planned) 10,232 7,296 4,110 1,710 425 Beginning Cash 3,439 2,936 3,186 2,400 1,285 (+/‒) Change in Cash 13,671 10,232 7,296 4,110 1,710 Ending Cash
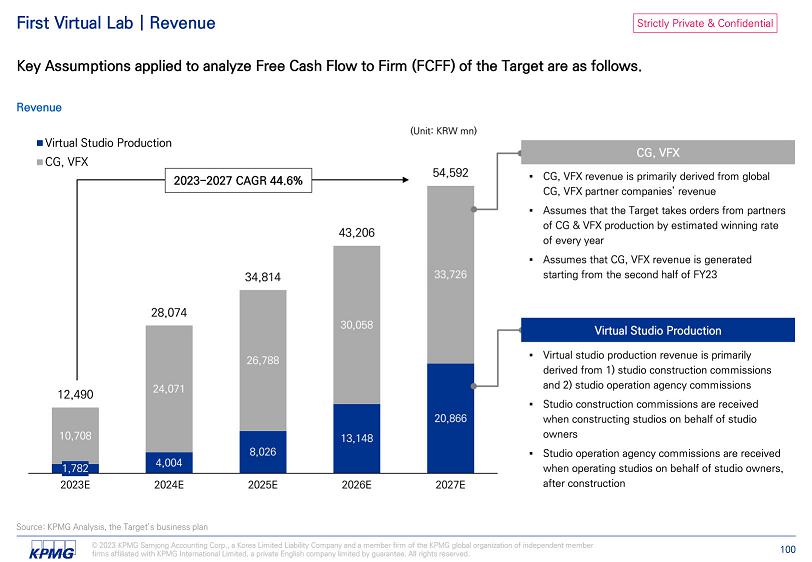
Strictly Private & Confidential First Virtual Lab | Revenue Key Assumptions applied to analyze Free Cash Flow to Firm (FCFF) of the Target are as follows. Revenue 1,782 4,004 8,026 13,148 20,866 10,708 24,071 26,788 30,058 33,726 12,490 28,074 34,814 43,206 54,592 2023E 2024E 2025E 2026E 2027E Virtual Studio Production CG, VFX (Unit: KRW mn) CG, VFX Virtual Studio Production 2023 - 2027 CAGR 44.6% Source: KPMG Analysis, the Target’s business plan © 2023 KPMG Samjong Accounting Corp., a Korea Limited Liability Company and a member firm of the KPMG global organization of independent member firms affiliated with KPMG International Limited, a private English company limited by guarantee. All rights reserved. 100
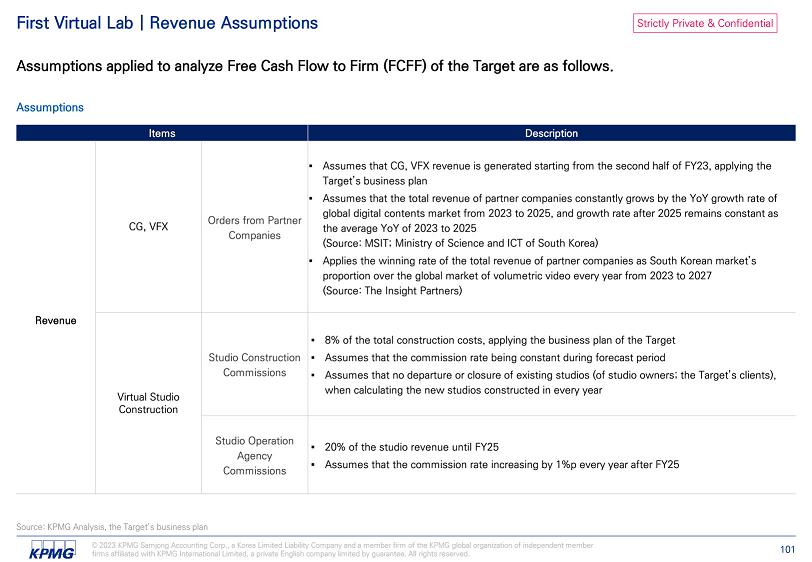
Strictly Private & Confidential First Virtual Lab | Revenue Assumptions Assumptions applied to analyze Free Cash Flow to Firm (FCFF) of the Target are as follows. Assumptions Revenue CG, VFX Ministry of Science and ICT of South Korea) Virtual Studio Construction Source: KPMG Analysis, the Target’s business plan © 2023 KPMG Samjong Accounting Corp., a Korea Limited Liability Company and a member firm of the KPMG global organization of independent member firms affiliated with KPMG International Limited, a private English company limited by guarantee. All rights reserved. 101
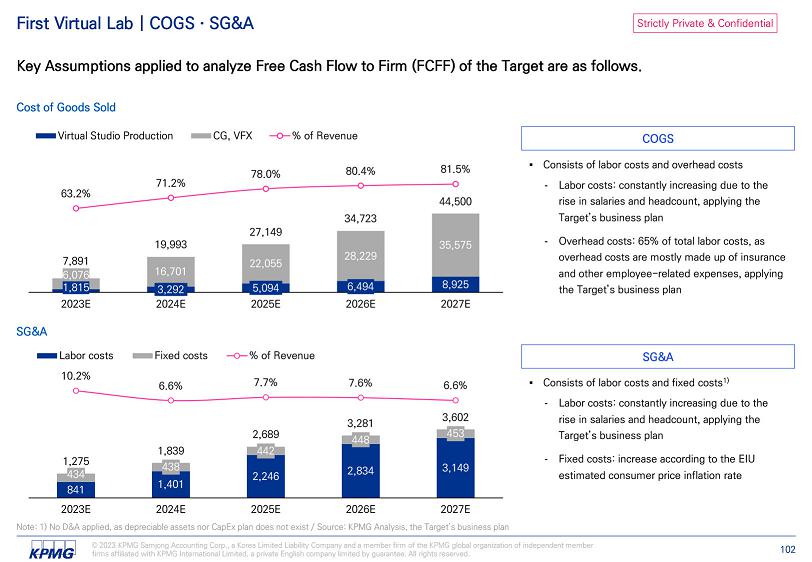
Strictly Private & Confidential First Virtual Lab | COGS · SG&A Key Assumptions applied to analyze Free Cash Flow to Firm (FCFF) of the Target are as follows. Cost of Goods Sold 1,815 3,292 5,094 6,494 8,925 6,076 16,701 22,055 28,229 35,575 7,891 19,993 27,149 34,723 44,500 63.2% 71.2% 78.0% 80.4% 81.5% 2023E 2024E 2025E 2026E 2027E Virtual Studio Production CG, VFX % of Revenue SG&A 841 1,401 2,246 2,834 3,149 434 438 442 448 453 1,275 1,839 2,689 3,281 3,602 Labor costs 10.2% 6.6% 7.7% 7.6% 6.6% 2023E 2024E 2025E 2026E 2027E Fixed costs % of Revenue - Labor costs: constantly increasing due to the rise in salaries and headcount, applying the Target’s business plan - Overhead costs: 65% of total labor costs, as overhead costs are mostly made up of insurance and other employee - related expenses, applying the Target’s business plan COGS SG&A - Labor costs: constantly increasing due to the rise in salaries and headcount, applying the Target’s business plan Note: 1) No D&A applied, as depreciable assets nor CapEx plan does not exist / Source: KPMG Analysis, the Target’s business plan © 2023 KPMG Samjong Accounting Corp., a Korea Limited Liability Company and a member firm of the KPMG global organization of independent member firms affiliated with KPMG International Limited, a private English company limited by guarantee. All rights reserved. 102 - Fixed costs: increase according to the EIU estimated consumer price inflation rate
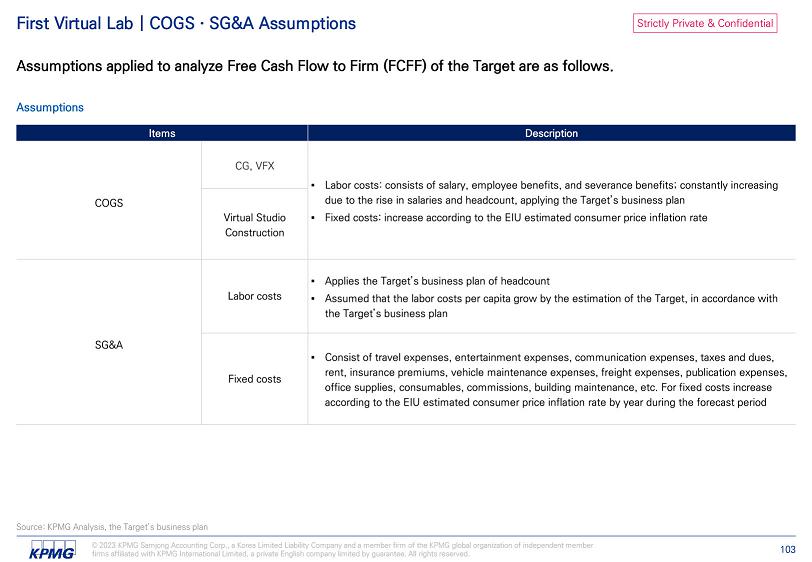
Strictly Private & Confidential First Virtual Lab | COGS · SG&A Assumptions Assumptions applied to analyze Free Cash Flow to Firm (FCFF) of the Target are as follows. Assumptions COGS Source: KPMG Analysis, the Target’s business plan © 2023 KPMG Samjong Accounting Corp., a Korea Limited Liability Company and a member firm of the KPMG global organization of independent member firms affiliated with KPMG International Limited, a private English company limited by guarantee. All rights reserved. 103 Virtual Studio Construction SG&A Labor costs Fixed costs
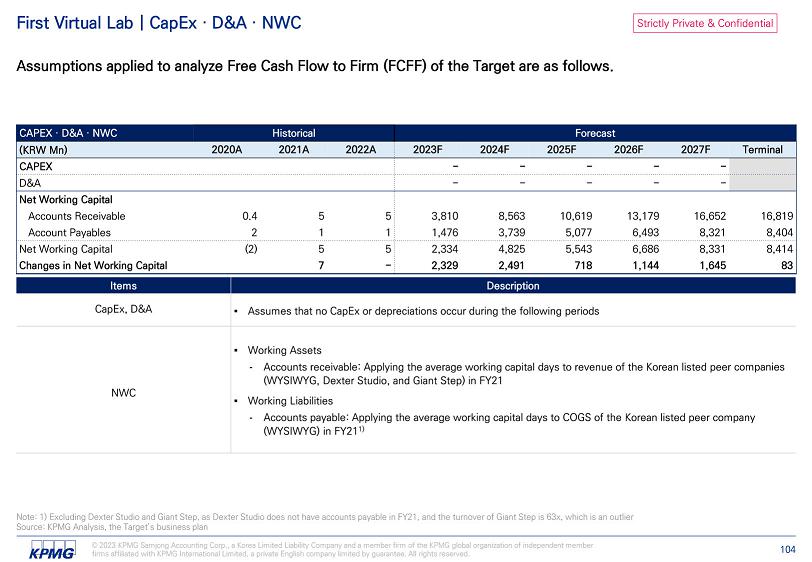
Strictly Private & Confidential First Virtual Lab | CapEx · D&A · NWC Assumptions applied to analyze Free Cash Flow to Firm (FCFF) of the Target are as follows. Note: 1) Excluding Dexter Studio and Giant Step, as Dexter Studio does not have accounts payable in FY21, and the turnover of Giant Step is 63x, which is an outlier Forecast Historical CAPEX · D&A · NWC Terminal 2027F 2026F 2025F 2024F 2023F 2022A 2021A 2020A (KRW Mn) - - - - - CAPEX - - - - - D&A Net Working Capital 16,819 16,652 13,179 10,619 8,563 3,810 5 5 0.4 Accounts Receivable 8,404 8,321 6,493 5,077 3,739 1,476 1 1 2 Account Payables 8,414 8,331 6,686 5,543 4,825 2,334 5 5 (2) Net Working Capital 83 1,645 1,144 718 2,491 2,329 - 7 Changes in Net Working Capital CapEx, D&A - Accounts receivable: Applying the average working capital days to revenue of the Korean listed peer - Accounts payable: Applying the average working capital days to COGS of the NWC Source: KPMG Analysis, the Target’s business plan © 2023 KPMG Samjong Accounting Corp., a Korea Limited Liability Company and a member firm of the KPMG global organization of independent member firms affiliated with KPMG International Limited, a private English company limited by guarantee. All rights reserved. 104
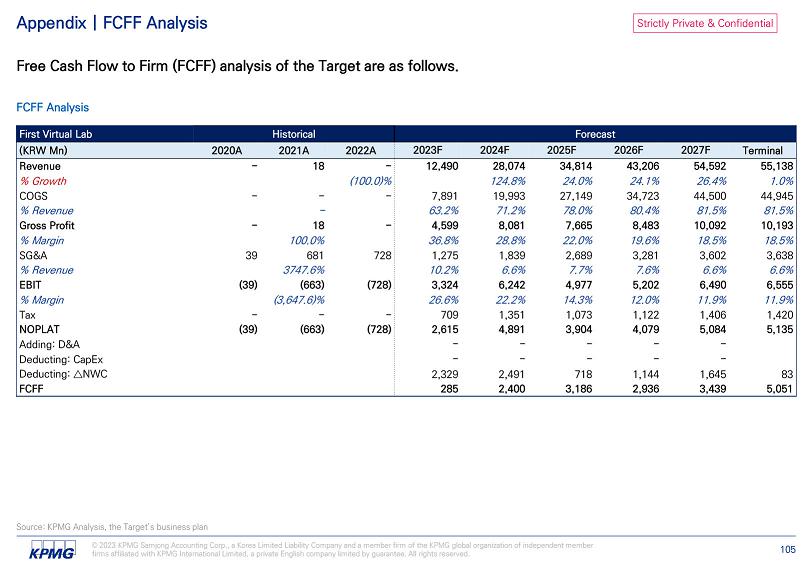
Strictly Private & Confidential Source: KPMG Analysis, the Target’s business plan © 2023 KPMG Samjong Accounting Corp., a Korea Limited Liability Company and a member firm of the KPMG global organization of independent member firms affiliated with KPMG International Limited, a private English company limited by guarantee. All rights reserved. 105 Appendix | FCFF Analysis Free Cash Flow to Firm (FCFF) analysis of the Target are as follows. FCFF Analysis Forecast Historical First Virtual Lab Terminal 2027F 2026F 2025F 2024F 2023F 2022A 2021A 2020A (KRW Mn) 55,138 54,592 43,206 34,814 28,074 12,490 - 18 - Revenue 1.0% 26.4% 24.1% 24.0% 124.8% (100.0)% % Growth 44,945 44,500 34,723 27,149 19,993 7,891 - - - COGS 81.5% 81.5% 80.4% 78.0% 71.2% 63.2% - % Revenue 10,193 10,092 8,483 7,665 8,081 4,599 - 18 - Gross Profit 18.5% 18.5% 19.6% 22.0% 28.8% 36.8% 100.0% % Margin 3,638 3,602 3,281 2,689 1,839 1,275 728 681 39 SG&A 6.6% 6.6% 7.6% 7.7% 6.6% 10.2% 3747.6% % Revenue 6,555 6,490 5,202 4,977 6,242 3,324 (728) (663) (39) EBIT 11.9% 11.9% 12.0% 14.3% 22.2% 26.6% (3,647.6)% % Margin 1,420 1,406 1,122 1,073 1,351 709 - - - Tax 5,135 5,084 4,079 3,904 4,891 2,615 (728) (663) (39) NOPLAT - - - - - Adding: D&A - - - - - Deducting: CapEx 83 1,645 1,144 718 2,491 2,329 Deducting: ټ NWC 5,051 3,439 2,936 3,186 2,400 285 FCFF

Strictly Private & Confidential Appendix | FCFF Key Assumptions Key Assumptions applied to analyze Free Cash Flow to Firm (FCFF) of the Target are as follows. Key Assumptions Analysis Date Forecast Period Cash Flow Key Assumptions Terminal Growth Rate Income Tax Source: KPMG Analysis © 2023 KPMG Samjong Accounting Corp., a Korea Limited Liability Company and a member firm of the KPMG global organization of independent member firms affiliated with KPMG International Limited, a private English company limited by guarantee. All rights reserved. 106 Macroeconomic Indicators
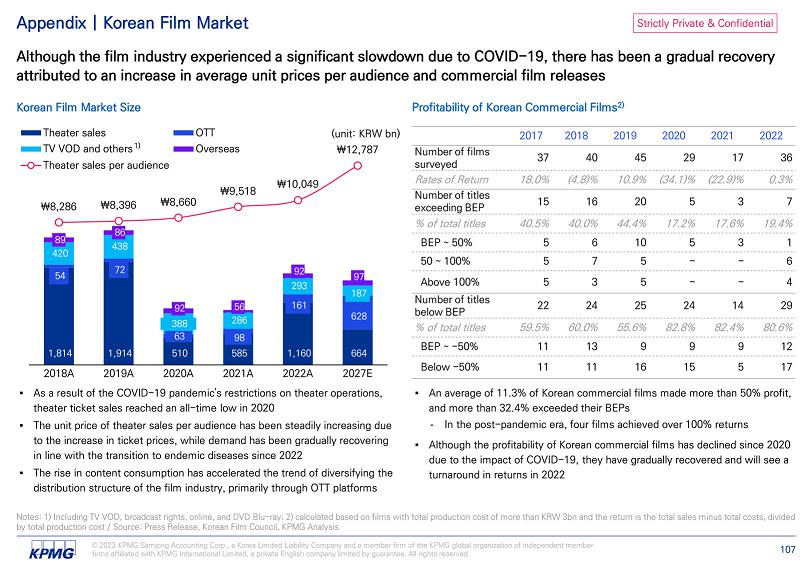
Strictly Private & Confidential Appendix | Korean Film Market Although the film industry experienced a significant slowdown due to COVID - 19, there has been a gradual recovery attributed to an increase in average unit prices per audience and commercial film releases Korean Film Market Size Profitability of Korean Commercial Films 2) Notes: 1) Including TV VOD, broadcast rights, online, and DVD Blu - ray; 2) calculated based on films with total production cost of more than KRW 3bn and the return is the total sales minus total costs, divided - In the post - pandemic era, four films achieved over 100% returns 54 72 161 420 438 293 187 89 86 92 56 92 97 ₩8,286 ₩8,396 ₩8,660 ₩9,518 ₩10,049 1,814 2018A 628 286 388 98 63 664 1,160 585 510 1,914 2027E 2022A 2021A 2020A 2019A (unit: KRW bn) ₩12,787 OTT Overseas Theater sales TV VOD and others 1) Theater sales per audience by total production cost / Source: Press Release, Korean Film Council, KPMG Analysis © 2023 KPMG Samjong Accounting Corp., a Korea Limited Liability Company and a member firm of the KPMG global organization of independent member firms affiliated with KPMG International Limited, a private English company limited by guarantee. All rights reserved. 107 2022 2021 2020 2019 2018 2017 36 17 29 45 40 37 Number of films surveyed 0.3% (22.9)% (34.1)% 10.9% (4.8)% 18.0% Rates of Return 7 3 5 20 16 15 Number of titles exceeding BEP 19.4% 17.6% 17.2% 44.4% 40.0% 40.5% % of total titles 1 3 5 10 6 5 BEP ~ 50% 6 - - 5 7 5 50 ~ 100% 4 - - 5 3 5 Above 100% 29 14 24 25 24 22 Number of titles below BEP 80.6% 82.4% 82.8% 55.6% 60.0% 59.5% % of total titles 12 9 9 9 13 11 BEP ~ - 50% 17 5 15 16 11 11 Below - 50%

Strictly Private & Confidential Appendix | Korean OTT Contents Market Netflix, the No. 1 OTT platform in Korea, has been successful in domestic and foreign markets through original Korean content, and investment in Korean content, which is more efficient than in other countries, is expected to continue. Investments in Korean Contents by Netflix and Original Titles Korean OTT Contents Market Trend Reorganize to focus on a small number of OTT companies that have successfully invested in bold content ▪ Netflix has secured competitive content by guaranteeing a high margin rate compared to existing distribution channels, and based on this, it has expanded its market share ▪ As the growth of the OTT market slows, companies with weak content and subscriber base will be eliminated and Netflix - oriented OTT content production will be strengthened Netflix's Continuous Investment Expected due to High Investment Efficiency in Korean Content ▪ Netflix announced plans to expand investment in non - English - speaking content, and "Two out of three top - rated non - English - speaking content in 2021 are Korean content." ▪ Korean content production costs are 1/10th that of the United States, and Korean content is expected to benefit from expanding investment in non - English content due to its high efficiency compared to production costs The Limited Expansion of OTT Original Film Production Expected ▪ Drama can expand the content consumption period from weeks to months by dividing the season and releasing one drama every week ▪ On the other hand, the expansion of original contents of the movie is expected to be limited as the consumption period of the movie is short from 1 to 2 days, which is disadvantageous in terms of maintaining the number of subscribers 15 82 92 248 333 550 - 1 1 5 9 20 24 2016 2017 2018 2019 2020 2021 2022 Investment in Korean contents by Netflix The number of Netflix Korean original titles 1) Note: 1) Includes movies, dramas, entertainment shows, documentaries and animations / Source: Press Release, Expert Interview, Netflix, KPMG Analysis © 2023 KPMG Samjong Accounting Corp., a Korea Limited Liability Company and a member firm of the KPMG global organization of independent member firms affiliated with KPMG International Limited, a private English company limited by guarantee. All rights reserved. 108 (Unit: KRW bn, titles)
Strictly Private & Confidential Studio Anseillen
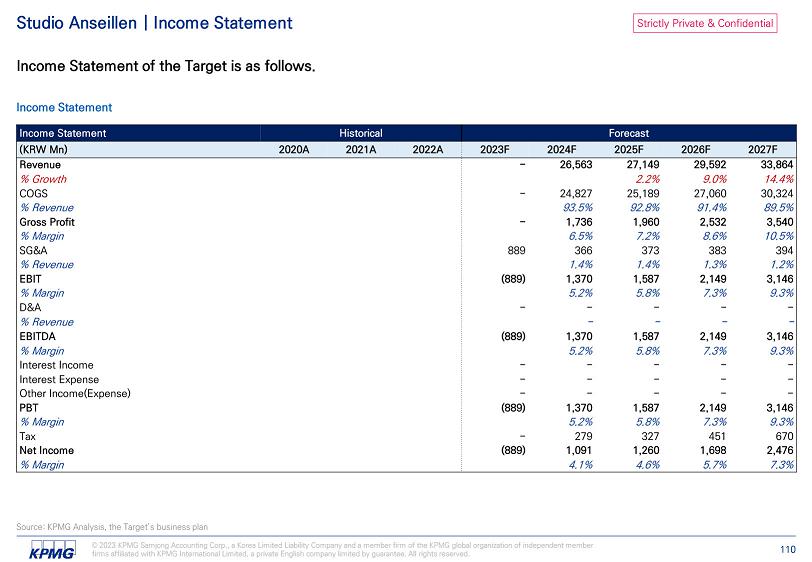
Strictly Private & Confidential © 2023 KPMG Samjong Accounting Corp., a Korea Limited Liability Company and a member firm of the KPMG global organization of independent member firms affiliated with KPMG International Limited, a private English company limited by guarantee. All rights reserved. 110 Studio Anseillen | Income Statement Income Statement of the Target is as follows. Income Statement Source: KPMG Analysis, the Target’s business plan Forecast Historical Income Statement 2027F 2026F 2025F 2024F 2023F 2022A 2021A 2020A (KRW Mn) 33,864 29,592 27,149 26,563 - Revenue 14.4% 9.0% 2.2% % Growth 30,324 27,060 25,189 24,827 - COGS 89.5% 91.4% 92.8% 93.5% % Revenue 3,540 2,532 1,960 1,736 - Gross Profit 10.5% 8.6% 7.2% 6.5% % Margin 394 383 373 366 889 SG&A 1.2% 1.3% 1.4% 1.4% % Revenue 3,146 2,149 1,587 1,370 (889) EBIT 9.3% 7.3% 5.8% 5.2% % Margin - - - - - D&A - - - - % Revenue 3,146 2,149 1,587 1,370 (889) EBITDA 9.3% 7.3% 5.8% 5.2% % Margin - - - - - Interest Income - - - - - Interest Expense - - - - - Other Income(Expense) 3,146 2,149 1,587 1,370 (889) PBT 9.3% 7.3% 5.8% 5.2% % Margin 670 451 327 279 - Tax 2,476 1,698 1,260 1,091 (889) Net Income 7.3% 5.7% 4.6% 4.1% % Margin
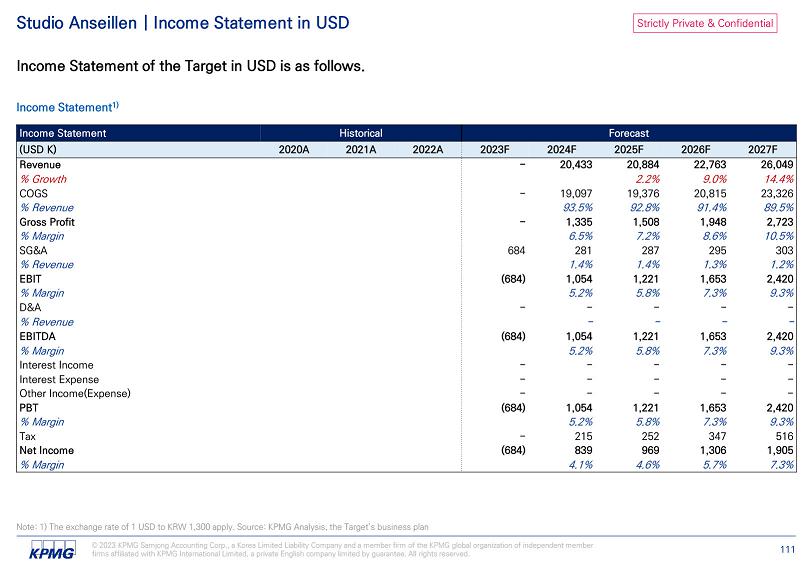
Strictly Private & Confidential © 2023 KPMG Samjong Accounting Corp., a Korea Limited Liability Company and a member firm of the KPMG global organization of independent member firms affiliated with KPMG International Limited, a private English company limited by guarantee. All rights reserved. 111 Studio Anseillen | Income Statement in USD Income Statement of the Target in USD is as follows. Income Statement 1) Note: 1) The exchange rate of 1 USD to KRW 1,300 apply. Source: KPMG Analysis, the Target’s business plan Forecast Historical Income Statement 2027F 2026F 2025F 2024F 2023F 2022A 2021A 2020A (USD K) 26,049 22,763 20,884 20,433 - Revenue 14.4% 9.0% 2.2% % Growth 23,326 20,815 19,376 19,097 - COGS 89.5% 91.4% 92.8% 93.5% % Revenue 2,723 1,948 1,508 1,335 - Gross Profit 10.5% 8.6% 7.2% 6.5% % Margin 303 295 287 281 684 SG&A 1.2% 1.3% 1.4% 1.4% % Revenue 2,420 1,653 1,221 1,054 (684) EBIT 9.3% 7.3% 5.8% 5.2% % Margin - - - - - D&A - - - - % Revenue 2,420 1,653 1,221 1,054 (684) EBITDA 9.3% 7.3% 5.8% 5.2% % Margin - - - - - Interest Income - - - - - Interest Expense - - - - - Other Income(Expense) 2,420 1,653 1,221 1,054 (684) PBT 9.3% 7.3% 5.8% 5.2% % Margin 516 347 252 215 - Tax 1,905 1,306 969 839 (684) Net Income 7.3% 5.7% 4.6% 4.1% % Margin
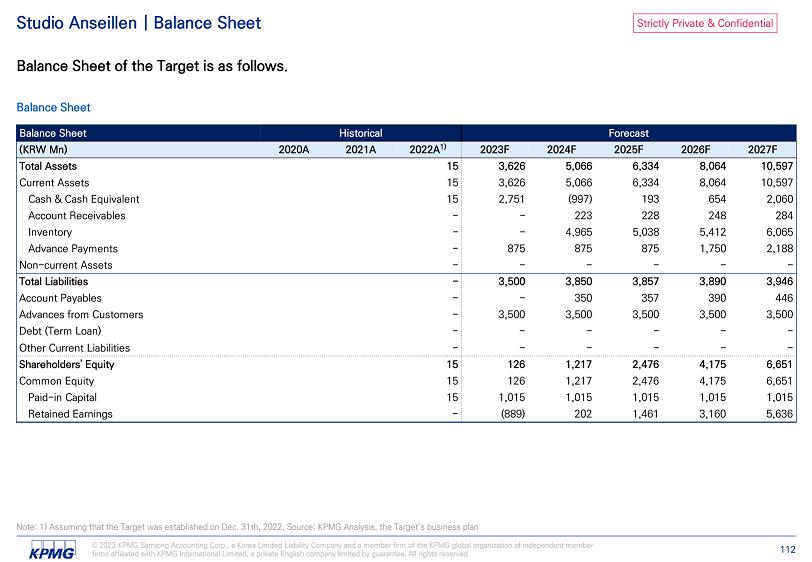
Strictly Private & Confidential Note: 1) Assuming that the Target was established on Dec. 31th, 2022, Source: KPMG Analysis, the Target’s business plan © 2023 KPMG Samjong Accounting Corp., a Korea Limited Liability Company and a member firm of the KPMG global organization of independent member firms affiliated with KPMG International Limited, a private English company limited by guarantee. All rights reserved. 112 Studio Anseillen | Balance Sheet Balance Sheet of the Target is as follows. Balance Sheet Forecast Historical Balance Sheet 2027F 2026F 2025F 2024F 2023F 2022A 1) 2021A 2020A (KRW Mn) 10,597 8,064 6,334 5,066 3,626 15 Total Assets 10,597 8,064 6,334 5,066 3,626 15 Current Assets 2,060 654 193 (997) 2,751 15 Cash & Cash Equivalent 284 248 228 223 - - Account Receivables 6,065 5,412 5,038 4,965 - - Inventory 2,188 1,750 875 875 875 - Advance Payments - - - - - - Non - current Assets 3,946 3,890 3,857 3,850 3,500 - Total Liabilities 446 390 357 350 - - Account Payables 3,500 3,500 3,500 3,500 3,500 - Advances from Customers - - - - - - Debt (Term Loan) - - - - - - Other Current Liabilities 6,651 4,175 2,476 1,217 126 15 Shareholders' Equity 6,651 4,175 2,476 1,217 126 15 Common Equity 1,015 1,015 1,015 1,015 1,015 15 Paid - in Capital 5,636 3,160 1,461 202 (889) - Retained Earnings
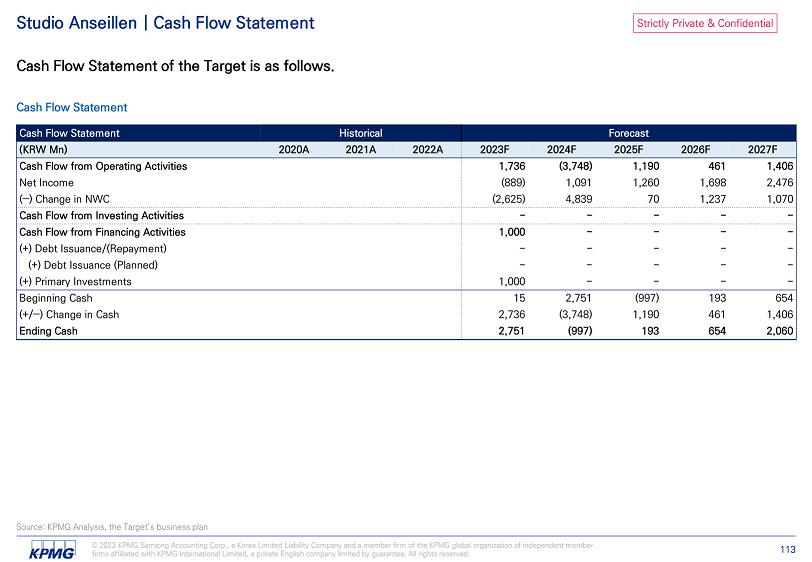
Strictly Private & Confidential Source: KPMG Analysis, the Target’s business plan © 2023 KPMG Samjong Accounting Corp., a Korea Limited Liability Company and a member firm of the KPMG global organization of independent member firms affiliated with KPMG International Limited, a private English company limited by guarantee. All rights reserved. 113 Studio Anseillen | Cash Flow Statement Cash Flow Statement of the Target is as follows. Cash Flow Statement Forecast Historical Cash Flow Statement 2027F 2026F 2025F 2024F 2023F 2022A 2021A 2020A (KRW Mn) 1,406 461 1,190 (3,748) 1,736 Cash Flow from Operating Activities 2,476 1,698 1,260 1,091 (889) Net Income 1,070 1,237 70 4,839 (2,625) (‒) Change in NWC - - - - - Cash Flow from Investing Activities - - - - 1,000 Cash Flow from Financing Activities - - - - - (+) Debt Issuance/(Repayment) - - - - - (+) Debt Issuance (Planned) - - - - 1,000 (+) Primary Investments 654 193 (997) 2,751 15 Beginning Cash 1,406 461 1,190 (3,748) 2,736 (+/‒) Change in Cash 2,060 654 193 (997) 2,751 Ending Cash
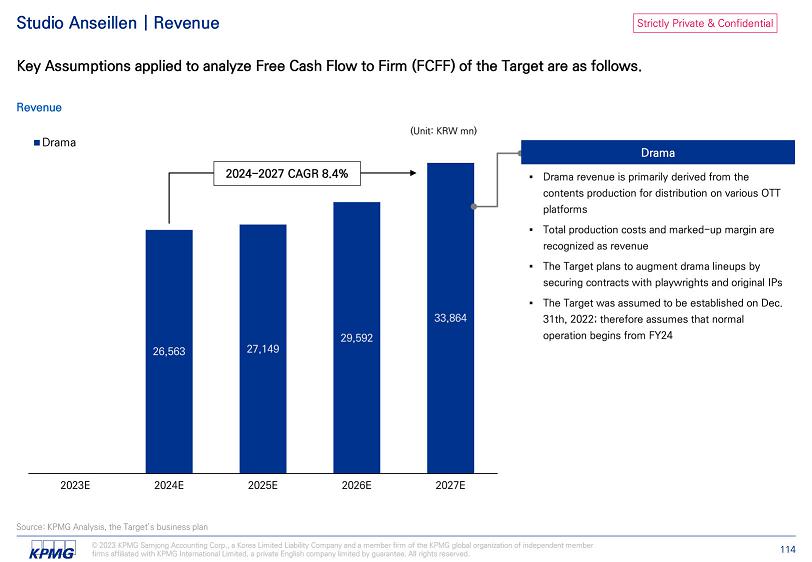
Strictly Private & Confidential Studio Anseillen | Revenue Key Assumptions applied to analyze Free Cash Flow to Firm (FCFF) of the Target are as follows. Revenue 26,563 27,149 29,592 33,864 2023E 2024E 2025E 2026E 2027E Drama (Unit: KRW mn) Drama 2024 - 2027 CAGR 8.4% Source: KPMG Analysis, the Target’s business plan © 2023 KPMG Samjong Accounting Corp., a Korea Limited Liability Company and a member firm of the KPMG global organization of independent member firms affiliated with KPMG International Limited, a private English company limited by guarantee. All rights reserved. 114
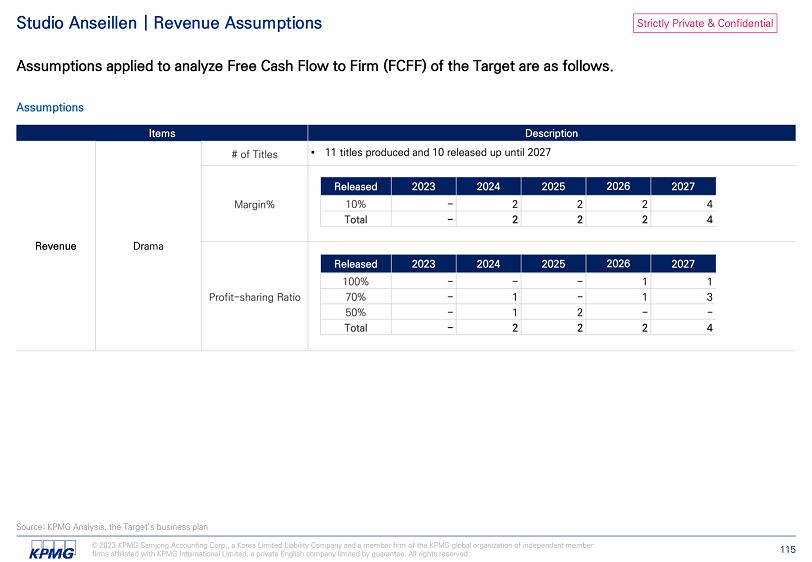
Strictly Private & Confidential Studio Anseillen | Revenue Assumptions Assumptions applied to analyze Free Cash Flow to Firm (FCFF) of the Target are as follows. Assumptions Revenue Source: KPMG Analysis, the Target’s business plan © 2023 KPMG Samjong Accounting Corp., a Korea Limited Liability Company and a member firm of the KPMG global organization of independent member firms affiliated with KPMG International Limited, a private English company limited by guarantee. All rights reserved. 115 Drama
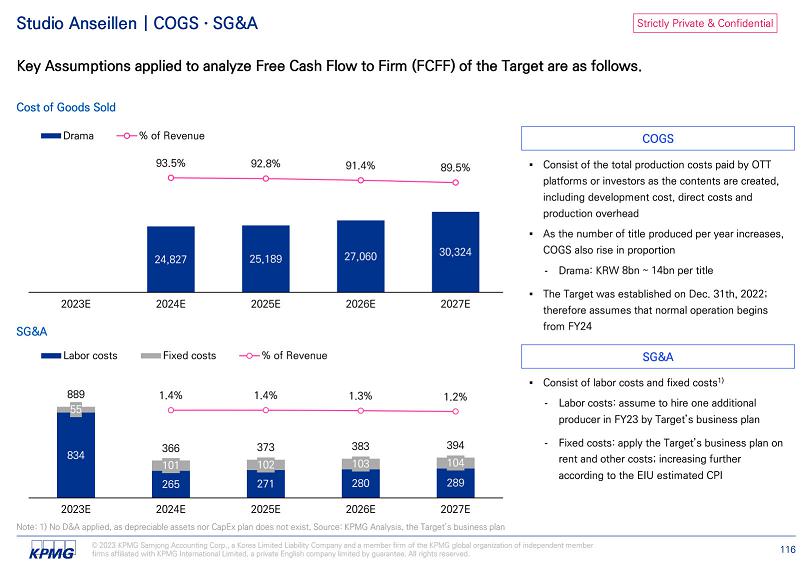
Strictly Private & Confidential Studio Anseillen | COGS · SG&A Key Assumptions applied to analyze Free Cash Flow to Firm (FCFF) of the Target are as follows. Cost of Goods Sold 24,827 25,189 27,060 30,324 93.5% 92.8% 91.4% 89.5% 2023E 2024E 2025E 2026E 2027E Drama % of Revenue SG&A 834 55 889 366 373 383 394 104 103 102 101 289 280 271 265 2027E 2026E 2025E 2024E 2023E 1.4% 1.4% 1.3% 1.2% Labor costs Fixed costs % of Revenue - Drama: KRW COGS SG&A - Labor costs: assume to hire one additional producer in FY23 by Target’s business plan Note: 1) No D&A applied, as depreciable assets nor CapEx plan does not exist, Source: KPMG Analysis, the Target’s business plan © 2023 KPMG Samjong Accounting Corp., a Korea Limited Liability Company and a member firm of the KPMG global organization of independent member firms affiliated with KPMG International Limited, a private English company limited by guarantee. All rights reserved. 116 - Fixed costs: apply the Target’s business plan on rent and other costs; increasing further according to the EIU estimated CPI
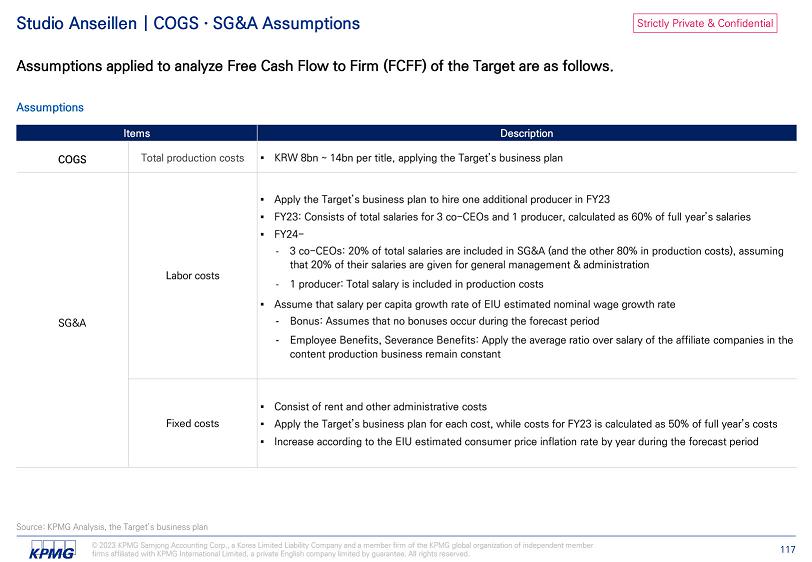
Strictly Private & Confidential Studio Anseillen | COGS · SG&A Assumptions Assumptions applied to analyze Free Cash Flow to Firm (FCFF) of the Target are as follows. Assumptions ▪ KRW COGS - Bonus: Assumes that no bonuses occur during the forecast period - Employee Benefits, Severance Benefits: Apply the average ratio over salary of the affiliate companies in the content production business remain constant Labor costs SG&A ▪ Apply the Target’s business plan for each cost, while costs for FY23 is calculated as 50% of full year’s costs Fixed costs Source: KPMG Analysis, the Target’s business plan © 2023 KPMG Samjong Accounting Corp., a Korea Limited Liability Company and a member firm of the KPMG global organization of independent member firms affiliated with KPMG International Limited, a private English company limited by guarantee. All rights reserved. 117
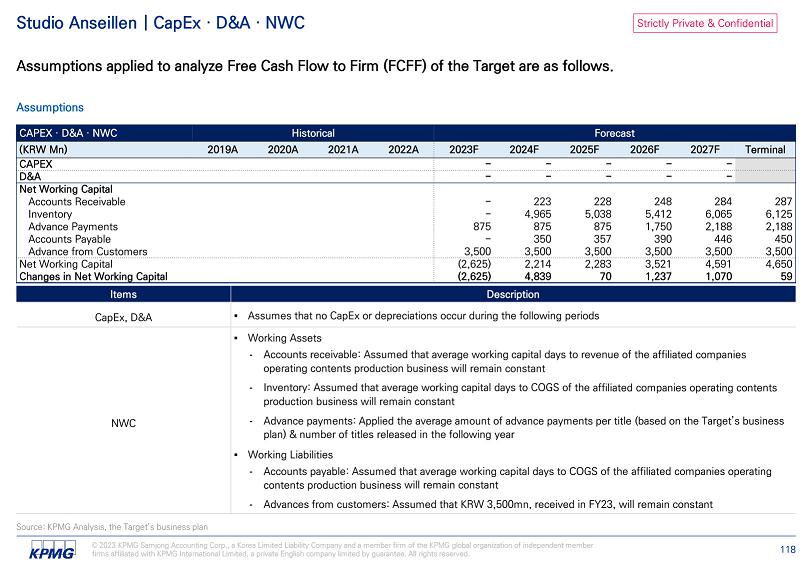
Strictly Private & Confidential Forecast Historical CAPEX · D&A · NWC Terminal 2027F 2026F 2025F 2024F 2023F 2022A 2021A 2020A 2019A (KRW Mn) - - - - - CAPEX - - - - - D&A Net Working Capital 287 284 248 228 223 - Accounts Receivable 6,125 6,065 5,412 5,038 4,965 - Inventory 2,188 2,188 1,750 875 875 875 Advance Payments 450 446 390 357 350 - Accounts Payable 3,500 3,500 3,500 3,500 3,500 3,500 Advance from Customers 4,650 4,591 3,521 2,283 2,214 (2,625) Net Working Capital 59 1,070 1,237 70 4,839 (2,625) Changes in Net Working Capital CapEx, D&A - Accounts receivable: Assumed that average working capital days to revenue of the will remain constant - Inventory: Assumed that average working capital days to COGS of the will remain constant - Advance payments: Applied the average amount of advance payments per title (based on the Target’s business plan) & number of titles released in the following year - Accounts payable: Assumed that average working capital days to COGS of the will remain constant - Advances from customers: Assumed that KRW 3,500mn, received in FY23, will remain constant NWC Source: KPMG Analysis, the Target’s business plan © 2023 KPMG Samjong Accounting Corp., a Korea Limited Liability Company and a member firm of the KPMG global organization of independent member firms affiliated with KPMG International Limited, a private English company limited by guarantee. All rights reserved. 118 Studio Anseillen | CapEx · D&A · NWC Assumptions applied to analyze Free Cash Flow to Firm (FCFF) of the Target are as follows. Assumptions
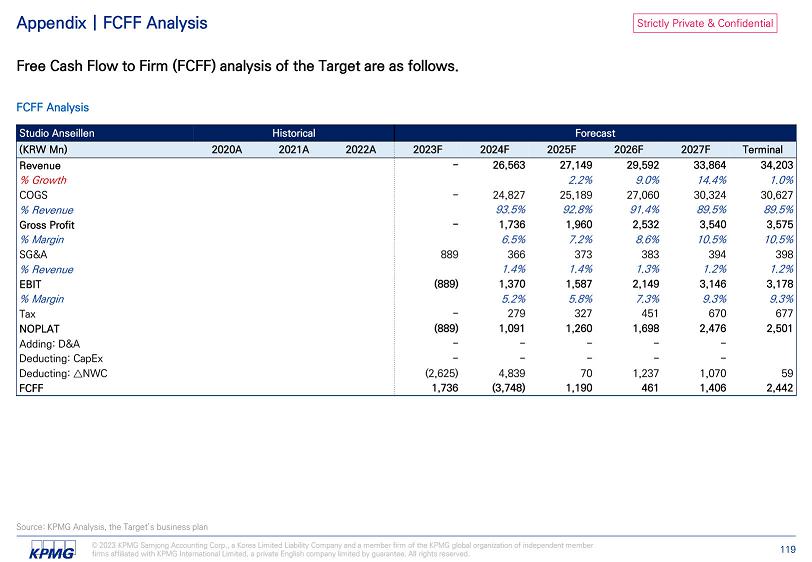
Strictly Private & Confidential Source: KPMG Analysis, the Target’s business plan © 2023 KPMG Samjong Accounting Corp., a Korea Limited Liability Company and a member firm of the KPMG global organization of independent member firms affiliated with KPMG International Limited, a private English company limited by guarantee. All rights reserved. 119 Appendix | FCFF Analysis Free Cash Flow to Firm (FCFF) analysis of the Target are as follows. FCFF Analysis Forecast Historical Studio Anseillen Terminal 2027F 2026F 2025F 2024F 2023F 2022A 2021A 2020A (KRW Mn) 34,203 33,864 29,592 27,149 26,563 - Revenue 1.0% 14.4% 9.0% 2.2% % Growth 30,627 30,324 27,060 25,189 24,827 - COGS 89.5% 89.5% 91.4% 92.8% 93.5% % Revenue 3,575 3,540 2,532 1,960 1,736 - Gross Profit 10.5% 10.5% 8.6% 7.2% 6.5% % Margin 398 394 383 373 366 889 SG&A 1.2% 1.2% 1.3% 1.4% 1.4% % Revenue 3,178 3,146 2,149 1,587 1,370 (889) EBIT 9.3% 9.3% 7.3% 5.8% 5.2% % Margin 677 670 451 327 279 - Tax 2,501 2,476 1,698 1,260 1,091 (889) NOPLAT - - - - - Adding: D&A - - - - - Deducting: CapEx 59 1,070 1,237 70 4,839 (2,625) Deducting: ټ NWC 2,442 1,406 461 1,190 (3,748) 1,736 FCFF

Strictly Private & Confidential Appendix | FCFF Key Assumptions Key Assumptions applied to analyze Free Cash Flow to Firm (FCFF) of the Target are as follows. Key Assumptions Analysis Date Forecast Period Cash Flow Key Assumptions Terminal Growth Rate Income Tax Source: KPMG Analysis © 2023 KPMG Samjong Accounting Corp., a Korea Limited Liability Company and a member firm of the KPMG global organization of independent member firms affiliated with KPMG International Limited, a private English company limited by guarantee. All rights reserved. 120 Macroeconomic Indicators

Strictly Private & Confidential Appendix | Korean Film Market Although the film industry experienced a significant slowdown due to COVID - 19, there has been a gradual recovery attributed to an increase in average unit prices per audience and commercial film releases. Korean Film Market Size Profitability of Korean Commercial Films 2) Notes: 1) Including TV VOD, broadcast rights, online, and DVD Blu - ray; 2) calculated based on films with total production cost of more than KRW 3bn and the return is the total sales minus total costs, divided - Four films have achieved high returns of over 100% in the post - pandemic era 54 72 161 420 438 293 187 89 86 92 56 92 97 ₩8,286 ₩8,396 ₩8,660 ₩9,518 ₩10,049 1,814 2018A 628 286 388 98 63 664 1,160 585 510 1,914 2027E 2022A 2021A 2020A 2019A (unit: KRW bn) ₩12,787 OTT Overseas Theater sales TV VOD and others 1) Theater sales per audience by total production cost / Source: Press Release, Korean Film Council, KPMG Analysis © 2023 KPMG Samjong Accounting Corp., a Korea Limited Liability Company and a member firm of the KPMG global organization of independent member firms affiliated with KPMG International Limited, a private English company limited by guarantee. All rights reserved. 121 2022 2021 2020 2019 2018 2017 36 17 29 45 40 37 Number of films surveyed 0.3% (22.9)% (34.1)% 10.9% (4.8)% 18.0% Rates of Return 7 3 5 20 16 15 Number of titles exceeding BEP 19.4% 17.6% 17.2% 44.4% 40.0% 40.5% % of total titles 1 3 5 10 6 5 BEP ~ 50% 6 - - 5 7 5 50 ~ 100% 4 - - 5 3 5 Above 100% 29 14 24 25 24 22 Number of titles below BEP 80.6% 82.4% 82.8% 55.6% 60.0% 59.5% % of total titles 12 9 9 9 13 11 BEP ~ - 50% 17 5 15 16 11 11 Below - 50%

Strictly Private & Confidential Appendix | Korean OTT Contents Market Netflix, the No. 1 OTT platform in Korea, has been successful in domestic and foreign markets through original Korean content, and investment in Korean content, which is more efficient than in other countries, is expected to continue. Investments in Korean Contents by Netflix and Original Titles Korean OTT Contents Market Trend Reorganize to focus on a small number of OTT companies that have successfully invested in bold content ▪ Netflix has secured competitive content by guaranteeing a high margin rate compared to existing distribution channels, and based on this, it has expanded its market share ▪ As the growth of the OTT market slows, companies with weak content and subscriber base will be eliminated and Netflix - oriented OTT content production will be strengthened Netflix's Continuous Investment Expected due to High Investment Efficiency in Korean Content ▪ Netflix announced plans to expand investment in non - English - speaking content, and "Two out of three top - rated non - English - speaking content in 2021 are Korean content." ▪ Korean content production costs are 1/10th that of the United States, and Korean content is expected to benefit from expanding investment in non - English content due to its high efficiency compared to production costs The Limited Expansion of OTT Original Film Production Expected ▪ Drama can expand the content consumption period from weeks to months by dividing the season and releasing one drama every week ▪ On the other hand, the expansion of original contents of the movie is expected to be limited as the consumption period of the movie is short from 1 to 2 days, which is disadvantageous in terms of maintaining the number of subscribers 15 82 92 248 333 550 - 1 1 5 9 20 24 2016 2017 2018 2019 2020 2021 2022 Investment in Korean contents by Netflix The number of Netflix Korean original titles 1) Note: 1) Includes movies, dramas, entertainment shows, documentaries and animations / Source: Press Release, Expert Interview, Netflix, KPMG Analysis © 2023 KPMG Samjong Accounting Corp., a Korea Limited Liability Company and a member firm of the KPMG global organization of independent member firms affiliated with KPMG International Limited, a private English company limited by guarantee. All rights reserved. 122 (Unit: KRW bn, titles)

Strictly Private & Confidential Solaire Partners
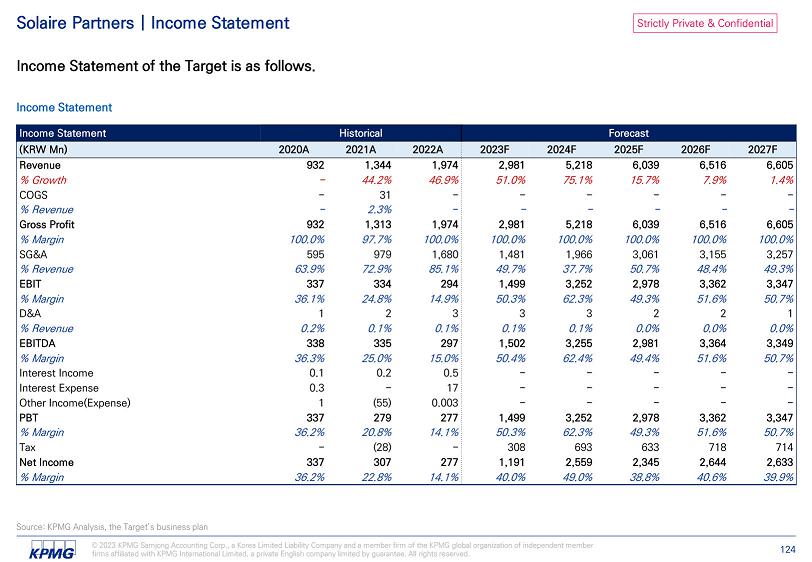
Strictly Private & Confidential © 2023 KPMG Samjong Accounting Corp., a Korea Limited Liability Company and a member firm of the KPMG global organization of independent member firms affiliated with KPMG International Limited, a private English company limited by guarantee. All rights reserved. 124 Solaire Partners | Income Statement Income Statement of the Target is as follows. Income Statement Source: KPMG Analysis, the Target’s business plan Forecast Historical Income Statement 2027F 2026F 2025F 2024F 2023F 2022A 2021A 2020A (KRW Mn) 6,605 6,516 6,039 5,218 2,981 1,974 1,344 932 Revenue 1.4% 7.9% 15.7% 75.1% 51.0% 46.9% 44.2% - % Growth - - - - - - 31 - COGS - - - - - - 2.3% - % Revenue 6,605 6,516 6,039 5,218 2,981 1,974 1,313 932 Gross Profit 100.0% 100.0% 100.0% 100.0% 100.0% 100.0% 97.7% 100.0% % Margin 3,257 3,155 3,061 1,966 1,481 1,680 979 595 SG&A 49.3% 48.4% 50.7% 37.7% 49.7% 85.1% 72.9% 63.9% % Revenue 3,347 3,362 2,978 3,252 1,499 294 334 337 EBIT 50.7% 51.6% 49.3% 62.3% 50.3% 14.9% 24.8% 36.1% % Margin 1 2 2 3 3 3 2 1 D&A 0.0% 0.0% 0.0% 0.1% 0.1% 0.1% 0.1% 0.2% % Revenue 3,349 3,364 2,981 3,255 1,502 297 335 338 EBITDA 50.7% 51.6% 49.4% 62.4% 50.4% 15.0% 25.0% 36.3% % Margin - - - - - 0.5 0.2 0.1 Interest Income - - - - - 17 - 0.3 Interest Expense - - - - - 0.003 (55) 1 Other Income(Expense) 3,347 3,362 2,978 3,252 1,499 277 279 337 PBT 50.7% 51.6% 49.3% 62.3% 50.3% 14.1% 20.8% 36.2% % Margin 714 718 633 693 308 - (28) - Tax 2,633 2,644 2,345 2,559 1,191 277 307 337 Net Income 39.9% 40.6% 38.8% 49.0% 40.0% 14.1% 22.8% 36.2% % Margin
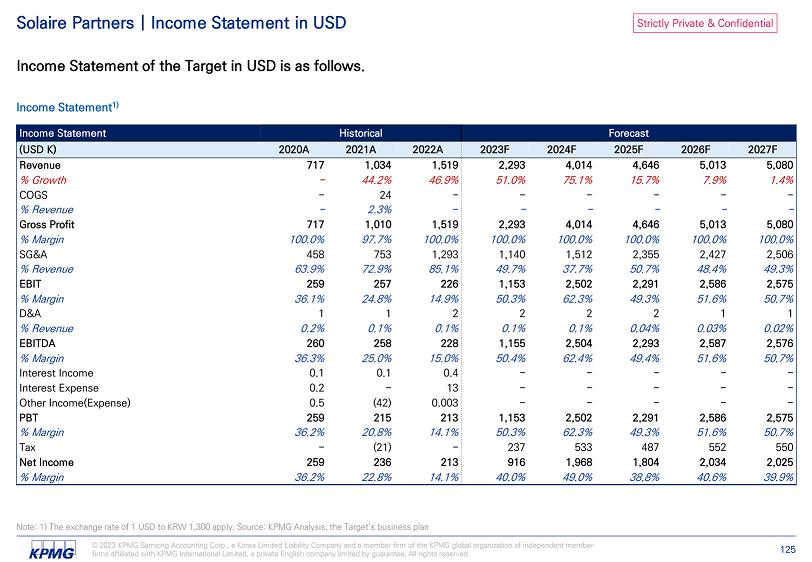
Strictly Private & Confidential © 2023 KPMG Samjong Accounting Corp., a Korea Limited Liability Company and a member firm of the KPMG global organization of independent member firms affiliated with KPMG International Limited, a private English company limited by guarantee. All rights reserved. 125 Solaire Partners | Income Statement in USD Income Statement of the Target in USD is as follows. Income Statement 1) Note: 1) The exchange rate of 1 USD to KRW 1,300 apply. Source: KPMG Analysis, the Target’s business plan Forecast Historical Income Statement 2027F 2026F 2025F 2024F 2023F 2022A 2021A 2020A (USD K) 5,080 5,013 4,646 4,014 2,293 1,519 1,034 717 Revenue 1.4% 7.9% 15.7% 75.1% 51.0% 46.9% 44.2% - % Growth - - - - - - 24 - COGS - - - - - - 2.3% - % Revenue 5,080 5,013 4,646 4,014 2,293 1,519 1,010 717 Gross Profit 100.0% 100.0% 100.0% 100.0% 100.0% 100.0% 97.7% 100.0% % Margin 2,506 2,427 2,355 1,512 1,140 1,293 753 458 SG&A 49.3% 48.4% 50.7% 37.7% 49.7% 85.1% 72.9% 63.9% % Revenue 2,575 2,586 2,291 2,502 1,153 226 257 259 EBIT 50.7% 51.6% 49.3% 62.3% 50.3% 14.9% 24.8% 36.1% % Margin 1 1 2 2 2 2 1 1 D&A 0.02% 0.03% 0.04% 0.1% 0.1% 0.1% 0.1% 0.2% % Revenue 2,576 2,587 2,293 2,504 1,155 228 258 260 EBITDA 50.7% 51.6% 49.4% 62.4% 50.4% 15.0% 25.0% 36.3% % Margin - - - - - 0.4 0.1 0.1 Interest Income - - - - - 13 - 0.2 Interest Expense - - - - - 0.003 (42) 0.5 Other Income(Expense) 2,575 2,586 2,291 2,502 1,153 213 215 259 PBT 50.7% 51.6% 49.3% 62.3% 50.3% 14.1% 20.8% 36.2% % Margin 550 552 487 533 237 - (21) - Tax 2,025 2,034 1,804 1,968 916 213 236 259 Net Income 39.9% 40.6% 38.8% 49.0% 40.0% 14.1% 22.8% 36.2% % Margin
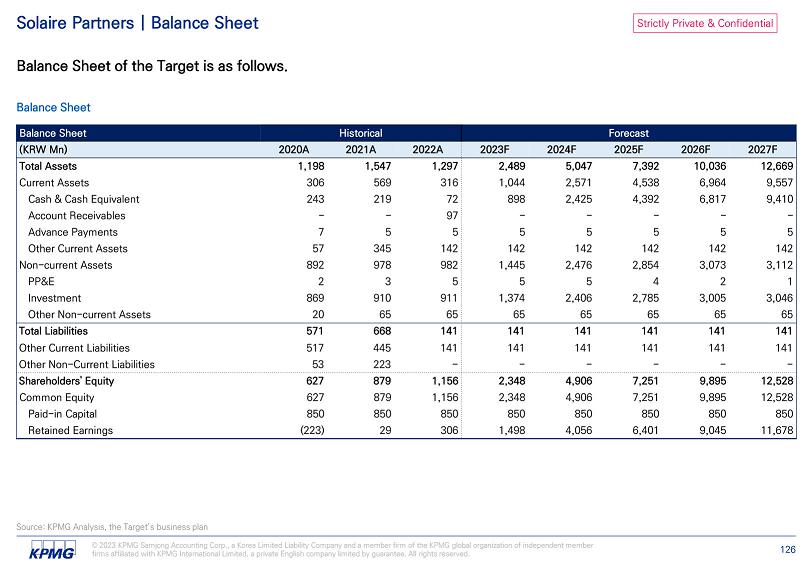
Strictly Private & Confidential Source: KPMG Analysis, the Target’s business plan © 2023 KPMG Samjong Accounting Corp., a Korea Limited Liability Company and a member firm of the KPMG global organization of independent member firms affiliated with KPMG International Limited, a private English company limited by guarantee. All rights reserved. 126 Solaire Partners | Balance Sheet Balance Sheet of the Target is as follows. Balance Sheet Forecast Historical Balance Sheet 2027F 2026F 2025F 2024F 2023F 2022A 2021A 2020A (KRW Mn) 12,669 10,036 7,392 5,047 2,489 1,297 1,547 1,198 Total Assets 9,557 6,964 4,538 2,571 1,044 316 569 306 Current Assets 9,410 6,817 4,392 2,425 898 72 219 243 Cash & Cash Equivalent - - - - - 97 - - Account Receivables 5 5 5 5 5 5 5 7 Advance Payments 142 142 142 142 142 142 345 57 Other Current Assets 3,112 3,073 2,854 2,476 1,445 982 978 892 Non - current Assets 1 2 4 5 5 5 3 2 PP&E 3,046 3,005 2,785 2,406 1,374 911 910 869 Investment 65 65 65 65 65 65 65 20 Other Non - current Assets 141 141 141 141 141 141 668 571 Total Liabilities 141 141 141 141 141 141 445 517 Other Current Liabilities - - - - - - 223 53 Other Non - Current Liabilities 12,528 9,895 7,251 4,906 2,348 1,156 879 627 Shareholders' Equity 12,528 9,895 7,251 4,906 2,348 1,156 879 627 Common Equity 850 850 850 850 850 850 850 850 Paid - in Capital 11,678 9,045 6,401 4,056 1,498 306 29 (223) Retained Earnings

Strictly Private & Confidential Source: KPMG Analysis, the Target’s business plan © 2023 KPMG Samjong Accounting Corp., a Korea Limited Liability Company and a member firm of the KPMG global organization of independent member firms affiliated with KPMG International Limited, a private English company limited by guarantee. All rights reserved. 127 Solaire Partners | Cash Flow Statement Cash Flow Statement of the Target is as follows. Cash Flow Statement Forecast Historical Cash Flow Statement 2027F 2026F 2025F 2024F 2023F 2022A 2021A 2020A (KRW Mn) 2,594 2,426 1,969 1,530 828 Cash Flow from Operating Activities 2,633 2,644 2,345 2,559 1,191 Net Income 1 2 2 3 3 (+) Depreciation & Amortization (41) (220) (379) (1,032) (463) (‒) Change in NWC - - - - 97 (+) Changes in Other Assets(Liabilities) (0.5) (1) (1) (2) (3) Cash Flow from Investing Activities 0.5 1 1 2 3 (‒) CAPEX - - - - - Cash Flow from Financing Activities 6,817 4,392 2,425 898 72 Beginning Cash 2,593 2,425 1,967 1,527 826 (+/‒) Change in Cash 9,410 6,817 4,392 2,425 898 Ending Cash
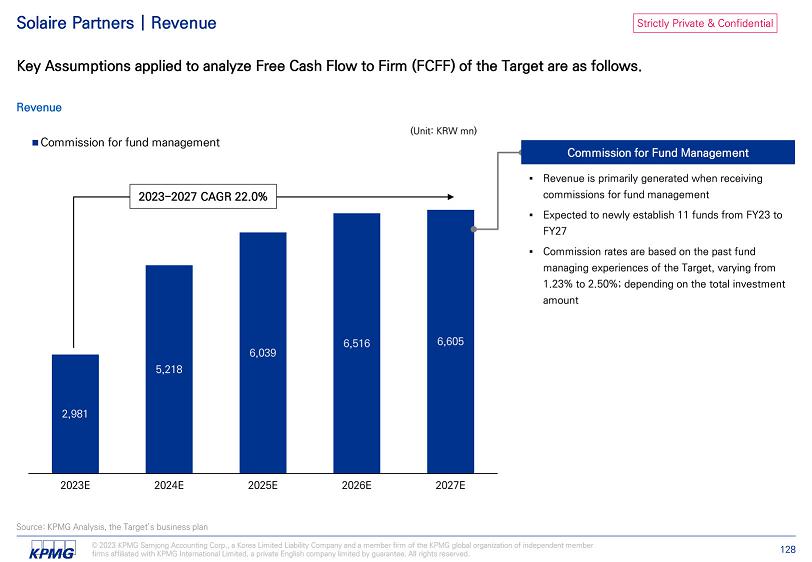
Strictly Private & Confidential Solaire Partners | Revenue Key Assumptions applied to analyze Free Cash Flow to Firm (FCFF) of the Target are as follows. Revenue 2,981 5,218 6,039 6,516 6,605 2023E 2024E 2025E 2026E 2027E Commission for fund management (Unit: KRW mn) Commission for Fund Management 2023 - 2027 CAGR 22.0% Source: KPMG Analysis, the Target’s business plan © 2023 KPMG Samjong Accounting Corp., a Korea Limited Liability Company and a member firm of the KPMG global organization of independent member firms affiliated with KPMG International Limited, a private English company limited by guarantee. All rights reserved. 128
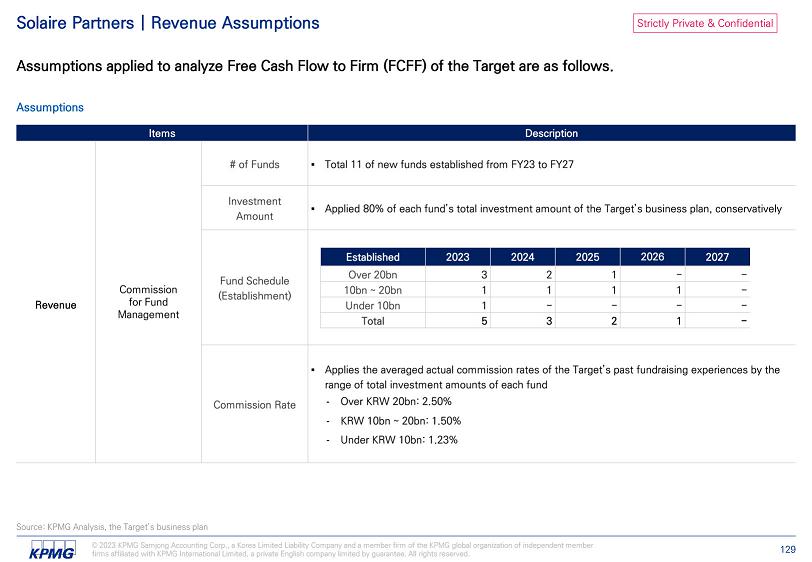
Strictly Private & Confidential Solaire Partners | Revenue Assumptions Assumptions applied to analyze Free Cash Flow to Firm (FCFF) of the Target are as follows. Assumptions Commission for Fund Management Revenue - Over KRW 20bn: 2.50% - KRW 10bn ~ 20bn: 1.50% - Under KRW 10bn: 1.23% Source: KPMG Analysis, the Target’s business plan © 2023 KPMG Samjong Accounting Corp., a Korea Limited Liability Company and a member firm of the KPMG global organization of independent member firms affiliated with KPMG International Limited, a private English company limited by guarantee. All rights reserved. 129
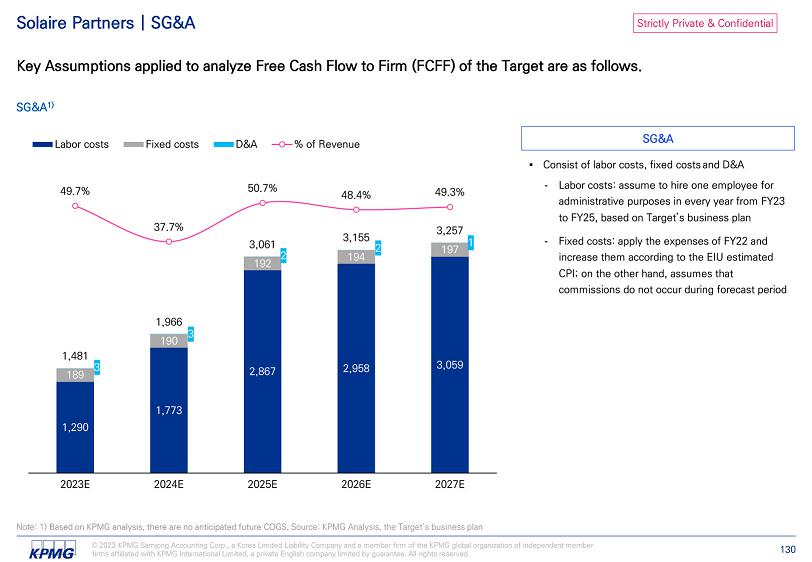
Strictly Private & Confidential Solaire Partners | SG&A Key Assumptions applied to analyze Free Cash Flow to Firm (FCFF) of the Target are as follows. SG&A 1) - Labor costs: assume to hire one employee for administrative purposes in every year from FY23 to FY25, based on Target’s business plan - Fixed costs: apply the expenses of FY22 and increase them according to the EIU estimated CPI; on the other hand, assumes that commissions do not occur during forecast period SG&A 1,290 1,773 2,867 2,958 3,059 189 190 192 194 197 3 3 2 1 1,481 1,966 3,061 3,155 2 3,257 49.7% 37.7% 50.7% 48.4% 49.3% 2023E 2024E 2025E 2026E 2027E Labor costs Fixed costs D&A % of Revenue Note: 1) Based on KPMG analysis, there are no anticipated future COGS, Source: KPMG Analysis, the Target’s business plan © 2023 KPMG Samjong Accounting Corp., a Korea Limited Liability Company and a member firm of the KPMG global organization of independent member firms affiliated with KPMG International Limited, a private English company limited by guarantee. All rights reserved. 130
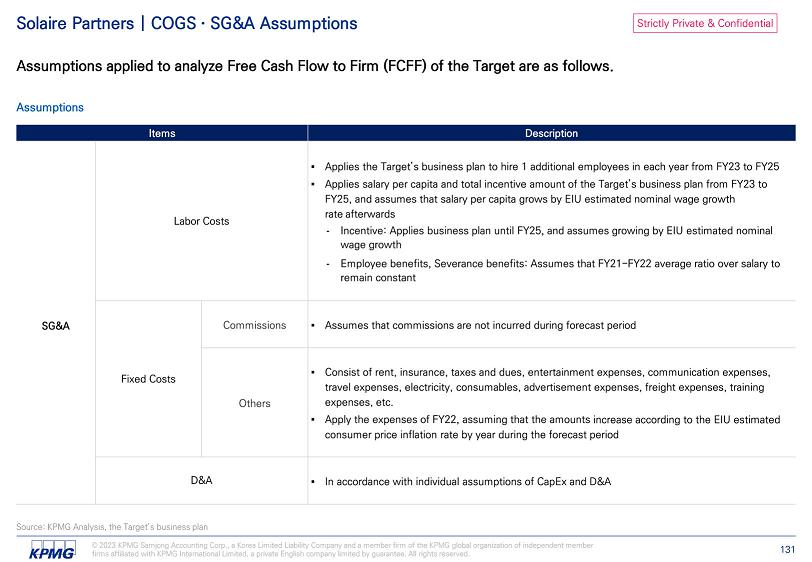
Strictly Private & Confidential Solaire Partners | COGS · SG&A Assumptions Assumptions applied to analyze Free Cash Flow to Firm (FCFF) of the Target are as follows. Assumptions - Incentive: Applies business plan until FY25, and assumes growing by EIU estimated nominal wage growth - Employee benefits, Severance benefits: Assumes that FY21 - FY22 average ratio over salary to remain constant Labor Costs SG&A Fixed Costs ▪ Apply the expenses of FY22, assuming that the amounts D&A Source: KPMG Analysis, the Target’s business plan © 2023 KPMG Samjong Accounting Corp., a Korea Limited Liability Company and a member firm of the KPMG global organization of independent member firms affiliated with KPMG International Limited, a private English company limited by guarantee. All rights reserved. 131
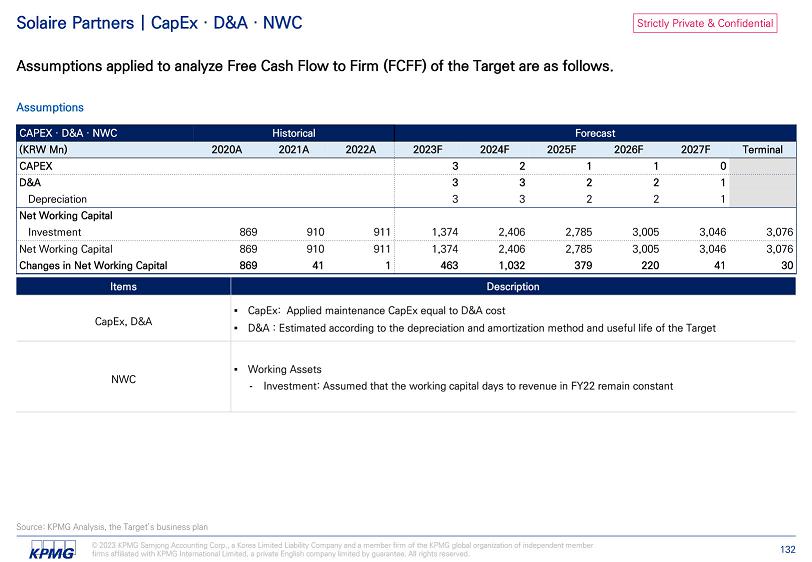
Strictly Private & Confidential Solaire Partners | CapEx · D&A · NWC Assumptions applied to analyze Free Cash Flow to Firm (FCFF) of the Target are as follows. Assumptions Forecast Historical CAPEX · D&A · NWC Terminal 2027F 2026F 2025F 2024F 2023F 2022A 2021A 2020A (KRW Mn) 0 1 1 2 3 CAPEX 1 2 2 3 3 D&A 1 2 2 3 3 Depreciation Net Working Capital 3,076 3,046 3,005 2,785 2,406 1,374 911 910 869 Investment 3,076 3,046 3,005 2,785 2,406 1,374 911 910 869 Net Working Capital 30 41 220 379 1,032 463 1 41 869 Changes in Net Working Capital CapEx, D&A - Investment: Assumed that the working capital days to revenue in FY22 remain constant NWC Source: KPMG Analysis, the Target’s business plan © 2023 KPMG Samjong Accounting Corp., a Korea Limited Liability Company and a member firm of the KPMG global organization of independent member firms affiliated with KPMG International Limited, a private English company limited by guarantee. All rights reserved. 132
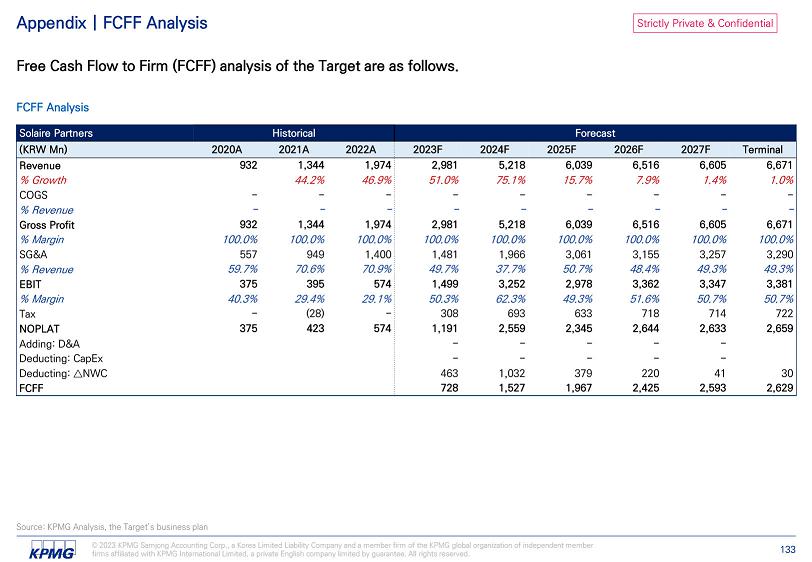
Strictly Private & Confidential Source: KPMG Analysis, the Target’s business plan © 2023 KPMG Samjong Accounting Corp., a Korea Limited Liability Company and a member firm of the KPMG global organization of independent member firms affiliated with KPMG International Limited, a private English company limited by guarantee. All rights reserved. 133 Appendix | FCFF Analysis Free Cash Flow to Firm (FCFF) analysis of the Target are as follows. FCFF Analysis Forecast Historical Solaire Partners Terminal 2027F 2026F 2025F 2024F 2023F 2022A 2021A 2020A (KRW Mn) 6,671 6,605 6,516 6,039 5,218 2,981 1,974 1,344 932 Revenue 1.0% 1.4% 7.9% 15.7% 75.1% 51.0% 46.9% 44.2% % Growth - - - - - - - - - COGS - - - - - - - - - % Revenue 6,671 6,605 6,516 6,039 5,218 2,981 1,974 1,344 932 Gross Profit 100.0% 100.0% 100.0% 100.0% 100.0% 100.0% 100.0% 100.0% 100.0% % Margin 3,290 3,257 3,155 3,061 1,966 1,481 1,400 949 557 SG&A 49.3% 49.3% 48.4% 50.7% 37.7% 49.7% 70.9% 70.6% 59.7% % Revenue 3,381 3,347 3,362 2,978 3,252 1,499 574 395 375 EBIT 50.7% 50.7% 51.6% 49.3% 62.3% 50.3% 29.1% 29.4% 40.3% % Margin 722 714 718 633 693 308 - (28) - Tax 2,659 2,633 2,644 2,345 2,559 1,191 574 423 375 NOPLAT - - - - - Adding: D&A - - - - - Deducting: CapEx 30 41 220 379 1,032 463 Deducting: ټ NWC 2,629 2,593 2,425 1,967 1,527 728 FCFF
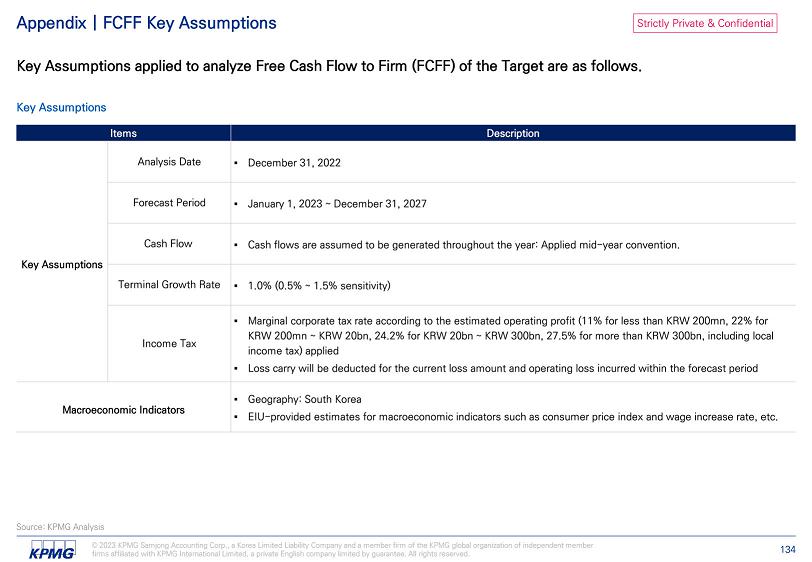
Strictly Private & Confidential Appendix | FCFF Key Assumptions Key Assumptions applied to analyze Free Cash Flow to Firm (FCFF) of the Target are as follows. Key Assumptions Analysis Date Forecast Period Cash Flow Key Assumptions Terminal Growth Rate Income Tax Source: KPMG Analysis © 2023 KPMG Samjong Accounting Corp., a Korea Limited Liability Company and a member firm of the KPMG global organization of independent member firms affiliated with KPMG International Limited, a private English company limited by guarantee. All rights reserved. 134 Macroeconomic Indicators
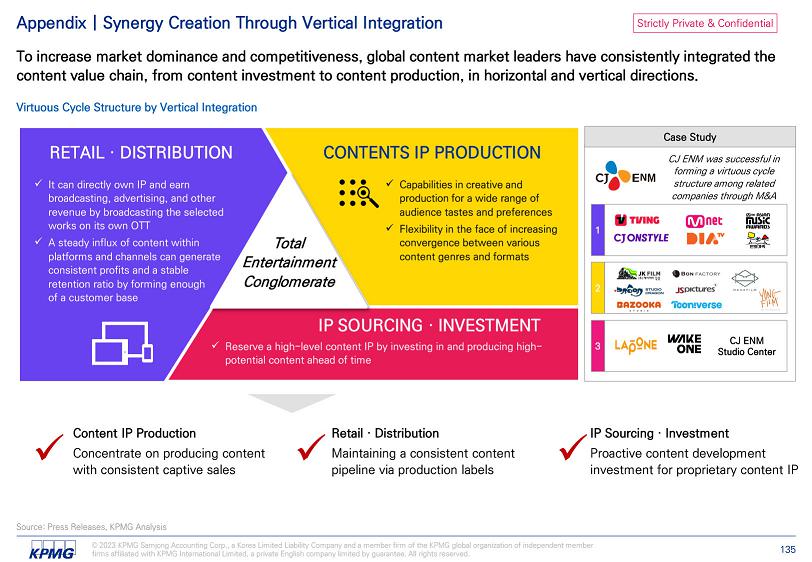
Strictly Private & Confidential 1 2 3 Appendix | Synergy Creation Through Vertical Integration To increase market dominance and competitiveness, global content market leaders have consistently integrated the content value chain, from content investment to content production, in horizontal and vertical directions. Virtuous Cycle Structure by Vertical Integration Content IP Production Concentrate on producing content with consistent captive sales RETAIL · DISTRIBUTION CONTENTS IP PRODUCTION CJ ENM Studio Center Case Study CJ ENM was successful in forming a virtuous cycle structure among related companies through M&A Total Entertainment Conglomerate x Capabilities in creative and production for a wide range of audience tastes and preferences x Flexibility in the face of increasing convergence between various content genres and formats x It can directly own IP and earn broadcasting, advertising, and other revenue by broadcasting the selected works on its own OTT x A steady influx of content within platforms and channels can generate consistent profits and a stable retention ratio by forming enough of a customer base IP SOURCING · INVESTMENT x Reserve a high - level content IP by investing in and producing high - potential content ahead of time x Source: Press Releases, KPMG Analysis © 2023 KPMG Samjong Accounting Corp., a Korea Limited Liability Company and a member firm of the KPMG global organization of independent member firms affiliated with KPMG International Limited, a private English company limited by guarantee. All rights reserved. 135 Retail · Distribution x Maintaining a consistent content pipeline via production labels x IP Sourcing · Investment Proactive content development investment for proprietary content IP
Strictly Private & Confidential K · Enter Drama Team
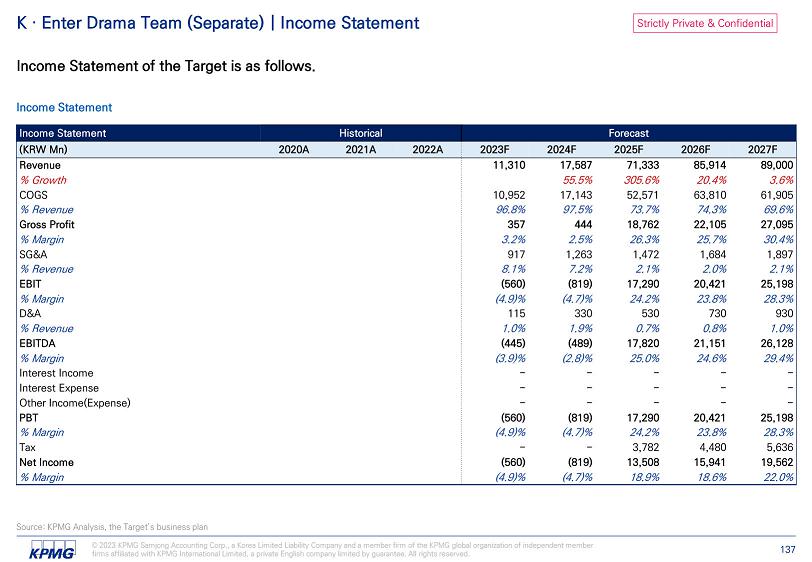
Strictly Private & Confidential © 2023 KPMG Samjong Accounting Corp., a Korea Limited Liability Company and a member firm of the KPMG global organization of independent member firms affiliated with KPMG International Limited, a private English company limited by guarantee. All rights reserved. 137 K · Enter Drama Team (Separate) | Income Statement Income Statement of the Target is as follows. Income Statement Source: KPMG Analysis, the Target’s business plan Forecast Historical Income Statement 2027F 2026F 2025F 2024F 2023F 2022A 2021A 2020A (KRW Mn) 89,000 85,914 71,333 17,587 11,310 Revenue 3.6% 20.4% 305.6% 55.5% % Growth 61,905 63,810 52,571 17,143 10,952 COGS 69.6% 74.3% 73.7% 97.5% 96.8% % Revenue 27,095 22,105 18,762 444 357 Gross Profit 30.4% 25.7% 26.3% 2.5% 3.2% % Margin 1,897 1,684 1,472 1,263 917 SG&A 2.1% 2.0% 2.1% 7.2% 8.1% % Revenue 25,198 20,421 17,290 (819) (560) EBIT 28.3% 23.8% 24.2% (4.7)% (4.9)% % Margin 930 730 530 330 115 D&A 1.0% 0.8% 0.7% 1.9% 1.0% % Revenue 26,128 21,151 17,820 (489) (445) EBITDA 29.4% 24.6% 25.0% (2.8)% (3.9)% % Margin - - - - - Interest Income - - - - - Interest Expense - - - - - Other Income(Expense) 25,198 20,421 17,290 (819) (560) PBT 28.3% 23.8% 24.2% (4.7)% (4.9)% % Margin 5,636 4,480 3,782 - - Tax 19,562 15,941 13,508 (819) (560) Net Income 22.0% 18.6% 18.9% (4.7)% (4.9)% % Margin
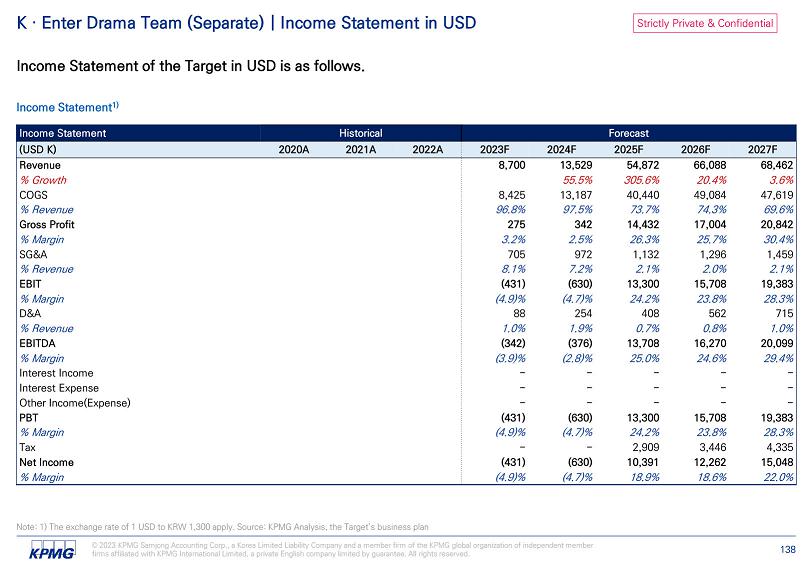
Strictly Private & Confidential © 2023 KPMG Samjong Accounting Corp., a Korea Limited Liability Company and a member firm of the KPMG global organization of independent member firms affiliated with KPMG International Limited, a private English company limited by guarantee. All rights reserved. 138 K · Enter Drama Team (Separate) | Income Statement in USD Income Statement of the Target in USD is as follows. Income Statement 1) Note: 1) The exchange rate of 1 USD to KRW 1,300 apply. Source: KPMG Analysis, the Target’s business plan Forecast Historical Income Statement 2027F 2026F 2025F 2024F 2023F 2022A 2021A 2020A (USD K) 68,462 66,088 54,872 13,529 8,700 Revenue 3.6% 20.4% 305.6% 55.5% % Growth 47,619 49,084 40,440 13,187 8,425 COGS 69.6% 74.3% 73.7% 97.5% 96.8% % Revenue 20,842 17,004 14,432 342 275 Gross Profit 30.4% 25.7% 26.3% 2.5% 3.2% % Margin 1,459 1,296 1,132 972 705 SG&A 2.1% 2.0% 2.1% 7.2% 8.1% % Revenue 19,383 15,708 13,300 (630) (431) EBIT 28.3% 23.8% 24.2% (4.7)% (4.9)% % Margin 715 562 408 254 88 D&A 1.0% 0.8% 0.7% 1.9% 1.0% % Revenue 20,099 16,270 13,708 (376) (342) EBITDA 29.4% 24.6% 25.0% (2.8)% (3.9)% % Margin - - - - - Interest Income - - - - - Interest Expense - - - - - Other Income(Expense) 19,383 15,708 13,300 (630) (431) PBT 28.3% 23.8% 24.2% (4.7)% (4.9)% % Margin 4,335 3,446 2,909 - - Tax 15,048 12,262 10,391 (630) (431) Net Income 22.0% 18.6% 18.9% (4.7)% (4.9)% % Margin

Strictly Private & Confidential Source: KPMG Analysis, the Target’s business plan © 2023 KPMG Samjong Accounting Corp., a Korea Limited Liability Company and a member firm of the KPMG global organization of independent member firms affiliated with KPMG International Limited, a private English company limited by guarantee. All rights reserved. 139 K · Enter Drama Team (Separate) | Balance Sheet Balance Sheet of the Target is as follows. Balance Sheet Forecast Historical Balance Sheet 2027F 2026F 2025F 2024F 2023F 2022A 2021A 2020A (KRW Mn) 71,472 51,687 34,275 15,469 15,627 Total Assets 68,957 49,242 32,100 13,764 14,592 Current Assets 54,621 34,580 19,837 9,174 11,297 Cash & Cash Equivalent 1,295 1,251 1,038 256 165 Account Receivables 7,619 7,854 6,471 2,110 1,348 Inventory 1,000 1,000 1,000 1,000 1,000 Advance Payments 4,421 4,557 3,755 1,224 782 Prepaid Expenses 2,515 2,445 2,175 1,705 1,035 Non - current Assets 15 45 75 105 135 PP&E 2,500 2,400 2,100 1,600 900 Intangible Assets 8,839 8,616 7,146 1,848 1,187 Total Liabilities 1,276 1,315 1,083 353 226 Account Payables 7,564 7,302 6,062 1,495 961 Advances from Customers 62,633 43,070 27,130 13,622 14,440 Shareholders' Equity 62,633 43,070 27,130 13,622 14,440 Common Equity 15,000 15,000 15,000 15,000 15,000 Paid - in Capital 47,633 28,070 12,130 (1,378) (560) Retained Earnings
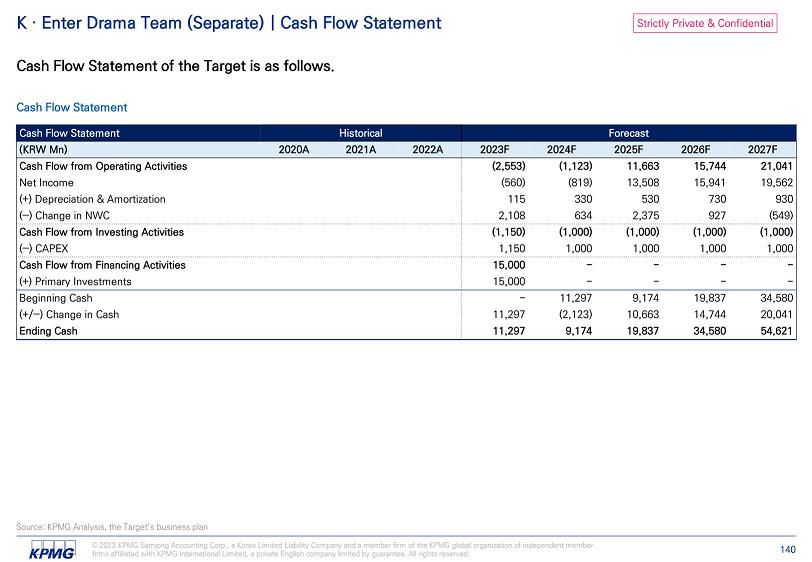
Strictly Private & Confidential Source: KPMG Analysis, the Target’s business plan © 2023 KPMG Samjong Accounting Corp., a Korea Limited Liability Company and a member firm of the KPMG global organization of independent member firms affiliated with KPMG International Limited, a private English company limited by guarantee. All rights reserved. 140 K · Enter Drama Team (Separate) | Cash Flow Statement Cash Flow Statement of the Target is as follows. Cash Flow Statement Forecast Historical Cash Flow Statement 2027F 2026F 2025F 2024F 2023F 2022A 2021A 2020A (KRW Mn) 21,041 15,744 11,663 (1,123) (2,553) Cash Flow from Operating Activities 19,562 15,941 13,508 (819) (560) Net Income 930 730 530 330 115 (+) Depreciation & Amortization (549) 927 2,375 634 2,108 (‒) Change in NWC (1,000) (1,000) (1,000) (1,000) (1,150) Cash Flow from Investing Activities 1,000 1,000 1,000 1,000 1,150 (‒) CAPEX - - - - 15,000 Cash Flow from Financing Activities - - - - 15,000 (+) Primary Investments 34,580 19,837 9,174 11,297 - Beginning Cash 20,041 14,744 10,663 (2,123) 11,297 (+/‒) Change in Cash 54,621 34,580 19,837 9,174 11,297 Ending Cash
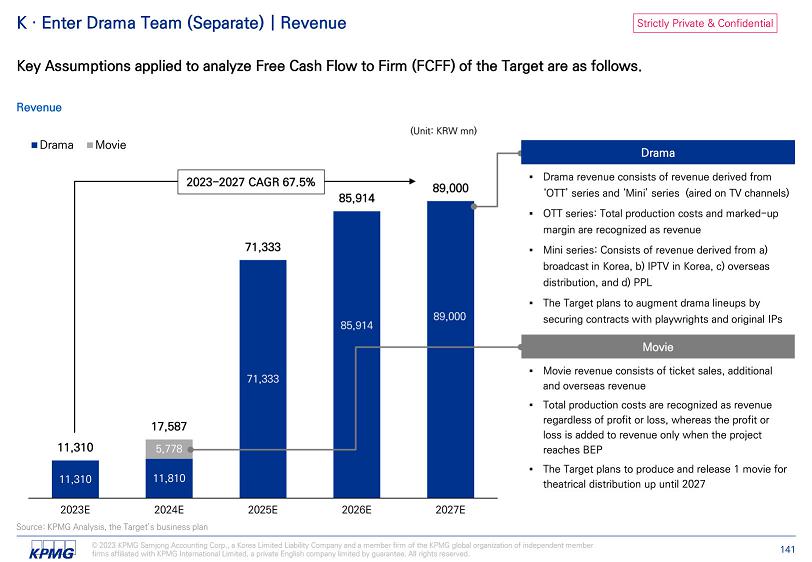
Strictly Private & Confidential 11,310 11,810 71,333 89,000 85,914 5,778 11,310 17,587 71,333 85,914 89,000 2023E 2024E 2025E 2026E 2027E Drama Movie K · Enter Drama Team (Separate) | Revenue Key Assumptions applied to analyze Free Cash Flow to Firm (FCFF) of the Target are as follows. Revenue (Unit: KRW mn) Drama 2023 - 2027 CAGR 67.5% Movie Source: KPMG Analysis, the Target’s business plan © 2023 KPMG Samjong Accounting Corp., a Korea Limited Liability Company and a member firm of the KPMG global organization of independent member firms affiliated with KPMG International Limited, a private English company limited by guarantee. All rights reserved. 141
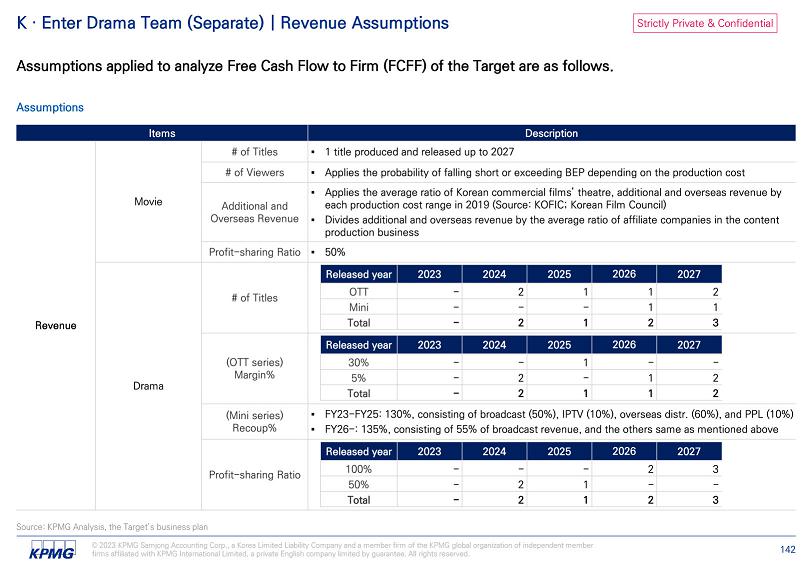
Strictly Private & Confidential K · Enter Drama Team (Separate) | Revenue Assumptions Assumptions applied to analyze Free Cash Flow to Firm (FCFF) of the Target are as follows. Assumptions Revenue Source: KPMG Analysis, the Target’s business plan © 2023 KPMG Samjong Accounting Corp., a Korea Limited Liability Company and a member firm of the KPMG global organization of independent member firms affiliated with KPMG International Limited, a private English company limited by guarantee. All rights reserved. 142 Movie Drama
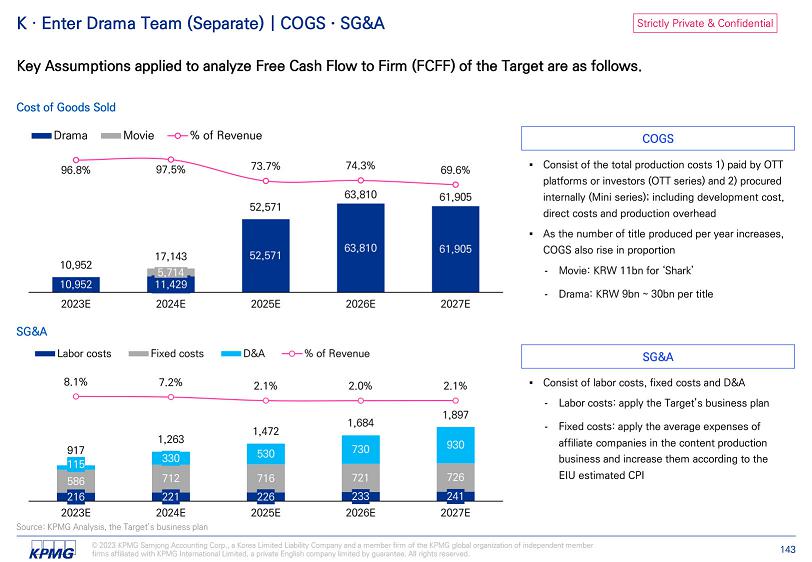
Strictly Private & Confidential K · Enter Drama Team (Separate) | COGS · SG&A Key Assumptions applied to analyze Free Cash Flow to Firm (FCFF) of the Target are as follows. Cost of Goods Sold SG&A 216 221 226 233 586 241 712 716 721 726 115 330 530 730 930 917 1,263 1,472 1,684 1,897 8.1% 7.2% 2.1% 2.0% 2.1% 2023E 2024E 2025E 2026E 2027E Labor costs Fixed costs D&A % of Revenue - Movie: KRW 11bn for ‘Shark’ - Drama: KRW COGS SG&A - Labor costs: apply th - Fixed costs: apply the average expenses of affiliate companies in the content production business and increase them according to the EIU estimated CPI 10,952 11,429 52,571 63,810 61,905 5,714 10,952 17,143 52,571 63,810 61,905 96.8% 97.5% 73.7% 74.3% 69.6% 2023E 2024E 2025E 2026E 2027E Drama Movie % of Revenue Source: KPMG Analysis, the Target’s business plan © 2023 KPMG Samjong Accounting Corp., a Korea Limited Liability Company and a member firm of the KPMG global organization of independent member firms affiliated with KPMG International Limited, a private English company limited by guarantee. All rights reserved. 143
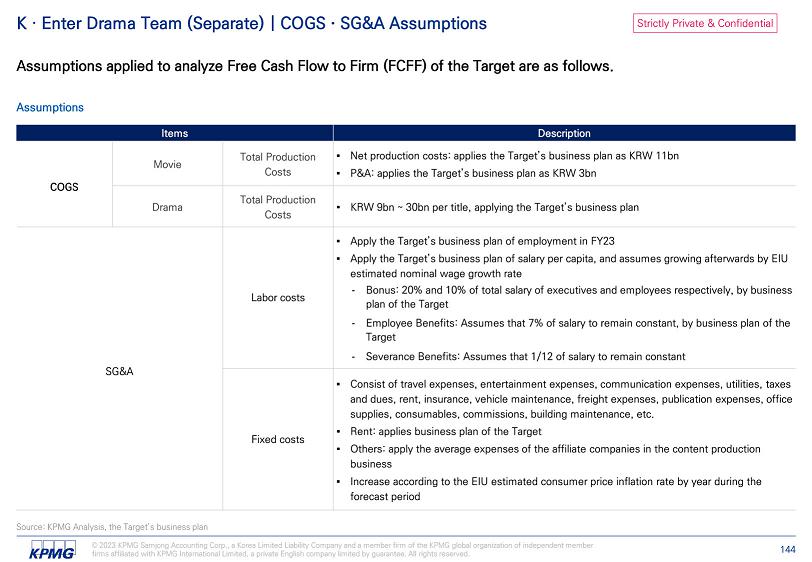
Strictly Private & Confidential K · Enter Drama Team (Separate) | COGS · SG&A Assumptions Assumptions applied to analyze Free Cash Flow to Firm (FCFF) of the Target are as follows. Assumptions COGS ▪ KRW - Bonus: 20% and 10% of total salary of executives and employees respectively, by business plan of the Target - Employee Benefits: Assumes that 7% of salary to remain constant, by business plan of the Target - Severance Benefits: Assumes that 1/12 of salary to remain constant Labor costs SG&A ▪ Rent: applies business plan of the Target ▪ Others: apply the average expenses of the affiliate companies in the content production business Fixed costs Source: KPMG Analysis, the Target’s business plan © 2023 KPMG Samjong Accounting Corp., a Korea Limited Liability Company and a member firm of the KPMG global organization of independent member firms affiliated with KPMG International Limited, a private English company limited by guarantee. All rights reserved. 144
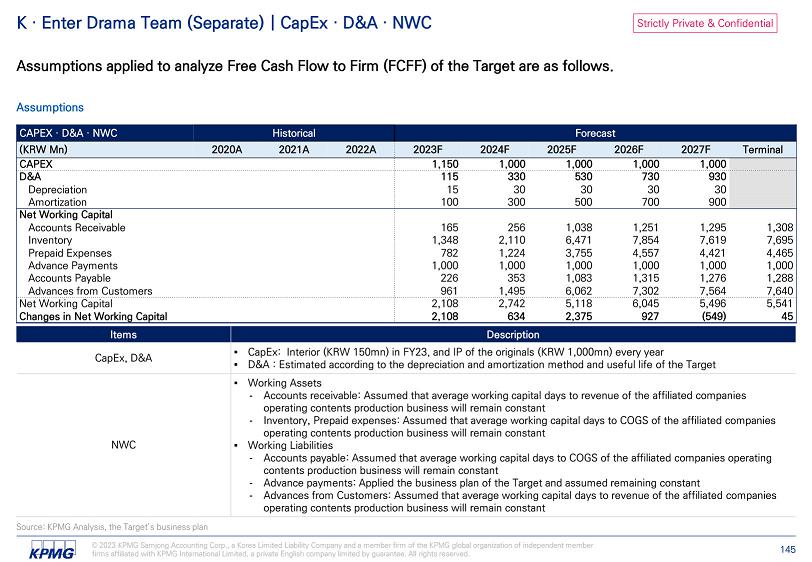
Strictly Private & Confidential K · Enter Drama Team (Separate) | CapEx · D&A · NWC Assumptions applied to analyze Free Cash Flow to Firm (FCFF) of the Target are as follows. Assumptions Forecast Historical CAPEX · D&A · NWC Terminal 2027F 2026F 2025F 2024F 2023F 2022A 2021A 2020A (KRW Mn) 1,000 1,000 1,000 1,000 1,150 CAPEX 930 730 530 330 115 D&A 30 30 30 30 15 Depreciation 900 700 500 300 100 Amortization Net Working Capital 1,308 1,295 1,251 1,038 256 165 Accounts Receivable 7,695 7,619 7,854 6,471 2,110 1,348 Inventory 4,465 4,421 4,557 3,755 1,224 782 Prepaid Expenses 1,000 1,000 1,000 1,000 1,000 1,000 Advance Payments 1,288 1,276 1,315 1,083 353 226 Accounts Payable 7,640 7,564 7,302 6,062 1,495 961 Advances from Customers 5,541 5,496 6,045 5,118 2,742 2,108 Net Working Capital 45 (549) 927 2,375 634 2,108 Changes in Net Working Capital CapEx, D&A - Accounts receivable: Assumed that average working capital days to revenue of the will remain constant - Inventory, Prepaid expenses: Assumed that average working capital days to COGS of the will remain constant - Accounts payable: Assumed that average working capital days to COGS of the will remain constant - Advance payments: Applied the business plan of the Target and assumed remaining constant - Advances from Customers: Assumed that average working capital days to revenue of the will remain constant NWC Source: KPMG Analysis, the Target’s business plan © 2023 KPMG Samjong Accounting Corp., a Korea Limited Liability Company and a member firm of the KPMG global organization of independent member firms affiliated with KPMG International Limited, a private English company limited by guarantee. All rights reserved. 145
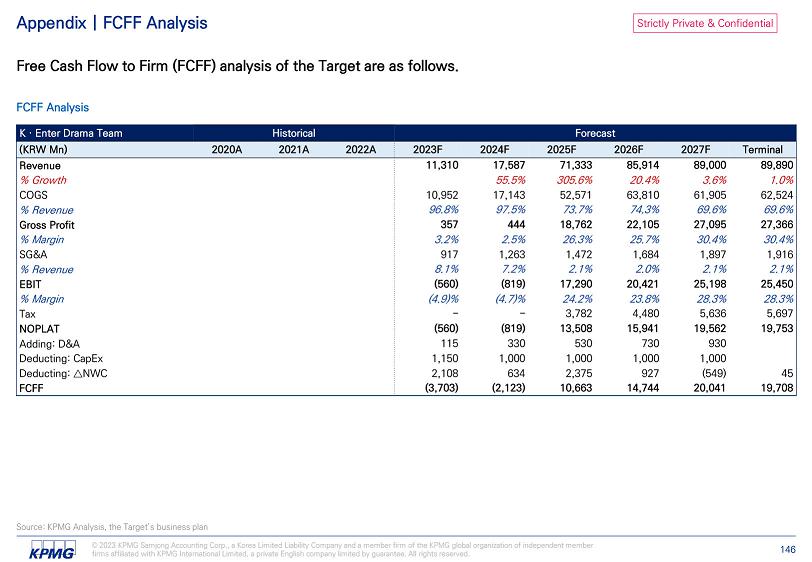
Strictly Private & Confidential Source: KPMG Analysis, the Target’s business plan © 2023 KPMG Samjong Accounting Corp., a Korea Limited Liability Company and a member firm of the KPMG global organization of independent member firms affiliated with KPMG International Limited, a private English company limited by guarantee. All rights reserved. 146 Appendix | FCFF Analysis Free Cash Flow to Firm (FCFF) analysis of the Target are as follows. FCFF Analysis Forecast Historical K · Enter Drama Team Terminal 2027F 2026F 2025F 2024F 2023F 2022A 2021A 2020A (KRW Mn) 89,890 89,000 85,914 71,333 17,587 11,310 Revenue 1.0% 3.6% 20.4% 305.6% 55.5% % Growth 62,524 61,905 63,810 52,571 17,143 10,952 COGS 69.6% 69.6% 74.3% 73.7% 97.5% 96.8% % Revenue 27,366 27,095 22,105 18,762 444 357 Gross Profit 30.4% 30.4% 25.7% 26.3% 2.5% 3.2% % Margin 1,916 1,897 1,684 1,472 1,263 917 SG&A 2.1% 2.1% 2.0% 2.1% 7.2% 8.1% % Revenue 25,450 25,198 20,421 17,290 (819) (560) EBIT 28.3% 28.3% 23.8% 24.2% (4.7)% (4.9)% % Margin 5,697 5,636 4,480 3,782 - - Tax 19,753 19,562 15,941 13,508 (819) (560) NOPLAT 930 730 530 330 115 Adding: D&A 1,000 1,000 1,000 1,000 1,150 Deducting: CapEx 45 (549) 927 2,375 634 2,108 Deducting: ټ NWC 19,708 20,041 14,744 10,663 (2,123) (3,703) FCFF

Strictly Private & Confidential Appendix | FCFF Key Assumptions Key Assumptions applied to analyze Free Cash Flow to Firm (FCFF) of the Target are as follows. Key Assumptions Analysis Date Forecast Period Cash Flow Key Assumptions Terminal Growth Rate Income Tax Source: KPMG Analysis © 2023 KPMG Samjong Accounting Corp., a Korea Limited Liability Company and a member firm of the KPMG global organization of independent member firms affiliated with KPMG International Limited, a private English company limited by guarantee. All rights reserved. 147 Macroeconomic Indicators
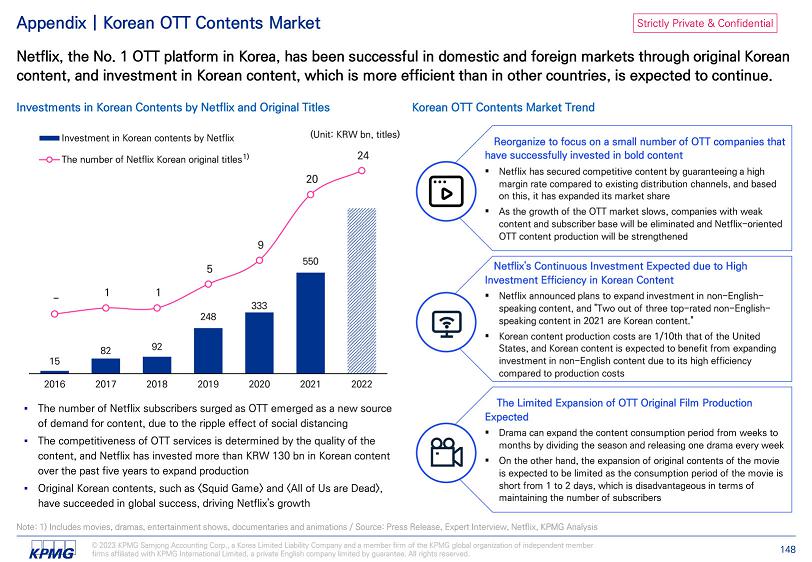
Strictly Private & Confidential Appendix | Korean OTT Contents Market Netflix, the No. 1 OTT platform in Korea, has been successful in domestic and foreign markets through original Korean content, and investment in Korean content, which is more efficient than in other countries, is expected to continue. Investments in Korean Contents by Netflix and Original Titles Korean OTT Contents Market Trend Reorganize to focus on a small number of OTT companies that have successfully invested in bold content ▪ Netflix has secured competitive content by guaranteeing a high margin rate compared to existing distribution channels, and based on this, it has expanded its market share ▪ As the growth of the OTT market slows, companies with weak content and subscriber base will be eliminated and Netflix - oriented OTT content production will be strengthened Netflix's Continuous Investment Expected due to High Investment Efficiency in Korean Content ▪ Netflix announced plans to expand investment in non - English - speaking content, and "Two out of three top - rated non - English - speaking content in 2021 are Korean content." ▪ Korean content production costs are 1/10th that of the United States, and Korean content is expected to benefit from expanding investment in non - English content due to its high efficiency compared to production costs The Limited Expansion of OTT Original Film Production Expected ▪ Drama can expand the content consumption period from weeks to months by dividing the season and releasing one drama every week ▪ On the other hand, the expansion of original contents of the movie is expected to be limited as the consumption period of the movie is short from 1 to 2 days, which is disadvantageous in terms of maintaining the number of subscribers 15 82 92 248 333 550 - 1 1 5 9 20 24 2016 2017 2018 2019 2020 2021 2022 Investment in Korean contents by Netflix The number of Netflix Korean original titles 1) Note: 1) Includes movies, dramas, entertainment shows, documentaries and animations / Source: Press Release, Expert Interview, Netflix, KPMG Analysis © 2023 KPMG Samjong Accounting Corp., a Korea Limited Liability Company and a member firm of the KPMG global organization of independent member firms affiliated with KPMG International Limited, a private English company limited by guarantee. All rights reserved. 148 (Unit: KRW bn, titles)
kpmg.com/kr © 2023 KPMG Samjong Accounting Corp., a Korea Limited Liability Company and a member firm of the KPMG global organization of independent member firms affiliated with KPMG International Limited, a private English company limited by guarantee. All rights reserved. The KPMG name and logo are trademarks used under license by the independent member firms of the KPMG global organization. The information contained herein is of a general nature and is not intended to address the circumstances of any particular individual or entity. Although we endeavour to provide accurate and timely information, there can be no guarantee that such information is accurate as of the date it is received or that it will continue to be accurate in the future. No one should act on such information without appropriate professional advice after a thorough examination of the particular situation. Contact us Strictly Private & Confidential PARK, Young - gul Partner Tel. 02 2112 0749 Mail. younggulpark@kr.kpmg.com PARK, Song - hak Director Tel. 02 2112 7585 Mail. songhakpark@kr.kpmg.com