
Chittenden CORPORATION
reaching more customers by reaching out with more
As of September 30, 2004
Multi-bank holding company with significant operating autonomy at the individual banks
Banking assets of $6.0 billion at September 30, 2004
Listed on the NYSE (CHZ), current market capitalization of $1.3 billion
120 full service banking offices and 152 ATM locations throughout VT, NH, MA, ME
Commercial loans make up 69% of the total loan portfolio and core funding comprises 97% of total funding
Strong wealth management operation with assets under administration of $7.9 billion and assets under management of $1.9 billion
Excellent credit quality with year-to-date charge-offs at .04% and an allowance for loan losses to loans of 1.47%
Who We Are
2
Recognized competency in an attractive business mix
Deep relationships with worthwhile customers
Conservative underwriting standards and disciplined lending
Efficient generator of low cost stable deposits
Proven leadership focus to achieve superior financial results
Well established and tangible shareholder orientation
A Tradition of Success
3
Complete the merger of Granite into Ocean National Bank and other franchise streamlining initiatives
Complete the IT conversion from Fidelity to Jack Henry and realize the product, operating and financial benefits of the new system
Maintain a risk based capital ratio in excess of 11% and tangible common equity of 6% or higher
Maintain strong asset quality and an allowance for loan losses greater than 1.40%
Continue the steady growth in the Company’s earnings per share and improve the efficiency ratio by at least 2% starting in the 3rd quarter
Objectives and Outlook for 2004
4
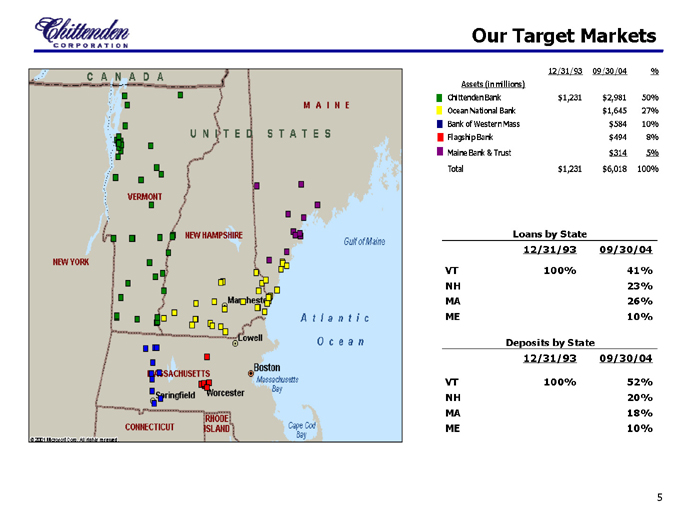
Our Target Markets
12/31/93
09/30/04
%
Assets (in millions)
Chittenden Bank
$1,231
$2,981
50%
Ocean National Bank
$1,645
27%
Bank of Western Mass
$584
10%
Flagship Bank
$494
8%
Maine Bank & Trust
$314
5%
Total
$1,231
$6,018
100%
Loans by State
12/31/93 09/30/04
VT 100% 41%
NH 23%
MA 26%
ME 10%
Deposits by State
12/31/93 09/30/04
VT 100% 52%
NH 20%
MA 18%
ME 10%
5
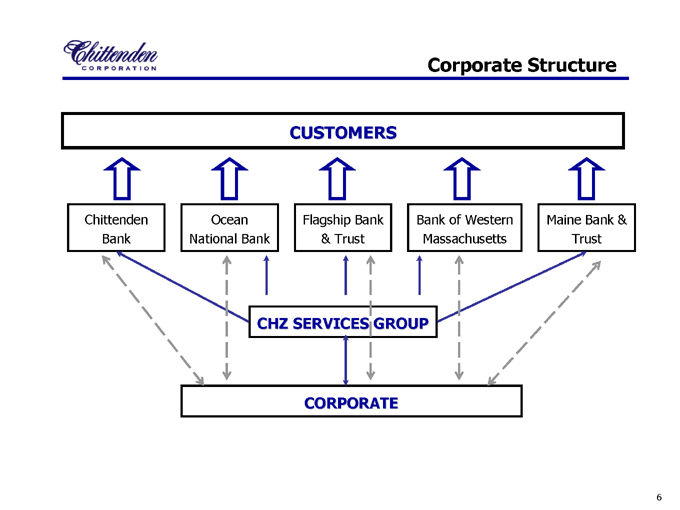
CUSTOMERS
Chittenden Bank
Ocean National Bank
Bank of Western Massachusetts
Flagship Bank & Trust
Maine Bank & Trust
CHZ SERVICES GROUP
CORPORATE
Corporate Structure
6
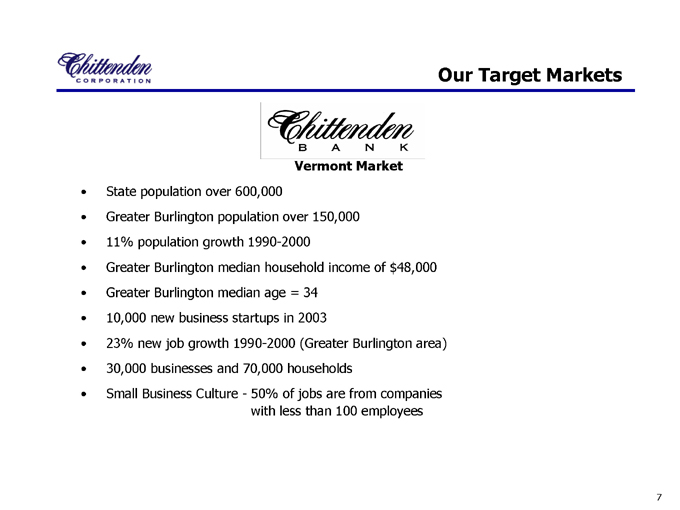
Bank
Vermont Market
State population over 600,000
Greater Burlington population over 150,000
11% population growth 1990-2000
Greater Burlington median household income of $48,000
Greater Burlington median age = 34
10,000 new business startups in 2003
23% new job growth 1990-2000 (Greater Burlington area)
30,000 businesses and 70,000 households
Small Business Culture—50% of jobs are from companies
with less than 100 employees
Our Target Markets
7
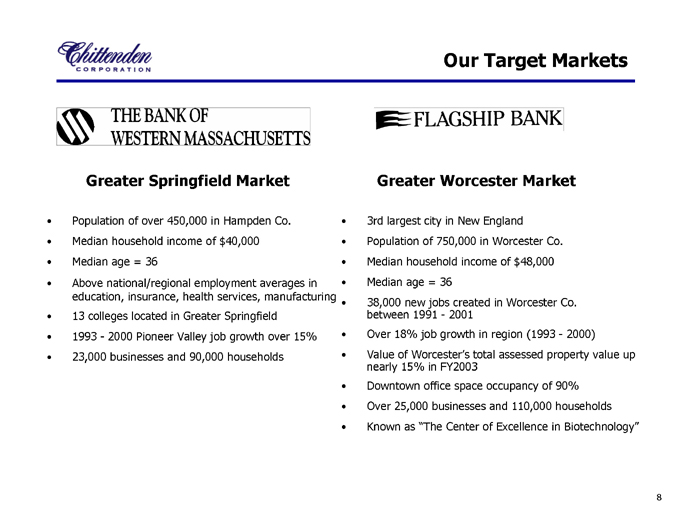
THE BANK OF WESTERN MASSACHUSETTS
FLAGSHIP BANK
Greater Springfield Market Greater Worcester Market
Population of over 450,000 in Hampden Co.
Median household income of $40,000
Median age = 36
Above national/regional employment averages in education, insurance, health services, manufacturing
13 colleges located in Greater Springfield
1993—2000 Pioneer Valley job growth over 15%
23,000 businesses and 90,000 households
3rd largest city in New England
Population of 750,000 in Worcester Co.
Median household income of $48,000
Median age = 36
38,000 new jobs created in Worcester Co.
between 1991—2001
Over 18% job growth in region (1993—2000)
Value of Worcester’s total assessed property value up nearly 15% in FY2003
Downtown office space occupancy of 90%
Over 25,000 businesses and 110,000 households
Known as “The Center of Excellence in Biotechnology”
Our Target Markets
8
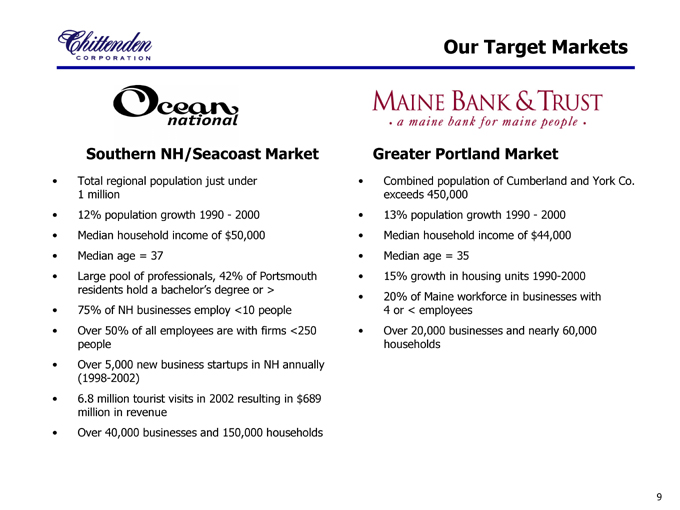
Maine Bank & Trust
A maine bank maine people
Southern NH/Seacoast Market Greater Portland Market
Total regional population just under
1 million
12% population growth 1990—2000
Median household income of $50,000
Median age = 37
Large pool of professionals, 42% of Portsmouth residents hold a bachelor’s degree or >
75% of NH businesses employ <10 people
Over 50% of all employees are with firms <250 people
Over 5,000 new business startups in NH annually (1998-2002)
6.8 million tourist visits in 2002 resulting in $689 million in revenue
Over 40,000 businesses and 150,000 households
Combined population of Cumberland and York Co. exceeds 450,000
13% population growth 1990—2000
Median household income of $44,000
Median age = 35
15% growth in housing units 1990-2000
20% of Maine workforce in businesses with
4 or < employees
Over 20,000 businesses and nearly 60,000 households
Our Target Markets
9
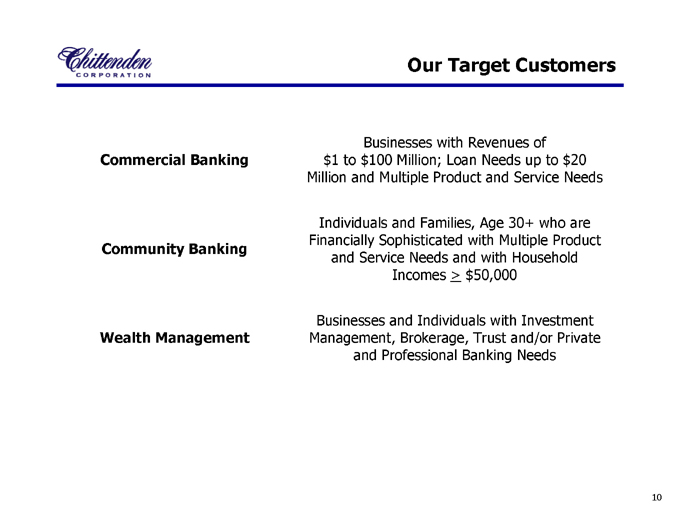
Our Target Customers
Commercial Banking
Businesses with Revenues of
$1 to $100 Million; Loan Needs up to $20
Million and Multiple Product and Service Needs
Community Banking
Individuals and Families, Age 30+ who are
Financially Sophisticated with Multiple Product
and Service
Needs and with Household
Incomes
³
$50,000
Wealth Management
Businesses and Individuals with Investment
Management, Brokerage, Trust and/or Private
and Professional Banking Needs
10
Commercial & Community Banking
11
A Diversified Loan Portfolio
12/31/01
09/30/04
*Annualized
Total loans as of December 31, 2001 and September 30, 2004 were $2.8 billion and $4.0 billion respectively
Consumer 12%
Municipal 3%
Multi Family 2%
Commercial RE 32%
Home Equity 6%
Residential 1-4 22%
Construction 3%
C&I 20%
Growth in C&I and CRE 9%
30% 16% 23% 2% 12% 25% 22% 0% 10% 20% 30% 40% 2001 2002 2003 09/30/04*
C&I CRE
60% 65% 67% 70% 40% 35% 33% 30% 0% 20% 40% 60% 80%
2001 2002 2003
09/30/04
Commercial
Consumer
Consumer 6%
Municipal 3%
Multi Family 5%
Commercial RE 39%
Home Equity 7%
Residential 1-4 17%
Construction 4%
C&I 19%
12
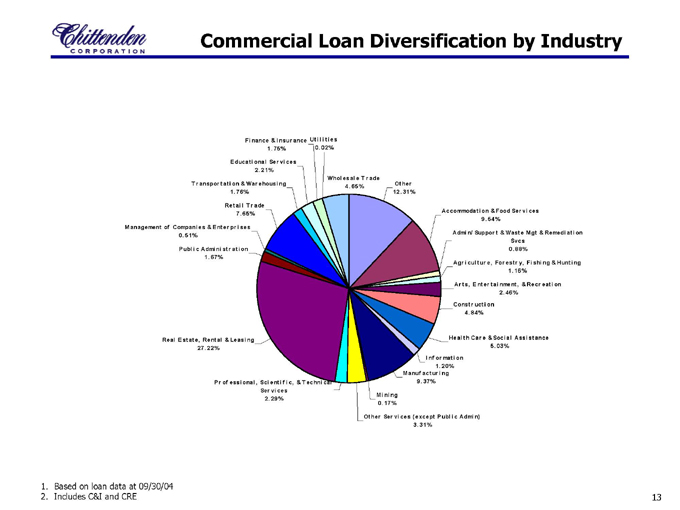
Commercial Loan Diversification by Industry
Finance & Insurance 1.75%
Educational Services 2.21%
Transportation & Warehousing 1.76%
Retail Treade 7.65%
Management of Companies & Enterprises 0.51%
Public Administration 1.67%
Real Estate, Rental & Leasing 27.22%
Professional, Scientific, & Technical Services 2.29%
Other Services (except Public Admin) 3.31%
Mining 0.17%
Manufacturing 9.37%
Information 1.20%
Health Care & Social Assistance 5.03%
Construction 4.84%
Arts, Entertainment, & Recreation 2.46%
Agriculture, Foresty, Fishing & Hunting 1.16%
Admin/Support & Waste Mgt & Remediation Svcs 0.88%
Accommodation & Food Services 9.54%
Other 12.31%
Wholesale Trade 4.65%
Utilities 0.02%
1. Based on loan data at 09/30/04
2. Includes C&I and CRE
13
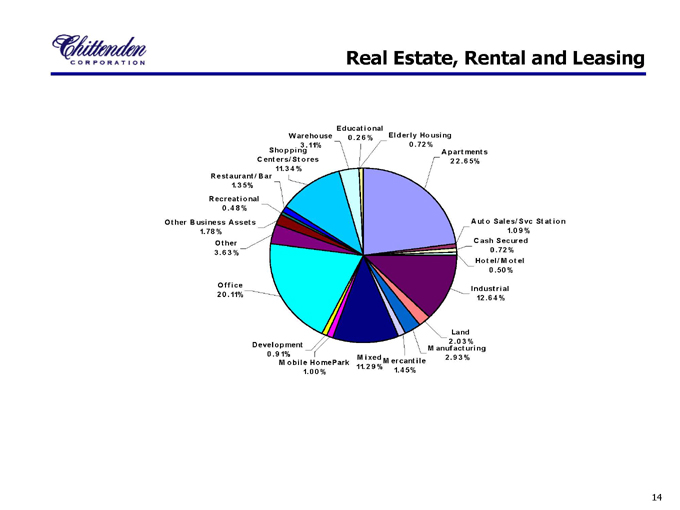
Real Estate, Rental and Leasing
Educational 0.26%
Warehouse 3.11%
Shopping Centers/Stores 11.34%
Restaurant/Bar 1.35%
Recreational 0.48%
Other Business Assets 1.78%
Other 3.63%
Office 20.11%
Development 0.91%
Mobile HomePark 1.00%
Mixed 11.29%
Mercantile 1.45%
Manufacturing 2.93%
Land 2.03%
Industrial 12.64%
Hotel/Motel 0.50%
Cash Secured 0.72%
Auto Sales/Svc Station 1.09%
Apartments 22.65%
Elderly Housing 0.72%
14
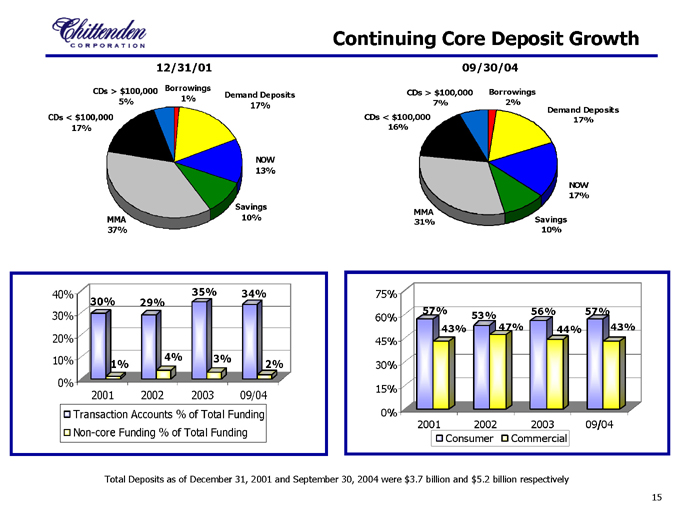
Continuing Core Deposit Growth
12/31/01
09/30/04
Total Deposits as of December 31, 2001 and September 30, 2004 were $3.7 billion and $5.2 billion respectively
CDs < $100,000
17%
CDs > $100,000
5%
MMA
37%
Demand Deposits
17%
NOW
13%
Savings
10%
Borrowings
1%
57%
43%
53%
47%
56%
44%
57%
43%
0%
15%
30%
45%
60%
75%
2001
2002
2003
09/04
Consumer
Commercial
15
40% 30% 20% 10% 0%
30% 1% 29% 4% 35% 3% 34% 2%
2001 2002 2003 09/04
CDS ³ $100,000 16% MMA 31%
Savings 10%
NOW 17%
Demand Deposits 17%
Borrowings 2%
CDS ³ $100,000 7%
Transaction Accounts % of Total Funding
Non-core Funding %of Total Funding
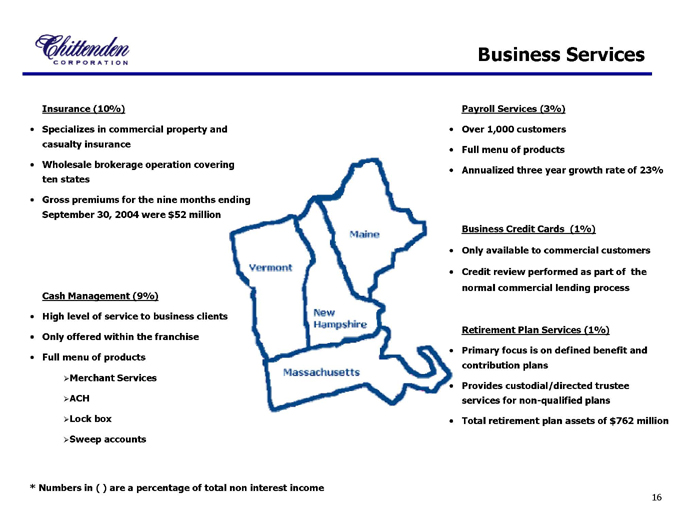
Business Services
Cash Management (9%)
High level of service to business clients
Only offered within the franchise
Full menu of products
Merchant Services
ACH
Lock box
Sweep accounts
Payroll Services (3%)
Over 1,000 customers
Full menu of products
Annualized three year growth rate of 23%
Business Credit Cards (1%)
Only available to commercial customers
Credit review performed as part of the normal commercial lending process
Retirement Plan Services (1%)
Primary focus is on defined benefit and contribution plans
Provides custodial/directed trustee services for non-qualified plans
Total retirement plan assets of $762 million
Insurance (10%)
Specializes in commercial property and casualty insurance
Wholesale brokerage operation covering ten states
Gross premiums for the nine months ending September 30, 2004 were $52 million
* Numbers in ( ) are a percentage of total non interest income
Maine, Vermont, New Hampshire, Massachusetts
16
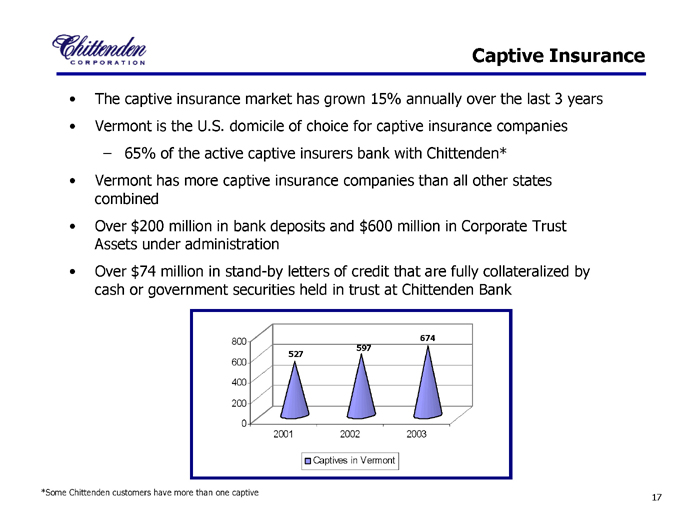
Captive Insurance
The captive insurance market has grown 15% annually over the last 3 years
Vermont is the U.S. domicile of choice for captive insurance companies
– 65% of the active captive insurers bank with Chittenden*
Vermont has more captive insurance companies than all other states combined
Over $200 million in bank deposits and $600 million in Corporate Trust Assets under administration
Over $74 million in stand-by letters of credit that are fully collateralized by cash or government securities held in trust at Chittenden Bank
*Some Chittenden customers have more than one captive
527
597
674
0
200
400
600
800
2001
2002
2003
Captives in Vermont
17
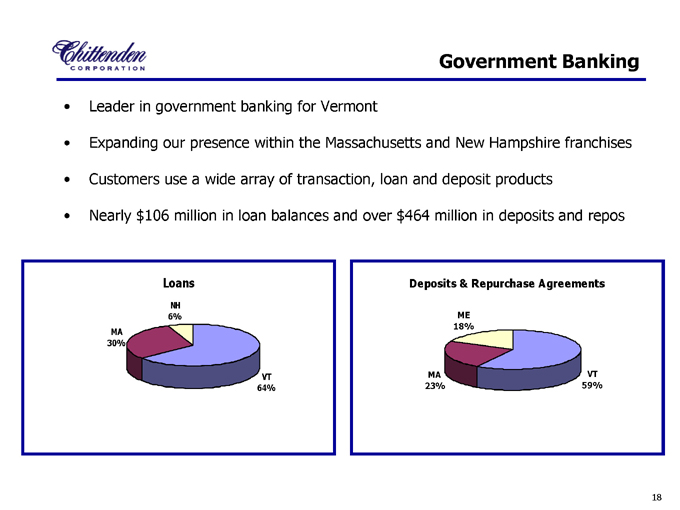
Government Banking
Leader in government banking for Vermont
Expanding our presence within the Massachusetts and New Hampshire franchises
Customers use a wide array of transaction, loan and deposit products
Nearly $106 million in loan balances and over $464 million in deposits and repos
Loans
VT
64%
MA
30%
NH
6%
Deposits & Repurchase Agreements
ME 18%
MA 23%
VT 59%
18
Mortgage Banking
Originations for 2003 were $1.5 billion, and $516 million for the first nine months of 2004, of which $1.4 billion and $365 million, respectively, were sold in the secondary markets
Underlying coupons in the mortgage servicing portfolio continue to decline
Mortgage servicing portfolio of $2.3 billion at September 30, 2004 with a conservative valuation of $12.1 million or 52 basis points*
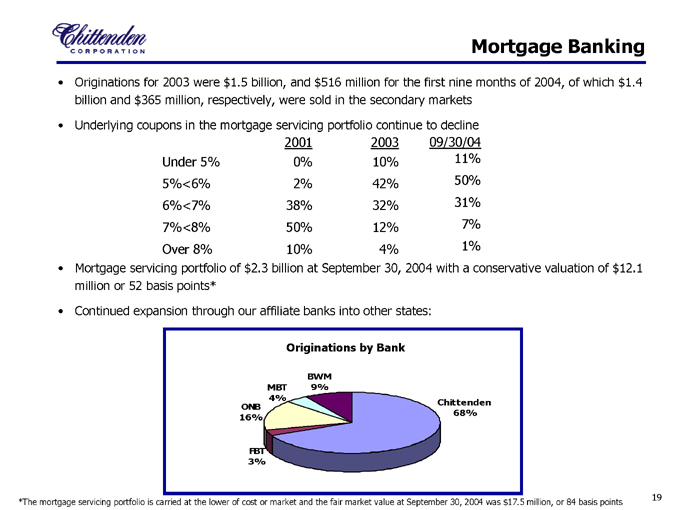
Continued expansion through our affiliate banks into other states:
*The mortgage servicing portfolio is carried at the lower of cost or market and the fair market value at September 30, 2004 was $17.5 million, or 84 basis points
Originations by Bank
2001 2003 09/30/04 Under 5%
0% 10% 11% 5%<6%
2% 42% 50% 6%<7%
38% 32% 31% 7%<8% 50% 12% 7% Over 8% 10%
4%
1%
FBT
3%
ONB
16%
Chittenden
68%
BWM
9%
MBT
4%
19

Wealth Management
20
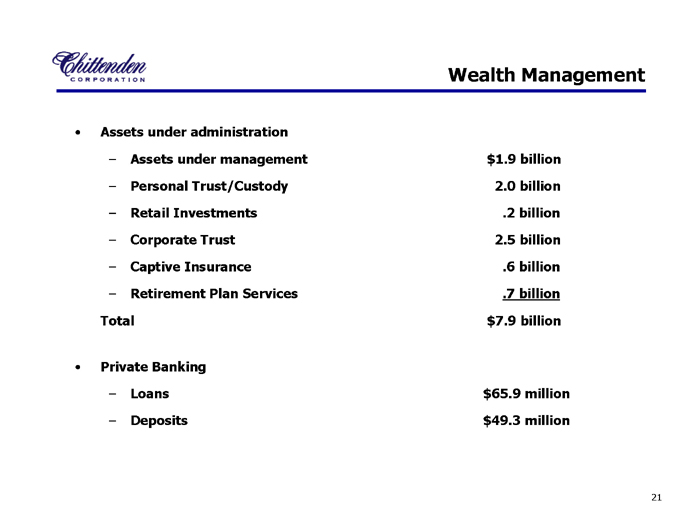
Assets under administration
Assets under management $1.9 billion
Personal Trust/Custody 2.0 billion
Retail Investments .2 billion
Corporate Trust 2.5 billion
Captive Insurance .6 billion
Retirement Plan Services .7 billion
Total $7.9 billion
Private Banking
Loans $65.9 million
Deposits $49.3 million
Wealth Management
21
Asset Management Services
Chittenden Investment Services
Asset Management Private Banking Investments
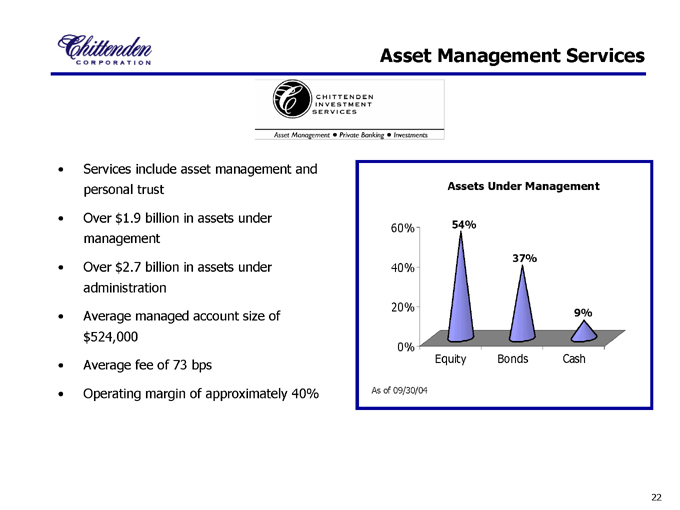
Services include asset management and personal trust
Over $1.9 billion in assets under management
Over $2.7 billion in assets under administration
Average managed account size of $524,000
Average fee of 73 bps
Operating margin of approximately 40%
As of 09/30/04
Assets Under Management
54%
37%
9%
0%
20%
40%
60%
Equity
Bonds
Cash
22
Wealth Management
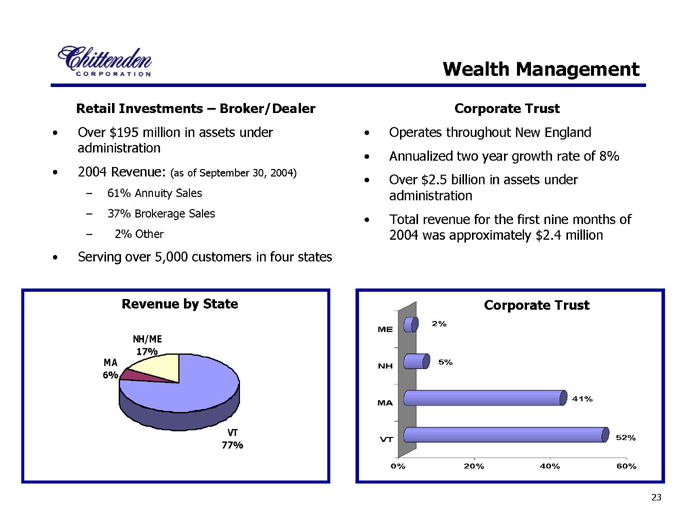
Retail Investments – Broker/Dealer
Over $195 million in assets under administration
2004 Revenue: (as of September 30, 2004)
61% Annuity Sales
37% Brokerage Sales
2% Other
Serving over 5,000 customers in four states
Corporate Trust
Operates throughout New England
Annualized two year growth rate of 8%
Over $2.5 billion in assets under administration
Total revenue for the first nine months of 2004 was approximately $2.4 million
Revenue by State
Corporate Trust
52%
41%
5%
2%
0%
20%
40%
60%
VT
MA
NH
ME
VT
77%
MA
6%
NH/ME
17%
23
Financial Performance
24
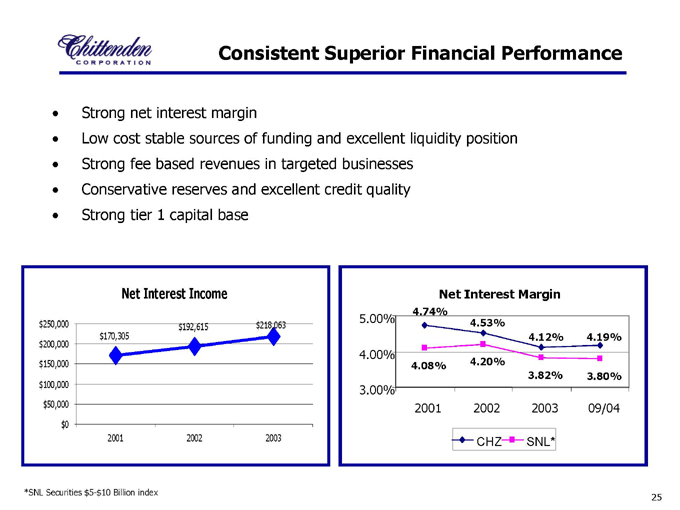
Consistent Superior Financial Performance
Strong net interest margin
Low cost stable sources of funding and excellent liquidity position
Strong fee based revenues in targeted businesses
Conservative reserves and excellent credit quality
Strong tier 1 capital base
*SNL Securities $5-$10 Billion index
Net Interest Income
$170,305
$192,615
$218,063
$0
$50,000
$100,000
$150,000
$200,000
$250,000
2001
2002
2003
Net Interest Margin
4.08%
4.20%
3.82%
3.80%
4.19%
4.12%
4.53%
4.74%
3.00%
4.00%
5.00%
2001
2002
2003
09/04
CHZ
SNL*
25
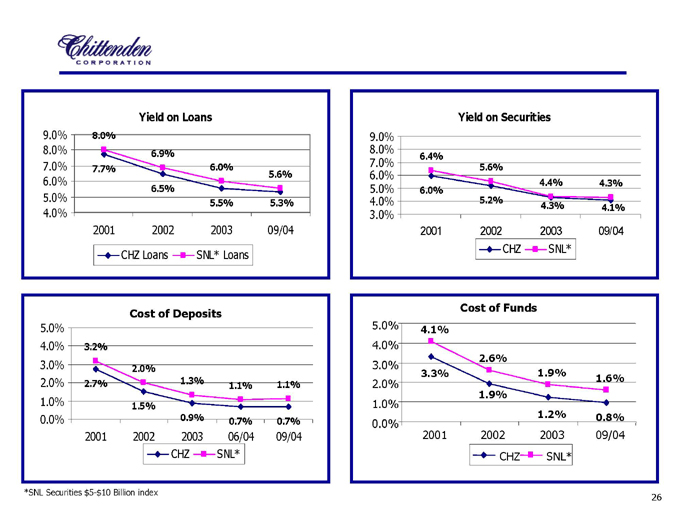
Cost of Funds
Cost of Deposits
*SNL Securities $5-$10 Billion index
0.7%
1.1%
0.7%
0.9%
1.5%
2.7%
1.1%
1.3%
2.0%
3.2%
0.0%
1.0%
2.0%
3.0%
4.0%
5.0%
2001
2002
2003
06/04
09/04
CHZ
SNL*
Yield on Loans
7.7%
6.5%
5.5%
8.0%
6.9%
6.0%
5.6%
5.3%
4.0%
5.0%
6.0%
7.0%
8.0%
9.0%
2001 2002 2003 09/04
CHZ Loans SNL* Loans
26
6.4% 6.0%
5.6% 5.2%
4.4% 4.3%
4.3% 4.1%
CHZ SNL*
3.0%
4.1% 3.3%
2.6% 1.9%
1.9% 1.2%
1.6% 0.8%
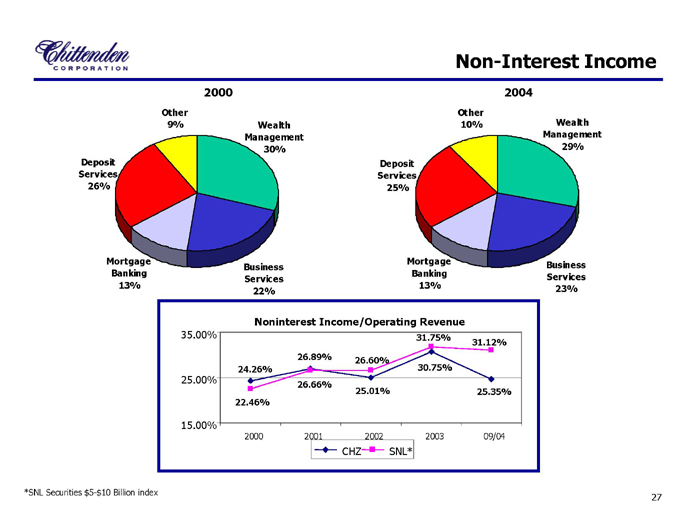
Non-Interest Income
*SNL Securities $5-$10 Billion index
2000
2004
Noninterest Income/Operating Revenue
24.26%
26.89%
26.66%
25.01%
30.75%
25.35%
22.46%
26.60%
31.75%
31.12%
15.00%
25.00%
35.00%
2000
2001
2002
2003
09/04
CHZ
SNL*
Business
Services
22%
Mortgage
Banking
13%
Deposit
Services
26%
Other
9%
Wealth
Management
30%
27
Deposit Services 25%
Mortgage Banking 13%
Business Services 23%
Wealth Management 29%
Other 10%
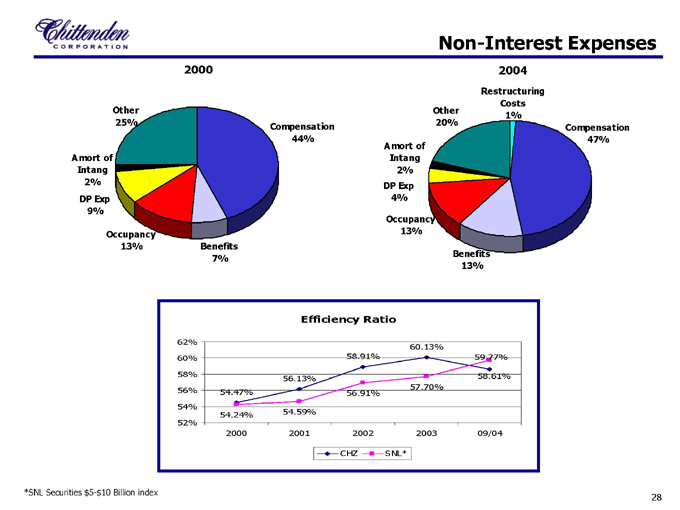
Non-Interest Expenses
2000
Other 25%
Amort of Intang 2%
DP Exp 9%
Occupancy 13%
Benefits 7%
Compensation 44%
2004
Other 20%
Amort of Intang 2%
DP Exp 4%
Occupancy 13%
Benefits 13%
Compensation 47%
Restructuring Costs 1%
Efficiency Ratio
62% 60% 58% 56% 54% 52%
54.24% 54.59% 56.91% 57.70% 59.77%
54.47% 56.13% 58.91% 60.13% 58.61%
2000 2001 2002 2003 09/04
CHZ SNL*
* SNL Securities $5-$10 Billion index
28
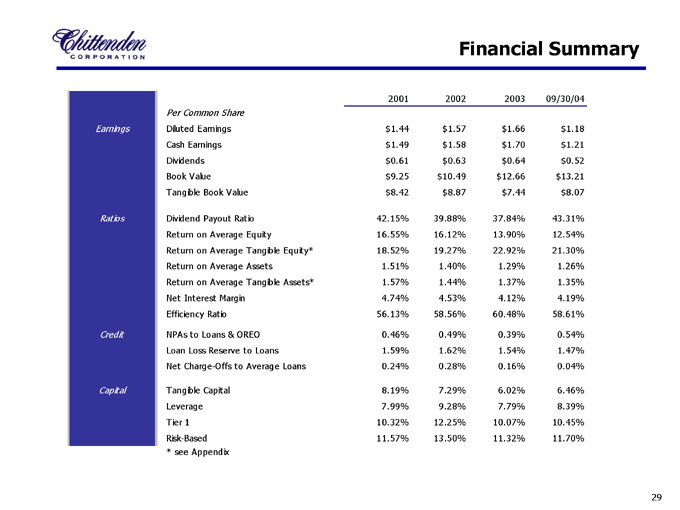
Financial Summary
2001 2002 2003 09/30/04
Per Common Share Earnings Diluted Earnings
$1.44 $1.57 $1.66 $1.18
Cash Earnings
$1.49 $1.58 $1.70 $1.21
Dividends
$0.61 $0.63 $0.64 $0.52
Book Value
$9.25 $10.49 $12.66 $13.21
Tangible Book Value
$8.42 $8.87 $7.44 $8.07
Ratios
Dividend Payout Ratio
42.15% 39.88% 37.84% 43.31%
Return on Average Equity
16.55% 16.12% 13.90% 12.54%
Return on Average Tangible Equity*
18.52% 19.27% 22.92% 21.30%
Return on Average Assets
1.51% 1.40% 1.29% 1.26%
Return on Average Tangible Assets*
1.57% 1.44% 1.37% 1.35%
Net Interest Margin
4.74% 4.53% 4.12% 4.19%
Efficiency Ratio
56.13% 58.56% 60.48% 58.61%
Credit
NPAs to Loans & OREO
0.46% 0.49% 0.39% 0.54%
Loan Loss Reserve to Loans
1.59% 1.62% 1.54% 1.47%
Net Charge-Offs to Average Loans
0.24% 0.28% 0.16% 0.04%
Capital
Tangible Capital
8.19% 7.29% 6.02% 6.46%
Leverage
7.99% 9.28% 7.79% 8.39%
Tier 1
10.32% 12.25% 10.07% 10.45%
Risk-Based
11.57% 13.50% 11.32% 11.70%
* see Appendix
29
Risk Management
30
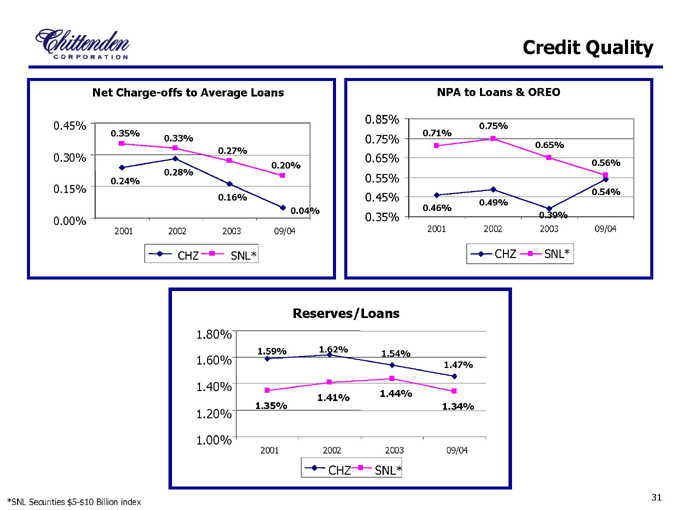
Credit Quality
Net Charge-offs to Average Loans
NPA to Loans & OREO
*SNL Securities $5-$10 Billion index
0.24%
0.28%
0.16%
0.35%
0.33%
0.27%
0.20%
0.04%
0.00%
0.15%
0.30%
0.45%
2001
2002
2003
09/04
CHZ
SNL*
Reserves/Loans
1.54%
1.47%
1.62%
1.59%
1.44%
1.34%
1.41%
1.35%
1.00%
1.20%
1.40%
1.60%
1.80%
2001
2002
2003
09/04
CHZ
SNL*
31
0.85% 0.75% 0.65% 0.55% 0.45% 0.35%
0.71%
0.75%
0.65%
0.56%
0.54%
0.39%
0.49%
0.46%
2001 2002 2003 2004
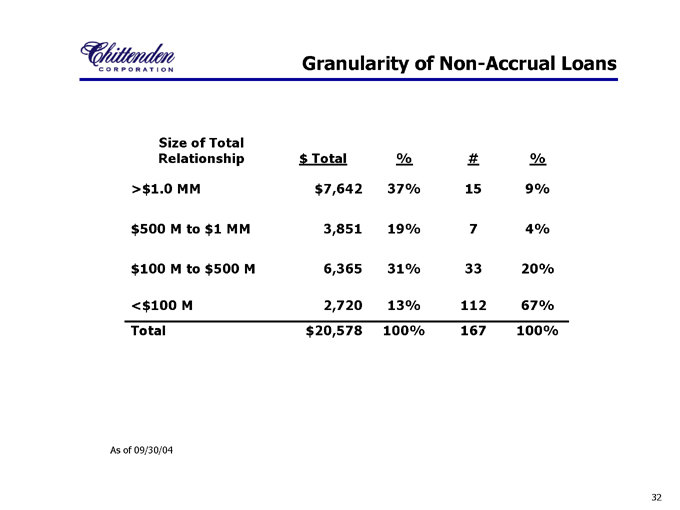
Granularity of Non-Accrual Loans
As of 09/30/04
Size of Total
Relationship $ Total % # %
> $1.0 MM $7,642 37% 15 9%
$500 M to $1 MM 3,851 19% 7 4%
$100 M to $500 M 6,365 31% 33 20%
< $100 M 2,720 13% 112 67%
Total $20,578 100% 167 100%
32
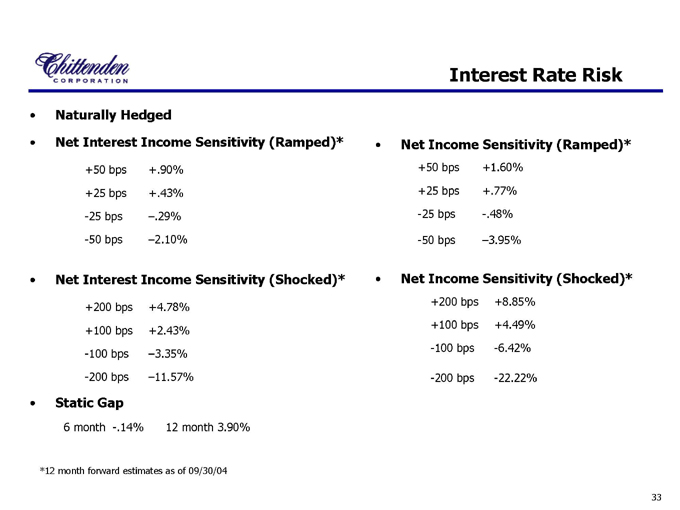
Interest Rate Risk
Net Interest Income Sensitivity (Shocked)*
+200 bps +4.78%
+100 bps +2.43%
-100 bps –3.35%
-200 bps –11.57%
Static Gap
6 month -.14% 12 month 3.90%
Net Income Sensitivity (Shocked)*
+200 bps +8.85%%
+100 bps +4.49%
-100 bps -6.42%
-200 bps -22.22%
Naturally Hedged
Net Interest Income Sensitivity (Ramped)*
+50 bps +.90%
+25 bps +.43%
-25 bps –.29%
-50 bps –2.10%
Net Income Sensitivity (Ramped)*
+50 bps +1.60%
+25 bps +.77%
-25 bps -.48%
-50 bps –3.95%
*12 month forward estimates as of 09/30/04
33

In Summary
34
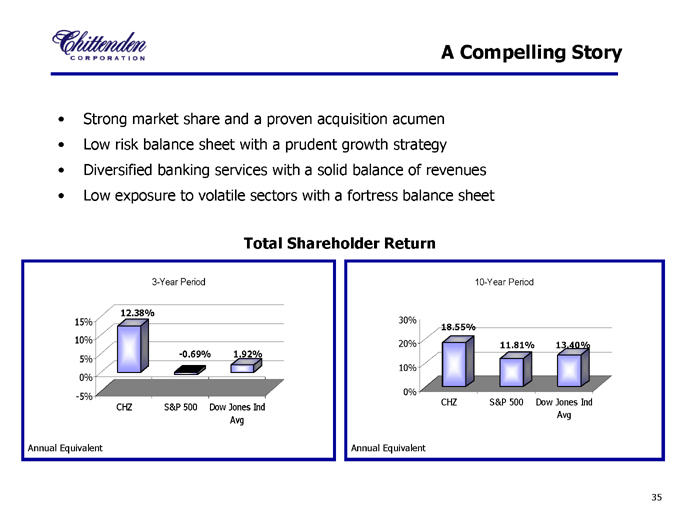
A Compelling Story
Strong market share and a proven acquisition acumen
Low risk balance sheet with a prudent growth strategy
Diversified banking services with a solid balance of revenues
Low exposure to volatile sectors with a fortress balance sheet
Annual Equivalent
Annual Equivalent
Total Shareholder Return
12.38%
-0.69%
1.92%
-5%
0%
5%
10%
15%
CHZ
S&P 500
Dow Jones Ind
Avg
3-Year Period
35
30% 20% 10% 0%
18.55% 11.81% 13.40%
10-Year Period
Visit our website for a wide range of products, latest financial reports and many other interactive services: www.chittendencorp.com
This presentation contains “forward-looking statements” which may describe future plans and strategic initiatives. These forward-looking statements are based on current plans and expectations, which are subject to a number of factors and uncertainties that could cause future results to differ from historical performance or future expectations.
36
Appendix
37
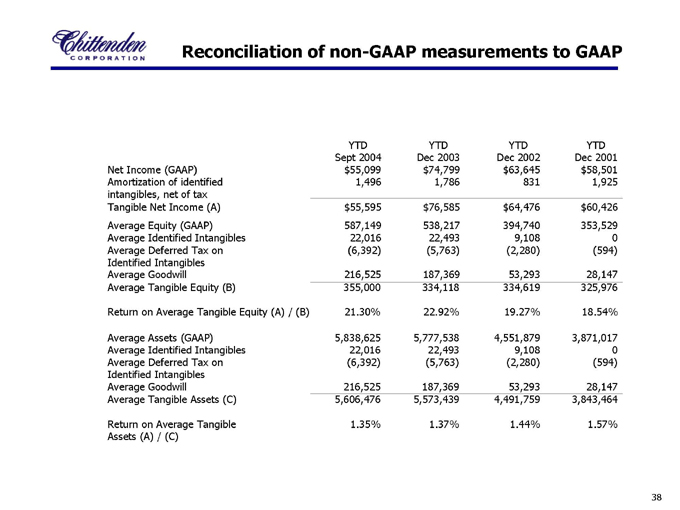
Reconciliation of non-GAAP measurements to GAAP
YTD Sept 2004 YTD
Dec 2003
YTD
Dec 2002
YTD
Dec 2001
Net Income (GAAP)
$55,099 $74,799 $63,645 $58,501
Amortization of identified
intangibles, net of tax
1,496 1,786 831 1,925
Tangible Net Income (A)
$55,595 $76,585 $64,476 $60,426
Average Equity (GAAP)
587,149 538,217 394,740 353,529
Average Identified Intangibles
22,016 22,493 9,108 0
Average Deferred Tax on
Identified Intangibles
(6,392) (5,763) (2,280) (594)
Average Goodwill
216,525 187,369 53,293 28,147
Average Tangible Equity (B)
355,000 334,118 334,619 325,976
Return on Average Tangible
Equity (A) / (B)
21.30% 22.92% 19.27% 18.54%
Average Assets (GAAP)
5,838,625 5,777,538 4,551,879 3,87
1,017
Average Identified Intangibles
22,016 22,493 9,108 0
Average Deferred Tax on
Identified Intangibles
(6,392) (5,763) (2,280) (594)
Average Goodwill
216,525 187,369 53,293 28,147
Average Tangible Assets (C)
5,606,476 5,573,439 4,491,759 3,843,464
Return on Average Tangible
Assets (A) / (C)
1.35% 1.37% 1.44% 1.57%
38