Table of Contents
UNITED STATES
SECURITIES AND EXCHANGE COMMISSION
Washington, D.C. 20549
FORM 10-K
(Mark One)
| x | Annual Report Pursuant to Section 13 or 15(d) of the |
Securities Exchange Act of 1934
For the Fiscal Year Ended December 31, 2005
| or |
| ¨ | Transition Report Pursuant to Section 13 or 15(d) of the |
Securities Exchange Act of 1934
for the transition period from to
Commission File Number 001-13769
CHITTENDEN CORPORATION
(Exact name of Registrant as specified in its charter)
| Vermont | 03-0228404 | |
| (State of Incorporation) | (IRS Employer Identification No.) |
Two Burlington Square Burlington, Vermont | 05401 | |
| (Address of Principal Executive Offices) | (Zip Code) |
Registrant’s telephone number: 802-658-4000
Securities registered pursuant to Section 12(b) of the Act:
Title of each class | Name of each exchange on which registered | |
| $1.00 Par Value Common Stock | New York Stock Exchange | |
| 8.00% Trust Originated Preferred Securities issued by Chittenden Capital Trust I, Guaranteed by Chittenden Corporation | New York Stock Exchange | |
Securities registered pursuant to Section 12(g) of the Act:
NONE
Indicate by check mark whether the registrant is a well-known seasoned issuer, as defined in Rule 405 of the Securities Act. YESx NO¨
Indicate by check mark whether the registrant is not required to file reports pursuant to Section 13 or Section 15(d) of the Exchange Act. YES¨ NOx
Indicate by check mark whether the registrant: (1) has filed all reports required to be filed by Section 13 or 15(d) of the Securities Exchange Act of 1934 during the preceding 12 months (or for such shorter period that the Registrant was required to file such reports), and (2) has been subject to such filing requirements for the past 90 days. YESx NO¨
Indicate by check mark if disclosure of delinquent filers pursuant to Item 405 of Regulation S-K is not contained herein, and will not be contained, to the best of registrant’s knowledge, in definitive proxy or information statements incorporated by reference in Part III of this Form 10-K or any amendment to this Form 10-K.¨
Indicate by check mark whether the registrant is an accelerated filer (as defined in Exchange Act Rule 12b-2). YESx NO¨
Indicate by check mark whether the registrant is a shell company (as defined in Exchange Act Rule 12b-2). YES¨ NOx
The aggregate market value of the Registrant’s common stock held by non-affiliates of the Registrant, computed by reference to the last reported sale price on the NYSE on June 30, 2005 was $1,240,118,312.
At January 31, 2006, there were 46,893,526 shares of the Registrant’s common stock issued and outstanding.
DOCUMENTS INCORPORATED BY REFERENCE
The following documents, in whole or in part, are specifically incorporated by reference in the indicated Part of this Annual Report on Form 10-K:
| 1. | Notice of 2006 Annual Meeting and Proxy Statement: Part III, Items 10, 11, 12, 13 and 14. |
Table of Contents
Item No. | Page No. | |||
| 2 | ||||
| PART I | ||||
1. | 3 | |||
Supervision and Regulation | 6 | |||
| 14 | ||||
| 15 | ||||
1A. | 15 | |||
1B. | 18 | |||
2. | 18 | |||
3. | 18 | |||
4. | 18 | |||
| PART II | ||||
5. | Market for Registrant’s Common Equity and Related Stockholder Matters and Issuer of Purchases of Equity Securities | 19 | ||
6. | 20 | |||
7. | Management’s Discussion and Analysis of Financial Condition and Results of Operations | 22 | ||
7A. | 41 | |||
8. | 44 | |||
9. | Changes in and Disagreements with Accountants on Accounting and Financial Disclosure | 87 | ||
9A. | 87 | |||
Management’s Annual Report on Internal Control Over Financial Reporting | 87 | |||
| 87 | ||||
9B. | 87 | |||
| PART III | ||||
*10. | 88 | |||
*11. | 88 | |||
*12. | Security Ownership of Certain Beneficial Owners and Management and Related Stock-Holder Matters | 88 | ||
*13. | 88 | |||
*14. | 88 | |||
| PART IV | ||||
15. | 89 | |||
| * | Incorporated by reference to the Proxy Statement for the Registrant’s Annual Meeting of Stockholders to be held on April 19, 2006. |
1
Table of Contents
This report contains statements that may be considered forward-looking statements within the meaning of Section 27A of the Securities Act of 1933 and Section 21E of the Securities Exchange Act of 1934. You can identify these statements by forward-looking words such as “may,” “could”, “should,” “would,” “intend,” “will,” “expect,” “anticipate,” “believe,” “estimate,” “continue” or similar words. Chittenden intends these forward-looking statements to be covered by the safe harbor provisions for forward-looking statements contained in the Private Securities Litigation Reform Act of 1995 and is including this statement for purposes of complying with these safe harbor provisions. You should read statements that contain these words carefully because they discuss the Company’s future expectations, contain projections of the Company’s future results of operations or financial condition, or state other “forward-looking” information. There may be events in the future that Chittenden is not able to predict accurately or control and that may cause actual results to differ materially from the expectations described in forward-looking statements.
Readers are cautioned that all forward-looking statements involve risks and uncertainties, and actual results may differ materially from those discussed in this document, including the documents incorporated by reference in this document. Important factors that could cause actual results to differ from those in the forward-looking statements include, among others, those discussed under “Risk Factors” in Part I, Item 1A of this Annual Report on Form 10-K.
You should not place undue reliance on forward-looking statements. You should be aware that the occurrence of the events described in this document, including the documents incorporated by reference, could harm the Company’s business, operating results or financial condition. Chittenden does not undertake any obligation to update any forward-looking statements as a result of future events or developments.
2
Table of Contents
PART I
Chittenden Corporation (the “Company” or “Chittenden”), a Vermont corporation organized in 1971, is a registered bank holding company under the Bank Holding Company Act of 1956, as amended. At December 31, 2005, the Company had total consolidated assets of approximately $6.5 billion. The Company is the holding company parent and owns 100% of the outstanding common stock of Chittenden Trust Company (“CTC”), Flagship Bank and Trust Company (“FBT”), The Bank of Western Massachusetts (“BWM”), Maine Bank & Trust (“MBT”), and Ocean National Bank (“ONB”) (collectively the “Banks”).
The following table summarizes Chittenden’s acquisition history since 1994. The acquisitions of Vermont Financial Services Corp. and Granite State Bancshares are also included as they were significant transactions that were merged into the Company’s existing franchise banks:
Date Announced | Acquisition | Subsidiary Bank(s) | State(s) of | Consideration Paid (in millions) | Accounting | Date Closed | ||||||
11/2/2002 | Granite State Bancshares, Inc. | Granite Bank (4) | NH | $238.9 stock & cash | Purchase (1) | 2/28/03 | ||||||
10/5/2001 | Ocean National Corporation | Ocean National Bank | NH / ME | $53.25 cash | Purchase (1) | 2/28/02 | ||||||
1/26/2001 | Maine Bank Corporation | Maine Bank & Trust | ME | $49.25 cash | Purchase (1) | 4/30/01 | ||||||
12/16/1998 | Vermont Financial Services, Corp. | Vermont National Bank (3), United Bank (3) | VT / NH / MA | $387.2 stock | Pooling (2) | 5/28/99 | ||||||
9/19/1995 | Flagship Bank and Trust | Flagship Bank and Trust | MA | $41.7 cash | Pooling (2) | 2/29/96 | ||||||
8/17/1994 | Bank of Western Massachusetts | Bank of Western Massachusetts | MA | $26.5 cash | Purchase (1) | 3/17/95 | ||||||
| (1) | These acquisitions have been accounted for as purchases and accordingly, the operations of the acquired companies are included in the financial statements from their dates of acquisition. |
| (2) | These acquisitions were accounted for as poolings of interests and accordingly, all financial data was restated to reflect the combined financial condition and results of operations as if these acquisitions were in effect for all periods presented. |
| (3) | United Bank merged into The Bank of Western Massachusetts in the third quarter of 1999. Vermont National Bank merged into Chittenden Trust Company in the first quarter of 2000. |
| (4) | Granite Bank merged into Ocean National Bank in the second quarter of 2004. |
The Company engages in one line of business, that of providing financial services through its banking subsidiaries. Through its subsidiaries, the Company offers a variety of lending services, with loans totaling approximately $4.5 billion at December 31, 2005. The largest loan categories are commercial loans and residential real estate loans. Commercial loans include the following loan categories: commercial & industrial, municipal, multi-family, commercial real estate and construction. Commercial loans amounted to approximately 71% of the total loans outstanding at December 31, 2005.
Residential real estate loans include those collateralized by 1-4 family units and home equity lines of credit, and comprised 23% of total loans outstanding at December 31, 2005. The Company underwrites its residential
3
Table of Contents
mortgages based upon secondary market standards and sells substantially all of its fixed-rate residential mortgage loans on a servicing-retained basis. Private banking residential mortgage loans primarily to our commercial and wealth management customers are typically held in portfolio and generally do not meet secondary market underwriting standards. Consumer loans at December 31, 2005 were 6% of total loans outstanding. Approximately 82% of these loans were indirect installment loans while the remaining loans consisted of direct installment and revolving credit.
The Company’s lending activities are conducted primarily in Vermont, Massachusetts, New Hampshire and Maine, with additional activity related to nearby market areas in New York, Connecticut, and Quebec. In addition to the portfolio diversification described above, the loans are diversified by borrowers and industry groups. In making commercial loans, the Company occasionally solicits the participation of other banks. The Company also occasionally participates in loans originated by other banks. Certain of the Company’s commercial loans are made under programs administered by the U.S. Small Business Administration, U.S. Farmers Home Administration or other local government agencies within the Company’s markets. Loan terms generally include repayment guarantees by the agency involved in varying amounts up to 90% of the original loan amount.
The Banks offer a wide range of banking services, including the acceptance of demand, savings, NOW, money market, cash management and time deposits. As of December 31, 2005, total interest-bearing deposits and noninterest-bearing demand deposits amounted to approximately $4.5 billion and $974 million, respectively. The Banks also provide personal trust services, including services as executor, trustee, administrator, custodian and guardian. Corporate trust services are also provided, including services as trustee for pension and profit sharing plans. Asset management services are also provided for both personal and corporate clients. Wealth management assets under administration totaled $9.1 billion at December 31, 2005, which included $2.0 billion under full discretionary management.
The Company also provides various business services including payroll processing, business credit cards, merchant credit card processing, and cash management. Financial and investment counseling is provided to municipalities and school districts within the Company’s service area, as well as central depository, lending, and other banking services. The Banks offer a variety of other services including safe deposit facilities, certain non-deposit investment products through the brokerage services of Chittenden Securities, Inc., and various insurance related products through Chittenden Insurance Group. Chittenden Securities and Chittenden Insurance Group are subsidiaries of Chittenden Trust Company.
The Company’s principal executive offices are located at Two Burlington Square, Burlington, Vermont 05401; telephone number: 802-658-4000.
CHITTENDEN TRUST COMPANY
CTC was chartered by the Vermont Legislature as a commercial bank in 1904. It is the largest bank headquartered in Vermont, based on total assets of approximately $3.4 billion, total loans of approximately $2.3 billion and total deposits of approximately $2.9 billion. CTC’s principal offices are located in Burlington, Vermont and it has fifty additional locations in Vermont. The trade name “Chittenden Bank” is used at all locations. The Company operates its mortgage banking and servicing operations under the “Mortgage Service Center” trade name.
CTC has a registered broker/dealer subsidiary, Chittenden Securities, Inc. (“CSI”). A full service broker-dealer registered with the Securities and Exchange Commission (SEC), CSI is a member of the National Association of Securities Dealers, Inc. (NASD) and the Securities Investor Protection Corporation (SIPC). CSI operates throughout the locations of the CTC franchise as well as at locations of the other affiliate banks.
CTC, through its subsidiary Chittenden Insurance Group (“CIG”), offers various insurance related products including commercial, personal and life/health policies, as well as specialized coverages and risk management
4
Table of Contents
services. CTC, through its subsidiary Chittenden Commercial Finance based in Montreal, Quebec, offers commercial finance lending services in Canada. CTC also provides the services directly throughout Northern New England and Massachusetts.
THE BANK OF WESTERN MASSACHUSETTS
BWM was chartered by the Commonwealth of Massachusetts as a commercial bank in 1986. At December 31, 2005, BWM had total assets of $694 million, total loans of $631 million and total deposits of $574 million. BWM’s principal offices are located in Springfield, Massachusetts and it has eleven additional locations in western Massachusetts. BWM plans to expand its presence into Connecticut with the opening of a branch in Enfield in the spring of 2006.
FLAGSHIP BANK AND TRUST COMPANY
FBT was chartered by the Commonwealth of Massachusetts as a commercial bank in 1986. At December 31, 2005, FBT had total assets of $539 million, total loans of $324 million and total deposits of $494 million. FBT’s principal offices are located in Worcester, Massachusetts and it has seven additional locations in the greater Worcester, Massachusetts area.
MAINE BANK & TRUST
MBT was chartered by the State of Maine as a commercial bank in 1991. At December 31, 2005, MBT had total assets of $357 million, total loans of $273 million and total deposits of $298 million. MBT’s principal offices are located in Portland, Maine and it has eleven additional locations in southern Maine.
OCEAN NATIONAL BANK
ONB is a federally chartered commercial bank founded in 1854. At December 31, 2005, ONB had total assets of $1.6 billion, total loans of $1.0 billion and total deposits of $1.2 billion. ONB’s principal offices are located in Portsmouth, New Hampshire and it has thirty-seven additional locations in southern Maine and New Hampshire.
ECONOMY
The Northern New England economy continues to expand at a moderate pace. Commercial businesses are generally performing well, experiencing continued steady, moderate growth. Commercial and residential real estate development and sales continue to be healthy in the markets that the Company services, although the pace of residential sales has slowed as rising mortgage rates are pushing some buyers from the market. Housing inventories and market times are moving up to more normal levels. Changes in the economy are difficult to predict, and the discussion above may or may not be indicative of whether the Northern New England economy is improving or will continue to strengthen. See “Risk Factors” in Part I, Item 1A of this Annual Report on Form 10-K for further discussion regarding the impact of changes in the local economies on the Company’s business and financial performance.
COMPETITION
There is vigorous competition in the Company’s marketplace for all aspects of banking and related financial services activities. The Banks compete with other banks, credit unions, and finance companies for banking business in Northern New England. The asset management and trust business which provides financial and estate advice competes with brokerage firms, both traditional and online, insurance companies and investment managers. Money market deposit accounts, cash management accounts and short-term certificates of deposit offered by the Banks compete with investment account offerings of brokerage firms and with products offered by
5
Table of Contents
insurance companies. The expansion of financial institutions both within and outside our primary banking markets has increased the competition in our markets. Areas of competition include interest rates for loans and deposits, efforts to obtain deposits, and range and quality of products and services provided, including new technology driven products and services.
SUPERVISION AND REGULATION
The Company and its banking subsidiaries are subject to extensive regulation under federal and state banking laws and regulations. The following discussion of certain of the material elements of the regulatory framework applicable to banks and bank holding companies is not intended to be complete and is qualified in its entirety by the text of the relevant state and federal statutes and regulations. A change in the applicable laws or regulations may have a material effect on the business of the Company and/or the Banks.
General. As a corporation incorporated under Vermont law, the Company is subject to regulation by the Vermont Secretary of State, and Vermont corporate law governs the rights of our stockholders. As a bank holding company, the Company is subject to inspection, examination, supervision and regulation by the Board of Governors of the Federal Reserve System (the “Federal Reserve Board”) under the Bank Holding Company Act of 1956, as amended (the “BHC Act”). Under the BHC Act, bank holding companies generally may not acquire ownership or control of more than 5% of any class of voting shares or substantially all of the assets of any company, including a bank, without the prior approval of the Federal Reserve Board. In addition, bank holding companies (such as the Company) that are not also financial holding companies are generally prohibited under the BHC Act from engaging in non-banking activities, subject to certain exceptions. As a bank holding company that has not elected to become a financial holding company, the Company’s activities are limited generally to the business of banking and activities determined by the Federal Reserve Board to be so closely related to banking as to be a proper incident thereto. The Federal Reserve Board has the authority to issue orders to bank holding companies to cease and desist from unsafe or unsound banking practices and violations of conditions imposed by, or violations of agreements with, or commitments to, the Federal Reserve Board. The Federal Reserve Board is also empowered to assess civil money penalties against companies or individuals who violate the BHC Act or orders or regulations there under, to order termination of non-banking activities of non-banking subsidiaries of bank holding companies, and to order termination of ownership and control of a non-banking subsidiary by a bank holding company.
Riegle-Neal Interstate Banking and Branching Efficiency Act of 1994 (the “Interstate Act”). The Interstate Act permits adequately capitalized and adequately managed bank holding companies, as determined by the Federal Reserve Board, to acquire banks in any state subject to certain concentration limits and other conditions. The Interstate Act also generally authorizes the interstate merger of banks. In addition, among other things, the Interstate Act permits banks to establish new branches on an interstate basis provided that the law of the host state specifically authorizes such action. However, as a bank holding company, the Company is required to obtain prior Federal Reserve Board approval before acquiring more than 5% of a class of voting securities, or substantially all of the assets, of a bank holding company, bank or savings association.
Control Acquisitions.The Change in Bank Control Act prohibits a person or group of persons from acquiring “control” of a bank holding company, such as the Company, unless the Federal Reserve Board has been notified and has not objected to the transaction. Under a rebuttable presumption established by the Federal Reserve Board, the acquisition of 10% or more of a class of voting securities of a bank holding company with a class of securities registered under Section 12 of the Securities Exchange Act of 1934, as amended, would, under the circumstances set forth in the presumption, constitute acquisition of control of the bank holding company. In addition, a company is required to obtain the approval of the Federal Reserve Board under the BHC Act before acquiring 25% (5% in the case of an acquirer that is a bank holding company) or more of any class of outstanding voting securities of a bank holding company, or otherwise obtaining control or a “controlling influence” over that bank holding company.
6
Table of Contents
Dividends. The Federal Reserve Board has authority to prohibit bank holding companies from paying dividends if such payment is deemed to be an unsafe or unsound practice. The Federal Reserve Board has indicated generally that it may be an unsafe and unsound practice for bank holding companies to pay dividends unless the bank holding company’s net income over the preceding year is sufficient to fund the dividends and the expected rate of earnings retention is consistent with the organization’s capital needs, asset quality, and overall financial condition. The Company’s ability to pay dividends is dependent upon the flow of dividend income to it from the Banks, which may be affected or limited by regulatory restrictions imposed by federal or state bank regulatory agencies. See “Regulation of The Banks—Dividends.”
Certain Transactions by Bank Holding Companies with their Affiliates. There are various statutory restrictions on the extent to which bank holding companies and their non-bank subsidiaries may borrow, obtain credit from or otherwise engage in “covered transactions” with their insured depository institution subsidiaries. An insured depository institution (and its subsidiaries) may not lend money to, or engage in covered transactions with, its non-depository institution affiliates if the aggregate amount of covered transactions outstanding involving the bank, plus the proposed transaction exceeds the following limits: (a) in the case of any one such affiliate, the aggregate amount of covered transactions of the insured depository institution and its subsidiaries cannot exceed 10% of the capital stock and surplus of the insured depository institution; and (b) in the case of all affiliates, the aggregate amount of covered transactions of the insured depository institution and its subsidiaries cannot exceed 20% of the capital stock and surplus of the insured depository institution. For this purpose, “covered transactions” are defined by statute to include a loan or extension of credit to an affiliate, a purchase of or investment in securities issued by an affiliate, a purchase of assets from an affiliate unless exempted by the Federal Reserve Board, the acceptance of securities issued by an affiliate as collateral for a loan or extension of credit to any person or company, or the issuance of a guarantee, acceptance or letter of credit on behalf of an affiliate. Covered transactions are also subject to certain collateral security requirements. Covered transactions as well as other types of transactions between a bank and a bank holding company must be on market terms and not otherwise unduly favorable to the holding company or an affiliate thereof. Moreover, Section 106 of the BHC Act provides that, to further competition, a bank holding company and its subsidiaries are prohibited from engaging in certain tying arrangements in connection with any extension of credit, lease or sale of property of any kind, or furnishing of any service.
Holding Company Support of Subsidiary Banks. Under Federal Reserve Board policy, the Company is expected to act as a source of financial and managerial strength to its subsidiary banks and to commit resources to support such subsidiaries. This support of its subsidiary banks may be required at times when, absent such Federal Reserve Board policy, the Company might not otherwise be inclined to provide it. In addition, any capital loans by a bank holding company to any of its subsidiary banks are subordinate in right of payment to deposits and certain other indebtedness of such subsidiary banks. In the event of a bank holding company’s bankruptcy, any commitment by the bank holding company to a federal bank regulatory agency to maintain capital of a subsidiary bank will be assumed by the bankruptcy trustee and entitled to a priority of payment.
Liability of Commonly Controlled Depository Institutions. Under the Federal Deposit Insurance Act, as amended (“FDI Act”), FDIC-insured depository institutions, such as any of the Banks, can be held liable for any loss incurred by, or reasonably expected to be incurred by, the FDIC in connection with (i) the “default” of a commonly controlled FDIC-insured depository institution, or (ii) any assistance provided by the FDIC to any commonly controlled depository institution in “danger of default.” For these purposes, the term “default” is defined generally as the appointment of a conservator or receiver and “in danger of default” is defined generally as the existence of certain conditions indicating that a default is likely to occur without federal regulatory assistance.
General. As FDIC-insured state-chartered banks, the Banks (with the exception of ONB) are subject to the supervision of and regulation by the Commissioner of Banking, Insurance, Securities and Health Care Administration of the State of Vermont, in the case of CTC (the “Commissioner”); the Maine Superintendent of
7
Table of Contents
the Bureau of Banking in the case of MBT (the “Superintendent”); the Commissioner of Banks of the Commonwealth of Massachusetts in the case of BWM and FBT (together with the Commissioner and the Superintendent, the “Commissioners”). ONB is a nationally chartered bank principally regulated by the Office of Comptroller of the Currency (the “OCC”). This supervision and regulation is for the protection of depositors, the Bank Insurance Fund (“BIF”), and consumers, and is not for the protection of the Company’s stockholders. The prior approval of the FDIC or the OCC and the relevant Commissioner is required, among other things, for the Banks to establish or relocate an additional branch office, assume deposits, or engage in any merger, consolidation, purchase or sale of all or substantially all of the assets of any of the Banks.
Examinations and Supervision. The FDIC, the OCC, and the Commissioners regularly examine the condition and the operations of the Banks, including (but not limited to) their capital adequacy, reserves, loans, investments, earnings, liquidity, compliance with laws and regulations, record of performance under the Community Reinvestment Act of 1997 and management practices. In addition, the Banks are required to furnish quarterly and annual reports of income and condition to the FDIC and the OCC as well as periodic reports to the Commissioners. The enforcement authority of the FDIC and the OCC includes the power to impose civil money penalties, terminate insurance coverage, remove officers and directors and issue cease-and-desist orders to prevent unsafe or unsound practices or violations of laws or regulations and to take a broad range of actions against the Banks and their institution-affiliated parties. In addition, the FDIC has authority to impose additional restrictions and requirements with respect to banks that do not satisfy applicable regulatory capital requirements. See “Capital Requirements and FDICIA—Prompt Corrective Action” below.
Dividends. The principal source of the Company’s revenue is dividends from the Banks. Payments of dividends by the Banks are subject to certain Vermont, Maine, and Massachusetts banking law restrictions. Payment of dividends by CTC is subject to Vermont banking law restrictions, which require that CTC may not, without the Commissioner’s approval, authorize dividends that reduce capital below certain standards established by the Commissioner. Payment of dividends by BWM and FBT is subject to Massachusetts banking law restrictions, which require that each bank’s capital not be impaired and limits the amount of dividends that may be paid during a calendar year to net profit for that year plus retained net profits from the prior two years. Payments of dividends by MBT are subject to Maine banking law restrictions, which require that they may not, without the Superintendent’s approval, authorize dividends that reduce capital below certain standards established by the Superintendent. Payment of dividends by ONB is subject to certain limitations imposed by the OCC, which limit dividends that a national bank may declare during any calendar year to retained net income for that year plus retained net income for the preceding two years.
The FDIC and the OCC have the authority to prevent the Banks from paying dividends if such payment would constitute an unsafe or unsound banking practice or reduce the respective Bank’s capital below safe and sound levels. In addition, federal legislation prohibits FDIC-insured depository institutions from paying dividends or making capital distributions that would cause the institution to fail to meet minimum capital requirements. See “Capital Requirements and FDICIA—Prompt Corrective Action” below.
Affiliate Transactions. As noted above, banks are subject to restrictions imposed by federal law on extensions of credit to, purchases of assets from, and certain other transactions with affiliates and on investments in stock or other securities issued by affiliates. Such restrictions prevent the Banks from making loans to affiliates unless the loans are secured by collateral in specified amounts and have terms at least as favorable to the Banks as the terms of comparable transactions between the Banks and non-affiliates. Further, applicable federal and state laws significantly restrict extensions of credit by the Banks to directors, executive officers and principal stockholders and related interests of such persons.
Deposit Insurance. The Banks’ deposits are insured by the BIF of the FDIC to the legal maximum of $100,000 for each insured depositor. The FDI Act provides that the FDIC shall set deposit insurance assessment rates on a semi-annual basis at a level sufficient to increase the ratio of BIF reserves to BIF-insured deposits to at least 1.25%, and to maintain that ratio. Although current assessment levels are low, BIF insurance assessments
8
Table of Contents
may be increased in the future if necessary to maintain BIF reserves at the required level. See “Capital Requirements and FDICIA—Risk-Based Deposit Insurance and FICO Assessments” below.
Federal Reserve Board Policies and Reserve Requirements. The monetary policies and regulations of the Federal Reserve Board have had a significant effect on the operating results of banks in the past and are expected to continue to do so in the future. Federal Reserve Board policies affect the levels of bank earnings on loans and investments and the levels of interest paid on bank deposits through the Federal Reserve System’s open-market operations in United States government securities, regulation of the discount rate on bank borrowings from Federal Reserve Banks and regulation of non-earning reserve requirements. Regulation D promulgated by the Federal Reserve Board requires all depository institutions, including the Banks, to maintain reserves against their transaction accounts (generally, demand deposits, NOW accounts and certain other types of accounts that permit payments or transfer to third parties) or non-personal time deposits (generally, money market deposit accounts or other savings deposits held by corporations or other depositors that are not natural persons, and certain other types of time deposits), subject to certain exemptions. Because required reserves must be maintained in the form of either vault cash, a non-interest bearing account at the Federal Reserve Bank or a pass-through account as defined by the Federal Reserve Board, the effect of this reserve requirement is to reduce the amount of the Banks’ interest-bearing assets. As of December 31, 2005 the Banks’ aggregate reserve requirement was approximately $29.5 million.
Consumer Protection Regulation. Other aspects of the lending and deposit businesses of the Banks that are subject to regulation by the FDIC, the OCC and the Commissioners include disclosure requirements with respect to interest, payment and other terms of consumer and residential mortgage loans and disclosure of interest and fees and other terms of, and the availability of, funds for withdrawal from consumer deposit accounts. In addition, the Banks are subject to federal and state laws and regulations prohibiting certain forms of discrimination in credit transactions, and imposing certain recordkeeping, reporting and disclosure requirements with respect to residential mortgage loan applications.
USA PATRIOT Act. The USA Patriot Act of 2001 (the “USA PATRIOT Act”), designed to deny terrorists and others the ability to obtain anonymous access to the U.S. financial system, has significant implications for depository institutions, broker-dealers and other businesses involved in the transfer of money. The USA PATRIOT Act, together with the implementing regulations of various federal regulatory agencies, have caused financial institutions, including the Banks, to adopt and implement additional or amend existing policies and procedures with respect to, among other things, anti-money laundering compliance, suspicious activity and currency transaction reporting, customer identity verification and customer risk analysis. The statute and its underlying regulations also permit information sharing for counter-terrorist purposes between federal law enforcement agencies and financial institutions, as well as among financial institutions, subject to certain conditions, and require the Federal Reserve Board (and other federal banking agencies) to evaluate the effectiveness of an applicant in combating money laundering activities when considering applications filed under Section 3 of the BHC Act or under the Bank Merger Act.
CRA Regulations. The Community Reinvestment Act of 1997 (“CRA”) requires lenders to identify the communities served by the institution’s offices and to identify the types of credit the institution is prepared to extend within such communities. The FDIC examines each of the Banks, except for ONB, which is examined by the OCC, and the agencies rate such institutions’ compliance with CRA as “Outstanding”, “Satisfactory”, “Needs to Improve” or “Substantial Noncompliance”. As of their last CRA examinations, CTC, MBT, BWM and FBT all received a rating of “Outstanding,” and ONB received a rating of “Satisfactory.”
Failure of an institution to receive at least a “Satisfactory” rating could inhibit such institution or its holding company from undertaking certain activities, including engaging in activities newly permitted as a financial holding company under the GLBA and acquisitions of other financial institutions. The Federal Reserve Board must take into account the record of performance of banks in meeting the credit needs of the entire community served, including low-and moderate-income neighborhoods. Current CRA regulations for large banks (CTC and
9
Table of Contents
ONB) primarily rely on objective criteria of the performance of institutions under three key assessment tests: a lending test, a service test and an investment test. For smaller banks (BWM, FBT and MBT) current CRA regulations primarily evaluate the performance of institutions under two key assessment tests: a lending test and a community development test. The Banks are committed to meeting the existing or anticipated credit needs of their entire communities, including low and moderate-income neighborhoods, consistent with safe and sound banking operations.
Capital Requirements and FDICIA
General. The FDIC has established guidelines with respect to the maintenance of appropriate levels of capital by FDIC-insured banks, and the OCC has established nearly identical guidelines applicable to national banks. The Federal Reserve Board has established substantially identical guidelines with respect to the maintenance of appropriate levels of capital, on a consolidated basis, by bank holding companies. If a banking organization’s capital levels fall below the minimum requirements established by such guidelines, a bank or bank holding company will be expected to develop and implement a plan acceptable to the FDIC, the OCC or the Federal Reserve Board, respectively, to achieve adequate levels of capital within a reasonable period, and may be denied approval to acquire or establish additional banks or non-bank businesses, merge with other institutions or open branch facilities until such capital levels are achieved. Federal legislation requires federal bank regulators to take “prompt corrective action” with respect to insured depository institutions that fail to satisfy minimum capital requirements and imposes significant restrictions on such institutions. See “Prompt Corrective Action” below.
Leverage Capital Ratio. The regulations of the FDIC and the OCC require FDIC-insured state banks and national banks, respectively, to maintain a minimum “Leverage Capital Ratio” or “Tier 1 Capital” (as defined in the Risk-Based Capital Guidelines discussed in the following paragraphs) to Total Assets of 3.0%. The regulations of the FDIC and the OCC state that only banks with the highest federal bank regulatory examination rating will be permitted to operate at or near such minimum level of capital. All other banks are expected to maintain an additional margin of capital, equal to at least 1% to 2% of Total Assets, above the minimum ratio. Any bank experiencing or anticipating significant growth is expected to maintain capital well above the minimum levels. The Federal Reserve Board’s guidelines impose substantially similar leverage capital requirements on bank holding companies on a consolidated basis.
Risk-Based Capital Requirements. The regulations of the FDIC and the OCC also require FDIC-insured state banks and national banks, respectively, to maintain minimum capital levels measured as a percentage of such banks’ risk-adjusted assets. A bank’s qualifying total capital (“Total Capital”) for this purpose may include two components—“Core” (Tier 1) Capital and “Supplementary” (Tier 2) Capital. Core Capital consists primarily of common stockholders’ equity, which generally includes common stock, related surplus and retained earnings, certain non-cumulative perpetual preferred stock and related surplus, and minority interests in the equity accounts of consolidated subsidiaries, and (subject to certain limitations) mortgage servicing rights and purchased credit card relationships, less all other intangible assets (primarily goodwill). Supplementary Capital elements include, subject to certain limitations, a portion of the allowance for losses on loans and leases, perpetual preferred stock that does not qualify for inclusion in Tier 1 capital, long-term preferred stock with an original maturity of at least 20 years and related surplus, certain forms of perpetual debt and mandatory convertible securities, and certain forms of subordinated debt and intermediate-term preferred stock.
The risk-based capital rules assign a bank’s balance sheet assets and the credit equivalent amounts of the bank’s off-balance sheet obligations to one of four risk categories, weighted at 0%, 20%, 50% or 100%, respectively. Applying these risk-weights to each category of the bank’s balance sheet assets and to the credit equivalent amounts of the bank’s off-balance sheet obligations and summing the totals results in the amount of the bank’s total Risk-Adjusted Assets for purposes of the risk-based capital requirements. Risk-Adjusted Assets can either exceed or be less than reported balance sheet assets, depending on the risk profile of the banking organization. Risk-Adjusted Assets for institutions such as the Banks will generally be less than reported balance sheet assets because their retail banking activities include proportionally more residential mortgage loans and certain investment securities with a lower risk weighting and relatively smaller off-balance sheet obligations.
10
Table of Contents
The risk-based capital regulations require all banks to maintain a minimum ratio of Total Capital to Risk-Adjusted Assets of 8.0%, of which at least one-half (4.0%) must be Core (Tier 1) Capital. For the purpose of calculating these ratios: (i) a banking organization’s Supplementary Capital eligible for inclusion in Total Capital is limited to no more than 100% of Core Capital; and (ii) the aggregate amount of certain types of Supplementary Capital eligible for inclusion in Total Capital is further limited. For example, the regulations limit the portion of the allowance for loan losses eligible for inclusion in Total Capital to 1.25% of Risk-Adjusted Assets. The Federal Reserve Board has established substantially identical risk-based capital requirements, which are applied to bank holding companies on a consolidated basis. The risk-based capital regulations explicitly provide for the consideration of interest rate risk in the overall evaluation of a bank’s capital adequacy to ensure that banks effectively measure and monitor their interest rate risk, and that they maintain capital adequate for that risk. A bank deemed by its federal banking regulator to have excessive interest rate risk exposure may be required by the FDIC to maintain additional capital (that is, capital in excess of the minimum ratios discussed above). The Banks believe, based on their level of interest rate risk exposure, that this provision will not have a material adverse effect on them.
On March 1, 2005, the Federal Reserve Board adopted a final rule that would retain trust preferred securities in Tier 1 capital of bank holding companies, but with stricter quantitative limits and clearer standards. The final rule provides a five-year transition period, ending March 31, 2009, at which point the aggregate amount of trust preferred securities would be limited to 25 percent of Tier 1 capital elements, net of goodwill. The Company has evaluated the potential impact of such a change on its Tier 1 capital ratio and has concluded that it would remain well capitalized under the new rules. The regulatory capital treatment of the trust preferred securities in the Company’s total capital ratio is expected to be unchanged.
In October 2005, the federal banking agencies issued an advance notice of proposed rulemaking (“ANPR”) concerning potential changes in the risk-based capital rules (“Basel IA) that are designed to apply to, and potentially reduce the risk-based capital requirements of bank holding companies, such as the Company, that are not among the 20 or so largest U.S. bank holding companies. It remains uncertain whether the Basel IA rules will be adopted and, even if adopted, how closely the final Basel IA rules will resemble the rules described in the ANPR and what the effective date of such rules will be. Accordingly, the Company is not yet in a position to determine the effect of such rules on its risk-based capital requirements.
On December 31, 2005, the Company’s consolidated Total and Tier 1 Risk-Based Capital Ratios were 12.23% and 11.05%, respectively, and its Leverage Capital Ratio was 9.09%. Based on the above figures and accompanying discussion, the Company exceeded all regulatory capital requirements and was considered well capitalized.
Prompt Corrective Action. The Federal Deposit Insurance Corporation Improvement Act of 1991 (“FDICIA”) requires, among other things, that the federal banking regulators take “prompt corrective action” with respect to, and imposes significant restrictions on, any bank that fails to satisfy its applicable minimum capital requirements. FDICIA establishes five capital categories consisting of “well capitalized,” “adequately capitalized,” “undercapitalized,” “significantly undercapitalized” and “critically undercapitalized.” Under applicable regulations, a bank that has a Total Risk-Based Capital Ratio of 10.0% or greater, a Tier 1 Risk-Based Capital Ratio of 6.0% or greater and a Leverage Capital Ratio of 5.0% or greater, and is not subject to any written agreement, order, capital directive or prompt corrective action directive to meet and maintain a specific capital level for any capital measure is deemed to be “well capitalized.” A bank that has a Total Risk-Based Capital Ratio of 8.0% or greater, a Tier 1 Risk-Based Capital Ratio of 4.0% or greater and a Leverage Capital Ratio of 4.0% (or 3.0% for banks with the highest regulatory examination rating that are not experiencing or anticipating significant growth or expansion) or greater and does not meet the definition of a well capitalized bank is considered to be “adequately capitalized.” A bank that has a Total Risk-Based Capital Ratio of less than 8.0% or has a Tier 1 Risk-Based Capital Ratio that is less than 4.0%, except as noted above, a Leverage Capital Ratio of less than 4.0% is considered “undercapitalized.” A bank that has a Total Risk-Based Capital Ratio of less than 6.0%, or a Tier 1 Risk-Based Capital Ratio that is less than 3.0% or a Leverage Capital Ratio that is less
11
Table of Contents
than 3.0% is considered to be “significantly undercapitalized,” and a bank that has a ratio of tangible equity to total assets equal to or less than 2.0% is deemed to be “critically undercapitalized.” A bank may be deemed to be in a capital category lower than is indicated by its actual capital position if it is determined to be in an unsafe or unsound condition or receives an unsatisfactory examination rating. FDICIA generally prohibits a bank from making capital distributions (including payment of dividends) or paying management fees to controlling stockholders or their affiliates if, after such payment, the bank would be undercapitalized.
Under FDICIA and the applicable implementing regulations, an undercapitalized bank will be (i) subject to increased monitoring by its primary federal banking regulator; (ii) required to submit to its primary federal banking regulator an acceptable capital restoration plan (guaranteed, subject to certain limits, by the bank’s holding company) within 45 days of being classified as undercapitalized; (iii) subject to strict asset growth limitations; and (iv) required to obtain prior regulatory approval for certain acquisitions, transactions not in the ordinary course of business, and entries into new lines of business. In addition to the foregoing, the primary federal banking regulator may issue a “prompt corrective action directive” to any undercapitalized institution. Such a directive may (i) require sale or re-capitalization of the bank, (ii) impose additional restrictions on transactions between the bank and its affiliates, (iii) limit interest rates paid by the bank on deposits, (iv) limit asset growth and other activities, (v) require divestiture of subsidiaries, (vi) require replacement of directors and officers, and (vii) restrict capital distributions by the bank’s parent holding company. In addition to the foregoing, a significantly undercapitalized institution may not award bonuses or increases in compensation to its senior executive officers until it has submitted an acceptable capital restoration plan and received approval from its primary federal banking regulator.
Not later than 90 days after an institution becomes critically undercapitalized, the primary federal banking regulator for the institution must appoint a receiver or, with the concurrence of the FDIC, a conservator, unless the agency, with the concurrence of the FDIC, determines that the purpose of the prompt corrective action provisions would be better served by another course of action. FDICIA requires that any alternative determination be “documented” and reassessed on a periodic basis. Notwithstanding the foregoing, a receiver must be appointed after 270 days unless the appropriate federal banking agency and the FDIC certify that the institution is viable and not expected to fail.
Deposit Insurance Assessments. The FDIC uses a risk-based system which assigns each of the Banks to one of three capital categories (1) well capitalized, (2) adequately capitalized, or (3) undercapitalized, and to one of three subgroups within a capital category on the basis of supervisory evaluations by the applicable Bank’s primary federal regulator and, if applicable, other information relevant to the Banks’ financial condition and the risk posed to the BIF. An institution’s assessment rate depends on the capital category and supervisory category to which it is assigned. The FDIC is authorized to raise the assessment rates in certain circumstances. If the FDIC determines to increase the assessment rates for all institutions, institutions in all risk categories could be affected. The FDIC has exercised this authority several times in the past and may raise BIF insurance premiums again in the future. If the FDIC takes such action, it could have an adverse effect on the earnings of the Banks, the extent of which is not currently quantifiable. The risk classification to which an institution is assigned by the FDIC is confidential and may not be disclosed.
Assessment rates in 2005 ranged from 0% of domestic deposits for an institution in the lowest risk category (i.e., well capitalized and healthy from a supervisory standpoint) to 0.27% of domestic deposits for institutions in the highest risk category (i.e., undercapitalized and unhealthy from a supervisory standpoint). The Deposit Insurance Funds Act of 1996 eliminates the minimum assessment and authorizes the Financing Corporation (FICO) to levy assessments on BIF-assessable deposits. The actual assessment rates for FICO are adjusted on a quarterly basis to reflect changes in the assessment bases of the insurance funds. The Banks paid assessments totaling $748,287 or 0.0134 cents per $100 of deposits in 2005.
Brokered Deposits and Pass-Through Deposit Insurance Limitations. Under FDICIA, a bank cannot accept brokered deposits unless it either (i) is “Well Capitalized” or (ii) is “Adequately Capitalized” and has received a
12
Table of Contents
written waiver from its primary federal banking regulator. For this purpose, “Well Capitalized” and “Adequately Capitalized” have the same definitions as in the Prompt Corrective Action regulations. See “—Prompt Corrective Action” above. Banks that are not in the “Well Capitalized” category are subject to certain limits on the rates of interest they may offer on any deposits (whether or not obtained through a third-party deposit broker). Pass-through insurance coverage is not available in banks that do not satisfy the requirements for acceptance of brokered deposits for deposits of certain employee benefit plans, except that pass-through insurance coverage will be provided for employee benefit plan deposits in institutions which at the time of acceptance of the deposit meet all applicable regulatory capital requirements and send written notice to their depositors that their funds are eligible for pass-through deposit insurance. Although eligible to do so, the Banks have not accepted brokered deposits.
Conservatorship and Receivership Amendments. FDICIA authorizes the FDIC to appoint itself conservator or receiver for a state-chartered bank under certain circumstances and expands the grounds for appointment of a conservator or receiver for an insured depository institution to include (i) consent to such action by the board of directors of the institution; (ii) cessation of the institution’s status as an insured depository institution; (iii) the institution is undercapitalized and has no reasonable prospect of becoming adequately capitalized, or fails to become adequately capitalized when required to do so, or fails to timely submit an acceptable capital plan, or materially fails to implement an acceptable capital plan; and (iv) the institution is critically undercapitalized or otherwise has substantially insufficient capital. FDICIA provides that an institution’s directors shall not be liable to its stockholders or creditors for acquiescing in or consenting to the appointment of the FDIC as receiver or conservator for, or as a supervisor in the acquisition of, the institution.
Real Estate Lending Standards. FDICIA requires the federal bank regulatory agencies to adopt uniform real estate lending standards. The FDIC and the OCC have adopted regulations, which establish supervisory limitations on Loan-to-Value (“LTV”) ratios in real estate loans by FDIC-insured banks, including national banks. The regulations require banks to establish LTV ratio limitations within or below the prescribed uniform range of supervisory limits.
Standards for Safety and Soundness. Pursuant to FDICIA the federal bank regulatory agencies have prescribed, by regulation, standards and guidelines for all insured depository institutions and depository institution holding companies relating to: (i) internal controls, information systems and internal audit systems; (ii) loan documentation; (iii) credit underwriting; (iv) interest rate risk exposure; (v) asset growth; and (vi) compensation, fees and benefits. The compensation standards prohibit employment contracts, compensation or benefit arrangements, stock option plans, fee arrangements or other compensatory arrangements that would provide “excessive” compensation, fees or benefits, or that could lead to material financial loss. In addition, the federal bank regulatory agencies are required by FDICIA to prescribe standards specifying; (i) maximum classified assets to capital ratios; (ii) minimum earnings sufficient to absorb losses without impairing capital; and (iii) to the extent feasible, a minimum ratio of market value to book value for publicly-traded shares of depository institutions and depository institution holding companies.
Activities and Investments of Insured State Banks. FDICIA provides that FDIC-insured state banks such as CTC, MBT, BWM, and FBT may not engage as a principal, directly or through a subsidiary, in any activity that is not permissible for a national bank, such as ONB, unless the FDIC determines that the activity does not pose a significant risk to the BIF, and the bank is in compliance with its applicable capital standards. In addition, an insured state bank may not acquire or retain, directly or through a subsidiary, any equity investment of a type, or in an amount, that is not permissible for a national bank, unless such investments meet certain grandfather requirements.
The GLBA includes a section of the FDI Act governing subsidiaries of state banks that engage in “activities as principal that would only be permissible” for a national bank to conduct in a financial subsidiary. This provision permits state banks, to the extent permitted under state law, to engage in certain new activities, which are permissible for subsidiaries of a financial holding company. See “Supervision and Regulation, Regulation of
13
Table of Contents
the Company.” Further, it expressly preserves the ability of a state bank to retain all existing subsidiaries. Because the applicable Vermont statute explicitly permits banks chartered by the state to engage in all activities permissible for national banks, CTC will be permitted to form subsidiaries to engage in the activities authorized by the GLBA. Massachusetts and Maine permit banks chartered by those states to engage in activities which are permissible for a national bank and that are approved by the Massachusetts Commissioner of Banks or the Maine Superintendent of Banking. Thus, MBT, BWM, and FBT would only be permitted to engage in the activities authorized by the GLBA that are also approved by the state’s banking regulatory agency or otherwise by state law. In order to form a financial subsidiary, a state bank must be well-capitalized, and the state bank would be subject to certain capital deduction, risk management and affiliate transaction rules, which are applicable to national banks.
Consumer Protection Provisions. FDICIA also includes provisions requiring advance notice to regulators and customers for any proposed branch closing and authorizing (subject to future appropriation of the necessary funds) reduced insurance assessments for institutions offering “lifeline” banking accounts or engaged in lending in distressed communities. FDICIA also includes provisions requiring depository institutions to make additional and uniform disclosures to depositors with respect to the rates of interest, fees and other terms applicable to consumer deposit accounts.
Customer Information Security.The FDIC and other bank regulatory agencies have adopted final guidelines for establishing standards for safeguarding nonpublic personal information about customers that implement provisions of the Gramm-Leach-Bliley Act of 1999 or “GLBA,” which establishes a comprehensive framework to permit affiliations among commercial banks, insurance companies, securities firms, and other financial service providers by revising and expanding the BHCA framework. Specifically, the Information Security Guidelines established by the GLBA require each financial institution, under the supervision and ongoing oversight of its board of directors or an appropriate committee thereof, to develop, implement and maintain a comprehensive written information security program designed to ensure the security and confidentiality of customer information, to protect against anticipated threats or hazards to the security or integrity of such information; and to protect against unauthorized access to or use of such information that could result in substantial harm or inconvenience to any customer. The federal banking regulators have issued guidance for banks on response programs for unauthorized access to customer information. This guidance, among other things, requires notice to be sent to customers whose “sensitive information” has been compromised if unauthorized use of this information is “reasonably possible.” Various states have enacted legislation concerning breaches of data security and various bills requiring consumer notice of data security breaches are being considered by Congress.
Privacy.The GLBA requires financial institutions to implement policies and procedures regarding the disclosure of nonpublic personal information about consumers to nonaffiliated third parties. In general, the statute requires financial institutions to explain to consumers their policies and procedures regarding the disclosure of such nonpublic personal information, and, unless otherwise required or permitted by law, financial institutions are prohibited from disclosing such information except as provided in their policies and procedures.
FDIC Waiver of Certain Regulatory Requirements. The FDIC issued a rule, effective on September 22, 2003, that includes a waiver provision, which grants the FDIC Board of Directors extremely broad discretionary authority to waive FDIC regulatory provisions that are not specifically mandated by statute or by a separate regulation.
At December 31, 2005, the Company employed 2,025 persons, with a full-time equivalency of 1,905 employees. The Company enjoys good relations with its employees. A variety of employee benefits, including health, group life and disability income replacement insurance, a funded non-contributory pension plan, and an incentive savings and profit sharing plan, are available to qualifying employees.
14
Table of Contents
The Company maintains a website at www.chittendencorp.com. The Company makes available, free of charge, on its website its annual report on Form 10-K, quarterly reports on Form 10-Q, current reports on Form 8-K, and amendments to those reports filed or furnished pursuant to Section 13(a) or 15(d) of the Securities Exchange Act of 1934, as amended, as well as all Section 16 reports on Forms 3, 4, and 5, as soon as reasonably practicable after such reports are electronically filed with, or furnished to, the SEC. The Company’s reports filed with, or furnished to, the SEC are also available at the SEC’s website at www.sec.gov. Information contained on the Company’s website does not constitute a part of this report.
The risks and uncertainties described below are not the only ones that we face. Additional risks and uncertainties that we are unaware of, or that we currently deem immaterial, also may become important factors that affect us and our business. If any of these risks were to occur, our business, financial condition or results of operations could be materially and adversely affected.
We face significant competition for banking services in New England, our primary market, and in the local markets in which we operate. Competition in the local banking industries may limit our ability to attract and retain customers. We may face competition now and in the future from the following: other banking institutions, including larger New England and other commercial banking organizations; savings banks; credit unions; other financial institutions; and non-bank financial services companies serving New England and adjoining areas.
In particular, our competitors include several major financial companies whose greater resources may afford them a marketplace advantage by enabling them to maintain numerous banking locations and mount extensive promotional and advertising campaigns. Additionally, banks and other financial institutions with larger capitalization and financial intermediaries not subject to bank regulatory restrictions have larger lending limits, which enable them to serve the credit needs of larger customers. We also face competition from out-of-state financial intermediaries that have opened low-end production offices or that solicit deposits in their respective market areas. If we are unable to attract and retain banking customers we may be unable to continue our loan growth and level of deposits and our results of operations and financial condition may otherwise be negatively affected.
In the past, we have expanded our operations into non-banking activities such as asset management and wealth advisory services, insurance-related products, credit cards, payroll processing and brokerage services. We may have difficulty competing with more established providers of these products and services due to the intense competition in many of these industries, especially in the New England region. In addition, we may be unable to attract and retain non-banking customers due to a lack of market and product knowledge or other industry specific matters or an inability to attract and retain qualified, experienced employees. Our failure to attract and retain customers with respect to these non-banking activities could negatively impact our future earnings.
Our main source of income from operations is net interest income, which is equal to the difference between the interest income received on loans, investment securities and other interest-bearing assets and the interest expense incurred in connection with deposits, borrowings and other interest-bearing liabilities. As a result, our net interest income can be affected by changes in market interest rates. These rates are highly sensitive to many factors beyond our control, including general economic conditions, both domestic and foreign, and the monetary and fiscal policies of various governmental and regulatory authorities. We have adopted asset and liability management policies to try to minimize the potential adverse effects of changes in interest rates on our net interest income, primarily by altering the mix and maturity of loans, investments and funding sources. However, even with these policies in place, we cannot provide assurance that changes in interest rates will not negatively impact our operating results.
15
Table of Contents
An increase in interest rates also could have a negative impact on our business by reducing the ability of borrowers to repay their current loan obligations, which could not only result in increased loan defaults, foreclosures and write-offs, but also necessitate further increases to our allowance for loan losses. Increases in interest rates also may reduce the demand for loans and, as a result, the amount of loan and commitment fees. In addition, fluctuations in interest rates may result in disintermediation, which is the flow of funds away from depository institutions into direct investments that pay higher rates of return, and may affect the value of our investment securities and other interest-earning assets.
If our customers default on the repayment of their loans, our profitability could be adversely affected. A borrower’s default on its obligations under one or more of our loans may result in lost principal and interest income and increased operating expenses as a result of the allocation of management time and resources to the collection and work-out of the loans. If collection efforts are unsuccessful or acceptable workout arrangements cannot be reached, we may have to write-off the loans in whole or in part. Although we may acquire any real estate or other assets that secure the defaulted loans through foreclosure or other similar remedies, the amount owed under the defaulted loans may exceed the value of the assets acquired.
Our management periodically makes a determination of our allowance for loan losses based on available information, including the quality of our loan portfolio, economic conditions, the value of the underlying collateral and the level of our non-accruing loans. If our assumptions prove to be incorrect, our allowance may not be sufficient. Increases in this allowance will result in an expense for the period. If, as a result of general economic conditions or an increase in non-performing loans, management determines that an increase in our allowance for loan losses is necessary, we may incur additional expenses.
In addition, as an integral part of their examination process, bank regulatory agencies periodically review our allowance for loan losses and the value we attribute to real estate acquired through foreclosure or other similar remedies. These regulatory agencies may require us to adjust our determination of the value for these items. These adjustments could negatively impact our results of operations or financial condition.
Because we serve primarily individuals and smaller businesses located in New England and adjoining areas, the ability of our customers to repay their loans is impacted by the economic conditions in these areas. As of December 31, 2005, approximately 71% of our loan portfolio consisted of commercial loans, defined as commercial and industrial, municipal, multi-family, commercial real estate and construction loans. Thus, our results of operations, both in terms of the origination of new loans and the potential default of existing loans, is heavily dependent upon the strength of local businesses.
In addition, a substantial portion of our loans are secured by real estate located primarily in Vermont, Massachusetts, New Hampshire and Maine. Consequently, our ability to continue to originate real estate loans may be impaired by adverse changes in local and regional economic conditions in these real estate markets or by acts of nature. These events also could have an adverse effect on the value of our collateral and, due to the concentration of our collateral in real estate, on our financial condition.
We have traditionally obtained funds principally through deposits and borrowings. As a general matter, deposits are a cheaper source of funds than borrowings, because interest rates paid for deposits are typically less than interest rates charged for borrowings. If, as a result of competitive pressures, market interest rates, general economic conditions or other events, the balance of our deposits decrease relative to our overall banking operations, we may have to rely more heavily on borrowings as a source of funds in the future. Such an increased reliance on borrowings could have a negative impact on our results of operations or financial condition.
In the course of our business, we may acquire, through foreclosure, properties securing loans that are in default. Particularly in commercial real estate lending, there is a risk that hazardous substances could be discovered on these properties. In this event, we might be required to remove these substances from the affected properties at our sole cost and expense. The cost of this removal could substantially exceed the value of the
16
Table of Contents
affected properties. We may not have adequate remedies against the prior owners or other responsible parties and could find it difficult or impossible to sell the affected properties. The occurrence of one or more of these events could adversely affect our financial condition or operating results.
Bank holding companies and state and federally chartered banks operate in a highly regulated environment and are subject to supervision and examination by federal and state regulatory agencies. We are subject to the Bank Holding Company Act of 1956, as amended, and to regulation and supervision by the Federal Reserve Board, or FRB. Our state chartered banks are subject to regulation and supervision by the Federal Deposit Insurance Corporation, or FDIC, and the applicable state banking authorities, including the Vermont Commissioner of Banking, Insurance, Securities and Health Care Administration, the Maine Superintendent of the Bureau of Banking and the Massachusetts Commissioner of Banks. Our national bank subsidiary is subject to regulation by the Office of the Comptroller of the Currency, or the OCC. The cost of compliance with regulatory requirements may adversely affect our results of operations or financial condition. Federal and state laws and regulations govern numerous matters including: changes in the ownership or control of banks and bank holding companies; maintenance of adequate capital and the financial condition of a financial institution; permissible types, amounts and terms of extensions of credit and investments; permissible non-banking activities; the level of reserves against deposits; and restrictions on dividend payments.
The FDIC, the OCC and state banking authorities possess cease and desist powers to prevent or remedy unsafe or unsound practices or violations of law by banks subject to their regulation, and the FRB possesses similar powers with respect to bank holding companies. These and other restrictions limit the manner in which we may conduct our business and obtain financing.
Furthermore, our banking business is affected not only by general economic conditions, but also by the monetary policies of the FRB. Changes in monetary or legislative policies may affect the interest rates we must offer to attract deposits and the interest rates we can charge on our loans, as well as the manner in which we offer deposits and make loans. These monetary policies have had, and are expected to continue to have, significant effects on the operating results of depository institutions, including our banks.
We will continue to consider the acquisition of other businesses. However, we may not have the opportunity to make suitable acquisitions on favorable terms in the future, which could negatively impact the growth of our business. We expect that other banking and financial companies will compete with us to acquire compatible businesses. This competition could increase prices for acquisitions that we would likely pursue, and our competitors may have greater resources than us. Also, acquisitions of regulated businesses such as banks are subject to various regulatory approvals. If we fail to receive the appropriate regulatory approvals, we will not be able to complete an acquisition that we believe is in our best interests.
We have in the past acquired, and will in the future consider the acquisition of, other banking and related businesses. If we acquire other companies in the future, our business may be negatively impacted by risks related to those acquisitions. These risks include the following: the risk that the acquired business will not perform in accordance with management’s expectations; the risk that difficulties will arise in connection with the integration of the operations of the acquired business with our operations; the risk that management will divert its attention from other aspects of our business; the risk that we may lose key employees of the acquired business; the risks associated with entering into geographic and product markets in which we have limited or no direct prior experience; and the risks of the acquired company that we may assume in connection with an acquisition.
As a result of these risks, any given acquisition, if and when consummated, may adversely affect our results of operations or financial condition. In addition, because the consideration for an acquisition may involve cash, debt or the issuance of shares of our common stock and may involve the payment of a premium over book and market values, existing holders of our common stock could experience dilution in connection with the acquisition.
17
Table of Contents
We rely heavily on communications and information systems to conduct our business. Any failure or interruptions or breach in security of these systems could result in failures or disruptions in our customer relationship management, general ledger, deposits, servicing or loan origination systems. The occurrence of any failures or interruptions could result in a loss of customer business and have a material adverse effect on our results of operations and financial condition.
Under regulatory capital adequacy guidelines and other regulatory requirements, we and our Banks must meet guidelines that include quantitative measures of assets, liabilities, and certain off-balance sheet items, subject to qualitative judgments by regulators about components, risk weightings and other factors. If we fail to meet these minimum capital guidelines and other regulatory requirements, our financial condition would be materially and adversely affected. Our failure to maintain the status of “well capitalized” under our regulatory framework could affect the confidence of our customers in us, thus compromising our competitive position. In addition, failure to maintain the status of “well capitalized” under our regulatory framework or “well managed” under regulatory examination procedures could compromise our status as a bank holding company and related eligibility for a streamlined review process for acquisition proposals.
ITEM 1B UNRESOLVED STAFF COMMENTS
None
The offices of the Company are located in a facility owned by CTC at Two Burlington Square in Burlington, Vermont. CTC’s principal offices are also located in Burlington, Vermont and it has fifty additional locations in Vermont and one commercial finance lending office in Montreal, Quebec. BWM’s principal offices are located in Springfield, Massachusetts and it has eleven additional locations in the western Massachusetts area. FBT’s principal offices are located in Worcester, Massachusetts and it has seven additional locations in the greater Worcester, Massachusetts area. MBT’s principal offices are located in Portland, Maine and it has eleven additional locations in southern Maine. ONB’s principal offices are located in Portsmouth, New Hampshire and it has thirty-seven additional locations in southern Maine and New Hampshire. The offices of all subsidiaries are in good physical condition with modern equipment and facilities considered by management to be adequate to meet the banking needs of customers in the communities served.
A number of legal claims against the Company arising in the normal course of business were outstanding at December 31, 2005. Management, after reviewing these claims with legal counsel, is of the opinion that these matters, when resolved, will not have a material effect on the Company’s consolidated financial statements.
ITEM 4 SUBMISSION OF MATTERS TO A VOTE OF SECURITY HOLDERS
None
18
Table of Contents
PART II
| ITEM 5 | MARKET FOR REGISTRANT’S COMMON EQUITY, RELATED STOCKHOLDER MATTERS, AND ISSUER PURCHASES OF EQUITY SECURITIES |
(A)The $1 par value common stock of Chittenden Corporation has been publicly traded since November 14, 1974. As of January 31, 2006, there were 4,659 holders of record of the Company’s common stock.
The Company’s stock trades on the NYSE under the symbol “CHZ”. The following table sets forth the range of the high and low sales prices for the Company’s common stock, and the dividends declared, for each quarterly period within the past two years.
Quarter ended | High | Low | Dividends Paid | ||||||
2004 | |||||||||
March 31 | $ | 27.41 | $ | 25.14 | $ | 0.16 | |||
June 30 | 28.12 | 22.64 | 0.18 | ||||||
September 30 | 30.36 | 26.59 | 0.18 | ||||||
December 31 | 30.28 | 26.26 | 0.18 | ||||||
2005 | |||||||||
March 31 | 29.03 | 25.54 | $ | 0.18 | |||||
June 30 | 27.70 | 23.85 | 0.18 | ||||||
September 30 | 29.55 | 25.77 | 0.18 | ||||||
December 31 | 30.30 | 24.47 | 0.18 | ||||||
For a discussion of dividend restrictions on the Company’s common stock, see “Dividends” under the caption “Business—Supervision and Regulation” in this report.
(C)Share Repurchases. The following table sets forth information with respect to any purchase made by or on behalf of Chittenden or any “affiliated purchaser,” as defined in §240.10b-18(a)(3) under the Exchange Act, of shares of Chittenden common stock during the indicated periods.
Period | Total Number of Shares Purchased | Average Price Paid per Share | Total Number of Shares Purchased as Part of a Publicly Announced Plans or Programs | Maximum Number of Shares that may yet be Purchased under the Plans or Programs (1) | ||||
October 20-31, 2005 | — | — | — | 1,000,000 | ||||
November 1-30, 2005 | — | — | — | 1,000,000 | ||||
December 1-31, 2005 | — | — | — | 1,000,000 | ||||
Total | — | — | — | 1,000,000 |
| (1) | On October 20, 2005, the Company announced that the Board of Directors authorized the repurchase of up to 1,000,000 shares of the Company’s common stock in negotiated transactions or open market purchases. Chittenden, depending on market conditions, may repurchase its common stock without further Board authorization over the next two years. |
19
Table of Contents
ITEM 6 SELECTED FINANCIAL DATA
| Years Ended December 31, | ||||||||||||||||||||
| 2005 | 2004 | 2003 | 2002 | 2001 | ||||||||||||||||
| (In thousands, except share and per share amounts) | ||||||||||||||||||||
Statements of income: | ||||||||||||||||||||
Interest income | $ | 320,242 | $ | 269,767 | $ | 271,442 | $ | 259,019 | $ | 266,497 | ||||||||||
Interest expense | 75,929 | 44,269 | 53,379 | 66,404 | 96,192 | |||||||||||||||
Net interest income | 244,313 | 225,498 | 218,063 | 192,615 | 170,305 | |||||||||||||||
Provision for credit losses | 5,154 | 4,377 | 7,175 | 8,331 | 8,041 | |||||||||||||||
Noninterest income | 69,964 | 73,405 | 97,031 | 65,060 | 63,733 | |||||||||||||||
Noninterest expense | 178,708 | 176,372 | 191,371 | 151,544 | 135,760 | |||||||||||||||
Income before income taxes | 130,415 | 118,154 | 116,548 | 97,800 | 90,237 | |||||||||||||||
Income tax expense | 47,024 | 43,027 | 41,749 | 34,155 | 31,736 | |||||||||||||||
Net income | $ | 83,391 | $ | 75,127 | $ | 74,799 | $ | 63,645 | $ | 58,501 | ||||||||||
Total assets at year-end | $ | 6,464,670 | $ | 6,070,210 | $ | 5,900,644 | $ | 4,920,544 | $ | 4,153,714 | ||||||||||
Common shares outstanding at year-end | 46,829,048 | 46,341,819 | 45,795,688 | 39,924,338 | 40,088,058 | |||||||||||||||
Balance sheets—average daily balances: | ||||||||||||||||||||
Total assets | $ | 6,216,492 | $ | 5,895,720 | $ | 5,777,538 | $ | 4,551,879 | $ | 3,871,017 | ||||||||||
Net loans | 4,240,206 | 3,842,719 | 3,568,323 | 2,969,430 | 2,871,899 | |||||||||||||||
Investment securities | 1,394,556 | 1,478,989 | 1,696,982 | 1,264,156 | 729,027 | |||||||||||||||
Deposits | 5,204,051 | 4,956,450 | 4,758,388 | 3,896,968 | 3,407,439 | |||||||||||||||
Borrowings | 317,777 | 293,583 | 413,339 | 194,118 | 52,752 | |||||||||||||||
Stockholders’ equity | 636,254 | 591,693 | 538,217 | 394,740 | 353,529 | |||||||||||||||
Per common share: | ||||||||||||||||||||
Basic earnings | $ | 1.79 | $ | 1.63 | $ | 1.67 | $ | 1.58 | $ | 1.46 | ||||||||||
Diluted earnings | 1.77 | 1.61 | 1.66 | 1.57 | 1.44 | |||||||||||||||
Cash dividends declared | 0.72 | 0.70 | 0.64 | 0.63 | 0.61 | |||||||||||||||
Book value | 14.15 | 13.38 | 12.66 | 10.49 | 9.25 | |||||||||||||||
Tangible book value (1) | 9.16 | 8.28 | 7.44 | 8.87 | 8.42 | |||||||||||||||
Weighted average common shares outstanding | 46,502,983 | 46,106,057 | 44,719,710 | 40,132,330 | 40,204,668 | |||||||||||||||
Weighted average common and common equivalent shares outstanding | 47,051,394 | 46,731,304 | 45,150,135 | 40,619,253 | 40,683,786 | |||||||||||||||
Selected financial ratios: | ||||||||||||||||||||
Return on average stockholders’ equity | 13.11 | % | 12.70 | % | 13.90 | % | 16.12 | % | 16.55 | % | ||||||||||
Return on average tangible stockholders’ equity (2) | 20.99 | 21.43 | 22.92 | 19.27 | 18.54 | |||||||||||||||
Return on average total assets | 1.34 | 1.27 | 1.29 | 1.40 | 1.51 | |||||||||||||||
Return on average tangible total assets (2) | 1.42 | 1.36 | 1.37 | 1.44 | 1.57 | |||||||||||||||
Common stock dividend payout ratio (3) | 40.12 | 42.45 | 37.84 | 39.88 | 42.15 | |||||||||||||||
Net yield on earning assets | 4.31 | 4.21 | 4.12 | 4.53 | 4.74 | |||||||||||||||
Interest rate spread | 3.99 | 4.02 | 3.90 | 4.16 | 4.08 | |||||||||||||||
Efficiency Ratio (4) | 56.00 | 57.38 | 60.48 | 58.56 | 56.13 | |||||||||||||||
Net charge-offs as a percent of average loans | 0.05 | 0.07 | 0.16 | 0.28 | 0.24 | |||||||||||||||
Nonperforming assets ratio (5) | 0.36 | 0.49 | 0.39 | 0.49 | 0.46 | |||||||||||||||
Allowance for credit losses as a percent of year-end loans | 1.38 | 1.45 | 1.54 | 1.62 | 1.59 | |||||||||||||||
Leverage capital ratio | 9.09 | 8.42 | 7.79 | 9.28 | 7.99 | |||||||||||||||
Risk-based capital ratios: | ||||||||||||||||||||
Tier 1 | 11.05 | 10.44 | 10.07 | 12.25 | 10.32 | |||||||||||||||
Total | 12.23 | 11.64 | 11.32 | 13.50 | 11.57 | |||||||||||||||
Average equity / Average assets | 10.23 | 10.04 | 9.32 | 8.67 | 9.13 | |||||||||||||||
Tangible capital ratio (1) | 6.88 | 6.58 | 6.02 | 7.29 | 8.19 | |||||||||||||||
20
Table of Contents
| (1) | Tangible Capital/Book Value Reconciliation |
Total Equity | $ | 662,524 | $ | 620,257 | $ | 579,951 | $ | 418,792 | $ | 370,654 | ||||||||||
Goodwill | 216,038 | 216,136 | 216,431 | 55,257 | 29,341 | |||||||||||||||
Identified Intangible | 17,655 | 20,422 | 22,733 | 9,480 | 4,007 | |||||||||||||||
Tangible Equity (A) | $ | 428,831 | $ | 383,699 | $ | 340,787 | $ | 354,055 | $ | 337,306 | ||||||||||
Total Assets | $ | 6,464,970 | $ | 6,070,210 | $ | 5,900,644 | $ | 4,920,544 | $ | 4,153,714 | ||||||||||
Goodwill | 216,038 | 216,136 | 216,431 | 55,257 | 29,341 | |||||||||||||||
Identified Intangible | 17,655 | 20,422 | 22,733 | 9,480 | 4,007 | |||||||||||||||
Tangible Assets (B) | $ | 6,230,977 | $ | 5,833,652 | $ | 5,661,480 | $ | 4,855,807 | $ | 4,120,366 | ||||||||||
Tangible Capital (A) /(B) | 6.88 | % | 6.58 | % | 6.02 | % | 7.29 | % | 8.19 | % | ||||||||||
Common Shares Outstanding at Year | 46,829,048 | 46,341,819 | 45,795,688 | 39,924,338 | 40,088,058 | |||||||||||||||
Tangible Book Value (A)/(C) | $9.16 | $8.28 | $7.44 | $8.87 | $8.42 | |||||||||||||||
| (2) | Reconciliation of non-GAAP measurements to GAAP |
Net Income (GAAP) | $ | 83,391 | $ | 75,127 | $ | 74,799 | $ | 63,645 | $ | 58,501 | ||||||||||
Amortization of Identified Intangibles, net of tax | 1,799 | 2,000 | 1,786 | 831 | 1,925 | |||||||||||||||
Tangible Net Income (A) | $ | 85,190 | $ | 77,127 | $ | 76,585 | $ | 64,476 | $ | 60,426 | ||||||||||
Average Equity (GAAP) | $ | 636,254 | $ | 591,693 | $ | 538,217 | $ | 394,740 | $ | 353,529 | ||||||||||
Average Identified Intangibles | 19,056 | 21,741 | 22,493 | 9,108 | — | |||||||||||||||
Average Deferred Tax on Identified Intangibles | (4,785 | ) | (6,392 | ) | (5,763 | ) | (2,280 | ) | (594 | ) | ||||||||||
Average Goodwill | 216,127 | 216,519 | 187,369 | 53,293 | 28,147 | |||||||||||||||
Average Tangible Equity (B) | $ | 405,856 | $ | 359,825 | $ | 334,118 | $ | 334,619 | $ | 325,976 | ||||||||||
Return on Average Tangible Equity (A) / (B) | 20.99 | % | 21.43 | % | 22.92 | % | 19.27 | % | 18.54 | % | ||||||||||
Average Assets (GAAP) | $ | 6,216,492 | $ | 5,895,720 | $ | 5,777,538 | $ | 4,551,879 | $ | 3,871,017 | ||||||||||
Average Identified Intangibles | 19,056 | 21,741 | 22,493 | 9,108 | — | |||||||||||||||
Average Deferred Tax on Identified Intangibles | (4,785 | ) | (6,392 | ) | (5,763 | ) | (2,280 | ) | (594 | ) | ||||||||||
Average Goodwill | 216,127 | 216,519 | 187,369 | 53,293 | 28,147 | |||||||||||||||
Average Tangible Assets (C) | $ | 5,986,094 | $ | 5,663,852 | $ | 5,573,439 | $ | 4,491,759 | $ | 3,843,464 | ||||||||||
Return on Average Tangible Assets (A) / (C) | 1.42 | % | 1.36 | % | 1.37 | % | 1.44 | % | 1.57 | % | ||||||||||
| (3) | Common stock cash dividends declared divided by net income. |
| (4) | Efficiency Ratio is computed by dividing total noninterest expense (less oreo expense, amortization expense and any nonrecurring items) by the sum of net interest income on a tax equivalent basis and total noninterest income (exclusive of gains and losses from bank investment securities, and nonrecurring items). The Company uses this non-GAAP measure, which is used widely in the banking industry, to provide important information regarding its operational efficiency. |
| (5) | The sum of nonperforming assets (nonaccrual loans, restructured loans, and other real estate owned) divided by the sum of total loans and other real estate owned. |
While the Company’s management uses non-GAAP measures for operational and investment decisions and believes that these measures are among several useful measures for understanding its operating results and financial condition, these measures should not be construed as a substitute for GAAP measures. Non-GAAP measures should be read and used in conjunction with the Company’s reported GAAP operating results and financial information.
21
Table of Contents
| ITEM 7 | MANAGEMENT’S DISCUSSION AND ANALYSIS OF FINANCIAL CONDITION AND RESULTS OF OPERATIONS |
For the Years Ended December 31, 2005, 2004, and 2003
The following discussion and analysis of financial condition and results of operations of the Company and its subsidiaries should be read in conjunction with the consolidated financial statements and accompanying notes and selected statistical information included in this report.
Application of Critical Accounting Policies
The Company’s significant accounting policies are described in Note 1 to the consolidated financial statements included in Item 8 of this Form 10-K. The Company considers the following accounting policies and related estimates to be the most critical in their potential effect on its financial position or results of operations:
Allowance for Credit Losses.The allowance for credit losses consists of two components: (1) the allowance for loan losses and (2) the reserve for unfunded commitments. The allowance for loan losses is established through a charge against current earnings to the provision for credit losses. The allowance for loan losses is based on management’s estimate of the amount required to reflect the probable inherent losses in the loan portfolio, based on circumstances and conditions known at each reporting date in accordance with Generally Accepted Accounting Principles (“GAAP”). There are three components of the allowance for loan losses: 1) specific reserves for loans considered to be impaired or for other loans for which management considers a specific reserve to be necessary; 2) allocated reserves based upon management’s formula-based process for assessing the adequacy of the allowance for loan losses; and 3) a non-specific environmentally-driven allowance considered necessary by management based on its assessment of other qualitative factors. The allowance for loan losses is a significant estimate and is regularly reviewed by the Company for adequacy using a consistent, systematic methodology which assesses such factors as changes in the mix and volume of the loan portfolio; trends in portfolio credit quality, including delinquency and charge-off rates; and current economic conditions that may affect a borrower’s ability to repay. Adverse changes in management’s assessment of these factors could lead to additional provisions for credit losses. The Company’s methodology with respect to the assessment of the adequacy of the allowance for loan losses is more fully discussed in later sections of Management’s Discussion and Analysis of Financial Condition and Results of Operations (“MD&A”).
The reserve for unfunded commitments is based on management’s estimate of the amount required to reflect the probable inherent losses on outstanding letters of credit, merchant processing activity and unused loan credit lines. Adequacy of the reserve is determined using a consistent, systematic methodology, similar to the one which analyzes the allowance for loan losses. Management must also estimate the likelihood that these commitments would be funded and become loans. This is done by evaluating the historical utilization of each type of unfunded commitment and estimating the likelihood that the current utilization rates on lines available at the balance sheet date could increase in the future.
Mortgage Servicing Rights (MSRs). Servicing assets are recognized as separate assets when rights are acquired through purchase or through the sale of financial assets on a servicing-retained basis. Capitalized servicing rights are amortized into noninterest income in proportion to, and over the period of, the estimated future net servicing income of the underlying financial assets. Servicing assets are evaluated regularly for impairment based upon the fair value of the rights as compared to amortized cost. Impairment is determined by stratifying servicing rights by predominant characteristics, such as interest rates, original loan terms and whether the loans are fixed or adjustable rate mortgages. Fair value is determined using prices for similar assets with similar characteristics, when available, or based upon discounted cash flows using market-based assumptions. When the book value of an individual stratum exceeds its fair value, an impairment reserve is recognized so that each individual stratum is carried at the lower of its amortized book value or fair value. In periods of falling market interest rates, accelerated loan prepayment speeds can adversely impact the fair value of these mortgage-servicing rights relative to their book value. In the event that the fair value of these assets were to increase in the future, the Company can recognize the increased fair value to the extent of the impairment allowance but cannot
22
Table of Contents
recognize an asset in excess of its amortized book value. Future changes in management’s assessment of the impairment of these servicing assets, as a result of changes in observable market data relating to market interest rates, loan prepayment speeds, and other factors, could impact the Company’s financial condition and results of operations either positively or adversely.
Income Taxes.The Company estimates its income taxes for each of the jurisdictions in which it operates to determine an appropriate expense against current pre-tax earnings. This involves estimating the Company’s actual current tax expense as well as assessing temporary differences resulting from differing treatment of items, such as timing of the deduction of expenses, for tax and accounting purposes. These differences result in deferred tax assets and liabilities, which are included in the Company’s consolidated balance sheets. The Company must also assess the likelihood that any deferred tax assets will be recovered from future taxable income and to the extent that recovery is not likely, a valuation allowance must be established. Significant management judgment is required in determining income tax expense, and deferred tax assets and liabilities. As of December 31, 2005, there were no valuation allowances set aside against any deferred tax assets.
Interest Income Recognition.Interest on loans is included in income as earned based upon interest rates applied to unpaid principal. Interest is not accrued on loans 90 days or more past due unless they are adequately secured and in the process of collection or on other loans when management believes collection is doubtful. All loans considered impaired are nonaccruing. Interest on nonaccruing loans is recognized as payments are received when the ultimate collectibility of interest is no longer considered doubtful. When a loan is placed on nonaccrual status, all unpaid interest previously accrued is reversed against current-period interest income; therefore, an increase in loans on nonaccural status could have an adverse impact on interest income recognized in future periods.
Restructuring Charges.The Company recognizes restructuring charges in accordance with Statement of Financial Accounting Standard No. 146Accounting for Costs Associated with Exit or Disposal Activities and SEC Staff Accounting Bulletin No. 10Restructuring and Impairment Charges, which contain specific guidance regarding the types of, and circumstances under which, certain expenses can be accrued. In general, the Statements require that the Company have a detailed plan in place, which has been communicated to substantially all the employees affected. Significant management judgment is required in estimating the amount of expense that is appropriate to recognize in relation to these plans.
Executive Overview
Chittenden posted 2005 net income of $83.4 million, compared with $75.1 million in 2004. Diluted earnings per share were $1.77, an increase of 9% from 2004. Specific highlights included:
| • | Net interest income increased $18.8 million or 8.3% from 2004. This increase was driven by higher levels of interest earnings assets, which increased 6% to $5.7 million in 2005, as well as to an increase of 10 basis points in the net yield on earning assets to 4.31% in 2005. |
| • | The provision for credit losses of $5.2 million was $777,000 higher than in 2004 due to continued strong loan growth. However, both 2004 and 2005 were considered low in comparison to the recent past. The provision for credit losses ranged from $7.2 million to $8.3 million in 2001-2003. The lower levels of provision for credit losses in the last two years have been due to significantly lower net charge-offs. |
| • | Credit quality continued to be strong in 2005. Net charge-offs were very low at $2.2 million in 2005 compared with $2.8 million in 2004. During 2001-2003, net charge-offs ranged from $5.8 million to $8.4 million. Non performing assets as a percentage of total loans and other real estate owned declined to 36 basis points, the lowest level during the last five years. |
| • | Total loan footings increased $410 million, or 10%, during 2005. The increase was attributable to continued growth across all loan categories, particularly in the commercial & industrial and commercial real estate portfolios, residential real estate loans, and municipal loans. This loan growth was more than funded by higher levels of deposits, which were up $476 million, or 9.4%, year over year. |
23
Table of Contents
| • | Noninterest income declined $3.4 million from 2004. Several categories saw declines including investment management and trust ($1.6 million), service charges on deposits ($1.8 million), gains on sales of loans ($640,000), and insurance commissions ($601,000). These declines were partially offset by improved mortgage servicing ($1.7 million) and credit card income ($386,000). These fluctuations are more fully explained on page 39. |
| • | Noninterest expenses increased $2.3 million or just 1.3% from 2004. Salaries and employee benefits increased $3.0 million or 2.8%. It is important to note that in the second quarter of 2005, the Company decided to change the delivery mechanism, effective January 1, 2006, for its employees’ pension benefit by redirecting it through the Company’s 401(k) plan. This decision resulted in the immediate recognition of $1.5 million in deferred credits relating to previous pension plan changes made in the mid-1990s. Occupany costs increased $1.4 million due to the opening of two new branches during the year. Data processing expenses declined $2.7 million due to the mid-2004 change in the Company’s core data processing platform. |
| • | Return on average equity (ROE) was 13.11% for the year-ended December 31, 2005 compared with 12.70% and 13.90% in 2004 and 2003. Return on average assets (ROA) was 1.34% for 2005 an increase from 1.27% in 2004 and 1.29% in 2003. These increases were due to higher levels of net income. |
Lending Activity
Loan Portfolio
The Company offers a range of banking services, including residential real estate, consumer and commercial loans. The following table shows the composition of the loan portfolio (based on underlying collateral utilizing bank regulatory definitions) for the five years ended:
| December 31, | ||||||||||||||||||||
| 2005 | 2004 | 2003 | 2002 | 2001 | ||||||||||||||||
| (in thousands) | ||||||||||||||||||||
Commercial & industrial | $ | 848,420 | $ | 801,369 | $ | 658,615 | $ | 568,224 | $ | 559,752 | ||||||||||
Municipal | 160,357 | 106,120 | 87,080 | 77,820 | 85,479 | |||||||||||||||
Multi-family | 196,590 | 182,541 | 176,478 | 96,494 | 54,623 | |||||||||||||||
Commercial real estate | 1,778,202 | 1,590,457 | 1,430,945 | 1,103,897 | 903,819 | |||||||||||||||
Construction | 192,165 | 174,283 | 140,801 | 85,512 | 79,801 | |||||||||||||||
Residential real estate | 737,462 | 688,017 | 700,671 | 561,330 | 618,033 | |||||||||||||||
Home equity credit lines | 316,465 | 294,656 | 270,959 | 203,882 | 182,905 | |||||||||||||||
Consumer | 257,829 | 239,750 | 259,135 | 276,704 | 353,765 | |||||||||||||||
Total gross loans | 4,487,490 | 4,077,193 | 3,724,684 | 2,973,863 | 2,838,177 | |||||||||||||||
Allowance for loan losses | (60,822 | ) | (59,031 | ) | (57,464 | ) | (48,197 | ) | (45,268 | ) | ||||||||||
Net loans | $ | 4,426,668 | $ | 4,018,162 | $ | 3,667,220 | $ | 2,925,666 | $ | 2,792,909 | ||||||||||
Commercial Loans.The Company offers a wide range of banking services to businesses with revenues up to approximately $100 million. The Company’s lending activities are conducted primarily in Vermont, New Hampshire, Massachusetts and Maine, with additional activity relating to nearby trading areas in New York, Connecticut, and Quebec. The total commercial loan portfolio, defined as commercial & industrial, municipal, multi-family, commercial real estate and construction loans, constituted $3.176 billion, or 71% of Chittenden’s loan portfolio at December 31, 2005.
The Company’s commercial loans grew 11% from 2004 with growth coming from the commercial & industrial (“C&I”) portfolio (up 6%) and the commercial real estate (“CRE”) portfolio (up 12%). In addition, the Company experienced growth of 51% in its municipal portfolio and 10% in the construction portfolio. The primary emphasis in the construction portfolio is the financing of projects for the Company’s commercial
24
Table of Contents
customers, as well as individual consumer loans. At December 31, 2005, the construction portfolio was comprised of approximately 30% in individual consumer construction loans, 28% in loans to commercial customers for owner-occupied properties, 21% for commercial customers for investor properties, and 21% to residential developers. The continued growth came primarily from the Company’s Vermont, Massachusetts and New Hampshire markets and was not specifically concentrated in any one industry.
The following graph shows the industry diversification, which are based on NAICS sector codes, of the commercial loan portfolios at December 31, 2005:
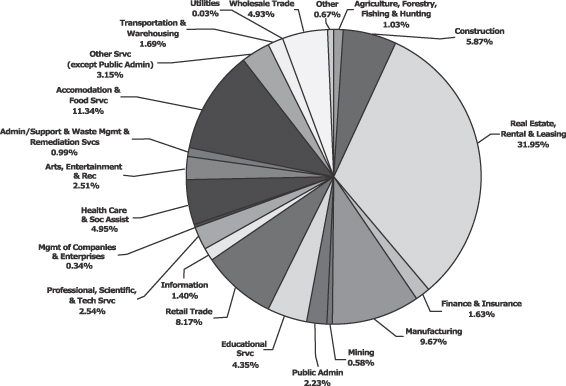
Residential Real Estate Loans.Residential real estate loans, comprised of 1-4 family and home equity lines of credit, totaled $1.054 billion at December 31, 2005, an increase of $71 million from 2004. The increase is primarily attributable to the home equity lines of credit, which totaled $316.5 million at December 31, 2005 compared with $294.6 million at the end of 2004 and growth of $49 million from the prior year-end in 1-4 family loans which was primarily due to the increased production of private banking loans in our Vermont, Massachusetts and Maine markets. Approximately 3% or $21 million of the residential real estate loans are private banking loans, which are nontraditional interest only loans.
Consumer Loans.Consumer loans were $257.8 million, at December 31, 2005, an increase of $18.1 million from 2004. Approximately 82% of these loans were indirect installment loans while the remaining loans consisted of direct installment and revolving credit. All of the Company’s indirect installment loans were originated from dealers within the Banks’ operating areas.
25
Table of Contents
Mortgage Banking Operations
Residential mortgage sales during 2005 totaled $427 million, compared to $491 million during 2004. This decline was primarily due to the origination of lower volumes of fixed rate residential loans caused by gradually increasing market rates during 2005 and lower volumes of refinancing activity. The Company underwrites its residential mortgages to secondary market standards and sells substantially all of its fixed-rate residential mortgage production on a servicing-retained non-recourse basis.
The portfolio of residential mortgages serviced for investors totaled $2.098 billion at December 31, 2005 compared to $2.142 billion at year-end 2004. These assets are owned by investors other than Chittenden and therefore are not included in the Company’s consolidated balance sheets. The net assets relating to this servicing portfolio recorded on the Company’s books at December 31, 2005 and 2004 were $13.7 million and $11.8 million, respectively. As noted under the Application of Critical Accounting Policies, the Company evaluates the MSR asset for impairment on a regular basis. At December 31, 2005, the MSR’s amortized cost of $14.4 million was reduced by an impairment reserve of $639,000, as compared to an impairment reserve of $1.0 million at the end of 2004.
Nonperforming Assets
Loans on which the accrual of interest has been discontinued are designated as nonaccrual loans. Management classifies loans as nonaccrual when they become 90 days past due as to principal or interest, unless they are adequately secured and in the process of collection. In addition, loans that have not met this delinquency test may be placed on nonaccrual at management’s discretion. To the extent that certain loans classified as nonaccrual have an associated governmental agency guarantee, a separate assessment of the classification of the guaranteed portion is made. Generally, as long as interest and principal are less than 90 days past due, the guaranteed amounts are collectible from the guarantor and therefore are not classified as nonaccrual. In these situations, only the non-guaranteed portion of the loan would be classified as nonaccrual. (In the event that a guaranteed loan were to exceed 90 days past due, no further interest would be accrued on the guaranteed portion, as it generally would not be reimbursed by the guarantor.) Consumer and residential loans are included when management considers it to be appropriate, based upon evidence of collectibility, the value of any underlying collateral and other general criteria. Generally, a loan remains on nonaccrual status until the factors which indicated doubtful collectibility no longer exist or the loan is determined to be uncollectible and is charged off against the allowance for loan losses.
A loan is classified as a restructured loan when its interest rate is reduced and/or other terms are modified because of the inability of the borrower to service debt at current market rates and terms. Other real estate owned (“OREO”) is real estate that has been acquired through foreclosure and is recorded at the lower of the carrying amount of the loan or the fair value of the property, less estimated costs to sell, at the time of acquisition.
The following table shows the composition of nonperforming assets and loans past due 90 days or more and still accruing interest as of the end of each of the five years ended:
| December 31, | ||||||||||||||||||||
| 2005 | 2004 | 2003 | 2002 | 2001 | ||||||||||||||||
| (in thousands) | ||||||||||||||||||||
Loans on nonaccrual | $ | 15,819 | $ | 19,915 | $ | 14,331 | $ | 14,576 | $ | 12,374 | ||||||||||
Troubled debt restructurings | — | — | — | 225 | — | |||||||||||||||
Other real estate owned | 375 | 109 | 100 | 158 | 703 | |||||||||||||||
Total nonperforming assets | $ | 16,194 | $ | 20,024 | $ | 14,431 | $ | 14,959 | $ | 13,077 | ||||||||||
Loans past due 90 days or more and still accruing | $ | 3,038 | $ | 2,604 | $ | 4,029 | $ | 2,953 | $ | 4,583 | ||||||||||
Percentage of nonperforming assets to total loans and other real estate owned | 0.36 | % | 0.49 | % | 0.39 | % | 0.49 | % | 0.46 | % | ||||||||||
Nonperforming assets to total assets | 0.25 | 0.33 | 0.24 | 0.30 | 0.31 | |||||||||||||||
Allowance for credit losses to nonperforming loans, excluding OREO | 392.06 | 296.41 | 400.99 | 325.64 | 365.83 | |||||||||||||||
26
Table of Contents
The following graph compares the Company’s percentage of nonperforming assets to total loans and other real estate owned with the composite of banks included in SNL Securities $5-$10 billion bank index.
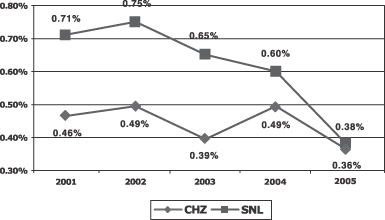
The percentage of nonperforming assets to total loans and OREO was unusually low at the end of 2003 and 2005 as compared with the Company’s historical experience which has averaged approximately 50 basis points. Nonaccrual loans at December 31, 2005 consisted of approximately 199 loans, which were diversified across a range of industries, sectors and geography. Approximately 36% of the total nonaccrual loans, or $5.7 million, represent relationships of $1.0 million or greater, 10% or $1.6 million represent relationships between $500,000 to $1.0 million, and 54% of the nonaccrual loan relationships are under $100,000. Nonaccrual loans with payments less than 30 days past due represent 62% of total loans on nonaccrual at December 31, 2005.
Allowance for credit losses
The allowance for credit losses consists of two components: 1) the allowance for loan losses which is presented as a contra to total gross loans in the assets section of the balance sheet, and 2) the reserve for unfunded commitments included in other liabilities on the balance sheet.
Adequacy of the allowance for loan losses is determined using a consistent, systematic methodology, which analyzes the risk inherent in the loan portfolio. In addition to evaluating the collectibility of specific loans when determining the adequacy of the allowance for loan losses, management also takes into consideration other factors such as changes in the mix and size of the loan portfolio, historic loss experience, the amount of delinquencies and loans adversely classified, and economic trends. The adequacy of the allowance for loan losses is assessed by an allocation process whereby specific loss allocations are made against certain adversely classified loans, and general loss allocations are made against segments of the loan portfolio which have similar attributes.
The allowance for loan losses is increased by provisions charged against current earnings. Loan losses are charged against the allowance when management believes that the collectibility of the loan principal is unlikely. Recoveries on loans previously charged off are credited to the allowance. While management uses available information to assess possible losses on loans, future additions to the allowance may be necessary based on increases in non-accrual loans, changes in economic conditions, growth in loan portfolios, or for other reasons. Any future additions to the allowance would be recognized in the period in which they were determined to be necessary. In addition, various regulatory agencies periodically review the Company’s allowance for loan losses as an integral part of their examinations. Such agencies may require the Company to record additions to the allowance based on judgments different from those of management.
27
Table of Contents
Credit quality of the commercial portfolios is quantified by a corporate credit rating system designed to parallel regulatory criteria and categories of loan risk. Individual loan officers monitor their loans to ensure appropriate rating assignments are made on a timely basis. Risk ratings and quality of commercial and consumer credit portfolios are also assessed on a regular basis by an independent Credit Review Department. Credit Review personnel conduct ongoing portfolio trend analyses and individual credit reviews to evaluate loan risk and compliance with corporate lending policies. The level of allowance allocable to each group of risk-rated loans is then determined by applying a loss factor that estimates the amount of probable loss in each category. The assigned loss factor for each risk rating is based upon management’s assessment of historical loss data, portfolio characteristics, economic trends, overall market conditions and past experience.
Consumer and residential real estate loan quality is evaluated on the basis of delinquency data and other credit data available due to the large number of such loans and the relatively small size of individual credits. Allocations for these loan categories are principally determined by applying loss factors that represent management’s estimate of inherent losses. In each category, inherent losses are estimated based upon management’s assessment of historical loss data, portfolio characteristics, economic trends, overall market conditions and past experience. In addition, certain loans in these categories may be individually risk-rated if considered necessary by management.
The other method used to allocate the allowance for loan losses entails the assignment of reserve amounts to individual loans on the basis of loan impairment. Certain loans are evaluated individually and are judged to be impaired when management believes it is probable that the Company will not collect all of the contractual interest and principal payments as scheduled in the loan agreement. Under this method, loans are selected for evaluation based on internal risk ratings or non-accrual status. A specific reserve amount is allocated to an individual loan when that loan has been deemed impaired and when the amount of a probable loss is estimable on the basis of its collateral value, the present value of anticipated future cash flows, or its net realizable value. At December 31, 2005, impaired loans with specific reserves totaled $3,495,388 (all of these loans were on nonaccrual status) and the amount of such reserves was $1,061,441.
The adequacy of the reserve for unfunded commitments is determined similarly to the allowance for loan losses, with the exception that management must also estimate the likelihood of these commitments being funded and becoming loans. This is done by evaluating the historical utilization of each type of unfunded commitment and estimating the likelihood that the current utilization rates could increase in the future.
28
Table of Contents
Results and recommendations from these processes provide senior management and the Board of Directors with independent information on the loan portfolio and unfunded commitments credit risk. The following table summarizes the activity in the Company’s allowance for credit losses for the five years ended:
| December 31, | ||||||||||||||||||||
| 2005 | 2004 | 2003 | 2002 | 2001 | ||||||||||||||||
| (in thousands) | ||||||||||||||||||||
Allowance for loan losses, at beginning of year | $ | 59,031 | $ | 57,464 | $ | 48,197 | $ | 45,268 | $ | 40,255 | ||||||||||
Allowance acquired through acquisitions | — | — | 7,936 | 2,972 | 4,083 | |||||||||||||||
Loans charged off: | ||||||||||||||||||||
Commercial & industrial | 1,354 | 2,755 | 3,653 | 4,340 | 2,881 | |||||||||||||||
Commercial real estate | 577 | 248 | 1,794 | 554 | 1,073 | |||||||||||||||
Construction | 266 | 4 | — | — | 60 | |||||||||||||||
Residential real estate | 350 | 143 | 187 | 487 | 402 | |||||||||||||||
Home equity credit lines | 35 | 11 | 21 | 138 | 263 | |||||||||||||||
Consumer | 3,393 | 3,989 | 4,383 | 6,048 | 5,780 | |||||||||||||||
Total loans charged off | 5,975 | 7,150 | 10,038 | 11,567 | 10,459 | |||||||||||||||
Recoveries of loans previously charged off: | ||||||||||||||||||||
Commercial & industrial | 1,198 | 1,986 | 1,287 | 1,048 | 806 | |||||||||||||||
Commercial real estate | 109 | 246 | 189 | 232 | 349 | |||||||||||||||
Construction | — | 5 | 64 | 19 | 66 | |||||||||||||||
Residential real estate | 184 | 158 | 333 | 71 | 130 | |||||||||||||||
Home equity credit lines | 104 | 18 | 90 | 36 | 15 | |||||||||||||||
Consumer | 2,217 | 1,927 | 2,231 | 1,787 | 1,982 | |||||||||||||||
Total recoveries | 3,812 | 4,340 | 4,194 | 3,193 | 3,348 | |||||||||||||||
Net loans charged off | 2,163 | 2,810 | 5,844 | 8,374 | 7,111 | |||||||||||||||
Transfer for liability for unfunded commitments | 1,200 | — | — | — | — | |||||||||||||||
Provision for credit losses charged to expense | 5,154 | 4,377 | 7,175 | 8,331 | 8,041 | |||||||||||||||
Allowance for loan losses, at year-end | $ | 60,822 | $ | 59,031 | $ | 57,464 | $ | 48,197 | $ | 45,268 | ||||||||||
Components of allowance for credit losses: | ||||||||||||||||||||
Allowance for loan losses | $ | 60,822 | $ | 59,031 | $ | 57,464 | $ | 48,197 | $ | 45,268 | ||||||||||
Liability for unfunded credit commitments | 1,200 | — | — | — | — | |||||||||||||||
Balance of allowance for credit losses at year-end | $ | 62,022 | $ | 59,031 | $ | 57,464 | $ | 48,197 | $ | 45,268 | ||||||||||
Loans outstanding at end of year | $ | 4,487,490 | $ | 4,077,193 | $ | 3,724,865 | $ | 2,973,863 | $ | 2,838,177 | ||||||||||
Average loans outstanding during the year | 4,275,625 | 3,874,107 | 3,550,648 | 2,974,370 | 2,885,228 | |||||||||||||||
Ratio of net charge-offs during year to average loans outstanding | 0.05 | % | 0.07 | % | 0.16 | % | 0.28 | % | 0.24 | % | ||||||||||
Allowance for credit losses as a percent of loans | 1.38 | % | 1.45 | 1.54 | 1.62 | 1.59 | ||||||||||||||
Allowance for credit losses as a percent of loans excluding municipal loans | 1.43 | 1.49 | 1.58 | 1.66 | 1.64 | |||||||||||||||
29
Table of Contents
Management strives for directional consistency between its provision for loans losses and the quantitative and qualitative indicators of its asset quality. In 2002, the provision was increased approximately $300,000, primarily due to higher levels of commercial charge-offs and the ONB acquisition. In 2003, the provision was reduced by $1.156 million, primarily due to improved credit quality evidenced by much lower net charge-offs, which declined $2.5 million. This trend continued in 2004 when the provision declined $2.8 million to $4.4 million, primarily due to significantly lower net charge-offs, which declined $3.0 million from 2003. In 2005, the provision increased $777,000 primarily due to continued strong commercial loan growth. The allowance for credit losses as a percentage of loans has declined from 1.62% at year-end 2002 to 1.38% at December 31, 2005 as a result of the sustained period of lower net charge-offs and due to continued improvements in the ratios of nonperforming assets to loans plus OREO.
The allowance for loan losses is allocated to various loan categories for analytical purposes as part of the Company’s process of evaluating the adequacy of the allowance for loan losses.
The following table summarizes the allocation of the allowance for loan losses at:
| December 31, | ||||||||||||||||||||||||||||||
| 2005 | 2004 | 2003 | 2002 | 2001 | ||||||||||||||||||||||||||
| Amount Allocated | Loan Distribution | Amount Allocated | Loan Distribution | Amount Allocated | Loan Distribution | Amount Allocated | Loan Distribution | Amount Allocated | Loan Distribution | |||||||||||||||||||||
| (in thousands) | ||||||||||||||||||||||||||||||
Commercial & industrial | $ | 14,057 | 22 | % | $ | 13,028 | 22 | % | $ | 13,302 | 20 | % | $ | 11,252 | 22 | % | $ | 9,381 | 23 | % | ||||||||||
Commercial real estate | 32,475 | 40 | 28,479 | 40 | 25,832 | 38 | 19,429 | 37 | 15,637 | 32 | ||||||||||||||||||||
Construction | 2,949 | 4 | 2,742 | 4 | 2,240 | 4 | 1,257 | 3 | 1,250 | 3 | ||||||||||||||||||||
Residential real estate | 1,951 | 21 | 1,756 | 21 | 1,763 | 24 | 1,733 | 22 | 1,950 | 24 | ||||||||||||||||||||
Home equity credit lines | 1,194 | 7 | 1,064 | 7 | 966 | 7 | 748 | 7 | 671 | 6 | ||||||||||||||||||||
Consumer | 3,813 | 6 | 3,905 | 6 | 4,454 | 7 | 4,821 | 9 | 5,139 | 12 | ||||||||||||||||||||
Other | 4,383 | — | 8,057 | — | 8,907 | — | 8,957 | — | 11,240 | — | ||||||||||||||||||||
| $ | 60,822 | 100 | % | $ | 59,031 | 100 | % | $ | 57,464 | 100 | % | $ | 48,197 | 100 | % | $ | 45,268 | 100 | % | |||||||||||
During 2005, the allowance for loan losses allocated to commercial & industrial loans increased by $1.0 million and the allocation to commercial real estate loans increased by $4.0 million. The increased allocations to these categories reflected growth in the portfolios.
The other category is the allowance considered necessary by management based on its assessment of historical loss experience, industry trends, and the impact of the local and regional economy on the Company’s borrowers that have not been captured in the specific risk classifications. Due to the imprecise nature of the loan loss estimation process and the effects of changing environmental conditions, these risk attributes may not be adequately captured in the data related to the formula-based loan loss components used to determine allocations in the Company’s analysis of the adequacy of the allowance for loan losses.
Prior to the Company’s recognition in 2005 of a separate reserve for unfunded commitments, a portion of the other category was reserved for inherent losses in the off-balance sheet exposures, which are now recognized in the separate liability. The amount of the Other allocation at December 31, 2004 reserved for this purpose was approximately $3.5 million.
Investment Securities
The investment portfolio is used to meet liquidity demands, invest excess liquidity, generate interest income and mitigate interest rate sensitivity. At December 31, 2005, the Company held investments available for sale totaling $1.4 billion, essentially unchanged from the prior year-end. At December 31, 2005, net unrealized losses were $29.3 million compared with net unrealized gains of $1.1 million at December 31, 2004. The decline in
30
Table of Contents
unrealized loss at December 31, 2005, is primarily due to higher market interest rates at year-end and explains virtually the entire variance from the balance a year ago. There was no other than temporary impairment in the available for sale portfolio at December 31, 2005 (see note 4 to the Company’s consolidated financial statements in Item 8 of this Form 10-K for further discussion).
The following table shows the composition of the Company’s investment portfolio, at:
| December 31, | |||||||||||||||
| 2005 | 2004 | 2003 | 2002 | 2001 | |||||||||||
Securities available for sale (at amortized cost) | |||||||||||||||
U.S. Treasury securities | $ | 5,342 | $ | 6,612 | $ | 7,797 | $ | 51,989 | $ | 3,296 | |||||
U.S. government agency obligations | 548,734 | 452,150 | 497,573 | 475,268 | 228,189 | ||||||||||
Obligations of states and political subdivisions | 500 | 1,294 | 1,297 | 1,571 | 4,663 | ||||||||||
Mortgage-backed securities | 406,353 | 499,891 | 537,033 | 453,855 | 371,631 | ||||||||||
Corporate bonds and notes | 451,483 | 484,309 | 519,890 | 469,301 | 172,636 | ||||||||||
Other debt securities | 842 | 834 | 843 | 874 | 32,623 | ||||||||||
Total securities available for sale | $ | 1,413,254 | $ | 1,445,090 | $ | 1,564,433 | $ | 1,452,858 | $ | 813,038 | |||||
The following table shows the maturity distribution of the amortized cost of the Company’s investment securities and weighted average yields of such securities on a fully taxable equivalent basis at December 31, 2005, with comparative totals for 2004. Expected maturities may differ from contractual maturities because borrowers may have the right to call or prepay certain investments:
Within One Year | After One But Within Five Years | After Five But Within Ten Years | After Ten Years | Total | ||||||||||||||||||||||||||
| Amount | Yield(2) | Amount | Yield(2) | Amount | Yield(2) | Amount | Yield(2) | Amount | Yield(2) | |||||||||||||||||||||
| (in thousands) | ||||||||||||||||||||||||||||||
SECURITIESAVAILABLEFORSALE | ||||||||||||||||||||||||||||||
U.S. Treasury securities | $ | 1,999 | 3.44 | % | $ | 3,343 | 3.09 | % | $ | — | — | % | $ | — | — | % | $ | 5,342 | 3.22 | % | ||||||||||
U.S. government agency obligations | 48,604 | 3.55 | 500,113 | 3.66 | 17 | 7.61 | — | — | $ | 548,734 | 3.65 | % | ||||||||||||||||||
Obligations of states and political subdivisions | 3 | 8.79 | 385 | 6.31 | 60 | 8.79 | 52 | 8.79 | 500 | 6.88 | % | |||||||||||||||||||
Mortgage-backed securities(1) | 102,235 | 4.37 | 217,161 | 4.50 | 85,146 | 4.57 | 1,811 | 6.98 | 406,353 | 4.49 | % | |||||||||||||||||||
Corporate bonds and notes | 111,789 | 4.61 | 339,694 | 4.39 | — | — | — | 0.00 | 451,483 | 4.45 | % | |||||||||||||||||||
Other debt securities | 111 | 7.24 | 720 | 4.51 | — | — | 11 | 0.00 | 842 | 4.88 | % | |||||||||||||||||||
Total available for sale | $ | 264,741 | 4.31 | % | $ | 1,061,416 | 4.07 | % | $ | 85,223 | 4.57 | % | $ | 1,874 | 7.03 | % | $ | 1,413,254 | 4.15 | % | ||||||||||
Comparative totals for 2004 | $ | 254,639 | 4.59 | % | $ | 1,059,755 | 4.01 | % | $ | 127,007 | 4.40 | % | $ | 3,689 | 4.82 | % | $ | 1,445,090 | 4.15 | % | ||||||||||
| (1) | Maturities of mortgage-backed securities are based on contractual payments and estimated mortgage loan prepayments. |
| (2) | Tax-equivalent yield computed using a 35% effective tax rate and historical cost balances and does not give effect to changes in fair value. |
31
Table of Contents
The Company evaluates and monitors the credit risk of its investments utilizing a variety of resources including external credit rating agencies (predominantly Moody’s and S&P). The following table shows the rating distribution of the investment portfolio on December 31, 2005 with comparative totals for 2004 (in thousands):
| AAA/ AAA | AA/AA | AA/A | A/A | A/BBB | BAA/ BB | Not rated | TOTAL | |||||||||||||||||
Securities available for sale | ||||||||||||||||||||||||
U.S. Treasury securities | $ | 5,342 | $ | — | $ | — | $ | — | $ | — | $ | — | $ | — | $ | 5,342 | ||||||||
U.S. government agency obligations | 548,734 | — | — | — | — | — | — | 548,734 | ||||||||||||||||
Corporate bonds notes | 19,252 | 39,146 | 127,212 | 255,574 | 8,299 | 2,000 | — | 451,483 | ||||||||||||||||
Mortgage-backed securities | 406,353 | — | — | — | — | — | — | 406,353 | ||||||||||||||||
Other debt securities | — | 1,211 | — | — | — | — | 131 | 1,342 | ||||||||||||||||
Total | $ | 979,681 | $ | 40,357 | $ | 127,212 | $ | 255,574 | $ | 8,299 | $ | 2,000 | $ | 131 | $ | 1,413,254 | ||||||||
Comparative totals for 2004 | $ | 982,626 | $ | 34,296 | $ | 103,301 | $ | 241,944 | $ | 34,499 | $ | 48,298 | $ | 126 | $ | 1,445,090 | ||||||||
Deposits
During 2005, total deposits averaged $5.2 billion, up from $5 billion in 2004. The increase from the prior year-end was primarily attributable to higher levels of demand deposits, and jumbo CDs. The growth in CDs $100,000 and greater is generated by our customers’ desire for higher interest rates as well as their willingness to invest money for longer time periods. Approximately 42% of the Company’s deposit base is comprised of demand deposits, savings and NOW accounts, which had an overall weighted average cost of 27 basis points in 2005. In addition, approximately 32% of the Company’s total deposits are held in CMA/money market accounts that are primarily from its commercial customers with a weighted average cost of 1.46%. The remaining deposits consist of CDs of less than $100,000 and CDs of $100,000 and greater with a weighted average cost of 2.36% and 2.94% respectively, for 2005. The average term at year-end 2005 of the Company’s CDs of less than $100,000 is 11 months and greater than $100,000 is 8 months. The overall cost of deposits, including demand deposits at 0%, in 2005 was 1.23% and the all in cost of funds, was 1.38% compared to 0.74% and 0.84%, respectively, in 2004.
The following table shows average balances of the Company’s deposits for the periods indicated:
| Years Ended December 31, | |||||||||
| 2005 | 2004 | 2003 | |||||||
| (in thousands) | |||||||||
Demands | $ | 921,934 | $ | 882,408 | $ | 793,877 | |||
Savings | 505,177 | 528,480 | 517,003 | ||||||
NOWs | 870,896 | 887,801 | 825,947 | ||||||
CMA/Money Market | 1,561,028 | 1,550,528 | 1,551,136 | ||||||
Certificates of deposit less than $100,000 | 790,968 | 769,222 | 814,089 | ||||||
Certificates of deposit of $100,000 and greater | 554,048 | 338,011 | 256,336 | ||||||
Total deposits | $ | 5,204,051 | $ | 4,956,450 | $ | 4,758,388 | |||
32
Table of Contents
The Company’s ending balances of outstanding certificates of deposit and other time deposits in denominations of $100,000 and over had maturities as follows:
| Years Ended December 31, | |||||||||||||||
| 2005 | 2004 | 2003 | 2002 | 2001 | |||||||||||
| (in thousands) | |||||||||||||||
Three months or less | $ | 226,447 | $ | 182,892 | $ | 130,067 | $ | 126,062 | $ | 119,696 | |||||
Over three months to six months | 108,050 | 73,835 | 38,440 | 54,448 | 42,179 | ||||||||||
Over six months to twelve months | 161,880 | 95,151 | 73,370 | 57,433 | 39,770 | ||||||||||
Over twelve months | 129,305 | 81,722 | 61,782 | 33,748 | 21,828 | ||||||||||
| $ | 625,682 | $ | 433,600 | $ | 303,659 | $ | 271,691 | $ | 223,473 | ||||||
Borrowings
Borrowings and customer repurchase agreements were $227.3 million at December 31, 2005, a decrease of $129.2 million from the end of 2004. During 2005, borrowings averaged $317.8 million, up from $293.6 million in 2004. This funding consists of proceeds from securities sold under agreements to repurchase, Federal Home Loan Bank (FHLB) borrowings, federal funds purchased and the trust-preferred securities. Repurchase agreements averaged $86.7 million for 2005, up from $73.9 million in 2004. FHLB borrowings averaged $52.4 million for 2005, down slightly from $52.9 million in 2004.
On May 21, 2002, a wholly-owned subsidiary of the Company, Chittenden Capital Trust I (the “Trust”), issued $125 million of 8% trust preferred securities (“TPS”) to the public and invested the proceeds from this offering in an equivalent amount of junior subordinated debentures issued by the Company. The TPS pay interest quarterly, are mandatorily redeemable on July 1, 2032 and may be redeemed by the Trust at par any time on or after July 1, 2007. The Company has fully and unconditionally guaranteed the securities issued by the Trust. Concurrent with the issuance of these securities, the Company entered into interest rate swap agreements with two counterparties, in which the Company receives 8% fixed on the notional amount of $125 million, while paying the counterparties a variable rate based on the three month LIBOR (London Interbank Offered Rate), plus approximately 122 basis points. Transaction costs associated with the issuance are amortized on an effective yield basis over five years to the call date. The amortization of these costs add approximately 92 basis points to the overall cost of these borrowings.
Capital Resources
The Company’s capital is the foundation for developing programs for growth and new activities. Total capital at December 31, 2005 was $663 million, an increase of $43 million from December 31, 2004. Net income of $83.4 million increased the Company’s capital position in 2005, while dividend payments of $33.4 million reduced it. The increase in capital was also affected by a decrease in accumulated other comprehensive income which was the result of higher net unrealized losses of $19.0 million on securities available for sale. This amount was partially offset by $11.2 million in proceeds from the issuance of common stock.
The FRB, FDIC and OCC have defined leverage capital requirements, which measure Tier 1 capital (as defined below) against average total assets without regard to risk weighting. Additionally, these regulators have a risk-based capital standard. Under this measure of capital, banks are required to hold more capital against certain assets perceived as higher risk, such as commercial loans, than against other assets perceived as lower risk, such as residential mortgage loans and U.S. Treasury securities. Further, off-balance sheet items such as unfunded loan commitments and standby letters of credit are included for purposes of determining risk-weighted assets. Commercial banking organizations are required to have total capital equal to 8% of risk-weighted assets, and Tier 1 capital—consisting of common stock and certain types of preferred stock, including the TPS, equal to at least 4% of risk-weighted assets. Tier 2 capital, included in total capital, includes the allowance for possible loan losses up to a maximum of 1.25% of risk-weighted assets.
33
Table of Contents
FDIC and OCC regulations pertaining to capital adequacy, which apply to the Banks, require a minimum 3% leverage capital ratio for those institutions with the most favorable composite regulatory examination rating. In addition, a 4% Tier 1 risk-based capital ratio, and an 8% total risk-based capital ratio are required for a bank to be considered adequately capitalized. Leverage, Tier 1 risk-based, and total risk-based capital ratios exceeding 5%, 6%, and 10%, respectively, qualify a bank for the “well-capitalized” designation.
The following table presents the regulatory capital ratios for each subsidiary bank and the Company at December 31, 2005:
| CTC | BWM | FBT | MBT | ONB | COMPANY | |||||||||||||
Leverage | 7.87 | % | 8.95 | % | 8.05 | % | 9.74 | % | 8.44 | % | 9.09 | % | ||||||
Tier 1 Risk-Based | 9.80 | % | 9.76 | % | 10.26 | % | 10.35 | % | 10.18 | % | 11.05 | % | ||||||
Total Risk-Based | 10.96 | % | 11.02 | % | 11.31 | % | 11.60 | % | 11.34 | % | 12.23 | % |
These ratios placed the Banks in the FDIC’s highest capital category of “well capitalized”. Capital ratios in excess of minimum requirements indicate capacity to take advantage of profitable and credit-worthy opportunities as well as the potential to respond to unforeseen adverse conditions.
On March 1, 2005, the Federal Reserve Board adopted a final rule that would retain trust preferred securities in Tier 1 capital of bank holding companies, but with stricter quantitative limits and clearer standards. The final rule provides a five-year transition period, ending March 31, 2009, the aggregate amount of trust preferred securities would be limited to 25 percent of Tier 1 capital elements, net of goodwill. The Company has evaluated the potential impact of such a change on its Tier 1 capital ratio and has concluded that it would remain well capitalized under the new rules.
In June 2004, the central bank governors of the member countries of the Basel Committee approved a revised capital adequacy framework generally known as the “Basel II Framework.” The Basel II Framework is a three-pillar capital adequacy approach versus the flat 8% of risk-weighted assets (as defined) currently used. The Basel II Framework also permits qualifying bank institutions to use more advanced approaches for measuring operational risk and credit risk. In order to address competitive equity issues for community and regional banking organizations that could arise under the bifurcated regulatory capital framework following the implementation of the Basel II Framework, the United States bank regulatory agencies issued an advance notice of proposed rulemaking (ANPR) in October 2005, known as Basel IA, which would make some aspects of the Basel II Framework applicable in modified form to smaller banks. It remains uncertain whether the rules will be adopted and, even it adopted, how closely the final Basel IA rules will resemble the rules described in ANPR and what the effective date of such rules will be.
On October 20, 2005, the Company announced that the Board of Directors authorized the repurchase of up to 1,000,000 shares of the Company’s common stock in negotiated transactions or open market purchases. Chittenden, depending on market conditions, may repurchase its common stock without further Board authorization over the next two years.
34
Table of Contents
The following table presents regulatory capital components and ratios of the Company at:
| December 31, | ||||||||||||||||||||
| 2005 | 2004 | 2003 | 2002 | 2001 | ||||||||||||||||
| (in thousands) | ||||||||||||||||||||
Leverage | ||||||||||||||||||||
Stockholders’ equity | $ | 567,190 | $ | 503,097 | $ | 445,778 | $ | 445,581 | $ | 324,363 | ||||||||||
Total average assets (1) | 6,239,947 | 5,978,058 | 5,720,890 | 4,804,216 | 4,057,839 | |||||||||||||||
| 9.09 | % | 8.42 | % | 7.79 | % | 9.28 | % | 7.99 | % | |||||||||||
Risk-based | ||||||||||||||||||||
Capital components: | ||||||||||||||||||||
Tier 1 | $ | 567,190 | $ | 503,097 | $ | 445,778 | $ | 445,581 | $ | 324,363 | ||||||||||
Tier 2 (2) | 60,461 | 57,949 | 55,359 | 45,509 | 39,357 | |||||||||||||||
Total | $ | 627,651 | $ | 561,046 | $ | 501,137 | $ | 491,090 | $ | 363,720 | ||||||||||
Risk-weighted assets: | ||||||||||||||||||||
On-balance sheet | $ | 4,844,146 | $ | 4,575,988 | $ | 4,199,347 | $ | 3,448,755 | $ | 2,960,493 | ||||||||||
Off-balance sheet | 289,453 | 243,837 | 229,382 | 191,897 | 188,079 | |||||||||||||||
| $ | 5,133,599 | $ | 4,819,825 | $ | 4,428,729 | $ | 3,640,652 | $ | 3,148,572 | |||||||||||
Ratios: | ||||||||||||||||||||
Tier 1 | 11.05 | % | 10.44 | % | 10.07 | % | 12.25 | % | 10.32 | % | ||||||||||
Total (including Tier 2) | 12.23 | 11.64 | 11.32 | 13.50 | 11.57 | |||||||||||||||
Tangible capital | 6.88 | 6.58 | 6.02 | 7.29 | 8.19 | |||||||||||||||
| (1) | Total average assets for the fourth quarter of the respective year. |
| (2) | Allowable portion of allowance for credit losses. |
The components of stockholders’ equity under GAAP that are not considered capital for regulatory purposes include goodwill, accumulated other comprehensive income and directors deferred compensation to be settled in stock.
Liquidity
The measure of an institution’s liquidity is its ability to meet its cash commitments at all times with available cash or by conversion of other assets to cash at a reasonable price. The asset and liability committee, based upon policies approved by the Board of Directors, monitors the Company’s liquidity and rate sensitivity.
The primary source of funding for the parent company is dividends received from the Banks. For the Banks, primary sources of funding include customer deposits, and wholesale funding. The Banks generate significant amounts of low cost funds through their deposit gathering operations. For the year ended December 31, 2005, the Company’s ratio of average loans to average deposits was approximately 82.6%. At December 31, 2005, the Company maintained cash and cash equivalents of approximately $180.7 million, compared with $136.5 million at December 31, 2004. In addition, the Company’s securities available for sale were $1.4 billion at December 31, 2005 with expected cash flow of $264.7 million in 2006 from maturities and normal MBS prepayments.
The Company’s borrowing costs and its ability to raise wholesale funds can be impacted by its credit ratings and changes thereto. Chittenden Corporation’s credit ratings at December 31, 2005:
Agency | Rating | |
| Moody’s | A3 | |
| S&P | BBB (1) | |
| DBRS | A | |
| Fitch | A- |
| (1) | S&P’s rating was increased to BBB+ on February 10, 2006. |
35
Table of Contents
An adverse change in one or more of Chittenden’s credit ratings could inhibit the Company’s ability to raise additional wholesale funds or increase costs related to the Company’s capital raising activities.
The Company has available borrowing capacity under certain programs including the FHLB, U.S. Treasury, repurchase agreement lines, and advised Fed Funds lines totaling more than $813 million as of December 31, 2005. The Company also has an effective shelf registration statement under which an additional $225 million in debt securities, common stock, preferred stock, or warrants may be offered from time to time.
Aggregate Contractual Obligations
Contractual Obligations | Payments due by period | |||||||||||||||
| (in thousands) | ||||||||||||||||
| Total | Less than 1 year | 1-3 years | 3-5 years | More than 5 years | ||||||||||||
FHLB borrowings | $ | 42,445 | $ | 20,065 | (1) | $ | 134 | $ | — | $ | 22,246 | |||||
Trust preferred securities | 125,000 | — | — | — | 125,000 | |||||||||||
Data processing contract | 3,997 | 1,142 | 2,855 | — | — | |||||||||||
Equity investment commitments to limited partnerships | 13,186 | 3,507 | 9,679 | — | — | |||||||||||
Operating leases | 22,644 | 4,987 | 6,917 | 3,307 | 7,433 | |||||||||||
Total | $ | 207,272 | $ | 29,701 | $ | 19,585 | $ | 3,307 | $ | 154,679 | ||||||
Due to recent contributions made in excess of the minimum required amounts, the Company does not anticipate a required pension contribution during 2006. However, it is possible that the Company could make a voluntary contribution during 2006 to respond to changes in pension funding legislation and/or to further improve the plan’s funded status. No pension contributions are reflected beyond 12 months because these depend on a variety of factors that cannot be easily predicted.
| (1) | On January 17, 2006, $20 million of the FHLB borrowings in the less than one-year category were called. |
FINANCIAL INSTRUMENTSWITH OFF-BALANCE SHEET RISK
In the normal course of business, to meet the financing needs of their customers and to reduce their own exposure to fluctuations in interest rates, the Banks are parties to financial instruments with off-balance sheet risk, held for purposes other than trading. The financial instruments involve, to varying degrees, elements of credit and interest rate risk in excess of the amount recognized in the consolidated balance sheets. The Banks’ exposure to credit loss in the event of nonperformance by the other party to the financial instrument, for loan commitments and standby letters of credit, is represented by the contractual amount of those instruments, assuming that the amounts are fully advanced and that collateral or other security is of no value. The Banks use the same credit policies in making commitments and conditional obligations as they do for on-balance sheet loans. The amount of collateral obtained, if deemed necessary by the Banks upon extension of credit, is based on management’s credit evaluation of the borrower. Collateral held varies, but may include accounts receivable, inventory, property, plant and equipment, and income-producing commercial properties.
Commitments to originate loans, unused lines of credit, and unadvanced portions of commercial real estate and construction loans are agreements to lend to a customer provided there is no violation of any condition established in the contract. Commitments generally have fixed expiration dates or other termination clauses and may require payment of a fee. Many of the commitments are expected to expire without being drawn upon. Therefore, the amounts presented below do not necessarily represent future cash requirements.
Standby letters of credit are conditional commitments issued by the Banks to guarantee the performance by a customer to a third party. These guarantees are issued primarily to support public and private borrowing
36
Table of Contents
arrangements, bond financings, and similar transactions. The credit risk involved in issuing letters of credit is essentially the same as that involved in extending loan commitments to customers.
Financial instruments whose contractual amounts represent off-balance sheet risk at December 31, 2005 and 2004 are as follows:
| 2005 | 2004 | |||||
| (in thousands) | ||||||
Loans and Other Commitments | ||||||
Commitments to originate new loans | $ | 120,635 | $ | 204,193 | ||
Unused home equity lines of credit | 365,040 | 313,526 | ||||
Unused portions of business credit card lines | 55,393 | 39,921 | ||||
Unadvanced portions of commercial & industrial loans | 435,697 | 420,758 | ||||
Unadvanced portions of commercial real estate and construction loans | 245,523 | 173,878 | ||||
Equity investment commitments to limited partnerships | 13,186 | 4,785 | ||||
Standby Letters of Credit | ||||||
Notional amount of standby letters of credit fully collateralized by cash | 65,345 | 71,880 | ||||
Notional amount of other standby letters of credit | 32,430 | 29,938 | ||||
Liability associated with letters of credit recorded on balance sheet | 669 | 510 | ||||
Results of Operations
Comparison of Years Ended December 31, 2005 and 2004
Net Interest Income
Net interest income is the amount by which interest income on interest earning assets exceeds interest paid on interest bearing liabilities. Fluctuations in interest rates, as well as changes in the amount and type of interest earning assets and interest bearing liabilities, combine to affect net interest income.
For 2005, net interest income was $244.3 million, up $18.8 million from the 2004 level. On a fully tax equivalent basis, net interest income increased $19.5 million from 2004, to $246.4 million in 2005. The net yield on earnings assets was 4.31%, an increase of 10 basis points from 2004. The increase in the net yield on earning assets from 2004 was primarily attributable to higher yields on loans driven by increases in the prime rate, as well as continued improvement in the Company’s asset mix which was partially offset by higher funding costs.
37
Table of Contents
The following table presents an analysis of average rates and yields on a fully taxable equivalent basis for the years indicated:
| 2005 | 2004 | 2003 | ||||||||||||||||||||||||||||
| Average Balance | Interest Income/ Expense (1) | Average Yield/ Rate (1) | Average Balance | Interest Income/ Expense (1) | Average Yield/ Rate (1) | Average Balance | Interest Income/ Expense (1) | Average Yield/ Rate (1) | ||||||||||||||||||||||
| (in thousands) | ||||||||||||||||||||||||||||||
Assets | ||||||||||||||||||||||||||||||
Interest-earning assets: | ||||||||||||||||||||||||||||||
Loans | ||||||||||||||||||||||||||||||
Commercial & industrial | $ | 826,073 | $ | 54,591 | 6.61 | % | $ | 726,467 | $ | 39,635 | 5.46 | % | $ | 619,658 | $ | 34,101 | 5.50 | % | ||||||||||||
Municipal | 127,476 | 5,219 | 4.09 | 98,462 | 3,070 | 3.12 | 89,974 | 2,937 | 3.26 | |||||||||||||||||||||
Commercial real estate | 1,700,160 | 105,991 | 6.23 | 1,510,458 | 82,914 | 5.49 | 1,308,792 | 73,086 | 5.58 | |||||||||||||||||||||
Construction | 159,838 | 10,296 | 6.35 | 142,764 | 7,568 | 5.30 | 117,293 | 6,539 | 5.57 | |||||||||||||||||||||
Residential real estate (4) | 1,234,922 | 73,024 | 5.90 | 1,174,944 | 62,231 | 5.30 | 1,218,033 | 64,981 | 5.33 | |||||||||||||||||||||
Consumer | 252,614 | 14,297 | 5.66 | 247,847 | 15,014 | 6.06 | 271,109 | 18,909 | 6.97 | |||||||||||||||||||||
Total loans | 4,301,083 | 263,418 | 6.12 | 3,900,942 | 210,432 | 5.39 | 3,624,859 | 200,553 | 5.53 | |||||||||||||||||||||
Investments: | ||||||||||||||||||||||||||||||
Taxable | 1,393,446 | 58,177 | 4.18 | 1,475,016 | 60,361 | 4.09 | 1,660,119 | 71,552 | 4.31 | |||||||||||||||||||||
Tax-favored | 1,110 | 69 | 6.22 | 3,973 | 164 | 4.13 | 9,569 | 231 | 2.42 | |||||||||||||||||||||
Interest-bearing deposits | 211 | 5 | 2.33 | 150 | 2 | 1.21 | 182 | 3 | 1.91 | |||||||||||||||||||||
Federal funds sold | 16,633 | 644 | 3.87 | 13,007 | 181 | 1.39 | 27,112 | 291 | 1.07 | |||||||||||||||||||||
Total interest-earning assets | 5,712,483 | 322,313 | 5.64 | 5,393,088 | 271,140 | 5.03 | 5,321,841 | 272,630 | 5.12 | |||||||||||||||||||||
Noninterest-earning assets | 564,886 | 560,855 | 512,233 | |||||||||||||||||||||||||||
Allowance for loan losses | (60,877 | ) | (58,223 | ) | (56,536 | ) | ||||||||||||||||||||||||
Total assets | $ | 6,216,492 | $ | 5,895,720 | $ | 5,777,538 | ||||||||||||||||||||||||
Interest-bearing liabilities: | ||||||||||||||||||||||||||||||
Savings | $ | 505,177 | 2,203 | 0.44 | $ | 528,480 | 1,654 | 0.31 | $ | 517,003 | 2,121 | 0.41 | ||||||||||||||||||
NOWs | 870,896 | 4,081 | 0.47 | 887,801 | 2,465 | 0.28 | 825,947 | 3,121 | 0.38 | |||||||||||||||||||||
CMA / Money Market | 1,561,028 | 22,728 | 1.46 | 1,550,528 | 11,498 | 0.74 | 1,551,136 | 13,333 | 0.86 | |||||||||||||||||||||
CDs under $100,000 | 790,968 | 18,636 | 2.36 | 769,222 | 14,554 | 1.89 | 814,089 | 17,798 | 2.19 | |||||||||||||||||||||
CDs $100,000 and over | 554,048 | 16,278 | 2.94 | 338,011 | 6,268 | 1.85 | 256,336 | 4,799 | 1.87 | |||||||||||||||||||||
Total interest-bearing deposits | 4,282,117 | 63,926 | 1.49 | 4,074,042 | 36,439 | 0.89 | 3,964,511 | 41,172 | 1.04 | |||||||||||||||||||||
Repurchase agreements | 86,701 | 1,498 | 1.73 | 73,860 | 618 | 0.84 | 97,508 | 1,383 | 1.42 | |||||||||||||||||||||
Borrowings | 231,076 | 10,505 | 4.55 | 219,723 | 7,212 | 3.28 | 315,831 | 10,824 | 3.43 | |||||||||||||||||||||
Total interest-bearing liabilities | 4,599,894 | 75,929 | 1.65 | 4,367,625 | 44,269 | 1.01 | 4,377,850 | 53,379 | 1.22 | |||||||||||||||||||||
Noninterest-bearing liabilities: | ||||||||||||||||||||||||||||||
Demands | 921,934 | 882,408 | 793,877 | |||||||||||||||||||||||||||
Other liabilities | 58,410 | 53,994 | 67,594 | |||||||||||||||||||||||||||
Total liabilities | 5,580,238 | 5,304,027 | 5,239,321 | |||||||||||||||||||||||||||
Stockholders’ equity | 636,254 | 591,693 | 538,217 | |||||||||||||||||||||||||||
Total liabilities and stockholders’ equity | $ | 6,216,492 | $ | 5,895,720 | $ | 5,777,538 | ||||||||||||||||||||||||
Net interest income | $ | 246,384 | $ | 226,871 | $ | 219,251 | ||||||||||||||||||||||||
Interest rate spread (2) | 3.99 | % | 4.02 | % | 3.90 | % | ||||||||||||||||||||||||
Net yield on earning assets (3) | 4.31 | % | 4.21 | % | 4.12 | % | ||||||||||||||||||||||||
| (1) | On a fully taxable equivalent basis using a Federal income tax rate of 35%. Loan income includes fees. |
| (2) | Interest rate spread is the average rate earned on total interest-earning assets less the average rate paid on interest-bearing liabilities. |
| (3) | Net yield on earning assets is net interest income divided by total interest-earning assets. |
| (4) | Residential real estate includes 1-4 family, multi-family, home equity loans and loans held for sale. |
38
Table of Contents
The following table attributes changes in the Company’s net interest income (on a fully taxable equivalent basis) to changes in either average balances or average rates. Changes due to both interest rate and volume have been allocated to change due to balance and change due to rate in proportion to the relationship of the absolute dollar amounts of the change in each.
| 2005 Compared With 2004 | 2004 Compared With 2003 | ||||||||||||||||||||||
| Increase (Decrease) Due to Change in Net Interest Income: | Total Increase | Increase (Decrease) Due to Change in Net Interest Income: | Total Increase | ||||||||||||||||||||
| Average Rate | Average Balance | Average Rate | Average Balance | ||||||||||||||||||||
| (in thousands) | |||||||||||||||||||||||
Interest income: | |||||||||||||||||||||||
Loans | |||||||||||||||||||||||
Commercial & industrial | $8,392 | $ | 6,564 | $ | 14,956 | ($293 | ) | $ | 5,827 | $ | 5,534 | ||||||||||||
Municipal | 961 | 1,188 | 2,149 | (126 | ) | 259 | 133 | ||||||||||||||||
Commercial real estate | 11,300 | 11,777 | 23,077 | (1,242 | ) | 11,070 | 9,828 | ||||||||||||||||
Construction | 1,662 | 1,066 | 2,728 | (321 | ) | 1,350 | 1,029 | ||||||||||||||||
Residential real estate | 7,256 | 3,537 | 10,793 | (468 | ) | (2,282 | ) | (2,750 | ) | ||||||||||||||
Consumer | (969 | ) | 252 | (717 | ) | (2,486 | ) | (1,409 | ) | (3,895 | ) | ||||||||||||
Total loans | 28,602 | 24,384 | 52,986 | (4,936 | ) | 14,815 | 9,879 | ||||||||||||||||
Investments: | |||||||||||||||||||||||
Taxable | 1,279 | (3,463 | ) | (2,184 | ) | (3,618 | ) | (7,573 | ) | (11,191 | ) | ||||||||||||
Tax-favored | 83 | (178 | ) | (95 | ) | 164 | (231 | ) | (67 | ) | |||||||||||||
Interest-bearing deposits | 2 | 1 | 3 | (1 | ) | — | (1 | ) | |||||||||||||||
Federal funds sold | 323 | 140 | 463 | 86 | (196 | ) | (110 | ) | |||||||||||||||
Total interest income | 30,289 | 20,884 | 51,173 | (8,305 | ) | 6,815 | (1,490 | ) | |||||||||||||||
Interest expense: | |||||||||||||||||||||||
Deposits: | |||||||||||||||||||||||
Savings | (645 | ) | 96 | (549 | ) | 503 | (36 | ) | 467 | ||||||||||||||
NOW s | (1,685 | ) | 69 | (1,616 | ) | 828 | (172 | ) | 656 | ||||||||||||||
CMA / Money market | (11,014 | ) | (216 | ) | (11,230 | ) | 1,830 | 5 | 1,835 | ||||||||||||||
CDs under $100,000 | (3,517 | ) | (565 | ) | (4,082 | ) | 2,395 | 849 | 3,244 | ||||||||||||||
CDs of $100,000 and over | (3,601 | ) | (6,409 | ) | (10,010 | ) | 46 | (1,515 | ) | (1,469 | ) | ||||||||||||
Total deposits | (20,462 | ) | (7,025 | ) | (27,487 | ) | 5,602 | (869 | ) | 4,733 | |||||||||||||
Repurchase agreements | (653 | ) | (227 | ) | (880 | ) | 567 | 198 | 765 | ||||||||||||||
Borrowings | (2,747 | ) | (546 | ) | (3,293 | ) | 457 | 3,155 | 3,612 | ||||||||||||||
Total interest expense | (23,862 | ) | (7,798 | ) | (31,660 | ) | 6,626 | 2,484 | 9,110 | ||||||||||||||
Change in net interest income | $ | 6,427 | $ | 13,086 | $ | 19,513 | ($1,679 | ) | $ | 9,299 | $ | 7,620 | |||||||||||
Noninterest Income and Noninterest Expense
Noninterest income for the year ended December 31, 2005 was $69.9 million, a decline of $3.4 million from the prior year. The decline was a result of lower investment management and trust income, lower service charges on deposits and lower levels of gains on sales of securities, net of losses on prepayments of borrowings. Partially offsetting these declines were higher mortgage servicing and other income. Investment management and trust income declined $1.6 million from 2004 primarily due to lower annuity sales. Service charges on deposits declined $1.8 million due to lower overdraft fee income from our customers. Mortgage servicing income was $1.7 million higher in 2005 than in 2004, driven primarily by lower amortization of $3.1 million.
In 2005, noninterest expenses were $178.7 million, up $2.3 million from 2004. Higher salary expenses, net occupancy expenses, and other expenses were offset by lower data processing and conversion and restructuring
39
Table of Contents
charges. Salary expense increased due to higher incentive accruals of $5.0 million. Net occupancy expense increased from 2004 due to higher utility and property expenses as well as the opening of new branches in Westborough, Massachusetts and Manchester, New Hampshire. Increases in other noninterest expense were related to higher legal and accounting, and education & training. Data processing expenses declined $2.7 million from 2004 due to efficiencies gained from the conversion of the Company’s core data processing platform in mid-2004.
The components of other noninterest expense for the years presented are as follows:
| 2005 | 2004 | 2003 | 2002 | 2001 | |||||||||||||||
| (in thousands) | |||||||||||||||||||
Legal and accounting | $ | 3,631 | $ | 2,695 | $ | 3,105 | $ | 1,864 | $ | 2,187 | |||||||||
Marketing | 3,247 | 3,466 | 3,282 | 2,942 | 2,746 | ||||||||||||||
Software and supplies | 7,344 | 7,845 | 7,288 | 4,924 | 4,884 | ||||||||||||||
Net OREO and collection expenses | (51 | ) | (617 | ) | (129 | ) | (293 | ) | 86 | ||||||||||
Telephone | 2,438 | 2,829 | 3,210 | 3,071 | 2,799 | ||||||||||||||
Postage | 2,454 | 2,865 | 3,009 | 2,561 | 2,338 | ||||||||||||||
Outside services | 2,101 | 2,430 | 2,308 | 2,433 | 2,355 | ||||||||||||||
Other | 17,633 | 14,082 | 14,932 | 13,688 | 11,377 | ||||||||||||||
| $ | 38,797 | $ | 35,595 | $ | 37,005 | $ | 31,190 | $ | 28,772 | ||||||||||
Income Taxes
The Company and the Banks are taxed on income by the IRS at the Federal level and by various states in which they do business. The State of Vermont levies franchise taxes on banking institutions based upon average deposit levels in lieu of taxing income. Franchise taxes are included in income tax expense in the consolidated statements of operations.
Income Tax Provision
For the years ended December 31, 2005 and 2004, Federal and state income tax provisions amounted to $47.0 million and $43.0 million, respectively. The effective tax rates for the respective periods were 36.1% and 36.4%. During both periods, the Company’s statutory Federal corporate tax rate was 35%. The Company’s effective tax rates differed from the statutory rates primarily because of state income taxes, net of benefit on Federal taxes, interest income from state and municipal securities and loans which are partially exempt from Federal taxation, and tax credits on investments in qualified low income housing projects. The Company invests in these partnerships primarily for CRA purposes.
Tax returns filed by the Company are subject to periodic examinations by various federal and state governmental tax authorities. During 2005, two such examinations were completed. The impact of the examinations on income tax expense in 2005 was not material.
Results of Operations
Comparison of Years Ended December 31, 2004 and 2003
Net Interest Income
For 2004, net interest income was $225.5 million, up $7.4 million from the 2003 level. On a fully tax equivalent basis, net interest income increased $7.6 million from 2003, to $226.9 million in 2004. The yield on earning assets was 4.21%, an increase of 9 basis points from 2003. The increase in the net yield on earning assets from 2003 was primarily attributable to 1) increases totaling 1.25% during 2004 in the Fed funds rate by the
40
Table of Contents
Federal Reserve which led to corresponding increases in the Company’s prime rate and 2) an improvement in the Company’s earning asset mix with proportionally fewer investments and more loans.
Noninterest Income and Noninterest Expense
Noninterest income for the year ended December 31, 2004, was $73.4 million, a decline of $23.6 million from the prior year. Lower levels of gains on sales of securities and mortgage loans, net of lower losses on prepayments of borrowings, accounted for the majority of the variance. Excluding these items, noninterest income was $1.6 million higher in 2004 than in 2003, driven primarily by higher levels of investment management income, which offset lower levels of retail investment income. Also included in the 2004 other income amount was $1.3 million in gains on sales of two branches.
In 2004, noninterest expenses were $15 million lower than in 2003, primarily driven by $6.7 million in reduced conversion and restructuring charges. An additional $4.8 million was due to reduced salary expenses, driven by lower staffing and reduced levels of incentive compensation. Lower levels of data processing expenses also accounted for $3.2 million of the decline. Increased employee benefits costs, driven by higher medical and dental benefits of $699,000, were offset by reduced levels of occupancy expenses of $587,000 and other noninterest expenses of $1.4 million.
Income Taxes
For the years ended December 31, 2004 and 2003, Federal and state income tax provisions amounted to $43.0 million and $41.7 million, respectively. The effective tax rates for the respective periods were 36.4% and 35.8%. During both periods, the Company’s statutory Federal corporate tax rate was 35%. The Company’s effective tax rates differed from the statutory rates primarily because of state income taxes paid, net of benefit on Federal taxes, and the proportion of interest income from state and municipal securities and loans which are partially exempt from Federal taxation, and tax credits on investments in qualified low income housing projects.
ITEM 7A. QUALITATIVE AND QUANTITATIVE DISCLOSURES ABOUT MARKET RISK
Market risk is the sensitivity of income to changes in interest rates, foreign exchange rates, commodity prices, equity prices, and other market-driven rates or prices. Since the Company has no trading operations, risks associated with foreign exchange rates, commodity prices, and equity prices are not significant. Interest rate risk, including mortgage prepayment risk, is the single most significant non-credit risk to which the Company is exposed.
To measure the sensitivity of its income to changes in interest rates, the Company uses a variety of methods, including simulation, and gap analyses. Interest rate risk is the sensitivity of income to variations in interest rates over both short-term and long-term horizons. The primary goal of interest-rate risk management is to control this risk within limits approved by the Board of Directors, which reflect the Company’s tolerance for interest-rate risk. The Company attempts to control interest-rate risk by identifying exposures, quantifying them and taking appropriate actions.
The Company uses simulation analyses to measure the exposure of net interest income to changes in interest rates over a relatively short (i.e., within one year) time horizon. Simulation analysis incorporates what management believes to be the most appropriate assumptions about customer and competitor behavior in the specified interest rate scenario. These assumptions are the basis for projecting future interest income and expense from the Company’s assets and liabilities under various scenarios. Simulation analysis may have certain limitations caused by market conditions varying from those assumed in a model. Actual results can often differ due to the effects of prepayments and refinancings of loans and investments, as well as the repricing or runoff of deposits, which may be different from that which has been assumed.
The Company’s limits on interest-rate risk specify that if interest rates were to shift immediately, up or down 200 basis points, estimated net interest income for the next twelve months should not be impacted by
41
Table of Contents
greater than 10%. An additional analysis is performed to review results if interest rates were to shift quarterly, (ramped) up or down 100 and 200 basis points over a twelve-month period. The results of these simulations are shown below:
Interest Rate Sensitivity Analysis
As of December 31, 2005
($ in thousands)
Immediate Net Interest | Ramped Net Interest | |||||||
Changes in interest rates | Changes in interest rates | |||||||
+ 200 bps | 1.52 | % | +50 bps | 0.38 | % | |||
+ 100 bps | 0.83 | +25 bps | 0.20 | |||||
- 100 bps | (1.02 | ) | -25 bps | (0.23 | ) | |||
- 200 bps | (2.78 | ) | -50 bps | (0.57 | ) | |||
Policy Limit | +/-10.00 | % | Policy Limit | — |
As noted above, one of the tools used to measure rate sensitivity is gap analysis. The gap is defined as the amount by which a bank’s rate sensitive assets exceed its rate sensitive liabilities. A positive gap exists when rate sensitive assets exceed rate sensitive liabilities. This indicates that a greater volume of assets than liabilities will reprice during a given period. This mismatch will improve earnings in a rising rate environment and inhibit earnings when rates decline. Conversely, when rate sensitive liabilities exceed rate sensitive assets, the gap is referred to as negative. In this case, a rising rate environment will inhibit earnings and declining rates will improve earnings. Notwithstanding this general description of the effect on net interest income of the gap position, it may not be an accurate predictor of changes in net interest income. The Company’s limits on interest-rate risk specify that the cumulative one-year gap should be less than 10% of total assets.
The following table shows the amounts of interest-earning assets and interest-bearing liabilities at December 31, 2005 that reprice during the periods indicated:
| Repricing Date | |||||||||||||||||||
| One Day To Six Months | Over Six Months To One Year | Over One Year To Five Years | Over Five Years | Total | |||||||||||||||
| (in thousands) | |||||||||||||||||||
Interest-earning assets: | |||||||||||||||||||
Loans (1) | $ | 2,140,071 | $ | 515,186 | $ | 1,663,992 | $ | 187,978 | $ | 4,507,227 | |||||||||
Investment securities (2) | 107,293 | 143,643 | 1,058,124 | 93,360 | 1,402,420 | ||||||||||||||
Interest-bearing cash equivalents | 15,251 | 61 | 820 | 0 | 16,132 | ||||||||||||||
Total interest-earning assets | 2,262,615 | 658,890 | 2,722,936 | 281,338 | 5,925,779 | ||||||||||||||
Interest-bearing liabilities: | |||||||||||||||||||
Deposits | 2,554,449 | 418,840 | 607,072 | 960,222 | 4,540,583 | ||||||||||||||
Borrowings | 204,831 | 32 | 345 | 22,115 | 227,323 | ||||||||||||||
Total interest-bearing liabilities | 2,759,280 | 418,872 | 607,417 | 982,337 | 4,767,906 | ||||||||||||||
Net interest rate sensitivity gap | ($496,665 | ) | $ | 240,018 | $ | 2,115,519 | ($700,999 | ) | $ | 1,157,873 | |||||||||
Cumulative gap at December 31, 2005 | ($496,665 | ) | ($256,647 | ) | $ | 1,858,872 | $ | 1,157,873 | |||||||||||
Cumulative gap as a % of total assets | (7.68 | %) | (3.97 | %) | 28.75 | % | 17.91 | % | |||||||||||
Cumulative gap at December 31, 2004 | ($253,813 | ) | $ | 83,403 | $ | 1,872,898 | $ | 1,072,576 | |||||||||||
Cumulative gap as a % of total assets | (4.18 | %) | 1.37 | % | 30.85 | % | 17.66 | % | |||||||||||
| (1) | Loans include loans held for sale. |
| (2) | Amounts are based on amortized cost balances. Total includes securities available for sale and FRB / FHLB stock. |
42
Table of Contents
The following table shows scheduled maturities of selected loans at December 31, 2005:
| Less Than One Year | One Year To Five Years | Over Five Years | Total | |||||||||
| (in thousands) | ||||||||||||
Predetermined rates: | ||||||||||||
Commercial (1) | $ | 221,960 | $ | 145,237 | $ | 38,565 | $ | 405,762 | ||||
Commercial real estate and construction | 90,570 | 487,965 | 224,512 | 803,047 | ||||||||
Total | $ | 312,530 | $ | 633,202 | $ | 263,077 | $ | 1,208,809 | ||||
Comparative totals for 2004 | $ | 253,169 | $ | 480,074 | $ | 183,420 | $ | 916,663 | ||||
Floating or adjustable rates: | ||||||||||||
Commercial (1) | $ | 279,736 | $ | 226,802 | $ | 96,477 | $ | 603,015 | ||||
Commercial real estate and construction | 226,012 | 579,747 | 558,151 | 1,363,910 | ||||||||
Total | $ | 505,748 | $ | 806,549 | $ | 654,628 | $ | 1,966,925 | ||||
Comparative totals for 2004 | $ | 436,577 | $ | 866,106 | $ | 635,424 | $ | 1,938,107 | ||||
| (1) | Includes commercial, municipal and multi-family. |
43
Table of Contents
ITEM 8 FINANCIAL STATEMENTS AND SUPPLEMENTARY DATA
CHITTENDEN CORPORATION
CONSOLIDATED BALANCE SHEETS
| December 31, | ||||||||
| 2005 | 2004 | |||||||
| (in thousands) | ||||||||
Assets | ||||||||
Cash and cash equivalents | $ | 180,707 | $ | 136,468 | ||||
Securities available for sale | 1,383,909 | 1,446,221 | ||||||
FRB and FHLB stock | 19,352 | 19,243 | ||||||
Loans held for sale | 19,737 | 33,535 | ||||||
Loans | 4,487,490 | 4,077,193 | ||||||
Less: Allowance for loan losses | (60,822 | ) | (59,031 | ) | ||||
Net loans | 4,426,668 | 4,018,162 | ||||||
Accrued interest receivable | 32,621 | 28,956 | ||||||
Other assets | 84,511 | 64,970 | ||||||
Premises and equipment, net | 69,731 | 74,271 | ||||||
Mortgage servicing rights | 13,741 | 11,826 | ||||||
Identified intangibles | 17,655 | 20,422 | ||||||
Goodwill | 216,038 | 216,136 | ||||||
Total assets | $ | 6,464,670 | $ | 6,070,210 | ||||
Liabilities and Stockholders’ Equity | ||||||||
LIABILITIES: | ||||||||
Deposits: | ||||||||
Demand | $ | 973,752 | $ | 890,561 | ||||
Savings | 489,734 | 519,623 | ||||||
NOW | 861,000 | 890,701 | ||||||
Cash management / money market | 1,749,878 | 1,577,474 | ||||||
Certificates of deposit less than $100,000 | 814,289 | 735,577 | ||||||
Certificates of deposit $100,000 and over | 625,682 | 424,794 | ||||||
Total deposits | 5,514,335 | 5,038,730 | ||||||
Securities sold under agreements to repurchase | 56,315 | 76,716 | ||||||
Other borrowings | 171,008 | 279,755 | ||||||
Accrued expenses and other liabilities | 60,488 | 54,752 | ||||||
Total liabilities | 5,802,146 | 5,449,953 | ||||||
STOCKHOLDERS’ EQUITY: | ||||||||
Preferred stock—$100 par value—authorized: 1,000,000 shares—issued and outstanding: none | — | — | ||||||
Common stock—$1 par value—authorized: 120,000,000 shares—issued and outstanding: 50,219,825 in 2005 and 50,203,529 in 2004 | 50,220 | 50,204 | ||||||
Surplus | 251,853 | 249,036 | ||||||
Retained earnings | 434,616 | 384,679 | ||||||
Treasury stock, at cost—3,390,777 shares in 2005 and 3,861,710 shares in 2004 | (60,801 | ) | (69,246 | ) | ||||
Accumulated other comprehensive income | (18,968 | ) | 672 | |||||
Directors’ deferred compensation to be settled in stock | 5,604 | 4,930 | ||||||
Unearned portion of employee restricted stock | — | (18 | ) | |||||
Total stockholders’ equity | 662,524 | 620,257 | ||||||
Total liabilities and stockholders’ equity | $ | 6,464,670 | $ | 6,070,210 | ||||
The accompanying notes are an integral part of these consolidated financial statements.
44
Table of Contents
CHITTENDEN CORPORATION
CONSOLIDATED STATEMENTS OF INCOME
| Years Ended December 31, | |||||||||||
| 2005 | 2004 | 2003 | |||||||||
| (in thousands, except per share amounts) | |||||||||||
INTERESTINCOME: | |||||||||||
Interest on loans | $ | 261,359 | $ | 209,107 | $ | 199,436 | |||||
Interest on investment securities: | |||||||||||
Taxable | 58,177 | 60,413 | 71,551 | ||||||||
Tax-favored | 45 | 53 | 162 | ||||||||
Short-term investments | 661 | 194 | 293 | ||||||||
Total interest income | 320,242 | 269,767 | 271,442 | ||||||||
INTERESTEXPENSE: | |||||||||||
Deposits | 63,926 | 36,439 | 41,172 | ||||||||
Borrowings | 12,003 | 7,830 | 12,207 | ||||||||
Total interest expense | 75,929 | 44,269 | 53,379 | ||||||||
Net interest income | 244,313 | 225,498 | 218,063 | ||||||||
Provision for credit losses | 5,154 | 4,377 | 7,175 | ||||||||
Net interest income after provision for credit losses | 239,159 | 221,121 | 210,888 | ||||||||
NONINTERESTINCOME: | |||||||||||
Investment management and trust | 20,017 | 21,622 | 20,577 | ||||||||
Service charges on deposits | 16,113 | 17,886 | 18,396 | ||||||||
Mortgage servicing | 1,829 | 159 | 281 | ||||||||
Gains on sales of loans, net | 9,021 | 9,661 | 21,765 | ||||||||
Gains on sales of securities | 6 | 2,335 | 17,380 | ||||||||
Loss on prepayments of borrowings | — | (1,194 | ) | (3,070 | ) | ||||||
Credit card income, net | 4,536 | 4,150 | 4,079 | ||||||||
Insurance commissions, net | 6,365 | 6,966 | 6,686 | ||||||||
Other | 12,077 | 11,820 | 10,937 | ||||||||
Total noninterest income | 69,964 | 73,405 | 97,031 | ||||||||
NONINTERESTEXPENSE: | |||||||||||
Salaries | 87,374 | 84,619 | 89,431 | ||||||||
Employee benefits | 22,218 | 21,958 | 20,578 | ||||||||
Net occupancy expense | 24,094 | 22,669 | 23,256 | ||||||||
Data processing | 3,457 | 6,188 | 9,384 | ||||||||
Amortization of intangibles | 2,768 | 3,077 | 2,748 | ||||||||
Conversion and restructuring charges | — | 2,266 | 8,969 | ||||||||
Other | 38,797 | 35,595 | 37,005 | ||||||||
Total noninterest expense | 178,708 | 176,372 | 191,371 | ||||||||
Income before income taxes | 130,415 | 118,154 | 116,548 | ||||||||
Income tax expense | 47,024 | 43,027 | 41,749 | ||||||||
Net income | $ | 83,391 | $ | 75,127 | $ | 74,799 | |||||
Basic earnings per share | $ | 1.79 | $ | 1.63 | $ | 1.67 | |||||
Diluted earnings per share | 1.77 | 1.61 | 1.66 | ||||||||
Dividends per share | 0.72 | 0.70 | 0.64 | ||||||||
Weighted average common shares outstanding | 46,503 | 46,106 | 44,720 | ||||||||
Weighted average common and common equivalent shares outstanding | 47,051 | 46,731 | 45,150 | ||||||||
The accompanying notes are an integral part of these consolidated financial statements.
45
Table of Contents
CHITTENDEN CORPORATION
CONSOLIDATED STATEMENTS OF CHANGES IN STOCKHOLDERS’ EQUITY
AND COMPREHENSIVE INCOME
Years ended December 31, 2005, 2004 and 2003
(In thousands)
Comp- rehensive Income | Common Stock | Surplus | Retained Earnings | Treasury Stock | Accum- ulated Other rehensive Income | Directors’ Deferred Comp. Stock | Unearned Portion of Employee Restricted Stock | Total Stock- holders’ Equity | ||||||||||||||||||||||||||
BALANCEAT DECEMBER 31, 2002 | $ | 44,686 | $ | 136,254 | $ | 294,943 | $ | (85,382 | ) | $ | 24,289 | $ | 4,052 | $ | (50 | ) | $ | 418,792 | ||||||||||||||||
Comprehensive income: | ||||||||||||||||||||||||||||||||||
Net income | $ | 74,799 | — | — | 74,799 | — | — | — | — | 74,799 | ||||||||||||||||||||||||
Other comprehensive income (Note 9) | (8,694 | ) | — | — | — | — | (8,694 | ) | — | — | (8,694 | ) | ||||||||||||||||||||||
Total comprehensive income | $ | 66,105 | ||||||||||||||||||||||||||||||||
Cash dividends ($0.64 per share) | — | — | (28,301 | ) | — | — | — | — | (28,301 | ) | ||||||||||||||||||||||||
Shares issued under stock plans, net | 9 | 241 | — | 6,803 | — | (15 | ) | — | 7,038 | |||||||||||||||||||||||||
Shares issued in Granite acquisition | 5,483 | 110,443 | — | — | — | — | — | 115,926 | ||||||||||||||||||||||||||
Amortization of restricted stock | — | — | — | — | — | — | 15 | 15 | ||||||||||||||||||||||||||
Directors’ deferred compensation | — | — | — | — | — | 376 | — | 376 | ||||||||||||||||||||||||||
BALANCEAT DECEMBER 31, 2003 | 50,178 | 246,938 | 341,441 | (78,579 | ) | 15,595 | 4,413 | (35 | ) | 579,951 | ||||||||||||||||||||||||
Comprehensive Income: | ||||||||||||||||||||||||||||||||||
Net income | $ | 75,127 | — | — | 75,127 | — | — | — | — | 75,127 | ||||||||||||||||||||||||
Other comprehensive income (Note 9) | (14,923 | ) | — | — | — | — | (14,923 | ) | — | — | (14,923 | ) | ||||||||||||||||||||||
Total comprehensive income | $ | 60,204 | ||||||||||||||||||||||||||||||||
Cash dividends ($0.70 per share) | — | — | (31,889 | ) | — | — | — | — | (31,889 | ) | ||||||||||||||||||||||||
Shares issued under stock plans, net | 26 | 2,098 | — | 9,333 | — | (16 | ) | 2 | 11,443 | |||||||||||||||||||||||||
Amortization of restricted stock | — | — | — | — | — | — | 15 | 15 | ||||||||||||||||||||||||||
Directors’ deferred compensation | — | — | — | — | — | 533 | — | 533 | ||||||||||||||||||||||||||
BALANCEAT DECEMBER 31, 2004 | 50,204 | 249,036 | 384,679 | (69,246 | ) | 672 | 4,930 | (18 | ) | 620,257 | ||||||||||||||||||||||||
Comprehensive income: | ||||||||||||||||||||||||||||||||||
Net income | $ | 83,391 | — | — | 83,391 | — | — | — | — | 83,391 | ||||||||||||||||||||||||
Other comprehensive income (Note 9) | (19,640 | ) | — | — | — | — | (19,640 | ) | — | — | (19,640 | ) | ||||||||||||||||||||||
Total comprehensive income | $ | 63,751 | ||||||||||||||||||||||||||||||||
Cash dividends ($0.72 per share) | — | — | (33,454 | ) | — | — | — | — | (33,454 | ) | ||||||||||||||||||||||||
Shares issued under stock plans, net | 16 | 2,817 | — | 8,445 | — | — | — | 11,278 | ||||||||||||||||||||||||||
Amortization of restricted stock | — | — | — | — | — | — | 18 | 18 | ||||||||||||||||||||||||||
Directors’ deferred compensation | — | — | — | — | — | 674 | — | 674 | ||||||||||||||||||||||||||
BALANCEAT DECEMBER 31, 2005 | $ | 50,220 | $ | 251,853 | $ | 434,616 | $ | (60,801 | ) | $ | (18,968 | ) | $ | 5,604 | $ | — | $ | 662,524 | ||||||||||||||||
The accompanying notes are an integral part of these consolidated financial statements.
46
Table of Contents
CHITTENDEN CORPORATION
CONSOLIDATED STATEMENTS OF CASH FLOWS
| Years Ended December 31, | ||||||||||||
| 2005 | 2004 | 2003 | ||||||||||
| (in thousands) | ||||||||||||
CASHFLOWSFROMOPERATINGACTIVITIES: | ||||||||||||
Net income | $ | 83,391 | $ | 75,127 | $ | 74,799 | ||||||
Adjustments to reconcile net income to net cash provided by operating activities: | ||||||||||||
Provision for credit losses | 5,154 | 4,377 | 7,175 | |||||||||
Depreciation | 8,066 | 7,977 | 8,362 | |||||||||
Amortization of intangible assets | 2,768 | 3,077 | 2,748 | |||||||||
Amortization of premiums, fees, and discounts, net | 11,333 | 15,110 | 11,457 | |||||||||
Recovery of impairment of MSR asset | (380 | ) | (1,691 | ) | (5,732 | ) | ||||||
Securities gains | (6 | ) | (2,335 | ) | (17,380 | ) | ||||||
Deferred (prepaid) income taxes | (4,624 | ) | 1,053 | (6,385 | ) | |||||||
Loans originated for sale | (413,586 | ) | (499,350 | ) | (1,312,649 | ) | ||||||
Proceeds from sales of loans | 430,786 | 495,648 | 1,416,877 | |||||||||
Gains on sales of loans, net | (9,021 | ) | (9,661 | ) | (21,765 | ) | ||||||
Changes in assets and liabilities: | ||||||||||||
Accrued interest receivable | (3,665 | ) | 168 | 5,388 | ||||||||
Other assets | (1,787 | ) | 16,690 | (1,044 | ) | |||||||
Accrued expenses and other liabilities | 12,472 | 1,492 | (3,927 | ) | ||||||||
Net cash provided by operating activities | 120,901 | 107,682 | 157,924 | |||||||||
CASHFLOWSFROMINVESTINGACTIVITIES: | ||||||||||||
Cash paid, net of cash acquired in acquisitions | — | (1,120 | ) | (90,468 | ) | |||||||
Proceeds from sale (purchase) of FRB and FHLB stock | (109 | ) | 1,510 | 4,545 | ||||||||
Proceeds from sales of securities available for sale | 26,196 | 195,437 | 677,467 | |||||||||
Proceeds from maturing securities and principal payments on securities available for sale | 263,883 | 325,115 | 627,407 | |||||||||
Purchases of securities available for sale | (265,706 | ) | (409,963 | ) | (1,014,748 | ) | ||||||
Loans originated, net of principal repayments | (420,181 | ) | (362,894 | ) | (146,798 | ) | ||||||
Purchases of premises and equipment | (3,526 | ) | (10,118 | ) | (13,143 | ) | ||||||
Net cash provided by (used in) investing activities | (399,443 | ) | (262,033 | ) | 44,262 | |||||||
CASHFLOWSFROMFINANCINGACTIVITIES: | ||||||||||||
Net increase in deposits | 475,605 | 68,839 | 60,904 | |||||||||
Net increase (decrease) in repurchase agreements | (20,401 | ) | (2,264 | ) | 13,899 | |||||||
Net increase (decrease) in other borrowings | (108,747 | ) | 71,301 | (266,221 | ) | |||||||
Proceeds from issuance of treasury and common stock | 9,778 | 9,893 | 6,330 | |||||||||
Dividends on common stock | (33,454 | ) | (31,889 | ) | (28,301 | ) | ||||||
Net cash provided by (used in) financing activities | 322,781 | 115,880 | (219,389 | ) | ||||||||
Net increase (decrease) in cash and cash equivalents | 44,239 | (38,471 | ) | (17,203 | ) | |||||||
Cash and cash equivalents at beginning of year | 136,468 | 174,939 | 192,142 | |||||||||
Cash and cash equivalents at end of year | $ | 180,707 | $ | 136,468 | $ | 174,939 | ||||||
Supplemental disclosure of cash flow information: | ||||||||||||
Cash paid during the year for: | ||||||||||||
Interest | $ | 77,933 | $ | 45,277 | $ | 51,755 | ||||||
Income taxes | 50,323 | 27,529 | 61,228 | |||||||||
Non-cash investing and financing activities: | ||||||||||||
Loans transferred to other real estate owned | 472 | 1,021 | 380 | |||||||||
Issuance of treasury and restricted stock | 7,808 | 9,333 | 6,803 | |||||||||
Assets acquired and liabilities assumed through acquisitions: | ||||||||||||
Fair value of assets acquired | — | 854 | 1,122,089 | |||||||||
Fair value of liabilities assumed | — | — | 1,044,334 | |||||||||
Equity issued | — | — | 115,931 | |||||||||
Cash paid | — | 1,120 | 122,998 | |||||||||
Excess of cost over fair value of net assets acquired | — | 266 | 161,174 | |||||||||
The accompanying notes are an integral part of these consolidated financial statements.
47
Table of Contents
CHITTENDEN CORPORATION
NOTES TO CONSOLIDATED FINANCIAL STATEMENTS
Note 1 SUMMARYOF SIGNIFICANT ACCOUNTING POLICIES
Principles of Consolidation
The accompanying consolidated financial statements include the accounts of Chittenden Corporation (the “Company”) and its subsidiaries: Chittenden Trust Company (CTC), and its subsidiaries Chittenden Insurance Group (CIG), Chittenden Securities, Inc. (CSI) and Chittenden Commercial Finance (CCF); The Bank of Western Massachusetts (BWM); Flagship Bank and Trust Company (FBT); Maine Bank & Trust (MBT); Ocean National Bank (ONB); and Chittenden Connecticut Corporation (CCC). (CTC, BWM, FBT, MBT, and ONB are collectively referred to as the “Banks.”) All material intercompany accounts and transactions have been eliminated in consolidation. Certain reclassifications have been made to prior year balances to conform to the current year presentation.
Nature of Operations
The Banks’ primary business is providing loans, deposits, and other banking services to commercial, individual, and public sector customers. CCC is a mortgage banking operation with offices in Brattleboro, Vermont. CIG is an independent insurance agency with offices in Vermont, Massachusetts and New Hampshire. CSI is a registered broker/dealer providing brokerage services to its customers through banking locations in Vermont, Massachusetts, New Hampshire, and Maine. CCF’s commercial finance operations are based in Montreal, Quebec.
Use of Estimates in the Preparation of Financial Statements
The preparation of financial statements in conformity with generally accepted accounting principles requires management to make estimates and assumptions that affect the reported amounts of assets and liabilities and the disclosure of contingent assets and liabilities at the date of the financial statements, and the reported amounts of revenues and expenses during the reporting period. Actual results could differ from those estimates. Material estimates that are particularly susceptible to significant changes in the near term relate to the determination of the allowance for loan losses, income tax expense, mortgage-servicing rights, recognition of interest income on loans, and the recognition of restructuring charges.
Cash and Cash Equivalents
Cash and cash equivalents consist of cash on hand, amounts due from banks, interest-bearing deposits and certain money market fund investments. Cash equivalents are accounted for at cost, which approximates fair value.
Investments
Investments in debt securities may be classified as held for investment and measured at amortized cost only if the Company has the positive intent and ability to hold such securities to maturity. Investments in debt securities that are not classified as held for investment and equity securities that have readily determinable fair values are classified as either trading securities or securities available for sale. Trading securities are investments purchased and held principally for the purpose of selling in the near term; securities available for sale are investments not classified as trading or held for investment. All of the Company’s securities are classified as available for sale.
Securities transferred between categories are accounted for at market value. Unrealized holding gains and losses on trading securities are included in earnings; unrealized holding gains and losses on securities available
48
Table of Contents
CHITTENDEN CORPORATION
NOTES TO CONSOLIDATED FINANCIAL STATEMENTS—(Continued)
for sale or on securities transferred into the available for sale category from the held for investment category are reported as a separate component of stockholders’ equity, net of applicable income taxes. Unrealized losses that are considered other than temporary in nature are recognized in earnings. The Company uses the specific identification method to determine the cost basis in the recognition of gains and losses on the sales of securities as well as the calculation of unrealized gains and losses.
Loans
Loans are stated at the amount of unpaid principal, net of unearned discounts and unearned loan origination fees. Such fees and discounts are accreted using the effective-interest method. Interest on loans is included in income as earned based upon interest rates applied to unpaid principal. Interest is not accrued on loans 90 days or more past due unless they are adequately secured and in the process of collection or on other loans when management believes collection is doubtful. All loans considered impaired (except troubled debt restructurings), as defined in the following paragraph, are nonaccruing. Interest on nonaccruing loans is recognized as payments are received when the ultimate collectibility of interest is no longer considered doubtful. When a loan is placed on nonaccrual status, all unpaid interest previously accrued is reversed against current-period interest income.
A loan is impaired when, based on current information and events, it is probable that a creditor will be unable to collect all amounts due according to the contractual terms of the loan agreement. Impaired loans are measured based on the present value of the expected future cash flows discounted at the loan’s effective interest rate. In the case of collateral dependent loans, impairment may be measured based on the fair value of the collateral. When the measure of the impaired loan is less than the recorded investment in the loan, the impairment is recorded through a valuation allowance.
Allowance for Loan Losses
The allowance for loan losses is based on management’s estimate of the amount required to reflect the probable inherent losses in the loan portfolio, based on circumstances and conditions known at each reporting date. There are inherent uncertainties with respect to the collectibility of the Banks’ loans. Because of these inherent uncertainties, it is reasonably possible that actual losses experienced in the near term may differ from the amounts reflected in these consolidated financial statements.
Adequacy of the allowance is determined using a consistent, systematic methodology, which analyzes the size and risk of the loan portfolio. In addition to evaluating the collectibility of specific loans when determining the adequacy of the allowance for loan losses, management also takes into consideration other factors such as changes in the mix and volume of the loan portfolio, historic loss experience, the amount of delinquencies and loans adversely classified, and economic trends. An allocation process whereby specific loss allocations are made against certain adversely classified loans, and general loss allocations are made against segments of the loan portfolio, which have similar attributes together, assesses the adequacy of the allowance for loan losses.
Provisions charged against current earnings increase the allowance for loan losses. Loan losses are charged against the allowance when management believes that the collectibility of the loan principal is doubtful. Recoveries on loans previously charged off are credited to the allowance. While management uses available information to assess probable losses on loans, future additions to the allowance may be necessary. In addition, various regulatory agencies periodically review the Company’s allowance for loan losses as an integral part of their examination process. Such agencies may require the Company to recognize additions to the allowance based on judgments different from those of management.
Credit quality of the commercial portfolios is quantified by a corporate credit rating system designed to parallel regulatory criteria and categories of loan risk. Individual loan officers monitor their loans to ensure
49
Table of Contents
CHITTENDEN CORPORATION
NOTES TO CONSOLIDATED FINANCIAL STATEMENTS—(Continued)
appropriate rating assignments are made on a timely basis. Risk ratings and quality of both commercial and consumer credit portfolios are also assessed on a regular basis by an independent Credit Review Department. Credit Review personnel conduct ongoing portfolio trend analyses and individual credit reviews to evaluate loan risk and compliance with corporate lending policies. Results and recommendations from this process provide senior management and the Board of Directors with independent information on the loan portfolio condition. Consumer and residential real estate loan quality is evaluated on the basis of delinquency data and other credit data available due to the large number of such loans and the relatively small size of individual credits.
Key elements of the above estimates, including assumptions used in developing independent appraisals, are dependent on the economic conditions prevailing at the time such estimates are made. Accordingly, uncertainty exists as to the final outcome of certain valuation judgments as a result of changes in economic conditions in the Banks’ lending areas.
Loan Origination and Commitment Fees
Loan origination and commitment fees, and certain loan origination costs, are deferred and amortized over the contractual term of the related loans as yield adjustments using primarily the level-yield method. When loans are sold or paid off, the unamortized net fees and costs are recognized in income. Net deferred loan fees amounted to $6,720,000 and $6,979,000 at December 31, 2005 and 2004, respectively.
Loans Held for Sale / Gains and Losses on Sales of Mortgage Loans
Loans held for sale are carried at the lower of aggregate cost or market value. Gains and losses on sales of mortgage loans are recognized at the time of the sale and are generally comprised of 1) an amount representing a mortgage servicing right (see below) and 2) a cash gain or loss based on the sale of the loan to a third party. The price paid by a willing third party is influenced by the contractual interest rate charged to the borrower and the prevailing market rate for similar loans. The Company enters into forward sale contracts on substantially all loan commitments at the time that the customer locks their contractual interest rate, so that the exposure due to interest rate changes on the cash gain / loss recognized by the Company is minimal.
Mortgage Servicing Rights
Servicing assets are recognized when rights are acquired through purchase or sale of residential mortgage loans. Capitalized servicing rights are amortized against mortgage servicing income in proportion to, and over the period of, the estimated future net servicing income of the underlying mortgage loans. Servicing assets are evaluated regularly for impairment based upon the fair value of the servicing rights as compared to their amortized cost. Fair value is determined using prices for similar assets with similar characteristics, when available, or based upon discounted cash flows using market-based assumptions.
Premises and Equipment
Premises and equipment are stated at cost, less accumulated depreciation. Depreciation is provided using the straight-line method over the estimated useful lives of the premises and equipment. Leasehold improvements are amortized over the shorter of the terms of the respective leases or the estimated useful lives of the improvements. Expenditures for maintenance, repairs, and renewals of minor items are charged to expense as incurred.
Other Real Estate Owned
Collateral acquired through foreclosure (“Other Real Estate Owned” or “OREO”) is recorded at the lower of the carrying amount of the loan or the fair value of the property, less estimated costs to sell, at the time of
50
Table of Contents
CHITTENDEN CORPORATION
NOTES TO CONSOLIDATED FINANCIAL STATEMENTS—(Continued)
acquisition. Net operating income or expense related to OREO is included in noninterest expense in the accompanying consolidated statements of income.
Identified Intangible Assets & Goodwill
Intangible assets include the excess of the purchase price over the fair value of net assets acquired (goodwill) in various acquisitions as well as core deposit intangibles (CDI) and customer list intangibles. Core deposit intangibles are amortized on a straight-line basis over 10 years. The straight-line basis is used because the Company has not experienced significant run off of core deposits in its past acquisitions. The customer list intangibles are also amortized straight-line over 10 years. The Company periodically evaluates intangible assets for impairment on the basis of whether these assets are fully recoverable from projected, undiscounted net cash flows of the related acquired segment or customer base.
Income Taxes
The Company accounts for income taxes using the asset and liability method. Under this method, deferred tax assets and liabilities are established for the temporary differences between the accounting basis and the tax basis of the Company’s assets and liabilities at enacted tax rates expected to be in effect when the amounts related to such temporary differences are realized or settled.
Reserve for Unfunded Commitments
The reserve for unfunded commitments is based on management’s estimate of the amount required to reflect the probable inherent losses on outstanding letters of credit, merchant processing activity and unused loan credit lines. Adequacy of the reserve is determined using a consistent, systematic methodology, similar to the one, which analyzes the allowance for loan losses. Additionally, management must also estimate the likelihood that these commitments would be funded and become loans. This is done by evaluating the historical utilization of each type of unfunded commitment and estimating the likelihood that the current utilization rates on lines available at the balance sheet date could increase in the future.
Earnings Per Share
The calculation of basic earnings per share is based on the weighted average number of shares of common stock outstanding during the period. Diluted earnings per share is based on the weighted average number of shares of common stock outstanding adjusted for the incremental shares attributed to outstanding common stock equivalents, using the treasury stock method. Common stock equivalents include options granted under the Company’s stock plans and shares to be issued under the Company’s Directors’ Deferred Compensation Plan.
Investment Management and Trust
Assets under administration of approximately $9.1 billion and $8.2 billion at December 31, 2005 and 2004, respectively, held by the Banks in a fiduciary or agency capacity for customers, are not included in the accompanying consolidated balance sheets. Investment management and trust income is recorded on the cash basis (which approximates the accrual method) in accordance with industry practice.
Credit Card Income
Credit card income includes interchange income from credit cards issued by the Company, and merchant discount income. Merchant discount income consists of the fees charged on credit card receipts submitted by the
51
Table of Contents
CHITTENDEN CORPORATION
NOTES TO CONSOLIDATED FINANCIAL STATEMENTS—(Continued)
Company’s commercial customers. Credit card income is presented net of credit card expense, which includes fees paid by the Company to credit card issuers and third-party processors. Such amounts are recognized on the accrual basis, and are presented in noninterest income in the consolidated statements of income.
Insurance Commissions
Insurance commission income is recognized when billed to the customer, net of commissions paid to the producing agent. In addition, CIG may receive additional performance commissions based on achieving specific sales goals and loss experience targets.
Stock-Based Compensation
Statement of Financial Accounting Standards No. 123R,Accounting for Share-Based Payment (“SFAS 123R”),requires that companies implement SFAS 123R beginning with their first fiscal year after June 15, 2005, which will be January 1, 2006 for the Company. (See Note 19, Recent Accounting Pronouncements.) The Company has chosen to continue to account for stock-based compensation using the intrinsic value method prescribed in Accounting Principles Board Opinion No. 25,Accounting for Stock Issued to Employees,and related Interpretations until the required adoption date. Accordingly, compensation cost for stock options is measured as the excess, if any, of the quoted market price of the Company’s stock at the date of the grant over the amount an employee must pay to acquire the stock.
If compensation cost for these plans had been determined using the Black-Scholes method in accordance with SFAS 123, the Company’s net income and earnings per share would have been reduced to the following pro forma amounts:
| 2005 | 2004 | 2003 | ||||||||||
| (in thousands, except per share data) | ||||||||||||
Net Income : | ||||||||||||
As reported | $ | 83,391 | $ | 75,127 | $ | 74,799 | ||||||
Deduct: Total stock-based employee compensation expense determined under fair value based method for all awards, net of related tax effects | (1,352 | ) | (2,447 | ) | (2,546 | ) | ||||||
Pro forma | $ | 82,039 | $ | 72,680 | $ | 72,253 | ||||||
Earnings Per Share: | ||||||||||||
Basic: | ||||||||||||
As reported | $ | 1.79 | $ | 1.63 | $ | 1.67 | ||||||
Pro forma | 1.76 | 1.58 | 1.61 | |||||||||
Diluted: | ||||||||||||
As reported | $ | 1.77 | $ | 1.61 | $ | 1.66 | ||||||
Pro forma | 1.74 | 1.56 | 1.60 | |||||||||
The SFAS 123 method of accounting has not been applied to options granted prior to January 1, 1995; the resulting pro forma compensation cost may not be representative for results of future years because of, among other things, changes in the number of options granted in the future as well as future changes to underlying assumptions used in the model.
52
Table of Contents
CHITTENDEN CORPORATION
NOTES TO CONSOLIDATED FINANCIAL STATEMENTS—(Continued)
The fair value of each option granted is estimated on the date of grant using the Black-Scholes option-pricing model with the following weighted-average assumptions used for grants in 2005, 2004 and 2003:
| 2005 | 2004 | 2003 | ||||||||||
Expected life (years) | 4.76 | 4.67 | 5.13 | |||||||||
Volatility | 21.97 | 22.45 | 23.9 | |||||||||
Interest rate | 3.78 | % | 3.25 | % | 3.11 | % | ||||||
Dividend yield | 2.91 | % | 2.63 | % | 2.96 | % | ||||||
Fair value per share | $ | 4.36 | $ | 5.55 | $ | 5.05 | ||||||
Accounting for Derivatives
The Company accounts and reports for derivative instruments in accordance with Statement of Financial Accounting 149,Amendment of Statement of 133 on Derivative Instruments and Hedging Activities(“SFAS 149”). SFAS 149 amends Statement 133 for decisions made (1) as part of the Derivatives Implementation Group, (2) in connection with other Board projects dealing with financial instruments, and (3) in connection with implementation issues raised in relation to the application of the definition of a derivative. Statements 133 and 149 require companies to recognize all derivatives as either assets or liabilities in the statement of financial position and to measure those instruments at fair value.
Changes in the fair value of a derivative that is highly effective, and that is designated and qualifies, as a fair value hedge, along with changes in fair value of the hedged asset or liability that is attributable to the hedged risk (including losses or gains on firm commitments), are recorded currently in noninterest income. If a derivative has ceased to be highly effective, hedge accounting is discontinued prospectively.
Restructuring Charges
Effective January 1, 2003, the Company adopted Statement of Financial Accounting Standard No. 146Accounting for Costs Associated with Exit or Disposal Activities (“SFAS 146”), which contains specific guidance regarding the types of, and circumstances under which, certain expenses related to restructuring activities can be accrued. In general, SFAS 146 requires that the Company have a detailed plan in place, which has been communicated to employees affected. Significant management judgment is required in estimating the amount of expense that is appropriate to recognize in relation to these plans.
Accounting Policies Adopted in the Current Period
In November 2005, the Financial Accounting Standards Board (FASB) issued FASB Staff Position (FSP) 115-1, The Meaning of Other-Than-Temporary Impairment and Its Application to Certain Investments. This FSP provides additional guidance on when an investment in a debt or equity security should be considered impaired and when that impairment should be considered other-than-temporary and recognized as a loss in earnings. Specifically, the guidance clarifies that an investor should recognize an impairment loss no later than when the impairment is deemed other-than-temporary, even if a decision to sell has not been made. The FSP also requires certain disclosures about unrealized losses that have not been recognized as other-than-temporary impairments.
In December 2003, the American Institute of Certified Public Accountants issued Statement of Position (SOP) 03-3, Accounting for Certain Loans or Debt Securities Acquired in a Transfer. SOP 03-3 requires acquired loans, including debt securities, to be recorded at the amount of the purchaser’s initial investment and prohibits carrying over valuation allowances from the seller for those individually evaluated loans that have evidence of deterioration in credit quality since origination, and it is probable all contractual cash flows on the loan will be
53
Table of Contents
CHITTENDEN CORPORATION
NOTES TO CONSOLIDATED FINANCIAL STATEMENTS—(Continued)
unable to be collected. SOP 03-3 also requires the excess of all undiscounted cash flows expected to be collected at acquisition over the purchaser’s initial investment to be recognized as interest income on a level-yield basis over the life of the loan. Subsequent increases in cash flows expected to be collected are recognized prospectively through an adjustment of the loan’s yield over its remaining life, while subsequent decreases are recognized as impairment. Loans carried at fair value, mortgage loans held for sale, and loans to borrowers in good standing under revolving credit agreements are excluded from the scope of SOP 03-3. The Corporation adopted the provisions of SOP 03-03 effective January 1, 2005. The adoption of this standard did not have a material impact on financial condition, results of operations, or liquidity.
Note 2 ACQUISITIONS
Granite Bank
On February 28, 2003, Chittenden acquired Granite State Bankshares, Inc., headquartered in Keene, New Hampshire, and its subsidiary, Granite Bank for $239 million in cash and stock. The transaction has been accounted for as a purchase and, accordingly, the operations of Granite Bank are included in the Company’s consolidated financial statements from the date of acquisition.
The purchase price has been allocated to assets acquired and liabilities assumed based on estimates of fair value at the date of acquisition. The excess of purchase price over the fair value of net tangible and intangible assets acquired has been recorded as goodwill. The fair value of these assets and liabilities is summarized as follows (in thousands):
Cash and cash equivalents | $ | 32,530 | ||
FHLB stock | 8,271 | |||
Securities available for sale | 395,443 | |||
Loans, Net | 626,238 | |||
Prepaid expenses and other assets | 26,907 | |||
Premises and equipment | 13,387 | |||
Identified intangibles | 19,313 | |||
Goodwill | 161,174 | |||
Deposits | (782,894 | ) | ||
Borrowings | (247,102 | ) | ||
Accrued expenses and other liabilities | (14,338 | ) | ||
Total acquisition cost | $ | 238,929 | ||
The following is unaudited supplemental information, reflecting selected pro forma results as if this acquisition had been consummated as of January 1, 2003 (in thousands, except EPS):
| For the years ended December 31, | |||||||||
| 2005 | 2004 | 2003 | |||||||
Total revenue | $ | 314,776 | $ | 298,930 | $ | 323,304 | |||
Income before income taxes | 130,914 | 118,181 | 119,492 | ||||||
Net income | $ | 83,697 | $ | 75,144 | $ | 76,124 | |||
Diluted earnings per share (EPS) | $ | 1.78 | $ | 1.61 | $ | 1.69 | |||
Total revenue includes net interest income and noninterest income.
54
Table of Contents
CHITTENDEN CORPORATION
NOTES TO CONSOLIDATED FINANCIAL STATEMENTS—(Continued)
Note 3 INTANGIBLE ASSETSAND GOODWILL
Identified Intangible Assets
As of December 31, 2005 (in thousands) | |||||||||
| Gross Carrying Amount | Accumulated Amortization | Net Carrying Amount | |||||||
Amortized intangible assets: | |||||||||
Core deposit intangibles | $ | 28,541 | $ | 14,869 | $ | 13,672 | |||
Customer list intangibles | 3,498 | 985 | 2,513 | ||||||
Acquired trust relationships | 4,000 | 2,530 | 1,470 | ||||||
Total | $ | 36,039 | $ | 18,384 | $ | 17,655 | |||
| (in thousands) | |||
Aggregate Amortization Expense: | |||
For year ended December 31, 2005 | $ | 2,768 | |
Estimated Amortization Expense: | |||
For year ended December 31, 2006 | $ | 2,659 | |
For year ended December 31, 2007 | 2,659 | ||
For year ended December 31, 2008 | 2,659 | ||
For year ended December 31, 2009 | 2,659 | ||
For year ended December 31, 2010 | 2,542 | ||
Goodwill
The changes in the carrying amount of goodwill for the year ended December 31, 2005 are as follows (in thousands):
| Commercial Banking Segment | Other Segment | Total | |||||||||
Balance as of December 31, 2004 | $ | 211,084 | $ | 5,052 | $ | 216,136 | |||||
Deferred tax adjustment to GB goodwill . | (98 | ) | — | (98 | ) | ||||||
Impairment losses | — | — | — | ||||||||
Balance as of December 31, 2005 | $ | 210,986 | $ | 5,052 | $ | 216,038 | |||||
55
Table of Contents
CHITTENDEN CORPORATION
NOTES TO CONSOLIDATED FINANCIAL STATEMENTS—(Continued)
Note 4 INVESTMENTS
Investment securities at December 31, 2005 and 2004 are as follows:
Amortized Cost | Unrealized Gains | Unrealized Losses | Fair Value | ||||||||||
| (in thousands) | |||||||||||||
2005 | |||||||||||||
SECURITIESAVAILABLEFORSALE: | |||||||||||||
U.S. Treasury securities | $ | 5,342 | $ | 2 | $ | (105 | ) | $ | 5,239 | ||||
U.S. government agency obligations | 548,734 | 80 | (12,690 | ) | 536,124 | ||||||||
Obligations of states and political subdivisions | 500 | 2 | — | 502 | |||||||||
Mortgage-backed securities | 406,353 | 1,107 | (11,710 | ) | 395,750 | ||||||||
Corporate bonds and notes | 451,483 | 630 | (6,661 | ) | 445,452 | ||||||||
Other debt securities | 842 | — | — | 842 | |||||||||
Total securities available for sale | $ | 1,413,254 | $ | 1,821 | $ | (31,166 | ) | $ | 1,383,909 | ||||
2004 | |||||||||||||
SECURITIESAVAILABLEFORSALE: | |||||||||||||
U.S. Treasury securities | $ | 6,612 | $ | 31 | $ | (49 | ) | $ | 6,594 | ||||
U.S. government agency obligations | 452,150 | 1,191 | (4,259 | ) | 449,082 | ||||||||
Obligations of states and political subdivisions | 1,294 | 23 | — | 1,317 | |||||||||
Mortgage-backed securities | 499,891 | 3,754 | (5,334 | ) | 498,311 | ||||||||
Corporate bonds and notes | 484,309 | 7,011 | (1,237 | ) | 490,083 | ||||||||
Other debt securities | 834 | — | — | 834 | |||||||||
Total securities available for sale | $ | 1,445,090 | $ | 12,010 | ($ | 10,879 | ) | $ | 1,446,221 | ||||
The following table presents information related to sales of debt securities in each of the last three-year periods ended December 31:
| 2005 | 2004 | 2003 | |||||||
| (in thousands) | |||||||||
Proceeds | $ | 26,196 | $ | 195,437 | $ | 677,467 | |||
Realized losses | 97 | 2,448 | 1,895 | ||||||
Realized gains | 103 | 4,783 | 19,275 | ||||||
The market value of securities pledged to secure U.S. Treasury borrowings, public deposits, securities sold under agreements to repurchase, and for other purposes required by law, amounted to $519 million and $312 million at December 31, 2005 and 2004, respectively.
56
Table of Contents
CHITTENDEN CORPORATION
NOTES TO CONSOLIDATED FINANCIAL STATEMENTS—(Continued)
The following table shows the maturity distribution of the amortized cost of the Company’s investment securities at December 31, 2005, with comparative totals for 2004. Expected maturities may differ from contractual maturities because borrowers may have the right to call or prepay obligations:
| Within One Year | After One But Within Five Years | After Five But Within Ten Years | After Ten Years | Total | |||||||||||
| (in thousands) | |||||||||||||||
Investment securities: | |||||||||||||||
U.S. Treasury securities | $ | 1,999 | $ | 3,343 | $ | — | $ | — | $ | 5,342 | |||||
U.S. government agency obligations | 48,604 | 500,113 | 17 | — | 548,734 | ||||||||||
Obligations of states and political subdivisions | 3 | 385 | 60 | 52 | 500 | ||||||||||
Mortgage-backed securities (1) | 102,235 | 217,161 | 85,146 | 1,811 | 406,353 | ||||||||||
Corporate bonds and notes | 111,789 | 339,694 | — | — | 451,483 | ||||||||||
Other debt securities | 111 | 720 | — | 11 | 842 | ||||||||||
Total investment securities | $ | 264,741 | $ | 1,061,416 | $ | 85,223 | $ | 1,874 | $ | 1,413,254 | |||||
Comparative totals for 2004 | $ | 254,639 | $ | 1,059,755 | $ | 127,007 | $ | 3,689 | $ | 1,445,090 | |||||
| (1) | Maturities of mortgage-backed securities are based on contractual payments and estimated mortgage loan prepayments. |
The following table shows the maturity distribution of the fair value of the Company’s investment securities at December 31, 2005, with comparative totals for 2004. Expected maturities may differ from contractual maturities because borrowers may have the right to call or prepay obligations:
| Within One Year | After One But Within Five Years | After Five But Within Ten Years | After Ten Years | Total | |||||||||||
| (in thousands) | |||||||||||||||
INVESTMENT SECURITIES: | |||||||||||||||
U.S. Treasury securities | $ | 1,993 | $ | 3,246 | $ | — | $ | — | $ | 5,239 | |||||
U.S. government agency obligations | 48,260 | 487,845 | 19 | — | 536,124 | ||||||||||
Obligations of states and political subdivisions | 3 | 387 | 60 | 52 | 502 | ||||||||||
Mortgage-backed securities (1) | 99,568 | 211,495 | 82,924 | 1,763 | 395,750 | ||||||||||
Corporate bonds and notes | 111,455 | 333,997 | — | — | 445,452 | ||||||||||
Other debt securities | 111 | 720 | — | 11 | 842 | ||||||||||
Total investment securities | $ | 261,390 | $ | 1,037,690 | $ | 83,003 | $ | 1,826 | $ | 1,383,909 | |||||
Comparative totals for 2004 | $ | 255,588 | $ | 1,060,284 | $ | 126,671 | $ | 3,678 | $ | 1,446,221 | |||||
| (1) | Maturities of mortgage-backed securities are based on contractual repayments and estimated mortgage loan prepayments. |
57
Table of Contents
CHITTENDEN CORPORATION
NOTES TO CONSOLIDATED FINANCIAL STATEMENTS—(Continued)
Temporarily Impaired Investment Securities
at December 31, 2005 (in thousands):
| Less than 12 months | 12 months or longer | Total | ||||||||||||||||
| Fair Value | Unrealized Losses | Fair Value | Unrealized Losses | Fair Value | Unrealized Losses | |||||||||||||
Description of Investment Securities | ||||||||||||||||||
U.S. Treasury securities | $ | 288 | ($5 | ) | $ | 3,950 | ($100 | ) | $ | 4,238 | ($105 | ) | ||||||
U.S. government agency obligations | 203,200 | (3,061 | ) | 288,167 | (9,629 | ) | 491,367 | (12,690 | ) | |||||||||
Mortgage-backed securities | 40,244 | (547 | ) | 294,590 | (11,163 | ) | 334,834 | (11,710 | ) | |||||||||
Corporate bonds and notes | 178,799 | (2,438 | ) | 159,595 | (4,223 | ) | 338,394 | (6,661 | ) | |||||||||
Total temporarily impaired securities | $ | 422,531 | ($6,051 | ) | $ | 746,302 | ($25,115 | ) | $ | 1,168,833 | ($31,166 | ) | ||||||
Temporarily Impaired Investment Securities
At December 31, 2004 (in thousands):
| Less than 12 months | 12 months or longer | Total | |||||||||||||||||
| Fair Value | Unrealized Losses | Fair Value | Unrealized Losses | Fair Value | Unrealized Losses | ||||||||||||||
Description of Investment Securities | |||||||||||||||||||
U.S. Treasury securities | $ | 3,071 | ($21 | ) | $ | 2,254 | ($28 | ) | $ | 5,325 | ($49 | ) | |||||||
U.S. government agency obligations | 205,025 | (1,377 | ) | 132,786 | (2,882 | ) | 337,811 | (4,259 | ) | ||||||||||
Mortgage-backed securities | 80,122 | (420 | ) | 286,540 | (4,914 | ) | 366,662 | (5,334 | ) | ||||||||||
Corporate bonds and notes | 132,580 | (840 | ) | 41,469 | (397 | ) | 174,049 | (1,237 | ) | ||||||||||
Total temporarily impaired securities | $ | 420,798 | ($2,658 | ) | $ | 463,049 | ($8,221 | ) | $ | 883,847 | ($ | 10,879 | ) | ||||||
U.S. Treasury securities and U.S. government agency obligations. The unrealized losses on the Company’s investments in U.S. Treasury securities and direct obligations of U.S. government agencies were caused by interest rate increases. Because the Company has the ability and intent to hold these investments until a recovery of their amortized cost, which may be at maturity, the Company does not consider these investments to be other-than-temporarily impaired at December 31, 2005.
Mortgage-backed securities. The unrealized losses on the Company’s investment in federal agency mortgage-backed securities were caused by interest rate increases. Because the decline in market value is attributable to changes in interest rates and not credit quality and because the Company has the ability and intent to hold these investments until a recovery of their amortized cost, which may be at maturity, the Company does not consider these investments to be other-than-temporarily impaired at December 31, 2005.
Corporate bonds and notes.The Company’s unrealized loss on investments in corporate bonds and notes was caused by a general increase in market interest rates. Included are 34 issuers with a carrying value of $345.0 million and a fair value of $338.3 million. These bonds have at least an S&P rating of at least A3 and a Moody’s rating of at least BBB+ except for notes issued by the Ford Motor Credit Company. These notes had a carrying and fair value of $2.0 million at December 31, 2005 and they were paid off on February 1, 2006. The Company’s
58
Table of Contents
CHITTENDEN CORPORATION
NOTES TO CONSOLIDATED FINANCIAL STATEMENTS—(Continued)
review of the credit ratings determined that there were no downgrades during the year except for the $2.0 million Ford Motor Credit Company notes. Because the Company has the ability and intent to hold these investments until a recovery of their amortized cost, which may be at maturity, it does not consider any to be other-than-temporarily impaired at December 31, 2005.
Note 5 LOANS
The Company’s lending activities are conducted primarily in Vermont, New Hampshire, Massachusetts and Maine, with additional activity relating to nearby trading areas in New York, Connecticut and Quebec. The Banks make single-family and multi-family residential loans, commercial real estate loans, commercial & industrial loans, and a variety of consumer loans and municipal loans. In addition, the Banks make loans for the construction of residential homes, multi-family and commercial properties, and for land development.
Major classifications of loans at December 31, 2005 and 2004 are as follows:
| 2005 | 2004 | |||||||
| (in thousands) | ||||||||
Commercial & industrial | $ | 848,420 | $ | 801,369 | ||||
Municipal | 160,357 | 106,120 | ||||||
Multi-family | 196,590 | 182,541 | ||||||
Commercial real estate | 1,778,202 | 1,590,457 | ||||||
Construction | 192,165 | 174,283 | ||||||
Residential real estate | 737,462 | 688,017 | ||||||
Home equity credit lines | 316,465 | 294,656 | ||||||
Consumer | 257,829 | 239,750 | ||||||
Total gross loans | 4,487,490 | 4,077,193 | ||||||
Allowance for loan losses | (60,822 | ) | (59,031 | ) | ||||
Net loans | $ | 4,426,668 | $ | 4,018,162 | ||||
Loans held for sale | $ | 19,737 | $ | 33,535 | ||||
Changes in the allowance for loan losses are summarized as follows:
| 2005 | 2004 | 2003 | ||||||||||
| (in thousands) | ||||||||||||
Balance at beginning of year | $ | 59,031 | $ | 57,464 | $ | 48,197 | ||||||
Allowance acquired through acquisitions | — | — | 7,936 | |||||||||
Provision for credit losses | 5,154 | 4,377 | 7,175 | |||||||||
Loan recoveries | 3,812 | 4,340 | 4,194 | |||||||||
Loans charged off | (5,975 | ) | (7,150 | ) | (10,038 | ) | ||||||
Transferred to liability for unfunded commitments | (1,200 | ) | — | — | ||||||||
Balance at end of year | $ | 60,822 | $ | 59,031 | $ | 57,464 | ||||||
The principal amount of loans on nonaccrual status was $15,819,400 and $19,915,000 at December 31, 2005 and 2004, respectively. At the end of 2005 and 2004, the Company had no loans whose terms had been substantially modified in troubled debt restructurings.
59
Table of Contents
CHITTENDEN CORPORATION
NOTES TO CONSOLIDATED FINANCIAL STATEMENTS—(Continued)
The amount of interest which was not earned but which would have been earned had nonaccrual loans performed in accordance with their original terms and conditions was as follows:
| 2005 | 2004 | 2003 | |||||||
| (in thousands) | |||||||||
Interest income in accordance with original loan terms | $ | 1,895 | $ | 1,762 | $ | 1,937 | |||
Interest income recognized | 564 | 359 | 1,497 | ||||||
Reduction in interest income | $ | 1,331 | $ | 1,403 | $ | 440 | |||
Information regarding loans that were considered to be impaired under SFAS 114 is as follows:
| December 31, | |||||||||
| 2005 | 2004 | 2003 | |||||||
| (in thousands) | |||||||||
Investment in impaired loans | $ | 8,076 | $ | 15,211 | $ | 9,863 | |||
Impaired loans with no specific reserve | 4,581 | 8,670 | 4,197 | ||||||
Impaired loans with a specific reserve | 3,495 | 6,541 | 5,666 | ||||||
Specific reserve for impaired loans | 1,061 | 2,040 | 1,725 | ||||||
Average investment in impaired loans during the year | 11,915 | 15,024 | 10,130 | ||||||
Cash-basis interest income recognized during the year | 143 | 2 | 2 | ||||||
Accrual-basis interest income recognized during the year | — | — | 14 | ||||||
Residential mortgage loans serviced for others, which are not reflected in the consolidated balance sheets, totaled approximately $2.098 billion and $2.142 billion at December 31, 2005 and 2004, respectively. No recourse provisions exist in connection with such servicing.
The following table is a summary of activity for mortgage servicing rights purchased and originated for the three years ended December 31, 2005:
| Purchased | Originated | Total | ||||||||||
| (in thousands) | ||||||||||||
Balance at December 31, 2002 | $ | 982 | $ | 7,509 | $ | 8,491 | ||||||
MSR’s obtained in Granite acquisition | — | 1,480 | 1,480 | |||||||||
Additions | — | 7,839 | 7,839 | |||||||||
Amortization | (1,279 | ) | (9,998 | ) | (11,277 | ) | ||||||
Recovery of impairment | 870 | 4,862 | 5,732 | |||||||||
Balance at December 31, 2003 | 573 | 11,692 | 12,265 | |||||||||
Additions | — | 5,090 | 5,090 | |||||||||
Amortization | (551 | ) | (6,669 | ) | (7,220 | ) | ||||||
Recovery of impairment | 388 | 1,303 | 1,691 | |||||||||
Balance at December 31, 2004 | $ | 410 | $ | 11,416 | $ | 11,826 | ||||||
Additions | — | 5,619 | 5,619 | |||||||||
Amortization | (177 | ) | (3,907 | ) | (4,084 | ) | ||||||
Recovery of impairment | 78 | 302 | 380 | |||||||||
Balance at December 31, 2005 | $ | 311 | $ | 13,430 | $ | 13,741 | ||||||
SFAS 140 requires enterprises to measure the impairment of servicing assets based on the difference between the carrying amount of the servicing rights and their current fair value. Fair value is measured as the
60
Table of Contents
CHITTENDEN CORPORATION
NOTES TO CONSOLIDATED FINANCIAL STATEMENTS—(Continued)
discounted cash flow of future servicing income expected to be received based upon market conditions at the time the estimate is made. Significant assumptions made by management at December 31, 2005 include discount rate (9%), weighted average prepayment speed (201 PSA/12.06 CPR), weighted average servicing fee (25.60 basis points) and net cost to service loans ($17/loan). Based upon these assumptions, the Company calculated the fair value of its servicing rights to be $21.464 million at December 31, 2005.
The Company stratifies its servicing portfolio based upon interest rate (in increments of 50 basis points) and original loan term (primarily 15 and 30 year). The estimated market value of capitalized servicing rights may vary significantly in subsequent periods primarily due to changing market interest rates, and their effect on prepayment speeds, and discount rates.
At December 31, 2005 and 2004, the impairment valuation allowance was $639,000 and $1,041,000, respectively.
The estimated sensitivity of the current fair value of the mortgage servicing rights portfolio to changes in interest rates at December 31, 2005, was as follows:
Change in Market Interest Rates | Change in fair value | |||
–25 bps | $ | (1,037 | ) | |
–50 bps | (2,105 | ) | ||
–100 bps | (4,228 | ) | ||
–200 bps | (8,084 | ) | ||
+25 bps | 979 | |||
+50 bps | 1,799 | |||
+100 bps | 3,158 | |||
+200 bps | 5,109 | |||
The sensitivities in the table above are hypothetical and should be used with caution. The effect of a variation in a particular assumption on the fair value of the mortgage servicing right is calculated independently without changing any other assumption. In reality, changes in one factor may result in changes in another, which might magnify or counteract the sensitivities. Because the amount recognized on the Company’s balance sheet is at the lower of cost or market (fair value), changes in the calculated fair value of mortgage servicing rights will not necessarily translate to a corresponding change in the amount shown on the balance sheet.
Note 6 PREMISESAND EQUIPMENT
Premises and equipment at December 31, 2005 and 2004 are summarized as follows:
| 2005 | 2004 | Estimated Original Useful Lives | ||||||||
| (in thousands) | ||||||||||
Land | $ | 12,672 | $ | 11,711 | — | |||||
Buildings and improvements | 62,734 | 55,773 | 25-50 years | |||||||
Leasehold improvements | 13,625 | 12,434 | 2-50 years | |||||||
Furniture and equipment | 52,851 | 51,916 | 3-15 years | |||||||
Construction in progress | 406 | 10,848 | — | |||||||
Premises and equipment, gross | 142,288 | 142,682 | ||||||||
Accumulated depreciation and amortization | (72,557 | ) | (68,411 | ) | ||||||
Premises and equipment, net | $ | 69,731 | $ | 74,271 | ||||||
61
Table of Contents
CHITTENDEN CORPORATION
NOTES TO CONSOLIDATED FINANCIAL STATEMENTS—(Continued)
Total depreciation expense amounted to approximately $8,066,000, $7,977,000 and $8,362,000 in 2005, 2004 and 2003.
The Company is obligated under various noncancelable operating leases for premises and equipment expiring in various years through 2021. Total lease expense, net of income from subleases, amounted to approximately $4,518,000, $4,560,000 and $4,480,000 in 2005, 2004, and 2003, respectively.
Future minimum rental commitments for noncancelable operating leases on premises and equipment with initial or remaining terms of one year or more at December 31, 2005 are as follows:
Year | Lease Obligations | ||
| (in thousands) | |||
2006 | $ | 4,987 | |
2007 | 4,135 | ||
2008 | 2,782 | ||
2009 | 1,997 | ||
2010 | 1,310 | ||
Thereafter | 7,433 | ||
Total minimum lease payments | $ | 22,644 | |
Note 7 BORROWINGS
Borrowings at December 31, 2005 and 2004 consisted of the following:
| 2005 | 2004 | |||||
| (in thousands) | ||||||
Federal funds purchased, 2.25% in 2004 | $ | — | $ | 101,947 | ||
Securities sold under agreements to repurchase | 56,315 | 76,716 | ||||
Trust preferred securities | 125,000 | 125,000 | ||||
Bank revolving debt @ 3.37% | 3,273 | — | ||||
Note Payable, 6.18% in 2005 and 4.35% in 2004, due January 1, 2015 | 290 | 273 | ||||
FHLB Advances: | ||||||
Maturing December 27, 2010 @ 4.80%, (callable) | 20,000 | 20,000 | ||||
Maturing March 28, 2011 @ 3.99% (called 12/27/05) | — | 10,031 | ||||
Maturing April 19, 2011 @ 3.50% | 1,416 | 1,463 | ||||
Maturing August 1, 2011 @ 5.00% | 560 | 560 | ||||
Maturing January 17, 2012 @ 3.95% (called 1/17/06) | 20,000 | 19,996 | ||||
Maturing December 29, 2023 @ 0.13% | 469 | 485 | ||||
Total Borrowings | $ | 227,323 | $ | 356,471 | ||
Securities sold under agreements to repurchase are collateralized by U.S. Treasury and agency securities, mortgage-backed securities and corporate notes or bonds. These assets had a carrying value and a market value of $63,802,000 and $61,418,000 respectively, at December 31, 2005, and $86,090,000 and $85,043,000, respectively, at December 31, 2004. The borrowings from the Federal Home Loan Bank of Boston are secured by residential mortgage loans held in the Company’s loan portfolio.
62
Table of Contents
CHITTENDEN CORPORATION
NOTES TO CONSOLIDATED FINANCIAL STATEMENTS—(Continued)
The following information relates to securities sold under agreements to repurchase:
| 2005 | 2004 | 2003 | ||||||||||
| (in thousands) | ||||||||||||
Average balance outstanding during the year | $ | 86,701 | $ | 73,860 | $ | 97,508 | ||||||
Average interest rate during the year | 1.73 | % | 0.84 | % | 1.42 | % | ||||||
Maximum amount outstanding at any month-end | $ | 149,750 | $ | 79,365 | $ | 123,131 | ||||||
The following information relates to FHLB borrowings:
| 2005 | 2004 | 2003 | ||||||||||
| (in thousands) | ||||||||||||
Average balance outstanding during the year | $ | 52,365 | $ | 52,942 | $ | 177,494 | ||||||
Average interest rate during the year | 4.30 | % | 4.47 | % | 3.81 | % | ||||||
Maximum amount outstanding at any month-end | $ | 52,533 | $ | 52,535 | $ | 272,644 | ||||||
On May 21, 2002, a wholly-owned subsidiary of the Company, Chittenden Capital Trust I (the “Trust”), issued $125 million of 8% trust preferred securities (“TPS”) to the public and invested the proceeds from this offering in an equivalent amount of junior subordinated debentures issued by the Company. These debentures are the sole asset of the trust subsidiary. The proceeds from the offering, which was net of $4.5 million of issuance costs, were used as the cash consideration in the Granite Bank acquisition. The TPS pay interest quarterly, are mandatorily redeemable on July 1, 2032 and may be redeemed by the Trust at par any time on or after July 1, 2007. The Company has fully and unconditionally guaranteed the TPS issued by the Trust.
Concurrent with the issuance of these securities, the Company entered into interest rate swap agreements with two counterparties, in which the Company will receive 8% fixed on the notional amount of $125 million, while paying the counterparties a variable rate based on the three month LIBOR (London Interbank Offered Rate), plus approximately 122 basis points.
The following information relates to TPS borrowings:
| 2005 | 2004 | 2003 | ||||||||||
| (in thousands) | ||||||||||||
Average balance outstanding during the year | $ | 125,000 | $ | 125,000 | $ | 125,000 | ||||||
Average effective interest rate during the year (net of interest rate swaps) | 4.58 | % | 2.73 | % | 2.48 | % | ||||||
Maximum amount outstanding at any month-end | $ | 125,000 | $ | 125,000 | $ | 125,000 | ||||||
63
Table of Contents
CHITTENDEN CORPORATION
NOTES TO CONSOLIDATED FINANCIAL STATEMENTS—(Continued)
Note 8 INCOME TAXES
Income tax expense consists of the following:
| 2005 | 2004 | 2003 | ||||||||||
| (in thousands) | ||||||||||||
Current payable | ||||||||||||
Federal | $ | 44,668 | $ | 35,070 | $ | 41,260 | ||||||
State | 6,980 | 6,904 | 6,874 | |||||||||
| 51,648 | 41,974 | 48,134 | ||||||||||
Deferred (prepaid) | ||||||||||||
Federal | (4,152 | ) | 1,407 | (5,471 | ) | |||||||
State | (472 | ) | (354 | ) | (914 | ) | ||||||
| (4,624 | ) | 1,053 | (6,385 | ) | ||||||||
Income tax expense | $ | 47,024 | $ | 43,027 | $ | 41,749 | ||||||
Current income taxes receivable, included in other assets, were $2,285,000 and $3,262,000 at December 31, 2005 and 2004, respectively. The State of Vermont assesses a franchise tax for banks in lieu of a bank income tax. The franchise tax, assessed based on deposits, amounted to approximately $3,012,000, $2,977,000, and $2,757,000 in 2005, 2004, and 2003, respectively. These amounts are included in income tax expense in the accompanying consolidated statements of income. The Company is also taxed on income in the other states in which it operates.
The following is a reconciliation of the provision for Federal income taxes, calculated at the statutory rate, to the recorded income tax expense:
| 2005 | 2004 | 2003 | ||||||||||
| (in thousands) | ||||||||||||
Computed tax at statutory Federal rate of 35% | $ | 45,645 | $ | 41,354 | $ | 40,792 | ||||||
Increase (decrease) in taxes from: | ||||||||||||
Amortization of intangible assets | 98 | 98 | 98 | |||||||||
Tax-exempt interest, net | (1,506 | ) | (954 | ) | (825 | ) | ||||||
Dividends received deduction | — | (13 | ) | (25 | ) | |||||||
State taxes, net of Federal tax benefit | 4,230 | 4,341 | 3,874 | |||||||||
Tax credits | (2,034 | ) | (2,169 | ) | (1,562 | ) | ||||||
Other, net | 591 | 370 | (603 | ) | ||||||||
Total | $ | 47,024 | $ | 43,027 | $ | 41,749 | ||||||
Effective income tax rate | 36.1 | % | 36.4 | % | 35.8 | % | ||||||
64
Table of Contents
CHITTENDEN CORPORATION
NOTES TO CONSOLIDATED FINANCIAL STATEMENTS—(Continued)
The components of the net deferred tax asset at December 31, 2005 and 2004 are as follows:
| 2005 | 2004 | |||||||
| (in thousands) | ||||||||
Allowance for loan losses | $ | 22,630 | $ | 22,118 | ||||
Deferred compensation and pension | 3,832 | 2,409 | ||||||
Depreciation | (2,256 | ) | (262 | ) | ||||
Accrued liabilities | (1,028 | ) | (2,892 | ) | ||||
Unrealized (gains) losses on securities available for sale | 10,694 | (551 | ) | |||||
Basis differences, purchase accounting | (2,954 | ) | (3,398 | ) | ||||
Core deposit intangible | (4,690 | ) | (5,427 | ) | ||||
Lease financing | (333 | ) | (1,763 | ) | ||||
Mortgage servicing | (4,803 | ) | (4,054 | ) | ||||
Other | (1,002 | ) | (1,959 | ) | ||||
| $ | 20,090 | $ | 4,221 | |||||
Note 9 STOCKHOLDERS’ EQUITY
Treasury Stock
On October 20, 2005, the Company announced that the Board of Directors authorized the repurchase of up to 1,000,000 shares of the Corporation’s common stock (approximately 2% of the Company’s outstanding common stock) in negotiated transactions or open market purchases. Chittenden, depending on market conditions, may repurchase its common stock without further Board authorization over the next two years. As of December 31, 2005 the Company had repurchased no shares.
Dividends
Dividends paid by the Banks are the primary source of funds available to the Company for payment of dividends to its stockholders and for other corporate needs. Applicable federal and state statutes, regulations, and guidelines impose restrictions on the amount of dividends that may be declared by the Banks. The Company paid dividends of $33.4 million, $31.9 million and $28.3 million during 2005, 2004, and 2003, respectively. These amounts represented $0.72, $0.70, and $0.64 per share.
Earnings Per Share
The following table summarizes the calculation of basic and diluted earnings per share:
| 2005 | 2004 | 2003 | ||||||||||
| (in thousands except per share information) | ||||||||||||
Net income | $ | 83,391 | $ | 75,127 | $ | 74,799 | ||||||
Weighted average common shares outstanding | 46,503 | 46,106 | 44,720 | |||||||||
Dilutive effect of common stock equivalents | 548 | 625 | 430 | |||||||||
Weighted average common and common equivalent shares outstanding | 47,051 | 46,731 | 45,150 | |||||||||
Basic earnings per share | $ | 1.79 | $ | 1.63 | $ | 1.67 | ||||||
Dilutive effect of common stock equivalents | (0.02 | ) | (0.02 | ) | (0.01 | ) | ||||||
Diluted earnings per share | $ | 1.77 | $ | 1.61 | $ | 1.66 | ||||||
65
Table of Contents
CHITTENDEN CORPORATION
NOTES TO CONSOLIDATED FINANCIAL STATEMENTS—(Continued)
The following table summarizes options that could potentially dilute earnings per share in the future which were not included in the computation of the common stock equivalents because to do so would have been antidilutive:
| 2005 | 2004 | 2003 | |||||||
Anti-dilutive options | 445,725 | 449,414 | 768,329 | ||||||
Weighted average exercise price | $ | 29.90 | $ | 29.90 | $ | 24.91 | |||
Comprehensive Income
Comprehensive income is the total of net income and all other non-owner changes in equity. The Company has chosen to display comprehensive income in the Consolidated Statements of Changes in Stockholders’ Equity. The following table summarizes reclassification detail for other comprehensive income for the years ended December 31:
| 2005 | 2004 | 2003 | ||||||||||
| (in thousands) | ||||||||||||
Unrealized losses on securities available for sale, net of tax | ($ | 19,632 | ) | ($ | 13,405 | ) | ($1,681 | ) | ||||
Reclassification adjustment for realized (gains) losses arising during period, net of tax | (4 | ) | (1,518 | ) | (11,297 | ) | ||||||
Foreign currency translation adjustments | (4 | ) | — | — | ||||||||
Accrued minimum pension liability, net of tax | — | — | 4,284 | |||||||||
Total other comprehensive income | ($ | 19,640 | ) | ($ | 14,923 | ) | $ | (8,694 | ) | |||
Note 10 STOCK PLANS
The Company has two stock option plans: The Stock Incentive Plan, and the Directors’ Omnibus Long-term Incentive Plan. The Company accounts for these plans in accordance with APB Opinion No. 25, under which no compensation cost for stock options has been recognized, since all options qualify for fixed plan accounting and all options are granted at fair market value, or higher in the case of stepped options.
Under the plans, certain key employees and directors are eligible to receive various types of stock incentives, including, but not limited to options to, purchase a specified number of shares of stock at a specified price (including incentive stock options and non-qualified stock options); restricted stock which vests after a specified period of time; unrestricted stock awards; performance awards; and non-employee directors’ stock options to purchase stock at predetermined fixed prices. There were a total of 7,688,624 shares at December 31, 2005 and 2004 available to be issued under the plans and 5,636,131 and 5,151,393 had been issued at each of these dates.
The Company has a Performance Share Program that governs Performance Share Awards under the Stock Incentive Plan. Performance awards consist of shares of the Company’s common stock to be issued at the conclusion of the three-year performance cycle provided that performance goals are met as measured by one or more of the following: corporate profitability, EPS, ROE and/or other measures as deemed relevant by the Executive committee. The Executive Committee has determined that the 2005 Performance Share Awards will be primarily based on the following performance measure: EPS Growth Rate as compared to the Company’s peer group. In 2005, a target of 41,460 Performance Shares was set that could be earned at the end of the three-year performance cycle (2007) if the performance measures are attained. The plan is a leveraged plan meaning that if the Company is ranked in the 100th percentile versus its comparison group up to 150% of the targeted amount of
66
Table of Contents
CHITTENDEN CORPORATION
NOTES TO CONSOLIDATED FINANCIAL STATEMENTS—(Continued)
shares could be earned, or 62,190. In order to earn the full target award of 41,460, the Company would need to be ranked in the 75th percentile. If the Company is not ranked in at least the 25th percentile no shares will be awarded. Not withstanding these guidelines, the Board of Directors has the authority to reduce, but not increase, these awards if they deem it to be appropriate in the circumstances. Benefit expense related to this plan was $450,000 in 2005.
The following tables summarize information regarding the Company’s stock option plans:
| Weighted Average Exercise Price Per Share | Options | |||||
December 31, 2002 | $ | 19.98 | 2,449,139 | |||
Granted | 21.74 | 1,024,687 | ||||
Exercised | 15.98 | (368,214 | ) | |||
Expired | — | — | ||||
December 31, 2003 | 21.09 | 3,105,612 | ||||
Granted | 27.71 | 771,226 | ||||
Exercised | 18.35 | (529,292 | ) | |||
Expired | 28.83 | (313 | ) | |||
December 31, 2004 | 23.07 | 3,347,233 | ||||
Granted | 24.52 | 485,050 | ||||
Exercised | 21.66 | (452,184 | ) | |||
Expired | 6.53 | (6,476 | ) | |||
December 31, 2005 | $ | 23.49 | 3,373,623 | |||
OPTIONS OUTSTANDING AND EXERCISABLE
December 31, 2005
| Options Outstanding | Options Exercisable | |||||||||||
Range of Exercise | Options Outstanding | Weighted Contractual Life | Weighted Average Exercise Price | Options Outstanding | Weighted Average Exercise Price | |||||||
$ 7.72 - $20.15 | 738,173 | 5.24 | $ | 18.91 | 738,173 | $ | 18.91 | |||||
$20.24 - $22.89 | 831,102 | 5.76 | $ | 21.95 | 831,102 | $ | 21.95 | |||||
$22.93 - $24.50 | 796,836 | 8.33 | $ | 23.93 | 796,836 | $ | 23.93 | |||||
$24.60 - $29.46 | 943,470 | 7.68 | $ | 27.43 | 943,470 | $ | 27.43 | |||||
$29.77 - $36.02 | 64,042 | 2.78 | $ | 32.92 | 64,042 | $ | 32.92 | |||||
$ 7.72 - $36.02 | 3,373,623 | 6.73 | $ | 23.49 | 3,373,623 | $ | 23.49 | |||||
Note 11 EMPLOYEE BENEFITS
Pension Plan
The Company sponsors a qualified defined benefit pension plan that covers substantially all of its employees who meet minimum age and service requirements and the Chittenden Pension Account Plan provides benefits based on years of service and compensation earned during those years of service.
67
Table of Contents
CHITTENDEN CORPORATION
NOTES TO CONSOLIDATED FINANCIAL STATEMENTS—(Continued)
On May 18, 2005, the Board of Directors approved changes to the Company’s retirement program. As a result, on December 31, 2005, benefits accrued under the defined benefit Pension Account Plan were frozen based on participants’ current service and pay levels. Effective January 1, 2006, the Company’s annual contribution to the Incentive Savings and Profit Sharing Plan (401 (k) Plan) will be enhanced for all eligible employees. The change in the defined benefit plan resulted in the recognition of a curtailment gain of $1.5 million in the second quarter of 2005. The changes to the defined benefit pension plan have been reflected in the Company’s 2005 pension cost and year-end 2005 benefit obligation as shown below.
The changes in the benefit obligation for the years ended December 31, 2005 and 2004 are as follows:
| 2005 | 2004 | |||||||
| (in thousands) | ||||||||
Projected benefit obligation at beginning of year | $ | 71,378 | $ | 59,913 | ||||
Service cost | 4,189 | 3,419 | ||||||
Interest cost | 4,030 | 3,697 | ||||||
Plan amendments | — | 845 | ||||||
Actuarial loss | 1,901 | 5,412 | ||||||
Disbursements | (3,751 | ) | (1,908 | ) | ||||
Curtailment | (10,679 | ) | — | |||||
Projected benefit obligation at end of year | $ | 67,068 | $ | 71,378 | ||||
The accumulated benefit obligations for the pension plan at the end of 2005 and 2004 were $67,067,768 and $62,128,975, respectively.
Weighted-average assumptions used in determining pension obligations for the years ended December 31:
| 2005 | 2004 | |||||
Discount rate | 5.75 | % | 5.75 | % | ||
Rate of compensation increase | 4.50 | % | 4.50 | % |
The changes in the plan assets for the years ended December 31, 2005 and 2004 are as follows:
| 2005 | 2004 | |||||||
| (in thousands) | ||||||||
Fair value of assets at beginning of year | $ | 64,450 | $ | 57,146 | ||||
Actual return on plan assets | 4,877 | 4,212 | ||||||
Company contributions | 7,500 | 5,000 | ||||||
Disbursements | (3,751 | ) | (1,908 | ) | ||||
Fair value of assets at end of year | $ | 73,076 | $ | 64,450 | ||||
The asset allocation for the Company’s pension plan at December 31, 2004 and 2005, and the target asset allocation for 2006, by asset category are as follows:
Asset Category | 2004 | 2005 | Target Asset 2006 | ||||||
Equity securities | 63 | % | 67 | % | 40-75 | % | |||
Debt securities | 22 | % | 20 | % | 20-55 | % | |||
Cash | 15 | % | 13 | % | 0-20 | % | |||
Total | 100 | % | 100 | % |
68
Table of Contents
CHITTENDEN CORPORATION
NOTES TO CONSOLIDATED FINANCIAL STATEMENTS—(Continued)
Chittenden uses a measurement date of September 30 for its pension plan. The cash positions shown in the actual allocation are due to significant contributions made just prior to the measurement date, which at the time had not yet been allocated into other asset categories.
The Company’s investment policy seeks to achieve long-term capital growth to enable the plan to meet its future benefit obligations to participants and to maintain liquidity sufficient to cover plan distributions without exposing the Company to undue investment risk. The Retirement Plan Committee is responsible for overseeing the investment performance of the plan, including evaluating the performance of the investment managers. The Committee is also responsible for periodically reviewing the plan’s investment objectives and guidelines to ensure they remain appropriate.
The funded status of the plan year-end, reconciled to the amount on the statement of financial position, follows:
| 2005 | 2004 | |||||||
| (in thousands) | ||||||||
Fair value of plan assets | $ | 73,076 | $ | 64,450 | ||||
Projected benefit obligation | (67,068 | ) | (71,378 | ) | ||||
Funded status | 6,008 | (6,928 | ) | |||||
Prior service cost not yet recognized in net periodic pension cost | — | (1,911 | ) | |||||
Unrecognized net loss from actual experience versus assumptions | 11,928 | 21,595 | ||||||
Prepaid pension benefit included in other assets | $ | 17,936 | $ | 12,756 | ||||
| 2005 | 2004 | |||||||
| (in thousands) | ||||||||
Prepaid benefit cost | $ | 17,936 | $ | 12,756 | ||||
Accrued benefit cost | — | — | ||||||
Net amount recognized | $ | 17,936 | $ | 12,756 | ||||
At the end of 2005 and 2004, the projected benefit obligation, the accumulated benefit obligation and the fair value of plan assets for the pension plan with a projected benefit obligation in excess of plan assets and for the pension plan with an accumulated benefit obligation in excess of plan assets were as follows:
| Projected Benefit Obligation exceeds the Fair Value of Plan Assets | Accumulated Benefit Obligation exceeds the Fair Value of Plan Assets | ||||||||
| 2005 | 2004 | 2005 | 2004 | ||||||
Projected benefit obligation | — | $ | 71,378 | — | — | ||||
Accumulated benefit obligation | — | 62,129 | — | — | |||||
Fair value of plan assets | — | 64,450 | — | — | |||||
Employer contributions and benefit disbursements for the years ended December 31, 2004 and 2005, and expected contributions and benefit disbursements for 2006 are as follows:
| 2004 | 2005 | Projected 2006 | |||||||
Employer contribution | $ | 5,000 | $ | 7,500 | $ | — | |||
Benefit disbursements | 1,908 | 3,751 | $ | 3,500 | |||||
69
Table of Contents
CHITTENDEN CORPORATION
NOTES TO CONSOLIDATED FINANCIAL STATEMENTS—(Continued)
Due to recent contributions made in excess of the minimum required amounts, the Company does not anticipate a required contribution during 2006. However, it is possible that the Company, if appropriate to its tax and cash position, will make a voluntary contribution during 2006 to respond to changes in pension funding legislation and/or to further improve the plan’s funded status.
Net pension expense components included in employee benefits in the consolidated statements of income are as follows:
| December 31, | ||||||||||||
| 2005 | 2004 | 2003 | ||||||||||
| (in thousands) | ||||||||||||
Service cost | $ | 4,189 | $ | 3,419 | $ | 2,817 | ||||||
Interest cost | 4,030 | 3,697 | 3,376 | |||||||||
Expected return on plan assets | (4,803 | ) | (4,451 | ) | (3,544 | ) | ||||||
Net amortization: | ||||||||||||
Prior service cost | (380 | ) | (640 | ) | (590 | ) | ||||||
Net actuarial loss | 816 | 468 | — | |||||||||
Transition amount | — | (112 | ) | (129 | ) | |||||||
Total amortization | 436 | (284 | ) | (719 | ) | |||||||
Curtailment (gain) | (1,531 | ) | — | — | ||||||||
Net pension expense | $ | 2,321 | $ | 2,381 | $ | 1,930 | ||||||
Weighted-average assumptions used to determine net cost:
| 2005 | 2004 | 2003 | |||||||
Discount rate | 5.75% / 5.25 | %* | 6.00 | % | 6.50 | % | |||
Expected long term return on plan assets | 7.25 | % | 7.25 | % | 7.25 | % | |||
Rate of compensation increase | 4.50 | % | 4.50 | % | 4.50 | % |
| * | 5.75% was used to determine cost for the first eight months of 2005. As of May 31, 2005, the plan was remeasured due to the Company’s decision to change the delivery mechanism, effective January 1, 2006, for its employees’ pension benefit by redirecting it through the Company’s 401(k) plan. 5.25% was used for the last four months of cost of 2005. |
Based on a representative allocation within the target asset allocation described above, management expects an annual long-term return for its portfolio of 7.25%. In formulating this assumed long-term rate of return, the Company considered historical returns by asset category and expectations for future returns by asset category based, in part, on simulated capital market performance over the next 15 years. Resulting expected returns by asset category have been weighted based on the target asset allocation to produce the weighted average assumption of 7.25%.
Amounts resulting from changes in actuarial assumptions used to measure the Company’s benefit obligations are not recognized as they occur, but are amortized systematically over subsequent periods.
CTC has supplemental pension arrangements with certain retired employees. The liability, included in accrued expenses and other liabilities, related to such arrangements was $1,297,000 and $1,433,000 at December 31, 2005 and 2004, respectively.
70
Table of Contents
CHITTENDEN CORPORATION
NOTES TO CONSOLIDATED FINANCIAL STATEMENTS—(Continued)
The Company has established a supplemental executive retirement plan (SERP) for members of the executive management group. This unfunded plan is intended to cover only those benefits excluded from coverage under the Company’s qualified defined benefit pension plan as a result of IRS regulations. The design elements of this SERP mirror those of the Company’s qualified plan. In addition to the SERP, the Company has a separate arrangement with its Chief Executive Officer under which contributions are accrued based upon the Company’s return on equity (ROE). A ROE of 10% is the minimum threshold at which any contribution will be made. Benefits are payable upon attaining the age of 55, except in the event of death or disability. The liability related to the SERPs, included in accrued expenses and other liabilities was $5,021,000 and $4,530,000 at December 31, 2005 and 2004 respectively. Expenses related to this plan were $911,000, $760,000 and $614,000 in 2005, 2004 and 2003, respectively.
Other Benefit Plans
The Company has an incentive savings and profit sharing plan to provide eligible employees with a means to invest a portion of their earnings for retirement. Eligible employees of the Company may contribute, by salary reductions, up to 6% of their compensation as a basic employee contribution and may contribute up to an additional 20% of their compensation as a supplemental employee contribution. Investment in the Company’s common stock is one of the investment options available to employees; however, there are no restrictions on transfers or required holding periods.
During the three year period ended December 31, 2005, the Company made incentive savings contributions in amounts equal to 35% of each employee’s basic contribution, which was charged to benefits expense.
Year | 35% Contribution Amount | ||
2005 | $ | 1,320,000 | |
2004 | 1,322,000 | ||
2003 | 1,184,000 | ||
The Company may also make an additional matching contribution (profit-sharing) to the incentive savings and profit sharing plan based on the extent to which the annual corporate profitability goals established by the Board of Directors are met. Benefits expense related to the additional matching contribution totaled:
Year | Profit Sharing Contribution Amount | ||
2005 | $ | 922,000 | |
2004 | 376,000 | ||
2003 | 761,000 | ||
The following table reflects the shares of the Company’s common stock that were purchased through the incentive savings and profit sharing plan, during each of the last three years:
Year | Shares | |
2005 | 122,226 | |
2004 | 123,212 | |
2003 | 132,796 |
The Company has established a supplemental executive savings plan. This plan is intended to cover only those benefits excluded from coverage under the Corporation’s qualified incentive savings and profit sharing
71
Table of Contents
CHITTENDEN CORPORATION
NOTES TO CONSOLIDATED FINANCIAL STATEMENTS—(Continued)
plan as a result of IRS regulations. Any contributions under this supplemental plan, when combined with the regular pre-tax contributions shall not exceed 16% of the individual’s earnings. Benefit expense related to this plan was $110,000, $12,000 and $29,000 in 2005, 2004 and 2003, respectively.
The Company also has an Executive Management Incentive Compensation Plan. Executives at defined levels of responsibility are eligible to participate in the plan. Incentive award payments are determined on the basis of corporate and group profitability, relative performance within a defined peer group and individual performance. Awards may range from zero to 100% of annual compensation. Expenses for this plan totaled $2,235,000, $715,000 and $2,169,000 in 2005, 2004, and 2003, respectively.
The Company has a Directors’ Deferred Compensation Plan. Under the plan, Directors may defer fees and retainers that would otherwise be payable currently. Deferrals may be made to an uninsured interest bearing account or to an account recorded in equivalents of the Company’s common stock. Directors are required to defer 50% of their compensation (and may defer as much as 100%) in the equivalent of the Company’s common stock. Expenses for this plan totaled $1,256,000, $1,189,000, and $879,000 for 2005, 2004, and 2003, respectively. Based on these elections, shares that could be issued under the plan totaled 418,705 at December 31, 2005.
Note 12 FINANCIAL INSTRUMENTSWITH OFF-BALANCE SHEET RISK
In the normal course of business, to meet the financing needs of their customers and to reduce their own exposure to fluctuations in interest rates, the Banks are parties to financial instruments with off-balance sheet risk, held for purposes other than trading. The financial instruments involve, to varying degrees, elements of credit and interest rate risk in excess of the amount recognized in the consolidated balance sheets. The Banks’ exposure to credit losses in the event of nonperformance by the other party to the financial instrument, for loan commitments and standby letters of credit, is represented by the contractual amount of those instruments, assuming that the amounts are fully advanced and that collateral or other security is of no value. The Banks use the same credit policies in making commitments and conditional obligations as they do for on-balance sheet loans. The amount of collateral obtained, if deemed necessary by the Banks upon extension of credit, is based on management’s credit evaluation of the borrower. Collateral held varies, but may include accounts receivable, inventory, property, plant and equipment, and income-producing commercial properties.
Commitments to originate loans, unused lines of credit, and unadvanced portions of commercial real estate and construction loans are agreements to lend to a customer provided there is no violation of any condition established in the contract. Commitments generally have fixed expiration dates or other termination clauses and may require payment of a fee. Many of the commitments are expected to expire without being drawn upon. Therefore, the amounts presented below do not necessarily represent future cash requirements.
Standby letters of credit are conditional commitments issued by the Banks to guarantee the performance by a customer to a third party. These guarantees are issued primarily to support public and private borrowing arrangements, bond financings, and similar transactions. The credit risk involved in issuing letters of credit is essentially the same as that involved in extending loan commitments to customers.
72
Table of Contents
CHITTENDEN CORPORATION
NOTES TO CONSOLIDATED FINANCIAL STATEMENTS—(Continued)
Financial instruments whose contractual amounts represent off-balance sheet risk at December 31, 2005 and 2004 are as follows:
| 2005 | 2004 | |||||
| (in thousands) | ||||||
Loans and Other Commitments | ||||||
Commitments to originate new loans | $ | 120,635 | $ | 204,193 | ||
Unused home equity lines of credit | 365,040 | 313,526 | ||||
Unused portions of credit card lines | 55,393 | 39,921 | ||||
Unadvanced portions of commercial & industrial loans | 435,697 | 420,758 | ||||
Unadvanced portions of commercial real estate and construction loans | 245,523 | 173,878 | ||||
Equity investment commitments to limited partnerships | 13,186 | 4,785 | ||||
Standby Letters of Credit | ||||||
Notional amount of standby letters of credit fully collateralized by cash | 65,345 | 71,880 | ||||
Notional amount of other standby letters of credit | 32,430 | 29,938 | ||||
Liability associated with letters of credit recorded on balance sheet | 669 | 510 | ||||
Note 13 COMMITMENTSAND CONTINGENCIES
The Federal Reserve System requires nonmember banks to maintain certain reserve requirements of vault cash and/or deposits with the Federal Reserve Bank of Boston. The amount of this reserve requirement, included in cash and cash equivalents, was $29,483,000 and $26,097,000 at December 31, 2005 and 2004, respectively.
The Company has entered into severance agreements with the Chief Executive Officer and several members of senior management. These agreements are triggered by a change of control under certain circumstances. Payments are equal to 2.99 times annual salary for the Chief Executive Officer and from 1 to 2 times annual salary for the individual participating members of senior management.
Various legal claims against the Company arising in the normal course of business were outstanding at December 31, 2005. Management, after reviewing these claims with legal counsel, is of the opinion that the resolution of these claims will not have a material effect on the financial condition or results of operations of the Company.
Note 14 OTHER NONINTEREST EXPENSE
The components of other noninterest expense for the years presented are as follows:
| 2005 | 2004 | 2003 | ||||||||||
| (in thousands) | ||||||||||||
Legal and accounting | $ | 3,631 | $ | 2,695 | $ | 3,105 | ||||||
Marketing | 3,247 | 3,466 | 3,282 | |||||||||
Software and supplies | 7,344 | 7,845 | 7,288 | |||||||||
Net OREO and collection expenses | (51 | ) | (617 | ) | (129 | ) | ||||||
Telephone | 2,438 | 2,829 | 3,210 | |||||||||
Postage | 2,454 | 2,865 | 3,009 | |||||||||
Outside services | 2,101 | 2,430 | 2,308 | |||||||||
Other | 17,633 | 14,082 | 14,932 | |||||||||
| $ | 38,797 | $ | 35,595 | $ | 37,005 | |||||||
73
Table of Contents
CHITTENDEN CORPORATION
NOTES TO CONSOLIDATED FINANCIAL STATEMENTS—(Continued)
Note 15 FAIR VALUEOF FINANCIAL INSTRUMENTS
Cash and Cash Equivalents
The carrying amounts for cash and cash equivalents approximate fair value because they mature in 90 days or less and do not present unanticipated valuation risk.
Securities
The fair value of investment securities, other than Federal Home Loan Bank (FHLB) stock and Federal Reserve Bank stock (FRB), is based on quoted market prices. The carrying value of FHLB and FRB stock represents its redemption value.
Loans
Fair values are estimated for portfolios of loans with similar financial and credit characteristics. The loan portfolio was evaluated in the following segments: 1) commercial loans which include commercial & industrial, municipal, multi-family, commercial real estate and construction and 2) residential real estate loans including home equity credit lines.
The fair value of performing commercial loans is estimated by discounting cash flows through the estimated maturity using discount rates that reflect the expected maturity, credit and interest rate risk inherent in such loans. The fair value of nonperforming commercial loans is estimated using historical net charge-off experience applied to the nonperforming balances. For performing residential real estate loans, fair value is estimated by discounting contractual cash flows adjusted for prepayment estimates using discount rates based on secondary market sources. The fair value of municipal loans is estimated to be equal to amortized cost since most of these loans mature within nine months. The fair value of consumer loans is estimated based on secondary market prices for asset-backed securities with similar characteristics.
Mortgage Servicing Rights
The fair value is estimated by discounting the future cash flows through the estimated maturity of the underlying mortgage loans.
Deposits
The fair value of deposits with no stated maturity is equal to the amount payable on demand, that is, the carrying amount. The fair value of certificates of deposit is based on the discounted value of contractual cash flows. The discount rate used is based on the estimated rates currently offered for deposits of similar remaining maturities.
Borrowings
The fair value of long-term debt is based upon the discounted value of contractual cash flows using a discount rate consistent with currently offered rates of similar duration.
Commitments to Extend Credit and Standby Letters of Credit
The fair value of commitments to extend credit is estimated using the fees currently charged to enter into similar agreements, taking into account the remaining terms of the agreements and the present creditworthiness of the counterparties. For fixed rate loan commitments, fair value also considers the difference between current
74
Table of Contents
CHITTENDEN CORPORATION
NOTES TO CONSOLIDATED FINANCIAL STATEMENTS—(Continued)
levels of interest rates and the committed rates. The fair value of financial standby letters of credit is based on fees currently charged for similar agreements or on the estimated cost to terminate them or otherwise settle the obligations with the counterparties.
Assumptions
Fair value estimates are made at a specific point in time, based on relevant market information and information about specific financial instruments. These estimates do not reflect any premium or discount that could result from offering for sale at one time the Banks’ entire holdings of a particular financial instrument. Because no active observable market exists for a significant portion of the Banks’ financial instruments, fair value estimates are based on judgments regarding future expected loss experience, current economic conditions, risk characteristics of various financial instruments, and other factors. These estimates are subjective in nature and involve uncertainties and matters of significant judgment and therefore cannot be determined with precision. Changes in assumptions could significantly affect the estimates.
The estimated fair values of the Company’s financial instruments are as follows:
| December 31, | ||||||||||||
| 2005 | 2004 | |||||||||||
| Carrying Amount | Fair Value | Carrying Amount | Fair Value | |||||||||
| (in thousands) | ||||||||||||
Financial assets: | ||||||||||||
Cash and cash equivalents | $ | 180,707 | $ | 180,707 | $ | 136,468 | $ | 136,468 | ||||
Securities available for sale | 1,383,909 | 1,383,909 | 1,446,221 | 1,446,221 | ||||||||
FRB and FHLB stock | 19,352 | 19,352 | 19,243 | 19,243 | ||||||||
Loans, net | 4,426,668 | 4,403,151 | 4,018,162 | 4,029,935 | ||||||||
Loans held for sale | 19,737 | 19,737 | 33,535 | 33,535 | ||||||||
Mortgage servicing rights | 13,741 | 21,464 | 11,826 | 17,198 | ||||||||
Financial liabilities: | ||||||||||||
Deposits: | ||||||||||||
Demand | 973,752 | 988,096 | 890,561 | 890,561 | ||||||||
Savings | 489,734 | 489,734 | 519,623 | 519,623 | ||||||||
NOW | 861,000 | 861,000 | 890,701 | 890,701 | ||||||||
CMA / money market | 1,749,878 | 1,749,878 | 1,577,474 | 1,577,474 | ||||||||
Certificates of deposit less than $100,000 | 814,289 | 810,778 | 752,828 | 755,337 | ||||||||
Certificates of deposit of $100,000 and over | 625,682 | 623,959 | 407,543 | 406,539 | ||||||||
Borrowings | 227,323 | 227,201 | 356,471 | 356,214 | ||||||||
Commitments | 669 | 704 | 510 | 682 | ||||||||
75
Table of Contents
CHITTENDEN CORPORATION
NOTES TO CONSOLIDATED FINANCIAL STATEMENTS—(Continued)
Note 16 PARENT COMPANY FINANCIAL STATEMENTS
Chittenden Corporation (Parent Company Only)
BALANCE SHEETS
| December 31, | ||||||
| 2005 | 2004 | |||||
| (in thousands) | ||||||
Assets | ||||||
Cash and cash equivalents | $ | 88,657 | $ | 66,723 | ||
Investment in subsidiaries | 729,784 | 695,017 | ||||
Other assets | 6,351 | 14,868 | ||||
Total assets | $ | 824,792 | $ | 776,608 | ||
Liabilities and stockholders’ equity | ||||||
Liabilities: | ||||||
Accrued expenses and other liabilities | 37,268 | 31,351 | ||||
Other borrowings | 125,000 | 125,000 | ||||
Total liabilities | 162,268 | 156,351 | ||||
Total stockholders’ equity | 662,524 | 620,257 | ||||
Total liabilities and stockholders’ equity | $ | 824,792 | $ | 776,608 | ||
STATEMENTSOF INCOME
| Years Ended December 31, | |||||||||
| 2005 | 2004 | 2003 | |||||||
| (in thousands) | |||||||||
Operating income: | |||||||||
Dividends from bank subsidiaries | $ | 46,525 | $ | 49,525 | $ | 78,350 | |||
Interest income | — | — | 607 | ||||||
Total operating income | 46,525 | 49,525 | 78,957 | ||||||
Operating expense: | |||||||||
Interest expense | 6,682 | 4,284 | 2,795 | ||||||
Other operating expense | 2,232 | 1,163 | 3,823 | ||||||
Total expense | 8,914 | 5,447 | 6,618 | ||||||
Income before income taxes and equity in undistributed earnings of subsidiaries | 37,611 | 44,078 | 72,339 | ||||||
Income tax benefit | 3,298 | 1,938 | 2,301 | ||||||
Income before equity in undistributed earnings of subsidiaries | 40,909 | 46,016 | 74,640 | ||||||
Equity in undistributed earnings of subsidiaries | 42,482 | 29,111 | 159 | ||||||
Net income | $ | 83,391 | $ | 75,127 | $ | 74,799 | |||
76
Table of Contents
CHITTENDEN CORPORATION
NOTES TO CONSOLIDATED FINANCIAL STATEMENTS—(Continued)
STATEMENTSOF CASH FLOWS
| Years Ended December 31, | ||||||||||||
| 2005 | 2004 | 2003 | ||||||||||
| (in thousands) | ||||||||||||
Cash flows from operating activities: | ||||||||||||
Net income | $ | 83,391 | $ | 75,127 | $ | 74,799 | ||||||
Adjustments to reconcile net income to net cash provided by operating activities: | ||||||||||||
Equity in undistributed earnings of bank subsidiaries | (42,482 | ) | (29,111 | ) | (159 | ) | ||||||
Decrease in other assets | 8,517 | 2,615 | 2,438 | |||||||||
Increase in accrued expenses and other liabilities | 6,179 | 5,874 | 7,159 | |||||||||
Net cash provided by operating activities | 55,605 | 54,505 | 84,237 | |||||||||
Cash flows from investing activities: | ||||||||||||
Investments in and advanced to subsidiaries | (10,000 | ) | — | (122,998 | ) | |||||||
Net cash used in investing activities | (10,000 | ) | — | (122,998 | ) | |||||||
Cash flows from financing activities: | ||||||||||||
Proceeds from issuance of treasury and common stock | 9,783 | 9,765 | 6,082 | |||||||||
Dividends paid on common stock | (33,454 | ) | (31,889 | ) | (28,301 | ) | ||||||
Net cash provided by (used in) financing activities | (23,671 | ) | (22,124 | ) | (22,219 | ) | ||||||
Net increase (decrease) in cash and cash equivalents | 21,934 | 32,381 | (60,980 | ) | ||||||||
Cash and cash equivalents at beginning of year | 66,723 | 34,342 | 95,322 | |||||||||
Cash and cash equivalents at end of year | $ | 88,657 | $ | 66,723 | $ | 34,342 | ||||||
Note 17 REGULATORY MATTERS
The Company and the Banks are subject to various regulatory capital requirements administered by the federal banking agencies. Failure to meet minimum capital requirements can initiate certain mandatory and possibly additional discretionary actions by regulators that, if undertaken, could have a direct material effect on the Company’s financial statements. Under capital adequacy guidelines and the regulatory framework for prompt corrective action, the Company and the Banks must meet specific capital guidelines that involve quantitative measures of their assets, liabilities, and certain off-balance sheet items as calculated under regulatory accounting practices. Each entity’s capital amounts and classification are also subject to qualitative judgments by the regulators about components, risk weightings, and other factors.
Quantitative measures established by regulation to ensure capital adequacy require the Company and the Banks to maintain minimum amounts and ratios (set forth in the tables below) of total and Tier I capital (as defined in the regulation) to risk-weighted assets (as defined), and of Tier I capital to average assets (as defined). Management believes, as of December 31, 2005, that the Company and the Banks meet all capital adequacy requirements.
As of December 31, 2005, the Company and the Banks were “well capitalized” under the regulatory framework for prompt corrective action. To be categorized as adequately or well capitalized, the Company and the Banks must maintain minimum total risk-based, Tier 1 risk-based, and Tier 1 leverage ratios as set forth in the tables below.
77
Table of Contents
CHITTENDEN CORPORATION
NOTES TO CONSOLIDATED FINANCIAL STATEMENTS—(Continued)
The Company’s and the Banks’ actual capital amounts (dollars in thousands) and ratios are presented in the following tables:
| Actual | For Capital Adequacy Purposes | To Be Well Capitalized Under Prompt Corrective Action Provisions: | ||||||||||||||||
| Amount | Ratio | Amount | Ratio | Amount | Ratio | |||||||||||||
As of December 31, 2005 | ||||||||||||||||||
Total Capital (to Risk Weighted Assets): | ||||||||||||||||||
Consolidated | $ | 627,651 | 12.23 | % | $ | 410,563 | 8.00 | % | $ | 513,204 | 10.00 | % | ||||||
Chittenden Trust Company | 288,706 | 10.96 | 210,794 | 8.00 | 263,492 | 10.00 | ||||||||||||
Bank of Western Massachusetts | 68,566 | 11.02 | 49,800 | 8.00 | 62,250 | 10.00 | ||||||||||||
Flagship Bank and Trust | 46,887 | 11.31 | 33,179 | 8.00 | 41,474 | 10.00 | ||||||||||||
Maine Bank & Trust | 36,066 | 11.60 | 24,876 | 8.00 | 31,094 | 10.00 | ||||||||||||
Ocean National Bank | 135,712 | 11.34 | 95,749 | 8.00 | 119,687 | 10.00 | ||||||||||||
Tier 1 Capital (to Risk Weighted Assets): | ||||||||||||||||||
Consolidated | 567,190 | 11.05 | 205,344 | 4.00 | 308,016 | 6.00 | ||||||||||||
Chittenden Trust Company | 258,162 | 9.80 | 105,397 | 4.00 | 158,095 | 6.00 | ||||||||||||
Bank of Western Massachusetts | 60,766 | 9.76 | 24,959 | 4.00 | 37,438 | 6.00 | ||||||||||||
Flagship Bank and Trust | 42,543 | 10.26 | 16,589 | 4.00 | 24,884 | 6.00 | ||||||||||||
Maine Bank & Trust | 32,178 | 10.35 | 12,442 | 4.00 | 18,662 | 6.00 | ||||||||||||
Ocean National Bank | 121,827 | 10.18 | 47,875 | 4.00 | 71,812 | 6.00 | ||||||||||||
Tier 1 Capital (to Average Assets): | ||||||||||||||||||
Consolidated | 567,190 | 9.09 | 249,598 | 4.00 | 311,997 | 5.00 | ||||||||||||
Chittenden Trust Company | 258,162 | 7.87 | 131,285 | 4.00 | 164,107 | 5.00 | ||||||||||||
Bank of Western Massachusetts | 60,766 | 8.95 | 27,168 | 4.00 | 33,959 | 5.00 | ||||||||||||
Flagship Bank and Trust | 42,543 | 8.05 | 21,133 | 4.00 | 26,417 | 5.00 | ||||||||||||
Maine Bank & Trust | 32,178 | 9.74 | 13,222 | 4.00 | 16,527 | 5.00 | ||||||||||||
Ocean National Bank | 121,827 | 8.44 | 57,731 | 4.00 | 72,163 | 5.00 | ||||||||||||
78
Table of Contents
CHITTENDEN CORPORATION
NOTES TO CONSOLIDATED FINANCIAL STATEMENTS—(Continued)
| Actual | For Capital Adequacy Purposes | To Be Well Capitalized Under Prompt Corrective Action Provisions: | ||||||||||||||||
| Amount | Ratio | Amount | Ratio | Amount | Ratio | |||||||||||||
As of December 31, 2004: | ||||||||||||||||||
Total Capital (to Risk Weighted Assets): | ||||||||||||||||||
Consolidated | $ | 561,046 | 11.64 | % | $ | 385,499 | 8.00 | % | $ | 481,874 | 10.00 | % | ||||||
Chittenden Trust Company | 262,528 | 10.70 | 196,252 | 8.00 | 245,315 | 10.00 | ||||||||||||
Bank of Western Massachusetts | 56,634 | 10.15 | 44,638 | 8.00 | 55,797 | 10.00 | ||||||||||||
Flagship Bank and Trust | 41,038 | 10.82 | 30,345 | 8.00 | 37,931 | 10.00 | ||||||||||||
Maine Bank & Trust | 30,870 | 10.52 | 23,482 | 8.00 | 29,352 | 10.00 | ||||||||||||
Ocean National Bank | 125,588 | 10.96 | 91,660 | 8.00 | 114,576 | 10.00 | ||||||||||||
Tier 1 Capital (to Risk Weighted Assets): | ||||||||||||||||||
Consolidated | 503,097 | 10.44 | 192,793 | 4.00 | 289,190 | 6.00 | ||||||||||||
Chittenden Trust Company | 233,573 | 9.52 | 98,126 | 4.00 | 147,189 | 6.00 | ||||||||||||
Bank of Western Massachusetts | 49,647 | 8.90 | 22,359 | 4.00 | 33,538 | 6.00 | ||||||||||||
Flagship Bank and Trust | 36,774 | 9.70 | 15,172 | 4.00 | 22,759 | 6.00 | ||||||||||||
Maine Bank & Trust | 27,200 | 9.27 | 11,744 | 4.00 | 17,616 | 6.00 | ||||||||||||
Ocean National Bank | 111,515 | 9.73 | 45,830 | 4.00 | 68,745 | 6.00 | ||||||||||||
Tier 1 Capital (to Average Assets): | ||||||||||||||||||
Consolidated | 503,097 | 8.42 | 239,122 | 4.00 | 298,903 | 5.00 | ||||||||||||
Chittenden Trust Company | 233,573 | 7.49 | 124,790 | 4.00 | 155,987 | 5.00 | ||||||||||||
Bank of Western Massachusetts | 49,647 | 8.31 | 23,889 | 4.00 | 29,861 | 5.00 | ||||||||||||
Flagship Bank and Trust | 36,774 | 7.42 | 19,824 | 4.00 | 24,780 | 5.00 | ||||||||||||
Maine Bank & Trust | 27,200 | 9.19 | 11,838 | 4.00 | 14,798 | 5.00 | ||||||||||||
Ocean National Bank | 111,515 | 7.75 | 57,543 | 4.00 | 71,929 | 5.00 | ||||||||||||
Note 18 BUSINESS SEGMENTS
Statement of Financial Accounting Standards (SFAS) No. 131,Disclosures about Segments of an Enterprise and Related Informationhas established standards for public companies relating to the reporting of financial and descriptive information about their operating segments in financial statements. Operating segments are components of an enterprise, which are evaluated regularly by the chief operating decision maker in deciding how to allocate resources and in assessing performance. The Company’s chief operating decision maker is the President and Chief Executive Officer of the Company.
The Company has identified Commercial Banking as its reportable operating business segment based on the fact that the results of operations are viewed as a single strategic unit by the chief operating decision-maker. The Commercial Banking segment is comprised of the five Commercial Banking subsidiaries and CCC, which provide similar products and services, have similar distribution methods, types of customers and regulatory responsibilities. Commercial Banking derives its revenue from a wide range of banking services, including lending activities, acceptance of demand, savings and time deposits, business services, trust and investment management, brokerage services, mortgage banking, and loan servicing for investor portfolios.
Immaterial operating segments of the Company’s operations, which do not have similar characteristics to the commercial banking operations and do not meet the quantitative thresholds requiring disclosure, are included in the Other category in the disclosure of business segments below. Revenue derived from these segments includes insurance commissions from insurance products and services, as well as other operations associated with the parent holding company.
79
Table of Contents
CHITTENDEN CORPORATION
NOTES TO CONSOLIDATED FINANCIAL STATEMENTS—(Continued)
The accounting policies used in the disclosure of business segments are the same as those described in the summary of significant accounting policies. The consolidation adjustments reflect certain eliminations of inter-segment revenue in 2003, cash and parent company investments in subsidiaries.
The following tables present the results of the Company’s reportable operating business segments:
| Commercial Banking | Other (2) | Consolidation Adjustments | Consolidated | |||||||||||
Year Ended December 31, 2005 | ||||||||||||||
Net interest income (1) | $ | 250,995 | ($6,682 | ) | $ | — | $ | 244,313 | ||||||
Non interest income: | ||||||||||||||
Investment management income | 20,017 | — | — | 20,017 | ||||||||||
Service charges on deposits | 16,113 | — | — | 16,113 | ||||||||||
Mortgage servicing | 1,829 | — | — | 1,829 | ||||||||||
Gains on sales of loans, net | 9,021 | — | — | 9,021 | ||||||||||
Gains on sales of securities | 6 | — | — | 6 | ||||||||||
Loss on prepayment of borrowings | — | — | — | — | ||||||||||
Credit card income, net | 4,536 | — | — | 4,536 | ||||||||||
Insurance commissions, net | — | 6,365 | — | 6,365 | ||||||||||
Other non-interest income | 11,953 | 124 | — | 12,077 | ||||||||||
Total non-interest income | 63,475 | 6,489 | — | 69,964 | ||||||||||
Total income | 314,470 | (193 | ) | — | 314,277 | |||||||||
Provision for loan losses | 5,154 | — | — | 5,154 | ||||||||||
Depreciation and amortization expense | 10,415 | 418 | — | 10,833 | ||||||||||
Salaries and employee benefits | 94,011 | 15,581 | — | 109,592 | ||||||||||
Other non-interest expense | 66,974 | (8,691 | ) | — | 58,283 | |||||||||
Total non-interest expense | 171,400 | 7,308 | — | 178,708 | ||||||||||
Income (loss) before income taxes | 137,916 | (7,501 | ) | — | $ | 130,415 | ||||||||
Income tax expense (benefit) | 49,660 | (2,636 | ) | — | 47,024 | |||||||||
Net income (loss) | $ | 88,256 | ($4,865 | ) | $ | — | $ | 83,391 | ||||||
End of period assets | $ | 6,583,160 | $ | 862,408 | ($ | 980,898 | ) | $ | 6,464,670 | |||||
End of period loans, net | 4,426,668 | — | — | 4,426,668 | ||||||||||
End of period deposits | 5,602,992 | — | (88,657 | ) | 5,514,335 | |||||||||
Expenditures for long-lived assets | 3,465 | 61 | — | 3,526 | ||||||||||
80
Table of Contents
CHITTENDEN CORPORATION
NOTES TO CONSOLIDATED FINANCIAL STATEMENTS—(Continued)
| Commercial Banking | Other (2) | Consolidation Adjustments | Consolidated | |||||||||||||
Year Ended December 31, 2004 | ||||||||||||||||
Net interest Income (1) | $ | 229,782 | $ | (4,284 | ) | $ | — | $ | 225,498 | |||||||
Non interest income: | ||||||||||||||||
Investment management income | 21,622 | — | — | 21,622 | ||||||||||||
Service charges on deposits | 17,886 | — | — | 17,886 | ||||||||||||
Mortgage servicing | 159 | — | — | 159 | ||||||||||||
Gains on sales of loans, net | 9,661 | — | — | 9661 | ||||||||||||
Gains on sales of securities | 2,335 | — | — | 2,335 | ||||||||||||
Loss on prepayment of borrowings | (1,194 | ) | — | — | (1,194 | ) | ||||||||||
Credit card income, net | 4,150 | — | — | 4,150 | ||||||||||||
Insurance commissions, net | — | 6,966 | — | 6,966 | ||||||||||||
Other non-interest income | 11,725 | 95 | — | 11,820 | ||||||||||||
Total non-interest income | 66,344 | 7,061 | — | 73,405 | ||||||||||||
Total income | 296,126 | 2,777 | — | 298,903 | ||||||||||||
Provision for loan losses | 4,377 | — | — | 4,377 | ||||||||||||
Depreciation and amortization expense | 10,748 | 306 | — | 11,054 | ||||||||||||
Salaries and employee benefits | 93,145 | 13,432 | — | 106,577 | ||||||||||||
Other non-interest expense | 67,253 | (8,512 | ) | — | 58,741 | |||||||||||
Total non-interest expense | 171,146 | 5,226 | — | 176,372 | ||||||||||||
Income (loss) before income taxes | 120,603 | (2,449 | ) | — | 118,154 | |||||||||||
Income tax expense (benefit) | 44,157 | (1,130 | ) | — | 43,027 | |||||||||||
Net income (loss) | $ | 76,446 | ($1,319 | ) | $ | — | $ | 75,127 | ||||||||
End of period assets | $ | 6,166,544 | $ | 793,520 | ($ | 889,854 | ) | $ | 6,070,210 | |||||||
End of period loans, net | 4,018,162 | — | — | 4,018,162 | ||||||||||||
End of period deposits | 5,101,453 | — | (62,723 | ) | 5,038,730 | |||||||||||
Expenditures for long-lived assets | 9,945 | 173 | — | 10,118 | ||||||||||||
81
Table of Contents
CHITTENDEN CORPORATION
NOTES TO CONSOLIDATED FINANCIAL STATEMENTS—(Continued)
| Commercial Banking | Other (2) | Consolidation Adjustments | Consolidated | |||||||||||||
Year Ended December 31, 2003 | ||||||||||||||||
Net interest Income (1) | $ | 221,353 | $ | (3,290 | ) | $ | — | $ | 218,063 | |||||||
Non interest income: | ||||||||||||||||
Investment management income | 20,577 | — | — | 20,577 | ||||||||||||
Service charges on deposits | 18,396 | — | — | 18,396 | ||||||||||||
Mortgage servicing | 281 | — | — | 281 | ||||||||||||
Gains on sales of loans, net | 21,765 | — | — | 21,765 | ||||||||||||
Gains on sales of securities | 17,380 | — | — | 17,380 | ||||||||||||
Loss on prepayment of borrowings | (3,070 | ) | — | — | (3,070 | ) | ||||||||||
Credit card income, net | 4,079 | — | — | 4,079 | ||||||||||||
Insurance commissions, net | — | 6,870 | (184 | ) | 6,686 | |||||||||||
Other non-interest income | 10,957 | (20 | ) | — | 10,937 | |||||||||||
Total non-interest income | 90,365 | 6,850 | (184 | ) | 97,031 | |||||||||||
Total income | 311,718 | 3,560 | (184 | ) | 315,094 | |||||||||||
Provision for loan losses | 7,175 | — | — | 7,175 | ||||||||||||
Depreciation and amortization expense | 11,027 | 82 | — | 11,109 | ||||||||||||
Salaries and employee benefits | 95,995 | 14,014 | — | 110,009 | ||||||||||||
Other non-interest expense | 76,107 | (5,670 | ) | (184 | ) | 70,253 | ||||||||||
Total non-interest expense | 183,129 | 8,426 | (184 | ) | 191,371 | |||||||||||
Income (loss) before income taxes | 121,414 | (4,866 | ) | — | 116,548 | |||||||||||
Income tax expense (benefit) | 43,015 | (1,266 | ) | — | 41,749 | |||||||||||
Net income (loss) | $ | 78,399 | ($3,600 | ) | — | $ | 74,799 | |||||||||
End of period assets | $ | 5,917,806 | $ | 880,403 | ($ | 897,565 | ) | $ | 5,900,644 | |||||||
End of period loans, net | 3,667,220 | — | — | 3,667,220 | ||||||||||||
End of period deposits | 5,004,303 | — | (34,412 | ) | 4,969,891 | |||||||||||
Expenditures for long-lived assets | 13,090 | 53 | — | 13,143 | ||||||||||||
| (1) | The Commercial Banking segment derives a majority of its revenue from net interest income. In addition, management primarily relies on net interest income, not the gross revenue and expense amounts, in managing that segment. Therefore, only the net amount has been disclosed. |
| (2) | Revenue derived from these non-reportable segments includes insurance commissions from various insurance related products and services, as well as other operations associated with the parent holding company. |
Note 19 RECENT ACCOUNTING PRONOUNCEMENTS
In December 2004, the Financial Accounting Standards Board (FASB) issued Statement of Financial Accounting Standards No. 123R (“SFAS 123R”)(revised December 2004), Share-Based Payment, which establishes standards for the accounting for transactions in which an entity exchanges its equity instruments for goods or services. This statement does not change the accounting guidance for share-based payment transactions with parties other than employees provided in SFAS 123, however non-employee directors are included in the scope of SFAS 123R. This statement requires a public entity to measure the cost of employee services received in exchange for an award of equity instruments based on the grant-date fair value of the award. SFAS 123R allows the use of valuation models other than those prescribed in SFAS 123. On April 14, 2005, the Securities and Exchange Commission delayed the effective date for SFAS 123R, which allows companies to implement the statement at the beginning of their first fiscal year beginning after June 15, 2005, which will be January 1, 2006 for the Company. The pro forma costs of stock option expense estimated in Note 1 using the Black-Scholes method may not be representative of the costs recognized by the Company upon adoption of SFAS 123R because of, among other things, changes in the number of options granted in the future as well as future changes to underlying assumptions used in the model.
82
Table of Contents
Report of Independent Registered Public Accounting Firm
TOTHE BOARDOF DIRECTORSAND SHAREHOLDERSOF CHITTENDEN CORPORATION:
We have completed integrated audits of Chittenden Corporation’s 2005 and 2004 consolidated financial statements and of its internal control over financial reporting as of December 31, 2005, and an audit of its 2003 consolidated financial statements in accordance with the standards of the Public Company Accounting Oversight Board (United States). Our opinions, based on our audits, are presented below.
Consolidated financial statements
In our opinion, the consolidated financial statements listed in the accompanying index present fairly, in all material respects, the financial position of Chittenden Corporation (the “Company”) and its subsidiaries at December 31, 2005 and 2004, and the results of their operations and their cash flows for each of the three years in the period ended December 31, 2005 in conformity with accounting principles generally accepted in the United States of America. These financial statements are the responsibility of the Company’s management. Our responsibility is to express an opinion on these financial statements based on our audits. We conducted our audits of these statements in accordance with the standards of the Public Company Accounting Oversight Board (United States). Those standards require that we plan and perform the audit to obtain reasonable assurance about whether the financial statements are free of material misstatement. An audit of financial statements includes examining, on a test basis, evidence supporting the amounts and disclosures in the financial statements, assessing the accounting principles used and significant estimates made by management, and evaluating the overall financial statement presentation. We believe that our audits provide a reasonable basis for our opinion.
Internal control over financial reporting
Also, in our opinion, management’s assessment, included in Management’s Annual Report on Internal Control over Financial Reporting appearing under Item 9A, that the Company maintained effective internal control over financial reporting as of December 31, 2005 based on criteria established inInternal Control—Integrated Framework issued by the Committee of Sponsoring Organizations of the Treadway Commission (COSO), is fairly stated, in all material respects, based on those criteria. Furthermore, in our opinion, the Company maintained, in all material respects, effective internal control over financial reporting as of December 31, 2005, based on criteria established inInternal Control—Integrated Framework issued by the COSO. The Company’s management is responsible for maintaining effective internal control over financial reporting and for its assessment of the effectiveness of internal control over financial reporting. Our responsibility is to express opinions on management’s assessment and on the effectiveness of the Company’s internal control over financial reporting based on our audit. We conducted our audit of internal control over financial reporting in accordance with the standards of the Public Company Accounting Oversight Board (United States). Those standards require that we plan and perform the audit to obtain reasonable assurance about whether effective internal control over financial reporting was maintained in all material respects. An audit of internal control over financial reporting includes obtaining an understanding of internal control over financial reporting, evaluating management’s assessment, testing and evaluating the design and operating effectiveness of internal control, and performing such other procedures as we consider necessary in the circumstances. We believe that our audit provides a reasonable basis for our opinions.
A company’s internal control over financial reporting is a process designed to provide reasonable assurance regarding the reliability of financial reporting and the preparation of financial statements for external purposes in accordance with generally accepted accounting principles. A company’s internal control over financial reporting includes those policies and procedures that (i) pertain to the maintenance of records that, in reasonable detail, accurately and fairly reflect the transactions and dispositions of the assets of the company; (ii) provide reasonable assurance that transactions are recorded as necessary to permit preparation of financial statements in accordance with generally accepted accounting principles, and that receipts and expenditures of the company are being made only in accordance with authorizations of management and directors of the company; and (iii) provide reasonable
83
Table of Contents
assurance regarding prevention or timely detection of unauthorized acquisition, use, or disposition of the company’s assets that could have a material effect on the financial statements.
Because of its inherent limitations, internal control over financial reporting may not prevent or detect misstatements. Also, projections of any evaluation of effectiveness to future periods are subject to the risk that controls may become inadequate because of changes in conditions, or that the degree of compliance with the policies or procedures may deteriorate.

PricewaterhouseCoopers LLP
Montpelier, VT
February 17, 2006
84
Table of Contents
MANAGEMENT’S STATEMENTOF RESPONSIBILITY
The consolidated financial statements contained in this annual report on Form 10-K have been prepared in accordance with generally accepted accounting principles and, where appropriate, include amounts based upon management’s best estimates and judgments. Management is responsible for the integrity and the fair presentation of the consolidated financial statements and related information.
Management maintains a system of internal controls to provide reasonable assurance that the Company’s assets are safeguarded against loss and that transactions are executed in accordance with management’s authorization and recorded properly to permit the preparation of consolidated financial statements in accordance with generally accepted accounting principles in the United States of America. These internal controls include the establishment and communication of policies and procedures, the selection and training of qualified personnel and an internal auditing program that evaluates the adequacy and effectiveness of such internal controls, policies and procedures. Management recognizes that even a highly effective internal control system has inherent risks, including the possibility of human error and the circumvention or overriding of controls, and that the effectiveness of an internal control system can change with circumstances. However, management believes that the internal control system provides reasonable assurance that errors or irregularities that could be material to the consolidated financial statements are prevented or would be detected on a timely basis and corrected through the normal course of business. As of December 31, 2005, management believes the internal controls were in place and operating effectively.
The Board of Directors discharges its responsibility for the consolidated financial statements through its Audit Committee, which is comprised entirely of non-employee directors. The Audit Committee meets periodically with management, internal auditors and the independent public accountants. The internal auditors and the independent public accountants have direct full and free access to the Audit Committee and meet with it, with and without management being present, to discuss the scope and results of their audits and any recommendations regarding the system of internal controls.
The independent accountants were engaged to perform an independent audit of the consolidated financial statements. They have conducted their audit in accordance with the standards of the Public Company Accounting Oversight Board (United States) as stated in their report which appears on page 83 and 84.
 |  | |||
| Paul A. Perrault | Kirk W. Walters | |||
| President, Chief Executive Officer and Chair of Board of Directors | Executive Vice President and Chief Financial Officer | |||
85
Table of Contents
QUARTERLY FINANCIAL DATA (Unaudited)
A summary of quarterly financial data for 2005 and 2004 is presented below:
| Three Months Ended | ||||||||||||
| March 31 | June 30 | Sept. 30 | Dec. 31 | |||||||||
| (in thousands, except per share amounts) | ||||||||||||
2005 | ||||||||||||
Total interest income | $ | 73,212 | $ | 77,615 | $ | 82,621 | $ | 86,794 | ||||
Total interest expense | 14,227 | 17,535 | 20,406 | 23,761 | ||||||||
Net interest income | 58,985 | 60,080 | 62,215 | 63,033 | ||||||||
Provision for loan losses | 1,075 | 1,400 | 1,325 | 1,354 | ||||||||
Noninterest income | 17,559 | 17,176 | 17,778 | 17,451 | ||||||||
Noninterest expense | 45,440 | 43,380 | 44,660 | 45,228 | ||||||||
Income before income taxes | 30,029 | 32,476 | 34,008 | 33,902 | ||||||||
Income tax expense | 10,947 | 11,670 | 12,321 | 12,086 | ||||||||
Net income | $ | 19,082 | $ | 20,806 | $ | 21,687 | $ | 21,816 | ||||
Basic earnings per share | $ | 0.41 | $ | 0.45 | $ | 0.47 | $ | 0.46 | ||||
Diluted earnings per share | 0.41 | 0.44 | 0.46 | 0.46 | ||||||||
Dividends paid per share | 0.18 | 0.18 | 0.18 | 0.18 | ||||||||
| Three Months Ended | ||||||||||||
| March 31 | June 30 | Sept. 30 | Dec. 31 | |||||||||
| (in thousands, except per share amounts) | ||||||||||||
2004 | ||||||||||||
Total interest income | $ | 64,854 | $ | 65,283 | $ | 67,969 | $ | 71,661 | ||||
Total interest expense | 10,143 | 10,359 | 11,300 | 12,467 | ||||||||
Net interest income | 54,711 | 54,924 | 56,669 | 59,194 | ||||||||
Provision for loan losses | 427 | 1,100 | 1,025 | 1,825 | ||||||||
Noninterest income | 18,003 | 20,638 | 17,841 | 16,923 | ||||||||
Noninterest expense | 44,602 | 45,963 | 42,811 | 42,996 | ||||||||
Income before income taxes | 27,685 | 28,499 | 30,674 | 31,296 | ||||||||
Income tax expense | 10,218 | 10,345 | 11,196 | 11,268 | ||||||||
Net income | $ | 17,467 | $ | 18,154 | $ | 19,478 | $ | 20,028 | ||||
Basic earnings per share | $ | 0.38 | $ | 0.40 | $ | 0.42 | $ | 0.43 | ||||
Diluted earnings per share | 0.37 | 0.39 | 0.42 | 0.43 | ||||||||
Dividends paid per share | 0.16 | 0.18 | 0.18 | 0.18 | ||||||||
86
Table of Contents
| ITEM 9 | CHANGES IN AND DISAGREEMENTS WITH ACCOUNTANTS ON ACCOUNTING AND FINANCIAL DISCLOSURE |
None
ITEM 9A CONTROLS AND PROCEDURES
As required by Rule 13a-15 under the Securities Exchange Act of 1934, as of December 31, 2005, the end of the period covered by this report, the Company carried out an evaluation under the supervision and with the participation of the Company’s management, including the Company’s Chief Executive Officer and Chief Financial Officer, of the effectiveness of the design and operation of the Company’s disclosure controls and procedures. In designing and evaluating the Company’s disclosure controls and procedures, the Company and its management recognize that any controls and procedures, no matter how well designed and operated, can provide only reasonable assurance of achieving the desired control objectives, and the Company’s management necessarily was required to apply its judgment in evaluating and implementing possible controls and procedures. Based upon that evaluation, the Chief Executive Officer and Chief Financial Officer concluded that the Company’s disclosure controls and procedures are effective to provide reasonable assurance that information required to be disclosed by the Company in the reports it files or submits under the Exchange Act is recorded, processed, summarized and reported, within the time periods specified in the Securities and Exchange Commission’s rules and forms. Also, based on management’s evaluation, there was no change in the Company’s internal control over financial reporting that occurred during the fiscal quarter ended December 31, 2005 that has materially affected, or is reasonably likely to materially affect, the Company’s internal control over financial reporting. The Company reviews its disclosure controls and procedures, which may include its internal control over financial reporting on an ongoing basis, and may from time to time make changes aimed at enhancing their effectiveness and to ensure that the Company’s systems evolve with its business.
MANAGEMENT’S ANNUAL REPORT ON INTERNAL CONTROL OVER FINANCIAL REPORTING
The Management of Chittenden Corporation is responsible for establishing and maintaining adequate internal control over financial reporting and for identifying the framework used to evaluate its effectiveness. Chittenden’s system of internal control over financial reporting was designed to provide reasonable assurance to the Company’s management and Board of Directors regarding the preparation and fair presentation of financial statements in accordance with Generally Accepted Accounting Principles.
All internal control systems, no matter how well designed, have inherent limitations. Therefore, even those systems determined to be effective can provide only reasonable assurance with respect to financial statement preparation and presentation.
Chittenden’s management including the Company’s CEO and CFO, assessed the effectiveness of the company’s internal control over financial reporting as of December 31, 2005. In making this assessment, it used the criteria set forth by the Committee of Sponsoring Organizations of the Treadway Commission (COSO) in Internal Control-Integrated Framework. Based on our assessment, management concluded that, as of December 31, 2005, the Company’s internal control over financial reporting was effective based on those criteria.
Chittenden’s independent auditors, PricewaterhouseCoopers, LLP, an independent registered public accounting firm, have issued an attestation report on our management’s assessment of the Company’s internal control over financial reporting. Their report is included herein below.
ATTESTATION REPORT OF THE REGISTERED PUBLIC ACCOUNTING FIRM
See Report of Independent Registered Public Accounting Firm on pages 83 and 84.
On October 19, 2005, the Board, after analyzing the retainers paid to the Boards of other Bank Holding Companies in its peer group, voted to increase the annual retainer paid to its members from $8,000 to $12,000 on a pro rata basis effective October 1, 2005.
87
Table of Contents
PART III
ITEM 10 DIRECTORS AND EXECUTIVE OFFICERS OF THE REGISTRANT
Information with respect to directors and executive officers of the Company required by Item 10 shall be included in the Proxy Statement and is incorporated herein by reference.
The Company’s Policy on Ethics and Professional Standards was approved by the Chittenden Board of Directors on September 17, 2003 and is available on the Company’s website atwww.chittendencorp.com. A copy of the Code of Ethics will be provided to any person without charge upon request to the Secretary of the Company.
ITEM 11 EXECUTIVE COMPENSATION
Information with respect to executive compensation required by Item 11 shall be included in the Proxy Statement and is incorporated herein by reference.
| ITEM 12 | SECURITY OWNERSHIP OF CERTAIN BENEFICIAL OWNERS AND MANAGEMENT AND RELATED STOCKHOLDER MATTERS |
Information with respect to security ownership of certain beneficial owners and management required by Item 12 shall be included in the Proxy Statement and is incorporated herein by reference.
ITEM 13 CERTAIN RELATIONSHIPS AND RELATED TRANSACTIONS
Information with respect to certain relationships and related transactions required by Item 13 shall be included in the Proxy Statement and is incorporated herein by reference.
ITEM 14 PRINCIPAL ACCOUNTING FEES AND SERVICES
Information with respect to principal accounting fees and services required by Item 14 shall be included in the Proxy Statement and is incorporated herein by reference.
88
Table of Contents
PART IV
ITEM 15 EXHIBITS AND FINANCIAL STATEMENT SCHEDULES
(a)
(1) FINANCIAL STATEMENTS
The financial statements of the Company and its subsidiaries are included in Part II, Item 8 hereof and are incorporated herein by reference.
(2) FINANCIAL STATEMENT SCHEDULES
There are no financial statement schedules required to be included in this report.
(3) EXHIBITS
(a) The following are included as exhibits to this report:
| 3 (i).1 | Amended and restated Articles of Incorporation of the Company, incorporated herein by reference to the Proxy Statement for the 1999 Annual Meeting of Stockholders. | |
| 3 (ii).1 | By-laws of the Company, as amended and restated as of October 18, 1997 and further amended as of January 21, 2004 is incorporated herein by reference to the Company’s Annual Report on Form 10-K for the year ended December 31, 2003. | |
| 4. | Statement of the Company regarding its Dividend Reinvestment Plan is incorporated herein by reference to the Company’s Annual Report on Form 10-K for the year ended December 31, 1993. | |
| 10.1 | Directors’ Deferred Compensation Plan, dated April 1972, as amended May 20, 1992, incorporated herein by reference to the Company’s Annual Report on Form 10-K for the year ended December 31, 1992. | |
| 10.2 | Amended and Restated Pension Plan, incorporated herein by reference to the Company’s Annual Report on Form 10-Q for the period ended September 30, 1996. | |
| 10.3 | Incentive Savings and Profit Sharing Plan, attached to the Company’s Annual Report on Form 10-K for the year ended December 31, 1994, as amended for the year ended December 31, 1995. | |
| 10.4 | Letter from the Company to Paul A. Perrault, dated July 26, 1990, regarding terms of employment, incorporated herein by reference to the Company’s Annual Report on Form 10-K for the year ended December 31, 1990. | |
| 10.7 | Executive Management Incentive Compensation Plan (“EMICP”), incorporated herein by reference to the Company’s Annual Report on Form 10-K for the year ended December 31, 1994. | |
| 10.8 | Amendment to EMICP to increase cap on awards from 60% to 100% of base salary, incorporated herein by reference to the Company’s Annual Report on Form 10-K for the year ended December 31, 1996. | |
| 10.9 | The Company’s Stock Incentive Plan, amended and restated February 21, 2001, incorporated herein by reference to the Company’s Proxy Statement for the 2001 Annual Meeting of Stockholders. | |
| 10.10 | Compensation plan of Paul A. Perrault, incorporated herein by reference to the Company’s Annual Report on Form 10-K for the year ended December 31, 1996. | |
| 10.11 | Supplemental Executive Retirement Plan of Paul A. Perrault, incorporated herein by reference to the Company’s Annual Report on Form 10-K for the year ended December 31, 2002. | |
| 10.12 | Supplemental Executive Cash Balance Restoration Plan, incorporated herein by reference to the Company’s Annual Report on Form 10-K for the year ended December 31, 1997. | |
89
Table of Contents
| 10.13 | Supplemental Executive Savings Plan, incorporated herein by reference to the Company’s Annual Report on Form 10-K for the year ended December 31, 1997. | |
| 10.14 | The Company’s Amended and Restated Directors’ Omnibus Long-Term Incentive Plan, incorporated herein by reference to the Company’s Proxy Statement for the 2002 Annual Meeting of Stockholders. | |
| 10.15 | Chittenden Corporation Stock Incentive Plan Option Agreement, incorporated herein by reference to the Company’s quarterly report on Form 10-Q for the quarter ended September 30, 2004. | |
| 10.16 | Chittenden Corporation Amended and Restated Directors’ Omnibus Long-Term Incentive Plan—Non-Employee Director Stock Option Agreement, incorporated herein by reference to the Company’s quarterly report on Form 10-Q for the quarter ended September 30, 2004. | |
| 10.17 | Employment Agreement of Paul A. Perrault incorporated herein by reference to the Company’s Annual Report on Form 10-K for the year ended December 31, 2004. | |
| 10.18 | Employment Agreement of Kirk W. Walters incorporated herein by reference to the Company’s Annual Report on Form 10-K for the year ended December 31, 2004. | |
| 10.19 | Employment Agreement of John P. Barnes incorporated herein by reference to the Company’s Annual Report on Form 10-K for the year ended December 31, 2004. | |
| 10.20 | Employment Agreement of John W. Kelly incorporated herein by reference to the Company’s Annual Report on Form 10-K for the year ended December 31, 2004. | |
| 10.21 | Employment Agreement of F. Sheldon Prentice incorporated herein by reference to the Company’s Annual Report on Form 10-K for the year ended December 31, 2004. | |
| 10.22 | Chittenden Corporation Performance Share Program, incorporated herein by reference to the Company’s Quarterly report for the quarter ended March 31, 2005. | |
| 10.23 | Chittenden Corporation Form of Performance Share Award Agreement, incorporated herein by reference to the Company’ Quarterly Report for the quarter ended September 30, 2005. | |
| *10.24 | Employment Agreement of Danny H. O’Brien. | |
| 14 | The Company’s Policy on Ethics and Professional Standards was approved by the Chittenden Board of Directors on September 17, 2003 and is available onwww.chittendencorp.com. A copy of the code of ethics will be provided to any person without charge upon request to the Secretary of the Company. | |
| *21 | List of subsidiaries of the Registrant. | |
| *23 | Consent of PricewaterhouseCoopers LLP | |
| *31.1 | Certification of Chairman, President and Chief Executive Officer Paul A. Perrault required by Section 302 of the Sarbanes-Oxley Act of 2002. | |
| *31.2 | Certification of Executive Vice President and Chief Financial Officer Kirk W. Walters required by Section 302 of the Sarbanes-Oxley Act of 2002. | |
| *32.1 | Certification of Chairman, President and Chief Executive Officer Paul A. Perrault required by Section 906 of the Sarbanes-Oxley Act of 2002. | |
| *32.2 | Certification of Executive Vice President and Chief Financial Officer Kirk W. Walters required by Section 906 of the Sarbanes-Oxley Act of 2002. | |
| * | Filed / furnished herewith |
90
Table of Contents
EXHIBITS
(c)
EXHIBIT 21 LIST OF SUBSIDIARIES OF CHITTENDEN CORPORATION
Chittenden Trust Company, Vermont, d/b/a Chittenden Bank, and Mortgage Service Center, Chittenden Trust Company’s subsidiaries Chittenden Securities, Inc., Chittenden Insurance Products and Services, Inc, d/b/a The Chittenden Insurance Group, and Chittenden Commercial Finance
The Bank of Western Massachusetts, Massachusetts
Flagship Bank and Trust Company, Massachusetts
Maine Bank & Trust, Maine
Ocean National Bank, New Hampshire and Maine
Chittenden Connecticut Corporation, Vermont, d/b/a Mortgage Service Center
EXHIBIT 23 CONSENT OF PRICEWATERHOUSECOOPERS HAS BEEN FILED AS AN EXHIBIT
91
Table of Contents
Pursuant to the requirements of Section 13 or 15 (d) of the Securities Exchange Act of 1934, the registrant has duly caused this report to be signed on its behalf by the undersigned, thereto duly authorized.
Date: February 15, 2006 | CHITTENDEN CORPORATION | |||||||
By: | /s/ PAUL A. PERRAULT | |||||||
| Paul A. Perrault | ||||||||
President, Chief Executive Officer and Chairman of the Board of Directors | ||||||||
Table of Contents
SIGNATURES
Pursuant to the requirements of the Securities Exchange Act of 1934, this report has been signed below by the following persons on behalf of the registrant and in the capacities and on the dates indicated.
NAME | TITLE | DATE | ||
/s/ PAUL A. PERRAULT | President, Chief Executive Officer and Chairman of the Board of Directors | 2/15/06 | ||
/s/ KIRK W. WALTERS | Executive Vice President, Chief Financial Officer and Treasurer (principal financial and accounting officer) | 2/15/06 | ||
/s/ SALLY W. CRAWFORD | Director | 2/15/06 | ||
PHILIP M. DRUMHELLER | Director | 2/15/06 | ||
JOHN K. DWIGHT | Director | 2/15/06 | ||
LYN HUTTON | Director | 2/15/06 | ||
/s/ JAMES C. PIZZAGALLI | Director | 2/15/06 | ||
/s/ ERNEST A. POMERLEAU | Director | 2/15/06 | ||
/s/ MARK W. RICHARDS | Director | 2/15/06 | ||
/s/ CHARLES W. SMITH, JR. | Director | 2/15/06 | ||
/s/ PALL D. SPERA | Director | 2/15/06 | ||
/s/ OWEN W. WELLS | Director | 2/15/06 | ||
Table of Contents
CHITTENDEN CORPORATION
SKU-#0667-TK-06