| FREE WRITING PROSPECTUS | ||
| FILED PURSUANT TO RULE 433 | ||
| REGISTRATION FILE NO.: 333-257991-09 | ||
 |  |  |
Free Writing Prospectus
Structural and Collateral Term Sheet
$914,466,875
(Approximate Initial Pool Balance)
$828,735,000
(Approximate Aggregate Certificate Balance of Offered Certificates)
MSWF Commercial Mortgage Trust 2023-2
as Issuing Entity
Wells Fargo Commercial Mortgage Securities, Inc.
as Depositor
Wells Fargo Bank, National Association
Morgan Stanley Mortgage Capital Holdings LLC
Argentic Real Estate Finance 2 LLC
Bank of America, National Association
Starwood Mortgage Capital LLC
as Sponsors and Mortgage Loan Sellers
Commercial Mortgage Pass-Through Certificates
Series 2023-2
December 3, 2023
| WELLS FARGO SECURITIES | BofA SECURITIES | MORGAN STANLEY |
Co-Lead Manager and Joint Bookrunner | Co-Lead Manager and Joint Bookrunner | Co-Lead Manager and Joint Bookrunner |
Academy Securities Co-Manager | Drexel Hamilton Co-Manager | Siebert Williams Shank Co-Manager |
STATEMENT REGARDING THIS FREE WRITING PROSPECTUS
The depositor has filed a registration statement (including a prospectus) with the Securities and Exchange Commission (“SEC”) (SEC File No. 333-257991) for the offering to which this communication relates. Before you invest, you should read the prospectus in the registration statement and other documents the depositor has filed with the SEC for more complete information about the depositor, the issuing entity and this offering. You may get these documents for free by visiting EDGAR on the SEC Web site at www.sec.gov. Alternatively, the depositor, any underwriter, or any dealer participating in the offering will arrange to send you the prospectus after filing if you request it by calling toll free 1-800-745-2063 (8 a.m. – 5 p.m. Eastern Time) or by emailing wfs.cmbs@wellsfargo.com.
Nothing in this document constitutes an offer of securities for sale in any jurisdiction where the offer or sale is not permitted. The information contained herein is preliminary as of the date hereof, supersedes any such information previously delivered to you and will be superseded by any such information subsequently delivered and ultimately by the final prospectus relating to the securities. These materials are subject to change, completion, supplement or amendment from time to time.
This free writing prospectus has been prepared by the underwriters for information purposes only and does not constitute, in whole or in part, a prospectus for the purposes of (i) Regulation (EU) 2017/1129 (as amended), (ii) such Regulation as it forms part of UK domestic law, or (iii) Part VI of the UK Financial Services and Markets Act 2000, as amended; and does not constitute an offering document for any other purpose.
STATEMENT REGARDING ASSUMPTIONS AS TO SECURITIES, PRICING ESTIMATES AND OTHER INFORMATION
The attached information contains certain tables and other statistical analyses (the “Computational Materials”) which have been prepared in reliance upon information furnished by the Mortgage Loan Sellers. Numerous assumptions were used in preparing the Computational Materials, which may or may not be reflected herein. As such, no assurance can be given as to the Computational Materials’ accuracy, appropriateness or completeness in any particular context; or as to whether the Computational Materials and/or the assumptions upon which they are based reflect present market conditions or future market performance. The Computational Materials should not be construed as either projections or predictions or as legal, tax, financial or accounting advice. You should consult your own counsel, accountant and other advisors as to the legal, tax, business, financial and related aspects of a purchase of these securities. Any weighted average lives, yields and principal payment periods shown in the Computational Materials are based on prepayment and/or loss assumptions, and changes in such prepayment and/or loss assumptions may dramatically affect such weighted average lives, yields and principal payment periods. In addition, it is possible that prepayments or losses on the underlying assets will occur at rates higher or lower than the rates shown in the attached Computational Materials. The specific characteristics of the securities may differ from those shown in the Computational Materials due to differences between the final underlying assets and the preliminary underlying assets used in preparing the Computational Materials. The principal amount and designation of any security described in the Computational Materials are subject to change prior to issuance. None of Wells Fargo Securities, LLC, Morgan Stanley & Co. LLC, BofA Securities, Inc., Academy Securities, Inc., Drexel Hamilton, LLC, Siebert Williams Shank & Co., LLC or any of their respective affiliates, make any representation or warranty as to the actual rate or timing of payments or losses on any of the underlying assets or the payments or yield on the securities. The information in this presentation is based upon management forecasts and reflects prevailing conditions and management’s views as of this date, all of which are subject to change. In preparing this presentation, we have relied upon and assumed, without independent verification, the accuracy and completeness of all information available from public sources or which was provided to us by or on behalf of the Mortgage Loan Sellers or which was otherwise reviewed by us.
This free writing prospectus contains certain forward-looking statements. If and when included in this free writing prospectus, the words “expects”, “intends”, “anticipates”, “estimates” and analogous expressions and all statements that are not historical facts, including statements about our beliefs or expectations, are intended to identify forward-looking statements. Any forward-looking statements are made subject to risks and uncertainties which could cause actual results to differ materially from those stated. Those risks and uncertainties include, among other things, declines in general economic and business conditions, increased competition, changes in demographics, changes in political and social conditions, regulatory initiatives and changes in customer preferences, many of which are beyond our control and the control of any other person or entity related to this offering. The forward-looking statements made in this free writing prospectus are made as of the date stated on the cover. We have no obligation to update or revise any forward-looking statement.
Wells Fargo Securities is the trade name for the capital markets and investment banking services of Wells Fargo & Company and its subsidiaries, including but not limited to Wells Fargo Securities, LLC, a member of NYSE, FINRA, NFA and SIPC, Wells Fargo Prime Services, LLC, a member of FINRA, NFA and SIPC, and Wells Fargo Bank, N.A. Wells Fargo Securities, LLC and Wells Fargo Prime Services, LLC are distinct entities from affiliated banks and thrifts.
“BofA Securities” is the marketing name for the global banking and global markets businesses of Bank of America Corporation. Lending, derivatives, and other commercial banking activities are performed globally by banking affiliates of Bank of America Corporation, including Bank of America, N.A., member FDIC. Securities, strategic advisory, and other investment banking activities are performed globally by investment banking affiliates of Bank of America Corporation, including, in the United States, BofA Securities, Inc., which is a registered broker-dealer and member of FINRA and SIPC, and, in other jurisdictions, locally registered entities.
IMPORTANT NOTICE REGARDING THE OFFERED CERTIFICATES
The information herein is preliminary and may be supplemented or amended prior to the time of sale. In addition, the Offered Certificates referred to in these materials and the asset pool backing them are subject to modification or revision (including the possibility that one or more classes of certificates may be split, combined or eliminated at any time prior to issuance or availability of a final prospectus) and are offered on a “when, as and if issued” basis.
The underwriters described in these materials may from time to time perform investment banking services for, or solicit investment banking business from, any company named in these materials. The underwriters and/or their affiliates or respective employees may from time to time have a long or short position in any security or contract discussed in these materials.
The information contained herein supersedes any previous such information delivered to any prospective investor and will be superseded by information delivered to such prospective investor prior to the time of sale.
IMPORTANT NOTICE RELATING TO AUTOMATICALLY-GENERATED EMAIL DISCLAIMERS
Any legends, disclaimers or other notices that may appear at the bottom of any email communication to which this free writing prospectus is attached relating to (1) these materials not constituting an offer (or a solicitation of an offer), (2) any representation that these materials are accurate or complete and may not be updated or (3) these materials possibly being confidential, are not applicable to these materials and should be disregarded. Such legends, disclaimers or other notices have been automatically generated as a result of these materials having been sent via Bloomberg or another system.
| THE INFORMATION IN THIS STRUCTURAL AND COLLATERAL TERM SHEET IS NOT COMPLETE AND MAY BE AMENDED PRIOR TO THE TIME OF SALE. THIS TERM SHEET IS NOT AN OFFER TO SELL THESE SECURITIES AND IT IS NOT A SOLICITATION OF AN OFFER TO BUY THESE SECURITIES IN ANY JURISDICTION WHERE THE OFFER OR SALE IS NOT PERMITTED. | ||
| 2 | ||
| MSWF Commercial Mortgage Trust 2023-2 | Certificate Structure |
I. Certificate Structure
| Class | Expected Ratings (Fitch/KBRA/Moody’s)(1) | Approximate Initial Certificate Balance or Notional Amount(2) | Approximate Initial Available Certificate Balance or Notional Amount(2) | Approximate Initial Retained Certificate Balance or Notional Amount(2)(3) | Approx. Initial Credit Support(4) | Pass-Through Rate Description | Weighted Average Life (Years)(5) | Expected Principal Window(5) | Certificate Principal to Value Ratio(6) | Certificate Principal U/W NOI Debt Yield(7) | |
| Offered Certificates | |||||||||||
| A-1 | AAAsf/AAA(sf)/Aaa(sf) | $2,741,000 | $2,654,000 | $87,000 | 30.000% | (8) | 2.18 | 1-49 | 34.3% | 21.1% | |
| A-2 | AAAsf/AAA(sf)/Aaa(sf) | $69,432,000 | $67,244,000 | $2,188,000 | 30.000% | (8) | 4.83 | 49-59 | 34.3% | 21.1% | |
| A-SB | AAAsf/AAA(sf)/Aaa(sf) | $6,496,000 | $6,291,000 | $205,000 | 30.000% | (8) | 7.21 | 59-110 | 34.3% | 21.1% | |
| A-4(9) | AAAsf/AAA(sf)/Aaa(sf) | (9)(10) | (9)(10) | (9)(10) | 30.000% | (8) | (10) | (10) | 34.3% | 21.1% | |
| A-5(9) | AAAsf/AAA(sf)/Aaa(sf) | (9)(10) | (9)(10) | (9)(10) | 30.000% | (8) | (10) | (10) | 34.3% | 21.1% | |
| X-A | AAAsf/AAA(sf)/Aaa(sf) | $640,126,000(11) | $619,962,000(11) | $20,164,000(11) | N/A | Variable(12) | N/A | N/A | N/A | N/A | |
| X-B | A-sf/AAA(sf)/NR | $188,609,000(13) | $182,667,000(13) | $5,942,000(13) | N/A | Variable(14) | N/A | N/A | N/A | N/A | |
| A-S(9) | AAAsf/AAA(sf)/Aa1(sf) | $121,167,000(9) | $117,350,000(9) | $3,817,000(9) | 16.750% | (8) | 9.90 | 119-119 | 40.8% | 17.8% | |
| B(9) | AA-sf/AA-(sf)/NR | $38,865,000(9) | $37,640,000(9) | $1,225,000(9) | 12.500% | (8) | 9.90 | 119-119 | 42.9% | 16.9% | |
| C(9) | A-sf/A-(sf)/NR | $28,577,000(9) | $27,676,000(9) | $901,000(9) | 9.375% | (8) | 9.93 | 119-120 | 44.5% | 16.3% | |
| Non-Offered Certificates | |||||||||||
| X-D | BBB-sf/BBB(sf)/NR | $24,005,000(15) | $23,248,000(15) | $757,000(15) | N/A | Variable(16) | N/A | N/A | N/A | N/A | |
| X-F | BB-sf/BB+(sf)/NR | $17,146,000(17) | $16,605,000(17) | $541,000(17) | N/A | Variable(18) | N/A | N/A | N/A | N/A | |
| D | BBBsf/BBB+(sf)/NR | $14,860,000 | $14,391,000 | $469,000 | 7.750% | (8) | 9.98 | 120-120 | 45.2% | 16.0% | |
| E | BBB-sf/BBB(sf)/NR | $9,145,000 | $8,856,000 | $289,000 | 6.750% | (8) | 9.98 | 120-120 | 45.7% | 15.9% | |
| F | BB-sf/BB+(sf)/NR | $17,146,000 | $16,605,000 | $541,000 | 4.875% | (8) | 9.98 | 120-120 | 46.7% | 15.5% | |
| G-RR | B-sf/B+(sf)/NR | $11,431,000 | $11,070,000 | $361,000 | 3.625% | (8) | 9.98 | 120-120 | 47.3% | 15.3% | |
| H-RR | NR/NR/NR | $33,149,874 | $32,104,874 | $1,045,000 | 0.000% | (8) | 9.98 | 120-120 | 49.1% | 14.8% | |
| Notes: | |
| (1) | The expected ratings presented are those of Fitch Ratings, Inc. (“Fitch”), Kroll Bond Rating Agency, LLC (“KBRA”) and Moody’s Investors Service, Inc. (“Moody’s”), which the depositor hired to rate the Offered Certificates. One or more other nationally recognized statistical rating organizations that were not hired by the depositor may use information they receive pursuant to Rule 17g-5 under the Securities Exchange Act of 1934, as amended (the “Exchange Act”) or otherwise, to rate or provide market reports and/or published commentary related to the Offered Certificates. We cannot assure you as to what ratings a non-hired nationally recognized statistical rating organization would assign or that its reports will not express differing, possibly negative, views of the mortgage loans and/or the Offered Certificates. The ratings of each Class of Offered Certificates address the likelihood of the timely distribution of interest and, except in the case of the Class X-A, X-B, X-D and X-F Certificates, the ultimate distribution of principal due on those Classes on or before the Rated Final Distribution Date. See “Risk Factors—Other Risks Relating to the Certificates—Nationally Recognized Statistical Rating Organizations May Assign Different Ratings to the Certificates; Ratings of the Certificates Reflect Only the Views of the Applicable Rating Agencies as of the Dates Such Ratings Were Issued; Ratings May Affect ERISA Eligibility; Ratings May Be Downgraded” and “Ratings” in the Preliminary Prospectus, expected to be dated December 3, 2023 (the “Preliminary Prospectus”). Fitch, KBRA and Moody’s have informed us that the “sf” designation in their ratings represents an identifier for structured finance product ratings. |
| (2) | The Certificate Balances and Notional Amounts set forth in the table are approximate. The actual initial Certificate Balances and Notional Amounts may be larger or smaller in connection with any variation in the Certificate Balance of the VRR Interest and/or the Horizontal Risk Retention Certificates following the calculation of the actual fair value of all of the ABS interests (as such term is defined in the Credit Risk Retention Rules) issued by the issuing entity, as described under “Credit Risk Retention” in the Preliminary Prospectus. The actual initial Certificate Balances and Notional Amounts also depend on the initial pool balance of the mortgage loans definitively included in the pool of mortgage loans, which aggregate cut-off date balance may be as much as 5% larger or smaller than the amount presented in the Preliminary Prospectus. In addition, the Notional Amounts of the Class X-A, X-B, X-D and X-F Certificates may vary depending upon the final pricing of the Classes of Principal Balance Certificates (as defined below) or trust components whose Certificate Balances comprise such Notional Amounts, and, if, as a result of such pricing, the pass-through rate of any of the Class X-A, X-B, X-D and X-F Certificates, as applicable, would be equal to zero at all times, such Class of Certificates may not be issued on the closing date of this securitization. |
| (3) | On the closing date, the Certificates with the initial Certificate Balances or Notional Amounts, as applicable, set forth in the table above under “Approximate Initial Retained Certificate Balance or Notional Amount” (such Certificates, collectively the “VRR Interest”) are expected to be purchased for cash from the underwriters by a majority-owned affiliate of Argentic Real Estate Finance 2 LLC (a sponsor and affiliate of the special servicer), as the “retaining sponsor” (as such term is defined in the Credit Risk Retention Rules), as further described in “Credit Risk Retention” in the Preliminary Prospectus. |
| (4) | The approximate initial credit support with respect to the Class A-1, A-2, A-SB, A-4 and A-5 Certificates represents the approximate credit enhancement for the Class A-1, A-2, A-SB, A-4 and A-5 Certificates in the aggregate, taking into account the Certificate Balances of the Class A-4 and Class A-5 trust components. The approximate initial credit support set forth for the Class A-S certificates represents the approximate initial credit enhancement for the underlying Class A-S trust component. The approximate initial credit support set forth for the Class B certificates represents the approximate initial credit enhancement for the underlying Class B trust component. The approximate initial credit support set forth for the Class C certificates represents the approximate initial credit enhancement for the underlying Class C trust component. |
| (5) | Weighted Average Lives and Expected Principal Windows are calculated based on an assumed prepayment rate of 0% CPR and the “Structuring Assumptions” described under “Yield and Maturity Considerations—Weighted Average Life” in the Preliminary Prospectus. |
| (6) | The Certificate Principal to Value Ratio for each Class of Certificates (other than the Class A-1, A-2, A-SB, A-4 and A-5 Certificates) is calculated as the product of (a) the weighted average Cut-off Date LTV Ratio for the mortgage loans and (b) a fraction, the numerator of which is the total initial Certificate Balance of such Class of Certificates and all Classes of Principal Balance Certificates (or, with respect to the Class A-4, A-5, A-S, B or C Certificates, the trust component with the same alphanumeric designation) senior to such Class of Certificates and the denominator of which is the total initial Certificate Balance of all of the Classes of Principal Balance Certificates (or, with respect to the Class A-4, A-5, A-S, B or C Certificates, the trust component with the same alphanumeric designation). The Certificate Principal to Value Ratio for each of the Class A-1, A-2, A-SB, A-4 and A-5 Certificates is calculated in the aggregate for those Classes as if they were a single Class and is calculated as the product of (a) the weighted average Cut-off Date LTV Ratio for the mortgage loans and (b) a fraction, the numerator of which is the total initial Certificate Balance of such Classes of Certificates (or, with respect to the Class A-4 or A-5 Certificates, the trust component with the same alphanumeric designation) and the denominator of which is the total initial Certificate Balance of all of the Classes of Principal Balance Certificates (or, with respect to the Class A-4, A-5, A-S, B or C Certificates, the trust component with the same alphanumeric designation). In any event, however, excess mortgaged property value associated with a mortgage loan will not be available to offset losses on any other mortgage loan. |
| THE INFORMATION IN THIS STRUCTURAL AND COLLATERAL TERM SHEET IS NOT COMPLETE AND MAY BE AMENDED PRIOR TO THE TIME OF SALE. THIS TERM SHEET IS NOT AN OFFER TO SELL THESE SECURITIES AND IT IS NOT A SOLICITATION OF AN OFFER TO BUY THESE SECURITIES IN ANY JURISDICTION WHERE THE OFFER OR SALE IS NOT PERMITTED. | ||
| 3 | ||
| MSWF Commercial Mortgage Trust 2023-2 | Certificate Structure |
| (7) | The Certificate Principal U/W NOI Debt Yield for each Class of Certificates (other than the Class A-1, A-2, A-SB, A-4 and A-5 Certificates) is calculated as the product of (a) the weighted average U/W NOI Debt Yield for the mortgage loans and (b) a fraction, the numerator of which is the total initial Certificate Balance of all of the Classes of Principal Balance Certificates (or, with respect to the Class A-4, A-5, A-S, B or C Certificates, the trust component with the same alphanumeric designation) and the denominator of which is the total initial Certificate Balance of such Class of Certificates and all Classes of Principal Balance Certificates (or, with respect to the Class A-4, A-5, A-S, B or C Certificates, the trust component with the same alphanumeric designation) senior to such Class of Certificates. The Certificate Principal U/W NOI Debt Yield for each of the Class A-1, A-2, A-SB, A-4 and A-5 Certificates is calculated in the aggregate for those Classes as if they were a single Class and is calculated as the product of (a) the weighted average U/W NOI Debt Yield for the mortgage loans and (b) a fraction, the numerator of which is the total initial Certificate Balance of all of the Classes of Principal Balance Certificates (or, with respect to the Class A-4, A-5, A-S, B or C Certificates, the trust component with the same alphanumeric designation) and the denominator of which is the total initial Certificate Balance of such Classes of Certificates (or, with respect to the Class A-4 and A-5 Certificates, the trust component with the same alphanumeric designation). In any event, however, cash flow from each mortgaged property supports only the related mortgage loan and will not be available to support any other mortgage loan. |
| (8) | The pass-through rates for the Class A-1, A-2, A-SB, A-4, A-5, A-S, B, C, D, E, F, G-RR and H-RR Certificates in each case will be one of the following: (i) a fixed rate per annum, (ii) a variable rate per annum equal to the weighted average of the net mortgage interest rates on the mortgage loans for the related distribution date, (iii) a variable rate per annum equal to the lesser of (a) a fixed rate and (b) the weighted average of the net mortgage interest rates on the mortgage loans for the related distribution date or (iv) a variable rate per annum equal to the weighted average of the net mortgage interest rates on the mortgage loans for the related distribution date minus a specified percentage. For purposes of the calculation of the weighted average of the net mortgage interest rates on the mortgage loans for each distribution date, the mortgage interest rates will be adjusted as necessary to a 30/360 basis. |
| (9) | The Class A-4-1, A-4-2, A-4-X1, A-4-X2, A-5-1, A-5-2, A-5-X1, A-5-X2, A-S-1, A-S-2, A-S-X1, A-S-X2, B-1, B-2, B-X1, B-X2, C-1, C-2, C-X1 and C-X2 Certificates are also offered certificates. Such Classes of Certificates, together with the Class A-4, A-5, A-S, B and C Certificates, constitute the “Exchangeable Certificates”. The Class A-1, A-2, A-SB, D, E, F, G-RR and H-RR Certificates, together with the Exchangeable Certificates with a Certificate Balance, are referred to as the “Principal Balance Certificates.” Each class of Exchangeable Certificates will have the Certificate Balance or Notional Amount and pass-through rate described below under “Exchangeable Certificates.” |
| (10) | The exact initial Certificate Balances or Notional Amounts of the Class A-4, A-4-X1, A-4-X2, A-5, A-5-X1 and A-5-X2 trust components (and consequently, the exact initial Certificate Balances or Notional Amounts of the Exchangeable Certificates with an “A-4” or “A-5” designation) are unknown and will be determined based on the final pricing of the Certificates. However, the initial Certificate Balances, weighted average lives and principal windows of the Class A-4 and A-5 trust components are expected to be within the applicable ranges reflected in the following chart. The aggregate initial Certificate Balance of the Class A-4 and A-5 trust components is expected to be approximately $561,457,000, subject to a variance of plus or minus 5%. The Class A-4-X1 and A-4-X2 trust components will have initial Notional Amounts equal to the initial Certificate Balance of the Class A-4 trust component. The Class A-5-X1 and A-5-X2 trust components will have initial Notional Amounts equal to the initial Certificate Balance of the Class A-5 trust component. In the event that the Class A-5 Certificates are issued at $561,457,000, the Class A-4 Certificates will not be issued. |
| Trust Components | Expected Range of Approximate Initial Certificate Balance | Expected Range of Weighted Average Life (Years) | Expected Range of Principal Window | |||
Class A-4 Class A-5 | $0 – $250,000,000 $311,457,000 – $561,457,000 | N/A – 9.43 | N/A / 02/33 – 08/33 |
| (11) | The Class X-A Certificates are notional amount certificates. The Notional Amount of the Class X-A Certificates will be equal to the aggregate Certificate Balance of the Class A-1, A-2 and A-SB Certificates and the Class A-4 and A-5 trust components outstanding from time to time. The Class X-A Certificates will not be entitled to distributions of principal. |
| (12) | The pass-through rate for the Class X-A Certificates for any distribution date will be a per annum rate equal to the excess, if any, of (a) the weighted average of the net mortgage interest rates on the mortgage loans for the related distribution date, over (b) the weighted average of the pass-through rates on the Class A-1, A-2 and A-SB Certificates and the Class A-4, A-4-X1, A-4-X2, A-5, A-5-X1 and A-5-X2 trust components for the related distribution date, weighted on the basis of their respective Certificate Balances or Notional Amounts outstanding immediately prior to that distribution date (but excluding trust components with a Notional Amount in the denominator of such weighted average calculation). For purposes of the calculation of the weighted average of the net mortgage interest rates on the mortgage loans for each distribution date, the mortgage interest rates will be adjusted as necessary to a 30/360 basis. |
| (13) | The Class X-B Certificates are notional amount certificates. The Notional Amount of the Class X-B Certificates will be equal to the aggregate Certificate Balance of the Class A-S, B and C trust components outstanding from time to time. The Class X-B Certificates will not be entitled to distributions of principal. |
| (14) | The pass-through rate for the Class X-B Certificates for any distribution date will be a per annum rate equal to the excess, if any, of (a) the weighted average of the net mortgage interest rates on the mortgage loans for the related distribution date, over (b) the weighted average of the pass-through rates on the Class A-S, A-S-X1, A-S-X2, B, B-X1, B-X2, C, C-X1 and C-X2 trust components for the related distribution date, weighted on the basis of their respective Certificate Balances or Notional Amounts outstanding immediately prior to that distribution date (but excluding trust components with a Notional Amount in the denominator of such weighted average calculation). For purposes of the calculation of the weighted average of the net mortgage interest rates on the mortgage loans for each distribution date, the mortgage interest rates will be adjusted as necessary to a 30/360 basis. |
| (15) | The Class X-D Certificates are notional amount certificates. The Notional Amount of the Class X-D Certificates will be equal to the aggregate Certificate Balance of the Class D and E Certificates outstanding from time to time. The Class X-D Certificates will not be entitled to distributions of principal. |
| (16) | The pass-through rate for the Class X-D Certificates for any distribution date will be a per annum rate equal to the excess, if any, of (a) the weighted average of the net mortgage interest rates on the mortgage loans for the related distribution date, over (b) the weighted average of the pass-through rates on the Class D and E Certificates for the related distribution date, weighted on the basis of their respective Certificate Balances outstanding immediately prior to that distribution date. For purposes of the calculation of the weighted average of the net mortgage interest rates on the mortgage loans for each distribution date, the mortgage interest rates will be adjusted as necessary to a 30/360 basis. |
| (17) | The Class X-F Certificates are notional amount certificates. The Notional Amount of the Class X-F Certificates will be equal to the Certificate Balance of the Class F Certificates outstanding from time to time. The Class X-F Certificates will not be entitled to distributions of principal. |
| (18) | The pass-through rate for the Class X-F Certificates for any distribution date will be a per annum rate equal to the excess, if any, of (a) the weighted average of the net mortgage interest rates on the mortgage loans for the related distribution date, over (b) the pass-through rate on the Class F Certificates for the related distribution date. For purposes of the calculation of the weighted average of the net mortgage interest rates on the mortgage loans for each distribution date, the mortgage interest rates will be adjusted as necessary to a 30/360 basis. |
| THE INFORMATION IN THIS STRUCTURAL AND COLLATERAL TERM SHEET IS NOT COMPLETE AND MAY BE AMENDED PRIOR TO THE TIME OF SALE. THIS TERM SHEET IS NOT AN OFFER TO SELL THESE SECURITIES AND IT IS NOT A SOLICITATION OF AN OFFER TO BUY THESE SECURITIES IN ANY JURISDICTION WHERE THE OFFER OR SALE IS NOT PERMITTED. | ||
| 4 | ||
| MSWF Commercial Mortgage Trust 2023-2 | Transaction Highlights |
II. Transaction Highlights
Mortgage Loan Sellers:
Mortgage Loan Seller | Number of | Number of | Aggregate Cut-off Date Balance | % of Initial Pool | ||
| Wells Fargo Bank, National Association | 17 | 20 | $288,184,291 | 31.5 | % | |
| Morgan Stanley Mortgage Capital Holdings LLC | 10 | 38 | 196,184,000 | 21.5 | ||
| Argentic Real Estate Finance 2 LLC | 12 | 29 | 189,648,584 | 20.7 | ||
| Bank of America, National Association | 2 | 8 | 91,250,000 | 10.0 | ||
| Bank of America, National Association/Morgan Stanley Mortgage Capital Holdings LLC | 1 | 1 | 75,000,000 | 8.2 | ||
| Starwood Mortgage Capital LLC | 4 | 4 | 74,200,000 | 8.1 | ||
Total | 46 | 100 | $914,466,875 |
| 100.0 | % |
Loan Pool:
| Initial Pool Balance: | $914,466,875 |
| Number of Mortgage Loans: | 46 |
| Average Cut-off Date Balance per Mortgage Loan: | $19,879,715 |
| Number of Mortgaged Properties: | 100 |
| Average Cut-off Date Balance per Mortgaged Property(1): | $9,144,669 |
| Weighted Average Mortgage Interest Rate: | 7.0381% |
| Ten Largest Mortgage/Cross-collateralized Loans as % of Initial Pool Balance: | 59.9% |
| Weighted Average Original Term to Maturity or ARD (months): | 115 |
| Weighted Average Remaining Term to Maturity or ARD (months): | 113 |
| Weighted Average Original Amortization Term (months)(2): | 360 |
| Weighted Average Remaining Amortization Term (months)(2): | 359 |
| Weighted Average Seasoning (months): | 3 |
| (1) | Information regarding mortgage loans secured by multiple properties is based on an allocation according to relative appraised values or the allocated loan amounts or property-specific release prices set forth in the related loan documents or such other allocation as the related mortgage loan seller deemed appropriate. |
| (2) | Excludes any mortgage loan that does not amortize. |
Credit Statistics:
| Weighted Average U/W Net Cash Flow DSCR(1): | 1.99x |
| Weighted Average U/W Net Operating Income Debt Yield(1): | 14.8% |
| Weighted Average Cut-off Date Loan-to-Value Ratio(1): | 49.1% |
| Weighted Average Balloon or ARD Loan-to-Value Ratio(1): | 48.4% |
| % of Mortgage Loans with Additional Subordinate Debt(2): | 3.3% |
| % of Mortgage Loans with Single Tenants(3): | 9.5% |
| (1) | With respect to any mortgage loan that is part of a whole loan, loan-to-value ratio, debt service coverage ratio and debt yield calculations include the related pari passu companion loan(s) but exclude any related subordinate companion loan(s) (unless otherwise stated). The information for each mortgaged property that relates to a mortgage loan that is cross-collateralized or cross-defaulted with one or more other mortgage loans is based upon the principal balance of that mortgage loan, except that the applicable loan-to-value ratio, debt service coverage ratio, and debt yield for each such mortgage loan is based upon the ratio or yield (as applicable) for the aggregate indebtedness evidenced by all loans in the group (without regard to any limitation on the amount of indebtedness secured by any mortgaged property in such cross-collateralized group). The debt service coverage ratio, debt yield and loan-to-value ratio information do not take into account any subordinate debt (whether or not secured by the related mortgaged property), that currently exists or is allowed under the terms of any mortgage loan. See “Description of the Mortgage Pool—Mortgage Pool Characteristics” in the Preliminary Prospectus and Annex A-1 to the Preliminary Prospectus. |
| (2) | The percentage figure expressed as “% of Mortgage Loans with Additional Subordinate Debt” is determined as a percentage of the initial pool balance and does not take into account any future subordinate debt (whether or not secured by the mortgaged property), if any, that may be permitted under the terms of any mortgage loan or the pooling and servicing agreement. See “Description of the Mortgage Pool—Additional Indebtedness” in the Preliminary Prospectus. |
| (3) | Excludes mortgage loans that are secured by multiple single tenant properties. |
| THE INFORMATION IN THIS STRUCTURAL AND COLLATERAL TERM SHEET IS NOT COMPLETE AND MAY BE AMENDED PRIOR TO THE TIME OF SALE. THIS TERM SHEET IS NOT AN OFFER TO SELL THESE SECURITIES AND IT IS NOT A SOLICITATION OF AN OFFER TO BUY THESE SECURITIES IN ANY JURISDICTION WHERE THE OFFER OR SALE IS NOT PERMITTED. | ||
| 5 | ||
| MSWF Commercial Mortgage Trust 2023-2 | Transaction Highlights |
Loan Structural Features:
Amortization: Based on the Initial Pool Balance, 16.4% of the mortgage pool (13 mortgage loans) has scheduled amortization, as follows:
9.3% (5 mortgage loans) provide for an interest-only period followed by an amortization period; and
7.0% (8 mortgage loans) require amortization during the entire loan term.
Interest-Only: Based on the Initial Pool Balance, 83.6% of the mortgage pool (33 mortgage loans) provide for interest-only payments during the entire loan term through maturity or anticipated repayment date. The Weighted Average Cut-off Date Loan-to-Value Ratio and Weighted Average U/W Net Cash Flow DSCR for those mortgage loans are 47.5% and 2.11x, respectively.
Hard Lockboxes: Based on the Initial Pool Balance, 61.2% of the mortgage pool (21 mortgage loans) have hard lockboxes in place.
Reserves: The mortgage loans require amounts to be escrowed monthly as follows (excluding any mortgage loans with springing provisions):
| Real Estate Taxes: | 60.8% of the pool |
| Insurance: | 33.9% of the pool |
| Capital Replacements: | 53.5% of the pool |
| TI/LC: | 39.7% of the pool(1) |
| (1) | The percentage of Initial Pool Balance for mortgage loans with TI/LC reserves is based on the aggregate principal balance allocable to loans that include office, retail, mixed use, industrial and data center properties. |
Call Protection/Defeasance: Based on the Initial Pool Balance, the mortgage pool has the following call protection and defeasance features:
72.4% of the mortgage pool (34 mortgage loans) feature a lockout period, then defeasance only until an open period;
11.6% of the mortgage pool (5 mortgage loans) feature a lockout period, then the greater of a prepayment premium (1%) or yield maintenance, then the greater of a prepayment premium (1%) or yield maintenance or defeasance until an open period;
8.5% of the mortgage pool (5 mortgage loans) feature a lockout period, then the greater of a prepayment premium (1%) or yield maintenance until an open period;
6.7% of the mortgage pool (1 mortgage loan) feature a lockout period, then the greater of a prepayment premium (0.5%) or yield maintenance or defeasance until an open period; and
0.8% of the mortgage pool (1 mortgage loan) feature a lockout period, then the greater of a prepayment premium (2%) or yield maintenance or defeasance until an open period.
Prepayment restrictions for each mortgage loan reflect the entire life of the mortgage loan. Please refer to Annex A-1 to the Preliminary Prospectus and the footnotes related thereto for further information regarding individual loan call protection.
| THE INFORMATION IN THIS STRUCTURAL AND COLLATERAL TERM SHEET IS NOT COMPLETE AND MAY BE AMENDED PRIOR TO THE TIME OF SALE. THIS TERM SHEET IS NOT AN OFFER TO SELL THESE SECURITIES AND IT IS NOT A SOLICITATION OF AN OFFER TO BUY THESE SECURITIES IN ANY JURISDICTION WHERE THE OFFER OR SALE IS NOT PERMITTED. | ||
| 6 | ||
| MSWF Commercial Mortgage Trust 2023-2 | Issue Characteristics |
III. Issue Characteristics
| Securities Offered: | $828,735,000 approximate monthly pay, multi-class, commercial mortgage REMIC pass-through certificates consisting of thirty classes (Classes A-1, A-2, A-SB, A-4, A-4-1, A-4-2, A-4-X1, A-4-X2, A-5, A-5-1, A-5-2, A-5-X1, A-5-X2, A-S, A-S-1, A-S-2, A-S-X1, A-S-X2, B, B-1, B-2, B-X1, B-X2, C, C-1, C-2, C-X1, C-X2, X-A and X-B), which are offered pursuant to a registration statement filed with the SEC (such classes of certificates, the “Offered Certificates”). | |
| Mortgage Loan Sellers: | Wells Fargo Bank, National Association (“WFB”), Morgan Stanley Mortgage Capital Holdings LLC (“MSMCH”), Argentic Real Estate Finance 2 LLC (“AREF 2”), Bank of America, National Association (“BANA”) and Starwood Mortgage Capital LLC (“SMC”) | |
| Joint Bookrunners and Co- Lead Managers: | Wells Fargo Securities, LLC, Morgan Stanley & Co. LLC and BofA Securities, Inc. | |
| Co-Managers: | Academy Securities, Inc., Drexel Hamilton, LLC and Siebert Williams Shank & Co., LLC | |
| Rating Agencies: | Fitch Ratings, Inc., Kroll Bond Rating Agency, LLC and Moody’s Investors Service, Inc. | |
| Master Servicer: | Wells Fargo Bank, National Association | |
| Special Servicer: | Argentic Services Company LP | |
| Certificate Administrator: | Computershare Trust Company, N.A. | |
| Trustee: | Computershare Trust Company, N.A. | |
| Operating Advisor: | BellOak, LLC | |
| Asset Representations Reviewer: | BellOak, LLC | |
| Initial Majority Controlling Class Certificateholder: | Argentic Securities Holdings 2 Cayman Limited, an affiliate of Argentic Real Estate Finance 2 LLC and Argentic Services Company LP | |
| U.S. Credit Risk Retention: | For a discussion on the manner in which the U.S. credit risk retention requirements will be satisfied by Argentic Real Estate Finance 2 LLC, as the retaining sponsor, see “Credit Risk Retention” in the Preliminary Prospectus. Argentic Real Estate Finance 2 LLC, the retaining sponsor, intends to cause Argentic Securities Holdings 2 Cayman Limited, a majority-owned affiliate, to retain (i) an “eligible horizontal residual interest”, in the form of certificates representing approximately 1.96% of the fair value of all of the ABS interests issued, which will be comprised of the Class G-RR and H-RR certificates (other than the portion that comprises the VRR Interest) and (ii) an “eligible vertical interest”, in the form of certificates representing approximately 3.15% of the certificate balance, notional amount or percentage interest of each class of certificates (other than the Class R certificates) in a manner that satisfies the U.S. credit risk retention requirements. Under the U.S. credit risk retention rules, Argentic Real Estate Finance 2 LLC or the applicable majority-owned affiliate will be permitted to transfer the horizontal risk retention certificates to a subsequent third-party purchaser. For additional information, see “Credit Risk Retention” in the Preliminary Prospectus.
| |
| EU/UK Credit Risk Retention | None of the sponsors, the depositor, the underwriters, or their respective affiliates, or any other party to the transaction intends to retain a material net economic interest in the securitization constituted by the issue of the Certificates, or take any other action in respect of such securitization, in a manner prescribed or contemplated by (i) Regulation (EU) 2017/2402, or (ii) such Regulation as it forms part of UK domestic law. In particular, no such person undertakes to take any action which may be required by any investor for the purposes of its compliance with any applicable requirement under either such Regulation. Furthermore, the arrangements described under “Credit Risk Retention” in the Preliminary Prospectus have not been structured with the objective of ensuring compliance by any person with any requirements of either such Regulation. See “Risk Factors—Other Risks Relating to the Certificates—EU Securitization Regulation and UK Securitization Regulation Due Diligence Requirements” in the Preliminary Prospectus.
| |
| Cut-off Date: | The Cut-off Date with respect to each mortgage loan is the payment due date for the monthly debt service payment that is due in December 2023 (or, in the case of any mortgage loan that has its first payment due date in December 2023, the date that would have been its payment due date in December 2023 under the terms of that mortgage loan if a monthly debt service payment were scheduled to be due in that month). | |
| Expected Closing Date: | On or about December 21, 2023. |
| THE INFORMATION IN THIS STRUCTURAL AND COLLATERAL TERM SHEET IS NOT COMPLETE AND MAY BE AMENDED PRIOR TO THE TIME OF SALE. THIS TERM SHEET IS NOT AN OFFER TO SELL THESE SECURITIES AND IT IS NOT A SOLICITATION OF AN OFFER TO BUY THESE SECURITIES IN ANY JURISDICTION WHERE THE OFFER OR SALE IS NOT PERMITTED. | ||
| 7 | ||
| MSWF Commercial Mortgage Trust 2023-2 | Issue Characteristics |
| Determination Dates: | The 11th day of each month (or if that day is not a business day, the next succeeding business day), commencing in January 2024. | |
| Distribution Dates: | The 4th business day following the Determination Date in each month, commencing in January 2024. | |
| Rated Final Distribution Date: | The Distribution Date in December 2056. | |
| Interest Accrual Period: | With respect to any Distribution Date, the calendar month immediately preceding the month in which such Distribution Date occurs. | |
| Day Count: | The Offered Certificates will accrue interest on a 30/360 basis. | |
| Minimum Denominations: | $10,000 for each Class of Offered Certificates (other than the Class X-A and X-B Certificates) and $1,000,000 for the Class X-A and X-B Certificates. Investments may also be made in any whole dollar denomination in excess of the applicable minimum denomination. | |
| Clean-up Call: | 1.0% | |
| Delivery: | DTC, Euroclear and Clearstream Banking | |
| ERISA/SMMEA Status: | Each Class of Offered Certificates is expected to be eligible for exemptive relief under ERISA. No Class of Offered Certificates will be SMMEA eligible. | |
| Risk Factors: | THE CERTIFICATES INVOLVE CERTAIN RISKS AND MAY NOT BE SUITABLE FOR ALL INVESTORS. SEE THE “RISK FACTORS” SECTION OF THE PRELIMINARY PROSPECTUS. | |
| Bond Analytics Information: | The Certificate Administrator will be authorized to make distribution date statements, CREFC® reports and certain supplemental reports (other than confidential information) available to certain financial modeling and data provision services, including Bloomberg, L.P., CRED iQ, Trepp, LLC, Intex Solutions, Inc., Interactive Data Corp., Markit Group Limited, BlackRock Financial Management, Inc., CMBS.com, Inc., Moody’s Analytics, Inc., Morningstar Credit Information & Analytics, LLC, KBRA Analytics, LLC, MBS Data, LLC, Thomson Reuters Corporation and RealINSIGHT. | |
| Tax Treatment | For U.S. federal income tax purposes, the issuing entity will consist of two or more REMICs arranged in a tiered structure and a trust (the “grantor trust”). The upper-most REMIC will issue REMIC regular interests some of which will be held by the grantor trust (such grantor trust-held REMIC regular interests, the “trust components”). The Offered Certificates (other than the Exchangeable Certificates) will represent REMIC regular interests (other than the trust components). The Exchangeable Certificates will represent beneficial ownership of one or more of the trust components held by the grantor trust. |
| THE INFORMATION IN THIS STRUCTURAL AND COLLATERAL TERM SHEET IS NOT COMPLETE AND MAY BE AMENDED PRIOR TO THE TIME OF SALE. THIS TERM SHEET IS NOT AN OFFER TO SELL THESE SECURITIES AND IT IS NOT A SOLICITATION OF AN OFFER TO BUY THESE SECURITIES IN ANY JURISDICTION WHERE THE OFFER OR SALE IS NOT PERMITTED. | ||
| 8 | ||
| MSWF Commercial Mortgage Trust 2023-2 | Characteristics of the Mortgage Pool |
IV. Characteristics of the Mortgage Pool(1)
| A. | Ten Largest Mortgage Loans or Cross-Collateralized Mortgage Loans |
| Mortgage Loan Seller | Mortgage Loan Name | City | State | Number of Mortgage Loans / Mortgaged Properties | Mortgage Loan Cut-off Date Balance ($) | % of Initial Pool Balance (%) | Property Type | Number of SF/Rooms / Units | Cut-off Date Balance Per SF / Room / Unit | Cut-off Date LTV Ratio (%) | Balloon or ARD LTV Ratio (%) | U/W NCF DSCR (x) | U/W NOI Debt Yield (%) | |
| MSMCH | 60 Hudson | New York | NY | 1 / 1 | $90,000,000 | 9.8 | % | Other | 1,149,619 | $244 | 17.5% | 17.5% | 3.92x | 24.2% |
| WFB | Arundel Mills and Marketplace | Hanover | MD | 1 / 1 | 90,000,000 | 9.8 | Retail | 1,938,983 | 186 | 41.4 | 41.4 | 1.98 | 16.1 | |
| BANA/MSMCH | Fashion Valley Mall | San Diego | CA | 1 / 1 | 75,000,000 | 8.2 | Retail | 1,377,155 | 327 | 31.5 | 31.5 | 3.15 | 18.7 | |
| WFB | Philadelphia Marriott Downtown | Philadelphia | PA | 1 / 1 | 61,666,666 | 6.7 | Hospitality | 1,408 | 152,699 | 54.9 | 54.9 | 1.53 | 16.0 | |
| BANA | CX - 250 Water Street | Cambridge | MA | 1 / 1 | 61,250,000 | 6.7 | Mixed Use | 479,004 | 1,110 | 48.8 | 48.8 | 1.66 | 9.3 | |
| AREF2 | BLE Portfolio(2) | Houston | TX | 1 / 3 | 27,300,000 | 3.0 | Multifamily | 680 | 79,514 | 58.8 | 58.8 | 1.22 | 9.5 | |
| AREF2 | La Primavera(2) | Houston | TX | 1 / 1 | 12,700,000 | 1.4 | Multifamily | 328 | 79,514 | 58.8 | 58.8 | 1.22 | 9.5 | |
| SMC | Cross County Plaza | West Palm Beach | FL | 1 / 1 | 40,000,000 | 4.4 | Retail | 347,093 | 115 | 64.9 | 64.9 | 1.33 | 10.5 | |
| MSMCH | RTL Retail Portfolio | Various | Various | 1 / 29 | 30,000,000 | 3.3 | Retail | 3,117,102 | 83 | 51.2 | 51.2 | 1.97 | 13.8 | |
| BANA | Rhino Retail Portfolio 2 | Various | Various | 1 / 7 | 30,000,000 | 3.3 | Retail | 827,429 | 158 | 65.7 | 65.7 | 1.41 | 10.7 | |
| AREF2 | Blackbird Portfolio | Ann Arbor | MI | 1 / 10 | 30,000,000 | 3.3 | Various | 427,513 | 84 | 53.3 | 51.1 | 1.40 | 12.9 | |
| Top Three Total/Weighted Average | 3 / 3 | $255,000,000 | 27.9 | % | 30.1% | 30.1% | 3.01x | 19.7% | ||||||
| Top Five Total/Weighted Average | 5 / 5 | $377,916,666 | 41.3 | % | 37.1% | 37.1% | 2.55x | 17.4% | ||||||
| Top Ten Total/Weighted Average | 11 / 56 | $547,916,666 | 59.9 | % | 44.0% | 43.8% | 2.21x | 15.5% | ||||||
| Non-Top Ten Total/Weighted Average | 35 / 44 | $366,550,209 | 40.1 | % | 56.6% | 55.2% | 1.66x | 13.7% | ||||||
| (1) | With respect to any mortgage loan that is part of a whole loan, Cut-off Date Balance Per SF/Room/Unit, loan-to-value ratio, debt service coverage ratio and debt yield calculations include the related pari passu companion loan(s) (unless otherwise stated). With respect to each mortgage loan, debt service coverage ratio, debt yield and loan-to-value ratio information do not take into account subordinate debt (whether or not secured by the related mortgaged property), if any, that currently exists or is allowed under the terms of such mortgage loan. The information for each mortgaged property that relates to a mortgage loan that is cross-collateralized or cross-defaulted with other mortgage loans is based upon the principal balance of that mortgage loan, except that the applicable loan-to-value ratio, debt service coverage ratio and debt yield for each such mortgage loan is based upon the ratio or yield (as applicable) for the aggregate indebtedness evidenced by all loans in the group (without regard to any limitation on the amount of indebtedness secured by any mortgaged property in such cross-collateralized group). On an individual basis, without regard to the cross-collateralization feature, any mortgage loan that is part of a cross-collateralized group of mortgage loans may have a higher loan-to-value ratio, lower debt service coverage ratio and/or lower debt yield than is presented herein. |
| (2) | The BLE Portfolio mortgage loan and the La Primavera mortgage loan are cross-collateralized and cross-defaulted with each other. |
| THE INFORMATION IN THIS STRUCTURAL AND COLLATERAL TERM SHEET IS NOT COMPLETE AND MAY BE AMENDED PRIOR TO THE TIME OF SALE. THIS TERM SHEET IS NOT AN OFFER TO SELL THESE SECURITIES AND IT IS NOT A SOLICITATION OF AN OFFER TO BUY THESE SECURITIES IN ANY JURISDICTION WHERE THE OFFER OR SALE IS NOT PERMITTED. | ||
| 9 | ||
| MSWF Commercial Mortgage Trust 2023-2 | Characteristics of the Mortgage Pool |
B. Summary of the Whole Loans
| No. | Loan Name | Mortgage Loan Seller in MSWF 2023-2 | Trust Cut-off Date Balance | Aggregate Pari Passu Companion Loan Cut-off Date Balance(1) | Controlling Pooling/Trust & Servicing Agreement | Master Servicer | Special Servicer | Related Pari Passu Companion Loan(s) Securitizations | Related Pari Passu Companion Loan(s) Original Balance |
| 1 | 60 Hudson | MSMCH | $90,000,000 | $280,000,000 | MSWF 2023-2 | Wells Fargo Bank, National Association | Argentic Services Company LP | BBMS 2023-C22 | $190,000,000 |
| 2 | Arundel Mills and Marketplace | WFB | $90,000,000 | $360,000,000 | MSWF 2023-2 | Wells Fargo Bank, National Association | Argentic Services Company LP | BMO 2023-C7 | $270,000,000 |
| 3 | Fashion Valley Mall | BANA/MSMCH | $75,000,000 | $450,000,000 | BBCMS 2023-C20(2) | KeyBank National Association(2) | LNR Partners, LLC(2) | BBCMS 2023-C20, BMARK 2023-B39, BANK 2023-BNK46, BMO 2023-C6, BBCMS 2023-C21 | $375,000,000 |
| 4 | Philadelphia Marriott Downtown | WFB | $61,666,666 | $215,000,000 | BBCMS 2023-5C23 | Midland Loan Services | LNR Partners, LLC | BBCMS 2023-5C23, BMARK 2023-V4, BANK5 2023-5YR4 | $153,333,334 |
| 5 | CX - 250 Water Street | BANA | $61,250,000 | $531,500,000 | MSWF 2023-2 | Wells Fargo Bank, National Association | Argentic Services Company LP | BANK 2023-BNK45, MSWF 2023-1, BMARK 2023-B38, BBCMS 2023-C20, BBCMS 2023-C21, BMO 2023-C6, BBCMS 2023-C22, BANK 2023-BNK46 | $470,250,000 |
| 6 | BLE Portfolio | AREF2 | $27,300,000 | $54,650,000 | MSWF 2023-2 | Wells Fargo Bank, National Association | Argentic Services Company LP | Future Securitization | $27,350,000 |
| 7 | La Primavera | AREF2 | $12,700,000 | $25,500,000 | MSWF 2023-2 | Wells Fargo Bank, National Association | Argentic Services Company LP | Future Securitization | $12,800,000 |
| 9 | RTL Retail Portfolio | MSMCH | $30,000,000 | $260,000,000 | BBCMS 2023-C22 | Midland Loan Services | Rialto Capital Advisors, LLC | BBCMS 2023-C21, BBCMS 2023-C22 | $230,000,000 |
| 10 | Rhino Retail Portfolio 2 | BANA | $30,000,000 | $130,500,000 | BBCMS 2023-C21 | Midland Loan Services | 3650 REIT Loan Servicing LLC | BBCMS 2023-C21, BBCMS 2023-C22 | $100,500,000 |
| 11 | Blackbird Portfolio | AREF2 | $30,000,000 | $35,750,000 | MSWF 2023-2 | Wells Fargo Bank, National Association | Argentic Services Company LP | Future Securitization | $5,750,000 |
| 12 | Centre Pointe Portfolio | AREF2 | $30,000,000 | $47,650,000 | MSWF 2023-2 | Wells Fargo Bank, National Association | Argentic Services Company LP | Future Securitization | $17,650,000 |
| 38 | Metroplex | AREF2 | $5,000,000 | $54,000,000 | MSWF 2023-1 | Wells Fargo Bank, National Association | Argentic Services Company LP | MSWF 2023-1 | $49,000,000 |
| 39 | 3800 Horizon Boulevard | AREF2 | $5,000,000 | $27,000,000 | MSWF 2023-1 | Wells Fargo Bank, National Association | Argentic Services Company LP | MSWF 2023-1 | $22,000,000 |
| 46 | Westfarms | WFB | $2,000,000 | $242,000,000 | BMO 2023-5C2 | KeyBank, National Association | Greystone Servicing Company LLC | BANK5 2023-5YR3, BMO 2023-5C2, BANK5 2023-5YR4 | $240,000,000 |
| (1) | The Aggregate Pari Passu Companion Loan Cut-off Date Balance excludes any related Subordinate Companion Loans. |
| (2) | The related whole loan is expected to initially be serviced under the BBCMS 2023-C20 securitization pooling and servicing agreement until the securitization of the related “lead” pari passu note, after which the related whole loan will be serviced under the pooling and servicing agreement governing such securitization of the related “lead” pari passu note. The master servicer and special servicer for such securitization will be identified in a notice, report or statement to holders of the MSWF 2023-2 certificates after the closing of such securitization. |
| THE INFORMATION IN THIS STRUCTURAL AND COLLATERAL TERM SHEET IS NOT COMPLETE AND MAY BE AMENDED PRIOR TO THE TIME OF SALE. THIS TERM SHEET IS NOT AN OFFER TO SELL THESE SECURITIES AND IT IS NOT A SOLICITATION OF AN OFFER TO BUY THESE SECURITIES IN ANY JURISDICTION WHERE THE OFFER OR SALE IS NOT PERMITTED. | ||
| 10 | ||
| MSWF Commercial Mortgage Trust 2023-2 | Characteristics of the Mortgage Pool |
C. Mortgage Loans with Additional Secured and Mezzanine Financing
| Loan No. | Mortgage Loan Seller | Mortgage Loan Name | Mortgage Loan Cut-off Date Balance ($) | % of Initial Pool Balance (%) | Sub Debt Cut-off Date Balance ($) | Mezzanine Debt Cut-off Date Balance ($) | Total Debt Interest Rate (%)(1) | Mortgage Loan U/W NCF DSCR (x)(2) | Total Debt U/W NCF DSCR (x) | Mortgage Loan Cut-off Date U/W NOI Debt Yield (%)(2) | Total Debt Cut-off Date U/W NOI Debt Yield (%) | Mortgage Loan Cut-off Date LTV Ratio (%)(2) | Total Debt Cut-off Date LTV Ratio (%) |
| 11 | AREF2 | Blackbird Portfolio | $30,000,000 | 3.3% | NAP | $5,250,000 | 8.4424% | 1.40x | 1.16x | 12.9% | 11.3% | 53.3% | 61.1% |
| Total/Weighted Average | $30,000,000 | 3.3% | NAP | $5,250,000 | 8.4424% | 1.40x | 1.16x | 12.9% | 11.3% | 53.3% | 61.1% | ||
| (1) | Total Debt Interest Rate for any specified mortgage loan reflects the weighted average of the interest rates on the respective components of the total debt. |
| (2) | With respect to any mortgage loan that is part of a whole loan, the loan-to-value ratio, debt service coverage ratio and debt yield calculations include the related pari passu companion loan(s) but excludes any related subordinate companion loan. |
| THE INFORMATION IN THIS STRUCTURAL AND COLLATERAL TERM SHEET IS NOT COMPLETE AND MAY BE AMENDED PRIOR TO THE TIME OF SALE. THIS TERM SHEET IS NOT AN OFFER TO SELL THESE SECURITIES AND IT IS NOT A SOLICITATION OF AN OFFER TO BUY THESE SECURITIES IN ANY JURISDICTION WHERE THE OFFER OR SALE IS NOT PERMITTED. | ||
| 11 | ||
| MSWF Commercial Mortgage Trust 2023-2 | Characteristics of the Mortgage Pool |
D. Previous Securitization History(1)
| Loan No. | Mortgage Loan Seller | Mortgage Loan or Mortgaged Property Name | City | State | Property Type | Mortgage Loan or Mortgaged Property Cut-off Date Balance ($) | % of Cut-off Date Pool Balance (%) | Previous Securitization |
| 1.00 | MSMCH | 60 Hudson | New York | NY | Other | $90,000,000 | 9.8% | COMM 2013-CR13, COMM 2014-CR14 |
| 2.00 | WFB | Arundel Mills and Marketplace | Hanover | MD | Retail | 90,000,000 | 9.8 | MSBAM 2014-C15, MSBAM 2014-C16, JPMBB 2014-C19 |
| 4.00 | WFB | Philadelphia Marriott Downtown | Philadelphia | PA | Hospitality | 61,666,666 | 6.7 | MSBAM 2014-C15, MSBAM 2014-C16, MSBAM 2014-C17 |
| 6.02 | AREF2 | The Establishment | Houston | TX | Multifamily | 10,325,544 | 1.1 | BSPRT 2018-FL3 |
| 7.00 | AREF2 | La Primavera | Houston | TX | Multifamily | 12,700,000 | 1.4 | FREMF 2018-K730 |
| 8.00 | SMC | Cross County Plaza | West Palm Beach | FL | Retail | 40,000,000 | 4.4 | COMM 2014-UBS4 |
| 13.00 | WFB | Gwinnett Marketfair | Duluth | GA | Retail | 25,400,000 | 2.8 | WFRBS 2013-C16 |
| 14.02 | AREF2 | Custer Crossing and Raven Wood | Dickinson | ND | Multifamily | 4,848,000 | 0.5 | COMM 2014-CR15; COMM 2013 CR-13 |
| 15.00 | AREF2 | Rockwall Market Center | Rockwall | TX | Retail | 22,100,000 | 2.4 | WFRBS 2013-C17 |
| 18.00 | MSMCH | Bangor Parkade | Bangor | ME | Retail | 15,000,000 | 1.6 | GSMS 2014-GC18 |
| 27.00 | WFB | Tammany on the Ponds | Lansing | MI | Multifamily | 9,963,904 | 1.1 | GSMS 2013-GC13 |
| 30.00 | WFB | McDonough Marketplace | McDonough | GA | Retail | 9,000,000 | 1.0 | GSMS 2013-GC16 |
| 33.00 | AREF2 | Highlands Plaza | Conroe | TX | Mixed Use | 7,521,084 | 0.8 | GSMS 2013-GC14 |
| 34.00 | MSMCH | Nogales Plaza | Nogales | AZ | Retail | 7,500,000 | 0.8 | WFRBS 2014-LC14 |
| 37.00 | WFB | Sorrento View Apartments | Beaverton | OR | Multifamily | 5,092,598 | 0.6 | CGCMT 2014-GC19 |
| 38.00 | AREF2 | Metroplex | Los Angeles | CA | Office | 5,000,000 | 0.5 | COMM 2012-CR5 |
| 39.00 | AREF2 | 3800 Horizon Boulevard | Feasterville-Trevose | PA | Office | 5,000,000 | 0.5 | AREIT 2020-CRE4 |
| 42.00 | WFB | Tammany Hills Apartments | Lansing | MI | Multifamily | 3,188,362 | 0.3 | GSMS 2013-GC13 |
| 44.00 | WFB | Broad Street Commons | Mansfield | TX | Retail | 2,750,000 | 0.3 | WFRBS 2013-C17 |
| Total | $427,056,159 | 46.7% |
| (1) | The table above represents the most recent securitization with respect to the mortgaged property securing the related mortgage loan, based on information provided by the related borrower or obtained through searches of a third-party database. While loans secured by the above mortgaged properties may have been securitized multiple times in prior transactions, mortgage loans in this securitization are only listed in the above chart if the mortgage loan paid off a loan in another securitization. The information has not otherwise been confirmed by the mortgage loan sellers. |
| THE INFORMATION IN THIS STRUCTURAL AND COLLATERAL TERM SHEET IS NOT COMPLETE AND MAY BE AMENDED PRIOR TO THE TIME OF SALE. THIS TERM SHEET IS NOT AN OFFER TO SELL THESE SECURITIES AND IT IS NOT A SOLICITATION OF AN OFFER TO BUY THESE SECURITIES IN ANY JURISDICTION WHERE THE OFFER OR SALE IS NOT PERMITTED. | ||
| 12 | ||
| MSWF Commercial Mortgage Trust 2023-2 | Characteristics of the Mortgage Pool |
E. Mortgage Loans with Scheduled Balloon Payments and Related Classes(1)
| Class A-2 | ||||||||||||||||
| Loan No. | Mortgage Loan Seller | Mortgage Loan Name | State | Property Type | Mortgage Loan Cut-off Date Balance ($) | % of Initial Pool Balance (%) | Mortgage Loan Balance at Maturity or ARD($) | % of Class A-2 Certificate Principal Balance (%)(2) | SF/Rooms | Loan per SF/Room ($)(3) | U/W NCF DSCR (x)(3) | U/W NOI Debt Yield (%)(3) | Cut-off Date LTV Ratio (%)(3) | Balloon or ARD LTV Ratio (%)(3) | Rem. IO Period (mos.) | Rem. Term to Maturity or ARD (mos.) |
| 4 | WFB | Philadelphia Marriott Downtown | PA | Hospitality | $61,666,666 | 6.7% | $61,666,666 | 88.8% | 1,408 | $152,699 | 1.53x | 16.0% | 54.9% | 54.9% | 59 | 59 |
| 38 | AREF2 | Metroplex | CA | Office | 5,000,000 | 0.5 | 5,000,000 | 7.2 | 419,804 | $129 | 1.73 | 12.5 | 51.9 | 51.9 | 49 | 49 |
| 46 | WFB | Westfarms | CT | Retail | 2,000,000 | 0.2 | 2,000,000 | 2.9 | 501,990 | $482 | 1.76 | 14.4 | 44.2 | 44.2 | 57 | 57 |
| Total/Weighted Average | $68,666,666 | 7.5% | $68,666,666 | 98.9% | 1.55x | 15.7% | 54.4% | 54.4% | 58 | 58 | ||||||
| (1) | The table above presents the mortgage loan(s) whose balloon payments would be applied to pay down the principal balance of the Class A-2 Certificates, assuming a 0% CPR and applying the “Structuring Assumptions” described in the Preliminary Prospectus, including the assumptions that (i) none of the mortgage loans in the pool experience prepayments prior to maturity, defaults or losses; (ii) there are no extensions of maturity dates of any mortgage loans in the pool; and (iii) each mortgage loan in the pool is paid in full on its stated maturity date. Each Class of Certificates evidences undivided ownership interests in the entire pool of mortgage loans. Debt service coverage ratio, debt yield and loan-to-value ratio information do not take into account subordinate debt (whether or not secured by the related mortgaged property), if any, that currently exists or is allowed under the terms of any mortgage loan. See Annex A-1 to the Preliminary Prospectus. |
| (2) | Reflects the percentage equal to the Balloon Balance divided by the initial Class A-2 Certificate Balance. |
| (3) | With respect to any mortgage loan that is part of a whole loan, the loan-to-value ratio, debt service coverage ratio and debt yield calculations include the related pari passu companion loan(s) but excludes any related subordinate companion loan. |
| THE INFORMATION IN THIS STRUCTURAL AND COLLATERAL TERM SHEET IS NOT COMPLETE AND MAY BE AMENDED PRIOR TO THE TIME OF SALE. THIS TERM SHEET IS NOT AN OFFER TO SELL THESE SECURITIES AND IT IS NOT A SOLICITATION OF AN OFFER TO BUY THESE SECURITIES IN ANY JURISDICTION WHERE THE OFFER OR SALE IS NOT PERMITTED. | ||
| 13 | ||
| MSWF Commercial Mortgage Trust 2023-2 | Characteristics of the Mortgage Pool |
F. Property Type Distribution(1)
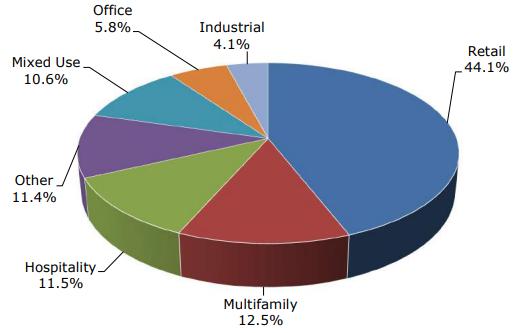
| Property Type | Number of Mortgaged Properties | Aggregate Cut-off Date Balance ($) | % of Initial Pool Balance (%) | Weighted Average Cut-off Date LTV Ratio (%) | Weighted Average Balloon LTV Ratio (%) | Weighted Average U/W NCF DSCR (x) | Weighted Average U/W NOI Debt Yield (%) | Weighted Average U/W NCF Debt Yield (%) | Weighted Average Mortgage Rate (%) | |||
| Retail | 53 | $402,934,483 | 44.1 | % | 50.7 | % | 50.5 | % | 1.95x | 14.2% | 13.6% | 7.0624% |
| Anchored | 43 | 207,924,808 | 22.7 | 61.6 | 61.2 | 1.54 | 12.0 | 11.2 | 7.1690 | |||
| Super Regional Mall | 3 | 167,000,000 | 18.3 | 37.0 | 37.0 | 2.50 | 17.2 | 16.7 | 6.8169 | |||
| Shadow Anchored | 4 | 15,002,692 | 1.6 | 56.3 | 56.3 | 1.47 | 12.2 | 11.6 | 7.9178 | |||
| Unanchored | 2 | 10,810,000 | 1.2 | 49.7 | 49.7 | 1.83 | 14.5 | 14.0 | 7.5840 | |||
| Single Tenant | 1 | 2,196,983 | 0.2 | 35.6 | 31.3 | 1.75 | 14.4 | 14.3 | 7.2230 | |||
| Multifamily | 17 | 114,686,864 | 12.5 | 56.3 | 55.5 | 1.46 | 11.3 | 10.8 | 7.2229 | |||
| Garden | 15 | 87,802,266 | 9.6 | 57.3 | 56.5 | 1.36 | 11.0 | 10.5 | 7.4207 | |||
| Senior Housing | 1 | 21,792,000 | 2.4 | 57.3 | 57.3 | 1.71 | 11.4 | 11.2 | 6.4800 | |||
| Low Rise | 1 | 5,092,598 | 0.6 | 34.4 | 30.1 | 1.96 | 16.1 | 15.7 | 6.9920 | |||
| Hospitality | 5 | 104,856,928 | 11.5 | 54.9 | 53.4 | 1.65 | 16.2 | 14.1 | 8.2941 | |||
| Full Service | 2 | 76,356,928 | 8.3 | 56.4 | 55.1 | 1.52 | 15.8 | 13.5 | 8.5815 | |||
| Extended Stay | 2 | 19,500,000 | 2.1 | 52.5 | 49.3 | 1.98 | 17.3 | 16.0 | 7.6130 | |||
| Select Service | 1 | 9,000,000 | 1.0 | 48.1 | 48.1 | 2.00 | 16.8 | 14.9 | 7.3320 | |||
| Other | 2 | 104,000,000 | 11.4 | 21.4 | 21.4 | 3.71 | 23.2 | 22.5 | 6.0226 | |||
| Data Center | 1 | 90,000,000 | 9.8 | 17.5 | 17.5 | 3.92 | 24.2 | 23.4 | 5.8850 | |||
| Golf Course/Recreational Facilities | 1 | 14,000,000 | 1.5 | 46.4 | 46.4 | 2.35 | 16.5 | 16.4 | 6.9070 | |||
| Mixed Use | 11 | 97,289,206 | 10.6 | 51.4 | 50.1 | 1.57 | 10.6 | 10.3 | 6.3081 | |||
| Lab/Office | 1 | 61,250,000 | 6.7 | 48.8 | 48.8 | 1.66 | 9.3 | 9.3 | 5.5095 | |||
| Office/Industrial/Lab | 5 | 18,122,036 | 2.0 | 53.3 | 51.1 | 1.40 | 12.9 | 12.2 | 7.9200 | |||
| Office/Industrial | 4 | 10,396,086 | 1.1 | 53.3 | 51.1 | 1.40 | 12.9 | 12.2 | 7.9200 | |||
| Office/Retail | 1 | 7,521,084 | 0.8 | 65.1 | 56.7 | 1.46 | 12.4 | 11.4 | 6.7000 | |||
| Office | 5 | 52,917,394 | 5.8 | 60.8 | 58.0 | 1.53 | 13.9 | 11.9 | 6.9187 | |||
| Suburban | 3 | 36,481,878 | 4.0 | 66.2 | 64.1 | 1.43 | 14.0 | 11.4 | 7.0557 | |||
| CBD | 2 | 16,435,516 | 1.8 | 48.9 | 44.6 | 1.76 | 13.7 | 13.1 | 6.6146 | |||
| Industrial | 7 | 37,782,000 | 4.1 | 46.5 | 46.5 | 1.97 | 16.1 | 14.7 | 7.5736 | |||
| Warehouse | 6 | 30,050,000 | 3.3 | 52.7 | 52.7 | 1.49 | 12.8 | 11.7 | 7.7983 | |||
| Warehouse/Distribution | 1 | 7,732,000 | 0.8 | 22.2 | 22.2 | 3.87 | 29.2 | 26.3 | 6.7000 | |||
| Total/Weighted Average | 100 | $914,466,875 | 100.0 | % | 49.1 | % | 48.4 | % | 1.99x | 14.8% | 13.9% | 7.0381% |
| (1) | Because this table presents information relating to the mortgaged properties and not the mortgage loans, (a) the information for mortgage loans secured by more than one mortgaged property (other than through cross-collateralization with other mortgage loans) is based on allocated loan amounts (allocating the principal balance of the mortgage loan to each of those properties according to the relative appraised values of the mortgaged properties or the allocated loan amounts or property-specific release prices set forth in the related mortgage loan documents or such other allocation as the related mortgage loan seller deemed appropriate) and (b) the information for each mortgaged property that relates to a mortgage loan that is cross-collateralized or cross-defaulted with other mortgage loans is based upon the principal balance of that mortgage loan, except that the applicable loan-to-value ratio, debt service coverage ratio and debt yield for each such mortgage loan is based upon the ratio or yield (as applicable) for the aggregate indebtedness evidenced by all loans in the group (without regard to any limitation on the amount of indebtedness secured by any mortgaged property in such cross-collateralized group). On an individual basis, without regard to the cross-collateralization feature, any mortgage loan that is part of a cross-collateralized group of mortgage loans may have a higher loan-to-value ratio, lower debt service coverage ratio and/or lower debt yield than is presented herein. With respect to any mortgage loan that is part of a whole loan, the loan-to-value ratio, debt service coverage ratio and debt yield calculations include the related pari passu companion loan(s) but exclude any related subordinate secured loan(s) (unless otherwise stated). With respect to each mortgage loan, debt service coverage ratio, debt yield and loan-to-value ratio information do not take into account any subordinate debt (whether or not secured by the related mortgaged property) that currently exists or is allowed under the terms of such mortgage loan. See Annex A-1 to the Preliminary Prospectus. |
| THE INFORMATION IN THIS STRUCTURAL AND COLLATERAL TERM SHEET IS NOT COMPLETE AND MAY BE AMENDED PRIOR TO THE TIME OF SALE. THIS TERM SHEET IS NOT AN OFFER TO SELL THESE SECURITIES AND IT IS NOT A SOLICITATION OF AN OFFER TO BUY THESE SECURITIES IN ANY JURISDICTION WHERE THE OFFER OR SALE IS NOT PERMITTED. | ||
| 14 | ||
| MSWF Commercial Mortgage Trust 2023-2 | Characteristics of the Mortgage Pool |
G. Geographic Distribution(1)(2)
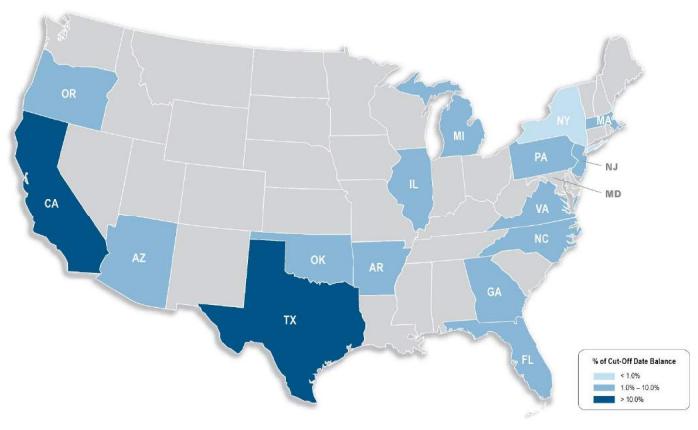
| Location | Number of Mortgaged Properties | Aggregate Cut-off Date Balance ($) | % of Initial Pool Balance (%) | Weighted Average Cut-off Date LTV Ratio (%) | Weighted Average Balloon or ARD LTV Ratio (%) | Weighted Average U/W NCF DSCR (x) | Weighted Average U/W NOI Debt Yield (%) | Weighted Average U/W NCF Debt Yield (%) | Weighted Average Mortgage Rate (%) | |||||||
| California | 6 | $123,412,527 | 13.5 | % | 40.5 | % | 39.9 | % | 2.62 | x | 16.6 | % | 16.2 | % | 6.1627 | % |
| Southern California | 4 | 105,435,516 | 11.5 | 36.2 | 35.5 | 2.83 | 17.6 | 17.2 | 6.0242 | |||||||
| Northern California | 2 | 17,977,011 | 2.0 | 65.7 | 65.7 | 1.41 | 10.7 | 10.0 | 6.9750 | |||||||
| Maryland | 4 | 107,941,860 | 11.8 | 44.2 | 43.3 | 1.91 | 15.9 | 15.1 | 7.7283 | |||||||
| New York | 1 | 90,000,000 | 9.8 | 17.5 | 17.5 | 3.92 | 24.2 | 23.4 | 5.8850 | |||||||
| Texas | 12 | 86,916,853 | 9.5 | 59.6 | 58.9 | 1.47 | 11.5 | 10.9 | 7.2198 | |||||||
| Pennsylvania | 5 | 78,335,128 | 8.6 | 54.8 | 54.5 | 1.52 | 15.0 | 13.0 | 8.3814 | |||||||
| Massachusetts | 1 | 61,250,000 | 6.7 | 48.8 | 48.8 | 1.66 | 9.3 | 9.3 | 5.5095 | |||||||
| Florida | 4 | 53,700,769 | 5.9 | 62.8 | 61.6 | 1.45 | 11.9 | 11.7 | 7.7117 | |||||||
| Other(3) | 67 | 312,909,737 | 34.2 | 56.5 | 55.6 | 1.63 | 13.4 | 12.3 | 7.2737 | |||||||
| Total/Weighted Average | 100 | $914,466,875 | 100.0 | % | 49.1 | % | 48.4 | % | 1.99 | x | 14.8 | % | 13.9 | % | 7.0381 | % |
| (1) | The mortgaged properties are located in 32 states. |
| (2) | Because this table presents information relating to the mortgaged properties and not the mortgage loans, (a) the information for mortgage loans secured by more than one mortgaged property (other than through cross-collateralization with other mortgage loans) is based on allocated loan amounts (allocating the principal balance of the mortgage loan to each of those properties according to the relative appraised values of the mortgaged properties or the allocated loan amounts or property-specific release prices set forth in the related mortgage loan documents or such other allocation as the related mortgage loan seller deemed appropriate) and (b) the information for each mortgaged property that relates to a mortgage loan that is cross-collateralized or cross-defaulted with other mortgage loans is based upon the principal balance of that mortgage loan, except that the applicable loan-to-value ratio, debt service coverage ratio and debt yield for each such mortgage loan is based upon the ratio or yield (as applicable) for the aggregate indebtedness evidenced by all loans in the group (without regard to any limitation on the amount of indebtedness secured by any mortgaged property in such cross-collateralized group). On an individual basis, without regard to the cross-collateralization feature, any mortgage loan that is part of a cross-collateralized group of mortgage loans may have a higher loan-to-value ratio, lower debt service coverage ratio and/or lower debt yield than is presented herein. With respect to any mortgage loan that is part of a whole loan, the loan-to-value ratio, debt service coverage ratio and debt yield calculations include the related pari passu companion loan(s) but exclude any related subordinate secured loan(s) (unless otherwise stated). With respect to each mortgage loan, debt service coverage ratio, debt yield and loan-to-value ratio information do not take into account any subordinate debt (whether or not secured by the related mortgaged property) that currently exists or is allowed under the terms of such mortgage loan. See Annex A-1 to the Preliminary Prospectus. |
| (3) | Includes 25 other states. |
| THE INFORMATION IN THIS STRUCTURAL AND COLLATERAL TERM SHEET IS NOT COMPLETE AND MAY BE AMENDED PRIOR TO THE TIME OF SALE. THIS TERM SHEET IS NOT AN OFFER TO SELL THESE SECURITIES AND IT IS NOT A SOLICITATION OF AN OFFER TO BUY THESE SECURITIES IN ANY JURISDICTION WHERE THE OFFER OR SALE IS NOT PERMITTED. | ||
| 15 | ||
| MSWF Commercial Mortgage Trust 2023-2 | Characteristics of the Mortgage Pool |
H. Characteristics of the Mortgage Pool(1)
| CUT-OFF DATE BALANCE | |||
| Range of Cut-off Date Balances ($) | Number of Mortgage Loans | Aggregate Cut-off Date Balance ($) | Percent by Aggregate Cut-off Date Pool Balance (%) |
| 2,000,000 - 5,000,000 | 9 | $30,695,345 | 3.4% |
| 5,000,001 - 15,000,000 | 22 | 224,462,864 | 24.5 |
| 15,000,001 - 30,000,000 | 9 | 241,392,000 | 26.4 |
| 30,000,001 - 50,000,000 | 1 | 40,000,000 | 4.4 |
| 50,000,001 - 70,000,000 | 2 | 122,916,666 | 13.4 |
| 70,000,001 - 90,000,000 | 3 | 255,000,000 | 27.9 |
| Total: | 46 | $914,466,875 | 100.0% |
| Average: | $19,879,715 | ||
| UNDERWRITTEN NOI DEBT SERVICE COVERAGE RATIO | |||
| Range of U/W NOI DSCRs (x) | Number of Mortgage Loans | Aggregate Cut-off Date Balance ($) | Percent by Aggregate Cut-off Date Pool Balance (%) |
| 1.28 - 1.50 | 11 | 181,260,000 | 19.8% |
| 1.51 - 2.00 | 22 | 374,632,277 | 41.0 |
| 2.01 - 4.00 | 11 | 260,842,598 | 28.5 |
| 4.01 - 4.30 | 2 | 97,732,000 | 10.7 |
| Total: | 46 | $914,466,875 | 100.0% |
| Weighted Average: | 2.10x | ||
| UNDERWRITTEN NOI DEBT YIELD | |||
| Range of U/W NOI Debt Yields (%) | Number of Mortgage Loans | Aggregate Cut-off Date Balance ($) | Percent by Aggregate Cut-off Date Pool Balance (%) |
| 9.3 - 12.0 | 14 | $267,602,000 | 29.3% |
| 12.1 - 16.0 | 21 | 326,290,277 | 35.7 |
| 16.1 - 20.0 | 9 | 222,842,598 | 24.4 |
| 20.1 - 29.2 | 2 | 97,732,000 | 10.7 |
| Total: | 46 | $914,466,875 | 100.0% |
| Weighted Average: | 14.8% | ||
LOAN PURPOSE | ||||
| Loan Purpose | Number of Mortgage Loans | Aggregate Cut-off Date Balance ($) | Percent by Aggregate Cut-off Date Pool Balance (%) | |
| Refinance | 33 | $735,474,614 | 80.4 | % |
| Acquisition | 10 | 130,492,261 | 14.3 | |
| Recapitalization | 3 | 48,500,000 | 5.3 | |
| Total: | 46 | $914,466,875 | 100.0 | % |
| MORTGAGE RATE | ||||
| Range of Mortgage Rates (%) | Number of Mortgage Loans | Aggregate Cut-off Date Balance ($) | Percent by Aggregate Cut-off Date Pool Balance (%) | |
| 5.5095 - 6.0000 | 3 | $226,250,000 | 24.7 | % |
| 6.0001 - 6.5000 | 2 | 51,792,000 | 5.7 | |
| 6.5001 - 7.0000 | 14 | 146,083,464 | 16.0 | |
| 7.0001 - 7.5000 | 11 | 147,946,983 | 16.2 | |
| 7.5001 - 8.0000 | 10 | 234,900,000 | 25.7 | |
| 8.0001 - 8.2500 | 3 | 22,977,762 | 2.5 | |
| 8.2501 - 8.7050 | 3 | 84,516,666 | 9.2 | |
| Total: | 46 | $914,466,875 | 100.0 | % |
| Weighted Average | 7.0381% | |||
| UNDERWRITTEN NCF DEBT SERVICE COVERAGE RATIO | ||||
| Range of U/W NCF DSCRs (x) | Number of Mortgage Loans | Aggregate Cut-off Date Balance ($) | Percent by Aggregate Cut-off Date Pool Balance (%) | |
| 1.22 - 1.50 | 18 | $283,998,846 | 31.1 | % |
| 1.51 - 2.00 | 20 | 415,986,029 | 45.5 | |
| 2.01 - 3.92 | 8 | 214,482,000 | 23.5 | |
| Total: | 46 | $914,466,875 | 100.0 | % |
| Weighted Average: | 1.99x | |||
| UNDERWRITTEN NCF DEBT YIELD | ||||
| Range of U/W NCF Debt Yields (%) | Number of Mortgage Loans | Aggregate Cut-off Date Balance ($) | Percent by Aggregate Cut-off Date Pool Balance (%) | |
| 9.1 - 12.0 | 23 | $398,461,446 | 43.6 | % |
| 12.1 - 16.0 | 17 | 311,773,429 | 34.1 | |
| 16.1 - 20.0 | 4 | 106,500,000 | 11.6 | |
| 20.1 - 26.3 | 2 | 97,732,000 | 10.7 | |
| Total: | 46 | $914,466,875 | 100.0 | % |
| Weighted Average: | 13.9% | |||
| (1) | The information for each mortgaged property that relates to a mortgage loan that is cross-collateralized or cross-defaulted with one or more other mortgage loans is based upon the principal balance of that mortgage loan, except that the applicable loan-to-value ratio, debt service coverage ratio, and debt yield for each such mortgage loan is based upon the ratio or yield (as applicable) for the aggregate indebtedness evidenced by all loans in the group (without regard to any limitation on the amount of indebtedness secured by any mortgaged property in such cross-collateralized group). With respect to any mortgage loan that is part of a whole loan, the loan-to-value ratio, debt service coverage ratio and debt yield calculations include the related pari passu companion loan(s) but exclude any related subordinate debt (unless otherwise stated). With respect to each mortgage loan, debt service coverage ratio, debt yield and loan-to-value ratio information do not take into account any subordinate debt (whether or not secured by the related mortgaged property) that currently exists or is allowed under the terms of such mortgage loan. See Annex A-1 to the Preliminary Prospectus. Prepayment provisions for each mortgage loan reflects the entire life of the loan (from origination to maturity or ARD) and may be currently prepayable. |
| THE INFORMATION IN THIS STRUCTURAL AND COLLATERAL TERM SHEET IS NOT COMPLETE AND MAY BE AMENDED PRIOR TO THE TIME OF SALE. THIS TERM SHEET IS NOT AN OFFER TO SELL THESE SECURITIES AND IT IS NOT A SOLICITATION OF AN OFFER TO BUY THESE SECURITIES IN ANY JURISDICTION WHERE THE OFFER OR SALE IS NOT PERMITTED. | ||
| 16 | ||
| MSWF Commercial Mortgage Trust 2023-2 | Characteristics of the Mortgage Pool |
| ORIGINAL TERM TO MATURITY | |||
| Original Terms to Maturity (months) | Number of Mortgage Loans | Aggregate Cut- off Date Balance | Percent by Aggregate Cut-off Date Pool Balance (%) |
| 60 | 3 | $68,666,666 | 7.5% |
| 120 | 43 | 845,800,209 | 92.5 |
| Total: | 46 | $914,466,875 | 100.0% |
| Weighted Average: | 115 months | ||
| REMAINING TERM TO MATURITY | |||
| Range of Remaining Terms to Maturity (months) | Number of Mortgage Loans | Aggregate Cut- off Date Balance | Percent by Aggregate Cut-off Date Pool Balance (%) |
| 49 - 60 | 3 | $68,666,666 | 7.5% |
| 61 - 120 | 43 | 845,800,209 | 92.5 |
| Total: | 46 | $914,466,875 | 100.0% |
| Weighted Average: | 113 months | ||
| ORIGINAL AMORTIZATION TERM(1) | |||
| Original Amortization Terms (months) | Number of Mortgage Loans | Aggregate Cut- off Date Balance | Percent by Aggregate Cut-off Date Pool Balance (%) |
| Non-Amortizing | 33 | $764,900,666 | 83.6% |
| 360 | 13 | 149,566,209 | 16.4 |
| Total: | 46 | $914,466,875 | 100.0% |
| Weighted Average: | 360 months | ||
| REMAINING AMORTIZATION TERM(2) | |||
| Range of Remaining Amortization Terms (months) | Number of Mortgage Loans | Aggregate Cut- off Date Balance | Percent by Aggregate Cut-off Date Pool Balance (%) |
| Non-Amortizing | 33 | $764,900,666 | 83.6% |
| 353 - 360 | 13 | 149,566,209 | 16.4 |
| Total: | 46 | $914,466,875 | 100.0% |
| Weighted Average(3): | 359 months | ||
| LOCKBOXES | |||
| Type of Lockbox | Number of Mortgage Loans | Aggregate Cut- off Date Balance | Percent by Aggregate Cut-off Date Pool Balance (%) |
| Hard/ Springing Cash Management | 16 | $392,098,846 | 42.9% |
| Springing | 19 | 204,568,864 | 22.4 |
| Hard/ In Place Cash Management | 5 | 167,196,983 | 18.3 |
| Soft/ Springing Cash Management | 4 | 110,602,182 | 12.1 |
| Soft/ In Place Cash Management | 2 | 40,000,000 | 4.4 |
| Total: | 46 | $914,466,875 | 100.0% |
| PREPAYMENT PROVISION SUMMARY | |||
| Prepayment Provision | Number of Mortgage Loans | Aggregate Cut- off Date Balance | Percent by Aggregate Cut-off Date Pool Balance (%) |
| Lockout / Defeasance / Open | 34 | $661,679,125 | 72.4% |
| Lockout / GRTR 1% or YM / GRTR 1% or YM or Defeasance / Open | 5 | 106,100,000 | 11.6 |
| Lockout / GRTR 1% or YM / Open | 5 | 77,500,000 | 8.5 |
| Lockout / GRTR 0.5% or YM or Defeasance / Open | 1 | 61,666,666 | 6.7 |
| Lockout / GRTR 2% or YM or Defeasance / Open | 1 | 7,521,084 | 0.8 |
| Total: | 46 | $914,466,875 | 100.0% |
CUT-OFF DATE LOAN-TO-VALUE RATIO | ||||
| Range of Cut-off Date LTV Ratios (%) | Number of Mortgage Loans | Aggregate Cut- off Date Balance | Percent by Aggregate Cut-off Date Pool Balance (%) | |
| 17.5 - 20.0 | 1 | $90,000,000 | 9.8 | % |
| 20.1 - 30.0 | 1 | 7,732,000 | 0.8 | |
| 30.1 - 40.0 | 5 | 88,227,943 | 9.6 | |
| 40.1 - 50.0 | 10 | 224,435,516 | 24.5 | |
| 50.1 - 60.0 | 15 | 256,082,570 | 28.0 | |
| 60.1 - 67.9 | 14 | 247,988,846 | 27.1 | |
| Total: | 46 | $914,466,875 | 100.0 | % |
| Weighted Average: | 49.1% | |||
| BALLOON LOAN-TO-VALUE RATIO | ||||
| Range of Balloon LTV Ratios (%) | Number of Mortgage Loans | Aggregate Cut- off Date Balance | Percent by Aggregate Cut-off Date Pool Balance (%) | |
| 17.5 - 20.0 | 1 | $90,000,000 | 9.8 | % |
| 20.1 - 30.0 | 2 | 10,920,362 | 1.2 | |
| 30.1 - 40.0 | 4 | 85,039,581 | 9.3 | |
| 40.1 - 50.0 | 11 | 234,399,420 | 25.6 | |
| 50.1 - 60.0 | 16 | 268,330,012 | 29.3 | |
| 60.1 - 67.3 | 12 | 225,777,500 | 24.7 | |
| Total: | 46 | $914,466,875 | 100.0 | % |
| Weighted Average: | 48.4% | |||
| AMORTIZATION TYPE | ||||
| Amortization Type | Number of Mortgage Loans | Aggregate Cut- off Date Balance | Percent by Aggregate Cut-off Date Pool Balance (%) | |
| Interest Only | 32 | $703,650,666 | 76.9 | % |
| Interest Only, Amortizing Balloon | 5 | 85,477,500 | 9.3 | |
| Amortizing Balloon | 8 | 64,088,709 | 7.0 | |
| Interest Only, ARD | 1 | 61,250,000 | 6.7 | |
| Total: | 46 | $914,466,875 | 100.0 | % |
| ORIGINAL TERM OF INTEREST-ONLY PERIOD FOR PARTIAL IO LOANS | ||||
| IO Terms (months) | Number of Mortgage Loans | Aggregate Cut- off Date Balance | Percent by Aggregate Cut-off Date Pool Balance (%) | |
| 24 | 2 | $10,477,500 | 1.1 | % |
| 60 | 2 | 45,000,000 | 4.9 | |
| 90 | 1 | 30,000,000 | 3.3 | |
| Total: | 5 | $85,477,500 | 9.3 | % |
| Weighted Average: | 66 months | |||
| SEASONING | ||||
| Seasoning (months) | Number of Mortgage Loans | Aggregate Cut- off Date Balance | Percent by Aggregate Cut-off Date Pool Balance (%) | |
| 0 | 6 | $100,277,500 | 11.0 | % |
| 1 | 13 | 278,698,928 | 30.5 | |
| 2 | 7 | 155,089,581 | 17.0 | |
| 3 | 8 | 117,500,000 | 12.8 | |
| 4 | 2 | 32,750,000 | 3.6 | |
| 5 | 4 | 50,673,350 | 5.5 | |
| 6 | 2 | 96,792,000 | 10.6 | |
| 7 | 1 | 11,435,516 | 1.3 | |
| 8 | 1 | 5,000,000 | 0.5 | |
| 10 | 1 | 61,250,000 | 6.7 | |
| 11 | 1 | 5,000,000 | 0.5 | |
| Total: | 46 | $914,466,875 | 100.0 | % |
| Weighted Average: | 3 months | |||
| (1) | The original amortization term shown for any mortgage loan that is interest only for part of its term does not include the number of months in its interest only period and reflects only the number of months as of the commencement of amortization remaining from the end of such interest-only period. |
| (2) | The remaining amortization term shown for any mortgage loan that is interest only for part of its term does not include the number of months in its interest only period and reflects only the number of months as of the commencement of amortization remaining from the end of such interest-only period. |
| (3) | Excludes the non-amortizing mortgage loans. |
| THE INFORMATION IN THIS STRUCTURAL AND COLLATERAL TERM SHEET IS NOT COMPLETE AND MAY BE AMENDED PRIOR TO THE TIME OF SALE. THIS TERM SHEET IS NOT AN OFFER TO SELL THESE SECURITIES AND IT IS NOT A SOLICITATION OF AN OFFER TO BUY THESE SECURITIES IN ANY JURISDICTION WHERE THE OFFER OR SALE IS NOT PERMITTED. | ||
| 17 | ||
| MSWF Commercial Mortgage Trust 2023-2 | Certain Terms and Conditions |
V. Certain Terms and Conditions
| Interest Entitlements: | The interest entitlement of each Class of Certificates (other than the Class V and R Certificates) or trust component on each Distribution Date generally will be the interest accrued during the related Interest Accrual Period on the related Certificate Balance or Notional Amount at the related pass-through rate, net of any prepayment interest shortfalls allocated to that Class or trust component for such Distribution Date as described below. If prepayment interest shortfalls arise from voluntary prepayments (without Master Servicer consent) on particular non-specially serviced loans during any collection period, the Master Servicer is required to make a compensating interest payment to offset those shortfalls, generally up to an amount equal to the portion of its master servicing fees that accrue at 0.25 basis points per annum. The remaining amount of prepayment interest shortfalls will be allocated to reduce the interest entitlement on all Classes of Certificates (other than the Exchangeable Certificates) and trust components that are entitled to interest, on a pro rata basis, based on their respective amounts of accrued interest for the related Distribution Date. For any Distribution Date, prepayment interest shortfalls allocated to a trust component will be allocated amongst the related Classes of Exchangeable Certificates, pro rata, in accordance with their respective interest accrual amounts for that distribution date. If a Class or trust component receives less than the entirety of its interest entitlement on any Distribution Date, then the shortfall (excluding any shortfall due to prepayment interest shortfalls), together with interest thereon, will be added to its interest entitlement for the next succeeding Distribution Date. | |
| Principal Distribution Amount: | The Principal Distribution Amount for each Distribution Date generally will be the aggregate amount of principal received or advanced in respect of the mortgage loans, net of any non-recoverable advances and interest thereon and workout-delayed reimbursement amounts that are reimbursed to the Master Servicer, the Special Servicer or the Trustee during the related collection period. Non-recoverable advances and interest thereon are reimbursable from principal collections and advances before reimbursement from other amounts. Workout-delayed reimbursement amounts are reimbursable from principal collections. | |
| Subordination, Allocation of Losses and Certain Expenses | The chart below describes the manner in which the payment rights of certain Classes of Certificates will be senior or subordinate, as the case may be, to the payment rights of other Classes of Certificates. The chart also shows the corresponding entitlement to receive principal and/or interest of certain Classes of Certificates on any distribution date in descending order. It also shows the manner in which losses are allocated to certain Classes of Certificates in ascending order (beginning with the Non-Offered Certificates, other than the Class X-D, X-F, V and R Certificates) to reduce the Certificate Balance of each such Class to zero; provided that no principal payments or mortgage loan losses will be allocated to the Class X-A, X-B, X-D, X-F, V or R Certificates, although principal payments and losses may reduce the Notional Amounts of the Class X-A, X-B, X-D and X-F Certificates and, therefore, the amount of interest they accrue. | |
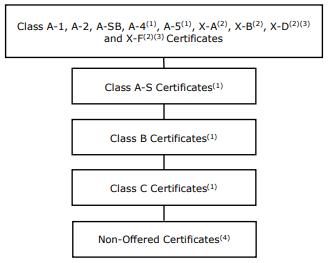 | ||
| (1) | The maximum Certificate Balances of Class A-4, A-5, A-S, B and C Certificates (subject to the constraint on the aggregate initial Certificate Balance of the Class A-4 and Class A-5 trust components discussed in footnote (10) to the table under “Certificate Structure”) will be issued on the closing date, and the Certificate Balance or Notional Amount of each other class of Exchangeable Certificates will be equal to zero on the closing date. The relative priorities of the Exchangeable Certificates are described more fully under “Exchangeable Certificates.” (2) The Class X‑A, X‑B, X-D and X-F Certificates are interest‑only certificates. (3) Non-Offered Certificates. (4) Other than the Class X-D, X-F, V and R Certificates | |
| THE INFORMATION IN THIS STRUCTURAL AND COLLATERAL TERM SHEET IS NOT COMPLETE AND MAY BE AMENDED PRIOR TO THE TIME OF SALE. THIS TERM SHEET IS NOT AN OFFER TO SELL THESE SECURITIES AND IT IS NOT A SOLICITATION OF AN OFFER TO BUY THESE SECURITIES IN ANY JURISDICTION WHERE THE OFFER OR SALE IS NOT PERMITTED. | ||
| 18 | ||
| MSWF Commercial Mortgage Trust 2023-2 | Certain Terms and Conditions |
| (2) | The Class X-A, X-B, X-D and X-F Certificates are interest-only certificates. | |
| (3) | Non-Offered Certificates. | |
| (4) | Other than the Class X-D, X-F, V and R Certificates | |
| Distributions: | On each Distribution Date, funds available for distribution from the mortgage loans, net of specified trust fees, expenses and reimbursements will generally be distributed in the following amounts and order of priority (in each case to the extent of remaining available funds): | |
| 1. | Class A-1, A-2, A-SB, X-A, X-B, X-D and X-F Certificates and the Class A-4, A-4-X1, A-4-X2, A-5, A-5-X1 and A-5-X2 trust components: To interest on the Class A-1, A-2, A-SB, X-A, X-B, X-D and X-F Certificates and the Class A-4, A-4-X1, A-4-X2, A-5, A-5-X1 and A-5-X2 trust components, pro rata, according to their respective interest entitlements. | |
| 2. | Class A-1, A-2 and A-SB Certificates and the Class A-4 and A-5 trust components: To principal on the Class A-1, A-2 and A-SB Certificates and the Class A-4 and A-5 trust components in the following amounts and order of priority: (i) first, to principal on the Class A-SB Certificates, in an amount up to the Principal Distribution Amount for such Distribution Date until their Certificate Balance is reduced to the Class A-SB Planned Principal Balance for such Distribution Date; (ii) second, to principal on the Class A-1 Certificates until their Certificate Balance is reduced to zero, up to the remainder of the Principal Distribution Amount for such Distribution Date; (iii) third, to principal on the Class A-2 Certificates until their Certificate Balance is reduced to zero, up to the remainder of the Principal Distribution Amount for such Distribution Date; (iv) fourth, to principal on the Class A-4 trust component until their Certificate Balance is reduced to zero, up to the remainder of the Principal distribution Amount for such distribution Date; (v) fifth, to principal on the Class A-5 trust component until its Certificate Balance is reduced to zero, up to the remainder of the Principal Distribution Amount for such Distribution Date; and (vi) sixth, to principal on the Class A-SB Certificates until their Certificate Balance is reduced to zero, up to the remainder of the Principal Distribution Amount for such Distribution Date. However, if the Certificate Balance of each Class of Principal Balance Certificates, other than the Class A-1, A-2 and A-SB Certificates and the Class A-4 and A-5 trust components, has been reduced to zero as a result of the allocation of mortgage loan losses and expenses and any of the Class A-1, A-2 and A-SB Certificates and the Class A-4 and A-5 trust components remains outstanding, then the Principal Distribution Amount will be distributed to the Class A-1, A-2 and A-SB Certificates and the Class A-4 and A-5 trust components remaining outstanding, pro rata, based on their respective outstanding Certificate Balances, until their Certificate Balances have been reduced to zero. | |
| 3. | Class A-1, A-2 and A-SB Certificates and the Class A-4 and A-5 trust components: To reimburse the holders of the Class A-1, A-2 and A-SB Certificates and the Class A-4 and A-5 trust components, pro rata, on the basis of previously allocated unreimbursed losses, for any previously unreimbursed losses (plus interest thereon) on the mortgage loans that were previously allocated in reduction of the Certificate Balances of such Classes or trust components. | |
| 4. | Class A-S, A-S-X1 and A-S-X2 trust components: To make distributions on the Class A-S, A-S-X1 and A-S-X2 trust components as follows: (a) first, to interest on the Class A-S, A-S-X1 and A-S-X2 trust components, pro rata, according to their respective interest entitlements; (b) next, to the extent of the portion of the Principal Distribution Amount remaining after distributions in respect of principal to each Class with a higher distribution priority (in this case, the Class A-1, A-2 and A-SB Certificates and the Class A-4 and A-5 trust components), to principal on the Class A-S trust component until its Certificate Balance is reduced to zero; and (c) next, to reimburse the holders of the Class A-S trust component for any previously unreimbursed losses (plus interest thereon) on the mortgage loans that were previously allocated to that trust component in reduction of their Certificate Balance. | |
5. | Class B, B-X1, B-X2 trust components: To make distributions on the Class B, B-X1 and B-X2 trust components as follows: (a) first, to interest on the Class B, B-X1 and B-X2 trust components, pro rata, according to their respective interest entitlements; (b) next, to the extent of the portion of the Principal Distribution Amount remaining after distributions in respect of principal to each Class with a higher distribution priority (in this case, the Class A-1, A-2 and A-SB Certificates and the Class A-4, A-5 and A-S trust components), to principal on the Class B trust component until its Certificate Balance is reduced to zero; and (c) next, to reimburse the holders of the Class B trust component for any previously unreimbursed losses (plus interest thereon) on the mortgage loans that were previously allocated to that trust component in reduction of their Certificate Balance. | |
| 6. | Class C, C-X1, C-X2 trust components: To make distributions on the Class C, C-X1 and C-X2 trust components as follows: (a) first, to interest on the Class C, C-X1 and C-X2 | |
| THE INFORMATION IN THIS STRUCTURAL AND COLLATERAL TERM SHEET IS NOT COMPLETE AND MAY BE AMENDED PRIOR TO THE TIME OF SALE. THIS TERM SHEET IS NOT AN OFFER TO SELL THESE SECURITIES AND IT IS NOT A SOLICITATION OF AN OFFER TO BUY THESE SECURITIES IN ANY JURISDICTION WHERE THE OFFER OR SALE IS NOT PERMITTED. | ||
| 19 | ||
| MSWF Commercial Mortgage Trust 2023-2 | Certain Terms and Conditions |
| trust components, pro rata, according to their respective interest entitlements; (b) next, to the extent of the portion of the Principal Distribution Amount remaining after distributions in respect of principal to each Class with a higher distribution priority (in this case, the Class A-1, A-2 and A-SB Certificates and the Class A-4, A-5, A-S and B trust components), to principal on the Class C trust component until its Certificate Balance is reduced to zero; and (c) next, to reimburse the holders of the Class C trust component for any previously unreimbursed losses (plus interest thereon) on the mortgage loans that were previously allocated to that trust component in reduction of their Certificate Balance. | ||
| 7. | Class D Certificates: To make distributions on the Class D Certificates as follows: (a) first, to interest on the Class D Certificates in the amount of the interest entitlement for that Class; (b) next, to the extent of the portion of the Principal Distribution Amount remaining after distributions in respect of principal to each Class with a higher distribution priority (in this case, the Class A-1, A-2 and A-SB Certificates and the Class A-4, A-5, A-S, B and C trust components), to principal on the Class D Certificates until their Certificate Balance is reduced to zero; and (c) next, to reimburse the holders of the Class D Certificates for any previously unreimbursed losses (plus interest thereon) on the mortgage loans that were previously allocated to that Class in reduction of their Certificate Balance. | |
| 8. | After the Class A-1, A-2, A-SB and D Certificates and the Class A-4, A-5, A-S, B and C trust components are paid all amounts to which they are entitled, the remaining funds available for distribution will be used to pay interest, principal and loss reimbursement amounts on the Class E, F, G-RR and H-RR Certificates sequentially in that order in a manner analogous to the Class D Certificates. |
Principal and interest payable on the Class A-4, A-4-X1, A-4-X2, A-5, A-5-X1, A-5-X2, A-S, A-S-X1, A-S-X2, B, B-X1, B-X2, C, C-X1 and C-X2 trust components will be distributed pro rata to the corresponding Classes of Exchangeable Certificates representing interests therein in accordance with their Class Percentage Interests therein as described below under “Exchangeable Certificates.” | |||||
| Exchangeable Certificates: | Each class of Exchangeable Certificates may be exchanged for the corresponding Classes of Exchangeable Certificates set forth next to such Class in the table below, and vice versa. Following any exchange of one or more Classes of Exchangeable Certificates (the applicable “Surrendered Classes”) for one or more Classes of other Exchangeable Certificates (the applicable “Received Classes”), the Class Percentage Interests (as defined below) of the outstanding Certificate Balances or Notional Amounts of the Corresponding Trust Components that are represented by the Surrendered Classes (and consequently their related Certificate Balances or Notional Amounts) will be decreased, and those of the Received Classes (and consequently their related Certificate Balances or Notional Amounts) will be increased. The dollar denomination of each of the Received Classes of Certificates must be equal to the dollar denomination of each of the Surrendered Classes of Certificates. No fee will be required with respect to any exchange of Exchangeable Certificates. | ||||
| Surrendered Classes (or Received Classes) of Certificates | Received Classes (or Surrendered Classes) of Certificates | ||||
| Class A-4 | Class A-4-1, Class A-4-X1 | ||||
| Class A-4 | Class A-4-2, Class A-4-X2 | ||||
| Class A-5 | Class A-5-1, Class A-5-X1 | ||||
| Class A-5 | Class A-5-2, Class A-5-X2 | ||||
| Class A-S | Class A-S-1, Class A-S-X1 | ||||
| Class A-S | Class A-S-2, Class A-S-X2 | ||||
| Class B | Class B-1, Class B-X1 | ||||
| Class B | Class B-2, Class B-X2 | ||||
| Class C | Class C-1, Class C-X1 | ||||
| Class C | Class C-2, Class C-X2 | ||||
| On the closing date, the issuing entity will issue the following “trust components,” each with the initial Certificate Balance (or, if such trust component has an “X” suffix, Notional Amount) and pass-through rate set forth next to it in the table below. Each trust component with an “X” suffix will not be entitled to distributions of principal. | |||||
| THE INFORMATION IN THIS STRUCTURAL AND COLLATERAL TERM SHEET IS NOT COMPLETE AND MAY BE AMENDED PRIOR TO THE TIME OF SALE. THIS TERM SHEET IS NOT AN OFFER TO SELL THESE SECURITIES AND IT IS NOT A SOLICITATION OF AN OFFER TO BUY THESE SECURITIES IN ANY JURISDICTION WHERE THE OFFER OR SALE IS NOT PERMITTED. | ||
| 20 | ||
| MSWF Commercial Mortgage Trust 2023-2 | Certain Terms and Conditions |
Trust Component | Initial Certificate Balance or Notional Amount | Pass-Through Rate | |
| Class A-4 | See footnote (10) to the table under “Certificate Structure” | Class A-4 Certificate Pass-Through Rate minus 1.00% | |
| Class A-4-X1 | Equal to Class A-4 trust component Certificate Balance | 0.50% | |
| Class A-4-X2 | Equal to Class A-4 trust component Certificate Balance | 0.50% | |
| Class A-5 | See footnote (10) to the table under “Certificate Structure” | Class A-5 Certificate Pass-Through Rate minus 1.00% | |
| Class A-5-X1 | Equal to Class A-5 trust component Certificate Balance | 0.50% | |
| Class A-5-X2 | Equal to Class A-5 trust component Certificate Balance | 0.50% | |
| Class A-S | $121,167,000 | Class A-S Certificate Pass-Through Rate minus 1.00% | |
| Class A-S-X1 | Equal to Class A-S trust component Certificate Balance | 0.50% | |
| Class A-S-X2 | Equal to Class A-S trust component Certificate Balance | 0.50% | |
| Class B | $38,865,000 | Class B Certificate Pass-Through Rate minus 1.00% | |
| Class B-X1 | Equal to Class B trust component Certificate Balance | 0.50% | |
| Class B-X2 | Equal to Class B trust component Certificate Balance | 0.50% | |
| Class C | $28,577,000 | Class C Certificate Pass-Through Rate minus 1.00% | |
| Class C-X1 | Equal to Class C trust component Certificate Balance | 0.50% | |
| Class C-X2 | Equal to Class C trust component Certificate Balance | 0.50% |
| Each class of Exchangeable Certificates represents an undivided beneficial ownership interest in the trust components set forth next to it in the table below (the “Corresponding Trust Components”). Each class of Exchangeable Certificates has a pass-through rate equal to the sum of the pass-through rates of the Corresponding Trust Components and represents a percentage interest (the related “Class Percentage Interest”) in each Corresponding Trust Component, including principal and interest payable thereon, equal to (x) the Certificate Balance (or, if such class has an “X” suffix, Notional Amount) of such class of certificates, divided by (y) the Certificate Balance of the Class A-4 trust component (if such class of Exchangeable Certificates has an “A-4” designation), the Class A-5 trust component (if such class of Exchangeable Certificates has an “A-5” designation), the Class A-S trust component (if such class of Exchangeable Certificates has an “A-S” designation), the Class B trust component (if such class of Exchangeable Certificates has a “B” designation) or the Class C trust component (if such class of Exchangeable Certificates has a “C” designation). |
| THE INFORMATION IN THIS STRUCTURAL AND COLLATERAL TERM SHEET IS NOT COMPLETE AND MAY BE AMENDED PRIOR TO THE TIME OF SALE. THIS TERM SHEET IS NOT AN OFFER TO SELL THESE SECURITIES AND IT IS NOT A SOLICITATION OF AN OFFER TO BUY THESE SECURITIES IN ANY JURISDICTION WHERE THE OFFER OR SALE IS NOT PERMITTED. | ||
| 21 | ||
| MSWF Commercial Mortgage Trust 2023-2 | Certain Terms and Conditions |
Group of Exchangeable Certificates | Class of Exchangeable Certificates | Corresponding Trust Components | |
| “Class A-4 Exchangeable Certificates” | Class A-4 | Class A-4, Class A-4-X1, Class A-4-X2 | |
| Class A-4-1 | Class A-4, Class A-4-X2 | ||
| Class A-4-2 | Class A-4 | ||
| Class A-4-X1 | Class A-4-X1 | ||
| Class A-4-X2 | Class A-4-X1, Class A-4-X2 | ||
| “Class A-5 Exchangeable Certificates” | Class A-5 | Class A-5, Class A-5-X1, Class A-5-X2 | |
| Class A-5-1 | Class A-5, Class A-5-X2 | ||
| Class A-5-2 | Class A-5 | ||
| Class A-5-X1 | Class A-5-X1 | ||
| Class A-5-X2 | Class A-5-X1, Class A-5-X2 | ||
| “Class A-S Exchangeable Certificates” | Class A-S | Class A-S, Class A-S-X1, Class A-S-X2 | |
| Class A-S-1 | Class A-S, Class A-S-X2 | ||
| Class A-S-2 | Class A-S | ||
| Class A-S-X1 | Class A-S-X1 | ||
| Class A-S-X2 | Class A-S-X1, Class A-S-X2 | ||
| “Class B Exchangeable Certificates” | Class B | Class B, Class B-X1, Class B-X2 | |
| Class B-1 | Class B, Class B-X2 | ||
| Class B-2 | Class B | ||
| Class B-X1 | Class B-X1 | ||
| Class B-X2 | Class B-X1, Class B-X2 | ||
| “Class C Exchangeable Certificates” | Class C | Class C, Class C-X1, Class C-X2 | |
| Class C-1 | Class C, Class C-X2 | ||
| Class C-2 | Class C | ||
| Class C-X1 | Class C-X1 | ||
| Class C-X2 | Class C-X1, Class C-X2 |
The maximum Certificate Balance or Notional Amount of each class of Class A-4 Exchangeable Certificates that could be issued in an exchange is equal to the Certificate Balance of the Class A-4 trust component, the maximum Certificate Balance or Notional Amount of each class of Class A-5 Exchangeable Certificates that could be issued in an exchange is equal to the Certificate Balance of the Class A-5 trust component, the maximum Certificate Balance or Notional Amount of each class of Class A-S Exchangeable Certificates that could be issued in an exchange is equal to the Certificate Balance of the Class A-S trust component, the maximum Certificate Balance or Notional Amount of each class of Class B Exchangeable Certificates that could be issued in an exchange is equal to the Certificate Balance of the Class B trust component, and the maximum Certificate Balance or Notional Amount of each class of Class C Exchangeable Certificates that could be issued in an exchange is equal to the Certificate Balance of the Class C trust component. The maximum Certificate Balances of Class A-4, A-5, A-S, B and C Certificates (subject to the constraints on the aggregate initial Certificate Balance of the Class A-4 and A-5 trust components discussed in footnote (10) to the table under “Certificate Structure”) will be issued on the closing date, and the Certificate Balance or Notional Amount of each other class of Exchangeable Certificates will be equal to zero on the closing date.
Each class of Class A-4 Exchangeable Certificates, Class A-5 Exchangeable Certificates, Class A-S Exchangeable Certificates, Class B Exchangeable Certificates and Class C Exchangeable Certificates will have a Certificate Balance or Notional Amount equal to its Class Percentage Interest multiplied by the Certificate Balance of the Class A-4 trust component, Class A-5 trust |
| THE INFORMATION IN THIS STRUCTURAL AND COLLATERAL TERM SHEET IS NOT COMPLETE AND MAY BE AMENDED PRIOR TO THE TIME OF SALE. THIS TERM SHEET IS NOT AN OFFER TO SELL THESE SECURITIES AND IT IS NOT A SOLICITATION OF AN OFFER TO BUY THESE SECURITIES IN ANY JURISDICTION WHERE THE OFFER OR SALE IS NOT PERMITTED. | ||
| 22 | ||
| MSWF Commercial Mortgage Trust 2023-2 | Certain Terms and Conditions |
component, Class A-S trust component, Class B trust component or Class C trust component, respectively. Each class of Class A-4 Exchangeable Certificates, Class A-5 Exchangeable Certificates, Class A-S Exchangeable Certificates, Class B Exchangeable Certificates and Class C Exchangeable Certificates with a Certificate Balance will have the same approximate initial credit support percentage, Expected Weighted Average Life, Expected Principal Window, Certificate Principal U/W NOI Debt Yield and Certificate Principal to Value Ratio as the Class A-4 Certificates, Class A-5 Certificates, Class A-S Certificates, Class B Certificates or Class C Certificates, respectively, shown above. | |
| Allocation of Yield Maintenance Charges and Prepayment Premiums: | If any Yield Maintenance Charge or Prepayment Premium is collected during any particular collection period with respect to any mortgage loan, then on the Distribution Date corresponding to that collection period, the certificate administrator will pay that Yield Maintenance Charge or Prepayment Premium (net of liquidation fees payable therefrom) in the following manner: |
(1) to each class of the Class A-1, A-2, A-SB, A-4, A-4-1, A-4-2, A-5, A-5-1, A-5-2, A-S, A-S-1, A-S-2, B, B-1, B-2, C, C-1, C-2, D and E Certificates, the product of (a) such Yield Maintenance Charge or Prepayment Premium, (b) the related Base Interest Fraction for such class and the applicable principal prepayment, and (c) a fraction, the numerator of which is equal to the amount of principal distributed to such class for that Distribution Date, and the denominator of which is the total amount of principal distributed to the Class A-1, A-2, A-SB, D and E Certificates and the Class A-4 Exchangeable Certificates, the Class A-5 Exchangeable Certificates, the Class A-S Exchangeable Certificates, the Class B Exchangeable Certificates and the Class C Exchangeable Certificates for that Distribution Date, (2) to the Class A-4-X1 Certificates, the product of (a) such Yield Maintenance Charge or Prepayment Premium, (b) a fraction, the numerator of which is equal to the amount of principal distributed to the Class A-4-1 Certificates for that Distribution Date, and the denominator of which is the total amount of principal distributed to the Class A-1, A-2, A-SB, D and E Certificates and the Class A-4 Exchangeable Certificates, the Class A-5 Exchangeable Certificates, the Class A-S Exchangeable Certificates, the Class B Exchangeable Certificates and the Class C Exchangeable Certificates for that Distribution Date and (c) the difference between (i) the Base Interest Fraction for the Class A-4 Certificates and the applicable principal prepayment and (ii) the Base Interest Fraction for the Class A-4-1 Certificates and the applicable principal prepayment, (3) to the Class A-4-X2 Certificates, the product of (a) such Yield Maintenance Charge or Prepayment Premium, (b) a fraction, the numerator of which is equal to the amount of principal distributed to the Class A-4-2 Certificates for that Distribution Date, and the denominator of which is the total amount of principal distributed to the Class A-1, A-2, A-SB, D and E Certificates and the Class A-4 Exchangeable Certificates, the Class A-5 Exchangeable Certificates, the Class A-S Exchangeable Certificates, the Class B Exchangeable Certificates and the Class C Exchangeable Certificates for that Distribution Date and (c) the difference between (i) the Base Interest Fraction for the Class A-4 Certificates and the applicable principal prepayment and (ii) the Base Interest Fraction for the Class A-4-2 Certificates and the applicable principal prepayment, (4) to the Class A-5-X1 Certificates, the product of (a) such Yield Maintenance Charge or Prepayment Premium, (b) a fraction, the numerator of which is equal to the amount of principal distributed to the Class A-5-1 Certificates for that Distribution Date, and the denominator of which is the total amount of principal distributed to the Class A-1, A-2, A-SB, D and E Certificates and the Class A-4 Exchangeable Certificates, the Class A-5 Exchangeable Certificates, the Class A-S Exchangeable Certificates, the Class B Exchangeable Certificates and the Class C Exchangeable Certificates for that Distribution Date and (c) the difference between (i) the Base Interest Fraction for the Class A-5 Certificates and the applicable principal prepayment and (ii) the Base Interest Fraction for the Class A-5-1 Certificates and the applicable principal prepayment, (5) to the Class A-5-X2 Certificates, the product of (a) such Yield Maintenance Charge or Prepayment Premium, (b) a fraction, the numerator of which is equal to the amount of principal distributed to the Class A-5-2 Certificates for that Distribution Date, and the denominator of which is the total amount of principal distributed to the Class A-1, A-2, A-SB, D and E Certificates and the Class A-4 Exchangeable Certificates, the Class A-5 Exchangeable Certificates, the Class A-S Exchangeable Certificates, the Class B Exchangeable Certificates and the Class C Exchangeable Certificates for that Distribution Date and (c) the difference |
| THE INFORMATION IN THIS STRUCTURAL AND COLLATERAL TERM SHEET IS NOT COMPLETE AND MAY BE AMENDED PRIOR TO THE TIME OF SALE. THIS TERM SHEET IS NOT AN OFFER TO SELL THESE SECURITIES AND IT IS NOT A SOLICITATION OF AN OFFER TO BUY THESE SECURITIES IN ANY JURISDICTION WHERE THE OFFER OR SALE IS NOT PERMITTED. | ||
| 23 | ||
| MSWF Commercial Mortgage Trust 2023-2 | Certain Terms and Conditions |
between (i) the Base Interest Fraction for the Class A-5 Certificates and the applicable principal prepayment and (ii) the Base Interest Fraction for the Class A-5-2 Certificates and the applicable principal prepayment, (6) to the Class A-S-X1 Certificates, the product of (a) such Yield Maintenance Charge or Prepayment Premium, (b) a fraction, the numerator of which is equal to the amount of principal distributed to the Class A-S-1 Certificates for that Distribution Date, and the denominator of which is the total amount of principal distributed to the Class A-1, A-2, A-SB, D and E Certificates and the Class A-4 Exchangeable Certificates, the Class A-5 Exchangeable Certificates, the Class A-S Exchangeable Certificates, the Class B Exchangeable Certificates and the Class C Exchangeable Certificates for that Distribution Date and (c) the difference between (i) the Base Interest Fraction for the Class A-S Certificates and the applicable principal prepayment and (ii) the Base Interest Fraction for the Class A-S-1 Certificates and the applicable principal prepayment, (7) to the Class A-S-X2 Certificates, the product of (a) such Yield Maintenance Charge or Prepayment Premium, (b) a fraction, the numerator of which is equal to the amount of principal distributed to the Class A-S-2 Certificates for that Distribution Date, and the denominator of which is the total amount of principal distributed to the Class A-1, A-2, A-SB, D and E Certificates and the Class A-4 Exchangeable Certificates, the Class A-5 Exchangeable Certificates, the Class A-S Exchangeable Certificates, the Class B Exchangeable Certificates and the Class C Exchangeable Certificates for that Distribution Date and (c) the difference between (i) the Base Interest Fraction for the Class A-S Certificates and the applicable principal prepayment and (ii) the Base Interest Fraction for the Class A-S-2 Certificates and the applicable principal prepayment, (8) to the Class B-X1 Certificates, the product of (a) such Yield Maintenance Charge or Prepayment Premium, (b) a fraction, the numerator of which is equal to the amount of principal distributed to the Class B-1 Certificates for that Distribution Date, and the denominator of which is the total amount of principal distributed to the Class A-1, A-2, A-SB, D and E Certificates and the Class A-4 Exchangeable Certificates, the Class A-5 Exchangeable Certificates, the Class A-S Exchangeable Certificates, the Class B Exchangeable Certificates and the Class C Exchangeable Certificates for that Distribution Date and (c) the difference between (i) the Base Interest Fraction for the Class B Certificates and the applicable principal prepayment and (ii) the Base Interest Fraction for the Class B-1 Certificates and the applicable principal prepayment, (9) to the Class B-X2 Certificates, the product of (a) such Yield Maintenance Charge or Prepayment Premium, (b) a fraction, the numerator of which is equal to the amount of principal distributed to the Class B-2 Certificates for that Distribution Date, and the denominator of which is the total amount of principal distributed to the Class A-1, A-2, A-SB, D and E Certificates and the Class A-4 Exchangeable Certificates, the Class A-5 Exchangeable Certificates, the Class A-S Exchangeable Certificates, the Class B Exchangeable Certificates and the Class C Exchangeable Certificates for that Distribution Date and (c) the difference between (i) the Base Interest Fraction for the Class B Certificates and the applicable principal prepayment and (ii) the Base Interest Fraction for the Class B-2 Certificates and the applicable principal prepayment, (10) to the Class C-X1 Certificates, the product of (a) such Yield Maintenance Charge or Prepayment Premium, (b) a fraction, the numerator of which is equal to the amount of principal distributed to the Class C-1 Certificates for that Distribution Date, and the denominator of which is the total amount of principal distributed to the Class A-1, A-2, A-SB, D and E Certificates and the Class A-4 Exchangeable Certificates, the Class A-5 Exchangeable Certificates, the Class A-S Exchangeable Certificates, the Class B Exchangeable Certificates and the Class C Exchangeable Certificates for that Distribution Date and (c) the difference between (i) the Base Interest Fraction for the Class C Certificates and the applicable principal prepayment and (ii) the Base Interest Fraction for the Class C-1 Certificates and the applicable principal prepayment, (11) to the Class C-X2 Certificates, the product of (a) such Yield Maintenance Charge or Prepayment Premium, (b) a fraction, the numerator of which is equal to the amount of principal distributed to the Class C-2 Certificates for that Distribution Date, and the denominator of which is the total amount of principal distributed |
| THE INFORMATION IN THIS STRUCTURAL AND COLLATERAL TERM SHEET IS NOT COMPLETE AND MAY BE AMENDED PRIOR TO THE TIME OF SALE. THIS TERM SHEET IS NOT AN OFFER TO SELL THESE SECURITIES AND IT IS NOT A SOLICITATION OF AN OFFER TO BUY THESE SECURITIES IN ANY JURISDICTION WHERE THE OFFER OR SALE IS NOT PERMITTED. | ||
| 24 | ||
| MSWF Commercial Mortgage Trust 2023-2 | Certain Terms and Conditions |
to the Class A-1, A-2, A-SB, D and E Certificates and the Class A-4 Exchangeable Certificates, the Class A-5 Exchangeable Certificates, the Class A-S Exchangeable Certificates, the Class B Exchangeable Certificates and the Class C Exchangeable Certificates for that Distribution Date and (c) the difference between (i) the Base Interest Fraction for the Class C Certificates and the applicable principal prepayment and (ii) the Base Interest Fraction for the Class C-2 Certificates and the applicable principal prepayment, (12) to the Class X-A Certificates, the excess, if any, of (a) the product of (i) such Yield Maintenance Charge or Prepayment Premium and (ii) a fraction, the numerator of which is equal to the total amount of principal distributed to the Class A-1, A-2 and A-SB Certificates and the Class A-4 Exchangeable Certificates and the Class A-5 Exchangeable Certificates for that Distribution Date, and the denominator of which is the total amount of principal distributed to the Class A-1, A-2, A-SB, D and E Certificates and the Class A-4 Exchangeable Certificates, the Class A-5 Exchangeable Certificates, the Class A-S Exchangeable Certificates, the Class B Exchangeable Certificates and the Class C Exchangeable Certificates for that Distribution Date, over (b) the total amount of such Yield Maintenance Charge or Prepayment Premium distributed to the Class A-1, Class A-2 and Class A-SB Certificates and the Class A-4 Exchangeable Certificates and the Class A-5 Exchangeable Certificates as described above, (13) to the holders of the Class X-B Certificates, the excess, if any, of (a) the product of (i) such Yield Maintenance Charge or Prepayment Premium and (ii) a fraction, the numerator of which is equal to the total amount of principal distributed to the Class A-S Exchangeable Certificates, the Class B Exchangeable Certificates and the Class C Exchangeable Certificates for that Distribution Date, and the denominator of which is the total amount of principal distributed to the Class A-1, A-2, A-SB, D and E Certificates and the Class A-4 Exchangeable Certificates, the Class A-5 Exchangeable Certificates, the Class A-S Exchangeable Certificates, the Class B Exchangeable Certificates and the Class C Exchangeable Certificates for that Distribution Date, over (b) the total amount of such Yield Maintenance Charge or Prepayment Premium distributed to the Class A-S Exchangeable Certificates, the Class B Exchangeable Certificates and the Class C Exchangeable Certificates as described above, and (14) to the Class X-D Certificates, any remaining portion of such Yield Maintenance Charge or Prepayment Premium not distributed as described above. Notwithstanding any of the foregoing to the contrary, if at any time the Certificate Balances of the Principal Balance Certificates (other than the Control Eligible Certificates) have been reduced to zero as a result of the allocation of principal payments on the mortgage loans, the certificate administrator will be required to pay to the holders of each remaining Class of Principal Balance Certificates then entitled to distributions of principal on such Distribution Date the product of (a) any Yield Maintenance Charge or Prepayment Premium distributable on the subject Distribution Date (net of any liquidation fees payable therefrom) and (b) a fraction, the numerator of which is equal to the amount of principal distributed to such Class for that Distribution Date, and the denominator of which is the total amount of principal distributed to all Principal Balance Certificates for that Distribution Date. No Prepayment Premiums or Yield Maintenance Charges will be distributed to the holders of the Class X-F, F, V or R Certificates. For a description of when Prepayment Premiums and Yield Maintenance Charges are generally required on the mortgage loans, see Annex A-1 to the Preliminary Prospectus. See also “Risk Factors—Risks Relating to the Mortgage Loans—Risks Relating to Enforceability of Yield Maintenance Charges, Prepayment Premiums or Defeasance Provisions” and “Risk Factors—Other Risks Relating to the Certificates—Your Yield May Be Affected by Defaults, Prepayments and Other Factors” in the Preliminary Prospectus. Prepayment Premiums and Yield Maintenance Charges will be distributed on each Distribution Date only to the extent they are actually received on the mortgage loans as of the related Determination Date. | |
| Realized Losses: | The Certificate Balances of the Class A-1, A-2, A-SB, D, E, F, G-RR and H-RR Certificates and the Class A-4, A-5, A-S, B and C trust components will be reduced without distribution on any Distribution Date as a write-off to the extent of any losses realized on the mortgage loans allocated to such Class on such Distribution Date. Such losses will be applied in the following order, in each case until the related Certificate Balance is reduced to zero: first, to the Class H-RR Certificates; second, to the Class G-RR Certificates; third, to the Class F Certificates; fourth, to the Class E Certificates; fifth, to the Class D Certificates; sixth, to the Class C trust component; seventh, to the Class B trust component; eighth, to the Class A-S trust component; and, finally, |
| THE INFORMATION IN THIS STRUCTURAL AND COLLATERAL TERM SHEET IS NOT COMPLETE AND MAY BE AMENDED PRIOR TO THE TIME OF SALE. THIS TERM SHEET IS NOT AN OFFER TO SELL THESE SECURITIES AND IT IS NOT A SOLICITATION OF AN OFFER TO BUY THESE SECURITIES IN ANY JURISDICTION WHERE THE OFFER OR SALE IS NOT PERMITTED. | ||
| 25 | ||
| MSWF Commercial Mortgage Trust 2023-2 | Certain Terms and Conditions |
pro rata, to the Class A-1, A-2 and A-SB Certificates and the Class A-4 and A-5 trust components based on their outstanding Certificate Balances. Any portion of such amount applied to the Class A-4, A-5, A-S, B or C trust component will reduce the Certificate Balance or Notional Amount of each Class of Certificates in the related group of Exchangeable Certificates by an amount equal to the product of (x) its Certificate Balance or Notional Amount, divided by the Certificate Balance of such trust component prior to the applicable reduction, and (y) the amount applied to such trust component. The Notional Amount of the Class X-A Certificates will be reduced by the amount of all losses that are allocated to the Class A-1, A-2 and A-SB Certificates and the Class A-4 and A-5 trust components as write-offs in reduction of their Certificate Balances. The Notional Amount of the Class X-B Certificates will be reduced by the amount of all losses that are allocated to the Class A-S, B and C trust components as write-offs in reduction of their Certificate Balances. | |
| P&I Advances: | The Master Servicer or, if the Master Servicer fails to do so, the Trustee, will be obligated to advance delinquent debt service payments (other than balloon payments and default interest) and assumed debt service payments on mortgage loans with delinquent balloon payments (excluding any related companion loan), except to the extent any such advance is deemed non-recoverable from collections on the related mortgage loan. In addition, if an Appraisal Reduction Amount exists for a given mortgage loan, the interest portion of any P&I advance for such mortgage loan will be reduced, which will have the effect of reducing the amount of interest available for distribution to the Certificates (other than the Class V and R Certificates) in reverse alphabetical order of their Class designations (except that interest payments on the Class A-1, A-2, A-SB, A-4, A-4-X1, A-4-X2, A-5, A-5-X1, A-5-X2, X-A, X-B, X-D and X-F Certificates would be affected on a pari passu basis). |
| Servicing Advances: | The Master Servicer or, if the Master Servicer fails to do so, the Trustee, will be obligated to make servicing advances, including the payment of delinquent property taxes, insurance premiums and ground rent, except to the extent that those advances are deemed non-recoverable from collections on the related mortgage loan. The Master Servicer or the Trustee, as applicable, will have the primary obligation to make any required servicing advances with respect to any serviced whole loan. With respect to any non-serviced whole loan, the master servicer or trustee, as applicable, under the related lead securitization servicing agreement will have the primary obligation to make any required servicing advances with respect to such non-serviced whole loan. |
Appraisal Reduction Amounts and Collateral Deficiency Amounts: | An “Appraisal Reduction Amount” generally will be created in the amount, if any, by which the principal balance of a required appraisal loan (which is a mortgage loan (other than a non-serviced mortgage loan) with respect to which certain defaults, modifications or insolvency events have occurred as further described in the Preliminary Prospectus) plus other amounts overdue or advanced in connection with such mortgage loan exceeds 90% of the appraised value of the related mortgaged property (together with any other mortgage loan cross-collateralized with such mortgage loan) plus certain escrows and reserves (including letters of credit) held with respect to the mortgage loan. With respect to any serviced whole loan, any Appraisal Reduction Amount will be allocated, pro rata, to the related mortgage loan and the related pari passu companion loan(s). With respect to any non-serviced mortgage loan, appraisal reduction amounts are expected to be calculated in a similar manner under the related non-serviced pooling and servicing agreement.
A mortgage loan will cease to be a required appraisal loan when the same has ceased to be a specially serviced loan (if applicable), has been brought current for at least three consecutive months and no other circumstances exist that would cause such mortgage loan to be a required appraisal loan. A “Collateral Deficiency Amount” will exist with respect to any mortgage loan that is modified into an AB loan structure and remains a corrected mortgage loan and will generally equal the excess of (i) the stated principal balance of such AB modified loan (taking into account the related junior note(s) and any pari passu notes included therein), over (ii) the sum of (in the case of a whole loan, solely to the extent allocable to the subject mortgage loan) (x) the most recent appraised value of the related mortgaged property plus (y) solely to the extent not reflected or taken into account in such appraised value and to the extent on deposit with, or otherwise under the control of, the lender as of the date of such determination, any capital or additional collateral contributed by the related borrower at the time the mortgage loan (and as part of the modification thereto) became an AB modified loan plus (z) any other escrows or reserves (in addition to any amounts set forth in the immediately preceding clause (y) and solely to the extent not reflected or taken into account in the calculation of any related Appraisal Reduction Amount) held by the lender with respect to the mortgage loan as of the date of such determination. A “Cumulative Appraisal Reduction Amount” with respect to any mortgage loan will be the sum of any Appraisal Reduction Amount and any Collateral Deficiency Amount.
|
| THE INFORMATION IN THIS STRUCTURAL AND COLLATERAL TERM SHEET IS NOT COMPLETE AND MAY BE AMENDED PRIOR TO THE TIME OF SALE. THIS TERM SHEET IS NOT AN OFFER TO SELL THESE SECURITIES AND IT IS NOT A SOLICITATION OF AN OFFER TO BUY THESE SECURITIES IN ANY JURISDICTION WHERE THE OFFER OR SALE IS NOT PERMITTED. | ||
| 26 | ||
| MSWF Commercial Mortgage Trust 2023-2 | Certain Terms and Conditions |
Appraisal Reduction Amounts will affect the amount of debt service advances in respect of the related mortgage loan. Additionally, Cumulative Appraisal Reduction Amounts will be taken into account in the determination of the identity of the Class whose majority constitutes the “majority controlling class certificateholder” and is entitled to appoint the directing certificateholder. Neither (i) a Payment Accommodation with respect to any mortgage loan or serviced whole loan nor (ii) any default or delinquency that would have existed but for such Payment Accommodation will constitute an appraisal reduction event, for so long as the related borrower is complying with the terms of such Payment Accommodation. A “Payment Accommodation” for any mortgage loan or serviced whole loan means the entering into of any temporary forbearance agreement as a result of the COVID-19 emergency (and qualification as a COVID-19 emergency forbearance will be determined by the special servicer in its sole and absolute discretion in accordance with the servicing standard) relating to payment obligations or operating covenants under the related mortgage loan documents or the use of funds on deposit in any reserve account or escrow account for any purpose other than the explicit purpose described in the related mortgage loan documents, that in each case (i) defers no greater than 3 monthly debt service payments (but no greater than 9 monthly debt service payments in the aggregate with any other Payment Accommodations) and (ii) requires full repayment of deferred payments, reserves and escrows by the date that is 12 months following the date of the first Payment Accommodation for such mortgage loan or serviced whole loan. | |
Clean-Up Call and Exchange Termination: | On each Distribution Date occurring after the aggregate unpaid principal balance of the pool of mortgage loans is less than 1.0% of the principal balance of the mortgage loans as of the cut-off date, certain specified persons will have the option to purchase all of the remaining mortgage loans (and the trust’s interest in all property acquired through exercise of remedies in respect of any mortgage loan) at the price specified in the Preliminary Prospectus. Exercise of the option will terminate the trust and retire the then-outstanding Certificates. If the aggregate Certificate Balances of each of the Class A-1, A-2, A-SB, D and E Certificates and the Class A-4, A-5, A-S, B and C trust components have been reduced to zero, the trust may also be terminated in connection with an exchange of all the then-outstanding Certificates (other than the Class V and R Certificates) for the mortgage loans and REO properties then remaining in the issuing entity, subject to payment of a price specified in the Preliminary Prospectus, but all of the holders of those outstanding Classes of Certificates (other than the Class V and R Certificates) would have to voluntarily participate in the exchange. |
| Liquidation Loan Waterfall: | Following the liquidation of any mortgage loan or mortgaged property, the net liquidation proceeds generally will be applied (after reimbursement of advances and certain trust fund expenses), first, as a recovery of accrued interest, other than delinquent interest that was not advanced as a result of Appraisal Reduction Amounts, second, as a recovery of principal until all principal has been recovered, and then as a recovery of delinquent interest that was not advanced as a result of Appraisal Reduction Amounts. Please see “Description of the Certificates—Distributions—Application Priority of Mortgage Loan Collections or Whole Loan Collections” in the Preliminary Prospectus. |
| Control Eligible Certificates: | The Class G-RR and H-RR Certificates. |
| Directing Certificateholder/ Controlling Class: | A directing certificateholder may be appointed by the “majority controlling class certificateholder”, which will be the holder(s) of a majority of the Controlling Class. The “Controlling Class” will be, as of any time of determination, the most subordinate Class of Control Eligible Certificates then outstanding that has an aggregate Certificate Balance (as notionally reduced by any Cumulative Appraisal Reduction Amounts allocable to such Class(es)) at least equal to 25% of the initial Certificate Balance of that Class; provided, however, that if at any time the Certificate Balances of the Certificates other than the Control Eligible Certificates have been reduced to zero as a result of principal payments on the Mortgage Loans, then the Controlling Class will be the most subordinate Class of Control Eligible Certificates that has a Certificate Balance greater than zero without regard to any Cumulative Appraisal Reduction Amounts. The Controlling Class as of the closing date will be the Class H-RR Certificates. |
| Control and Consultation: | The rights of various parties to replace the Special Servicer and approve or consult with respect to major actions of the Special Servicer will vary according to defined periods. A “Control Termination Event” will occur when (i) the Class G-RR Certificates have a Certificate Balance (taking into account the application of any Cumulative Appraisal Reduction Amounts to notionally reduce the Certificate Balance of such Class) of less than 25% of the initial Certificate Balance of that Class or (ii) a holder of the Class G-RR Certificates is the majority Controlling Class Certificateholder and has irrevocably waived its right, in writing, to exercise any of the rights of the Controlling Class Certificateholder and such rights have not been reinstated to a successor controlling class certificateholder as described below; provided that a Control Termination Event will not be deemed continuing in the event that the Certificate Balances of the |
| THE INFORMATION IN THIS STRUCTURAL AND COLLATERAL TERM SHEET IS NOT COMPLETE AND MAY BE AMENDED PRIOR TO THE TIME OF SALE. THIS TERM SHEET IS NOT AN OFFER TO SELL THESE SECURITIES AND IT IS NOT A SOLICITATION OF AN OFFER TO BUY THESE SECURITIES IN ANY JURISDICTION WHERE THE OFFER OR SALE IS NOT PERMITTED. | ||
| 27 | ||
| MSWF Commercial Mortgage Trust 2023-2 | Certain Terms and Conditions |
Certificates other than the Control Eligible Certificates have been reduced to zero as a result of principal payments on the mortgage loans. A “Consultation Termination Event” will occur when (i) there is no Class of Control Eligible Certificates that has a then-outstanding Certificate Balance at least equal to 25% of the initial Certificate Balance of that Class, in each case, without regard to the application of any Cumulative Appraisal Reduction Amounts; or (ii) a holder of the Class G-RR certificates is the majority Controlling Class Certificateholder and has irrevocably waived its right, in writing, to exercise any of the rights of the Controlling Class Certificateholder and such rights have not been reinstated to a successor controlling class certificateholder pursuant to the terms of the MSWF 2023-2 pooling and servicing agreement; provided that no Consultation Termination Event resulting solely from the operation of clause (ii) will be deemed to have existed or be in continuance with respect to a successor holder of the Class G-RR certificates that has not irrevocably waived its right to exercise any of the rights of the Controlling Class Certificateholder; provided, further, that a Consultation Termination Event will not be deemed continuing in the event that the Certificate Balances of the Certificates other than the Control Eligible Certificates have been reduced to zero as a result of principal payments on the mortgage loans. If no Control Termination Event has occurred and is continuing, except with respect to the Excluded Loans (as defined below) (i) the directing certificateholder will be entitled to grant or withhold approval of asset status reports prepared, and material servicing actions proposed, by the Special Servicer, and (ii) the directing certificateholder will be entitled to terminate and replace the Special Servicer with or without cause, and appoint itself or another person as the successor special servicer. It will be a condition to such appointment that Fitch, KBRA and Moody’s (and any rating agency rating any securities backed by any pari passu companion loan(s) serviced under this transaction) confirm that the appointment would not result in a qualification, downgrade or withdrawal of any of their then-current ratings of Certificates (and any certificates backed by any pari passu companion loan(s) serviced under this transaction). If a Control Termination Event has occurred and is continuing but no Consultation Termination Event has occurred and is continuing, the Special Servicer will be required to consult with the directing certificateholder (other than with respect to Excluded Loans) in connection with asset status reports and material special servicing actions. If a Consultation Termination Event has occurred and is continuing, no directing certificateholder will be recognized or have any right to terminate the Special Servicer or approve, direct or consult with respect to servicing matters. With respect to each serviced whole loan, the rights of the directing certificateholder described above will be subject to the consultation rights of the holders of the related pari passu companion loans. Those consultation rights will generally extend to asset status reports and material special servicing actions involving the related whole loan, will be as set forth in the related intercreditor agreement, and will be in addition to the rights of the directing certificateholder in this transaction described above.
With respect to each non-serviced whole loan, the applicable servicing agreement for the related controlling pari passu companion loan(s) generally grants (or will grant) the directing certificateholder under the related securitization control rights that may include the right to approve or disapprove various material servicing actions involving the related whole loan. The directing certificateholder for this securitization (so long as no Consultation Termination Event has occurred and is occurring) generally will nonetheless have the right to be consulted on a non-binding basis with respect to such actions. For purposes of the servicing of any such whole loan contemplated by this paragraph, the occurrence and continuance of a Control Termination Event or Consultation Termination Event under this securitization will not limit the control or other rights of the directing certificateholder (or equivalent) under the securitization of the related controlling pari passu companion loan(s).
The control rights and consent and consultation rights described in the preceding paragraphs are subject to various limitations, conditions and exceptions as described in the Preliminary Prospectus. Notwithstanding any contrary description set forth above, in the event that, with respect to any mortgage loan, the majority controlling class certificateholder or the directing certificateholder is a Borrower Party, the majority controlling class certificateholder and the directing certificateholder will have no right to receive asset status reports or such other information as may be specified in the MSWF 2023-2 pooling and servicing agreement, to grant or withhold approval of, or consult with respect to, asset status reports prepared, and material servicing actions proposed, by the Special Servicer, with respect to such mortgage loan, and such mortgage loan will be referred to as an “Excluded Loan” as to such party. |
| THE INFORMATION IN THIS STRUCTURAL AND COLLATERAL TERM SHEET IS NOT COMPLETE AND MAY BE AMENDED PRIOR TO THE TIME OF SALE. THIS TERM SHEET IS NOT AN OFFER TO SELL THESE SECURITIES AND IT IS NOT A SOLICITATION OF AN OFFER TO BUY THESE SECURITIES IN ANY JURISDICTION WHERE THE OFFER OR SALE IS NOT PERMITTED. | ||
| 28 | ||
| MSWF Commercial Mortgage Trust 2023-2 | Certain Terms and Conditions |
In addition, notwithstanding any contrary description set forth above, in the event that, with respect to any mortgage loan, a controlling class certificateholder is a Borrower Party, such controlling class certificateholder will have no right to receive asset status reports or such other information as may be specified in the MSWF 2023-2 pooling and servicing agreement with respect to such mortgage loan. “Borrower Party” means a borrower, a mortgagor or a manager of a mortgaged property, an Accelerated Mezzanine Loan Lender, or any Borrower Party Affiliate. “Accelerated Mezzanine Loan Lender” means a mezzanine lender under a mezzanine loan that has been accelerated or as to which foreclosure or enforcement proceedings have been commenced against the equity collateral pledged to secure such mezzanine loan. “Borrower Party Affiliate” means, with respect to a borrower, a mortgagor, a manager of a mortgaged property or an Accelerated Mezzanine Loan Lender, (x) any other person controlling or controlled by or under common control with such borrower, mortgagor, manager or Accelerated Mezzanine Loan Lender, as applicable, or (y) any other person owning, directly or indirectly, 25% or more of the beneficial interests in such borrower, mortgagor, manager or Accelerated Mezzanine Loan Lender. | |
| Risk Retention Consultation Party: | A risk retention consultation party may be appointed by the holder or holders of more than 50% of the VRR Interest, by Certificate Balance. The holder of the majority of the VRR Interest will have a continuing right to appoint, remove or replace the risk retention consultation party in its sole discretion. This right may be exercised at any time and from time to time. There is expected to be no initial risk retention consultation party as of the closing date. Notwithstanding any contrary description set forth above, in the event that, with respect to any mortgage loan, the holder of the majority of the VRR Interest or the risk retention consultation party is a Borrower Party, such mortgage loan will be referred to as an “Excluded Loan” as to such party. Except with respect to an Excluded Loan as to such party, the risk retention consultation party will be entitled to consult with the Special Servicer, upon request of the risk retention consultation party, with respect to certain material servicing actions proposed by the Special Servicer. |
| Replacement of Special Servicer: | If a Control Termination Event has occurred and is continuing, the Special Servicer may be removed and replaced without cause upon the affirmative direction of certificate owners holding not less than 66-2/3% of a certificateholder quorum, following a proposal from certificate owners holding not less than 25% of the appraisal-reduced voting rights of all Principal Balance Certificates. The certificateholders who initiate a vote on a termination and replacement of the Special Servicer without cause must cause Fitch, KBRA and Moody’s to confirm the then-current ratings of the Certificates (or decline to review the matter) and cause the payment of the fees and expenses incurred in the replacement. If no Control Termination Event has occurred and is continuing, the Special Servicer may be replaced by the directing certificateholder, subject to Fitch, KBRA and Moody’s (and any Rating Agency rating any securities backed by any pari passu companion loan(s) serviced under this transaction) confirming the then-current ratings of the Certificates (and any certificates backed by any pari passu companion loans serviced under this transaction) or declining to review the matter. In addition, if at any time the Operating Advisor determines, in its sole discretion exercised in good faith, that (i) the Special Servicer is not performing its duties as required under the pooling and servicing agreement in accordance with the Servicing Standard and (ii) the replacement of the Special Servicer would be in the best interest of the certificateholders as a collective whole, then the Operating Advisor will have the right to recommend the replacement of the Special Servicer and will submit its formal recommendation to the Trustee and the Certificate Administrator (along with its rationale, its proposed replacement special servicer and other relevant information justifying its recommendation). The Operating Advisor’s recommendation to replace the Special Servicer must be confirmed by an affirmative vote of holders of Principal Balance Certificates evidencing at least a majority of a quorum of certificateholders (which, for this purpose, is the holders of Principal Balance Certificates that (i) evidence at least 20% of the Voting Rights (taking into account the application of any cumulative appraisal reduction amounts to notionally reduce the respective Certificate Balances) of all Principal Balance Certificates on an aggregate basis, and (ii) consist of at least three certificateholders or certificate owners that are not risk retention affiliated with each other). In the event the holders of Principal Balance Certificates evidencing at least a majority of a quorum of certificateholders elect to remove and replace the Special Servicer (which requisite affirmative votes must be received within 180 days of the posting of the notice of the Operating Advisor’s recommendation to replace the Special Servicer to the Certificate Administrator’s website), the Certificate Administrator will be required to receive a Rating Agency Confirmation from each of the Rating Agencies at that time. |
| Excluded Special Servicer: | In the event that, with respect to any mortgage loan, the Special Servicer is a Borrower Party, the Special Servicer will be required to resign as special servicer of such mortgage loan (referred |
| THE INFORMATION IN THIS STRUCTURAL AND COLLATERAL TERM SHEET IS NOT COMPLETE AND MAY BE AMENDED PRIOR TO THE TIME OF SALE. THIS TERM SHEET IS NOT AN OFFER TO SELL THESE SECURITIES AND IT IS NOT A SOLICITATION OF AN OFFER TO BUY THESE SECURITIES IN ANY JURISDICTION WHERE THE OFFER OR SALE IS NOT PERMITTED. | ||
| 29 | ||
| MSWF Commercial Mortgage Trust 2023-2 | Certain Terms and Conditions |
| to as an “excluded special servicer loan”). If no Control Termination Event has occurred and is continuing, the directing certificateholder will be entitled to appoint (and may replace with or without cause) a separate special servicer that is not a Borrower Party (referred to as an “excluded special servicer”) with respect to such excluded special servicer loan unless such excluded special servicer loan is also an excluded loan. Otherwise, upon resignation of the Special Servicer with respect to an excluded special servicer loan, the resigning Special Servicer will be required to use commercially reasonable efforts to appoint the excluded special servicer. | |
| Appraisal Remedy: | If the Class of Certificates comprising the Controlling Class loses its status as Controlling Class because of the application of an Appraisal Reduction Amount or Collateral Deficiency Amount, the holders of a majority of the voting rights of such Class may require the Special Servicer to order a second appraisal for any mortgage loan in respect of which an Appraisal Reduction Amount or Collateral Deficiency Amount has been applied. The Special Servicer must thereafter determine whether, based on its assessment of such second appraisal, any recalculation of the Appraisal Reduction Amount or Collateral Deficiency Amount is warranted and, if so warranted, will recalculate such Appraisal Reduction Amount or Collateral Deficiency Amount. Such Class will not be able to exercise any direction, control, consent and/or similar rights of the Controlling Class unless and until reinstated as the Controlling Class through such determination; and pending such determination, the rights of the Controlling Class will be exercised by the Control Eligible Certificates, if any, that would be the Controlling Class taking into account the subject appraisal reduction amount. |
| Sale of Defaulted Assets: | There will be no “fair value” purchase option. Instead, the MSWF 2023-2 pooling and servicing agreement will authorize the Special Servicer to sell defaulted mortgage loans serviced by such Special Servicer to the highest bidder in a manner generally similar to sales of REO properties. The sale of a defaulted loan (other than a non-serviced whole loan) for less than par plus accrued interest and certain other fees and expenses owed on the loan will be subject to consent or consultation rights of the directing certificateholder, Operating Advisor and/or Risk Retention Consultation Party, as described in the Preliminary Prospectus. Generally speaking, the holder of a pari passu companion loan will have consent and/or consultation rights, as described in the Preliminary Prospectus. With respect to any serviced whole loan, if such whole loan becomes a defaulted loan under the MSWF 2023-2 pooling and servicing agreement, the Special Servicer will generally be required to sell both the mortgage loan and the related pari passu companion loan(s) as a single whole loan.
With respect to each non-serviced whole loan, the applicable servicing agreement governing the servicing of such whole loan generally provides (or is expected to provide) that, if the related pari passu companion loan(s) serviced under such agreement become a defaulted loan under such servicing agreement, then the related special servicer may offer to sell to any person (or may offer to purchase) for cash such whole loan during such time as such applicable pari passu companion loan(s) constitutes a defaulted loan under such servicing agreement. Generally speaking, in connection with any such sale, the related special servicer is required to sell both the mortgage loan and the related pari passu companion loan(s) (and, in some cases, any related subordinate companion loan) as a whole loan. The directing certificateholder for this securitization generally will have consultation rights as the holder of an interest in the related mortgage loan, as described in the Preliminary Prospectus. The procedures for the sale of any whole loan that becomes a defaulted whole loan, and any associated consultation rights, are subject to various limitations, conditions and exceptions as described in the Preliminary Prospectus. |
| “As-Is” Appraisals: | Appraisals must be conducted on an “as-is” basis, and must be no more than 12 months old, for purposes of determining Appraisal Reduction Amounts and market value in connection with REO sales. Required appraisals may consist of updates of prior appraisals. Internal valuations by the Special Servicer are permitted if the principal balance of a mortgage loan is less than $2,000,000. |
| THE INFORMATION IN THIS STRUCTURAL AND COLLATERAL TERM SHEET IS NOT COMPLETE AND MAY BE AMENDED PRIOR TO THE TIME OF SALE. THIS TERM SHEET IS NOT AN OFFER TO SELL THESE SECURITIES AND IT IS NOT A SOLICITATION OF AN OFFER TO BUY THESE SECURITIES IN ANY JURISDICTION WHERE THE OFFER OR SALE IS NOT PERMITTED. | ||
| 30 | ||
| MSWF Commercial Mortgage Trust 2023-2 | Certain Terms and Conditions |
| Operating Advisor: | The Operating Advisor will have certain review and consultation rights relating to the performance of the Special Servicer and with respect to its actions taken in connection with the resolution and/or liquidation of Specially Serviced Loans. With respect to each mortgage loan (other than a Non-Serviced Mortgage Loan) or serviced whole loan, the Operating Advisor will be responsible for: ● reviewing the actions of the Special Servicer with respect to any Specially Serviced Loan; ● reviewing (i) all reports by the Special Servicer made available to Privileged Persons on the Certificate Administrator’s website that are relevant to the Operating Advisor’s obligations under the pooling and servicing agreement and (ii) each Asset Status Report (as defined in the Preliminary Prospectus) (after the occurrence and during the continuance of an Operating Advisor Consultation Event (as defined below)) and Final Asset Status Report (as defined in the Preliminary Prospectus); ● reviewing for accuracy and consistency with the MSWF 2023-2 pooling and servicing agreement the mathematical calculations by the special servicer and the corresponding application of the non-discretionary portion of the applicable formulas required to be utilized in connection with Appraisal Reduction Amounts, Collateral Deficiency Amounts and net present value calculations used in the Special Servicer’s determination of what course of action to take in connection with the workout or liquidation of a Specially Serviced Loan; and ● preparing an annual report (if any mortgage loan (other than any Non-Serviced Mortgage Loan) or serviced whole loan was a Specially Serviced Loan at any time during the prior calendar year or an Operating Advisor Consultation Event (as defined below) occurred during the prior calendar year) that sets forth whether the Operating Advisor believes, in its sole discretion exercised in good faith, that the Special Servicer is operating in compliance with the Servicing Standard with respect to its performance of its duties under the pooling and servicing agreement with respect to Specially Serviced Loans (and, after the occurrence and during the continuance of an Operating Advisor Consultation Event (as defined below), with respect to major decisions on non-Specially Serviced Loans) during the prior calendar year on an “asset-level basis”. The Operating Advisor will identify (1) which, if any, standards the Operating Advisor believes, in its sole discretion exercised in good faith, the Special Servicer has failed to comply with and (2) any material deviations from the Special Servicer’s obligations under the pooling and servicing agreement with respect to the resolution or liquidation of any Specially Serviced Loan or REO Property (other than with respect to any REO Property related to any Non-Serviced Mortgage Loan). In preparing any Operating Advisor Annual Report (as defined in the Preliminary Prospectus), the Operating Advisor will not be required to report on instances of non-compliance with, or deviations from, the Servicing Standard or the Special Servicer’s obligations under the pooling and servicing agreement that the Operating Advisor determines, in its sole discretion exercised in good faith, to be immaterial. With respect to each mortgage loan (other than any Non-Serviced Mortgage Loan) or serviced whole loan, after the Operating Advisor has received notice that an Operating Advisor Consultation Event (as defined below) has occurred and is continuing, in addition to the duties described above, the Operating Advisor will be required to perform the following additional duties: ● to consult (on a non-binding basis) with the Special Servicer in respect of asset status reports and ● to consult (on a non-binding basis) with the Special Servicer with respect to “major decisions” processed by the Special Servicer. An “Operating Advisor Consultation Event” will occur when the Certificate Balance of the Class G-RR and Class H-RR Certificates in the aggregate (taking into account the application of any Cumulative Appraisal Reduction Amounts to notionally reduce the Certificate Balances of such Classes) is 25% or less of the initial Certificate Balances of such Classes in the aggregate. |
| Asset Representations Reviewer: | The Asset Representations Reviewer will be required to review certain delinquent mortgage loans after a specified delinquency threshold has been exceeded (an “Asset Review Trigger”) and the required percentage of certificateholders vote to direct a review of such delinquent loans. An Asset Review Trigger will occur when either (1) mortgage loans with an aggregate outstanding principal balance of 25.0% or more of the aggregate outstanding principal balance of all of the mortgage loans (including any REO loans (or a portion of any REO loan in the case of a whole loan)) held by the issuing entity as of the end of the applicable collection period are delinquent loans or (2) at least 15 mortgage loans are delinquent loans as of the end of the applicable collection period and the outstanding principal balance of such delinquent loans in the aggregate |
| THE INFORMATION IN THIS STRUCTURAL AND COLLATERAL TERM SHEET IS NOT COMPLETE AND MAY BE AMENDED PRIOR TO THE TIME OF SALE. THIS TERM SHEET IS NOT AN OFFER TO SELL THESE SECURITIES AND IT IS NOT A SOLICITATION OF AN OFFER TO BUY THESE SECURITIES IN ANY JURISDICTION WHERE THE OFFER OR SALE IS NOT PERMITTED. | ||
| 31 | ||
| MSWF Commercial Mortgage Trust 2023-2 | Certain Terms and Conditions |
constitutes at least 20.0% of the aggregate outstanding principal balance of all of the mortgage loans (including any REO loans (or a portion of any REO loan in the case of a whole loan)) held by the issuing entity as of the end of the applicable collection period. See “Pooling and Servicing Agreement—The Asset Representations Reviewer—Asset Review” in the Preliminary Prospectus. The Asset Representations Reviewer may be terminated and replaced without cause. Upon (i) the written direction of certificateholders evidencing not less than 25% of the voting rights (without regard to the application of any Cumulative Appraisal Reduction Amounts) requesting a vote to terminate and replace the Asset Representations Reviewer with a proposed successor Asset Representations Reviewer that is an eligible asset representations reviewer, and (ii) payment by such holders to the certificate administrator of the reasonable fees and expenses to be incurred by the certificate administrator in connection with administering such vote, the certificate administrator will promptly provide notice to all certificateholders and the Asset Representations Reviewer of such request by posting such notice on its internet website, and by mailing such notice to all certificateholders and the Asset Representations Reviewer. Upon the written direction of certificateholders evidencing at least 75% of a certificateholder quorum (without regard to the application of any Cumulative Appraisal Reduction Amounts), the Trustee will terminate all of the rights and obligations of the Asset Representations Reviewer under the MSWF 2023-2 pooling and servicing agreement by written notice to the Asset Representations Reviewer, and the proposed successor Asset Representations Reviewer will be appointed. See “Pooling and Servicing Agreement—The Asset Representations Reviewer” in the Preliminary Prospectus. | |
| Dispute Resolution Provisions: | The mortgage loan sellers will be subject to the dispute resolution provisions set forth in the MSWF 2023-2 pooling and servicing agreement to the extent those provisions are triggered with respect to any mortgage loan sold to the depositor by a mortgage loan seller and such mortgage loan seller will be obligated under the related mortgage loan purchase agreement to comply with all applicable provisions and to take part in any mediation or arbitration proceedings that may result. Generally, in the event that a Repurchase Request (as defined in the Preliminary Prospectus) is not “Resolved” (as defined below) within 180 days after the related mortgage loan seller receives such Repurchase Request, then the enforcing servicer will be required to send a notice to the “Initial Requesting Certificateholder” (if any) and the Certificate Administrator indicating the enforcing servicer’s intended course of action with respect to the Repurchase Request. If (a) the enforcing servicer’s intended course of action with respect to the Repurchase Request does not involve pursuing further action to exercise rights against the related mortgage loan seller with respect to the Repurchase Request and the Initial Requesting Certificateholder, if any, or any other certificateholder or certificate owner wishes to exercise its right to refer the matter to mediation (including non-binding arbitration) or arbitration, or (b) the enforcing servicer’s intended course of action is to pursue further action to exercise rights against the related mortgage loan seller with respect to the Repurchase Request but the Initial Requesting Certificateholder, if any, or any other certificateholder or certificate owner does not agree with the dispute resolution method selected by the enforcing servicer, then the Initial Requesting Certificateholder, if any, or such other certificateholder or certificate owner may deliver a written notice to the Special Servicer indicating its intent to exercise its right to refer the matter to either mediation or arbitration. “Resolved” means, with respect to a Repurchase Request, (i) that the related Material Defect has been cured, (ii) the related mortgage loan has been repurchased in accordance with the related mortgage loan purchase agreement, (iii) a mortgage loan has been substituted for the related mortgage loan in accordance with the related mortgage loan purchase agreement, (iv) the applicable mortgage loan seller has made a Loss of Value Payment (as defined in the Preliminary Prospectus), (v) a contractually binding agreement is entered into between the enforcing servicer, on behalf of the issuing entity, and the related mortgage loan seller that settles the related mortgage loan seller’s obligations under the related mortgage loan purchase agreement or (vi) the related mortgage loan is no longer property of the issuing entity as a result of a sale or other disposition in accordance with the MSWF 2023-2 pooling and servicing agreement. See “Pooling and Servicing Agreement—Dispute Resolution Provisions” in the Preliminary Prospectus. |
| Investor Communications: | The certificate administrator is required to include on any Form 10–D any request received from a certificateholder to communicate with other certificateholders related to certificateholders exercising their rights under the terms of the MSWF 2023-2 pooling and servicing agreement. Any certificateholder wishing to communicate with other certificateholders regarding the exercise of its rights under the terms of the MSWF 2023-2 pooling and servicing agreement will be able to deliver a written request signed by an authorized representative of the requesting investor to the certificate administrator. |
| Certain Fee Offsets: | If a workout fee is earned by the Special Servicer following a loan default with respect to any mortgage loan that it services, then certain limitations will apply based on modification fees paid by the borrower. The modification fee generally must not exceed 1% of the principal balance of |
| THE INFORMATION IN THIS STRUCTURAL AND COLLATERAL TERM SHEET IS NOT COMPLETE AND MAY BE AMENDED PRIOR TO THE TIME OF SALE. THIS TERM SHEET IS NOT AN OFFER TO SELL THESE SECURITIES AND IT IS NOT A SOLICITATION OF AN OFFER TO BUY THESE SECURITIES IN ANY JURISDICTION WHERE THE OFFER OR SALE IS NOT PERMITTED. | ||
| 32 | ||
| MSWF Commercial Mortgage Trust 2023-2 | Certain Terms and Conditions |
| the loan as modified in any 12-month period. In addition, if the loan re-defaults, any subsequent workout fee on that loan must be reduced by a portion of the modification fees paid by the borrower in the previous 12-months. Likewise, liquidation fees collected in connection with a liquidation or partial liquidation of a mortgage loan must be reduced by a portion of the modification fees paid by the borrower in the previous 12 months. | |
| Deal Website: | The Certificate Administrator will be required to maintain a deal website, which will include, among other items: (a) summaries of asset status reports prepared by the Special Servicer, (b) inspection reports, (c) appraisals, (d) various “special notices” described in the Preliminary Prospectus, (e) the “Investor Q&A Forum”, (f) a voluntary “Investor Registry” and (g) the “Risk Retention Special Notices” tab. Investors may access the deal website following execution of a certification and confidentiality agreement. |
| Initial Majority Controlling Class Certificateholder: | It is expected that Argentic Securities Holdings 2 Cayman Limited, an affiliate of Argentic Real Estate Finance 2 LLC and Argentic Services Company LP or an affiliate will be the initial majority controlling class certificateholder. |
| Whole Loans: | Each of the mortgaged properties identified above under “IV. Characteristics of the Mortgage Pool—B. Summary of the Whole Loans” secures both a mortgage loan to be included in the trust fund and one or more other mortgage loans that will not be included in the trust fund, each of which will be pari passu or subordinate in right of payment with the mortgage loan included in the trust fund. We refer to each such group of mortgage loans as a “whole loan”. Such “—Summary of the Whole Loans” section includes further information regarding the various notes in each whole loan, the holders of such notes, the lead servicing agreement for each such whole loan, and the master servicer and special servicer under such lead servicing agreement. |
| THE INFORMATION IN THIS STRUCTURAL AND COLLATERAL TERM SHEET IS NOT COMPLETE AND MAY BE AMENDED PRIOR TO THE TIME OF SALE. THIS TERM SHEET IS NOT AN OFFER TO SELL THESE SECURITIES AND IT IS NOT A SOLICITATION OF AN OFFER TO BUY THESE SECURITIES IN ANY JURISDICTION WHERE THE OFFER OR SALE IS NOT PERMITTED. | ||
| 33 | ||
| Other – Data Center | Loan #1 | Cut-off Date Balance: | $90,000,000 | |
| 60 Hudson Street | 60 Hudson | Cut-off Date LTV: | 17.5% | |
| New York, NY 10013 | U/W NCF DSCR: | 3.92x | ||
| U/W NOI Debt Yield: | 24.2% |
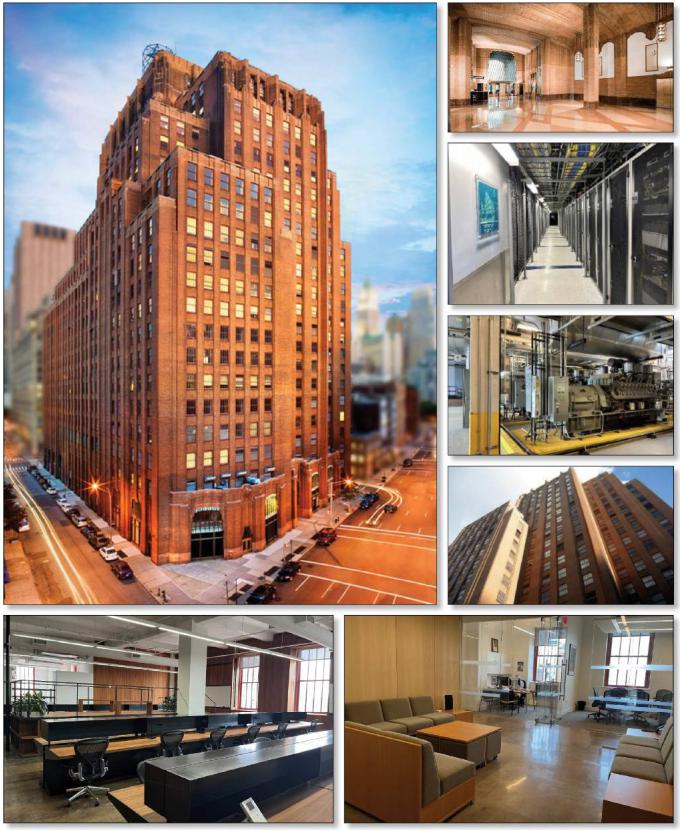
| THE INFORMATION IN THIS STRUCTURAL AND COLLATERAL TERM SHEET IS NOT COMPLETE AND MAY BE AMENDED PRIOR TO THE TIME OF SALE. THIS TERM SHEET IS NOT AN OFFER TO SELL THESE SECURITIES AND IT IS NOT A SOLICITATION OF AN OFFER TO BUY THESE SECURITIES IN ANY JURISDICTION WHERE THE OFFER OR SALE IS NOT PERMITTED. | ||
| 34 | ||
| Other – Data Center | Loan #1 | Cut-off Date Balance: | $90,000,000 | |
| 60 Hudson Street | 60 Hudson | Cut-off Date LTV: | 17.5% | |
| New York, NY 10013 | U/W NCF DSCR: | 3.92x | ||
| U/W NOI Debt Yield: | 24.2% |
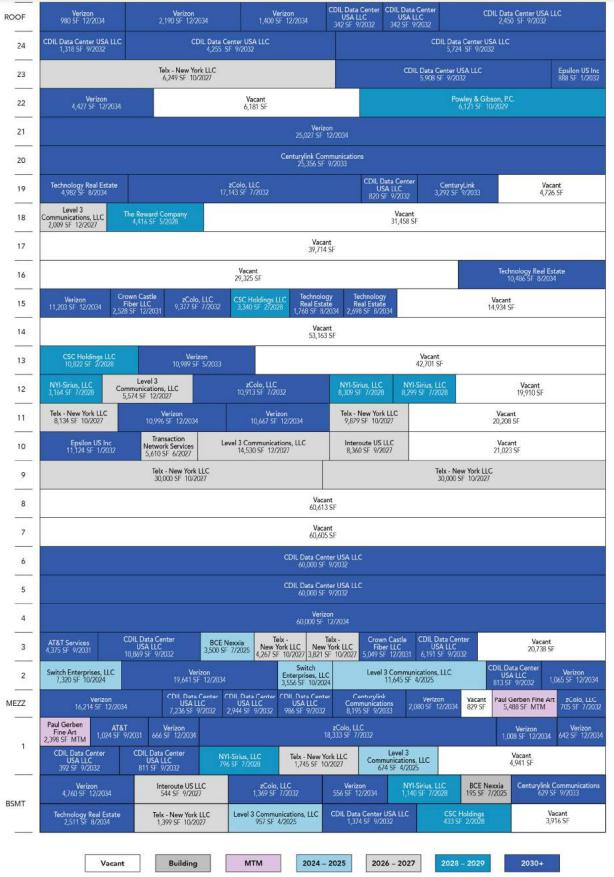
| THE INFORMATION IN THIS STRUCTURAL AND COLLATERAL TERM SHEET IS NOT COMPLETE AND MAY BE AMENDED PRIOR TO THE TIME OF SALE. THIS TERM SHEET IS NOT AN OFFER TO SELL THESE SECURITIES AND IT IS NOT A SOLICITATION OF AN OFFER TO BUY THESE SECURITIES IN ANY JURISDICTION WHERE THE OFFER OR SALE IS NOT PERMITTED. | ||
| 35 | ||
| Other – Data Center | Loan #1 | Cut-off Date Balance: | $90,000,000 | |
| 60 Hudson Street | 60 Hudson | Cut-off Date LTV: | 17.5% | |
| New York, NY 10013 | U/W NCF DSCR: | 3.92x | ||
| U/W NOI Debt Yield: | 24.2% |
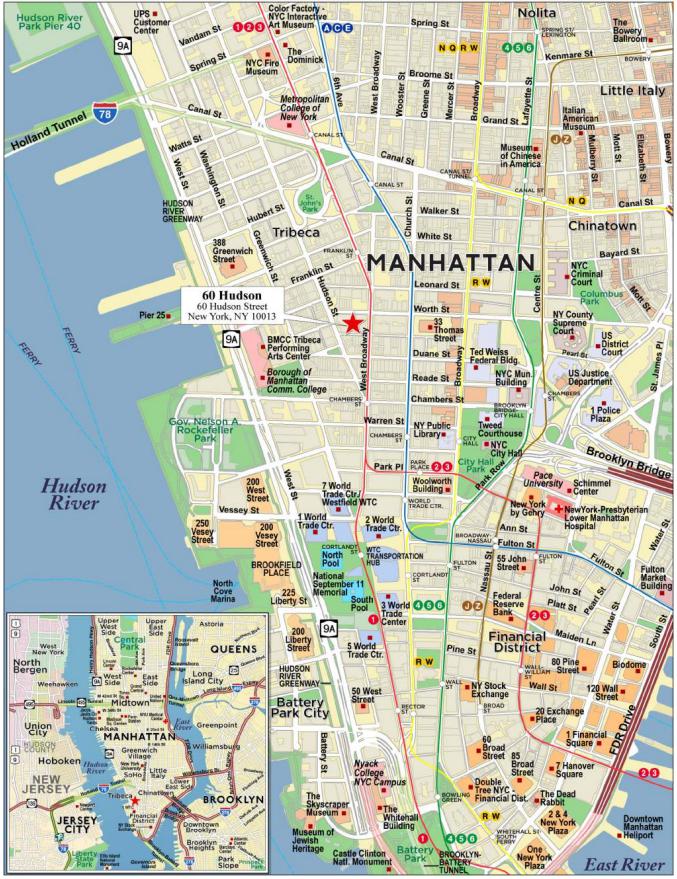
| THE INFORMATION IN THIS STRUCTURAL AND COLLATERAL TERM SHEET IS NOT COMPLETE AND MAY BE AMENDED PRIOR TO THE TIME OF SALE. THIS TERM SHEET IS NOT AN OFFER TO SELL THESE SECURITIES AND IT IS NOT A SOLICITATION OF AN OFFER TO BUY THESE SECURITIES IN ANY JURISDICTION WHERE THE OFFER OR SALE IS NOT PERMITTED. | ||
| 36 | ||
| No. 1 – 60 Hudson | |||||||
| Mortgage Loan Information | Mortgaged Property Information | ||||||
| Mortgage Loan Seller: | Morgan Stanley Mortgage Capital Holdings LLC | Single Asset/Portfolio: | Single Asset | ||||
Credit Assessment (Fitch/KBRA/Moody’s): | AAAsf/AAA(sf)/Aaa(sf) | Property Type – Subtype: | Other – Data Center | ||||
| Original Principal Balance(1): | $90,000,000 | Location: | New York, NY | ||||
| Cut-off Date Balance(1): | $90,000,000 | Size: | 1,149,619 SF | ||||
| % of Initial Pool Balance: | 9.8% | Cut-off Date Balance Per SF(1): | $243.56 | ||||
| Loan Purpose: | Refinance | Maturity Date Balance Per SF(1): | $243.56 | ||||
| Borrower Sponsor: | The Stahl Organization | Year Built/Renovated: | 1930 / 2013 | ||||
| Guarantor: | NAP(2) | Title Vesting: | Fee | ||||
| Mortgage Rate: | 5.8850% | Property Manager: | Colliers Tri-State Management LLC (borrower-related) | ||||
| Note Date: | September 6, 2023 | Current Occupancy (As of): | 62.2% (6/5/2023) | ||||
| Seasoning: | 2 months | YE 2022 Occupancy: | 63.2% | ||||
| Maturity Date: | October 1, 2033 | YE 2021 Occupancy: | 64.1% | ||||
| IO Period: | 120 months | YE 2020 Occupancy: | 72.6% | ||||
| Loan Term (Original): | 120 months | As-Is Appraised Value: | $1,596,000,000 | ||||
| Amortization Term (Original): | NAP | As-Is Appraised Value Per SF: | $1,388.29 | ||||
| Loan Amortization Type: | Interest Only | As-Is Appraisal Valuation Date: | May 8, 2023 | ||||
| Call Protection: | L(26),D(89),O(5) | ||||||
| Lockbox Type: | Hard/In Place Cash Management | ||||||
| Additional Debt(1)(3): | Yes | Underwriting and Financial Information | |||||
| Additional Debt Type (Balance)(1)(3): | Pari Passu ($190,000,000) | TTM 6/30/2023 NOI: | $73,525,984 | ||||
| YE 2022 NOI: | $65,561,820 | ||||||
| YE 2021 NOI: | $77,460,400 | ||||||
| YE 2020 NOI: | $67,543,911 | ||||||
| U/W Revenues: | $120,518,204 | ||||||
| U/W Expenses: | $52,684,531 | ||||||
| Escrows and Reserves(4) | U/W NOI: | $67,833,673 | |||||
| Initial | Monthly | Cap | U/W NCF: | $65,493,494 | |||
| Taxes: | $7,089,987 | $1,772,497 | NAP | U/W DSCR based on NOI/NCF(1): | 4.06x / 3.92x | ||
| Insurance: | $0 | Springing | NAP | U/W Debt Yield based on NOI/NCF(1): | 24.2% / 23.4% | ||
| Replacement Reserve: | $0 | Springing | NAP | U/W Debt Yield at Maturity based on NOI/NCF(1): | 24.2% / 23.4% | ||
| TI/LC Reserve: | $0 | Springing | NAP | Cut-off Date LTV Ratio(1): | 17.5% | ||
| LTV Ratio at Maturity(1): | 17.5% | ||||||
| Sources and Uses | ||||||||
| Sources | Uses | |||||||
| Whole Loan Amount | $280,000,000 | 98.7% | Loan Payoff | $274,771,150 | 96.9% | |||
| Borrower Equity | 3,678,608 | 1.3 | Reserves | 7,089,987 | 2.5 | |||
| Closing Costs | 1,817,471 | 0.6 | ||||||
| Total Sources | $283,678,608 | 100.0% | Total Uses | $283,678,608 | 100.0% | |||
| (1) | The 60 Hudson Mortgage Loan (as defined below) is part of the 60 Hudson Whole Loan (as defined below), which is comprised of 10 pari passu promissory notes with an aggregate original principal balance of $280,000,000. The Cut-off Date Balance Per SF, Maturity Date Balance Per SF, U/W DSCR based on NOI/NCF, U/W Debt Yield based on NOI/NCF, U/W Debt Yield at Maturity based on NOI/NCF, Cut-off Date LTV Ratio and LTV Ratio at Maturity presented above are based on the aggregate Cut-off Date principal balance of the 60 Hudson Whole Loan. |
| (2) | There is no non-recourse carveout guarantor or separate environmental indemnitor with respect to the 60 Hudson Whole Loan. |
| (3) | See “The Mortgage Loan” below for further information about additional mortgage debt. |
| (4) | See “Escrows” below. |
| THE INFORMATION IN THIS STRUCTURAL AND COLLATERAL TERM SHEET IS NOT COMPLETE AND MAY BE AMENDED PRIOR TO THE TIME OF SALE. THIS TERM SHEET IS NOT AN OFFER TO SELL THESE SECURITIES AND IT IS NOT A SOLICITATION OF AN OFFER TO BUY THESE SECURITIES IN ANY JURISDICTION WHERE THE OFFER OR SALE IS NOT PERMITTED. | ||
| 37 | ||
| Other – Data Center | Loan #1 | Cut-off Date Balance: | $90,000,000 | |
| 60 Hudson Street | 60 Hudson | Cut-off Date LTV: | 17.5% | |
| New York, NY 10013 | U/W NCF DSCR: | 3.92x | ||
| U/W NOI Debt Yield: | 24.2% |
The Mortgage Loan. The largest mortgage loan (the “60 Hudson Mortgage Loan”) is part of a whole loan (the “60 Hudson Whole Loan”) evidenced by 10 pari passu promissory notes with an aggregate original principal balance of $280,000,000. The 60 Hudson Whole Loan is secured by a first priority fee mortgage encumbering a 1,149,619 SF data center property in New York, New York (the “60 Hudson Property”). The 60 Hudson Mortgage Loan is evidenced by the controlling Note A-1 and the non-controlling Note A-4 with an aggregate original principal balance of $90,000,000. The 60 Hudson Whole Loan was originated by Morgan Stanley Bank, N.A. (“MSBNA”). Barclays Capital Real Estate Inc. acquired Note A-5 in the original principal balance of $30,000,000 from MSBNA on September 21, 2023, and Note A-8 in the original principal balance of $10,000,000 from MSBNA or an affiliate on October 11, 2023, and both such notes were subsequently contributed to the BBCMS 2023-C22 securitization transaction. Bank of Montreal acquired Note A-9 and Note A-10, in the aggregate original principal balance of $20,000,000 from MSBNA or an affiliate on October 3, 2023. The rest of the non-controlling Notes with an aggregate original principal balance of $130,000,000 (together with Note A-5, Note A-8, Note A-9 and Note A-10, the “60 Hudson Serviced Pari Passu Companion Loans”) are currently held by MSBNA and are expected to be contributed to one or more future securitization transactions. The 60 Hudson Whole Loan will be serviced pursuant to the pooling and servicing agreement for the MSWF 2023-2 transaction. See “Description of the Mortgage Pool—The Whole Loans—The Serviced Pari Passu Whole Loans” and “Pooling and Servicing Agreement” in the prospectus.
Whole Loan Note Summary
| Notes | Original Balance | Cut-off Date Balance | Note Holder | Controlling Piece |
| A-1 | $60,000,000 | $60,000,000 | MSWF 2023-2 | Yes |
| A-2 | $50,000,000 | $50,000,000 | MSBNA | No |
| A-3 | $40,000,000 | $40,000,000 | MSBNA | No |
| A-4 | $30,000,000 | $30,000,000 | MSWF 2023-2 | No |
| A-5 | $30,000,000 | $30,000,000 | BBCMS 2023-C22 | No |
| A-6 | $20,000,000 | $20,000,000 | MSBNA | No |
| A-7 | $20,000,000 | $20,000,000 | MSBNA | No |
| A-8 | $10,000,000 | $10,000,000 | BBCMS 2023-C22 | No |
| A-9 | $10,000,000 | $10,000,000 | Bank of Montreal | No |
| A-10 | $10,000,000 | $10,000,000 | Bank of Montreal | No |
| Total (Whole Loan) | $280,000,000 | $280,000,000 |
The Borrower and the Borrower Sponsor. The borrower for the 60 Hudson Whole Loan is 60 Hudson Owner LLC, a single-purpose Delaware limited liability company with two independent directors in its organizational structure. The borrower sponsor is The Stahl Organization. The Stahl Organization is a privately held, New York based real estate company founded by Stanley Stahl in 1949. The Stahl Organization’s current real estate portfolio comprises over 5 million SF of office space, including 277 Park Avenue and 122 East 42nd Street, and 10 retail/commercial properties in Manhattan. The Stahl Organization is also a significant residential landlord with over 3,500 apartments in various residential assets located throughout New York City. There is no non-recourse carveout guarantor or separate environmental indemnitor with respect to the 60 Hudson Whole Loan.
In addition to its real estate portfolio, The Stahl Organization owns 100% of Apple Bank for Savings, which has 84 branches. The Stahl Organization also owns Cauldwell Wingate Company, a construction company based in New York City and founded in 1910.
The Stahl Organization’s executives have been associated with the company for many years as employees and third-party professional consultants. Richard F. Czaja, the Co-President and General Counsel, has been with The Stahl Organization for over 35 years and has represented the company in legal matters during the prior eight years. Gregg S. Wolpert, Co-President, has been with the company for over 33 years and managed several of the company’s real estate investments during the prior eight years. Marianne Dziuba, Executive Vice President, has been with the organization for over 40 years. Robert Getreu, a key principal, is an Executive Vice President of Colliers Tri-State Management, LLC (the “Property Manager”), and handled the redevelopment and expansion of the 60 Hudson Property in 2013. Robert Getreu has been with the Property Manager for over 31 years. Richard F. Czaja and Robert Getreu are the non-member managers of two entities which own an approximately 67.5% indirect equity interest in the borrower. Richard F. Czaja and Gregg S. Wolpert are trustees of a trust which is the general partner of a third entity which owns the remaining 32.5% indirect equity interest in the borrower.
The Property. The 60 Hudson Property is a 24-story, plus basement, 1,149,619 SF data center/carrier hotel building situated on an approximately 1.2-acre site located in New York, New York. The 60 Hudson Property spans an entire block between Hudson Street, West Broadway, Worth Street and Thomas Street. The 60 Hudson Property is one of the primary telecom and internet centers in New York City. Built in 1930 for the Western Union Telegraph Company, the 60 Hudson Property was initially known as the "Telegraph Capital of America”. After Western Union departed in 1973, the 60 Hudson Property was converted into a colocation center. Hundreds of telecommunication companies interconnect their respective internet networks, where telecommunications companies route internet traffic and exchange information in a “meet-me room” located at the 60 Hudson Property through fiber-optic lines. The 60 Hudson Property is widely considered a primary telecommunications hub of the Northeast region of the United States. The 60 Hudson Property provides an interconnection via under-sea cable to the United Kingdom, and to the cables from Manasquan, New Jersey, and Truckerton, New York, to the European Union.
| THE INFORMATION IN THIS STRUCTURAL AND COLLATERAL TERM SHEET IS NOT COMPLETE AND MAY BE AMENDED PRIOR TO THE TIME OF SALE. THIS TERM SHEET IS NOT AN OFFER TO SELL THESE SECURITIES AND IT IS NOT A SOLICITATION OF AN OFFER TO BUY THESE SECURITIES IN ANY JURISDICTION WHERE THE OFFER OR SALE IS NOT PERMITTED. | ||
| 38 | ||
| Other – Data Center | Loan #1 | Cut-off Date Balance: | $90,000,000 | |
| 60 Hudson Street | 60 Hudson | Cut-off Date LTV: | 17.5% | |
| New York, NY 10013 | U/W NCF DSCR: | 3.92x | ||
| U/W NOI Debt Yield: | 24.2% |
The borrower sponsor most recently renovated the 60 Hudson Property in 2013. As of June 5, 2023, the 60 Hudson Property was 62.2% leased and anchored by major telecommunications and data center tenants, including Verizon, Hudson Interxchange, Telx New York LLC (Digital Realty Trust), and zColo. Approximately 9.5% of net rentable area consists of traditional office space. The 60 Hudson Property building was designated as a historical landmark in 1992 by the New York City Landmarks Preservation Commission.
Major Tenants.
Verizon (184,420 square feet, 16.0% of net rentable area, 28.3% of underwritten rent). Verizon (NYSE: VZ) is a leading provider of technology and communications services. Headquartered in New York City, and formed on June 30, 2000, the company offers voice, data and video services and solutions on its networks and platforms. Verizon has nearly 1,500 retail locations throughout over 150 countries and reported 2022 revenues of $136.8 billion. Verizon operates at the 60 Hudson Property under four separate affiliated entities: MCI Communication Services (157,952 SF), Metropolitan Fiber Systems of NY (14,904 SF), XO Communications Services (10,898 SF) and Verizon New York Inc. (666 SF). Verizon and its affiliated tenants have been a tenant at the 60 Hudson Property since July 1984, December 1986, September 1990, and December 1997, respectively. With the exception of XO Communications Services (10,898 SF), Verizon and its affiliated leases recently executed extension notices for their leases, which will extend for 10 years through December 2034, with one, 10-year renewal option remaining. The XO Communications Services lease has an expiration date of May 31, 2033, with no renewal options remaining.
CDIL Data Centre USA LLC (“Hudson Interxchange”) (172,775 square feet, 15.0% of net rentable area, 22.1% of underwritten rent). Hudson Interxchange (previously known as Datagryd) is a wholesale data center provider meeting the demands of high-power cloud computing and data storage clients by offering colocation space and power and cooling infrastructure for data network, telecommunications, cloud and large enterprises. Datagryd was acquired by Cordiant Digital Infrastructure in 2022 for $74.0 million and was rebranded to Hudson Interxchange. Hudson Interxchange has occupied the 60 Hudson Property since September 2011, has a lease expiration date of September 30, 2032 and has three 5-year renewal options remaining.
Telx – New York LLC (Digital Realty) (“Telx”) (95,494 square feet, 8.3% of net rentable area, 12.9% of underwritten rent). Telx is a provider of data center colocation, interconnection, and cloud enablement solutions. Telx was acquired by Digital Realty Trust, Inc. in 2015 for $1.9 billion. Digital Realty Trust, Inc. operates as a real estate investment trust and is a large global provider of cloud- and carrier-neutral data center, colocation, and interconnection solutions. As of December 31, 2022, Digital Realty Trust Inc.’s portfolio consisted of 316 specialty industrial properties located in North America, Europe, South America, Africa, Australia and Asia. Telx has been a tenant at the 60 Hudson Property since June 1997, has a lease expiration date of October 31, 2027 and has one, 5-year renewal option remaining.
zColo, LLC (DataBank) (57,840 square feet, 5.0% of net rentable area, 10.6% of underwritten rent). Databank acquired the data center assets of Zayo Group (zColo LLC) in December 2020 for approximately $1.4 billion, expanding Databank’s footprint to over 65 data centers in over 29 markets and creating one of the largest privately held data center operators in North America. ZColo’s data centers are located in markets across the United States, and include major carrier interconnects in markets such as New York, Los Angeles, Seattle, Denver, Chicago, Minneapolis, Boston, Philadelphia, and Miami. zColo, LLC (DataBank) has been a tenant at the 60 Hudson Property since April 1995, has a lease expiration date of July 31, 2032 and has one, 10-year renewal option remaining.
| THE INFORMATION IN THIS STRUCTURAL AND COLLATERAL TERM SHEET IS NOT COMPLETE AND MAY BE AMENDED PRIOR TO THE TIME OF SALE. THIS TERM SHEET IS NOT AN OFFER TO SELL THESE SECURITIES AND IT IS NOT A SOLICITATION OF AN OFFER TO BUY THESE SECURITIES IN ANY JURISDICTION WHERE THE OFFER OR SALE IS NOT PERMITTED. | ||
| 39 | ||
| Other – Data Center | Loan #1 | Cut-off Date Balance: | $90,000,000 | |
| 60 Hudson Street | 60 Hudson | Cut-off Date LTV: | 17.5% | |
| New York, NY 10013 | U/W NCF DSCR: | 3.92x | ||
| U/W NOI Debt Yield: | 24.2% |
The following table presents certain information relating to the major tenants at the 60 Hudson Property:
Major Tenants(1)
| Tenant Name | Credit Rating (Fitch/ Moody’s/ S&P)(2) | Tenant NRSF | % of NRSF | Annual U/W Base Rent PSF | Annual U/W Base Rent | % of Total Annual U/W Base Rent | Lease Expiration Date | Extension Options | Term. Option (Y/N) |
| Major Tenants | |||||||||
| Verizon(3) | A-/Baa1/BBB+ | 184,420 | 16.0% | $125.96 | $23,229,241 | 28.3% | Various(3) | Various(3) | N |
| Hudson Interxchange | NR/NR/NR | 172,775 | 15.0% | $104.95 | $18,132,737 | 22.1% | 9/30/2032 | 3x5 yr | N |
| Telx | BBB/Baa2/BBB | 95,494 | 8.3% | $111.26 | $10,624,472 | 12.9% | 10/31/2027 | 1x5 yr | N |
| zColo, LLC (DataBank) | NR/NR/NR | 57,840 | 5.0% | $150.18 | $8,686,211 | 10.6% | 7/31/2032 | 1x10 yr | N |
| Level 3 Communications, LLC | NR/NR/NR | 35,389 | 3.1% | $119.59 | $4,232,080 | 5.2% | Various(4) | 1x10 yr | Y(5) |
| Centurylink Communications | BB-/Caa2/CCC+ | 37,472 | 3.3% | $101.29 | $3,795,715 | 4.6% | 9/30/2033 | 1x10 yr | N |
| NYI-Sirius, LLC | NR/NR/NR | 21,708 | 1.9% | $115.42 | $2,505,625 | 3.0% | 7/31/2028 | 1x10 yr | Y(6) |
| Total Major Tenants | 605,098 | 52.6% | $117.68 | $71,206,081 | 86.7% | ||||
| Non-Major Tenants | 109,536 | 9.5% | $99.99 | $10,952,927 | 13.3% | ||||
| Occupied Collateral Total | 714,634 | 62.2% | $114.97 | $82,159,008 | 100.0% | ||||
| Vacant Space(7) | 434,985 | 37.8% | |||||||
| Collateral Total | 1,149,619 | 100.0% | |||||||
| (1) | Information is based on the underwritten rent roll. |
| (2) | Certain ratings are those of the parent company whether or not the parent company guarantees the lease. |
| (3) | Includes Verizon affiliated leases under MCI Communication Services (157,952 SF), Metropolitan Fiber Systems of NY (14,904 SF), XO Communications Services (10,898 SF) and Verizon New York Inc. (666 SF). With the exception of the XO Communications Services lease, Verizon and its affiliated leases recently executed extension notices for their leases, which extends the leases through December 31, 2034. The XO Communications Services lease has a lease expiration date of May 31, 2033. With the exception of the Verizon New York Inc. and XO Communications Services leases, Verizon’s affiliated leases have one, 10-year renewal option remaining. |
| (4) | Level 3 Communications, LLC has 22,113 SF with an expiration date of December 31, 2027 and 13,276 SF with an expiration date of April 30, 2025. |
| (5) | Level 3 Communications, LLC has the right to terminate its lease with respect to the 12th floor premises (5,574 SF) on December 31, 2024 upon delivery of written notice to the landlord no less than 12 months, and no more than 15 months prior. |
| (6) | NYI-Sirius, LLC has the option to terminate its lease with respect to the Suite 1213 premises (8,309 SF) upon 12 months prior notice to the landlord, together with a payment of $100,000. |
| (7) | Vacant Space includes one in-place tenant, Stadium Goods (13,828 SF) which was underwritten as vacant due to its lease expiring in October 2023. |
The following table presents certain information relating to the lease rollover schedule at the 60 Hudson Property:
Lease Expiration Schedule(1)(2)
| Year Ending December 31 | No. of Leases Expiring | Expiring NRSF | % of Total NRSF | Cumulative Expiring NRSF | Cumulative % of Total NRSF | Annual U/W Base Rent | % of Total Annual U/W Base Rent | Annual U/W Base Rent PSF |
| MTM | 2 | 7,886 | 0.7% | 7,886 | 0.7% | $0 | 0.0% | $0.00 |
| 2023 | 0 | 0 | 0.0% | 7,886 | 0.7% | $0 | 0.0% | $0.00 |
| 2024 | 2 | 10,876 | 0.9% | 18,762 | 1.6% | $1,090,229 | 1.3% | $100.24 |
| 2025 | 2 | 16,971 | 1.5% | 35,733 | 3.1% | $1,938,982 | 2.4% | $114.25 |
| 2026 | 0 | 0 | 0.0% | 35,733 | 3.1% | $0 | 0.0% | $0.00 |
| 2027 | 12 | 132,121 | 11.5% | 167,854 | 14.6% | $14,937,189 | 18.2% | $113.06 |
| 2028 | 5 | 40,719 | 3.5% | 208,573 | 18.1% | $4,776,223 | 5.8% | $117.30 |
| 2029 | 1 | 6,121 | 0.5% | 214,694 | 18.7% | $529,996 | 0.6% | $86.59 |
| 2030 | 0 | 0 | 0.0% | 214,694 | 18.7% | $0 | 0.0% | $0.00 |
| 2031 | 3 | 12,976 | 1.1% | 227,670 | 19.8% | $1,581,019 | 1.9% | $121.84 |
| 2032 | 19 | 242,627 | 21.1% | 470,297 | 40.9% | $28,097,299 | 34.2% | $115.80 |
| 2033 | 2 | 48,370 | 4.2% | 518,667 | 45.1% | $5,014,225 | 6.1% | $103.66 |
| Thereafter | 7 | 195,967 | 17.0% | 714,634 | 62.2% | $24,193,846 | 29.4% | $123.46 |
| Vacant(3) | 0 | 434,985 | 37.8% | 1,149,619 | 100.0% | $0 | 0.0% | $0.00 |
| Total/Wtd. Avg. | 55 | 1,149,619 | 100.0% | $82,159,008 | 100.0% | $114.97(4) |
| (1) | Information is based on the underwritten rent roll as of June 5, 2023. |
| (2) | Certain tenants may have lease termination options that are exercisable prior to the stated expiration date of the subject lease or leases which are not considered in the lease rollover schedule. |
| (3) | Vacant includes one in-place tenant, Stadium Goods (13,828 square feet) which was underwritten as vacant due to its lease expiring in October 2023. |
| (4) | Total/Wtd. Avg. Annual U/W Base Rent PSF excludes vacant space. |
| THE INFORMATION IN THIS STRUCTURAL AND COLLATERAL TERM SHEET IS NOT COMPLETE AND MAY BE AMENDED PRIOR TO THE TIME OF SALE. THIS TERM SHEET IS NOT AN OFFER TO SELL THESE SECURITIES AND IT IS NOT A SOLICITATION OF AN OFFER TO BUY THESE SECURITIES IN ANY JURISDICTION WHERE THE OFFER OR SALE IS NOT PERMITTED. | ||
| 40 | ||
| Other – Data Center | Loan #1 | Cut-off Date Balance: | $90,000,000 | |
| 60 Hudson Street | 60 Hudson | Cut-off Date LTV: | 17.5% | |
| New York, NY 10013 | U/W NCF DSCR: | 3.92x | ||
| U/W NOI Debt Yield: | 24.2% |
The following table presents historical occupancy percentages at the 60 Hudson Property:
Historical Occupancy
2020(1) | 2021(1) | 2022(1) | 6/5/2023(2) |
| 72.6% | 64.1% | 63.2% | 62.2% |
| (1) | Information was provided by the borrower. |
| (2) | Information based on the underwritten rent roll. |
Underwritten Net Cash Flow. The following table presents certain information relating to the historic operating results and underwritten net cash flow at the 60 Hudson Property:
Cash Flow Analysis
| 2020 | 2021 | 2022 | 6/30/2023 TTM | U/W | %(1) | U/W $ per SF | |
| Gross Potential Rent | $80,020,378 | $81,473,151 | $79,777,070 | $80,757,027 | $126,042,403(2) | 76.7% | $109.64 |
| Recoveries | 8,899,659 | 7,503,651 | 6,767,304 | 7,800,073 | 6,459,196 | 3.9 | 5.62 |
| Other Income(3) | 22,431,718 | 29,768,129 | 26,396,142 | 35,751,074 | 31,900,000 | 19.4 | 27.75 |
| Net Rental Income | $111,351,756 | $118,744,930 | $112,940,517 | $124,308,174 | $164,401,599 | 100.0% | $143.01 |
| Less Vacancy & Credit Loss | 0 | 0 | 0 | 0 | (43,883,395) | (34.8) | (38.17) |
| Effective Gross Income | $111,351,756 | $118,744,930 | $112,940,517 | $124,308,174 | $120,518,204 | 73.3% | $104.83 |
| Real Estate Taxes(4) | $20,888,707 | $16,556,736 | $20,495,261 | $20,777,690 | $21,269,961 | 17.6% | $18.50 |
| Insurance | 707,269 | 703,478 | 681,814 | 758,606 | 745,821 | 0.6 | 0.65 |
| Other Operating Expenses | 22,211,869 | 24,024,316 | 26,201,622 | 29,245,894 | 30,668,749 | 25.4 | 26.68 |
| Total Operating Expenses | $43,807,845 | $41,284,530 | $47,378,697 | $50,782,190 | $52,684,531 | 43.7% | $45.83 |
| Net Operating Income | $67,543,911 | $77,460,400 | $65,561,820 | $73,525,984 | $67,833,673 | 56.3% | $59.01 |
| Replacement Reserves | 0 | 0 | 0 | 0 | 229,924 | 0.2 | 0.20 |
| TI/LC | 0 | 0 | 0 | 0 | 2,110,256 | 1.8 | 1.84 |
| Net Cash Flow | $67,543,911 | $77,460,400 | $65,561,820 | $73,525,984 | $65,493,494 | 54.3% | $56.97 |
| NOI DSCR(4) | 4.04x | 4.64x | 3.92x | 4.40x | 4.06x | ||
| NCF DSCR(4) | 4.04x | 4.64x | 3.92x | 4.40x | 3.92x | ||
| NOI Debt Yield(4) | 24.1% | 27.7% | 23.4% | 26.3% | 24.2% | ||
| NCF Debt Yield(4) | 24.1% | 27.7% | 23.4% | 26.3% | 23.4% |
| (1) | Represents (i) percent of Net Rental Income for all revenue fields, (ii) percent of Gross Potential Rent for Vacancy & Credit Loss and (iii) percent of Effective Gross Income for all other fields. |
| (2) | Based on the underwritten rent roll dated as of June 5, 2023 inclusive of contractual rent steps through September 2024 totaling $3,076,879. |
| (3) | Other Income includes metered electric charges, conduit income, point of entry income, condenser water income, emergency generator access charges, fuel riser income and other miscellaneous fees. |
| (4) | Debt service coverage ratios and debt yields are based on the aggregate Cut-off Date balance of the 60 Hudson Whole Loan. |
Appraisal. The appraiser concluded to an “as-is” value as of May 8, 2023 of $1,596,000,000.
Environmental Matters. According to the Phase I environmental report dated May 11, 2023, there was no evidence of any recognized environmental conditions at the 60 Hudson Property.
Market Overview and Competition. The 60 Hudson Property is located in the Financial District neighborhood of Lower Manhattan, which borders the neighborhoods of Downtown West, Downtown East, Battery Park, Tribeca/City Hall, Chinatown, and Lower East Side. The 60 Hudson Property is located 5 blocks north of the Wall Street subway station, which provides access to the 2 and 3 lines, while also being located a short walk from the PATH, 4, 5, A, C, E, J, M, Z, W, R, 1, 2, and 3 subway lines, with the new Fulton Street Transit Center providing access to New Jersey, Brooklyn, and the residential neighborhoods in Lower Manhattan.
The 60 Hudson Property is located within the New York metro data center market, which includes clusters of properties in Northern New Jersey, Southeastern New York, and Southwestern Connecticut. The New York metro represents the second-largest data center market in the United States, behind Northern Virginia, and accounts for the highest colocation revenues with proximity to Wall Street and subsea connectivity. Manhattan represents a major confluence of fiber networks and enterprise information technology footprints, with developed carrier hotels including the 60 Hudson Property, 32 Avenue of the Americas, and 111 8th Avenue expected to remain central hubs for networking and connectivity. As of 2023, according to a third party market research report, the New York metro is estimated to operate with nearly 800 megawatts of multi-tenant information technology capacity. The New York market is estimated to have surpassed 6.0 million SF of multi-tenant operational space as of 2022.
| THE INFORMATION IN THIS STRUCTURAL AND COLLATERAL TERM SHEET IS NOT COMPLETE AND MAY BE AMENDED PRIOR TO THE TIME OF SALE. THIS TERM SHEET IS NOT AN OFFER TO SELL THESE SECURITIES AND IT IS NOT A SOLICITATION OF AN OFFER TO BUY THESE SECURITIES IN ANY JURISDICTION WHERE THE OFFER OR SALE IS NOT PERMITTED. | ||
| 41 | ||
| Other – Data Center | Loan #1 | Cut-off Date Balance: | $90,000,000 | |
| 60 Hudson Street | 60 Hudson | Cut-off Date LTV: | 17.5% | |
| New York, NY 10013 | U/W NCF DSCR: | 3.92x | ||
| U/W NOI Debt Yield: | 24.2% |
Data center customers within this region primarily include the financial sector, but also include healthcare, media, and others which have specific user requirements and compliance needs. New York’s financial industry is responsible for approximately 40% of its total economic output. Transferring data is vital for the financial services industry, and this communication must move quickly with its information stored securely. Increased volume of data in trading is raising demand for cybersecurity software with monitors for fraud or noncompliance. Proximity hosting allows traders to be physically close to information technology systems allowing the advantage of multiple data flows. According to the appraisal, data center operators in this region or other major markets are reporting occupancy rates from 75% to 94%.
According to the appraisal, the estimated 2022 population within a half-, one - and two-mile radius was approximately 19,702, 213,569, and 677,036, respectively, and the average household income within the same radii was $206,211, $207,361, and $217,611, respectively.
The following table presents certain information relating to the appraisal’s market rent conclusion for the 60 Hudson Property:
Market Rent Summary
| Category | Market Rent (PSF) | Lease Type (Reimbursements)(1) | Rent Increase Projection | Lease Term | Tenant Improvements (New/Renewal) | Leasing Commissions (New/Renewal) |
| Office (Floors 1-13) | $54.00 | MG+E (Taxes Only) | 2.5% per year | 10 years | $125.00 / $90.00 | 4.0% / 2.0% |
| Office (Floors 14-24) | $60.00 | MG+E (Taxes Only) | 2.5% per year | 10 years | $125.00 / $90.00 | 4.0% / 2.0% |
| Office (Floor 14; 1st Turn) | $60.00 | MG+E (Taxes Only) | 2.5% per year | 10 years | $150.00 / $90.00 | 4.0% / 2.0% |
| Data Center ($100 PSF) | $100.00 | MG+E (Taxes Only) | 2.5% per year | 10 years | $20.00 / $5.00 | 4.0% / 2.0% |
| Data Center ($125 PSF) | $125.00 | MG+E (Taxes Only) | 2.5% per year | 10 years | $20.00 / $5.00 | 4.0% / 2.0% |
| Data Center ($175 PSF) | $175.00 | MG+E (Taxes Only) | 2.5% per year | 10 years | $20.00 / $5.00 | 4.0% / 2.0% |
Source: Appraisal.
| (1) | MG+E (Taxes Only) represents modified gross basis with tenants paying their pro rata share of expense reimbursements (taxes only) over a base year. |
The following table presents information relating to the sales of comparable properties to the 60 Hudson Property identified by the appraisal:
Comparable Sales Summary
| Subject/Location | Year Built/ Renovated | Rentable Area (SF) | Occupancy | Sale Date | Sale Price | Sale Price PSF |
60 Hudson Property (subject)(1) New York, NY | 1930/2013 | 1,149,619 | 62.2% | NAV | $1,596,000,000(2) | $1,388.29(2) |
1500 Champa Street Denver, CO | 1985 / 2014 | 140,323 | 100.0% | Dec. 2021 | $92,000,000 | $655.63 |
Confidential Major Market | 1925 / 2010 | 66,000 | Value Add | Oct. 2021 | $31,895,000 | $483.26 |
325 Hudson New York, NY | 1967 / 2007 | 217,600 | Value Add | May 2021 | $134,140,000 | $616.45 |
Confidential Secondary Market | 1914 / 2001 | 300,000 | Value Add | Jan. 2021 | $360,000,000 | $1,200.00 |
Confidential Major Market | 1942 / 2000 | 175,000 | 75.0% | Dec. 2020 | $165,468,922 | $945.54 |
Confidential Major Market | 1923 / Various | 110,000 | 94.0% | Apr. 2020 | $100,000,00 | $909.09 |
Confidential Major Market | 1981 / 2013 | 400,000 | 90.0% | Jan. 2020 | $750,000,000 | $1,875.00 |
1950 North Stemmons Freeway Dallas, TX | 1985 / Various | 1,600,000 | 90.0% | Feb. 2018 | $800,000,000 | $500.00 |
Source: Appraisal.
| (1) | Information obtained from the underwritten rent roll other than year built/renovated. |
| (2) | Sale Price represents appraisal value |
| THE INFORMATION IN THIS STRUCTURAL AND COLLATERAL TERM SHEET IS NOT COMPLETE AND MAY BE AMENDED PRIOR TO THE TIME OF SALE. THIS TERM SHEET IS NOT AN OFFER TO SELL THESE SECURITIES AND IT IS NOT A SOLICITATION OF AN OFFER TO BUY THESE SECURITIES IN ANY JURISDICTION WHERE THE OFFER OR SALE IS NOT PERMITTED. | ||
| 42 | ||
| Other – Data Center | Loan #1 | Cut-off Date Balance: | $90,000,000 | |
| 60 Hudson Street | 60 Hudson | Cut-off Date LTV: | 17.5% | |
| New York, NY 10013 | U/W NCF DSCR: | 3.92x | ||
| U/W NOI Debt Yield: | 24.2% |
Escrows
Real Estate Taxes – At origination the borrower deposited $7,089,987 into a reserve for real estate taxes. On each monthly payment date, the borrower is required to deposit into a reserve for real estate taxes an amount equal to 1/12 of the real estate taxes that the lender estimates will be payable during the next 12 months for the 60 Hudson Property (currently approximately $1,772,497).
Insurance – On each monthly payment date, the borrower is required to deposit into a reserve for insurance premiums an amount equal to 1/12 of the insurance premiums that the lender estimates will be payable for the renewal of coverage upon the expiration of the insurance policies. Notwithstanding the foregoing, the borrower is not required to reserve for insurance premiums, provided that (i) no event of default is continuing under the 60 Hudson Whole Loan documents, (ii) the liability and casualty insurance coverage for the 60 Hudson Property is included in blanket policies approved by the lender in its reasonable discretion, and (iii) the borrower provides the lender with evidence of renewal of the policies and paid receipts for the payment of the insurance premiums by no later than 10 days prior to the expiration date of the policies (which was the case at origination).
Replacement Reserve – On each monthly payment date during the continuance of a Reserves Trigger Period (as defined below), the borrower is required to deposit approximately $19,160 into a reserve for capital expenditures.
TI/LC Reserve – On each monthly payment date during the continuance of a Reserves Trigger Period, the borrower is required to deposit approximately $287,405 into a reserve for tenant improvements and leasing commissions.
“Reserves Trigger Period” means the continuance of any Cash Sweep Event Period (as defined below), provided that if such Cash Sweep Event Period is not caused by an event of default under the 60 Hudson Whole Loan documents, the Reserves Trigger Period will not be deemed to have occurred if (i) the borrower demonstrates to the reasonable satisfaction of the lender that the borrower has Sufficient Liquid Resources (as defined below) or (ii) the borrower delivers to the lender the Additional Collateral (as defined below) as and when permitted by the 60 Hudson Whole Loan documents.
“Sufficient Liquid Resources” means that the borrower has cash, cash equivalents and/or other liquid assets equal to not less than 50% or more of the capital expenditures and tenant improvements and leasing commissions payable as of an applicable determination date.
“Additional Collateral” means either cash or a letter of credit in the amount of $17,500,000.
“Cash Sweep Event Period” means a period (A) commencing upon the earliest of (i) the occurrence of an event of default under the 60 Hudson Whole Loan documents, or (ii) the interest only debt service coverage ratio of the 60 Hudson Whole Loan being less than 1.60x at the end of any calendar quarter; and (B) expiring upon (y) with regard to any Cash Sweep Event Period commenced in connection with clause (i) above, the cure (if applicable) of such event of default, and (z) with regard to any Cash Sweep Event Period commenced in connection with clause (ii) above, the date that either (A) the interest only debt service coverage ratio is equal to or greater than 1.60x for the immediately preceding calendar quarter (without assuming that the Additional Collateral has been applied as a partial repayment of the 60 Hudson Whole Loan) or (B) assuming that no event of default is continuing, the date that the borrower delivers Additional Collateral to the lender; provided, however, that if, 12 months following the commencement of the Cash Sweep Event Period that resulted in delivery of Additional Collateral, the interest only debt service coverage ratio is less than 1.60x at the end of any calendar quarter (without giving effect to application of the Additional Collateral to the outstanding principal balance of the 60 Hudson Whole Loan), a Cash Sweep Event Period will be deemed to have occurred and will continue until the date that the interest only debt service coverage ratio is equal to or greater than 1.60x for the immediately preceding calendar quarter. In no event will the borrower have the right to cure a Cash Sweep Event Period by delivering Additional Collateral on more than three occasions.
Lockbox and Cash Management. The 60 Hudson Whole Loan is structured with a hard lockbox maintained with Apple Bank for Savings, an affiliate of the borrower, and in place cash management. All rents are required to be deposited into the lender-controlled lockbox account. The 60 Hudson Whole Loan documents require that the borrower deliver tenant direction letters to the tenants directing them to pay all rents into the lockbox account, and if the borrower or property manager receives rents from the 60 Hudson Property despite such direction, deposit such rents into the lockbox account within one business day of receipt. All funds in the lockbox account are required to be swept on each business day into a lender-controlled cash management account, to be applied, provided no event of default is continuing under the 60 Hudson Whole Loan, (i) to make the monthly deposits, if any, into the tax and insurance reserve funds, as described above under “Escrows” (ii) to pay debt service on the 60 Hudson Whole Loan, (iii) to make monthly deposits, if any, into the replacement reserve and the TI/LC reserve, as described above under “Escrows” (iv) if a Cash Sweep Event Period is continuing, to pay monthly operating expenses in the amount set forth in the lender-approved annual budget and lender approved extraordinary expenses, and (v) to apply any funds remaining in the cash management account after the application described above (x) if a Cash Sweep Event Period exists, to be deposited into an excess cash flow reserve to be held as additional collateral for the 60 Hudson Whole Loan during the continuance of such Cash Sweep Event Period and (y) otherwise, to be disbursed to the borrower.
Subordinate and Mezzanine Indebtedness. None.
Partial Release. Not permitted.
Real Estate Substitution. Not permitted.
Property Management. The property manager is Colliers Tri-State Management LLC, an affiliate of the borrower.
| THE INFORMATION IN THIS STRUCTURAL AND COLLATERAL TERM SHEET IS NOT COMPLETE AND MAY BE AMENDED PRIOR TO THE TIME OF SALE. THIS TERM SHEET IS NOT AN OFFER TO SELL THESE SECURITIES AND IT IS NOT A SOLICITATION OF AN OFFER TO BUY THESE SECURITIES IN ANY JURISDICTION WHERE THE OFFER OR SALE IS NOT PERMITTED. | ||
| 43 | ||
| Other – Data Center | Loan #1 | Cut-off Date Balance: | $90,000,000 | |
| 60 Hudson Street | 60 Hudson | Cut-off Date LTV: | 17.5% | |
| New York, NY 10013 | U/W NCF DSCR: | 3.92x | ||
| U/W NOI Debt Yield: | 24.2% |
Letter of Credit. None; provided that a letter of credit may be delivered to cure a Cash Sweep Event Period caused by a decline in debt service coverage ratio as described above under “Escrows.”
Right of First Offer/Right of First Refusal. None.
Ground Lease. None.
Terrorism Insurance. The borrower is required to obtain and maintain an “all risk” property insurance policy that covers perils of terrorism and acts of terrorism in an amount equal to the “full replacement cost” of the 60 Hudson Property together with 24 months of business income insurance, plus an extended period of indemnity of up to 12 months. Notwithstanding the foregoing, for so long as the Terrorism Risk Insurance Act of 2002, as extended and modified by the Terrorism Risk Insurance Program Reauthorization Act of 2015 (“TRIPRA”), is in effect (including any extensions thereof or if another federal governmental program is in effect relating to “acts of terrorism” which provides substantially similar protections as TRIPRA), the lender is required to accept terrorism insurance which insures against “covered acts” as defined by TRIPRA (or such other program) but only in the event that TRIPRA (or such other program) continues to cover both domestic and foreign acts of terrorism. Additionally, with respect to any such stand-alone policy covering perils of terrorism and acts of terrorism, the borrower will not be required to pay any insurance premiums solely with respect to such terrorism coverage in excess of two times the amount of the insurance premium that is payable in respect of the property insurance and business income/loss of rents insurance for the 60 Hudson Property (without giving effect to the cost of terrorism and earthquake components of such insurance) at the time that such terrorism coverage is excluded from the applicable insurance policy. See “Risk Factors—Risks Relating to the Mortgage Loans—Terrorism Insurance May Not Be Available for All Mortgaged Properties” in the prospectus.
| THE INFORMATION IN THIS STRUCTURAL AND COLLATERAL TERM SHEET IS NOT COMPLETE AND MAY BE AMENDED PRIOR TO THE TIME OF SALE. THIS TERM SHEET IS NOT AN OFFER TO SELL THESE SECURITIES AND IT IS NOT A SOLICITATION OF AN OFFER TO BUY THESE SECURITIES IN ANY JURISDICTION WHERE THE OFFER OR SALE IS NOT PERMITTED. | ||
| 44 | ||
| Retail – Super Regional Mall | Loan #2 | Cut-off Date Balance: | $90,000,000 | |
| 7000 and 7600 Arundel Mills Circle | Arundel Mills and Marketplace | Cut-off Date LTV: | 41.4% | |
| Hanover, MD 21076 | U/W NCF DSCR: | 1.98x | ||
| U/W NOI Debt Yield: | 16.1% |
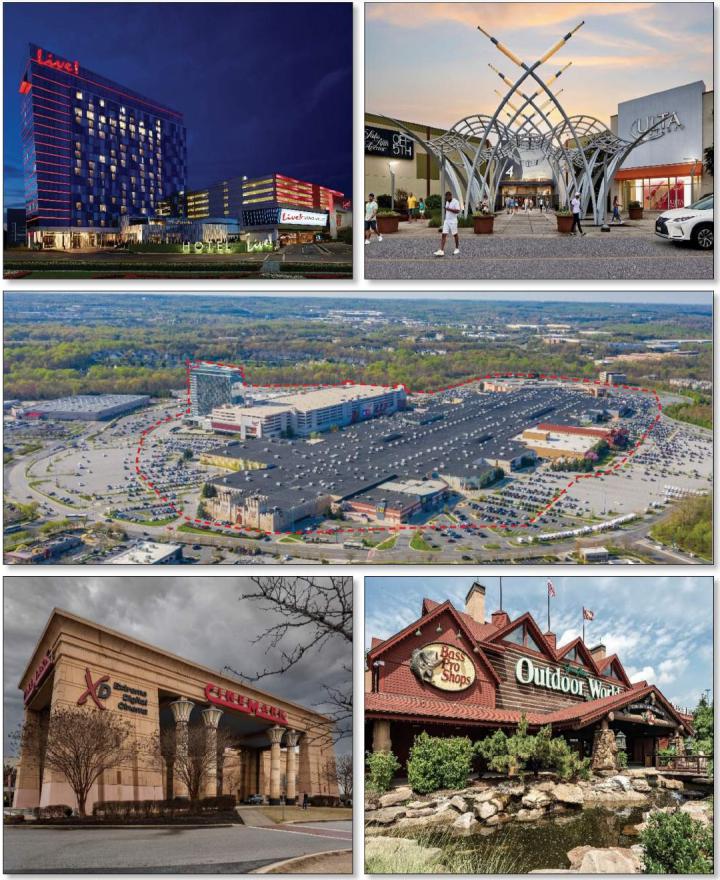
| THE INFORMATION IN THIS STRUCTURAL AND COLLATERAL TERM SHEET IS NOT COMPLETE AND MAY BE AMENDED PRIOR TO THE TIME OF SALE. THIS TERM SHEET IS NOT AN OFFER TO SELL THESE SECURITIES AND IT IS NOT A SOLICITATION OF AN OFFER TO BUY THESE SECURITIES IN ANY JURISDICTION WHERE THE OFFER OR SALE IS NOT PERMITTED. | ||
| 45 | ||
| Retail – Super Regional Mall | Loan #2 | Cut-off Date Balance: | $90,000,000 | |
| 7000 and 7600 Arundel Mills Circle | Arundel Mills and Marketplace | Cut-off Date LTV: | 41.4% | |
| Hanover, MD 21076 | U/W NCF DSCR: | 1.98x | ||
| U/W NOI Debt Yield: | 16.1% |
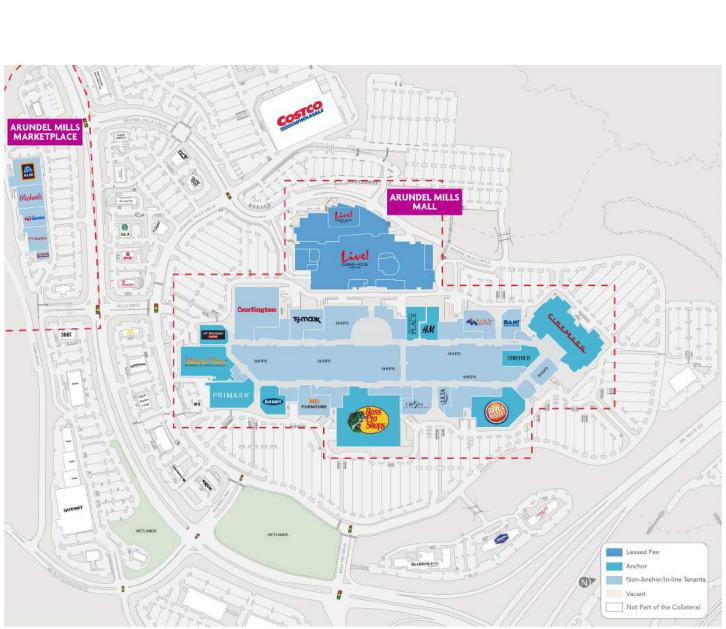
| THE INFORMATION IN THIS STRUCTURAL AND COLLATERAL TERM SHEET IS NOT COMPLETE AND MAY BE AMENDED PRIOR TO THE TIME OF SALE. THIS TERM SHEET IS NOT AN OFFER TO SELL THESE SECURITIES AND IT IS NOT A SOLICITATION OF AN OFFER TO BUY THESE SECURITIES IN ANY JURISDICTION WHERE THE OFFER OR SALE IS NOT PERMITTED. | ||
| 46 | ||
| Retail – Super Regional Mall | Loan #2 | Cut-off Date Balance: | $90,000,000 | |
| 7000 and 7600 Arundel Mills Circle | Arundel Mills and Marketplace | Cut-off Date LTV: | 41.4% | |
| Hanover, MD 21076 | U/W NCF DSCR: | 1.98x | ||
| U/W NOI Debt Yield: | 16.1% |
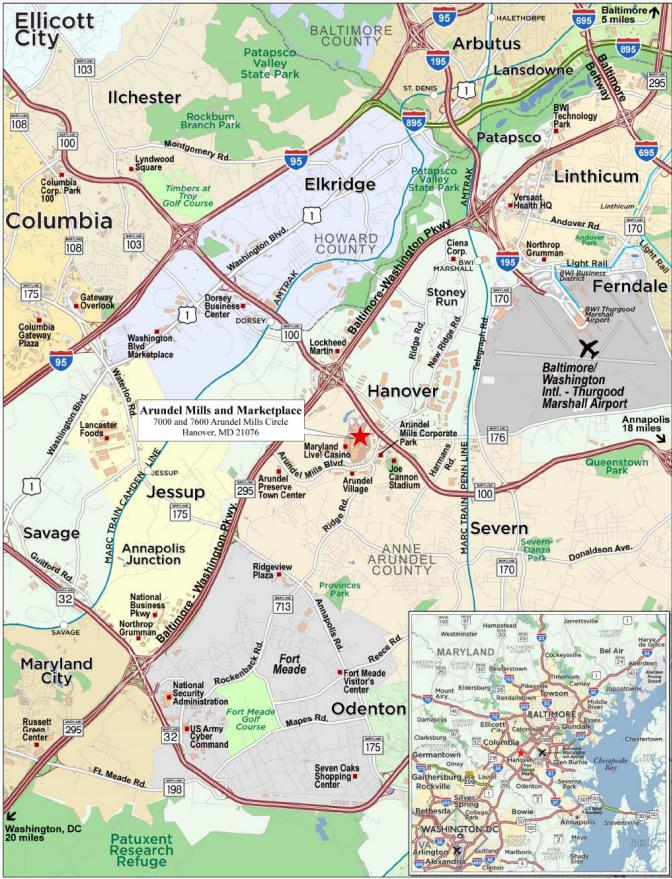
| THE INFORMATION IN THIS STRUCTURAL AND COLLATERAL TERM SHEET IS NOT COMPLETE AND MAY BE AMENDED PRIOR TO THE TIME OF SALE. THIS TERM SHEET IS NOT AN OFFER TO SELL THESE SECURITIES AND IT IS NOT A SOLICITATION OF AN OFFER TO BUY THESE SECURITIES IN ANY JURISDICTION WHERE THE OFFER OR SALE IS NOT PERMITTED. | ||
| 47 | ||
| No. 2 – Arundel Mills and Marketplace |
| Mortgage Loan Information | Mortgaged Property Information | ||||||
| Mortgage Loan Seller: | Wells Fargo Bank, National Association | Single Asset/Portfolio: | Single Asset | ||||
Credit Assessment (Fitch/KBRA/Moody’s): | NR/BBB-(sf)/A3(sf) | Property Type – Subtype: | Retail – Super Regional Mall | ||||
| Original Principal Balance(1): | $90,000,000 | Location: | Hanover, MD | ||||
| Cut-off Date Balance(1): | $90,000,000 | Size(6): | 1,938,983 SF | ||||
| % of Initial Pool Balance: | 9.8% | Cut-off Date Balance Per SF(1)(6): | $185.66 | ||||
| Loan Purpose: | Refinance | Maturity Date Balance Per SF(1)(6): | $185.66 | ||||
| Borrower Sponsor: | Simon Property Group, L.P. | Year Built/Renovated: | 2000; 2002; 2012/NAP | ||||
| Guarantor: | Simon Property Group, L.P. | Title Vesting: | Fee | ||||
| Mortgage Rate: | 7.7010% | Property Manager: | Simon Management Associates II, LLC (borrower-related) | ||||
| Note Date: | October 5, 2023 | Current Occupancy (As of)(7): | 98.3% (6/15/2023) | ||||
| Seasoning: | 1 month | YE 2022 Occupancy(7): | 97.2% | ||||
| Maturity Date: | November 1, 2033 | YE 2021 Occupancy(7): | 93.2% | ||||
| IO Period: | 120 months | YE 2020 Occupancy(7): | 94.2% | ||||
| Loan Term (Original): | 120 months | YE 2019 Occupancy(7): | 98.2% | ||||
| Amortization Term (Original): | NAP | As-Is Appraised Value: | $870,600,000 | ||||
| Loan Amortization Type: | Interest Only | As-Is Appraised Value Per SF(6): | $449.00 | ||||
| Call Protection(2): | L(25),D(89),O(6) | As-Is Appraisal Valuation Date: | September 1, 2023 | ||||
| Lockbox Type: | Hard/Springing Cash Management | Underwriting and Financial Information | |||||
| Additional Debt(1)(3)(4): | Yes | TTM NOI (8/31/2023)(8): | $51,525,734 | ||||
| Additional Debt Type (Balance)(1)(3)(4): | Pari Passu ($270,000,000) | YE 2022 NOI: | $52,750,256 | ||||
| YE 2021 NOI(9): | $52,018,087 | ||||||
| YE 2020 NOI(9): | $42,286,167 | ||||||
| Escrows and Reserves(5) | U/W Revenues: | $74,354,670 | |||||
| Initial | Monthly | Cap | U/W Expenses: | $16,415,944 | |||
| Taxes: | $0 | Springing | NAP | U/W NOI(8): | $57,938,726 | ||
| Insurance: | $0 | Springing | NAP | U/W NCF: | $55,557,554 | ||
| Replacement Reserve: | $0 | Springing | NAP | U/W DSCR based on NOI/NCF(1): | 2.06x / 1.98x | ||
| TI/LC Reserve: | $0 | $231,942 | $5,566,608 | U/W Debt Yield based on NOI/NCF(1): | 16.1% /15.4% | ||
| Gap Rent Reserve: | $587,891 | $0 | NAP | U/W Debt Yield at Maturity based on NOI/NCF(1): | 16.1% /15.4% | ||
| Outstanding TI/LC Reserve: | $3,796,478 | $0 | NAP | Cut-off Date LTV Ratio(1): | 41.4% | ||
| LTV Ratio at Maturity(1): | 41.4% | ||||||
| Sources and Uses | ||||||||||
| Sources | Uses | |||||||||
| Whole Loan Amount(1) | $360,000,000 | 91.8 | % | Loan Payoff | $384,870,923 | 98.1 | % | |||
| Sponsor Equity | 32,236,503 | 8.2 | Upfront Reserves | 4,384,369 | 1.1 | |||||
| Closing Costs | 2,981,210 | 0.8 | ||||||||
| Total Sources | $392,236,503 | 100.0 | % | Total Uses | $392,236,503 | 100.0 | % | |||
| (1) | The Arundel Mills and Marketplace Mortgage Loan (as defined below) is part of the Arundel Mills and Marketplace Whole Loan (as defined below), which is comprised of 16 pari passu promissory notes with an aggregate original principal balance of $360,000,000. The Cut-off Date Balance Per SF, Maturity Date Balance Per SF, U/W DSCR based on NOI/NCF, U/W Debt Yield based on NOI/NCF, U/W Debt Yield at Maturity based on NOI/NCF, Cut-off Date LTV Ratio and LTV Ratio at Maturity presented above are based on the aggregate Cut-off Date principal balance of the Arundel Mills and Marketplace Whole Loan. |
| (2) | Prepayment of the Arundel Mills and Marketplace Whole Loan is permitted at any time after the earlier to occur of (a) the end of the two-year period commencing on the closing date of the securitization of the last promissory note representing a portion of the Arundel Mills and Marketplace Whole Loan to be securitized and (b) December 1, 2026. The assumed prepayment lockout period of 25 payments is based on the closing date of this transaction in December 2023. If any pari passu note has not been securitized for 2 years by December 1, 2026, the borrower may prepay any note that has not been securitized for 2 years on a greater of (i) 1% of the prepaid amount or (ii) yield maintenance basis in conjunction with defeasance of any securitized pari passu note. In addition, the Arundel Mills and Marketplace Whole Loan may be prepaid in connection with a partial release, as described under “Partial Release” section below. |
| (3) | See “The Mortgage Loan” section below for further discussion of additional mortgage debt. |
| (4) | The property is subject to an existing property assessed clean energy loan in an original principal amount of $2,037,877.38 from Petros PACE Finance, LLC, a Texas limited liability company to the borrower. The PACE loan has a 17-year term with final payment occurring in November 2035. The annual debt service is $195,956.85 and the remaining balance, including all interest and administrative expenses, as of October 2023 was $1,633,579.73. Payments and any accrued interest are collected on the subject’s tax bill and constitute a first lien on the property that has a priority over any mortgage loan. In addition, the Arundel Mills and Marketplace Whole Loan documents permit the borrowers to enter into an additional PACE loan for an amount not to exceed $5,000,000. |
| (5) | See “Escrows” section below for further discussion of reserve requirements. |
| (6) | The Arundel Mills and Marketplace Property (as defined below) includes a larger mall and lifestyle center which consists of 1,391,652 SF of owned improvements and 547,331 SF of leased fee improvements. The Cut-off Date Balance Per SF, Maturity Date Balance Per SF, and As-Is Appraised Value Per SF are based on the total SF of 1,938,983. The Cut-off Date Balance Per SF, Maturity Date Balance Per SF, and As-Is Appraised Value Per SF based on the Owned SF (as defined below) of 1,391,652 is $258.69, $258.69, and $625.59, respectively. |
| (7) | Occupancy represents the occupancy excluding square footage from the leased fee tenant, Live Casino Hotel Maryland, and is based on the Owned SF totaling 1,391,652. |
| THE INFORMATION IN THIS STRUCTURAL AND COLLATERAL TERM SHEET IS NOT COMPLETE AND MAY BE AMENDED PRIOR TO THE TIME OF SALE. THIS TERM SHEET IS NOT AN OFFER TO SELL THESE SECURITIES AND IT IS NOT A SOLICITATION OF AN OFFER TO BUY THESE SECURITIES IN ANY JURISDICTION WHERE THE OFFER OR SALE IS NOT PERMITTED. | ||
| 48 | ||
| Retail – Super Regional Mall | Loan #2 | Cut-off Date Balance: | $90,000,000 | |
| 7000 and 7600 Arundel Mills Circle | Arundel Mills and Marketplace | Cut-off Date LTV: | 41.4% | |
| Hanover, MD 21076 | U/W NCF DSCR: | 1.98x | ||
| U/W NOI Debt Yield: | 16.1% |
Occupancy including Live Casino Hotel Maryland is 98.8%.
| (8) | The increase from the TTM NOI to the U/W NOI is driven by 18 new and renewal leases commencing in 2023 and 2024 totaling 113,039 SF (5.8% of SF and 8.3% of underwritten rent) and rent steps of $604,665. |
| (9) | The increase in YE 2020 NOI to YE 2021 NOI was primarily driven by an increase in bad debt/collection loss in 2020 due to the effect of the novel coronavirus pandemic. |
The Mortgage Loan. The second largest mortgage loan (the “Arundel Mills and Marketplace Mortgage Loan”) is part of a whole loan (the “Arundel Mills and Marketplace Whole Loan”) evidenced by 16 pari passu notes with an aggregate outstanding principal balance as of the Cut-off Date of $360,000,000. The Arundel Mills and Marketplace Whole Loan is secured by a first mortgage lien on the borrowers’ fee interest in a 1,837,764 SF super regional mall (“Arundel Mills”) and a 101,219 SF lifestyle center (“Arundel Marketplace”) totaling 1,938,983 SF located in Hanover, Maryland (the “Arundel Mills and Marketplace Property”). The Arundel Mills and Marketplace Mortgage Loan is evidenced by the controlling Note A-1-1 and the non-controlling Notes A-1-2, and A-1-4 with an aggregate outstanding principal balance as of the Cut-off Date of $90,000,000. The Arundel Mills and Marketplace Whole Loan was co-originated by Wells Fargo Bank, National Association (“WFB”), Société Générale Financial Corporation (“SGFC”), DBR Investments Co. Limited (“DBRI”) and Citi Real Estate Funding Inc. (“CREFI”) on October 5, 2023. The Arundel Mills and Marketplace Whole Loan pari passu notes other than those evidencing the Arundel Mills and Marketplace Mortgage Loan are referred to herein as the “Arundel Mills and Marketplace Pari Passu Companion Loans.” The Arundel Mills and Marketplace Whole Loan is being serviced pursuant to the pooling and servicing agreement for the MSWF 2023-2 securitization trust. The relationship between the holders of the Arundel Mills and Marketplace Whole Loan is governed by a co-lender agreement as described under “Description of the Mortgage Pool—The Whole Loans—The Serviced Pari Passu Whole Loans” in the prospectus.
Whole Loan Note Summary
| Note | Original Balance | Cut-off Date Balance | Note Holder | Controlling Piece |
| A-1-1 | $50,000,000 | $50,000,000 | MSWF 2023-2 | Yes |
| A-1-2 | $30,000,000 | $30,000,000 | MSWF 2023-2 | No |
| A-1-3 | $15,000,000 | $15,000,000 | WFB | No |
| A-1-4 | $10,000,000 | $10,000,000 | MSWF 2023-2 | No |
| A-2-1 | $40,000,000 | $40,000,000 | SGFC | No |
| A-2-2 | $30,000,000 | $30,000,000 | SGFC | No |
| A-2-3 | $10,000,000 | $10,000,000 | SGFC | No |
| A-2-4 | $5,000,000 | $5,000,000 | SGFC | No |
| A-3-1 | $25,000,000 | $25,000,000 | DBRI | No |
| A-3-2 | $20,000,000 | $20,000,000 | DBRI | No |
| A-3-3 | $15,000,000 | $15,000,000 | DBRI | No |
| A-3-4 | $15,000,000 | $15,000,000 | DBRI | No |
| A-3-5 | $10,000,000 | $10,000,000 | DBRI | No |
| A-4-1 | $40,000,000 | $40,000,000 | BMO 2023-C7 | No |
| A-4-2 | $25,000,000 | $25,000,000 | CREFI | No |
| A-4-3 | $20,000,000 | $20,000,000 | BMO 2023-C7 | No |
| Total (Whole Loan) | $360,000,000 | $360,000,000 |
The Borrowers and Borrower Sponsor. The borrowers are Arundel Mills Limited Partnership and Arundel Mills Marketplace Limited Partnership, each a Delaware limited partnership with two independent directors. The borrowers comprise a joint venture between Simon Property Group, L.P. (59.3%) and Kan Am Group (40.7%). The borrower sponsor and non-recourse carveout guarantor of the Arundel Mills and Marketplace Whole Loan is Simon Property Group, L.P. (“Simon”).
Simon (NYSE: SPG) is a real estate investment trust engaged in the ownership of premier shopping, dining, entertainment and mixed-use destinations. Simon has approximately 400 retail centers across 24 countries.
Pursuant to the Arundel Mills and Marketplace Whole Loan documents, so long as one or more of Simon Property Group, Inc. or an affiliate of Simon is the non-recourse carveout guarantor, the non-recourse carveout guarantor’s liability is limited to 20.0% of the original principal balance of the Arundel Mills and Marketplace Whole Loan ($72,000,000) in the aggregate, plus all of the reasonable out-of-pocket costs and expenses (including court costs and reasonable attorneys’ fees) incurred by the lender in the enforcement of the related guaranty or the preservation of the lender’s rights under such guaranty. In addition, there is no separate environmental indemnity with respect to the Arundel Mills and Marketplace Whole Loan. The non-recourse carveout guaranty covers breaches of representations, warranties and indemnification provisions in the loan agreement concerning environmental laws and hazardous materials; however, such coverage is subject to the cap described above.
The Property. The Arundel Mills and Marketplace Property comprises Arundel Mills, a 1,837,764 SF super regional mall, which includes 1,290,433 SF of owned SF and 547,331 SF of leased fee SF, and Arundel Marketplace, a 101,219 SF lifestyle center, totaling 1,938,983 SF located in Hanover, Maryland. In total, the Owned SF comprises 1,391,652 SF (the “Owned SF”). Arundel Mills is anchored by Live Casino Hotel Maryland (“Live Casino Hotel”), which owns its improvements and ground leases the underlying land from the borrowers, Bass Pro Shops Outdoor (“Bass Pro”), Burlington, Dave & Buster’s, Medieval Times and Cinemark Theatres (“Cinemark”). Arundel Mills
| THE INFORMATION IN THIS STRUCTURAL AND COLLATERAL TERM SHEET IS NOT COMPLETE AND MAY BE AMENDED PRIOR TO THE TIME OF SALE. THIS TERM SHEET IS NOT AN OFFER TO SELL THESE SECURITIES AND IT IS NOT A SOLICITATION OF AN OFFER TO BUY THESE SECURITIES IN ANY JURISDICTION WHERE THE OFFER OR SALE IS NOT PERMITTED. | ||
| 49 | ||
| Retail – Super Regional Mall | Loan #2 | Cut-off Date Balance: | $90,000,000 | |
| 7000 and 7600 Arundel Mills Circle | Arundel Mills and Marketplace | Cut-off Date LTV: | 41.4% | |
| Hanover, MD 21076 | U/W NCF DSCR: | 1.98x | ||
| U/W NOI Debt Yield: | 16.1% |
is an enclosed mall with multiple wings and entrances, containing a food court and anchor tenants. Arundel Marketplace is leased to major tenants including Aldi, Michael’s, Staples and PetsMart. Built between 2000 and 2012, the Arundel Mills and Marketplace Property is situated on a 208.08-acre parcel and contains 6,207 parking spaces (4.5/1,000 SF), which excludes the spaces within the casino parking structure. The collateral tenancy, outside of the anchors, is granular with no other tenant making up more than 3.3% of the Owned SF. Notable tenants include T.J. Maxx, Saks Fifth Avenue Off 5th, Old Navy, Polo Ralph Lauren, Ulta Beauty, Nike Factory Store, The North Face, and Victoria’s Secret. As of June 15, 2023, the Arundel Mills and Marketplace Property was 98.3% leased based on Owned SF and 98.8% leased based on total SF by 177 tenants.
The trailing 12-month in-line sales PSF as of July 31, 2023 are $559 PSF, representing a 10.0% increase over 2019. As of the trailing 12-month period as of July 31, 2023, the in-line occupancy cost ratio is 13.0%. The table below provides an overview of sales by inline tenants with less than 10,000 square feet.
| Sales by Tenancy Type(1) | |||||
| Tenancy Type | 2019 Sales PSF | 2020 Sales PSF | 2021 Sales PSF | 2022 Sales PSF | TTM 7/31/2023 Sales PSF |
| Inline Sales (< 10,000 SF) | $508 | $394 | $568 | $562 | $559 |
| Occupancy Cost | 13.8% | 17.6% | 12.9% | 12.7% | 13.0% |
| (1) | Information obtained from the borrowers. |
Major Tenants
Cinemark (Fitch/Moody’s/S&P: B+/NR/B+; 107,190 square feet; 5.5% of net rentable area; 9.1% of underwritten base rent; 12/31/2025 lease expiration). Founded in 1984 and headquartered in Plano, Texas, Cinemark is the third-largest movie theater chain in the United States, operating 5,812 screens across 514 theaters in the US and Latin America as of June 30, 2023. The tenant operates 24 screens at the property and, according to the appraisal, this is the strongest performing theater in a 15-mile radius with 1.2 million visitors during the trailing 12-month period ending in August 2023. Cinemark has been a tenant at the property since 2000 and is on a lease expiring in December 2025. The tenant has 3, 5-year extension options and no termination options.
Live Casino Hotel (Fitch/Moody’s/S&P: NR/NR/NR; 547,331 square feet; 28.2% of net rentable area; 5.5% of underwritten base rent; 7/13/2115 lease expiration). Live Casino Hotel is owned by The Cordish Companies, which started in 1910 and is a real estate developer and owner operator of multiple businesses in the entertainment industry. Live Casino Hotel offers a wide range of gaming and entertainment options with approximately 206 tables, 310 hotel rooms, a spa, and 75,000 square feet of event space. Live Casino Hotel attracts more than 10 million visitors annually and features the largest gambling floor of any casino in the country. Live Casino Hotel has been a tenant at the property since June 2012. The tenant owns its improvements and leases the underlying land from the borrowers on a ground lease expiring in July 2115. Live Casino Hotel may terminate their lease on June 30, 2027, which is the expiration of the first 15-year period from the rent commencement date, or at the end of any 10 year period thereafter with 365 days’ notice. In addition to base rent, the tenant pays percentage rent equal to 1% of retail and gaming gross revenues, less percentage rent allowance of $1,500,000. The underwritten Live Casino Hotel percentage rent is $6,324,300, which is based on TTM 7/31/2023 sales.
Dave & Buster’s (Fitch/Moody’s/S&P: NR/NR/NR; 63,631 square feet; 3.3% of net rentable area; 4.5% of underwritten base rent; 5/31/2026 lease expiration). Founded in 1982 in Dallas, Texas, Dave & Buster’s is an entertainment venue including an arcade, sports bar and restaurant. Today, there are over 150 locations across North America with a total of over 20 million visitors annually. Dave & Buster’s has been a tenant at the property since 2000 and is on a lease expiring in May 2026. The tenant has 2, 5-year extension options and no termination options.
| THE INFORMATION IN THIS STRUCTURAL AND COLLATERAL TERM SHEET IS NOT COMPLETE AND MAY BE AMENDED PRIOR TO THE TIME OF SALE. THIS TERM SHEET IS NOT AN OFFER TO SELL THESE SECURITIES AND IT IS NOT A SOLICITATION OF AN OFFER TO BUY THESE SECURITIES IN ANY JURISDICTION WHERE THE OFFER OR SALE IS NOT PERMITTED. | ||
| 50 | ||
| Retail – Super Regional Mall | Loan #2 | Cut-off Date Balance: | $90,000,000 | |
| 7000 and 7600 Arundel Mills Circle | Arundel Mills and Marketplace | Cut-off Date LTV: | 41.4% | |
| Hanover, MD 21076 | U/W NCF DSCR: | 1.98x | ||
| U/W NOI Debt Yield: | 16.1% |
The following table presents a summary regarding the major tenants at the Arundel Mills and Marketplace Property:
Major Tenants
| Tenant Name | Credit Rating (Fitch/Moody's/ S&P)(1) | Tenant NRSF | % of NRSF | Annual U/W Rent(2)(3) | % of Total Annual U/W Rent | Annual U/W Rent PSF(2)(3) | Term. Option (Y/N) | Lease Expiration Date | Ext. Options |
Anchor Tenant | |||||||||
| Live Casino Hotel | NR/NR/NR | 547,331 | 28.2% | $2,231,337(5) | 5.5% | $4.08 | Y(6) | 7/13/2115 | None |
| Total/Wtd. Avg. | 547,331 | 28.2% | $2,231,337 | 5.5% | $4.08 | ||||
| Major Tenants | |||||||||
| Cinemark | B+/NR/B+ | 107,190 | 5.5% | $3,644,460 | 9.1% | $34.00 | N | 12/31/2025 | 3 x 5 Yr |
| Dave & Buster's | NR/NR/NR | 63,631 | 3.3% | $1,819,847 | 4.5% | $28.60 | N | 5/31/2026 | 2 x 5 Yr |
| Primark | NR/NR/A | 46,143 | 2.4% | $1,161,117 | 2.9% | $25.16 | Y(7) | 8/31/2033 | 3 x 5 Yr |
| Forever 21 | NR/NR/NR | 25,211 | 1.3% | $1,051,790(8) | 2.6% | $41.72 | N | 1/31/2026 | None |
| Bass Pro | NR/NR/NR | 127,672 | 6.6% | $895,134(8) | 2.2% | $7.01 | N | 10/3/2026 | 5 x 5 Yr |
| The Children’s Place | NR/NR/NR | 20,816 | 1.1% | $749,792 | 1.9% | $36.02 | N | 4/30/2025 | None |
| Old Navy | NR/Ba3/BB | 26,044 | 1.3% | $745,958 | 1.9% | $28.64 | N | 1/31/2027 | None |
| Michael Kors | BBB-/NR/BBB- | 6,861 | 0.4% | $655,363 | 1.6% | $95.52 | N | 4/30/2028 | None |
| H&M | NR/NR/BBB | 20,296 | 1.0% | $562,336(8) | 1.4% | $27.71 | N | 1/31/2028 | None |
| Off Broadway Shoes | NR/NR/NR | 21,526 | 1.1% | $514,691 | 1.3% | $23.91 | N | 1/31/2026 | None |
| Medieval Times | NR/NR/NR | 66,244 | 3.4% | $496,680 | 1.2% | $7.50 | N | 8/31/2033 | 2 x 10 Yr |
| Total/Wtd. Avg. | 531,634 | 27.4% | $12,297,168 | 30.6% | $23.13 | ||||
| Non-Major Tenants(9) | 835,783 | 43.1% | $25,684,060 | 63.9% | $30.73 | ||||
| Occupied Collateral Total | 1,914,748 | 98.8% | $40,212,565 | 100.0% | $27.78(10) | ||||
| Vacant Space | 24,235 | 1.2% | |||||||
| Total/Wtd. Avg. | 1,938,983 | 100.0% |
| (1) | Certain ratings are those of the parent company whether or not the parent guarantees the lease. |
| (2) | Annual U/W Rent and Annual U/W Rent PSF includes percentage in-lieu of rents totaling $3,023,713. |
| (3) | Annual U/W Rent and Annual U/W Rent PSF includes $604,665 of rent steps through September 2024. |
| (4) | Live Casino Hotel owns their own improvements and ground leases the land from the borrowers. The Tenant NRSF shown represents the leased fee SF. |
| (5) | Live Casino Hotel also pays percentage rent, which equates to 1% of retail and gaming gross revenues, less percentage rent allowance of $1,500,000. The underwritten Live Casino Hotel percentage rent is $6,324,300, which is based on TTM 7/31/2023 sales and not included in the Annual U/W Rent. |
| (6) | Live Casino Hotel may terminate their lease on June 30, 2027, which is the expiration of the first 15-year period from the rent commencement date, or at the end of any 10 year period thereafter. |
| (7) | If Primark does not achieve sales of at least $12,000,000 during the fourth lease year (9/1/2026-8/31/2027), tenant may terminate its lease within 120 days of the expiration of the fourth lease year. |
| (8) | Forever 21, Bass Pro and H&M Annual U/W Rent and Annual U/W Rent PSF represent percentage in-lieu of rent based on the tenants’ TTM 7/31/2023 sales. |
| (9) | Non-Major Tenants includes three tenants, The North Face, Brooks Brothers, and True Religion, totaling 15,717 SF (1.1% of Owned SF), with lease start dates in June 2024, May 2024, and February 2024, respectively. |
| (10) | Occupied Collateral Total Annual U/W Rent PSF are based on the Owned SF and excludes NRSF and Annual U/W Rent from the leased fee tenant, Live Casino Hotel. |
| THE INFORMATION IN THIS STRUCTURAL AND COLLATERAL TERM SHEET IS NOT COMPLETE AND MAY BE AMENDED PRIOR TO THE TIME OF SALE. THIS TERM SHEET IS NOT AN OFFER TO SELL THESE SECURITIES AND IT IS NOT A SOLICITATION OF AN OFFER TO BUY THESE SECURITIES IN ANY JURISDICTION WHERE THE OFFER OR SALE IS NOT PERMITTED. | ||
| 51 | ||
| Retail – Super Regional Mall | Loan #2 | Cut-off Date Balance: | $90,000,000 | |
| 7000 and 7600 Arundel Mills Circle | Arundel Mills and Marketplace | Cut-off Date LTV: | 41.4% | |
| Hanover, MD 21076 | U/W NCF DSCR: | 1.98x | ||
| U/W NOI Debt Yield: | 16.1% |
The following table presents a summary of sales and occupancy costs for certain tenants at the Arundel Mills and Marketplace Property:
Sales and Occupancy Cost Summary(1)
| 2019 Sales (PSF) | 2020 Sales (PSF) | 2021 Sales (PSF) | 2022 Sales (PSF) | TTM 7/31/2023 Sales (PSF) | TTM 7/31/2023 Occupancy Cost(2) | |
| Live Casino Hotel(3) | $643,538,000 | $463,348,000 | $723,949,000 | $785,282,000 | $782,430,000 | 1.2% |
| Cinemark(4) | $756,958 | $146,750 | $382,500 | $588,875 | $690,661 | 26.3% |
| Dave & Buster’s | $233.44 | $108.61 | $223.33 | $251.94 | $258.58 | 17.5% |
| Primark | NAV | NAV | NAV | NAV | NAV | NAV |
| Forever 21 | $189.96 | $116.30 | $243.82 | $209.63 | $185.42 | 24.4% |
| Bass Pro | $280.45 | $322.68 | $347.17 | $346.38 | $350.56 | 2.5% |
| The Children’s Place | $201.58 | $99.44 | $209.50 | $180.49 | $175.94 | 22.7% |
| Old Navy | $281.56 | $157.54 | $286.94 | $257.30 | $257.59 | 16.2% |
| Michael Kors | $974.64 | $569.01 | $787.20 | $895.93 | $816.75 | 16.6% |
| H&M | $279.71 | $185.50 | $315.68 | $309.37 | $291.65 | 10.8% |
| Off Broadway Shoes | $216.62 | $124.50 | $222.15 | $229.26 | $212.70 | 17.2% |
| Medieval Times | $159.17 | $29.30 | $73.71 | $154.85 | $177.06 | 8.8% |
| (1) | Information obtained from the borrowers. |
| (2) | Occupancy cost calculation includes percentage in lieu and percentage rent. |
| (3) | Live Casino Hotel is the ground lessee and owns it improvements, therefore sales are shown as the total dollar amount. |
| (4) | Cinemark sales are based on 24 screens. |
The following table presents certain information relating to the lease rollover schedule at the Arundel Mills and Marketplace Property:
Lease Expiration Schedule(1)(2)
| Year Ending December 31, | No. of Leases Expiring | Expiring NRSF | % of Total NRSF | Cumulative Expiring NRSF | Cumulative % of Total NRSF | Annual U/W Base Rent(3) | % of Total Annual U/W Base Rent | Annual U/W Base Rent PSF(3)(4) |
| MTM | 6 | 13,206 | 0.7% | 13,206 | 0.7% | $832,702 | 2.1% | $63.05 |
| 2023 | 5 | 12,698 | 0.7% | 25,904 | 1.3% | $608,878 | 1.5% | $47.95 |
| 2024 | 42 | 145,714 | 7.5% | 171,618 | 8.9% | $5,321,562 | 13.2% | $36.52 |
| 2025 | 26 | 249,150 | 12.8% | 420,768 | 21.7% | $7,710,372 | 19.2% | $30.95 |
| 2026 | 23 | 418,423 | 21.6% | 839,191 | 43.3% | $7,077,611 | 17.6% | $16.91 |
| 2027 | 24 | 103,687 | 5.3% | 942,878 | 48.6% | $4,697,690 | 11.7% | $45.31 |
| 2028 | 16 | 113,056 | 5.8% | 1,055,934 | 54.5% | $3,708,472 | 9.2% | $32.80 |
| 2029 | 14 | 56,297 | 2.9% | 1,112,231 | 57.4% | $2,542,768 | 6.3% | $45.17 |
| 2030 | 6 | 21,905 | 1.1% | 1,134,136 | 58.5% | $931,272 | 2.3% | $42.51 |
| 2031 | 2 | 6,199 | 0.3% | 1,140,335 | 58.8% | $265,149 | 0.7% | $42.77 |
| 2032 | 1 | 30,641 | 1.6% | 1,170,976 | 60.4% | $300,000 | 0.7% | $9.79 |
| 2033 | 9 | 182,701 | 9.4% | 1,353,677 | 69.8% | $3,399,377 | 8.5% | $18.61 |
| 2034 & Beyond | 3 | 561,071 | 28.9% | 1,914,748 | 98.8% | $2,816,711 | 7.0% | $42.60 |
| Vacant | 0 | 24,235 | 1.2% | 1,938,983 | 100.0% | $0 | 0.0% | $0.00 |
| Total/Weighted Average | 177 | 1,938,983 | 100.0% | $40,212,565 | 100.0% | $27.78(5) |
| (1) | Information is based on the underwritten rent roll as of June 15, 2023. |
| (2) | Certain tenants may have lease termination options that are exercisable prior to the stated expiration date of the subject lease or leases which are not considered in the lease expiration schedule. |
| (3) | Annual U/W Base Rent and Annual U/W Base Rent PSF includes percentage in-lieu of rent totaling $3,023,713 and rent steps totaling $604,665 through September 2024. |
| (4) | The Annual U/W Base Rent PSF is based on the Owned SF and excludes rent from the leased fee tenant, Live Casino Hotel. |
| (5) | Total/Weighted Average Annual U/W Base Rent PSF excludes vacant space. |
The following table presents historical occupancy percentages at the Arundel Mills and Marketplace Property:
Historical Occupancy(1)(2)
12/31/2019(3) | 12/31/2020(3) | 12/31/2021(3) | 12/31/2022(3) | 6/15/2023(4) |
| 98.2% | 94.2% | 93.2% | 97.2% | 98.3% |
| (1) | Information obtained from the Arundel Mills and Marketplace borrowers. |
| (2) | Occupancy represents the occupancy excluding the square footage from the leased fee tenant, Live Casino Hotel, and is based on the Owned SF. Occupancy as of 6/15/2023 based on the total SF is 98.8%. |
| (3) | Occupancy figures excludes temporary tenants. |
| (4) | Information obtained from the underwritten rent roll. |
| THE INFORMATION IN THIS STRUCTURAL AND COLLATERAL TERM SHEET IS NOT COMPLETE AND MAY BE AMENDED PRIOR TO THE TIME OF SALE. THIS TERM SHEET IS NOT AN OFFER TO SELL THESE SECURITIES AND IT IS NOT A SOLICITATION OF AN OFFER TO BUY THESE SECURITIES IN ANY JURISDICTION WHERE THE OFFER OR SALE IS NOT PERMITTED. | ||
| 52 | ||
| Retail – Super Regional Mall | Loan #2 | Cut-off Date Balance: | $90,000,000 | |
| 7000 and 7600 Arundel Mills Circle | Arundel Mills and Marketplace | Cut-off Date LTV: | 41.4% | |
| Hanover, MD 21076 | U/W NCF DSCR: | 1.98x | ||
| U/W NOI Debt Yield: | 16.1% |
Operating History and Underwritten Net Cash Flow. The following table presents certain information relating to the historical operating performance and underwritten net cash flow at the Arundel Mills and Marketplace Property:
Cash Flow Analysis
| 2019 | 2020 | 2021 | 2022 | TTM 8/31/2023 | U/W | %(1) | U/W $ per SF | |
| Base Rent | $36,140,448 | $33,938,041 | $33,271,004 | $32,940,359 | $34,871,979 | $36,584,187 | 48.5% | $18.87 |
| Rent Steps | 0 | 0 | 0 | 0 | 0 | 604,665(2) | 0.8 | 0.31 |
| Percentage in Lieu | 2,164,224 | 2,365,569 | 4,167,022 | 3,784,601 | 2,469,932 | 3,023,713(3) | 4.0 | 1.56 |
| Grossed Up Vacant Space | 0 | 0 | 0 | 0 | 0 | 1,028,517 | 1.4 | 0.53 |
| Gross Potential Rent | $38,304,672 | $36,303,610 | $37,438,026 | $36,724,960 | $37,341,911 | $41,241,082 | 54.7% | $21.27 |
| Percentage Rent | 5,808,460 | 3,354,054 | 7,437,689 | 8,482,789 | 8,559,268 | 8,491,820(4) | 11.3 | 4.38 |
| Temp Tenant Income | 3,342,965 | 2,264,738 | 3,091,587 | 3,631,703 | 3,339,445 | 3,339,445 | 4.4 | 1.72 |
| Reimbursement Revenue | 22,032,762 | 21,644,732 | 21,147,941 | 20,262,474 | 20,258,479 | 21,856,710 | 29.0 | 11.27 |
| Other Revenue(5) | 582,524 | 112,149 | 367,765 | 406,519 | 454,130 | 454,130 | 0.6 | 0.23 |
| Net Rental Income | $70,071,383 | $63,679,283 | $69,483,008 | $69,508,445 | $69,953,233 | $75,383,187 | 100.0% | $38.88 |
| Less Free Rent & Credit Loss | (226,840) | (6,402,854) | (81,074) | 475,767 | (228,717) | 0 | 0.0 | 0.00 |
| Less Vacancy | 0 | 0 | 0 | 0 | 0 | (1,028,517) | (2.5)(6) | (0.53) |
| Effective Gross Income | $69,844,543 | $57,276,429 | $69,401,934 | $69,984,212 | $69,724,516 | $74,354,670 | 98.6% | $38.35 |
| Real Estate Taxes | $5,088,710 | $5,406,023 | $5,550,627 | $3,310,098 | $5,186,899 | $5,186,899 | 7.0% | $2.68 |
| Insurance | 506,729 | 593,510 | 625,192 | 703,339 | 759,782 | 759,782 | 1.0 | 0.39 |
| Management Fee | 2,849,028 | 2,385,373 | 2,769,663 | 2,901,210 | 2,782,838 | 1,000,000 | 1.3 | 0.52 |
| Other Expenses | 9,351,475 | 6,605,356 | 8,438,365 | 10,319,309 | 9,469,263 | 9,469,263 | 12.7 | 4.88 |
| Total Expenses | $17,795,942 | $14,990,262 | $17,383,847 | $17,233,956 | $18,198,782 | $16,415,944 | 22.1% | $8.47 |
| Net Operating Income | $52,048,601(7) | $42,286,167(7) | $52,018,087(7) | $52,750,256 | $51,525,734(8) | $57,938,726(8) | 77.9% | $29.88 |
| TI/LC | 0 | 0 | 0 | 0 | 0 | 2,102,842 | 2.8 | 1.08 |
| Capital Expenditures | 0 | 0 | 0 | 0 | 0 | 278,330 | 0.4 | 0.14 |
| Net Cash Flow | $52,048,601 | $42,286,167 | $52,018,087 | $52,750,256 | $51,525,734 | $55,557,554 | 74.7% | $28.65 |
| NOI DSCR(9) | 1.85x | 1.50x | 1.85x | 1.88x | 1.83x | 2.06x | ||
| NCF DSCR(9) | 1.85x | 1.50x | 1.85x | 1.88x | 1.83x | 1.98x | ||
| NOI Debt Yield(9) | 14.5% | 11.7% | 14.4% | 14.7% | 14.3% | 16.1% | ||
| NCF Debt Yield(9) | 14.5% | 11.7% | 14.4% | 14.7% | 14.3% | 15.4% |
| (1) | Represents (i) percent of Net Rental Income for all revenue fields, (ii) percent of Gross Potential Rent for Vacancy and Free Rent & Credit Loss and (iii) percent of Effective Gross Income for all other fields. |
| (2) | Represents rent steps through September 2024. |
| (3) | Percentage in Lieu rents are underwritten based on the tenants’ TTM 7/31/2023 sales. |
| (4) | Primarily comprised of percentage rent paid by Live Casino Hotel, which equates to 1% of retail and gaming gross revenues, less percentage rent allowance of $1,500,000. The underwritten Live Casino Hotel percentage rent is $6,324,300, which is based on TTM 7/31/2023 sales. |
| (5) | Other Revenue includes revenue from tenant services, media, and telecom. |
| (6) | Represents the underwritten economic vacancy %. The Arundel Mills and Marketplace Property was 98.3% occupied based on the Owned SF as of June 15, 2023. |
| (7) | The decrease in YE 2019 NOI to YE 2020 NOI and subsequent increase to YE 2021 NOI was primarily driven by an increase in bad debt/collection loss in 2020 due to the effect of the novel coronavirus pandemic. |
| (8) | The increase from the TTM NOI to the U/W NOI is driven by 18 new and renewal leases commencing in 2023 and 2024 totaling 113,039 SF (5.8% of Owned SF and 8.3% of underwritten rent) and underwritten rent steps of $604,665. |
| (9) | Debt service coverage ratios and debt yields are based on the Arundel Mills and Marketplace Whole Loan. |
| THE INFORMATION IN THIS STRUCTURAL AND COLLATERAL TERM SHEET IS NOT COMPLETE AND MAY BE AMENDED PRIOR TO THE TIME OF SALE. THIS TERM SHEET IS NOT AN OFFER TO SELL THESE SECURITIES AND IT IS NOT A SOLICITATION OF AN OFFER TO BUY THESE SECURITIES IN ANY JURISDICTION WHERE THE OFFER OR SALE IS NOT PERMITTED. | ||
| 53 | ||
| Retail – Super Regional Mall | Loan #2 | Cut-off Date Balance: | $90,000,000 | |
| 7000 and 7600 Arundel Mills Circle | Arundel Mills and Marketplace | Cut-off Date LTV: | 41.4% | |
| Hanover, MD 21076 | U/W NCF DSCR: | 1.98x | ||
| U/W NOI Debt Yield: | 16.1% |
Appraisal. The appraiser concluded to an “As-is” value for the Arundel Mills and Marketplace Property of $870,600,000 as of September 1, 2023.
Environmental Matters. According to the Phase I environmental site assessments dated September 25, 2023 and September 29, 2023, there was no evidence of any recognized environmental conditions at the Arundel Mills and Marketplace Property.
Market Overview and Competition. The Arundel Mills and Marketplace Property is located in Hanover, Maryland, approximately 13.1 miles south of Baltimore and 28.9 miles north of Washington, D.C. According to the appraisal, the neighborhood is primarily comprised of retail and residential uses with the property anchoring a dominant commercial corridor. Primary access to the area is provided by State Highway 100, which is adjacent to the property and had a traffic count of approximately 74,222 vehicles per day, and Interstate 295, which is approximately 2 miles from the property. According to the appraisal, the top five employers in the surrounding area are Fort Meade, Johns Hopkins University, Johns Hopkins Hospital, University of Maryland Medical Systems, and University System of Maryland.
Within a one-, three-, and five-mile radius of the Arundel Mills and Marketplace Property, the 2022 average household income was approximately $148,021, $145,352, and $145,096, respectively; and within the same radius, the 2022 estimated population was 9,168, 53,846, 155,847 respectively.
According to a third-party market research report, the property is situated within the BWI/Anne Arundel retail submarket of the Baltimore retail market. As of November 2023, the submarket reported total inventory of approximately 4.4 million SF with a 1.1% vacancy rate and average rents of $27.55 PSF.
The following table presents certain information relating to the appraiser’s market rent conclusions for the Arundel Mills and Marketplace Property:
Market Rent Summary(1)
| Market Rent (PSF) | Lease Term (Yrs.) | Rent Increase Projections | New Tenant Improvements | |
| Less Than <1,000 SF | $85.00 | 7 | 3.0% annually | $65.00 |
| 1,000-2,499 SF | $44.00 | 7 | 3.0% annually | $65.00 |
| 2,500-4,999 SF | $32.50 | 7 | 3.0% annually | $65.00 |
| 5,000-9,999 SF | $37.50 | 7 | 3.0% annually | $65.00 |
| Over 10,000 SF | $36.50 | 7 | 3.0% annually | $65.00 |
| Jewelry | $91.00 | 7 | 3.0% annually | $65.00 |
| Food Court | $202.50 | 7 | 3.0% annually | $65.00 |
| Restaurant | $39.00 | 7 | 3.0% annually | $150.00 |
| Kiosk | $385.00 | 7 | 3.0% annually | $0.00 |
| Jr. Anchor | $21.50 | 10 | 10.0% Mid-Term | $100.00 |
| Major | $22.50 | 10 | 10.0% Mid-Term | $100.00 |
| Anchor | $7.25 | 10 | 10.0% Mid-Term | $0.00 |
| Movie Theater | $31.00 | 10 | 10.0% Mid-Term | $65.00 |
| Grocery Anchor(2) | $15.00 | 20 | 10.0% every 5 years | $15.00 |
| Junior Anchor(2) | $17.00 | 10 | 10.0% Mid-Term | $15.00 |
| Large Inline(2) | $40.00 | 5 | 3.0% annually | $20.00 |
| (1) | Information obtained from the appraisal. |
| (2) | Market rent conclusions for Arundel Marketplace. |
| THE INFORMATION IN THIS STRUCTURAL AND COLLATERAL TERM SHEET IS NOT COMPLETE AND MAY BE AMENDED PRIOR TO THE TIME OF SALE. THIS TERM SHEET IS NOT AN OFFER TO SELL THESE SECURITIES AND IT IS NOT A SOLICITATION OF AN OFFER TO BUY THESE SECURITIES IN ANY JURISDICTION WHERE THE OFFER OR SALE IS NOT PERMITTED. | ||
| 54 | ||
| Retail – Super Regional Mall | Loan #2 | Cut-off Date Balance: | $90,000,000 | |
| 7000 and 7600 Arundel Mills Circle | Arundel Mills and Marketplace | Cut-off Date LTV: | 41.4% | |
| Hanover, MD 21076 | U/W NCF DSCR: | 1.98x | ||
| U/W NOI Debt Yield: | 16.1% |
The table below presents certain information relating to comparable retail centers pertaining to the Arundel Mills and Marketplace Property identified by the appraiser:
Competitive Set(1)
| Property Name | Year Built/Renovated | Total NRA | Total Occupancy | Anchor / Major Tenants | Distance to Arundel Mills and Marketplace Property |
| Arundel Mills and Marketplace | 2000; 2002; 2012/NAP | 1,938,983(2) | 98.3%(2) | Live Casino Hotel, Bass Pro, Burlington, Dave & Buster’s, Medieval Times and Cinemark | |
| Marley Station | 1987/2006 | 1,086,384 | 55.7% | Macy’s, JCPenney | 9.0 miles |
| Waugh Chapel Towne Centre | 2012/NAP | 662,717 | 97.1% | Wegmans, Target, Dick’s Sporting Goods, Regal Waugh Chapel | 13.0 miles |
| The Mall in Columbia | 1971/2018 | 1,439,872 | 91.7% | Macy’s, JCPenney, Nordstrom, AMC Columbia 14, Lidl | 13.2 miles |
| Security Square Mall | 1900/1998 | 1,345,170 | 97.8% | Macy’s, Burlington, AMC Security Square 8 | 16.2 miles |
| The Gallery at Harborplace | 1980/2019 | 327,774 | 50.4% | NAV | 12.6 miles |
| Westfield Wheaton | 1958/2016 | 1,522,828 | 97.2% | Macy’s, Target, Costco Wholesale, JCPenney | 27.6 miles |
| Weighted Average | 89.3% |
| (1) | Information obtained from the appraisal, unless otherwise specified. |
| (2) | Information based on the underwritten rent roll as of June 15, 2023 and occupancy is based on the Owned SF. Total Occupancy based on total SF is 98.8% |
Escrows.
Real Estate Taxes – After the occurrence of a Control Event (as defined below) or during a Lockbox Event Period (as defined below), or at any time (x) any property taxes are not paid by the borrowers prior to the assessment of a penalty, or (y) upon request of the lender, the borrowers fail to promptly provide evidence that property taxes have been paid prior to a penalty, the loan documents require the borrowers to make monthly payments into the real estate tax reserve in an amount equal to 1/12th of the property taxes that the lender reasonably estimates will be payable during the ensuing 12 months.
Insurance – After the occurrence of a Control Event or during a Lockbox Event Period, if the borrowers have not provided satisfactory evidence to the lender that the property is covered by policies that are being maintained as part of a reasonably acceptable blanket insurance policies, the loan documents require the borrowers to make ongoing monthly deposits in an amount equal to 1/12th of the insurance premiums that the lender reasonably estimates will be payable for the renewal of the coverage afforded by the policy in order to accumulate sufficient funds to pay the premiums at least 30 days prior to expiration.
Replacement Reserve – After the occurrence of a Control Event or during the Lockbox Event Period, the loan documents require springing ongoing monthly deposits of $39,430 for replacement reserves.
TI/LC Reserve – The loan documents require ongoing monthly deposits of $231,942 for tenant improvements and leasing commissions reserves, subject to a cap of $5,566,608, provided that no such cap shall apply during a Lockbox Event Period.
Gap Rent Reserve – The loan documents require an upfront deposit of $587,891 for gap and free rent related to Kids Empire, Brooks Brothers, and Komma Tea.
Outstanding TI/LC Reserve – The loan documents require an upfront deposit of $3,796,478 for outstanding tenant improvements and leasing commissions related to Primark, Under Armour, Kids Empire, Adidas, The North Face, Brooks Brothers, Vera Bradley, Spencer’s, and Movado Company Store.
A “Control Event” will occur upon Simon Property Group, L.P. or Simon Property Group, Inc. not owning at least 50% of the direct or indirect interests in the borrowers or not controlling the borrowers.
Lockbox and Cash Management. The Arundel Mills and Marketplace Whole Loan is structured with a hard lockbox and springing cash management. The borrowers are required to deposit all rents into a lender controlled lockbox account within two business days of receipt, and to direct all tenants to make direct rent deposits into the lockbox account. As long as a Lockbox Event Period is not in effect, all funds in the lockbox account are required to be distributed to the borrowers weekly. During the continuance of a Lockbox Event Period, all funds in the lockbox will be transferred weekly to a lender controlled cash management account to be disbursed in accordance with the cash management waterfall set forth in the loan documents, with any excess funds required to be held as additional security in an excess cash flow subaccount controlled by the lender for so long as the Lockbox Event Period continues.
| THE INFORMATION IN THIS STRUCTURAL AND COLLATERAL TERM SHEET IS NOT COMPLETE AND MAY BE AMENDED PRIOR TO THE TIME OF SALE. THIS TERM SHEET IS NOT AN OFFER TO SELL THESE SECURITIES AND IT IS NOT A SOLICITATION OF AN OFFER TO BUY THESE SECURITIES IN ANY JURISDICTION WHERE THE OFFER OR SALE IS NOT PERMITTED. | ||
| 55 | ||
| Retail – Super Regional Mall | Loan #2 | Cut-off Date Balance: | $90,000,000 | |
| 7000 and 7600 Arundel Mills Circle | Arundel Mills and Marketplace | Cut-off Date LTV: | 41.4% | |
| Hanover, MD 21076 | U/W NCF DSCR: | 1.98x | ||
| U/W NOI Debt Yield: | 16.1% |
A “Lockbox Event Period” will commence upon the earlier of the following:
| (i) | the occurrence of an event of default; |
| (ii) | any bankruptcy action of the borrowers; |
| (iii) | a bankruptcy action of the manager if the manager is an affiliate of the borrowers, and provided the manager is not replaced within 60 days with a qualified manager; |
| (iv) | the net operating income debt yield (“NOI DY”), based on the trailing four calendar quarter period, is below 10.5%, for two consecutive calendar quarters; or |
| (v) | the occurrence of a Major Tenant Trigger Event (as defined below). |
A Lockbox Event Period will end upon the occurrence of the following:
| ● | with regard to clause (i), the cure of such event of default; |
| ● | with regard to clause (ii) and (iii), the borrowers replace the manager with a qualified manager under a replacement management agreement within 60 days, or the bankruptcy proceeding is discharged or dismissed within 90 days without any adverse consequences to the property or loan; |
| ● | with regard to clause (iv), the NOI DY, based on the trailing four calendar quarter period, is 10.5% or greater, for two consecutive calendar quarters; or |
| ● | with regard to clause (v), a Major Tenant Trigger Cure (as defined below). |
A “Major Tenant Trigger Event” will commence upon the occurrence of any of the following:
| (i) | Bass Pro Shops, Cinemark, Live Casino Hotel or any replacement tenant occupying at least 50% of the space (a “Major Tenant”) filing for bankruptcy; |
| (ii) | a Major Tenant going dark or vacating on a permanent basis (other than closures due to renovation, closures less than 90 days or closures mandated by law or COVID stay-at-home orders); or |
| (iii) | a Major Tenant failing to give notice to renew its lease by the earlier of (a) the requirement under the lease or (b) 6 months’ prior to the lease expiration. |
An “Major Tenant Trigger Event Cure” will commence upon the occurrence of any of the following:
| ● | with regard to clause (i), Major Tenant has assumed and any applicable bankruptcy court has affirmed such assumption of the Major Tenant lease, and Major Tenant is in occupancy of its full space; |
| ● | with regard to clause (ii), the applicable Major Tenant continuously operates its business for at least 30 consecutive days during normal business hours and is paying full rent as is required under the lease; |
| ● | with regard to clause (iii), the date on which Major Tenant renews and/or extends its lease, at least 50% of the applicable Major Tenant space has been leased to one or more new tenants, the applicable Major Tenant Threshold Amount (as defined below) has been deposited in the excess cash reserve account; or |
| ● | With regard to clauses (i)-(iii) the guarantor has delivered to lender a guaranty in the applicable Major Tenant Threshold Amount. |
“Major Tenant Threshold Amount” means, (i) with respect to the Bass Pro Shops space, the amount of $6,383,600, (ii) with respect to Cinemark space, the amount of $5,359,500 and (iii) with respect to the space occupied by Live Casino Hotel, the amount of $13,037,450.
Additional Secured Indebtedness (not including trade debts). The Arundel Mills and Marketplace Property also secures the Arundel Mills and Marketplace Serviced Pari Passu Companion Loans, which have an aggregate Cut-off Date principal balance of $270,000,000. The Arundel Mills and Marketplace Serviced Pari Passu Companion Loans accrue interest at the same rate as the Arundel Mills and Marketplace Mortgage Loan. The Arundel Mills and Marketplace Mortgage Loan is entitled to payments of principal and interest on a pro rata and pari passu basis with the Arundel Mills and Marketplace Serviced Pari Passu Companion Loans. The holders of the Arundel Mills and Marketplace Mortgage Loan and the Arundel Mills and Marketplace Serviced Pari Passu Companion Loans have entered into a co-lender agreement which sets forth the allocation of collections on the Arundel Mills and Marketplace Whole Loan. See “Description of the Mortgage Pool—The Whole Loans—The Serviced Pari Passu Whole Loans” in the prospectus.
Property Management. The Arundel Mills and Marketplace Property is managed by Simon Management Associates II, LLC, an affiliate of the borrowers.
Partial Release. Provided that no event of default exists and a Control Event has not occurred, (I) with respect to a partial prepayment, at any time prior to the date that is two years after the closing date of the securitization that includes the last note to be securitized (the “REMIC Prohibition Period”), and (II) with respect to a partial defeasance, at any time after the earlier to occur of (a) December 1, 2026, and (b) the expiration of the REMIC Prohibition Period, the Arundel Mills and Marketplace Whole Loan documents permit the release of Arundel Marketplace, which has an allocated loan amount of $11,000,000, upon defeasance or prepayment (together with, if prior to the open period, payment of a prepayment fee equal to the greater of 1.00% of the amount prepaid and a yield maintenance premium), as applicable, of 100% of such allocated loan amount of $11,000,000, provided the following conditions, among others, are satisfied: (i) (a) lender’s determination that the post-release debt yield for the remaining mortgaged property is equal to or greater than the pre-release debt yield for the mortgaged property, or (b) borrowers’ partial defeasance or partial prepayment of the Arundel Mills and Marketplace Mortgage Whole Loan in an amount that would result in the post-release debt yield for the remaining mortgaged property being equal to or greater than the pre-release debt yield for the mortgaged property; (ii) an opinion of counsel that the partial release satisfies REMIC related requirements; and (iii) if Arundel Marketplace is conveyed to an affiliate, (a) receipt of an officer’s certificate confirming that the intended primary use of Arundel Marketplace will not be exclusively for retail, (b) any tenants being
| THE INFORMATION IN THIS STRUCTURAL AND COLLATERAL TERM SHEET IS NOT COMPLETE AND MAY BE AMENDED PRIOR TO THE TIME OF SALE. THIS TERM SHEET IS NOT AN OFFER TO SELL THESE SECURITIES AND IT IS NOT A SOLICITATION OF AN OFFER TO BUY THESE SECURITIES IN ANY JURISDICTION WHERE THE OFFER OR SALE IS NOT PERMITTED. | ||
| 56 | ||
| Retail – Super Regional Mall | Loan #2 | Cut-off Date Balance: | $90,000,000 | |
| 7000 and 7600 Arundel Mills Circle | Arundel Mills and Marketplace | Cut-off Date LTV: | 41.4% | |
| Hanover, MD 21076 | U/W NCF DSCR: | 1.98x | ||
| U/W NOI Debt Yield: | 16.1% |
relocated to Arundel Marketplace from the mall property have been replaced with comparable tenants on comparable rental terms, (c) the release will not have a material adverse effect on the remaining mortgaged property and (d) a rent roll and leasing plan for the remaining mortgaged property and Arundel Marketplace.
Real Estate Substitution. Not permitted.
Subordinate and Mezzanine Indebtedness. None.
Ground Lease. None.
Rights of First Offer / Rights of First Refusal. None.
Letter of Credit. None.
Terrorism Insurance. The loan documents require that the “all risk” insurance policy required to be maintained by the borrowers provide coverage for terrorism in an amount equal to the full replacement cost of the property, as well as business interruption insurance covering no less than the 24-month period following the occurrence of a casualty event, together with a 12-month extended period of indemnity (provided that if TRIPRA or a similar statute is not in effect, the borrowers will not be obligated to pay terrorism insurance premiums in excess of two times the annual premium for the property and business interruption/rental loss insurance coverage). See “Risk Factors—Risks Relating to the Mortgage Loans—Terrorism Insurance May Not Be Available for All Mortgaged Properties” in the prospectus.
| THE INFORMATION IN THIS STRUCTURAL AND COLLATERAL TERM SHEET IS NOT COMPLETE AND MAY BE AMENDED PRIOR TO THE TIME OF SALE. THIS TERM SHEET IS NOT AN OFFER TO SELL THESE SECURITIES AND IT IS NOT A SOLICITATION OF AN OFFER TO BUY THESE SECURITIES IN ANY JURISDICTION WHERE THE OFFER OR SALE IS NOT PERMITTED. | ||
| 57 | ||
| Retail – Super Regional Mall | Loan #3 | Cut-off Date Balance: | $75,000,000 | |
| 7007 Friars Road | Fashion Valley Mall | Cut-off Date LTV: | 31.5% | |
| San Diego, CA 92108 | U/W NCF DSCR: | 3.15x | ||
| U/W NOI Debt Yield: | 18.7% |
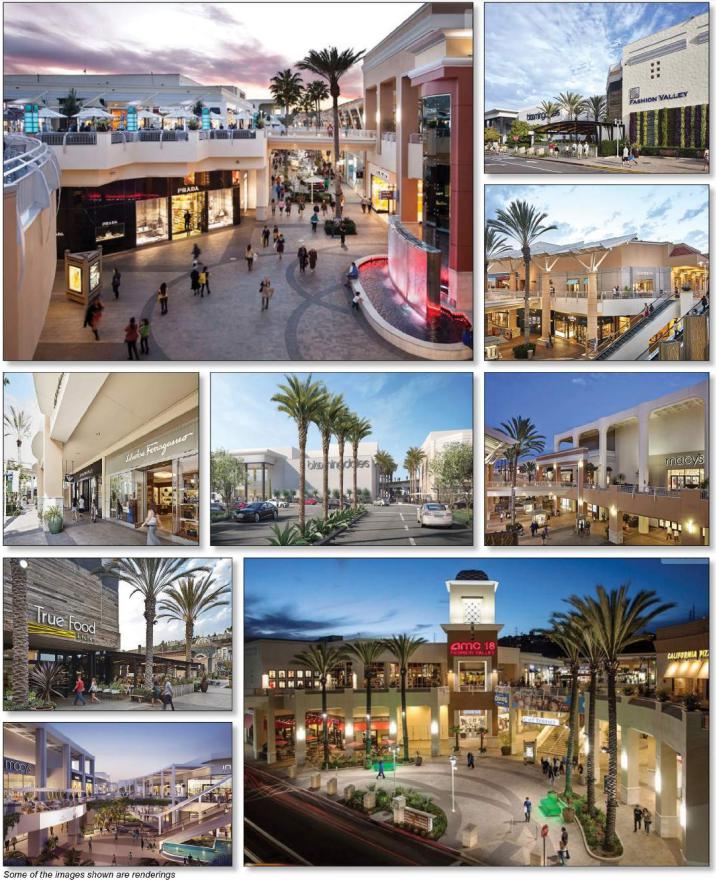
| THE INFORMATION IN THIS STRUCTURAL AND COLLATERAL TERM SHEET IS NOT COMPLETE AND MAY BE AMENDED PRIOR TO THE TIME OF SALE. THIS TERM SHEET IS NOT AN OFFER TO SELL THESE SECURITIES AND IT IS NOT A SOLICITATION OF AN OFFER TO BUY THESE SECURITIES IN ANY JURISDICTION WHERE THE OFFER OR SALE IS NOT PERMITTED. | ||
| 58 | ||
| Retail – Super Regional Mall | Loan #3 | Cut-off Date Balance: | $75,000,000 | |
| 7007 Friars Road | Fashion Valley Mall | Cut-off Date LTV: | 31.5% | |
| San Diego, CA 92108 | U/W NCF DSCR: | 3.15x | ||
| U/W NOI Debt Yield: | 18.7% |
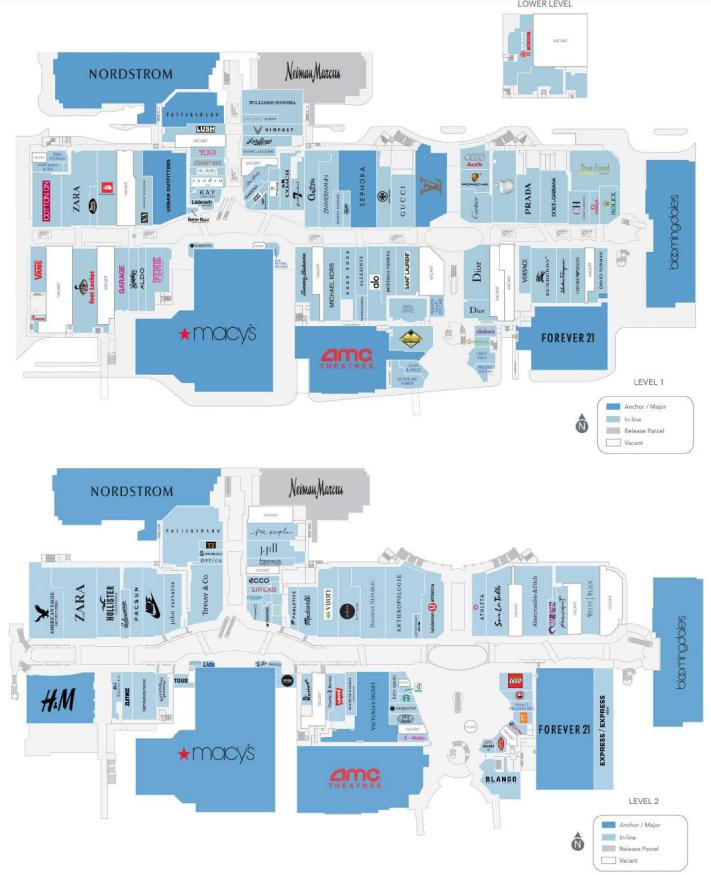
| THE INFORMATION IN THIS STRUCTURAL AND COLLATERAL TERM SHEET IS NOT COMPLETE AND MAY BE AMENDED PRIOR TO THE TIME OF SALE. THIS TERM SHEET IS NOT AN OFFER TO SELL THESE SECURITIES AND IT IS NOT A SOLICITATION OF AN OFFER TO BUY THESE SECURITIES IN ANY JURISDICTION WHERE THE OFFER OR SALE IS NOT PERMITTED. | ||
| 59 | ||
| Retail – Super Regional Mall | Loan #3 | Cut-off Date Balance: | $75,000,000 | |
| 7007 Friars Road | Fashion Valley Mall | Cut-off Date LTV: | 31.5% | |
| San Diego, CA 92108 | U/W NCF DSCR: | 3.15x | ||
| U/W NOI Debt Yield: | 18.7% |

| THE INFORMATION IN THIS STRUCTURAL AND COLLATERAL TERM SHEET IS NOT COMPLETE AND MAY BE AMENDED PRIOR TO THE TIME OF SALE. THIS TERM SHEET IS NOT AN OFFER TO SELL THESE SECURITIES AND IT IS NOT A SOLICITATION OF AN OFFER TO BUY THESE SECURITIES IN ANY JURISDICTION WHERE THE OFFER OR SALE IS NOT PERMITTED. | ||
| 60 | ||
| Retail – Super Regional Mall | Loan #3 | Cut-off Date Balance: | $75,000,000 | |
| 7007 Friars Road | Fashion Valley Mall | Cut-off Date LTV: | 31.5% | |
| San Diego, CA 92108 | U/W NCF DSCR: | 3.15x | ||
| U/W NOI Debt Yield: | 18.7% |
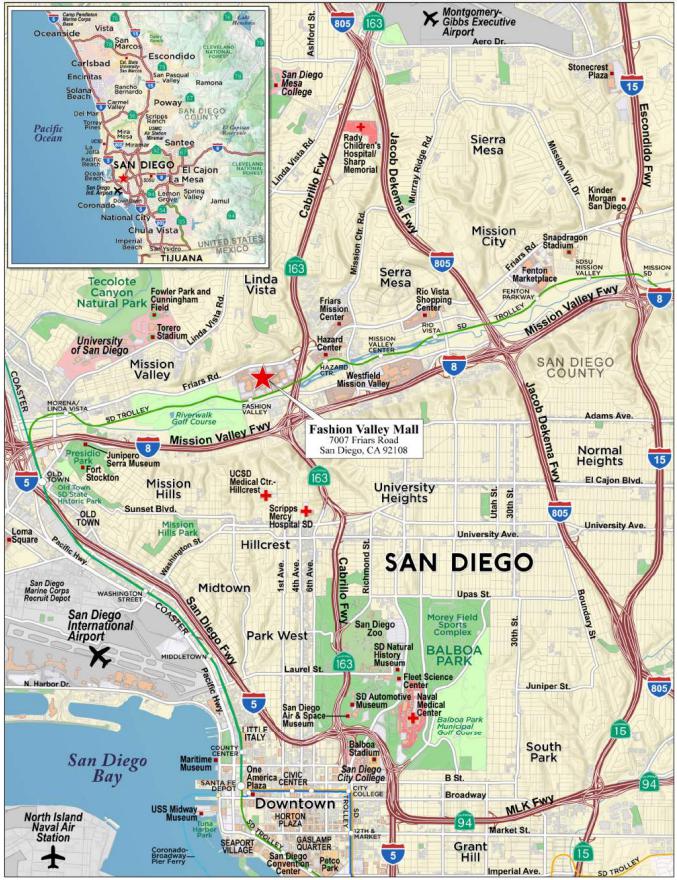
| THE INFORMATION IN THIS STRUCTURAL AND COLLATERAL TERM SHEET IS NOT COMPLETE AND MAY BE AMENDED PRIOR TO THE TIME OF SALE. THIS TERM SHEET IS NOT AN OFFER TO SELL THESE SECURITIES AND IT IS NOT A SOLICITATION OF AN OFFER TO BUY THESE SECURITIES IN ANY JURISDICTION WHERE THE OFFER OR SALE IS NOT PERMITTED. | ||
| 61 | ||
| No. 3 – Fashion Valley Mall |
| Mortgage Loan Information | Mortgaged Property Information | ||||||
| Mortgage Loan Seller: | Bank of America, National Association, Morgan Stanley Mortgage Capital Holdings LLC | Single Asset/Portfolio: | Single Asset | ||||
| Credit Assessment (Fitch/KBRA/Moody’s): | AAAsf/AAA(sf)/Aaa(sf) | Property Type – Subtype: | Retail – Super Regional Mall | ||||
| Original Principal Balance(1): | $75,000,000 | Location: | San Diego, CA | ||||
| Cut-off Date Balance(1): | $75,000,000 | Size: | 1,377,155 SF | ||||
| % of Initial Pool Balance: | 8.2% | Cut-off Date Balance Per SF(1): | $326.76 | ||||
| Loan Purpose: | Refinance | Maturity Date Balance Per SF(1): | $326.76 | ||||
| Borrower Sponsor: | Simon Property Group, L.P. | Year Built/Renovated(5): | 1969/2023 | ||||
| Guarantors: | Simon Property Group, L.P. and PPF Retail, LLC | Title Vesting: | Fee | ||||
| Mortgage Rate: | 5.7300% | Property Manager: | Simon Management Associates, LLC (borrower-related) | ||||
| Note Date: | May 25, 2023 | Current Occupancy (As of)(5): | 94.0% (5/15/2023) | ||||
| Seasoning: | 6 months | YE 2022 Occupancy(5): | 96.7% | ||||
| Maturity Date: | June 1, 2033 | YE 2021 Occupancy(5): | 98.0% | ||||
| IO Period: | 120 months | YE 2020 Occupancy(5): | 96.1% | ||||
| Loan Term (Original): | 120 months | As-Is Appraised Value(6): | $1,430,000,000 | ||||
| Amortization Term (Original): | NAP | As-Is Appraised Value Per SF(6): | $1,308.37 | ||||
| Loan Amortization Type: | Interest Only | As-Is Appraisal Valuation Date: | April 5, 2023 | ||||
| Call Protection(2): | L(30),D(84),O(6) | ||||||
| Lockbox Type: | Hard/Springing Cash Management | Underwriting and Financial Information | |||||
| Additional Debt(1)(3): | Yes | YE 2022 NOI: | $80,846,012 | ||||
| Additional Debt Type (Balance)(1)(3): | Pari Passu ($375,000,000) | YE 2021 NOI: | $79,065,945 | ||||
| YE 2020 NOI: | $72,772,653 | ||||||
| YE 2019 NOI: | $82,934,141 | ||||||
| U/W Revenues: | $103,974,716 | ||||||
| Escrows and Reserves(4) | U/W Expenses: | $19,972,427 | |||||
| Initial | Monthly | Cap | U/W NOI: | $84,002,289 | |||
| Taxes: | $0 | Springing | NAP | U/W NCF: | $82,302,958 | ||
| Insurance: | $0 | Springing | NAP | U/W DSCR based on NOI/NCF(1): | 3.21x / 3.15x | ||
| Replacement Reserves: | $0 | Springing | NAP | U/W Debt Yield based on NOI/NCF(1): | 18.7% / 18.3% | ||
| TI/LC Reserve: | $0 | Springing | NAP | U/W Debt Yield at Maturity based on NOI/NCF(1): | 18.7% / 18.3% | ||
| Gap Rent Reserve: | $4,458,079 | $0 | NAP | Cut-off Date LTV Ratio(1)(6): | 31.5% | ||
| Outstanding TI/LC: | $24,345,615 | $0 | NAP | LTV Ratio at Maturity(1)(6): | 31.5% | ||
| Sources and Uses | |||||||||
| Sources | Uses | ||||||||
| Whole Loan Amount | $450,000,000 | 100.0% | Loan Payoff | $417,362,939 | 92.7 | % | |||
| Reserves | 28,803,694 | 6.4 | |||||||
| Return of Equity | 2,571,188 | 0.6 | |||||||
| Closing Costs | 1,262,178 | 0.3 | |||||||
| Total Sources | $450,000,000 | 100.0% | Total Uses | $450,000,000 | 100.0 | % | |||
| (1) | The Fashion Valley Mall Mortgage Loan (as defined below) is part of the Fashion Valley Mall Whole Loan (as defined below), which is evidenced by 22 pari passu promissory notes with an aggregate principal balance as of the Cut-off Date of $450,000,000. The Cut-off Date Balance Per SF, Maturity Date Balance Per SF, U/W DSCR based on NOI/NCF, U/W Debt Yield based on NOI/NCF, U/W Debt Yield at Maturity based on NOI/NCF, Cut-off Date LTV Ratio and LTV Ratio at Maturity presented above are based on the Fashion Valley Mall Whole Loan. |
| (2) | Defeasance of the Fashion Valley Mall Whole Loan is permitted after the date that is the earlier of (i) two years from the closing date of the securitization that includes the last note to be securitized (the “REMIC Prohibition Period”) and (ii) May 25, 2026 (the “Permitted Release Date”). The assumed lockout period is based on the expected MSWF 2023-2 closing date in December 2023. The actual lockout period may be longer. If the Permitted Release Date has occurred but the REMIC Prohibition Period has not occurred, the borrower may prepay the Fashion Valley Mall Whole Loan in whole (but not in part) provided that such prepayment includes an amount equal to the yield maintenance premium. |
| (3) | The borrower utilized an approximately $2.5 million C-PACE loan to complete energy efficient upgrades at the Fashion Valley Mall Property (as defined below). The C-PACE loan has a 10-year term with final payment occurring in September 2025. The annual debt service is $312,351 and the remaining balance as of March 2023 was $866,043. The debt service is included as an assessment on the Fashion Valley Mall Property’s real estate tax bills and is a recoverable expense. |
| (4) | See “Escrows” below for further discussion of reserve requirements. |
| (5) | Historical occupancies include all tenants in place, Retail Development Program (“RDP”) tenants and excludes all Release Parcels (as defined below). As of May 15, 2023, the Fashion Valley Mall Property was 96.0% occupied inclusive of RDP tenants. RDP tenants have been excluded from the underwriting as RDP lease terms are for less than a year and can be terminated by the landlord at any time with 30 days’ notice. |
| (6) | The Appraised Value represents the hypothetical as-is value, which excludes the value attributed to Release Parcels. Based on the actual as-is value of $1,450,000,000, the Cut-off Date LTV Ratio and LTV Ratio at Maturity are 31.0% and 31.0%, respectively. See “Partial Release” below. |
| THE INFORMATION IN THIS STRUCTURAL AND COLLATERAL TERM SHEET IS NOT COMPLETE AND MAY BE AMENDED PRIOR TO THE TIME OF SALE. THIS TERM SHEET IS NOT AN OFFER TO SELL THESE SECURITIES AND IT IS NOT A SOLICITATION OF AN OFFER TO BUY THESE SECURITIES IN ANY JURISDICTION WHERE THE OFFER OR SALE IS NOT PERMITTED. | ||
| 62 | ||
| Retail – Super Regional Mall | Loan #3 | Cut-off Date Balance: | $75,000,000 | |
| 7007 Friars Road | Fashion Valley Mall | Cut-off Date LTV: | 31.5% | |
| San Diego, CA 92108 | U/W NCF DSCR: | 3.15x | ||
| U/W NOI Debt Yield: | 18.7% |
The Mortgage Loan. The third largest mortgage loan (the “Fashion Valley Mall Mortgage Loan”) is part of a whole loan (the “Fashion Valley Mall Whole Loan”) evidenced by 22 pari passu promissory notes in the aggregate original principal amount of $450,000,000. The Fashion Valley Mall Whole Loan was co-originated on May 25, 2023 by Bank of America, National Association (“BANA”), JPMorgan Chase Bank, National Association (“JPMCB”), Barclays Capital Real Estate Inc. (“Barclays”) and Bank of Montreal (“BMO”). The Fashion Valley Mall Mortgage Loan is evidenced by the non-controlling notes A-1-1-1 and A-1-4, originated by BANA, A-3-2 and A-4-5, originated by BMO and Barclays, respectively, and subsequently acquired by Morgan Stanley Mortgage Capital Holdings LLC, with an aggregate outstanding principal balance as of the Cut-off Date of $75,000,000. The remaining promissory notes comprising the Fashion Valley Mall Whole Loan are summarized in the below table. The Fashion Valley Mall Whole Loan will be serviced pursuant to the pooling and servicing agreement for the BBCMS 2023-C20 trust until the controlling note A-1-1 is securitized, whereupon the Fashion Valley Mall Whole Loan will be serviced pursuant to the pooling and servicing agreement for such future securitization. See “Description of the Mortgage Pool—The Whole Loans—The Non-Serviced Pari Passu Whole Loans” and “Pooling and Servicing Agreement—Servicing of the Non-Serviced Mortgage Loans-Servicing of the Fashion Valley Mall Mortgage Loan” in the prospectus.
Whole Loan Note Summary
| Notes | Original Balance | Cut-off Date Balance | Note Holder | Controlling Piece | |
| A-1-1 | $25,000,000 | $25,000,000 | BANA | Yes | |
| A-1-2, A-2-1-2, A-2-4 | $70,000,000 | $70,000,000 | BANK 2023-BNK46 | No | |
| A-1-3, A-3-3, A-4-2, A-4-3 | $82,500,000 | $82,500,000 | BBCMS 2023-C20 | No | |
| A-1-1-1, A-1-4, A-3-2, A-4-5 | $75,000,000 | $75,000,000 | MSWF 2023-2 | No | |
| A-2-1-1, A-2-2, A-2-3 | $85,000,000 | $85,000,000 | Benchmark 2023-B39 | No | |
| A-3-1, A-3-4, A-3-5 | $50,000,000 | $50,000,000 | BMO 2023-C6 | No | |
| A-3-6, A-4-1, A-4-4, A-4-6 | $62,500,000 | $62,500,000 | BBCMS 2023-C21 | No | |
| Total | $450,000,000 | $450,000,000 | |||
The Borrower and the Borrower Sponsor. The borrowing entity for the Fashion Valley Mall Whole Loan is Fashion Valley Mall, LLC, a Delaware limited liability company and single purpose entity with two independent directors. The borrower sponsor is Simon Property Group, L.P. (“Simon”) and the non-recourse carveout guarantors are Simon and PPF Retail, LLC (“PPF”). Simon and PPF’s liability as the non-recourse carveout guarantor (or if any affiliate of Simon is the non-recourse carveout guarantor) is limited to 20% ($90,000,000) of the original principal amount of the Fashion Valley Mall Whole Loan, plus all reasonable out-of-pocket costs and expenses incurred in the enforcement of the guaranty or preservation of the lenders’ rights under the guaranty. There is no separate environmental indemnity for the Fashion Valley Mall Whole Loan; however, environmental losses are a recourse carveout which is guaranteed by Simon and PPF (subject to the aforementioned 20% cap).
Simon is the operating partnership of Simon Property Group Inc. (NYSE: SPG / S&P: A-), which is in the ownership of shopping, dining, entertainment and mixed-use destinations and an S&P 100 company. As of December 31, 2022, Simon owned or had an interest in 230 properties comprising over 184 million square feet in North America, Asia and Europe. Simon also owns an 80% interest in The Taubman Realty Group (“TRG”), which owns 24 regional, super-regional and outlet malls in the U.S. and Asia. Additionally, as of December 31, 2022, Simon had a 22.4% ownership interest in Klépierre, a publicly traded, Paris-based real estate company, which owns shopping centers in 14 European countries. As of July 2023, Simon had an equity market capitalization of over $45 billion.
PPF is a real estate core fund managed by Morgan Stanley Real Estate Advisors. The fund is located in New York, New York and invests across the United States and targets investments in the retail, multi-family, office and industrial sectors. As of March 31, 2022, PPF managed 526 investments, with a total value of more than $44.4 billion in gross real estate assets.
The Property. The Fashion Valley Mall Property is a Class A, open-air, super-regional mall that was constructed in 1969 on an 81.44-acre plot of land in the Mission Valley section of San Diego, California. The Fashion Valley Mall Property consists of 1,377,155 square feet of net rentable area and provides parking via 7,512 surface parking and parking garage spaces (approximately 5.5 spaces per 1,000 square feet). The Fashion Valley Mall Property is home to six anchor department stores, including Neiman Marcus (excluded from underwriting), Bloomingdale’s, Nordstrom, Macy’s and JCPenney (excluded from underwriting), and an 18-screen AMC Theatres.
The parcels relating to the Neiman Marcus and JCPenney stores, including their related parking structures and spaces, are permitted to be freely released by the borrower, therefore all square footage and any rent for those tenants has been excluded in the lenders’ underwriting and no value has been given to either parcel in the appraised value. The information relating to the Fashion Valley Mall Property herein does not include either the Neiman Marcus or JCPenney parcels (each, a “Release Parcel”), unless otherwise expressly stated herein. See “Partial Release” below.
As of May 15, 2023, the Fashion Valley Mall Property was 94.0% leased by over 150 tenants and 96.0% leased including three additional RDP tenants. 859,488 square feet (62.4% of net rentable area) is occupied by the 14 anchor tenants, three of which are subject to ground leases under which the tenants own their improvements. As of the trailing 12-month period ending March 2023, the Fashion Valley Mall Property generated over $1.05 billion in total sales, and in-line sales of $1,424 per square foot (excluding Apple and Tesla). The Fashion Valley Mall Property is the only full-price location in the San Diego market for many retailers and restaurants, including Armani Exchange, Bloomingdale’s, Burberry, Cartier, Coach, Dior, Gucci, Hugo Boss, Neiman Marcus, Omega, Prada, Rolex, Saint Laurent, Salvatore Ferragamo and Tory Burch.
| THE INFORMATION IN THIS STRUCTURAL AND COLLATERAL TERM SHEET IS NOT COMPLETE AND MAY BE AMENDED PRIOR TO THE TIME OF SALE. THIS TERM SHEET IS NOT AN OFFER TO SELL THESE SECURITIES AND IT IS NOT A SOLICITATION OF AN OFFER TO BUY THESE SECURITIES IN ANY JURISDICTION WHERE THE OFFER OR SALE IS NOT PERMITTED. | ||
| 63 | ||
| Retail – Super Regional Mall | Loan #3 | Cut-off Date Balance: | $75,000,000 | |
| 7007 Friars Road | Fashion Valley Mall | Cut-off Date LTV: | 31.5% | |
| San Diego, CA 92108 | U/W NCF DSCR: | 3.15x | ||
| U/W NOI Debt Yield: | 18.7% |
The Fashion Valley Mall Property recently completed an estimated $84.9 million cosmetic renovation in the fourth quarter of 2023 that included removal of outdated architectural elements, installation of additional landscaping and an experiential water feature, replacement and relocation of escalators and elevators, renovations to restrooms, additions of outdoor cabana rooms, and the building of a landscaped park at the food court.
Major Tenants.
Nordstrom (220,486 square feet, 16.0% of NRA, 0.0% of underwritten base rent): Nordstrom (Moody’s/S&P/Fitch: Ba1/BB+/BBB-) was founded in 1901 as a retail shoe business in Seattle, Washington. Nordstrom offers an extensive selection of brand-name and private label merchandise for women, men, young adults and children and is focused on apparel, shoes, beauty, accessories and home goods. The Nordstrom-lease at the Fashion Valley Mall Property has an original commencement date of August 28, 1981 and ground lease expiration date of December 31, 2080. Nordstrom does not pay base rent but is responsible for Common Area and Maintenance (“CAM”) charges. Nordstrom’s reported sales at the Fashion Valley Mall Property were $147,000,000 for year-end 2022.
Bloomingdale’s (201,502 square feet, 14.6% of NRA, 0.05% of underwritten base rent): Founded in 1872 and headquartered in New York, New York, Bloomingdale’s (Moody’s/S&P/Fitch: Ba2/BB+/BBB-) is a department store chain with over 2,500 employees and 60 stores in the United States. Bloomingdale’s offers a variety of shopping services including stylists, beauty, gift shopping, tailoring and wedding registry. The Bloomingdale’s store at the Fashion Valley Mall Property is an original tenant at the Fashion Valley Mall Property from 1969. Bloomingdale’s has a ground lease expiration date of January 31, 2035 with three 15-year renewal options. Bloomingdale’s reported sales at the Fashion Valley Mall Property were $40,400,000 for year-end 2022.
Macy’s (196,120 square feet, 14.2% of NRA, 0.05% of underwritten base rent): Founded in 1858 and headquartered in New York, New York, Macy’s (Moody’s/S&P/Fitch: Ba2/BB+/BBB-) is a department store chain that operates approximately 725 stores in the United States and Washington, D.C., as well as Guam and Puerto Rico. Macy’s has three banners that include Macy’s, bluemercury, and Bloomingdale’s (and accompanying e-commerce sites), that sell men's, women's, and children's apparel and accessories, cosmetics, and home furnishings, among other merchandise. The Macy’s store at the Fashion Valley Mall Property is an original tenant at the Fashion Valley Mall Property since 1969. Macy’s has a ground lease expiration date of January 31, 2026 with two, 21-year renewal options remaining so long as there is no event of default. Macy’s reported sales at the Fashion Valley Mall Property were $51,000,000 for year-end 2022.
The following table presents certain information relating to the tenant sales at the Fashion Valley Mall Property:
Tenant Sales(1)(2)
| 2017 | 2018 | 2019 | 2020(3) | 2021 | 2022 | TTM March 2023 | ||
| Gross Mall Sales | $608,514,305 | $682,415,790 | $1,085,890,001 | $717,229,387 | $983,426,151 | $$1,050,104,045 | $$1,055,000,320 | |
| Gross Mall Sales (Ex-Apple / Tesla)(4) | $490,756,985 | $501,039,180 | $812,226,260 | $629,072,676 | $890,646,999 | $979,138,467 | $978,542,475 | |
| Sales PSF (Inline) | $1,235 | $1,410 | $1,675 | $1,095 | $1,503 | $$1,534 | $$1,599 | |
| Sales PSF (Inline, Ex-Apple / Tesla)(4) | $966 | $989 | $998 | $895 | $1,297 | $$1,378 | $$1,424 | |
| Occupancy Cost (Inline)(5) | 13.1% | 11.9% | 10.3% | 15.8% | 11.7% | 11.5% | 11.1% | |
| Occupancy Cost (Inline, Ex- Apple / Tesla)(4)(5) | 16.8% | 17.0% | 17.3% | 19.4% | 13.6% | 12.8% | 12.5% | |
| (1) | All sales information presented herein with respect to the Fashion Valley Mall Property is based upon information provided by the borrower sponsor. In certain instances, sales figures represent estimates because the tenants are not required to report, or otherwise may not have reported sales information on a timely basis. Further, because sales are self-reported, such information is not independently verified by the borrower sponsor. The sales information in this table includes the Release Parcels. Sales for anchor tenants were only provided between 2019 and 2022. TTM March 2023 anchor sales are for year-end 2022. |
| (2) | Inline tenants include those less than 10,000 square feet. |
| (3) | The Fashion Valley Mall Property was closed due to the COVID-19 pandemic from March 29, 2020 through May 23, 2020. |
| (4) | The Apple lease commenced on February 1, 2023. The Tesla lease expired on January 31, 2022. |
| (5) | Occupancy Cost is calculated by the sum of rent, percentage rent, CAM and taxes divided by annual sales. |
| THE INFORMATION IN THIS STRUCTURAL AND COLLATERAL TERM SHEET IS NOT COMPLETE AND MAY BE AMENDED PRIOR TO THE TIME OF SALE. THIS TERM SHEET IS NOT AN OFFER TO SELL THESE SECURITIES AND IT IS NOT A SOLICITATION OF AN OFFER TO BUY THESE SECURITIES IN ANY JURISDICTION WHERE THE OFFER OR SALE IS NOT PERMITTED. | ||
| 64 | ||
| Retail – Super Regional Mall | Loan #3 | Cut-off Date Balance: | $75,000,000 | |
| 7007 Friars Road | Fashion Valley Mall | Cut-off Date LTV: | 31.5% | |
| San Diego, CA 92108 | U/W NCF DSCR: | 3.15x | ||
| U/W NOI Debt Yield: | 18.7% |
The following table presents certain information relating to the major tenant sales at the Fashion Valley Mall Property:
Major Tenant Sales(1)
| Tenant Name | 2017 | 2018 | 2019 | 2020(2) | 2021 | 2022 | TTM March 2023 | TTM March 2023 Sales PSF/Screen |
| Nordstrom | N/A | N/A | $140,200,000 | $98,100,000 | $135,600,000 | $147,000,000 | $147,000,000 | $667 |
| Bloomingdale's | N/A | N/A | $39,200,000 | $23,500,000 | $39,200,000 | $40,400,000 | $40,400,000 | $200 |
| Macy's | N/A | N/A | $57,000,000 | $31,400,000 | $51,300,000 | $51,000,000 | $51,000,000 | $260 |
| Forever 21 | $11,925,965 | $11,976,850 | $10,716,695 | $5,952,591 | $10,081,242 | $8,133,078 | $7,558,543 | $141 |
| AMC Theatres | $10,517,462 | $12,823,064 | $11,531,806 | $4,257,851 | $4,274,855 | $8,769,754 | $8,674,735 | $481,930(3) |
| The Container Store | $10,450,544 | $9,597,623 | $9,861,732 | $7,571,965 | $11,483,773 | $11,346,954 | $10,946,269 | $448 |
| Zara | $14,422,358 | $14,978,373 | $17,324,258 | $12,031,385 | $19,974,922 | $27,250,373 | $27,873,804 | $1,283 |
| Pottery Barn | $7,453,111 | $6,644,660 | $6,762,824 | $5,612,810 | $7,815,960 | $9,311,118 | $9,321,064 | $468 |
| H&M | $8,601,793 | $7,292,426 | $7,681,442 | $5,924,805 | $7,965,235 | $8,670,202 | $8,576,263 | $608 |
| Victoria's Secret | $10,524,915 | $10,079,554 | $9,918,003 | $6,919,209 | $9,686,990 | $10,372,731 | $9,921,287 | $790 |
| (1) | All sales information presented herein with respect to the Fashion Valley Mall Property is based upon information provided by the borrower sponsor. In certain instances, sales figures represent estimates because the tenants are not required to report, or otherwise may not have reported sales information on a timely basis. Further, because sales are self-reported, such information is not independently verified by the borrower sponsor. TTM March 2023 anchor sales are for year-end 2022. |
| (2) | The Fashion Valley Mall Property was closed due to the COVID-19 pandemic from March 29, 2020 through May 23, 2020. |
| (3) | Based on AMC Theatres’ 18 screens. |
| THE INFORMATION IN THIS STRUCTURAL AND COLLATERAL TERM SHEET IS NOT COMPLETE AND MAY BE AMENDED PRIOR TO THE TIME OF SALE. THIS TERM SHEET IS NOT AN OFFER TO SELL THESE SECURITIES AND IT IS NOT A SOLICITATION OF AN OFFER TO BUY THESE SECURITIES IN ANY JURISDICTION WHERE THE OFFER OR SALE IS NOT PERMITTED. | ||
| 65 | ||
| Retail – Super Regional Mall | Loan #3 | Cut-off Date Balance: | $75,000,000 | |
| 7007 Friars Road | Fashion Valley Mall | Cut-off Date LTV: | 31.5% | |
| San Diego, CA 92108 | U/W NCF DSCR: | 3.15x | ||
| U/W NOI Debt Yield: | 18.7% |
The following table presents certain information relating to the major tenants at the Fashion Valley Mall Property:
Major Tenants(1)
| Tenant Name | Credit Rating (Moody’s/ S&P/Fitch)(2) | Tenant NRSF | % of NRSF | Annual U/W Base Rent PSF(1) | Annual U/W Base Rent(1) | % of Total Annual U/W Base Rent(1) | Sales PSF/ Year(3) | U/W Occ. Cost | Lease Expiration Date | Renewal | Term. Option (Y/N) |
| Anchor Tenants | |||||||||||
| Nordstrom(4) | Ba1/BB+/BBB- | 220,486 | 16.0% | $0.00 | $0 | 0.0% | $667 | 0.1% | 12/31/2080 | None | N |
| Bloomingdale's(4) | Ba2/BB+/BBB- | 201,502 | 14.6% | $0.17 | $33,450 | 0.05% | $200 | 0.4% | 1/31/2035 | 3 x 15 yr | N |
| Macy's(4) | Ba2/BB+/BBB- | 196,120 | 14.2% | $0.17 | $33,866 | 0.05% | $260 | 0.3% | 1/31/2026 | 2 x 21 yr | N |
| Anchor Tenants Subtotal / Wtd. Avg. | 618,108 | 44.9% | $0.11 | $67,316 | 0.1% | ||||||
| Junior Anchor Tenants | |||||||||||
| Forever 21 | NR/NR/NR | 53,787 | 3.9% | $34.32 | $1,845,796 | 2.5% | $141 | 25.3% | 1/31/2026 | None | N |
| AMC Theatres | Caa2/CCC+/NR | 51,610 | 3.7% | $30.25 | $1,561,203 | 2.1% | $481,930(5) | 23.6% | 12/31/2024 | 3 x 5 yr | N |
| The Container Store | NR/B/NR | 24,432 | 1.8% | $40.00 | $977,280 | 1.3% | $448 | 12.3% | 5/31/2030 | 1 x 5 yr | N |
| Zara(6) | NR/NR/NR | 21,726 | 1.6% | $104.38 | $2,267,760 | 3.1% | $1,283 | 12.5% | 9/30/2022 | None | N |
| Pottery Barn | NR/NR/NR | 19,920 | 1.4% | $55.81 | $1,111,639 | 1.5% | $468 | 22.7% | 1/31/2024 | None | N |
| H&M(6) | NR/BBB/NR | 14,106 | 1.0% | $67.13 | $946,934 | 1.3% | $608 | 21.6% | 1/31/2023 | None | N |
| Victoria's Secret | B1/BB-/NR | 12,559 | 0.9% | $159.88 | $2,007,925 | 2.8% | $790 | 27.4% | 1/31/2025 | None | N |
| Jr. Anchor Tenants Subtotal / Wtd. Avg. | 198,140 | 14.4% | $54.10 | $10,718,5361 | 14.7% | ||||||
| Remaining Occupied | 478,320 | 34.7% | $129.72 | $62,046,033 | 85.2% | ||||||
| Occupied Collateral Total/ Wtd. Avg. | 1,294,568 | 94.0% | $56.26 | $72,831,885 | 100.0% | ||||||
| Vacant Space | 82,587 | 6.0% | |||||||||
| Collateral Total | 1,377,155 | 100.0% | |||||||||
| (1) | Based on the underwritten rent roll dated May 15, 2023, inclusive of rent steps through May 2024 and overage and percent in lieu rent as of the 12 months ended March 2023 sales for certain tenants. |
| (2) | In certain instances, ratings provided are those of the parent company of the entity shown, whether or not the parent company guarantees the lease. |
| (3) | All sales information presented herein with respect to the Fashion Valley Mall Property is based upon information provided by the borrower sponsor as of the 12 months ended March 2023. In certain instances, sales figures represent estimates because the tenants are not required to report, or otherwise may not have reported sales information on a timely basis. Further, because sales are self-reported, such information is not independently verified by the borrower sponsor. Sales for anchor tenants are as of year-end 2022. |
| (4) | Nordstrom, Bloomingdale’s and Macy’s are subject to ground leases. Nordstrom does not pay base rent but is responsible for CAM charges. |
| (5) | Based on AMC Theatres’ 18 screens. |
| (6) | Leases for both Zara and H&M are subject to renewal. Both tenants are month to month and continue to pay rent. We cannot assure you whether or when either lease will be renewed. |
| THE INFORMATION IN THIS STRUCTURAL AND COLLATERAL TERM SHEET IS NOT COMPLETE AND MAY BE AMENDED PRIOR TO THE TIME OF SALE. THIS TERM SHEET IS NOT AN OFFER TO SELL THESE SECURITIES AND IT IS NOT A SOLICITATION OF AN OFFER TO BUY THESE SECURITIES IN ANY JURISDICTION WHERE THE OFFER OR SALE IS NOT PERMITTED. | ||
| 66 | ||
| Retail – Super Regional Mall | Loan #3 | Cut-off Date Balance: | $75,000,000 | |
| 7007 Friars Road | Fashion Valley Mall | Cut-off Date LTV: | 31.5% | |
| San Diego, CA 92108 | U/W NCF DSCR: | 3.15x | ||
| U/W NOI Debt Yield: | 18.7% |
The following table presents certain information relating to the lease rollover schedule at the Fashion Valley Mall Property:
Lease Expiration Schedule(1)(2)
| Year Ending December 31 | No. of Leases Expiring | Expiring NRSF | % of Total NRSF | Cumulative Expiring NRSF | Cumulative % of Total NRSF | Annual U/W Base Rent | % of Total Annual U/W Base Rent | Annual U/W Base Rent PSF |
| 2023 & MTM | 16 | 65,119 | 4.7% | 65,119 | 4.7% | $7,383,543 | 10.1% | $113.39 |
| 2024 | 21 | 138,793 | 10.1% | 203,912 | 14.8% | $9,777,149 | 13.4% | $70.44 |
| 2025 | 10 | 40,591 | 2.9% | 244,503 | 17.8% | $5,789,837 | 7.9% | $142.64 |
| 2026 | 8 | 268,169 | 19.5% | 512,672 | 37.2% | $4,432,342 | 6.1% | $16.53 |
| 2027 | 13 | 52,290 | 3.8% | 564,962 | 41.0% | $6,395,710 | 8.8% | $122.31 |
| 2028 | 16 | 56,510 | 4.1% | 621,472 | 45.1% | $7,440,994 | 10.2% | $131.68 |
| 2029 | 16 | 36,387 | 2.6% | 657,859 | 47.8% | $4,722,754 | 6.5% | $129.79 |
| 2030 | 17 | 89,563 | 6.5% | 747,422 | 54.3% | $9,430,718 | 12.9% | $105.30 |
| 2031 | 8 | 19,726 | 1.4% | 767,148 | 55.7% | $2,091,762 | 2.9% | $106.04 |
| 2032 | 8 | 24,906 | 1.8% | 792,054 | 57.5% | $2,871,986 | 3.9% | $115.31 |
| 2033 | 18 | 62,768 | 4.6% | 854,822 | 62.1% | $10,362,452 | 14.2% | $165.09 |
| 2034 & Beyond | 7 | 439,746 | 31.9% | 1,294,568 | 94.0% | $2,132,637 | 2.9% | $4.85 |
| Vacant | 0 | 82,587 | 6.0% | 1,377,155 | 100.0% | $0 | 0.0% | $0.00 |
| Total/Wtd. Avg. | 158 | 1,377,155 | 100.0% | $72,831,885 | 100.0% | $56.26(3) |
| (1) | Based on the underwritten rent roll dated May 15, 2023 inclusive of rent steps through May 2024 and overage and percent in lieu rent as of the 12 months ended March 2023 sales for certain tenants. |
| (2) | Certain tenants may have lease termination options that are exercisable prior to the stated expiration date of the subject lease or leases that are not considered in the Lease Expiration Schedule. |
| (3) | Total/Wtd. Avg. Annual U/W Base Rent PSF excludes vacant space. |
The following table presents historical occupancy percentages at the Fashion Valley Mall Property:
Historical Occupancy(1)
12/31/2020(2) | 12/31/2021(2) | 12/31/2022(2) | 5/15/2023(3) |
| 96.1% | 98.0% | 96.7% | 94.0% |
| (1) | Occupancy does not include the Release Parcels. |
| (2) | Historical occupancies are as of December 31 for each respective year and are inclusive of RDP tenants. |
| (3) | Current occupancy is as of May 15, 2023 and includes all tenants in place and tenants with signed leases as of the reporting period. The Fashion Valley Mall Property was 96.0% occupied inclusive of RDP tenants. RDP tenants have been excluded from the underwriting as RDP lease terms are for less than a year and can be terminated by the landlord at any time with 30 days’ notice. |
| THE INFORMATION IN THIS STRUCTURAL AND COLLATERAL TERM SHEET IS NOT COMPLETE AND MAY BE AMENDED PRIOR TO THE TIME OF SALE. THIS TERM SHEET IS NOT AN OFFER TO SELL THESE SECURITIES AND IT IS NOT A SOLICITATION OF AN OFFER TO BUY THESE SECURITIES IN ANY JURISDICTION WHERE THE OFFER OR SALE IS NOT PERMITTED. | ||
| 67 | ||
| Retail – Super Regional Mall | Loan #3 | Cut-off Date Balance: | $75,000,000 | |
| 7007 Friars Road | Fashion Valley Mall | Cut-off Date LTV: | 31.5% | |
| San Diego, CA 92108 | U/W NCF DSCR: | 3.15x | ||
| U/W NOI Debt Yield: | 18.7% |
Operating History and Underwritten Net Cash Flow. The following table presents certain information relating to the historical operating performance and underwritten net cash flow at the Fashion Valley Mall Property:
Cash Flow Analysis
| 2019 | 2020(1) | 2021 | 2022 | U/W(2) | % | (3) | U/W $ per SF | |
| Base Rent | $65,244,678 | $62,076,239 | $55,990,692 | $56,783,656 | $62,582,702(4) | 54.3 | % | $45.44 |
| Contractual Rent Steps(5) | 0 | 0 | 0 | 0 | 1,475,982 | 1.3 | 1.07 | |
| Overage Rent(6) | 2,964,021 | 2,858,448 | 7,036,298 | 8,776,710 | 6,515,626 | 5.7 | 4.73 | |
| Vacant Income | 0 | 0 | 0 | 0 | 9,925,306 | 8.6 | 7.21 | |
| Percentage Rent in Lieu(6) | 18,238 | 1,817,988 | 3,439,192 | 2,870,199 | 2,257,576 | 2.0 |
| 1.64 |
| Gross Potential Rent | $68,226,937 | $66,752,675 | $66,466,182 | $68,430,565 | $82,757,191 | 71.8 | % | $60.09 |
| Other Income(7) | 2,478,795 | 1,414,802 | 1,823,959 | 2,325,352 | 1,990,156 | 1.7 | 1.45 | |
| Total Reimbursements | 28,751,732 | 28,054,338 | 26,714,510 | 26,406,200 | 29,319,699 | 25.4 | 21.29 | |
| Temp Tenant Income | 2,674,141 | 1,598,280 | 2,629,279 | 3,201,937 | 1,227,157 | 1.1 | 0.89 | |
| Net Rental Income | $102,131,605 | $97,820,095 | $97,633,930 | $100,364,054 | $115,294,203 | 100.0 | % | $83.72 |
| Less Vacancy & Credit Loss | 427,991 | 8,190,545 | 614,970 | 219,541 | 11,319,487 | 13.7 |
| 8.22 |
| Effective Gross Income | $101,703,614 | $89,629,550 | $97,018,960 | $100,144,513 | $103,974,716 | 90.2 | % | $75.50 |
| Real Estate Taxes(8) | 6,240,843 | 6,504,302 | 6,409,444 | 6,573,617 | 6,835,547 | 6.6 | 4.96 | |
| Insurance | 1,221,624 | 1,463,511 | 1,667,073 | 1,857,588 | 2,051,070 | 2.0 | 1.49 | |
| Management Fee | 3,071,417 | 2,712,396 | 2,920,689 | 3,189,710 | 3,188,185 | 3.1 | 2.32 | |
| Other Operating Expenses | 8,235,589 | 6,176,688 | 6,955,809 | 7,677,586 | 7,897,625 | 7.6 |
| 5.73 |
| Total Operating Expenses | $18,769,473 | $16,856,897 | $17,953,015 | $19,298,501 | $19,972,427 | 19.2 | % | $14.50 |
| Net Operating Income | $82,934,141 | $72,772,653 | $79,065,945 | $80,846,012 | $84,002,289 | 80.8 | % | $61.00 |
| Replacement Reserves | 0 | 0 | 0 | 0 | 195,237 | 0.2 | 0.14 | |
| TI/LC | 0 | 0 | 0 | 0 | 1,504,094 | 1.4 |
| 1.09 |
| Net Cash Flow | $82,934,141 | $72,772,653 | $79,065,945 | $80,846,012 | $82,302,958 | 79.2 | % | $59.76 |
| NOI DSCR(9) | 3.17x | 2.78x | 3.02x | 3.09x | 3.21x | |||
| NCF DSCR(9) | 3.17x | 2.78x | 3.02x | 3.09x | 3.15x | |||
| NOI Debt Yield(9) | 18.4% | 16.2% | 17.6% | 18.0% | 18.7% | |||
| NCF Debt Yield(9) | 18.4% | 16.2% | 17.6% | 18.0% | 18.3% | |||
| (1) | The Fashion Valley Mall Property was closed due to the COVID-19 pandemic from March 29, 2020 through May 23, 2020. |
| (2) | Underwritten financials exclude all income and expenses related to the Release Parcels. Historical financials include the Release Parcels. |
| (3) | Represents (i) percent of Net Rental Income for all revenue fields, (ii) percent of Gross Potential Rent for Vacancy & Credit Loss and (iii) percent of Effective Gross Income for all other fields. |
| (4) | Based on the underwritten rent roll dated May 15, 2023, with adjustments made for executed leases, pending renewals and tenants that have given notice to vacate. |
| (5) | Contractual Rent Steps were taken through May 2024. |
| (6) | U/W Overage Rent and U/W Percentage Rent in Lieu are based on the terms of applicable leases using TTM March 2023 sales figures. |
| (7) | Other Income is based on the borrower sponsor’s projections. Includes media participation, Simon ad panels, and miscellaneous income. Underwritten parking income excludes $400,000 of projected gross parking income from the Neiman Marcus garage and $80,000 of projected parking income expenses are excluded from underwritten expenses too. |
| (8) | U/W Real Estate Taxes include debt service for the C-PACE loan to complete energy efficient upgrades at the Fashion Valley Mall Property, which is a recoverable expense. The C-PACE loan has a 10-year term with final payment occurring in September 2025. The annual debt service is $312,351 and the remaining balance as of March 2023 was $866,043. |
| (9) | Debt service coverage ratios and debt yields are based on the Fashion Valley Mall Whole Loan. |
Appraisal. The appraisal concluded to a “hypothetical as-is value”, which excludes the value attributed to Release Parcels, as of April 5, 2023 of $1,430,000,000. The “as-is value” including the Release Parcels is $1,450,000,000.
Environmental Matters. The Phase I environmental assessment dated April 10, 2023 identified a recognized environmental condition (the “REC”) at the Fashion Valley Mall Property in connection with a building used for automotive repair located at 6977 Friars Road, which is part of the Release Parcels. The REC was identified based on the duration of hazardous waste generation pertaining to automotive repair, limitations during the property inspection in which observation of the tenant space was not allowed, observations during 2020 reconnaissance, the potential of an unregistered gasoline underground storage tank and violations reported under compliance inspections from the San Diego County Department of Environmental Health (which have been cured). The lenders obtained a remedial cost estimate ranging from $157,603 to $1,579,956 to assess and remediate the auto service center for potential impacts. See “Description of the Mortgage Pool—Environmental Considerations” in the prospectus.
| THE INFORMATION IN THIS STRUCTURAL AND COLLATERAL TERM SHEET IS NOT COMPLETE AND MAY BE AMENDED PRIOR TO THE TIME OF SALE. THIS TERM SHEET IS NOT AN OFFER TO SELL THESE SECURITIES AND IT IS NOT A SOLICITATION OF AN OFFER TO BUY THESE SECURITIES IN ANY JURISDICTION WHERE THE OFFER OR SALE IS NOT PERMITTED. | ||
| 68 | ||
| Retail – Super Regional Mall | Loan #3 | Cut-off Date Balance: | $75,000,000 | |
| 7007 Friars Road | Fashion Valley Mall | Cut-off Date LTV: | 31.5% | |
| San Diego, CA 92108 | U/W NCF DSCR: | 3.15x | ||
| U/W NOI Debt Yield: | 18.7% |
Market Overview and Competition. The Fashion Valley Mall Property is located in San Diego, California, within the San Diego metropolitan statistical area (the “San Diego MSA”) and the West San Diego Beach submarket. The San Diego MSA is the second largest metropolitan area in California, behind Los Angeles, with a population of over three million people. The Fashion Valley Mall Property is located in a high-traffic corridor near Interstate 8 and Highway 163. It is the only true luxury center in San Diego County and draws affluent shoppers from a 20-mile radius, as well as tourists and international shoppers from Mexico.
According to the appraisal, the vacancy rate as of year-end 2022 was 6.2% for the San Diego retail market, and 3.4% for the West San Diego Beach submarket. The average asking rental rate for the same period was $32.39 per square foot for the San Diego retail market and $37.88 per square foot for the West San Diego Beach submarket. According to the appraisal, the estimated 2022 population within a five-, seven- and ten-mile radius was 526,945, 807,687 and 1,219,300, respectively. Additionally, for the same period, the average household income within the same radii was $107,685, $111,999 and $109,418, respectively.
The following table presents comparable retail centers with respect to the Fashion Valley Mall Property:
Comparable Retail Center Summary
| Property Name | Year Built / Renovated or Expanded | Total NRA (SF) | Total Occ. | Distance to Subject | Sales PSF | Major Tenants |
| Fashion Valley Mall | 1969 / 2023 | 1,377,155(1) | 94.0%(1) | NAP | $1,424(2) | Macy’s Bloomingdale’s Nordstrom Forever 21 |
| Westfield UTC | 1977 / 1997 | 1,189,411 | 96.0% | 6.0 miles | $1,237 | Macy’s Nordstrom Tesla |
| Westfield Mission Valley | 1960 / 2004 | 1,216,321 | 90.0% | 1.0 mile | $600 | Bloomingdale’s Outlet Macy’s Backstage Nordstrom Rack Target |
| Grossmont Center | 1961 / NAP | 939,000 | 88.0% | 9.0 miles | $473 | CVS Macy’s Target Walmart |
| Plaza Bonita | 1981 / 2007 | 1,029,029 | 85.0% | 11.7 miles | $593 | JCPenney Macy’s Nordstrom Rack |
| Chula Vista Center | 1962 / 2012 | 862,620 | 64.0% | 12.8 miles | $496 | Burlington JCPenney Macy’s |
Source: Third Party Report, unless stated otherwise.
| (1) | Information obtained from the underwritten rent roll dated May 15, 2023. |
| (2) | Represents sales per square foot as of TTM March 31, 2023 for in-line tenants (excluding Apple and Tesla). All sales information presented herein with respect to the Fashion Valley Mall Property is based upon information provided by the borrower sponsor. In certain instances, sales figures represent estimates because the tenants are not required to report, or otherwise may not have reported sales information on a timely basis. Further, because sales are self-reported, such information is not independently verified by the borrower sponsor. |
Escrows. At origination, the borrower deposited into escrow (i) $24,345,615 for outstanding tenant improvement allowances and leasing commissions and (ii) $4,458,079 for outstanding gap rent.
Tax Escrows – On a monthly basis after the occurrence of a Control Event (as defined below) or during the continuance of a Lockbox Event Period (as defined below) or at any time taxes are not paid by the borrower prior to the assessment of any penalty, the borrower is required to escrow 1/12th of the annual estimated tax payments payable during the next ensuing 12 months.
Insurance Escrows – After the occurrence of a Control Event or during the continuance of a Lockbox Event Period, except if the Fashion Valley Mall Property is insured under an acceptable blanket policy, the borrower is required to escrow 1/12th of the annual estimated insurance payments on a monthly basis.
Replacement Reserves – After the occurrence of a Control Event or during the continuance of a Lockbox Event Period, the borrower is required to escrow approximately $16,270 on a monthly basis for replacements and repairs to be made at the Fashion Valley Mall Property.
Rollover Reserves – After the occurrence of a Control Event or during the continuance of a Lockbox Event Period, the borrower is required to escrow approximately $125,341 on a monthly basis for ongoing leasing reserves.
A “Lockbox Event Period” means the period commencing upon the occurrence of (i) an event of default, (ii) bankruptcy action of the borrower or property manager (if the property manager is an affiliate of the borrower) and the property manager is not replaced within 60 days with a qualified manager, or (iii) the debt yield based on the trailing four calendar quarters is less than 12.0% for two consecutive calendar quarters. A Lockbox Event Period will end (a) with respect to clause (i) above, if the cure of the event of default
| THE INFORMATION IN THIS STRUCTURAL AND COLLATERAL TERM SHEET IS NOT COMPLETE AND MAY BE AMENDED PRIOR TO THE TIME OF SALE. THIS TERM SHEET IS NOT AN OFFER TO SELL THESE SECURITIES AND IT IS NOT A SOLICITATION OF AN OFFER TO BUY THESE SECURITIES IN ANY JURISDICTION WHERE THE OFFER OR SALE IS NOT PERMITTED. | ||
| 69 | ||
| Retail – Super Regional Mall | Loan #3 | Cut-off Date Balance: | $75,000,000 | |
| 7007 Friars Road | Fashion Valley Mall | Cut-off Date LTV: | 31.5% | |
| San Diego, CA 92108 | U/W NCF DSCR: | 3.15x | ||
| U/W NOI Debt Yield: | 18.7% |
has been accepted by the lenders, (b) with respect to clause (ii) above, if the property manager is replaced within 60 days or the bankruptcy action with respect to the property manager is dismissed within 90 days without adverse consequences to the Fashion Valley Mall Property, or (c) with respect to clause (iii) above, the debt yield based on the trailing four calendar quarters is greater than or equal to 12.0% for two consecutive calendar quarters; provided, however, that (A) no event of default or other Lockbox Event Period is continuing, (B) the borrower has paid all of the lenders’ reasonable expenses incurred in connection with the cure of such Lockbox Event Period, including reasonable attorney’s fees and expenses, (C) the borrower may not cure a Lockbox Event Period more than a total of five times in the aggregate during the term of the Fashion Valley Mall Whole Loan, and (D) in no event may the borrower cure a Lockbox Event Period caused by a bankruptcy action of the borrower.
A “Control Event” means if one or more of (i) Simon Property Group, Inc. and (ii) Simon Property Group, L.P. does not own at least 50% of the direct or indirect interests in the borrower or does not control the borrower.
Lockbox and Cash Management. The Fashion Valley Mall Whole Loan is structured with a hard lockbox and springing cash management. The borrower and property manager are required to direct the tenants to pay rent directly into the lockbox account, and to deposit any rents otherwise received in such account within two business days after receipt. During the continuance of a Lockbox Event Period, all funds in the lockbox account are required to be swept on a weekly basis and to a lender-controlled cash management account. Funds in the cash management account are required to be applied to debt service and the reserves and escrows described above, with any excess funds (i) to be deposited into an excess cash flow reserve account held by the lenders as cash collateral for the Fashion Valley Mall Whole Loan, or if (ii) no Lockbox Event Period is continuing, disbursed to the borrower.
Property Management. The Fashion Valley Mall Property is managed by Simon Management Associates, LLC, an affiliate of the borrower.
Partial Release. The borrower may obtain a release of one or more of the Release Parcels for no consideration, subject to the satisfaction of certain conditions including, but not limited to, (i) no event of default has occurred and is continuing, (ii) a Control Event has not occurred, (iii) the borrower delivers to the lenders evidence reasonably satisfactory to a prudent lender that the Release Parcel has been (or will be upon recordation of the applicable transfer documentation which will occur contemporaneously with the release of the Release Parcel) legally subdivided from the remainder of the Fashion Valley Mall Property and constitutes one or more separate tax lots, (iv) the Fashion Valley Mall Property will comply with all zoning laws and be serviced by adequate parking and access, (v) the borrower certifies to the lenders that the remaining property with all easements appurtenant and other permitted encumbrances thereto will not, strictly as a result of such transfer and release of the Release Parcel, be in violation of certain reciprocal easement agreements or any then applicable law, statute, rule or regulation, (vi) if the Release Parcel is conveyed to or owned by an affiliate of the borrower, the borrower will be required to satisfy certain affiliate Release Parcel conditions with respect to relocation and re-tenanting, and (vii) satisfaction of any REMIC release conditions.
Real Estate Substitution. Not permitted.
Subordinate and Mezzanine Indebtedness. None.
Letter of Credit. None.
Right of First Offer / Right of First Refusal. None.
Ground Lease. None.
Terrorism Insurance. The borrower is required to obtain and maintain property insurance and business interruption insurance for 24 months plus a 365-day extended period of indemnity. Such insurance is required to cover perils of terrorism and acts of terrorism. If the Terrorism Risk Insurance Program Reauthorization Act of 2015 is not in effect, the borrower will only be required to pay for terrorism insurance a maximum of two times the annual insurance premiums payable for the Fashion Valley Mall Property at the time with respect to the property and business income or rental income insurance interruption policies (excluding the terrorism and earthquake components of such premiums). See “Risk Factors—Risks Relating to the Mortgage Loans—Terrorism Insurance May Not Be Available for All Mortgaged Properties” in the prospectus.
| THE INFORMATION IN THIS STRUCTURAL AND COLLATERAL TERM SHEET IS NOT COMPLETE AND MAY BE AMENDED PRIOR TO THE TIME OF SALE. THIS TERM SHEET IS NOT AN OFFER TO SELL THESE SECURITIES AND IT IS NOT A SOLICITATION OF AN OFFER TO BUY THESE SECURITIES IN ANY JURISDICTION WHERE THE OFFER OR SALE IS NOT PERMITTED. | ||
| 70 | ||
| Hospitality – Full Service | Loan #4 | Cut-off Date Balance: | $61,666,666 | ||
| 1201 and 1113 Market Street | Philadelphia Marriott Downtown | Cut-off Date LTV: | 54.9% | ||
| Philadelphia, PA 19107 | U/W NCF DSCR: | 1.53x | |||
| U/W NOI Debt Yield: | 16.0% | ||||

| THE INFORMATION IN THIS STRUCTURAL AND COLLATERAL TERM SHEET IS NOT COMPLETE AND MAY BE AMENDED PRIOR TO THE TIME OF SALE. THIS TERM SHEET IS NOT AN OFFER TO SELL THESE SECURITIES AND IT IS NOT A SOLICITATION OF AN OFFER TO BUY THESE SECURITIES IN ANY JURISDICTION WHERE THE OFFER OR SALE IS NOT PERMITTED. | ||
| 71 | ||
| Hospitality – Full Service | Loan #4 | Cut-off Date Balance: | $61,666,666 | ||
| 1201 and 1113 Market Street | Philadelphia Marriott Downtown | Cut-off Date LTV: | 54.9% | ||
| Philadelphia, PA 19107 | U/W NCF DSCR: | 1.53x | |||
| U/W NOI Debt Yield: | 16.0% | ||||
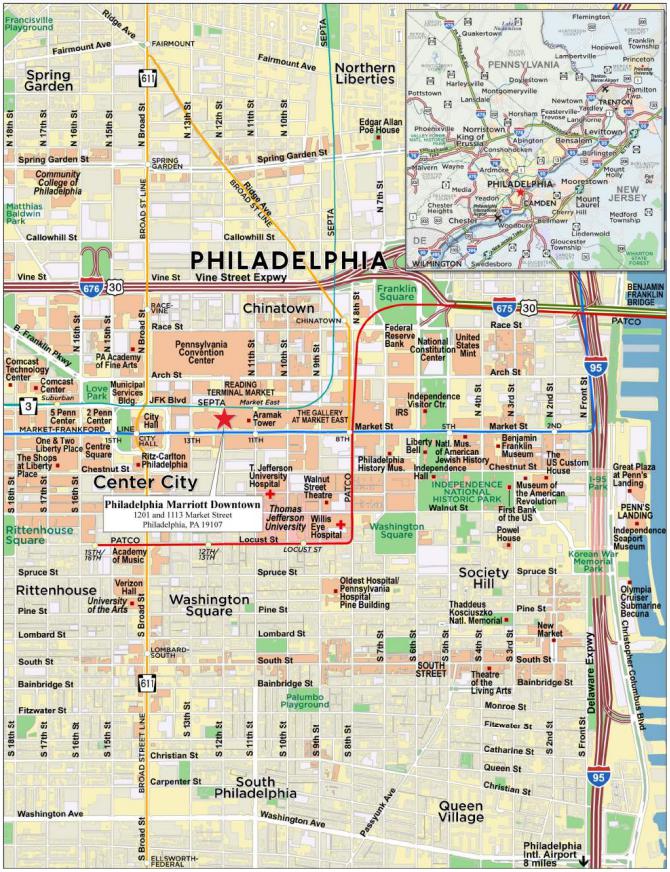
| THE INFORMATION IN THIS STRUCTURAL AND COLLATERAL TERM SHEET IS NOT COMPLETE AND MAY BE AMENDED PRIOR TO THE TIME OF SALE. THIS TERM SHEET IS NOT AN OFFER TO SELL THESE SECURITIES AND IT IS NOT A SOLICITATION OF AN OFFER TO BUY THESE SECURITIES IN ANY JURISDICTION WHERE THE OFFER OR SALE IS NOT PERMITTED. | ||
| 72 | ||
| No. 4 – Philadelphia Marriott Downtown |
| Mortgage Loan Information | Mortgaged Property Information | ||||||
| Mortgage Loan Seller: | Wells Fargo Bank, National Association | Single Asset/Portfolio: | Single Asset | ||||
Credit Assessment (Fitch/KBRA/Moody’s): | NR/NR/NR | Property Type – Subtype: | Hospitality – Full Service | ||||
| Original Principal Balance(1): | $61,666,666 | Location: | Philadelphia, PA | ||||
| Cut-off Date Balance(1): | $61,666,666 | Size: | 1,408 Rooms | ||||
| % of Initial Pool Balance: | 6.7% | Cut-off Date Balance Per Room(1): | $152,699 | ||||
| Loan Purpose: | Refinance | Maturity Date Balance Per Room(1): | $152,699 | ||||
| Borrower Sponsors: | Oaktree Capital Management, LLC, Clearview Hotel Capital, LLC and Host Hotels & Resorts, L.P. | Year Built/Renovated: | 1990;1995/2023 | ||||
| Guarantor: | Oaktree Real Estate Opportunities Fund VI, L.P. | Title Vesting(6): | Fee | ||||
| Mortgage Rate: | 8.7050% | Property Manager: | Marriott Hotel Services, LLC | ||||
| Note Date: | October 25, 2023 | Current Occupancy (As of): | 57.1% (9/30/2023) | ||||
| Seasoning: | 1 month | YE 2022 Occupancy: | 46.4% | ||||
| Maturity Date: | November 6, 2028 | YE 2021 Occupancy: | 20.6% | ||||
| IO Period: | 60 months | YE 2020 Occupancy: | 12.9% | ||||
| Loan Term (Original): | 60 months | YE 2019 Occupancy: | 80.3% | ||||
| Amortization Term (Original): | NAP | As-Is Appraised Value: | $391,300,000 | ||||
| Loan Amortization Type: | Interest Only | As-Is Appraised Value Per Room: | $277,912 | ||||
| Call Protection(2): | L(25),DorYM0.5(28),O(7) | As-Is Appraisal Valuation Date: | September 7, 2023 | ||||
| Lockbox Type: | Soft/Springing Cash Management | Underwriting and Financial Information | |||||
| Additional Debt: | Yes | TTM NOI (9/30/2023)(7): | $33,559,922 | ||||
| Additional Debt Type (Balance)(1)(3)(4): | Pari Passu ($153,333,334); Future Mezzanine | YE 2022 NOI(7): | $25,990,687 | ||||
| YE 2021 NOI(7): | ($2,422,803) | ||||||
| YE 2020 NOI(7): | ($10,617,103) | ||||||
| U/W Revenues: | $111,076,788 | ||||||
| U/W Expenses: | $76,576,225 | ||||||
| U/W NOI(7): | $34,500,562 | ||||||
| Escrows and Reserves(5) | U/W NCF: | $29,075,976 | |||||
| Initial | Monthly | Cap | U/W DSCR based on NOI/NCF(1): | 1.82x / 1.53x | |||
| Taxes: | $0 | Springing | NAP | U/W Debt Yield based on NOI/NCF(1): | 16.0% / 13.5% | ||
| Insurance: | $0 | Springing | NAP | U/W Debt Yield at Maturity based on NOI/NCF(1): | 16.0% / 13.5% | ||
| FF&E Reserve: | $0 | Springing | NAP | Cut-off Date LTV Ratio(1): | 54.9% | ||
| Other Reserve: | $0 | Springing | NAP | LTV Ratio at Maturity(1): | 54.9% | ||
| Sources and Uses | ||||||||||
| Sources | Uses | |||||||||
| Whole Loan Amount(1) | $215,000,000 | 89.9 | % | Loan Payoff | $237,270,647 | 99.2 | % | |||
| Borrower Sponsor Equity(8) | 24,286,718 | �� | 10.1 | Closing Costs | 2,016,071 | 0.8 | ||||
| Total Sources | $239,286,718 | 100.0 | % | Total Uses | $239,286,718 | 100.0 | % | |||
| (1) | The Philadelphia Marriott Downtown Mortgage Loan (as defined below) is part of the Philadelphia Marriott Downtown Whole Loan (as defined below), which is evidenced by 12 pari passu notes with an aggregate outstanding principal balance as of the Cut-off Date of $215,000,000. The financial information in the chart above is based on the aggregate outstanding balance as of the Cut-off Date of the Philadelphia Marriott Downtown Whole Loan. |
| (2) | The lockout period is required to be at least 25 payments beginning with and including the first payment date of December 6, 2023. After the earlier of (x) the date that is two years from the closing date of the securitization that includes the last note of the Philadelphia Marriott Downtown Whole Loan to be securitized and (y) October 25, 2026 (the “Lockout Expiration Date”), which is the date that is three years from the origination date of the Philadelphia Marriott Downtown Whole Loan, the borrowers may prepay the Philadelphia Marriott Downtown Whole Loan at any time in whole (but not in part), subject to payment of the yield maintenance premium if such prepayment occurs before May 6, 2028 (the “Permitted Prepayment Date”). In addition, the borrowers may defease the Philadelphia Marriott Downtown Whole Loan in whole (but not in part) after the Lockout Expiration Date and prior to the Permitted Prepayment Date. The assumed lockout period of 25 months is based on the expected closing date of the MSWF 2023-2 securitization in December 2023. The actual lockout period may be longer. |
| (3) | Each of the borrowers is the lender to a certain working capital loan to the Operating Lessee (as defined below) secured by, among other things, all of the Operating Lessee’s interest in and to the “Working Capital” at the Philadelphia Marriott Downtown Property (as defined below). In addition, there currently exist seven unsecured intercompany loans among the Downtown Borrower (as defined below) and various other affiliates of the borrowers. Each of the foregoing is subordinate to the Philadelphia Marriott Downtown Mortgage Loan. See “Description of the Mortgage Pool–Additional Indebtedness–Permitted Unsecured Debt and Other Debt” in the Prospectus. |
| (4) | See “Permitted Future Mezzanine or Secured Subordinate Indebtedness” Section. |
| (5) | See “Escrows” section. |
| (6) | The Philadelphia Marriott Downtown Whole Loan is secured by both the borrowers’ fee interest in the substantial portion of the Philadelphia Marriott Downtown Property as well as the borrowers’ subleasehold interest in the skybridge that connects the two buildings constituting the Philadelphia Marriott Downtown |
| THE INFORMATION IN THIS STRUCTURAL AND COLLATERAL TERM SHEET IS NOT COMPLETE AND MAY BE AMENDED PRIOR TO THE TIME OF SALE. THIS TERM SHEET IS NOT AN OFFER TO SELL THESE SECURITIES AND IT IS NOT A SOLICITATION OF AN OFFER TO BUY THESE SECURITIES IN ANY JURISDICTION WHERE THE OFFER OR SALE IS NOT PERMITTED. | ||
| 73 | ||
| Hospitality – Full Service | Loan #4 | Cut-off Date Balance: | $61,666,666 | ||
| 1201 and 1113 Market Street | Philadelphia Marriott Downtown | Cut-off Date LTV: | 54.9% | ||
| Philadelphia, PA 19107 | U/W NCF DSCR: | 1.53x | |||
| U/W NOI Debt Yield: | 16.0% | ||||
| Property with the Pennsylvania Convention Center and the parcel of land that allows an overhang and partial driveway that form part of the entrance to one of the two buildings. See “Ground Lease” below for additional information. |
| (7) | The increase from YE 2020 NOI and YE 2021 NOI, to YE 2022 NOI, TTM NOI (9/30/2023) and U/W NOI is primarily attributable to increases in room revenue and F&B revenue following impact of the COVID-19 pandemic in 2020 and 2021. Historical performance was largely impacted by the COVID-19 pandemic, during which the Philadelphia Marriott Downtown Property was closed from April 10, 2020 through May 27, 2021 and underwent extensive renovations including renovation of 1,408 guestrooms. |
| (8) | See “Description of the Mortgage Pool–Additional Indebtedness–Preferred Equity and Preferred Return Arrangements” in the Prospectus. |
The Mortgage Loan. The fourth largest mortgage loan (the “Philadelphia Marriott Downtown Mortgage Loan”) is part of a whole loan (the “Philadelphia Marriott Downtown Whole Loan”) secured by the borrowers’ fee and subleasehold interests in the Philadelphia Marriot Downtown, a 1,408 room full service hotel located in Philadelphia, Pennsylvania (the “Philadelphia Marriott Downtown Property”). The Philadelphia Marriott Downtown Mortgage Loan has an aggregate original principal balance and outstanding principal balance as of the Cut-off Date of $61,666,666. The Philadelphia Marriott Downtown Whole Loan is comprised of 12 pari passu notes, with an aggregate original principal balance and outstanding principal balance as of the Cut-off Date of $215,000,000 and was co-originated by Barclays Capital Real Estate Inc. (“Barclays”), JPMorgan Chase Bank, National Association (“JPMCB”) and Wells Fargo Bank, National Association (“WFB”) on October 25, 2023.
The table below summarizes the promissory notes that comprise the Philadelphia Marriott Downtown Whole Loan. The relationship between the holders of the Philadelphia Marriott Downtown Whole Loan will be governed by a co-lender agreement as described under “Description of the Mortgage Pool—The Whole Loans—The Non-Serviced Pari Passu Whole Loans” and “—The Whole Loans—The Outside Serviced Pari Passu Whole Loans” in the Prospectus. The Philadelphia Marriott Downtown Whole Loan will be serviced under the pooling and servicing agreement for BBCMS 2023-5C23. See “The Pooling and Servicing Agreement” in the Prospectus.
Whole Loan Summary
| Note | Original Balance | Cut-off Date Balance | Note Holder | Controlling Piece |
| A-1 | $55,000,000 | $55,000,000 | BBCMS 2023-5C23 | Yes |
| A-2 | $25,000,000 | $25,000,000 | Benchmark 2023-V4 | No |
| A-3 | $20,000,000 | $20,000,000 | MSWF 2023-2 | No |
| A-4 | $10,000,000 | $10,000,000 | BBCMS 2023-5C23 | No |
| A-5 | $15,000,000 | $15,000,000 | Benchmark 2023-V4 | No |
| A-6 | $15,000,000 | $15,000,000 | MSWF 2023-2 | No |
| A-7 | $6,666,667 | $6,666,667 | Barclays(1) | No |
| A-8 | $10,000,000 | $10,000,000 | Benchmark 2023-V4 | No |
| A-9 | $10,000,000 | $10,000,000 | BANK5 2023-5YR4 | No |
| A-10 | $26,666,666 | $26,666,666 | MSWF 2023-2 | No |
| A-11 | $10,000,000 | $10,000,000 | BANK5 2023-5YR4 | No |
| A-12 | $11,666,667 | $11,666,667 | JPMCB(1) | No |
| Total | $215,000,000 | $215,000,000 |
| (1) | The notes held by the lenders are expected to be contributed to one or more future securitization transactions or may otherwise be transferred at any time. |
The Borrowers and Borrower Sponsors. The borrowers, Philadelphia Market Street HMC Hotel Limited Partnership (the “Downtown Borrower”) and Philadelphia Market Street Marriott Hotel II Limited Partnership, are both Delaware limited partnerships. The borrower sponsors are Oaktree Capital Management, LLC (“Oaktree”), Clearview Hotel Capital, LLC (“Clearview”), and Host Hotels & Resorts, L.P. Oaktree and Clearview comprise the majority of the sponsorship and collectively hold an 89% interest in the Philadelphia Marriott Downtown Property while Host Hotels & Resorts, L.P. retains an 11% interest. The guarantor is the Oaktree Real Estate Opportunities Fund VI, L.P., a fund controlled by Oaktree Capital Management, L.P. Legal counsel to the borrowers delivered a non-consolidation opinion in connection with the origination of the Philadelphia Marriott Downtown Whole Loan.
Oaktree Capital Management, L.P. is an experienced global investment management firm that was founded in 1990 and 1995 with a primary focus on real assets. As of June 2023, Oaktree had $179 billion in assets under management, with over 1,100 employees across 21 offices across the world. Clearview Hotel Capital, LLC is a privately held hotel investment and advisory company focused on acquiring, renovating, and managing hotels in urban and unique areas. Since its founding in 2007, Clearview has acquired over $2.0 billion worth of hotels containing nearly 17,000 rooms and completed over $170 million in renovations. Host Hotels & Resorts, Inc. is the largest publicly traded lodging REIT. As of December 2022, Host Hotels & Resorts, Inc. owned 77 luxury and upper-upscale hotels.
The Property. The Philadelphia Marriott Downtown Property is a 23-story, 1,408-room full service hotel built in 1995 and most recently renovated from 2020 through 2023. The Philadelphia Marriott Downtown Property consists of two buildings: (i) a 23-story main tower with 1,198 rooms built in 1995, connected to the Pennsylvania Convention Center via a skybridge, and (ii) a nine-story building with 210 rooms built in 1893 as a railroad terminal building and converted to hospitality use in 1990. The nine-story building is part of a larger condominium regime that includes the Philadelphia Marriott Downtown Property (one unit) and two additional units consisting of a retail component and a public access space component. The borrower sponsors generally control the condominium association via an approximately 71% of the ownership interest in the common elements and approximately 82% of the voting rights in the related condominium association, and having the right to appoint two of the three board seats.
| THE INFORMATION IN THIS STRUCTURAL AND COLLATERAL TERM SHEET IS NOT COMPLETE AND MAY BE AMENDED PRIOR TO THE TIME OF SALE. THIS TERM SHEET IS NOT AN OFFER TO SELL THESE SECURITIES AND IT IS NOT A SOLICITATION OF AN OFFER TO BUY THESE SECURITIES IN ANY JURISDICTION WHERE THE OFFER OR SALE IS NOT PERMITTED. | ||
| 74 | ||
| Hospitality – Full Service | Loan #4 | Cut-off Date Balance: | $61,666,666 | ||
| 1201 and 1113 Market Street | Philadelphia Marriott Downtown | Cut-off Date LTV: | 54.9% | ||
| Philadelphia, PA 19107 | U/W NCF DSCR: | 1.53x | |||
| U/W NOI Debt Yield: | 16.0% | ||||
Since 2014, the Philadelphia Marriott Downtown Property has undergone several renovations, totaling approximately $46.8 million in investments from the borrower sponsors. The most recent $41.9 million renovation began in June 2020, during which time the Philadelphia Marriott Downtown Property was closed from April 10, 2020 through May 27, 2021. Over $31.1 million was invested in a full renovation of the 1,408 guestrooms beginning in 2020. The guestroom renovations included upgrades to meet the latest in Marriott brand standards, which include new case goods, soft goods and bathroom upgrades. An additional $7.4 million was invested to enhance public spaces, including a full lobby renovation.
The Philadelphia Marriott Downtown Property features a direct connection via a skybridge to the Pennsylvania Convention Center, the 14th largest exhibition space in the country. The Pennsylvania Convention Center is a multi-use public facility located one block away from the Philadelphia Marriott Downtown Property and is designed to accommodate large conventions, exhibitions, conferences and other events. Although the number of guests and events at the Pennsylvania Convention Center declined in 2021 due to closures related to the COVID-19 pandemic, 2022 saw the return of large in-person events. In 2022, the Pennsylvania Convention Center hosted 19 citywides (gatherings that generate 2,000 or more hotel room stays on a peak night) for the first time since 2019. In total, 2022 saw the Pennsylvania Convention Center report 224 events (including 19 citywides), gathering 494,300 attendees and generating 513,400 room nights. According to the appraisal, 223 events are planned to be held in 2023, including 14 citywide.
The Philadelphia Marriott Downtown Property features various amenities including an indoor swimming pool, a fitness center, a business center, a guest laundry room, a sundries shop, and vending and ice machines. Further, the Philadelphia Marriott Downtown Property also has four different food and beverage outlets: Circ Bar, Thirteen Restaurant, Center City Pantry and Liberty Lanes Pub. Circ Bar is located in the middle of the ground level and serves as a centralized social hub. Circ Bar serves lunch, dinner and also offers a full service bar. Thirteen Restaurant is open for breakfast, lunch and dinner. Breakfast is served buffet style with the food being a fusion between American and Mediterranean flavors. The space features both a covered outdoor patio and a private indoor dining area. Center City Pantry is located in the lobby of the Philadelphia Marriott Downtown Property and is a retail shop consisting of convenience items as well as freshly brewed coffee and bakery items. Center City Pantry also sells various snacks, ice cream, sandwiches and alcoholic beverages. Liberty Lanes Pub is a restaurant featuring duckpin bowling, billiards and seven large-screen TVs. The space serves specialty cocktails and light foods and is equipped to handle private events up to 120 people. The Philadelphia Marriott Downtown Property also includes the 1201 Innovation Lab, a re-purposed room intended to provide innovative tastings and food demonstrations for groups. The kitchen has a hydroponic garden system, a mushroom farm and a resident mixologist to develop cocktails tailored towards the guests’ themes and demographics. Additionally, a portion of the Philadelphia Marriott Downtown Property is leased to third party retail tenants, including FedEx, T-Mobile and Starbucks. Starbucks went dark in June 2023 but is required to pay rent through its lease expiration in February 2025.
As of September 30, 2023, the Philadelphia Marriott Downtown Property had a trailing 12-month occupancy of 57.1%, ADR of $230.42 and RevPAR of $131.55. Total revenue at the Philadelphia Marriott Downtown Property is comprised of four components: rooms (64.9% of underwritten revenue), food and beverage (30.2% of underwritten revenue), other operated departments (2.0% of underwritten revenue) and miscellaneous income (2.9% of underwritten revenue). According to the appraisal, the demand segmentation in 2022 for the Philadelphia Marriott Downtown Property was 70% meeting and group, 14% leisure, 14% commercial and 2% extended stay. The Philadelphia Marriott Downtown Property has over 93,000 square feet of conference space. The largest of its 72 distinct conference rooms/ballrooms is 34,000 square feet and accommodates up to 4,500 attendees. Other rooms include the Liberty Ballroom, The Gallery and the Independence Ballroom. The Liberty Ballroom is appropriate for weddings and receptions, featuring arched ceilings and an outdoor balcony overlooking Philadelphia. The Liberty Ballroom contains 6,000 square feet of space and can accommodate 650 wedding guests. The newest event space, The Gallery, is on the ground level and has access to both the street and the hotel. Inside is a large media wall and state-of-the-art audio equipment. The Independence Ballroom measures 2,640 square feet and is perfect for sit down gatherings with space for 280 guests in a cocktail-style event.
The following table presents certain information relating to the performance of the Philadelphia Marriott Downtown Property:
| Historical Occupancy, ADR, RevPAR | ||||||||||||
| Competitive Set(1)(2) | Philadelphia Marriott Downtown Property(3) | Penetration Factor | ||||||||||
| Year | Occupancy | ADR | RevPAR | Occupancy | ADR | RevPAR | Occupancy | ADR | RevPAR | |||
| 2019 | 70.4% | $187.17 | $131.76 | 80.3% | $196.81 | $158.12 | 114.1% | 105.2% | 120.0% | |||
| 2020 | 26.0% | $142.54 | $37.04 | 12.9% | $158.40 | $20.45 | 49.6% | 111.1% | 55.2% | |||
| 2021 | 35.1% | $159.20 | $55.80 | 20.6% | $181.77 | $37.37 | 58.7% | 114.2% | 67.0% | |||
| 2022 | 51.7% | $196.83 | $101.69 | 46.4% | $221.64 | $102.75 | 89.7% | 112.6% | 101.0% | |||
| 9/30/2023 TTM(4) | 54.9% | $204.08 | $112.11 | 57.1% | $230.42 | $131.55 | 104.0% | 112.9% | 117.3% | |||
| (1) | Data obtained from third-party hospitality research reports |
| (2) | The competitive set consists of the following hotels: Sonesta Philadelphia, DoubleTree by Hilton Hotel Philadelphia Center City, Sheraton Philadelphia Downtown, Westin Philadelphia, Philadelphia Marriott Old City, Loews Philadelphia and The Notary Hotel Autograph Collection. |
| (3) | Based on operating statements provided by the borrower sponsors. |
| (4) | TTM represents the trailing 12-month period ending September 30, 2023. |
| THE INFORMATION IN THIS STRUCTURAL AND COLLATERAL TERM SHEET IS NOT COMPLETE AND MAY BE AMENDED PRIOR TO THE TIME OF SALE. THIS TERM SHEET IS NOT AN OFFER TO SELL THESE SECURITIES AND IT IS NOT A SOLICITATION OF AN OFFER TO BUY THESE SECURITIES IN ANY JURISDICTION WHERE THE OFFER OR SALE IS NOT PERMITTED. | ||
| 75 | ||
| Hospitality – Full Service | Loan #4 | Cut-off Date Balance: | $61,666,666 | ||
| 1201 and 1113 Market Street | Philadelphia Marriott Downtown | Cut-off Date LTV: | 54.9% | ||
| Philadelphia, PA 19107 | U/W NCF DSCR: | 1.53x | |||
| U/W NOI Debt Yield: | 16.0% | ||||
The following table presents historical occupancy percentages at Philadelphia Marriott Downtown Property:
Historical Occupancy(1)
12/31/2019(2) | 12/31/2020(2) | 12/31/2021(2) | 12/31/2022(2) | 9/30/2023 |
| 80.3% | 12.9% | 20.6% | 46.4% | 57.1% |
| (1) | Information obtained from the borrowers. |
| (2) | The decrease in occupancy from 2019 to 2020 and subsequent increase from 2020 to 2021 and 2021 to 2022 was primarily due to the effect of the novel coronavirus on the hospitality industry in 2020, and the recovery in 2021. |
Operating History and Underwritten Net Cash Flow. The following table presents certain information relating to the historical operating performance and underwritten net cash flow at the Philadelphia Marriott Downtown Property:
Cash Flow Analysis(1)
| 2019 | 2020 | 2021 | 2022 | TTM 9/30/2023 | U/W | % of U/W Total Revenue(2) | U/W $ per Room | |
| Occupancy | 80.3% | 12.9% | 20.6% | 46.4% | 57.1% | 60.2% | ||
| ADR | $196.81 | $158.40 | $181.77 | $221.64 | $230.42 | $233.09 | ||
| RevPAR | $158.12 | $20.45 | $37.37 | $102.75 | $131.55 | $140.33 | ||
| Room Revenue | $81,261,150 | $10,536,633 | $19,204,417 | $52,802,945 | $67,604,104 | $72,120,141 | 64.9% | $51,222 |
| Food & Beverage Revenue | 34,561,479 | 4,102,758 | 4,438,021 | 26,806,221 | 33,363,703 | $33,501,795 | 30.2 | 23,794 |
| Other Departmental Income | 3,091,293 | 573,441 | 1,110,012 | 1,973,829 | 2,083,544 | $2,220,038 | 2.0 | 1,577 |
| Miscellaneous Income | 2,919,143 | 2,880,099 | 2,163,742 | 3,566,146 | 3,503,777 | $3,234,813 | 2.9 | 2,297 |
| Total Revenue | $121,833,065 | $18,092,932 | $26,916,192 | $85,149,141 | $106,555,128 | $111,076,788 | 100.0% | $78,890 |
| Room Expense | 20,634,509 | 5,629,182 | 5,684,824 | 13,171,864 | 16,448,709 | 17,085,119 | 23.7 | 12,134 |
| Food & Beverage Expense | 22,133,817 | 5,762,213 | 5,242,478 | 16,971,634 | 21,711,930 | 21,632,811 | 64.6 | 15,364 |
| Other Department Expense | 0 | 0 | 0 | 80,765 | 32,501 | 1 | 0.0 | 0 |
| Total Department Expenses | $42,768,326 | $11,391,395 | $10,927,302 | $30,224,262 | $38,193,140 | $38,717,931 | 34.9% | $27,499 |
| Departmental Profit | $79,064,739 | $6,701,536 | $15,988,890 | $54,924,879 | $68,361,988 | $72,358,857 | 65.1% | $51,391 |
| Total Undistributed Expenses | $24,497,194 | $11,215,882 | $11,592,653 | $21,303,490 | $25,043,963 | $25,443,716 | 22.9% | $18,071 |
| Gross Operating Profit | $54,567,545 | ($4,514,345) | $4,396,237 | $33,621,389 | $43,318,025 | $46,915,141 | 42.2% | $33,320 |
| Management Fee | 3,560,969 | 532,165 | 799,243 | 2,489,176 | 3,112,913 | 3,254,752 | 2.9 | 2,312 |
| Incentive Management Fee | 6,121,232 | 0 | 0 | 0 | 1,606,209 | 3,596,862 | 3.2 | 2,555 |
| Real Estate Taxes | 4,144,318 | 4,233,243 | 4,489,532 | 3,377,144 | 3,045,199 | 3,836,380 | 3.5 | 2,725 |
| Property Insurance | 566,212 | 462,754 | 538,172 | 768,375 | 789,920 | 618,049 | 0.6 | 439 |
| Other Non-Operating Expenses | 901,591 | 874,595 | 992,092 | 996,006 | 1,203,861 | 1,108,536 | 1.0 | 787 |
| Total Operating Expenses | $15,294,323 | $6,102,758 | $6,819,039 | $7,630,702 | $9,758,103 | $12,414,578 | 11.2% | $8,817 |
| Net Operating Income | $39,273,222 | ($10,617,103) | ($2,422,803) | $25,990,687 | $33,559,922 | $34,500,562 | 31.1% | $24,503 |
| FF&E(3) | 8,308,932 | 1,241,670 | 1,842,988 | 4,908,954 | 5,188,093 | 5,424,586 | 4.9 | 3,853 |
| Net Cash Flow(4) | $30,964,291 | ($11,858,773) | ($4,265,790) | $21,081,733 | $28,371,829 | $29,075,976 | 26.2% | $20,651 |
| NOI DSCR (5) | 2.07x | (0.56)x | (0.13)x | 1.37x | 1.77x | 1.82x | ||
| NCF DSCR (5) | 1.63x | (0.62)x | (0.22)x | 1.11x | 1.50x | 1.53x | ||
| NOI DY (5) | 18.3% | (4.9)% | (1.1)% | 12.1% | 15.6% | 16.0% | ||
| NCF DY (5) | 14.4% | (5.5)% | (2.0)% | 9.8% | 13.2% | 13.5% |
| (1) | Certain items such as depreciation, amortization, debt service payments and any other non-recurring items were excluded from the historical presentation and are not considered for the underwritten cash flow. |
| (2) | % of U/W Total Revenue for Room Expense, Food & Beverage Expense, and Other Department Expense are based on their corresponding revenue line items. All other line items represent percent of Total Revenue. |
| (3) | The FF&E reserve was temporarily increased to 7% from 2019 through July 2023 to repay a temporary reduction of the FF&E reserve % in 2015. |
| (4) | The decrease in Net Cash Flow from 2019 to 2020 and subsequent increase year-over-year from 2020 to TTM 9/30/2023 is primarily attributable to increases in room revenue and F&B revenue following the impact of the COVID-19 pandemic in 2020 and 2021. Historical performance was largely impacted by the COVID-19 pandemic, during which the Philadelphia Marriott Downtown Property was closed from April 10, 2020 through May 27, 2021 and underwent extensive renovations including renovation of 1,408 guestrooms. |
| (5) | Debt Service Coverage Ratio and Debt Yield statistics are based on the Philadelphia Marriott Downtown Whole Loan. |
| THE INFORMATION IN THIS STRUCTURAL AND COLLATERAL TERM SHEET IS NOT COMPLETE AND MAY BE AMENDED PRIOR TO THE TIME OF SALE. THIS TERM SHEET IS NOT AN OFFER TO SELL THESE SECURITIES AND IT IS NOT A SOLICITATION OF AN OFFER TO BUY THESE SECURITIES IN ANY JURISDICTION WHERE THE OFFER OR SALE IS NOT PERMITTED. | ||
| 76 | ||
| Hospitality – Full Service | Loan #4 | Cut-off Date Balance: | $61,666,666 | ||
| 1201 and 1113 Market Street | Philadelphia Marriott Downtown | Cut-off Date LTV: | 54.9% | ||
| Philadelphia, PA 19107 | U/W NCF DSCR: | 1.53x | |||
| U/W NOI Debt Yield: | 16.0% | ||||
Appraisal. The appraisal concluded to an “as is” appraised value for the Philadelphia Marriott Downtown Property of $391,300,000 as of September 7, 2023.
| Appraisal Valuation Summary | ||
| Appraisal Approach | Appraised Value | Capitalization Rate |
| Discounted Cash Flow Approach | $391,300,000 | 8.25%(1) |
| Direct Capitalization Approach | $394,100, | 8.00% |
| (1) | Represents the terminal capitalization rate. The implied capitalization rate based on the appraiser’s year one cash flow is 7.23%. |
Environmental Matters. According to the Phase I environmental site assessment dated September 20, 2023 (the “ESA”), there was no evidence of any recognized environmental conditions at the Philadelphia Marriott Downtown Property. The Philadelphia Marriott Downtown Property has an underground storage tank (the “UST”) used to fire the main building boilers, fire pump, and emergency generator. According to the ESA, the UST passed the most recent annual tightness testing, but because of certain limitations of such tightness testing and the age of the UST (29 years, where the expected useful life is 30 years), the ESA identified the presence of the UST a business environmental risk. The ESA did not recommend any further action. However, the borrowers obtained a storage tank liability insurance policy as required under the Philadelphia Marriott Downtown Whole Loan documents.
Market Overview and Competition. The Philadelphia Marriott Downtown Property is located in downtown Philadelphia, Pennsylvania, within the greater Philadelphia Central Business District (“CBD”). According to the appraisal and a third party market research report, the Philadelphia CBD submarket is comprised of over 68 properties and around 15,000 rooms. The Philadelphia Marriott Downtown Property is the largest hotel in the area, with approximately 10% of the total rooms in the market. Philadelphia has a population of approximately 4.3 million and an income per capita of $41,000 as of January 2023. The Philadelphia CBD submarket is characterized by upper-scale hotels with over half of all rooms being luxury or upper upscale, a proportion found in less than 5% of U.S. submarkets. Similarly, the Philadelphia market as a whole has a larger proportion of high-end lodging than the typical U.S. market. While COVID-19 severely weakened the submarket, 12-month RevPAR in the Philadelphia CBD hotel submarket has seen a 25.4% year-over-year increase as of August 31, 2023 and, according to a third party research report, is forecasted to achieve 81% RevPAR recovery to 2019 by year-end 2023.
The Philadelphia Marriott Downtown Property is the only hotel that features direct access to the Pennsylvania Convention Center, the 14th largest exhibition space in the country. The Pennsylvania Convention Center contains more than two million square feet of space across 82 meeting rooms, seven exhibition halls, two ballrooms, a grand hall and atrium. In 2019, the Pennsylvania Convention Center hosted 180 events that attracted over 1.2 million attendees. The Pennsylvania Convention Center underwent a $786 million expansion in 2011.
The Philadelphia Marriott Downtown Property is located 12.3 miles from the Philadelphia International Airport and has access into streets such as Market Street and Arch Street, both gateways to the rest of the downtown area. Additionally, the Philadelphia Marriott Downtown Property is located 1.2 miles from the Philadelphia 30th Street Amtrak station. More than 4.4 million rail passengers use the Philadelphia rail system each year and the Philadelphia 30th Street Amtrak station is the third busiest Amtrak station in the country due to its high speed connections into Boston, New York, Baltimore and Washington D.C. According to the Bureau of Transportation Statistics and the Transportation Security Administration, Philadelphia saw an increase of 7.3 million total rail passengers between 1990 and 2020, growing at a compounded average growth over this period of 3.9%. The Philadelphia Marriott Downtown Property is also located within close proximity to several popular attractions such as the Independence Hall, the Liberty Bell and the Reading Terminal Market. Philadelphia is also home to five different professional sports teams including the 76ers (NBA), Eagles (NFL), Flyers (NHL), Phillies (MLB) and Union (MLS).
The following table presents certain information relating to the primary hotel competition for the Philadelphia Marriott Downtown Property:
| Competitive Set(1) | |||||||||
| 2022 Market Mix | 2022 Operating Statistics | ||||||||
| Property | Year Built | Number of Rooms | Commercial | Meeting and Group | Leisure | Extended Stay | Occupancy | ADR | RevPAR |
| Philadelphia Marriott Downtown(2) | 1990; 1995 | 1,408 | 14% | 70% | 14% | 2% | 57.1% | $230.42 | $131.55 |
| Sonesta Philadelphia | 1971 | 439 | 39% | 25% | 30% | 6% | 30%-35% | $190-$195 | $60-$65 |
| DoubleTree by Hilton Hotel Philadelphia Center City | 1980 | 481 | 20% | 56% | 21% | 3% | 45%-50% | $200-$205 | $90-$95 |
| Sheraton Philadelphia Downtown | 1980 | 762 | 14% | 70% | 14% | 2% | 50%-55% | $205-$210 | $105-$110 |
| Westin Philadelphia | 1990 | 294 | 30% | 34% | 31% | 5% | 50%-55% | $210-$215 | $115-$120 |
| Philadelphia Marriott Old City | 1986 | 364 | 24% | 47% | 25% | 4% | 50%-55% | $210-$215 | $110-$115 |
| Loews Philadelphia | 2000 | 581 | 18% | 70% | 9% | 3% | 50%-55% | $195-$200 | $105-$110 |
| The Notary Hotel Autograph Collection | 1999 | 499 | 31% | 30% | 34% | 5% | 55%-60% | $205-$210 | $120-$125 |
| (1) | Source: Appraisal unless otherwise noted. Competitive set occupancy, ADR and RevPAR are based on estimated 2022 values. |
| (2) | Number of Rooms, Occupancy, ADR and RevPAR are per the U/W as of September 30, 2023. |
| THE INFORMATION IN THIS STRUCTURAL AND COLLATERAL TERM SHEET IS NOT COMPLETE AND MAY BE AMENDED PRIOR TO THE TIME OF SALE. THIS TERM SHEET IS NOT AN OFFER TO SELL THESE SECURITIES AND IT IS NOT A SOLICITATION OF AN OFFER TO BUY THESE SECURITIES IN ANY JURISDICTION WHERE THE OFFER OR SALE IS NOT PERMITTED. | ||
| 77 | ||
| Hospitality – Full Service | Loan #4 | Cut-off Date Balance: | $61,666,666 | ||
| 1201 and 1113 Market Street | Philadelphia Marriott Downtown | Cut-off Date LTV: | 54.9% | ||
| Philadelphia, PA 19107 | U/W NCF DSCR: | 1.53x | |||
| U/W NOI Debt Yield: | 16.0% | ||||
Escrows.
Real Estate Taxes - During the continuance of a Cash Sweep Period (as defined below), the borrowers are required to deposit monthly 1/12 of an amount which the lender estimates would be sufficient to pay taxes (other than hotel taxes) for the ensuing 12 months.
Insurance - During the continuance of a Cash Sweep Period, the borrowers are required to deposit monthly 1/12 of the insurance premiums that the lender estimates will be payable for the renewal of coverage, unless the borrowers maintain a blanket insurance policy in accordance with the Philadelphia Marriott Downtown Whole Loan documents.
FF&E Reserve - During the continuance of a Cash Sweep Period, the borrowers are required to deposit monthly into the replacement reserve account an amount equal to the greater of (i) 4% of the gross revenue generated in the immediately preceding calendar month and (ii) the reserves for FF&E required by the related management agreement or franchise agreement to fund the costs of the required FF&E work. The borrowers will not be required to make monthly deposits into the FF&E Reserve account if: (i) the Philadelphia Marriott Downtown Property is managed by the hotel manager under the management agreement as in effect as of the loan origination; (ii) the management agreement remains in full force and effect; and (iii) such hotel manager is maintaining the cash management system and FF&E reserves as set forth in the management agreement.
Condominium Funds - During the continuance of a Cash Sweep Period, the borrowers are required to deposit monthly an amount that would be sufficient to pay the assessments and other expenses owed under the condominium documents during the ensuing 12 months. Notwithstanding the foregoing, the borrowers will not be required to reserve for condominium funds, provided that the Philadelphia Marriott Downtown Property is managed by the hotel manager under the management agreement as in effect as of the loan origination and the hotel manager is paying such condominium expenses as operating expenses directly to the condominium association and the borrowers provide evidence reasonably satisfactory to the lender that the condominium expenses have been paid.
Lockbox and Cash Management. The Philadelphia Marriott Downtown Whole Loan is structured with a soft lockbox and springing cash management. On each business day, all funds in the lockbox accounts will be swept to an account designated by the borrowers, unless a Cash Sweep Period is continuing, in which case such funds are required to be swept on each business day into a cash management account controlled by the lender, at which point, following payment of taxes and insurance, debt service, bank fees, operating expenses and required reserves, all funds are required to be deposited into the excess cash flow reserve, to be held by the lender as additional security for the Philadelphia Marriott Downtown Whole Loan and disbursed in accordance with the terms of the Philadelphia Marriott Downtown Whole Loan documents.
A “Cash Sweep Period” will commence upon the earlier of (a) an event of default under the Philadelphia Marriott Downtown Whole Loan documents; or (b) the debt service coverage ratio for the Philadelphia Marriott Downtown Whole Loan based on the trailing 12-month period immediately preceding the date of such determination being less than 1.20x for two consecutive calendar quarters.
A Cash Sweep Period may be cured upon the occurrence of the following: (i) with respect to clause (a) above, the acceptance by the lender of a cure of such event of default in accordance with the Philadelphia Marriott Downtown Whole Loan documents and (ii) with respect to clause (b) above, (x) the achievement of a debt service coverage ratio for the Philadelphia Marriott Downtown Whole Loan of 1.20x or greater for two consecutive calendar quarters based upon the trailing 12-month period immediately preceding the date of determination or (y) the borrowers have prepaid the Philadelphia Marriott Downtown Whole Loan (or provided cash collateral or a letter of credit to lender as additional collateral) in an amount sufficient such that the debt service coverage ratio for the Philadelphia Marriott Downtown Whole Loan is equal to or greater than 1.20x, in which case such Cash Sweep Period will immediately cease.
Property Management. The Philadelphia Marriott Downtown Property is managed by Marriott Hotel Services, LLC.
Partial Release. Not permitted.
Real Estate Substitution. Not permitted.
Current Mezzanine or Secured Subordinate Indebtedness. None.
Permitted Future Mezzanine or Secured Subordinate Indebtedness. The Philadelphia Marriott Downtown Whole Loan documents permit future mezzanine debt secured by a pledge of direct equity interests in the borrowers subject to the satisfaction of certain conditions including, among others, (i) immediately after giving effect to such debt (x) the combined loan-to-value ratio may not exceed 54.9%, (y) the combined net operating income debt yield, as calculated in accordance with the Philadelphia Marriott Downtown Whole Loan documents, is at least 13.2% and (z) the combined net operating income debt service coverage ratio, as calculated in accordance with the Philadelphia Marriott Downtown Whole Loan documents, is at least 1.50x, and (ii) execution of a subordination and intercreditor agreement is reasonably acceptable to the lender and satisfactory to the rating agencies.
Operating Lease. Each borrower has entered into an operating lease (each, an “Operating Lease”) with CCMH Philadelphia Mkt. LLC (the “Operating Lessee”), an affiliate of the borrowers. The Operating Lessee (i) is a party to the mortgage and grant the lender a first priority security interest in the leasehold interest created by each Operating Lease, and (ii) has caused both of its members to pledge their respective membership interests in the Operating Lessee in favor of the lender. All cash generated at the Philadelphia Marriott Downtown Property is required to flow from the manager (the “Manager”) under the related management agreement between the Manager and the Operating Lessee, to the Operating Lessee, who is required to deposit all revenue into a restricted account pledged to the lender. Each Operating Lease expires in December 2034 if all renewal periods are exercised. See “Description of the Mortgage Pool–Tenant Issues–Affiliated Leases and Master Leases” in the Prospectus.
| THE INFORMATION IN THIS STRUCTURAL AND COLLATERAL TERM SHEET IS NOT COMPLETE AND MAY BE AMENDED PRIOR TO THE TIME OF SALE. THIS TERM SHEET IS NOT AN OFFER TO SELL THESE SECURITIES AND IT IS NOT A SOLICITATION OF AN OFFER TO BUY THESE SECURITIES IN ANY JURISDICTION WHERE THE OFFER OR SALE IS NOT PERMITTED. | ||
| 78 | ||
| Hospitality – Full Service | Loan #4 | Cut-off Date Balance: | $61,666,666 | ||
| 1201 and 1113 Market Street | Philadelphia Marriott Downtown | Cut-off Date LTV: | 54.9% | ||
| Philadelphia, PA 19107 | U/W NCF DSCR: | 1.53x | |||
| U/W NOI Debt Yield: | 16.0% | ||||
Ground Lease. The Philadelphia Marriott Downtown Property is substantially owned in fee by the borrowers; however, (i) a sky-bridge (the “Bridge”) connecting the main building of the Philadelphia Marriott Downtown Property and the Pennsylvania Convention Center and (ii) a parcel of land, which allows for an overhang and partial driveway (the “Tunnel”) at one of the entrances to the Philadelphia Marriott Downtown Property, are subject to certain sub-ground leases. The sub-ground leases are between the Downtown Borrower, as the subtenant, and the Redevelopment Authority of the City of Philadelphia (“RDA” or “Sublandlord”), which in turn leases the same premises from the City of Philadelphia, as the landlord. The Bridge sublease is subject to a reciprocal easement agreement with the Pennsylvania Convention Center Authority. The sub-ground lease agreements extend to 2042 for the Bridge and 2091 for the Tunnel. The ground rent associated with each sub-ground lease is $1/year and has been prepaid for the full term for each of the sub-ground leases. The Tunnel sub-ground lease includes a right of first refusal whereby the borrower, as the subtenant, will be entitled at any time once in every 10-year period to purchase the Tunnel with a notice and the payment of a purchase price in the amount equal to the “Unimproved Land Fair Market Value” which is the fair market value that is 60 days before closing of the Tunnel as if the same existed in a “raw,” vacant and unimproved condition. See “Description of the Mortgage Pool–Statistical Characteristics of the Mortgage Loans–Leasehold Interests” in the Prospectus.
Terrorism Insurance. The Philadelphia Marriott Whole Loan Documents require that the “all risk” insurance policy required to be maintained by the borrower provides coverage for terrorism in an amount equal to the full replacement cost of the Philadelphia Marriott Downtown Property, as well as business interruption insurance covering no less than the 18-month period following the occurrence of a casualty event, together with a 12-month extended period of indemnity.
| THE INFORMATION IN THIS STRUCTURAL AND COLLATERAL TERM SHEET IS NOT COMPLETE AND MAY BE AMENDED PRIOR TO THE TIME OF SALE. THIS TERM SHEET IS NOT AN OFFER TO SELL THESE SECURITIES AND IT IS NOT A SOLICITATION OF AN OFFER TO BUY THESE SECURITIES IN ANY JURISDICTION WHERE THE OFFER OR SALE IS NOT PERMITTED. | ||
| 79 | ||
| Mixed Use – Lab/Office | Loan #5 | Cut-off Date Balance: | $61,250,000 | |
| 250 Water Street | CX – 250 Water Street | Cut-off Date LTV: | 48.8% | |
| Cambridge, MA 02141 | U/W NCF DSCR: | 1.66x | ||
| U/W NOI Debt Yield: | 9.3% |
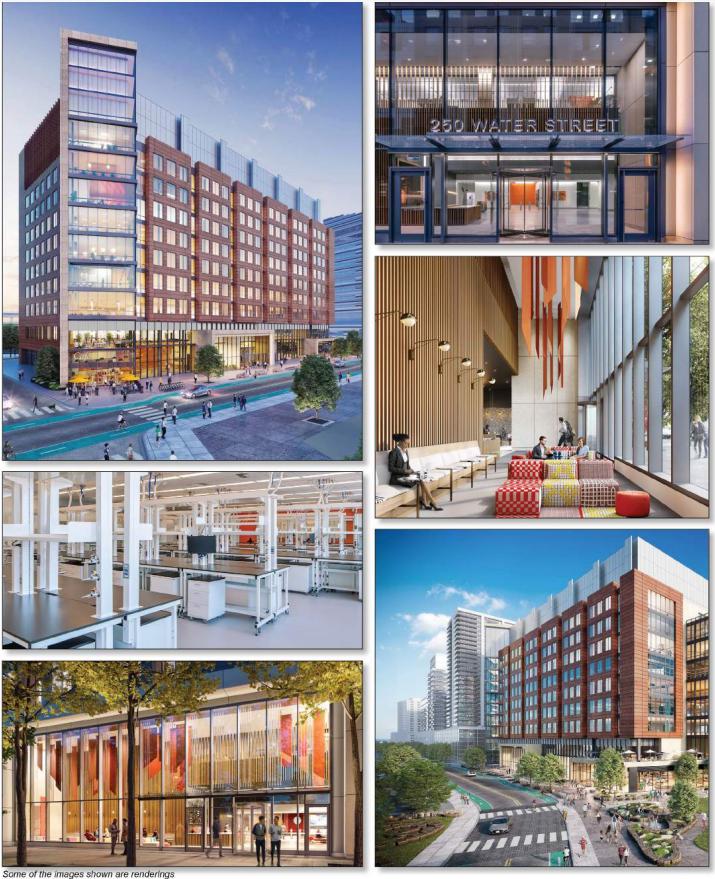
| THE INFORMATION IN THIS STRUCTURAL AND COLLATERAL TERM SHEET IS NOT COMPLETE AND MAY BE AMENDED PRIOR TO THE TIME OF SALE. THIS TERM SHEET IS NOT AN OFFER TO SELL THESE SECURITIES AND IT IS NOT A SOLICITATION OF AN OFFER TO BUY THESE SECURITIES IN ANY JURISDICTION WHERE THE OFFER OR SALE IS NOT PERMITTED. | ||
| 80 | ||
| Mixed Use – Lab/Office | Loan #5 | Cut-off Date Balance: | $61,250,000 | |
| 250 Water Street | CX – 250 Water Street | Cut-off Date LTV: | 48.8% | |
| Cambridge, MA 02141 | U/W NCF DSCR: | 1.66x | ||
| U/W NOI Debt Yield: | 9.3% |
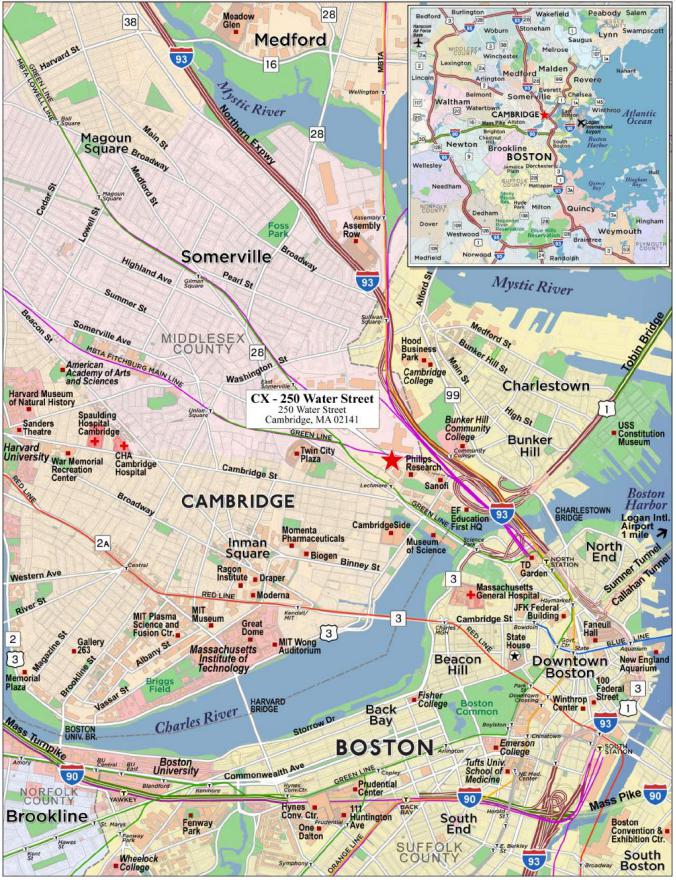
| THE INFORMATION IN THIS STRUCTURAL AND COLLATERAL TERM SHEET IS NOT COMPLETE AND MAY BE AMENDED PRIOR TO THE TIME OF SALE. THIS TERM SHEET IS NOT AN OFFER TO SELL THESE SECURITIES AND IT IS NOT A SOLICITATION OF AN OFFER TO BUY THESE SECURITIES IN ANY JURISDICTION WHERE THE OFFER OR SALE IS NOT PERMITTED. | ||
| 81 | ||
| No. 5 – CX - 250 Water Street |
| Mortgage Loan Information | Mortgaged Property Information | ||||||
| Mortgage Loan Seller: | Bank of America, National Association | Single Asset/Portfolio: | Single Asset | ||||
| Credit Assessment (Fitch/KBRA/Moody’s): | BBBsf/BBB(sf)/Baa2(sf) | Property Type – Subtype: | Mixed Use – Lab/Office | ||||
| Original Principal Balance(1): | $61,250,000 | Location: | Cambridge, MA | ||||
| Cut-off Date Balance(1): | $61,250,000 | Size: | 479,004 SF | ||||
| % of Initial Pool Balance: | 6.7% | Cut-off Date Balance Per SF(1): | $1,109.59 | ||||
| Loan Purpose: | Refinance | Maturity Date Balance Per SF(1): | $1,109.59 | ||||
| Borrower Sponsors: | DivcoWest Real Estate Services, LLC, California State Teachers’ Retirement System and Teacher Retirement System of Texas | Year Built/Renovated: | 2022 / NAP | ||||
| Guarantor: | DW Propco EF, LLC | Title Vesting: | Fee | ||||
| Mortgage Rate(2): | 5.5095% | Property Manager: | Divco West Real Estate Services, Inc. (borrower-related) | ||||
| Note Date: | January 27, 2023 | Current Occupancy (As of): | 98.7% (12/1/2023) | ||||
| Seasoning: | 10 months | YE 2022 Occupancy(5): | NAP | ||||
| Maturity Date(2): | February 10, 2033 | YE 2021 Occupancy(5): | NAP | ||||
| IO Period(2): | 120 months | YE 2020 Occupancy(5): | NAP | ||||
| Loan Term (Original)(2): | 120 months | Appraised Value(6): | $1,090,000,000 | ||||
| Amortization Term (Original): | NAP | Appraised Value Per SF(6): | $2,275.56 | ||||
| Loan Amortization Type: | Interest Only – ARD | Appraisal Valuation Date(6): | January 1, 2023 | ||||
| Call Protection: | L(24),YM1(10),DorYM1(79),O(7) | Underwriting and Financial Information | |||||
| Lockbox Type: | Hard/Springing Cash Management | YE 2022 NOI(5): | NAP | ||||
| Additional Debt(1): | Yes | YE 2021 NOI(5): | NAP | ||||
| Additional Debt Type (Balance)(1): | Pari Passu ($470,250,000) | YE 2020 NOI(5): | NAP | ||||
| YE 2019 NOI(5): | NAP | ||||||
| U/W Revenues: | $62,561,733 | ||||||
| U/W Expenses: | $13,277,931 | ||||||
| U/W NOI: | $49,283,802 | ||||||
| Escrows and Reserves(3) | U/W NCF: | $49,164,051 | |||||
| Initial | Monthly | Cap | U/W DSCR based on NOI/NCF(1): | 1.66x / 1.66x | |||
| Taxes: | $0 | Springing | NAP | U/W Debt Yield based on NOI/NCF(1): | 9.3% / 9.3% | ||
| Insurance: | $0 | Springing | NAP | U/W Debt Yield at Maturity based on NOI/NCF(1): | 9.3% / 9.3% | ||
| TI/LC Reserve: | $0 | Springing | NAP | Cut-off Date LTV Ratio(1)(6): | 48.8% | ||
| Other Reserves(4): | $17,593,844 | $0 | NAP | LTV Ratio at Maturity(1)(6): | 48.8% | ||
| Sources and Uses | ||||||||||
| Sources | Uses | |||||||||
| Whole Loan Amount | $531,500,000 | 98.6 | % | Loan Payoff | $473,876,626 | 87.9 | % | |||
| Cash Equity Contribution | 7,497,903 | 1.4 | Outstanding TI Payment(7) | 44,192,678 | 8.2 | |||||
| Reserves | 17,593,844 | 3.3 | ||||||||
| Closing Costs | 3,334,755 | 0.6 | ||||||||
| Total Sources | $538,997,903 | 100.0 | % | Total Uses | $538,997,903 | 100.0 | % | |||
| (1) | The CX – 250 Water Street Mortgage Loan (as defined below) is part of the CX – 250 Water Street Whole Loan (as defined below), which is evidenced by 21 pari passu promissory notes with an aggregate principal balance as of the Cut-off Date of $531,500,000. The financial information in the chart above reflects the CX – 250 Water Street Whole Loan. |
| (2) | The CX – 250 Water Street Whole Loan is structured with an anticipated repayment date (the “ARD”) of February 10, 2033 and a final maturity date of February 10, 2038. The initial interest rate for the CX – 250 Water Street Whole Loan is 5.5095% per annum. After the ARD, the interest rate will increase to a per annum rate equal to the greater of (i) 7.5095% and (ii) the sum of the swap rate in effect on the ARD plus 4.2800%. The metrics presented above are calculated based on the ARD. |
| (3) | For a full description of Escrows and Reserves, please refer to “Escrows” below. |
| (4) | The Other Reserves represents a Base Building Work Reserve ($5,932,952), an Outstanding TI/LC Reserve ($7,160,274) and an Outstanding Linkage Fees Reserve ($4,500,617). |
| (5) | Historical occupancy and financial information are not applicable because the CX - 250 Water Street Property (as defined below) was built in 2022. |
| (6) | Appraised Value represents the “Prospective Market Value Upon Completion & Stabilization” as of January 1, 2023, which assumes that remaining construction balances are paid, outstanding tenant improvements are paid to the tenant, the tenant has commenced rent payments, and retail space leasing costs are paid, all of which have occurred other than payment of $5,932,952 for base building work, $7,160,274 for tenant improvements and future retail leasing costs. Such amounts for base building work and tenant improvements were fully reserved by the lenders at loan origination. The appraisal concluded to an “as-is” appraised value of $960,000,000 as of May 4, 2022. The “as-is” appraised value results in a Cut-off Date LTV Ratio and LTV Ratio at Maturity of 55.4% for the CX - 250 Water Street Whole Loan. The appraisal concluded to an “as dark” appraised value of $920,000,000 as of May 4, 2022. The “as dark” appraised value results in a Cut-off Date LTV Ratio and LTV Ratio at Maturity of 57.8% for the CX - 250 Water Street Whole Loan. |
| (7) | Outstanding tenant improvements were paid directly to E.R. Squibb & Sons LLC by the borrower sponsors at origination. |
| THE INFORMATION IN THIS STRUCTURAL AND COLLATERAL TERM SHEET IS NOT COMPLETE AND MAY BE AMENDED PRIOR TO THE TIME OF SALE. THIS TERM SHEET IS NOT AN OFFER TO SELL THESE SECURITIES AND IT IS NOT A SOLICITATION OF AN OFFER TO BUY THESE SECURITIES IN ANY JURISDICTION WHERE THE OFFER OR SALE IS NOT PERMITTED. | ||
| 82 | ||
| Mixed Use – Lab/Office | Loan #5 | Cut-off Date Balance: | $61,250,000 | |
| 250 Water Street | CX – 250 Water Street | Cut-off Date LTV: | 48.8% | |
| Cambridge, MA 02141 | U/W NCF DSCR: | 1.66x | ||
| U/W NOI Debt Yield: | 9.3% |
The Mortgage Loan. The fifth largest mortgage loan (the “CX - 250 Water Street Mortgage Loan”) is part of a whole loan (the “CX - 250 Water Street Whole Loan”) that is evidenced by 21 pari passu promissory notes in the aggregate original principal amount of $531,500,000 and secured by a first priority fee mortgage encumbering a 479,004 SF mixed-use, life sciences laboratory and office property located in Cambridge, Massachusetts (the “CX - 250 Water Street Property”). The CX - 250 Water Street Whole Loan was co-originated by Bank of America, National Association (“BANA”), Wells Fargo Bank, National Association, Goldman Sachs Bank USA (“GS”) and 3650 Real Estate Investment Trust 2 LLC (“3650”). The CX - 250 Water Street Mortgage Loan, with an original aggregate principal amount of $61,250,000, is evidenced by the controlling Note A-1 and noncontrolling Note A-7. The remaining promissory notes comprising the CX - 250 Water Street Whole Loan are summarized in the below table. The CX - 250 Water Street Whole Loan will be serviced pursuant to the pooling and servicing agreement for the MSWF 2023-2 trust. See “Description of the Mortgage Pool—The Whole Loans—The Serviced Pari Passu Whole Loans” and “Pooling and Servicing Agreement” in the prospectus.
The CX - 250 Water Street Whole Loan has a 10-year interest-only term through the ARD of February 10, 2033 and a final maturity date of February 10, 2038. After the ARD, the interest rate will increase to the greater of (i) 7.5095%, and (ii) the sum of the swap rate in effect on the ARD plus 4.2800% (“Adjusted Interest Rate”), however, interest accrued at the excess of the Adjusted Interest Rate over the initial interest rate will be deferred as described below under “Lockbox and Cash Management.” From the origination date through the ARD, the CX - 250 Water Street Whole Loan accrues interest at the rate of 5.5095% per annum.
Whole Loan Note Summary
| Notes | Original Balance | Cut-off Date Balance | Note Holder | Controlling Piece | |
| A-1, A-7 | $61,250,000 | $61,250,000 | MSWF 2023-2 | Yes | |
| A-3 | $50,000,000 | $50,000,000 | BBCMS 2023-C22 | No | |
| A-5, A-9-1 | $72,000,000 | $72,000,000 | BANK 2023-BNK46 | No | |
| A-2, A-6, A-8 | $75,125,000 | $75,125,000 | BBCMS 2023-C20 | No | |
| A-4, A-12 | $55,000,000 | $55,000,000 | BANK 2023-BNK45 | No | |
| A-10, A-11, A-14 | $65,625,000 | $65,625,000 | MSWF 2023-1 | No | |
| A-9-2, A-13, A-15, A-16 | $46,200,000 | $46,200,000 | BMO 2023-C6 | No | |
| A-17, A-18 | $53,150,000 | $53,150,000 | Benchmark 2023-B38 | No | |
| A-19, A-20 | $53,150,000 | $53,150,000 | BBCMS 2023-C21 | No | |
| Total | $531,500,000 | $531,500,000 | |||
The Borrower and the Borrower Sponsors. The borrowing entity for the CX - 250 Water Street Whole Loan is DW Propco EF, LLC, a Delaware limited liability company and single purpose entity with two independent directors. There is no non-recourse carveout guarantor or environmental indemnitor for the CX - 250 Water Street Whole Loan separate from the borrower. The borrower sponsors are a joint venture between DivcoWest Real Estate Services, LLC (“Divco”), California State Teachers’ Retirement System (“CalSTRS”) and Teacher Retirement System of Texas (“TRS”).
Founded in 1993, Divco is a multidisciplinary investment firm headquartered in San Francisco, California, with over 190 employees across seven investment offices. Divco is a developer, owner and operator of real estate throughout the United States, with expertise in Boston, having invested in and managed over 22 commercial properties in the area, including offices in the Seaport, Financial District, and East Cambridge submarkets. Most notably, Divco owned and operated One Kendall Square, a life sciences office campus in the Kendall Square submarket. As of September 30, 2022, Divco had over $17.7 billion in assets under management. Since inception, Divco has acquired approximately 59.7 million square feet.
CalSTRS is reported to be the nation’s second largest public pension fund, with assets totaling approximately $304.9 billion as of October 31, 2023. CalSTRS’ investment portfolio is diversified into nine asset categories, including nearly 16.3% (approximately $49.6 billion as of October 31, 2023) allocated to real estate investments in institutional Class A commercial assets across the United States. Divco and CalSTRS have a 20-year history working together, with over $1.5 billion co-invested into various Divco-sponsored investment vehicles.
Established in 1937, TRS provides retirement and related benefits for those employed by the public schools, colleges and universities supported by the State of Texas. As of August 31, 2022, the agency was serving approximately 1.9 million participants and had assets under management of nearly $184 billion. TRS is the largest public retirement system in Texas in both membership and assets.
The Property. The CX - 250 Water Street Property consists of a Class A, LEED Gold (targeted), mixed-use, life sciences laboratory and office building located in Cambridge, Massachusetts that was recently developed by the borrower sponsors. The CX - 250 Water Street Property is a part of Cambridge Crossing, a 43-acre, mixed-use, master-planned area located in East Cambridge, which is being developed by Divco, who owns all but four parcels. Cambridge Crossing broke ground in May 2017 Cambridge Crossing (Phase 1) was recently completed and features 4.5 million square feet of mixed use space. Major tenants at Cambridge Crossing include Philips, Sanofi and Bristol Myers Squibb. Cambridge Crossing is at the intersection of Cambridge, Somerville and Boston, and is accessible to all parts of the greater Boston area via two MBTA stations (Green and Orange lines), nearby commuter and Amtrak trains, an on-site shuttle, and dedicated bike lanes throughout. Cambridge Crossing is approximately 3.5 miles from Boston Logan International Airport.
The CX – 250 Water Street Property was designed by Jacobs and Ennead and construction was completed in 2022. The CX - 250 Water Street Property is a nine-story building with post-COVID design features and includes laboratory space (approximately 60.0% of NRA), office space (approximately 40.0% of NRA), ground floor retail (6,424 square feet), two penthouse mechanical levels, three below-
| THE INFORMATION IN THIS STRUCTURAL AND COLLATERAL TERM SHEET IS NOT COMPLETE AND MAY BE AMENDED PRIOR TO THE TIME OF SALE. THIS TERM SHEET IS NOT AN OFFER TO SELL THESE SECURITIES AND IT IS NOT A SOLICITATION OF AN OFFER TO BUY THESE SECURITIES IN ANY JURISDICTION WHERE THE OFFER OR SALE IS NOT PERMITTED. | ||
| 83 | ||
| Mixed Use – Lab/Office | Loan #5 | Cut-off Date Balance: | $61,250,000 | |
| 250 Water Street | CX – 250 Water Street | Cut-off Date LTV: | 48.8% | |
| Cambridge, MA 02141 | U/W NCF DSCR: | 1.66x | ||
| U/W NOI Debt Yield: | 9.3% |
grade parking levels with 355 parking spaces (0.74 spaces per 1,000 SF), bike storage, a fitness center, an indoor solarium and an adjacent open green space with a playing field and a plaza to host food trucks. The CX - 250 Water Street Property has 15’ - 20’ ceiling heights and five passenger elevators. The CX - 250 Water Street Property is 98.7% leased to E.R. Squibb & Sons LLC (wholly owned by Bristol Myers Squibb (“BMY”)).
Major Tenant.
E.R. Squibb & Sons LLC (472,580 square feet, 98.7% of NRA, 100.0% of underwritten base rent): E.R. Squibb & Sons LLC is a wholly owned subsidiary of BMY (rated A+/A2 by S&P/Moody’s), which is the guarantor under the E.R. Squibb & Sons LLC leases. Founded in 1887, BMY is a global biopharmaceutical company headquartered in New York, New York. BMY focuses on making critical advances in oncology, hematology, immunology, and cardiovascular disease among other fields. BMY has had several high-profile drugs successfully receive approval, with notable recent releases and current pipeline drugs including Abecma (approved: multiple myeloma), Zeposia (approved: multiple sclerosis) and Breyanzi (approved: lymphoma). BMY (NYSE: BMY) is publicly traded and had revenues of $46.2 billion in 2022. As of November 2023, BMY had a market capitalization of approximately $99.4 billion.
The CX - 250 Water Street Property is expected to serve as BMY’s research and early development center, where it is expected to consolidate approximately 550 employees from multiple locations in the Boston area. BMY is entitled to receive an approximate $106.3 million ($225 PSF) tenant improvement allowance, of which approximately $7.2 million remained outstanding as of the origination date and was fully reserved by the lenders. In addition to such tenant improvement allowance, BMY reportedly is investing an additional $169.0 million ($358 PSF) toward the buildout of its space. In the fourth quarter of 2023, the tenant completed its work and took occupancy of its space.
E.R. Squibb & Sons LLC leases all of the laboratory and office space at the CX – 250 Water Street Property through October 31, 2037, with two, 10-year renewal options and no termination option. E.R. Squibb & Sons LLC’s original lease was for 415,900 SF (floors 1-8) before expanding to lease the remaining 56,680 square feet on floor 9. The rent commencement dates of the BMY leases at the CX - 250 Water Street Property were July 1, 2022 (for floor 9) and November 1, 2022 (for all other floors). The blended starting base rent for the E.R. Squibb & Sons LLC leases is $90.48 PSF (NNN). Base rent for floors 1-8 is $88.50 PSF and base rent for floor 9 is $105.00 PSF, with both leases including approximately 2.5% and 2.75% annual rent steps, respectively. E.R. Squibb & Sons LLC did not receive any free rent as part of its lease. The blended in-place rent at the CX - 250 Water Street Property is approximately 27.1% below the appraisal’s concluded market rent of $115.00 PSF (NNN).
E.R. Squibb & Sons LLC has a contraction option for its floor 9 space, which, if exercised, would be effective October 31, 2032, upon 18-30 months’ notice and payment of a contraction fee equal to an estimated $8.3 million. E.R. Squibb & Sons LLC has subleased a portion of the floor 9 space (45,500 square feet, 9.6% of E.R. Squibb & Sons LLC’s leased NRA or 9.5% of the total building NRA) to Eterna Therapeutics Inc. (NASDAQ: ERNA) at a sublease rent of $120 PSF with 3.0% annual increases, which sublease is coterminous with the effective date of E.R. Squibb & Sons LLC’s contraction option. Eterna Therapeutics Inc. received a tenant improvement allowance of $190 PSF from E.R. Squibb & Sons LLC to build out its space. Eterna Therapeutics Inc. has a termination option in year 7 of the sublease term and has one five-year extension option.
| THE INFORMATION IN THIS STRUCTURAL AND COLLATERAL TERM SHEET IS NOT COMPLETE AND MAY BE AMENDED PRIOR TO THE TIME OF SALE. THIS TERM SHEET IS NOT AN OFFER TO SELL THESE SECURITIES AND IT IS NOT A SOLICITATION OF AN OFFER TO BUY THESE SECURITIES IN ANY JURISDICTION WHERE THE OFFER OR SALE IS NOT PERMITTED. | ||
| 84 | ||
| Mixed Use – Lab/Office | Loan #5 | Cut-off Date Balance: | $61,250,000 | |
| 250 Water Street | CX – 250 Water Street | Cut-off Date LTV: | 48.8% | |
| Cambridge, MA 02141 | U/W NCF DSCR: | 1.66x | ||
| U/W NOI Debt Yield: | 9.3% |
The following table presents certain information relating to the tenancy at the CX - 250 Water Street Property:
Major Tenant(1)
| Tenant Name | Suite | Credit Rating (Fitch/ Moody’s/ | Tenant NRSF | % of NRSF | Annual U/W Base Rent PSF | Annual U/W Base Rent | % of Total Annual U/W Base Rent | Lease Expiration Date | Extension Options | Term. Option (Y/N) |
| Major Tenant | ||||||||||
| E.R. Squibb & Sons LLC | 100 – 800 | NR/A2/A+ | 415,900 | 86.8% | $88.50 | $36,807,150 | 86.1% | 10/31/2037 | 2 x 10 yr | N |
| E.R. Squibb & Sons LLC(3) | 900 | NR/A2/A+ | 56,680 | 11.8% | $105.00 | $5,951,400 | 13.9% | 10/31/2037 | 2 x 10 yr | Y |
| Occupied Collateral Total | 472,580 | 98.7% | $90.48 | $42,758,550 | 100.0% | |||||
| Vacant Space (Retail) | 6,424 | 1.3% | ||||||||
| Collateral Total | 479,004 | 100.0% | ||||||||
| (1) | Based on underwritten rent roll dated December 1, 2023. |
| (2) | The credit ratings are those of the direct parent company, BMY, which is the guarantor under the leases. |
| (3) | E.R. Squibb & Sons LLC has a contraction option for its floor 9 space on the last day of the 10th lease year (October 31, 2032) with 18-30 months’ notice and a contraction payment equal to an estimated $8.3 million. E.R. Squibb & Sons LLC has subleased a portion of the floor 9 space (45,500 square feet) to Eterna Therapeutics Inc. through October 31, 2032. Eterna Therapeutics Inc. has a termination option in year 7 of the sublease term and has one five-year extension option. |
The following table presents certain information relating to the lease rollover schedule at the CX - 250 Water Street Property:
Lease Expiration Schedule(1)(2)
| Year Ending December 31, | No. of Leases Expiring | Expiring NRSF | % of Total NRSF | Cumulative Expiring NRSF | Cumulative % of Total NRSF | Annual U/W Base Rent | % of Total Annual U/W Base Rent | Annual U/W Base Rent PSF |
| MTM | 0 | 0 | 0.0% | 0 | 0.0% | $0 | 0.0% | $0.00 |
| 2023 | 0 | 0 | 0.0% | 0 | 0.0% | $0 | 0.0% | $0.00 |
| 2024 | 0 | 0 | 0.0% | 0 | 0.0% | $0 | 0.0% | $0.00 |
| 2025 | 0 | 0 | 0.0% | 0 | 0.0% | $0 | 0.0% | $0.00 |
| 2026 | 0 | 0 | 0.0% | 0 | 0.0% | $0 | 0.0% | $0.00 |
| 2027 | 0 | 0 | 0.0% | 0 | 0.0% | $0 | 0.0% | $0.00 |
| 2028 | 0 | 0 | 0.0% | 0 | 0.0% | $0 | 0.0% | $0.00 |
| 2029 | 0 | 0 | 0.0% | 0 | 0.0% | $0 | 0.0% | $0.00 |
| 2030 | 0 | 0 | 0.0% | 0 | 0.0% | $0 | 0.0% | $0.00 |
| 2031 | 0 | 0 | 0.0% | 0 | 0.0% | $0 | 0.0% | $0.00 |
| 2032 | 0 | 0 | 0.0% | 0 | 0.0% | $0 | 0.0% | $0.00 |
| 2033 | 0 | 0 | 0.0% | 0 | 0.0% | $0 | 0.0% | $0.00 |
| 2034 & Beyond | 2 | 472,580 | 98.7% | 472,580 | 98.7% | $42,758,550 | 100.0% | $90.48 |
| Vacant | 0 | 6,424 | 1.3% | 479,004 | 100.0% | $0 | 0.0% | $0.00 |
| Total/Weighted Average(3) | 2 | 479,004 | 100.0% | $42,758,550 | 100.0% | $90.48 |
| (1) | Based on the underwritten rent roll dated December 1, 2023. |
| (2) | Certain tenants may have lease termination options that are exercisable prior to the originally stated expiration date of the subject lease and that are not considered in the Lease Expiration Schedule. |
| (3) | Total/Weighted Average Annual U/W Base Rent PSF excludes vacant space. |
The following table presents historical occupancy percentages at the CX - 250 Water Street Property:
Historical Occupancy(1)
12/31/2020 | 12/31/2021 | 12/31/2022 | 12/1/2023(2) |
| NAP | NAP | NAP | 98.7% |
| (1) | Historical occupancies are not applicable because the CX – 250 Water Street Property was built in 2022. |
| (2) | Based on the underwritten rent roll. |
| THE INFORMATION IN THIS STRUCTURAL AND COLLATERAL TERM SHEET IS NOT COMPLETE AND MAY BE AMENDED PRIOR TO THE TIME OF SALE. THIS TERM SHEET IS NOT AN OFFER TO SELL THESE SECURITIES AND IT IS NOT A SOLICITATION OF AN OFFER TO BUY THESE SECURITIES IN ANY JURISDICTION WHERE THE OFFER OR SALE IS NOT PERMITTED. | ||
| 85 | ||
| Mixed Use – Lab/Office | Loan #5 | Cut-off Date Balance: | $61,250,000 | |
| 250 Water Street | CX – 250 Water Street | Cut-off Date LTV: | 48.8% | |
| Cambridge, MA 02141 | U/W NCF DSCR: | 1.66x | ||
| U/W NOI Debt Yield: | 9.3% |
Underwritten Net Cash Flow. The following table presents certain information relating to the underwritten net cash flow at the CX - 250 Water Street Property:
Cash Flow Analysis(1)
| U/W | %(2) | U/W $ per SF | ||
| Base Rent(3) | $43,079,750 | 68.2% | $89.94 | |
| Straight Lined Rent(4) | 5,689,409 | 9.0 | 11.88 |
|
| Gross Potential Rent | $48,769,159 | 77.2% | $101.81 | |
| Parking Income | 1,596,600 | 2.5 | 3.33 | |
| Total Reimbursements | 12,827,911 | 20.3 | 26.78 | |
| Net Rental Income | $63,193,670 | 100.0% | $131.93 | |
| Less Vacancy & Credit Loss | 631,937 | 1.3 | 1.32 |
|
| Effective Gross Income | $62,561,733 | 99.0% | $130.61 | |
| Real Estate Taxes | $6,619,604 | 10.6% | $13.82 | |
| Insurance | 355,155 | 0.6 | 0.74 | |
| Management Fee | 1,564,043 | 2.5 | 3.27 |
|
| Other Operating Expenses | 4,739,129 | 7.6 | 9.89 |
|
| Total Operating Expenses | $13,277,931 | 21.2% | $27.72 | |
| Net Operating Income | $49,283,802 | 78.8% | $102.89 | |
| Replacement Reserves | 119,751 | 0.2 | 0.25 | |
| TI/LC | 0 | 0.0 | 0.00 |
|
| Net Cash Flow | $49,164,051 | 78.6% | $102.64 | |
| NOI DSCR(5) | 1.66x | |||
| NCF DSCR(5) | 1.66x | |||
| NOI Debt Yield(5) | 9.3% | |||
| NCF Debt Yield(5) | 9.3% | |||
| (1) | Historical financial information is not available because the CX - 250 Water Street Property was built in 2022. |
| (2) | Represents (i) percent of Net Rental Income for all revenue fields, (ii) percent of Gross Potential Rent for Vacancy & Credit Loss and (iii) percent of Effective Gross Income for all other fields. |
| (3) | Based on the in-place rent roll dated December 1, 2023 for contractual leases. |
| (4) | Straight-line average rent credit was taken for the E.R. Squibb & Sons LLC leases (BMY is the investment grade rated parent company) through the loan term. |
| (5) | Debt service coverage ratios and debt yields are based on the CX - 250 Water Street Whole Loan. |
Appraisal. The appraised value of $1,090,000,000 represents the “Prospective Market Value Upon Completion & Stabilization”, as of January 1, 2023, which assumes that remaining construction balances are paid, outstanding tenant improvements are paid to the tenant, the tenant has commenced rent payments, and retail space leasing costs are paid, all of which have occurred other than payment of $5,932,952 for base building work, $7,160,274 for tenant improvements and future retail leasing costs. Such amounts for base building work and tenant improvements were fully reserved by the lenders at loan origination. The appraisal concluded to an “as-is” appraised value of $960,000,000 as of May 4, 2022. The appraisal concluded to an “as dark” appraised value of $920,000,000 as of May 4, 2022.
Environmental Matters. The Phase I environmental assessment (“ESA”) dated May 24, 2022 identified a controlled recognized environmental condition at the CX - 250 Water Street Property resulting from former industrial and rail yard use (primarily lead and petroleum impacts to soil) and the presence of urban fill, which is common in the area surrounding Boston. Remedial actions are anticipated to be completed in connection with the completion of construction at the CX - 250 Water Street Property, and when completed, are expected to result in regulatory closure for the CX - 250 Water Street Property, according to the ESA. See “Description of the Mortgage Pool—Mortgage Pool Characteristics—Environmental Considerations” in the prospectus.
Market Overview and Competition. The CX - 250 Water Street Property is located in Cambridge, Massachusetts, within the Boston core-based statistical area, directly north of the City of Boston and separated from Boston’s central business district by the Charles River. Cambridge is bordered by Somerville to the north and Watertown to the west. Cambridge is acclaimed for its mix of venture capital, National Institutes of Health (“NIH”) funding and state investments. In recent years, Cambridge has become a life sciences and biotechnology hub not only for the Northeast, but for the entire United States. 18 of the top 20 life sciences companies are in East Cambridge. Cambridge is home to over 5,000 private business establishments, including Watson Health, Amgen, Facebook and Apple, among others.
| THE INFORMATION IN THIS STRUCTURAL AND COLLATERAL TERM SHEET IS NOT COMPLETE AND MAY BE AMENDED PRIOR TO THE TIME OF SALE. THIS TERM SHEET IS NOT AN OFFER TO SELL THESE SECURITIES AND IT IS NOT A SOLICITATION OF AN OFFER TO BUY THESE SECURITIES IN ANY JURISDICTION WHERE THE OFFER OR SALE IS NOT PERMITTED. | ||
| 86 | ||
| Mixed Use – Lab/Office | Loan #5 | Cut-off Date Balance: | $61,250,000 | |
| 250 Water Street | CX – 250 Water Street | Cut-off Date LTV: | 48.8% | |
| Cambridge, MA 02141 | U/W NCF DSCR: | 1.66x | ||
| U/W NOI Debt Yield: | 9.3% |
The Cambridge market is best known for its innovation and high concentration of research and development operations. Cambridge has one of the highest densities of college educated people in the world, with three major NIH hospitals and 42 colleges, universities and community colleges in the Boston/Cambridge area, including Harvard University and Massachusetts Institute of Technology. There are over 11,000 undergraduate students and over 11,000 graduate students living in Cambridge.
The following table presents the submarket statistics for the laboratory space in the Cambridge market:
| Submarket | Inventory (SF) | Overall Vacancy Rate | YTD Overall Absorptions (SF) | Under Construction (SF) | Direct Avg. Rent | Direct Avg. Rent (Class A) |
| East Cambridge | 8,159,000 | 3.5% | 0 | 2,169,000 | $102.78 | $110.00 |
| Mid Cambridge | 2,951,620 | 1.0% | (29,562) | 0 | $115.00 | $115.00 |
| West Cambridge | 1,406,102 | 0.0% | 1,589 | 326,616 | $96.18 | $100.00 |
| Total/Wtd. Avg. | 12,516,722 | 2.5% | (27,973) | 2,495,616 | $104.92 | $110.06 |
Source: Appraisal.
The following table summarizes the comparable office leases in the surrounding market:
| Property | Year Built |
Tenant Name | Lease Start Date | Term (yrs.) | Lease Type | Tenant Size (SF) | Base Rent PSF | Rent Steps/yr | TI PSF |
CX - 250 Water Street(1)(2) Cambridge, MA | 2022 | E.R. Squibb & Sons LLC | Jul/Nov-22 | 15.0 | NNN | 472,580 | $90.48 | 2.53% | $225.00 |
325 Binney Cambridge, MA | 2024 | Moderna Therapeutics | Jan-24 | 15.0 | NNN | 462,000 | $117.00 | 3.00% | $225.00 |
Lab Building Somerville, MA | 2021 | Generate Biomedicines, Inc. | Apr-22 | 10.1 | NNN | 71,330 | $82.30 | 2.75% | $250.00 |
One Rogers/Charles Park Cambridge, MA | 1984 | Flagship Entities | Nov-23 | 10.0 | NNN | 388,000 | $115.00 | 3.00% | $200.00 |
The Richards Building Cambridge, MA | 1989 | Vericel Corporation | Mar-22 | 10.0 | NNN | 57,159 | $102.00 | 3.00% | $75.00 |
University Park Cambridge, MA | 2000 | Brigham and Women's | Feb-21 | 5.0 | NNN | 112,410 | $100.00 | 3.00% | $0.00 |
| Average(3) | 10.0 | 218,180 | $103.26 | $150.00 |
| Source: Appraisal. | ||
| (1) | Information is based on the underwritten rent roll dated December 1, 2023. | |
| (2) | The information is based on the weighted average of the E.R. Squibb & Sons LLC leases and includes both office and lab spaces. The lease to E.R. Squibb & Sons LLC for floors 1-8 started on November 1, 2022 for 415,900 square feet at a base rent PSF of $88.50 with 2.5% annual increases. The lease to E.R. Squibb & Sons LLC for floor 9 started on July 1, 2022 for 56,680 square feet at a base rent PSF of $105.00 with 2.75% annual increases. |
| (3) | Average excludes the CX - 250 Water Street Property. |
Escrows. At origination, the borrower deposited into escrow (i) $7,160,274 for a reserve with respect to outstanding tenant improvement allowances and leasing commissions, (ii) $5,932,952 for a base building reserve with respect to construction of the CX - 250 Water Street Property, and (iii) $4,500,617 for a reserve with respect to outstanding linkage fees. The borrower is required to pay the Somerville Affordable Housing Trust Fund linkage fees in the amount of $2,250,309 on August 18, 2023 and August 18, 2024, pursuant to the Project Mitigation Agreement, between the City of Somerville and the borrower.
Tax Escrows – During a Trigger Period (as defined below), the borrower is required to deposit into a real estate tax reserve, on a monthly basis, 1/12th of the estimated annual real estate taxes.
Insurance Escrows – During a Trigger Period, or if the borrower fails to maintain a blanket insurance policy, the borrower is required to deposit into an insurance reserve, on a monthly basis, 1/12th of estimated annual insurance premiums.
TI/LC Reserves – During a Lease Sweep Period (as defined below), all excess cash will be swept into the TI/LC reserve.
A “Trigger Period” will occur:
| (i) | commencing upon the ARD (with no cure or end date); |
| (ii) | commencing upon the occurrence of an event of default under the CX - 250 Water Street Whole Loan until waived or cured; |
| (iii) | on any date from and after June 30, 2023, commencing when the debt service coverage ratio is less than 1.45x based on the CX - 250 Water Street Whole Loan for two consecutive calendar quarters, and ending upon the earlier to occur of (x) the debt service coverage ratio based on the CX - 250 Water Street Whole Loan being equal to or greater than 1.45x for two consecutive calendar quarters and (y) funds on deposit in the cash collateral account (without regard to prior disbursements from such account) equaling or exceeding $23,950,200; or |
| (iv) | during a Lease Sweep Period. |
| THE INFORMATION IN THIS STRUCTURAL AND COLLATERAL TERM SHEET IS NOT COMPLETE AND MAY BE AMENDED PRIOR TO THE TIME OF SALE. THIS TERM SHEET IS NOT AN OFFER TO SELL THESE SECURITIES AND IT IS NOT A SOLICITATION OF AN OFFER TO BUY THESE SECURITIES IN ANY JURISDICTION WHERE THE OFFER OR SALE IS NOT PERMITTED. | ||
| 87 | ||
| Mixed Use – Lab/Office | Loan #5 | Cut-off Date Balance: | $61,250,000 | |
| 250 Water Street | CX – 250 Water Street | Cut-off Date LTV: | 48.8% | |
| Cambridge, MA 02141 | U/W NCF DSCR: | 1.66x | ||
| U/W NOI Debt Yield: | 9.3% |
A “Lease Sweep Period” will commence (prior to the ARD) upon:
(i) the earliest to occur of:
(a) the date that is 12 months prior to the earliest stated expiration of the Lease Sweep Lease (as defined below);
(b) the last date under such Lease Sweep Lease that the tenant has the right to give notice of its exercise of a renewal option; or
(c) with respect to any Lease Sweep Lease that is a Short Term Qualifying Lease (as defined below), the date that is 12 months prior to the ARD or the date that the lenders reasonably determine that a Lease Sweep Period should commence in order for the aggregate amount of projected deposits into the rollover account for the period commencing on such date through the ARD to equal the Lease Sweep Deposit Amount (as defined below);
(ii) the date of the early termination, early cancellation or early surrender of a Lease Sweep Lease (or any material portion thereof) prior to its then-current expiration date or the receipt by the borrower or manager of written notice from the tenant under a Lease Sweep Lease of its intent to effect an early termination, early cancellation or early surrender of such Lease Sweep Lease prior to its then-current expiration date;
(iii) solely with respect to any Lease Sweep Lease under which neither the applicable tenant nor any lease guarantor is an investment grade entity, if such tenant has ceased operating its business (i.e., “goes dark”) in a majority of its leased space at the CX - 250 Water Street Property and the same has not been subleased in accordance with the terms of the CX - 250 Water Street Whole Loan documents, pursuant to a sublease on the same or substantially similar or better terms as the applicable Lease Sweep Lease;
(iv) a monetary or material non-monetary default under a Lease Sweep Lease by the tenant; or
(v) the occurrence of an insolvency proceeding with respect to the tenant under a Lease Sweep Lease, its parent company or any lease guarantor.
A Lease Sweep Period will end upon:
| (A) | if triggered in the case of clause (i), (ii), (iii) and (iv) above, the entirety of the Lease Sweep Lease space is leased pursuant to one or more qualified leases and in the lenders’ reasonable judgment, sufficient funds have been accumulated in the rollover account; |
| (B) | if triggered in the case of clause (i) above, the date on which the tenant under the Lease Sweep Lease irrevocably exercises its renewal or extension option or otherwise extends its Lease Sweep Lease in accordance with the terms of the CX - 250 Water Street Property Whole Loan documents with respect to all of its Lease Sweep Lease space, and, in the lenders’ reasonable judgment, sufficient funds have been accumulated in the rollover account; |
| (C) | if triggered in the case of clause (ii) above, if the tenant under the applicable Lease Sweep Lease rescinds in writing the exercise of its notice exercising its early termination, cancellation or surrender right or option; |
| (D) | if triggered in the case of clause (iii) above, the circumstances giving rise to a Lease Sweep Period under clause (iii) no longer exist; |
| (E) | if triggered in the case of clause (iv) above, the date on which the subject default has been cured; |
| (F) | if triggered in the case of clause (v) above, either (1) the applicable insolvency proceeding has terminated and the applicable Lease Sweep Lease has been affirmed, assumed or assigned in a manner reasonably satisfactory to the lenders or (2) the applicable Lease Sweep Lease has been assumed or assumed and assigned to a third party in a manner reasonably satisfactory to the lenders; |
| (G) | if triggered in the case of clauses (i), (ii), (iii), (iv) and/or (v) above, the CX - 250 Water Street Property has achieved a debt yield of not less than 7.5% and, in the lenders’ reasonable judgment, sufficient funds have been accumulated in the rollover account; or |
| (H) | if triggered in the case of clauses (i), (ii), (iii), (iv) and/or (v) above, the date on which funds in the rollover account collected with respect to the Lease Sweep Lease space in question is equal to the Lease Sweep Deposit Amount applicable to such Lease Sweep Lease space. |
A “Lease Sweep Lease” means (i) the E.R. Squibb & Sons, LLC leases at the CX - 250 Water Street Property and (ii) any replacement lease that, either individually or when taken together with any other lease with the same tenant or its affiliates, covers the majority of the Lease Sweep Lease space.
A “Lease Sweep Tenant” means any tenant under a Lease Sweep Lease.
A “Lease Sweep Deposit Amount” means an amount equal to the total rentable square feet of the applicable Lease Sweep Lease space that is the subject of a Lease Sweep Period multiplied by $50.00.
A “Short Term Qualifying Lease” means any “qualified lease” that has an initial term which does not extend at least two years beyond the ARD.
Lockbox and Cash Management. The CX - 250 Water Street Whole Loan is structured with a hard lockbox and springing cash management. All rents are required to be deposited directly into a lender-controlled lockbox account. During a Trigger Period, funds on deposit in the lockbox account are required to be swept on a daily basis into a lender-controlled cash management account. Prior to the ARD (except during the continuance of an event of default under the CX – 250 Water Street Whole Loan), all excess cash is required to be transferred to a lender-controlled account as additional collateral for the CX - 250 Water Street Whole Loan, subject to certain permitted uses by the borrower described in the CX - 250 Water Street Whole Loan documents, and except as described with respect to a Lease Sweep Period. If the CX - 250 Water Street Whole Loan is not paid by the ARD, from and after the ARD, the CX -
| THE INFORMATION IN THIS STRUCTURAL AND COLLATERAL TERM SHEET IS NOT COMPLETE AND MAY BE AMENDED PRIOR TO THE TIME OF SALE. THIS TERM SHEET IS NOT AN OFFER TO SELL THESE SECURITIES AND IT IS NOT A SOLICITATION OF AN OFFER TO BUY THESE SECURITIES IN ANY JURISDICTION WHERE THE OFFER OR SALE IS NOT PERMITTED. | ||
| 88 | ||
| Mixed Use – Lab/Office | Loan #5 | Cut-off Date Balance: | $61,250,000 | |
| 250 Water Street | CX – 250 Water Street | Cut-off Date LTV: | 48.8% | |
| Cambridge, MA 02141 | U/W NCF DSCR: | 1.66x | ||
| U/W NOI Debt Yield: | 9.3% |
250 Water Street Whole Loan will accrue interest at the Adjusted Interest Rate; however, interest accrued at the excess of the Adjusted Interest Rate over the initial interest rate will be deferred.
On and after the ARD (except during the continuance of an event of default under the CX – 250 Water Street Whole Loan), all amounts on deposit in the cash management account after payment of debt service, required reserves and budgeted operating expenses will be required to be applied to the prepayment of the outstanding principal balance of the CX - 250 Water Street Whole Loan until the outstanding principal balance has been reduced to zero and then to any excess interest until the excess interest has been reduced to zero.
Property Management. The CX - 250 Water Street Property is managed by Divco West Real Estate Services, Inc., an affiliate of the borrower.
Partial Release. Not permitted.
Real Estate Substitution. Not permitted.
Subordinate and Mezzanine Indebtedness. None.
Letter of Credit. None.
Right of First Offer / Right of First Refusal. None.
Ground Lease. None.
Terrorism Insurance. The borrower is required to obtain and maintain property insurance and business interruption insurance for 24 months plus a 365-day extended period of indemnity. Such insurance is required to cover perils of terrorism and acts of terrorism. If the Terrorism Risk Insurance Program Reauthorization Act of 2015 is not in effect, the borrower will only be required to pay for terrorism insurance a maximum of two times the annual insurance premiums payable for the CX - 250 Water Street Property at the time with respect to the property and business income or rental income insurance interruption policies (excluding the terrorism and earthquake components of such premiums). See “Risk Factors—Risks Relating to the Mortgage Loans—Terrorism Insurance May Not Be Available for All Mortgaged Properties” in the prospectus.
| THE INFORMATION IN THIS STRUCTURAL AND COLLATERAL TERM SHEET IS NOT COMPLETE AND MAY BE AMENDED PRIOR TO THE TIME OF SALE. THIS TERM SHEET IS NOT AN OFFER TO SELL THESE SECURITIES AND IT IS NOT A SOLICITATION OF AN OFFER TO BUY THESE SECURITIES IN ANY JURISDICTION WHERE THE OFFER OR SALE IS NOT PERMITTED. | ||
| 89 | ||
| Multifamily – Garden | Loan #6 & 7 | Cut-off Date Balance: | $40,000,000 | |
| Various | BLE Portfolio and La Primavera | Cut-off Date LTV: | 58.8% | |
| Houston, TX | Crossed Loan Group | U/W NCF DSCR: | 1.22x | |
| U/W NOI Debt Yield: | 9.5% |

| THE INFORMATION IN THIS STRUCTURAL AND COLLATERAL TERM SHEET IS NOT COMPLETE AND MAY BE AMENDED PRIOR TO THE TIME OF SALE. THIS TERM SHEET IS NOT AN OFFER TO SELL THESE SECURITIES AND IT IS NOT A SOLICITATION OF AN OFFER TO BUY THESE SECURITIES IN ANY JURISDICTION WHERE THE OFFER OR SALE IS NOT PERMITTED. | ||
| 90 | ||
| Multifamily – Garden | Loan #6 & 7 | Cut-off Date Balance: | $40,000,000 | |
| Various | BLE Portfolio and La Primavera | Cut-off Date LTV: | 58.8% | |
| Houston, TX | Crossed Loan Group | U/W NCF DSCR: | 1.22x | |
| U/W NOI Debt Yield: | 9.5% |
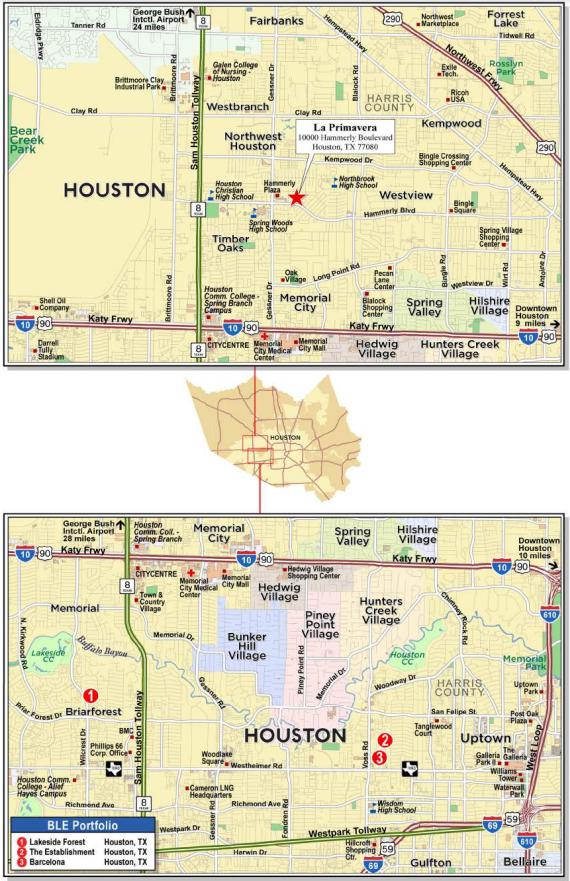
| THE INFORMATION IN THIS STRUCTURAL AND COLLATERAL TERM SHEET IS NOT COMPLETE AND MAY BE AMENDED PRIOR TO THE TIME OF SALE. THIS TERM SHEET IS NOT AN OFFER TO SELL THESE SECURITIES AND IT IS NOT A SOLICITATION OF AN OFFER TO BUY THESE SECURITIES IN ANY JURISDICTION WHERE THE OFFER OR SALE IS NOT PERMITTED. | ||
| 91 | ||
Nos. 6 & 7 – BLE Portfolio and La Primavera Crossed Loan Group(1) | |||||||
| Mortgage Loan Information | Mortgaged Property Information | ||||||
| Mortgage Loan Seller: | Argentic Real Estate Finance 2 LLC | Single Asset/Portfolio: | Portfolio | ||||
| Credit Assessment (Fitch/KBRA/Moody’s): | NR/NR/NR | Property Type – Subtype: | Multifamily – Garden | ||||
| Original Principal Balance(1): | $40,000,000 | Location: | Houston, TX | ||||
| Cut-off Date Balance(1): | $40,000,000 | Size: | 1,008 Units | ||||
| % of Initial Pool Balance: | 4.4% | Cut-off Date Balance Per Unit: | $79,514 | ||||
| Loan Purpose: | Refinance | Maturity Date Balance Per Unit: | $79,514 | ||||
| Borrower Sponsor: | Swapnil Agarwal | Year Built/Renovated: | Various/2019-2020 | ||||
| Guarantor: | Swapnil Agarwal | Title Vesting(7): | Leasehold | ||||
| Mortgage Rate(2): | Various | Property Manager: | KPM Property Management, LLC | ||||
| Note Date(2): | Various | Current Occupancy (As of)(8): | 90.1% (Various) | ||||
| Seasoning(2): | Various | YE 2022 Occupancy: | 92.5% | ||||
| Maturity Date(2): | Various | YE 2021 Occupancy: | 91.5% | ||||
| IO Period: | 120 months | YE 2020 Occupancy: | 89.0% | ||||
| Loan Term (Original): | 120 months | YE 2019 Occupancy: | NAV | ||||
| Amortization Term (Original): | NAP | As-Is Appraised Value(9): | $136,300,000 | ||||
| Loan Amortization Type: | Interest Only | As-Is Appraised Value Per Unit(9): | $135,218 | ||||
| Call Protection(3)(4): | Various | As-Is Appraisal Valuation Date(9): | Various | ||||
| Lockbox Type(5): | Soft/In Place Cash Management | ||||||
| Additional Debt(1): | Pari Passu | Underwriting and Financial Information(10) | |||||
| Additional Debt Type (Balance)(1): | $40,150,000 | TTM NOI(11)(12): | $4,812,799 | ||||
| YE 2022 NOI: | $4,947,590 | ||||||
| YE 2021 NOI: | $4,973,181 | ||||||
| U/W Revenues: | $12,604,597 | ||||||
| U/W Expenses: | $4,982,591 | ||||||
| U/W NOI(11): | $7,622,006 | ||||||
| Escrows and Reserves(6) | U/W NCF: | $7,286,389 | |||||
| Initial | Monthly | Cap | U/W DSCR based on NOI/NCF: | 1.28x / 1.22x | |||
| Taxes: | $1,480,172 | Springing | NAP | U/W Debt Yield based on NOI/NCF: | 9.5% / 9.1% | ||
| Insurance: | $334,134 | $59,395 | NAP | U/W Debt Yield at Maturity based on NOI/NCF: | 9.5% / 9.1% | ||
| Replacement Reserve: | $515,000 | $27,968 | NAP | Cut-off Date LTV Ratio: | 58.8% | ||
| Immediate Repairs: | $444,720 | $0 | NAP | LTV Ratio at Maturity: | 58.8% | ||
| PFC Payments Reserve: | $0 | Springing | NAP | ||||
| Sources and Uses | ||||||||||
| Sources | Uses | |||||||||
| BLE Portfolio Whole Loan | $54,650,000 | 61.8 | % | Loan Payoff | $71,744,821 | 81.1 | % | |||
| La Primavera Whole Loan | 25,500,000 | 28.8 | Closing Costs(13) | 13,898,760 | 15.7 | |||||
| Borrower Equity Contribution | 8,267,607 | 9.4 | Upfront Reserves | 2,774,026 | 3.1 | |||||
| Total Sources | $88,417,607 | 100.0 | % | Total Uses: | $88,417,607 | 100.0 | % | |||
| (1) | The BLE Portfolio and La Primavera Crossed Mortgage Loans (as defined below) are part of the BLE Portfolio and La Primavera Crossed Whole Loans (as defined below), with outstanding principal balances as of the Cut-off Date of $54,650,000 and $25,500,000, respectively, which are cross-collateralized and cross-defaulted with one another. All information herein presents the BLE Portfolio and La Primavera Crossed Whole Loans as one whole loan, except as otherwise specified. The Underwriting and Financial Information presented above, including the applicable debt service coverage ratios, debt yields, and loan-to-value ratios, is based upon the indebtedness evidenced by both whole loans. On an individual basis, without regard to the cross-collateralization feature, a whole loan may have a lower debt service coverage ratio, lower debt yield and/or higher loan-to-value ratio, than is presented in the table above. |
| (2) | The BLE Portfolio Whole Loan (as defined below) has a Mortgage Rate of 7.2640%, a Note Date of October 5, 2023, Seasoning of two months, and a Maturity Date of October 6, 2033. The La Primavera Whole Loan (as defined below) has a Mortgage Rate of 7.5320%, a Note Date of October 23, 2023, Seasoning of one month, and a Maturity Date of November 6, 2033. |
| (3) | The Call Protection for the BLE Portfolio Whole Loan is L(26),D(90),O(4). The lockout period will be at least 26 months beginning with and including the first payment on November 6, 2023. Defeasance of the BLE Portfolio Whole Loan is permitted after the date that is the earlier of (i) two years from the closing date of the securitization that includes the last note to be securitized and (ii) October 5, 2026. The assumed lockout period of 26 payments is based on the anticipated closing date of the MSWF 2023-2 securitization trust in December 2023. The actual lockout period may be longer. |
| (4) | The Call Protection for the La Primavera Whole Loan is L(25),D(91),O(4). The lockout period will be at least 25 months beginning with and including the first payment on December 6, 2023. Defeasance of the La Primavera Whole Loan is permitted after the date that is the earlier of (i) two years from the closing date of the securitization that includes the last note to be securitized and (ii) October 23, 2026. The assumed lockout period of 25 payments is based on the anticipated closing date of the MSWF 2023-2 securitization trust in December 2023. The actual lockout period may be longer. |
| (5) | The BLE Portfolio and La Primavera Crossed Whole Loans are structured with in-place cash management and provide full recourse to the guarantor until the Tax Exemption (as defined below) under the Public Facility Corporation Program (“PFC Program”) is granted for the BLE Portfolio and La Primavera Properties (as defined below). See “Lockbox and Cash Management” below for further information. |
| (6) | The amounts shown represent the combined amounts for the BLE Portfolio Whole Loan and the La Primavera Whole Loan. See “Escrows” below for further discussion of reserve requirements. |
| THE INFORMATION IN THIS STRUCTURAL AND COLLATERAL TERM SHEET IS NOT COMPLETE AND MAY BE AMENDED PRIOR TO THE TIME OF SALE. THIS TERM SHEET IS NOT AN OFFER TO SELL THESE SECURITIES AND IT IS NOT A SOLICITATION OF AN OFFER TO BUY THESE SECURITIES IN ANY JURISDICTION WHERE THE OFFER OR SALE IS NOT PERMITTED. | ||
| 92 | ||
| Multifamily – Garden | Loan #6 & 7 | Cut-off Date Balance: | $40,000,000 | |
| Various | BLE Portfolio and La Primavera | Cut-off Date LTV: | 58.8% | |
| Houston, TX | Crossed Loan Group | U/W NCF DSCR: | 1.22x | |
| U/W NOI Debt Yield: | 9.5% |
| (7) | Each of the BLE Portfolio Properties and the La Primavera Property are encumbered by a separate 99-year ground lease as part of the PFC Program. See “The Properties” below for further information. |
| (8) | Current Occupancy is as of August 15, 2023 for the BLE Portfolio Properties and as of October 17, 2023 for the La Primavera Property. |
| (9) | The As-Is Appraised Value and As-Is Appraised Value Per Unit shown represent the combined “As Encumbered” values of the leasehold interests for the BLE Portfolio and La Primavera Properties as of October 1, 2023 for the Lakeside Forest Property and La Primavera Property and July 19, 2023 for The Establishment Property and Barcelona Property, which assume the BLE Portfolio and La Primavera Properties are encumbered by a ground lease as part of the PFC Program and that the Tax Savings Payment (as defined below) is subordinate to the BLE Portfolio Whole Loan and La Primavera Whole Loan. The market-based “As Is” appraised values, which assume no Tax Exemptions for the BLE Portfolio and La Primavera Properties, are $68,400,000 and $32,700,000, respectively. See “The Properties” below for further information. |
| (10) | The underwriting and financial information shown represents the BLE Portfolio and La Primavera Crossed Whole Loans in aggregate. |
| (11) | The increase in U/W NOI from TTM NOI is primarily due to the anticipated real estate tax savings related to the admission of the BLE Portfolio and La Primavera Properties into the PFC Program. |
| (12) | TTM NOI is as of the trailing-12 months dated July 31, 2023 for the BLE Portfolio Properties and as of the trailing-12 months dated August 31, 2023 for the La Primavera Property. |
| (13) | Closing Costs include approximately $4.0 million in origination fees and approximately $4.1 million in upfront fees and related legal fee reimbursement paid to the TEHPFC (as defined below) as a condition for admission into the PFC Program. |
The Mortgage Loans. The sixth and seventh largest mortgage loans (individually, the “BLE Portfolio Mortgage Loan” and the “La Primavera Mortgage Loan”, and collectively, the “BLE Portfolio and La Primavera Crossed Mortgage Loans”) are part of two whole loans (individually, the “BLE Portfolio Whole Loan” and the “La Primavera Whole Loan”, and collectively, the “BLE Portfolio and La Primavera Crossed Whole Loans”) that are cross-collateralized and cross-defaulted with one another and are not permitted to be uncrossed by the borrowers, except in connection with the release of an individual property securing the BLE Portfolio Whole Loan as described under “Release of Property” below.
The BLE Portfolio Mortgage Loan is part of the BLE Portfolio Whole Loan evidenced by four pari passu notes with an aggregate outstanding principal balance as of the Cut-off Date of $54,650,000. The BLE Portfolio Whole Loan is secured by the applicable borrowers’ leasehold interests in three garden-style multifamily properties located in Houston, Texas (the “Barcelona Property”, the “Lakeside Forest Property” and “The Establishment Property”, and collectively, the “BLE Portfolio Properties”). The BLE Portfolio Mortgage Loan is evidenced by the controlling Note A-1-1 and the non-controlling Note A-2-2, with an aggregate principal balance as of the Cut-off Date of $27,300,000. The BLE Portfolio Whole Loan was originated by Argentic Real Estate Finance 2 LLC (“AREF2”) and Barclays Capital Real Estate Inc. (“Barclays”) on October 5, 2023. The remaining pari passu notes in the aggregate original principal balance of $27,350,000 are expected to be contributed to one or more future securitization transactions. The BLE Portfolio Whole Loan will be serviced pursuant to the pooling and servicing agreement for the MSWF 2023-2 securitization trust. See “Description of the Mortgage Pool—The Whole Loans—The Serviced Pari Passu Whole Loans” and “Pooling and Servicing Agreement” in the prospectus.
The La Primavera Mortgage Loan is part of the La Primavera Whole Loan evidenced by four pari passu notes with an aggregate outstanding principal balance as of the cut-off date of $25,500,000. The La Primavera Whole Loan is secured by the applicable borrower’s leasehold interest in a garden-style multifamily property located in Houston, Texas (the “La Primavera Property” and, together with the BLE Portfolio Properties, the “BLE Portfolio and La Primavera Properties”). The La Primavera Mortgage Loan is evidenced by the controlling Note A-1-1 and the non-controlling Note A-2-1, with an aggregate principal balance as of the Cut-off Date of $12,700,000. The La Primavera Whole Loan was originated by AREF2 and Barclays on October 23, 2023. The remaining pari passu notes in the aggregate original principal balance of $12,800,000 are expected to be contributed to one or more future securitization transactions. The La Primavera Whole Loan will be serviced pursuant to the pooling and servicing agreement for the MSWF 2023-2 securitization trust. See “Description of the Mortgage Pool—The Whole Loans—The Serviced Pari Passu Whole Loans” and “Pooling and Servicing Agreement” in the prospectus.
BLE Portfolio Whole Loan Note Summary
| Notes | Original Balance | Cut-off Date Balance | Note Holder | Controlling Note |
| A-1-1 | $19,110,000 | $19,110,000 | MSWF 2023-2 | Yes |
| A-1-2(1) | $13,680,000 | $13,680,000 | AREF2 | No |
| A-2-1(1) | $13,670,000 | $13,670,000 | Barclays | No |
| A-2-2 | $8,190,000 | $8,190,000 | MSWF 2023-2 | No |
| Total | $54,650,000 | $54,650,000 |
| (1) | Expected to be contributed to one or more securitization trusts. |
| THE INFORMATION IN THIS STRUCTURAL AND COLLATERAL TERM SHEET IS NOT COMPLETE AND MAY BE AMENDED PRIOR TO THE TIME OF SALE. THIS TERM SHEET IS NOT AN OFFER TO SELL THESE SECURITIES AND IT IS NOT A SOLICITATION OF AN OFFER TO BUY THESE SECURITIES IN ANY JURISDICTION WHERE THE OFFER OR SALE IS NOT PERMITTED. | ||
| 93 | ||
| Multifamily – Garden | Loan #6 & 7 | Cut-off Date Balance: | $40,000,000 | |
| Various | BLE Portfolio and La Primavera | Cut-off Date LTV: | 58.8% | |
| Houston, TX | Crossed Loan Group | U/W NCF DSCR: | 1.22x | |
| U/W NOI Debt Yield: | 9.5% |
La Primavera Whole Loan Note Summary
Notes | Original Balance | Cut-off Date Balance | Note Holder | Controlling Note |
| A-1-1 | $8,890,000 | $8,890,000 | MSWF 2023-2 | Yes |
| A-1-2(1) | $6,410,000 | $6,410,000 | AREF2 | No |
| A-2-1 | $3,810,000 | $3,810,000 | MSWF 2023-2 | No |
| A-2-2(1) | $6,390,000 | $6,390,000 | Barclays | No |
| Total | $25,500,000 | $25,500,000 |
| (1) | Expected to be contributed to one or more securitization trusts. |
The Borrowers and the Borrower Sponsors. The borrowers with respect to the BLE Portfolio Whole Loan are Barcelona Apartments, LLC, The Establishment, LLC, and Lakeside Forest, LLC, each a Delaware limited liability company and special purpose entity with two independent directors. The borrower with respect to the La Primavera Whole Loan is Hunters Chase, LLC, a Delaware limited liability company and special purpose entity with two independent directors. A non-consolidation opinion was provided in connection with the origination of the BLE Portfolio Whole Loan and La Primavera Whole Loan. The borrower sponsor and guarantor is Swapnil Agarwal. Swapnil Agarwal is the founder and managing principal of Nitya Capital. Nitya Capital, based in Houston, Texas, is a real estate investment firm that owns and manages approximately $2 billion in real estate assets across the United States. Since inception in 2013, Nitya Capital has acquired over 20,000 multifamily units, 627 student housing units, 1.0 million square feet of office, and approximately 300,000 square feet of retail/mixed-use space. Nitya Capital currently owns 78 properties, totaling approximately 18 million square feet.
The Properties. The BLE Portfolio and La Primavera Properties comprise four garden-style multifamily properties totaling 1,008 units located in Houston, Texas. The following table presents certain information relating to the BLE Portfolio and La Primavera Properties:
Crossed Portfolio Summary
| Property Name | Location | Year Built / Renovated | Number of Units | Occ. %(1) | Allocated Cut-off Date Whole Loan Amount (“ALA”) | Appraised Value(2) | U/W Net Cash Flow | % of U/W Net Cash Flow |
| Lakeside Forest | Houston, TX | 1975 / 2019-2020 | 240 | 87.5% | $25,614,000 | $32,900,000 | $1,812,281 | 24.9% |
| The Establishment | Houston, TX | 1971 / 2019-2020 | 313 | 90.1% | $20,670,000 | $44,800,000 | $2,342,366 | 32.1% |
| Barcelona | Houston, TX | 1963 / 2019-2020 | 127 | 91.3% | $8,366,000 | $14,300,000 | $725,821 | 10.0% |
| BLE Portfolio Total/Wtd. Avg. | 680 | 89.4% | $54,650,000 | $92,000,000 | $4,880,469 | 67.0% | ||
| La Primavera | Houston, TX | 1974 / 2019-2020 | 328 | 91.5% | $25,500,000 | $44,300,000 | $2,405,920 | 33.0% |
| Crossed Portfolio Total/Wtd. Avg. | 1,008 | 90.1% | $80,150,000 | $136,300,000 | $7,286,389 | 100.0% |
| (1) | Occ. % is as of August 15, 2023 for the BLE Portfolio Properties and as of October 17, 2023 for the La Primavera Property. |
| (2) | The Appraised Values shown represent the “As Encumbered” values of the leasehold interests for the BLE Portfolio and La Primavera Properties, which assume the BLE Portfolio and La Primavera Properties are encumbered by a ground lease as part of the PFC Program and that the Tax Savings Payment is subordinate to the BLE Portfolio Whole Loan and La Primavera Whole Loan. |
Lakeside Forest. The Lakeside Forest Property is a 240-unit garden-style multifamily property in Houston, Texas, located approximately 12 miles west of downtown Houston. Constructed in 1975 and most recently renovated in 2019-2020, the Lakeside Forest Property consists of 23 two-story buildings situated on an approximately 10.11-acre site. Since the Lakeside Forest Property was acquired in May 2018, the borrower sponsor has invested approximately $2.0 million in various renovation projects. The Lakeside Forest Property offers amenities such as a fitness center, playground, two laundry facilities, and two swimming pools. The unit mix includes 84 one-bedroom, 101 two-bedroom, 51 three-bedroom, and four four-bedroom floorplans, with an average unit size of 1,051 square feet. Unit amenities include balcony/patio, ceiling fans, dishwasher, and laundry connections in select units. The Lakeside Forest Property features 395 parking spaces, resulting in a parking ratio of approximately 1.6 spaces per unit. As of August 15, 2023, the Lakeside Forest Property was 87.5% occupied.
| THE INFORMATION IN THIS STRUCTURAL AND COLLATERAL TERM SHEET IS NOT COMPLETE AND MAY BE AMENDED PRIOR TO THE TIME OF SALE. THIS TERM SHEET IS NOT AN OFFER TO SELL THESE SECURITIES AND IT IS NOT A SOLICITATION OF AN OFFER TO BUY THESE SECURITIES IN ANY JURISDICTION WHERE THE OFFER OR SALE IS NOT PERMITTED. | ||
| 94 | ||
| Multifamily – Garden | Loan #6 & 7 | Cut-off Date Balance: | $40,000,000 | |
| Various | BLE Portfolio and La Primavera | Cut-off Date LTV: | 58.8% | |
| Houston, TX | Crossed Loan Group | U/W NCF DSCR: | 1.22x | |
| U/W NOI Debt Yield: | 9.5% |
The following table presents a summary regarding the unit mix of the Lakeside Forest Property:
Lakeside Forest Property Unit Mix(1)
| Unit Type | # of Units | % of Units | Occupied Units | Occupancy | Average Unit Size (SF) | Avg. Monthly Rent Per Unit | Monthly Market Rent Per Unit(2) |
| One Bedroom | 84 | 35.0% | 74 | 88.1% | 721 | $894 | $835-$930 |
| Two Bedroom | 101 | 42.1% | 85 | 84.2% | 1,158 | $1,169 | $925-$1,375 |
| Three Bedroom | 51 | 21.3% | 48 | 94.1% | 1,347 | $1,463 | $1,360-$1,550 |
| Four Bedroom | 4 | 1.7% | 3 | 75.0% | 1,500 | $1,609 | $1,590 |
| Total/Wtd. Avg. | 240 | 100.0% | 210 | 87.5% | 1,051 | $1,146 | $1,148 |
| (1) | Based on the applicable borrower’s rent roll dated August 15, 2023. |
| (2) | Based on the appraiser’s concluded market rents. |
The Establishment. The Establishment Property is a 313-unit garden-style multifamily property in Houston, Texas, located approximately 10 miles west of downtown Houston. Constructed in 1971 and most recently renovated in 2019-2020, The Establishment Property consists of 13 two-story buildings situated on an approximately 9.65-acre site. Since The Establishment Property was acquired in February 2018, the borrower sponsor has invested approximately $1.3 million in various renovation projects. The Establishment Property offers amenities such as a fitness center, six laundry facilities, and three swimming pools. The unit mix includes 177 one-bedroom, 103 two-bedroom, and 33 three-bedroom floorplans, with an average unit size of 892 square feet. Unit amenities include balcony/patio, ceiling fans, stainless steel or black appliances, and granite or resurfaced countertops. The Establishment Property features 523 parking spaces, resulting in a parking ratio of approximately 1.7 spaces per unit. As of August 15, 2023, The Establishment Property was 90.1% occupied.
The following table presents a summary regarding the unit mix of The Establishment Property:
The Establishment Property Unit Mix(1)
| Unit Type | # of Units | % of Units | Occupied Units | Occupancy | Average Unit Size (SF) | Avg. Monthly Rent Per Unit | Monthly Market Rent Per Unit(2) |
| One Bedroom | 177 | 56.5% | 157 | 88.7% | 685 | $864 | $925-$1,150 |
| Two Bedroom | 103 | 32.9% | 93 | 90.3% | 1,109 | $1,096 | $1,085-$1,250 |
| Three Bedroom | 33 | 10.5% | 32 | 97.0% | 1,321 | $1,372 | $1,325-$1,650 |
| Total/Wtd. Avg. | 313 | 100.0% | 282 | 90.1% | 892 | $998 | $1,083 |
| (1) | Based on the applicable borrower’s rent roll dated August 15, 2023. |
| (2) | Based on the appraiser’s concluded market rents. |
Barcelona. The Barcelona Property is a 127-unit garden-style multifamily property in Houston, Texas, located approximately 10 miles west of downtown Houston. Constructed in 1963 and most recently renovated in 2019-2020, the Barcelona Property consists of 16 two-story buildings situated on an approximately 4.17-acre site. Since the Barcelona Property was acquired in June 2018, the borrower sponsor has invested approximately $925,000 in various renovation projects. The Barcelona Property offers amenities such as a swimming pool, two laundry facilities, sundeck, and reserved parking. The unit mix includes 60 one-bedroom, 62 two-bedroom, and five three-bedroom floorplans, with an average unit size of 915 square feet. Unit amenities include stainless steel or black appliances, balcony/patio, ceiling fans, and dishwashers. The Barcelona Property features 200 parking spaces, resulting in a parking ratio of approximately 1.6 spaces per unit. As of August 15, 2023, the Barcelona Property was 91.3% occupied.
| THE INFORMATION IN THIS STRUCTURAL AND COLLATERAL TERM SHEET IS NOT COMPLETE AND MAY BE AMENDED PRIOR TO THE TIME OF SALE. THIS TERM SHEET IS NOT AN OFFER TO SELL THESE SECURITIES AND IT IS NOT A SOLICITATION OF AN OFFER TO BUY THESE SECURITIES IN ANY JURISDICTION WHERE THE OFFER OR SALE IS NOT PERMITTED. | ||
| 95 | ||
| Multifamily – Garden | Loan #6 & 7 | Cut-off Date Balance: | $40,000,000 | |
| Various | BLE Portfolio and La Primavera | Cut-off Date LTV: | 58.8% | |
| Houston, TX | Crossed Loan Group | U/W NCF DSCR: | 1.22x | |
| U/W NOI Debt Yield: | 9.5% |
The following table presents a summary regarding the unit mix of the Barcelona Property:
Barcelona Property Unit Mix(1)
| Unit Type | # of Units | % of Units | Occupied Units | Occupancy | Average Unit Size (SF) | Avg. Monthly Rent Per Unit | Monthly Market Rent Per Unit(2) |
| One Bedroom | 60 | 47.2% | 53 | 88.3% | 770 | $825 | $800-$855 |
| Two Bedroom | 62 | 48.8% | 58 | 93.5% | 1,018 | $1,032 | $1,025-$1,300 |
| Three Bedroom | 5 | 3.9% | 5 | 100.0% | 1,377 | $1,462 | $1,500-$1,700 |
| Total/Wtd. Avg. | 127 | 100.0% | 116 | 91.3% | 915 | $956 | $1,015 |
| (1) | Based on the applicable borrower’s rent roll dated August 15, 2023. |
| (2) | Based on the appraiser’s concluded market rents. |
La Primavera. The La Primavera Property is a 328-unit garden-style multifamily property in Houston, Texas, located approximately 11 miles northwest of downtown Houston. Constructed in 1974 and most recently renovated in 2019-2020, the La Primavera Property consists of 23 two-story buildings situated on an approximately 9.73-acre site. Since the La Primavera Property was acquired in December 2017, the borrower sponsor has invested approximately $1.4 million in various renovation projects. The La Primavera Property offers amenities such as controlled access, three laundry facilities, and two swimming pools. The unit mix includes 168 one-bedroom, 112 two-bedroom, and 48 three-bedroom floorplans, with an average unit size of 786 square feet. Unit amenities include balcony/patio, ceiling fans, dishwasher, and laundry connections in select units. The La Primavera Property features 432 parking spaces, resulting in a parking ratio of approximately 1.3 spaces per unit. As of October 17, 2023, the La Primavera Property was 91.5% occupied.
The following table presents a summary regarding the unit mix of the La Primavera Property:
La Primavera Property Unit Mix(1)
| Unit Type | # of Units | % of Units | Occupied Units | Occupancy | Average Unit Size (SF) | Avg. Monthly Rent Per Unit | Monthly Market Rent Per Unit(2) |
| One Bedroom | 168 | 51.2% | 146 | 86.9% | 605 | $789 | $810-$875 |
| Two Bedroom | 112 | 34.1% | 107 | 95.5% | 877 | $1,012 | $950-$1,125 |
| Three Bedroom | 48 | 14.6% | 47 | 97.9% | 1,205 | $1,323 | $1,285-$1,380 |
| Total/Wtd. Avg. | 328 | 100.0% | 300 | 91.5% | 786 | $952 | $976 |
| (1) | Based on the applicable borrower’s rent roll dated October 17, 2023. |
| (2) | Based on the appraiser’s concluded market rents. |
Pursuant to the PFC Program, in the State of Texas, a property will be exempt from all property taxes (the “Tax Exemption”) if it meets certain conditions including, among other things, (i) a portion of the property is utilized for the purpose of affordable housing; and (ii) the fee interest to the property is owned by the governing body overseeing the PFC Program. In order to receive the Tax Exemption, the BLE Portfolio and La Primavera Properties are required to set aside or rent at least 50% of the units to tenants earning less than 80% of the area median income (“AMI”) established by the Department of Housing and Urban Development for the applicable metropolitan area (the "Affordable Units"), with at least 3% of the Affordable Units reserved for individuals and families earning no more than 30% of the applicable AMI (the “30% Units”) and at least 10% of the Affordable Units reserved for individuals and families earning no more than 60% of the applicable AMI, inclusive of the 30% Units. Furthermore, the monthly rents for the Affordable Units cannot exceed 35% of the stated percentage multiplied by the AMI, divided by 12. The income and rent limits are not required to be adjusted for family size and the Affordable Units can be allocated among the various unit types within an individual property and as selected by the applicable borrower(s). With the exception of a small percentage of units, the in-place rents at the BLE Portfolio and La Primavera Properties currently generally comply with the rent limits under the PFC Program documents. The appraiser concluded the rental rates are currently below maximum allowable rental rates for most units. The borrowers have entered into 99-year ground leases between the Texas Essential Housing Public Facility Corporation (“TEHPFC”), as ground lessor, and the applicable borrower, as ground lessee (see “Ground Lease” below).
| THE INFORMATION IN THIS STRUCTURAL AND COLLATERAL TERM SHEET IS NOT COMPLETE AND MAY BE AMENDED PRIOR TO THE TIME OF SALE. THIS TERM SHEET IS NOT AN OFFER TO SELL THESE SECURITIES AND IT IS NOT A SOLICITATION OF AN OFFER TO BUY THESE SECURITIES IN ANY JURISDICTION WHERE THE OFFER OR SALE IS NOT PERMITTED. | ||
| 96 | ||
| Multifamily – Garden | Loan #6 & 7 | Cut-off Date Balance: | $40,000,000 | |
| Various | BLE Portfolio and La Primavera | Cut-off Date LTV: | 58.8% | |
| Houston, TX | Crossed Loan Group | U/W NCF DSCR: | 1.22x | |
| U/W NOI Debt Yield: | 9.5% |
Rent Restrictions Summary(1)
| Property | 30% of AMI | 60% of AMI | 80% of AMI | Average In-Place Monthly Rental Rate(2) |
| Lakeside Forest | $816 | $1,631 | $2,175 | $1,146 |
| The Establishment | $816 | $1,631 | $2,175 | $998 |
| Barcelona | $816 | $1,631 | $2,175 | $956 |
| La Primavera | $816 | $1,631 | $2,175 | $952 |
| (1) | Information obtained from the appraisals. |
| (2) | Information obtained from the underwritten rent rolls. |
All four of the BLE Portfolio and La Primavera Properties have entered into the PFC Program. The Barcelona Property and The Establishment Property entered into the PFC Program in May 2023 while the Lakeside Forest Property and La Primavera Property entered into the PFC Program in October 2023. The Tax Exemption has been granted for the Barcelona Property and The Establishment Property but has not yet been granted for the Lakeside Forest Property and La Primavera Property. The review and processing time frame for the applicable central appraisal districts to issue tax exemptions after properties have formally entered the PFC Program have historically ranged from three to six months on average. Each of the BLE Portfolio Whole Loan and La Primavera Whole Loan is structured with in-place cash management and provides full recourse to the guarantor until such time as the Tax Exemption is approved and made effective with the applicable central appraisal district for, in relation to the BLE Portfolio Whole Loan, the entirety of the BLE Portfolio Properties, and, in relation to the La Primavera Whole Loan, the La Primavera Property. The Tax Exemption for the Barcelona Property and The Establishment Property is retroactive to, and the Tax Exemption once issued for the Lakeside Forest Property and the La Primavera Property is expected to be retroactive to, the date fee ownership in the applicable property was transferred by the applicable borrower to the TEHPFC (May 31, 2023 for The Establishment Property and Barcelona Property, October 5, 2023 for the Lakeside Forest Property, and October 23, 2023 for the La Primavera Property) and continues for the term of the related ground lease or until its earlier termination. No real estate taxes were underwritten due to entry into the PFC Program.
The BLE Portfolio Whole Loan documents and La Primavera Whole Loan documents require the applicable borrower(s) to partially prepay (in conjunction with the applicable payment of yield maintenance premium) the applicable whole loan within 30 days in the amount necessary for the applicable properties to satisfy both a debt service coverage ratio of 1.21x with respect to the BLE Portfolio Properties and 1.24x with respect to the La Primavera Property and a debt yield of 8.93% with respect to the BLE Portfolio Properties and 9.43% with respect to the La Primavera Property (“PFC Termination Prepayment”), if in relation to any of the BLE Portfolio and La Primavera Properties, either (i) the Tax Exemption is not granted by (x) October 5, 2024 with respect to the BLE Portfolio Properties and (y) October 23, 2024 with respect to the La Primavera Property or (ii) the PFC Program documents applicable to such property are terminated, the Tax Exemption is lost and/or the applicable borrower otherwise surrenders the leasehold estate created by its ground lease with the TEHPFC and such borrower acquires the fee interest in the applicable property. The BLE Portfolio Whole Loan documents and La Primavera Whole Loan documents provide recourse to the guarantor for the PFC Termination Prepayment.
The counsel for the TEHPFC issued a legal opinion for the benefit of the borrowers and lenders opining that the BLE Portfolio and La Primavera Properties (including both the fee and leasehold interest therein) should be held by the Chief Appraiser for Harris County to be exempt from ad valorem taxation under the Texas Property Tax Code. We cannot assure you that the Tax Exemption will be obtained for the Lakeside Forest Property and La Primavera Property as expected or at all. At loan origination, 10 months of unabated real estate taxes for the La Primavera Property, 9.5 months of unabated real estate taxes for the Lakeside Forest Property, and five months of unabated real estate taxes for each of the Barcelona Property and The Establishment Property were deposited into the applicable real estate tax reserve.
The following table presents historical occupancy percentages at the BLE Portfolio and La Primavera Properties:
Historical Occupancy
12/31/2020(1)(2) | 12/31/2021(1)(2) | 12/31/2022(1)(2) | Current(3)(4) |
| 89.0% | 91.5% | 92.5% | 90.1% |
| (1) | Represents the average occupancy for the BLE Portfolio and La Primavera Properties during the trailing-12 month period. |
| (2) | Information obtained from the borrowers. |
| (3) | Information obtained from the underwritten rent rolls. |
| (4) | Current occupancy is as of August 15, 2023 for the BLE Portfolio Properties and as of October 17,2023 for the La Primavera Property. |
| THE INFORMATION IN THIS STRUCTURAL AND COLLATERAL TERM SHEET IS NOT COMPLETE AND MAY BE AMENDED PRIOR TO THE TIME OF SALE. THIS TERM SHEET IS NOT AN OFFER TO SELL THESE SECURITIES AND IT IS NOT A SOLICITATION OF AN OFFER TO BUY THESE SECURITIES IN ANY JURISDICTION WHERE THE OFFER OR SALE IS NOT PERMITTED. | ||
| 97 | ||
| Multifamily – Garden | Loan #6 & 7 | Cut-off Date Balance: | $40,000,000 | |
| Various | BLE Portfolio and La Primavera | Cut-off Date LTV: | 58.8% | |
| Houston, TX | Crossed Loan Group | U/W NCF DSCR: | 1.22x | |
| U/W NOI Debt Yield: | 9.5% |
Operating History and Underwritten Net Cash Flow. The following table presents certain information relating to the operating history and underwritten net cash flow at the BLE Portfolio and La Primavera Properties:
Cash Flow Analysis(1)
| 2021 | 2022 | TTM(2) | U / W | %(3) | U / W $ Per Unit | |
| Base Rent | $11,059,358 | $11,687,066 | $12,000,162 | $12,226,230 | 100.0% | $12,129 |
| Other Income | 1,547,973 | 1,761,088 | 1,986,600 | 1,986,600 | 16.2 | 1,971 |
| Vacancy, Concessions & Credit Loss | (1,441,101) | (1,360,829) | (1,667,379) | (1,608,233) | (13.2) | (1,595) |
| Effective Gross Income | $11,166,230 | $12,087,325 | $12,319,382 | $12,604,597 | 103.1% | $12,505 |
| Real Estate Taxes | $1,676,415 | $1,993,492 | $2,235,449 | $0 | 0.0% | $0 |
| Insurance | 524,185 | 734,524 | 948,498 | 712,741 | 5.7 | 707 |
| Management Fee | 368,385 | 438,190 | 472,647 | 378,138 | 3.0 | 375 |
| Other Expenses | 3,624,064 | 3,973,528 | 3,849,990 | 3,891,712 | 30.9 | 3,861 |
| Total Expenses | $6,193,049 | $7,139,735 | $7,506,584 | $4,982,591 | 39.5% | $4,943 |
| Net Operating Income(4) | $4,973,181 | $4,947,590 | $4,812,799 | $7,622,006 | 60.5% | $7,562 |
| Capital Expenditures | 0 | 0 | 0 | 335,617 | 2.7 | 333 |
| Net Cash Flow | $4,973,181 | $4,947,590 | $4,812,799 | $7,286,389 | 57.8% | $7,229 |
| NOI DSCR(5) | 0.83x | 0.83x | 0.81x | 1.28x | ||
| NCF DSCR(5) | 0.83x | 0.83x | 0.81x | 1.22x | ||
| NOI Debt Yield(5) | 6.2% | 6.2% | 6.0% | 9.5% | ||
| NCF Debt Yield(5) | 6.2% | 6.2% | 6.0% | 9.1% |
| (1) | Represents the combined cash flows of the BLE Portfolio and La Primavera Properties. |
| (2) | TTM is as of July 31, 2023 for the BLE Portfolio Properties and as of August 31, 2023 for the La Primavera Property. |
| (3) | Represents (i) percent of Base Rent for all revenue fields and (ii) percent of Effective Gross Income for all other fields. |
| (4) | The increase in U/W Net Operating Income from TTM Net Operating Income is primarily due to the anticipated real estate tax savings related to the admission of the BLE Portfolio and La Primavera Properties into the PFC Program. |
| (5) | Debt Service coverage ratios and debt yields are based on the BLE Portfolio and La Primavera Crossed Whole Loans. |
Appraisals. The appraiser concluded to an “As Encumbered” value for the BLE Portfolio Properties and the La Primavera Property of $92,000,000 and $44,300,000, respectively. The “As Encumbered” values of the leasehold interests for the BLE Portfolio and La Primavera Properties are as of October 1, 2023 for the Lakeside Forest Property and La Primavera Property and July 19, 2023 for The Establishment Property and Barcelona Property and assume the BLE Portfolio and La Primavera Properties are encumbered by a ground lease as part of the PFC Program and that the Tax Savings Payment is subordinate to the BLE Portfolio Whole Loan and La Primavera Whole Loan. The market-based “As Is” appraised values, which assume no Tax Exemptions for the BLE Portfolio and La Primavera Properties, are $68,400,000 and $32,700,000, respectively.
Environmental Matters. According to Phase I environmental site assessments dated July 26, 2023, there was no evidence of any recognized environmental conditions at the BLE Portfolio and La Primavera Properties.
Market Overview and Competition. The BLE Portfolio and La Primavera Properties are located in the Houston multifamily market and are located within 9 to 14 miles of downtown Houston. As of the first quarter of 2023, the Houston multifamily market had an inventory of 679,912 units with a vacancy rate of 9.7%. The average rental rate in the Houston multifamily market was $1,312 per unit and there were 34,834 units under construction.
| THE INFORMATION IN THIS STRUCTURAL AND COLLATERAL TERM SHEET IS NOT COMPLETE AND MAY BE AMENDED PRIOR TO THE TIME OF SALE. THIS TERM SHEET IS NOT AN OFFER TO SELL THESE SECURITIES AND IT IS NOT A SOLICITATION OF AN OFFER TO BUY THESE SECURITIES IN ANY JURISDICTION WHERE THE OFFER OR SALE IS NOT PERMITTED. | ||
| 98 | ||
| Multifamily – Garden | Loan #6 & 7 | Cut-off Date Balance: | $40,000,000 | |
| Various | BLE Portfolio and La Primavera | Cut-off Date LTV: | 58.8% | |
| Houston, TX | Crossed Loan Group | U/W NCF DSCR: | 1.22x | |
| U/W NOI Debt Yield: | 9.5% |
The following table presents certain market information relating to the BLE Portfolio and La Primavera Properties:
Market Summary(1)
| Property Name | Location | Submarket | Submarket Inventory (Units) | Submarket Rental Rate Per Month | Average Submarket Vacancy |
| Lakeside Forest | Houston, TX | Westchase/Woodlake | 41,075 | $1,223 | 11.6% |
| The Establishment | Houston, TX | Galleria/Uptown | 24,086 | $1,521 | 8.5% |
| Barcelona | Houston, TX | Galleria/Uptown | 24,086 | $1,521 | 8.5% |
| La Primavera | Houston, TX | Spring Branch | 21,951 | $1,173 | 9.3% |
| (1) | Information obtained from the appraisals. |
Lakeside Forest. The Lakeside Forest Property is located approximately 14 miles west of downtown Houston. The neighborhood is accessible to all parts of the Houston metropolitan area due to proximity to Sam Houston Tollway, Westpark Tollway, Interstate 10, Texas State Highway 6 and numerous other primary traffic arterials. The estimated 2023 population within a one-, three-, and five-mile radius is 24,949, 185,328, and 469,685, respectively. Additionally, for the same period, the average household income within a one-, three-, and five-mile radius was $104,527, $105,204, and $94,298.
The Establishment. The Establishment Property is located approximately 10 miles west of downtown Houston. The neighborhood is accessible to all parts of the Houston metropolitan area due to proximity to Sam Houston Tollway, Westpark Tollway, Interstate 10, Texas State Highway 6 and numerous other primary traffic arterials. The estimated 2023 population within a one-, three-, and five-mile radius is 33,794, 210,494, and 512,224, respectively. Additionally, for the same period, the average household income within a one-, three-, and five-mile radius was $104,446, $107,363, and $118,319.
Barcelona. The Barcelona Property is located approximately nine miles west of downtown Houston. The neighborhood is accessible to all parts of the Houston metropolitan area due to proximity to Interstate 10, Sam Houston Tollway, Interstate 610, Westpark Tollway and numerous other primary traffic arterials. The estimated 2023 population within a one-, three-, and five-mile radius is 37,740, 215,458, and 515,032, respectively. Additionally, for the same period, the average household income within a one-, three-, and five-mile radius was $97,330, $105,427, and $118,780.
La Primavera. The La Primavera Property is located approximately 14 miles northwest of downtown Houston. The neighborhood is accessible to all parts of the Houston metropolitan area due to proximity to Sam Houston Tollway, US 290, Interstate 10 and numerous other primary traffic arterials. The estimated 2023 population within a one-, three-, and five-mile radius is 21,275, 120,061, and 283,136, respectively. Additionally, for the same period, the average household income within a one-, three-, and five-mile radius was $90,854, $104,163, and $121,066.
Escrows.
Real Estate Taxes – At loan origination, the borrowers deposited a total of approximately $1,480,172 into a reserve for real estate taxes (approximately $914,165 with respect to the BLE Portfolio Whole Loan and approximately $566,007 with respect to the La Primavera Whole Loan). On a monthly basis, the applicable borrower(s) are required to escrow 1/12th of the property taxes (taking into account any Tax Exemption) that the lenders estimate will be payable during the next 12 months, provided the applicable borrower(s) will not be required to make the monthly escrow for the BLE Portfolio Properties or La Primavera Property as described herein if the Tax Exemption is in effect or otherwise until the earlier to occur of the following in relation to such property: (A) the Tax Exemption is not formally granted by the applicable central appraisal district or (B) there is a PFC Termination Prepayment as a result of the failure to timely obtain the Tax Exemption.
Insurance – At loan origination, the borrowers deposited a total of approximately $334,134 into a reserve for insurance premiums (approximately $204,079 with respect to the BLE Portfolio Whole Loan and approximately $130,056 with respect to the La Primavera Whole Loan). On a monthly basis, the applicable borrower(s) are required to deposit approximately $40,816 with respect to the BLE Portfolio Whole Loan and approximately $18,579 with respect to the La Primavera Whole Loan into an insurance reserve.
Deferred Maintenance Reserve – At loan origination, the borrowers deposited a total of $444,720 into a reserve for the completion of deferred maintenance ($398,145 with respect to the BLE Portfolio Whole Loan and $46,575 with respect to the La Primavera Whole Loan).
Replacement Reserve – At loan origination, the applicable borrower deposited $515,000 with respect to the La Primavera Whole Loan into a replacement reserve. On a monthly basis, the applicable borrower(s) are required to deposit approximately $18,511 with respect to the BLE Portfolio Whole Loan and approximately $9,457 with respect to the La Primavera Whole Loan into a replacement reserve.
PFC Payments Reserve – The lenders are required to maintain a subaccount (the “PFC Payments Subaccount”) as a reserve for the PFC Payments (as defined below). The applicable borrower(s) are not required to make monthly deposits in the PFC Payments Subaccount in respect of PFC Payments so long as (i) no event of default has occurred and is continuing and (ii) the borrower(s) deliver
| THE INFORMATION IN THIS STRUCTURAL AND COLLATERAL TERM SHEET IS NOT COMPLETE AND MAY BE AMENDED PRIOR TO THE TIME OF SALE. THIS TERM SHEET IS NOT AN OFFER TO SELL THESE SECURITIES AND IT IS NOT A SOLICITATION OF AN OFFER TO BUY THESE SECURITIES IN ANY JURISDICTION WHERE THE OFFER OR SALE IS NOT PERMITTED. | ||
| 99 | ||
| Multifamily – Garden | Loan #6 & 7 | Cut-off Date Balance: | $40,000,000 | |
| Various | BLE Portfolio and La Primavera | Cut-off Date LTV: | 58.8% | |
| Houston, TX | Crossed Loan Group | U/W NCF DSCR: | 1.22x | |
| U/W NOI Debt Yield: | 9.5% |
evidence reasonably acceptable to the lenders that the PFC Payments due under the PFC documents are paid on or prior to the applicable due date in accordance with the PFC Program documents. To the extent deposits are required, the applicable borrower(s) are required to pay to the lenders an amount that is estimated by the lenders to be sufficient to pay the next monthly or annual installment of PFC Payments due under the PFC Program documents, and the lenders will transfer such amounts to the PFC Payments Subaccount. Provided that no event of default has occurred and is continuing, the lenders will apply the funds in the PFC Payments Subaccount to payments of PFC Payments required to be made by the applicable borrower(s) under the PFC Program documents.
Lockbox and Cash Management. Each of the BLE Portfolio Whole Loan and La Primavera Whole Loan is structured with a soft lockbox and in-place cash management until the Tax Exemption under the PFC Program has been granted, in relation to the BLE Portfolio Whole Loan, for the entirety of the BLE Portfolio Properties, and, in relation to the La Primavera Whole Loan, for the La Primavera Property. The BLE Portfolio Whole Loan documents and La Primavera Whole Loan documents require the applicable borrower(s) to deposit, or cause the manager to deposit, all rents into the lockbox within two business days of receipt. If a Cash Management Period (as defined below) is not in effect, all funds in the lockbox will be swept daily into the applicable borrower(s)’ operating account(s). During a Cash Management Period, all funds in the lockbox will be swept daily into a cash management account controlled by the lenders and applied in accordance with the BLE Portfolio Whole Loan documents or La Primavera Whole Loan documents, as applicable.
A “Cash Management Period” commenced at the origination of each of the BLE Portfolio Whole Loan and the La Primavera Whole Loan and will continue until the Tax Exemption under the PFC Program has been granted, in relation to the BLE Portfolio Whole Loan, for the entirety of the BLE Portfolio Properties, and, in relation to the La Primavera Whole Loan, for the La Primavera Property. Any future Cash Management Periods will occur upon the earliest of the following:
| (i) | the occurrence of an event of default under the BLE Portfolio Whole Loan documents or La Primavera Whole Loan documents, as applicable; or |
| (ii) | if, as of the last day of any calendar quarter, the net cash flow debt service coverage ratio is less than 1.15x based on the trailing 12 months. The calculation of the net cash flow income is required to use operating expenses of no less than $5,295 per unit and annual capital expenditure of $327 per unit with respect to the BLE Portfolio Whole Loan, and operating expenses of no less than $4,208 per unit and annual capital expenditure of $324 per unit with respect to the La Primavera Whole Loan. |
A Cash Management Period will end upon:
| ● | with regard to clause (i), if the related event of default is no longer continuing and no other event of default has occurred and is continuing; or |
| ● | with regard to clause (ii), upon the debt service coverage ratio based on the trailing 12-month period being at least 1.20x for two consecutive calendar quarters. |
Property Management. The BLE Portfolio and La Primavera Properties are managed by KPM Property Management, LLC, an affiliate of the borrowers.
Release of Property. With respect to the BLE Portfolio Whole Loan, after the earlier of (i) two years from the closing date of the securitization that includes the last note to be securitized and (ii) October 5, 2026, the applicable borrowers may obtain the release of any individual property which comprises the BLE Portfolio Properties upon a bona fide third-party sale upon satisfaction of certain conditions in the BLE Portfolio Whole Loan documents, including among other things: (i) no event of default, (ii) the borrowers partially defease the BLE Portfolio Whole Loan in the amount equal to the greater of (x) 100% of the net sales proceeds from such individual property, (y) 110% of the allocated loan amount of such individual property and (z) if after taking into account the partial defeasance, the loan-to-value ratio of the remaining properties is greater than 125%, an amount such that the loan-to-value ratio is no more than 125%, (iii) the net operating income debt yield following the release is no less than the greater of (x) 8.93% and (y) the net operating income debt yield immediately preceding such release; provided, however, if the foregoing debt yield test is not satisfied, the borrowers may, at their option, increase the defeased amount of the principal of the BLE Portfolio Whole Loan (and the amount in clause (ii) above will be increased) by such amount as may be necessary to satisfy such debt yield test, and (iv) satisfaction of all REMIC requirements.
Real Estate Substitution. Not permitted.
Subordinate and Mezzanine Indebtedness. Not permitted.
Ground Lease. Each of the BLE Portfolio and La Primavera Properties are encumbered by a separate ground lease between the TEHPFC, as ground lessor, and the applicable borrower, as ground lessee. Pursuant to each ground lease which each has a scheduled lease expiration ranging from May 2122 to October 2122, with no extensions, the applicable borrower is required to pay the TEHPFC, among other fees, as applicable, (i) an annual oversight and compliance fee equal to the sum of $100 per unit (the “Compliance Fee”) and (ii) an annual payment in the amount of 15% of the annual property tax savings received by the applicable borrower pursuant to the Tax Exemption (“Tax Savings Payment” and, together with the Compliance Fee, the “PFC Payments”). The TEHPFC entered into a fee agreement agreeing that all fees required under the PFC Program documents, including the PFC Payments, be paid from excess distributable cash, if any, after the payment of debt service payments in connection with the BLE Portfolio and La Primavera Crossed Whole Loans and operating expenses due and owing. The lenders have the PFC Payments Subaccount for the PFC Payments as described above.
Letter of Credit. None.
| THE INFORMATION IN THIS STRUCTURAL AND COLLATERAL TERM SHEET IS NOT COMPLETE AND MAY BE AMENDED PRIOR TO THE TIME OF SALE. THIS TERM SHEET IS NOT AN OFFER TO SELL THESE SECURITIES AND IT IS NOT A SOLICITATION OF AN OFFER TO BUY THESE SECURITIES IN ANY JURISDICTION WHERE THE OFFER OR SALE IS NOT PERMITTED. | ||
| 100 | ||
| Multifamily – Garden | Loan #6 & 7 | Cut-off Date Balance: | $40,000,000 | |
| Various | BLE Portfolio and La Primavera | Cut-off Date LTV: | 58.8% | |
| Houston, TX | Crossed Loan Group | U/W NCF DSCR: | 1.22x | |
| U/W NOI Debt Yield: | 9.5% |
Right of First Offer/Right of First Refusal. Under each of the applicable ground leases, in the event that the related borrower proposes to transfer the fee and leasehold estates of the applicable mortgaged property to an unaffiliated third party, terminate such ground lease and reclaim the fee interest granted to the TEHPFC, the TEHPFC will have a right of first refusal to terminate the ground lease and retain ownership of the mortgaged property on the same terms and conditions as any offer by an unaffiliated third-party acceptable to the borrower (“Third-Party Offer”). To exercise such right, the TEHPFC must deliver written notice to the applicable borrower, within five business days following the date the borrower notifies the TEHPFC of the acceptable Third-Party Offer, of its intent to exercise the right of first refusal and purchase the ground lease from the borrower for the purchase price equal to the amount of the Third-Party Offer. The TEHPFC has agreed that (i) its fee simple rights, title and interests in and to each mortgaged property are subject to the lien of the related whole loan and (ii) upon the occurrence of an event of default under the applicable whole loan, the lender may elect to foreclose the TEHPFC’s fee interest and the related borrower’s leasehold interest in the applicable mortgaged property; provided, however, that the TEHPFC has not expressly waived its right of first refusal in connection with a foreclosure, deed-in-lieu of foreclosure or other exercise of the lender’s remedies.
Terrorism Insurance. The borrowers are required to obtain and maintain property insurance that covers perils through the loan term and acts of terrorism and are required to obtain and maintain business interruption insurance for 18 months plus a six-month extended period of indemnity. See “Risk Factors—Risks Relating to the Mortgage Loans—Terrorism Insurance May Not Be Available for All Mortgaged Properties” in the prospectus.
| THE INFORMATION IN THIS STRUCTURAL AND COLLATERAL TERM SHEET IS NOT COMPLETE AND MAY BE AMENDED PRIOR TO THE TIME OF SALE. THIS TERM SHEET IS NOT AN OFFER TO SELL THESE SECURITIES AND IT IS NOT A SOLICITATION OF AN OFFER TO BUY THESE SECURITIES IN ANY JURISDICTION WHERE THE OFFER OR SALE IS NOT PERMITTED. | ||
| 101 | ||
| Retail – Anchored | Loan #8 | Cut-off Date Balance: | $40,000,000 | |
| 4348 Okeechobee Boulevard | Cross County Plaza | Cut-off Date LTV: | 64.9% | |
| West Palm Beach, FL 33409 | U/W NCF DSCR | 1.33x | ||
| U/W NOI Debt Yield | 10.5% |

| THE INFORMATION IN THIS STRUCTURAL AND COLLATERAL TERM SHEET IS NOT COMPLETE AND MAY BE AMENDED PRIOR TO THE TIME OF SALE. THIS TERM SHEET IS NOT AN OFFER TO SELL THESE SECURITIES AND IT IS NOT A SOLICITATION OF AN OFFER TO BUY THESE SECURITIES IN ANY JURISDICTION WHERE THE OFFER OR SALE IS NOT PERMITTED. | ||
| 102 | ||
| Retail – Anchored | Loan #8 | Cut-off Date Balance: | $40,000,000 | |
| 4348 Okeechobee Boulevard | Cross County Plaza | Cut-off Date LTV: | 64.9% | |
| West Palm Beach, FL 33409 | U/W NCF DSCR | 1.33x | ||
| U/W NOI Debt Yield | 10.5% |

| THE INFORMATION IN THIS STRUCTURAL AND COLLATERAL TERM SHEET IS NOT COMPLETE AND MAY BE AMENDED PRIOR TO THE TIME OF SALE. THIS TERM SHEET IS NOT AN OFFER TO SELL THESE SECURITIES AND IT IS NOT A SOLICITATION OF AN OFFER TO BUY THESE SECURITIES IN ANY JURISDICTION WHERE THE OFFER OR SALE IS NOT PERMITTED. | ||
| 103 | ||
| No. 8 – Cross County Plaza |
| Mortgage Loan Information | Mortgaged Property Information | ||||||
| Mortgage Loan Seller: | Starwood Mortgage Capital LLC | Single Asset/Portfolio: | Single Asset | ||||
Credit Assessment (Fitch/KBRA/Moody’s): | NR/NR/NR | Property Type – Subtype: | Retail – Anchored | ||||
| Original Principal Balance: | $40,000,000 | Location: | West Palm Beach, FL | ||||
| Cut-off Date Balance: | $40,000,000 | Size: | 347,093 SF | ||||
| % of Initial Pool Balance: | 4.4% | Cut-off Date Balance Per SF: | $115.24 | ||||
| Loan Purpose: | Refinance | Maturity Date Balance Per SF: | $115.24 | ||||
| Borrower Sponsor: | Paul Pollak | Year Built/Renovated: | 1991/1998 | ||||
| Guarantor: | Paul Pollak | Title Vesting(2): | Fee | ||||
| Mortgage Rate: | 7.6600% | Property Manager: | Madison Properties USA LLC | ||||
| Note Date: | October 13, 2023 | Current Occupancy (As of)(3): | 99.2% (10/5/2023) | ||||
| Seasoning: | 1 month | 1/1/2022 Occupancy: | 85.0% | ||||
| Maturity Date: | November 6, 2033 | 1/1/2021 Occupancy: | 84.2% | ||||
| IO Period: | 120 months | 1/1/2020 Occupancy: | 84.6% | ||||
| Loan Term (Original): | 120 months | As-Is Appraised Value: | $61,600,000 | ||||
| Amortization Term (Original): | NAP | As-Is Appraised Value Per SF: | $177.47 | ||||
| Loan Amortization Type: | Interest Only | As-Is Appraisal Valuation Date: | October 10, 2023 | ||||
| Call Protection: | L(25),D(91),O(4) | ||||||
| Lockbox Type: | Hard/In Place Cash Management | Underwriting and Financial Information | |||||
| Additional Debt: | None | TTM NOI (7/31/2023): | $3,777,034 | ||||
| Additional Debt Type (Balance): | NAP | YE 2022 NOI: | $3,704,320 | ||||
| YE 2021 NOI: | $3,467,218 | ||||||
| Escrows and Reserves(1) | YE 2020 NOI: | $3,130,761 | |||||
| Initial | Monthly | Cap | U/W Revenues: | $6,162,059 | |||
| Taxes | $65,927 | $65,927 | NAP | U/W Expenses: | $1,952,443 | ||
| Insurance | $319,065 | $53,177 | NAP | U/W NOI(3): | $4,209,616 | ||
| Replacement Reserve | $0 | $5,776 | NAP | U/W NCF: | $4,140,197 | ||
| TI/LC Reserve | $750,000 | Springing | NAP | U/W DSCR based on NOI/NCF: | 1.36x / 1.33x | ||
| Deferred Maintenance | $109,142 | $0 | NAP | U/W Debt Yield based on NOI/NCF: | 10.5% / 10.4% | ||
| Free Rent Reserve | $243,481 | $0 | NAP | U/W Debt Yield at Maturity based on NOI/NCF: | 10.5% / 10.4% | ||
| Rent Credit Reserve | $172,189 | $0 | NAP | Cut-off Date LTV Ratio: | 64.9% | ||
| Primary Tenant Reserve | $0 | Springing | $525,900 | LTV Ratio at Maturity: | 64.9% | ||
| Sources and Uses | |||||||||
| Sources | Uses | ||||||||
| Original Mortgage Loan Amount | $40,000,000 | 100.0% | Loan Payoff | $31,222,703 | 78.1 | % | |||
| Return of Equity | 4,670,804 | 11.7 | |||||||
| Closing Costs | 2,446,689 | 6.1 | |||||||
| Upfront Reserves | 1,659,804 | 4.1 | |||||||
| Total Sources | $40,000,000 | 100.0% | Total Uses | $40,000,000 | 100.0 | % | |||
| (1) | See “Escrows” section. |
| (2) | The borrower additionally owns a leased fee interest in the Release Parcel, described in “Partial Release” section below. |
| (3) | The increase in U/W NOI and in Current Occupancy is driven primarily by Conn’s ($578,310 of underwritten base rent; 12.7% of underwritten base rent; 13.6% of NRA) which lease commenced in April 2023. |
The Mortgage Loan. The eighth largest mortgage loan (the “Cross County Plaza Mortgage Loan”) is evidenced by a promissory note in the original principal amount of $40,000,000 and secured by a first priority fee interest in a 347,093 square foot anchored retail property located in West Palm Beach, Florida (the “Cross County Plaza Property”).
The Borrower and Borrower Sponsor. The borrower is Cross County Owner LLC, a Delaware limited liability company and single purpose entity with one independent director. Legal counsel to the borrower delivered a non-consolidation opinion in connection with the origination of the Cross County Plaza Mortgage Loan. The borrower sponsor is Paul Pollak.
Mr. Pollak has over 35 years of commercial real estate experience including ownership, management and renovation of commercial properties throughout New York, Virginia and Florida. Mr. Pollak has an ownership interest in more than 20 properties.
| THE INFORMATION IN THIS STRUCTURAL AND COLLATERAL TERM SHEET IS NOT COMPLETE AND MAY BE AMENDED PRIOR TO THE TIME OF SALE. THIS TERM SHEET IS NOT AN OFFER TO SELL THESE SECURITIES AND IT IS NOT A SOLICITATION OF AN OFFER TO BUY THESE SECURITIES IN ANY JURISDICTION WHERE THE OFFER OR SALE IS NOT PERMITTED. | ||
| 104 | ||
| Retail – Anchored | Loan #8 | Cut-off Date Balance: | $40,000,000 | |
| 4348 Okeechobee Boulevard | Cross County Plaza | Cut-off Date LTV: | 64.9% | |
| West Palm Beach, FL 33409 | U/W NCF DSCR | 1.33x | ||
| U/W NOI Debt Yield | 10.5% |
The Property. The Cross County Plaza Property is a 347,093 SF grocery-anchored retail property located in West Palm Beach, Florida. The Cross County Plaza Property was originally constructed in 1991, expanded in 1998 and is anchored by Presidente Supermarket (“Presidente”), which opened in June 2022 after executing a long-term lease through February 2041. The Cross County Plaza Property is located less than three miles from Palm Beach International Airport and approximately five miles from Palm Beach. As of October 5, 2023, the Cross County Plaza Property is 99.2% leased to 27 tenants.
The Cross County Plaza Property’s tenant mix includes a grocer and numerous restaurants, healthcare, wellness, and service-based tenants that serve the surrounding area. The three largest tenants are Presidente (15.4% of NRA), Conn’s (13.6% of NRA) and Ollie’s Bargain Outlet (“Ollie’s”) (10.9% of NRA); no other tenant is larger than 9.4% of the NRA. The borrower sponsor purchased the Cross County Plaza Property in June 2014 for $42.0 million and has since put significant capital back into the Cross County Plaza Property, including capital expenditures, and tenant improvements and leasing commissions for approximately 229,000 square feet of new leasing. The borrower sponsor’s total cost basis is estimated at approximately $60.3 million.
The Cross County Plaza Property was previously anchored by Kmart and Winn Dixie, which collectively leased approximately 49% of the NRA. In 2016, Kmart went dark on its space, though it continued to pay rent. The borrower sponsor elected to subdivide Kmart’s 123,011 square foot space and by mid-2018 had completed the subdivision. The borrower sponsor began talks with two new tenants (Supertramp and Ollie’s) for approximately two-thirds of the space. Supertramp and Ollie’s commenced leases in 2019. The third and final vacancy in the former Kmart suite was recently leased by Conn’s, which agreed to an 11-year lease on the 47,209 square feet.
While the Kmart space was being subdivided and re-leased, the borrower sponsor also learned that Winn Dixie would be vacating at its lease expiration in May 2019. Winn Dixie, which occupied 53,291 square feet, was backfilled by Presidente on a long-term lease through February 2041. Presidente, which signed its lease in July 2019, began its buildout in August 2019, its buildout was delayed due to a shortage in labor and materials. It eventually opened its store in June 2022 and is currently paying full, unabated rent.
Major Tenants.
Presidente (53,291 SF; 15.4% of NRA; 8.2% of underwritten base rent). Presidente operates nearly 30 affordable grocery stores throughout Florida. Presidente executed a lease in 2019, opened for business in June 2022, has a current lease expiration date in February 2041 and has three five-year renewal options remaining. Presidente has no termination options. Additionally, the president of the Presidente grocery chain, Pedro Rodriquez, is personally guaranteeing this store’s lease for the first 12 years of the lease term.
Conn’s (47,209 SF; 13.6% of NRA; 12.7% of underwritten base rent). Conn’s is an American furniture, appliance, electronics, mattress and computer store. Conn’s operates over 170 stores with over 4,000 employees in 15 states across the southern U.S. Conn’s has been at the Cross County Plaza Property since 2023, has a current lease expiration date in April 2034 and has four five-year renewal options remaining. Conn’s has no termination options.
Ollie’s (37,693 SF; 10.9% of NRA; 9.3% of underwritten base rent). Ollie’s is America’s largest retailer of closeout merchandise and excess inventory. Ollie’s has been at the Cross County Plaza Property since 2019, has a current lease expiration date in December 2026 and has three five-year renewal options remaining. Ollie’s has no termination options.
| THE INFORMATION IN THIS STRUCTURAL AND COLLATERAL TERM SHEET IS NOT COMPLETE AND MAY BE AMENDED PRIOR TO THE TIME OF SALE. THIS TERM SHEET IS NOT AN OFFER TO SELL THESE SECURITIES AND IT IS NOT A SOLICITATION OF AN OFFER TO BUY THESE SECURITIES IN ANY JURISDICTION WHERE THE OFFER OR SALE IS NOT PERMITTED. | ||
| 105 | ||
| Retail – Anchored | Loan #8 | Cut-off Date Balance: | $40,000,000 | |
| 4348 Okeechobee Boulevard | Cross County Plaza | Cut-off Date LTV: | 64.9% | |
| West Palm Beach, FL 33409 | U/W NCF DSCR | 1.33x | ||
| U/W NOI Debt Yield | 10.5% |
The following table presents certain information relating to the tenancy at the Cross County Plaza Property:
Major Tenants(1)
| Tenant Name | Credit Rating (Fitch/ Moody’s/ | Tenant NRSF | % of NRSF | Annual U/W Base Rent PSF(3) | Annual U/W Base Rent(3) | % of Total Annual U/W Base Rent | Lease Expiration Date | Ext. Options | Term. Option (Y/N) |
| Major Tenants | |||||||||
| Presidente | NR/NR/NR | 53,291 | 15.4% | $7.00 | $373,037 | 8.2% | 2/9/2041 | 3, 5-year | N |
| Conn’s | NR/NR/NR | 47,209 | 13.6% | $12.25 | $578,310 | 12.7% | 4/30/2034 | 4, 5-year | N |
| Ollie’s | NR/NR/NR | 37,693 | 10.9% | $11.25 | $424,046 | 9.3% | 12/31/2026 | 3, 5-year | N |
| Supertramp | NR/NR/NR | 32,505 | 9.4% | $10.15 | $330,000 | 7.3% | 6/30/2032 | 2, 5-year | N |
| Ross Dress for Less | NR/NR/NR | 28,102 | 8.1% | $12.00 | $337,224 | 7.4% | 1/31/2029 | 2, 5-year | N |
| 198,800 | 57.3% | $10.27 | $2,042,618 | 45.0% | |||||
| Non-Major Tenants | 145,380 | 41.9% | $17.17 | $2,496,805 | 55.0% | ||||
| Occupied Collateral Total | 344,180 | 99.2% | $13.19 | $4,539,423 | 100.0% | ||||
| Vacant Space | 2,913 | 0.8% | |||||||
| Collateral Total | 347,093 | 100.0% | |||||||
| (1) | Information obtained from the underwritten rent roll dated October 5, 2023. |
| (2) | Certain ratings are those of the parent company, whether or not the parent company guarantees the lease. |
| (3) | Annual U/W Base Rent PSF and Annual U/W Base Rent include contractual rent steps totalling $50,734 through March 2024. |
The following table presents a summary of sales and occupancy costs for certain tenants at the Cross County Plaza Property:
Tenant Sales(1)(2)(3)
| 2020 Sales (PSF) | 2021 Sales (PSF) | 2022 Sales (PSF) | Occupancy Cost(4) | |
| Ross Dress for Less | $261 | $429 | $432 | 4.1% |
| (1) | Information obtained from the borrower. |
| (2) | Tenants shown on the Major Tenants table above and not included on the Tenant Sales table are not required to report sales. |
| (3) | Sales (PSF) represents for the trailing 12 months ending December 30 except for 2022 Sales (PSF) which represents the trailing 12 months ending January 31, 2022. |
| (4) | Occupancy cost based on underwritten base rent and any applicable reimbursements, divided by most recent reported sales. |
| THE INFORMATION IN THIS STRUCTURAL AND COLLATERAL TERM SHEET IS NOT COMPLETE AND MAY BE AMENDED PRIOR TO THE TIME OF SALE. THIS TERM SHEET IS NOT AN OFFER TO SELL THESE SECURITIES AND IT IS NOT A SOLICITATION OF AN OFFER TO BUY THESE SECURITIES IN ANY JURISDICTION WHERE THE OFFER OR SALE IS NOT PERMITTED. | ||
| 106 | ||
| Retail – Anchored | Loan #8 | Cut-off Date Balance: | $40,000,000 | |
| 4348 Okeechobee Boulevard | Cross County Plaza | Cut-off Date LTV: | 64.9% | |
| West Palm Beach, FL 33409 | U/W NCF DSCR | 1.33x | ||
| U/W NOI Debt Yield | 10.5% |
The following table presents certain information relating to the lease rollover schedule at the Cross County Plaza Property:
Lease Expiration Schedule(1)(2)
| Year Ending December 31, | No. of Leases Expiring | Expiring NRSF | % of Total NRSF | Cumulative Expiring NRSF | Cumulative % of Total NRSF | Annual U/W Base Rent | % of Total Annual U/W Base Rent | Annual U/W Base Rent PSF |
| MTM | 0 | 0 | 0.0% | 0 | 0.0% | $0 | 0.0% | $0.00 |
| 2023 | 0 | 0 | 0.0% | 0 | 0.0% | $0 | 0.0% | $0.00 |
| 2024 | 2 | 15,600 | 4.5% | 15,600 | 4.5% | $204,900 | 4.5% | $13.13 |
| 2025 | 3 | 11,174 | 3.2% | 26,774 | 7.7% | $328,308 | 7.2% | $29.38 |
| 2026 | 5 | 65,506 | 18.9% | 92,280 | 26.6% | $963,553 | 21.2% | $14.71 |
| 2027 | 4 | 15,902 | 4.6% | 108,182 | 31.2% | $233,585 | 5.1% | $14.69 |
| 2028 | 2 | 28,120 | 8.1% | 136,302 | 39.3% | $330,681 | 7.3% | $11.76 |
| 2029 | 3 | 41,630 | 12.0% | 177,932 | 51.3% | $605,880 | 13.3% | $14.55 |
| 2030 | 3 | 30,641 | 8.8% | 208,573 | 60.1% | $532,393 | 11.7% | $17.38 |
| 2031 | 2 | 2,602 | 0.7% | 211,175 | 60.8% | $58,775 | 1.3% | $22.59 |
| 2032 | 1 | 32,505 | 9.4% | 243,680 | 70.2% | $330,000 | 7.3% | $10.15 |
| 2033 | 0 | 0 | 0.0% | 243,680 | 70.2% | $0 | 0.0% | $0.00 |
| Thereafter | 2 | 100,500 | 29.0% | 344,180 | 99.2% | $951,347 | 21.0% | $9.47 |
| Vacant | 0 | 2,913 | 0.8% | 347,093 | 100.0% | $0 | 0.0% | $0.00 |
| Total/Weighted Average | 27 | 347,093 | 100.0% | $4,539,423 | 100.0% | $13.19(3) |
| (1) | Information obtained from the underwritten rent roll dated October 5, 2023. |
| (2) | Certain tenants may have lease termination options that are exercisable prior to the originally stated expiration date of the related lease and are not considered in the rollover schedule. |
| (3) | Total/Weighted Average Annual U/W Base Rent PSF excludes vacant space. |
The following table presents historical occupancy percentages at the Cross County Plaza Property:
Historical Occupancy
1/1/2020(1) | 1/1/2021(1) | 1/1/2022(1) | 10/5/2023(2) |
| 84.6% | 84.2% | 85.0% | 99.2% |
| (1) | Information obtained from the borrower. |
| (2) | Information obtained from the underwritten rent roll dated October 5, 2023. |
| THE INFORMATION IN THIS STRUCTURAL AND COLLATERAL TERM SHEET IS NOT COMPLETE AND MAY BE AMENDED PRIOR TO THE TIME OF SALE. THIS TERM SHEET IS NOT AN OFFER TO SELL THESE SECURITIES AND IT IS NOT A SOLICITATION OF AN OFFER TO BUY THESE SECURITIES IN ANY JURISDICTION WHERE THE OFFER OR SALE IS NOT PERMITTED. | ||
| 107 | ||
| Retail – Anchored | Loan #8 | Cut-off Date Balance: | $40,000,000 | |
| 4348 Okeechobee Boulevard | Cross County Plaza | Cut-off Date LTV: | 64.9% | |
| West Palm Beach, FL 33409 | U/W NCF DSCR | 1.33x | ||
| U/W NOI Debt Yield | 10.5% |
Operating History and Underwritten Net Cash Flow. The following table presents certain information relating to the historical operating performance and underwritten net cash flow at the Cross County Plaza Property:
Cash Flow Analysis
| 2020 | 2021 | 2022 | TTM 7/31/2023 | U/W | %(1) | U/W $ per SF | |
| Base Rent | $3,378,139 | $3,657,079 | $3,899,155 | $4,040,916 | $4,539,423(2) | 70.0% | $13.08 |
| Grossed Up Vacant Space | 0 | 0 | 0 | 0 | 174,780 | 2.7 | 0.50 |
| Gross Potential Rent | $3,378,139 | $3,657,079 | $3,899,155 | $4,040,916 | $4,714,203 | 72.7% | $13.58 |
| Other Income | 67,919 | 65,881 | 57,299 | 54,791 | 54,791 | 0.8 | 0.16 |
| Total Recoveries | 978,848 | 1,075,728 | 1,223,769 | 1,220,444 | 1,714,501 | 26.4 | $4.94 |
| Net Rental Income | $4,424,907 | $4,798,688 | $5,180,224 | $5,316,151 | $6,483,494 | 100.0% | $18.68 |
| (Vacancy & Credit Loss) | 0 | 0 | 0 | 0 | (321,435)(3) | (5.0) | (0.93) |
| Effective Gross Income | $4,424,907 | $4,798,688 | $5,180,224 | $5,316,151 | $6,162,059 | 95.0% | $17.75 |
| Real Estate Taxes | $630,302 | $643,135 | $695,943 | $691,593 | $766,433 | 12.4% | $2.21 |
| Insurance | 217,616 | 241,470 | 258,500 | 298,690 | 638,129 | 10.4 | 1.84 |
| Other Operating Expenses | 446,228 | 446,865 | 521,460 | 548,833 | 547,881 | 8.9 | 1.58 |
| Total Operating Expenses | $1,294,146 | $1,331,470 | $1,475,903 | $1,539,117 | $1,952,443 | 31.7% | $5.63 |
| Net Operating Income(4) | $3,130,761 | $3,467,218 | $3,704,320 | $3,777,034 | $4,209,616 | 68.3% | $12.13 |
| Replacement Reserves | 0 | 0 | 0 | 0 | 69,419 | 1.1 | 0.20 |
| TI/LC | 0 | 0 | 0 | 0 | 0 | 0.0 | 0.00 |
| Net Cash Flow | $3,130,761 | $3,467,218 | $3,704,320 | $3,777,034 | $4,140,197 | 67.2% | $11.93 |
| NOI DSCR | 1.01x | 1.12x | 1.19x | 1.22x | 1.36x | ||
| NCF DSCR | 1.01x | 1.12x | 1.19x | 1.22x | 1.33x | ||
| NOI Debt Yield | 7.8% | 8.7% | 9.3% | 9.4% | 10.5% | ||
| NCF Debt Yield | 7.8% | 8.7% | 9.3% | 9.4% | 10.4% |
| (1) | Represents (i) percent of Net Rental Income for all revenue fields and (ii) percent of Effective Gross Income for all other fields. |
| (2) | The U/W Base Rent includes contractual rent steps totaling $50,734 through March 2024. |
| (3) | The underwritten economic vacancy is 5.0%. The Cross County Plaza Property was 99.2% leased as of October 5, 2023. |
| (4) | The increase in Net Operating Income is primarily attributed to the former Kmart (123,011 SF, 34.4% total NRA) vacating in September 2018 and the former Winn-Dixie (53,291 SF; 14.9% NRA) vacating in May 2019. Both spaces have since been backfilled by (i) Presidente (15.4% NRA; $373,073 underwritten base rent; lease commencement July 2019), (ii) Ollie’s (10.9% NRA; $424,046 underwritten base rent; lease commencement September 2019), (iii) Conn’s (13.6% NRA; $578,310 underwritten base rent; lease commencement April 2023) and (iv) Supertramp (9.4% NRA; $330,000 underwritten base rent; lease commencement November 2019). |
Appraisal. The appraiser concluded to an “as-is” appraised value for the Cross County Plaza Property of $61,600,000 as of October 10, 2023.
Environmental Matters. According to a Phase I environmental assessment dated February 2, 2023, a REC was identified at the Cross County Plaza Property in connection with the historical operation of a dry cleaning facility on a parcel adjacent to the Cross County Plaza Property. A limited subsurface investigation at the adjacent parcel conducted in 1997 indicated contamination in groundwater and soil above cleanup target levels. A vapor intrusion investigation at the adjacent parcel conducted in 2017 identified some soil gas concentrations above the carcinogenic risk and target hazard quotients. The environmental consultant reported that the potential of volatile organic compound vapors from impacted groundwater and soil remained high. The environmental consultant advised that, pending the results of outstanding groundwater analysis, additional reporting and remediation may be required. The adjacent property is enrolled in the Florida Department of Environmental Protection’s Drycleaning Solvent Cleanup Program and is eligible for state-funded site rehabilitation under applicable state law. See “Description of the Mortgage Pool—Environmental Considerations” in the prospectus.
Market Overview and Competition. The Cross County Plaza Property is located in the Palm Beach retail market and the West Palm Beach retail submarket. According to the appraisal, as of the second quarter of 2023, the Palm Beach retail market reported a total inventory of approximately 81.7 million SF with an approximately 3.4% vacancy rate and an average asking rent of $34.51 PSF. Additionally, according to the appraisal, as of the second quarter of 2023, the West Palm Beach retail submarket reported a total inventory of approximately 17.0 million SF with an approximately 3.2% vacancy rate and an average asking rent of $27.35 PSF. According to a market report, the 2023 estimated population within a one-, three- and five-mile radius of the Cross County Plaza Property was 15,834, 111,565 and 280,659, respectively; and the 2023 estimated average median household income within the same radii was approximately $42,655, $49,447 and $52,386, respectively.
| THE INFORMATION IN THIS STRUCTURAL AND COLLATERAL TERM SHEET IS NOT COMPLETE AND MAY BE AMENDED PRIOR TO THE TIME OF SALE. THIS TERM SHEET IS NOT AN OFFER TO SELL THESE SECURITIES AND IT IS NOT A SOLICITATION OF AN OFFER TO BUY THESE SECURITIES IN ANY JURISDICTION WHERE THE OFFER OR SALE IS NOT PERMITTED. | ||
| 108 | ||
| Retail – Anchored | Loan #8 | Cut-off Date Balance: | $40,000,000 | |
| 4348 Okeechobee Boulevard | Cross County Plaza | Cut-off Date LTV: | 64.9% | |
| West Palm Beach, FL 33409 | U/W NCF DSCR | 1.33x | ||
| U/W NOI Debt Yield | 10.5% |
The following table presents certain information relating to the appraiser’s market rent conclusions for the Cross County Plaza Property:
Market Rent Summary(1)
| Grocery | Jr. Anchor | Large In-Line (>6,000 SF) | Small In-Line (<6,000 SF) | Outparcel | Gym | |
| Market Rent (PSF) | $6.50 | $10.00 | $15.00 | $25.00 | $35.00 | $16.00 |
| Lease Term (Years) | 10 | 10 | 10 | 5 | 10 | 10 |
Lease Type (Reimbursements) | NNN | NNN | NNN | NNN | NNN | NNN |
| Rent Increase Projection | 3.0%/year | 3.0%/year | 3.0%/year | 3.0%/year | 3.0%/year | 3.0%/year |
| Tenant Improvements (New / Renewal) | $10.00 / $5.00 | $10.00 / $5.00 | $15.00 / $5.00 | $20.00 / $5.00 | $20.00 / $5.00 | $20.00 / $5.00 |
| Leasing Commissions (New / Renewal) | 6.0% / 3.0% | 6.0% / 3.0% | 6.0% / 3.0% | 6.0% / 3.0% | 6.0% / 3.0% | 6.0% / 3.0% |
| Free Rent Months (New / Renewal) | 6 / 3 | 6 / 3 | 6 / 3 | 6 / 3 | 6 / 3 | 6 / 3 |
| (1) | Information obtained from the appraisal. |
The table below presents certain information relating to comparable sales pertaining to the Cross County Plaza Property, as identified by the appraiser:
Comparable Sales(1)
Property Name | Location | Year Built/Renovated | Rentable Area (SF) | Occupancy | Sale Date | Sale Price | Sale Price (PSF) |
| Cross County Plaza | 4348 Okeechobee Boulevard West Palm Beach, FL | 1991/1998 | 347,093(2) | 99.2%(2) | - | - | - |
| 6852 North University Drive | 6852 North University Drive Tamarac, FL | 1977/2004 | 80,244 | 97.0% | 8/2023 | $14,765,000 | $184 |
| 1013 South Federal Highway | 1013 South Federal Highway Deerfield Beach, FL | 1980/2010 | 145,502 | 92.0% | 6/2022 | $18,750,000 | $129 |
| 2415 Northwest Federal Highway | 2415 Northwest Federal Highway Stuart, FL | 2005/NAP | 255,572 | 99.0% | 6/2022 | $48,500,000 | $190 |
| (1) | Information obtained from the appraisal unless otherwise stated. |
| (2) | Information obtained from the underwritten rent roll dated October 5, 2023. |
Escrows.
Real Estate Taxes – The Cross County Plaza Mortgage Loan documents require an upfront deposit of $65,927 for real estate taxes and ongoing monthly deposits equal to 1/12 of the taxes that the lender estimates will be payable during the next 12 months, initially $65,927.
Insurance – The Cross County Plaza Mortgage Loan documents require an upfront deposit of $319,065 for insurance premiums and ongoing monthly deposits equal to 1/12 of the insurance premiums that the lender estimates will be payable during the next 12 months, initially $53,177.
Replacement Reserve – The Cross County Plaza Mortgage Loan documents require ongoing monthly replacement reserve deposits of $5,776 ($0.20 per square foot per year).
Leasing Reserve – The Cross County Plaza Mortgage Loan documents require an upfront deposit of $750,000 and, once the reserve falls below a floor of $500,000, ongoing monthly reserves of $8,677 ($0.30 per square foot per year) for tenant improvements and leasing commissions.
Deferred Maintenance – The Cross County Plaza Mortgage Loan documents require an upfront deposit of $109,142, which equates to 115% of the lender’s estimate of the cost of immediate repairs at the Cross County Plaza Property.
Free Rent Reserve – The Cross County Plaza Mortgage Loan documents require an upfront deposit of $243,481 for free rent related to Conn’s and King’s Super Buffet.
Rent Credit Reserve – The Cross County Plaza Mortgage Loan documents require an upfront deposit of $172,189 for seven months of outstanding rent credits related to Conn’s.
| THE INFORMATION IN THIS STRUCTURAL AND COLLATERAL TERM SHEET IS NOT COMPLETE AND MAY BE AMENDED PRIOR TO THE TIME OF SALE. THIS TERM SHEET IS NOT AN OFFER TO SELL THESE SECURITIES AND IT IS NOT A SOLICITATION OF AN OFFER TO BUY THESE SECURITIES IN ANY JURISDICTION WHERE THE OFFER OR SALE IS NOT PERMITTED. | ||
| 109 | ||
| Retail – Anchored | Loan #8 | Cut-off Date Balance: | $40,000,000 | |
| 4348 Okeechobee Boulevard | Cross County Plaza | Cut-off Date LTV: | 64.9% | |
| West Palm Beach, FL 33409 | U/W NCF DSCR | 1.33x | ||
| U/W NOI Debt Yield | 10.5% |
Primary Tenant Reserve - Upon the occurrence of a Primary Tenant Cash Trap Period (as defined below), the borrower will be required to deposit on each monthly payment date, until such Primary Tenant Cash Trap Period is cured, $87,650 into a reserve (the “Primary Tenant Reserve”) for re-leasing the Primary Tenant (as defined below) space. The Primary Tenant Reserve is subject to a cap of $525,900.
Lockbox and Cash Management. The Cross County Plaza Mortgage Loan is structured with a hard lockbox and in place cash management. The Cross County Plaza Mortgage Loan documents require the borrower to deliver tenant direction letters to the tenants directing such tenants to pay all rents into the lockbox account. All funds in the lockbox account are required to be swept daily to a cash management account under the control of the lender to be applied and disbursed in accordance with the Cross County Plaza Mortgage Loan documents. Upon the occurrence and during the continuance of a Sweep Event Period (as defined below) (other than a Sweep Event Period continuing solely as a result of a Primary Tenant Cash Trap Period), all excess cash flow funds remaining in the cash management account after the application of such funds in accordance with the Cross County Plaza Mortgage Loan documents are required to be held by the lender in an excess cash flow reserve account as additional collateral for the Cross County Plaza Mortgage Loan. To the extent that no Sweep Event Period is continuing (or a Sweep Event Period is continuing solely as a result of a Primary Tenant Cash Trap Period), all excess cash flow funds are required to be disbursed to the borrower.
A “Sweep Event Period” will commence upon the earliest of the following:
| (i) | the occurrence of an event of default; |
| (ii) | the date on which the debt service coverage ratio (commencing on the monthly payment date occurring six months after origination of the date and based on the trailing 12-month period, as calculated by the lender) is less than 1.25x; or |
| (iii) | the occurrence of a Primary Tenant Cash Trap Period. |
A Sweep Event Period will end upon the occurrence of the following:
| ● | with regard to clause (i), the cure of such event of default; |
| ● | with regard to clause (ii), the debt service coverage ratio (based on the trailing 12-month period as calculated by the lender) is at least 1.30x for two consecutive calendar quarters; or |
| ● | with regard to clause (iii), such Primary Tenant Cash Trap Period is cured, as further described below. |
A “Primary Tenant Cash Trap Period” will commence upon the earliest of: (i) the date that is 12 months prior to lease expiration of such Primary Tenant, (ii) the date upon which any Primary Tenant becomes a debtor in any bankruptcy or insolvency proceeding and/or is placed in or becomes subject to any conservatorship or receivership, (iii) the date required under any Primary Tenant lease by which the Primary Tenant is required to give notice of its exercise of a renewal option (and such renewal has not been so exercised) or the date that the Primary Tenant gives notice or otherwise indicates its intention not to renew the related lease or that it intends to discontinue its business at the space demised under its lease), (iv) the date upon which any Primary Tenant vacates, ceases operations, surrenders or otherwise “goes dark” at its space or indicates its intention to vacate, cease operations, surrender, or otherwise “go dark” at the Primary Tenant space, (v) the date upon which a Primary Tenant terminates its lease or gives notice of its intent to terminate its lease, (vi) the date on which a Primary Tenant defaults under its lease and (vii) the date upon which a Primary Tenant sublets any portion of its leased space without the lender’s prior consent.
A Primary Tenant Cash Trap Period will terminate: (a) with regard to clause (ii), on the date on which such Primary Tenant ceases to be a debtor in any bankruptcy or insolvency proceeding (and such Primary Tenant has not rejected the related lease in such proceeding); (b) with regard to clause (iv), upon the related Primary Tenant re-commencing operations at its leased space during normal business hours for a period of six consecutive months; (c) with regard to clause (v), if such termination option is not validly exercised by the applicable Primary Tenant by the latest exercise date specified in the related lease or is otherwise validly and irrevocably waived by the applicable Primary Tenant; and (d) with regard to clause (vi), the date on which the subject default has been cured and no other event of default under the applicable lease occurs for a period of six consecutive months. A Primary Tenant Cash Trap Period will also terminate (i) in the event that a Primary Tenant Re-Tenanting Event (as defined below) has occurred or (ii) on the date that the amount in the Primary Tenant Reserve reaches the deposit cap of $525,900.
A “Primary Tenant Re-Tenanting Event” means that: (i) the related Primary Tenant space is leased pursuant to a replacement lease (or leases) for a term of at least five years beyond the maturity date of the Cross County Plaza Mortgage Loan and on terms acceptable to the lender for the related space, which replacement lease (or leases) must satisfy additional conditions; (ii) each such Primary Tenant is in occupancy of its premises, open for business, and paying unabated base rent, and (iii) all tenant improvement costs and leasing commissions provided in each such replacement lease have been paid, and the lender has received a reasonably satisfactory estoppel certificate from each such replacement tenant affirming the foregoing.
A “Primary Tenant” means individually and collectively as the context may require, Presidente, Conn’s, Ollie’s and any replacement tenant that enters into a lease for any portion of space at the Cross County Plaza Property currently leased to the foregoing tenants.
Property Management. The Cross County Plaza Property is managed by Madison Properties USA LLC.
| THE INFORMATION IN THIS STRUCTURAL AND COLLATERAL TERM SHEET IS NOT COMPLETE AND MAY BE AMENDED PRIOR TO THE TIME OF SALE. THIS TERM SHEET IS NOT AN OFFER TO SELL THESE SECURITIES AND IT IS NOT A SOLICITATION OF AN OFFER TO BUY THESE SECURITIES IN ANY JURISDICTION WHERE THE OFFER OR SALE IS NOT PERMITTED. | ||
| 110 | ||
| Retail – Anchored | Loan #8 | Cut-off Date Balance: | $40,000,000 | |
| 4348 Okeechobee Boulevard | Cross County Plaza | Cut-off Date LTV: | 64.9% | |
| West Palm Beach, FL 33409 | U/W NCF DSCR | 1.33x | ||
| U/W NOI Debt Yield | 10.5% |
Partial Release. Provided that no event of default exists, at any time after 60 days following the closing date of the MSWF 2023-2 securitization, the lender permits the release of a parcel at the Cross County Plaza Property that is currently ground leased to Chili’s Florida, Inc. (the “Release Parcel”) as collateral for the Cross County Plaza Mortgage Loan, provided that the following conditions, among others, are satisfied: (i) the Release Parcel and the remaining Cross County Plaza Property, and all improvements thereon, comply with applicable zoning, parking, land use and similar laws; (ii) all applicable zoning and subdivision approvals necessary to create legally identifiable tracts of real property, and separate tax and zoning lots for all real property taxes, have been granted; (iii) the borrower provides evidence satisfactory to the lender that, after the release, the remaining Cross County Plaza Property has available to it all necessary utility, facilities, easements and other services for the use, occupancy and operation of the remaining Cross County Plaza Property, as well as unimpeded access for ingress and egress, all as approved by the lender; (iv) the borrower provides the lender with an updated survey and zoning report for the Release Parcel and the remaining Cross County Plaza Property; (v) title to the Release Parcel is transferred to a person that is not the borrower or a general partner or managing member of the borrower, or any person owned or controlled by such a person (provided that the transferee may be an affiliate of the guarantor); and (vi) the release of the Release Parcel is in compliance with applicable REMIC requirements. No value was attributed to the Release Parcel in the appraisal or in the lender’s underwriting of the Cross County Plaza Mortgage Loan.
Real Estate Substitution. Not permitted.
Subordinate and Mezzanine Indebtedness. None.
Right of First Offer / Right of First Refusal. None.
Ground Lease. The borrower currently ground leases the Release Parcel to Chili’s Florida, Inc. under a ground lease that expires on May 28, 2090. There is no base rent payable under the ground lease and Chili’s Florida, Inc. pays a common area maintenance charge equal to approximately $5,500 per annum for shared easements. No value was attributed to the Release Parcel in the appraisal or in the lender’s underwriting of the Cross County Plaza Mortgage Loan. The borrower is permitted to the Release Parcel as described in “Partial Release” above.
Terrorism Insurance. The Cross County Plaza Mortgage Loan documents require that the “all risk” insurance policy required to be maintained by the borrower provides coverage for terrorism in an amount equal to the full replacement cost of the Cross County Plaza Property, as well as business interruption insurance covering no less than the 18-month period following the occurrence of a casualty event, together with a 180-day extended period of indemnity.
| THE INFORMATION IN THIS STRUCTURAL AND COLLATERAL TERM SHEET IS NOT COMPLETE AND MAY BE AMENDED PRIOR TO THE TIME OF SALE. THIS TERM SHEET IS NOT AN OFFER TO SELL THESE SECURITIES AND IT IS NOT A SOLICITATION OF AN OFFER TO BUY THESE SECURITIES IN ANY JURISDICTION WHERE THE OFFER OR SALE IS NOT PERMITTED. | ||
| 111 | ||
| Retail – Various | Loan #9 | Cut-off Date Balance: | $30,000,000 | |
| Various | RTL Retail Portfolio | Cut-off Date LTV: | 51.2% | |
| Various | U/W NCF DSCR: | 1.97x | ||
| U/W NOI Debt Yield: | 13.8% |
| THE INFORMATION IN THIS STRUCTURAL AND COLLATERAL TERM SHEET IS NOT COMPLETE AND MAY BE AMENDED PRIOR TO THE TIME OF SALE. THIS TERM SHEET IS NOT AN OFFER TO SELL THESE SECURITIES AND IT IS NOT A SOLICITATION OF AN OFFER TO BUY THESE SECURITIES IN ANY JURISDICTION WHERE THE OFFER OR SALE IS NOT PERMITTED. | ||
| 112 | ||
| Retail – Various | Loan #9 | Cut-off Date Balance: | $30,000,000 | |
| Various | RTL Retail Portfolio | Cut-off Date LTV: | 51.2% | |
| Various | U/W NCF DSCR: | 1.97x | ||
| U/W NOI Debt Yield: | 13.8% |
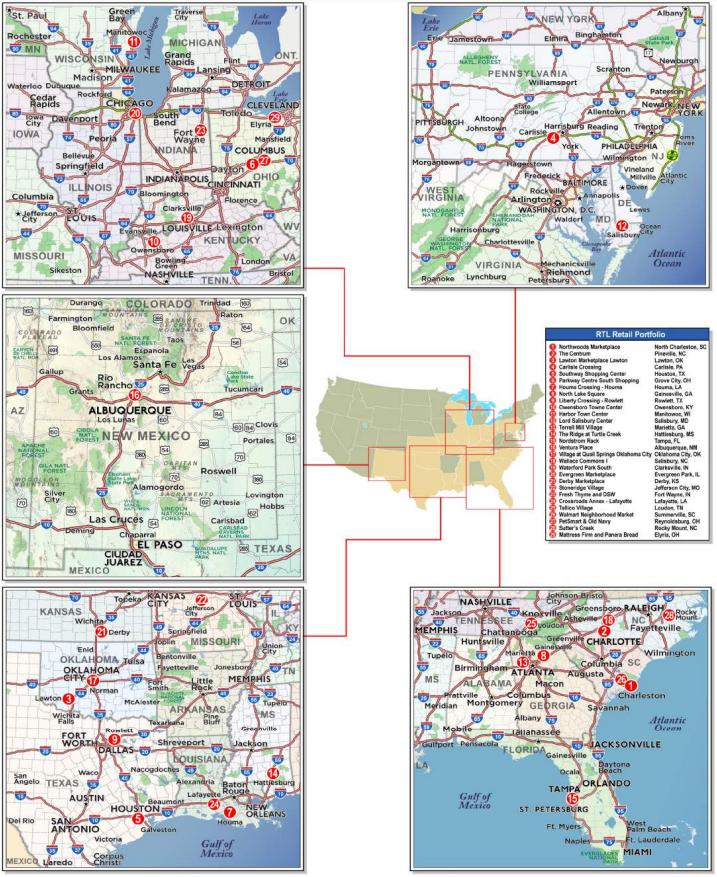
| THE INFORMATION IN THIS STRUCTURAL AND COLLATERAL TERM SHEET IS NOT COMPLETE AND MAY BE AMENDED PRIOR TO THE TIME OF SALE. THIS TERM SHEET IS NOT AN OFFER TO SELL THESE SECURITIES AND IT IS NOT A SOLICITATION OF AN OFFER TO BUY THESE SECURITIES IN ANY JURISDICTION WHERE THE OFFER OR SALE IS NOT PERMITTED. | ||
| 113 | ||
| No. 9 – RTL Retail Portfolio |
| Mortgage Loan Information | Mortgaged Property Information | ||||||
| Mortgage Loan Seller: | Morgan Stanley Mortgage Capital Holdings LLC | Single Asset/Portfolio: | Portfolio | ||||
| Credit Assessment | NR/NR/NR | Property Type – Subtype: | Retail – Various | ||||
| (Fitch/KBRA/Moody’s): | Location: | Various | |||||
| Original Principal Balance(1): | $30,000,000 | Size: | 3,117,102 SF | ||||
| Cut-off Date Balance(1): | $30,000,000 | Cut-off Date Balance Per SF(1): | $83.41 | ||||
| % of Initial Pool Balance: | 3.3% | Maturity Date Balance Per SF(1): | $83.41 | ||||
| Loan Purpose: | Recapitalization | Year Built/Renovated: | Various/Various | ||||
| Borrower Sponsor: | Global Net Lease, Inc. | Title Vesting: | Fee | ||||
| Guarantor: | Global Net Lease, Inc. | Property Manager: | Necessity Retail Properties, LLC | ||||
| Mortgage Rate: | 6.44575% | (borrower-related) | |||||
| Note Date: | August 30,2023 | Current Occupancy (As of): | 95.3% (9/1/2023) | ||||
| Seasoning: | 3 months | YE 2022 Occupancy: | 94.1% | ||||
| Maturity Date: | September 6, 2033 | YE 2021 Occupancy(4): | 90.7% | ||||
| IO Period: | 120 months | YE 2020 Occupancy(4)(5): | 76.5% | ||||
| Loan Term (Original): | 120 months | YE 2019 Occupancy: | NAV | ||||
| Amortization Term (Original): | NAP | Appraised Value(6): | $508,200,000 | ||||
| Loan Amortization Type: | Interest Only | Appraised Value Per SF(6): | $163.04 | ||||
| Call Protection(2): | L(12),YM(15),DorYM1(86),O(7) | Appraisal Valuation Date(6): | July 31, 2023 | ||||
| Lockbox Type: | Hard/Springing Cash Management | ||||||
| Additional Debt(1): | Yes | Underwriting and Financial Information | |||||
| Additional Debt Type(1) | Pari Passu | TTM 6/30/2023 NOI: | $33,695,199 | ||||
| (Balance) (1): | ($230,000,000) | YE 2022 NOI(7): | $27,051,928 | ||||
| YE 2021 NOI(8): | NAV | ||||||
| Escrows and Reserves(3) | YE 2020 NOI(8): | NAV | |||||
| Initial | Monthly | Cap | U/W Revenues: | $53,888,610 | |||
| Taxes: | $4,174,654 | $596,379 | NAP | U/W Expenses: | $17,916,793 | ||
| Insurance: | $5,240 | $1,310 | NAP | U/W NOI: | $35,971,817 | ||
| Deferred Maintenance: | $1,027,622 | $0 | NAP | U/W NCF: | $33,409,746 | ||
| Replacement Reserve: | $0 | Springing | NAP | U/W DSCR based on NOI/NCF(1): | 2.12x / 1.97x | ||
| TI/LC: | $0 | Springing | NAP | U/W Debt Yield based on NOI/NCF(1): | 13.8% / 12.8% | ||
| Environmental Reserve: | $977,500 | $0 | NAP | U/W Debt Yield at Maturity based on | |||
| Outstanding TI/LC: | $9,576,923 | $0 | NAP | NOI/NCF(1): | 13.8% / 12.8% | ||
| Outstanding Free Rent: | $311,601 | $0 | NAP | Cut-off Date LTV Ratio(1)(6): | 51.2% | ||
| Outstanding Gap Rent: | $241,832 | $0 | NAP | LTV Ratio at Maturity(1)(6): | 51.2% | ||
| Sources and Uses | |||||||||
| Sources | Uses | ||||||||
| Whole Loan Amount | $260,000,000 | 100.0% | Return of Equity | $238,632,813 | 91.8 | % | |||
| Reserves | 16,315,372 | 6.3 | |||||||
| Closing Costs | 5,051,814 | 1.9 | |||||||
| Total Sources | $260,000,000 | 100.0% | Total Uses | $260,000,000 | 100.0 | % | |||
| (1) | The RTL Retail Portfolio Mortgage Loan (as defined below) is part of the RTL Retail Portfolio Whole Loan (as defined below), which is comprised of 17 pari passu promissory notes with an aggregate original principal balance of $260,000,000 (collectively, the “RTL Retail Portfolio Whole Loan”). The Cut-off Date Balance Per SF, Maturity Date Balance Per SF, U/W DSCR based on NOI/NCF, U/W Debt Yield based on NOI/NCF, U/W Debt Yield at Maturity based on NOI/NCF, Cut-off Date LTV Ratio and LTV Ratio at Maturity presented above are based on the aggregate Cut-off Date principal balance of the RTL Retail Portfolio Whole Loan. |
| (2) | Defeasance of the RTL Retail Portfolio Whole Loan is permitted at any time after the date that is the earliest to occur of (i) two years after the closing date of the securitization that includes the last note to be securitized and (ii) August 30, 2026. The RTL Retail Portfolio Whole Loan may be voluntarily prepaid in full, but not in part, after the payment date in September 2024, with the payment of a yield maintenance premium if such prepayment occurs prior to the payment date in March 2033. The RTL Retail Portfolio Whole Loan may be voluntarily prepaid at any time on or after the payment date in March 2033 without the payment of a yield maintenance premium. The assumed defeasance lockout period of 27 payments is based on the anticipated closing date of the MSWF 2023-2 securitization trust in December 2023. The actual defeasance lockout period may be longer. |
| (3) | See "Escrows” below for further discussion of reserve requirements. |
| (4) | Based on occupancy statistics at the Liberty Crossing - Rowlett, Southway Shopping Center, Northwoods Marketplace, The Centrum, and Village at Quail Springs Oklahoma City mortgaged properties, which were acquired by the borrower sponsor in 2017. The other 24 mortgaged properties had not yet been acquired by the borrower sponsor, and such information was not available. These five mortgaged properties were 93.6% occupied as of the end of 2022 and 92.5% occupied as of September 1, 2023. |
| (5) | The 2020 historical occupancy of 76.5% is driven by The Centrum mortgaged property which was 39.0% occupied. The Centrum mortgaged property’s occupancy increased to 78.0% in 2021 driven by a new 20-year lease for 108,714 square feet to Super G Market, a family-owned grocery store. |
| (6) | The Appraised Value represents the “as portfolio” value which includes a portfolio premium to the portfolio properties if sold together on a bulk basis. The sum of the “as-is” appraised values on a stand-alone basis is $498,190,000. The Cut-off Date LTV Ratio and LTV Ratio at Maturity based on the aggregate stand-alone “as-is” appraised values are both 52.2%. |
| (7) | 24 of the mortgaged properties were acquired between February 2022 and April 2022. For such mortgaged properties, 2022 cash flows only include financials from the acquisition date through December 2022. |
| THE INFORMATION IN THIS STRUCTURAL AND COLLATERAL TERM SHEET IS NOT COMPLETE AND MAY BE AMENDED PRIOR TO THE TIME OF SALE. THIS TERM SHEET IS NOT AN OFFER TO SELL THESE SECURITIES AND IT IS NOT A SOLICITATION OF AN OFFER TO BUY THESE SECURITIES IN ANY JURISDICTION WHERE THE OFFER OR SALE IS NOT PERMITTED. | ||
| 114 | ||
| Retail – Various | Loan #9 | Cut-off Date Balance: | $30,000,000 | |
| Various | RTL Retail Portfolio | Cut-off Date LTV: | 51.2% | |
| Various | U/W NCF DSCR: | 1.97x | ||
| U/W NOI Debt Yield: | 13.8% |
| (8) | Historical cash flows are unavailable as 24 of the 29 RTL Retail Portfolio Properties (as defined below) were acquired in 2022 and such information is not available. |
The Mortgage Loan. The ninth largest mortgage loan (the “RTL Retail Portfolio Mortgage Loan”) is part of a whole loan (the “RTL Retail Portfolio Whole Loan”) evidenced by 17 pari passu promissory notes in the aggregate original principal amount of $260,000,000. The RTL Retail Portfolio Whole Loan is secured by the borrowers’ fee interests in a 3,117,102 square foot portfolio compromised of 29 retail properties located in 19 states (the “RTL Retail Portfolio Properties”). The RTL Retail Portfolio Whole Loan was co-originated by Barclays Capital Real Estate Inc. (“Barclays”), Societe Generale Financial Corporation (“SGFC”), Bank of Montreal (“BMO”), and KeyBank National Association (“KeyBank”). Morgan Stanley Mortgage Capital Holdings LLC acquired the non-controlling note A-3, with an original principal balance of $30,000,000, from Barclays on September 21, 2023, which represents the RTL Retail Portfolio Mortgage Loan and will be included in the MSWF 2023-2 securitization trust. The RTL Retail Portfolio Whole Loan will be serviced pursuant to the pooling and servicing agreement for the BBCMS 2023-C22 securitization trust. See “Description of the Mortgage Pool—The Whole Loans—The Non-Serviced Pari Passu Whole Loans” and “The Pooling and Servicing Agreement—Servicing of the Non-Serviced Mortgage Loans” in the prospectus.
Whole Loan Note Summary
| Notes | Original Balance | Cut-off Date Balance | Note Holder | Controlling Piece |
| A-1 | $28,500,000 | $28,500,000 | BBCMS 2023-C22 | Yes |
| A-2 | $32,500,000 | $32,500,000 | BBCMS 2023-C21 | No |
| A-3 | $30,000,000 | $30,000,000 | MSWF 2023-2 | No |
| A-4 | $15,000,000 | $15,000,000 | BBCMS 2023-C22 | No |
| A-5 | $18,800,000 | $18,800,000 | SGFC | No |
| A-6 | $12,500,000 | $12,500,000 | SGFC | No |
| A-7 | $10,033,333 | $10,033,333 | SGFC | No |
| A-8 | $7,000,000 | $7,000,000 | BBCMS 2023-C22 | No |
| A-9 | $30,000,000 | $30,000,000 | BBCMS 2023-C21 | No |
| A-10 | $14,000,000 | $14,000,000 | BMO | No |
| A-11 | $5,333,334 | $5,333,334 | BBCMS 2023-C22 | No |
| A-12 | $15,000,000 | $15,000,000 | KeyBank | No |
| A-13 | $11,000,000 | $11,000,000 | KeyBank | No |
| A-14 | $10,000,000 | $10,000,000 | KeyBank | No |
| A-15 | $8,000,000 | $8,000,000 | BBCMS 2023-C22 | No |
| A-16 | $7,333,333 | $7,333,333 | KeyBank | No |
| A-17 | $5,000,000 | $5,000,000 | BBCMS 2023-C22 | No |
| Total (Whole Loan) | $260,000,000 | $260,000,000 |
The Borrowers and Borrower Sponsors. The borrowers for the RTL Retail Portfolio Mortgage Loan are 29 Delaware limited liability companies and special purpose entities, each with two independent directors in its organizational structure. Legal counsel to the borrowers provided a non-consolidation opinion in connection with the origination of the RTL Retail Portfolio Whole Loan.
The borrower sponsor and non-recourse carve-out guarantor for the RTL Retail Portfolio Mortgage Loan was The Necessity Retail REIT Operating Partnership, L.P. (“RTL”) (NASDAQ: RTL) prior to the completion of the Global Net Lease Merger (as defined below). At completion of the Global Net Lease Merger, Global Net Lease Inc. became, and is currently, the borrower sponsor and non-recourse carveout guarantor. RTL is a publicly traded real estate investment trust with a focus on acquiring and managing a diversified portfolio of primarily service-oriented and traditional retail and distribution related commercial real estate properties in the United States. RTL has a portfolio consisting of 991 net leased properties in 46 different states and the District of Columbia totaling approximately 27.4 million square feet as of June 30, 2023. RTL’s portfolio was 92.7% leased with a 6.9-year weighted average lease term remaining as of June 30, 2023. RTL reported revenue of approximately $106.7 million in the second quarter of 2023.
The Necessity Retail REIT, Inc. (“RTL Parent”) and Global Net Lease, Inc. completed a merger on September 12, 2023 (such merger of RTL Parent with Global Net Lease, Inc., the “Global Net Lease Merger”). RTL had been externally managed by AR Global Investments, LLC. However, the combined entity is now internally managed. Global Net Lease, Inc. is a publicly traded real estate investment trust that specializes in sale-leaseback transactions involving single tenant, income producing net-leased assets. Prior to the Global Net Lease Merger, as of June 30, 2023, Global Net Lease, Inc. had a portfolio consisting of 1,308 properties totaling approximately 66.9 million square feet. As of June 30, 2023, Global Net Lease, Inc.’s portfolio was 96% leased with a weighted average remaining lease term of 6.9 years.
| THE INFORMATION IN THIS STRUCTURAL AND COLLATERAL TERM SHEET IS NOT COMPLETE AND MAY BE AMENDED PRIOR TO THE TIME OF SALE. THIS TERM SHEET IS NOT AN OFFER TO SELL THESE SECURITIES AND IT IS NOT A SOLICITATION OF AN OFFER TO BUY THESE SECURITIES IN ANY JURISDICTION WHERE THE OFFER OR SALE IS NOT PERMITTED. | ||
| 115 | ||
| Retail – Various | Loan #9 | Cut-off Date Balance: | $30,000,000 | |
| Various | RTL Retail Portfolio | Cut-off Date LTV: | 51.2% | |
| Various | U/W NCF DSCR: | 1.97x | ||
| U/W NOI Debt Yield: | 13.8% |
The Properties. The RTL Retail Portfolio Properties consist of 29 retail centers located in 19 different states and totaling 3,117,102 square feet. 27 of the RTL Retail Portfolio Properties are anchored, while the other two are shadow anchored. The RTL Retail Portfolio Properties are 95.3% occupied by 188 tenants as of September 1, 2023. The borrower sponsor acquired five of the RTL Retail Portfolio Properties in 2017 and the rest were acquired in 2022. Since the acquisition of the remaining 24 RTL Retail Portfolio Properties, occupancy of the RTL Retail Portfolio Properties has been at least 94.0%. Eight of the RTL Retail Portfolio Properties are anchored, or shadow anchored by 11 non-collateral stores (the “Non-Collateral Anchors”), and the space occupied by the Non-Collateral Anchors is not part of the collateral securing the RTL Retail Portfolio Whole Loan. The information relating to the RTL Retail Portfolio Properties in this term sheet does not include any space occupied by the Non-Collateral Anchors, unless otherwise expressly stated herein.
The following table presents certain information relating to the RTL Retail Portfolio Properties:
Portfolio Summary
| Property Name | Location | Year Built/ Renovated | Square Feet(1) | Occ. %(1) | Allocated Cut-off Date Whole Loan Amount (“ALA”) | % of ALA | Appraised Value | % of Appraised Value |
| Northwoods Marketplace | North Charleston, SC | 1998 / NAP | 236,078 | 97.8% | $21,500,000 | 8.3% | $41,200,000 | 8.1% |
| The Centrum | Pineville, NC | 1997 / 2020 | 274,446 | 79.9%(3) | $17,210,000 | 6.6% | $36,800,000 | 7.2% |
| Lawton Marketplace Lawton | Lawton, OK | 2013 / 2023 | 196,715 | 98.9% | $16,180,000 | 6.2% | $31,000,000 | 6.1% |
| Carlisle Crossing | Carlisle, PA | 2005 / NAP | 152,487 | 95.3% | $15,760,000 | 6.1% | $30,200,000 | 5.9% |
| Southway Shopping Center | Houston, TX | 1976-2011 / NAP | 181,836 | 100.0% | $15,660,000 | 6.0% | $30,000,000 | 5.9% |
| Parkway Centre South Shopping | Grove City, OH | 2004 / NAP | 131,887 | 100.0% | $13,550,000 | 5.2% | $25,000,000 | 4.9% |
| Houma Crossing - Houma | Houma, LA | 2008 / NAP | 181,423 | 83.4% | $12,940,000 | 5.0% | $24,800,000 | 4.9% |
| North Lake Square | Gainesville, GA | 2015, 2016 / NAP | 140,116 | 99.0% | $12,790,000 | 4.9% | $24,500,000 | 4.8% |
| Liberty Crossing - Rowlett | Rowlett, TX | 2007 / NAP | 105,769 | 93.2% | $12,470,000 | 4.8% | $23,900,000 | 4.7% |
| Owensboro Towne Center | Owensboro, KY | 1992; 1996; 1997; 1999 / 2015 | 164,941 | 90.5% | $11,850,000 | 4.6% | $22,700,000 | 4.5% |
| Harbor Town Center | Manitowoc, WI | 2005 / NAP | 138,744 | 93.0% | $9,600,000 | 3.7% | $18,400,000 | 3.6% |
| Lord Salisbury Center | Salisbury, MD | 2005 / NAP | 113,821 | 98.8% | $9,140,000 | 3.5% | $15,600,000 | 3.1% |
| Terrell Mill Village | Marietta, GA | 1974 / 2012 | 75,184 | 100.0% | $8,980,000 | 3.5% | $17,200,000 | 3.4% |
| The Ridge at Turtle Creek | Hattiesburg, MS | 1992 / NAP | 98,705 | 100.0% | $8,090,000 | 3.1% | $15,500,000 | 3.0% |
| Nordstrom Rack | Tampa, FL | 1994 / NAP | 45,457 | 97.7% | $7,720,000 | 3.0% | $14,800,000 | 2.9% |
| Ventura Place | Albuquerque, NM | 2008 / NAP | 66,595 | 96.0% | $7,350,000 | 2.8% | $14,090,000 | 2.8% |
| Village at Quail Springs Oklahoma City | Oklahoma City, OK | 1984 / 2004 | 100,404 | 100.0% | $6,940,000 | 2.7% | $13,300,000 | 2.6% |
| Wallace Commons I | Salisbury, NC | 2008 / NAP | 98,509 | 98.5% | $6,680,000 | 2.6% | $12,800,000 | 2.5% |
| Waterford Park South | Clarksville, IN | 2005 / 2008 | 91,906 | 93.4% | $6,580,000 | 2.5% | $12,600,000 | 2.5% |
| Evergreen Marketplace | Evergreen Park, IL | 2013 / NAP | 49,842 | 100.0% | $5,950,000 | 2.3% | $11,400,000 | 2.2% |
| Derby Marketplace | Derby, KS | 2015 / NAP | 100,000 | 100.0% | $5,480,000 | 2.1% | $10,500,000 | 2.1% |
| Stoneridge Village | Jefferson City, MO | 2008 / NAP | 72,483 | 100.0% | $5,350,000 | 2.1% | $9,300,000 | 1.8% |
| FreshThyme and DSW | Fort Wayne, IN | 1985 / 2014 | 49,033 | 100.0% | $3,910,000 | 1.5% | $7,500,000 | 1.5% |
| Crossroads Annex - Lafayette | Lafayette, LA | 2012 / NAP | 40,578 | 100.0% | $3,710,000 | 1.4% | $7,100,000 | 1.4% |
| Tellico Village | Loudon, TN | 2008 / NAP | 40,928 | 100.0% | $3,440,000 | 1.3% | $6,600,000 | 1.3% |
| Walmart Neighborhood Market | Summerville, SC | 2015 / NAP | 51,441 | 100.0% | $3,240,000 | 1.2% | $6,200,000 | 1.2% |
| PetSmart & Old Navy | Reynoldsburg, OH | 2012 / NAP | 28,970 | 100.0% | $2,970,000 | 1.1% | $5,700,000 | 1.1% |
| Sutter’s Creek | Rocky Mount, NC | 1996 / NAP | 80,004 | 100.0% | $2,690,000 | 1.0% | $5,150,000 | 1.0% |
| Mattress Firm and Panera Bread | Elyria, OH | 2016 / NAP | 8,800 | 100.0% | $2,270,000 | 0.9% | $4,350,000 | 0.9% |
| Total/Wtd. Avg.(2) | 3,117,102 | 95.3% | $260,000,000 | 100.0% | $508,200,000(3) | 100.0% |
| (1) | Information is based on the underwritten rent roll dated as of September 1, 2023. |
| (2) | Occ. % excludes 11 non-collateral tenants at The Centrum mortgaged property, including Home Depot and Best Buy. |
| (3) | The total Appraised Value represents the “As Portfolio” value which includes a portfolio premium to the portfolio properties if sold together on a bulk basis. The sum of the “As-Is” appraised values on a standalone basis is $498,190,000. |
| THE INFORMATION IN THIS STRUCTURAL AND COLLATERAL TERM SHEET IS NOT COMPLETE AND MAY BE AMENDED PRIOR TO THE TIME OF SALE. THIS TERM SHEET IS NOT AN OFFER TO SELL THESE SECURITIES AND IT IS NOT A SOLICITATION OF AN OFFER TO BUY THESE SECURITIES IN ANY JURISDICTION WHERE THE OFFER OR SALE IS NOT PERMITTED. | ||
| 116 | ||
| Retail – Various | Loan #9 | Cut-off Date Balance: | $30,000,000 | |
| Various | RTL Retail Portfolio | Cut-off Date LTV: | 51.2% | |
| Various | U/W NCF DSCR: | 1.97x | ||
| U/W NOI Debt Yield: | 13.8% |
Major Tenants.
Hobby Lobby Stores, Inc. (277,512 square feet; 8.9% of portfolio net rentable area; 5.4% of portfolio underwritten base rent). Hobby Lobby Stores, Inc. (“Hobby Lobby”) was founded in 1972 and has over 900 stores today. Hobby Lobby has over 43,000 employees and operates in 48 different states. Hobby Lobby had revenue of approximately $7.7 billion in 2022, which was an approximately 20.3% year-over-year increase from 2021. Hobby Lobby occupies 55,126 square feet at the Village at Quail Springs Oklahoma City mortgaged property with a lease expiration date of September 30, 2028 and three, five-year renewal options remaining. Hobby Lobby occupies 55,710 square feet at the Sutter’s Creek mortgaged property with a lease expiration date of August 31, 2031 and two, five-year renewal options remaining. Hobby Lobby occupies 56,676 square feet at the Houma Crossing - Houma mortgaged property with a lease expiration date of August 31, 2031 and two, five-year renewal options remaining. Hobby Lobby occupies 55,000 square feet at the Derby Marketplace mortgaged property with a lease expiration date of September 30, 2030 and four, five-year renewal options remaining. Hobby Lobby occupies 55,000 square feet at the North Lake Square mortgaged property with a lease expiration date of October 31, 2030 and three, five-year renewal options remaining. Hobby Lobby does not have any termination options at any of the mortgaged properties.
Academy Sports and Outdoors (182,928 square feet; 5.9% of portfolio net rentable area; 5.2% of portfolio underwritten base rent). Academy Sports and Outdoors (“Academy Sports”) is a full-line sporting goods and outdoor recreation retailer throughout the U.S. Academy Sports was founded in 1938 and now operates 271 stores across 18 different states. Academy Sports occupies 45,000 square feet at the Stoneridge Village mortgaged property with a lease expiration date of February 28, 2039 and three, five-year renewal options remaining. Academy Sports occupies 75,760 square feet at The Ridge at Turtle Creek mortgaged property with a lease expiration date of January 31, 2035, and four, five-year renewal options remaining. Academy Sports occupies 62,168 square feet at the Lawton Marketplace Lawton mortgaged property with a lease expiration date of January 31, 2033, and three, five-year renewal options remaining. Academy Sports does not have any termination options at any of the mortgaged properties.
Ross Dress For Less (167,328 square feet; 5.4% of portfolio net rentable area; 4.8% of portfolio underwritten base rent). Ross Dress For Less (“Ross”) is an American chain of discount department stores headquartered in Dublin, California. Ross is the largest off-price retailer in the U.S., operating 1,704 stores in 40 different states, the District of Columbia and Guam. Ross reported 2022 revenues of $18.7 billion and was named a Fortune 500 company. Ross Stores Inc., the parent company of Ross, has approximately 100,000 employees. Ross occupies 27,657 square feet at the Liberty Crossing - Rowlett mortgaged property with a lease expiration date of January 31, 2026 and three, five-year renewal options remaining. Ross occupies 31,815 square feet at the Southway Shopping Center mortgaged property with a lease expiration date of January 31, 2026 and two, five-year renewal options remaining. Ross occupies 27,623 square feet at the Waterford Park South mortgaged property with a lease expiration date of January 31, 2025 and four, five-year renewal options remaining. Ross occupies 25,046 square feet at the Evergreen Marketplace mortgaged property with a lease expiration date of January 31, 2029 and four, five-year renewal options remaining. Ross occupies 30,187 square feet at the Lord Salisbury Center mortgaged property with a lease expiration date of January 31, 2026 and two, five-year renewal options remaining. Ross occupies 25,000 square feet at the Derby Marketplace mortgaged property with a lease expiration date of January 31, 2027 and four, five-year renewal options remaining. Ross does not have any termination options at any of the mortgaged properties.
| THE INFORMATION IN THIS STRUCTURAL AND COLLATERAL TERM SHEET IS NOT COMPLETE AND MAY BE AMENDED PRIOR TO THE TIME OF SALE. THIS TERM SHEET IS NOT AN OFFER TO SELL THESE SECURITIES AND IT IS NOT A SOLICITATION OF AN OFFER TO BUY THESE SECURITIES IN ANY JURISDICTION WHERE THE OFFER OR SALE IS NOT PERMITTED. | ||
| 117 | ||
| Retail – Various | Loan #9 | Cut-off Date Balance: | $30,000,000 | |
| Various | RTL Retail Portfolio | Cut-off Date LTV: | 51.2% | |
| Various | U/W NCF DSCR: | 1.97x | ||
| U/W NOI Debt Yield: | 13.8% |
The following table presents a summary regarding the major tenants at the RTL Retail Portfolio Properties:
Major Tenants(1)
| Tenant Name | Credit Rating (Moody’s/ S&P/Fitch)(2) | Property/ Property Count | Tenant NRSF | % of NRSF | Annual U/W Gross Rent PSF(3) | Annual U/W Gross Rent(3) | % of Total Annual U/W Gross Rent(3) | Lease Expiration Date | Term. Option | Sales PSF(4) | Occupancy Cost(4) |
| Major Tenants | |||||||||||
| Hobby Lobby | NR/NR/NR | 5(5) | 277,512 | 8.9% | $7.74 | $2,149,125 | 5.4% | Various(5) | N | NAV | NAV |
| Academy Sports | NR/BB/NR | 3(6) | 182,928 | 5.9% | $11.27 | $2,060,914 | 5.2% | Various(6) | N | NAV | NAV |
| Ross | A2/BBB+/NR | 6(7) | 167,328 | 5.4% | $11.48 | $1,921,113 | 4.8% | Various(7) | N | $552.59(8) | 3.2%(8) |
| PetSmart | B3/B+/NR | 9(9) | 158,353 | 5.1% | $15.38 | $2,434,699 | 6.1% | Various(9) | N | NAV | NAV |
| Best Buy | A3/BBB+/NR | 4(10) | 150,981 | 4.8% | $9.77 | $1,475,221 | 3.7% | Various(10) | N | NAV | NAV |
| Kohls Corporation | Ba3/BB/BBB- | 2(11) | 137,062 | 4.4% | $6.89 | $943,882 | 2.4% | 1/31/2029 | N | NAV | NAV |
| TJ Maxx | A2/A/NR | 5(12) | 123,913 | 4.0% | $10.11 | $1,252,852 | 3.1% | Various(12) | N | $447.52(13) | 3.8%(13) |
| Super G Mart | NR/NR/NR | The Centrum | 108,714 | 3.5% | $6.00 | $652,284 | 1.6% | 5/31/2042 | N | NAV | NAV |
| Michaels | Caa2/B-/NR | 4(14) | 88,275 | 2.8% | $12.11 | $1,069,053 | 2.7% | Various(14) | N | $151.34(15) | 10.5%(15) |
| Five Below | NR/NR/NR | 9(16) | 79,239 | 2.5% | $16.75 | $1,326,940 | 3.3% | Various(16) | N | NAV | NAV |
| Total Major Tenants | 1,474,305 | 47.3% | $10.37 | $15,286,082 | 38.4% | ||||||
| Non-Major Tenants | 1,496,417 | 48.0% | $16.39 | $24,519,919 | 61.6% | ||||||
| Occupied Collateral Total | 2,970,722 | 95.3% | $13.40 | $39,806,001 | 100.0% | ||||||
| Vacant Space | 146,380 | 4.7% | |||||||||
| Collateral Total | 3,117,102 | 100.0% | |||||||||
| (1) | Information is based on the underwritten rent roll dated as of September 1, 2023. |
| (2) | Certain ratings are those of the parent entity, whether or not the parent entity guarantees the lease. |
| (3) | Annual U/W Gross Rent PSF, Annual U/W Gross Rent and % of Total Annual U/W Gross Rent include $326,233 of contractual rent steps through August 2024 and $101,189 of percentage rent. |
| (4) | Sales PSF and Occupancy Cost represent the trailing 12-month period ending March 31, 2023. |
| (5) | Hobby Lobby occupies 55,126 square feet at the Village at Quail Springs Oklahoma City mortgaged property with a lease expiration date of September 30, 2028, 55,710 square feet at the Sutters Creek mortgaged property with a lease expiration date of August 31, 2031, 56,676 square feet at the Houma Crossing - Houma mortgaged property with a lease expiration date of August 31, 2031, 55,000 square feet at the Derby Marketplace mortgaged property with a lease expiration date of September 30, 2030 and 55,000 square feet at the North Lake Square mortgaged property with a lease expiration date of October 31, 2030. |
| (6) | Academy Sports occupies 45,000 square feet at the Stoneridge Village mortgaged property with a lease expiration date of February 28, 2039, 75,760 square feet at The Ridge at Turtle Creek mortgaged property with a lease expiration date of January 31, 2035 and 62,168 square feet at the Lawton Marketplace Lawton mortgaged property with a lease expiration date of January 31, 2033. |
| (7) | Ross occupies 27,657 square feet at the Liberty Crossing – Rowlett mortgaged property with a lease expiration date of January 31, 2026, 31,815 square feet at the Southway Shopping Center mortgaged property with a lease expiration date of January 31, 2026, 27,623 square feet at the Waterford Park South mortgaged property with a lease expiration date of January 31, 2025, 25,046 square feet at the Evergreen Marketplace mortgaged property with a lease expiration date of January 31, 2029, 30,187 square feet at the Lord Salisbury Center mortgaged property with a lease expiration date of January 31, 2026 and 25,000 square feet at the Derby Marketplace mortgaged property with a lease expiration date of January 31, 2027. |
| (8) | Based solely on sales for Ross at the Southway Shopping Center mortgaged property. |
| (9) | PetSmart occupies 20,087 square feet at the Liberty Crossing mortgaged property with a lease expiration date of January 31, 2024, 17,445 square feet at the Northwoods Marketplace mortgaged property with a lease expiration date of November 30, 2028, 13,858 square feet at the PetSmart & Old Navy mortgaged property with a lease expiration date of September 30, 2032, 20,087 square feet at the Waterford Park South mortgaged property with a lease expiration date of January 31, 2032, 12,157 square feet at the Stoneridge /Village mortgaged property with a lease expiration date of January 31, 2027, 20,087 square feet at the Carlisle Crossing mortgaged property with a lease expiration date of June 30, 2026, 23,197 square feet at the Owensboro Towne Center mortgaged property with a lease expiration date of August 31, 2033, 19,107 square feet at the Parkway Centre South mortgaged property with a lease expiration date of January 31, 2025 and 12,328 square feet at the Lawton Marketplace – Lawton mortgaged property with a lease expiration date of January 31, 2024. |
| (10) | Best Buy occupies 30,000 square feet at the Southway Shopping Center mortgaged property with a lease expiration date of January 31, 2028, 43,278 square feet at the Northwoods Marketplace mortgaged property with a lease expiration date of November 25, 2028, 45,278 square feet at the Village at Quail Springs Oklahoma City mortgaged property with a lease expiration date of March 31, 2025 and 32,425 square feet at the Owensboro Towne Center mortgaged property with a lease expiration date of March 31, 2026. |
| (11) | Kohls Corporation occupies 68,423 square feet at the Harbor Town Center mortgaged property and 68,639 square feet at the Wallace Commons I mortgaged property. Each lease expires on January 31, 2029. |
| (12) | TJ Maxx occupies 22,504 square feet at the Harbor Town Center mortgaged property with a lease expiration date of May 31, 2028, 29,409 square feet at the Owensboro Towne Center mortgaged property with a lease expiration date of January 31, 2027, 28,000 square feet at the Parkway Centre South mortgaged property with a lease expiration date of November 30, 2026, 24,000 square feet at the Lawton Marketplace - Lawton mortgaged property with a lease expiration date of August 31, 2028 and 20,000 square feet at the Derby Marketplace mortgaged property with a lease expiration date of March 31, 2026. |
| (13) | Based solely on sales at the Parkway Centre South Shopping mortgaged property. |
| (14) | Michaels occupies 23,327 square feet at the Northwoods Marketplace mortgaged property with a lease expiration date of February 28, 2026, 21,727 square feet at the Waterford Park South mortgaged property with a lease expiration date of February 28, 2026, 21,574 square feet at the Evergreen Marketplace mortgaged property with a lease expiration date of February 28, 2026 and 21,647 square feet at the Carlisle Crossing mortgaged property with a lease expiration date of May 31, 2026. |
| (15) | Based solely on sales at the Carlisle Crossing and Northwoods Marketplace mortgaged properties. |
| (16) | Five Below occupies 8,474 square feet at the Liberty Crossing – Rowlett mortgaged property with a lease expiration date of February 29, 2032, 8,933 square feet at the Southway Shopping Center mortgaged property with a lease expiration date of January 31, 2027, 8,000 square feet at the Stoneridge Village mortgaged property with |
| THE INFORMATION IN THIS STRUCTURAL AND COLLATERAL TERM SHEET IS NOT COMPLETE AND MAY BE AMENDED PRIOR TO THE TIME OF SALE. THIS TERM SHEET IS NOT AN OFFER TO SELL THESE SECURITIES AND IT IS NOT A SOLICITATION OF AN OFFER TO BUY THESE SECURITIES IN ANY JURISDICTION WHERE THE OFFER OR SALE IS NOT PERMITTED. | ||
| 118 | ||
| Retail – Various | Loan #9 | Cut-off Date Balance: | $30,000,000 | |
| Various | RTL Retail Portfolio | Cut-off Date LTV: | 51.2% | |
| Various | U/W NCF DSCR: | 1.97x | ||
| U/W NOI Debt Yield: | 13.8% |
a lease expiration date of January 31, 2026, 9,450 square feet at the Carlisle Crossing mortgaged property with a lease expiration date of January 31, 2032, 9,000 square feet at the Owensboro Towne Center mortgaged property with a lease expiration date of June 30, 2026, 9,330 square feet at the Parkway Centre South mortgaged property with a lease expiration date of January 31, 2032, 10,000 square feet at the Houma Crossing – Houma mortgaged property with a lease expiration date of January 31, 2029, 7,941 square feet at the Lawton Marketplace - Lawton mortgaged property with a lease expiration date of January 31, 2030 and 8,111 square feet at the North Lake Square mortgaged property with a lease expiration date of July 31, 2026.
The following table presents certain information relating to the lease rollover schedule at the RTL Retail Portfolio Properties:
Lease Expiration Schedule(1)(2)
| Year Ending December 31 | No. of Leases Expiring | Expiring NRSF | % of Total NRSF | Cumulative Expiring NRSF | Cumulative % of Total NRSF | Annual U/W Gross Rent(3) | % of Total Annual U/W Gross Rent(3) | Annual U/W Gross Rent PSF(3) |
| MTM | 1 | 4,068 | 0.1% | 4,068 | 0.1% | $64,736 | 0.2% | $15.91 |
| 2023 | 6 | 29,040 | 0.9% | 33,108 | 1.1% | $588,387 | 1.5% | $20.26 |
| 2024 | 34 | 175,134 | 5.6% | 208,242 | 6.7% | $3,008,031 | 7.6% | $17.18 |
| 2025 | 29 | 181,893 | 5.8% | 390,135 | 12.5% | $2,744,328 | 6.9% | $15.09 |
| 2026 | 48 | 477,019 | 15.3% | 867,154 | 27.8% | $6,521,264 | 16.4% | $13.67 |
| 2027 | 36 | 235,924 | 7.6% | 1,103,078 | 35.4% | $3,980,423 | 10.0% | $16.87 |
| 2028 | 38 | 454,788 | 14.6% | 1,557,866 | 50.0% | $5,930,282 | 14.9% | $13.04 |
| 2029 | 17 | 284,055 | 9.1% | 1,841,921 | 59.1% | $3,430,732 | 8.6% | $12.08 |
| 2030 | 15 | 256,766 | 8.2% | 2,098,687 | 67.3% | $3,666,652 | 9.2% | $14.28 |
| 2031 | 9 | 147,450 | 4.7% | 2,246,137 | 72.1% | $1,424,004 | 3.6% | $9.66 |
| 2032 | 16 | 200,157 | 6.4% | 2,446,294 | 78.5% | $2,600,853 | 6.5% | $12.99 |
| 2033 | 14 | 182,187 | 5.8% | 2,628,481 | 84.3% | $2,484,082 | 6.2% | $13.63 |
| Thereafter | 10 | 342,241 | 11.0% | 2,970,722 | 95.3% | $3,362,227 | 8.4% | $9.82 |
| Vacant | 0 | 146,380 | 4.7% | 3,117,102 | 100.0% | $0 | 0.0% | $0.00 |
| Total/Wtd. Avg.(4) | 273 | 3,117,102 | 100.0% | $39,806,001 | 100.0% | $13.40 |
| (1) | Information obtained from the underwritten rent roll dated as of September 1, 2023. |
| (2) | Certain tenants may have lease termination options that are exercisable prior to the stated expiration date of the subject lease or leases that are not considered in the lease expiration schedule. |
| (3) | Annual U/W Gross Rent, % of Total Annual U/W Gross Rent and Annual U/W Gross Rent PSF are inclusive of $326,233 of contractual rent steps through August 2024 and $101,189 of percentage rent. |
| (4) | Total/Wtd. Avg. Annual U/W Gross Rent PSF excludes vacant space. |
The following table presents historical occupancy percentages at the RTL Retail Portfolio Properties:
Historical Occupancy
12/31/2020(1)(2) | 12/31/2021(1) | 12/31/2022(1) | 9/1/2023(3) |
| 76.5% | 90.7% | 94.1% | 95.3% |
| (1) | Based on occupancy statistics at the Liberty Crossing - Rowlett, Southway Shopping Center, Northwoods Marketplace, The Centrum, and The Village at Quail Springs Oklahoma City mortgaged properties, which were acquired by the borrower sponsor in 2018. The other 24 mortgaged properties had not yet been acquired by the borrower sponsor, and such information was not available. These five mortgaged properties were 93.6% occupied as of the end of 2022 and 92.5% occupied as of September 1, 2023. |
| (2) | The 2020 historical occupancy of 76.5% is driven by The Centrum mortgaged property which was 39.0% occupied. The Centrum mortgaged property’s occupancy increased to 78.0% in 2021 driven by a new 20-year lease for 108,714 square feet to Super G Market, a family-owned grocery store. |
| (3) | Based on the underwritten rent roll. |
| THE INFORMATION IN THIS STRUCTURAL AND COLLATERAL TERM SHEET IS NOT COMPLETE AND MAY BE AMENDED PRIOR TO THE TIME OF SALE. THIS TERM SHEET IS NOT AN OFFER TO SELL THESE SECURITIES AND IT IS NOT A SOLICITATION OF AN OFFER TO BUY THESE SECURITIES IN ANY JURISDICTION WHERE THE OFFER OR SALE IS NOT PERMITTED. | ||
| 119 | ||
| Retail – Various | Loan #9 | Cut-off Date Balance: | $30,000,000 | |
| Various | RTL Retail Portfolio | Cut-off Date LTV: | 51.2% | |
| Various | U/W NCF DSCR: | 1.97x | ||
| U/W NOI Debt Yield: | 13.8% |
Operating History and Underwritten Net Cash Flow. The following table presents certain information relating to the historical operating performance and underwritten net cash flow at the RTL Retail Portfolio Properties:
Cash Flow Analysis(1)
| 2022 | TTM 6/30/2023 | U/W(1) | %(2) | U/W $ per SF | |
| Rents in Place(3) | $30,907,670 | $37,311,334 | $39,378,579 | 69.4% | $12.63 |
| Rent Steps(4) | 0 | 0 | 326,233 | 0.6 | 0.10 |
| Straight Line Rent | 0 | 0 | 7,000 | 0.0 | 0.00 |
| Percentage Rent | 0 | 155,969 | 101,189 | 0.2 | 0.03 |
| Vacancy Gross Up | 0 | 0 | 2,763,888 | 4.9 | 0.89 |
| Gross Potential Rent | $30,907,670 | $37,467,303 | $42,576,889 | 75.1% | $13.66 |
| Total Reimbursements | 10,208,401 | 11,658,704 | 14,147,963 | 24.9 | 4.54 |
| Net Rental Income | $41,116,072 | $49,126,007 | $56,724,852 | 100.0% | $18.20 |
| Other Income | 0 | 68,582 | 0 | 0.0 | 0 |
| (Vacancy/Credit Loss) | 0 | 0 | (2,836,243) | (5.0) | (0.91) |
| Effective Gross Income | $41,116,072 | $49,194,589 | $53,888,610 | 95.0% | $17.29 |
| Real Estate Taxes | 5,916,899 | 6,767,608 | 6,913,585 | 12.8 | 2.22 |
| Insurance | 1,195,587 | 1,243,194 | 2,053,265 | 3.8 | 0.66 |
| Management Fee | 1,550,658 | 1,956,924 | 1,886,101 | 3.5 | 0.61 |
| Other Operating Expenses | 5,400,999 | 5,531,664 | 7,063,842 | 13.1% | 2.27 |
| Total Operating Expenses | $14,064,144 | $15,499,390 | $17,916,793 | 33.2% | $5.75 |
| Net Operating Income | $27,051,928 | $33,695,199 | $35,971,817 | 66.8% | $11.54 |
| Replacement Reserves | 0 | 0 | 521,495 | 1.0 | 0.17 |
| TI/LC | 0 | 0 | 2,040,576 | 3.8 | 0.65 |
| Net Cash Flow | $27,051,928 | $33,695,199 | $33,409,746 | 62.0% | $10.72 |
| NOI DSCR(5) | 1.59x | 1.98x | 2.12x | ||
| NCF DSCR(5) | 1.59x | 1.98x | 1.97x | ||
| NOI Debt Yield(5) | 10.4% | 13.0% | 13.8% | ||
| NCF Debt Yield(5) | 10.4% | 13.0% | 12.8% |
| (1) | Based on the underwritten rent roll dated September 1, 2023. |
| (2) | Represents (i) percent of Net Rental Income for all revenue and vacancy fields, and (ii) percent of Effective Gross Income for all other fields. |
| (3) | Since July 1, 2022, there have been 539,910 square feet (17.3% of net rentable area) of new leases or renewals representing approximately $8.1 million (20.5% of underwritten rents in place.) |
| (4) | Includes contractual rent steps through August 2024. |
| (5) | Debt service coverage ratios and debt yields are based on the RTL Retail Portfolio Whole Loan. |
Appraisal. According to the appraisal dated July 31, 2023, the RTL Portfolio Properties have an “As Portfolio” value of $508,200,000, which includes a portfolio premium to the portfolio properties if sold together on a bulk basis. The sum of the “As Is” values on a stand alone basis is $498,190,000. The Cut-off Date LTV Ratio and LTV Ratio at Maturity based on the aggregate stand-alone appraised “As-Is” values are both 52.2%.
Environmental Matters. According to the Phase I environmental reports (each, an “ESA”) each dated August 1, 2023, a recognized environmental condition was found at the Terrell Mill Village mortgaged property (3.5% ALA, 2.4% of portfolio net rentable area) in connection with dry cleaning operations at the Terrell Mill Village mortgaged property. A 2022 subsurface investigation detected tetrachloroethylene and perchloroethylene in soil gas samples at concentrations above the applicable regulatory standards. At origination, the borrowers reserved $977,500 to complete a subsurface investigation. If the subsurface investigation confirms that there is a vapor intrusion condition, the borrowers will be required to use commercially reasonable efforts to (i) undertake further sampling and (ii) install a passive or active vapor intrusion mitigation system. Additionally, a controlled recognized environmental condition (a “CREC”) was identified at the Evergreen Marketplace mortgaged property (2.3% ALA, 1.6% of portfolio net rentable area) related to prior environmental reports which identified a closed leaking underground storage tank (“LUST”) case and three environmentally impacted areas at the Evergreen Marketplace mortgaged property formerly occupied by a golf course. The LUST case was issued a no further action determination with a use restriction, which states that the mortgaged property may only be used for industrial or commercial purposes. Based on the reported remediation activities, locations of the affected areas relative to the mortgaged property, the soil sampling results and redevelopment of the mortgaged property, the historical uses of the Evergreen Marketplace mortgaged property are considered a CREC. See “Description of the Mortgage Pool—Environmental Considerations” in the prospectus.
| THE INFORMATION IN THIS STRUCTURAL AND COLLATERAL TERM SHEET IS NOT COMPLETE AND MAY BE AMENDED PRIOR TO THE TIME OF SALE. THIS TERM SHEET IS NOT AN OFFER TO SELL THESE SECURITIES AND IT IS NOT A SOLICITATION OF AN OFFER TO BUY THESE SECURITIES IN ANY JURISDICTION WHERE THE OFFER OR SALE IS NOT PERMITTED. | ||
| 120 | ||
| Retail – Various | Loan #9 | Cut-off Date Balance: | $30,000,000 | |
| Various | RTL Retail Portfolio | Cut-off Date LTV: | 51.2% | |
| Various | U/W NCF DSCR: | 1.97x | ||
| U/W NOI Debt Yield: | 13.8% |
Market Overview and Competition.
The following table presents certain market information relating to the RTL Retail Portfolio Properties:
Market Rent Summary(1)
| Property | Location | Market | Submarket | U/W Rental Rate PSF(2)(3) | Market Rent Rate PSF | Average Submarket Vacancy |
| Northwoods Marketplace | North Charleston, SC | Charleston | North Charleston | $14.01 | $13.87 | 4.60% |
| The Centrum | Pineville, NC | Charlotte | Outer Southeast | $10.27 | $11.57 | 3.00% |
| Lawton Marketplace Lawton | Lawton, OK | Lawton MSA | Lawton | $14.07 | $14.50 | 7.50% |
| Carlisle Crossing | Carlisle, PA | Harrisburg | Harrisburg West | $16.34 | $16.87 | 4.40% |
| Southway Shopping Center | Houston, TX | Houston | Southwest | $14.20 | $14.08 | 3.80% |
| Parkway Centre South Shopping | Grove City, OH | Columbus | Southwest | $16.67 | $15.71 | 5.10% |
| Houma Crossing - Houma | Houma, LA | Houma-Thibodaux MSA | Houma | $11.52 | $12.77 | 2.10% |
| North Lake Square | Gainesville, GA | Atlanta | Gainesville/Hall County | $13.11 | $13.97 | 3.50% |
| Liberty Crossing - Rowlett | Rowlett, TX | Dallas-Fort Worth | Sachse/Rowlett | $17.69 | $18.65 | 3.40% |
| Owensboro Towne Center | Owensboro, KY | Owensboro MSA | Daviess County | $12.77 | $12.68 | 4.10% |
| Harbor Town Center | Manitowoc, WI | Green Bay MSA | Manitowoc County | $10.30 | $10.24 | 2.50% |
| Lord Salisbury Center | Salisbury, MD | Salisbury MSA | Wicomico County | $14.20 | $13.34 | 5.50% |
| Terrell Mill Village | Marietta, GA | Atlanta | Cumberland/Galleria | $19.19 | $18.15 | 4.20% |
| The Ridge at Turtle Creek | Hattiesburg, MS | Hattiesburg | Hattiesburg/South Area | $13.12 | $13.33 | 2.30% |
| Nordstrom Rack | Tampa, FL | Hillsborough County | Central Tampa Submarket | $23.24 | $23.23 | 1.80% |
| Ventura Place | Albuquerque, NM | Albuquerque | Far Northeast Heights | $16.59 | $16.06 | 2.90% |
| Village at Quail Springs Oklahoma City | Oklahoma City, OK | Oklahoma County | North Oklahoma City | $9.76 | $11.00 | 5.10% |
| Wallace Commons I | Salisbury, NC | Charlotte | Rowan County | $10.20 | $10.46 | 2.00% |
| Waterford Park South | Clarksville, IN | Louisville MSA | South Clark County | $12.95 | $15.60 | 3.70% |
| Evergreen Marketplace | Evergreen Park, IL | Chicago | Near South Cook | $16.85 | $16.03 | 6.20% |
| Derby Marketplace | Derby, KS | Wichita | Derby-Haysville-Mulvane | $8.28 | $10.79 | 2.30% |
| Stoneridge Village | Jefferson City, MO | Jefferson City | NAV | $15.52 | $13.00 | NAV |
| FreshThyme and DSW | Fort Wayne, IN | Fort Wayne MSA | North Fort Wayne | $13.31 | $12.56 | 5.30% |
| Crossroads Annex - Lafayette | Lafayette, LA | Lafayette MSA | Greater Lafayette | $16.39 | $16.00 | 1.40% |
| Tellico Village | Loudon, TN | Knoxville | Loudon County | $12.64 | $12.72 | 0.60% |
| Walmart Neighborhood Market | Summerville, SC | Charleston | Dorchester County | $8.98 | $9.55 | 6.40% |
| PetSmart & Old Navy | Reynoldsburg, OH | Columbus | Fairfield County | $16.47 | $16.50 | 4.40% |
| Sutter’s Creek | Rocky Mount, NC | Nash, Wake, Franklin, Warren, Halifax, Edgecombe, Wilson, Johnston counties | Nash County | $6.13 | $5.48 | 6.90% |
| Mattress Firm & Panera Bread | Elyria, OH | Cleveland | Lorain County | $36.35 | $34.98 | 3.00% |
| Weighted Average | $13.40 | $13.63 | 3.9% |
| (1) | Information obtained from the appraisals dated between July 7, 2023, and July 25, 2023. |
| (2) | Based on the underwritten rent roll dated September 1, 2023. |
| (3) | Includes $326,233 of contractual rent steps through August 2024 and $101,189 of percentage rent across the portfolio. |
| THE INFORMATION IN THIS STRUCTURAL AND COLLATERAL TERM SHEET IS NOT COMPLETE AND MAY BE AMENDED PRIOR TO THE TIME OF SALE. THIS TERM SHEET IS NOT AN OFFER TO SELL THESE SECURITIES AND IT IS NOT A SOLICITATION OF AN OFFER TO BUY THESE SECURITIES IN ANY JURISDICTION WHERE THE OFFER OR SALE IS NOT PERMITTED. | ||
| 121 | ||
| Retail – Various | Loan #9 | Cut-off Date Balance: | $30,000,000 | |
| Various | RTL Retail Portfolio | Cut-off Date LTV: | 51.2% | |
| Various | U/W NCF DSCR: | 1.97x | ||
| U/W NOI Debt Yield: | 13.8% |
Escrows.
Required Repairs – The RTL Retail Portfolio Whole Loan documents provide for an upfront reserve of $1,027,622 for required repairs.
Real Estate Taxes – The RTL Retail Portfolio Whole Loan documents provide for an upfront reserve of $4,174,654 for real estate taxes and ongoing monthly reserves for real estate taxes in an amount equal to 1/12th of the real estate taxes that the lender estimates will be payable during the next 12 months (initially $596,379).
Insurance – The RTL Retail Portfolio Whole Loan documents provide for an upfront reserve of $5,240 for insurance premiums and ongoing monthly reserves for insurance premiums in an amount equal to 1/12th of the insurance premiums that the lender estimates will be payable during the next 12 months (initially $1,310).
Replacement Reserve – During a Cash Sweep Period (as defined below), the borrowers are required to escrow 1/12th of the product obtained by multiplying $0.25 by the aggregate square footage of the RTL Retail Portfolio Properties (initially approximately $64,940 per month). In the event of a partial release, the monthly deposit will be reduced by an amount equal to 1/12th of the product obtained by multiplying $0.25 by the total number of rentable square feet of the individual mortgaged property that is the subject of such partial release.
TI/LC Reserve – During a Cash Sweep Period, the borrowers are required to escrow 1/12th of the product obtained by multiplying $1.50 by the total number of rentable square feet of the RTL Retail Portfolio Properties (initially approximately $389,638 per month). In the event of a partial release, the monthly deposit will be reduced by an amount equal to 1/12th of the product obtained by multiplying $1.50 by the total number of rentable square feet of the individual mortgaged property that is the subject of such partial release.
Outstanding TI/LC Reserve – The RTL Retail Portfolio Whole Loan documents provide for an upfront reserve of approximately $9,576,923 for outstanding tenant improvements and leasing commissions as of the origination date.
Outstanding Free Rent Reserve – The RTL Retail Portfolio Whole Loan documents provide for an upfront reserve of approximately $311,601 for outstanding free rent as of the origination date.
Gap Rent Reserve – The RTL Retail Portfolio Whole Loan documents provide for an upfront reserve of approximately $241,832 for gap rent as of the origination date.
Environmental Reserve – The RTL Retail Portfolio Whole Loan documents provide for an upfront reserve of approximately $977,500 for the environmental reserve fund.
Lockbox and Cash Management. The RTL Retail Portfolio Whole Loan is structured with a hard lockbox and springing cash management. The borrowers established a lockbox account and were required to deliver letters to the tenants (excluding any tenants who use VersaPay to pay their rent) at the RTL Retail Portfolio Properties directing them to pay all rents directly into a lender-controlled lockbox account. Additionally, all revenues and other monies received by the borrowers or related property manager are required to be deposited into the lockbox account within one business day following receipt. During the occurrence and continuance of a Cash Sweep Event (as defined below), all funds in the lockbox account are required to be swept each business day into the cash management account controlled by the lenders and disbursed on each payment date in accordance with the RTL Retail Portfolio Whole Loan documents, which provide that provided no event of default or borrower bankruptcy event is continuing, such funds will be applied (i) to make required deposits, if any, into the real estate tax and insurance reserves as described above under “Escrows,” (ii) to pay debt service on the RTL Retail Portfolio Whole Loan, (iii) to pay operating and capital expenses in accordance with the annual budget (which is required to be reasonably approved by the lenders during a Cash Sweep Period) and lender-approved extraordinary expenses, (iv) to make required deposits, if any, into the replacement reserve and TI/LC reserve as described above under “Escrows,” and (v) to deposit all excess cash flow to be held as additional security for the RTL Retail Portfolio Whole Loan during the continuance of such Cash Sweep Event.
A “Cash Sweep Period” will commence upon a Cash Sweep Event and will terminate upon the cure of such Cash Sweep Event.
A “Cash Sweep Event” means the occurrence of (i) an event of default, (ii) a Debt Yield Trigger Event (as defined below), or (iii) a Hobby Lobby Trigger Event (as defined below). A Cash Sweep Event will end upon, (x) with respect to clause (i), a cure of such event of default, (y) with respect to clause (ii), (a) achieving a debt yield of at least 9.95% for two consecutive calendar quarters, (b) the delivery by the borrowers to the lenders of the Debt Yield Cure – Letter of Credit (as defined below), or (c) the borrowers’ completion of a Debt Yield Cure – Partial Prepayment (as defined below), and (z) with respect to clause (iii) the occurrence of a Hobby Lobby Trigger Event Cure (as defined below).
A “Debt Yield Trigger Event” will commence upon (i) the debt yield being less than 9.95% for two consecutive calendar quarters or (ii) if the borrowers previously cured or prevented a Debt Yield Trigger Event by depositing a Debt Yield Cure – Letter of Credit with the lenders, the expiration of the three month period that commenced on the date the borrowers delivered such Debt Yield Cure – Letter of Credit to the lenders; provided, however, that a Debt Yield Trigger Event will not be deemed to have occurred if, within five business days of the date described in clause (i) or (ii) of this definition, the borrowers deposit with the lenders the applicable Debt Yield Cure – Letter of Credit or complete the applicable Debt Yield Cure – Partial Prepayment.
| THE INFORMATION IN THIS STRUCTURAL AND COLLATERAL TERM SHEET IS NOT COMPLETE AND MAY BE AMENDED PRIOR TO THE TIME OF SALE. THIS TERM SHEET IS NOT AN OFFER TO SELL THESE SECURITIES AND IT IS NOT A SOLICITATION OF AN OFFER TO BUY THESE SECURITIES IN ANY JURISDICTION WHERE THE OFFER OR SALE IS NOT PERMITTED. | ||
| 122 | ||
| Retail – Various | Loan #9 | Cut-off Date Balance: | $30,000,000 | |
| Various | RTL Retail Portfolio | Cut-off Date LTV: | 51.2% | |
| Various | U/W NCF DSCR: | 1.97x | ||
| U/W NOI Debt Yield: | 13.8% |
A “Debt Yield Cure – Letter of Credit” means a letter of credit in an amount equal to the excess cash flow that would have been swept in the three-month period immediately preceding the applicable date of determination if a Cash Sweep Period had been in effect during such time, as reasonably determined by the lender. Each Debt Yield Cure – Letter of Credit will be effective for a period of three months and the borrowers may continue to prevent subsequent Debt Yield Trigger Events after each three-month period by depositing with the lenders additional Debt Yield Cure – Letters of Credit on, or prior to, the expiration of each such three-month period.
A “Debt Yield Cure – Partial Prepayment” means a partial prepayment of the loan in accordance with the RTL Retail Portfolio Whole Loan documents in an amount (including any required yield maintenance premium) that results in a reduction of the then-outstanding balance of the RTL Retail Portfolio Whole Loan to achieve a debt yield equal to or greater than 9.95% for the trailing 12-month period.
A “Hobby Lobby Trigger Event” will occur if Hobby Lobby or its parent company, or the guarantor of any Hobby Lobby lease, becomes a debtor in any bankruptcy or insolvency proceeding or has its assets made subject to the jurisdiction of a bankruptcy court; provided, however, a Cash Sweep Event will not be deemed to have occurred, and a Cash Sweep Period will not commence, solely as a result of a Hobby Lobby Trigger Event if a Hobby Lobby Reserve Funds Cap Cure (as defined below) occurs within five business days of such Hobby Lobby Trigger Event.
“Hobby Lobby Trigger Event Cure” means that (i) the borrowers provide the lenders with (a) reasonably satisfactory evidence that the assets of Hobby Lobby or its parent company or lease guarantor are no longer subject to the jurisdiction of the bankruptcy court, and (b) satisfactory evidence that each Hobby Lobby lease or its guaranty (as applicable) has been affirmed and is in full force and effect, including an updated tenant estoppel certificate from Hobby Lobby that is reasonably acceptable to the lenders confirming that each Hobby Lobby lease is in full effect, Hobby Lobby is paying full contractual rent, without offset or free rent credit and that there is no default by either party under any Hobby Lobby lease; (ii) the satisfaction of the Hobby Lobby Replacement Lease Criteria (as defined below); or (iii) occurrence of a Hobby Lobby Reserve Funds Cap Cure.
“Hobby Lobby Reserve Funds Cap Cure” means that (i) the borrowers have deposited with the lenders an amount in cash equal to the Hobby Lobby Reserve Funds Cap (as defined below), (ii) during the applicable Cash Sweep Period, the amount on deposit in the excess cash flow reserve account at any time exceeds the Hobby Lobby Reserve Funds Cap, or (iii) the borrowers have deposited with the lenders a Hobby Lobby letter of credit, which is in an amount equal to the Hobby Lobby Reserve Funds Cap.
“Hobby Lobby Reserve Funds Cap” means an amount equal to (i) $4,295,952.13, less (ii) if applicable, the Hobby Lobby Replacement Rent Amount (as defined below).
“Hobby Lobby Replacement Rent Amount” means, following the occurrence of a Hobby Lobby Trigger Event and the execution of one or more Hobby Lobby replacement leases that demise a portion (but not all) of the Hobby Lobby premises, an amount equal to base rent required to be paid by each replacement tenant to the borrowers under the applicable replacement lease for the two year period immediately subsequent to the effective date of such replacement lease.
“Hobby Lobby Replacement Lease Criteria” means (i) the borrowers have entered into one or more Hobby Lobby replacement leases; (ii) each Hobby Lobby replacement tenant is in physical occupancy of the space covered by the applicable replacement lease; and (iii) the borrowers provide the lenders with (a) a copy of each executed Hobby Lobby replacement lease, (b) a tenant estoppel certificate in form and substance reasonably satisfactory to the lenders executed by each Hobby Lobby replacement tenant which confirms that such replacement lease is in full effect and such replacement tenant is in physical occupancy of the space and paying full contractual rent, (c) upon request of the lender, unless the Hobby Lobby replacement lease is fully subordinate to the RTL Retail Portfolio Whole Loan by its terms, a subordination, non-disturbance and attornment agreement in form and substance satisfactory to the lenders executed by each Hobby Lobby replacement tenant and the lender, (d) satisfactory evidence that the borrowers have performed and paid for all tenant improvements relating to such Hobby Lobby replacement tenant and that there are no unpaid leasing commissions associated with such Hobby Lobby replacement tenant, and (e) an updated rent roll.
Subordinate and Mezzanine Indebtedness. None.
Partial Release. On any payment date following the payment date in (a) September 2024 (with prepayment and payment of a yield maintenance premium) or (b) on any payment date following the earlier of two years following the last note to be securitized or August 30, 2026 (with either a partial defeasance or prepayment and payment of a yield maintenance premium), the borrowers may obtain the release any of the RTL Retail Portfolio Properties with 15 days’ notice if the following conditions (among others) are met: (i) no event of default has occurred and is continuing; (ii) the borrowers pay all costs and provide customary documentation as described in the RTL Retail Portfolio Whole Loan documents; (iii) as of the date of consummation of the partial release, (a) if 70% or more of the aggregate rentable square footage of such released property is occupied by tenants as of the partial release date, the debt service coverage ratio with respect to the remaining individual mortgaged properties will be no less than the greater of (A) 2.01x and (B) the debt service coverage ratio immediately prior to the partial release or (b) if less than 70% of the aggregate rentable square footage of such released property is occupied by tenants as of the partial release date, then the debt service coverage ratio with respect to the remaining individual mortgaged properties will be no less than the debt service coverage ratio immediately prior to the partial release; (iv) as of the date of consummation of the partial release, (a) if 70% or more of the aggregate rentable square footage of such released property is occupied by tenants as of the partial release date, the debt yield with respect to the remaining individual mortgaged properties will be no less than the greater of (A) 13.11% and (B) the debt yield immediately prior to the partial release or (b) if less than 70% of the aggregate rentable square footage of such released property is occupied by tenants as of the partial release date, the debt yield with respect to the remaining individual mortgaged properties will be no less than the debt yield immediately prior to the partial release; (v) prepayment (including any applicable yield maintenance premium) or defeasance of the release amount equal to 115% of the allocated loan amount for such individual property and (vi) satisfaction of REMIC related conditions.
| THE INFORMATION IN THIS STRUCTURAL AND COLLATERAL TERM SHEET IS NOT COMPLETE AND MAY BE AMENDED PRIOR TO THE TIME OF SALE. THIS TERM SHEET IS NOT AN OFFER TO SELL THESE SECURITIES AND IT IS NOT A SOLICITATION OF AN OFFER TO BUY THESE SECURITIES IN ANY JURISDICTION WHERE THE OFFER OR SALE IS NOT PERMITTED. | ||
| 123 | ||
| Retail – Various | Loan #9 | Cut-off Date Balance: | $30,000,000 | |
| Various | RTL Retail Portfolio | Cut-off Date LTV: | 51.2% | |
| Various | U/W NCF DSCR: | 1.97x | ||
| U/W NOI Debt Yield: | 13.8% |
Real Estate Substitution. Not permitted.
Letter of Credit. None.
Right of First Offer/Right of First Refusal. The tenant Wal-Mart has a right of first refusal (“ROFR”) to purchase the Walmart Neighborhood Market mortgaged property and the tenant McDonalds has a ROFR to purchase the portion of the Southway Shopping Center mortgaged property occupied by such tenant. Pursuant to the Wal-Mart lease, the ROFR does not apply in connection with a foreclosure or deed-in-lieu of foreclosure, however, such right applies to any subsequent sale. Pursuant to the McDonalds lease, the ROFR only applies if the premises leased to McDonalds is the only portion of the related mortgaged property being transferred.
Ground Lease. None.
Terrorism Insurance. The RTL Retail Portfolio Whole Loan documents require that the “all risk” insurance policy required to be maintained by the borrowers provides coverage for perils and acts of terrorism in an amount not less than 100% of the full replacement cost of the RTL Retail Portfolio Properties. The RTL Retail Portfolio Whole Loan documents also require business income/loss of rents insurance covering perils and acts of terrorism for a period of no less than the 18-month period commencing at the time of loss, together with a 365-day extended period of indemnity; provided, however, the borrowers will not be required to spend on terrorism insurance coverage more than two times the amount of the insurance premiums that are payable in respect of the property insurance and rental loss and/or business income insurance required under the RTL Retail Portfolio Whole Loan (without giving effect to the cost of terrorism, earthquake components and catastrophic premium surcharges of such property and rental loss and/or business income insurance) on the origination date. See “Risk Factors—Risks Relating to the Whole Loans—Terrorism Insurance May Not Be Available for All Mortgaged Properties” in the prospectus.
| THE INFORMATION IN THIS STRUCTURAL AND COLLATERAL TERM SHEET IS NOT COMPLETE AND MAY BE AMENDED PRIOR TO THE TIME OF SALE. THIS TERM SHEET IS NOT AN OFFER TO SELL THESE SECURITIES AND IT IS NOT A SOLICITATION OF AN OFFER TO BUY THESE SECURITIES IN ANY JURISDICTION WHERE THE OFFER OR SALE IS NOT PERMITTED. | ||
| 124 | ||
| Retail – Anchored | Loan #10 | Cut-off Date Balance: | $30,000,000 | |
| Various | Rhino Retail Portfolio 2 | Cut-off Date LTV: | 65.7% | |
| Various | U/W NCF DSCR: | 1.41x | ||
| U/W NOI Debt Yield: | 10.7% |
| THE INFORMATION IN THIS STRUCTURAL AND COLLATERAL TERM SHEET IS NOT COMPLETE AND MAY BE AMENDED PRIOR TO THE TIME OF SALE. THIS TERM SHEET IS NOT AN OFFER TO SELL THESE SECURITIES AND IT IS NOT A SOLICITATION OF AN OFFER TO BUY THESE SECURITIES IN ANY JURISDICTION WHERE THE OFFER OR SALE IS NOT PERMITTED. | ||
| 125 | ||
| Retail – Anchored | Loan #10 | Cut-off Date Balance: | $30,000,000 | |
| Various | Rhino Retail Portfolio 2 | Cut-off Date LTV: | 65.7% | |
| Various | U/W NCF DSCR: | 1.41x | ||
| U/W NOI Debt Yield: | 10.7% |
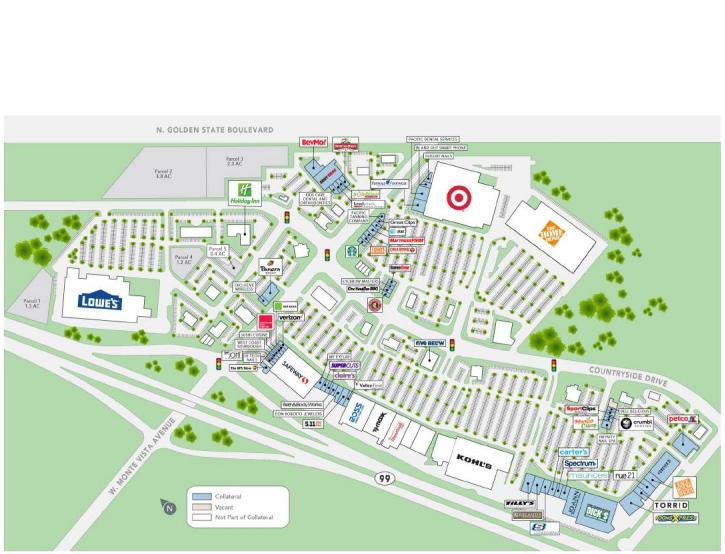
| THE INFORMATION IN THIS STRUCTURAL AND COLLATERAL TERM SHEET IS NOT COMPLETE AND MAY BE AMENDED PRIOR TO THE TIME OF SALE. THIS TERM SHEET IS NOT AN OFFER TO SELL THESE SECURITIES AND IT IS NOT A SOLICITATION OF AN OFFER TO BUY THESE SECURITIES IN ANY JURISDICTION WHERE THE OFFER OR SALE IS NOT PERMITTED. | ||
| 126 | ||
| Retail – Anchored | Loan #10 | Cut-off Date Balance: | $30,000,000 | |
| Various | Rhino Retail Portfolio 2 | Cut-off Date LTV: | 65.7% | |
| Various | U/W NCF DSCR: | 1.41x | ||
| U/W NOI Debt Yield: | 10.7% |
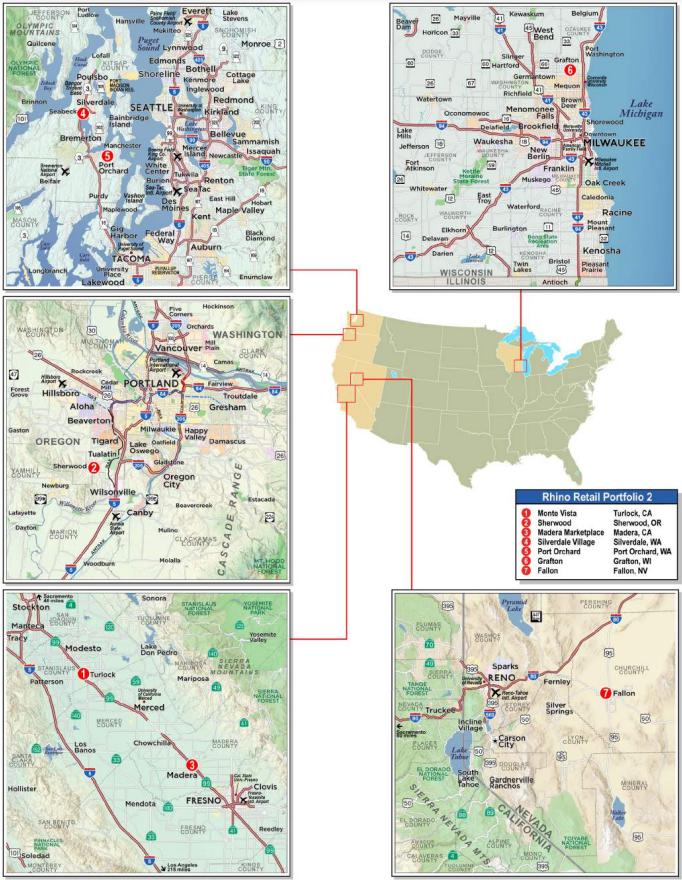
| THE INFORMATION IN THIS STRUCTURAL AND COLLATERAL TERM SHEET IS NOT COMPLETE AND MAY BE AMENDED PRIOR TO THE TIME OF SALE. THIS TERM SHEET IS NOT AN OFFER TO SELL THESE SECURITIES AND IT IS NOT A SOLICITATION OF AN OFFER TO BUY THESE SECURITIES IN ANY JURISDICTION WHERE THE OFFER OR SALE IS NOT PERMITTED. | ||
| 127 | ||
| No. 10 – Rhino Retail Portfolio 2 |
| Mortgage Loan Information | Mortgaged Property Information | ||||||
| Mortgage Loan Seller: | Bank of America, National Association | Single Asset/Portfolio: | Portfolio | ||||
| Credit Assessment (Fitch/KBRA/Moody’s) | NR/NR/NR | Property Type – Subtype: | Retail - Anchored | ||||
| Original Principal Balance(1): | $30,000,000 | Location(4): | Various | ||||
| Cut-off Date Balance(1): | $30,000,000 | Size: | 827,429 SF | ||||
| % of Initial Pool Balance: | 3.3% | Cut-off Date Balance Per SF(1): | $157.72 | ||||
| Loan Purpose: | Refinance | Maturity Date Balance Per SF(1): | $157.72 | ||||
| Borrower Sponsor: | Sanjiv Chopra | Year Built/Renovated(4): | Various / Various | ||||
| Guarantor: | Sanjiv Chopra | Title Vesting: | Fee | ||||
| Mortgage Rate: | 6.9750% | Property Manager(5): | Various | ||||
| Note Date: | July 28, 2023 | Current Occupancy (As of): | 95.5% (7/20/2023) | ||||
| Seasoning: | 4 months | YE 2022 Occupancy: | 84.0% | ||||
| Maturity Date: | August 6, 2033 | YE 2021 Occupancy: | 84.5% | ||||
| IO Period: | 120 months | YE 2020 Occupancy: | NAV | ||||
| Loan Term (Original): | 120 months | YE 2019 Occupancy: | NAV | ||||
| Amortization Term (Original): | NAP | As-Is Appraised Value: | $198,631,638 | ||||
| Loan Amortization Type: | Interest Only | As-Is Appraised Value Per SF: | $240.06 | ||||
| Call Protection: | L(24),YM1(89),O(7) | As-Is Appraisal Valuation Date(6): | Various | ||||
| Lockbox Type: | Soft/Springing Cash Management | Underwriting and Financial Information | |||||
| Additional Debt(1): | Yes | TTM NOI (5/31/2023)(7)(8): | $3,670,860 | ||||
| Additional Debt Type (Balance)(1): | Pari Passu ($100,500,000) | YE 2022 NOI(7): | $3,867,109 | ||||
| YE 2021 NOI(7)(9): | $4,135,747 | ||||||
| YE 2020 NOI(7)(9): | $4,037,012 | ||||||
| U/W Revenues: | $19,233,452 | ||||||
| Escrows and Reserves(2) | U/W Expenses: | $5,271,185 | |||||
| Initial | Monthly | Cap | U/W NOI(8): | $13,962,267 | |||
| Taxes: | $785,206 | $157,041 | NAP | U/W NCF: | $12,992,206 | ||
| Insurance: | $0 | Springing | NAP | U/W DSCR based on NOI/NCF(1): | 1.51x / 1.41x | ||
| Replacement Reserve: | $0 | $10,343 | NAP | U/W Debt Yield based on NOI/NCF(1): | 10.7% / 10.0% | ||
| TI/LC Reserve: | $0 | $51,714 | $1,861,715 | U/W Debt Yield at Maturity based on NOI/NCF(1): | 10.7% / 10.0% | ||
| Deferred Maintenance: | $47,813 | $0 | NAP | Cut-off Date LTV Ratio(1): | 65.7% | ||
| Other Reserves(3): | $11,867,009 | $100,000 | $968,576 | LTV Ratio at Maturity(1): | 65.7% | ||
| Sources and Uses | ||||||||
| Sources | Uses | |||||||
| Whole Loan Amount | $130,500,000 | 99.9 | % | Loan Payoff | $112,026,380 | 85.7 | % | |
| Borrower Equity | 194,081 | 0.1 | Reserves | 12,700,027 | 9.7 | |||
| Closing Costs | 5,967,674 | 4.6 | ||||||
| Total Sources | $130,694,081 | 100.0 | % | Total Uses | $130,694,081 | 100.0 | % | |
| (1) | The Rhino Retail Portfolio 2 Mortgage Loan (as defined below) is part of the Rhino Retail Portfolio 2 Whole Loan (as defined below), which is evidenced by six pari passu notes with an aggregate outstanding principal balance as of the Cut-off Date of $130.5 million. The Cut-off Date Balance Per SF, Maturity Date Balance Per SF, U/W DSCR based on NOI/NCF, U/W Debt Yield based on NOI/NCF, U/W Debt Yield at Maturity based on NOI/NCF, Cut-off Date LTV Ratio and LTV Ratio at Maturity numbers presented above are based on the aggregate principal balance of the promissory notes comprising the Rhino Retail Portfolio 2 Whole Loan. |
| (2) | See “Escrows” section below. |
| (3) | Other Reserves consist of upfront TI/LC reserve ($8,513,460), free rent and gap rent reserve ($2,578,518), Planet Fitness TI/LC reserve ($468,576) and static insurance reserve ($306,455). |
| (4) | See “The Properties” section below. |
| (5) | The Rhino Retail Portfolio 2 Properties (as defined below) are managed by various third-party management companies that are not affiliated with the borrower sponsor, apart from the Fallon mortgaged property. The Fallon mortgaged property is self-managed. |
| (6) | The valuation dates for the individual property appraised values are between June 7, 2023 and June 10, 2023. |
| (7) | Historical cash flows exclude the Monte Vista mortgaged property, as the data provided by the borrower sponsor included income from parcels that are not part of the collateral. |
| (8) | The increase from TTM NOI (5/31/2023) to U/W NOI is primarily attributed to the inclusion of the Monte Vista mortgaged property cash flows. Another driver for this increase is recent leasing throughout the Rhino Retail Portfolio 2 Properties. Recent leasing includes several major tenants, including Ross Dress for Less ($364,078 of underwritten base rent; lease commencement date of December 2023), Treetop Village Early Learning Center ($360,000 of underwritten base rent; lease commencement date of August 2023), Big Lots ($250,000 of underwritten base rent; lease commencement date of December 2023), Smart & Final ($603,220 of underwritten base rent; lease commencement date of December 2023), Planet Fitness ($368,335 of underwritten base rent; lease commencement date of June 2024) and The TJX Companies, Inc. ($236,922 of underwritten base rent; lease commencement date of October 2023. |
| (9) | YE 2021 NOI excludes the Silverdale Village mortgaged property, as the mortgaged property was acquired in 2021 and such information is not available. |
| THE INFORMATION IN THIS STRUCTURAL AND COLLATERAL TERM SHEET IS NOT COMPLETE AND MAY BE AMENDED PRIOR TO THE TIME OF SALE. THIS TERM SHEET IS NOT AN OFFER TO SELL THESE SECURITIES AND IT IS NOT A SOLICITATION OF AN OFFER TO BUY THESE SECURITIES IN ANY JURISDICTION WHERE THE OFFER OR SALE IS NOT PERMITTED. | ||
| 128 | ||
| Retail – Anchored | Loan #10 | Cut-off Date Balance: | $30,000,000 | |
| Various | Rhino Retail Portfolio 2 | Cut-off Date LTV: | 65.7% | |
| Various | U/W NCF DSCR: | 1.41x | ||
| U/W NOI Debt Yield: | 10.7% |
The Mortgage Loan. The tenth largest mortgage loan (the “Rhino Retail Portfolio 2 Mortgage Loan”) is part of a whole loan (the “Rhino Retail Portfolio 2 Whole Loan”) that is secured by the borrowers’ fee interests in an 827,429 square foot, seven-property anchored retail portfolio located across California, Oregon, Washington, Wisconsin and Nevada (each individual property, a “Rhino Retail Portfolio 2 Property”, and collectively, the “Rhino Retail Portfolio 2 Properties”). The Rhino Retail Portfolio 2 Whole Loan was co-originated on July 28, 2023 by Barclays Capital Real Estate Inc. and Bank of America, National Association. The non-controlling Note A-5, with an original principal balance and Cut-off Date Balance of $30,000,000, will be contributed to the MSWF 2023-2 securitization trust. The Rhino Retail Portfolio 2 Whole Loan is being serviced pursuant to the pooling and servicing agreement for the BBCMS 2023-C21 trust. See “Description of the Mortgage Pool—The Whole Loans—The Non-Serviced Pari Passu Whole Loans” in the prospectus.
Whole Loan Note Summary
| Notes | Original Balance | Cut-off Date Balance | Note Holder | Controlling Piece | |
| A-1, A-2 | $55,000,000 | $55,000,000 | BBCMS 2023-C21 | Yes | |
| A-3, A-4, A-6 | $45,500,000 | $45,500,000 | BBCMS 2023-C22 | No | |
| A-5 | $30,000,000 | $30,000,000 | MSWF 2023-2 | No | |
| Total | $130,500,000 | $130,500,000 |
The Borrower and the Borrower Sponsors. The borrowers are Rhino Holdings Turlock, LLC, Rhino Holdings Port Orchard, LLC, Rhino Holdings Madera Marketplace, LLC, Rhino Holdings Grafton, LLC, Rhino Holdings Fallon, LLC, Rhino Holdings SV, LLC and Rhino Holdings Sherwood, LLC, all Delaware limited liability companies and special purpose entities with two independent directors. Legal counsel to the borrowers provided a non-consolidation opinion in connection with the origination of the Rhino Retail Portfolio 2 Whole Loan.
The non-recourse carve-out guarantor and borrower sponsor of the Rhino Retail Portfolio 2 Whole Loan is Sanjiv Chopra. Sanjiv Chopra is the founder and chief executive officer of Rhino Investment Group, a real estate acquisition and development firm with a portfolio of over 5 million square feet located on over 60 sites throughout the United States. The borrower sponsor previously owned and controlled an entity that filed for Chapter 11 bankruptcy in 2019 (later converted to Chapter 7 proceedings) related to certain fitness centers operated by such entity, and the borrower sponsor filed for a personal bankruptcy in 2011 that was resolved in 2015. See “—Litigation and Other Considerations” and “—Loan Purpose; Default History, Bankruptcy Issues and Other Proceedings” in the prospectus.
The Properties. The Rhino Retail Portfolio 2 Properties consist of seven anchored retail centers located in California (59.9% of whole allocated loan amount (“ALA”)), Oregon (18.8% of ALA), Washington (14.8% of ALA), Wisconsin (3.8% of ALA) and Nevada (2.8% of ALA). The Rhino Retail Portfolio 2 Properties were 95.5% occupied by 142 tenants as of July 20, 2023. The Rhino Retail Portfolio 2 Properties include 5,165 parking spaces (approximately 6.2 parking spaces per 1,000 square feet of net rentable area (“NRA”) based on a weighted average of each Rhino Retail Portfolio 2 Property’s NRA).
Portfolio Summary
| Property Name | Location | Year Built / Renovated | NRSF | Occupancy %(1) | Allocated Cut-off Date Whole Loan Amount | % of ALA | Appraised Value | % of Appraised Value | |
| Monte Vista | Turlock, CA | 2000 / 2015 | 275,087 | 98.7% | $58,000,000 | 44.4% | $94,943,627 | 47.8% | |
| Sherwood | Sherwood, OR | 1995 / NAP | 125,515 | 99.3% | $24,500,000 | 18.8% | $35,558,011 | 17.9% | |
| Madera Marketplace | Madera, CA | 1992 / NAP | 134,833 | 85.8% | $20,200,000 | 15.5% | $28,400,000 | 14.3% | |
| Silverdale Village | Silverdale, WA | 1965 / 2023 | 73,818 | 93.8% | $10,300,000 | 7.9% | $14,390,000 | 7.2% | |
| Port Orchard | Port Orchard, WA | 1995 / 2022 | 75,349 | 100.0% | $9,000,000 | 6.9% | $12,670,000 | 6.4% | |
| Grafton | Grafton, WI | 1989 / 2022 | 82,374 | 98.1% | $4,900,000 | 3.8% | $6,960,000 | 3.5% | |
| Fallon | Fallon, NV | 1990 / NAP | 60,453 | 87.1% | $3,600,000 | 2.8% | $5,710,000 | 2.9% | |
| Total | 827,429 | 95.5% | $130,500,000 | 100.0% | $198,631,638 | 100.0% | |||
| (1) | Occupancy % is as of July 20, 2023. |
| THE INFORMATION IN THIS STRUCTURAL AND COLLATERAL TERM SHEET IS NOT COMPLETE AND MAY BE AMENDED PRIOR TO THE TIME OF SALE. THIS TERM SHEET IS NOT AN OFFER TO SELL THESE SECURITIES AND IT IS NOT A SOLICITATION OF AN OFFER TO BUY THESE SECURITIES IN ANY JURISDICTION WHERE THE OFFER OR SALE IS NOT PERMITTED. | ||
| 129 | ||
| Retail – Anchored | Loan #10 | Cut-off Date Balance: | $30,000,000 | |
| Various | Rhino Retail Portfolio 2 | Cut-off Date LTV: | 65.7% | |
| Various | U/W NCF DSCR: | 1.41x | ||
| U/W NOI Debt Yield: | 10.7% |
Major Tenants.
Harbor Freight Tools (52,829 square feet; 6.4% of portfolio NRA; 4.4% of portfolio underwritten base rent). Harbor Freight Tools was founded in 1977. Harbor Freight Tools (S&P: BB-) now operates over 1,400 stores and has had over 75 million customers in its over 40-year history. Harbor Freight Tools reported revenue of approximately $6.8 billion in 2022, which was approximately a 33.3% increase from 2021. Harbor Freight Tools is a tenant at three of the Rhino Retail Portfolio 2 Properties. Harbor Freight Tools leases 16,310 square feet and has been a tenant at the Fallon mortgaged property since 2020 under a lease that is scheduled to expire in December 2030. Harbor Freight Tools leases 17,500 square feet and has been a tenant at the Grafton mortgaged property since 2022 under a lease that is scheduled to expire in November 2032. Harbor Freight Tools leases 19,019 square feet and has been a tenant at the Silverdale Village mortgaged property since 2022 under a lease that is scheduled to expire in July 2032. Harbor Freight Tools has five, five-year renewal options for its space at the Fallon and Grafton mortgaged properties. Harbor Freight Tools has six, five-year renewal options at the Silverdale Village mortgaged property. Harbor Freight Tools has the right to terminate its lease at the Fallon mortgaged property at any time following the 90-day period from January 1, 2025 through December 31, 2025, with 60 days’ notice, if its gross sales do not exceed $4,000,000 during such period. According to a third party provider, Harbor Freight Tools’ gross sales at the Fallon mortgaged property are currently estimated to be higher than the termination sales threshold. Upon timely delivery of the termination notice, Harbor Freight Tools will be required to pay a termination fee equal to the sum of (i) 50% of the brokerage commission to the extent the same was actually paid by the landlord to the broker and (ii) $50,000 representing 50% of the allowance to the extent the same was actually paid by the landlord to Harbor Freight Tools. Harbor Freight Tools has the right to terminate its space at the Grafton mortgaged property on November 30, 2029, subject to prior written notice provided at any time prior to December 1, 2028. Harbor Freight Tools does not have any termination options at the Silverdale Village mortgaged property.
Hobby Lobby (49,793 square feet; 6.0% of portfolio NRA; 2.7% of portfolio underwritten base rent). Hobby Lobby was founded in 1972 and has over 900 stores today as the largest privately-owned arts-and-crafts retailer in the world. Hobby Lobby has over 43,000 employees and operates in 47 different states. Hobby Lobby had revenue of approximately $7.7 billion in 2022, which was an approximately 20.3% year-over-year increase from 2021. Hobby Lobby has been at the Sherwood mortgaged property since 2020, has a current lease expiration date in February 2030 and has three, five-year lease renewal options remaining. Hobby Lobby has no termination options.
Dick’s Sporting Goods (45,000 square feet; 5.4% of portfolio NRA; 4.9% of portfolio underwritten base rent). Dick’s Sporting Goods (“Dick’s”) is a Fortune 500 company founded in 1948 and headquartered in Pittsburgh, Pennsylvania. Dick’s (Moody’s/S&P: Baa3/BBB) is an omnichannel retailer that serves athletes and outdoor enthusiasts by offering an assortment of sports equipment, apparel, footwear and accessories. Dick’s operates more than 850 Dick’s Sporting Goods, Golf Galaxy, Public Lands, Moosejaw, Going Going Gone! and Warehouse Sale stores, online, and through its mobile app. Dick’s reported net sales of $12.4 billion for the trailing 12-month period through January 31, 2023, which was a 0.6% increase from the trailing 12 month period through January 31, 2022 and 41% higher than the trailing 12 month period through January 31, 2020. Dick’s has been at the Monte Vista mortgaged property since 2014, has a current lease expiration in January 2025 and has three, five-year renewal options remaining. Dick’s has no termination options.
| THE INFORMATION IN THIS STRUCTURAL AND COLLATERAL TERM SHEET IS NOT COMPLETE AND MAY BE AMENDED PRIOR TO THE TIME OF SALE. THIS TERM SHEET IS NOT AN OFFER TO SELL THESE SECURITIES AND IT IS NOT A SOLICITATION OF AN OFFER TO BUY THESE SECURITIES IN ANY JURISDICTION WHERE THE OFFER OR SALE IS NOT PERMITTED. | ||
| 130 | ||
| Retail – Anchored | Loan #10 | Cut-off Date Balance: | $30,000,000 | |
| Various | Rhino Retail Portfolio 2 | Cut-off Date LTV: | 65.7% | |
| Various | U/W NCF DSCR: | 1.41x | ||
| U/W NOI Debt Yield: | 10.7% |
The following table presents certain information relating to the tenancy at the Rhino Retail Portfolio 2 Properties:
Tenant Summary(1)
| Tenant | Property | Ratings Fitch(2) | Net Rentable Area (SF) | % of Total NRA | U/W Base Rent PSF(3) | U/W Base Rent(3) | % of Total U/W Base Rent(3) | Lease Exp. Date | Renewal Options | ||
| Harbor Freight Tools | Various(4) | B1 / BB- / NR | 52,829 | 6.4% | $12.30 | $649,600 | 4.4% | Various(4) | Various(5) | ||
| Hobby Lobby | Sherwood | NR / NR / NR | 49,793 | 6.0% | $8.00 | $398,344 | 2.7% | 2/28/2030 | 3 x 5 yr | ||
| Dick's Sporting Goods | Monte Vista | Baa3 / BBB / NR | 45,000 | 5.4% | $16.00 | $720,000 | 4.9% | 1/31/2025 | 3 x 5 yr | ||
| Big Lots(7) | Grafton | NR / NR / NR | 39,042 | 4.7% | $6.40 | $250,000 | 1.7% | 1/31/2034 | 3 x 5 yr | ||
| Boot Barn | Various(6) | NR / NR / NR | 32,040 | 3.9% | $7.69 | $246,546 | 1.7% | Various(6) | 3 x 5 yr | ||
| Smart & Final(7) | Madera Marketplace | NR / NR / NR | 30,161 | 3.6% | $20.00 | $603,220 | 4.1% | 11/30/2038 | 3 x 5 yr | ||
| Treetop Village Early Learning Center | Port Orchard | NR / NR / NR | 30,000 | 3.6% | $12.00 | $360,000 | 2.4% | 8/31/2033 | 2 x 5 yr | ||
| Ross Dress for Less(7) | Madera Marketplace | A2 / BBB+ / NR | 28,321 | 3.4% | $12.86 | $364,078 | 2.5% | 1/31/2034 | 4 x 5 yr | ||
| The TJX Companies, Inc. | Fallon | A2 / A / NR | 22,564 | 2.7% | $10.50 | $236,922 | 1.6% | 9/30/2033 | 4 x 5 yr | ||
| Dollar Tree | Various(8) | NR / NR / NR | 20,974 | 2.5% |
| $8.80 | $184,518 | 1.2% |
| Various(8) | 3 x 5 yr |
| Top Ten Tenants | 350,724 | 42.4% | $11.44 | $4,013,228 | 27.2% | ||||||
| Remaining Tenants | 439,153 | 53.1% |
| $24.48 | $10,752,539 | 72.8% |
| ||||
| Occupied Collateral Total / Wtd. Avg. | 789,877 | 95.5% | $18.69 | $14,765,767 | 100.0% | ||||||
| Vacant Space | 37,552 | 4.5% |
| ||||||||
| Total | 827,429 | 100.0% | |||||||||
| (1) | Information is based on the underwritten rent roll dated July 20, 2023. |
| (2) | Certain ratings are those of the parent company whether or not the parent company guarantees the lease. |
| (3) | Includes $384,278 of percentage rent. Of the $384,278 of percentage rent, $294,862 is attributed to Forever 21 at the Monte Vista mortgaged property. |
| (4) | Harbor Freight Tools occupies 16,310 square feet at the Fallon mortgaged property with a lease expiration date of December 31, 2030, 17,500 square feet at the Grafton mortgaged property with a lease expiration date of November 30, 2032 and a one-time right to terminate its lease on November 30, 2029 by providing the landlord written notice prior to December 1, 2028. Harbor Freight Tools occupies 19,019 square feet at the Silverdale Village mortgaged property with a lease expiration date of July 31, 2032. |
| (5) | Harbor Freight Tools has six, five-year renewal options at the Silverdale Village mortgaged property and five, five-year renewal options at the Fallon and Grafton mortgaged properties. |
| (6) | Boot Barn occupies 13,776 square feet at the Fallon mortgaged property with a lease expiration date of May 31, 2032, and 18,264 square feet at the Monte Vista mortgaged property with a lease expiration date of November 30, 2031. Boot Barn has the option to terminate its space at the Monte Vista mortgaged property in the event that its sales from December 1, 2025 through November 30, 2026 (the “Measuring Period”) are less than $2,200,000. If sales are less than $2,200,000 in such period, and if Boot Barn exercises the termination option, Boot Barn must provide termination notice to the lenders within 90 days after the Measuring Period. Boot Barn’s lease would then terminate 180 days after the lenders’ receipt of the termination notice. Boot Barn reported sales of approximately $7.6 million ($418 per square foot at the Monte Vista mortgaged property) for the trailing 12-month period ending in June 2023. |
| (7) | Big Lots, Smart & Final and Ross Dress for Less are each expected to take occupancy in December 2023. |
| (8) | Dollar Tree is expected to take occupancy of 11,600 square feet at the Port Orchard mortgaged property in February 2024, with a lease expiration date of February 28, 2034, and occupies 9,374 square feet at the Grafton mortgaged property with a lease expiration date of August 31, 2026. |
| THE INFORMATION IN THIS STRUCTURAL AND COLLATERAL TERM SHEET IS NOT COMPLETE AND MAY BE AMENDED PRIOR TO THE TIME OF SALE. THIS TERM SHEET IS NOT AN OFFER TO SELL THESE SECURITIES AND IT IS NOT A SOLICITATION OF AN OFFER TO BUY THESE SECURITIES IN ANY JURISDICTION WHERE THE OFFER OR SALE IS NOT PERMITTED. | ||
| 131 | ||
| Retail – Anchored | Loan #10 | Cut-off Date Balance: | $30,000,000 | |
| Various | Rhino Retail Portfolio 2 | Cut-off Date LTV: | 65.7% | |
| Various | U/W NCF DSCR: | 1.41x | ||
| U/W NOI Debt Yield: | 10.7% |
The following table presents certain information relating to the lease rollover schedule at the Rhino Retail Portfolio 2 Properties:
Lease Expiration Schedule(1)(2)
| Year Ending December 31, | No. of Leases Expiring | Expiring NRSF | % of Total NRSF | Cumulative Expiring NRSF | Cumulative % of Total NRSF | Annual U/W Base Rent(3) | % of Total Annual U/W Base Rent(3) | Annual U/W Base Rent PSF(3) |
| 2023 | 0 | 0 | 0.0% | 0 | 0.0% | $0 | 0.0% | $0.00 |
| 2024 | 14 | 31,885 | 3.9% | 31,885 | 3.9% | $992,540 | 6.7% | $31.13 |
| 2025 | 18 | 103,164 | 12.5% | 135,049 | 16.3% | $2,103,466 | 14.2% | $20.39 |
| 2026 | 19 | 74,037 | 8.9% | 209,086 | 25.3% | $1,489,074 | 10.1% | $20.11 |
| 2027 | 22 | 83,373 | 10.1% | 292,459 | 35.3% | $1,933,683 | 13.1% | $23.19 |
| 2028 | 17 | 64,277 | 7.8% | 356,736 | 43.1% | $1,623,342 | 11.0% | $25.26 |
| 2029 | 7 | 17,366 | 2.1% | 374,102 | 45.2% | $477,654 | 3.2% | $27.51 |
| 2030 | 12 | 92,732 | 11.2% | 466,834 | 56.4% | $1,225,317 | 8.3% | $13.21 |
| 2031 | 6 | 29,437 | 3.6% | 496,271 | 60.0% | $379,825 | 2.6% | $12.90 |
| 2032 | 11 | 74,113 | 9.0% | 570,384 | 68.9% | $1,176,023 | 8.0% | $15.87 |
| 2033 | 10 | 71,027 | 8.6% | 641,411 | 77.5% | $1,216,079 | 8.2% | $17.12 |
| Thereafter | 12 | 148,466 | 17.9% | 789,877 | 95.5% | $2,148,765 | 14.6% | $14.47 |
| Vacant | 0 | 37,552 | 4.5% | 827,429 | 100.0% | $0 | 0.0% | $0.00 |
| Total/Wtd. Avg. | 148 | 827,429 | 100.0% | $14,765,767 | 100.0% | $18.69 |
| (1) | Information is based on the underwritten rent roll dated July 20, 2023. |
| (2) | Certain tenants may have lease termination options that are exercisable prior to the originally stated expiration date of the subject lease and that are not considered in the Lease Expiration Schedule. |
| (3) | Annual U/W Base Rent, % of Total Annual U/W Base Rent and Annual U/W Base Rent PSF include $384,278 of percentage rent. Of the $384,278 of percentage rent, $294,862 is attributed to Forever 21 at the Monte Vista mortgaged property. |
The following table presents historical occupancy percentages at the Rhino Retail Portfolio 2 Properties:
Historical Occupancy
12/31/2020 | 12/31/2021(1) | 12/31/2022(1)(2) | 7/20/2023(2)(3) |
| NAV | 84.5% | 84.0% | 95.5% |
| (1) | Includes certain parcels at the Monte Vista mortgaged property that are no longer included in the collateral. |
| (2) | The increase from the 2022 occupancy to the current occupancy is attributed to recent leasing throughout the Rhino Retail Portfolio 2 Properties. Recent leasing includes several major tenants, including Ross Dress for Less (28,321 SF; lease commencement date of December 2023), Treetop Village Early Learning Center (30,000 SF; lease commencement date of August 2023), Big Lots (39,042 SF; lease commencement date of December 2023), Smart & Final (30,161 SF; lease commencement date of December 2023), Planet Fitness (19,910 SF; lease commencement date of June 2024) and The TJX Companies, Inc. (22,564 SF; lease commencement date of October 2023). |
| (3) | Information based on the underwritten rent roll. |
| THE INFORMATION IN THIS STRUCTURAL AND COLLATERAL TERM SHEET IS NOT COMPLETE AND MAY BE AMENDED PRIOR TO THE TIME OF SALE. THIS TERM SHEET IS NOT AN OFFER TO SELL THESE SECURITIES AND IT IS NOT A SOLICITATION OF AN OFFER TO BUY THESE SECURITIES IN ANY JURISDICTION WHERE THE OFFER OR SALE IS NOT PERMITTED. | ||
| 132 | ||
| Retail – Anchored | Loan #10 | Cut-off Date Balance: | $30,000,000 | |
| Various | Rhino Retail Portfolio 2 | Cut-off Date LTV: | 65.7% | |
| Various | U/W NCF DSCR: | 1.41x | ||
| U/W NOI Debt Yield: | 10.7% |
Underwritten Net Cash Flow. The following table presents certain information relating to the underwritten net cash flow at the Rhino Retail Portfolio 2 Properties:
Cash Flow Analysis(1)
| 2020 | 2021(2) | 2022 | TTM 5/31/2023(3) | U/W(3) | %(4) | U/W $ per SF | |
| Base Rent | $4,765,307 | $4,643,279 | $4,867,367 | $4,715,375 | $14,381,488 | 70.5% | $17.38 |
| Vacancy Gross Up | 0 | 0 | 0 | 0 | 761,094 | 3.7 | 0.92 |
| Percentage Rent(5) | 12,993 | 6,671 | 0 | 0 | 384,278 | 1.9 | 0.46 |
| Gross Potential Income | $4,778,300 | $4,649,950 | $4,867,367 | $4,715,375 | $15,526,860 | 76.1% | $18.77 |
| Reimbursements | 1,577,271 | 1,500,131 | 1,531,526 | 1,362,892 | 4,717,952 | 23.1 | 5.70 |
| Other Income | 31,823 | 65,058 | 32,347 | 39,084 | 146,357 | 0.7 | 0.18 |
| Net Rental Income | $6,387,394 | $6,215,139 | $6,431,240 | $6,117,352 | $20,391,169 | 100.0% | $24.64 |
| (Vacancy/Credit Loss) | 0 | 0 | 0 | 0 | (1,157,716) | (5.7) | (1.40) |
| Effective Gross Income | $6,387,394 | $6,215,139 | $6,431,240 | $6,117,352 | $19,233,452 | 94.3% | $23.24 |
| Total Expenses | $2,350,382 | $2,079,392 | $2,564,132 | $2,446,492 | $5,271,185 | 27.4% | $6.37 |
| Net Operating Income | $4,037,012 | $4,135,747 | $3,867,109 | $3,670,860 | $13,962,267 | 72.6% | $16.87 |
| TI/LC | 0 | 0 | 0 | 0 | 845,946 | 4.4 | 1.02 |
| Cap Ex | 0 | 0 | 0 | 0 | 124,114 | 0.6 | 0.15 |
| Net Cash Flow | $4,037,012 | $4,135,747 | $3,867,109 | $3,670,860 | $12,992,206 | 67.6% | $15.70 |
| NOI DSCR(6) | 0.44x | 0.45x | 0.42x | 0.40x | 1.51x | ||
| NCF DSCR(6) | 0.44x | 0.45x | 0.42x | 0.40x | 1.41x | ||
| NOI Debt Yield(6) | 3.1% | 3.2% | 3.0% | 2.8% | 10.7% | ||
| NCF Debt Yield(6) | 3.1% | 3.2% | 3.0% | 2.8% | 10.0% |
| (1) | Historical cash flows exclude the Monte Vista mortgaged property, as the data provided by the borrower sponsor included income from parcels that are not part of the collateral. |
| (2) | 2021 cash flows exclude the Silverdale Village mortgaged property, as it was acquired in 2021 and such information is not available. |
| (3) | The increase from TTM 5/31/2023 Net Operating Income to U/W Net Operating Income is primarily attributed to the inclusion of the Monte Vista mortgaged property cash flows, which has an underwritten net operating income of $6,327,824 and an underwritten net cash flow of $5,901,878. Another driver for this increase is recent leasing throughout the Rhino Retail Portfolio 2 Properties. Recent leasing includes several major tenants, including Ross Dress for Less ($364,078 of underwritten base rent; lease commencement date of December 2023), Treetop Village Early Learning Center ($360,000 of underwritten base rent; lease commencement date of August 2023), Big Lots ($250,000 of underwritten base rent; lease commencement date of December 2023), Smart & Final ($603,220 of underwritten base rent; lease commencement date of December 2023), Planet Fitness ($368,335 of underwritten base rent; lease commencement date of June 2024) and The TJX Companies, Inc. ($236,922 of underwritten base rent; lease commencement date of October 2023). |
| (4) | % column represents (i) percent of Net Rental Income for revenue fields and (ii) percent of Effective Gross Income for the remainder of fields. |
| (5) | Of the $384,278 of percentage rent, $294,862 is attributed to Forever 21 at the Monte Vista mortgaged property. |
| (6) | Debt service coverage ratios and debt yields are based on the Rhino Retail Portfolio 2 Whole Loan. |
Appraisal. According to the individual appraisals with valuation as-of dates between June 7, 2023 and June 10, 2023, the Rhino Retail Portfolio 2 Properties had an aggregate “As-is” value of $198,631,638, which assumes that certain escrows have been reserved for tenant improvement and leasing commissions, gap rent and free rent associated with the lease up of various tenant spaces in an estimated aggregate amount of $14,456,598, which was reserved at loan closing.
Environmental Matters. According to the Phase I environmental reports dated June 19, 2023 and July 22, 2023, a recognized environmental condition (a “REC”) was identified at the Silverdale Village mortgaged property and controlled recognized environmental conditions (each, a “CREC”) were identified at the Port Orchard and Sherwood mortgaged properties.
A dry-cleaning business formerly operating at the Silverdale Village mortgaged property used cleaning solvent components (chlorinated compounds including Perchloroethylene (“PCE”)) which have impacted soil and groundwater at the Silverdale Village mortgaged property that exceed their respective Model Toxics Control Act cleanup levels. The extent of the impacted soil and groundwater at the Silverdale Village mortgaged property has been fully delineated and an enhanced bioremediation remedial action, approved by the Washington Department of Ecology (“WDE”), is being implemented to address the impacted soil and groundwater. The cleanup is being conducted under a WDE Voluntary Cleanup Plan (“VCP”) agreement between Mentor Company (the prior owner of the Silverdale Village mortgaged property and identified responsible party) and WDE. The chlorinated compound impacts to soil and groundwater at the Silverdale Village mortgaged property is identified as a REC; however, since the responsible party has been identified, and remediation is being conducted under the VCP, no further investigation is required at this time. A third-party consultant hired by Mentor Company estimated $86,000 expenses remaining prior to obtaining closure. Mentor Company has a remaining escrow of $118,116 for the remaining remediation work.
Based on the analytical soil and soil vapor data at the Port Orchard mortgaged property, the presence of PCE impacted soil beneath the South Park Cleaners tenant space is classified as a CREC. On March 26, 2020, a Vapor Intrusion Assessment Report was completed at the Port Orchard mortgaged property. Based on the results of the Vapor Intrusion Assessment Report, further assessment of vapor intrusion risk is not recommended.
| THE INFORMATION IN THIS STRUCTURAL AND COLLATERAL TERM SHEET IS NOT COMPLETE AND MAY BE AMENDED PRIOR TO THE TIME OF SALE. THIS TERM SHEET IS NOT AN OFFER TO SELL THESE SECURITIES AND IT IS NOT A SOLICITATION OF AN OFFER TO BUY THESE SECURITIES IN ANY JURISDICTION WHERE THE OFFER OR SALE IS NOT PERMITTED. | ||
| 133 | ||
| Retail – Anchored | Loan #10 | Cut-off Date Balance: | $30,000,000 | |
| Various | Rhino Retail Portfolio 2 | Cut-off Date LTV: | 65.7% | |
| Various | U/W NCF DSCR: | 1.41x | ||
| U/W NOI Debt Yield: | 10.7% |
CRECs were identified at the Sherwood mortgaged property in connection with a gas station and dry cleaning services. With regard to the gas station, benzene in groundwater was found to be above regulatory criteria, however, the contamination has been determined to be localized and not indicative of a significant contamination plume. With regard to the dry cleaning tenant, PCE was detected in excess of the Oregon Department of Environmental Quality Risk Based Concentrations for urban residential settings and occupational settings. No further action was required given that the vapor intrusion risks were acceptable for commercial occupants, however, the release of PCE represents a CREC.
Environmental insurance was obtained at origination of the Rhino Retail Portfolio 2 Whole Loan for the Port Orchard and Sherwood mortgaged properties with a coverage limit of $4,000,000 and a policy expiration date of July 27, 2026. See “Description of the Mortgage Pool—Mortgage Pool Characteristics—Environmental Considerations” in the prospectus.
Market Overview and Competition. The Rhino Retail Portfolio 2 Properties consist of seven properties located across five different states. The Rhino Retail Portfolio 2 Properties are located in submarkets with vacancy rates ranging from 1.10% to 6.40% and average market asking rents per square foot ranging from $9.01 to $25.90.
The following table presents certain market information relating to the Rhino Retail Portfolio 2 Properties:
Market Summary(1)
| Property Name | Location | Market | Submarket | U/W Rental Rate PSF(2) | Market Rent Rate PSF | Average Submarket Vacancy |
| Monte Vista | Turlock, CA | Stockton Modesto | Turlock SW Stanislaus | $24.43 | $25.90 | 3.10% |
| Sherwood | Sherwood, OR | Portland MSA | I-5 Corridor | $20.84 | $22.39 | 2.70% |
| Madera Marketplace | Madera, CA | Fresno | Suburban Madera | $18.20 | $18.22 | 3.10% |
| Silverdale Village | Silverdale, WA | Kitsap County | 3 Mile | $17.17 | $17.20 | 2.30% |
| Port Orchard | Port Orchard, WA | Kitsap County | 3 Mile | $14.32 | $15.10 | 6.40% |
| Grafton | Grafton, WI | Milwaukee | North Ozaukee | $8.34 | $9.01 | 1.10% |
| Fallon | Fallon, NV | Reno/Sparks | Fallon | $9.25 | $11.89 | 1.10% |
| (1) | Source: Appraisals dated from June 7, 2023 through June 10, 2023. |
| (2) | Based on the underwritten rent roll dated July 20, 2023 and includes $384,278 of percentage rent. |
Escrows. At origination, the borrowers deposited into escrow (i) approximately $8,513,460 for upfront TI/LCs, (ii) approximately $2,578,518 for free rent and gap rent, (iii) $785,206 for taxes, (iv) $468,576 related to a Planet Fitness TI/LC reserve for upfront TI/LCs, (v) $306,455 as a static upfront insurance payment and (vi) $47,813 for deferred maintenance.
Real Estate Taxes – On a monthly basis, the borrowers are required to escrow 1/12th of the annual estimated tax payments, which currently equates to approximately $157,041.
Insurance – If there is no approved blanket policy in place, the borrowers are required to escrow 1/12th of the annual estimated insurance payments on a monthly basis.
Replacement Reserve – On a monthly basis, the borrowers are required to escrow $10,343 ($0.15 per square foot annually) for replacement reserves.
TI/LC Reserve – The borrowers are required to make monthly deposits into the TI/LC reserve in an amount equal to $51,714 ($0.75 per square foot annually) subject to a cap of $1,861,715 (three years of collections).
Planet Fitness Reserve – Planet Fitness is expected to open for business in February 2024 at the Silverdale Village mortgaged property and will be due a $968,576 tenant improvement reimbursement in accordance with its lease. The borrowers deposited $468,576 at origination and on a monthly basis, the borrowers are required to escrow $100,000 until $968,576 is reserved.
Lockbox and Cash Management. The Rhino Retail Portfolio 2 Whole Loan documents require a soft lockbox, with springing cash management. Prior to a Trigger Period (as defined below), all rents received by the borrowers or property manager are required to be deposited into the lockbox account within one business day of receipt. Commencing at the first Trigger Period, the borrowers are required to instruct all tenants to deposit rent directly to the lockbox account. So long as a Trigger Period is not continuing, funds in the lockbox account are required to be transferred to the borrowers’ operating account on each business day. Upon the occurrence and during the continuance of a Trigger Period, all funds in the lockbox account are required to be swept on each business day to a lender-controlled cash management account to be applied and disbursed in accordance with the Rhino Retail Portfolio 2 Whole Loan documents, and all excess cash flow funds remaining in the cash management account after the application of such funds will be applied in accordance with the Rhino Retail Portfolio 2 Whole Loan documents. If the DSCR is less than 1.10x for two consecutive calendar quarters, all excess cash flow will be reserved with the lenders.
A “Trigger Period” will commence upon the earliest of:
| (i) | an event of default; or |
| THE INFORMATION IN THIS STRUCTURAL AND COLLATERAL TERM SHEET IS NOT COMPLETE AND MAY BE AMENDED PRIOR TO THE TIME OF SALE. THIS TERM SHEET IS NOT AN OFFER TO SELL THESE SECURITIES AND IT IS NOT A SOLICITATION OF AN OFFER TO BUY THESE SECURITIES IN ANY JURISDICTION WHERE THE OFFER OR SALE IS NOT PERMITTED. | ||
| 134 | ||
| Retail – Anchored | Loan #10 | Cut-off Date Balance: | $30,000,000 | |
| Various | Rhino Retail Portfolio 2 | Cut-off Date LTV: | 65.7% | |
| Various | U/W NCF DSCR: | 1.41x | ||
| U/W NOI Debt Yield: | 10.7% |
| (ii) | the DSCR being less than 1.10x, based on a 30 year amortization schedule. |
A Trigger Period will end upon the occurrence of:
| ● | with regard to clause (i), the cure of such event of default, and |
| ● | with regard to clause (ii), the date that the DSCR is equal to or greater than 1.15x for two consecutive calendar quarters, based on a 30-year amortization schedule. |
Property Management. The Rhino Retail Portfolio 2 Properties are managed by various third-party management companies that are not affiliated with the borrower sponsor, apart from the Fallon mortgaged property. The Fallon mortgaged property is self-managed.
Partial Release. Provided that no event of default exists, after August 6, 2025, the borrowers may obtain the release of the Fallon mortgaged property, the Grafton mortgaged property and/or the Port Orchard mortgaged property, upon the satisfaction of certain conditions, including, among other conditions: (i) payment of a release price in an amount equal to the greater of (a) 115% of the ALA of the property being released and (b) net proceeds received in connection with the sale of the individual mortgaged property; (ii) if such partial release occurs prior to the open date, which is the payment date occurring in February 2033, payment of the yield maintenance premium; (iii) the debt service coverage ratio is equal to or greater than (a) 1.25x based on a 30-year amortization schedule and (b) the debt service coverage ratio for the then remaining properties (including the individual property to be released) for the 12 months immediately preceding the release; (iv) the loan-to-value ratio for the remaining mortgaged properties is no greater than the lesser of (a) 65.7% and (b) the loan-to-value ratio for the then remaining properties (including the individual property to be released) immediately preceding the release; (v) the net operating income debt yield is equal to the greater of (a) 9.96% and (b) the net operating income flow debt yield for the then remaining properties (including the individual property to be released) for the 12 months immediately preceding the release; and (vi) satisfaction of all REMIC requirements.
Additionally, provided that no event of default exists, the borrowers may obtain a release of the designated outparcel consisting of unimproved land located at the Sherwood mortgaged property upon the satisfaction of certain conditions, including, among other conditions: (i) payment of a release price in an amount equal to the greater of (a) 100% of the appraised value of the designated outparcel and (b) 100% of the net sales proceeds of the designated parcel, provided that in each case, if such release occurs prior to the open date, together with the payment of the applicable yield maintenance premium; and (ii) net operating income debt yield and debt service coverage ratio are greater than or equal to, and the loan to value ratio is less than or equal to, 10.7%, 1.41x and 65.7%, respectively, and such ratios immediately prior to the release.
Real Estate Substitution. Not permitted.
Subordinate and Mezzanine Indebtedness. None.
Permitted Future Mezzanine Debt. From and after the date that is two years following the date on which a securitization has occurred, a mezzanine loan is permitted, provided that each of the following conditions, among others as described in the Rhino Retail Portfolio 2 Whole Loan documents, is satisfied: (i) no event of default has occurred or is continuing; (ii) the combined loan to value ratio is less than or equal to 65.7%; (iii) the operating income flow debt yield as of the date of closing of the proposed permitted mezzanine loan (without giving effect to the permitted mezzanine loan) is equal to or greater than 9.96%; (iv) the combined debt service coverage ratio is equal to or greater than 1.25x based on a 30-year amortization schedule; and (v) rating agency confirmation is obtained.
Ground Lease. None.
Terrorism Insurance. The Rhino Retail Portfolio 2 Whole Loan documents require the borrowers to obtain and maintain property insurance and business interruption insurance for 18 months plus a six-month extended period of indemnity, which insurance is required to cover perils of terrorism and acts of terrorism. See “Risk Factors—Risks Relating to the Mortgage Loans—Terrorism Insurance May Not Be Available for All Mortgaged Properties” in the prospectus.
| THE INFORMATION IN THIS STRUCTURAL AND COLLATERAL TERM SHEET IS NOT COMPLETE AND MAY BE AMENDED PRIOR TO THE TIME OF SALE. THIS TERM SHEET IS NOT AN OFFER TO SELL THESE SECURITIES AND IT IS NOT A SOLICITATION OF AN OFFER TO BUY THESE SECURITIES IN ANY JURISDICTION WHERE THE OFFER OR SALE IS NOT PERMITTED. | ||
| 135 | ||
| Various | Loan #11 | Cut-off Date Balance: | $30,000,000 | |
| Various | Blackbird Portfolio | Cut-off Date LTV: | 53.3% | |
| Ann Arbor, MI 48108 | U/W NCF DSCR: | 1.40x | ||
| U/W NOI Debt Yield: | 12.9% |
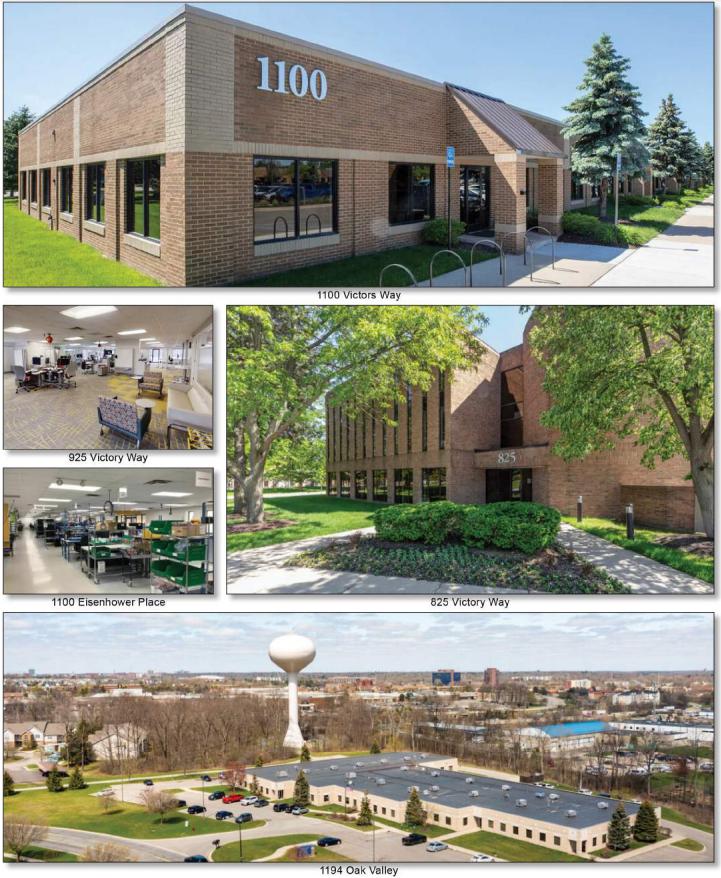
| THE INFORMATION IN THIS STRUCTURAL AND COLLATERAL TERM SHEET IS NOT COMPLETE AND MAY BE AMENDED PRIOR TO THE TIME OF SALE. THIS TERM SHEET IS NOT AN OFFER TO SELL THESE SECURITIES AND IT IS NOT A SOLICITATION OF AN OFFER TO BUY THESE SECURITIES IN ANY JURISDICTION WHERE THE OFFER OR SALE IS NOT PERMITTED. | ||
| 136 | ||
| Various | Loan #11 | Cut-off Date Balance: | $30,000,000 | |
| Various | Blackbird Portfolio | Cut-off Date LTV: | 53.3% | |
| Ann Arbor, MI 48108 | U/W NCF DSCR: | 1.40x | ||
| U/W NOI Debt Yield: | 12.9% |
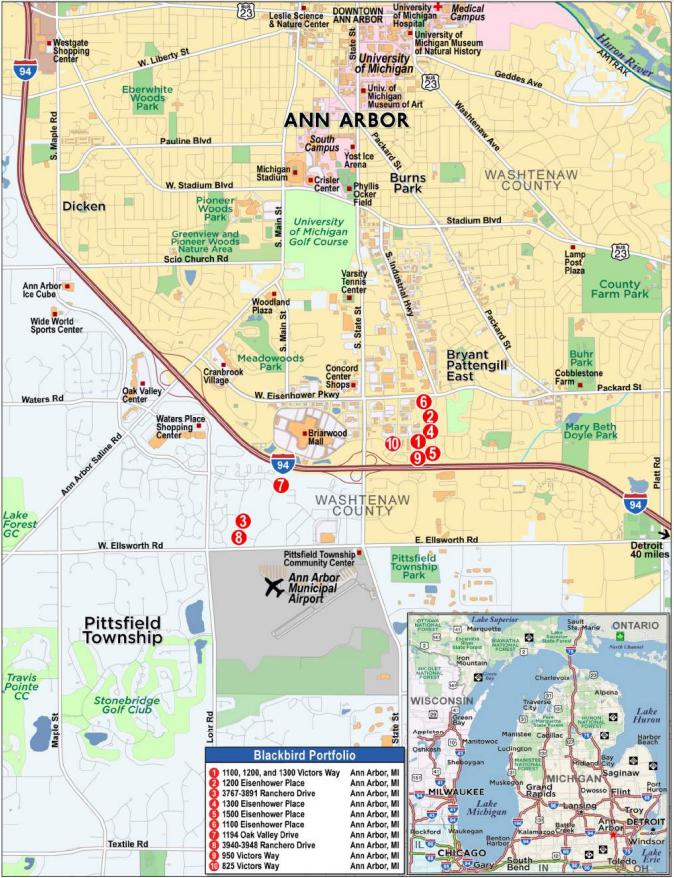
| THE INFORMATION IN THIS STRUCTURAL AND COLLATERAL TERM SHEET IS NOT COMPLETE AND MAY BE AMENDED PRIOR TO THE TIME OF SALE. THIS TERM SHEET IS NOT AN OFFER TO SELL THESE SECURITIES AND IT IS NOT A SOLICITATION OF AN OFFER TO BUY THESE SECURITIES IN ANY JURISDICTION WHERE THE OFFER OR SALE IS NOT PERMITTED. | ||
| 137 | ||
| No. 11 – Blackbird Portfolio |
| Mortgage Loan Information | Mortgaged Property Information | ||||||
| Mortgage Loan Seller: | Argentic Real Estate Finance 2 LLC | Single Asset/Portfolio: | Portfolio | ||||
Credit Assessment (Fitch/KBRA/Moody’s): | NR/NR/NR | Property Type – Subtype: | Various – Various | ||||
| Original Principal Balance(1): | $30,000,000 | Location: | Ann Arbor, MI | ||||
| Cut-off Date Balance(1): | $30,000,000 | Size: | 427,513 SF | ||||
| % of Initial Pool Balance: | 3.3% | Cut-off Date Balance Per SF(1): | $83.62 | ||||
| Loan Purpose: | Refinance | Maturity Date Balance Per SF(1): | $80.09 | ||||
| Borrower Sponsor: | Jeffrey L. Hauptman | Year Built/Renovated: | Various/Various | ||||
| Guarantor: | Jeffrey L. Hauptman | Title Vesting: | Fee | ||||
| Mortgage Rate: | 7.9200% | Property Manager: | Oxford Property Management, LLC | ||||
| Note Date: | November 21, 2023 | Current Occupancy (As of): | 83.4% (Various) | ||||
| Seasoning: | 0 months | YE 2022 Occupancy: | 96.3% | ||||
| Maturity Date: | December 6, 2033 | YE 2021 Occupancy: | 89.9% | ||||
| IO Period: | 60 months | YE 2020 Occupancy: | 85.8% | ||||
| Loan Term (Original): | 120 months | As-Is Appraised Value(4): | $67,060,000 | ||||
| Amortization Term (Original): | 360 months | As-Is Appraised Value Per SF: | $156.86 | ||||
| Loan Amortization Type: | Interest Only, Amortizing Balloon | As-Is Appraisal Valuation Date: | September 30, 2023 | ||||
| Call Protection(2): | L(24),D(92),O(4) | ||||||
| Lockbox Type: | Hard/Springing Cash Management | Underwriting and Financial Information | |||||
| Additional Debt(1): | Yes | TTM NOI (9/30/2023)(5): | $5,529,487 | ||||
| Additional Debt Type (Balance)(1): | Pari Passu ($5,750,000) | YE 2022 NOI(6): | $5,717,017 | ||||
| Mezzanine ($5,250,000) | YE 2021 NOI(6): | $4,439,220 | |||||
| YE 2020 NOI: | $4,564,176 | ||||||
| U/W Revenues: | $8,001,309 | ||||||
| U/W Expenses: | $3,378,501 | ||||||
| Escrows and Reserves(3) | U/W NOI(5): | $4,622,808 | |||||
| Initial | Monthly | Cap | U/W NCF: | $4,373,919 | |||
| Tax: | $694,641 | $138,928 | NAP | U/W DSCR based on NOI/NCF(1): | 1.48x / 1.40x | ||
| Insurance: | $86,855 | $9,651 | NAP | U/W Debt Yield based on NOI/NCF(1): | 12.9% / 12.2% | ||
| Replacement Reserve: | $0 | $7,125 | NAP | U/W Debt Yield at Maturity based on NOI/NCF(1): | 13.5% / 12.8% | ||
| TI/LC Reserve: | $2,000,000 | $57,002 | NAP | Cut-off Date LTV Ratio(1): | 53.3% | ||
| Deferred Maintenance: | $150,510 | $0 | NAP | LTV Ratio at Maturity(1): | 51.1% | ||
| Outstanding TI/LC Reserve: | $118,000 | $0 | NAP | ||||
| Sources and Uses | ||||||||
| Sources | Uses | |||||||
| Original Whole Loan Amount(1) | $35,750,000 | 87.0 | % | Loan Payoff | $36,443,847 | 88.7 | % | |
| Mezzanine Loan(7) | 5,250,000 | 12.8 | Upfront Reserves | 3,050,005 | 7.4 | |||
| Borrower Equity Contribution | 75,000 | 0.2 | Closing Costs | 1,581,147 | 3.8 | |||
| Total Sources | $41,075,000 | 100.0 | % | Total Uses | $41,075,000 | 100.0 | % | |
| (1) | The Blackbird Portfolio Mortgage Loan (as defined below) is part of the Blackbird Portfolio Whole Loan (as defined below) with an original aggregate principal balance of $35,750,000. The Cut-off Date Balance Per SF, Maturity Date Balance Per SF, U/W DSCR based on NOI/NCF, U/W Debt Yield based on NOI/NCF, U/W Debt Yield at Maturity based on NOI/NCF, Cut-off Date LTV Ratio and LTV Ratio at Maturity presented above are based on the Blackbird Portfolio Whole Loan. |
| (2) | At any time after the earlier of (i) November 21, 2026 and (ii) two years from the closing date of the securitization that includes the last pari passu note of the Blackbird Portfolio Whole Loan to be securitized, the borrower has the right to defease the Blackbird Portfolio Whole Loan in whole or in part, in connection with the release of any of the 10 properties comprising the Blackbird Portfolio Properties (as defined below). See “Partial Release” below for further information. |
| (3) | See “Escrows” below for further discussion of reserve requirements. |
| (4) | The As-Is Appraised Value represents the appraiser’s concluded portfolio value for the Blackbird Portfolio Properties. Based on cumulative individual property values, the As-Is Appraised Value is $65.42 million and results in a Cut-off Date LTV Ratio and LTV Ratio at Maturity of 54.6% and 52.3%, respectively. |
| (5) | The decrease in NOI from TTM 9/30/2023 and U/W NOI is primarily due to six tenants that leased approximately 12.3% of net rentable area that downsized or vacated their respective spaces in 2023. |
| (6) | The increase in NOI from 2021 to 2022 was primarily driven by additional income from five new tenants that comprised approximately 6.1% of net rentable area that signed leases in 2022. |
| (7) | A borrower sponsor affiliated entity which is 100.0% indirectly owned by the guarantor for the Blackbird Portfolio Whole Loan originated a $5,250,000 mezzanine loan at origination. |
| THE INFORMATION IN THIS STRUCTURAL AND COLLATERAL TERM SHEET IS NOT COMPLETE AND MAY BE AMENDED PRIOR TO THE TIME OF SALE. THIS TERM SHEET IS NOT AN OFFER TO SELL THESE SECURITIES AND IT IS NOT A SOLICITATION OF AN OFFER TO BUY THESE SECURITIES IN ANY JURISDICTION WHERE THE OFFER OR SALE IS NOT PERMITTED. | ||
| 138 | ||
| Various | Loan #11 | Cut-off Date Balance: | $30,000,000 | |
| Various | Blackbird Portfolio | Cut-off Date LTV: | 53.3% | |
| Ann Arbor, MI 48108 | U/W NCF DSCR: | 1.40x | ||
| U/W NOI Debt Yield: | 12.9% |
The Mortgage Loan. The eleventh largest mortgage loan (the “Blackbird Portfolio Mortgage Loan”) is part of a whole loan (the “Blackbird Portfolio Whole Loan”) secured by first priority fee interests in nine mixed-use buildings and one office building totaling 427,513 square feet, located in Ann Arbor, Michigan (the “Blackbird Portfolio Properties”). The Blackbird Portfolio Whole Loan has an original aggregate principal balance of $35,750,000 and is comprised of two pari passu notes. The Blackbird Portfolio Mortgage Loan, with an original principal balance of $30,000,000, is evidenced by the controlling Note A-1. The non-controlling Note A-2 in the original principal amount of $5,750,000 is currently held by Argentic Real Estate Finance 2 LLC (“AREF2”) and will be contributed to one or more future securitizations. See “Description of the Mortgage Pool—The Whole Loans—The Serviced Pari Passu Whole Loans” and “Pooling and Servicing Agreement” in the prospectus.
| Blackbird Portfolio Whole Loan Summary | ||||
| Note | Original Balance | Cut-off Date Balance | Note Holder | Controlling Note |
| A-1 | $30,000,000 | $30,000,000 | MSWF 2023-2 | Yes |
| A-2 | $5,750,000 | $5,750,000 | AREF2 | No |
| Total | $35,750,000 | $35,750,000 | ||
The Borrower and Borrower Sponsor. The borrower is Blackbird Ann Arbor LLC, a single-purpose, Delaware limited liability company with two independent directors. Legal counsel to the borrower delivered a non-consolidation opinion in connection with the origination of the Blackbird Portfolio Whole Loan.
The borrower sponsor and non-recourse carveout guarantor is Jeffrey L. Hauptman who is the founder and chief executive officer of Oxford Companies as well as serving as managing member to several investment partnerships. Founded in 1998, Oxford Companies is a full-service investment firm involved in the acquisition, construction, and management of commercial real estate properties. Jeffrey L. Hauptman’s and Oxford Companies’ portfolio included 14 separate real estate funds located in the Ann Arbor metropolitan statistical area. Oxford Companies has approximately 2.6 million commercial square feet under management totaling over $500 million.
The Properties. The Blackbird Portfolio Properties consist of nine mixed-use properties and one office property, all of which are located in the southern end of Ann Arbor, Michigan. The Blackbird Portfolio Properties were built between 1980 and 2000 and renovated between 2000 and 2022 and are located within an approximately three-mile radius of each other. Totaling 427,513 square feet, the Blackbird Portfolio Properties range from 23,723 square feet to 68,348 square feet. The Blackbird Portfolio Properties are comprised of nine properties that are mixed-use and feature office/industrial (“flex”) and laboratory space (“lab”) and one property (825 Victors Way; 30,956 square feet) that features more traditional office space. The Blackbird Portfolio Properties are currently 83.4% leased to 36 tenants. The occupancies for the Blackbird Portfolio Properties range from 45.8% to 100.0%. Furthermore, one of the 10 properties is fully leased to a single tenant while the remainder are currently leased to or can accommodate multiple tenants. The flex, lab, and traditional office space comprise 60.5%, 32.4% and 7.1% of the portfolio square footage, respectively. The flex, lab, and traditional office space comprise 50.8%, 39.1% and 10.0% of the underwritten base rent, respectively.
Certain of the Blackbird Portfolio Properties are part of (i) with respect to the 1100 Eisenhower Place Property, 1200 Eisenhower Place Property, 1300 Eisenhower Place Property and 1500 Eisenhower Place Property (each as defined below), a condominium of which the borrower owns four of the five units (the “Eisenhower Condominium”), and (ii) with respect to the 1194 Oak Valley Drive Property, 3767-3891 Ranchero Drive Property and 3940-3948 Ranchero Drive Property (each as defined below), a condominium of which the borrower owns 6 of the 27 units (the “Valley Ranch Condominium”). With respect to the Eisenhower Condominium, the borrower owns an 80% undivided interest in the common elements of such condominium; and with respect to the Valley Ranch Condominium, the borrower owns a 23.3% undivided interest in the common elements of such condominium and holds the voting rights for one additional unit that it does not own, resulting in the borrower holding 28.09% of the total voting rights of the Valley Ranch Condominium. See “Description of the Mortgage Pool—Mortgage Pool Characteristics—Condominium and Other Shared Interests” in the prospectus.
1100, 1200, and 1300 Victors Way
The 1100, 1200, and 1300 Victors Way property is a 68,348 square-foot, mixed-use (flex/lab) property (the “1100, 1200, and 1300 Victors Way Property”). Situated on a 5.720-acre site, the 1100, 1200, and 1300 Victors Way Property consists of three standalone single-story buildings built in 1999 and renovated in 2022. The three buildings comprising the 1100, 1200, and 1300 Victors Way Property contain 30,691 square feet, 21,187 square feet and 16,470 square feet, respectively. The 1100, 1200, and 1300 Victors Way Property is comprised of 58.7% flex space and 41.3% lab space. The 1100, 1200, and 1300 Victors Way Property is served by 280 open parking spaces at a parking ratio of 4.10 spaces per 1,000 square feet of net rentable area. As of October 31, 2023, the 1100, 1200, and 1300 Victors Way Property was 100% occupied by seven tenants. The largest tenant is NeuMoDx Molecular, Inc., which occupies 41.3% of the space under a lease that expires in July 2025 and primarily utilizes the space as lab space.
1200 Eisenhower Place
The 1200 Eisenhower Place property is a 48,368 square-foot, mixed-use (flex/lab) property (the “1200 Eisenhower Place Property”). Situated on a 5.460 acres site, the 1200 Eisenhower Place Property comprise a single-story building built in 1985, renovated in 2007. The 1200 Eisenhower Place Property is comprised of 85.8% lab space and 14.3% flex space. The 1200 Eisenhower Place Property is served by 122 open parking spaces at a parking ratio of 2.52 spaces per 1,000 square feet of net rentable area. As of December 1, 2023, the 1200 Eisenhower Place Property was 85.8% occupied by one tenant. The sole tenant is NeuMoDx Molecular, Inc. which has a lease that expires in July 2025 and primarily utilizes the space as lab space.
| THE INFORMATION IN THIS STRUCTURAL AND COLLATERAL TERM SHEET IS NOT COMPLETE AND MAY BE AMENDED PRIOR TO THE TIME OF SALE. THIS TERM SHEET IS NOT AN OFFER TO SELL THESE SECURITIES AND IT IS NOT A SOLICITATION OF AN OFFER TO BUY THESE SECURITIES IN ANY JURISDICTION WHERE THE OFFER OR SALE IS NOT PERMITTED. | ||
| 139 | ||
| Various | Loan #11 | Cut-off Date Balance: | $30,000,000 | |
| Various | Blackbird Portfolio | Cut-off Date LTV: | 53.3% | |
| Ann Arbor, MI 48108 | U/W NCF DSCR: | 1.40x | ||
| U/W NOI Debt Yield: | 12.9% |
3767-3891 Ranchero Drive
The 3767-3891 Ranchero Drive property is a 59,335 square foot, mixed-use (flex) property (the “3767-3891 Ranchero Drive Property”). Situated on a 6.834 acres site, the 3767-3891 Ranchero Drive Property comprise two single-story buildings constructed in 2000 and renovated in 2014. The 3767-3891 Ranchero Drive Property features 100.0% flex space. The 3767-3891 Ranchero Drive Property is served by 145 open parking spaces at a parking ratio of 2.44 spaces per 1,000 square feet of net rentable area. As of October 31, 2023, the 3767-3891 Ranchero Drive Property was 45.8% occupied by five tenants. The largest tenant is Esperion Therapeutics, Inc. which occupies 19.3% of the space under a lease that expires in October 2028.
1300 Eisenhower Place
The 1300 Eisenhower Place property is a 42,691 square foot, mixed-use (flex/lab) property (the “1300 Eisenhower Place Property”). Situated on a 5.460 acres site, the 1300 Eisenhower Place Property comprise a single-story building built in 1985 and renovated in 2007. The 1300 Eisenhower Place Property features 81.4% flex space and 18.6% lab space. The 1300 Eisenhower Place Property is served by 174 open parking spaces at a parking ratio of 4.08 spaces per 1,000 square feet of net rentable area. As of October 31, 2023, the 1300 Eisenhower Place Property was 100% occupied by six tenants. The largest tenant is Igadea, LLC which occupies 25.6% of the space under a lease that expires in April 2025.
1500 Eisenhower Place
The 1500 Eisenhower Place property is a 42,874 square foot, mixed-use (flex) property (the “1500 Eisenhower Place Property”). Situated on a 4.920 acres site, the 1500 Eisenhower Place Property comprise a single-story building constructed in 1987 and renovated in 2006. The 1500 Eisenhower Place Property features 100.0% flex space. The 1500 Eisenhower Place Property is served by 156 open parking spaces at a parking ratio of 3.64 spaces per 1,000 square feet of net rentable area. As of October 31, 2023, the 1500 Eisenhower Place Property was 89.3% occupied by four tenants. The largest tenant is Hearst Communications, Inc. which occupies 41.6% of the space and recently renewed its lease expiration to December 2028.
1100 Eisenhower Place
The 1100 Eisenhower Place property is a 39,450 square foot, mixed-use (flex/lab) property (the “1100 Eisenhower Place Property”). Situated on a 5.460 acres site, the 1100 Eisenhower Place Property comprise a single-story building built in 1985 and renovated in 2007. The 1100 Eisenhower Place Property is 100.0% lab space. The 1100 Eisenhower Place Property is served by 135 open parking spaces at a parking ratio of 3.42 spaces per 1,000 square feet of net rentable area. As of December 1, 2023, the 1100 Eisenhower Place Property is currently 100% occupied by a single tenant. The sole tenant is NeuMoDx Molecular, Inc. which has a lease that expires in July 2025 and primarily utilizes the premises as lab space.
1194 Oak Valley Drive
The 1194 Oak Valley Drive property is a 42,296 square foot, mixed-use (flex/lab) property (the “1194 Oak Valley Drive Property”). Situated on a 4.350 acres site, the 1194 Oak Valley Drive Property comprise a single-story building built in 1998 and renovated in 2000. The 1194 Oak Valley Drive Property features 50.6% lab space and 49.4% flex space. The 1194 Oak Valley Drive Property is served by 147 open parking spaces at a parking ratio of 3.48 spaces per 1,000 square feet of net rentable area. As of October 31, 2023, the 1194 Oak Valley Drive Property was 100% occupied by four tenants. The largest tenant is GFG Instrumentation, Inc. which occupies 39.3% of the space under a lease that expires in February 2026.
3940-3948 Ranchero Drive
The 3940-3948 Ranchero Drive property is a 29,472 square foot, mixed-use (flex) property (the “3940-3948 Ranchero Drive Property”). Situated on a 3.35 acres site, the 3940-3948 Ranchero Drive Property comprise two single-story buildings constructed in 2000. The 3940-3948 Ranchero Drive Property features 100.0% flex space. The 3940-3948 Ranchero Drive Property is served by 128 open parking spaces at a parking ratio of 4.34 spaces per 1,000 square feet of net rentable area. As of October 31, 2023, the 3940-3948 Ranchero Drive Property was 50.1% occupied by three tenants. The largest tenant is 2BeSuccessful LLC which occupies 30.3% of the space under a lease that expires in January 2029.
950 Victors Way
The 950 Victors Way property is a 23,723 square foot, mixed-use (flex) property (the “950 Victors Way Property”). Situated on a 3.90 acres site, the 950 Victors Way Property comprises a single-story building built in 1997 and renovated in 2006. The 950 Victors Way Property features 100.0% flex space. The 950 Victors Way Property is served by 86 open parking spaces at a parking ratio of 3.63 spaces per 1,000 square feet of net rentable area. As of October 31, 2023, the 950 Victors Way Property was 69.0% occupied by three tenants. The largest tenant is Planned Parenthood Mid and South Michigan which occupies 43.4% of the space under a lease that expires in June 2033.
825 Victors Way
The 825 Victors Way property is a 30,956 square foot suburban office property (the “825 Victors Way Property”). Situated on a 2.490 acres site, the 825 Victors Way Property comprises a three-story building built in 1980 and renovated in 2019. The 825 Victors Way Property features 100.0% office space. The 825 Victors Way Property comprised of an elevator, served by 160 open parking spaces at a parking ratio of 5.17 spaces per 1,000 square feet of net rentable area. As of October 31, 2023, the 825 Victors Way Property was
| THE INFORMATION IN THIS STRUCTURAL AND COLLATERAL TERM SHEET IS NOT COMPLETE AND MAY BE AMENDED PRIOR TO THE TIME OF SALE. THIS TERM SHEET IS NOT AN OFFER TO SELL THESE SECURITIES AND IT IS NOT A SOLICITATION OF AN OFFER TO BUY THESE SECURITIES IN ANY JURISDICTION WHERE THE OFFER OR SALE IS NOT PERMITTED. | ||
| 140 | ||
| Various | Loan #11 | Cut-off Date Balance: | $30,000,000 | |
| Various | Blackbird Portfolio | Cut-off Date LTV: | 53.3% | |
| Ann Arbor, MI 48108 | U/W NCF DSCR: | 1.40x | ||
| U/W NOI Debt Yield: | 12.9% |
83.0% occupied by four tenants. The largest tenant is Online Tech, LLC which occupies 36.0% of the space under a lease that expires in June 2029.
The following tables presents certain information relating to the Blackbird Portfolio Properties:
| Blackbird Portfolio Property Summary(1) | |||||||
| Property Name / Location | City, State | Net Rentable Area (SF)(1) | Allocated Whole Loan Cut-off Date Balance | % of Portfolio Cut-off Date Balance | As-Is Appraised Value(2) | U/W NOI | % of U/W NOI |
| 1100, 1200, and 1300 Victors Way | Ann Arbor, MI | 68,348 | $5,981,113 | 16.7% | $11,010,000 | $996,391 | 21.6% |
| 1200 Eisenhower Place | Ann Arbor, MI | 48,368 | $4,707,256 | 13.2% | $8,610,000 | $612,001 | 13.2% |
| 3767-3891 Ranchero Drive | Ann Arbor, MI | 59,335 | $4,379,225 | 12.2% | $8,010,000 | $131,633 | 2.8% |
| 1300 Eisenhower Place | Ann Arbor, MI | 42,691 | $3,870,775 | 10.8% | $7,080,000 | $625,305 | 13.5% |
| 1500 Eisenhower Place | Ann Arbor, MI | 42,874 | $3,827,038 | 10.7% | $7,000,000 | $538,408 | 11.6% |
| 1100 Eisenhower Place | Ann Arbor, MI | 39,450 | $3,608,350 | 10.1% | $6,780,000 | $554,470 | 12.0% |
| 1194 Oak Valley Drive | Ann Arbor, MI | 42,296 | $3,427,932 | 9.6% | $6,270,000 | $625,034 | 13.5% |
| 3940-3948 Ranchero Drive | Ann Arbor, MI | 29,472 | $2,411,034 | 6.7% | $4,160,000 | $107,486 | 2.3% |
| 950 Victors Way | Ann Arbor, MI | 23,723 | $1,771,372 | 5.0% | $3,270,000 | $136,404 | 3.0% |
| 825 Victors Way | Ann Arbor, MI | 30,956 | $1,765,905 | 4.9% | $3,230,000 | $295,676 | 6.4% |
| Total/Weighted Average | 427,513 | $35,750,000 | 100.0% | $67,060,000 | $4,622,808 | 100.0% | |
| (1) | Information obtained from the underwritten rent rolls from various dates unless otherwise noted. |
| (2) | Information obtained from the appraisals. |
| Blackbird Portfolio Property Summary(1) | |||||||
| Property Name | Property Type | Property Subtype | Year Built/ Renovated | Net Rentable Area (SF)(1) | Occupancy | Number of Tenants | Number of Buildings |
| 1100, 1200, and 1300 Victors Way | Mixed Use | Office/Industrial/Lab | 1999 / 2022 | 68,348 | 100.0% | 7 | 3 |
| 1200 Eisenhower Place | Mixed Use | Office/Industrial/Lab | 1985 / 2007 | 48,368 | 85.8% | 1(2) | 1 |
| 3767-3891 Ranchero Drive | Mixed Use | Office/Industrial | 2000 / 2014 | 59,335 | 45.8% | 5 | 2 |
| 1300 Eisenhower Place | Mixed Use | Office/Industrial/Lab | 1985 / 2007 | 42,691 | 100.0% | 6 | 1 |
| 1500 Eisenhower Place | Mixed Use | Office/Industrial | 1987 / 2006 | 42,874 | 89.3% | 4 | 1 |
| 1100 Eisenhower Place | Mixed Use | Office/Industrial/Lab | 1985 / 2007 | 39,450 | 100.0% | 1 | 1 |
| 1194 Oak Valley Drive | Mixed Use | Office/Industrial/Lab | 1998 / 2000 | 42,296 | 100.0% | 4 | 1 |
| 3940-3948 Ranchero Drive | Mixed Use | Office/Industrial | 2000 / NAP | 29,472 | 50.1% | 3 | 2 |
| 950 Victors Way | Mixed Use | Office/Industrial | 1997 / 2006 | 23,723 | 69.0% | 3 | 1 |
| 825 Victors Way | Office | Suburban | 1980 / 2019 | 30,956 | 83.0% | 4 | 1 |
| 427,513 | 83.4% | ||||||
| (1) | Source: Appraisals. |
| (2) | As of December 1, 2023, the 1200 Eisenhower Place Property was 85.8% leased to one tenant and has one suite vacant. |
Major Tenants.
NeuMoDx Molecular Inc. (109,171 square feet; 25.5% of net portfolio rentable area; 29.5% of portfolio underwritten base rent): NeuMoDx Molecular Inc. (“NeuMoDx”) designs and develops molecular diagnostic solutions for hospital and clinical reference laboratories. NeuMoDx’s technology aims to streamline and simplify the process of molecular testing, enabling clinical laboratories to achieve faster and more accurate results. The company has an intellectual property portfolio that includes greater than 20 U.S. patents, along with corresponding foreign patents and applications. NeuMoDx was recently acquired by Qiagen which is based in the Netherlands. NeuMoDx leases space at the 1100 Eisenhower Place Property, the 1100, 1200, 1300 Victors Way Property and the 1200 Eisenhower Place Property, has been in occupancy since October 2012 and has expanded multiple times, most recently by
| THE INFORMATION IN THIS STRUCTURAL AND COLLATERAL TERM SHEET IS NOT COMPLETE AND MAY BE AMENDED PRIOR TO THE TIME OF SALE. THIS TERM SHEET IS NOT AN OFFER TO SELL THESE SECURITIES AND IT IS NOT A SOLICITATION OF AN OFFER TO BUY THESE SECURITIES IN ANY JURISDICTION WHERE THE OFFER OR SALE IS NOT PERMITTED. | ||
| 141 | ||
| Various | Loan #11 | Cut-off Date Balance: | $30,000,000 | |
| Various | Blackbird Portfolio | Cut-off Date LTV: | 53.3% | |
| Ann Arbor, MI 48108 | U/W NCF DSCR: | 1.40x | ||
| U/W NOI Debt Yield: | 12.9% |
approximately 8,400 square feet in January 2022. NeuMoDx has invested approximately $6.3 million ($58 per square foot) of its own capital to build out and upgrade its premises over the years. NeuMoDx has a lease expiration in July 2025 and has two, five-year renewal options remaining. NeuMoDx and the borrower sponsor are negotiating a letter of intent to renew the lease until 2030.
Hearst Communications, Inc. (17,841 square feet; 4.2% of net portfolio rentable area; 4.8% of portfolio underwritten base rent): Hearst Communications, Inc. is a global, diversified, information, services, and media company. The company was founded in 1887 in San Francisco and owns newspapers, magazines, television channels, and television stations, including the San Francisco Chronicle, the Houston Chronicle, Cosmopolitan and Esquire. It owns 50% of the A&E Networks cable network group and 20% of the sports cable network group ESPN, both in partnership with The Walt Disney Company. The conglomerate also owns several business-information companies, including Fitch Ratings and First Databank. Hearst Communications, Inc. has been in occupancy at the 1500 Eisenhower Place Property since May 2008 and has extended its lease term multiple times including a five-year renewal signed in November 2023 to its current lease expiration in December 2028. The tenant has no renewal options remaining.
GFG Instrumentation, Inc. (16,630 square feet, 3.9% of net portfolio rentable area; 5.9% of portfolio underwritten base rent):
GFG Instrumentation, Inc. is a manufacturer of portable and fixed gas detectors and systems. The company has over six decades of experience across several industrials, including automotive, mining, boiler rooms, distilleries, breweries, fire departments, refrigeration, sewer construction, and underground parking. GFG Instrumentation, Inc. has offices in Germany, Poland, the United States, the United Kingdom, South Africa, France, Switzerland, etc. GFG Instrumentation, Inc. has been in occupancy at the 1194 Oak Valley Drive Property since May 1999 and has extended its lease term five times. The tenant currently pays $19.96 per square foot annually and has no renewal options remaining.
The following table presents certain information relating to the tenancy at the Blackbird Portfolio Properties:
Major Tenants
| Tenant Name | Credit Rating (Fitch/ Moody’s/ | Tenant NRSF | % of NRSF | Annual U/W Base Rent PSF(2) | Annual U/W Base Rent(2) | % of Total Annual U/W Base Rent | Lease Expiration Date | Ext. Options | Term. Option (Y/N) |
| Major Tenants | |||||||||
| NeuMoDx Molecular, Inc. | NR/NR/NR | 109,171 | 25.5% | $15.26 | $1,666,322 | 29.5% | 7/31/2025 | 2, 5-year | N |
| Hearst Communications, Inc. | NR/NR/NR | 17,841 | 4.2% | $15.25 | $272,075 | 4.8% | 12/31/2028 | None | N |
| GFG Instrumentation, Inc | NR/NR/NR | 16,630 | 3.9% | $19.96 | $331,957 | 5.9% | 2/28/2026 | None | N |
| U.S. Medical Management, LLC | NR/NR/NR | 11,943 | 2.8% | $15.48 | $184,827 | 3.3% | 9/30/2025 | 1, 5-year | N |
| Esperion Therapeutics, Inc. | NR/NR/NR | 11,471 | 2.7% | $13.41 | $153,828 | 2.7% | 10/31/2028 | None | N |
| Online Tech, LLC | NR/NR/NR | 11,143 | 2.6% | $21.00 | $234,000 | 4.1% | 6/30/2029 | None | N |
| Igadea, LLC | NR/NR/NR | 10,931 | 2.6% | $12.00 | $131,172 | 2.3% | 4/30/2025 | None | N |
| Society for College and University Planning | NR/NR/NR | 10,900 | 2.5% | $15.50 | $168,948 | 3.0% | 11/30/2026 | None | N |
| Planned Parenthood Mid and South Michigan | NR/NR/NR | 10,300 | 2.4% | $12.65 | $130,284 | 2.3% | 6/30/2033 | None | N |
| ParishSOFT, LLC | NR/NR/NR | 9,799 | 2.3% | $12.50 | $122,487 | 2.2% | 9/30/2024 | 1, 3-year | N |
| 220,129 | 51.5% | $15.43 | $3,395,901 | 60.2% | |||||
| Non-Major Tenants | 136,420 | 31.9% | $16.48 | $2,248,019 | 39.8% | ||||
| Occupied Collateral Total | 356,549 | 83.4% | $15.83 | $5,643,920 | 100.0% | ||||
| Vacant Space | 70,964 | 16.6% | |||||||
| Collateral Total | 427,513 | 100.0% | |||||||
| (1) | Certain ratings are those of the parent company whether or not the parent company guarantees the lease |
| (2) | The Annual U/W Base Rent and Annual U/W Base Rent PSF represent rent steps through September 2024. |
| THE INFORMATION IN THIS STRUCTURAL AND COLLATERAL TERM SHEET IS NOT COMPLETE AND MAY BE AMENDED PRIOR TO THE TIME OF SALE. THIS TERM SHEET IS NOT AN OFFER TO SELL THESE SECURITIES AND IT IS NOT A SOLICITATION OF AN OFFER TO BUY THESE SECURITIES IN ANY JURISDICTION WHERE THE OFFER OR SALE IS NOT PERMITTED. | ||
| 142 | ||
| Various | Loan #11 | Cut-off Date Balance: | $30,000,000 | |
| Various | Blackbird Portfolio | Cut-off Date LTV: | 53.3% | |
| Ann Arbor, MI 48108 | U/W NCF DSCR: | 1.40x | ||
| U/W NOI Debt Yield: | 12.9% |
The following table presents certain information relating to the lease rollover schedule at the Blackbird Portfolio Properties:
Lease Expiration Schedule(1)
| Year Ending December 31, | No. of Leases Expiring | Expiring NRSF | % of Total NRSF | Cumulative Expiring NRSF | Cumulative % of Total NRSF | Annual U/W Base Rent(2) | % of Total Annual U/W Base Rent | Annual U/W Base Rent PSF(2) | |
| MTM | 0 | 0 | 0.0% | 0 | 0.0% | $0 | 0.0% | $0.00 | |
| 2023 | 0 | 0 | 0.0% | 0 | 0.0% | $0 | 0.0% | $0.00 | |
| 2024 | 3 | 16,033 | 3.8% | 16,033 | 3.8% | $229,138 | 4.1% | $14.29 | |
| 2025 | 12 | 190,898 | 44.7% | 206,931 | 48.4% | $2,923,853 | 51.8% | $15.32 | |
| 2026 | 7 | 39,106 | 9.1% | 246,037 | 57.6% | $673,100 | 11.9% | $17.21 | |
| 2027 | 5 | 23,348 | 5.5% | 269,385 | 63.0% | $374,101 | 6.6% | $16.02 | |
| 2028 | 3 | 34,124 | 8.0% | 303,509 | 71.0% | $491,603 | 8.7% | $14.41 | |
| 2029 | 3 | 28,272 | 6.6% | 331,781 | 77.6% | $495,860 | 8.8% | $17.54 | |
| 2030 | 2 | 14,468 | 3.4% | 346,249 | 81.0% | $325,980 | 5.8% | $22.53 | |
| 2031 | 0 | 0 | 0.0% | 346,249 | 81.0% | $0 | 0.0% | $0.00 | |
| 2032 | 0 | 0 | 0.0% | 346,249 | 81.0% | $0 | 0.0% | $0.00 | |
| 2033 & Beyond | 1 | 10,300 | 2.4% | 356,549 | 83.4% | $130,284 | 2.3% | $12.65 | |
| Vacant | 0 | 70,964 | 16.6% | 427,513 | 100.0% | $0 | 0.0% | $0.00 | |
| Total/Weighted Average | 36 | 427,513 | 100.0% | $5,643,920 | 100.0% | $15.83 | |||
| (1) | Information obtained from the underwritten rent rolls from various dates. |
| (2) | Annual U/W Base Rent and Annual U/W Base Rent PSF do not include vacant space. |
The following table presents historical occupancy percentages at the Blackbird Portfolio Properties:
Historical Occupancy
12/31/2020(1) | 12/31/2021(1) | 12/31/2022(1) | Various(2)(3) |
| 85.8% | 89.9% | 96.3% | 83.4% |
| (1) | Information obtained from the borrower. |
| (2) | Information obtained from the underwritten rent rolls from various dates. |
| (2) | Current occupancy is as of December 1, 2023 for the 1200 Eisenhower Place Property and 1100 Eisenhower Place Property and as of October 31, 2023 for the remaining Blackbird Portfolio Properties. |
| THE INFORMATION IN THIS STRUCTURAL AND COLLATERAL TERM SHEET IS NOT COMPLETE AND MAY BE AMENDED PRIOR TO THE TIME OF SALE. THIS TERM SHEET IS NOT AN OFFER TO SELL THESE SECURITIES AND IT IS NOT A SOLICITATION OF AN OFFER TO BUY THESE SECURITIES IN ANY JURISDICTION WHERE THE OFFER OR SALE IS NOT PERMITTED. | ||
| 143 | ||
| Various | Loan #11 | Cut-off Date Balance: | $30,000,000 | |
| Various | Blackbird Portfolio | Cut-off Date LTV: | 53.3% | |
| Ann Arbor, MI 48108 | U/W NCF DSCR: | 1.40x | ||
| U/W NOI Debt Yield: | 12.9% |
Operating History and Underwritten Net Cash Flow. The following table presents certain information relating to the historical operating performance and underwritten net cash flow at the Blackbird Portfolio Properties:
Cash Flow Analysis
| 2020 | 2021 | 2022 | TTM 9/30/2023 | U/W | %(1) | U/W $ per SF | |
| Base Rent(2) | $5,154,908 | $5,770,288 | $6,447,339 | $6,278,904 | $5,643,920 | 59.0% | $13.20 |
| Grossed Up Vacant Space | 0 | 0 | 0 | 0 | 1,571,656 | 16.4 | 3.68 |
| Gross Potential Rent | $5,154,908 | $5,770,288 | $6,447,339 | $6,278,904 | $7,215,576 | 75.4% | $16.88 |
| Other Income(3) | 125,070 | 16,133 | 11,228 | 8,387 | 8,387 | 0.1 | 0.02 |
| Total Recoveries | 2,319,825 | 2,350,656 | 2,772,757 | 2,695,470 | 2,349,002 | 24.5 | 5.49 |
| Net Rental Income | $7,599,803 | $8,137,077 | $9,231,324 | $8,982,761 | $9,572,965 | 100.0% | $22.39 |
| (Vacancy, Abatements & Credit Loss) | (19,301) | (326,010) | (84,613) | 0 | (1,571,656) | (21.8) | (3.68) |
| Effective Gross Income | $7,580,502 | $7,811,067 | $9,146,710 | $8,982,761 | $8,001,309 | 83.6% | $18.72 |
| Real Estate Taxes | $1,479,171 | $1,525,992 | $1,569,633 | $1,646,658 | $1,621,280 | 20.3% | $3.79 |
| Insurance | 54,898 | 56,549 | 54,115 | 55,378 | 115,806 | 1.4 | 0.27 |
| Management Fee | 280,604 | 270,391 | 318,935 | 349,862 | 240,039 | 3.0 | 0.56 |
| Other Operating Expenses | 1,201,653 | 1,518,915 | 1,487,009 | 1,401,376 | 1,401,376 | 17.5 | 3.28 |
| Total Operating Expenses | $3,016,326 | $3,371,847 | $3,429,693 | $3,453,274 | $3,378,501 | 42.2% | $7.90 |
| Net Operating Income(4) | $4,564,176 | $4,439,220 | $5,717,017 | $5,529,487 | $4,622,808 | 57.8% | $10.81 |
| Replacement Reserves | 0 | 0 | 0 | 0 | 85,503 | 1.1 | 0.20 |
| TI/LC | 0 | 0 | 0 | 0 | 163,386(5) | 2.0 | 0.38 |
| Net Cash Flow | $4,564,176 | $4,439,220 | $5,717,017 | $5,529,487 | $4,373,919 | 54.7% | $10.23 |
| NOI DSCR(6) | 1.46x | 1.42x | 1.83x | 1.77x | 1.48x | ||
| NCF DSCR(6) | 1.46x | 1.42x | 1.83x | 1.77x | 1.40x | ||
| NOI Debt Yield(6) | 12.8% | 12.4% | 16.0% | 15.5% | 12.9% | ||
| NCF Debt Yield(6) | 12.8% | 12.4% | 16.0% | 15.5% | 12.2% |
| (1) | Represents (i) percent of Net Rental Income for all revenue fields, (ii) percent of Gross Potential Rent for Vacancy, Abatements & Credit Loss and (iii) percent of Effective Gross Income for all other fields. |
| (2) | U/W Base Rent represents rent steps through September 2024. |
| (3) | Other Income includes late fees and other miscellaneous tenant charges. |
| (4) | The increase in Net Operating Income from 2021 to 2022 was primarily driven by additional income from five new tenants that comprised approximately 6.1% of net rentable area that signed leases in 2022. The decrease in Net Operating Income from TTM 9/30/2023 and U/W NOI is primarily due to six tenants that leased approximately 12.3% of net rentable area that downsized or vacated their respective spaces in 2023. |
| (5) | Includes a $200,000 credit for the upfront TI/LC reserve of $2,000,000. |
| (6) | Debt service coverage ratios and debt yields are based on the Blackbird Portfolio Whole Loan. |
Appraisals. The appraisals concluded to an “as-is” appraised portfolio value for the Blackbird Portfolio Properties of $67,060,000 as of September 30, 2023. The appraisals also provided cumulative individual property values of $65,420,000 as of September 30, 2023.
Environmental Matters. According to the Phase I environmental site assessments for the Blackbird Portfolio Properties, with dates ranging from July 24, 2023 to July 26, 2023, there was no evidence of any recognized environmental conditions at any of the properties. For the 825 Victors Way Property, 1100 Eisenhower Place Property, 1200 Eisenhower Place Property, 1300 Eisenhower Place Property, and 1500 Eisenhower Place Property, the implementation of an asbestos operations and maintenance plan was recommended.
Market Overview and Competition. The Blackbird Portfolio Properties are all located in the southern end of Ann Arbor, Michigan and form part of the Ann Arbor metro area. The Blackbird Portfolio Properties are located within approximately 3 miles from each other in the Ann Arbor metro area. The neighborhood represents a commercial node anchored by the Briarwood Mall. Additionally, the neighborhood contains a concentration of office and research and development-oriented, industrial, flex uses, especially the portion of the neighborhood located south of Interstate 94. Primary access to the area is provided via Interstate 94, a major east / west interstate throughout the state of Michigan and beyond. Major thoroughfares in the vicinity include State Street (State Road to the south of Interstate 94), Eisenhower Parkway, and Ellsworth Road. Numerous smaller secondary streets serving the neighborhood include Victors Way, Oak Valley Drive, and Eisenhower Place. Detroit Metropolitan Airport, the area's large international airport, is approximately 25 miles east of the city. The commute to Detroit’s central business district is about 40 minutes and the drive to the Detroit Metropolitan Wayne County Airport is approximately 20 minutes. The Blackbird Portfolio Properties are located in the desirable Ann Arbor community, with a high percentage of college graduates. According to the appraisals, this factor, along with the prominent influence of the University of Michigan, continues to make the area a highly appealing destination for research and development and engineering oriented companies that rely on the highly educated workforce.
According to the appraisals, the estimated 2023 population within a one, three and five-mile radius of the 1100, 1200, 1300 Victors Way Property was approximately 6,817, 86,149, and 179,500, respectively and the estimated 2023 average household income within
| THE INFORMATION IN THIS STRUCTURAL AND COLLATERAL TERM SHEET IS NOT COMPLETE AND MAY BE AMENDED PRIOR TO THE TIME OF SALE. THIS TERM SHEET IS NOT AN OFFER TO SELL THESE SECURITIES AND IT IS NOT A SOLICITATION OF AN OFFER TO BUY THESE SECURITIES IN ANY JURISDICTION WHERE THE OFFER OR SALE IS NOT PERMITTED. | ||
| 144 | ||
| Various | Loan #11 | Cut-off Date Balance: | $30,000,000 | |
| Various | Blackbird Portfolio | Cut-off Date LTV: | 53.3% | |
| Ann Arbor, MI 48108 | U/W NCF DSCR: | 1.40x | ||
| U/W NOI Debt Yield: | 12.9% |
the same radii was approximately $97,131, $122,669, and $120,900, respectively. Given the proximity of each property, this is representative of each of the Blackbird Portfolio Properties.
According to the appraisals, the Blackbird Portfolio Properties are situated within the Washtenaw West of 23 submarket. As of the second quarter of 2023, the competitive office and flex market segment had an inventory of 4.84 million square feet, an occupancy rate of 87.5% and asking gross rent per square foot of $21.09. The appraiser concluded to market rents of $14.50 per square foot for flex space and $15.50 per square foot for lab space for the Blackbird Portfolio Properties.
The following table presents certain information relating to the appraiser’s market rent conclusions for the Blackbird Portfolio Properties:
Market Rent Summary(1)
| Market Rent | Reimbursement Type | Term (Months) | |
| 1100, 1200, and 1300 Victors Way | $14.50-$15.50 | NNN | 60 |
| 1200 Eisenhower Place | $14.50-$15.50 | NNN | 60 |
| 3767-3891 Ranchero Drive | $14.50 | NNN | 60 |
| 1300 Eisenhower Place | $14.50-$15.50 | NNN | 60 |
| 1500 Eisenhower Place | $14.50 | NNN | 84 |
| 1100 Eisenhower Place | $15.50 | NNN | 84 |
| 1194 Oak Valley Drive | $14.50-$15.50 | NNN | 60 |
| 3940-3948 Ranchero Drive | $14.50 | NNN | 84 |
| 950 Victors Way | $14.50 | NNN | 84 |
| 825 Victors Way | $22.50 | Modified Gross | 60 |
| (1) | Information obtained from the appraisals. |
The table below presents certain information relating to comparable sales pertaining to the Blackbird Portfolio Properties identified by the appraisals.
Comparable Sales(1)
| Property Name | Location | Year Built/ Renovated | Rentable Area (SF) | Occupancy | Sale Date | Sale Price | Sale Price PSF | Cap Rate |
| Google 5690 Hines Drive | Ann Arbor, MI | 2000 / 2019 | 65,200 | 100% | Jun-22 | $11,050,000 | $169.48 | 5.3% |
| Two Property Portfolio 400 West Morgan Road and 4743 Venture Drive | Ann Arbor, MI | 1995 / NAP | 44,750 | 100% | Apr-22 | $6,150,000 | $145.25 | 8.0% |
| Park Place 52373 Oak Valley Drive | Ann Arbor, MI | 2018 / NAP | 60,706 | 100% | Oct-21 | $15,750,000 | $259.45 | 7.6% |
| Pharmacy Advantage 1191 East South Boulevard | Rochester Hills, MI | 2016 / 2023 | 31,277 | 100% | Sep-22 | $9,400,000 | $300.54 | 5.8% |
| Stadium Centre 1880-1898 West Stadium Boulevard | Ann Arbor, MI | 1984 / NAP | 20,517 | 100% | Feb-23 | $4,900,000 | $238.83 | 8.2% |
| (1) | Information obtained from the appraisals. |
| THE INFORMATION IN THIS STRUCTURAL AND COLLATERAL TERM SHEET IS NOT COMPLETE AND MAY BE AMENDED PRIOR TO THE TIME OF SALE. THIS TERM SHEET IS NOT AN OFFER TO SELL THESE SECURITIES AND IT IS NOT A SOLICITATION OF AN OFFER TO BUY THESE SECURITIES IN ANY JURISDICTION WHERE THE OFFER OR SALE IS NOT PERMITTED. | ||
| 145 | ||
| Various | Loan #11 | Cut-off Date Balance: | $30,000,000 | |
| Various | Blackbird Portfolio | Cut-off Date LTV: | 53.3% | |
| Ann Arbor, MI 48108 | U/W NCF DSCR: | 1.40x | ||
| U/W NOI Debt Yield: | 12.9% |
Escrows.
Taxes – The Blackbird Portfolio Whole Loan documents require an upfront deposit of $694,641 and ongoing monthly real estate tax reserves in an amount equal to 1/12th of the real estate taxes that the lender estimates will be payable during the next 12 months, initially estimated at $138,928 monthly.
Insurance – The Blackbird Portfolio Whole Loan documents require an upfront deposit of $86,855 and ongoing monthly insurance reserves in an amount equal to 1/12th of the annual estimated insurance payments, initially estimated at $9,651 monthly.
Replacement Reserve – The Blackbird Portfolio Whole Loan documents require an ongoing monthly replacement reserve deposit of $7,125.
TI/LC Reserve – The Blackbird Portfolio Whole Loan documents require an upfront deposit of $2,000,000 and an ongoing monthly TI/LC reserve deposit of $57,002; provided, however, upon the borrower’s satisfaction of certain conditions set forth under the Blackbird Portfolio Whole Loan documents with respect to the re-tenanting of the NeuMoDx space, the monthly TI/LC reserve deposit will be reduced to $30,282.
Deferred Maintenance – The Blackbird Portfolio Whole Loan documents require an upfront deposit of $150,510.
Outstanding TI/LC Reserve – The Blackbird Portfolio Whole Loan documents require an upfront deposit of $118,000, which represents the leasing commissions and tenant improvements payable by the borrower under existing leases at the Blackbird Portfolio Properties.
Lockbox and Cash Management. The Blackbird Portfolio Whole Loan is structured with a hard lockbox and springing cash management. The borrower is required to deliver tenant direction letters to tenants at the Blackbird Portfolio Properties, directing them to remit their rent directly to the lender-controlled lockbox. The borrower is required to cause revenue received by the borrower or the property manager from the Blackbird Portfolio Properties to be deposited into such lockbox within one business day. All funds deposited into the lockbox are required to be transferred on a daily basis to the borrower’s operating account unless a Cash Management Period (as defined below) exists. Upon the occurrence and during the continuance of a Cash Management Period, all funds in the lockbox account are required to be swept on a daily basis to a cash management account under the control of the lender to be applied and disbursed in accordance with the Blackbird Portfolio Whole Loan documents, and all excess cash flow funds remaining in the cash management account after the application of such funds in accordance with the Blackbird Portfolio Whole Loan documents are required to be held by the lender during the continuance of a Cash Management Period continuing solely as a result of a Lease Sweep Period (as defined below) in a special rollover reserve subaccount or otherwise, into the cash collateral subaccount as additional collateral for the Blackbird Portfolio Whole Loan. Upon an event of default under the Blackbird Portfolio Whole Loan documents, the lender will have the right to apply cash collateral subaccount funds to the debt in such priority as it may determine.
A “Cash Management Period” means a period which will commence upon any of the following: (i) the stated maturity date, (ii) an event of default, (iii) if, as of the last day any calendar quarter, the debt service coverage ratio is less than 1.20x (a “DSCR Cash Management Period”) or (iv) the commencement of a Lease Sweep Period; and will end if (1) the Blackbird Portfolio Whole Loan and all other obligations under the Blackbird Portfolio Whole Loan documents have been repaid in full or (2) the stated maturity date has not occurred and (A) with respect to the matters described in clause (ii) above, such event of default has been cured and no other event of default has occurred and is continuing or (B) with respect to the matter described in clause (iii) above, the lender has determined that the Blackbird Portfolio Properties have achieved a debt service coverage ratio of at least 1.25x as of the last day of any calendar quarter for two consecutive quarters or (C) with respect to the matter described in clause (iv) above, such Lease Sweep Period has ended.
A “Lease Sweep Period” commences upon the occurrence of any of the following: (i) the date that is 18 months prior to the end of the term of any Lease Sweep Lease (as defined below) (including any renewal terms); provided, however, at the borrower's option, exercisable at any point during the term of the Blackbird Portfolio Whole Loan, the foregoing 18-month period may, at the borrower's written request, be reduced to 15 months if and only if the lender has received a deposit of $375,000 into the special rollover reserve (the "Lease Sweep Deposit"); (ii) the date required under a Lease Sweep Lease by which the applicable Lease Sweep Tenant (as defined below) is required to give notice of its exercise of a renewal option thereunder (and such renewal has not been so exercised) or the date that any Lease Sweep Tenant gives notice of its intention not to renew or extend its Lease Sweep Lease; (iii) any Lease Sweep Lease is surrendered, cancelled or terminated prior to its then-current expiration date or any Lease Sweep Tenant gives notice of its intention to terminate, surrender or cancel its Lease Sweep Lease; (iv) any Lease Sweep Tenant has vacated or discontinued its business in any material portion of its premises (i.e., “goes dark”) or gives notice that it intends to do the same; (v) the occurrence and continuance (beyond any applicable notice and cure periods) of a default under any Lease Sweep Lease by the applicable Lease Sweep Tenant thereunder; or (vi) the occurrence of an insolvency or bankruptcy proceeding, among other things, by any tenant under a Lease Sweep Lease, its parent company or the lease guarantor under a Lease Sweep Lease, as described in the Blackbird Portfolio Whole Loan documents.
A “Lease Sweep Lease” means the NeuMoDx lease and any other lease (leased by such tenant and/or its affiliates) which covers 75,000 or more rentable square feet at the Blackbird Portfolio Properties.
A “Lease Sweep Tenant” means any tenant under a Lease Sweep Lease.
Property Management. The Blackbird Portfolio Properties are managed by Oxford Property Management, LLC, an affiliate of the borrower sponsor.
| THE INFORMATION IN THIS STRUCTURAL AND COLLATERAL TERM SHEET IS NOT COMPLETE AND MAY BE AMENDED PRIOR TO THE TIME OF SALE. THIS TERM SHEET IS NOT AN OFFER TO SELL THESE SECURITIES AND IT IS NOT A SOLICITATION OF AN OFFER TO BUY THESE SECURITIES IN ANY JURISDICTION WHERE THE OFFER OR SALE IS NOT PERMITTED. | ||
| 146 | ||
| Various | Loan #11 | Cut-off Date Balance: | $30,000,000 | |
| Various | Blackbird Portfolio | Cut-off Date LTV: | 53.3% | |
| Ann Arbor, MI 48108 | U/W NCF DSCR: | 1.40x | ||
| U/W NOI Debt Yield: | 12.9% |
Partial Release. From and after the prepayment lockout date, in connection with a bona fide sale to an unaffiliated third party, the borrower may obtain the release of any of the properties that make up the Blackbird Portfolio Properties, provided the following conditions, among others, are satisfied: (i) no event of default is continuing; (ii) defeasance of the greater of (a) 100% of the net proceeds of the sale, and (b) 125% of the allocated loan amount for such property; and (iii) after giving effect to such release and defeasance, (a) the debt yield for the remaining properties is no less than the greater of 11.66% and the debt yield immediately prior to the release, (b) the loan to value ratio for the remaining properties is not more than the lesser of 54.6% and the loan to value ratio immediately prior to the sale and (c) overall occupancy for the remaining properties is no less than the greater of 80% and the occupancy immediately preceding the sale.
Real Estate Substitution. Not permitted.
Subordinate and Mezzanine Indebtedness. Concurrently with the funding of the Blackbird Portfolio Whole Loan, Blackbird Mezz Lender, LLC, an affiliate of the borrower sponsor, originated a mezzanine loan in the amount of $5,250,000 (the “Blackbird Portfolio Mezzanine Loan”). The Blackbird Portfolio Mezzanine Loan is secured by the direct equity interests in the borrower and is coterminous with the Blackbird Portfolio Whole Loan. The Blackbird Portfolio Mezzanine Loan accrues interest at a rate of 12.00000% per annum. The intercreditor agreement provides that if the Blackbird Portfolio Mezzanine Loan is held by an owner who (i) owns more than 25% of the direct or indirect ownership interests in the borrower under the Blackbird Portfolio Whole Loan or Blackbird Portfolio Mezzanine Loan or any affiliate thereof or (ii) has the power, directly or indirectly, to direct the management or policies of the borrower under the Blackbird Portfolio Whole Loan or Blackbird Portfolio Mezzanine Loan, such owner will not be permitted to exercise certain rights of the mezzanine lender under the intercreditor agreement, including among other things, the mezzanine lender’s rights to (A) foreclose on the equity interests in the Blackbird Portfolio Whole Loan borrower, (B) enter into a modification of the Blackbird Portfolio Mezzanine Loan, (C) cure certain defaults under the Blackbird Portfolio Whole Loan, (D) terminate the property manager after an event of default under the Blackbird Portfolio Mezzanine Loan and select a replacement property manager, (E) purchase the Blackbird Portfolio Whole Loan upon the occurrence of certain events set forth in the Blackbird Portfolio Whole Loan documents, (F) require the mezzanine lender’s prior written consent upon a request by the Blackbird Portfolio Whole Loan borrower for the senior lender’s consent to either (x) the sale or transfer of all or any material portion of the Blackbird Portfolio Properties or any direct or indirect interest in the Blackbird Portfolio Whole Loan borrower, or (y) the granting of a further mortgage against the Blackbird Portfolio Properties or (G) approve the annual operating budget of the Blackbird Portfolio Whole Loan borrower.
Ground Lease. None.
Terrorism Insurance. The Blackbird Portfolio Whole Loan documents require that the “all risk” insurance policy required to be maintained by the borrower provides coverage for terrorism in an amount equal to the full replacement cost of the Blackbird Portfolio Properties, as well as business interruption insurance covering no less than the 18-month period following the occurrence of a casualty event, together with a six-month extended period of indemnity. See “Risk Factors—Risks Relating to the Mortgage Loans—Terrorism Insurance May Not Be Available for All Mortgaged Properties” in the prospectus.
| THE INFORMATION IN THIS STRUCTURAL AND COLLATERAL TERM SHEET IS NOT COMPLETE AND MAY BE AMENDED PRIOR TO THE TIME OF SALE. THIS TERM SHEET IS NOT AN OFFER TO SELL THESE SECURITIES AND IT IS NOT A SOLICITATION OF AN OFFER TO BUY THESE SECURITIES IN ANY JURISDICTION WHERE THE OFFER OR SALE IS NOT PERMITTED. | ||
| 147 | ||
| No. 12 – Centre Pointe Portfolio |
| Mortgage Loan Information | Mortgaged Property Information | ||||||
| Mortgage Loan Seller: | Argentic Real Estate Finance 2 LLC | Single Asset/Portfolio: | Single Asset | ||||
| Credit Assessment (Fitch/KBRA/Moody’s): | NR/NR/NR | Property Type – Subtype: | Office – Suburban | ||||
| Original Principal Balance(1): | $30,000,000 | Location: | West Chester, OH | ||||
| Cut-off Date Balance(1): | $30,000,000 | Size: | 640,177 SF | ||||
| % of Initial Pool Balance: | 3.3% | Cut-off Date Balance Per SF(1): | $74.43 | ||||
| Loan Purpose: | Acquisition | Maturity Date Balance Per SF(1): | $72.71 | ||||
| Borrower Sponsor: | Yaron Kandelker | Year Built/Renovated: | 2000-2007/NAP | ||||
| Guarantor: | Yaron Kandelker | Title Vesting: | Fee | ||||
| Mortgage Rate: | 7.0240% | Property Manager: | SVR Property Management LLC | ||||
| Note Date: | June 22, 2023 | Current Occupancy (As of): | 82.1% (5/31/2023) | ||||
| Seasoning: | 5 months | YE 2022 Occupancy: | 80.2% | ||||
| Maturity Date: | July 6, 2033 | YE 2021 Occupancy: | 80.4% | ||||
| IO Period: | 90 months | YE 2020 Occupancy: | 87.2% | ||||
| Loan Term (Original): | 120 months | YE 2019 Occupancy: | 86.3% | ||||
| Amortization Term (Original): | 360 months | As-Is Appraised Value: | $70,200,000 | ||||
| Loan Amortization Type: | Interest Only, Amortizing Balloon | As-Is Appraised Value Per SF: | $109.66 | ||||
| Call Protection: | L(29),D(87),O(4) | As-Is Appraisal Valuation Date: | April 17, 2023 | ||||
| Lockbox Type: | Hard/In Place Cash Management | Underwriting and Financial Information | |||||
| Additional Debt(1): | Yes | TTM NOI (3/31/2023)(4): | $5,081,872 | ||||
| Additional Debt Type (Balance)(1): | Pari Passu ($17,650,000) | YE 2022 NOI: | $4,576,618 | ||||
| Future Mezzanine(2) | YE 2021 NOI: | $5,718,797 | |||||
| YE 2020 NOI: | $6,572,323 | ||||||
| U/W Revenues: | $12,419,184 | ||||||
| U/W Expenses: | $5,610,831 | ||||||
| Escrows and Reserves | U/W NOI(4): | $6,808,354 | |||||
| Initial | Monthly | Cap | U/W NCF: | $5,399,965 | |||
| Taxes: | $148,910 | $148,910 | NAP | U/W DSCR based on NOI/NCF(1): | 1.79x / 1.42x | ||
| Insurance: | $33,333 | $8,333 | NAP | U/W Debt Yield based on NOI/NCF(1): | 14.3% / 11.3% | ||
| Deferred Maintenance: | $77,284 | $0 | NAP | U/W Debt Yield at Maturity based on NOI/NCF(1): | 14.6% / 11.6% | ||
| Replacement Reserve: | $0 | $10,670 | NAP | Cut-off Date LTV Ratio(1): | 67.9% | ||
| TI/LC Reserve: | $0 | $106,696 | $5,000,000 | LTV Ratio at Maturity(1): | 66.3% | ||
| Other Reserves(3): | $3,978,696 | $0 | NAP | ||||
| Sources and Uses | ||||||||
| Sources | Uses | |||||||
| Whole Loan Amount | $47,650,000 | 67.2 | % | Purchase Price | $64,500,000 | 90.9 | % | |
| Borrower Equity Contribution | 19,061,282 | 26.9 | Upfront Reserves | 4,238,223 | 6.0 | |||
| Seller’s Credits(5) | 4,226,999 | 6.0 | Closing Costs | 2,200,058 | 3.1 | |||
| Total Sources | $70,938,281 | 100.0 | % | Total Uses | $70,938,281 | 100.0 | % | |
| (1) | The Centre Pointe Portfolio Mortgage Loan (as defined below) is part of a whole loan evidenced by two pari passu notes with an aggregate outstanding principal balance of $47,650,000 (the “Centre Pointe Portfolio Whole Loan”). The Cut-off Date Balance Per SF, Maturity Date Balance Per SF, U/W DSCR based on NOI/NCF, U/W Debt Yield based on NOI/NCF, U/W Debt Yield at Maturity based on NOI/NCF, Cut-off Date LTV Ratio, and LTV Ratio at Maturity presented above are calculated based on the Centre Pointe Portfolio Whole Loan. |
| (2) | In connection with a transfer and assumption, the transferee is permitted to obtain a mezzanine loan provided, among other conditions, that the mezzanine loan will be in a principal amount that, when added to the outstanding principal balance of the Loan, is less than or equal to 70% of the total consideration paid by the proposed transferee to acquire the property and will have a principal amount, interest rate and debt service payments which will result in a combined debt service coverage ratio of at least 1.10x. |
| (3) | Other Reserves consist of an outstanding TI/LC reserve ($3,636,322), a free rent reserve ($235,797), and an existing insurance claim reserve ($106,576). |
| (4) | U/W NOI is greater than TTM 3/31/2023 Net Operating Income primarily due to new leasing, leases renewing at higher rents, and underwritten rent steps totaling $155,678 through August 2024. |
| (5) | Seller’s Credits consists of outstanding TI/LC and free rent most of which has been escrowed as Other Reserves. |
The Mortgage Loan. The twelfth largest mortgage loan (the “Centre Pointe Portfolio Mortgage Loan”) is part of a whole loan evidenced by two pari passu promissory notes with an aggregate original principal balance of $47,650,000 secured by a first mortgage encumbering the fee interest in a 640,177 square foot office property in West Chester, Ohio (the “Centre Pointe Portfolio Property”). The Centre Pointe Portfolio Mortgage Loan consists of the controlling Note A-1, which had an original principal balance of $30,000,000, has a Cut-off Date Balance of $30,000,000 and is being contributed to the MSWF 2023-2 trust. The non-controlling Note A-2 had an original principal balance of $17,650,000, has a Cut-off Date Balance of $17,650,000 and is expected to be contributed to one or more future securitization trust(s). See “Description of the Mortgage Pool—The Whole Loans—The Serviced Pari Passu Whole Loans” and “Pooling and Servicing Agreement” in the prospectus.
| THE INFORMATION IN THIS STRUCTURAL AND COLLATERAL TERM SHEET IS NOT COMPLETE AND MAY BE AMENDED PRIOR TO THE TIME OF SALE. THIS TERM SHEET IS NOT AN OFFER TO SELL THESE SECURITIES AND IT IS NOT A SOLICITATION OF AN OFFER TO BUY THESE SECURITIES IN ANY JURISDICTION WHERE THE OFFER OR SALE IS NOT PERMITTED. | ||
| 148 | ||
| Office – Suburban | Loan #12 | Cut-off Date Balance: | $30,000,000 | |
| 9100, 9050, 9075, 9025, & 9277 | Centre Pointe Portfolio | Cut-off Date LTV: | 67.9% | |
| Centre Pointe Drive | U/W NCF DSCR: | 1.42x | ||
| West Chester, OH 45069 | U/W NOI Debt Yield: | 14.3% |
Whole Loan Note Summary
| Notes | Original Balance | Cut-off Date Balance | Note Holder | Controlling Piece |
| A-1 | $30,000,000 | $30,000,000 | MSWF 2023-2 | Yes |
| A-2(1) | $17,650,000 | $17,650,000 | Argentic Real Estate Finance 2 LLC | No |
| Total | $47,650,000 | $47,650,000 |
| (1) | Expected to be contributed to one or more future securitization trust(s). |
The Property. The Centre Pointe Portfolio Property is a 640,177 square foot office property located in West Chester, Ohio, approximately 18 miles north of Cincinnati. The improvements consist of five, four-story buildings constructed between 2000 and 2007. The Centre Pointe Portfolio Property is part of the greater Centre Pointe Office Park, which includes various hotels, restaurants, one additional office building, and a public park that are not a part of the collateral for the Centre Pointe Portfolio Whole Loan. The Centre Pointe Portfolio Property is situated on an approximately 40.02-acre site with 2,731 surface parking spaces (approximately 4.27 spaces per 1,000 square feet). The buildings are all similar in size (121,397 square feet to 138,633 square feet) featuring rectangular floor plates ranging from 30,000 square feet to 36,500 square feet. The floor plates are easily divisible and can accommodate tenants ranging in size from full floor plates to smaller and mid-size tenants that occupy a small portion of a floor. Amenities at the Centre Pointe Portfolio Property include a 2,018 square foot fitness center and a furnished business conference center.
As of May 31, 2023, the Centre Pointe Portfolio Property was 82.1% leased to 54 tenants. The Centre Pointe Portfolio Property features a granular rent roll, with no tenant making up greater than 8.3% of the net rentable area and 9.2% of the underwritten base rent. Occupancy decreased from 87.2% in 2020 to 80.4% in 2021 primarily due to one of the major tenants at the time, GE Aviation, downsizing and retracting their Cincinnati presence and vacating its space at the Centre Pointe Portfolio Property. The borrower sponsor began to backfill the space and has executed 358,448 square feet across 15 new leases (143,823 square feet), 17 renewals (157,516 square feet), and approximately 29,219 square feet of expansion space since February 2020.
Major Tenants.
Synchrony (53,194 square feet, 8.3% of net rentable area; 9.2% of underwritten base rent; Fitch/Moody’s/S&P: BBB-/NR/BBB-) – The largest tenant, Synchrony (NYSE: SYF), is a consumer financial services company that offers a diverse set of financing solutions and digital capabilities to consumers. The company serves over 70 million customers and has approximately 18,500 employees. Synchrony moved into the Centre Pointe Portfolio Property in June 2022 and has a lease expiration in October 2027. The tenant has two, 5-year renewal options.
Contech Construction Products (44,814 square feet; 7.0% of net rentable area; 7.9% of underwritten base rent) – The second largest tenant, Contech Construction Products, is a provider of site solutions for engineers, contractors, architects, and owners. Contech Construction Products helps build, support, and sustain development projects such as bridges, drainage, erosion control, retaining walls, and storm water management. The company has over 1,400 employees and 60 facilities across North America and is headquartered at the Centre Pointe Portfolio Property. Contech Construction Products has been a tenant at the Centre Pointe Portfolio Property since November 2005 and signed a lease extension in January 2021 to extend its lease expiration to July 2031. The tenant has two, 5-year renewal options remaining.
Pilot Chemical Company of Ohio (“Pilot Chemical”) (37,533 square feet; 5.9% of net rentable area; 7.0% of underwritten base rent) – The third largest tenant, Pilot Chemical, specializes in providing products and services to the disinfecting, sanitizing, cleaning, metalworking, and oil industries. The company was founded in 1952 and is headquartered at the Centre Pointe Portfolio Property. Pilot Chemical has been a tenant at the Centre Pointe Portfolio Property since May 2019 and has a lease expiration in May 2029. Pilot Chemical has the one-time right to terminate its lease effective May 2026 provided the tenant provides written notice to the landlord on or prior to September 19, 2025. In connection with the early termination, the tenant is required to pay a termination fee of $875,331 plus the unamortized portion of the tenant improvement allowance, leasing commissions, and abated rent, assuming an 8% annual rate of amortization. Additionally, Pilot Chemical has the right to downsize its space by 5,000 square feet effective May 2026 for a termination fee equal to the unamortized portion of the tenant improvement allowance, leasing commissions, and abated rent, assuming an 8% annual rate of amortization applicable to the space that will be relinquished. The tenant has 3, five-year renewal options remaining.
| THE INFORMATION IN THIS STRUCTURAL AND COLLATERAL TERM SHEET IS NOT COMPLETE AND MAY BE AMENDED PRIOR TO THE TIME OF SALE. THIS TERM SHEET IS NOT AN OFFER TO SELL THESE SECURITIES AND IT IS NOT A SOLICITATION OF AN OFFER TO BUY THESE SECURITIES IN ANY JURISDICTION WHERE THE OFFER OR SALE IS NOT PERMITTED. | ||
| 149 | ||
| Office – Suburban | Loan #12 | Cut-off Date Balance: | $30,000,000 | |
| 9100, 9050, 9075, 9025, & 9277 | Centre Pointe Portfolio | Cut-off Date LTV: | 67.9% | |
| Centre Pointe Drive | U/W NCF DSCR: | 1.42x | ||
| West Chester, OH 45069 | U/W NOI Debt Yield: | 14.3% |
The following table presents certain information relating to the tenancy at the Centre Pointe Portfolio Property:
Major Tenants
| Tenant Name | Credit Rating (Fitch/Moody’s/ S&P)(1) | Tenant NRSF | % of NRSF | Annual U/W Base Rent PSF(2) | Annual U/W Base Rent(2) | % of Total Annual U/W Base Rent | Lease Expiration Date | Extension Options | Termination Option (Y/N) |
| Major Tenants | |||||||||
| Synchrony | BBB-/NR/BBB- | 53,194 | 8.3% | $13.22 | $703,225 | 9.2% | 10/31/2027 | 2, 5-year | N |
| Contech Construction Products | NR/NR/NR | 44,814 | 7.0% | $13.46 | $603,196 | 7.9% | 7/31/2031 | 2, 5-year | N |
| Pilot Chemical Company of Ohio | NR/NR/NR | 37,533 | 5.9% | $14.25 | $534,845 | 7.0% | 5/31/2029 | 3, 5-year | Y(3) |
| 3dB Labs, Inc. | NR/NR/NR | 32,998 | 5.2% | $14.59 | $481,512 | 6.3% | 5/31/2027 | None | N |
| Clarkwestern Dietrich Building Systems, LLC | NR/NR/NR | 24,944 | 3.9% | $15.89 | $396,305 | 5.2% | 10/31/2027 | 2, 5-year | N |
| Total Major Tenants | 193,483 | 30.2% | $14.05 | $2,719,084 | 35.7% | ||||
| Non-Major Tenants | 332,419 | 51.9% | $14.75 | $4,904,126 | 64.3% | ||||
| Occupied Collateral Total | 525,902 | 82.1% | $14.50 | $7,623,210 | 100.0% | ||||
| Vacant Space | 114,275 | 17.9% | |||||||
| Collateral Total | 640,177 | 100.0% | |||||||
| (1) | In certain instances, credit ratings shown are those of the parent company of the entity shown, whether or not the parent company guarantees the lease. |
| (2) | Annual U/W Base Rent PSF and Annual U/W Base Rent include contractual rent steps through August 2024 totaling $155,678. |
| (3) | Pilot Chemical has the right to terminate its lease effective May 2026 provided the tenant provides written notice to the landlord on or prior to September 19, 2025. In connection with the early termination, the tenant is required to pay a termination fee of $875,331 plus the unamortized portion of the tenant improvement allowance, leasing commissions, and abated rent, assuming an 8% annual rate of amortization. |
The following table presents certain information relating to the lease rollover schedule at the Centre Pointe Portfolio Property:
Lease Expiration Schedule(1)(2)
| Year Ending December 31, | No. of Leases Expiring | Expiring NRSF | % of Total NRSF | Cumulative Expiring NRSF | Cumulative % of Total NRSF | Annual U/W Base Rent | % of Total Annual U/W Base Rent | Annual U/W Base Rent PSF | ||||
| MTM | 1 | 6,932 | 1.1% | 6,932 | 1.1% | $109,040 | 1.4% | $15.73 | ||||
| 2023 | 0 | 0 | 0.0% | 6,932 | 1.1% | $0 | 0.0% | $0.00 | ||||
| 2024 | 6 | 30,675 | 4.8% | 37,607 | 5.9% | $421,145 | 5.5% | $13.73 | ||||
| 2025 | 11 | 76653 | 12.0% | 114,260 | 17.8% | $1,195,076 | 15.7% | $15.59 | ||||
| 2026 | 6 | 34,409 | 5.4% | 148,669 | 23.2% | $531,923 | 7.0% | $15.46 | ||||
| 2027 | 16 | 186,415 | 29.1% | 335,084 | 52.3% | $2,585,857 | 33.9% | $13.87 | ||||
| 2028 | 4 | 21,405 | 3.3% | 356,489 | 55.7% | $315,825 | 4.1% | $14.75 | ||||
| 2029 | 4 | 72,692 | 11.4% | 429,181 | 67.0% | $1,076,372 | 14.1% | $14.81 | ||||
| 2030 | 2 | 21336 | 3.3% | 450,517 | 70.4% | $321,570 | 4.2% | $15.07 | ||||
| 2031 | 1 | 44,814 | 7.0% | 495,331 | 77.4% | $603,196 | 7.9% | $13.46 | ||||
| 2032 | 3 | 30,571 | 4.8% | 525,902 | 82.1% | $463,206 | 6.1% | $15.15 | ||||
| 2033 | 0 | 0 | 0.0% | 525,902 | 82.1% | $0 | 0.0% | $0.00 | ||||
| Thereafter | 0 | 0 | 0.0% | 525,902 | 82.1% | $0 | 0.0% | $0.00 | ||||
| Vacant | 0 | 114,275 | 17.9% | 640,177 | 100.0% | $0 | 0.0% | $0.00 | ||||
| Total/Weighted Average | 54(3) | 640,177(3) | 100.0% | $7,623,210 | 100.0% | $14.50(4) | ||||||
| (1) | Information obtained from the underwritten rent roll dated May 31, 2023. |
| (2) | Certain tenants may have lease termination options that are exercisable prior to the originally stated expiration date of the subject lease and that are not considered in the Lease Expiration Schedule. |
| (3) | Includes the conference center, fitness center, and management office (totaling 6,117 square feet) for which no rent was underwritten. |
| (4) | Excludes vacant space. |
| THE INFORMATION IN THIS STRUCTURAL AND COLLATERAL TERM SHEET IS NOT COMPLETE AND MAY BE AMENDED PRIOR TO THE TIME OF SALE. THIS TERM SHEET IS NOT AN OFFER TO SELL THESE SECURITIES AND IT IS NOT A SOLICITATION OF AN OFFER TO BUY THESE SECURITIES IN ANY JURISDICTION WHERE THE OFFER OR SALE IS NOT PERMITTED. | ||
| 150 | ||
| Office – Suburban | Loan #12 | Cut-off Date Balance: | $30,000,000 | |
| 9100, 9050, 9075, 9025, & 9277 | Centre Pointe Portfolio | Cut-off Date LTV: | 67.9% | |
| Centre Pointe Drive | U/W NCF DSCR: | 1.42x | ||
| West Chester, OH 45069 | U/W NOI Debt Yield: | 14.3% |
The following table presents historical occupancy percentages at the Centre Pointe Portfolio Property:
Historical Occupancy
12/31/2020(1) | 12/31/2021(1) | 12/31/2022(1) | 5/31/2023(2) |
| 87.2% | 80.4% | 80.2% | 82.1% |
| (1) | Information obtained from the Centre Pointe Portfolio borrower. |
| (2) | Information obtained from the underwritten rent roll dated May 31, 2023. |
Market Overview and Competition. The Centre Pointe Portfolio Property is located in West Chester, Ohio, approximately 18 miles north of Cincinnati. Primary access is provided by Interstate 75 (located less than a mile from the Centre Pointe Portfolio Property) and Interstate 275, which connect the Centre Pointe Portfolio Property to the greater Cincinnati metropolitan area. The local neighborhood features retail, restaurants, and entertainment such as Ikea, Buffalo Wild Wings, Top Golf, and an AMC theater. The office park features more than four hotel options for business travel. Additionally, The Residences at the Clocktower, a brand new 300+ unit multifamily and retail complex, is currently being constructed in the center of the office park. Also at the heart of the office park is West Chester Clock Tower Park, which features outdoor recreation and live music for local residents.
According to the appraisal, the 2022 estimated population within a one-, three-, and five-mile radius of the Centre Pointe Portfolio Property is 3,102, 46,401 and 136,676 respectively. The 2022 estimated median household income within the same radii was $111,253, $98,474 and $94,197, respectively. Furthermore, the top three industries within the area are Health Care/Social Assistance, Manufacturing and Retail Trade, which represent a combined total of 40% of the workforce.
According to the appraisal, the Centre Pointe Portfolio Property is situated in the Butler County office submarket, which contained approximately 11.1 million square feet of office space as of the fourth quarter of 2022. The Butler County office submarket reported a vacancy rate of 11.1% with an average asking rental rate of $18.64 per square foot. The appraiser concluded a market rent of $13.85 per square foot for the Centre Pointe Portfolio Property.
The following table presents certain information relating to the appraiser’s market rent conclusion for the Centre Pointe Portfolio Property:
Market Rent Summary(1)
| Office | |
| Market Rent (PSF) | $13.85 |
| Lease Term (Years) | 7 |
| Lease Type (Reimbursements) | Net |
| Rent Increase Projection | 2.50% / year |
| Concessions (New Tenants) | 4 months |
| Concessions (Renewals) | 2 months |
| Tenant Improvements (New Tenants) | $40.00 |
| Tenant Improvements (Renewals) | $7.00 |
| Leasing Commissions (New Tenants) | 6.0% |
| Leasing Commissions (Renewals) | 3.0% |
| (1) | Information obtained from the appraisal. |
| THE INFORMATION IN THIS STRUCTURAL AND COLLATERAL TERM SHEET IS NOT COMPLETE AND MAY BE AMENDED PRIOR TO THE TIME OF SALE. THIS TERM SHEET IS NOT AN OFFER TO SELL THESE SECURITIES AND IT IS NOT A SOLICITATION OF AN OFFER TO BUY THESE SECURITIES IN ANY JURISDICTION WHERE THE OFFER OR SALE IS NOT PERMITTED. | ||
| 151 | ||
| Office – Suburban | Loan #12 | Cut-off Date Balance: | $30,000,000 | |
| 9100, 9050, 9075, 9025, & 9277 | Centre Pointe Portfolio | Cut-off Date LTV: | 67.9% | |
| Centre Pointe Drive | U/W NCF DSCR: | 1.42x | ||
| West Chester, OH 45069 | U/W NOI Debt Yield: | 14.3% |
The following table presents certain information relating to five recent sales of properties comparable to the Centre Pointe Portfolio Property:
Comparable Sales(1)
| Property Name | Location | Rentable Area (SF) | Sale Date | Sale Price | Sale Price (PSF) | Cap Rate |
| Summit Woods III and IV | Sharonville, OH | 218,497 | Jul-22 | $22,000,000 | $100.69 | 8.5% |
| Hurstbourne Park & Hurstbourne Place | Louisville, KY | 343,835 | Jul-22 | $42,500,000 | $123.61 | 7.3% |
| Westar I & II | Westerville, OH | 279,912 | Jan-23 | $31,000,000 | $110.75 | 8.0% |
| 9200 Worthington Building | Columbus, OH | 136,318 | Sep-22 | $14,750,000 | $108.20 | 7.0% |
| Two Crowne Point | Sharonville, OH | 74,460 | Dec-22 | $7,500,000 | $100.73 | 9.2% |
| (1) | Information obtained from the appraisal. |
The following table presents certain information relating to seven comparable leases to those at the Centre Pointe Portfolio Property:
Comparable Leases(1)
| Property Name/Location | Year Built | Total GLA (SF) | Tenant Name | Lease Term (Years) | Tenant Size (SF) | Annual Base Rent PSF | Lease Type |
| Office Park I | 2012 | 31,874 | RubyHaus | 5.0 | 1,799 | $17.00 | NNN |
| 9032 Union Centre Boulevard | |||||||
| West Chester, OH | |||||||
| Governor's Pointe 4680 | 1998 | 128,490 | VA - GSA | 10.0 | 19,412 | $21.69 | Gross |
| 4680 Parkway Drive | |||||||
| Deerfield Township, OH | |||||||
| GE Aviation | 2009 | 409,798 | GE Aviation | 5.3 | 204,899 | $13.80 | NNN |
| 6440 Aviation Way | |||||||
| West Chester Township, OH | |||||||
| Summit Woods III | 2006 | 106,000 | Clarify Wealth Management | 3.0 | 3,580 | $14.60 | NNN |
| 50 E. Business Way | |||||||
| Sharonville, OH | |||||||
| Summit Woods IV | 2015 | 108,422 | United Healthcare | 3.0 | 11,135 | $14.35 | NNN |
| 400 E. Business Way | |||||||
| Sharonville, OH | |||||||
| Kemper Pointe | 2005 | 96,418 | Rapid Mortgage | NAV | 8,280 | $14.00 | NNN |
| 7870 East Kemper Road | |||||||
| Cincinnati, OH | |||||||
| Deerfield Crossing A&B | 1999 | 320,802 | Nelson & Associates Inc | NAV | 2,550 | $15.75 | NNN |
| 5181 West Natorp Boulevard | |||||||
| Deerfield Township, OH |
| (1) | Information obtained from the appraisal. |
| THE INFORMATION IN THIS STRUCTURAL AND COLLATERAL TERM SHEET IS NOT COMPLETE AND MAY BE AMENDED PRIOR TO THE TIME OF SALE. THIS TERM SHEET IS NOT AN OFFER TO SELL THESE SECURITIES AND IT IS NOT A SOLICITATION OF AN OFFER TO BUY THESE SECURITIES IN ANY JURISDICTION WHERE THE OFFER OR SALE IS NOT PERMITTED. | ||
| 152 | ||
| Office – Suburban | Loan #12 | Cut-off Date Balance: | $30,000,000 | |
| 9100, 9050, 9075, 9025, & 9277 | Centre Pointe Portfolio | Cut-off Date LTV: | 67.9% | |
| Centre Pointe Drive | U/W NCF DSCR: | 1.42x | ||
| West Chester, OH 45069 | U/W NOI Debt Yield: | 14.3% |
Operating History and Underwritten Net Cash Flow. The following table presents certain information relating to the underwritten net cash flow at the Centre Pointe Portfolio Property:
Cash Flow Analysis
| 2020 | 2021 | 2022 | TTM 3/31/2023 | U/W | %(1) | U/W $ per SF | ||
| Rents in Place | $7,021,421 | $6,402,901 | $5,663,860 | $6,030,222 | $7,467,532 | 49.8 | % | $11.66 |
| Contractual Rent Steps(2) | 0 | 0 | 0 | 0 | 155,678 | 1.0 | 0.24 | |
| Grossed Up Vacant Space | 0 | 0 | 0 | 0 | 2,571,980 | 17.2 |
| 4.02 |
| Gross Potential Rent | $7,021,421 | $6,402,901 | $5,663,860 | $6,030,222 | $10,195,190 | 68.0 | % | $15.93 |
| Other Income(3) | 127,749 | 278,832 | 109,154 | 148,155 | 148,155 | 1.0 | 0.23 | |
| Total Recoveries | 4,467,651 | 3,998,795 | 4,206,747 | 4,513,730 | 4,647,819 | 31.0 |
| 7.26 |
| Net Rental Income | $11,616,821 | $10,680,528 | $9,979,761 | $10,692,107 | $14,991,164 | 100.0 | % | $23.42 |
| (Vacancy & Credit Loss) | 0 | 0 | 0 | 0 | (2,571,980) | (25.2) |
| (4.02) |
| Effective Gross Income | $11,616,821 | $10,680,528 | $9,979,761 | $10,692,107 | $12,419,184 | 82.8 | % | $19.40 |
| Real Estate Taxes | 1,880,327 | 1,609,726 | 1,781,579 | 1,774,782 | 1,678,111 | 13.5 | 2.62 | |
| Insurance | 120,606 | 147,640 | 117,418 | 133,433 | 100,000 | 0.8 | 0.16 | |
| Management Fee | 268,867 | 247,385 | 211,483 | 241,876 | 372,576 | 3.0 | 0.58 | |
| Other Operating Expenses | 2,774,698 | 2,956,980 | 3,292,663 | 3,460,144 | 3,460,144 | 27.9 |
| 5.40 |
| Total Operating Expenses | $5,044,498 | $4,961,731 | $5,403,143 | $5,610,235 | $5,610,831 | 45.2 | % | $8.76 |
| Net Operating Income | $6,572,323 | $5,718,797 | $4,576,618 | $5,081,872(4) | $6,808,354(4) | 54.8 | % | $10.64 |
| Replacement Reserves | 0 | 0 | 0 | 0 | 128,035 | 1.0 | 0.20 | |
| TI/LC | 0 | 0 | 0 | 0 | 1,280,354 | 10.3 |
| 2.00 |
| Net Cash Flow | $6,572,323 | $5,718,797 | $4,576,618 | $5,081,872 | $5,399,965 | 43.5 | % | $8.44 |
| NOI DSCR(5) | 1.72x | 1.50x | 1.20x | 1.33x | 1.79x | |||
| NCF DSCR(5) | 1.72x | 1.50x | 1.20x | 1.33x | 1.42x | |||
| NOI Debt Yield(5) | 13.8% | 12.0% | 9.6% | 10.7% | 14.3% | |||
| NCF Debt Yield(5) | 13.8% | 12.0% | 9.6% | 10.7% | 11.3% | |||
| (1) | Represents (i) percent of Net Rental Income for all revenue fields, (ii) percent of Gross Potential Rent for Vacancy & Credit Loss and (iii) percent of Effective Gross Income for all other fields. |
| (2) | Represents contractual rent steps through August 2024. |
| (3) | Other Income includes miscellaneous income. |
| (4) | U/W Net Operating Income is greater than TTM 3/31/2023 Net Operating Income primarily due to new leasing, leases renewing at higher rents, and underwritten rent steps totaling $155,678 through August 2024. |
| (5) | The debt service coverage ratios and debt yields are calculated based on the Centre Pointe Portfolio Whole Loan. |
| THE INFORMATION IN THIS STRUCTURAL AND COLLATERAL TERM SHEET IS NOT COMPLETE AND MAY BE AMENDED PRIOR TO THE TIME OF SALE. THIS TERM SHEET IS NOT AN OFFER TO SELL THESE SECURITIES AND IT IS NOT A SOLICITATION OF AN OFFER TO BUY THESE SECURITIES IN ANY JURISDICTION WHERE THE OFFER OR SALE IS NOT PERMITTED. | ||
| 153 | ||
| No. 13 – Gwinnett Marketfair |
| Mortgage Loan Information | Mortgaged Property Information | ||||||
| Mortgage Loan Seller: | Wells Fargo Bank, National Association | Single Asset/Portfolio: | Single Asset | ||||
Credit Assessment (Fitch/KBRA/Moody’s): | NR/NR/NR | Property Type – Subtype: | Retail – Anchored | ||||
| Original Principal Balance: | $25,400,000 | Location: | Duluth, GA | ||||
| Cut-off Date Balance: | $25,400,000 | Size: | 193,782 SF | ||||
| % of Initial Pool Balance: | 2.8% | Cut-off Date Balance Per SF: | $131.08 | ||||
| Loan Purpose: | Refinance | Maturity Date Balance Per SF: | $131.08 | ||||
| Borrower Sponsors: | Stanley Werb and Jonathan Gaines | Year Built/Renovated: | 1987/NAP | ||||
| Guarantors: | Stanley Werb and Jonathan Gaines | Title Vesting: | Fee | ||||
| Mortgage Rate: | 6.9680% | Property Manager: | Rivercrest Realty Associates, LLC | ||||
| Note Date: | August 29, 2023 | Current Occupancy (As of): | 96.6% (8/16/2023) | ||||
| Seasoning: | 3 months | YE 2022 Occupancy: | 100.0% | ||||
| Maturity Date: | September 11, 2033 | YE 2021 Occupancy: | 98.6% | ||||
| IO Period: | 120 months | YE 2020 Occupancy: | 96.9% | ||||
| Loan Term (Original): | 120 months | As-Is Appraised Value: | $39,800,000 | ||||
| Amortization Term (Original): | NAP | As-Is Appraised Value Per SF: | $205.39 | ||||
| Call Protection: | L(27),D(88),O(5) | As-Is Appraisal Valuation Date: | May 16, 2023 | ||||
| Lockbox Type: | Springing/Springing Cash Management | Underwriting and Financial Information | |||||
Additional Debt: | None | TTM NOI (6/30/2023): | $2,697,157 | ||||
| Additional Debt Type (Balance): | NAP | YE 2022 NOI: | $2,685,390 | ||||
| YE 2021 NOI: | $2,500,060 | ||||||
| Escrows and Reserves | YE 2020 NOI: | $2,403,226 | |||||
| Initial | Monthly | Cap | U/W Revenues: | $3,404,903 | |||
| Taxes: | $29,324 | $29,324 | NAP | U/W Expenses: | $761,253 | ||
| Insurance(1): | $0 | Springing | NAP | U/W NOI: | $2,643,650 | ||
| Replacement Reserve: | $124,748 | $3,230 | NAP | U/W NCF: | $2,568,003 | ||
| TI/LC Reserve(2): | $600,000 | Springing | $600,000 | U/W DSCR based on NOI/NCF: | 1.47x / 1.43x | ||
| U/W Debt Yield based on NOI/NCF: | 10.4% / 10.1% | ||||||
| Shoe Carnival Reserve(3): | $127,400 | $0 | NAP | U/W Debt Yield at Maturity based on NOI/NCF: | 10.4% / 10.1% | ||
| Burlington Reserve(4): | $280,000 | $0 | NAP | Cut-off Date LTV Ratio: | 63.8% | ||
| Party City Reserve(5): | $350,000 | $0 | NAP | LTV Ratio at Maturity: | 63.8% | ||
| Debt Yield Reserve(6): | $0 | Springing | NAP | ||||
| Sources and Uses | |||||||
| Sources | Uses | ||||||
| Original Mortgage Loan Amount | $25,400,000 | 100.0% | Loan Payoff | $15,777,471 | 62.1 | % | |
| Upfront Reserves | 1,511,472 | 6.0 | |||||
| Closing Costs | 812,802 | 3.2 | |||||
| Return of Equity | 7,298,255 | 28.7 | |||||
| Total Sources | $25,400,000 | 100.0% | Total Uses | $25,400,000 | 100.0 | % | |
| (1) | The Gwinnett Marketfair Mortgage Loan (as defined below) documents do not require ongoing monthly insurance reserves; provided (i) no event of default is continuing, (ii) the borrower maintains insurance coverage for the Gwinnett Marketfair Property (as defined below) as part of blanket or umbrella coverage reasonably approved by the lender and (iii) the borrower provides the lender with evidence of the renewals of the insurance policies and paid receipts for the payment of the insurance premiums no later than 30 business days prior to the expiration dates of the policies. If such conditions are not satisfied, the Gwinnett Marketfair Mortgage Loan documents require ongoing monthly deposits in an amount equal to 1/12th of the insurance premiums that the lender reasonably estimates will be payable for the coverage. |
| (2) | TI/LC Reserve shall be funded $12,111 monthly when the reserve is below its $600,000 cap, upon an event of default, cash trap event period or Debt Yield Event Period (as defined below). |
| (3) | The Gwinnett Marketfair Mortgage Loan documents require an upfront deposit of $127,400 for outstanding tenant improvements related to Shoe Carnival. |
| (4) | The Gwinnett Marketfair Mortgage Loan documents require an upfront deposit of $280,000, which will be released to the borrower upon lender receiving evidence that Burlington (as defined below) has taken occupancy of its space, is open for business and paying full unabated rent, provided, there is no event of default, cash trap event period (which commences upon the occurrence of an event of default) or Debt Yield Event Period. |
| (5) | The Party City Reserve has been released due to satisfaction of the following requirements: a) no event of default, cash trap event period or Debt Yield Event Period is continuing, and (b) the bankruptcy of the tenant has terminated in a manner satisfactory to the lender, the related lease has been affirmed, and the terms of the affirmed lease are satisfactory to the lender. |
| (6) | The Gwinnett Marketfair Mortgage Loan documents require a monthly deposit of all excess cash flow, commencing upon the next occurring monthly payment date, that the net cash flow debt yield (“NCF DY”) is less than 8.5% (a “Debt Yield Event Period”). A Debt Yield Event Period will end upon the date with the NCF DY is greater than or equal to 9.0% for two consecutive calendar quarters. Provided no event of default and no cash trap event period is continuing, the lender is required to disburse funds from the Debt Yield Reserve for tenant improvement and leasing commissions. |
| THE INFORMATION IN THIS STRUCTURAL AND COLLATERAL TERM SHEET IS NOT COMPLETE AND MAY BE AMENDED PRIOR TO THE TIME OF SALE. THIS TERM SHEET IS NOT AN OFFER TO SELL THESE SECURITIES AND IT IS NOT A SOLICITATION OF AN OFFER TO BUY THESE SECURITIES IN ANY JURISDICTION WHERE THE OFFER OR SALE IS NOT PERMITTED. | ||
| 154 | ||
| Retail – Anchored | Loan #13 | Cut-off Date Balance: | $25,400,000 | |
| 3675 Satellite Boulevard | Gwinnett Marketfair | Cut-off Date LTV: | 63.8% | |
| Duluth, GA 30096 | U/W NCF DSCR: | 1.43x | ||
| U/W NOI Debt Yield: | 10.4% |
The Mortgage Loan. The thirteenth largest mortgage loan (the “Gwinnett Marketfair Mortgage Loan”) is evidenced by a promissory note in the original principal amount of $25,400,000 and secured by a first priority fee interest in a 193,782 square foot anchored retail property located in Duluth, Georgia (the “Gwinnett Marketfair Property”).
The Borrower and Borrower Sponsors. The borrower is GA-Duluth Gwinnett-SSR, LLC, a Delaware limited liability company and single purpose entity with one independent director. Legal counsel to the borrower delivered a non-consolidation opinion in connection with the origination of the Gwinnett Marketfair Mortgage Loan. The borrower sponsors and non-recourse carveout guarantors are Stanley Werb and Johnathan Gaines.
Stanley Werb and Jonathan Gaines are currently principals at Rivercrest Realty Investors (“Rivercrest”). Founded in 1969 and based in Raleigh, North Carolina, Rivercrest is a privately owned and operated commercial real estate company specializing in the acquisition, long-term ownership and management of shopping centers, office buildings, and apartments throughout the eastern United States. Rivercrest currently owns a portfolio of 88 retail properties, two office properties, three self-storage properties and five multifamily properties. The sponsor has had one prior foreclosure. For additional information please see “Description of the Mortgage Pool – Loan Purpose; Default History, Bankruptcy Issues and Other Proceedings” in the prospectus.
The Property. The Gwinnett Marketfair Property is an anchored retail center located in Duluth, Georgia consisting of five buildings totaling 193,782 square feet. Built in 1987, the Gwinnett Marketfair Property is situated on a 17.9-acre site and is anchored by TJ Maxx, Five Below, Marshalls, Burlington Coat Factory Warehouse Corporation (“Burlington”), and Party City. TJ Maxx and Marshalls have been tenants since the Gwinnett Marketfair Property was built in 1987. Burlington assumed the existing Bed, Bath & Beyond lease and is expected to open on December 1, 2023. The Gwinnett Marketfair Property contains 847 surface parking spaces, resulting in a parking ratio of 4.37 spaces per 1,000 SF of rentable area. As of August 16, 2023, the Gwinnett Marketfair Property was 96.6% leased to 29 tenants and has averaged 98.5% occupancy since 2018. Additionally, nine tenants (comprising 50.5% of the net rentable area) have each been in occupancy at the center for at least 15 years.
Major Tenants.
Burlington (F/M/S: NR/NR/BB+; 29,820 SF; 15.4% of NRA; 10.6% of underwritten base rent). Founded in 1972 and headquartered in Burlington, New Jersey, Burlington (NYSE: BURL) is an off-price retailer that operated 933 stores across 46 states and Puerto Rico as of March 2023. Burlington’s product offering includes women’s ready-to-wear apparel, menswear, youth apparel, baby, beauty, footwear, accessories, home, toys, gifts, and coats. Burlington is assuming an existing Bed, Bath & Beyond lease, which has been approved by the bankruptcy court, and has a lease expiring in January 2026 with two, five-year renewal options remaining.
Marshalls (F/M/S: NR/A2/A (parent company); 27,054 SF; 14.0% of NRA; 9.3% of underwritten base rent). Founded in 1956 and headquartered in Framingham, Massachusetts, Marshalls, owned by TJX Companies, Inc. (NYSE: TJX), is an off-price retailer that operated 1,183 stores as of January 2023 throughout the U.S. and Canada. Marshalls product offering includes women’s ready-to-wear apparel, menswear, youth apparel, baby, beauty, footwear, accessories, home, toys, gifts, and coats. Marshalls has been a tenant since 1987 and has a lease expiring in January 2028 with one, five-year renewal option remaining and no termination options. Marshalls sales as of year-end 2022 were $482 per square foot, a 7.0% increase over year end 2021 sales.
TJ Maxx (F/M/S: NR/A2/A (parent company); 24,300 SF; 12.5% of NRA; 8.4% of underwritten base rent). Founded in 1976 and headquartered in Framingham, Massachusetts, TJ Maxx (NYSE: TJX) is an off-price retailer that operated 1,299 stores across the U.S. as of January 2023. TJ Maxx’s product offering includes women’s ready-to-wear apparel, menswear, youth apparel, baby, beauty, footwear, accessories, home, toys, gifts, and coats. TJ Maxx has been a tenant since 1987 and has a lease expiring in January 2028 with two, five-year renewal options remaining and no termination options. TJ Maxx sales as of January 31, 2023 were $504 per square foot, a 6.9% increase over the January 31, 2022 sales of $471 per square foot.
| THE INFORMATION IN THIS STRUCTURAL AND COLLATERAL TERM SHEET IS NOT COMPLETE AND MAY BE AMENDED PRIOR TO THE TIME OF SALE. THIS TERM SHEET IS NOT AN OFFER TO SELL THESE SECURITIES AND IT IS NOT A SOLICITATION OF AN OFFER TO BUY THESE SECURITIES IN ANY JURISDICTION WHERE THE OFFER OR SALE IS NOT PERMITTED. | ||
| 155 | ||
| Retail – Anchored | Loan #13 | Cut-off Date Balance: | $25,400,000 | |
| 3675 Satellite Boulevard | Gwinnett Marketfair | Cut-off Date LTV: | 63.8% | |
| Duluth, GA 30096 | U/W NCF DSCR: | 1.43x | ||
| U/W NOI Debt Yield: | 10.4% |
The following table presents certain information relating to the tenancy at the Gwinnett Marketfair Property:
Major Tenants(1)
| Tenant Name | Credit Rating (Fitch/ Moody’s/ | Tenant NRSF | % of NRSF | Annual U/W Base Rent PSF(3) | Annual U/W Base Rent(3) | % of Total Annual U/W Base Rent | Lease Expiration Date | Ext. Options | Term. Option (Y/N) |
| Major Tenants | |||||||||
| Burlington | NR/NR/BB+ | 29,820 | 15.4% | $9.50 | $283,290 | 10.6% | 1/31/2026 | 2, 5-year | N |
| Marshall’s | NR/A2/A | 27,054 | 14.0% | $9.25 | $250,250 | 9.3% | 1/31/2028 | 1, 5-year | N |
| TJ Maxx | NR/A2/A | 24,300 | 12.5% | $9.25 | $224,775 | 8.4% | 1/31/2028 | 2, 5-year | N |
| Party City | NR/NR/NR | 15,155 | 7.8% | $11.25 | $170,494 | 6.4% | 8/31/2031 | 2, 5-year | N |
| Shoe Carnival | NR/NR/NR | 12,740 | 6.6% | $12.24 | $155,938 | 5.8% | 7/31/2032 | 2, 5-year | N |
| Five Below | NR/NR/NR | 15,303 | 7.9% | $9.00 | $137,727 | 5.1% | 1/31/2030 | 3, 5-year | N |
| 124,372 | 64.2% | $9.83 | $1,222,474 | 45.6% | |||||
| Non-Major Tenants | 62,858 | 32.4% | $23.18 | $1,457,148 | 54.4% | ||||
| Occupied Collateral Total | 187,230 | 96.6% | $14.31 | $2,679,622 | 100.0% | ||||
| Vacant Space | 6,552 | 3.4% | |||||||
| Collateral Total | 193,782 | 100.0% | |||||||
| (1) | Information obtained from the underwritten rent roll dated August 16, 2023. |
| (2) | Certain ratings are those of the parent company, whether or not the parent company guarantees the lease. |
| (3) | The Annual U/W Base Rent PSF and Annual U/W Base Rent include contractual rent steps totaling $20,752 through August 2024. |
The following table presents a summary of sales and occupancy costs for certain tenants at the Gwinnett Marketfair Property:
Tenant Sales(1)(2)
| 2020 Sales (PSF) | 2021 Sales (PSF) | 2022 Sales (PSF) | Occupancy Cost(3) | |
| Marshall’s | $293 | $451 | $482 | 2.6% |
| TJ Maxx | $309(4) | $471(4) | $504(4) | 2.4% |
Party City Shoe Carnival | $169 N/A | $179 $416 | $143 $391 | 10.4% 4.1% |
| (1) | Information obtained from the borrower. |
| (2) | Tenants shown on the Major Tenants table above and not included on the Tenant Sales table are not required to report sales. |
| (3) | Occupancy cost is based on underwritten base rent and any applicable reimbursements, divided by most recent reported sales. |
| (4) | TJ Maxx sales are as of January 31, for 2021, 2022 and 2023 respectively. |
| THE INFORMATION IN THIS STRUCTURAL AND COLLATERAL TERM SHEET IS NOT COMPLETE AND MAY BE AMENDED PRIOR TO THE TIME OF SALE. THIS TERM SHEET IS NOT AN OFFER TO SELL THESE SECURITIES AND IT IS NOT A SOLICITATION OF AN OFFER TO BUY THESE SECURITIES IN ANY JURISDICTION WHERE THE OFFER OR SALE IS NOT PERMITTED. | ||
| 156 | ||
| Retail – Anchored | Loan #13 | Cut-off Date Balance: | $25,400,000 | |
| 3675 Satellite Boulevard | Gwinnett Marketfair | Cut-off Date LTV: | 63.8% | |
| Duluth, GA 30096 | U/W NCF DSCR: | 1.43x | ||
| U/W NOI Debt Yield: | 10.4% |
The following table presents certain information relating to the lease rollover schedule at the Gwinnett Marketfair Property:
Lease Expiration Schedule(1)(2)
Year Ending December 31, | No. of Leases Expiring | Expiring NRSF | % of Total NRSF | Cumulative Expiring NRSF | Cumulative % of Total NRSF | Annual U/W Base Rent | % of Total Annual U/W Base Rent | Annual U/W Base Rent PSF (3) |
| MTM | 0 | 0 | 0.0% | 0 | 0.0% | $0 | 0.0% | $0.00 |
| 2023 | 0 | 0 | 0.0% | 0 | 0.0% | $0 | 0.0% | $0.00 |
| 2024 | 1 | 3,475 | 1.8% | 3,475 | 1.8% | $66,894 | 2.5% | $19.25 |
| 2025 | 5 | 13,023 | 6.7% | 16,498 | 8.5% | $303,126 | 11.3% | $23.28 |
| 2026 | 5 | 39,908 | 20.6% | 56,406 | 29.1% | $510,147 | 19.0% | $12.78 |
| 2027 | 5 | 7,910 | 4.1% | 64,316 | 33.2% | $187,618 | 7.0% | $23.72 |
| 2028 | 5 | 65,123 | 33.6% | 129,439 | 66.8% | $813,549 | 30.4% | $12.49 |
| 2029 | 0 | 0 | 0.0% | 129,439 | 66.8% | $0 | 0.0% | $0.00 |
| 2030 | 1 | 15,303 | 7.9% | 144,742 | 74.7% | $137,727 | 5.1% | $9.00 |
| 2031 | 2 | 17,453 | 9.0% | 162,195 | 83.7% | $232,034 | 8.7% | $13.29 |
| 2032 | 5 | 25,035 | 12.9% | 187,230 | 96.6% | $428,528 | 16.0% | $17.12 |
| 2033 | 0 | 0 | 0.0% | 187,230 | 96.6% | $0 | 0.0% | $0.00 |
| Thereafter | 0 | 0 | 0.0% | 187,230 | 96.6% | $0 | 0.0% | $0.00 |
| Vacant | 0 | 6,552 | 3.4% | 193,782 | 100.0% | $0 | 0.0% | $0.00 |
| Total/Weighted Average | 29 | 193,782 | 100.0% | $2,679,622 | 100.0% | $14.31 |
| (1) | Information obtained from the underwritten rent roll dated August 16, 2023. |
| (2) | Certain tenants may have lease termination options that are exercisable prior to the originally stated expiration date of the related lease and are not considered in the rollover schedule. |
| (3) | Weighted Average Annual U/W Base Rent PSF excludes vacant space. |
The following table presents historical occupancy percentages at the Gwinnett Marketfair Property:
Historical Occupancy
12/31/2020(1) | 12/31/2021(1) | 12/31/2022(1) | 8/16/2023(2) |
| 96.9% | 98.6% | 100.0% | 96.6% |
| (1) | Information obtained from the borrower. |
| (2) | Information obtained from the underwritten rent roll dated August 16, 2023. |
| THE INFORMATION IN THIS STRUCTURAL AND COLLATERAL TERM SHEET IS NOT COMPLETE AND MAY BE AMENDED PRIOR TO THE TIME OF SALE. THIS TERM SHEET IS NOT AN OFFER TO SELL THESE SECURITIES AND IT IS NOT A SOLICITATION OF AN OFFER TO BUY THESE SECURITIES IN ANY JURISDICTION WHERE THE OFFER OR SALE IS NOT PERMITTED. | ||
| 157 | ||
| Retail – Anchored | Loan #13 | Cut-off Date Balance: | $25,400,000 | |
| 3675 Satellite Boulevard | Gwinnett Marketfair | Cut-off Date LTV: | 63.8% | |
| Duluth, GA 30096 | U/W NCF DSCR: | 1.43x | ||
| U/W NOI Debt Yield: | 10.4% |
Operating History and Underwritten Net Cash Flow. The following table presents certain information relating to the historical operating performance and underwritten net cash flow at the Gwinnett Marketfair Property:
Cash Flow Analysis
| 2020 | 2021 | 2022 | TTM 6/30/2023 | U/W | % (1) | U/W $ per SF | |
| Base Rent | $2,429,331 | $2,502,313 | $2,652,540 | $2,713,627 | $2,679,622(2) | 75.6 | $13.83 |
| Grossed Up Vacant Space | 0 | 0 | 0 | 0 | 106,763 | 3.0 | 0.55 |
| Gross Potential Rent | $2,429,331 | $2,502,313 | $2,652,540 | $2,713,627 | $2,786,385 | 78.6% | $14.38 |
| Other Income(3) | 38,775 | 65,801 | 81,353 | 72,518 | 68,303 | 1.9 | 0.35 |
| Total Recoveries | 759,472 | 754,185 | 732,961 | 751,046 | 689,534 | 19.5 | $3.56 |
| Net Rental Income | $3,227,578 | $3,322,299 | $3,466,854 | $3,537,191 | $3,544,222 | 100.0% | $18.29 |
| (Vacancy & Credit Loss) | 0 | 0 | 0 | (6,181) | (139,319) | (5.0)(4) | (0.72) |
| Effective Gross Income | $3,227,578 | $3,322,299 | $3,466,854 | $3,531,010 | $3,404,903 | 96.1% | $17.57 |
| Real Estate Taxes | 403,970 | 372,250 | 325,285 | 325,285 | 334,757 | 9.8 | 1.73 |
| Insurance | 37,294 | 47,185 | 51,412 | 58,134 | 55,233 | 1.6 | 0.29 |
| Management Fee | 139,435 | 151,500 | 149,915 | 149,242 | 102,147 | 3.0 | 0.53 |
| Other Operating Expenses | 243,653 | 251,304 | 254,852 | 301,192 | 269,116 | 7.9 | 1.39 |
| Total Operating Expenses | $824,352 | $822,239 | $781,464 | $833,853 | $761,253 | 22.4% | $3.93 |
| Net Operating Income | $2,403,226 | $2,500,060 | $2,685,390 | $2,697,157 | $2,643,650 | 77.6% | $13.64 |
| Replacement Reserves | 0 | 0 | 0 | 0 | 38,756 | 1.1 | 0.20 |
| TI/LC | 0 | 0 | 0 | 0 | 36,891(5) | 1.1 | 0.19 |
| Net Cash Flow | $2,403,226 | $2,500,060 | $2,685,390 | $2,697,157 | $2,568,003 | 75.4% | $13.25 |
| NOI DSCR | 1.34x | 1.39x | 1.50x | 1.50x | 1.47x | ||
| NCF DSCR | 1.34x | 1.39x | 1.50x | 1.50x | 1.43x | ||
| NOI Debt Yield | 9.5% | 9.8% | 10.6% | 10.6% | 10.4% | ||
| NCF Debt Yield | 9.5% | 9.8% | 10.6% | 10.6% | 10.1% |
| (1) | Represents (i) percent of Net Rental Income for all revenue fields, (ii) percent of Gross Potential Rent for Vacancy & Credit Loss and (iii) percent of Effective Gross Income for all other fields. |
| (2) | The U/W Base Rent includes contractual rent steps totaling $20,752 through August 2024. |
| (3) | Represents percentage rent, billboard sign rental and various tenant fees. |
| (4) | The underwritten economic vacancy is 5.0%. The Gwinnett Marketfair Property was 96.6% leased as of August 16, 2023. |
| (5) | Inclusive of 1/10th credit for the $600,000 upfront TI/LC reserve. |
Appraisal. The appraiser concluded to an “as-is” appraised value for the Gwinnett Marketfair Property of $39,800,000 as of May 16, 2023.
Environmental Matters. A Phase I environmental site assessment (“ESA”) dated May 22, 2023 revealed no evidence of recognized environmental conditions or controlled recognized environmental conditions, at the Gwinnett Marketfair Property.
Market Overview and Competition. The Gwinnett Marketfair Property is located in Duluth, Georgia, approximately 23.7 miles northeast of Atlanta. Primary access to the area is provided by the Northwest Expressway (Interstate 85). The Gwinnett Marketfair Property has visibility from Pleasant Hill Road, which provides direct access to the Gwinnett Marketfair Property from the Northeast Expressway, with an on-ramp less than 1 mile from the Gwinnett Marketfair Property. The surrounding area contains a mix of commercial and residential properties. Major employers in the area include Gwinnett County Public Schools, Gwinnett County Government, Northside Hospital, Publix, and Walmart.
According to the appraisal, the estimated 2023 population within a one-, three- and five-mile radius was approximately 11,103, 93,411, and 258,141, respectively, and the average household income within the same radii was $74,573, $81,616, and $95,488, respectively.
According to a third-party market research report, the Gwinnett Marketfair Property is located within the Gwinnett Mall/Duluth submarket of the greater Atlanta retail market. As of the second quarter 2023, the submarket reported total inventory of approximately 19.0 million square feet with a 7.8% vacancy rate and average asking rent of $23.08 per square foot. Additionally, according to a third-party market research provider, there is 46,940 square feet currently proposed in the retail submarket over the next eight quarters. The appraiser concluded to market rents for the Gwinnett Marketfair Property, ranging from $10.00 per square foot for junior anchor, to $25.00 per square foot for inline space.
| THE INFORMATION IN THIS STRUCTURAL AND COLLATERAL TERM SHEET IS NOT COMPLETE AND MAY BE AMENDED PRIOR TO THE TIME OF SALE. THIS TERM SHEET IS NOT AN OFFER TO SELL THESE SECURITIES AND IT IS NOT A SOLICITATION OF AN OFFER TO BUY THESE SECURITIES IN ANY JURISDICTION WHERE THE OFFER OR SALE IS NOT PERMITTED. | ||
| 158 | ||
| Retail – Anchored | Loan #13 | Cut-off Date Balance: | $25,400,000 | |
| 3675 Satellite Boulevard | Gwinnett Marketfair | Cut-off Date LTV: | 63.8% | |
| Duluth, GA 30096 | U/W NCF DSCR: | 1.43x | ||
| U/W NOI Debt Yield: | 10.4% |
The following table presents certain information relating to the appraiser’s market rent conclusions for the Gwinnett Marketfair Property:
Market Rent Summary(1)
| Inline | Jr. Anchor | |
| Market Rent (PSF) | $25.00 | $10.00 |
| Lease Term (Years) | 5 | 10 |
Lease Type (Reimbursements) | NNN | NNN |
| Rent Increase Projection | 2.0%/year | 2.0%/year |
| Tenant Improvements (New / Renewal) | $35.00 / $10.00 | $5.00 / $1.00 |
| Leasing Commissions (New / Renewal) | 6.0% / 3.0% | 6.0% / 3.0% |
| Free Rent Months (New / Renewal) | 0 / 0 | 0 / 0 |
| (1) | Information obtained from the appraisal. |
The table below presents certain information relating to comparable sales pertaining to the Gwinnett Marketfair Property, as identified by the appraiser:
Comparable Sales(1)
Property Name | Location | Year Built/Renovated | Rentable Area (SF) | Occupancy | Sale Date | Sale Price | Sale Price (PSF) |
| Gwinnett Marketfair | 3675 Satellite Boulevard Duluth, GA | 1987/NAP | 193,782(2) | 96.6%(2) | |||
| Kennesaw Walk Shopping Center | 2090 Baker Road Kennesaw, GA | 2004/NAP | 57,800 | 100.0% | 12/2022 | $11,041,635 | $191 |
| Hamilton Crossing | 2725 Hamilton Mill Road Buford, GA | 2006/NAP | 48,470 | 100.0% | 8/2022 | $12,500,000 | $258 |
| Shops at Old Milton | 4150 Old Milton Parkway Alpharetta, GA | 2007/NAP | 48,615 | 96.0% | 7/2022 | $11,500,000 | $237 |
| Poplin Place Shopping Center | 2875 West Highway 74 Monroe, NC | 2005/NAP | 196,462 | 100.0% | 3/2022 | $34,500,000 | $176 |
| Overlook Village | 80 South Tunnel Road Asheville, NC | 1989/1993 | 153,820 | 100.0% | 7/2021 | $28,350,000 | $184 |
| Coleman Village | 880 Marietta Highway Roswell, GA | NAV | 90,958 | 100.0% | 6/2021 | $20,750,000 | $228 |
| (1) | Information obtained from the appraisal. |
| (2) | Information obtained from the underwritten rent roll dated August 16, 2023. |
| THE INFORMATION IN THIS STRUCTURAL AND COLLATERAL TERM SHEET IS NOT COMPLETE AND MAY BE AMENDED PRIOR TO THE TIME OF SALE. THIS TERM SHEET IS NOT AN OFFER TO SELL THESE SECURITIES AND IT IS NOT A SOLICITATION OF AN OFFER TO BUY THESE SECURITIES IN ANY JURISDICTION WHERE THE OFFER OR SALE IS NOT PERMITTED. | ||
| 159 | ||
| No. 14 – Princeton ND Portfolio |
| Mortgage Loan Information | Mortgaged Property Information | ||||||
| Mortgage Loan Seller: | Argentic Real Estate Finance 2 LLC | Single Asset/Portfolio: | Portfolio | ||||
| Credit Assessment (Fitch/KBRA/Moody’s): | NR/NR/NR | Property Type – Subtype: | Multifamily – Garden | ||||
| Original Principal Balance: | $24,800,000 | Location: | Various, ND | ||||
| Cut-off Date Balance: | $24,800,000 | Size: | 603 Units | ||||
| % of Initial Pool Balance: | 2.7% | Cut-off Date Balance Per Unit: | $41,128 | ||||
| Loan Purpose: | Refinance | Maturity Date Balance Per Unit: | $41,128 | ||||
| Borrower Sponsor: | Matthew B. Lester | Year Built/Renovated: | Various/NAP | ||||
| Guarantor: | Matthew B. Lester | Title Vesting: | Fee | ||||
| Mortgage Rate: | 7.7960% | Property Manager: | Princeton Enterprises L.L.C. | ||||
| Note Date: | November 13, 2023 | Current Occupancy (As of): | 94.7% (10/23/2023) | ||||
| Seasoning: | 0 months | YE 2022 Occupancy: | 90.4% | ||||
| Maturity Date: | December 6, 2033 | YE 2021 Occupancy(1): | NAV | ||||
| IO Period: | 120 months | YE 2020 Occupancy(1): | NAV | ||||
| Loan Term (Original): | 120 months | YE 2019 Occupancy(1): | NAV | ||||
| Amortization Term (Original): | NAP | As-Is Appraised Value: | $39,680,000 | ||||
| Loan Amortization Type: | Interest Only | As-Is Appraised Value Per Unit: | $65,804 | ||||
| Call Protection: | L(24),D(92),O(4) | As-Is Appraisal Valuation Date: | Various | ||||
| Lockbox Type: | Springing | ||||||
| Additional Debt: | None | Underwriting and Financial Information | |||||
| Additional Debt Type (Balance): | NAP | TTM NOI (9/30/2023): | $2,806,846 | ||||
| YE 2022 NOI: | $2,188,182 | ||||||
| YE 2021 NOI(1): | NAV | ||||||
| YE 2020 NOI(1): | NAV | ||||||
| U/W Revenues: | $6,508,494 | ||||||
| U/W Expenses: | $3,388,274 | ||||||
| U/W NOI: | $3,120,220 | ||||||
| Escrows and Reserves | U/W NCF: | $2,956,611 | |||||
| Initial | Monthly | Cap | U/W DSCR based on NOI/NCF: | 1.59x / 1.51x | |||
| Taxes: | $173,066 | $38,459 | NAP | U/W Debt Yield based on NOI/NCF: | 12.6% / 11.9% | ||
| Insurance: | $89,495 | $29,832 | NAP | U/W Debt Yield at Maturity based on NOI/NCF: | 12.6% / 11.9% | ||
| Deferred Maintenance: | $88,585 | $0 | NAP | Cut-off Date LTV Ratio: | 62.5% | ||
| Replacement Reserve: | $0 | $13,618 | NAP | LTV Ratio at Maturity: | 62.5% | ||
| Environmental Reserve: | $13,700 | $0 | NAP | ||||
| Sources and Uses | ||||||||
| Sources | Uses | |||||||
| Original Loan Amount | $24,800,000 | 99.7 | % | Loan Payoff | $23,160,722 | 93.2 | % | |
| Borrower Equity Contribution | 62,997 | 0.3 | Closing Costs(2) | 1,337,428 | 5.4 | |||
| Upfront Reserves | 364,846 | 1.4 | ||||||
| Total Sources | $24,862,997 | 100.0 | % | Total Uses: | $24,862,997 | 100.0 | % | |
| (1) | Historical occupancy and NOI for 2019, 2020, and 2021 are unavailable as the borrower acquired the Princeton ND Portfolio Properties (as defined below) between 2018 and 2022. |
| (2) | Closing Costs include a $620,000 origination fee. |
The Mortgage Loan. The fourteenth largest mortgage loan (the “Princeton ND Portfolio Mortgage Loan”) is evidenced by one promissory note in the original principal balance of $24,800,000. The Princeton ND Portfolio Mortgage Loan is secured by a first priority fee mortgage encumbering seven multifamily properties located across North Dakota (the “Princeton ND Portfolio Properties”).
The Properties. The Princeton ND Portfolio Properties are comprised of seven multifamily properties totaling 603 units located in various cities across northwestern North Dakota. The Princeton ND Portfolio Properties were constructed between 2010 and 2015. The borrower acquired the Princeton ND Portfolio Properties between 2018 and 2022. As of October 23, 2023, the Princeton ND Portfolio Properties were 94.7% occupied in aggregate. The Princeton ND Portfolio Properties comprise 200 one-bedroom units (33.2% of unit count), 369 two-bedroom units (61.2% of unit count), and 34 three-bedroom units (5.6% of unit count).
| THE INFORMATION IN THIS STRUCTURAL AND COLLATERAL TERM SHEET IS NOT COMPLETE AND MAY BE AMENDED PRIOR TO THE TIME OF SALE. THIS TERM SHEET IS NOT AN OFFER TO SELL THESE SECURITIES AND IT IS NOT A SOLICITATION OF AN OFFER TO BUY THESE SECURITIES IN ANY JURISDICTION WHERE THE OFFER OR SALE IS NOT PERMITTED. | ||
| 160 | ||
| Multifamily – Garden | Loan #14 | Cut-off Date Balance: | $24,800,000 | |
| Various | Princeton ND Portfolio | Cut-off Date LTV: | 62.5% | |
| Various, ND | U/W NCF DSCR: | 1.51x | ||
| U/W NOI Debt Yield: | 12.6% |
The following table presents detailed information with respect to the Princeton ND Portfolio Properties:
Princeton ND Portfolio Properties Summary
| Building | Occ. % (1) | Year Built(2) | Units(1) | % of Total Units(1) | Appraised Value(2) | Allocated Loan Amount (“ALA”) | % of ALA | U/W NOI | % of U/W NOI |
| Timber Cove | 94.0% | 2013 | 168 | 27.9% | $9,310,000 | $6,018,000 | 24.3% | $792,847 | 25.4% |
| Custer Crossing and Raven Wood | 95.2% | 2012; 2013 | 124 | 20.6% | $8,730,000 | $4,848,000 | 19.5% | $645,831 | 20.7% |
| Raven Ridge | 95.2% | 2012 | 126 | 20.9% | $9,040,000 | $4,761,000 | 19.2% | $604,457 | 19.4% |
| Fox Run | 98.7% | 2015 | 77 | 12.8% | $5,300,000 | $3,879,000 | 15.6% | $465,629 | 14.9% |
| Killdeer Highlands | 97.6% | 2015 | 42 | 7.0% | $3,050,000 | $2,342,000 | 9.4% | $283,992 | 9.1% |
| Bakken Ridge | 92.9% | 2014 | 42 | 7.0% | $2,710,000 | $1,629,000 | 6.6% | $213,027 | 6.8% |
| Creekside Cottages | 79.2% | 2010 | 24 | 4.0% | $1,540,000 | $1,323,000 | 5.3% | $114,437 | 3.7% |
| Total/Wtd. Avg. | 94.7% | 603 | 100.0% | $39,680,000 | $24,800,000 | 100.0% | $3,120,220 | 100.0% |
| (1) | Based on the underwritten rent roll dated October 23, 2023. |
| (2) | Information obtained from the appraisal. |
The following table presents certain information relating to the tenancy at the Princeton ND Portfolio Properties:
Portfolio Unit Mix(1)
| Building | NRA | Units | One Bedroom | Two Bedroom | Three Bedroom |
| Timber Cove | 166,440 | 168 | 60 | 100 | 8 |
| Custer Crossing and Raven Wood | 135,787 | 124 | 27 | 91 | 6 |
| Raven Ridge | 124,830 | 126 | 45 | 75 | 6 |
| Fox Run | 72,215 | 77 | 34 | 37 | 6 |
| Killdeer Highlands | 43,385 | 42 | 15 | 25 | 2 |
| Bakken Ridge | 41,014 | 42 | 11 | 25 | 6 |
| Creekside Cottages | 13,440 | 24 | 8 | 16 | 0 |
| Total/Wtd. Avg. | 597,111 | 603 | 200 | 369 | 34 |
| (1) | Based on the underwritten rent roll dated October 23, 2023. |
The following table presents historical occupancy percentages at the Princeton ND Portfolio Properties:
Historical Occupancy
12/31/2020(1) | 12/31/2021(1) | 12/31/2022(2) | 10/23/2023(3) |
| NAV | NAV | 90.4% | 94.7% |
| (1) | Historical occupancy for 2020 and 2021 are not available as the borrower acquired the Princeton ND Portfolio Properties between 2018 and 2022. |
| (2) | Information obtained from Princeton ND Portfolio borrowers. |
| (3) | Information obtained from the underwritten rent roll. |
| THE INFORMATION IN THIS STRUCTURAL AND COLLATERAL TERM SHEET IS NOT COMPLETE AND MAY BE AMENDED PRIOR TO THE TIME OF SALE. THIS TERM SHEET IS NOT AN OFFER TO SELL THESE SECURITIES AND IT IS NOT A SOLICITATION OF AN OFFER TO BUY THESE SECURITIES IN ANY JURISDICTION WHERE THE OFFER OR SALE IS NOT PERMITTED. | ||
| 161 | ||
| Multifamily – Garden | Loan #14 | Cut-off Date Balance: | $24,800,000 | |
| Various | Princeton ND Portfolio | Cut-off Date LTV: | 62.5% | |
| Various, ND | U/W NCF DSCR: | 1.51x | ||
| U/W NOI Debt Yield: | 12.6% |
Market Overview and Competition. The Princeton ND Portfolio Properties are located in five cities across northwestern North Dakota near the Bakken and Three Forks Oil Formations.
The Bakken Ridge and Creekside Cottages properties are located in McKenzie County, in Watford City, North Dakota within an area generally described as the Bakken. The Bakken refers to the grouping of counties most affected by oil activity in Western North Dakota and Eastern Montana. As of October 2023, the McKenzie County multifamily market had an inventory of 3,472 units, a vacancy rate of 11.7%, and an average rent per unit of $1,184.
According to the appraisal, the estimated 2023 population within a one-, three-, and five-mile radius for the Bakken Ridge property is 3,323, 7,054, and 7,985, respectively. Additionally, for the same period, the average household income within a one-, three-, and five-mile radius was $108,448, $115,178, and $119,442.
According to the appraisal, the estimated 2023 population within a one-, three-, and five-mile radius for the Creekside Cottages property is 2,490, 7,215, and 8,046, respectively. Additionally, for the same period, the average household income within a one-, three-, and five-mile radius was $110,513, $115,580, and $119,402.
The Custer Crossing and Raven Wood property is located in Dickinson, North Dakota within the Stark County multifamily market. As of October 2023, the Stark County multifamily market had an inventory of 3,161 units, a vacancy rate of 7.8%, and an average rent per unit of $945. According to the appraisal, the estimated 2023 population within a one-, three-, and five-mile radius is 4,466, 24,233, and 28,363, respectively. Additionally, for the same period, the average household income within a one-, three-, and five-mile radius was $98,485, $88,117, and $88,460.
The Fox Run property is located in New Town, North Dakota within the Mountrail County multifamily market. As of October 2023, the Mountrail County multifamily market had an inventory of 896 units, a vacancy rate of 11.9%, and an average rent per unit of $1,267. The estimated 2023 population within a one-, three-, and five-mile radius is 2,694, 3,090, and 3,684, respectively. Additionally, for the same period, the average household income within a one-, three-, and five-mile radius was $86,270, $88,425, and $87,521.
The Killdeer Highlands property is located just southwest of central Killdeer, north of Highway 22 in Killdeer, North Dakota within the Dunn County multifamily market. As of October 2023, the Dunn County multifamily market had an inventory of 2,518 units, a vacancy rate of 10.3%, and an average rent per unit of $1,097. According to the appraisal, the estimated 2023 population within a one-, three-, and five-mile radius is 592, 989, and 1,075, respectively. Additionally, for the same period, the average household income within a one-, three-, and five-mile radius was $121,804, $121,825, and $121,814.
The Raven Ridge property is located within the northern portion of the city of Dickinson in Stark County, North Dakota within Stark County multifamily market. As of October 2023, the Stark County multifamily market had an inventory of 3,161 units, a vacancy rate of 7.8%, and an average rent per unit of $945. According to the appraisal, the estimated 2023 population within a one-, three-, and five-mile radius is 4,565, 21,223, and 28,543, respectively. Additionally, for the same period, the average household income within a one-, three-, and five-mile radius was $76,904, $86,498, and $88,837.
The Timber Cove property is located in Tioga, North Dakota within the Williams County multifamily market. As of October 2023, the Williams County multifamily market had an inventory of 8,587 units, a vacancy rate of 9.9%, and an average rent per unit of $1,150. The estimated 2023 population within a one-, three-, and five-mile radius is 1,154, 2,470, and 2,576, respectively. Additionally, for the same period, the average household income within a one-, three-, and five-mile radius was $96,249, $96,511, and $97,213.
| THE INFORMATION IN THIS STRUCTURAL AND COLLATERAL TERM SHEET IS NOT COMPLETE AND MAY BE AMENDED PRIOR TO THE TIME OF SALE. THIS TERM SHEET IS NOT AN OFFER TO SELL THESE SECURITIES AND IT IS NOT A SOLICITATION OF AN OFFER TO BUY THESE SECURITIES IN ANY JURISDICTION WHERE THE OFFER OR SALE IS NOT PERMITTED. | ||
| 162 | ||
| Multifamily – Garden | Loan #14 | Cut-off Date Balance: | $24,800,000 | |
| Various | Princeton ND Portfolio | Cut-off Date LTV: | 62.5% | |
| Various, ND | U/W NCF DSCR: | 1.51x | ||
| U/W NOI Debt Yield: | 12.6% |
The following table presents certain information relating to the appraiser’s market rent conclusion for the Princeton ND Portfolio Properties:
Market Rent Summary
| Property | Units(1) | Avg. Size(1) | Avg. Monthly In Place Rent per Unit(1) | Avg. Monthly In Place Rent PSF(1) | Avg. Monthly Market Rent per Unit(2) | Avg. Monthly Market Rent PSF(2) |
| Timber Cove | 168 | 991 | $810 | $0.82 | $824 | $0.83 |
| Custer Crossing and Raven Wood | 124 | 1,095 | $929 | $0.85 | $1,071 | $0.98 |
| Raven Ridge | 126 | 991 | $954 | $0.96 | $1,025 | $1.03 |
| Fox Run | 77 | 938 | $951 | $1.01 | $1,031 | $1.10 |
| Killdeer Highlands | 42 | 1,033 | $963 | $0.93 | $988 | $0.96 |
| Bakken Ridge | 42 | 977 | $945 | $0.97 | $962 | $0.99 |
| Creekside Cottages | 24 | 560 | $859 | $1.53 | $884 | $1.58 |
| Total/Wtd. Average | 603 | 990 | $905 | $0.91 | $967 | $0.98 |
| (1) | Based on contract rent per the underwritten rent roll dated October 23, 2023. |
| (2) | Based on Appraisal’s concluded market rent. |
Operating History and Underwritten Net Cash Flow. The following table presents certain information relating to the operating history and underwritten net cash flow at the Princeton ND Portfolio Properties:
Cash Flow Analysis
| 2022 | TTM 9/30/2023 | U/W | %(1) | U/W $ per Unit | ||
| Base Rent | $4,685,395 | $5,563,981 | $6,564,302 | 94.9% | $10,886 | |
| Other Income(2) | 283,199 | 353,855 | 353,855 | 5.1 | 587 | |
| Net Rental Income | $4,968,594 | $5,917,836 | $6,918,157 | 100.0 | % | $11,473 |
| (Vacancy & Credit Loss) | 0 | 0 | (409,663) | (6.2) |
| (679) |
| Effective Gross Income | $4,968,594 | $5,917,836 | $6,508,494 | 94.1 | % | $10,794 |
| Real Estate Taxes | 203,585 | 336,351 | 452,768 | 7.0 | $751 | |
| Insurance | 239,744 | 281,146 | 357,982 | 5.5 | 594 | |
| Management Fee | 87,128 | 111,224 | 195,255 | 3.0 | 324 | |
| Other Operating Expenses | 2,249,955 | 2,382,269 | 2,382,269 | 36.6 |
| 3,951 |
| Total Operating Expenses | $2,780,412 | $3,110,990 | $3,388,274 | 52.1 | % | $5,619 |
| Net Operating Income | $2,188,182 | $2,806,846 | $3,120,220 | 47.9 | % | $5,174 |
| Capital Expenditures | 0 | 0 | 163,610 | 2.5 |
| 271 |
| Net Cash Flow | $2,188,182 | $2,806,846 | $2,956,611 | 45.4 | % | $4,903 |
| NOI DSCR | 1.12x | 1.43x | 1.59x | |||
| NCF DSCR | 1.12x | 1.43x | 1.51x | |||
| NOI Debt Yield | 8.8% | 11.3% | 12.6% | |||
| NCF Debt Yield | 8.8% | 11.3% | 11.9% | |||
| (1) | Represents (i) percent of Net Rental Income for all revenue fields, (ii) percent of Net Rental Income for Vacancy & Credit Loss and (iii) percent of Effective Gross Income for all other fields. |
| (2) | Other Income is comprised of damage fees, pet fees, application fees, and other miscellaneous fees. |
| THE INFORMATION IN THIS STRUCTURAL AND COLLATERAL TERM SHEET IS NOT COMPLETE AND MAY BE AMENDED PRIOR TO THE TIME OF SALE. THIS TERM SHEET IS NOT AN OFFER TO SELL THESE SECURITIES AND IT IS NOT A SOLICITATION OF AN OFFER TO BUY THESE SECURITIES IN ANY JURISDICTION WHERE THE OFFER OR SALE IS NOT PERMITTED. | ||
| 163 | ||
| No. 15 – Rockwall Market Center |
| Mortgage Loan Information | Mortgaged Property Information | ||||||
| Mortgage Loan Seller: | Argentic Real Estate Finance 2 LLC | Single Asset/Portfolio: | Single Asset | ||||
| Credit Assessment (Fitch/KBRA/Moody’s): | NR/NR/NR | Property Type – Subtype: | Retail – Anchored | ||||
| Original Principal Balance: | $22,100,000 | Location: | Rockwall, TX | ||||
| Cut-off Date Balance: | $22,100,000 | Size: | 211,971 SF | ||||
| % of Initial Pool Balance: | 2.4% | Cut-off Date Balance Per SF: | $104.26 | ||||
| Loan Purpose: | Acquisition | Maturity Date Balance Per SF: | $104.26 | ||||
| Borrower Sponsor: | Mark Hutchinson | Year Built/Renovated: | 1999/NAP | ||||
| Guarantor: | Mark Hutchinson | Title Vesting: | Fee | ||||
| Mortgage Rate: | 7.1960% | Property Manager: | Dunhill Property Management Services, Inc. | ||||
| Note Date: | August 17, 2023 | Current Occupancy (As of): | 100.0% (7/10/2023) | ||||
| Seasoning: | 3 months | YE 2022 Occupancy: | 100.0% | ||||
| Maturity Date: | September 6, 2033 | YE 2021 Occupancy: | 94.0% | ||||
| IO Period: | 120 months | YE 2020 Occupancy: | 94.0% | ||||
| Loan Term (Original): | 120 months | YE 2019 Occupancy: | NAV | ||||
| Amortization Term (Original): | NAP | As-Is Appraised Value: | $33,500,000 | ||||
| Loan Amortization Type: | Interest Only | As-Is Appraised Value Per SF: | $158.04 | ||||
| Call Protection: | L(27), D(89),O(4) | As-Is Appraisal Valuation Date: | July 7, 2023 | ||||
| Lockbox Type: | Hard/Springing Cash Management | Underwriting and Financial Information | |||||
| Additional Debt: | Yes | TTM NOI (6/30/2023): | $2,776,969 | ||||
| Additional Debt Type (Balance): | Future Mezzanine | YE 2022 NOI: | $2,693,755 | ||||
| YE 2021 NOI: | $2,656,149 | ||||||
| YE 2020 NOI: | $2,378,493 | ||||||
| U/W Revenues: | $3,826,805 | ||||||
| U/W Expenses: | $1,127,528 | ||||||
| Escrows and Reserves | U/W NOI: | $2,699,277 | |||||
| Initial | Monthly | Cap | U/W NCF: | $2,558,503 | |||
| Taxes: | $281,252 | $31,250 | NAP | U/W DSCR based on NOI/NCF: | 1.67x / 1.59x | ||
| Insurance: | $65,480 | $8,185 | NAP | U/W Debt Yield based on NOI/NCF: | 12.2% / 11.6% | ||
| Replacement Reserve: | $0 | $2,650 | NAP | U/W Debt Yield at Maturity based on NOI/NCF: | 12.2% / 11.6% | ||
| TI/LC Reserve: | $500,000 | $13,248 | NAP | Cut-off Date LTV Ratio: | 66.0% | ||
| Unfunded Obligations Reserve: | $28,944 | $0 | NAP | LTV Ratio at Maturity: | 66.0% | ||
| Sources and Uses | ||||||||
| Sources | Uses | |||||||
| Original Loan Amount | $22,100,000 | 64.6 | % | Purchase Price | $32,400,000 | 94.8 | % | |
| Borrower Equity Contribution | 12,093,745 | 35.4 | Closing Costs | 918,068 | 2.7 | |||
| Upfront Reserves | 875,677 | 2.6 | ||||||
| Total Sources | $34,193,745 | 100.0 | % | Total Uses | $34,193,745 | 100.0 | % | |
The Mortgage Loan. The fifteenth largest mortgage loan (the “Rockwall Market Center Mortgage Loan”) is evidenced by one promissory note in the original principal balance of $22,100,000. The Rockwall Market Center Mortgage Loan is secured by a first priority fee mortgage encumbering an anchored retail property located in Rockwall, Texas (the “Rockwall Market Center Property”).
The Property. The Rockwall Market Center Property is a 211,971 square foot anchored retail property located in Rockwall, Texas approximately 25 miles northeast of downtown Dallas. The improvements consist of three buildings situated on a 21.42-acre parcel constructed in 1999. The Rockwall Market Center Property consists of 144,371 square feet (68.1% of NRA) of anchor retail space, 63,232 square feet (29.8% of NRA) of in-line retail space, and 4,368 square feet (2.1% of NRA) of storage space. The anchor space is primarily occupied by national tenants including Bealls, Ross Dress For Less, Michael’s, Office Max, Old Navy, and Petco. Additionally, the Rockwall Market Center Property is shadow anchored by a Home Depot. The Rockwall Market Center Property features 1,094 surface parking spaces, resulting in a parking ratio of 5.2 spaces per 1,000 square feet.
As of July 10, 2023, the Rockwall Market Center Property was 100.0% leased to 22 tenants. Since 2020, occupancy has averaged approximately 97%. Furthermore, 12 tenants occupying 139,657 square feet (65.9% of NRA) have been in occupancy since at least 2000, including five of the six anchor tenants.
Major Tenants.
| THE INFORMATION IN THIS STRUCTURAL AND COLLATERAL TERM SHEET IS NOT COMPLETE AND MAY BE AMENDED PRIOR TO THE TIME OF SALE. THIS TERM SHEET IS NOT AN OFFER TO SELL THESE SECURITIES AND IT IS NOT A SOLICITATION OF AN OFFER TO BUY THESE SECURITIES IN ANY JURISDICTION WHERE THE OFFER OR SALE IS NOT PERMITTED. | ||
| 164 | ||
| Retail – Anchored | Loan #15 | Cut-off Date Balance: | $22,100,000 | |
| 2663-2853 Market Center Drive | Rockwall Market Center | Cut-off Date LTV: | 66.0% | |
| Rockwall, TX 75032 | U/W NCF DSCR: | 1.59x | ||
| U/W NOI Debt Yield: | 12.2% |
Bealls (f/k/a Burkes Outlet) (34,027 square feet; 16.1% of net rentable area; 6.8% of underwritten base rent) – The largest tenant, Bealls, is a retail chain that offers apparel and home decor. Bealls is a subsidiary of Bealls, Inc., which was founded in 1915, employs over 14,000 people, and is headquartered in Bradenton, Florida. Bealls Inc. operates over 650 stores primarily in the Southeast and Midwest regions. Bealls has been a tenant at the Rockwall Market Center Property since September 2013 when it signed a 125-month lease. In June 2023, the tenant extended its lease by an additional five years to its current expiration in January 2029. The tenant has two, 5-year renewal options remaining.
Ross Dress For Less (30,187 square feet; 14.2% of net rentable area; 9.2% of underwritten base rent; Fitch/Moody’s/S&P: NR/A2/BBB+) – The second largest tenant, Ross Dress For Less (Nasdaq: ROST), is a retail chain that offers apparel, home decor, and electronics. The company was founded in 1957 and operates approximately 1,765 stores. Ross Dress For Less has been a tenant at the Rockwall Market Center Property since February 2000 when it signed a lease expiring in January 2011. The tenant has renewed its lease three times and has a current lease expiration in January 2026. The tenant has two, 5-year renewal options remaining.
Michael’s (23,988 square feet; 11.3% of net rentable area; 10.1% of underwritten base rent)– The third largest tenant, Michael’s, is a retail chain that specializes in arts and crafts supplies, as well as home decor and seasonal merchandise. The company was founded in 1973 and operates over 1,290 stores. Michael’s has been a tenant at the Rockwall Market Center Property since January 1999 when it signed a 120-month lease. The tenant has renewed its lease three times and has a current lease expiration in February 2025. The tenant has one, 5-year renewal option remaining.
The following table presents certain information relating to the tenancy at the Rockwall Market Center Property:
Major Tenants
| Tenant Name | Credit Rating (Fitch/Moody’s/ S&P)(1) | Tenant NRSF | % of NRSF | Annual U/W Base Rent PSF(2) | Annual U/W Base Rent(2) | % of Total Annual U/W Base Rent | Lease Expiration Date | Extension Options | Termination Option (Y/N)(3) |
| Major Tenants | |||||||||
| Bealls (f/k/a Burke’s Outlet) | NR/NR/NR | 34,027 | 16.1% | $6.05 | $205,863 | 6.8% | 1/31/2029 | 2, 5-year | N |
| Ross Dress For Less | NR/A2/BBB+ | 30,187 | 14.2% | $9.25 | $279,230 | 9.2% | 1/31/2026 | 2, 5-year | N |
| Michael's | NR/NR/NR | 23,988 | 11.3% | $12.70 | $304,648 | 10.1% | 2/28/2025 | 1, 5-year | N |
| Office Max | NR/NR/NR | 23,600 | 11.1% | $11.45 | $270,220 | 8.9% | 10/31/2024 | 3, 5-year | N |
| Old Navy | NR/NR/NR | 17,239 | 8.1% | $12.00 | $206,868 | 6.8% | 1/31/2025 | 2, 5-year | N |
| Total Major Tenants | 129,041 | 60.9% | $9.82 | $1,266,829 | 41.9% | ||||
| Non-Major Tenants | 82,930 | 39.1% | $21.22 | $1,760,116 | 58.1% | ||||
| Occupied Collateral Total | 211,971 | 100.0% | $14.28 | $3,026,945 | 100.0% | ||||
| Vacant Space | 0 | 0.0% | |||||||
| Collateral Total | 211,971 | 100.0% | |||||||
| (1) | In certain instances, credit ratings shown are those of the parent company of the entity shown, whether or not the parent company guarantees the lease. |
| (2) | Annual U/W Base Rent PSF and Annual U/W Base Rent include contractual rent steps through May 2024 totalling $60,062. |
| (3) | Certain tenants may have termination options tied to co-tenancy clauses. These have not been considered with respect to Termination Option (Y/N). |
| THE INFORMATION IN THIS STRUCTURAL AND COLLATERAL TERM SHEET IS NOT COMPLETE AND MAY BE AMENDED PRIOR TO THE TIME OF SALE. THIS TERM SHEET IS NOT AN OFFER TO SELL THESE SECURITIES AND IT IS NOT A SOLICITATION OF AN OFFER TO BUY THESE SECURITIES IN ANY JURISDICTION WHERE THE OFFER OR SALE IS NOT PERMITTED. | ||
| 165 | ||
| Retail – Anchored | Loan #15 | Cut-off Date Balance: | $22,100,000 | |
| 2663-2853 Market Center Drive | Rockwall Market Center | Cut-off Date LTV: | 66.0% | |
| Rockwall, TX 75032 | U/W NCF DSCR: | 1.59x | ||
| U/W NOI Debt Yield: | 12.2% |
The following table presents certain information relating to the lease rollover schedule at the Rockwall Market Center Property:
Lease Expiration Schedule(1)(2)
| Year Ending December 31, | No. of Leases Expiring | Expiring NRSF | % of Total NRSF | Cumulative Expiring NRSF | Cumulative % of Total NRSF | Annual U/W Base Rent(3) | % of Total Annual U/W Base Rent(3) | Annual U/W Base Rent PSF(3) | |||
| MTM | 1 | 4,368 | 2.1% | 4,368 | 2.1% | $4,800 | 0.2% | $1.10 | |||
| 2023 | 0 | 0 | 0.0% | 4,368 | 2.1% | $0 | 0.0% | $0.00 | |||
| 2024 | 5 | 34,460 | 16.3% | 38,828 | 18.3% | $627,231 | 20.7% | $18.20 | |||
| 2025 | 4 | 64,477 | 30.4% | 103,305 | 48.7% | $868,774 | 28.7% | $13.47 | |||
| 2026 | 4 | 34,973 | 16.5% | 138,278 | 65.2% | $407,775 | 13.5% | $11.66 | |||
| 2027 | 2 | 8,546 | 4.0% | 146,824 | 69.3% | $236,863 | 7.8% | $27.72 | |||
| 2028 | 0 | 0 | 0.0% | 146,824 | 69.3% | $0 | 0.0% | $0.00 | |||
| 2029 | 2 | 38,163 | 18.0% | 184,987 | 87.3% | $301,405 | 10.0% | $7.90 | |||
| 2030 | 0 | 0 | 0.0% | 184,987 | 87.3% | $0 | 0.0% | $0.00 | |||
| 2031 | 1 | 5,561 | 2.6% | 190,548 | 89.9% | $189,074 | 6.2% | $34.00 | |||
| 2032 | 2 | 12,023 | 5.7% | 202,571 | 95.6% | $226,523 | 7.5% | $18.84 | |||
| 2033 | 1 | 9,400 | 4.4% | 211,971 | 100.0% | $164,500 | 5.4% | $17.50 | |||
| Thereafter | 0 | 0 | 0.0% | 211,971 | 100.0% | $0 | 0.0% | $0.00 | |||
| Vacant | 0 | 0 | 0.0% | 211,971 | 100.0% | $0 | 0.0% | $0.00 | |||
| Total/Weighted Average | 22 | 211,971 | 100.0% | $3,026,945 | 100.0% | $14.28 | |||||
| (1) | Information obtained from the underwritten rent roll dated July 10, 2023. |
| (2) | Certain tenants may have lease termination options that are exercisable prior to the originally stated expiration date of the subject lease and that are not considered in the Lease Expiration Schedule. |
| (3) | Includes contractual rent steps through May 2024. |
The following table presents historical occupancy percentages at the Rockwall Market Center Property:
Historical Occupancy
12/31/2020(1) | 12/31/2021(1) | 12/31/2022(1) | 7/10/2023(2) |
| 94.0% | 94.0% | 100.0% | 100.0% |
| (1) | Information obtained from the Rockwall Market Center borrower. |
| (2) | Information obtained from the underwritten rent roll dated July 10, 2023. |
Market Overview and Competition. The Rockwall Market Center Property is located in Rockwall, Texas, approximately 25 miles northeast of downtown Dallas. Primary access to the Rockwall Market Center Property is provided by Interstate 30. The Rockwall Market Center Property is located in the main retail corridor of Rockwall, which includes several national retailers such as Home Depot (which serves as a shadow anchor), Walmart, Target, Lowe’s, Kohl’s, TJ Maxx, and Best Buy. According to the appraisal, the 2023 estimated population within a one-, three-, and five-mile radius of the Rockwall Market Center Property is 8,572, 38,844 and 98,389 respectively. The 2023 estimated median household income within the same radii was $94,043, $102,118 and $111,635, respectively.
According to the appraisal, the Rockwall Market Center Property is situated in the Rockwall retail submarket, which contained approximately 4.8 million square feet of retail space as of the first quarter of 2023. The Rockwall retail submarket reported a vacancy rate of 1.5% with an average asking rental rate of $26.84 per square foot. The appraiser concluded a market rent of $12.00 per square foot for anchor space (>10,000 square feet) and $35.00 per square foot for in-line space (<10,000 square feet) at the Rockwall Market Center Property.
The following table presents certain information relating to the appraiser’s market rent conclusion for the Rockwall Market Center Property:
Market Rent Summary(1)
| Retail (<10,000 SF) | Retail (>10,000 SF) | |
| Market Rent (PSF) | $35.00 | $12.00 |
| Lease Term (Years) | 10 | 10 |
| Lease Type (Reimbursements) | NNN | NNN |
| Tenant Improvements (New Tenants) | $25.00 | $12.00 |
| Tenant Improvements (Renewals) | $5.00 | $1.00 |
| Leasing Commissions (New Tenants) | 6.0% | 6.0% |
| Leasing Commissions (Renewals) | 3.0% | 3.0% |
| (1) | Information obtained from the appraisal. |
| THE INFORMATION IN THIS STRUCTURAL AND COLLATERAL TERM SHEET IS NOT COMPLETE AND MAY BE AMENDED PRIOR TO THE TIME OF SALE. THIS TERM SHEET IS NOT AN OFFER TO SELL THESE SECURITIES AND IT IS NOT A SOLICITATION OF AN OFFER TO BUY THESE SECURITIES IN ANY JURISDICTION WHERE THE OFFER OR SALE IS NOT PERMITTED. | ||
| 166 | ||
| Retail – Anchored | Loan #15 | Cut-off Date Balance: | $22,100,000 | |
| 2663-2853 Market Center Drive | Rockwall Market Center | Cut-off Date LTV: | 66.0% | |
| Rockwall, TX 75032 | U/W NCF DSCR: | 1.59x | ||
| U/W NOI Debt Yield: | 12.2% |
The following table presents certain information relating to five recent sales of properties comparable to the Rockwall Market Center Property:
Comparable Sales(1)
| Property Name | Location | Rentable Area (SF) | Sale Date | Sale Price | Sale Price (PSF) | Cap Rate |
| The Plaza at Rockwall Phase I | Rockwall, TX | 101,985 | Jun-23 | $13,360,434 | $131.00 | 7.8% |
| Independence Square | Plano, TX | 129,974 | Jun-22 | $18,156,473 | $139.69 | 8.5% |
| Highlands at Flower Mound | Flower Mound, TX | 175,000 | Apr-22 | $38,000,000 | $217.14 | 5.5% |
| Lewisville West Shopping Center | Lewisville, TX | 128,428 | Jan-22 | $24,000,000 | $186.88 | 7.5% |
| Craig Crossing | McKinney, TX | 128,394 | Jan-22 | $26,113,237 | $203.38 | 7.0% |
| (1) | Information obtained from the appraisal. |
The following table presents certain information relating to seven comparable leases to those at the Rockwall Market Center Property:
Comparable Leases(1)
| Property Name/Location | Year Built | Total GLA (SF) | Tenant Name | Lease Term (Months) | Tenant Size (SF) | Annual Base Rent PSF | Lease Type |
| 3220 East Hebron Parkway | 2007 | 14,431 | Northbound Investments | 13 | 1,898 | $22.00 | NNN |
| 3220 East Hebron Parkway | |||||||
| Carrollton, TX | |||||||
| Heath Buffalo Plaza | 2017 | 14,225 | Confidential | 60 | 1,650 | $26.75 | NNN |
| 110 Smirl Drive | |||||||
| Heath, TX | |||||||
| Retail Building | 2006 | 10,158 | Confidential | 24 | 1,100 | $35.00 | NNN |
| 450 Farm to Market 548 | |||||||
| Forney, TX | |||||||
| Retail Strip Center | 2008 | 14,092 | Confidential | 36 | 1,000 | $38.00 | NNN |
| 305 Farm to Market Road 544 | |||||||
| Murphy, TX | |||||||
| Pleasant Grove Plaza | 2012 | 21,594 | Shoe Palace | 120 | 5,589 | $22.00 | NNN |
| 1401 South Buckner Boulevard | |||||||
| Dallas, TX | |||||||
| Evans Crossing | 2017 | 7,600 | Confidential | 60 | 840 | $31.00 | NNN |
| 119 North Murphy Road | |||||||
| Murphy, TX | |||||||
| Castle Hills Corner | 2018 | 11,189 | Nail Spa | 60 | 2,715 | $32.00 | NNN |
| 615 Farm to Market Road 2281 | |||||||
| Lewisville, TX |
| (1) | Information obtained from the appraisal. |
| THE INFORMATION IN THIS STRUCTURAL AND COLLATERAL TERM SHEET IS NOT COMPLETE AND MAY BE AMENDED PRIOR TO THE TIME OF SALE. THIS TERM SHEET IS NOT AN OFFER TO SELL THESE SECURITIES AND IT IS NOT A SOLICITATION OF AN OFFER TO BUY THESE SECURITIES IN ANY JURISDICTION WHERE THE OFFER OR SALE IS NOT PERMITTED. | ||
| 167 | ||
| Retail – Anchored | Loan #15 | Cut-off Date Balance: | $22,100,000 | |
| 2663-2853 Market Center Drive | Rockwall Market Center | Cut-off Date LTV: | 66.0% | |
| Rockwall, TX 75032 | U/W NCF DSCR: | 1.59x | ||
| U/W NOI Debt Yield: | 12.2% |
Operating History and Underwritten Net Cash Flow. The following table presents certain information relating to the underwritten net cash flow at the Rockwall Market Center Property:
Cash Flow Analysis
| 2020 | 2021 | 2022 | TTM 6/30/2023 | U/W | %(1) | U/W $ per SF | ||
| Rents in Place | $2,684,695 | $2,899,173(2) | $2,872,392 | $2,967,655 | $2,966,883 | 73.7 | % | $14.00 |
| Contractual Rent Steps(3) | 0 | 0 | 0 | 0 | 60,062 | 1.5 | 0.28 | |
| Grossed Up Vacant Space | 0 | 0 | 0 | 0 | 0 | 0.0 |
| 0.00 |
| Gross Potential Rent | $2,684,695 | $2,899,173 | $2,872,392 | $2,967,655 | $3,026,945 | 75.2 | % | $14.28 |
| Other Income(4) | 1,296 | 1,296 | 1,296 | 1,296 | 7,296 | 0.2 | 0.03 | |
| Total Recoveries | 869,777 | 829,546 | 899,901 | 908,375 | 993,591 | 24.7 |
| 4.69 |
| Net Rental Income | $3,555,768 | $3,730,015 | $3,773,589 | $3,877,326 | $4,027,832 | 100.0 | % | $19.00 |
| (Vacancy, Abatements & Credit Loss) | (143,847) | (12,521) | 0 | 0 | (201,027) | (6.6) |
| (0.95) |
| Effective Gross Income | $3,411,921 | $3,717,494 | $3,773,589 | $3,877,326 | $3,826,805 | 95.0 | % | $18.05 |
| Real Estate Taxes | $627,857 | $619,744 | $617,970 | $617,084 | $597,371 | 15.6 | % | $2.82 |
| Insurance | 65,205 | 75,462 | 82,152 | 102,579 | 146,409 | 3.8 | 0.69 | |
| Management Fee | 103,140 | 114,451 | 107,720 | 112,083 | 114,804 | 3.0 | 0.54 | |
| Other Operating Expenses | 237,226 | 251,689 | 271,992 | 268,612 | 268,944 | 7.0 |
| 1.27 |
| Total Operating Expenses | $1,033,428 | $1,061,346 | $1,079,835 | $1,100,357 | $1,127,528 | 29.5 | % | $5.32 |
| Net Operating Income | $2,378,493 | $2,656,149 | $2,693,755 | $2,776,969 | $2,699,277 | 70.5 | % | $12.73 |
| Replacement Reserves | 0 | 0 | 0 | 0 | 31,796 | 0.8 | 0.15 | |
| TI/LC | 0 | 0 | 0 | 0 | 108,978 | 2.8 |
| 0.51 |
| Net Cash Flow | $2,378,493 | $2,656,149 | $2,693,755 | $2,776,969 | $2,558,503 | 66.9 | % | $12.07 |
| NOI DSCR | 1.48x | 1.65x | 1.67x | 1.72x | 1.67x | |||
| NCF DSCR | 1.48x | 1.65x | 1.67x | 1.72x | 1.59x | |||
| NOI Debt Yield | 10.8% | 12.0% | 12.2% | 12.6% | 12.2% | |||
| NCF Debt Yield | 10.8% | 12.0% | 12.2% | 12.6% | 11.6% | |||
| (1) | Represents (i) percent of Net Rental Income for all revenue fields, (ii) percent of Gross Potential Rent for Vacancy, Abatements & Credit Loss and (iii) percent of Effective Gross Income for all other fields. |
| (2) | Includes percentage rent and COVID rent repayment. |
| (3) | Represents contractual rent steps through May 2024. |
| (4) | Other Income includes parking and other miscellaneous income. |
| THE INFORMATION IN THIS STRUCTURAL AND COLLATERAL TERM SHEET IS NOT COMPLETE AND MAY BE AMENDED PRIOR TO THE TIME OF SALE. THIS TERM SHEET IS NOT AN OFFER TO SELL THESE SECURITIES AND IT IS NOT A SOLICITATION OF AN OFFER TO BUY THESE SECURITIES IN ANY JURISDICTION WHERE THE OFFER OR SALE IS NOT PERMITTED. | ||
| 168 | ||
| No. 16 – Mountain Lakes Estates |
| Mortgage Loan Information | Mortgaged Property Information | ||||||
| Mortgage Loan Seller: | Morgan Stanley Mortgage Capital Holdings LLC | Single Asset/Portfolio: | Single Asset | ||||
| Credit Assessment (Fitch/KBRA/Moody’s): | NR/NR/NR | Property Type – Subtype: | Multifamily – Senior Housing | ||||
| Original Principal Balance: | $21,792,000 | Location: | Reno, NV | ||||
| Cut-off Date Balance: | $21,792,000 | Size: | 131 Units | ||||
| % of Initial Pool Balance: | 2.4% | Cut-off Date Balance Per Unit: | $166,351 | ||||
| Loan Purpose: | Acquisition | Maturity Date Balance Per Unit: | $166,351 | ||||
| Borrower Sponsors: | Pietro V. Scola, Joseph L. Fox and Livingston Street Capital, LLC | Year Built/Renovated: | 2020/NAP | ||||
| Guarantors: | Pietro V. Scola and Joseph L. Fox | Title Vesting: | Fee | ||||
| Mortgage Rate: | 6.4800% | Property Manager: | Allure Active Adult Communities, LLC (borrower-related) | ||||
| Note Date: | 5/26/2023 | Current Occupancy (As of): | 96.9% (10/4/2023) | ||||
| Seasoning: | 6 months | YE 2022 Occupancy: | 94.4% | ||||
| Maturity Date: | June 1, 2033 | YE 2021 Occupancy: | 57.5% | ||||
| IO Period: | 120 months | YE 2020 Occupancy: | NAP(3) | ||||
| Loan Term (Original): | 120 months | YE 2019 Occupancy: | NAP(3) | ||||
| Amortization Term (Original): | NAP | As-Is Appraised Value(4): | $38,000,000 | ||||
| Loan Amortization Type: | Interest Only | As-Is Appraised Value Per Unit(4): | $290,076 | ||||
| Call Protection: | L(30),D(86),O(4) | As-Is Appraisal Valuation Date: | May 2, 2023 | ||||
| Lockbox Type: | Springing | Underwriting and Financial Information | |||||
| Additional Debt: | None | TTM NOI (5/31/2023): | $2,000,585 | ||||
| Additional Debt Type (Balance): | NAP | YE 2022 NOI: | $1,504,780 | ||||
| YE 2021 NOI: | $44,308 | ||||||
| YE 2020 NOI: | NAP(3) | ||||||
| YE 2019 NOI: | NAP(3) | ||||||
| U/W Revenues: | $5,302,048 | ||||||
| U/W Expenses: | $2,823,487 | ||||||
| Escrows and Reserves | U/W NOI: | $2,478,561 | |||||
| Initial | Monthly | Cap | U/W NCF: | $2,445,811 | |||
| Taxes: | $17,081 | $17,081 | NAP | U/W DSCR based on NOI/NCF: | 1.73x / 1.71x | ||
| Insurance: | $0 | Springing(1) | NAP | U/W Debt Yield based on NOI/NCF: | 11.4% / 11.2% | ||
| Cap Ex: | $98,250 | $2,729 | NAP | U/W Debt Yield at Maturity based on NOI/NCF: | 11.4% / 11.2% | ||
| CC&R Reserve: | $50,000 | Springing(2) | NAP | Cut-off Date LTV Ratio: | 57.3% | ||
| LTV Ratio at Maturity: | 57.3% | ||||||
| Sources and Uses | ||||||||
| Sources | Uses | |||||||
| Mortgage Loan Amount | $21,792,000 | 53.0 | % | Purchase Price | $37,250,000 | 90.7 | % | |
| Borrower Equity | 19,295,717 | 47.0 | Closing Costs | 3,672,386 | 8.9 | |||
| Reserves | 165,331 | 0.4 | ||||||
| Total Sources | $41,087,717 | 100.0 | % | Total Uses | $41,087,717 | 100.0 | % | |
| (1) | The Mountain Lakes Estates Mortgage Loan (as defined below) documents do not require ongoing monthly escrows for insurance premiums so long as (i) no event of default has occurred and is continuing, (ii) the borrower provides the lender with written evidence that all required insurance coverages are being maintained in full force and effect, and (iii) the borrower provides the lender with paid receipts for the payment of the insurance premiums at least 30 days prior to the expiration of the policy. |
| (2) | The lender may reassess the amount necessary for the CC&R Reserve from time to time based on the actual amount of assessments due by borrower pursuant to a declaration of covenants, conditions and restrictions (the “CC&R”) affecting the Mountain Lakes Estates Property (as defined below), and may require additional amounts to be deposited into the CC&R Reserve Account upon (i) 30 days' notice to borrower if the lender determines in its reasonable discretion that an increase is necessary and (ii) amounts on deposit being less than the greater of (a) $50,000 and (b) 2 times the then-current amount of annual assessments due from borrower under the CC&R. |
| (3) | Historical occupancies and NOI figures before 2021 are not available as the Mountain Lakes Estates Property was constructed in 2020. |
| (4) | The appraised value represents the value of the Mountain Lakes Estates Property as a going concern entity. See the definition of “Appraised Value” under “Description of the Mortgage Pool—Certain Calculations and Definitions-Definitions” in the prospectus. |
| THE INFORMATION IN THIS STRUCTURAL AND COLLATERAL TERM SHEET IS NOT COMPLETE AND MAY BE AMENDED PRIOR TO THE TIME OF SALE. THIS TERM SHEET IS NOT AN OFFER TO SELL THESE SECURITIES AND IT IS NOT A SOLICITATION OF AN OFFER TO BUY THESE SECURITIES IN ANY JURISDICTION WHERE THE OFFER OR SALE IS NOT PERMITTED. | ||
| 169 | ||
| Multifamily – Senior Housing | Loan #16 | Cut-off Date Balance: | $21,792,000 | |
| 765 South Meadows Parkway | Mountain Lakes Estates | Cut-off Date LTV: | 57.3% | |
| Reno, NV 89521 | UW NCF DSCR: | 1.71x | ||
| UW NOI Debt Yield: | 11.4% |
The Mortgage Loan. The sixteenth largest mortgage loan (the “Mountain Lakes Estates Mortgage Loan”) is evidenced by a promissory note in the original principal amount of $21,792,000 and secured by a first priority fee mortgage encumbering a 131-unit senior-housing multifamily property in Reno, Nevada (the “Mountain Lakes Estates Property”).
The Borrower and the Borrower Sponsor. The borrower for the Mountain Lakes Estates Mortgage Loan is LSC-Reno NV, DST, a single-purpose, Delaware statutory trust, with one independent trustee in its organizational structure. The non-recourse carve-out guarantors for the Mountain Lakes Estates Mortgage Loan are Joseph L. Fox and Pietro V. Scola, who together with Livingston Street Capital, LLC are the borrower sponsors. Pietro V. Scola and Joseph L. Fox are members of the executive team at Livingston Street Capital, LLC, which focuses on acquiring 55+ active adult and independent living properties, healthcare properties, multifamily properties, and office and industrial properties. Livingston Street Capital, LLC currently manages a portfolio of 16 properties.
The borrower has master leased the Mountain Lakes Estates Property to a master tenant, Livingston Street Multi15 LeaseCo LLC (the “Mountain Lakes Estates Master Tenant”), an entity affiliated with the non-recourse carve-out guarantors and borrower sponsors. The Mountain Lakes Estates Master Tenant is a Delaware limited liability company structured to be a special purpose entity, with one independent director. The Mountain Lakes Estates Master Tenant’s interest in all tenant rents was assigned to the borrower, which in turn collaterally assigned its interest to the lender. The lender has the ability to cause the borrower to terminate the master lease. The non-recourse carve-out guarantors for the Mountain Lakes Estates Mortgage Loan indirectly own 100% of the Mountain Lakes Estates Master Tenant. The master lease is subordinate to the Mountain Lakes Estates Mortgage Loan.
The lender has the right to cause the borrower to convert to a Delaware limited liability company upon (a) notice from the lender that an event of default under the Mountain Lakes Estates Mortgage Loan documents is continuing or (b) if the lender has not received evidence that the Mountain Lakes Estates Mortgage Loan will be repaid on its maturity date in the form of either (i) a commitment to refinance the Mountain Lakes Estates Mortgage Loan or (ii) an executed contract of sale, in each case, within 90 days prior to the maturity date.
The Property The Mountain Lakes Estates Property is an independent living community for adults aged 55 and over, situated on a 5.17-acre site, located in Reno, Nevada. The Mountain Lakes Estates Property is comprised of 131 units, and includes 54 studios, 66 one-bedroom units and 11 two-bedroom units. The Mountain Lakes Estates Property is a private pay facility and is not a licensed nursing or health care facility. Tenants’ lease contracts contain an affirmation that they are capable of providing their own healthcare and personal care needs. The monthly rent includes 3 meals per day served in the dining room, weekly housekeeping and laundry, all maintenance services, scheduled transportation, social activities and medication reminders. Additional housekeeping and laundry services are available for an additional cost, and laundry facilities are available for use by the residents. Other amenities offered at the Mountain Lakes Estates Property include a fitness center, movie theater, and lakeside patio with fire pit. Salon and spa services are also available. The leases for the Mountain Lakes Estates Property are structured on a month-to-month basis.
The Mountain Lakes Estates Property was built in 2020, and began leasing units in November 2020. The Mountain Lakes Estates Property achieved an 89.7% occupancy in June 2022, and as of October 4, 2023, was 96.9% leased.
The table below shows the residential apartment unit mix at the Mountain Lakes Estates Property:
Unit Mix(1)
| Unit Mix / Type | Total Units | Leased Units | % Leased | Monthly Average Actual Rent per Unit | Monthly Average Market Rent per Unit(2) |
| Studio | 54 | 51 | 94.4% | $2,857 | $2,800 |
| One Bedroom | 66 | 65 | 98.5% | $3,700 | $3,600 |
| Two Bedroom | 11 | 11 | 100.0% | $4,500 | $4,400 |
| Total/Wtd. Avg. | 131 | 127 | 96.9% | $3,431 | $3,337 |
| (1) | Information based on the borrower rent roll dated October 4, 2023. |
| (2) | Information based on the appraisal. |
The following table presents historical occupancy percentages at the Mountain Lakes Estates Property:
Historical Occupancy
12/31/2021(1) | 12/31/2022(1) | 10/4/2023(2) |
| 57.5% | 94.4% | 96.9% |
| (1) | Information obtained from the borrower sponsor. |
| (2) | Information based on the borrower rent roll dated October 4, 2023. |
| THE INFORMATION IN THIS STRUCTURAL AND COLLATERAL TERM SHEET IS NOT COMPLETE AND MAY BE AMENDED PRIOR TO THE TIME OF SALE. THIS TERM SHEET IS NOT AN OFFER TO SELL THESE SECURITIES AND IT IS NOT A SOLICITATION OF AN OFFER TO BUY THESE SECURITIES IN ANY JURISDICTION WHERE THE OFFER OR SALE IS NOT PERMITTED. | ||
| 170 | ||
| Multifamily – Senior Housing | Loan #16 | Cut-off Date Balance: | $21,792,000 | |
| 765 South Meadows Parkway | Mountain Lakes Estates | Cut-off Date LTV: | 57.3% | |
| Reno, NV 89521 | UW NCF DSCR: | 1.71x | ||
| UW NOI Debt Yield: | 11.4% |
Operating History and Underwritten Net Cash Flow. The following table presents certain information relating to the historical operating performance and underwritten net cash flow at the Mountain Lakes Estates Property:
Cash Flow Analysis
| 2021(1) | 2022(1) | 5/31/2023 TTM(1) | U/W(1) | %(2) | U/W $ per unit | |
| Gross Potential Rent(3) | $1,928,063 | $4,117,696 | $4,800,996 | $5,372,682 | 96.4% | $41,013 |
| Other Income(4) | 235,117 | 258,621 | 225,376 | 198,000 | 3.6 | 1,511 |
| Discounts Concessions | (323,076) | (187,881) | (126,009) | 0 | 0.0 | 0 |
| Net Rental Income | $1,840,104 | $4,188,436 | $4,900,364 | $5,570,682 | 100.0% | $42,524 |
| Less Vacancy & Credit Loss | 0 | 0 | 0 | (268,634) | (5.0) | (2,051) |
| Effective Gross Income | $1,840,104 | $4,188,436 | $4,900,364 | $5,302,048 | 95.2% | $40,474 |
| Real Estate Taxes | 132,353 | 176,177 | 191,055 | 199,000 | 3.8 | 1,519 |
| Insurance | 33,835 | 34,373 | 41,604 | 87,728 | 1.7 | 670 |
| Management Fee | 126,580 | 292,184 | 342,443 | 212,082 | 4.0 | 1,619 |
| Other Expenses | 1,503,027 | 2,180,922 | 2,324,677 | 2,324,677 | 43.8 | 17,746 |
| Total Operating Expenses | $1,795,796 | $2,683,655 | $2,899,779 | $2,823,487 | 53.3% | $21,553 |
| Net Operating Income | $44,308 | $1,504,780 | $2,000,585 | $2,478,561 | 46.7% | $18,920 |
| Capital Expenditures | 0 | 0 | 0 | 32,750 | 0.6 | 250 |
| Net Cash Flow | $44,308 | $1,504,780 | $2,000,585 | $2,445,811 | 46.1% | $18,670 |
| NOI DSCR | 0.03x | 1.05x | 1.40x | 1.73x | ||
| NCF DSCR | 0.03x | 1.05x | 1.40x | 1.71x | ||
| NOI Debt Yield | 0.2% | 6.9% | 9.2% | 11.4% | ||
| NCF Debt Yield | 0.2% | 6.9% | 9.2% | 11.2% |
| (1) | Increases in Gross Potential Rent and Net Operating Income from 2021 to 2022, 2022 to 5/31/2023 TTM and 5/31/2023 TTM to U/W is due to the Mountain Lakes Estates Property having been constructed in 2020, and having commenced leasing units in November 2020. The Mountain Lakes Estates Property achieved an 89.7% occupancy in June 2022. |
| (2) | Represents (i) percent of Net Rental Income for all revenue fields, (ii) percent of Gross Potential Rent for Vacancy & Credit Loss and (iii) percent of Effective Gross Income for all other fields. |
| (3) | U/W Gross Potential Rent is based on the borrower rent roll dated October 4, 2023. |
| (4) | Other Income is comprised of (i) double occupancy fees ($117,000) and (ii) miscellaneous income ($10,000). |
Appraisal. The appraisal concluded to an “as-is” appraised value as of May 2, 2023 of $38,000,000. The appraised value represents the value of the Mountain Lakes Estates Property as a going concern entity. See the definition of “Appraised Value” under “Description of the Mortgage Pool—Certain Calculations and Definitions-Definitions” in the prospectus.
Environmental Matters. According to the Phase I environmental report dated April 18, 2023, there was no evidence of any recognized environmental conditions at the Mountain Lakes Estates Property.
Market Overview and Competition. The Mountain Lakes Estates Property is located in Reno, Nevada, in Washoe County. The primary north-south highway through Reno is U.S. Route 395/Interstate 580, which is accessible less than 0.25 miles from the Mountain Lakes Estates Property. Additionally, Interstate-80 runs through downtown Reno and intersects with Interstate 580 approximately 6.7 miles north of the Mountain Lakes Estates Property. The city of Reno has a population of around 255,000 people and is located at an elevation of 4,400 feet in the Sierra Nevada mountain range. Reno is a popular destination for tourists and visitors due to its location near Lake Tahoe, which offers numerous outdoor recreational activities including skiing, hiking, and boating. The city is also known for its numerous casinos and entertainment venues, including the famous Reno Arch. The economy of Reno is diverse and includes industries such as manufacturing, healthcare, and technology. Reno is home to many large companies, including Tesla, Panasonic, and Amazon. According to the appraisal, the median home price in the city of Reno is approximately $415,000. According to a third-party market research report, the estimated 2023 population within a one-, five- and ten-mile radius was approximately 58,303, 116,994, and 344,283, respectively, and the median household income within the same radii was $112,097, $96,289, and $76,563, respectively.
The Mountain Lakes Estates Property is approximately 29.1 miles northeast of Lake Tahoe, 141 miles northeast of Sacramento, California, and 440 miles northwest of Las Vegas. The Reno-Tahoe International Airport is located approximately 6.3 miles north of the Mountain Lakes Estates Property. Medical services are provided to the area by Renown South Meadows Medical Center, which is located less than 0.25 miles from the Mountain Lakes Estates Property.
| THE INFORMATION IN THIS STRUCTURAL AND COLLATERAL TERM SHEET IS NOT COMPLETE AND MAY BE AMENDED PRIOR TO THE TIME OF SALE. THIS TERM SHEET IS NOT AN OFFER TO SELL THESE SECURITIES AND IT IS NOT A SOLICITATION OF AN OFFER TO BUY THESE SECURITIES IN ANY JURISDICTION WHERE THE OFFER OR SALE IS NOT PERMITTED. | ||
| 171 | ||
| Multifamily – Senior Housing | Loan #16 | Cut-off Date Balance: | $21,792,000 | |
| 765 South Meadows Parkway | Mountain Lakes Estates | Cut-off Date LTV: | 57.3% | |
| Reno, NV 89521 | UW NCF DSCR: | 1.71x | ||
| UW NOI Debt Yield: | 11.4% |
The following table presents certain information relating to the appraisal’s market rent conclusion for the Mountain Lakes Estates Property:
Market Rent Summary
| Unit Mix / Type | Units(1) | Avg. Monthly Actual Rent per Unit(1) | Avg. Monthly Market Rent per Unit(2) |
| Studio | 54 | $2,857 | $2,800 |
| One Bedroom | 66 | $3,700 | $3,600 |
| Two Bedroom | 11 | $4,500 | $4,400 |
| (1) | Based on the borrower rent roll dated October 4, 2023. |
| (2) | Based on the appraisal. |
The following table presents certain information relating to independent living rental properties comparable to the Mountain Lakes Estates Property:
Comparable Rental Properties
| Property | Year Built | # Units | Occupancy | Unit Mix | Range of Monthly Rent per Unit |
Mountain Lakes Estates Property(1) Reno, NV | 2020 | 131 | 96.9% | Studio 1BR 2BR | $2,495 - $3,475 $3,071 - $5,450 $3,861 - $5,507 |
Five Star Premier Residences of Reno Reno, NV | 1989 | 160 | 100.0% | Studio 1BR 2BR | $2,500 - $2,850 $3,250 - $3,500 $4,500 - $4,750 |
Lakeside Manor Reno, NV | 1981 | 91 | 90.0% | Studio 1BR 2BR | $1,600 - $2,100 $2,300 - $2,700 $2,500 - $3,000 |
Sky Peaks Reno, NV
| 2002 | 121 | 90.0% | Studio 1BR 2BR | $2,819 $2,899 $3,679 |
| (1) | Other than Year Built, information is based on the borrower rent roll dated October 4, 2023. |
The following table presents recent comparable senior housing multifamily sales data with respect to the Mountain Lakes Estates Property:
Comparable Sales(1)
| Property | Year Built | # Units | Occupancy | Date of Sale | Total NRA (SF) | Sale Price | Sales Price Per Bed |
Mountain Lakes Estates Property Reno, NV | 2020 | 131 | 96.9%(2) | Mar. 2023 | 104,728 | $37,250,000 | $284,351 |
Cogir of Brentwood Brentwood, CA | 2007 | 120 | NAV | Jun. 2022 | 141,467 | $39,200,000 | $326,667 |
Springwood at Allen Allen, TX | 2020 | 92 | 96.0% | Jan. 2022 | 78,784 | $19,300,000 | $209,783 |
The Wentworth at Parklane Salt Lake City, UT | 1987 | 94 | 93.0% | Jul. 2021 | 90,872 | $21,000,000 | $223,404 |
Timber Ridge at Talus Issaquah, WA | 2008 | 401 | 95.0% | Feb. 2020 | 820,305 | $133,000,000 | $331,671 |
Peninsula Del Rey Daly City, CA | 2011 | 207 | 85.0% | Aug. 2019 | 187,400 | $74,250,000 | $358,696 |
| (1) | Source: Appraisal |
| (2) | Based on the borrower rent roll dated October 4, 2023. |
| THE INFORMATION IN THIS STRUCTURAL AND COLLATERAL TERM SHEET IS NOT COMPLETE AND MAY BE AMENDED PRIOR TO THE TIME OF SALE. THIS TERM SHEET IS NOT AN OFFER TO SELL THESE SECURITIES AND IT IS NOT A SOLICITATION OF AN OFFER TO BUY THESE SECURITIES IN ANY JURISDICTION WHERE THE OFFER OR SALE IS NOT PERMITTED. | ||
| 172 | ||
| MSWF Commercial Mortgage Trust 2023-2 | Transaction Contact Information |
VI. Transaction Contact Information
Questions regarding this Structural and Collateral Term Sheet may be directed to any of the following individuals:
| Wells Fargo Securities, LLC | |
| Brigid Mattingly | Tel. (312) 269-3062 |
| A.J. Sfarra | Tel. (212) 214-5613 |
| Sean Duffy | Tel. (312) 827-1518 |
| Morgan Stanley & Co. LLC | |
| Nishant Kapur | Tel. (212) 761-1483 |
| Jane Lam | Tel. (212) 761-3507 |
| BofA Securities, Inc. | |
| Leland F. Bunch, III | Tel. (646) 855-3953 |
| Danielle Caldwell | Tel. (646) 855-3421 |
| THE INFORMATION IN THIS STRUCTURAL AND COLLATERAL TERM SHEET IS NOT COMPLETE AND MAY BE AMENDED PRIOR TO THE TIME OF SALE. THIS TERM SHEET IS NOT AN OFFER TO SELL THESE SECURITIES AND IT IS NOT A SOLICITATION OF AN OFFER TO BUY THESE SECURITIES IN ANY JURISDICTION WHERE THE OFFER OR SALE IS NOT PERMITTED. | ||
| 173 | ||