0000200406jnj:ConsumerMember2022-01-032023-01-01
UNITED STATES
SECURITIES AND EXCHANGE COMMISSION
Washington, D.C. 20549
FORM 10-K
| | | | | |
| ☑ | ANNUAL REPORT PURSUANT TO SECTION 13 OF THE SECURITIES EXCHANGE ACT OF 1934 |
For the fiscal year ended December 29, 2024
or
| | | | | |
| ☐ | Transition Report Pursuant to Section 13 or 15(d) of the Securities Exchange Act of 1934 for the transition period from to |
Commission file number 1-3215
Johnson & Johnson
(Exact name of registrant as specified in its charter) | | | | | | | | |
| New Jersey | | 22-1024240 |
| (State of incorporation) | | (I.R.S. Employer Identification No.) |
One Johnson & Johnson Plaza New Brunswick, New Jersey | | 08933 |
| (Address of principal executive offices) | | (Zip Code) |
One Johnson & Johnson Plaza
New Brunswick, New Jersey 08933
(Address of principal executive offices)
Registrant’s telephone number, including area code: (732) 524-0400
SECURITIES REGISTERED PURSUANT TO SECTION 12(b) OF THE ACT | | | | | | | | |
| Title of each class | Trading Symbol | Name of each exchange on which registered |
| Common Stock, Par Value $1.00 | JNJ | New York Stock Exchange |
| 1.150% Notes Due November 2028 | JNJ28 | New York Stock Exchange |
| 3.20% Notes Due November 2032 | JNJ32 | New York Stock Exchange |
| 1.650% Notes Due May 2035 | JNJ35 | New York Stock Exchange |
| 3.350% Notes Due November 2036 | JNJ36A | New York Stock Exchange |
| 3.550% Notes Due November 2044 | JNJ44 | New York Stock Exchange |
| | |
Indicate by check mark if the registrant is a well-known seasoned issuer, as defined in Rule 405 of the Securities Act. Yes þ No o
Indicate by check mark if the registrant is not required to file reports pursuant to Section 13 or Section 15(d) of the Exchange Act. Yes o No þ
Indicate by check mark whether the registrant (1) has filed all reports required to be filed by Section 13 or 15(d) of the Exchange Act during the preceding 12 months (or for such shorter period that the registrant was required to file such reports), and (2) has been subject to such filing requirements for the past 90 days. Yes þ No o
Indicate by check mark whether the registrant has submitted electronically every Interactive Data File required to be submitted pursuant to Rule 405 of Regulation S-T during the preceding 12 months (or for such shorter period that the registrant was required to submit such files). Yes þ No o
Indicate by check mark whether the registrant is a large accelerated filer, an accelerated filer, a non-accelerated filer, a smaller reporting company, or emerging growth company. See the definitions of “large accelerated filer,” “accelerated filer”, “smaller reporting company,” and “emerging growth company” in Rule 12b-2 of the Exchange Act.
| | | | | | | | | | | |
| Large accelerated filer | ☑ | Accelerated filer | ☐ |
| Non-accelerated filer | ☐ | Smaller reporting company | ☐ |
| Emerging growth company | ☐ | | |
If an emerging growth company, indicate by check mark if the registrant has elected not to use the extended transition period for complying with any new or revised financial accounting standards provided pursuant to Section 13(a) of the Exchange Act. o
Indicate by check mark whether the registrant has filed a report on and attestation to its management's assessment of the effectiveness of its internal control over financial reporting under Section 404(b) of the Sarbanes-Oxley Act (15 U.S.C. 7262(b)) by the registered public accounting firm that prepared or issued its audit report. Yes ☑ No o
If securities are registered pursuant to Section 12(b) of the Act, indicate by check mark whether the financial statements of the registrant included in the filing reflect the correction of an error to previously issued financial statements. o
Indicate by check mark whether any of those error corrections are restatements that required a recovery analysis of incentive-based compensation received by any of the registrant’s executive officers during the relevant recovery period pursuant to §240.10D-1(b). o
Indicate by check mark whether the registrant is a shell company (as defined in Rule 12b-2 of the Exchange Act). Yes ☐ No þ
The aggregate market value of the Common Stock held by non-affiliates computed by reference to the price at which the Common Stock was last sold as of the last business day of the registrant’s most recently completed second fiscal quarter was approximately $352 billion.
On February 6, 2025, there were 2,407,616,693 shares of Common Stock outstanding.
DOCUMENTS INCORPORATED BY REFERENCE
| | | | | |
| Part III: | Portions of the registrant’s proxy statement for its 2025 annual meeting of shareholders to be filed within 120 days after the close of the registrant’s fiscal year (the “Proxy Statement”), are incorporated by reference to this report on Form 10-K (this “Report”). |
Cautionary note regarding forward-looking statements
This Annual Report on Form 10-K and Johnson & Johnson’s other publicly available documents contain “forward-looking statements” within the meaning of the safe harbor provisions of the United States Private Securities Litigation Reform Act of 1995. Management and representatives of Johnson & Johnson and its subsidiaries (the Company) also may from time to time make forward-looking statements. Forward-looking statements do not relate strictly to historical or current facts and reflect management’s assumptions, views, plans, objectives and projections about the future. Forward-looking statements may be identified by the use of words such as “plans,” “expects,” “will,” “anticipates,” “estimates” and other words of similar meaning in conjunction with, among other things: discussions of future operations; expected operating results and financial performance; impact of planned acquisitions and dispositions; impact and timing of restructuring initiatives, including associated cost savings and other benefits; the Company’s strategy for growth; product development activities; regulatory approvals; market position and expenditures.
Because forward-looking statements are based on current beliefs, expectations and assumptions regarding future events, they are subject to uncertainties, risks and changes that are difficult to predict and many of which are outside of the Company’s control. Investors should realize that if underlying assumptions prove inaccurate, or known or unknown risks or uncertainties materialize, the Company’s actual results and financial condition could vary materially from expectations and projections expressed or implied in its forward-looking statements. Investors are therefore cautioned not to rely on these forward-looking statements. Risks and uncertainties include, but are not limited to:
Risks related to product development, market success and competition
•Challenges and uncertainties inherent in innovation and development of new and improved products and technologies on which the Company’s continued growth and success depend, including uncertainty of clinical outcomes, additional analysis of existing clinical data, obtaining regulatory approvals, health plan coverage and customer access, and initial and continued commercial success;
•Challenges to the Company’s ability to secure and maintain adequate patent and other intellectual property rights for new and existing products and technologies in the United States and other important markets;
•The impact of patent expirations, typically followed by the introduction of competing generic, biosimilar or other products and resulting revenue and market share losses;
•Increasingly aggressive and frequent challenges to the Company’s patents by competitors and others seeking to launch competing generic, biosimilar or other products and increased receptivity of courts, the United States Patent and Trademark Office and other decision makers to such challenges, potentially resulting in loss of market exclusivity and rapid decline in sales for the relevant product sooner than expected;
•Competition in research and development of new and improved products, processes and technologies, which can result in product and process obsolescence;
•Competition to reach agreement with third parties for collaboration, licensing, development and marketing agreements for products and technologies;
•Competition based on cost-effectiveness, product performance, technological advances and patents attained by competitors; and
•Allegations that the Company’s products infringe the patents and other intellectual property rights of third parties, which could adversely affect the Company’s ability to sell the products in question and require the payment of money damages and future royalties.
Risks related to product liability, litigation and regulatory activity
•Product efficacy or safety concerns, whether or not based on scientific evidence, potentially resulting in product withdrawals, recalls, regulatory action on the part of the United States Food and Drug Administration (U.S. FDA) (or international counterparts), declining sales, reputational damage, increased litigation expense and share price impact;
•The impact, including declining sales and reputational damage, of significant litigation or government action adverse to the Company, including product liability claims and allegations related to pharmaceutical marketing practices and contracting strategies;
•The impact of an adverse judgment or settlement and the adequacy of reserves related to legal proceedings, including patent litigation, product liability, personal injury claims, securities class actions, government investigations, employment and other legal proceedings;
•Increased scrutiny of the healthcare industry by government agencies and state attorneys general resulting in investigations and prosecutions, which carry the risk of significant civil and criminal penalties, including, but not limited to, debarment from government business;
•Failure to meet compliance obligations in compliance agreements with governments or government agencies, which could result in significant sanctions;
•Potential changes to applicable laws and regulations affecting United States and international operations, including relating to: approval of new products; licensing and patent rights; sales and promotion of healthcare products; access to, and reimbursement and pricing for, healthcare products and services; environmental protection; and sourcing of raw materials;
•Compliance with local regulations and laws that may restrict the Company’s ability to manufacture or sell its products in relevant markets, including requirements to comply with medical device reporting regulations and other requirements such as the European Union’s Medical Devices Regulation;
•Changes in domestic and international tax laws and regulations, increasing audit scrutiny by tax authorities around the world may cause exposures to additional tax liabilities potentially in excess of existing reserves; and
•The issuance of new or revised accounting standards by the Financial Accounting Standards Board and regulations by the Securities and Exchange Commission.
Risks related to the Company’s strategic initiatives and healthcare market trends
•Pricing pressures resulting from trends toward healthcare cost containment, including the continued consolidation among healthcare providers and other market participants, trends toward managed care, the shift toward governments increasingly becoming the primary payors of healthcare expenses, significant new entrants to the healthcare markets seeking to reduce costs and government pressure on companies to voluntarily reduce costs and price increases;
•Restricted spending patterns of individual, institutional and governmental purchasers of healthcare products and services due to economic hardship and budgetary constraints;
•Challenges to the Company’s ability to realize its strategy for growth including through externally sourced innovations, such as development collaborations, strategic acquisitions, licensing and marketing agreements, and the potential heightened costs of any such external arrangements due to competitive pressures;
•The potential that the expected strategic benefits and opportunities from any planned or completed acquisition or divestiture by the Company, including the divestment of Kenvue Inc., may not be realized or may take longer to realize than expected; and
•The potential that the expected benefits and opportunities related to past and ongoing restructuring actions may not be realized or may take longer to realize than expected.
Risks related to economic conditions, financial markets and operating internationally
•The risks associated with global operations on the Company and its customers and suppliers, including foreign governments in countries in which the Company operates;
•The impact of inflation and fluctuations in interest rates and currency exchange rates and the potential effect of such fluctuations on revenues, expenses and resulting margins;
•Potential changes in export/import and trade laws, regulations and policies of the United States and other countries, including any increased trade restrictions or tariffs and potential drug reimportation legislation, and the impact of such changes on raw material prices, supply chains market volatility and the pace of product development;
•The impact on international operations from financial instability in international economies, sovereign risk, possible imposition of governmental controls and restrictive economic policies, and unstable international governments and legal systems;
•The impact of global public health crises and pandemics;
•Changes to global climate, extreme weather and natural disasters that could affect demand for the Company’s products and services, cause disruptions in manufacturing and distribution networks, alter the availability of goods and services within the supply chain, and affect the overall design and integrity of the Company’s products and operations;
•The impact of global or economic changes or events, including global tensions and war; and
•The impact of armed conflicts and terrorist attacks in the United States and other parts of the world, including social and economic disruptions and instability of financial and other markets.
Risks related to supply chain and operations
•Difficulties and delays in manufacturing, internally, through third-party providers or otherwise within the supply chain, that may lead to voluntary or involuntary business interruptions or shutdowns, product shortages, withdrawals or suspensions of products from the market, and potential regulatory action;
•Interruptions and breaches of the Company’s information technology systems or those of the Company’s vendors, which could result in reputational, competitive, operational or other business harm as well as financial costs and regulatory action;
•Reliance on global supply chains and production and distribution processes that are complex and subject to increasing regulatory requirements that may adversely affect supply, sourcing and pricing of materials used in the Company’s products; and
•The potential that the expected benefits and opportunities related to restructuring actions may not be realized or may take longer to realize than expected, including due to any required approvals from applicable regulatory authorities.
Investors also should carefully read the risk factors described in Item 1A of this Annual Report on Form 10-K for a description of certain risks that could, among other things, cause the Company’s actual results to differ materially from those expressed in its forward-looking statements. Investors should understand that it is not possible to predict or identify all such factors and should not consider the risks described above and in Item 1A to be a complete statement of all potential risks and uncertainties. The Company does not undertake to publicly update any forward-looking statement that may be made from time to time, whether as a result of new information or future events or developments.
Part I
Item 1. Business
General
Johnson & Johnson and its subsidiaries (the Company) have approximately 138,100 employees worldwide engaged in the research and development, manufacture and sale of a broad range of products in the healthcare field. Johnson & Johnson is a holding company, with operating companies conducting business in virtually all countries of the world. The Company’s primary focus is products related to human health and well-being. Johnson & Johnson was incorporated in the State of New Jersey in 1887.
The Chief Operating Decision Maker (CODM) is the Company's Chief Executive Officer (Principal Executive Officer). The Executive Committee is Johnson & Johnson’s senior leadership team responsible for setting the strategy and priorities of the Company and driving accountability at all levels. Within the strategic parameters provided by the Executive Committee, senior management groups at U.S. and international operating companies are each responsible for their own strategic plans and the day-to-day operations of those companies.
Segments of business
The Company is organized into two business segments: Innovative Medicine and MedTech. Additional information required by this item is incorporated herein by reference to the narrative and tabular descriptions of segments and operating results under: Item 7. Management’s discussion and analysis of results of operations and financial condition of this Report; and Note 17 Segments of business and geographic areas of the notes to consolidated financial statements included in Item 8 of this Report.
Innovative Medicine
The Innovative Medicine segment is focused on the following therapeutic areas: Immunology (e.g., rheumatoid arthritis, psoriatic arthritis, inflammatory bowel disease and psoriasis), Infectious Diseases (e.g., HIV/AIDS), Neuroscience (e.g., mood disorders, neurodegenerative disorders and schizophrenia), Oncology (e.g., prostate cancer, hematologic malignancies, lung cancer and bladder cancer), Cardiovascular and Metabolism (e.g., thrombosis, diabetes and macular degeneration) and Pulmonary Hypertension (e.g., Pulmonary Arterial Hypertension). Medicines in this segment are distributed directly to retailers, wholesalers, distributors, hospitals and healthcare professionals for prescription use. Key products in the Innovative Medicine segment include: REMICADE (infliximab), a treatment for a number of immune-mediated inflammatory diseases; SIMPONI (golimumab), a subcutaneous treatment for adults with moderate to severe rheumatoid arthritis, active psoriatic arthritis, active ankylosing spondylitis and moderately active to severely active ulcerative colitis; SIMPONI ARIA (golimumab), an intravenous treatment for adults with moderate to severe rheumatoid arthritis, active psoriatic arthritis and active ankylosing spondylitis and active polyarticular juvenile idiopathic arthritis (pJIA) in people 2 years of age and older; STELARA (ustekinumab), a treatment for adults and children with moderate to severe plaque psoriasis, for adults with active psoriatic arthritis, for adults with moderately to severely active Crohn's disease and treatment of moderately to severely active ulcerative colitis; TREMFYA (guselkumab), a treatment for adults with moderate to severe plaque psoriasis and active psoriatic arthritis and ulcerative colitis; EDURANT (rilpivirine), PREZISTA (darunavir) and PREZCOBIX/REZOLSTA (darunavir/cobicistat), antiretroviral medicines for the treatment of human immunodeficiency virus (HIV) in combination with other antiretroviral products and SYMTUZA (darunavir/cobicistat/emtricitabine/tenofovir alafenamide), a once-daily single tablet regimen for the treatment of HIV; CONCERTA (methylphenidate HCl) extended-release tablets CII, a treatment for attention deficit hyperactivity disorder; INVEGA SUSTENNA/XEPLION (paliperidone palmitate), for the treatment of schizophrenia and schizoaffective disorder in adults; INVEGA TRINZA/TREVICTA (paliperidone palmitate), for the treatment of schizophrenia in patients after they have been adequately treated with INVEGA SUSTENNA for at least four months; SPRAVATO (Esketamine), a nasal spray, used along with an oral antidepressant, to treat adults with treatment-resistant depression (TRD) and depressive symptoms in adults with major depressive disorder (MDD) with suicidal thoughts or actions; CARVYKTI (ciltacabtagene autoleucel), a chimeric antigen receptor (CAR)-T-cell therapy for the treatment of patients with relapsed/refractory multiple
myeloma; ZYTIGA (abiraterone acetate), a treatment for patients with prostate cancer; ERLEADA (apalutamide), a next-generation androgen receptor inhibitor for the treatment of patients with prostate cancer; IMBRUVICA (ibrutinib), a treatment for certain B-cell malignancies, or blood cancers and chronic graft versus host disease; DARZALEX (daratumumab), a treatment for multiple myeloma; DARZALEX FASPRO (daratumumab and hyaluronidase-fihj), a treatment for multiple myeloma and light chain (AL) Amyloidosis; TECVAYLI (teclistamab-cqyv), a ready-to-use bispecific antibody for adults with relapsed or refractory multiple myeloma who have received at least four prior lines of therapy; XARELTO (rivaroxaban), an oral anticoagulant for the prevention of deep vein thrombosis (DVT), which may lead to pulmonary embolism (PE) in patients undergoing hip or knee replacement surgery, to reduce the risk of stroke and systemic embolism in patients with nonvalvular atrial fibrillation, and for the treatment and reduction of risk of recurrence of DVT and PE to reduce the risk of major cardiovascular events in patients with coronary artery disease (CAD) and peripheral artery disease (PAD), for the treatment and secondary prevention of thromboembolism in pediatric patients, and for thromboprophylaxis in pediatric patients following the Fontan procedure; OPSUMIT (macitentan) as monotherapy or in combination, indicated for the long-term treatment of pulmonary arterial hypertension (PAH); UPTRAVI (selexipag), the only approved oral and intravenous, selective IP receptor agonist targeting a prostacyclin pathway in PAH. Many of these medicines were developed in collaboration with strategic partners or are licensed from other companies and maintain active lifecycle development programs.
MedTech
The MedTech segment includes a broad portfolio of products used in the cardiovascular, orthopaedics, surgery, and vision categories. The Cardiovascular (previously referred to as Interventional solutions) portfolio includes electrophysiology products to treat heart rhythm disorders, the heart recovery portfolio (Abiomed) which includes technologies to treat severe coronary artery disease requiring high-risk PCI or AMI cardiogenic shock, circulatory restoration products (Shockwave) for the treatment of calcified coronary artery disease (CAD) and peripheral artery disease (PAD), and neurovascular care that treats hemorrhagic and ischemic stroke. The Orthopaedics portfolio includes products and enabling technologies that support hips, knees, trauma, spine, sports, and others. The Surgery portfolios include advanced and general surgery technologies, as well as solutions that focus on breast aesthetics and reconstruction (Mentor). Vision products include ACUVUE brand contact lenses and TECNIS intraocular lenses for cataract surgery. These products are distributed to wholesalers, hospitals, and retailers and are used predominantly in the professional fields by physicians, nurses, hospitals, eye care professionals, and clinics.
Geographic areas
The Company conducts business in virtually all countries of the world with the primary focus on products related to human health and well-being. The products made and sold in the international business include many of those described above under Segments of Business – Innovative Medicine and MedTech. However, the principal markets, products and methods of distribution in the international business vary with the country and the culture. The products sold in the international business include those developed in the U.S. and by subsidiaries abroad.
Investments and activities in some countries outside the U.S. are subject to higher risks than comparable U.S. activities because the investment and commercial climate may be influenced by financial instability in international economies, restrictive economic policies and political and legal system uncertainties.
Raw materials
Raw materials essential to the Company's business are generally readily available from multiple sources. Where there are exceptions, the temporary unavailability of those raw materials would not likely have a material adverse effect on the financial results of the Company.
Patents
The Company's subsidiaries have made a practice of obtaining patent protection on their products and processes where possible. They own, or are licensed under, a significant number of patents in the U.S. and other countries relating to their products, product uses, formulations and manufacturing processes, which in the aggregate are believed to be of material importance to the Company in the operation of its businesses. The Company’s subsidiaries face patent challenges from third parties, including challenges seeking to manufacture and market generic and biosimilar versions of the Company's key pharmaceutical products prior to expiration of the applicable patents covering those products. Significant legal proceedings
and claims involving the Company's patent and other intellectual property are described in Note 19 Legal proceedings—Intellectual property of the Notes to Consolidated Financial Statements included in Item 8 of this Report.
Sales of the Company’s largest product, collectively DARZALEX (daratumumab) and DARZALEX FASPRO (daratumumab and hyaluronidase-fihj), accounted for approximately 13.1% of the Company's total revenues for fiscal 2024. Accordingly, the patents related to these products are believed to be material to the Company. Genmab A/S owns two patent families related to DARZALEX, and Janssen Biotech, Inc. has an exclusive license to those patent families. The two patent families both expire in the United States in 2029, and in Europe, compound/use patent protection in select countries extends to 2031/2032. Janssen Biotech, Inc. owns a separate patent portfolio related to DARZALEX FASPRO.
Sales of the Company’s second largest product, STELARA (ustekinumab) accounted for approximately 11.7% of the Company's total revenues for fiscal 2024. According to patent settlement and license agreements, the Company expects continued launches of biosimilar versions of STELARA in Europe and the United States in 2025 which will impact the Company’s sales of STELARA.
Trademarks
The Company’s subsidiaries have made a practice of selling their products under trademarks and of obtaining protection for these trademarks by all available means. These trademarks are protected by registration in the U.S. and other countries where such products are marketed. The Company considers these trademarks in the aggregate to be of material importance in the operation of its businesses.
Seasonality
Worldwide sales do not reflect any significant degree of seasonality; however, spending has typically been heavier in the fourth quarter of each year than in other quarters. This reflects increased spending decisions, principally for advertising and research and development activity.
Competition
In all of their product lines, the Company's subsidiaries compete with companies both locally and globally. Competition exists in all product lines without regard to the number and size of the competing companies involved. Competition in research, both internally and externally sourced, involving the development and the improvement of new and existing products and processes, is particularly significant. The development of new and innovative products, as well as protecting the underlying intellectual property of the Company’s product portfolio, is important to the Company's success in all areas of its business. The competitive environment requires substantial investments in continuing research.
Environment
The Company is subject to a variety of environmental laws and regulations in the United States and other jurisdictions. The Company believes that its operations comply in all material respects with applicable environmental laws and regulations. The Company’s compliance with these requirements is not expected to have a material effect upon its capital expenditures, cash flows, earnings or competitive position.
Regulation
The Company’s businesses are subject to varying degrees of governmental regulation in the countries in which operations are conducted, and the general trend is toward increasingly stringent regulation and enforcement. The Company is subject to costly and complex U.S. and foreign laws and governmental regulations, and any adverse regulatory action may materially adversely affect the Company's financial condition and business operations. In the U.S., the pharmaceutical product and medical technology industries have long been subject to regulation by various federal and state agencies, primarily as to product safety, efficacy, manufacturing, advertising, labeling and safety reporting. The exercise of broad regulatory powers by the U.S. Food and Drug Administration (the U.S. FDA) continues to result in increases in the amounts of testing and documentation required for U.S. FDA approval of new drugs and devices and a corresponding increase in the expense of product introduction. Similar trends are also evident in major markets outside of the U.S.
The medical device regulatory framework and the evolving privacy, data localization, and emerging cyber security laws and regulations around the world are examples of such increased regulation. Within the U.S., an increasing number of U.S. States have enacted comprehensive privacy laws, and federal regulators (e.g., the U.S. FDA, FTC and HHS) continue to stress the intersection of health and privacy as a compliance and enforcement priority. In the EU, multiple directives and laws (including NIS2, EHDS, the Data Act, the Cyber Resilience Act, and the AI Act) are rapidly changing privacy and cybersecurity compliance requirements while introducing new enforcement risks. In addition, China has introduced broad personal information protection and data security regulations, with more anticipated, thereby increasing China’s scrutiny of company compliance and data transfer practices. With other jurisdictions enacting similar privacy laws, local data protection authorities will force greater accountability on the collection, access and use of personal data in the healthcare industry. These laws can also restrict transfers of data across borders, potentially impacting how data-driven health care solutions are developed and deployed globally in a compliant manner. Moreover, as a result of the broad scale release and availability of Artificial Intelligence (AI) technologies such as generative AI, a global trend towards more comprehensive and nuanced regulation to ensure the ethical use, privacy, and security of AI is underway that includes standards for transparency, accountability, and fairness, which will require compliance developments or enhancements.
The regulatory agencies under whose purview the Company operates have administrative powers that may subject it to actions such as product withdrawals, recalls, seizure of products and other civil and criminal sanctions. In some cases, the Company’s subsidiaries may deem it advisable to initiate product recalls regardless of whether it has been required or directed to.
The U.S. FDA and regulatory agencies around the globe are also increasing their enforcement activities. If the U.S. FDA were to conclude that we are not in compliance with applicable laws or regulations, or that any of our pharmaceutical products or medical technologies are ineffective or pose an unreasonable safety risk, the U.S. FDA could ban such products, detain or seize adulterated or misbranded products, order a recall, repair, replacement, or refund of such products, withdraw approval for such products, refuse to grant pending applications for marketing authorization or require certificates of foreign governments for exports, and/or require us to notify health professionals and others that the products present unreasonable risks of substantial harm to the public health. The U.S. FDA may also assess civil or criminal penalties against us, our officers or employees and impose operating restrictions on a company-wide basis, or enjoin and/or restrain certain conduct resulting in violations of applicable law. The U.S. FDA may also recommend prosecution to the U.S. Department of Justice. Any adverse regulatory action, depending on its magnitude, may restrict us from effectively marketing and selling our products and limit our ability to obtain future clearances, classifications or approvals, and could result in a substantial modification to our business practices and operations. Equivalent enforcement mechanisms exist in different countries in which we conduct business.
The costs of human healthcare have been and continue to be a subject of study, investigation and regulation by governmental agencies and legislative bodies around the world. In the U.S., attention has been focused by states, regulatory agencies and Congress on prices, profits, overutilization and the quality and costs of healthcare generally. Laws and regulations have been enacted to require adherence to strict compliance standards and prevent fraud and abuse in the healthcare industry. There is increased focus on interactions and financial relationships between healthcare companies and healthcare providers. Various state and federal transparency laws and regulations require disclosures of payments and other transfers of value made to certain healthcare practitioners, including physicians, teaching hospitals, and certain non-physician practitioners. Federal and foreign laws governing international business practices require strict compliance with anti-bribery standards and certain prohibitions with respect to payments to any foreign government official. Payors and Pharmacy Benefit Managers (PBMs) are a potent force in the marketplace, and increased attention is being paid to the impact of PBM practices on healthcare cost and access in the U.S.
Our business has been and continues to be affected by federal and state legislation that alters the pricing, coverage, and reimbursement landscape. At the federal level, in August 2022, President Biden signed into law the Inflation Reduction Act (IRA), which includes provisions that effectively authorize the government to establish prices for certain high-spend single-source drugs and biologics reimbursed by the Medicare program, starting in 2026 for Medicare Part D drugs and 2028 for Medicare Part B drugs. On August 29, 2023, the Centers for Medicare & Medicaid Services (“CMS”) published the first “Selected Drug” list, which includes XARELTO and STELARA as well as IMBRUVICA, which is developed in collaboration and co-commercialized in the U.S. with Pharmacyclics LLC, an AbbVie company. The Selected Drug list also included other medicines targeting disease states that are prevalent in the Medicare population. Although CMS published an explanation for how it determined prices for selected drugs in December 2024, uncertainty remains as to the methodology used to determine these prices. The IRA specifies a ceiling price but not a minimum price for selected drugs and does not require CMS to use a specific framework for determining selected drug prices. In any event, we anticipate that the selected products will be subjected to a government-established price for the Medicare population beginning in 2026.
The IRA also contains provisions that impose rebates if certain prices increase at a rate that outpaces the rate of inflation, beginning October 1, 2022, for Medicare Part D drugs and January 1, 2023, for Medicare Part B drugs. Separate IRA provisions redesign the Medicare Part D benefit in various ways, including by shifting a greater portion of costs to manufacturers within certain coverage phases and replacing the Part D coverage gap discount program with a new manufacturer discounting program. Failure to comply with IRA provisions may subject manufacturers to various penalties, including civil monetary penalties.
In July 2023, Janssen Pharmaceuticals, Inc. (Janssen) filed litigation against the U.S. Department of Health and Human Services as well as the Centers for Medicare and Medicaid Services challenging the constitutionality of the IRA's Medicare Drug Price Negotiation Program. The litigation requests a declaration that the IRA violates Janssen’s rights under the First Amendment and the Fifth Amendment to the Constitution and therefore that Janssen is not subject to the IRA’s mandatory pricing scheme. The impact of the IRA on our business and the broader pharmaceutical industry remains uncertain, as litigation filed by Janssen and other pharmaceutical companies remains ongoing and while CMS has publicly announced the maximum fair price for each of the selected drugs, implementation of the program is still in progress. In April 2024, Janssen appealed the district court’s denial of its summary judgment motion to the Third Circuit.
Additionally, we expect continued scrutiny on drug pricing and government price reporting from Congress, agencies, and other bodies at the federal and state levels, which may result in additional regulations or other mechanisms to increase pricing transparency and controls.
There are a number of additional bills pending in Congress and healthcare reform proposals at the state level that would affect drug pricing, including in the Medicare and Medicaid programs. This changing legal landscape has both positive and negative impacts on the U.S. healthcare industry with much remaining uncertain as to how various provisions of federal and state law, and potential modification or repeal of these laws, will ultimately affect the industry. The IRA and any other federal or state legislative change could affect the pricing and market conditions for our products.
In addition, business practices in the healthcare industry have come under increased scrutiny, particularly in the U.S., by government agencies and state attorneys general, and resulting investigations and prosecutions carry the risk of significant civil and criminal penalties. Of note is the increased enforcement activity by data protection authorities in various jurisdictions, particularly in the European Union, where significant fines have been levied on companies for data breaches, violations of privacy requirements, and unlawful cross-border data transfers. In the U.S., the Federal Trade Commission has stepped up enforcement of data privacy with several significant settlements (including settlements concerning the downstream sharing of personal information and use and disclosure of personal health data) and there have been a material increase in class-action lawsuits linked to the collection and use of biometric data and use of tracking technologies.
Further, the Company relies on global supply chains, and production and distribution processes, that are complex, and subject to increasing regulatory requirements that may affect sourcing, supply and pricing of materials used in the Company's products. These processes also are subject to complex and lengthy regulatory approvals.
Employees and human capital management
As of December 29, 2024 and December 31, 2023 the number of employees was approximately:
| | | | | | | | |
| 2024 | 2023 |
Employees(1) | 139,800 | | 134,400 | |
Full-time equivalent (FTE) positions(2) | 138,100 | | 131,900 | |
(1)“Employee” is defined as an individual working full-time or part-time, excluding fixed term employees, interns and co-op employees. Employee data may not include full population from more recently acquired companies and individuals on long-term disability are excluded. Contingent workers, contractors and subcontractors are also excluded. Shockwave has been included in the fiscal 2024 headcount in the above table.
(2)FTE represents the total number of full-time equivalent positions and does not reflect the total number of individual employees as some work part-time.
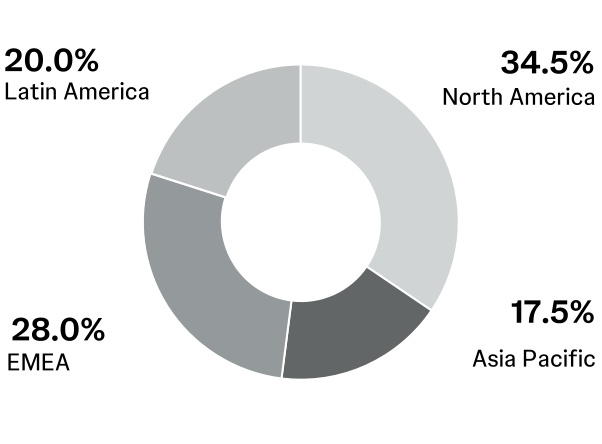
Employees by region (in percentages)
Strategy
The Company believes that its employees are critical to its continued success and are an essential element of its long-term strategy. Management is responsible for ensuring that its policies and processes reflect and reinforce the Company's desired corporate culture, including policies and processes related to strategy, risk management, and ethics and compliance. The Company’s human capital management strategy is built on three fundamental focus areas:
•Attracting and recruiting top talent
•Developing and retaining top talent
•Empowering and inspiring talent
Underpinning these focus areas are ongoing efforts to cultivate and foster a culture built on innovation, health, well-being and safety, inclusion and belonging where the Company's employees are encouraged to succeed both professionally and personally while helping the Company achieve its business goals.
Culture and employee engagement
At Johnson & Johnson, employees are guided by Our Credo, which sets forth the Company's responsibilities to patients, consumers, customers, healthcare professionals, employees, communities and shareholders. Employees worldwide must adhere to the Company’s Code of Business Conduct, which sets fundamental requirements and serves as a foundation for the Company policies, procedures and guidelines, all of which provide additional guidance on expected employee behaviors in every market where it operates. The Company conducts global surveys that offer its employees the ability to provide feedback and valuable insight to help address potential human resources risks and identify opportunities to improve. In 2024, 94% of global employees across 73 countries participated in Our Credo Survey which was offered in 36 languages.
Growth and development
To lead in the changing healthcare landscape, it is crucial that the Company continue to attract and retain top talent. In 2024, the Company's voluntary turnover rate was 6.3%. The Company believes that its employees must be equipped with the right knowledge and skills and be provided with opportunities to grow and develop in their careers. Accordingly, professional development programs and educational resources are available to all employees. The Company's objective is to foster a learning culture that helps shape each person’s unique career path while creating a robust pipeline of talent to deliver on the Company’s long-term strategies. In furtherance of this objective, the Company deploys a global approach to ensure development is for everyone, regardless of where they are on their career journey. To prioritize learning, the Company recently held Johnson & Johnson's second Global Learning Day. Employees were encouraged to set aside a full day to explore skill-building courses on J&J Learn, the new state-of-the-art learning platform.
Our workforce
As stated in Our Credo, we are responsible to our employees who work with us throughout the world. The Company is committed to cultivating, fostering and advancing an inclusive, credo-based work environment for employees that recognizes and rewards based on merit. The Company is dedicated to the values in Our Credo and strives to meet the needs of its employees and stakeholders through compliance with law and the following evidence based strategies:
•Sustain a global workforce of individuals with many different backgrounds, abilities, cultures and perspectives
•Maintain a work environment where each person’s dignity is respected and they have an opportunity to advance based on their merit
•Drive innovation and growth with our business to serve markets around the world
Our approach with respect to our workforce is guided by applicable laws, internal and external insights, global best practices and employee feedback.
Compensation and benefits
As part of the Company's total rewards philosophy, the Company offers competitive compensation and benefits to attract and retain top talent. The Company is committed to fair treatment in its compensation and benefits for employees at all levels. The Company observes legal minimum wage provisions and exceeds them where possible. The Company's total rewards offerings include an array of programs to support its employees' well-being, including annual performance incentive opportunities, pension and retirement savings programs, health and welfare benefits, paid time off, leave programs, flexible work schedules and employee assistance programs.
Health, wellness and safety
The Company’s investment in employee health, well-being and safety is built on its conviction that advancing health for humanity starts with advancing the health of its employees. With the right awareness, focus, practices and tools, the Company works to ensure that all its employees around the world, as well as contingent workers, contractors and visitors to the Company's sites, can work safely. The Company has continuously expanded health and well-being programs throughout the Company and across the globe, incorporating new thinking and technologies to keep its offerings best-in-class and to help employees achieve their personal health goals. The programs and practices the Company provides—physical, mental, emotional and financial—help promote holistic employee health. The Company continues to address our employees needs through J&J Flex, a hybrid model that empowers the Company’s office-based employees to find a balance of in-person and remote work, while preserving the Company's culture and need for face-to-face engagement and leadership.
Available information
The Company’s main corporate website address is www.jnj.com. The Company makes its SEC filings available on the Company’s website at www.investor.jnj.com/financials/sec-filings, as soon as reasonably practicable after having been electronically filed or furnished to the SEC. The Company's SEC filings are also available at the SEC’s website at www.sec.gov.
Investors and the public should note that the Company also announces information through its press releases and media statements at www.jnj.com/mediacenter, investor.jnj.com and www.factsabouttalc.com. We use these websites to communicate with investors and the public about our products, litigation and other matters. It is possible that the information we post to these websites could be deemed to be material information. Therefore, we encourage investors and others interested in the Company to review the information posted to these websites in conjunction with www.jnj.com, the Company's SEC filings, press releases, public conference calls and webcasts.
In addition, the Restated Certificate of Incorporation, as amended, Amended and Restated By-Laws, the written charters of the Audit Committee, the Compensation & Benefits Committee, the Nominating & Corporate Governance Committee, the Regulatory Compliance & Sustainability Committee, and the Science & Technology Committee of the Board of Directors, and the Company’s Principles of Corporate Governance, Code of Business Conduct (for employees), Code of Business Conduct & Ethics for Members of the Board of Directors and Executive Officers, and other corporate governance materials are available on the Company's website at www.investor.jnj.com/governance/corporate-governance-overview and will be provided without charge to any shareholder submitting a written request, as provided above. The information on www.jnj.com, investor.jnj.com and www.factsabouttalc.com is not, and will not be deemed, a part of this Report or incorporated into any other filings the Company makes with the SEC.
Item 1A. Risk factors
An investment in the Company’s common stock or debt securities involves risks and uncertainties. The Company seeks to identify, manage and mitigate risks to our business, but uncertainties and risks are difficult to predict and many are outside of the Company’s control and cannot therefore be eliminated. In addition to the other information in this report and the Company’s other filings with the SEC, investors should consider carefully the factors set forth below. Investors should be aware that it is not possible to predict or identify all such factors and that the following is not meant to be a complete discussion of all potential risks or uncertainties. If known or unknown risks or uncertainties materialize, the Company’s business, results of operations or financial condition could be adversely affected, potentially in a material way.
Risks related to our business, industry and operations
The Company’s businesses operate in highly competitive product markets and competitive pressures could adversely affect the Company’s earnings.
The Company faces substantial competition in its two operating segments and in all geographic markets. The Company’s businesses compete with companies of all sizes on the basis of cost-effectiveness, technological innovations, intellectual property rights, product performance, real or perceived product advantages, pricing and availability and rate of reimbursement. The Company also competes with other market participants in securing rights to acquisitions, collaborations and licensing agreements with third parties. Competition for rights to product candidates and technologies may result in significant investment and acquisition costs and onerous agreement terms for the Company. Competitors’ development of more effective or less costly products, and/or their ability to secure patent and other intellectual property rights and successfully market products ahead of the Company, could negatively impact sales of the Company’s existing products as well as its ability to bring new products to market despite significant prior investment in the related product development. The Company may also experience operational and financial risk in connection with acquisitions if we are unable to fully identify potential risks and liabilities associated with acquired businesses or products, successfully integrate operations and employees, and successfully identify and realize synergies with existing businesses while containing acquisition-related strain on our management, operations and financial resources.
For the Company’s Innovative Medicine businesses, loss of patent exclusivity for a product often is followed by a substantial reduction in sales as competitors gain regulatory approval for generic, biosimilar and other competing products and enter the market. For the Company’s MedTech businesses, technological innovation, product quality, reputation and customer service are especially important to competitiveness. Development by other companies of new or improved products, processes and technologies could threaten to make the Company’s products or technologies less desirable, less economical or obsolete. The Company’s business and operations will be negatively impacted if we are unable to introduce new products or technological advances that are safe, more effective, more effectively marketed or otherwise outperform those of our competitors.
Interruptions and delays in manufacturing operations could adversely affect the Company’s business, sales and reputation.
The Company’s manufacturing of products requires the timely delivery of sufficient amounts of complex, high-quality components and materials. The Company’s subsidiaries operate 64 manufacturing facilities as well as sourcing from thousands of suppliers around the world. The Company has in the past, and may in the future, face unanticipated interruptions and delays in manufacturing through its internal or external supply chain. Manufacturing disruptions can occur for many reasons including regulatory action, production quality deviations or safety issues, labor disputes, labor shortages, site-specific incidents (such as fires), natural disasters such as hurricanes and other severe weather events, raw material shortages, lack of available inspectors, political unrest, terrorist attacks and epidemics or pandemics. Such delays and difficulties in manufacturing can result in product shortages, declines in sales and reputational impact as well as significant remediation and related costs associated with addressing the shortage.
The Company relies on third parties to manufacture and supply certain of our products. Any failure by or loss of a third-party manufacturer or supplier could result in delays and increased costs, which may adversely affect our business.
The Company relies on third parties to manufacture and supply certain of our raw materials, component parts and products. We depend on these third-party manufacturers to allocate to us a portion of their manufacturing capacity sufficient to meet our needs, to produce products of acceptable quality and at acceptable manufacturing yields and to deliver those products to us on a timely basis and at acceptable prices. However, we cannot guarantee that these third-party manufacturers will be able to meet our near-term or long-term manufacturing requirements, which could result in lost sales and have an adverse effect on our business.
Other risks associated with our reliance on third parties to manufacture these products include reliance on the third party for regulatory compliance and quality assurance, misappropriation of the Company’s intellectual property, limited ability to manage our inventory, possible breach of the manufacturing agreement by the third party and the possible termination or nonrenewal of the manufacturing agreement by the third party at a time that is costly or inconvenient for us. Moreover, if any of our third-party manufacturers suffers any damage to facilities, loses benefits under material agreements, experiences power outages, encounters financial difficulties, is unable to secure necessary raw materials from its suppliers or suffers any other reduction in efficiency, the Company may experience significant business disruption. In the event of any such disruption, the Company would need to seek and source other qualified third-party manufacturers, likely resulting in further delays and increased costs which could affect our business adversely.
Counterfeit versions of our products could harm our patients and have a negative impact on our revenues, earnings, reputation and business.
Our industry continues to be challenged by the vulnerability of distribution channels to illegal counterfeiting and the presence of counterfeit products in a growing number of markets and over the Internet. Third parties may illegally distribute and sell counterfeit versions of our products, which do not meet our rigorous manufacturing and testing standards. To distributors and patients, counterfeit products may be visually indistinguishable from the authentic version. Counterfeit medicines pose a risk to patient health and safety because of the conditions under which they are manufactured – often in unregulated, unlicensed, uninspected and unsanitary sites – as well as the lack of regulation of their contents.
The industry’s failure to mitigate the threat of counterfeit medicines could adversely impact our business and reputation by impacting patient confidence in our authentic products, potentially resulting in lost sales, product recalls, and an increased threat of litigation. In addition, diversion of our products from their authorized market into other channels may result in reduced revenues and negatively affect our profitability.
Global health crises, pandemics, epidemics, or other outbreaks could adversely disrupt or impact certain aspects of the Company’s business, results of operations and financial condition.
We are subject to risks associated with global health crises, epidemics, pandemics and other outbreaks (such incident(s), a health crisis or health crises). The spread of health crises have caused and may cause the Company to modify its business practices, and take further actions as may be required by government authorities or as the Company determines are in the best interests of our patients, customers, employees and business partners under such circumstances. Impacts to the Company have included and may include adverse impacts to results of operations and financial condition, including lower sales and reduced customer demand and usage of certain of our products. While the Company has robust business continuity plans in place across our global supply chain network designed to help mitigate the impact of health crises, these efforts may not completely prevent our business from being adversely affected in the event of a health crisis. Health crises could adversely impact the Company’s operations, including, among other things, our manufacturing operations, supply chain, third-party suppliers, sales and marketing, and clinical trial operations. Any of these factors could adversely affect the Company’s business, financial results, and global economic conditions generally.
Risks related to government regulation and legal proceedings
Global sales in the Company’s Innovative Medicine and MedTech segments may be negatively impacted by healthcare reforms and increasing pricing pressures.
Sales of the Company’s Innovative Medicine and MedTech products are significantly affected by reimbursements by third-party payors such as government healthcare programs, private insurance plans and managed care organizations. As part of various efforts to contain healthcare costs, these payors are putting downward pressure on prices at which products will be reimbursed. In the U.S., increased purchasing power of entities that negotiate on behalf of Medicare, Medicaid, and private sector beneficiaries, in part due to continued consolidation among healthcare providers, could result in further pricing pressures. In addition, recent legislation and ongoing political scrutiny on pricing, coverage and reimbursement could result in additional pricing pressures. Specifically, the Inflation Reduction Act of 2022 (IRA) has changed Medicare Part D benefit design and has subjected certain of the Company's products to government-established pricing beginning in 2026 and may subject additional products in the future. Failure to adhere to the government's interpretations of the law pending ongoing litigation may expose the Company to penalties. In addition, change to Medicare Part D could have a negative impact on U.S. Innovative Medicine sales. Further, increased third-party utilization of the 340B Federal Drug Discount Program from expanded interpretations of the statute and program abuse may have a negative impact on the Company's financial performance. Outside the U.S., numerous major markets, including the EU, United Kingdom, Japan and China, have pervasive government involvement in funding healthcare and, in that regard, directly or indirectly impose price controls, limit access to, or reimbursement for, the Company’s products, or reduce the value of its intellectual property protection.
We are subject to an increasing number of costly and complex governmental regulations in the countries in which operations are conducted which may materially adversely affect the Company’s financial condition and business operations.
As described in Item 1. Business, the Company is subject to an increasing number of extensive government laws and regulations, investigations and legal action by national, state and local government agencies in the U.S. and other countries in which it operates. For example, changes to the U.S. FDA’s timing or requirements for approval or clearance of our products may have a negative impact on our ability to bring new products to market. New and changing laws, regulations, executive orders and other directives may also impose deadlines on the Company, or its third-party suppliers, manufacturers or other partners and providers, for which there may be insufficient time to implement changes to comply with such new regulations and may result in manufacturing delays or other supply chain constraints. If the Company is unable to identify ways to mitigate these delays or constraints, there may be an adverse effect on sales and access to our products.
The Company is subject to significant legal proceedings that can result in significant expenses, fines and reputational damage.
In the ordinary course of business, Johnson & Johnson and its subsidiaries are subject to numerous claims and lawsuits involving various issues such as product liability, patent disputes and claims that their product sales, marketing and pricing practices violate various antitrust, unfair trade practices and/or consumer protection laws. The Company’s more significant legal proceedings are described in Note 19 Legal proceedings under Notes to the Consolidated Financial Statements included in Item 8 of this Report. Litigation, in general, and securities, derivative action, class action and multi-district litigation, in particular, can be expensive and disruptive. Some of these matters may include thousands of plaintiffs, may involve parties seeking large and/or indeterminate amounts, including punitive or exemplary damages, and may remain unresolved for several years. For example, the Company is a defendant in numerous lawsuits arising out of the use of body powders containing talc, primarily JOHNSON’S Baby Powder. While the Company believes it has substantial defenses in these matters, it is not feasible to predict the ultimate outcome of litigation. The Company has been and could in the future be required to pay significant amounts as a result of settlements or judgments in these matters, potentially in excess of accruals, including matters where the Company could be held jointly and severally liable among other defendants. The resolution of, or increase in accruals for, one or more of these matters in any reporting period could have a material adverse effect on the Company’s results of operations and cash flows for that period. The Company does not purchase third-party product liability insurance; however, the Company utilizes a wholly owned captive insurance company subject to certain limits.
Product reliability, safety and effectiveness concerns can have significant negative impacts on sales and results of operations, lead to litigation and cause reputational damage.
Product concerns, whether raised internally or by litigants, regulators or consumer advocates, and whether or not based on scientific evidence, can result in safety alerts, product recalls, governmental investigations, regulatory action on the part of the U.S. FDA (or its counterpart in other countries), private claims and lawsuits, payment of fines and settlements, declining sales and reputational damage. These circumstances can also result in damage to brand image, brand equity and consumer trust in the Company’s products. Product recalls have in the past, and could in the future, prompt government investigations and inspections, the shutdown of manufacturing facilities, continued product shortages and related sales declines, significant remediation costs, reputational damage, possible civil penalties and criminal prosecution.
The Company faces significant regulatory scrutiny, which imposes significant compliance costs and exposes the Company to government investigations, legal actions and penalties.
The rapid increase in new government laws and regulations imposes significant compliance costs to the Company and a failure of the Company to timely implement changes to comply with these new laws may expose the Company to investigations, legal actions or penalties. Regulatory issues regarding compliance with current Good Manufacturing Practices (cGMP) (and comparable quality regulations in foreign countries) by manufacturers of drugs and devices can lead to fines and penalties, product recalls, product shortages, interruptions in production, delays in new product approvals and litigation. In addition, the marketing, pricing and sale of the Company’s products are subject to regulation, investigations and legal actions including under the Federal Food, Drug, and Cosmetic Act, the Medicaid Rebate Program, federal and state false claims acts, state unfair trade practices acts and consumer protection laws. Scrutiny of healthcare industry business practices by government agencies and state attorneys general in the U.S., and any resulting investigations and prosecutions, carry risk of significant civil and criminal penalties including, but not limited to, debarment from participation in government healthcare programs. Any such debarment could have a material adverse effect on the Company’s business and results of operations. The most significant current investigations and litigation brought by government agencies are described in Note 19 Legal proceedings—Government proceedings under Notes to the Consolidated Financial Statements included in Item 8 of this Report.
Changes in tax laws or exposures to additional tax liabilities could negatively impact the Company’s operating results.
Changes in tax laws or regulations around the world, including in the U.S. and as led by the Organization for Economic Cooperation and Development, such as the enactment by certain EU and non-EU countries, and the anticipated enactment by additional countries, of a global minimum tax, could negatively impact the Company’s effective tax rate and results of operations. A change in statutory tax rate or certain international tax provisions in any country would result in the revaluation of the Company’s deferred tax assets and liabilities related to that particular jurisdiction in the period in which the new tax law is enacted. This change would result in an expense or benefit recorded to the Company’s Consolidated Statement of Earnings. The Company closely monitors these proposals as they arise in the countries where it operates. Changes to tax laws or regulations may occur at any time, and any related expense or benefit recorded may be material to the fiscal quarter and year in which the law change is enacted.
See Note 8 Income taxes under Notes to the Consolidated Financial Statements included in Item 8 of this Report for additional information.
The Company conducts business and files tax returns in numerous countries and is addressing tax audits and disputes with many tax authorities. In connection with various government initiatives, companies are required to disclose more information to tax authorities on operations around the world, which may lead to greater audit scrutiny of profits earned in other countries. The Company regularly assesses the likely outcomes of its tax audits and disputes to determine the appropriateness of its tax reserves. However, any tax authority could take a position on tax treatment that is contrary to the Company’s expectations, which could result in tax liabilities in excess of reserves.
Risks related to our intellectual property
The Company faces increased challenges to intellectual property rights central to its business.
The Company owns or licenses a significant number of patents and other proprietary rights relating to its products and manufacturing processes. These rights are essential to the Company’s businesses and the inability of the Company to secure and maintain these rights may have a detrimental impact on the Company’s financial results. Public policy, both within and outside the U.S., has become increasingly unfavorable toward intellectual property rights. The Company cannot be certain that it will secure and maintain adequate patent protection for new products and technologies in the United States and other important markets.
Competitors routinely challenge the validity or extent of the Company’s owned or licensed patents and proprietary rights through litigation, interferences, oppositions and other proceedings, such as inter partes review (IPR) proceedings before the United States Patent & Trademark Office (USPTO). These proceedings absorb resources and can be protracted as well as unpredictable. In addition, others may claim the Company has infringed their intellectual property rights, including copyrights, patents, or trademarks, and/or has misappropriated their trade secrets, any of which could result in an injunction and/or the need to pay past damages and future royalties and adversely affect the competitive position and sales of our products.
The Company has faced increasing patent challenges from third parties seeking to manufacture and market generic and biosimilar versions of the Company’s key pharmaceutical products prior to expiration of the applicable patents covering those products. In the event the Company is not successful in defending its patents against such challenges, or upon the “at-risk” launch by the generic or biosimilar firm of its product, the Company can lose a major portion of revenues for the referenced product in a very short period of time. Current legal proceedings involving the Company’s patents and other intellectual property rights are described in Note 19 Legal proceedings—Intellectual property under Notes to the Consolidated Financial Statements included in Item 8 of this Report.
Risks related to product development, regulatory approval and commercialization
Significant challenges or delays in the Company’s innovation, development and implementation of new products, technologies and indications could have an adverse impact on the Company’s long-term success.
The Company’s continued growth and success depends on its ability to innovate and develop new and differentiated products and services that address the evolving healthcare needs of patients, providers and consumers. Development of successful products and technologies is also necessary to offset revenue losses when the Company’s existing products lose market share due to various factors such as competition and loss of patent exclusivity. New products introduced within the past five years accounted for approximately 25% of 2024 sales. The Company cannot be certain when or whether it will be able to develop, license or otherwise acquire companies, products and technologies, whether particular product candidates will be granted regulatory approval, and, if approved, whether the products will be commercially successful.
The Company pursues product development through internal research and development as well as through collaborations, acquisitions, joint ventures and licensing or other arrangements with third parties. In all of these contexts, developing new products, particularly pharmaceutical and biotechnology products and medical devices, requires significant investment of resources over many years. Only a very few biopharmaceutical research and development programs result in commercially viable products. The process depends on many factors including the ability to: discern patients’ and healthcare providers’ future needs; develop promising new compounds, strategies and technologies; achieve successful clinical trial results; secure effective intellectual property protection; obtain regulatory approvals on a timely basis; and, if and when they reach the market, successfully differentiate the Company’s products from competing products and approaches to treatment. Moreover, the development and regulatory approval of new products may be delayed due to limits on federal agency budgets or personnel, including reductions to the U.S. FDA’s budget, employees, and operations, which may lead to slower response times and longer review periods. After approval, new products or enhancements to existing products may not be accepted quickly or significantly in the marketplace due to product and price competition, changes in customer preferences or healthcare purchasing patterns, resistance by healthcare providers or uncertainty over third-party reimbursement. Even following initial regulatory approval, the success of a product can be adversely impacted by safety and efficacy findings in larger real-world patient populations, as well as market entry of competitive products.
The Company leverages the use of data science, machine learning and other forms of AI and emerging technologies across varying parts of its business and operations, and the introduction and incorporation of AI may result in unintended consequences or other new or expanded risks and liabilities. AI technology is continuously evolving, and the AI technologies we develop and adopt may become obsolete earlier than planned. Our investments in these technologies may not result in the benefits we anticipate or enable us to obtain or maintain a competitive advantage. The application of AI in our business is emerging and evolving alongside new laws and regulations that may entail significant costs or ultimately limit our ability to continue the use of these technologies. These technologies also carry inherent risks related to data privacy and security further described below.
Risks related to financial and economic market conditions
The Company faces a variety of financial, economic, legal, social and political risks associated with conducting business internationally.
The Company’s extensive operations and business activity throughout the world are accompanied by certain financial, economic, legal, social and political risks, including those listed below.
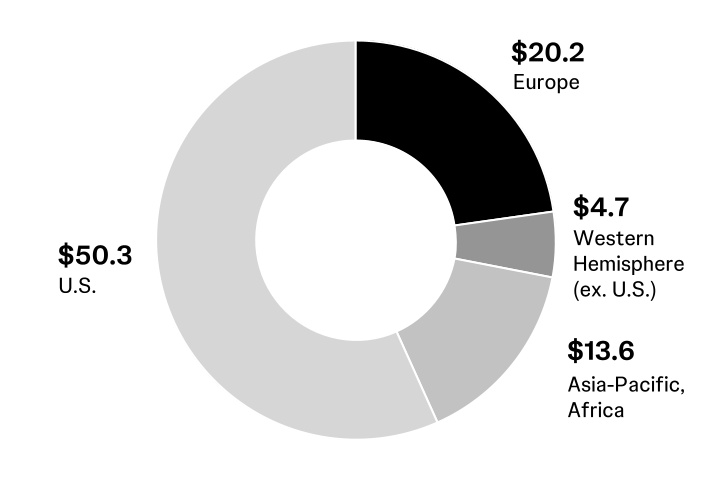
Foreign currency exchange: In fiscal 2024, approximately 43% of the Company’s sales occurred outside of the U.S., with approximately 23% in Europe, 5% in the Western Hemisphere, excluding the U.S., and 15% in the Asia-Pacific and Africa region. Changes in non-U.S. currencies relative to the U.S. dollar impact the Company’s revenues and expenses. While the Company uses financial instruments to mitigate the impact of fluctuations in currency exchange rates on its cash flows, unhedged exposures continue to be subject to currency fluctuations. In addition, the weakening or strengthening of the U.S. dollar may result in significant favorable or unfavorable translation effects when the operating results of the Company’s non-U.S. business activity are translated into U.S. dollars.
Inflation and currency devaluation risks: The Company faces challenges in maintaining profitability of operations in economies experiencing high inflation rates. Specifically, the Company has accounted for operations in Argentina, Turkey, Venezuela and Egypt (beginning in the fiscal fourth quarter of 2024) as highly inflationary, as the prior three-year cumulative inflation rate surpassed 100%. While the Company strives to maintain profit margins in these areas through cost reduction programs, productivity improvements and periodic price increases, it might experience operating losses as a result of continued inflation.
In addition, the impact of currency devaluations in countries experiencing high inflation rates or significant currency exchange fluctuations could negatively impact the Company’s operating results.
Illegal importation of pharmaceutical products: The illegal importation of pharmaceutical products from countries where government price controls or other market dynamics result in lower prices may adversely affect the Company’s sales and profitability in the U.S. and other countries in which the Company operates. With the exception of limited quantities of prescription drugs for personal use, foreign imports of pharmaceutical products are illegal under current U.S. law. However, the volume of illegal imports continues to rise as the ability of patients and other customers to obtain the lower-priced imports has grown significantly.
Anti-bribery and other regulations: The Company is subject to various federal and foreign laws that govern its international business practices with respect to payments to government officials. Those laws include the U.S. Foreign Corrupt Practices Act (FCPA), which prohibits U.S. publicly traded companies from promising, offering, or giving anything of value to foreign officials with the corrupt intent of influencing the foreign official for the purpose of helping the Company obtain or retain business or gain any improper advantage. The Company’s business is heavily regulated and therefore involves significant interaction with foreign officials. Also, in many countries outside the U.S., the healthcare providers who prescribe human pharmaceuticals are employed by the government and the purchasers of human pharmaceuticals are government entities; therefore, the Company’s interactions with these prescribers and purchasers are subject to regulation under the FCPA. In addition to the U.S. application and enforcement of the FCPA, various jurisdictions in which the Company operates have laws and regulations, including the U.K. Bribery Act 2010, aimed at preventing and penalizing corrupt and anticompetitive behavior. Enforcement activities under these laws could subject the Company to additional administrative and legal proceedings and actions, which could include claims for civil penalties, criminal sanctions, and administrative remedies, including exclusion from healthcare programs.
Other financial, economic, legal, social and political risks. Other risks inherent in conducting business globally include:
•local and regional economic environments and policies in the markets that we serve, including interest rates, monetary policy, inflation, economic growth, recession, commodity prices, and currency controls or other limitations on the ability to expatriate cash;
•protective economic policies taken by governments, such as trade protection measures, increased antitrust reporting requirements and enforcement activity, and import/export licensing requirements;
•compliance with local regulations and laws including, in some countries, regulatory requirements restricting the Company’s ability to manufacture or sell its products in the relevant market;
•diminished protection of intellectual property and contractual rights in certain jurisdictions;
•potential nationalization or expropriation of the Company’s foreign assets;
•political or social upheavals, economic instability, repression, or human rights issues; and
•geopolitical events, including natural disasters, disruptions to markets due to war, armed conflict, terrorism, epidemics or pandemics.
Due to the international nature of the Company's business, geopolitical or economic changes or events, including global tensions and war, could adversely affect our business, results of operations or financial condition.
As described above, the Company has extensive operations and business activity throughout the world. Global tensions, conflict and/or war among any of the countries in which we conduct business or distribute our products may result in foreign currency volatility, decreased demand for our products in affected countries, and challenges to our global supply chain related to increased costs of materials and other inputs for our products and suppliers. Most recently, we have experienced, and expect to continue to experience, impacts to the Company's business resulting from the Russia-Ukraine war, rising conflict in the Middle East as well as increasing tensions between the U.S. and China. In response to heightened conflict, such as the Russia-Ukraine war, governments may impose export controls and broad financial and economic sanctions. Our business and operations may be further impacted by the imposition of tariffs, trade protection measures or other policies adopted by any country that favor domestic companies and technologies over foreign competitors. Additional sanctions or other measures may be imposed by the global community, including but not limited to limitations on our ability to file, prosecute and maintain patents, trademarks and other intellectual property rights. Furthermore, in some countries, such as in Russia, action may be taken that allows companies and individuals to exploit inventions owned by patent holders from the United States and many other countries without consent or compensation and we may not be able to prevent third parties from practicing the Company's inventions in Russia or from selling or importing products in and into Russia. In addition, the U.S. government recently announced tariffs on products manufactured in several jurisdictions, including China, Mexico and Canada, and has
made announcements regarding the potential imposition of tariffs on other jurisdictions. While certain of the announced tariffs have been delayed, the U.S. government may in the future pause, reimpose or increase tariffs, and countries subject to such tariffs have and in the future may impose reciprocal tariffs or other restrictive trade measures in response. Any of these actions could increase uncertainties and associated risks relating to the Company’s global operations.
Weak financial performance, failure to maintain a satisfactory credit rating or disruptions in the financial markets could adversely affect our liquidity, capital position, borrowing costs and access to capital markets.
We currently maintain investment grade credit ratings with Moody’s Investors Service and Standard & Poor’s Ratings Services. Rating agencies routinely evaluate us, and their ratings of our long-term and short-term debt are based on a number of factors. Any downgrade of our credit ratings by a credit rating agency, whether as a result of our actions or factors which are beyond our control, can increase the cost of borrowing under any indebtedness we may incur, reduce market capacity for our commercial paper or require the posting of additional collateral under our derivative contracts. There can be no assurance that we will be able to maintain our credit ratings, and any additional actual or anticipated changes or downgrades in our credit ratings, including any announcement that our ratings are under review for a downgrade, may have a negative impact on our liquidity, capital position and access to capital markets.
Other risks
Our business depends on our ability to recruit and retain talented and highly skilled employees.
Our continued growth requires us to recruit and retain talented employees representing many different backgrounds, experiences, and skill sets. The market for highly skilled workers and leaders in our industry is extremely competitive and our ability to compete depends on our ability to hire, develop and motivate highly skilled personnel in all areas of our organization. Maintaining our brand and reputation, as well as a credo-based work environment enables us to attract top talent. If we are less successful in our recruiting efforts, or if we cannot retain highly skilled workers and key leaders, our ability to develop and deliver successful products and services may be adversely affected. In addition, effective succession planning is important to our long-term success. Any unsuccessful implementation of our succession plans or failure to ensure effective transfer of knowledge and smooth transitions involving key employees could adversely affect our business, financial condition, or results of operations.
Climate change or legal, regulatory or market measures to address climate change may negatively affect our business and results of operations.
Climate change resulting from increased concentrations of carbon dioxide and other greenhouse gases in the atmosphere could present risks to our operations, including an adverse impact on global temperatures, weather patterns and the frequency and severity of extreme weather and natural disasters. Natural disasters and extreme weather conditions, such as a hurricane, tornado, earthquake, wildfire or flooding, may pose physical risks to our facilities and disrupt the operation of our supply chain. The impacts of the changing climate on water resources may result in water scarcity, limiting our ability to access sufficient high-quality water in certain locations, which may increase operational costs.
Concern over climate change may also result in new or additional legal or regulatory requirements designed to reduce greenhouse gas emissions and/or mitigate the effects of climate change on the environment. If such laws or regulations are more stringent than current legal or regulatory obligations, we may experience disruption in, or an increase in the costs associated with sourcing, manufacturing and distribution of our products, which may adversely affect our business, results of operations or financial condition. Further, the impacts of climate change have an influence on customer preferences, and failure to provide climate-friendly products could potentially result in loss of market share.
An information security incident, including a cybersecurity breach, could have a negative impact on the Company’s business or reputation.
To meet business objectives, the Company relies on both internal information technology (IT) systems and networks, and those of third parties and their vendors, to process and store sensitive data (including confidential research, business plans, financial information, intellectual property, and personal data that may be subject to legal protection) to ensure the continuity of the Company’s supply chain and operations, and as part of many of the products we deliver to customers. The extensive range of information security and cybersecurity threats, which affect companies globally, pose a persistent risk to the security and availability of these systems and networks, including to customer products that are connected to or rely on such systems and networks, and the confidentiality, integrity, and availability of the Company’s sensitive data. The Company assesses these threats, responds to attacks and breaches that it has experienced, and makes investments to increase internal protection, detection, and response capabilities, as well as ensure the Company’s third-party providers have required capabilities and
controls, to address this risk. Because of the frequently changing attack techniques, along with the increased volume and sophistication of the attacks, there is the potential for the Company to be adversely impacted. This impact could result in reputational, competitive, operational or other business harm as well as financial costs and regulatory action. Also, increasing use of AI could increase these risks. The Company maintains cybersecurity insurance in the event of an information security or cyber incident; however, the coverage may not be sufficient to cover all financial, legal, business or reputational losses.
As a result of increased global tensions, the Company expects there will continue to be, an increased risk of information security or cybersecurity incidents, including cyberattacks perpetrated by adversaries of countries where the Company maintains operations. Given the potential sophistication of these attacks, the Company may not be able to address the threat of information security or cybersecurity incidents proactively or implement adequate preventative measures and we may not be able to detect and address any such disruption or security breach promptly, or at all, which could adversely affect customers that use our products, our business, results of operations or financial condition. Moreover, these threats could also impact our third-party partners resulting in compromise of the Company's IT systems, networks and data which could negatively affect the Company.
A breach of privacy laws or unauthorized access, loss or misuse of personal data could have a negative impact on the Company’s business or reputation.
The Company is subject to privacy and data protection laws and regulations across the globe that impose broad compliance obligations on the collection, possession, use, storage, access, disclosure, transfer, deletion and protection of personal data. Breach of the requirements of these laws and regulations could result in substantial fines, penalties, governmental actions, private right of actions, including class actions, and damage to our reputation and business. New privacy laws are expected globally, together with greater privacy enforcement by governmental authorities globally, particularly on data localization requirements and data transfers including international data flows. The Company has established privacy compliance programs and controls with which our businesses worldwide are required to comply. However, with many technology and data-driven initiatives evolving across the Company, involving multiple vendors and third parties, there are threats that could impact our business operations and research activities, including potential risks of unauthorized access and loss of personal data as well as legislative actions imposing limitations and controls on the use and sharing of personal data as well as on cross border data flows.
Item 1B. Unresolved staff comments
Not applicable.
Item 1C. Cybersecurity
Risk management and strategy
The Company has documented cybersecurity policies and standards, assesses risks from cybersecurity threats, and monitors information systems for potential cybersecurity issues. To protect the Company’s information systems from cybersecurity threats, the Company uses various security tools supporting protection, detection, and response capabilities. The Company maintains a cybersecurity incident response plan to help ensure a timely, consistent response to actual or attempted cybersecurity incidents impacting the Company.
The Company also identifies and assesses third-party risks within the enterprise, and through the Company's use of third-party service providers, across a range of areas including data security and supply chain through a structured third-party risk management program.
The Company maintains a formal information security training program for all employees that includes training on matters such as phishing and email security best practices. Employees are also required to complete mandatory training on data privacy.
To evaluate and enhance its cybersecurity program, the Company periodically utilizes third-party experts to undertake maturity assessments of the Company’s information security program.
To date, the Company is not aware of any cybersecurity incident that has had or is reasonably likely to have a material impact on the Company’s business or operations; however, because of the frequently changing attack techniques, along with the increased volume and sophistication of the attacks, there is the potential for the Company to be adversely impacted. This impact could result in reputational, competitive, operational or other business harm as well as financial costs and regulatory action. Refer to the risk factor captioned An information security incident, including a cybersecurity breach, could have a negative impact to the Company’s business or reputation in Part I, Item 1A. Risk factors for additional description of cybersecurity risks and potential related impacts on the Company.
Governance - management’s responsibility
The Company takes a risk-based approach to cybersecurity and has implemented cybersecurity controls designed to address cybersecurity threats and risks. The Chief Information Officer (CIO), who is a member of the Company’s Executive Committee, and the Chief Information Security Officer (CISO) are responsible for assessing and managing cybersecurity risks, including security incident detection, response, and recovery.
The Company’s CISO, in coordination with the CIO, is responsible for leading the Company’s cybersecurity program and management of cybersecurity risk. The current CISO has over twenty-five years of experience in information security, and his background includes technical experience, strategy and architecture focused roles, cyber and threat experience, and various leadership roles.
Governance - board oversight
The Company’s Board of Directors oversees the overall risk management process, including cybersecurity risks, directly and through its committees. The Regulatory Compliance & Sustainability Committee (RCSC) of the board is primarily responsible for oversight of risk from cybersecurity threats and oversees compliance with applicable laws, regulations and Company policies related to, among others, privacy and cybersecurity.
RCSC meetings include discussions of specific risk areas throughout the year including, among others, those relating to cybersecurity. The CISO provides quarterly updates each year to RCSC on cybersecurity matters. These reports include an overview of the cybersecurity threat landscape, key cybersecurity initiatives to improve the Company’s risk posture, changes in the legal and regulatory landscape relative to cybersecurity, and overviews of certain cybersecurity incidents that have occurred within the Company and within the industry.
Item 2. Properties
The Company's subsidiaries operate 64 manufacturing facilities occupying approximately 9.6 million square feet of floor space. The manufacturing facilities are used by the industry segments of the Company’s business approximately as follows:
| | | | | |
| Segment | Square Feet
(in thousands) |
| Innovative Medicine | 4,696 |
| MedTech | 4,911 |
| Worldwide Total | 9,607 |
Within the U.S., four facilities are used by the Innovative Medicine segment and 19 by the MedTech segment. Outside of the U.S., 14 facilities are used by the Innovative Medicine segment and 27 by the MedTech segment.
The locations of the manufacturing facilities by major geographic areas of the world are as follows:
| | | | | | | | | | | |
| Geographic Area | Number of
Facilities | | Square Feet
(in thousands) |
| United States | 23 | | 2,892 |
| Europe | 21 | | 4,521 |
| Western Hemisphere, excluding U.S. | 7 | | 898 |
| Africa, Asia and Pacific | 13 | | 1,296 |
| Worldwide Total | 64 | | 9,607 |
In addition to the manufacturing facilities discussed above, the Company maintains numerous office and warehouse facilities throughout the world.
The Company's subsidiaries generally seek to own, rather than lease, their manufacturing facilities, although some, principally in non-U.S. locations, are leased. Office and warehouse facilities are often leased. The Company also engages contract manufacturers.
The Company is committed to maintaining all of its properties in good operating condition.
Segment information on additions to property, plant and equipment is contained in Note 17 Segments of business and geographic areas of the Notes to Consolidated Financial Statements included in Item 8 of this Report.
Item 3. Legal proceedings
The information called for by this item is incorporated herein by reference to the information set forth in Note 19 Legal proceedings of the Notes to Consolidated Financial Statements included in Item 8 of this Report.
Item 4. Mine safety disclosures
Not applicable.
Executive officers of the registrant
Listed below are the executive officers of the Company. There are no family relationships between any of the executive officers, and there is no arrangement or understanding between any executive officer and any other person pursuant to which the executive officer was selected. At the annual meeting of the Board of Directors, the executive officers are elected by the Board to hold office for one year and until their respective successors are elected and qualified, or until earlier resignation or removal.
| | | | | |
| |
| Vanessa Broadhurst, 56 Member, Executive Committee; Executive Vice President, Global Corporate Affairs Ms. V. Broadhurst was named Executive Vice President, Global Corporate Affairs and appointed to the Executive Committee in 2022. Ms. Broadhurst rejoined the Company in 2017 and was appointed Company Group Chairman, Global Commercial Strategy Organization in 2018. From 2013 to 2017, she held General Manager roles at Amgen in Inflammation & Cardiovascular, and Cardiovascular & Bone. Prior to her roles at Amgen, she served in various leadership roles at the Company from 2005-2013. |
| |
| |
| Joaquin Duato, 62 Chairman of the Board; Chief Executive Officer Mr. J. Duato became Chairman of the Board of Directors in 2023 subsequent to his appointments as Chief Executive Officer and Director in 2022. Mr. Duato was appointed to the Executive Committee in 2016 when he was named Executive Vice President, Worldwide Chairman, Pharmaceuticals and subsequently served as Vice Chairman of the Executive Committee. Mr. Duato first joined the Company in 1989 with Janssen-Farmaceutica S.A. (Spain), a subsidiary of the Company, and held executive positions of increasing responsibility in all business sectors and across multiple geographies and functions. |
| |
| |
| Elizabeth Forminard, 54 Member, Executive Committee; Executive Vice President, Chief Legal Officer Ms. E. Forminard was appointed Executive Vice President, Chief Legal Officer and a member of the Executive Committee in 2022. Ms. Forminard joined the Company in 2006, serving in roles of increasing responsibility including General Counsel Medical Devices & Diagnostics, General Counsel Consumer Group & Supply Chain, Worldwide Vice President Corporate Governance, and in her immediate past role as General Counsel Pharmaceuticals. |
| |
| |
| Kristen Mulholland, 58 Member, Executive Committee; Executive Vice President, Chief Human Resources Officer Ms. K. Mulholland was appointed Executive Vice President, Chief Human Resources Officer and appointed to the Executive Committee in 2024. She joined the company in 2005 and has held HR leadership positions across the full breadth of the company including MedTech, Innovative Medicines, our Corporate Functions and Corporate HR Services including Performance and Development and most recently, Global Total Rewards. |
| |
| |
| John C. Reed, M.D., Ph.D., 66 Member, Executive Committee; Executive Vice President, Innovative Medicine, R&D Dr. J. C. Reed joined the Company in 2023 as Executive Vice President, Innovative Medicine, R&D and a member of the Executive Committee. Prior to joining the Company, Dr. Reed held executive leadership positions at Sanofi (2018-2022) and Roche (2013-2018), serving on their respective executive committees. He also served as CEO of Sanford-Burnham Medical Research Institute (now Sanford Burnham Prebys) where he established multiple therapeutic area-aligned research centers and platform technology centers. |
| |
| | | | | |
| |
| Tim Schmid, 55 Member, Executive Committee; Executive Vice President, Worldwide Chairman, MedTech Mr. T. Schmid was appointed Executive Vice President, Worldwide Chairman, MedTech and a member of the Executive Committee in 2023. He joined the Company in 1993 and has served in leadership positions throughout Johnson & Johnson MedTech, including Chief Strategic Customer Officer and President of Ethicon, and most recently served as Company Group Chairman MedTech Asia Pacific from 2018-2023. |
| |
| |
| James Swanson, 59 Member, Executive Committee; Executive Vice President, Chief Information Officer Mr. J. Swanson was appointed Executive Vice President, Chief Information Officer and a member of the Executive Committee in 2022. He rejoined the Company in 2019 as Chief Information Officer of Johnson & Johnson from Bayer Crop Science, where he served as a member of the Executive Leadership Team and as Chief Information Officer and Head of Digital Transformation. From 1996 to 2005, Mr. Swanson held positions of increasing responsibility at the Company, including Project Manager, Director IT, Sr. Director IT and Vice President, Chief Information Officer. |
| |
| |
| Jennifer L. Taubert, 61 Member, Executive Committee; Executive Vice President, Worldwide Chairman, Innovative Medicine Ms. J. L. Taubert was appointed Executive Vice President, Worldwide Chairman, Innovative Medicine (formerly Pharmaceuticals) and a member of the Executive Committee in 2018. She joined the Company in 2005 as Worldwide Vice President and held several executive positions of increasing responsibility in the Pharmaceuticals sector, including Company Group Chairman, North America, and Company Group Chairman, The Americas from 2012-2018. |
| |
| |
| Kathryn E. Wengel, 59 Member, Executive Committee; Executive Vice President, Chief Technical Operations & Risk Officer Ms. K. E. Wengel was appointed Executive Vice President, Chief Technical Operations & Risk Officer in 2023, subsequent to her appointment to the Executive Committee in 2018 when she was named as Executive Vice President, Chief Global Supply Chain Officer. Ms. Wengel first joined the Company in 1988 as Project Engineer and Engineering Supervisor at Janssen, a subsidiary of the Company. During her tenure with the Company, she has held a variety of strategic leadership and executive positions, including in roles within operations, quality, engineering, new products, information technology, and other technical and business functions. |
| |
| |
| Joseph J. Wolk, 58 Member, Executive Committee; Executive Vice President, Chief Financial Officer Mr. J. J. Wolk was appointed Executive Vice President, Chief Financial Officer and a member of the Executive Committee in 2018. He first joined the Company in 1998 as Finance Manager, Business Development for Ortho-McNeil, a subsidiary of the Company. During his tenure at the Company, he has held a variety of senior leadership roles in several segments and functions across the Company's subsidiaries, including Vice President, Finance and Chief Financial Officer of the Janssen Pharmaceutical Companies, and Vice President, Investor Relations. |
| |
Part II
Item 5. Market for registrant’s common equity, related stockholder matters and issuer purchases of equity securities
As of February 6, 2025, there were 114,147 record holders of common stock of the Company. Additional information called for by this item is incorporated herein by reference to the following sections of this Report: Note 16 “Common Stock, Stock Option Plans and Stock Compensation Agreements” of the Notes to Consolidated Financial Statements included in Item 8; and Item 12 “Security Ownership of Certain Beneficial Owners and Management and Related Stockholder Matters – Equity Compensation Plan Information.”
Issuer purchases of equity securities
The following table provides information with respect to common stock purchases by the Company during the fiscal fourth quarter of 2024. Common stock purchases on the open market are made as part of a systematic plan to meet the needs of the Company’s compensation programs. The repurchases below also include the stock-for-stock option exercises that settled in the fiscal fourth quarter.
| | | | | | | | | | | | | | | | | | | | | | | | | | |
| Fiscal Period | | Total Number of Shares Purchased(1) | | Avg. Price
Paid Per
Share | | Total Number of Shares (or
Units) Purchased as Part
of Publicly Announced
Plans or Programs | | Maximum Number (or Approximate
Dollar Value) of Shares (or Units)
that May Yet Be Purchased Under
the Plans or Programs |
| September 30, 2024 through October 27, 2024 | | 621,412 | | $163.13 | | — | | — |
| October 28, 2024 through November 24, 2024 | | 831,866 | | $158.98 | | — | | — |
| November 25, 2024 through December 29, 2024 | | 150,000 | | $152.96 | | — | | — |
| Total | | 1,603,278 | | | | — | | |
(1)During the fiscal fourth quarter of 2024, the Company repurchased an aggregate of 1,603,278 shares of Johnson & Johnson Common Stock in open-market transactions, all of which were purchased as part of a systematic plan to meet the needs of the Company’s compensation programs.
Item 6. Reserved
Item 7. Management’s discussion and analysis of results of operations and financial condition
Organization and business segments
Description of the company and business segments
Johnson & Johnson and its subsidiaries (the Company) have approximately 138,100 employees worldwide engaged in the research and development, manufacture and sale of a broad range of products in the healthcare field. The Company conducts business in virtually all countries of the world with the primary focus on products related to human health and well-being.
The Company is organized into two business segments: Innovative Medicine and MedTech. The Innovative Medicine segment is focused on the following therapeutic areas: Immunology, Infectious Diseases, Neuroscience, Oncology, Pulmonary Hypertension, and Cardiovascular and Metabolism. Products in this segment are distributed directly to retailers, wholesalers, distributors, hospitals and healthcare professionals for prescription use. The MedTech segment includes a broad portfolio of products used in the Orthopaedic, Surgery, Cardiovascular (previously referred to as Interventional Solutions) and Vision fields. These products are distributed to wholesalers, hospitals and retailers, and used principally in the professional fields by physicians, nurses, hospitals, eye care professionals and clinics.
The Chief Operating Decision Maker (CODM) is the Company's Chief Executive Officer (Principal Executive Officer).The Executive Committee is Johnson & Johnson’s senior leadership team responsible for setting the strategy and priorities of the Company and driving accountability at all levels. Within the strategic parameters provided by the Executive Committee, senior management groups at U.S. and international operating companies are each responsible for their own strategic plans and the day-to-day operations of those companies.
In all of its product lines, the Company competes with other companies both locally and globally, throughout the world. Competition exists in all product lines without regard to the number and size of the competing companies involved. Competition in research, involving the development and the improvement of new and existing products and processes, is particularly significant. The development of new and innovative products, as well as protecting the underlying intellectual property of the Company's product portfolio, is important to the Company’s success in all areas of its business. The competitive environment requires substantial investments in continuing research.
Management’s objectives
With Our Credo as the foundation, the Company believes health is everything. The Company's strength in healthcare innovation empowers us to build a world where complex diseases are prevented, treated, and cured, where treatments are smarter and less invasive, and solutions are personal. Through the Company's expertise in Innovative Medicine and MedTech, the Company is uniquely positioned to innovate across the full spectrum of healthcare solutions today to deliver the breakthroughs of tomorrow, and profoundly impact health for humanity.
New products introduced within the past five years accounted for approximately 25% of 2024 sales. In 2024, $17.2 billion was invested in research and development reflecting management’s commitment to create life-enhancing innovations and to create value through partnerships that will profoundly impact of health for humanity.
Our approximately 138,100 employees are critical drivers of the Company’s success. Employees are empowered and inspired to lead with Our Credo and purpose as guides. This allows every employee to use the Company’s reach and size to advance the Company’s purpose, and to also lead with agility and urgency. Leveraging the extensive resources across the enterprise enables the Company to innovate and execute with excellence. This ensures the Company can remain focused on addressing the unmet needs of society every day and invest for an enduring impact, ultimately delivering value to its patients, consumers and healthcare professionals, employees, communities and shareholders.
Acquisitions*
(net of cash acquired)
* Includes business combinations and asset acquisitions
Results of operations
Analysis of consolidated sales
For discussion on results of operations and financial condition pertaining to the fiscal years 2023 and 2022 see the Company’s Annual Report on Form 10-K for the fiscal year ended December 31, 2023, Item 7. Management's discussion and analysis of results of operations and financial condition. Prior periods disclosed herein were recast to reflect the continuing operations of the Company.
In 2024, worldwide sales increased 4.3% to $88.8 billion as compared to an increase of 6.5% in 2023. These sales changes consisted of the following:
| | | | | | | | | | | | | | | | |
| Sales increase/(decrease) due to: | | 2024 | | 2023 | | |
| Volume | | 5.9 | % | | 6.8 | % | | |
| Price | | 0.0 | | | 0.6 | | | |
| Currency | | (1.6) | | | (0.9) | | | |
| Total | | 4.3 | % | | 6.5 | % | | |
The net impact of acquisitions and divestitures on the worldwide sales growth was a positive impact of 0.5% in 2024 and a positive impact of 1.5% in 2023.
Sales by U.S. companies were $50.3 billion in 2024 and $46.4 billion in 2023. This represents increases of 8.3% in 2024 and 10.6% in 2023. In the fiscal 2024, acquisitions and divestitures had a net positive impact of 0.7% on the U.S. operational sales growth. Sales by international companies were $38.5 billion in 2024 and $38.7 billion in 2023. This represents a decrease of 0.5% in 2024 and an increase of 1.9% in 2023. In fiscal 2024, acquisitions and divestitures had a net positive impact of 0.2% on the international operational sales growth. In fiscal 2024, the impact of the Covid-19 Vaccine sales decline on the international operational sales was a negative 2.6%.
The five-year compound annual growth rates for worldwide, U.S. and international sales were 5.4%, 6.8% and 3.8%, respectively. The ten-year compound annual growth rates for worldwide, U.S. and international sales were 4.0%, 5.4% and 2.5%, respectively.
In 2024, sales by companies in Europe experienced a decline of 1.0% as compared to the prior year, which included an operational decline of 0.6% and a negative currency impact of 0.4%. In fiscal 2024, the net impact of the Covid-19 Vaccine on the European regions change in operational sales was a negative 4.7%. Sales by companies in the Western Hemisphere, excluding the U.S., achieved growth of 3.6% as compared to the prior year, which included operational growth of 20.4%, and a negative currency impact of 16.8%. Sales by companies in the Asia-Pacific, Africa region experienced a decline of 1.2% as compared to the prior year, including operational growth of 2.3% offset by a negative currency impact of 3.5%.
In 2024, the Company utilized three wholesalers distributing products for both segments that represented approximately 20.5%, 15.6% and 12.3% of the total gross revenues. In 2023, the Company had three wholesalers distributing products for both segments that represented approximately 18.2%, 15.1% and 14.2% of the total gross revenues.
2024 Sales by geographic region (in billions)
2024 Sales by segment (in billions)
Note: values may have been rounded
Analysis of sales by business segments
Innovative Medicine segment
Innovative Medicine segment sales in 2024 were $57.0 billion, an increase of 4.0% from 2023, which included operational growth of 5.7% and a negative currency impact of 1.7%. U.S. sales were $34.0 billion, an increase of 9.0%. International sales were $23.0 billion, a decrease of 2.5%, which included operational growth of 1.3% offset by a negative currency impact of 3.8%. In 2024, acquisitions and divestitures had a net negative impact of 0.1% on the operational sales growth of the worldwide Innovative Medicine segment. In fiscal 2024, the net impact of the Covid-19 Vaccine on the total Innovative Medicine and International change in operational sales was a negative 1.8% and 4.2%, respectively.
Major Innovative Medicine therapeutic area sales:
| | | | | | | | | | | | | | | | | | | | | | | | | | | | | | | | | | | | |
| (Dollars in Millions) | | 2024 | | 2023 | | | | Total
Change | | Operations
Change | | Currency
Change | | |
| Total Immunology | | $17,828 | | $18,052 | | | | (1.2 | %) | | 0.4 | % | | (1.6) | % | | |
| REMICADE | | 1,605 | | 1,839 | | | | (12.8) | | | (11.4) | | | (1.4) | | | |
| SIMPONI/SIMPONI ARIA | | 2,190 | | 2,197 | | | | (0.3) | | | 4.5 | | | (4.8) | | | |
| STELARA | | 10,361 | | 10,858 | | | | (4.6) | | | (3.4) | | | (1.2) | | | |
| TREMFYA | | 3,670 | | 3,147 | | | | 16.6 | | | 18.1 | | | (1.5) | | | |
| Other Immunology | | 3 | | 11 | | | | (74.1) | | | (74.1) | | | — | | | |
| Total Infectious Diseases | | 3,396 | | 4,418 | | | | (23.1) | | | (22.7) | | | (0.4) | | | |
| COVID-19 VACCINE | | 198 | | 1,117 | | | | (82.4) | | | (82.4) | | | 0.0 | | | |
| EDURANT/rilpivirine | | 1,272 | | 1,150 | | | | 10.6 | | | 10.6 | | | 0.0 | | | |
| PREZISTA/PREZCOBIX/REZOLSTA/SYMTUZA | | 1,712 | | 1,854 | | | | (7.7) | | | (7.1) | | | (0.6) | | | |
| Other Infectious Diseases | | 214 | | 297 | | | | (27.6) | | | (25.0) | | | (2.6) | | | |
| Total Neuroscience | | 7,115 | | 7,140 | | | | (0.4) | | | 1.3 | | | (1.7) | | | |
| CONCERTA/methylphenidate | | 641 | | 783 | | | | (18.1) | | | (15.1) | | | (3.0) | | | |
| INVEGA SUSTENNA/XEPLION/INVEGA TRINZA/TREVICTA | | 4,222 | | 4,115 | | | | 2.6 | | | 3.4 | | | (0.8) | | | |
| SPRAVATO | | 1,077 | | 689 | | | | 56.4 | | | 56.8 | | | (0.4) | | | |
| Other Neuroscience | | 1,175 | | 1,553 | | | | (24.3) | | | (20.7) | | | (3.6) | | | |
| Total Oncology | | 20,781 | | 17,661 | | | | 17.7 | | | 19.8 | | | (2.1) | | | |
| CARVYKTI | | 963 | | 500 | | | | 92.7 | | 92.7 | | 0.0 | | |
| DARZALEX | | 11,670 | | 9,744 | | | | 19.8 | | | 22.2 | | | (2.4) | | | |
| ERLEADA | | 2,999 | | 2,387 | | | | 25.6 | | | 27.3 | | | (1.7) | | | |
| IMBRUVICA | | 3,038 | | 3,264 | | | | (6.9) | | | (5.2) | | | (1.7) | | | |
| TECVAYLI | | 549 | | 395 | | | | 38.8 | | | 39.8 | | | (1.0) | | | |
| ZYTIGA /abiraterone acetate | | 631 | | 887 | | | | (28.8) | | | (25.0) | | | (3.8) | | | |
| Other Oncology | | 931 | | 484 | | | | 92.5 | | 94.3 | | (1.8) | | | |
| Total Pulmonary Hypertension | | 4,282 | | 3,815 | | | | 12.3 | | | 14.1 | | | (1.8) | | | |
| OPSUMIT | | 2,184 | | 1,973 | | | | 10.7 | | | 11.9 | | | (1.2) | | | |
| UPTRAVI | | 1,817 | | 1,582 | | | | 14.9 | | | 16.1 | | | (1.2) | | | |
| Other Pulmonary Hypertension | | 281 | | 260 | | | | 7.9 | | | 18.3 | | | (10.4) | | | |
| Total Cardiovascular / Metabolism / Other | | 3,562 | | 3,671 | | | | (3.0) | | | (2.6) | | | (0.4) | | | |
| XARELTO | | 2,373 | | 2,365 | | | | 0.3 | | | 0.3 | | | — | | | |
| Other | | 1,189 | | 1,306 | | | | (8.9) | | | (7.8) | | | (1.1) | | | |
| Total Innovative Medicine Sales | | $56,964 | | 54,759 | | | | 4.0 | % | | 5.7 | % | | (1.7) | % | | |
Immunology products sales were $17.8 billion in 2024, representing a decrease of 1.2% as compared to the prior year. The decline of STELARA (ustekinumab) sales was driven by share loss primarily due to European biosimilar entrants. Lower sales of REMICADE (infliximab) was due to continued biosimilar competition. The growth of TREMFYA (guselkumab) was due to market growth and share gains.
Sales of STELARA in the United States were approximately $6.7 billion in fiscal 2024. Third parties have filed abbreviated Biologics License Applications with the FDA seeking approval to market biosimilar versions of STELARA. The Company has settled certain litigation under the Biosimilar Price Competition and Innovation Act of 2009. According to patent settlement and license agreements, the Company expects continued launches of biosimilar versions of STELARA in Europe and the United States in 2025 which will impact the Company’s sales of STELARA.
Biosimilar versions of REMICADE have been introduced in the United States and certain markets outside the United States and additional competitors continue to enter the market. Continued infliximab biosimilar competition will result in a further reduction in sales of REMICADE.
Infectious disease products sales were $3.4 billion in 2024, a decline of 23.1% as compared to the prior year primarily driven by a decline in COVID-19 vaccine revenue.
Neuroscience products sales were $7.1 billion in 2024, representing a decrease of 0.4% as compared to the prior year primarily driven by a decline in Other Neuroscience. The decline was partially offset by the growth of SPRAVATO (esketamine) driven by the ongoing launch and increased physician and patient demand.
Oncology products achieved sales of $20.8 billion in 2024, representing an increase of 17.7% as compared to the prior year. Strong sales of DARZALEX (daratumumab) were driven by continued share gains and market growth. Growth of ERLEADA (apalutamide) was primarily due to continued share gains and market growth. Sales of CARVYKTI (ciltacabtagene autoleucel) were driven by continued share gains, capacity expansion and manufacturing efficiencies. Additionally, sales from the ongoing launches of TECVAYLI (teclistamab-cqyv), TALVEY (talquetamab-tgvs) and RYBREVANT (amivantamab), included in Other Oncology, contributed to the growth. Growth was partially offset by ZYTIGA (abiraterone acetate) due to loss of exclusivity and IMBRUVICA (ibrutinib) due to global competitive pressures.
Pulmonary Hypertension products sales were $4.3 billion, representing an increase of 12.3% as compared to the prior year. Sales growth of both OPSUMIT (macitentan) and UPTRAVI (selexipag) was driven by market growth and share gains. Growth in Other Pulmonary Hypertension was driven by OPSYNVI (macitentan/tadalafil).
Cardiovascular/Metabolism/Other products sales were $3.6 billion, a decline of 3.0% as compared to the prior year driven by declines in Other.
The Company maintains a policy that no end customer will be permitted direct delivery of product to a location other than the billing location. This policy impacts contract pharmacy transactions involving non-grantee 340B covered entities for most of the Company’s drugs, subject to multiple exceptions. Both grantee and non-grantee covered entities can maintain certain contract pharmacy arrangements under policy exceptions. The Company has been and will continue to offer 340B discounts to covered entities on all of its covered outpatient drugs, and it believes its policy will improve its ability to identify inappropriate duplicate discounts and diversion prohibited by the 340B statute. The 340B Drug Pricing Program is a U.S. federal government program requiring drug manufacturers to provide significant discounts on covered outpatient drugs to covered entities.
During 2024, the Company advanced its pipeline with several regulatory submissions and approvals for new drugs and additional indications for existing drugs as follows:
| | | | | | | | | | | | | | | | | |
Product Name
(Chemical Name) | Indication | US
Approval | EU
Approval | US
Filing | EU
Filing |
| BALVERSA (erdafitinib) | Treatment of Patients with Locally Advanced or Metastatic Urothelial Carcinoma and Selected Fibroblast Growth Factor Receptor Gene Alterations (THOR) | • | • | | |
| CARVYKTI (ciltacabtagene autoleucel) | Treatment for Relapsed and Refactor multiple myeloma with 1-3 PL (CARTITUDE-4) | • | • | | |
| DARZALEX (daratumumab) | Treatment for frontline multiple myeloma transplant eligible (PERSEUS) | • | • | | |
| DARZALEX (daratumumab) | Treatment for frontline multiple myeloma transplant ineligible (CEPHEUS) | | | • | • |
| DARZALEX (daratumumab) | Treatment as subcutaneous monotherapy for high-risk smoldering multiple myeloma (AQUILA) | | | • | • |
| EDURANT (rilpivirine) | Treatment for pediatric patients (2-12 years old) with HIV | • | • | | |
| IMBRUVICA (ibrutinib) | Treatment for frontline MCL (Triangle) | | | | • |
| nipocalimab | Treatment for Generalized Myasthenia Gravis | | | • | • |
| OPSUMIT (macitentan) | Treatment for pediatric pulmonary arterial hypertension (TOMORROW) | | • | • | |
| OPSYNVI (macitentan/tadalafil STCT) | Treatment for pulmonary arterial hypertension | • | • | | |
| REKAMBYS | Treatment for Adolescents HIV | | | | • |
| RYBREVANT (amivantamab) | In Combination with Chemotherapy for the First-Line Treatment of Adult Patients with Advanced Non-Small Cell Lung Cancer with Activating EGFR Exon 20 Insertion Mutations (PAPILLON) | • | • | | |
| RYBREVANT (amivantamab) | Treatment for subcutaneous (PALOMA-3) | | | • | • |
| RYBREVANT / LAZCLUZE | Treatment for Non-Small Cell Lung Cancer (MARIPOSA) | • | • | | |
| RYBREVANT | Treatment for Non-Small Cell Lung Cancer 2L (MARIPOSA-2) | • | • | | |
| SIMPONI (golimumab) | Treatment of Patients with Pediatric Ulcerative Colitis | | | • | • |
| SPRAVATO (esketamine) monotherapy | Treatment of Patients with Treatment Resistant Depression (TRD4005) | | | • | |
| STELARA (ustekinumab) | Treatment of Patients with Pediatric Crohn's Disease | | | | • |
| TREMFYA (guselkumab) | Treatment of Patients with Ulcerative Colitis (QUASAR) | • | | | • |
| TREMFYA (guselkumab) | Subcutaneous Induction for treatment of patients with Ulcerative Colitis (ASTRO) | | | • | |
| TREMFYA (guselkumab) | Subcutaneous Induction for treatment of patients with Crohn's Disease (GRAVITI) | | | • | • |
| TREMFYA (guselkumab) | Treatment of Patients with Crohn's Disease (GALAXI) | | | • | • |
| TREMFYA (guselkumab) | Treatment of Patients with Pediatric Psoriasis | | | • | |
| UPTRAVI (selexipag) | Treatment of Patients with Pediatric Pulmonary Arterial Hypertension (SALTO) | | | | • |
MedTech segment
The MedTech segment sales in 2024 were $31.9 billion, an increase of 4.8% from 2023, which included operational growth of 6.2% and a negative currency impact of 1.4%. U.S. sales were $16.3 billion, an increase of 6.9% as compared to the prior year. International sales were $15.5 billion, an increase of 2.6% as compared to the prior year, which included operational growth of 5.4% and a negative currency impact of 2.8%. In 2024, the net impact of acquisitions and divestitures on the MedTech segment worldwide operational sales growth was a positive 1.5% primarily related to the Shockwave acquisition.
Major MedTech franchise sales:
| | | | | | | | | | | | | | | | | | | | | | | | | | | | | | | | | | | | |
| (Dollars in Millions) | | 2024 | | 2023 | | | | Total
Change | | Operations
Change | | Currency
Change | | |
| Surgery | | $9,845 | | | 10,037 | | | | | (1.9) | % | | 0.1 | % | | (2.0) | % | | |
| Advanced | | 4,488 | | | 4,671 | | | | | (3.9) | | | (2.0) | | | (1.9) | | | |
| General | | 5,358 | | | 5,366 | | | | | (0.2) | | | 2.0 | | | (2.2) | | | |
| Orthopaedics | | 9,158 | | | 8,942 | | | | | 2.4 | | | 3.0 | | | (0.6) | | | |
| Hips | | 1,638 | | | 1,560 | | | | | 5.0 | | | 5.6 | | | (0.6) | | | |
| Knees | | 1,545 | | | 1,456 | | | | | 6.1 | | | 6.5 | | | (0.4) | | | |
| Trauma | | 3,049 | | | 2,979 | | | | | 2.3 | | | 2.9 | | | (0.6) | | | |
| Spine, Sports & Other | | 2,926 | | | 2,947 | | | | | (0.7) | | | (0.1) | | | (0.6) | | | |
Cardiovascular (1) | | 7,707 | | | 6,350 | | | | | 21.4 | | | 22.8 | | | (1.4) | | | |
| Electrophysiology | | 5,267 | | | 4,688 | | | | | 12.3 | | | 14.0 | | | (1.7) | | | |
| Abiomed | | 1,496 | | | 1,306 | | | | | 14.5 | | 14.9 | | (0.4) | | | |
Shockwave (2) | | 564 | | | — | | | | | * | | * | | — | | | |
| Other Cardiovascular | | 380 | | | 356 | | | | | 6.9 | | | 8.4 | | | (1.5) | | | |
| Vision | | 5,146 | | | 5,072 | | | | | 1.5 | | | 3.0 | | | (1.5) | | | |
| Contact Lenses/Other | | 3,733 | | | 3,702 | | | | | 0.8 | | | 2.6 | | | (1.8) | | | |
| Surgical | | 1,413 | | | 1,370 | | | | | 3.2 | | | 4.3 | | | (1.1) | | | |
| | | | | | | | | | | | | | |
| Total MedTech Sales | | $31,857 | | | 30,400 | | | | | 4.8 | % | | 6.2 | % | | (1.4) | % | | |
(1)Previously referred to as Interventional Solutions
(2)Acquired on May 31, 2024
* Percentage greater than 100% or not meaningful
The Surgery franchise sales were $9.8 billion in 2024, representing a decrease of 1.9% from 2023. The decline in Advanced Surgery was primarily due to China volume-based procurement across all platforms and competitive pressures in Energy and Endocutters. This was partially offset by the strength of the portfolio and commercial execution in Biosurgery as well as the strength of new products in Endocutters. Growth in General Surgery was primarily driven by technology penetration and benefits from the differentiated Wound Closure portfolio as well as increased procedure volume. This growth was offset by the negative impact of currency and the Acclarent divestiture.
The Orthopaedics franchise sales were $9.2 billion in 2024, representing an increase of 2.4% from 2023. The fiscal 2024 includes a one-time revenue recognition timing change related to certain products across all Orthopaedic platforms in the U.S. which positively impacted the worldwide Orthopaedics franchise growth as well as the negative impact from the near-term revenue disruption related to the previously announced Orthopaedics restructuring. The growth in Hips reflects continued strength of the portfolio primarily in the Anterior approach, and global procedure growth. The growth in Knees was primarily driven by the ATTUNE portfolio, pull through related to the VELYS Robotic assisted solution and global procedure growth. Growth in Trauma was driven by the adoption of recently launched products. The decline in Spine, Sports & Other was primarily driven by competitive pressures and impacts from China volume-based procurement. This was partially offset by growth in the U.S. market.
The Cardiovascular franchise, which includes sales from Shockwave Medical (Shockwave) acquired on May 31, 2024, achieved sales of $7.7 billion in 2024, representing an increase of 21.4% from 2023. Electrophysiology growth was driven by global procedure growth, new product performance and commercial execution. This was partially offset by the impacts of volume-based procurement in China and competitive pressures in Pulsed Field Ablation catheters in the U.S. Abiomed sales reflect the strength of all major commercialized regions driven by the continued adoption of Impella 5.5 and Impella RP.
The Vision franchise achieved sales of $5.1 billion in 2024, representing an increase of 1.5% from 2023. Contact Lenses/Other growth was primarily driven by price actions, continued strong performance in the ACUVUE OASYS 1-Day family of products (including recent launches), impacts from a one-time change in contract shipping terms in the U.S. and lapping of prior year impacts of Russian sanctions partially offset by U.S. distributor stocking dynamics. Surgical growth was primarily driven by the continued strength of recent innovations and commercial execution partially offset by China volume-based procurement and competitive pressures in the U.S.
Analysis of consolidated earnings before provision for taxes on income
Consolidated earnings before provision for taxes on income was $16.7 billion and $15.1 billion for the years 2024 and 2023, respectively. As a percent to sales, consolidated earnings before provision for taxes on income was 18.8% and 17.7%, in 2024 and 2023, respectively.
Earnings before provision for taxes
(Dollars in billions. Percentages in chart are as a percent to total sales)
Cost of products sold and selling, marketing and administrative expenses:
Selling, marketing & administrative
(Dollars in billions. Percentages in chart are as a percent to total sales)
Cost of products sold:
Cost of products sold decreased as a percent to sales driven by:
•Lower one-time COVID-19 vaccine supply network related exit costs in 2024 ($0 in 2024 versus $0.2 billion 2023) in the Innovative Medicine business
•Prior year restructuring related excess inventory costs in the MedTech business
partially offset by
•The fair value Inventory step-up of $0.4 billion related to the business combination accounting associated with Shockwave
The intangible asset amortization expense included in cost of products sold was $4.5 billion for both fiscal years 2024 and 2023.
Selling, Marketing and Administrative expense:
Selling, Marketing and Administrative Expenses increased as a percent to sales driven by:
•Increased commercial investment in the Innovative Medicine business
partially offset by
•Optimization efforts related to the residual costs associated with the Kenvue separation
Research and Development expense:
Research and development expense by segment of business was as follows:
| | | | | | | | | | | | | | | | | | | | | |
| | 2024 | | 2023 | | |
| (Dollars in Millions) | Amount | % of Sales* | | Amount | % of Sales* | | | | |
| Innovative Medicine | $13,529 | | 23.8 | % | | $11,963 | | 21.8 | % | | | | |
| MedTech | 3,703 | | 11.6 | | | 3,122 | | 10.3 | | | | | |
| Total research and development expense | $17,232 | | 19.4 | % | | $15,085 | | 17.7 | % | | | | |
| Percent increase/(decrease) over the prior year | 14.2 | % | | | 6.7 | % | | | | | |
| *As a percent to segment sales | | | | | | | | | |
Research and development activities represent a significant part of the Company's business. These expenditures relate to the processes of discovering, testing and developing new products, upfront payments and developmental milestones, improving existing products, as well as ensuring product efficacy and regulatory compliance prior to launch. The Company remains committed to investing in research and development with the aim of delivering high quality and innovative products.
Research and Development increased as a percent to sales primarily driven by:
•Acquired in-process research & development expense of $1.25 billion to secure the global rights to the NM26 bispecific antibody (Yellow Jersey acquisition) and pipeline advancement in the Innovative Medicine business
•Acquired in-process research & development expense of $0.5 billion from the V-Wave acquisition in the MedTech business
In-Process Research and Development Impairments (IPR&D): In the fiscal year 2024, the Company recorded a charge of approximately $0.2 billion associated with the M710 (biosimilar) asset acquired as part of the acquisition of Momenta Pharmaceuticals in 2020. There was also a partial impairment of this asset for $0.2 billion in the fiscal 2023. This asset is now fully impaired.
Other (Income) Expense, Net: Other (income) expense, net is the account where the Company records gains and losses related to the sale and write-down of certain investments in equity securities held by Johnson & Johnson Innovation - JJDC, Inc. (JJDC), changes in the fair value of securities, investment (income)/loss related to employee benefit programs, gains and losses on divestitures, certain transactional currency gains and losses, acquisition and divestiture related costs, litigation accruals and settlements, as well as royalty income.
Other (income) expense, net for the fiscal year 2024 reflected less expense of $1.9 billion as compared to the prior year primarily due to the following:
| | | | | | | | | | | |
| (Dollars in Billions)(Income)/Expense | 2024 | 2023 | Change |
Litigation related(1) | $5.5 | 6.9 | (1.4) |
Acquisition, Integration and Divestiture related(2) | 0.8 | 0.3 | 0.5 |
Changes in the fair value of securities(3) | 0.3 | 0.6 | (0.3) |
| COVID-19 vaccine manufacturing exit related costs | 0.1 | 0.4 | (0.3) |
| Monetization of royalty rights | (0.3) | 0.0 | (0.3) |
| Employee benefit plan related | (0.9) | (1.4) | 0.5 |
| Other | (0.8) | (0.2) | (0.6) |
| Total Other (Income) Expense, Net | $4.7 | 6.6 | (1.9) |
(1)The fiscal years 2024 and 2023 include charges primarily for talc matters (See Note 19 to the Consolidated Financial Statements for more details). The fiscal year 2023 includes favorable intellectual property related litigation settlements of approximately $0.3 billion.
(2)The fiscal year 2024 is primarily related to the acquisition of Shockwave. The fiscal year 2023 is primarily related to the impairment of Ponvory and one-time integration costs related to the acquisition of Abiomed.
(3)The fiscal year 2024 includes the loss of $0.4 billion on the completion of the debt for equity exchange of the retained stake in Kenvue. The fiscal year 2023 includes $0.4 billion related to the unfavorable change in the fair value of the remaining stake in Kenvue and $0.4 billion related to the partial impairment of Idorsia convertible debt and the change in the fair value of the Idorsia equity securities held.
Interest (Income) Expense: Interest income in the fiscal years 2024 and 2023 was $1.3 billion. Interest expense in the fiscal years 2024 and 2023 was $0.8 billion. Cash, cash equivalents and marketable securities totaled $24.5 billion at the end of 2024, and averaged $23.7 billion as compared to the cash, cash equivalents and marketable securities total of $22.9 billion and $22.6 billion average balance in 2023. The total debt balance at the end of 2024 was $36.6 billion with an average debt balance of $33.0 billion as compared to $29.3 billion at the end of 2023 and an average debt balance of $34.5 billion. The higher debt balance was due to the senior unsecured notes issued by the Company in the fiscal second quarter of 2024. The net proceeds from this offering were used to fund the Shockwave acquisition which closed on May 31, 2024 and for general corporate purposes.
Income before tax by segment
Income (loss) before tax by segment of business were as follows:
| | | | | | | | | | | | | | | | | | | | | | | | | | |
| | Income Before Tax | | Segment Sales | | Percent of Segment
Sales |
| (Dollars in Millions) | 2024 | 2023 | | 2024 | 2023 | | 2024 | 2023 |
| Innovative Medicine | $18,919 | 18,246 | | 56,964 | 54,759 | | 33.2 | % | 33.3 | |
| MedTech | 3,740 | 4,669 | | 31,857 | 30,400 | | 11.7 | | 15.4 | |
Segment earnings before tax(1) | 22,659 | 22,915 | | 88,821 | 85,159 | | 25.5 | | 26.9 | |
Less: Expenses not allocated to segments(2) | 5,972 | 7,853 | | | | | | |
| Worldwide income before tax | $16,687 | 15,062 | | 88,821 | 85,159 | | 18.8 | % | 17.7 | |
(1)See Note 17 to the Consolidated Financial Statements for more details.
(2)Amounts not allocated to segments include interest (income) expense and general corporate (income) expense. The fiscal years 2024 and 2023 include charges for talc matters of approximately $5.1 billion and $7.0 billion, respectively. The fiscal 2024 includes a loss of approximately $0.4 billion related to the debt to equity exchange of the Company's remaining shares of Kenvue Common Stock. The fiscal year 2023 includes an approximately $0.4 billion unfavorable change in the fair value of the retained stake in Kenvue.
Innovative Medicine segment:
In 2024, the Innovative Medicine segment income before tax as a percent to sales was 33.2% versus 33.3% in 2023. The decrease in the income before tax as a percent of sales was primarily driven by the following:
•Acquired in-process research and development expense of $1.25 billion to secure the global rights to the NM26 bispecific antibody
•Litigation expense of $0.4 billion in 2024, primarily related to Risperdal Gynecomastia, versus favorable litigation related items of $0.1 billion in 2023
•Increased research and development to advance the pipeline
•Increased commercial investment in selling and marketing expenses
partially offset by
•Monetization of royalty rights of $0.3 billion in 2024
•Lower one-time COVID-19 Vaccine related exit costs of $0.1 billion in 2024 versus $0.7 billion in 2023
•Lower amortization expense of $0.2 billion in 2024 versus 2023
•Restructuring charges of $0.1 billion in 2024 versus $0.5 billion in 2023
•A gain of $0.1 billion in 2024 as compared to a loss of $0.4 billion in 2023 related to changes in the fair value of securities
MedTech segment:
In 2024, the MedTech segment income before tax as a percent to sales was 11.7% versus 15.4% in 2023. The decrease in the income before tax as a percent to sales was primarily driven by the following:
•Acquisition and integration related costs of $1.0 billion in 2024 (primarily related to the Shockwave acquisition) versus $0.2 billion in 2023 related to Abiomed
•Acquired in-process research and development expense of $0.5 billion from the V-Wave acquisition in 2024
•Higher amortization expense of $0.2 billion in 2024 related to Shockwave
partially offset by
•A gain of $0.2 billion related to the Acclarent divestiture in 2024
•Restructuring related charge of $0.2 billion in 2024 versus $0.3 billion in 2023
Restructuring: In the fiscal year 2023, the Company completed a prioritization of its research and development (R&D) investment within the Innovative Medicine segment to focus on the most promising medicines with the greatest benefit to patients. This resulted in the exit of certain programs within therapeutic areas. The R&D program exits are primarily in infectious diseases and vaccines including the discontinuation of its respiratory syncytial virus (RSV) adult vaccine program, hepatitis and HIV development. The pre-tax restructuring charge of approximately $0.1 billion in the fiscal year 2024 was recorded in Restructuring on the Consolidated Statement of Earnings, and included the termination of partnered and non-partnered development program costs, asset impairments and asset divestments. The pre-tax restructuring charge of approximately $0.5 billion in the fiscal year 2023, of which $449 million was recorded in Restructuring and $30 million was recorded in Cost of products sold on the Consolidated Statement of Earnings, and included the termination of partnered and non-partnered program costs and asset impairments. Total project costs of approximately $0.6 billion have been recorded since the restructuring was announced. The program was completed in the fiscal fourth quarter of 2024.
In the fiscal year 2023, the Company initiated a restructuring program of its Orthopaedics franchise within the MedTech segment to streamline operations by exiting certain markets, product lines and distribution network arrangements. The pre-tax restructuring expense of $0.2 billion in the fiscal year 2024, of which $132 million was recorded in Restructuring and $35 million was recorded in Cost of products sold on the Consolidated Statement of Earnings, primarily included costs related to market and product exits. The pre-tax restructuring expense of $0.3 billion in the fiscal year 2023, of which $40 million was recorded in Restructuring and $279 million was recorded in Cost of products sold on the Consolidated Statement of Earnings, primarily included inventory and instrument charges related to market and product exits. Total project costs of approximately $0.5 billion have been recorded since the restructuring was announced.
See Note 20 to the Consolidated Financial Statements for additional details related to the restructuring programs.
Provision for Taxes on Income: The worldwide effective income tax rate from continuing operations was 15.7% in 2024 and 11.5% in 2023. For discussion related to the fiscal year 2024 provision for taxes refer to Note 8 to the Consolidated Financial Statements.
On December 15, 2022, the European Union (EU) Member States formally adopted the EU’s Pillar Two Directive, which generally provides for a minimum effective tax rate of 15%, as established by the Organization for Economic Co-operation and Development (OECD) Pillar Two Framework that was supported by over 130 countries worldwide. Several EU and non-EU countries have enacted Pillar Two legislation with an initial effective date of January 1, 2024, with other aspects of the law effective in 2025 or later. In the fiscal year 2024, the net impact of Pillar Two legislation was less than 1.0% to the Company’s effective tax rate. While countries continue to enact new provisions or issue new regulations, based on current guidance, the Company expects the net impact of Pillar Two in fiscal year 2025 to be up to 1.0% to the Company’s effective tax rate.
Liquidity and capital resources
Liquidity & cash flows
Cash and cash equivalents were $24.1 billion at the end of 2024 as compared to $21.9 billion at the end of 2023.
The primary sources and uses of cash that contributed to the $2.2 billion increase were:
| | | | | |
| (Dollars in billions) |
| $21.9 | Q4 2023 Cash and cash equivalents balance |
| 24.3 | cash generated from operating activities |
| (18.6) | net cash used by investing activities |
| (3.1) | net cash used by financing activities |
| (0.4) | effect of exchange rate and rounding |
| $24.1 | Q4 2024 Cash and cash equivalents balance |
In addition, the Company had $0.4 billion in marketable securities at the end of fiscal year 2024 and $1.1 billion at the end of fiscal year 2023. See Note 1 to the Consolidated Financial Statements for additional details on cash, cash equivalents and marketable securities.
Cash flow from operations of $24.3 billion was the result of:
| | | | | |
| (Dollars In billions) |
| $14.1 | Net Earnings |
| 8.4 | non-cash expenses and other adjustments primarily for depreciation and amortization, stock-based compensation, asset write-downs and charges for acquired in-process research and development assets partially offset by net gain on sale of assets/businesses and the deferred tax provision |
| |
| 1.7 | a decrease in other current and non-current assets |
| 1.6 | an increase in accounts payable and accrued liabilities |
| (1.5) | an increase in accounts receivable and inventories |
| |
| $24.3 | Cash flow from operations |
Cash flow used for investing activities of $18.6 billion was primarily due to:
| | | | | |
| (Dollars in billions) |
| $(4.4) | additions to property, plant and equipment |
| (15.1) | acquisitions, net of cash acquired |
| 0.7 | proceeds from the disposal of assets/businesses, net |
| (1.8) | acquired in-process research and development assets |
| 0.7 | net sales of investments |
| 1.5 | credit support agreements activity, net |
| (0.2) | other (including capitalized licenses and milestones) |
| $(18.6) | Net cash used for investing activities |
Cash flow used for financing activities of $3.1 billion was primarily due to:
| | | | | |
| (Dollars in billions) |
| $(11.8) | dividends to shareholders |
| (2.4) | repurchase of common stock |
| 11.0 | net proceeds from short and long-term debt |
| 0.8 | proceeds from stock options exercised/employee withholding tax on stock awards, net |
| 0.3 | credit support agreements activity, net |
| (1.0) | settlement of convertible debt acquired from Shockwave |
| |
| |
| |
| $(3.1) | Net cash used for financing activities |
The following table summarizes cash taxes paid net of refunds:
| | | | | | | | | | | | | | |
| (Dollars in Millions) | 2024 | 2023 | 2022 | | | |
U.S. Federal (1) | $3,815 | 4,722 | 2,158 | | | |
| U.S. State and Local taxes | 341 | 236 | 216 | | | |
| Total U.S. | $4,156 | 4,958 | 2,374 | | | |
| Total Foreign | 2,558 | 3,616 | 2,849 | | | |
| Total cash taxes paid net of refunds | $6,714 | $8,574 | $5,223 | | | |
(1)Includes TCJA foreign undistributed earnings payments of $2.0 billion in fiscal year 2024, $1.5 billion in fiscal year 2023 and $0.8 billion in fiscal year 2022
As of December 29, 2024, the Company's notes payable and long-term debt was in excess of cash, cash equivalents and marketable securities. As of December 29, 2024, the net debt position was $12.1 billion as compared to the prior year of $6.4 billion. The debt balance at the end of 2024 was $36.6 billion as compared to $29.3 billion in 2023. In the fiscal second quarter of 2024, the Company issued senior unsecured notes for a total of $6.7 billion. For additional details on borrowings, see Note 7 to the Consolidated Financial Statements. The net proceeds from this offering were used to fund the Shockwave acquisition which closed on May 31, 2024, and for general corporate purposes. Considering recent market conditions, the Company has re-evaluated its operating cash flows and liquidity profile and does not foresee any significant incremental risk. The Company anticipates that operating cash flows, the ability to raise funds from external sources, borrowing capacity from existing committed credit facilities and access to the commercial paper markets will continue to provide sufficient resources to fund operating needs, including the Company's remaining balance to be paid on the agreement to settle opioid litigation for approximately $1.5 billion and the approximately $11.6 billion ($13.5 billion nominal) reserve for talc matters (See Note 19 to the Consolidated Financial Statements for additional details). In addition, the Company monitors the global capital markets on an ongoing basis and from time to time may raise capital when market conditions are favorable.
On May 8, 2023, Kenvue, completed an initial public offering (the IPO) resulting in the issuance of 198,734,444 shares of its common stock, par value $0.01 per share (the Kenvue Common Stock), at an initial public offering of $22.00 per share for net proceeds of $4.2 billion. The excess of the net proceeds from the IPO over the net book value of the Johnson & Johnson
divested interest was $2.5 billion and was recorded to additional paid-in capital. As of the closing of the IPO, Johnson & Johnson owned approximately 89.6% of the total outstanding shares of Kenvue Common Stock and at July 2, 2023, the non-controlling interest of $1.3 billion associated with Kenvue was reflected in equity attributable to non-controlling interests in the consolidated balance sheet.
On August 23, 2023, Johnson & Johnson completed the disposition of an additional 80.1% ownership of Kenvue Common Stock through an exchange offer, which resulted in Johnson & Johnson acquiring 190,955,436 shares of the Company’s common stock in exchange for 1,533,830,450 shares of Kenvue Common Stock. The $31.4 billion of Johnson & Johnson common stock received in the exchange offer is recorded in Treasury stock. Following the exchange offer, the Company owned 9.5% of the total outstanding shares of Kenvue Common Stock that was recorded in other assets within continuing operations at the fair market value of $4.3 billion as of August 23, 2023 and $3.9 billion as of December 31, 2023.
Johnson & Johnson divested net assets of $11.6 billion as of August 23, 2023, and the accumulated other comprehensive loss attributable to the Consumer Health business at that date was $4.3 billion. Additionally, at the date of the exchange offer, Johnson & Johnson decreased the non-controlling interest by $1.2 billion to record the deconsolidation of Kenvue. This resulted in a gain on the exchange offer of $21.0 billion that was recorded in Net earnings from discontinued operations, net of taxes in the consolidated statements of earnings for the fiscal third quarter of 2023. This one-time gain includes a gain of $2.8 billion on the Kenvue Common Stock retained by Johnson & Johnson. The gain on the exchange offer qualifies as a tax-free transaction for U.S. federal income tax purposes.
On May 15, 2024, the Company issued $3.6 billion aggregate principal amount of commercial paper and received $3.6 billion of net cash proceeds to be used for general corporate purposes. On May 17, 2024, the Company completed a Debt-for-Equity Exchange of its remaining 182,329,550 shares of Kenvue Common Stock for the outstanding Commercial Paper. Upon completion of the Debt-for-Equity Exchange, the Commercial Paper was satisfied and discharged and the Company no longer owns any shares of Kenvue Common Stock. This exchange resulted in a loss of approximately $0.4 billion recorded in Other (income) expense.
The following table summarizes the Company’s material contractual obligations and their aggregate maturities as of December 29, 2024: To satisfy these obligations, the Company intends to use cash from operations.
| | | | | | | | | | | | | | | | | |
| (Dollars in Millions) | Tax Legislation
(TCJA) | Debt Obligations | Interest on
Debt Obligations | | | | Total |
| 2025 | $2,536 | 1,749 | 1,075 | | | | 5,360 |
| 2026 | — | 1,999 | 1,030 | | | | 3,029 |
| 2027 | — | 2,385 | 1,021 | | | | 3,406 |
| 2028 | — | 2,275 | 977 | | | | 3,252 |
| 2029 | — | 1,444 | 922 | | | | 2,366 |
| After 2029 | — | 22,548 | 8,921 | | | | 31,469 |
| Total | $2,536 | 32,400 | 13,946 | | | | 48,882 |
For tax matters, see Note 8 to the Consolidated Financial Statements. For the proposed talc settlement payments, see Note 19 to the Consolidated Financial Statements.
Financing and market risk
The Company uses financial instruments to manage the impact of foreign exchange rate changes on cash flows. Accordingly, the Company enters into forward foreign exchange contracts to protect the value of certain foreign currency assets and liabilities and to hedge future foreign currency transactions primarily related to product costs. Gains or losses on these contracts are offset by the gains or losses on the underlying transactions. A 10% appreciation of the U.S. Dollar from the December 29, 2024 market rates would increase the unrealized value of the Company’s forward contracts by $0.2 billion. Conversely, a 10% depreciation of the U.S. Dollar from the December 29, 2024 market rates would decrease the unrealized value of the Company’s forward contracts by $0.2 billion. In either scenario, the gain or loss on the forward contract would be offset by the gain or loss on the underlying transaction, and therefore, would have no impact on future anticipated earnings and cash flows.
The Company hedges the exposure to fluctuations in currency exchange rates, and the effect on certain assets and liabilities in foreign currency, by entering into currency swap contracts. A 1% change in the spread between U.S. and foreign interest rates on the Company’s interest rate sensitive financial instruments would either increase or decrease the unrealized value of the Company’s swap contracts by approximately $1.5 billion. In either scenario, at maturity, the gain or loss on the swap contract would be offset by the gain or loss on the underlying transaction, and therefore, would have no impact on future anticipated cash flows.
The Company does not enter into financial instruments for trading or speculative purposes. Further, the Company has a policy of only entering into contracts with parties that have at least an investment grade credit rating. The counterparties to these contracts are major financial institutions and there is no significant concentration of exposure with any one counterparty. Management believes the risk of loss is remote. The Company entered into credit support agreements (CSA) with certain derivative counterparties establishing collateral thresholds based on respective credit ratings and netting agreements. See Note 6 to the Consolidated Financial Statements for additional details on credit support agreements.
The Company invests in both fixed rate and floating rate interest earning securities which carry a degree of interest rate risk. The fair market value of fixed rate securities may be adversely impacted due to a rise in interest rates, while floating rate securities may produce less income than predicted if interest rates fall. A 1% (100 basis points) change in spread on the Company’s interest rate sensitive investments would either increase or decrease the unrealized value of cash equivalents and current marketable securities by less than $8.0 million.
The Company has access to substantial sources of funds at numerous banks worldwide. In June 2024, the Company secured a new 364-day Credit Facility of $10 billion, which expires on June 25, 2025. Interest charged on borrowings under the credit line agreement is based on either Secured Overnight Financing Rate (SOFR) Reference Rate or other applicable market rate as allowed plus applicable margins. Commitment fees under the agreement are not material.
Total borrowings at the end of 2024 and 2023 were $36.6 billion and $29.3 billion, respectively. The increase in the borrowings was due to the issuance of new debt in 2024. In 2024, net debt (cash and current marketable securities, net of debt) was $12.1 billion compared to net debt of $6.4 billion in 2023. Total debt represented 34.0% of total capital (shareholders’ equity and total debt) in 2024 and 30.0% of total capital in 2023. Shareholders’ equity per share at the end of 2024 was $29.70 compared to $28.57 at year-end 2023.
A summary of borrowings can be found in Note 7 to the Consolidated Financial Statements.
Dividends
The Company increased its dividend in 2024 for the 62nd consecutive year. Cash dividends paid were $4.91 per share in 2024 and $4.70 per share in 2023.
On January 2, 2025, the Board of Directors declared a regular cash dividend of $1.24 per share, payable on March 4, 2025 to shareholders of record as of February 18, 2025.
Other information
Critical accounting policies and estimates
Management’s discussion and analysis of results of operations and financial condition are based on the Company’s consolidated financial statements that have been prepared in accordance with accounting principles generally accepted in the U.S. (GAAP). The preparation of these financial statements requires that management make estimates and assumptions that affect the amounts reported for revenues, expenses, assets, liabilities and other related disclosures. Actual results may or may not differ from these estimates. The Company believes that the understanding of certain key accounting policies and estimates are essential in achieving more insight into the Company’s operating results and financial condition. These key accounting policies include revenue recognition, income taxes, legal and self-insurance contingencies, valuation of long-lived assets, assumptions used to determine the amounts recorded for pensions and other employee benefit plans and accounting for stock based awards.
Revenue Recognition: The Company recognizes revenue from product sales when obligations under the terms of a contract with the customer are satisfied; generally, this occurs with the transfer of control of the goods to customers. The Company's global payment terms are typically between 30 to 90 days. Provisions for certain rebates, sales incentives, trade promotions, coupons, product returns, discounts to customers and governmental clawback provisions are accounted for as variable consideration and recorded as a reduction in sales.
Product discounts granted are based on the terms of arrangements with direct, indirect and other market participants, as well as market conditions, including consideration of competitor pricing. Rebates and discounts are estimated based on contractual terms, historical experience, patient outcomes, trend analysis and projected market conditions in the various markets served. The Company evaluates market conditions for products or groups of products primarily through the analysis of wholesaler and other third-party sell-through and market research data, as well as internally generated information.
Sales returns are estimated and recorded based on historical sales and returns information. Products that have lost patent exclusivity, or that otherwise exhibit unusual sales or return patterns due to dating, competition or other marketing matters are specifically investigated and analyzed as part of the accounting for sales return accruals.
Sales returns allowances represent a reserve for products that may be returned due to expiration, destruction in the field, or in specific areas, product recall. In accordance with the Company’s accounting policies, the Company generally issues credit to customers for returned goods. The Company’s sales returns reserves are accounted for in accordance with the U.S. GAAP guidance for revenue recognition when right of return exists. Sales returns reserves are recorded at full sales value. Sales returns in the Innovative Medicine segment are almost exclusively not resalable. Sales returns for certain franchises in the MedTech segment are typically resalable but are not material. The Company infrequently exchanges products from inventory for returned products. The sales returns reserve for the total Company has been approximately 1.0% of annual net trade sales during the fiscal years 2024, 2023 and 2022.
Promotional programs, such as product listing allowances are recorded in the same period as related sales and include volume-based sales incentive programs. Volume-based incentive programs are based on the estimated sales volumes for the incentive period and are recorded as products are sold. These arrangements are evaluated to determine the appropriate amounts to be deferred or recorded as a reduction of revenue. The Company also earns profit-share payments through collaborative arrangements of certain products, which are included in sales to customers. Profit-share payments were less than 2.0% of the total revenues in fiscal year 2024 and 2023, respectively, and less than 3.0% of the total revenues in the fiscal year 2022 and are included in sales to customers.
In addition, the Company enters into collaboration arrangements that contain multiple revenue generating activities. Amounts due from collaborative partners for these arrangements are recognized as each activity is performed or delivered, based on the relative selling price. Upfront fees received as part of these arrangements are deferred and recognized over the performance period. See Note 1 to the Consolidated Financial Statements for additional disclosures on collaborations.
Reasonably likely changes to assumptions used to calculate the accruals for rebates, returns and promotions are not anticipated to have a material effect on the financial statements. The Company currently discloses the impact of changes to assumptions in the quarterly or annual filing in which there is a material financial statement impact.
Below are tables that show the progression of accrued rebates, returns, promotions, reserve for doubtful accounts and reserve for cash discounts by segment of business for the fiscal years ended December 29, 2024 and December 31, 2023.
Innovative Medicine segment
| | | | | | | | | | | | | | |
| (Dollars in Millions) | Balance at Beginning of Period | Accruals | Payments/ Credits(2) | Balance at End of Period |
| 2024 | | | | |
Accrued rebates (1) | $14,661 | 52,786 | (51,667) | 15,780 |
| Accrued returns | 634 | 845 | (355) | 1,124 |
| Accrued promotions | 6 | 3 | (6) | 3 |
| Subtotal | $15,301 | 53,634 | (52,028) | 16,907 |
| Reserve for doubtful accounts | 33 | 14 | (6) | 41 |
| Reserve for cash discounts | 111 | 1,493 | (1,495) | 109 |
| Total | $15,445 | 55,141 | (53,529) | 17,057 |
| | | | |
| 2023 | | | | |
Accrued rebates (1) | $12,289 | 47,523 | (45,151) | 14,661 |
| Accrued returns | 649 | 332 | (347) | 634 |
| Accrued promotions | 1 | 12 | (7) | 6 |
| Subtotal | $12,939 | 47,867 | (45,505) | 15,301 |
| Reserve for doubtful accounts | 44 | 0 | (11) | 33 |
| Reserve for cash discounts | 110 | 1,386 | (1,385) | 111 |
| Total | $13,093 | 49,253 | (46,901) | 15,445 |
(1)Includes reserve for customer rebates of $187 million at December 29, 2024 and $165 million at December 31, 2023, recorded as a contra asset.
(2)Includes prior period adjustments
MedTech segment
| | | | | | | | | | | | | | |
| (Dollars in Millions) | Balance at
Beginning of
Period | Accruals | Payments/
Credits | Balance at
End of
Period |
| 2024 | | | | |
Accrued rebates(1) | $1,455 | 5,955 | (5,986) | 1,424 |
| Accrued returns | 125 | 543 | (550) | 118 |
| Accrued promotions | 25 | 62 | (65) | 22 |
| Subtotal | $1,605 | 6,560 | (6,601) | 1,564 |
| Reserve for doubtful accounts | 133 | 31 | (38) | 126 |
| Reserve for cash discounts | 5 | 92 | (91) | 6 |
| Total | $1,743 | 6,683 | (6,730) | 1,696 |
| | | | |
| 2023 | | | | |
Accrued rebates(1) | $1,470 | 6,241 | (6,256) | 1,455 |
| Accrued returns | 134 | 555 | (564) | 125 |
| Accrued promotions | 43 | 74 | (92) | 25 |
| Subtotal | $1,647 | 6,870 | (6,912) | 1,605 |
| Reserve for doubtful accounts | 125 | 33 | (25) | 133 |
| Reserve for cash discounts | 9 | 96 | (100) | 5 |
| Total | $1,781 | 6,999 | (7,037) | 1,743 |
(1)Includes reserve for customer rebates of $704 million at December 29, 2024 and $740 million at December 31, 2023, recorded as a contra asset.
Income Taxes: Income taxes are recorded based on amounts refundable or payable for the current year and include the results of any difference between U.S. GAAP accounting and tax reporting, recorded as deferred tax assets or liabilities. The Company estimates deferred tax assets and liabilities based on enacted tax regulations and rates. Future changes in tax laws and rates may affect recorded deferred tax assets and liabilities.
The Company has unrecognized tax benefits for uncertain tax positions. The Company follows U.S. GAAP, which prescribes a recognition threshold and measurement attribute for the financial statement recognition and measurement of a tax position taken or expected to be taken in a tax return. Management believes that changes in these estimates would not have a material effect on the Company's results of operations, cash flows or financial position.
The Company has recorded deferred tax liabilities on all undistributed earnings prior to December 31, 2017 from its international subsidiaries. The Company has not provided deferred taxes on the undistributed earnings subsequent to January 1, 2018 from certain international subsidiaries where the earnings are considered to be indefinitely reinvested. The Company intends to continue to reinvest these earnings in those international operations. If the Company decides at a later date to repatriate these earnings to the U.S., the Company would be required to provide for the net tax effects on these amounts. The Company estimates that the tax effect of this repatriation would be approximately $0.5 billion under currently enacted tax laws and regulations and at current currency exchange rates. This amount does not include the possible benefit of U.S. foreign tax credits, which may substantially offset this cost.
See Note 1 and Note 8 to the Consolidated Financial Statements for further information regarding income taxes.
Legal and Self Insurance Contingencies: The Company records accruals for various contingencies, including legal proceedings and product liability claims as these arise in the normal course of business. The accruals are based on management’s judgment as to the probability of losses and, where applicable, actuarially determined estimates. The Company has self insurance through a wholly-owned captive insurance company. In addition to accruals in the self insurance program, claims that exceed the insurance coverage are accrued when losses are probable and amounts can be reasonably estimated.
The Company follows the provisions of U.S. GAAP when recording litigation related contingencies. A liability is recorded when a loss is probable and can be reasonably estimated.
See Notes 1 and 19 to the Consolidated Financial Statements for further information regarding product liability and legal proceedings.
Long-Lived and Intangible Assets: The Company assesses changes, both qualitatively and quantitatively, in economic conditions and makes assumptions regarding estimated future cash flows in evaluating the value of the Company’s property, plant and equipment, goodwill and intangible assets. As these assumptions and estimates may change over time, it may or may not be necessary for the Company to record impairment charges.
Employee Benefit Plans: The Company sponsors various retirement and pension plans, including defined benefit, defined contribution and termination indemnity plans, which cover most employees worldwide. These plans are based on assumptions for the discount rate, expected return on plan assets, mortality rates, expected salary increases, healthcare cost trend rates and attrition rates. See Note 10 to the Consolidated Financial Statements for further details on these rates.
Stock Based Compensation: The Company recognizes compensation expense associated with the issuance of equity instruments to employees for their services. Based on the type of equity instrument, the fair value is estimated on the date of grant using either the Black-Scholes option valuation model or a combination of both the Black-Scholes option valuation model and Monte Carlo valuation model, and is expensed in the financial statements over the service period. The input assumptions used in determining fair value are the expected life, expected volatility, risk-free rate and expected dividend yield. For performance share units, the fair market value is calculated for the two component goals at the date of grant: adjusted operational earnings per share and relative total shareholder return. The fair values for the earnings per share goal of each performance share unit was estimated on the date of grant using the fair market value of the shares at the time of the award, discounted for dividends, which are not paid on the performance share units during the vesting period. The fair value for the relative total shareholder return goal of each performance share unit was estimated on the date of grant using the Monte Carlo valuation model. See Note 16 to the Consolidated Financial Statements for additional information.
New accounting pronouncements
Refer to Note 1 to the Consolidated Financial Statements for recently adopted accounting pronouncements and recently issued accounting pronouncements not yet adopted as of December 29, 2024.
Economic and market factors
The Company is aware that its products are used in an environment where, for more than a decade, policymakers, consumers and businesses have expressed concerns about the rising cost of healthcare. In response to these concerns, the Company has a long-standing policy of pricing products responsibly. For the period 2014 - 2024, in the U.S., the weighted average compound annual growth rate of the Company’s net price increases for healthcare products (prescription and over-the-counter drugs, hospital and professional products) was below the U.S. Consumer Price Index (CPI).
The Company operates in certain countries where the economic conditions continue to present significant challenges. The Company continues to monitor these situations and take appropriate actions. Inflation rates continue to have an effect on worldwide economies and, consequently, on the way companies operate. The Company has accounted for operations in Argentina, Venezuela, Turkey and Egypt (beginning in the fiscal fourth quarter of 2024) as highly inflationary, as the prior three-year cumulative inflation rate surpassed 100%. This did not have a material impact to the Company's results in the period. In the face of increasing costs, the Company strives to maintain its profit margins through cost reduction programs, productivity improvements and periodic price increases.
In July 2023, Janssen Pharmaceuticals, Inc. (Janssen) filed litigation against the U.S. Department of Health and Human Services as well as the Centers for Medicare and Medicaid Services challenging the constitutionality of the IRA's Medicare Drug Price Negotiation Program. The litigation requests a declaration that the IRA violates Janssen’s rights under the First Amendment and the Fifth Amendment to the Constitution and therefore that Janssen is not subject to the IRA’s mandatory pricing scheme. The impact of the IRA on our business and the broader pharmaceutical industry remains uncertain, as litigation filed by Janssen and other pharmaceutical companies remains ongoing and while CMS has publicly announced the maximum fair price for each of the selected drugs, implementation of the program is still in progress. In April 2024, Janssen appealed the district court’s denial of its summary judgment motion to the Third Circuit.
Russia-Ukraine War
Although the long-term implications of Russia’s invasion of Ukraine are difficult to predict at this time, the financial impact of the conflict in the fiscal year 2024, including accounts receivable or inventory reserves, was not material. As of and for each of the fiscal years ending December 29, 2024 and December 31, 2023, the business of the Company’s Russian subsidiaries represented less than 1% of the Company’s consolidated assets and revenues. The Company does not maintain Ukraine subsidiaries subsequent to the Kenvue separation.
In March of 2022, the Company took steps to suspend all advertising, enrollment in clinical trials, and any additional investment in Russia. The Company continues to supply products relied upon by patients for healthcare purposes.
Conflict in the Middle East
Although the long-term implications of the conflict in the Middle East are difficult to predict at this time, the financial impact of the conflict in the fiscal year 2024, including accounts receivable or inventory reserves, was not material. As of and for each of the fiscal years ending December 29, 2024 and December 31, 2023, the business of the Company’s Israel subsidiaries represented 1% of the Company’s consolidated assets and represented less than 1% of revenues.
The Company is exposed to fluctuations in currency exchange rates. A 1% change in the value of the U.S. Dollar as compared to all foreign currencies in which the Company had sales, income or expense in 2024 would have increased or decreased the translation of foreign sales by approximately $0.4 billion and net income by approximately $0.1 billion.
Governments around the world consider various proposals to make changes to tax laws, which may include increasing or decreasing existing statutory tax rates. In connection with various government initiatives, companies are required to disclose more information to tax authorities on operations around the world, which may lead to greater audit scrutiny of profits earned in other countries. A change in statutory tax rate in any country would result in the revaluation of the Company’s deferred tax assets and liabilities related to that particular jurisdiction in the period in which the new tax law is enacted. This change would result in an expense or benefit recorded to the Company’s Consolidated Statement of Earnings. The Company closely monitors these proposals as they arise in the countries where it operates. Changes to the statutory tax rate may occur at any time, and any related expense or benefit recorded may be material to the fiscal quarter and year in which the law change is enacted.
The Company faces various worldwide healthcare changes that may continue to result in pricing pressures that include healthcare cost containment and government legislation relating to sales, promotions, pricing and reimbursement of healthcare products.
Changes in the behavior and spending patterns of purchasers of healthcare products and services, including delaying medical procedures, rationing prescription medications, reducing the frequency of physician visits and foregoing healthcare insurance coverage may continue to impact the Company’s businesses.
The Company also operates in an environment increasingly hostile to intellectual property rights. Firms have filed Abbreviated New Drug Applications or Biosimilar Biological Product Applications with the U.S. FDA or otherwise challenged the coverage and/or validity of the Company's patents, seeking to market generic or biosimilar forms of many of the Company’s key pharmaceutical products prior to expiration of the applicable patents covering those products. In the event the Company is not successful in defending the patent claims challenged in the resulting lawsuits, generic or biosimilar versions of the products at issue will be introduced to the market, resulting in the potential for substantial market share and revenue losses for those products, and which may result in a non-cash impairment charge in any associated intangible asset. There is also a risk that one or more competitors could launch a generic or biosimilar version of the product at issue following regulatory approval even though one or more valid patents are in place.
Legal proceedings
Johnson & Johnson and certain of its subsidiaries are involved in various lawsuits and claims regarding product liability, intellectual property, commercial, employment, indemnification and other matters; governmental investigations; and other legal proceedings that arise from time to time in the ordinary course of business.
The Company records accruals for loss contingencies associated with these legal matters when it is probable that a liability will be incurred and the amount of the loss can be reasonably estimated. As of December 29, 2024, the Company has determined that the liabilities associated with certain litigation matters are probable and can be reasonably estimated. The Company has accrued for these matters and will continue to monitor each related legal issue and adjust accruals as might be warranted based on new information and further developments in accordance with ASC 450-20-25, Contingencies. For these and other litigation and regulatory matters discussed below for which a loss is probable or reasonably possible, the Company is unable to estimate the possible loss or range of loss beyond the amounts accrued. Amounts accrued for legal contingencies often result from a complex series of judgments about future events and uncertainties that rely heavily on estimates and assumptions including timing of related payments. The ability to make such estimates and judgments can be affected by various factors including, among other things, whether damages sought in the proceedings are unsubstantiated or indeterminate; scientific and legal discovery has not commenced or is not complete; proceedings are in early stages; matters present legal uncertainties; there are significant facts in dispute; procedural or jurisdictional issues; the uncertainty and unpredictability of the number of potential claims; ability to achieve comprehensive multi-party settlements; complexity of related cross-claims and counterclaims; and/or there are numerous parties involved. To the extent adverse awards, judgments or verdicts have been rendered against the Company, the Company does not record an accrual until a loss is determined to be probable and can be reasonably estimated.
In the Company's opinion, based on its examination of these matters, its experience to date and discussions with counsel, the ultimate outcome of legal proceedings, net of liabilities accrued in the Company's balance sheet, is not expected to have a material adverse effect on the Company's financial position. However, the resolution of, or increase in accruals for, one or more of these matters in any reporting period may have a material adverse effect on the Company's results of operations and cash flows for that period.
See Note 19 to the Consolidated Financial Statements included in Item 8 of this report for further information regarding legal proceedings.
Common stock
The Company’s Common Stock is listed on the New York Stock Exchange under the symbol JNJ. As of February 6, 2025, there were 114,147 record holders of Common Stock of the Company.
Item 7A. Quantitative and qualitative disclosures about market risk
The information called for by this item is incorporated herein by reference to Item 7. Management’s discussion and analysis of results of operations and financial condition - Liquidity and capital resources - Financing and market risk of this Report; and Note 1 Summary of significant accounting policies - Financial instruments of the Notes to Consolidated Financial Statements included in Item 8 of this Report.
Item 8. Financial statements and supplementary data
Index to audited Consolidated Financial Statements
Johnson & Johnson and subsidiaries consolidated balance sheets
At December 29, 2024 and December 31, 2023
(Dollars in Millions Except Share and Per Share Amounts) (Note 1)
| | | | | | | | |
| 2024 | 2023 |
| Assets | | |
| Current assets | | |
| Cash and cash equivalents (Notes 1 and 2) | $24,105 | 21,859 |
| Marketable securities (Notes 1 and 2) | 417 | 1,068 |
| Accounts receivable trade, less allowances $167 (2023, $166) | 14,842 | 14,873 |
| Inventories (Notes 1 and 3) | 12,444 | 11,181 |
| | |
| Prepaid expenses and other receivables | 4,085 | 4,514 |
| | |
| Total current assets | 55,893 | 53,495 |
| Property, plant and equipment, net (Notes 1 and 4) | 20,518 | 19,898 |
| Intangible assets, net (Notes 1 and 5) | 37,618 | 34,175 |
| Goodwill (Notes 1 and 5) | 44,200 | 36,558 |
| Deferred taxes on income (Note 8) | 10,461 | 9,279 |
| Other assets | 11,414 | 14,153 |
| | |
| Total assets | $180,104 | 167,558 |
| Liabilities and Shareholders’ Equity | | |
| Current liabilities | | |
| Loans and notes payable (Note 7) | $5,983 | 3,451 |
| Accounts payable | 10,311 | 9,632 |
| Accrued liabilities | 8,549 | 10,212 |
| Accrued rebates, returns and promotions | 17,580 | 16,001 |
| Accrued compensation and employee related obligations | 4,126 | 3,993 |
| Accrued taxes on income (Note 8) | 3,772 | 2,993 |
| | |
| Total current liabilities | 50,321 | 46,282 |
| Long-term debt (Note 7) | 30,651 | 25,881 |
| Deferred taxes on income (Note 8) | 2,448 | 3,193 |
| Employee related obligations (Notes 9 and 10) | 7,255 | 7,149 |
| Long-term taxes payable (Note 1) | 390 | 2,881 |
| Other liabilities | 17,549 | 13,398 |
| | |
| Total liabilities | 108,614 | 98,784 |
| Commitments and Contingencies (Note 19) | | |
| Shareholders’ equity | | |
| Preferred stock — without par value (authorized and unissued 2,000,000 shares) | — | — |
| Common stock — par value $1.00 per share (Note 12) (authorized 4,320,000,000 shares; issued 3,119,843,000 shares) | 3,120 | 3,120 |
| Accumulated other comprehensive income (loss) (Note 13) | (11,741) | (12,527) |
| Retained earnings and Additional-paid-in-capital | 155,791 | 153,843 |
| Less: common stock held in treasury, at cost (Note 12) (712,921,000 shares and 712,765,000 shares) | 75,680 | 75,662 |
| Total shareholders’ equity | 71,490 | 68,774 |
| Total liabilities and shareholders’ equity | $180,104 | 167,558 |
See Notes to Consolidated Financial Statements
Johnson & Johnson and subsidiaries consolidated statements of earnings
(Dollars and Shares in Millions Except Per Share Amounts) (Note 1)
| | | | | | | | | | | |
| 2024 | 2023 | 2022 |
| Sales to customers | $88,821 | 85,159 | 79,990 |
| Cost of products sold | 27,471 | 26,553 | 24,596 |
| Gross profit | 61,350 | 58,606 | 55,394 |
| Selling, marketing and administrative expenses | 22,869 | 21,512 | 20,246 |
| Research and development expense | 17,232 | 15,085 | 14,135 |
| In-process research and development impairments | 211 | 313 | 783 |
| Interest income | (1,332) | (1,261) | (490) |
| Interest expense, net of portion capitalized (Note 4) | 755 | 772 | 276 |
| Other (income) expense, net | 4,694 | 6,634 | 810 |
| Restructuring (Note 20) | 234 | 489 | 275 |
| Earnings before provision for taxes on income | 16,687 | 15,062 | 19,359 |
| Provision for taxes on income (Note 8) | 2,621 | 1,736 | 2,989 |
| Net earnings from continuing operations | 14,066 | 13,326 | 16,370 |
| Net earnings from discontinued operations, net of tax (Note 21) | — | 21,827 | 1,571 |
| Net earnings | $14,066 | 35,153 | 17,941 |
| | | |
| Net earnings per share (Notes 1 and 15) | | | |
| | | |
| Continuing operations - basic | $5.84 | 5.26 | 6.23 |
| Discontinued operations - basic | — | 8.62 | 0.60 |
| Total net earnings per share - basic | $5.84 | 13.88 | 6.83 |
| | | |
| Continuing operations - diluted | $5.79 | 5.20 | 6.14 |
| Discontinued operations - diluted | — | 8.52 | 0.59 |
| Total net earnings per share - diluted | $5.79 | 13.72 | 6.73 |
| | | |
| Average shares outstanding (Notes 1 and 15) | | | |
| Basic | 2,407.3 | 2,533.5 | 2,625.2 |
| Diluted | 2,429.4 | 2,560.4 | 2,663.9 |
See Notes to Consolidated Financial Statements
Johnson & Johnson and subsidiaries consolidated statements of comprehensive income
(Dollars in Millions) (Note 1)
| | | | | | | | | | | |
| 2024 | 2023 | 2022 |
| Net earnings | $14,066 | 35,153 | 17,941 |
| | | |
| Other comprehensive income (loss), net of tax | | | |
| Foreign currency translation | 1,708 | (3,221) | (1,796) |
| | | |
| Securities: | | | |
| Unrealized holding gain (loss) arising during period | 2 | 26 | (24) |
| Reclassifications to earnings | — | — | — |
| Net change | 2 | 26 | (24) |
| | | |
| Employee benefit plans: | | | |
| Prior service credit (cost), net of amortization | (154) | (149) | (160) |
| Gain (loss), net of amortization | 541 | (1,183) | 1,854 |
| Consumer settlement/ curtailment | — | 23 | — |
| Effect of exchange rates | 62 | (90) | 111 |
| Net change | 449 | (1,399) | 1,805 |
| | | |
| Derivatives & hedges: | | | |
| Unrealized gain (loss) arising during period | (511) | 422 | 454 |
| Reclassifications to earnings | (862) | (569) | (348) |
| Net change | (1,373) | (147) | 106 |
| | | |
| Other comprehensive income (loss) | 786 | (4,741) | 91 |
| | | |
| Comprehensive income | $14,852 | 30,412 | 18,032 |
| | | |
| | | |
| | | |
| | | |
| | | |
The tax cost/(benefit) effects in other comprehensive income for the fiscal years 2024, 2023 and 2022 respectively: Foreign Currency Translation; $(1.1) billion, $797 million and $(460) million; Employee Benefit Plans: $86 million, $(289) million and $461 million, Derivatives & Hedges: $(365) million, $(39) million and $30 million.
See Notes to Consolidated Financial Statements
Amounts presented for 2023 and 2022 have not been recast to exclude discontinued operations
Johnson & Johnson and subsidiaries consolidated statements of equity
(Dollars in Millions) (Note 1)
| | | | | | | | | | | | | | | | | |
| Total | Retained
Earnings and
Additional
paid-in
capital | Accumulated
Other
Comprehensive
Income (Loss) | Common
Stock
Issued
Amount | Treasury
Stock
Amount |
| Balance, January 2, 2022 | $74,023 | 123,060 | (13,058) | 3,120 | (39,099) |
| | | | | |
| Net earnings | 17,941 | 17,941 | | | |
| Cash dividends paid ($4.45 per share) | (11,682) | (11,682) | | | |
| Employee compensation and stock option plans | 2,466 | (974) | | | 3,440 |
| Repurchase of common stock | (6,035) | | | | (6,035) |
| | | | | |
| Other comprehensive income (loss), net of tax | 91 | | 91 | | |
| Balance, January 1, 2023 | 76,804 | 128,345 | (12,967) | 3,120 | (41,694) |
| | | | | |
| Net earnings | 35,153 | 35,153 | | | |
| Cash dividends paid ($4.70 per share) | (11,770) | (11,770) | | | |
| Employee compensation and stock option plans | 2,193 | (336) | | | 2,529 |
| Repurchase of common stock | (5,054) | | | | (5,054) |
| Other | (25) | | | | (25) | |
| Kenvue Separation /IPO (Note 21) | (23,786) | | 2,451 | | 5,181 | | | (31,418) |
| Other comprehensive income (loss), net of tax | (4,741) | | (4,741) | | |
| Balance, December 31, 2023 | 68,774 | 153,843 | (12,527) | 3,120 | (75,662) |
| | | | | |
| Net earnings | 14,066 | 14,066 | | | |
| Cash dividends paid ($4.91 per share) | (11,823) | (11,823) | | | |
| Employee compensation and stock option plans | 2,094 | (295) | | | 2,389 |
| Repurchase of common stock | (2,407) | | | | (2,407) |
| | | | | |
| | | | | |
| Other comprehensive income (loss), net of tax | 786 | | 786 | | |
| Balance, December 29, 2024 | $71,490 | 155,791 | (11,741) | 3,120 | (75,680) |
See Notes to Consolidated Financial Statements
Johnson & Johnson and subsidiaries consolidated statements of cash flows
(Dollars in Millions) (Note 1)
| | | | | | | | | | | |
| 2024 | 2023 | 2022 |
| Cash flows from operating activities | | | |
| Net earnings | $14,066 | 35,153 | 17,941 |
| Adjustments to reconcile net earnings to cash flows from operating activities: | | | |
| Depreciation and amortization of property and intangibles | 7,339 | 7,486 | 6,970 |
| Stock based compensation | 1,176 | 1,162 | 1,138 |
| | | |
| Asset write-downs | 405 | 1,295 | 1,216 |
| | | |
| Charges for acquired in-process research and development assets | 1,841 | 483 | — |
| Gain on Kenvue separation | — | (20,984) | — |
| Net gain on sale of assets/businesses | (226) | (117) | (380) |
| | | |
| Deferred tax provision | (2,183) | (4,194) | (1,663) |
| Credit losses and accounts receivable allowances | 11 | — | (17) |
| Changes in assets and liabilities, net of effects from acquisitions and divestitures: | | | |
| Increase in accounts receivable | (406) | (624) | (1,290) |
| Increase in inventories | (1,128) | (1,323) | (2,527) |
| Increase in accounts payable and accrued liabilities | 1,621 | 2,346 | 1,098 |
| Decrease/(Increase) in other current and non-current assets | 1,717 | (3,480) | 687 |
| Increase/(Decrease) in other current and non-current liabilities | 33 | 5,588 | (1,979) |
| Net cash flows from operating activities | 24,266 | 22,791 | 21,194 |
| Cash flows from investing activities | | | |
| Additions to property, plant and equipment | (4,424) | (4,543) | (4,009) |
| Proceeds from the disposal of assets/businesses, net | 675 | 358 | 543 |
| Acquisitions, net of cash acquired (Note 18) | (15,146) | — | (17,652) |
| Acquired in-process research and development assets (Note 18) | (1,783) | (470) | — |
| Purchases of investments | (1,726) | (10,906) | (32,384) |
| Sales of investments | 2,462 | 19,390 | 41,609 |
| Credit support agreements activity, net | 1,517 | (2,963) | (249) |
| Other (including capitalized licenses and milestones) | (174) | 12 | (229) |
| Net cash (used by)/from investing activities | (18,599) | 878 | (12,371) |
| Cash flows from financing activities | | | |
| Dividends to shareholders | (11,823) | (11,770) | (11,682) |
| Repurchase of common stock | (2,432) | (5,054) | (6,035) |
| Proceeds from short-term debt | 15,277 | 13,743 | 16,134 |
| Repayment of short-term debt | (9,463) | (22,973) | (6,550) |
| Proceeds from long-term debt, net of issuance costs | 6,660 | — | 2 |
| Repayment of long-term debt | (1,453) | (1,551) | (2,134) |
| Proceeds from the exercise of stock options/employee withholding tax on stock awards, net | 838 | 1,094 | 1,329 |
| Credit support agreements activity, net | 272 | (219) | (28) |
| | | | | | | | | | | |
| 2024 | 2023 | 2022 |
| Settlement of convertible debt acquired from Shockwave | (970) | — | — |
| Proceeds of short and long-term debt, net of issuance cost, related to the debt that transferred to Kenvue at separation | — | 8,047 | — |
| Proceeds from Kenvue initial public offering | — | 4,241 | — |
| Cash transferred to Kenvue at separation | — | (1,114) | — |
| Other | (38) | (269) | 93 |
| Net cash used by financing activities | (3,132) | (15,825) | (8,871) |
| Effect of exchange rate changes on cash and cash equivalents | (289) | (112) | (312) |
| Increase/(Decrease) in cash and cash equivalents | 2,246 | 7,732 | (360) |
| Cash and cash equivalents from continuing operations, beginning of period | 21,859 | 12,889 | 13,309 |
| Cash and cash equivalents from discontinued operations, beginning of period | — | 1,238 | 1,178 |
| Cash and cash equivalents, beginning of year (Note 1) | 21,859 | 14,127 | 14,487 |
| | | |
| Cash and cash equivalents from continuing operations, end of period | 24,105 | 21,859 | 12,889 |
| Cash and cash equivalents from discontinued operations, end of period | — | — | 1,238 |
| Cash and cash equivalents, end of year (Note 1) | $24,105 | 21,859 | 14,127 |
| | | |
| Supplemental cash flow data | | | |
| Cash paid during the year for: | | | |
| Interest | $1,990 | 1,836 | 982 |
| Interest, net of amount capitalized | 1,911 | 1,766 | 933 |
| Income taxes, inclusive of discontinued operations | 6,714 | 8,574 | 5,223 |
| | | |
| Supplemental schedule of non-cash investing and financing activities | | | |
| Treasury stock issued for employee compensation and stock option plans, net of cash proceeds/ employee withholding tax on stock awards | $1,551 | 1,435 | 2,114 |
| | | |
| | | |
| Acquisitions | | | |
| Fair value of assets acquired | $16,091 | — | 18,710 |
| Fair value of liabilities assumed | (1,632) | — | (1,058) |
| Net cash paid for acquisitions (Note 18) | $14,459 | — | 17,652 |
See Notes to Consolidated Financial Statements
Amounts presented for 2023 and 2022 have not been recast to exclude discontinued operations.
Notes to consolidated financial statements
1. Summary of significant accounting policies
Principles of consolidation
The consolidated financial statements include the accounts of Johnson & Johnson and its subsidiaries (the Company). Intercompany accounts and transactions are eliminated. Columns and rows within tables may not add due to rounding. Percentages have been calculated using actual, non-rounded figures.
Description of the company
The Company has approximately 138,100 employees worldwide engaged in the research and development, manufacture and sale of a broad range of products in the healthcare field. The Company conducts business in virtually all countries of the world and its primary focus is on products related to human health and well-being.
Kenvue IPO/separation and discontinued operations
On May 8, 2023, Kenvue, completed an initial public offering (the IPO) resulting in the issuance of 198,734,444 shares of its common stock, par value $0.01 per share (the “Kenvue Common Stock”), at an initial public offering of $22.00 per share for net proceeds of $4.2 billion. The excess of the net proceeds from the IPO over the net book value of the Johnson & Johnson divested interest was $2.5 billion and was recorded to additional paid-in capital. As of the closing of the IPO, Johnson & Johnson owned approximately 89.6% of the total outstanding shares of Kenvue Common Stock and at July 2, 2023, the
non-controlling interest of $1.3 billion associated with Kenvue was reflected in equity attributable to non-controlling interests in the consolidated balance sheet in the fiscal second quarter of 2023.
On August 23, 2023, Johnson & Johnson completed the disposition of an additional 80.1% ownership of the shares of Kenvue through an exchange offer. Following the exchange offer, the Company owned 9.5% of the shares of Kenvue which were accounted for as an equity investment carried at fair value within continuing operations. The historical results of the Consumer Health business (which previously represented the Consumer Health business segment) are reflected as discontinued operations in the Company’s Consolidated Financial Statements through the date of the exchange offer (see Note 21 for additional details). Unless otherwise indicated, the information in the notes to the Consolidated Financial Statements refer only to Johnson & Johnson’s continuing operations.
In the fiscal second quarter of 2024 the Company completed a debt for equity exchange of the retained stake in Kenvue. Upon completion of the debt for equity exchange, the Company no longer owns any shares of Kenvue Common Stock.
Business segments
The Company is organized into two business segments: Innovative Medicine and MedTech. The Innovative Medicine segment is focused on the following therapeutic areas: Immunology, Infectious Diseases, Neuroscience, Oncology, Pulmonary Hypertension, and Cardiovascular and Metabolic. Products in this segment are distributed directly to retailers, wholesalers, distributors, hospitals and healthcare professionals for prescription use. The MedTech segment includes a broad portfolio of products used in the Orthopaedic, Surgery, Cardiovascular (previously referred to as Interventional Solutions) and Vision fields. These products are distributed to wholesalers, hospitals and retailers, and used principally in the professional fields by physicians, nurses, hospitals, eye care professionals and clinics.
New accounting standards
Recently adopted accounting standards
ASU 2023-07: Segment Reporting (Topic 280) – Improvements to Reportable Segment Disclosures
The Company adopted the standard in the fiscal year 2024, which requires expanded annual and interim disclosures for significant segment expenses that are regularly provided to the chief operating decision maker and included within each reported measure of segment profit or loss. The standard was applied retrospectively to all periods presented in the financial statements. As this accounting standard only impacts disclosures, it did not have a material impact on the Company’s Consolidated Financial Statements. See Note 17 for the required disclosures.
Recently issued accounting standards
Not adopted as of December 29, 2024
ASU 2024-03: Income Statement – Reporting Comprehensive Income – Expense Disaggregation Disclosures (Subtopic 220-40): Disaggregation of Income Statement Expenses
This update requires disclosure of disaggregated information about certain income statement expense line items on an annual and interim basis. This update will be effective for fiscal years beginning after December 15, 2026, and interim periods within fiscal years beginning after December 15, 2027. Early adoption is permitted. As this accounting standard only impacts disclosures, it will not have a material impact on the Company’s Consolidated Financial Statements.
ASU 2023-09: Income Taxes (Topic 740) - Improvements to Income Tax Disclosures
This update standardizes categories for the effective tax rate reconciliation, requires disaggregation of income taxes and additional income tax-related disclosures. This update is required to be effective for the Company for fiscal periods beginning after December 15, 2024. As this accounting standard only impacts disclosures, it will not have a material impact on the Company’s Consolidated Financial Statements.
Cash equivalents
The Company classifies all highly liquid investments with stated maturities of three months or less from date of purchase as cash equivalents and all highly liquid investments with stated maturities of greater than three months from the date of purchase as current marketable securities. The Company has a policy of making investments only with commercial institutions that have at least an investment grade credit rating. The Company invests its cash primarily in government securities and obligations, corporate debt securities, money market funds and reverse repurchase agreements (RRAs).
RRAs are collateralized by deposits in the form of Government Securities and Obligations for an amount not less than 102% of their value. The Company does not record an asset or liability as the Company is not permitted to sell or repledge the associated collateral. The Company has a policy that the collateral has at least an A (or equivalent) credit rating. The Company utilizes a third party custodian to manage the exchange of funds and ensure that collateral received is maintained at 102% of the value of the RRAs on a daily basis. RRAs with stated maturities of greater than three months from the date of purchase are classified as marketable securities.
Investments
Investments classified as held to maturity investments are reported at amortized cost and realized gains or losses are reported in earnings. Investments classified as available-for-sale debt securities are carried at estimated fair value with unrealized gains and losses recorded as a component of accumulated other comprehensive income. Available-for-sale securities available for current operations are classified as current assets; otherwise, they are classified as long term. Management determines the appropriate classification of its investment in debt and equity securities at the time of purchase and re-evaluates such determination at each balance sheet date. The Company reviews its investments for impairment and adjusts these investments to fair value through earnings, as required.
Property, plant and equipment and depreciation
Property, plant and equipment are stated at cost. The Company utilizes the straight-line method of depreciation over the estimated useful lives of the assets:
| | | | | |
| Building and building equipment | 30 years |
| Land and leasehold improvements | 10 - 20 years |
| Machinery and equipment | 2 - 13 years |
The Company capitalizes certain computer software and development costs, included in machinery and equipment, when incurred in connection with developing or obtaining computer software for internal use. Capitalized software costs are amortized over the estimated useful lives of the software, which generally range from 3 to 8 years.
The Company reviews long-lived assets to assess recoverability using undiscounted cash flows. When certain events or changes in operating or economic conditions occur, an impairment assessment may be performed on the recoverability of the carrying value of these assets. If the asset is determined to be impaired, the loss is measured based on the difference between the asset’s fair value and its carrying value. If quoted market prices are not available, the Company will estimate fair value using a discounted value of estimated future cash flows.
Revenue recognition
The Company recognizes revenue from product sales when obligations under the terms of a contract with the customer are satisfied; generally, this occurs with the transfer of control of the goods to customers. The Company's global payment terms are typically between 30 to 90 days. Provisions for certain rebates, sales incentives, trade promotions, coupons, product returns, discounts to customers and governmental clawback provisions are accounted for as variable consideration and recorded as a reduction in sales. The liability is recognized within Accrued rebates, returns, and promotions on the consolidated balance sheet.
Product discounts granted are based on the terms of arrangements with direct, indirect and other market participants, as well as market conditions, including consideration of competitor pricing. Rebates and discounts are estimated based on contractual terms, historical experience, patient outcomes, trend analysis and projected market conditions in the various markets served. A significant portion of the liability related to rebates is from the sale of the Company's pharmaceutical products within the U.S., primarily the Managed Care, Medicare and Medicaid programs, which amounted to $12.3 billion and $11.5 billion as of December 29, 2024 and December 31, 2023, respectively. The Company evaluates market conditions for products or groups of products primarily through the analysis of wholesaler and other third-party sell-through and market research data, as well as internally generated information.
Sales returns are estimated and recorded based on historical sales and returns information. Products that have lost patent exclusivity, or that otherwise exhibit unusual sales or return patterns due to dating, competition or other marketing matters are specifically investigated and analyzed as part of the accounting for sales return accruals.
Sales returns allowances represent a reserve for products that may be returned due to expiration, destruction in the field, or in specific areas, product recall. In accordance with the Company’s accounting policies, the Company generally issues credit to customers for returned goods. The Company’s sales returns reserves are accounted for in accordance with the U.S. GAAP guidance for revenue recognition when right of return exists. Sales returns reserves are recorded at full sales value. Sales returns in the Innovative Medicine segment are almost exclusively not resalable. Sales returns for certain franchises in the MedTech segment are typically resalable but are not material. The Company infrequently exchanges products from inventory for returned products. The sales returns reserve for the total Company has been approximately 1.0% of annual net trade sales during each of the fiscal years 2024, 2023 and 2022.
Promotional programs, such as product listing allowances are recorded in the same period as related sales and include
volume-based sales incentive programs. Volume-based incentive programs are based on the estimated sales volumes for the incentive period and are recorded as products are sold. These arrangements are evaluated to determine the appropriate amounts to be deferred or recorded as a reduction of revenue. The Company also earns profit-share payments through collaborative arrangements of certain products, which are included in sales to customers. Profit-share payments were less than 2.0% of the total revenues in the fiscal year 2024 and 2023, respectively, and less than 3.0% of total revenues in the fiscal year 2022 and are included in sales to customers.
See Note 17 to the Consolidated Financial Statements for further disaggregation of revenue.
Shipping and handling
Shipping and handling costs incurred were $0.9 billion, $0.9 billion and $0.8 billion in fiscal years 2024, 2023 and 2022, respectively, and are included in selling, marketing and administrative expense. The amount of revenue received for shipping and handling is less than 1.0% of sales to customers for all periods presented.
Inventories
Inventories are stated at the lower of cost or net realizable value determined by the first-in, first-out method.
Intangible assets and goodwill
The authoritative literature on U.S. GAAP requires that goodwill and intangible assets with indefinite lives be assessed annually for impairment. The Company completed its annual impairment test for 2024 in the fiscal fourth quarter. Future impairment tests will be performed annually in the fiscal fourth quarter, or sooner if warranted. In-process research and development purchased as part of a business combination is accounted for as an indefinite lived intangible asset until the underlying project is completed, at which point the intangible asset will be accounted for as a definite lived intangible asset. If warranted the purchased in-process research and development could be written off or partially impaired depending on the underlying program.
Intangible assets that have finite useful lives continue to be amortized over their useful lives and are reviewed for impairment when warranted by economic conditions. See Note 5 for further details on Intangible Assets and Goodwill.
Financial instruments
As required by U.S. GAAP, all derivative instruments are recorded on the balance sheet at fair value. Fair value is the exit price that would be received to sell an asset or paid to transfer a liability. Fair value is a market-based measurement determined using assumptions that market participants would use in pricing an asset or liability. The authoritative literature establishes a three-level hierarchy to prioritize the inputs used in measuring fair value, with Level 1 having the highest priority and Level 3 having the lowest. Changes in the fair value of derivatives are recorded each period in current earnings or other comprehensive income, depending on whether the derivative is designated as part of a hedge transaction, and if so, the type of hedge transaction.
The Company documents all relationships between hedged items and derivatives. The overall risk management strategy includes reasons for undertaking hedge transactions and entering into derivatives. The objectives of this strategy are: (1) minimize foreign currency exposure’s impact on the Company’s financial performance; (2) protect the Company’s cash flow from adverse movements in foreign exchange rates; (3) ensure the appropriateness of financial instruments; and (4) manage the enterprise risk associated with financial institutions. See Note 6 for additional information on Financial Instruments.
Leases
The Company determines whether an arrangement is a lease at contract inception by establishing if the contract conveys the right to control the use of identified property, plant, or equipment for a period of time in exchange for consideration. Right of Use (ROU) Assets and Lease Liabilities for operating leases are included in Other assets, Accrued liabilities, and Other liabilities on the consolidated balance sheet. The ROU Assets represent the right to use an underlying asset for the lease term and lease liabilities represent an obligation to make lease payments arising from the lease. Commitments under finance leases are not significant, and are included in Property, plant and equipment, Loans and notes payable, and Long-term debt on the consolidated balance sheet.
ROU Assets and Lease Liabilities are recognized at the lease commencement date based on the present value of all minimum lease payments over the lease term. The Company uses its incremental borrowing rate based on the information available at commencement date in determining the present value of lease payments, when the implicit rate is not readily determinable. Lease terms may include options to extend or terminate the lease. These options are included in the lease term when it is reasonably certain that the Company will exercise that option. Operating lease expense is recognized on a straight-line basis over the lease term. The Company has elected the following policy elections on adoption: use of portfolio approach on leases of assets under master service agreements, exclusion of short term leases on the balance sheet, and not separating lease and non-lease components.
The Company primarily has operating lease for space, vehicles, manufacturing equipment and data processing equipment. The ROU asset pertaining to leases from continuing operations was $1.1 billion and $1.0 billion in fiscal years 2024 and 2023, respectively. The lease liability from continuing operations was $1.2 billion and $1.1 billion in fiscal years 2024 and 2023, respectively. The operating lease costs from continuing operations were $0.2 billion in fiscal years 2024, 2023 and 2022. Cash paid for amounts included in the measurement of lease liabilities from continuing operations were $0.2 billion in fiscal years 2024, 2023 and 2022.
Product liability
Accruals for product liability claims are recorded, on an undiscounted basis, when it is probable that a liability has been incurred and the amount of the liability can be reasonably estimated based on existing information and actuarially determined estimates where applicable. The accruals are adjusted periodically as additional information becomes available. The Company accrues an estimate of the legal defense costs needed to defend each matter when those costs are probable and can be reasonably estimated. To the extent adverse verdicts have been rendered against the Company, the Company does not record an accrual until a loss is determined to be probable and can be reasonably estimated.
The Company has self insurance through a wholly-owned captive insurance company. In addition to accruals in the self insurance program, claims that exceed the insurance coverage are accrued when losses are probable and amounts can be reasonably estimated.
Research and development
Research and development expenses are expensed as incurred in accordance with ASC 730, Research and Development. Upfront and milestone payments made to third parties in connection with research and development collaborations are expensed as incurred up to the point of regulatory approval. Payments made to third parties subsequent to regulatory approval are capitalized and amortized over the remaining useful life of the related product. Amounts capitalized for such payments are included in other intangibles, net of accumulated amortization.
The Company enters into collaborative arrangements, typically with other pharmaceutical or biotechnology companies, to develop and commercialize drug candidates or intellectual property. These arrangements typically involve two (or more) parties who are active participants in the collaboration and are exposed to significant risks and rewards dependent on the commercial success of the activities. These collaborations usually involve various activities by one or more parties, including research and development, marketing and selling and distribution. Often, these collaborations require upfront, milestone and royalty or profit share payments, contingent upon the occurrence of certain future events linked to the success of the asset in development. Amounts due from collaborative partners related to development activities are generally reflected as a reduction of research and development expense because the performance of contract development services is not central to the Company’s operations. In general, the income statement presentation for these collaborations is as follows:
| | | | | | | | |
| Nature/Type of Collaboration | | Statement of Earnings Presentation |
| Third-party sale of product & profit share payments received | | Sales to customers |
| Royalties/milestones paid to collaborative partner (post-regulatory approval)* | | Cost of products sold |
| Royalties received from collaborative partner | | Other income (expense), net |
| Upfront payments & milestones paid to collaborative partner (pre-regulatory approval) | | Research and development expense |
| Research and development payments to collaborative partner | | Research and development expense |
| Research and development payments received from collaborative partner or government entity | | Reduction of Research and development expense |
* Milestones are capitalized as intangible assets and amortized to cost of products sold over the useful life.
For all years presented, there was no individual project that represented greater than 5% of the total annual consolidated research and development expense other than the acquired in-process research & development expense of $1.25 billion to secure the global rights to the NM26 bispecific antibody (Yellow Jersey acquisition) in fiscal year 2024.
The Company has a number of products and compounds developed in collaboration with strategic partners including XARELTO, co-developed with Bayer HealthCare AG, IMBRUVICA, developed in collaboration and co-marketed with Pharmacyclics LLC, an AbbVie company and CARVYKTI, licensed and developed in collaboration with Legend Biotech USA Inc. and Legend Biotech Ireland Limited.
Separately, the Company has a number of licensing arrangements for products and compounds including DARZALEX, licensed from Genmab A/S.
Advertising
Costs associated with advertising are expensed in the year incurred and are included in selling, marketing and administrative expenses. Advertising expenses worldwide, which comprised television, radio, print media and Internet advertising, were $0.6 billion, $0.5 billion and $0.7 billion in fiscal years 2024, 2023 and 2022, respectively.
Income taxes
Income taxes are recorded based on amounts refundable or payable for the current year and include the results of any difference between U.S. GAAP accounting and tax reporting, recorded as deferred tax assets or liabilities. The Company estimates deferred tax assets and liabilities based on enacted tax regulations and rates. Future changes in tax laws and rates may affect recorded deferred tax assets and liabilities in the future.
The Company has unrecognized tax benefits for uncertain tax positions. The Company follows U.S. GAAP which prescribes a recognition threshold and measurement attribute for the financial statement recognition and measurement of a tax position taken or expected to be taken in a tax return. Management believes that changes in these estimates would not have a material effect on the Company's results of operations, cash flows or financial position.
In 2017, the United States enacted into law new U.S. tax legislation, the U.S. Tax Cuts and Jobs Act (TCJA). This law included provisions for a comprehensive overhaul of the corporate income tax code, including a reduction of the statutory corporate tax rate from 35% to 21%, effective on January 1, 2018. The TCJA included a provision for a tax on all previously undistributed earnings of U.S. companies located in foreign jurisdictions. Undistributed earnings in the form of cash and cash equivalents were taxed at a rate of 15.5% and all other earnings were taxed at a rate of 8.0%. This tax is payable over 8 years and will not accrue interest. These payments began in fiscal year 2018 and will continue through 2025. The final payment of $2.5 billion will be made in fiscal year 2025.
The TCJA also includes provisions for a tax on global intangible low-taxed income (GILTI). GILTI is described as the excess of a U.S. shareholder’s total net foreign income over a deemed return on tangible assets, as provided by the TCJA. In January 2018, the FASB issued guidance that allows companies to elect as an accounting policy whether to record the tax effects of GILTI in the period the tax liability is generated (i.e., “period cost”) or provide for deferred tax assets and liabilities related to basis differences that exist and are expected to affect the amount of GILTI inclusion in future years upon reversal (i.e., “deferred method”). The Company has elected to account for GILTI under the deferred method. The deferred tax amounts recorded are based on the evaluation of temporary differences that are expected to reverse as GILTI is incurred in future periods.
The Company has recorded deferred tax liabilities on all undistributed earnings prior to December 31, 2017 from its international subsidiaries. The Company has not provided deferred taxes on the undistributed earnings subsequent to January 1, 2018 from certain international subsidiaries where the earnings are considered to be indefinitely reinvested. The Company intends to continue to reinvest these earnings in those international operations. If the Company decides at a later date to repatriate these earnings to the U.S., the Company would be required to provide for the net tax effects on these amounts. The Company estimates that the tax effect of this repatriation would be approximately $0.5 billion under currently enacted tax laws and regulations and at current currency exchange rates. This amount does not include the possible benefit of U.S. foreign tax credits, which may substantially offset this cost.
See Note 8 to the Consolidated Financial Statements for further information regarding income taxes.
Net earnings per share
Basic earnings per share is computed by dividing net earnings available to common shareholders by the weighted average number of common shares outstanding for the period. Diluted earnings per share reflects the potential dilution that could occur if securities were exercised or converted into common stock using the treasury stock method.
Use of estimates
The preparation of consolidated financial statements in conformity with accounting principles generally accepted in the U.S. requires management to make estimates and assumptions that affect the amounts reported. Estimates are used when accounting for sales discounts, rebates, allowances and incentives, product liabilities, income taxes, withholding taxes, depreciation, amortization, employee benefits, contingencies and intangible asset and liability valuations. Actual results may or may not differ from those estimates.
The Company follows the provisions of U.S. GAAP when recording litigation related contingencies. A liability is recorded when a loss is probable and can be reasonably estimated. The best estimate of a loss within a range is accrued; however, if no estimate in the range is better than any other, the minimum amount is accrued.
Supplier finance program obligations
The Company has agreements for supplier finance programs with third-party financial institutions. These programs provide participating suppliers the ability to finance payment obligations from the Company with the third-party financial institutions. The Company is not a party to the arrangements between the suppliers and the third-party financial institutions. The Company’s obligations to its suppliers, including amounts due, and scheduled payment dates (which have general payment terms of 90 days), are not affected by a participating supplier’s decision to participate in the program.
Confirmed obligations under the program as of December 29, 2024, and December 31, 2023, were $0.8 billion and $0.7 billion, respectively. The obligations are presented as Accounts payable on the Consolidated Balance Sheets.
The rollforward of the Company's valid obligations under the program were as follows:
| | | | | | | | |
| | 2024 |
| (Dollars in Millions) | | |
| Confirmed obligations - beginning of the year | | $704 |
| Invoices confirmed during the year | | 3,048 |
| Confirmed invoices paid during the year | | 2,964 |
| Confirmed obligations - end of the year | | $788 |
Annual closing date
The Company follows the concept of a fiscal year, which ends on the Sunday nearest to the end of the month of December. Normally each fiscal year consists of 52 weeks, but every five or six years the fiscal year consists of 53 weeks, and therefore includes additional shipping days, as was the case in fiscal year 2020, and will be the case again in fiscal year 2026.
2. Cash, cash equivalents and current marketable securities
At the end of the fiscal year 2024 and 2023, cash, cash equivalents and current marketable securities comprised:
| | | | | | | | | | | | | | | | | | | | | | | | | | | | | | | | | | |
| (Dollars in Millions) | | 2024 |
| Carrying
Amount | | Unrecognized
Gain | | | | Estimated
Fair Value | Cash & Cash
Equivalents | | Current
Marketable
Securities |
| Cash | | $2,918 | | — | | | | 2,918 | | 2,918 | | — |
| | | | | | | | | | | | |
Non-U.S. Sovereign Securities(1) | | 120 | | — | | | | 120 | | — | | 120 |
| U.S. Reverse repurchase agreements | | 7,100 | | — | | | | 7,100 | | 7,100 | | — |
| | | | | | | | | | | | |
| | | | | | | | | | | | |
| Money market funds | | 6,123 | | — | | | | 6,123 | | 6,123 | | — |
Time deposits(1) | | 1,045 | | — | | | | 1,045 | | 1,045 | | — |
| Subtotal | | $17,306 | | — | | | | 17,306 | | 17,186 | | 120 |
| | | | | | | | | | | | |
| U.S. Gov't Securities | | $6,815 | | 1 | | | | 6,816 | | 6,796 | | 20 |
| | | | | | | | | | | | |
| Other Sovereign Securities | | 176 | | — | | | | 176 | | 83 | | 93 |
| Corporate and other debt securities | | 224 | | — | | | | 224 | | 40 | | 184 |
| | | | | | | | | | | | |
Subtotal available for sale(2) | | $7,215 | | 1 | | | | 7,216 | | 6,919 | | 297 |
| | | | | | | | | | | | |
| Total cash, cash equivalents and current marketable securities | | | | | | | | | | $24,105 | | 417 |
| | | | | | | | | | | | | | | | | | | | | | | | | | | | | | | | | | |
| (Dollars in Millions) | | 2023 |
| Carrying Amount | | | | Unrecognized
Loss | | Estimated Fair Value | Cash & Cash Equivalents | | Current Marketable Securities |
| Cash | | $3,340 | | | | — | | 3,340 | | 3,340 | | — |
| | | | | | | | | | | | |
Non-U.S. Sovereign Securities(1) | | 522 | | | | — | | 522 | | 174 | | 348 |
| U.S. Reverse repurchase agreements | | 4,377 | | | | — | | 4,377 | | 4,377 | | — |
| | | | | | | | | | | | |
Corporate debt securities(1) | | 338 | | | | — | | 338 | | 189 | | 149 |
| Money market funds | | 4,814 | | | | — | | 4,814 | | 4,814 | | — |
Time deposits(1) | | 662 | | | | — | | 662 | | 662 | | — |
| Subtotal | | 14,053 | | | | — | | 14,053 | | 13,556 | | 497 |
| | | | | | | | | | | | |
| U.S. Gov't Securities | | $8,562 | | | | — | | 8,562 | | 8,259 | | 303 |
| U.S. Gov't Agencies | | 71 | | | | (1) | | 70 | | — | | 70 |
| Other Sovereign Securities | | 5 | | | | — | | 5 | | 1 | | 4 |
| Corporate and other debt securities | | 237 | | | | | | 237 | | 43 | | 194 |
| | | | | | | | | | | | |
Subtotal available for sale(2) | | $8,875 | | | | (1) | | 8,874 | | 8,303 | | 571 |
| | | | | | | | | | | | |
| Total cash, cash equivalents and current marketable securities | | | | | | | | | | $21,859 | | 1,068 |
(1)Held to maturity investments are reported at amortized cost and realized gains or losses are reported in earnings.
(2)Available for sale debt securities are reported at fair value with unrealized gains and losses reported net of taxes in other comprehensive income.
Fair value of government securities and obligations and corporate debt securities were estimated using quoted broker prices and significant other observable inputs.
The contractual maturities of the available for sale debt securities at December 29, 2024 are as follows:
| | | | | | | | | | | | | | |
| (Dollars in Millions) | | Cost Basis | | Fair Value |
| Due within one year | | $7,204 | | 7,205 |
| Due after one year through five years | | 11 | | 11 |
| Due after five years through ten years | | — | | — |
| Total debt securities | | $7,215 | | 7,216 |
The Company invests its excess cash in both deposits with major banks throughout the world and other high-quality money market instruments. The Company has a policy of making investments only with commercial institutions that have at least an investment grade credit rating.
3. Inventories
At the end of fiscal years 2024 and 2023, inventories comprised:
| | | | | | | | | | | | | | |
| (Dollars in Millions) | | 2024 | | 2023 |
| Raw materials and supplies | | $2,337 | | 2,355 |
| Goods in process | | 2,815 | | 1,952 |
| Finished goods | | 7,292 | | 6,874 |
| Total inventories | | $12,444 | | 11,181 |
4. Property, plant and equipment
At the end of fiscal years 2024 and 2023, property, plant and equipment at cost and accumulated depreciation were:
| | | | | | | | | | | | | | |
| (Dollars in Millions) | | 2024 | | 2023 |
| Land and land improvements | | $718 | | 795 |
| Buildings and building equipment | | 12,317 | | 12,375 |
| Machinery and equipment | | 29,444 | | 28,979 |
| Construction in progress | | 6,289 | | 5,627 |
| Total property, plant and equipment, gross | | $48,768 | | 47,776 |
| Less accumulated depreciation | | 28,250 | | 27,878 |
| Total property, plant and equipment, net | | $20,518 | | 19,898 |
The Company capitalizes interest expense as part of the cost of construction of facilities and equipment. Interest expense capitalized in fiscal years 2024, 2023 and 2022 was $79 million, $70 million and $49 million, respectively.
Depreciation expense, including the amortization of capitalized interest in fiscal years 2024, 2023 and 2022 was $2.8 billion, $2.6 billion and $2.4 billion, respectively.
Upon retirement or other disposal of property, plant and equipment, the costs and related amounts of accumulated depreciation or amortization are eliminated from the asset and accumulated depreciation accounts, respectively. The difference, if any, between the net asset value and the proceeds are recorded in earnings.
5. Intangible assets and goodwill
At the end of fiscal years 2024 and 2023, the gross and net amounts of intangible assets were:
| | | | | | | | | | | | | | |
| (Dollars in Millions) | | 2024 | | 2023 |
| Intangible assets with definite lives: | | | | |
Patents and trademarks — gross(1) | | $44,695 | | 40,417 |
| Less accumulated amortization | | (26,124) | | (24,808) |
| Patents and trademarks — net | | $18,571 | | 15,609 |
| Customer relationships and other intangibles — gross | | $20,310 | | 20,322 |
| Less accumulated amortization | | (13,544) | | (12,685) |
Customer relationships and other intangibles — net(2) | | $6,766 | | 7,637 |
| Intangible assets with indefinite lives: | | | | |
Trademarks(1) | | — | | | 1,714 |
| Purchased in-process research and development | | 12,281 | | 9,215 |
| Total intangible assets with indefinite lives | | $12,281 | | 10,929 |
| Total intangible assets — net | | $37,618 | | 34,175 |
(1)In September 2024, the Company announced changes to its MedTech brand identity and the $1.7 billion of trademarks associated with the DePuy Synthes business were reclassified from indefinite lived to definite lived and will be amortized over a 25 year period.
(2)The majority is comprised of customer relationships
Goodwill as of December 29, 2024 and December 31, 2023, as allocated by segment of business, was as follows:
| | | | | | | | | | | | | | | | | | | | | | | |
| (Dollars in Millions) | | | Innovative
Medicine | | MedTech | | Total |
| Goodwill at January 1, 2023 | | | $10,184 | | 25,863 | | 36,047 |
| Goodwill, related to acquisitions | | | — | | — | | — |
| Goodwill, related to divestitures | | | — | | — | | — |
| Currency translation/other | | | 223 | | 288 | * | 511 |
| Goodwill at December 31, 2023 | | | 10,407 | | 26,151 | | 36,558 |
| Goodwill, related to acquisitions | | | 640 | | 7,569 | | 8,209 |
| Goodwill, related to divestitures | | | — | | (56) | | (56) |
| Currency translation/other | | | (355) | | (156) | | (511) |
| Goodwill at December 29, 2024 | | | $10,692 | | 33,508 | | 44,200 |
* Includes purchase price allocation adjustments for Abiomed
The weighted average amortization period for patents and trademarks is approximately 12 years. The weighted average amortization period for customer relationships and other intangible assets is approximately 18 years. The amortization expense of amortizable assets included in Cost of products sold was $4.5 billion, $4.5 billion and $3.9 billion before tax, for the fiscal years ended December 29, 2024, December 31, 2023 and January 1, 2023, respectively. Intangible asset write-downs are included in Other (income) expense, net.
The estimated amortization expense related to intangible assets for approved products, before tax, for the five succeeding years is approximately:
| | | | | | | | | | | | | | | | | | | | | | | | | | |
| (Dollars in Millions) | | | | | | |
| 2025 | | 2026 | | 2027 | | 2028 | | 2029 |
| $4,000 | | 3,400 | | 2,800 | | 2,200 | | 2,200 |
See Note 18 to the Consolidated Financial Statements for additional details related to acquisitions and divestitures.
6. Fair value measurements
The Company uses forward foreign exchange contracts to manage its exposure to the variability of cash flows, primarily related to the foreign exchange rate changes of future intercompany products and third-party purchases of materials denominated in a foreign currency. The Company uses cross currency interest rate swaps to manage currency risk primarily related to borrowings. Both types of derivatives are designated as cash flow hedges.
Additionally, the Company uses interest rate swaps as an instrument to manage interest rate risk related to fixed rate borrowings. These derivatives are designated as fair value hedges. The Company uses cross currency interest rate swaps and forward foreign exchange contracts designated as net investment hedges. Additionally, the Company uses forward foreign exchange contracts to offset its exposure to certain foreign currency assets and liabilities. These forward foreign exchange contracts are not designated as hedges and therefore, changes in the fair values of these derivatives are recognized in earnings, thereby offsetting the current earnings effect of the related foreign currency assets and liabilities.
The Company does not enter into derivative financial instruments for trading or speculative purposes, or that contain credit risk related contingent features. The Company maintains credit support agreements (CSA) with certain derivative counterparties establishing collateral thresholds based on respective credit ratings and netting agreements. As of December 29, 2024 and December 31, 2023, the total amount of cash collateral paid by the Company under the CSA amounted to $2.2 billion and $4.0 billion net respectively, related to net investment and cash flow hedges. On an ongoing basis, the Company monitors counter-party credit ratings. The Company considers credit non-performance risk to be low, because the Company primarily enters into agreements with commercial institutions that have at least an investment grade credit rating. Refer to the table on significant financial assets and liabilities measured at fair value contained in this footnote for receivables and payables with these commercial institutions. As of December 29, 2024, the Company had notional amounts outstanding for forward foreign exchange contracts, cross currency interest rate swaps and interest rate swaps of $45.1 billion, $40.5 billion and $9.0 billion, respectively. As of December 31, 2023, the Company had notional amounts outstanding for forward foreign exchange contracts, cross currency interest rate swaps and interest rate swaps of $42.9 billion, $39.7 billion and $10.0 billion, respectively.
All derivative instruments are recorded on the balance sheet at fair value. Changes in the fair value of derivatives are recorded each period in current earnings or other comprehensive income, depending on whether the derivative is designated as part of a hedge transaction, and if so, the type of hedge transaction. Cash exchanged for derivatives is primarily in cash flows from operating activities.
The designation as a cash flow hedge is made at the entrance date of the derivative contract. At inception, all derivatives are expected to be highly effective. Foreign exchange contracts designated as cash flow hedges are accounted for under the forward method and all gains/losses associated with these contracts will be recognized in the income statement when the hedged item impacts earnings. Changes in the fair value of these derivatives are recorded in accumulated other comprehensive income until the underlying transaction affects earnings, and are then reclassified to earnings in the same account as the hedged transaction.
Gains and losses associated with interest rate swaps and changes in fair value of hedged debt attributable to changes in interest rates are recorded to interest expense in the period in which they occur. Gains and losses on net investment hedges are accounted through the currency translation account within accumulated other comprehensive income. The portion excluded from effectiveness testing is recorded through interest (income) expense using the spot method. On an ongoing basis, the Company assesses whether each derivative continues to be highly effective in offsetting changes of hedged items. If and when a derivative is no longer expected to be highly effective, hedge accounting is discontinued.
The Company designated its Euro denominated notes with due dates ranging from 2024 to 2044 as a net investment hedge of the Company's investments in certain of its international subsidiaries that use the Euro as their functional currency in order to reduce the volatility caused by changes in exchange rates.
As of December 29, 2024, the balance of deferred net loss on derivatives included in accumulated other comprehensive income was $1.7 billion after-tax. For additional information, see the Consolidated Statements of Comprehensive Income and Note 13. The Company expects that substantially all of the amounts related to forward foreign exchange contracts will be reclassified into earnings over the next 12 months as a result of transactions that are expected to occur over that period. The maximum length of time over which the Company is hedging transaction exposure is 18 months, excluding interest rate contracts and net investment hedges. The amount ultimately realized in earnings may differ as foreign exchange rates change. Realized gains and losses are ultimately determined by actual exchange rates at maturity of the derivative.
The following table is a summary of the activity related to derivatives and hedges for the fiscal years ended December 29, 2024 and December 31, 2023, net of tax:
| | | | | | | | | | | | | | | | | | | | | | | | | | | | | | | | | | | |
| |
| December 29, 2024 | | December 31, 2023 |
| (Dollars in Millions) | Sales | Cost of
Products
Sold | R&D
Expense | Interest
(Income)
Expense | Other
(Income)
Expense | | Sales | Cost of
Products
Sold | R&D
Expense | Interest
(Income)
Expense | Other
(Income)
Expense |
| | | | | | | | | | | |
| | | | | | | | | | | |
| The effects of fair value, net investment and cash flow hedging: | | | | | | | | | | | |
| Gain (Loss) on fair value hedging relationship: | | | | | | | | | | | |
| Interest rate swaps contracts: | | | | | | | | | | | |
| Hedged items | $— | — | — | 64 | — | | — | — | — | 168 | — |
| Derivatives designated as hedging instruments | — | — | — | (64) | — | | — | — | — | (168) | — |
| | | | | | | | | | | |
| Gain (Loss) on net investment hedging relationship: | | | | | | | | | | | |
| Cross currency interest rate swaps contracts: | | | | | | | | | | | |
| Amount of gain or (loss) recognized in income on derivative amount excluded from effectiveness testing | $— | — | — | 148 | — | | — | — | — | 130 | — |
| Amount of gain or (loss) recognized in AOCI | — | — | — | 148 | — | | — | — | — | 130 | — |
| | | | | | | | | | | |
| Gain (Loss) on cash flow hedging relationship: | | | | | | | | | | | |
| Forward foreign exchange contracts: | | | | | | | | | | | |
| Amount of gain or (loss) reclassified from AOCI into income | 2 | 426 | 33 | — | 6 | | 7 | 186 | (37) | — | 8 |
| | | | | | | | | | | |
| | | | | | | | | | | |
| | | | | | | | | | | |
| Amount of gain or (loss) recognized in AOCI | (7) | (156) | 80 | — | 21 | | 10 | 447 | (18) | — | 9 |
| | | | | | | | | | | |
| Cross currency interest rate swaps contracts: | | | | | | | | | | | |
| Amount of gain or (loss) reclassified from AOCI into income | — | — | — | 247 | — | | — | — | — | 275 | — |
| | | | | | | | | | | |
| Amount of gain or (loss) recognized in AOCI | $— | — | — | (597) | — | | — | — | — | (156) | — |
| | | | | | | | | | | |
As of December 29, 2024 and December 31, 2023, the following amounts were recorded on the consolidated balance sheet related to cumulative basis adjustment for fair value hedges:
| | | | | | | | | | | | | | | | | | | | | | | | | | |
Line item in the Consolidated Balance Sheet
in which the hedged item is included | | Carrying Amount of the Hedged Liability | | Cumulative Amount of Fair Value Hedging
Adjustment Included in the Carrying
Amount of the Hedged Liability |
| | | | | | | | |
| (Dollars in Millions) | | December 29, 2024 | | December 31, 2023 | | December 29, 2024 | | December 31, 2023 |
| | | | | | | | |
| Long-term Debt | | $7,935 | | $8,862 | | $(1,132) | | $(1,216) |
| | | | | | | | |
The following table is the effect of derivatives not designated as hedging instrument for the fiscal years ended
December 29, 2024 and December 31, 2023:
| | | | | | | | | | | | | | | | | | | | |
| (Dollars in Millions) | | Location of Gain /(Loss)
Recognized in Income on
Derivative | | Gain/(Loss)
Recognized In
Income on Derivative |
| Derivatives Not Designated as Hedging Instruments | | | | December 29, 2024 | | December 31, 2023 |
| Foreign Exchange Contracts | | Other (income) expense | | $8 | | (60) |
The following table is the effect of net investment hedges for the fiscal years ended December 29, 2024 and
December 31, 2023:
| | | | | | | | | | | | | | | | | | | | | | | | | | | | | | | | |
| | Gain/(Loss)
Recognized In
Accumulated OCI | | Location of Gain or
(Loss) Reclassified
from Accumulated Other Comprehensive Income Into Income | | Gain/(Loss)
Reclassified from
Accumulated OCI
Into Income |
| (Dollars in Millions) | | December 29, 2024 | | December 31, 2023 | | | | December 29, 2024 | | December 31, 2023 |
| Debt | | $282 | | (131) | | Interest (income) expense | | — | | — |
| Cross Currency interest rate swaps | | $955 | | 642 | | Interest (income) expense | | — | | — |
The Company holds equity investments with readily determinable fair values and equity investments without readily determinable fair values. The Company measures equity investments that do not have readily determinable fair values at cost minus impairment, if any, plus or minus changes resulting from observable price changes in orderly transactions for the identical or a similar investment of the same issuer.
The following table is a summary of the activity related to equity investments for the fiscal years ended December 29, 2024 and December 31, 2023:
| | | | | | | | | | | | | | | | | | | | | | | | | | | | | | | | |
| | December 31, 2023 | | | | | | December 29, 2024 |
| (Dollars in Millions) | | Carrying Value | | Changes in Fair Value Reflected in Net Income(1) | | Sales/ Purchases/ Other(2) | | Carrying Value | | Non-Current
Other Assets |
| Equity Investments with readily determinable value * | | $4,473 | | (17) | | (4,005) | | 451 | | 451 |
| | | | | | | | | | |
| Equity Investments without readily determinable value | | $696 | | (197) | | 274 | | 773 | | 773 |
| | | | | | | | | | | | | | | | | | | | | | | | | | | | | | | | |
| | January 1, 2023 | | | | | | December 31, 2023 |
| (Dollars in Millions) | | Carrying Value | | Changes in Fair Value Reflected in Net Income(1) | | Sales/ Purchases/ Other(2) | | Carrying Value | | Non-Current
Other Assets |
| Equity Investments with readily determinable value * | | $576 | | (368) | | 4,265 | | 4,473 | | 4,473 |
| | | | | | | | | | |
| Equity Investments without readily determinable value | | $613 | | 1 | | 82 | | 696 | | 696 |
(1)Recorded in Other Income/Expense
(2)Other includes impact of currency
* The December 31, 2023 balance includes the 9.5% remaining stake in Kenvue. A debt-for-equity exchange was completed in the fiscal second quarter of 2024.
On May 15, 2024, the Company issued $3.6 billion aggregate principal amount of commercial paper and received $3.6 billion of net cash proceeds to be used for general corporate purposes. On May 17, 2024, the Company completed a Debt-for-Equity Exchange of its remaining 182,329,550 shares of Kenvue Common Stock for the outstanding Commercial Paper. Upon completion of the Debt-for-Equity Exchange, the Commercial Paper was satisfied and discharged, and the Company no longer owns any shares of Kenvue Common Stock. This exchange resulted in a loss of approximately $0.4 billion recorded in Other (income) expense.
For the fiscal years ended December 29, 2024 and December 31, 2023 for equity investments without readily determinable market values, $171 million and $1 million, respectively, of the changes in fair value reflected in net income were the result of impairments. There were impacts of $26 million and $27 million, respectively, of changes in the fair value reflected in net income due to changes in observable prices and gains on the disposal of investments.
Fair value is the exit price that would be received to sell an asset or paid to transfer a liability. Fair value is a market-based measurement determined using assumptions that market participants would use in pricing an asset or liability. In accordance with ASC 820, a three-level hierarchy to prioritize the inputs used in measuring fair value. The levels within the hierarchy are described below with Level 1 having the highest priority and Level 3 having the lowest.
The fair value of a derivative financial instrument (i.e., forward foreign exchange contracts, interest rate contracts) is the aggregation by currency of all future cash flows discounted to its present value at the prevailing market interest rates and subsequently converted to the U.S. Dollar at the current spot foreign exchange rate. The Company does not believe that fair values of these derivative instruments materially differ from the amounts that could be realized upon settlement or maturity, or that the changes in fair value will have a material effect on the Company’s results of operations, cash flows or financial position. The Company also holds equity investments which are classified as Level 1 and debt securities which are classified as Level 2. The Company holds acquisition related contingent liabilities based upon certain regulatory and commercial events, which are classified as Level 3, whose values are determined using discounted cash flow methodologies or similar techniques for which the determination of fair value requires significant judgment or estimations.
The following three levels of inputs are used to measure fair value:
Level 1 — Quoted prices in active markets for identical assets and liabilities.
Level 2 — Significant other observable inputs.
Level 3 — Significant unobservable inputs.
The Company’s significant financial assets and liabilities measured at fair value as of the fiscal year ended December 29, 2024 and December 31, 2023 were as follows:
| | | | | | | | | | | | | | | | | | | | | | | | | | | | | | | | |
| | 2024 | | 2023 |
| (Dollars in Millions) | | Level 1 | | Level 2 | | Level 3 | | Total | | Total(1) |
| Derivatives designated as hedging instruments: | | | | | | | | | | |
| Assets: | | | | | | | | | | |
| Forward foreign exchange contracts | | $— | | 660 | | — | | 660 | | 539 |
Interest rate contracts(2) | | — | | 1,484 | | — | | 1,484 | | 988 |
| | | | | | | | | | |
| Total | | $— | | 2,144 | | — | | 2,144 | | 1,527 |
| Liabilities: | | | | | | | | | | |
| Forward foreign exchange contracts | | — | | 794 | | — | | 794 | | 624 |
Interest rate contracts(2) | | — | | 3,753 | | — | | 3,753 | | 5,338 |
| | | | | | | | | | |
| | | | | | | | | | |
| Total | | $— | | 4,547 | | — | | 4,547 | | 5,962 |
| Derivatives not designated as hedging instruments: | | | | | | | | | | |
| Assets: | | | | | | | | | | |
| Forward foreign exchange contracts | | $— | | 50 | | — | | 50 | | 64 |
| Liabilities: | | | | | | | | | | |
| Forward foreign exchange contracts | | — | | 17 | | — | | 17 | | 75 |
| Available For Sale Other Investments: | | | | | | | | | | |
Equity investments(3) | | 451 | | — | | — | | 451 | | 4,473 |
Debt securities(4) | | — | | 7,216 | | — | | 7,216 | | 8,874 |
| Other Liabilities | | | | | | | | | | |
Contingent Consideration(5) | | $ | | | | 1,217 | | 1,217 | | 1,092 |
| | | | | | | | | | | | | | |
| Gross to Net Derivative Reconciliation | | 2024 | | 2023 |
| (Dollars in Millions) | | | | |
| Total Gross Assets | | $2,194 | | 1,591 |
| Credit Support Agreements (CSA) | | (2,172) | | (1,575) |
| Total Net Asset | | 22 | | 16 |
| | | | |
| Total Gross Liabilities | | 4,564 | | 6,037 |
| Credit Support Agreements (CSA) | | (4,412) | | (5,604) |
| Total Net Liabilities | | $152 | | 433 |
| | | | |
Summarized information about changes in liabilities for contingent consideration is as follows:
| | | | | | | | | | | | | | | | | |
| 2024 | | 2023 | | 2022 |
| (Dollars in Millions) | | | | | |
| Beginning Balance | $1,092 | | 1,120 | | 533 |
| Changes in estimated fair value | 88 | | 29 | | (194) |
Additions(6) | 112 | | — | | 792 |
| Payments/Other | (75) | | (57) | | (11) |
Ending Balance(5) | $1,217 | | 1,092 | | 1,120 |
(1)2023 assets and liabilities are all classified as Level 2 with the exception of equity investments of $4,473 million, which are classified as Level 1 and contingent consideration of $1,092 million, classified as Level 3.
(2)Includes cross currency interest rate swaps and interest rate swaps.
(3)Classified as non-current other assets.
(4)Classified as cash equivalents and current marketable securities.
(5)Includes $1,217 million, $1,092 million and $1,116 million, classified as non-current other liabilities as of December 29, 2024,
December 31, 2023 and January 1, 2023, respectively. Includes $4 million classified as current liabilities as of January 1, 2023.
(6)In fiscal year 2024, the Company recorded $105 million of contingent consideration related to Proteologix. In fiscal year 2022, the Company recorded $704 million of contingent consideration related to Abiomed.
See Notes 2 and 7 for financial assets and liabilities held at carrying amount on the Consolidated Balance Sheet.
7. Borrowings
The components of long-term debt are as follows:
| | | | | | | | | | | | | | | | | | | | | | | | | | | | | |
| (Dollars in Millions) | | 2024 | | Effective
Rate
% | | 2023 | | Effective
Rate
% | |
0.650% Notes due 2024 (750MM Euro 1.1090)(3) | | $— | | — | % | | $831 | (3) | 0.68 | % | |
5.50% Notes due 2024 (500MM GBP 1.2756)(3) | | — | | — | | | 637 | (3) | 6.75 | | |
| 2.625% Notes due 2025 | | 750 | | 2.63 | | | 750 | | 2.63 | | |
| 0.55% Notes due 2025 | | 999 | | 0.57 | | | 950 | | 0.57 | | |
| 2.46% Notes due 2026 | | 1,999 | | 2.47 | | | 1,997 | | 2.47 | | |
| 2.95% Notes due 2027 | | 927 | | 2.96 | | | 900 | | 2.96 | | |
| 0.95% Notes due 2027 | | 1,458 | | 0.96 | | | 1,419 | | 0.96 | | |
1.150% Notes due 2028
(750MM Euro 1.0401)(2)/(750MM Euro 1.1090)(3) | | 777 | (2) | 1.21 | | | 828 | (3) | 1.21 | | |
| 2.90% Notes due 2028 | | 1,498 | | 2.91 | | | 1,497 | | 2.91 | | |
| 6.95% Notes due 2029 | | 298 | | 7.14 | | | 298 | | 7.14 | | |
| 4.80% Debentures due 2029 | | 1,146 | | 4.83 | | | — | | — | | |
| 1.30% Notes due 2030 | | 1,646 | | 1.30 | | | 1,630 | | 1.30 | | |
| 4.90% Debentures due 2031 | | 1,145 | | 4.92 | | | — | | — | | |
3.20% Debenture due 2032 (700M EUR 1.0401)(2) | | 725 | (2) | 3.21 | | | — | | — | | |
| 4.95% Debentures due 2033 | | 499 | | 4.95 | | | 499 | | 4.95 | | |
| 4.375% Notes due 2033 | | 854 | | 4.24 | | | 854 | | 4.24 | | |
| 4.95% Debentures due 2034 | | 846 | | 4.96 | | | — | | — | | |
1.650% Notes due 2035
(1.5B Euro 1.0401)(2)/(1.5B Euro 1.1090)(3) | | 1,550 | (2) | 1.68 | | | 1,652 | (3) | 1.68 | | |
3.35% Debentures due 2036 (800MM EUR 1.0401)(2) | | 827 | (2) | 3.37 | | | — | | — | | |
| 3.587% Notes due 2036 | | 869 | | 3.59 | | | 864 | | 3.59 | | |
| 5.95% Notes due 2037 | | 994 | | 5.99 | | | 994 | | 5.99 | | |
| 3.625% Notes due 2037 | | 1,358 | | 3.64 | | | 1,357 | | 3.64 | | |
| 5.85% Debentures due 2038 | | 697 | | 5.85 | | | 697 | | 5.85 | | |
| 3.40% Notes due 2038 | | 993 | | 3.42 | | | 993 | | 3.42 | | |
| 4.50% Debentures due 2040 | | 541 | | 4.63 | | | 541 | | 4.63 | | |
| 2.10% Notes due 2040 | | 845 | | 2.14 | | | 849 | | 2.14 | | |
| 4.85% Notes due 2041 | | 297 | | 4.89 | | | 297 | | 4.89 | | |
| 4.50% Notes due 2043 | | 496 | | 4.52 | | | 496 | | 4.52 | | |
3.55% Debentures due 2044 (1B EUR 1.0401)(2) | | 1,030 | (2) | 3.58 | | | — | | — | | |
| 3.73% Notes due 2046 | | 1,978 | | 3.74 | | | 1,977 | | 3.74 | | |
| 3.75% Notes due 2047 | | 822 | | 3.76 | | | 832 | | 3.76 | | |
| 3.500% Notes due 2048 | | 744 | | 3.52 | | | 743 | | 3.52 | | |
| 2.250% Notes due 2050 | | 808 | | 2.29 | | | 826 | | 2.29 | | |
| | | | | | | | | | | | | | | | | | | | | | | | | | | | | |
| 5.25% Debentures due 2054 | | 843 | | 5.26 | | | — | | — | | |
| 2.450% Notes due 2060 | | 1,058 | | 2.49 | | | 1,073 | | 2.49 | | |
| Other | | 83 | | — | | | 69 | | — | | |
| Subtotal | | 32,400 | (4) | 3.36 | % | (1) | 27,350 | (4) | 2.98 | % | (1) |
| Less current portion | | 1,749 | | | | 1,469 | | | |
| Total long-term debt | | $30,651 | | | | $25,881 | | | |
(1)Weighted average effective rate.
(2)Translation rate at December 29, 2024.
(3)Translation rate at December 31, 2023.
(4)The excess of the carrying value over the fair value of debt was $2.0 billion and $1.0 billion at the end of fiscal year 2024 and fiscal year 2023, respectively.
Fair value of the long-term debt was estimated using market prices, which were corroborated by quoted broker prices and significant other observable inputs.
The Company has access to substantial sources of funds at numerous banks worldwide. In June 2024, the Company secured a new 364-day Credit Facility of $10 billion, which expires on June 25, 2025. Interest charged on borrowings under the credit line agreement is based on either the Term SOFR Reference Rate or other applicable market rates as allowed under the terms of the agreement, plus applicable margins. Commitment fees under the agreements are not material.
Throughout fiscal years 2024 and 2023, the Company continued to have access to liquidity through the commercial paper market. Short-term borrowings and the current portion of long-term debt amounted to approximately $6.0 billion and $3.5 billion at the end of fiscal years 2024 and 2023, respectively. The current portion of the long-term debt was $1.7 billion and $1.5 billion in 2024 and 2023, respectively, and the remainder is commercial paper and local borrowing by international subsidiaries.
The current debt balance as of December 29, 2024 includes $4.1 billion of commercial paper which has a weighted average interest rate of 4.46% and a weighted average maturity of approximately two months. The current debt balance as of December 31, 2023 includes $2.0 billion of commercial paper which has a weighted average interest rate of 5.37% and a weighted average maturity of approximately two months.
Aggregate maturities of long-term debt obligations commencing in 2025 are:
| | | | | | | | | | | | | | | | | | | | | | | | | | | | | | | | |
| (Dollars in Millions) | | | | | | | | |
| 2025 | | 2026 | | 2027 | | 2028 | | 2029 | | After 2029 |
| $1,749 | | 1,999 | | 2,385 | | 2,275 | | 1,444 | | 22,548 |
8. Income taxes
The provision for taxes on income on continuing operations consists of:
| | | | | | | | | | | | | | | | | | |
| (Dollars in Millions) | 2024 | | 2023 | | 2022 | |
| Currently payable: | | | | | | |
| U.S. taxes | $2,200 | | 2,705 | | 2,274 | |
| | | | | | |
| International taxes | 2,604 | | 3,090 | | 2,295 | |
| Total currently payable | 4,804 | | 5,795 | | 4,569 | |
| Deferred: | | | | | | |
| U.S. taxes | (2,539) | | (3,440) | | (1,990) | |
| | | | | | |
| International taxes | 356 | | (619) | | 410 | |
| Total deferred | (2,183) | | (4,059) | | (1,580) | |
| Provision for taxes on income | $2,621 | | 1,736 | | 2,989 | |
A comparison of income tax expense at the U.S. statutory rate of 21% in fiscal years 2024, 2023 and 2022, to the Company’s effective tax rate is as follows:
| | | | | | | | | | | | | | | | | |
| (Dollars in Millions) | 2024 | | 2023 | | 2022 |
| U.S. | $(458) | | (2,033) | | 4,606 |
| International | 17,145 | | 17,095 | | 14,753 |
| Earnings before taxes on income: | $16,687 | | 15,062 | | 19,359 |
| Tax rates: | | | | | |
| U.S. statutory rate | 21.0 | % | | 21.0 | | | 21.0 | |
International operations(1) | (5.2) | | | (8.1) | | | (5.0) | |
| | | | | |
| | | | | |
| U.S. tax settlements | 1.0 | | | (3.0) | | | — | |
U.S. taxes on international income(2) | (2.6) | | | (0.3) | | | (1.1) | |
| U.S. state taxes | 1.5 | | | 1.0 | | | 0.3 | |
| Tax benefits on share-based compensation | (0.6) | | | (0.8) | | | (1.4) | |
| | | | | |
| | | | | |
| All other | 0.6 | | | 1.7 | | | 1.6 | |
| Effective Rate | 15.7 | % | | 11.5 | | | 15.4 | |
(1)International operations reflect the impacts of operations in jurisdictions with statutory tax rates different than the U.S., particularly Ireland, Switzerland, and Belgium, which is a favorable impact on the effective tax rate as compared with the U.S. statutory rate.
(2)Includes the net impact of the GILTI tax, the Foreign-Derived Intangible Income deduction and other foreign income that is taxable under the U.S. tax code as well as related foreign tax credits.
The fiscal year 2024 effective tax rate increased 4.2% as compared to the fiscal year 2023 effective tax rate. The primary drivers of this change are discussed below.
In fiscal year 2024, The Company had more income in higher tax jurisdictions compared to fiscal year 2023, primarily in the U.S. where the Company recorded a charge of approximately $5.1 billion in the fiscal year of 2024 versus approximately $7.0 billion in the fiscal year of 2023, both for the talc matters in the United States. Both charges were recorded at an effective U.S. tax rate of approximately 21% (for further information see Note 19 to the Consolidated Financial Statements).
Additionally in the fiscal year 2024, the effective tax rate was unfavorably impacted by legislative changes that went into effect for Pillar Two in some of the Company's foreign jurisdictions which are reflected in International operations on the Company’s effective tax rate reconciliation. Also in fiscal year 2024, the Company generated incremental U.S. foreign tax credits related to income sourced and taxed outside the United States and is reflected in U.S. taxes on international income on the Company’s effective tax rate reconciliation. In 2024, the Company finalized multi-year transfer pricing agreements with the U.S. Internal Revenue Service (IRS) and certain other foreign jurisdictions. The U.S portion of the agreements were partially offset by the related tax adjustments in the foreign jurisdictions which are reflected in U.S tax settlements and International operations, respectively, on the Company’s effective rate reconciliation.
The fiscal year 2023 effective tax rate decreased 3.9% as compared to the fiscal year 2022 effective tax rate as the Company recorded certain non-recurring favorable tax items in fiscal year 2023 when compared to the prior fiscal year.
In the fiscal fourth quarter of 2023, the Company settled the U.S. Internal Revenue Service audit for tax years 2013 through 2016 which resulted in a favorable impact to the rate of 3.0%. This settlement was partially offset by the Company recording a $0.4 billion decrease in expected U.S. foreign tax credits, an unfavorable effective rate impact of 2.6%, which has been reflected as a current tax expense in U.S. taxes on international income on the Company’s effective tax rate reconciliation.
In the fiscal year 2023, the Company had certain non-recurring impacts as a result of legislative tax elections made in certain international subsidiaries which resulted in a change in the Company’s tax basis in certain assets resulting in deferred tax re-measurements. The net impact of these non-recurring items is a net benefit of 3.4% to the Company’s annual effective tax rate, comprised of the following items:
•approximately $0.3 billion of tax benefit on local deferred tax assets to record the remeasurement of the increased tax basis, this benefit has been reflected as International operations on the Company’s effective tax rate reconciliation. This benefit was offset by approximately $0.1 billion of U.S. deferred tax expense on the GILTI deferred tax liability resulting from the remeasurement of these deferred tax assets. This has been reflected in the “U.S. tax on international income” on the Company’s effective tax rate reconciliation.
•approximately $0.3 billion of U.S. deferred tax benefit on the GILTI deferred tax related to an election made by an international subsidiary resulting in a decrease in local deferred tax assets. This has been reflected in the U.S. taxes on international income on the Company’s effective tax rate reconciliation.
The Company also had lower income in higher tax jurisdictions vs. fiscal year 2022, primarily in the U.S. where the Company recorded an approximately $7.0 billion charge related to talc matters in the United States at an effective tax rate of 21.1% (for further information see Note 19 to the Consolidated Financial Statements).
Temporary differences and carryforwards at the end of fiscal years 2024 and 2023 were as follows:
| | | | | | | | | | | | | | | | | | | | | | | | | | |
| | 2024 Deferred Tax | | 2023 Deferred Tax |
| (Dollars in Millions) | | Asset | | Liability | | Asset | | Liability |
| Employee related obligations | | $372 | | | | 586 | | |
| Stock based compensation | | 717 | | | | 686 | | |
| Depreciation of property, plant and equipment | | | | (833) | | | | (902) |
| Goodwill and intangibles | | | | (3,261) | | | | (1,252) |
| R&D capitalized for tax | | 4,398 | | | | 3,595 | | |
| Reserves & liabilities | | 4,444 | | | | 3,816 | | |
| Inventory related | | 371 | | | | 359 | | |
| Operating loss carryforwards | | 2,298 | | | | 2,145 | | |
| Undistributed foreign earnings | | 1,931 | | (1,492) | | 1,801 | | (1,695) |
| Global intangible low-taxed income | | | | (1,589) | | | | (2,731) |
| Miscellaneous international | | 1,212 | | | | 831 | | |
| Miscellaneous U.S. | | 1,083 | | | | | | (4) |
| Total deferred income taxes | | 16,826 | | (7,175) | | 13,819 | | (6,584) |
| Valuation allowances | | (1,638) | | | | (1,149) | | |
| Total deferred income taxes net of valuation allowances | | 15,188 | | (7,175) | | 12,670 | | (6,584) |
The Company has wholly-owned international subsidiaries that have cumulative net losses. The Company believes that it is more likely than not that these subsidiaries will generate future taxable income sufficient to partially utilize these deferred tax assets. In certain jurisdictions, valuation allowances have been recorded against deferred tax assets for loss carryforwards that are not more likely than not to be realized. The net operating loss carryforwards for these international subsidiaries that do not have an indefinite carryforward period will begin to expire in 2025 for various amounts.
The following table summarizes the activity related to valuation allowances for continuing operations:
| | | | | | | | | | | |
| (Dollars in Millions) | 2024 | | 2023 |
| Beginning of year | $1,149 | | 775 |
| Provision | 451 | | 355 |
| Utilization | — | | (116) |
| Foreign currency translation | (46) | | 25 |
| Net acquisitions / (dispositions/liquidations) | 84 | | 110 |
| End of year | $1,638 | | $1,149 |
The following table summarizes the activity related to unrecognized tax benefits for continuing operations:
| | | | | | | | | | | | | | | | | |
| (Dollars in Millions) | 2024 | | 2023 | | 2022 |
| Beginning of year | $2,485 | | 3,716 | | 3,210 |
| Increases related to current year tax positions | 176 | | 239 | | 523 |
| Increases related to prior period tax positions | 129 | | 244 | | 143 |
| Decreases related to prior period tax positions | (147) | | (781) | | (148) |
| Settlements | (583) | | (880) | | (1) |
| Lapse of statute of limitations | (40) | | (53) | | (11) |
| End of year | $2,020 | | 2,485 | | 3,716 |
As of December 29, 2024 the Company had approximately $2.0 billion of unrecognized tax benefits. The Company conducts business and files tax returns in numerous countries and currently has tax audits in progress with a number of tax authorities. With respect to the United States, the Internal Revenue Service (IRS) has completed its audit for the tax years through 2016 and has commenced the audit for tax years 2017 through 2020. The Company recently finalized multi-year transfer pricing agreements with the IRS and certain other foreign jurisdictions in the fiscal fourth quarter of 2024.
In other major jurisdictions where the Company conducts business, the years that remain open to tax audits go back to the year 2013. The Company believes it is possible that some tax audits may be completed over the next twelve months by taxing authorities in some jurisdictions. The Company anticipates a change in uncertain tax positions of approximately $200 million in certain jurisdictions in the next twelve months due to the expected expiration of the statute of limitations. However, generally the Company is not able to provide a reasonably reliable estimate of the timing of any other future tax payments, audit settlements, or changes in uncertain tax positions.
The Company classifies liabilities for unrecognized tax benefits and related interest and penalties as long-term liabilities. Interest expense and penalties related to unrecognized tax benefits are classified as income tax expense. The Company recognized after tax interest expense of $217 million, $99 million and $136 million in fiscal years 2024, 2023 and 2022, respectively. The total amount of accrued interest was $274 million and $264 million in fiscal years 2024 and 2023, respectively.
9. Employee related obligations
At the end of fiscal 2024 and fiscal 2023, employee related obligations recorded on the Consolidated Balance Sheets were:
| | | | | | | | | | | | | | |
| (Dollars in Millions) | | 2024 | | 2023 |
| Pension benefits | | $2,968 | | 3,129 |
| Postretirement benefits | | 1,920 | | 1,963 |
| Postemployment benefits | | 2,910 | | 2,527 |
| Deferred compensation | | 49 | | 68 |
| Total employee obligations | | 7,847 | | 7,687 |
| Less current benefits payable | | 592 | | 538 |
| Employee related obligations — non-current | | $7,255 | | 7,149 |
Prepaid employee related obligations of $6,046 million and $4,992 million for 2024 and 2023, respectively, are included in Other assets on the Consolidated Balance Sheets.
10. Pensions and other benefit plans
The Company sponsors various retirement and pension plans, including defined benefit, defined contribution and termination indemnity plans, which cover most employees worldwide. The Company also provides post-retirement benefits, primarily healthcare, to all eligible U.S. retired employees and their dependents.
Many international employees are covered by government-sponsored programs and the cost to the Company is not significant.
In the U.S., non-union pension benefits for employees hired before January 1, 2015 are primarily based on the employee’s compensation during the last five years before retirement and the number of years of service (the Final Average Pay formula). U.S. pension benefits for employees hired after 2014, are calculated using a different formula based on employee compensation over total years of service (the Retirement Value formula).
In January 2021, the Company announced that, effective on January 1, 2026, all eligible U.S. non-union employees, regardless of hire date, will earn benefits under the Retirement Value formula. This amendment does not affect the benefits accrued under the Final Average Pay formula for service before January 1, 2026.
International subsidiaries have plans under which funds are deposited with trustees, annuities are purchased under group contracts, or reserves are provided.
The Company does not fund retiree healthcare benefits in advance and has the right to modify these plans in the future.
In 2024 and 2023 the Company used December 31, 2024 and December 31, 2023, respectively, as the measurement date for all U.S. and international retirement and other benefit plans.
Net periodic benefit costs for the Company’s defined benefit retirement plans and other benefit plans for 2024, 2023 and 2022 include the following components:
| | | | | | | | | | | | | | | | | | | | | | | | | | | | | | | | | | | | | | |
| | Retirement Plans | | Other Benefit Plans |
| (Dollars in Millions) | | 2024 | | 2023 | | 2022 | | 2024 | | 2023 | | 2022 |
| Service cost | | $948 | | 893 | | 1,319 | | 277 | | 264 | | 320 |
| Interest cost | | 1,402 | | 1,437 | | 908 | | 209 | | 214 | | 104 |
| Expected return on plan assets | | (2,560) | | (2,716) | | (2,756) | | (7) | | (7) | | (8) |
| Amortization of prior service cost | | (184) | | (184) | | (184) | | (2) | | (2) | | (5) |
| | | | | | | | | | | | |
| Recognized actuarial losses (gains) | | 174 | | (199) | | 650 | | 53 | | 23 | | 122 |
| Curtailments and settlements | | (2) | | 93 | | 1 | | — | | (5) | | — |
| Net periodic benefit cost (credit) | | $(222) | | (676) | | (62) | | 530 | | 487 | | 533 |
The service cost component of net periodic benefit cost is presented in the same line items on the Consolidated Statement of Earnings where other employee compensation costs are reported, including Cost of products sold, Research and development expense, Selling, marketing and administrative expenses, and Net earnings from discontinued operations, net of taxes if related to the separation of Kenvue. All other components of net periodic benefit cost are presented as part of Other (income) expense, net on the Consolidated Statement of Earnings, with the exception of certain amounts for curtailments and settlements, which are reported in Net earnings from discontinued operations, net of taxes if related to the separation of Kenvue (as noted above).
Unrecognized gains and losses for the U.S. pension plans are amortized over the average remaining future service for each plan. For plans with no active employees, they are amortized over the average life expectancy. The amortization of gains and losses for the other U.S. benefit plans is determined by using a 10% corridor of the greater of the market value of assets or the accumulated postretirement benefit obligation. Total unamortized gains and losses in excess of the corridor are amortized over the average remaining future service.
Prior service costs/benefits for the U.S. pension plans are amortized over the average remaining future service of plan participants at the time of the plan amendment. Prior service cost/benefit for the other U.S. benefit plans is amortized over the average remaining service to full eligibility age of plan participants at the time of the plan amendment.
The following table represents the weighted-average actuarial assumptions:
| | | | | | | | | | | | | | | | | | | | | | | | | | | | | | | | | | | | | | |
| | Retirement Plans | | Other Benefit Plans |
| Worldwide Benefit Plans | | 2024 | | 2023 | | 2022 | | 2024 | | 2023 | | 2022 |
| Net Periodic Benefit Cost | | | | | | | | | | | | |
| Service cost discount rate | | 4.39 | % | | 4.85 | | | 2.46 | | | 5.09 | | | 5.40 | | | 2.59 | |
| Interest cost discount rate | | 4.95 | % | | 5.25 | | | 2.80 | | | 5.12 | | | 5.43 | | | 2.64 | |
| Rate of increase in compensation levels | | 3.70 | % | | 3.71 | | | 4.02 | | | 4.22 | | | 4.22 | | | 4.21 | |
| Expected long-term rate of return on plan assets | | 7.25 | % | | 7.21 | | | 7.25 | | | | | | | |
| | | | | | | | | | | | |
| Benefit Obligation | | | | | | | | | | | | |
| Discount rate | | 4.95 | % | | 4.58 | | | 5.01 | | | 5.54 | | | 5.11 | | | 5.42 | |
| Rate of increase in compensation levels | | 3.70 | % | | 3.69 | | | 4.00 | | | 4.22 | | | 4.22 | | | 4.21 | |
The Company’s discount rates are determined by considering current yield curves representing high quality, long-term fixed income instruments. The resulting discount rates are consistent with the duration of plan liabilities. The Company's methodology in determining service and interest cost uses duration specific spot rates along that yield curve to the plans' liability cash flows.
The expected rates of return on plan asset assumptions represent the Company's assessment of long-term returns on diversified investment portfolios globally. The assessment is determined using projections from external financial sources, long-term historical averages, actual returns by asset class and the various asset class allocations by market.
The following table displays the assumed healthcare cost trend rates, for all individuals:
| | | | | | | | | | | | | | |
| Healthcare Plans | | 2024 | | 2023 |
| Healthcare cost trend rate assumed for next year | | 9.33 | % | | 13.90 | % |
| Rate to which the cost trend rate is assumed to decline (ultimate trend) | | 4.02 | % | | 4.00 | % |
| Year the rate reaches the ultimate trend rate | | 2048 | | | 2048 | |
The following table sets forth information related to the benefit obligation and the fair value of plan assets at fiscal year-end 2024 and 2023 for the Company’s defined benefit retirement plans and other post-retirement plans:
| | | | | | | | | | | | | | | | | | | | | | | | | | |
| | Retirement Plans | | Other Benefit Plans |
| (Dollars in Millions) | | 2024 | | 2023 | | 2024 | | 2023 |
| Change in Benefit Obligation | | | | | | | | |
| Projected benefit obligation — beginning of year | | $31,744 | | 29,390 | | 4,108 | | 4,192 |
| Service cost | | 948 | | 893 | | 277 | | 264 |
| Interest cost | | 1,402 | | 1,437 | | 209 | | 214 |
| Plan participant contributions | | 75 | | 73 | | — | | — |
| Amendments | | — | | (6) | | — | | — |
Actuarial (gains) losses(1) | | (1,245) | | 2,068 | | 398 | | 469 |
Divestitures & acquisitions(2) | | — | | (352) | | — | | 1 |
| Curtailments, settlements & restructuring | | (121) | | (238) | | — | | (332) |
Benefits paid from plan(3) | | (1,801) | | (2,122) | | (556) | | (702) |
| Effect of exchange rates | | (685) | | 601 | | (11) | | 2 |
| Projected benefit obligation — end of year | | $30,317 | | 31,744 | | 4,425 | | 4,108 |
| | | | | | | | | | | | | | | | | | | | | | | | | | |
| Change in Plan Assets | | | | | | | | |
| Plan assets at fair value — beginning of year | | $33,607 | | 31,496 | | 86 | | 78 |
| Actual return (loss) on plan assets | | 2,113 | | 3,951 | | 15 | | 16 |
| Company contributions | | 229 | | 268 | | 548 | | 694 |
| Plan participant contributions | | 75 | | 73 | | — | | — |
| Settlements | | (114) | | (176) | | — | | — |
Divestitures & acquisitions(2) | | — | | (509) | | — | | — |
Benefits paid from plan assets(3) | | (1,801) | | (2,122) | | (556) | | (702) |
| Effect of exchange rates | | (714) | | 626 | | — | | — |
| Plan assets at fair value — end of year | | $33,395 | | 33,607 | | 93 | | 86 |
| Funded status — end of year | | $3,078 | | 1,863 | | (4,332) | | (4,022) |
| Amounts Recognized in the Company’s Balance Sheet consist of the following: | | | | | | | | |
| Non-current assets | | $6,046 | | 4,992 | | — | | — |
| Current liabilities | | (136) | | (119) | | (453) | | (416) |
| Non-current liabilities | | (2,832) | | (3,010) | | (3,879) | | (3,606) |
| Total recognized in the consolidated balance sheet — end of year | | $3,078 | | 1,863 | | (4,332) | | (4,022) |
| Amounts Recognized in Accumulated Other Comprehensive Income consist of the following: | | | | | | | | |
| Net actuarial loss | | $3,903 | | 4,962 | | 691 | | 354 |
| Prior service cost (credit) | | (1,051) | | (1,236) | | (4) | | (6) |
| Unrecognized net transition obligation | | — | | — | | — | | |
| Total before tax effects | | $2,852 | | 3,726 | | 687 | | 348 |
| | | | | | | | |
| Accumulated Benefit Obligations — end of year | | $28,883 | | 30,139 | | | | |
| | | | | | | | |
(1)The actuarial (gains)/losses for retirement plans in 2024 and 2023 were primarily driven by changes in the discount rates. (2)Driven by the Kenvue separation. (3)The fiscal years 2024 and 2023 includes approximately $400 million and $800 million, respectively, transferred to a group annuity contract issued by a third-party insurer for the U.S. Salaried Pension Plan. |
| | Retirement Plans | | Other Benefit Plans |
| (Dollars in Millions) | | 2024 | | 2023 | | 2024 | | 2023 |
| Amounts Recognized in Net Periodic Benefit Cost and Other Comprehensive Income | | | | | | | | |
| Net periodic benefit cost (credit) | | $(222) | | (676) | | 530 | | 487 |
| Net actuarial (gain) loss | | (807) | | 711 | | 389 | | 136 |
| Amortization of net actuarial loss | | (172) | | 199 | | (53) | | (22) |
| Prior service cost (credit) | | — | | (2) | | — | | — |
| Amortization of prior service (cost) credit | | 184 | | 185 | | 2 | | 2 |
| Effect of exchange rates | | (79) | | 103 | | 1 | | — |
| Total loss/(income) recognized in other comprehensive income, before tax | | $(874) | | 1,195 | | 339 | | 116 |
| Total recognized in net periodic benefit cost and other comprehensive income | | $(1,096) | | 519 | | 869 | | 603 |
The Company plans to continue to fund its U.S. Qualified Plans to comply with the Pension Protection Act of 2006. International Plans are funded in accordance with local regulations. Additional discretionary contributions are made when deemed appropriate to meet the long-term obligations of the plans. For certain plans, funding is not a common practice, as funding provides no economic benefit. Consequently, the Company has several pension plans that are not funded.
In 2024, the Company contributed $122 million and $107 million to its U.S. and international pension plans, respectively.
The following table displays the funded status of the Company's U.S. Qualified & Non-Qualified pension plans and international funded and unfunded pension plans at December 31, 2024 and December 31, 2023, respectively:
| | | | | | | | | | | | | | | | | | | | | | | | | | | | | | | | | | | |
| U.S. Plans | | International Plans |
| Qualified Plans | | Non-Qualified Plans | | Funded Plans | | Unfunded Plans |
| (Dollars in Millions) | 2024 | 2023 | | 2024 | 2023 | | 2024 | 2023 | | 2024 | 2023 |
| Plan Assets | $22,250 | 22,298 | | — | — | | 11,145 | 11,309 | | — | — |
| Projected Benefit Obligation | 18,146 | 19,152 | | 1,990 | 2,037 | | 10,069 | 10,431 | | 112 | 124 |
| Accumulated Benefit Obligation | 17,726 | 18,557 | | 1,949 | 1,982 | | 9,115 | 9,498 | | 93 | 102 |
| Over (Under) Funded Status | | | | | | | | | | | |
| Projected Benefit Obligation | $4,104 | 3,146 | | (1,990) | (2,037) | | 1,076 | 878 | | (112) | (124) |
| Accumulated Benefit Obligation | 4,524 | 3,741 | | (1,949) | (1,982) | | 2,030 | 1,811 | | (93) | (102) |
Plans with accumulated benefit obligations in excess of plan assets have an accumulated benefit obligation, projected benefit obligation and plan assets of $5.8 billion, $6.1 billion and $3.2 billion, respectively, at the end of 2024, and $5.8 billion, $6.1 billion and $3.1 billion, respectively, at the end of 2023.
The following table displays the projected future benefit payments from the Company’s retirement and other benefit plans:
| | | | | | | | | | | | | | | | | | | | | | | | | | | | | | | | | | | | | | |
| (Dollars in Millions) | | 2025 | | 2026 | | 2027 | | 2028 | | 2029 | | 2030-2034 |
| Projected future benefit payments | | | | | | | | | | | | |
| Retirement plans | | $1,480 | | 1,503 | | 1,604 | | 1,702 | | 1,797 | | 10,401 |
| | | | | | | | | | | | |
| | | | | | | | | | | | |
| Other benefit plans | | $464 | | 478 | | 432 | | 445 | | 462 | | 2,537 |
The following table displays the projected future minimum contributions to the unfunded retirement plans. These amounts do not include any discretionary contributions that the Company may elect to make in the future.
| | | | | | | | | | | | | | | | | | | | | | | | | | | | | | | | | | | | | | |
| (Dollars in Millions) | | 2025 | | 2026 | | 2027 | | 2028 | | 2029 | | 2030-2034 |
| Projected future contributions | | $133 | | 135 | | 140 | | 145 | | 150 | | 815 |
Each pension plan is overseen by a local committee or board that is responsible for the overall administration and investment of the pension plans. In determining investment policies, strategies and goals, each committee or board considers factors including, local pension rules and regulations; local tax regulations; availability of investment vehicles (separate accounts, commingled accounts, insurance funds, etc.); funded status of the plans; ratio of actives to retirees; duration of liabilities; and other relevant factors including: diversification, liquidity of local markets and liquidity of base currency. A majority of the Company’s pension funds are open to new entrants and are expected to be on-going plans. Permitted investments are primarily liquid and/or listed, with little reliance on illiquid and non-traditional investments such as hedge funds.
The Company’s retirement plan asset allocation at the end of 2024 and 2023 and target allocations for 2025 are as follows:
| | | | | | | | | | | | | | | | | | | | |
| | Percent of
Plan Assets | | Target
Allocation |
| Worldwide Retirement Plans | | 2024 | | 2023 | | 2025 |
| Equity securities | | 55 | % | | 58 | % | | 54 | % |
| Debt securities | | 45 | | | 42 | | | 46 | |
| Total plan assets | | 100 | % | | 100 | % | | 100 | % |
Determination of fair value of plan assets
The Plan has an established and well-documented process for determining fair values. Fair value is based upon quoted market prices, where available. If listed prices or quotes are not available, fair value is based upon models that primarily use, as inputs, market-based or independently sourced market parameters, including yield curves, interest rates, volatilities, equity or debt prices, foreign exchange rates and credit curves.
While the Plan believes its valuation methods are appropriate and consistent with other market participants, the use of different methodologies or assumptions to determine the fair value of certain financial instruments could result in a different estimate of fair value at the reporting date.
Valuation hierarchy
The authoritative literature establishes a three-level hierarchy to prioritize the inputs used in measuring fair value. The levels within the hierarchy are described in the table below with Level 1 having the highest priority and Level 3 having the lowest.
The Net Asset Value (NAV) is based on the value of the underlying assets owned by the fund, minus its liabilities, and then divided by the number of shares outstanding.
A financial instrument’s categorization within the valuation hierarchy is based upon the lowest level of input that is significant to the fair value measurement.
Following is a description of the valuation methodologies used for the investments measured at fair value.
•Short-term investment funds — Cash and quoted short-term instruments are valued at the closing price or the amount held on deposit by the custodian bank. Other investments are through investment vehicles valued using the NAV provided by the administrator of the fund. The NAV is a quoted price in a market that is not active and classified as Level 2.
•Government and agency securities — A limited number of these investments are valued at the closing price reported on the major market on which the individual securities are traded. Where quoted prices are available in an active market, the investments are classified within Level 1 of the valuation hierarchy. If quoted market prices are not available for the specific security, then fair values are estimated by using pricing models, quoted prices of securities with similar characteristics or discounted cash flows. When quoted market prices for a security are not available in an active market, they are classified as Level 2.
•Debt instruments — A limited number of these investments are valued at the closing price reported on the major market on which the individual securities are traded. Where quoted prices are available in an active market, the investments are classified as Level 1. If quoted market prices are not available for the specific security, then fair values are estimated by using pricing models, quoted prices of securities with similar characteristics or discounted cash flows and are classified as Level 2. Level 3 debt instruments are priced based on unobservable inputs.
•Equity securities — Equity securities are valued at the closing price reported on the major market on which the individual securities are traded. Substantially all equity securities are classified within Level 1 of the valuation hierarchy.
•Commingled funds — These investment vehicles are valued using the NAV provided by the fund administrator. Assets in the Level 2 category have a quoted market price.
•Other assets — Other assets are represented primarily by limited partnerships. These investment vehicles are valued using the NAV provided by the fund administrator. Other assets that are exchange listed and actively traded are classified as Level 1, while inactively traded assets are classified as Level 2.
The following table sets forth the Retirement Plans' investments measured at fair value as of December 31, 2024 and December 31, 2023:
| | | | | | | | | | | | | | | | | | | | | | | | | | | | | | | | | | | | | | | | | | | | | | | | | | | | | | | | | | | | | | |
| | Quoted Prices
in Active
Markets for
Identical Assets | | Significant
Other
Observable
Inputs | | Significant Unobservable Inputs(1) | | Investments
Measured at Net
Asset Value | | | | |
| | (Level 1) | | (Level 2) | | (Level 3) | | | | | | Total Assets |
| (Dollars in Millions) | | 2024 | | 2023 | | 2024 | | 2023 | | 2024 | | 2023 | | 2024 | | 2023 | | 2024 | | 2023 |
| Short-term investment funds | | $— | | | 12 | | 511 | | 829 | | — | | — | | — | | — | | 511 | | 841 |
| Government and agency securities | | — | | — | | 7,885 | | 5,985 | | — | | — | | — | | — | | 7,885 | | 5,985 |
| Debt instruments | | — | | — | | 2,321 | | 3,899 | | — | | — | | — | | — | | 2,321 | | 3,899 |
| Equity securities | | 7,144 | | 7,764 | | — | | — | | — | | — | | — | | — | | 7,144 | | 7,764 |
| Commingled funds | | — | | — | | 5,004 | | 4,967 | | 37 | | 43 | | 6,190 | | 6,672 | | 11,231 | | 11,682 |
| | | | | | | | | | | | | | | | | | | | |
| Other assets | | — | | — | | 88 | | 49 | | 128 | | 92 | | 4,087 | | 3,295 | | 4,303 | | 3,436 |
| Investments at fair value | | $7,144 | | | 7,776 | | 15,809 | | 15,729 | | 165 | | 135 | | 10,277 | | 9,967 | | 33,395 | | 33,607 |
(1)The activity for the Level 3 assets is not significant for all years presented.
The Company's Other Benefit Plans are unfunded except for U.S. commingled funds (Level 2) of $93 million and $86 million at December 31, 2024 and December 31, 2023, respectively.
The fair value of Johnson & Johnson Common Stock directly held in plan assets was $13 million at December 31, 2024 and $14 million at December 31, 2023.
11. Savings plan
The Company has voluntary 401(k) savings plans designed to enhance the existing retirement programs covering eligible employees. The Company matches a percentage of each employee’s contributions consistent with the provisions of the plan for which the employee is eligible. Total Company matching contributions to the plans were $282 million, $263 million and $257 million in fiscal years 2024, 2023 and 2022, respectively.
12. Capital and treasury stock
Changes in treasury stock were:
| | | | | | | | | | | | | | |
| | Treasury Stock |
| (Amounts in Millions Except Treasury Stock Shares in Thousands) | | Shares | | Amount |
| Balance at January 2, 2022 | | 490,878 | | $39,099 |
| Employee compensation and stock option plans | | (20,007) | | (3,440) |
| Repurchase of common stock | | 35,375 | | 6,035 |
| Balance at January 1, 2023 | | 506,246 | | 41,694 |
| Employee compensation and stock option plans | | (15,521) | | (2,529) |
| Repurchase of common stock | | 31,085 | | 5,079 |
| Kenvue share exchange (Note 21) | | 190,955 | | | 31,418 |
| Balance at December 31, 2023 | | 712,765 | | 75,662 |
| Employee compensation and stock option plans | | (15,027) | | (2,389) |
| Repurchase of common stock | | 15,183 | | 2,407 |
| | | | |
| Balance at December 29, 2024 | | 712,921 | | $75,680 |
Aggregate shares of common stock issued were approximately 3,119,843,000 shares at the end of fiscal years 2024, 2023 and 2022.
Cash dividends paid were $4.91 per share in fiscal year 2024, compared with dividends of $4.70 per share in fiscal year 2023, and $4.45 per share in fiscal year 2022.
On January 2, 2025, the Board of Directors declared a regular cash dividend of $1.24 per share, payable on March 4, 2025 to shareholders of record as of February 18, 2025.
On September 14, 2022, the Company announced that its Board of Directors approved a share repurchase program, authorizing the Company to purchase up to $5.0 billion of the Company's shares of common stock. The repurchase program was completed during the fiscal first quarter of 2023.
13. Accumulated other comprehensive income (loss)
Components of other comprehensive income (loss) consist of the following:
| | | | | | | | | | | | | | | | | | | | | | | | | | | | | | | | |
| (Dollars in Millions) | Foreign
Currency
Translation | | Gain/
(Loss) On
Securities | | Employee
Benefit Plans | | Gain/
(Loss) On
Derivatives
& Hedges | | Total
Accumulated
Other
Comprehensive
Income (Loss) |
| January 2, 2022 | | $(10,017) | | (3) | | (2,702) | | (336) | | (13,058) |
| | | | | | | | | | |
| Net 2022 changes | | (1,796) | | (24) | | 1,805 | | 106 | | 91 |
| January 1, 2023 | | (11,813) | | (27) | | (897) | | (230) | | (12,967) |
| | | | | | | | | | |
| Net 2023 changes | | (3,221) | | 26 | | (1,399) | | (147) | | (4,741) |
| Kenvue Separation/IPO | | 4,885 | | — | | 296 | * | — | | 5,181 |
| December 31, 2023 | | (10,149) | | (1) | | (2,000) | | (377) | | (12,527) |
| Net 2024 changes | | 1,708 | | 2 | | 449 | | (1,373) | | 786 |
| | | | | | | | | | |
| December 29, 2024 | | $(8,441) | | 1 | | (1,551) | | (1,750) | | (11,741) |
Amounts in accumulated other comprehensive income are presented net of the related tax impact. Foreign currency translation is not adjusted for income taxes where it relates to permanent investments in international subsidiaries. For additional details on comprehensive income see the Consolidated Statements of Comprehensive Income.
Details on reclassifications out of Accumulated Other Comprehensive Income:
Gain/(Loss) On Securities - reclassifications released to Other (income) expense, net.
Employee Benefit Plans - reclassifications are included in net periodic benefit cost. See Note 10 for additional details.
Gain/(Loss) On Derivatives & Hedges - reclassifications to earnings are recorded in the same account as the hedged transaction. See Note 6 for additional details.
* Includes impact of curtailments and settlements in connection with separation from Kenvue.
14. International currency translation
For translation of its subsidiaries operating in non-U.S. Dollar currencies, the Company has determined that the local currencies of its international subsidiaries are the functional currencies except those in highly inflationary economies, which are defined as those which have had compound cumulative rates of inflation of 100% or more during the past three years, or where a substantial portion of its cash flows are not in the local currency. For the majority of the Company's subsidiaries the local currency is the functional currency.
In consolidating international subsidiaries, balance sheet currency effects are recorded as a component of accumulated other comprehensive income. The other current and non-current assets line within the Statement of Cash flows includes the impact of foreign currency translation. This equity account includes the results of translating certain balance sheet assets and liabilities at current exchange rates and some accounts at historical rates, except for those located in highly inflationary economies (Argentina, Turkey and Venezuela). Beginning in the fiscal fourth quarter of 2024, the Company also accounted for operations in Egypt as highly inflationary. The translation of balance sheet accounts for highly inflationary economies are reflected in the operating results.
A rollforward of the changes during fiscal years 2024, 2023 and 2022 for foreign currency translation adjustments is included in Note 13.
Net currency transaction gains and losses included in Other (income) expense were losses of $214 million, $366 million and $286 million in fiscal years 2024, 2023 and 2022, respectively.
15. Earnings per share
The following is a reconciliation of basic net earnings per share to diluted net earnings per share for the fiscal years ended December 29, 2024, December 31, 2023 and January 1, 2023:
| | | | | | | | | | | | | | | | | | | | |
| (In Millions Except Per Share Amounts) | | 2024 | | 2023 | | 2022 |
| Basic net earnings per share from continuing operations | | $5.84 | | | 5.26 | | 6.23 |
| Basic net earnings per share from discontinued operations | | — | | | 8.62 | | 0.60 |
| Total net earnings per share - basic | | 5.84 | | 13.88 | | 6.83 |
| Average shares outstanding — basic | | 2,407.3 | | 2,533.5 | | 2,625.2 |
| Potential shares exercisable under stock option plans | | 77.7 | | 94.1 | | 140.1 |
| Less: shares repurchased under treasury stock method | | (55.6) | | (67.2) | | (101.4) |
| Adjusted average shares outstanding — diluted | | 2,429.4 | | 2,560.4 | | 2,663.9 |
| Diluted net earnings per share from continuing operations | | 5.79 | | | 5.20 | | 6.14 |
| Diluted net earnings per share from discontinuing operations | | — | | | 8.52 | | 0.59 |
| Total net earnings per share - diluted | | $5.79 | | | 13.72 | | 6.73 |
| | | | | | |
| (Shares in Millions) | | | | | | |
| The diluted net earnings per share calculation excluded the following number of shares related to stock options, as the exercise price of these options was greater than the average market value of the Company’s stock. | | 54.1 | | | 43.0 | | | 0.0 |
16. Common stock, stock option plans and stock compensation agreements
At December 29, 2024, the Company had one active stock-based compensation plan, the 2022 Long-Term Incentive Plan. The shares outstanding are for contracts under the Company's 2012 Long-Term Incentive Plan and 2022 Long-Term Incentive Plan. The 2012 Long-Term Incentive Plan expired on April 26, 2022. All awards (stock options, restricted shares units and performance share units) granted subsequent to that date were under the 2022 Long-Term Incentive Plan. Under the 2022 Long-Term Incentive Plan, the Company may issue up to 150 million shares of common stock, of which up to 110 million shares of common stock may be issued subject to stock options or stock appreciation rights and up to 40 million shares of common stock may be issued subject to full value awards. Awards will generally be counted on a 1-for-1 basis against the share reserve, provided that if more than 40 million full value awards are granted, each full value award in excess of 40 million will be counted on a 5-for-1 basis against the share reserve. Shares available for future grants under the 2022 Long-Term Incentive Plan were 111 million at the end of fiscal year 2024.
The compensation cost that has been charged against income for these plans was $1,176 million, $1,087 million and $1,028 million for fiscal years 2024, 2023 and 2022, respectively. The total income tax benefit recognized in the income statement for share-based compensation costs was $251 million, $221 million and $177 million for fiscal years 2024, 2023 and 2022, respectively. The Company also recognized additional income tax benefits of $94 million, $126 million and $267 million for fiscal years 2024, 2023 and 2022, respectively, for which options were exercised or restricted shares were vested. The total unrecognized compensation cost was $1,002 million, $907 million and $866 million for fiscal years 2024, 2023 and 2022, respectively. The weighted average period for this cost to be recognized was 1.81 years, 1.80 years and 1.80 years for fiscal years 2024, 2023, and 2022, respectively. Share-based compensation costs capitalized as part of inventory were insignificant in all periods.
The Company settles employee benefit equity issuances with treasury shares. Treasury shares are replenished through market purchases throughout the year for the number of shares used to settle employee benefit equity issuances.
Stock options
Stock options expire 10 years from the date of grant and vest over service periods that range from 6 months to 4 years. Options granted under the 2012 Long-Term Incentive Plan were granted at the average of the high and low prices of the Company’s Common Stock on the New York Stock Exchange on the date of grant. Options granted under the 2022 Long-Term incentive Plan were granted at the closing price of the Company’s Common Stock on the New York Stock Exchange on the date of grant.
The fair value of each option award was estimated on the date of grant using the Black-Scholes option valuation model that uses the assumptions noted in the following table. For 2024, 2023, and 2022 grants, expected volatility represents a blended rate of 10-year weekly historical overall volatility rate, and a 5-week average implied volatility rate based on at-the-money traded Johnson & Johnson options with a life of 2 years. For all grants, historical data is used to determine the expected life of the option. The risk-free rate was based on the U.S. Treasury yield curve in effect at the time of grant.
The average fair value of options granted was $27.67, $27.85 and $23.23, in fiscal years 2024, 2023 and 2022, respectively. The fair value was estimated based on the weighted average assumptions of:
| | | | | | | | | | | | | | | | | |
| 2024 | | 2023 | | 2022 |
| Risk-free rate | 4.15 | % | | 3.74 | % | | 1.98 | % |
| Expected volatility | 17.85 | % | | 17.69 | % | | 18.00 | % |
| Expected life (in years) | 7.0 | | 7.0 | | 7.0 |
| Expected dividend yield | 3.10 | % | | 2.90 | % | | 2.70 | % |
A summary of option activity under the Plan as of December 29, 2024, is presented below:
| | | | | | | | | | | | | | | | | | | | |
| (Shares in Thousands) | | Outstanding
Shares | | Weighted
Average Exercise
Price | | Aggregate
Intrinsic
Value
(Dollars in Millions) |
| | | | | | |
| | | | | | |
| | | | | | |
| | | | | | |
| | | | | | |
| | | | | | |
| | | | | | |
| | | | | | |
| Shares at December 31, 2023 | | 112,238 | | $139.88 | | $2,239 |
| Options granted | | 13,917 | | 157.92 | | |
| Options exercised | | (10,771) | | 107.06 | | |
| Options canceled/forfeited | | (2,755) | | 162.45 | | |
| Shares at December 29, 2024 | | 112,629 | | $144.69 | | $1,129 |
The total intrinsic value of options exercised was $560 million, $729 million and $1,228 million in fiscal years 2024, 2023 and 2022, respectively.
The following table summarizes stock options outstanding and exercisable at December 29, 2024:
| | | | | | | | | | | | | | | | | | | | | | | | | | | | | | | | |
| (Shares in Thousands) | | Outstanding | | Exercisable |
| Exercise Price Range | | Options | | Average Life(1) | | Weighted
Average
Exercise Price | | Options | | Weighted
Average
Exercise Price |
| $100.06 - $101.87 | | 13,016 | | 0.8 | | $101.29 | | 13,016 | | $101.29 |
| $115.67 - $129.51 | | 18,252 | | 2.6 | | 122.49 | | 18,252 | | 122.49 |
| $131.94 - $151.41 | | 25,624 | | 4.6 | | 142.87 | | 25,624 | | 142.87 |
| $157.92 - $162.75 | | 26,391 | | 8.6 | | 160.33 | | 4,269 | | 162.75 |
| $164.62 - $165.89 | | 29,346 | | 6.6 | | 165.29 | | 13,522 | | 164.64 |
| | | 112,629 | | 5.3 | | $144.69 | | 74,683 | | $135.72 |
(1)Average contractual life remaining in years.
Stock options outstanding at December 31, 2023 and January 1, 2023 were 112,238 and an average life of 5.5 years and 118,672 and an average life of 5.8 years, respectively. Stock options exercisable at December 31, 2023 and January 1, 2023 were 66,998 at an average price of $123.39 and 63,661 at an average price of $113.06, respectively.
Restricted share units and performance share units
The Company grants restricted share units which vest over service periods that range from 6 months to 3 years. The Company also grants performance share units, which are paid in shares of Johnson & Johnson Common Stock after the end of a three-year performance period. Performance shares were granted with two equally-weighted goals that directly align with or help drive long-term total shareholder return: adjusted operational earnings per share and relative total shareholder return. The number of shares actually earned at the end of the three-year period will vary, based only on actual performance, from 0% to 200% of the target number of performance share units granted.
A summary of the restricted share units and performance share units activity under the Plans as of December 29, 2024 is presented below:
| | | | | | | | | | | | | | |
| (Shares in Thousands) | | Outstanding
Restricted Share Units | | Outstanding
Performance Share Units |
| | | | |
| | | | |
| | | | |
| | | | |
| | | | |
| | | | |
| | | | |
| | | | |
| Shares at December 31, 2023 | | 12,938 | | 2,037 |
| Granted | | 6,331 | | 906 |
| Issued | | (5,454) | | (808) |
| Canceled/forfeited/adjusted | | (774) | | (122) |
| Shares at December 29, 2024 | | 13,041 | | 2,013 |
The average fair value of the restricted share units granted was $147.51, $152.63 and $153.67 in fiscal years 2024, 2023 and 2022, respectively, using the fair market value at the date of grant. The fair value of restricted share units was discounted for dividends, which are not paid on the restricted share units during the vesting period. The fair value of restricted share units issued was $833 million, $605 million and $591 million in 2024, 2023 and 2022, respectively.
The weighted average fair value of the performance share units granted was $133.76, $145.17 and $170.46 in fiscal years 2024, 2023 and 2022, calculated using the weighted average fair market value for each of the component goals at the date of grant.
The fair values for the earnings per share goals of each performance share unit were estimated on the date of grant using the fair market value of the shares at the time of the award discounted for dividends, which are not paid on the performance share units during the vesting period. The fair value for the relative total shareholder return goal of each performance share unit was estimated on the date of grant using the Monte Carlo valuation model. The fair value of performance share units issued was $146 million, $140 million and $94 million in fiscal years 2024, 2023 and 2022, respectively.
17. Segments of business and geographic areas
Following the separation of the Consumer Health business in the fiscal third quarter of 2023, the Company is now organized into two reportable segments: Innovative Medicine and MedTech. The segment results have been recast for all periods to reflect the continuing operations of the Company.
The Company’s chief operating decision maker (CODM) is the Chief Executive Officer (Principal Executive Officer). For the Innovative Medicine and MedTech segments, the CODM uses segment income before tax to allocate resources (including employees, financial, and capital resources) for each segment predominantly in the annual forecasting process. The CODM considers planning-to-actual variances on a quarterly basis to assess performance and make decisions about allocating resources to the segments.
| | | | | | | | | | | | | | | | | | | | | | | | | | | | | | | | |
| | | Sales to Customers | | % Change |
| (Dollars in Millions) | | 2024 | | 2023 | | 2022 | | ’24 vs. ’23 | | ’23 vs. ’22 |
| | | | | | | | | | |
| INNOVATIVE MEDICINE | | | | | | | | | | |
| Immunology | | | | | | | | | | |
| U.S. | | $11,355 | | 11,539 | | 11,036 | | (1.6) | % | | 4.6 | |
| International | | 6,473 | | 6,513 | | 5,899 | | (0.6) | | | 10.4 | |
| Worldwide | | 17,828 | | 18,052 | | 16,935 | | (1.2) | | | 6.6 | |
| REMICADE | | | | | | | | | | |
| U.S. | | 1,009 | | 1,143 | | 1,417 | | (11.7) | | | (19.3) | |
| U.S. Exports | | 98 | | 147 | | 204 | | (33.0) | | | (28.0) | |
| International | | 497 | | 549 | | 722 | | (9.5) | | | (23.9) | |
| Worldwide | | 1,605 | | 1,839 | | 2,343 | | (12.8) | | | (21.5) | |
| SIMPONI / SIMPONI ARIA | | | | | | | | | | |
| U.S. | | 1,082 | | 1,124 | | 1,166 | | (3.8) | | | (3.6) | |
| International | | 1,108 | | 1,073 | | 1,017 | | 3.3 | | | 5.4 | |
| Worldwide | | 2,190 | | 2,197 | | 2,184 | | (0.3) | | | 0.6 | |
| STELARA | | | | | | | | | | |
| U.S. | | 6,720 | | 6,966 | | 6,388 | | (3.5) | | | 9.0 | |
| International | | 3,641 | | 3,892 | | 3,335 | | (6.4) | | | 16.7 | |
| Worldwide | | 10,361 | | 10,858 | | 9,723 | | (4.6) | | | 11.7 | |
| TREMFYA | | | | | | | | | | |
| U.S. | | 2,443 | | 2,147 | | 1,844 | | 13.7 | | | 16.5 | |
| International | | 1,227 | | 999 | | 824 | | 22.8 | | | 21.2 | |
| Worldwide | | 3,670 | | 3,147 | | 2,668 | | 16.6 | | | 17.9 | |
| OTHER IMMUNOLOGY | | | | | | | | | | |
| U.S. | | 3 | | 11 | | 17 | | (74.1) | | | (33.8) | |
| International | | 0 | | 0 | | 0 | | — | | | — |
| Worldwide | | 3 | | 11 | | 17 | | (74.1) | | | (33.8) | |
| | | | | | | | | | |
| Infectious Diseases | | | | | | | | | | |
| U.S. | | 1,354 | | 1,500 | | 1,680 | | (9.8) | | | (10.7) | |
| International | | 2,042 | | 2,918 | | 3,769 | | (30.0) | | | (22.6) | |
| Worldwide | | 3,396 | | 4,418 | | 5,449 | | (23.1) | | | (18.9) | |
| COVID-19 VACCINE | | | | | | | | | | |
| U.S. | | 0 | | 0 | | 120 | | — | | * |
| International | | 198 | | 1,117 | | 2,059 | | (82.4) | | | (45.8) | |
| | | | | | | | | | | | | | | | | | | | | | | | | | | | | | | | |
| | | Sales to Customers | | % Change |
| (Dollars in Millions) | | 2024 | | 2023 | | 2022 | | ’24 vs. ’23 | | ’23 vs. ’22 |
| Worldwide | | 198 | | 1,117 | | 2,179 | | (82.4) | | | (48.8) | |
| EDURANT / rilpivirine | | | | | | | | | | |
| U.S. | | 31 | | 35 | | 36 | | (10.0) | | | (3.7) | |
| International | | 1,241 | | 1,115 | | 972 | | 11.2 | | | 14.8 | |
| Worldwide | | 1,272 | | 1,150 | | 1,008 | | 10.6 | | | 14.1 | |
PREZISTA / PREZCOBIX / REZOLSTA / SYMTUZA | | | | | | | | | | |
| U.S. | | 1,311 | | 1,446 | | 1,494 | | (9.4) | | | (3.2) | |
| International | | 401 | | 408 | | 449 | | (1.7) | | | (9.2) | |
| Worldwide | | 1,712 | | 1,854 | | 1,943 | | (7.7) | | | (4.6) | |
| OTHER INFECTIOUS DISEASES | | | | | | | | | | |
| U.S. | | 11 | | 19 | | 30 | | (41.0) | | | (34.5) | |
| International | | 203 | | 278 | | 289 | | (26.7) | | | (3.8) | |
| Worldwide | | 214 | | 297 | | 318 | | (27.6) | | | (6.7) | |
| | | | | | | | | | |
| Neuroscience | | | | | | | | | | |
| U.S. | | 4,398 | | 4,065 | | 3,570 | | 8.2 | | | 13.9 | |
| International | | 2,718 | | 3,076 | | 3,323 | | (11.6) | | | (7.5) | |
| Worldwide | | 7,115 | | 7,140 | | 6,893 | | (0.4) | | | 3.6 | |
| CONCERTA / methylphenidate | | | | | | | | | | |
| U.S. | | 134 | | 230 | | 151 | | (41.7) | | | 52.5 | |
| International | | 507 | | 554 | | 493 | | (8.4) | | | 12.2 | |
| Worldwide | | 641 | | 783 | | 644 | | (18.1) | | | 21.6 | |
| INVEGA SUSTENNA / XEPLION / INVEGA TRINZA / TREVICTA | | | | | | | | | | |
| U.S. | | 3,125 | | 2,897 | | 2,714 | | 7.9 | | | 6.7 | |
| International | | 1,097 | | 1,218 | | 1,426 | | (9.9) | | | (14.6) | |
| Worldwide | | 4,222 | | 4,115 | | 4,140 | | 2.6 | | | (0.6) | |
| SPRAVATO | | | | | | | | | | |
| U.S. | | 929 | | 589 | | 328 | | 57.8 | | | 79.7 | |
| International | | 148 | | 100 | | 46 | | 48.2 | | | * |
| Worldwide | | 1,077 | | 689 | | 374 | | 56.4 | | | 84.1 | |
| OTHER NEUROSCIENCE | | | | | | | | | | |
| U.S. | | 210 | | 349 | | 376 | | (39.8) | | | (7.3) | |
| International | | 965 | | 1,204 | | 1,358 | | (19.8) | | | (11.3) | |
| Worldwide | | 1,175 | | 1,553 | | 1,734 | | (24.3) | | | (10.4) | |
| | | | | | | | | | |
| Oncology | | | | | | | | | | |
| U.S. | | 10,854 | | 8,462 | | 6,930 | | 28.3 | | | 22.1 | |
| International | | 9,926 | | 9,199 | | 9,052 | | 7.9 | | | 1.6 | |
| Worldwide | | 20,781 | | 17,661 | | 15,983 | | 17.7 | | | 10.5 | |
| CARVYKTI | | | | | | | | | | |
| U.S. | | 869 | | 469 | | 133 | | 85.2 | | * |
| International | | 94 | | 30 | | — | | * | | * |
| | | | | | | | | | |
| | | | | | | | | | | | | | | | | | | | | | | | | | | | | | | | |
| | | Sales to Customers | | % Change |
| (Dollars in Millions) | | 2024 | | 2023 | | 2022 | | ’24 vs. ’23 | | ’23 vs. ’22 |
| Worldwide | | 963 | | 500 | | 133 | | 92.7 | | * |
| DARZALEX | | | | | | | | | | |
| U.S. | | 6,588 | | 5,277 | | 4,210 | | 24.8 | | | 25.4 | |
| International | | 5,082 | | 4,467 | | 3,767 | | 13.8 | | | 18.6 | |
| Worldwide | | 11,670 | | 9,744 | | 7,977 | | 19.8 | | | 22.2 | |
| ERLEADA | | | | | | | | | | |
| U.S. | | 1,282 | | 1,065 | | 968 | | 20.3 | | | 10.0 | |
| International | | 1,717 | | 1,322 | | 913 | | 29.8 | | | 44.8 | |
| Worldwide | | 2,999 | | 2,387 | | 1,881 | | 25.6 | | | 26.9 | |
| IMBRUVICA | | | | | | | | | | |
| U.S. | | 1,020 | | 1,051 | | 1,390 | | (3.0) | | | (24.4) | |
| International | | 2,018 | | 2,214 | | 2,394 | | (8.8) | | | (7.5) | |
| Worldwide | | 3,038 | | 3,264 | | 3,784 | | (6.9) | | | (13.7) | |
| TECVAYLI | | | | | | | | | | |
| U.S. | | 418 | | 334 | | 12 | | 25.3 | | | * |
| International | | 131 | | 61 | | 3 | | * | | * |
| Worldwide | | 549 | | 395 | | 15 | | 38.8 | | | * |
| ZYTIGA /abiraterone acetate | | | | | | | | | | |
| U.S. | | 34 | | 50 | | 74 | | (32.2) | | | (32.1) | |
| International | | 597 | | 837 | | 1,696 | | (28.6) | | | (50.7) | |
| Worldwide | | 631 | | 887 | | 1,770 | | (28.8) | | | (49.9) | |
| OTHER ONCOLOGY | | | | | | | | | | |
| U.S. | | 643 | | 215 | | 144 | | * | | 49.3 | |
| International | | 288 | | 269 | | 280 | | 7.1 | | | (3.9) | |
| Worldwide | | 931 | | 484 | | 423 | | 92.5 | | | 14.4 | |
| | | | | | | | | | |
| Pulmonary Hypertension | | | | | | | | | | |
| U.S. | | 3,143 | | 2,697 | | 2,346 | | 16.5 | | | 15.0 | |
| International | | 1,140 | | 1,117 | | 1,071 | | 2.0 | | | 4.3 | |
| Worldwide | | 4,282 | | 3,815 | | 3,417 | | 12.3 | | | 11.6 | |
| OPSUMIT | | | | | | | | | | |
| U.S. | | 1,520 | | 1,292 | | 1,132 | | 17.7 | | | 14.1 | |
| International | | 664 | | 681 | | 651 | | (2.4) | | | 4.6 | |
| Worldwide | | 2,184 | | 1,973 | | 1,783 | | 10.7 | | | 10.6 | |
| UPTRAVI | | | | | | | | | | |
| U.S. | | 1,511 | | 1,326 | | 1,104 | | 13.9 | | | 20.1 | |
| International | | 307 | | 255 | | 218 | | 20.1 | | | 17.3 | |
| Worldwide | | 1,817 | | 1,582 | | 1,322 | | 14.9 | | | 19.7 | |
| OTHER PULMONARY HYPERTENSION | | | | | | | | | | |
| U.S. | | 112 | | 79 | | 110 | | 41.8 | | | (28.6) | |
| International | | 169 | | 182 | | 202 | | (6.9) | | | (10.3) | |
| Worldwide | | 281 | | 260 | | 313 | | 7.9 | | | (16.7) | |
| | | | | | | | | | |
| | | | | | | | | | | | | | | | | | | | | | | | | | | | | | | | |
| | | Sales to Customers | | % Change |
| (Dollars in Millions) | | 2024 | | 2023 | | 2022 | | ’24 vs. ’23 | | ’23 vs. ’22 |
| Cardiovascular / Metabolism / Other | | | | | | | | | | |
| U.S. | | 2,866 | | 2,906 | | 3,042 | | (1.4) | | | (4.5) | |
| International | | 696 | | 765 | | 845 | | (9.1) | | | (9.4) | |
| Worldwide | | 3,562 | | 3,671 | | 3,887 | | (3.0) | | | (5.5) | |
| XARELTO | | | | | | | | | | |
| U.S. | | 2,373 | | 2,365 | | 2,473 | | 0.3 | | | (4.4) | |
| International | | — | | — | | — | | — | | | — | |
| Worldwide | | 2,373 | | 2,365 | | 2,473 | | 0.3 | | | (4.4) | |
| | | | | | | | | | |
| | | | | | | | | | |
| | | | | | | | | | |
| | | | | | | | | | |
| OTHER | | | | | | | | | | |
| U.S. | | 494 | | 541 | | 569 | | (8.8) | | | (5.0) | |
| International | | 696 | | 765 | | 845 | | (9.1) | | | (9.4) | |
| Worldwide | | 1,189 | | 1,306 | | 1,414 | | (8.9) | | | (7.6) | |
| | | | | | | | | | |
| TOTAL INNOVATIVE MEDICINE | | | | | | | | | | |
| U.S. | | 33,970 | | 31,169 | | 28,604 | | 9.0 | | | 9.0 | |
| International | | 22,994 | | 23,590 | | 23,959 | | (2.5) | | | (1.5) | |
| Worldwide | | 56,964 | | 54,759 | | 52,563 | | 4.0 | | | 4.2 | |
| | | | | | | | | | |
| MEDTECH | | | | | | | | | | |
| | | | | | | | | | |
| | | | | | | | | | |
| | | | | | | | | | |
| | | | | | | | | | |
| | | | | | | | | | |
| | | | | | | | | | |
| | | | | | | | | | |
| | | | | | | | | | |
Cardiovascular (1) | | | | | | | | | | |
| U.S. | | 4,513 | | 3,633 | | 2,169 | | 24.2 | | | 67.5 | |
| International | | 3,194 | | 2,717 | | 2,131 | | 17.6 | | | 27.5 | |
| Worldwide | | 7,707 | | 6,350 | | 4,300 | | 21.4 | | | 47.7 | |
| ELECTROPHYSIOLOGY | | | | | | | | | | |
| U.S. | | 2,738 | | 2,458 | | 2,036 | | 11.4 | | | 20.7 | |
| International | | 2,529 | | 2,230 | | 1,901 | | 13.4 | | | 17.3 | |
| Worldwide | | 5,267 | | 4,688 | | 3,937 | | 12.3 | | | 19.1 | |
ABIOMED(2) | | | | | | | | | | |
| U.S. | | 1,213 | | 1,066 | | 31 | | 13.7 | | | * |
| International | | 284 | | 240 | | — | | 18.2 | | | * |
| Worldwide | | 1,496 | | 1,306 | | 31 | | 14.5 | | | * |
SHOCKWAVE(3) | | | | | | | | | | |
| U.S. | | 442 | | — | | — | | * | | * |
| International | | 122 | | — | | — | | * | | * |
| Worldwide | | 564 | | — | | — | | * | | * |
OTHER CARDIOVASCULAR(1) | | | | | | | | | | |
| U.S. | | 120 | | 109 | | 102 | | 10.7 | | | 6.7 | |
| International | | 260 | | 247 | | 230 | | 5.3 | | | 7.3 | |
| Worldwide | | 380 | | 356 | | 332 | | 6.9 | | | 7.1 | |
| Orthopaedics | | | | | | | | | | |
| U.S. | | 5,689 | | 5,525 | | 5,321 | | 3.0 | | | 3.8 | |
| International | | 3,470 | | 3,417 | | 3,267 | | 1.5 | | | 4.6 | |
| Worldwide | | 9,158 | | 8,942 | | 8,587 | | 2.4 | | | 4.1 | |
| | | | | | | | | | | | | | | | | | | | | | | | | | | | | | | | |
| | | Sales to Customers | | % Change |
| (Dollars in Millions) | | 2024 | | 2023 | | 2022 | | ’24 vs. ’23 | | ’23 vs. ’22 |
| HIPS | | | | | | | | | | |
| U.S. | | 1,057 | | 996 | | 943 | | 6.2 | | | 5.6 | |
| International | | 581 | | 564 | | 571 | | 3.0 | | | (1.2) | |
| Worldwide | | 1,638 | | 1,560 | | 1,514 | | 5.0 | | | 3.0 | |
| | | | | | | | | | |
| KNEES | | | | | | | | | | |
| U.S. | | 922 | | 896 | | 851 | | 2.9 | | | 5.3 | |
| International | | 623 | | 559 | | 508 | | 11.3 | | | 10.2 | |
| Worldwide | | 1,545 | | 1,456 | | 1,359 | | 6.1 | | | 7.1 | |
| TRAUMA | | | | | | | | | | |
| U.S. | | 2,013 | | 1,949 | | 1,882 | | 3.3 | | | 3.6 | |
| International | | 1,036 | | 1,030 | | 989 | | 0.6 | | | 4.1 | |
| Worldwide | | 3,049 | | 2,979 | | 2,871 | | 2.3 | | | 3.8 | |
| SPINE, SPORTS & OTHER | | | | | | | | | | |
| U.S. | | 1,696 | | 1,684 | | 1,645 | | 0.7 | | | 2.4 | |
| International | | 1,230 | | 1,263 | | 1,198 | | (2.6) | | | 5.4 | |
| Worldwide | | 2,926 | | 2,947 | | 2,843 | | (0.7) | | | 3.7 | |
| Surgery | | | | | | | | | | |
| U.S. | | 4,003 | | 4,031 | | 3,897 | | (0.7) | | | 3.4 | |
| International | | 5,842 | | 6,006 | | 5,793 | | (2.7) | | | 3.7 | |
| Worldwide | | 9,845 | | 10,037 | | 9,690 | | (1.9) | | | 3.6 | |
| ADVANCED | | | | | | | | | | |
| U.S. | | 1,838 | | 1,833 | | 1,784 | | 0.2 | | | 2.8 | |
| International | | 2,650 | | 2,837 | | 2,785 | | (6.6) | | | 1.9 | |
| Worldwide | | 4,488 | | 4,671 | | 4,569 | | (3.9) | | | 2.2 | |
| GENERAL | | | | | | | | | | |
| U.S. | | 2,165 | | 2,198 | | 2,113 | | (1.5) | | | 4.0 | |
| International | | 3,192 | | 3,168 | | 3,008 | | 0.8 | | | 5.3 | |
| Worldwide | | 5,358 | | 5,366 | | 5,121 | | (0.2) | | | 4.8 | |
| Vision | | | | | | | | | | |
| U.S. | | 2,128 | | 2,086 | | 1,990 | | 2.0 | | | 4.8 | |
| International | | 3,018 | | 2,986 | | 2,859 | | 1.1 | | | 4.5 | |
| Worldwide | | 5,146 | | 5,072 | | 4,849 | | 1.5 | | | 4.6 | |
| CONTACT LENSES / OTHER | | | | | | | | | | |
| U.S. | | 1,684 | | 1,626 | | 1,522 | | 3.6 | | | 6.8 | |
| International | | 2,049 | | 2,076 | | 2,022 | | (1.3) | | | 2.7 | |
| Worldwide | | 3,733 | | 3,702 | | 3,543 | | 0.8 | | | 4.5 | |
| SURGICAL | | | | | | | | | | |
| U.S. | | 444 | | 460 | | 468 | | (3.4) | | | (1.8) | |
| International | | 969 | | 910 | | 837 | | 6.5 | | | 8.6 | |
| Worldwide | | 1,413 | | 1,370 | | 1,306 | | 3.2 | | | 4.9 | |
| | | | | | | | | | | | | | | | | | | | | | | | | | | | | | | | |
| | | Sales to Customers | | % Change |
| (Dollars in Millions) | | 2024 | | 2023 | | 2022 | | ’24 vs. ’23 | | ’23 vs. ’22 |
| TOTAL MEDTECH | | | | | | | | | | |
| U.S. | | 16,332 | | 15,275 | | 13,377 | | 6.9 | | | 14.2 | |
| International | | 15,525 | | 15,125 | | 14,050 | | 2.6 | | | 7.7 | |
| Worldwide | | 31,857 | | 30,400 | | 27,427 | | 4.8 | | | 10.8 | |
| | | | | | | | | | |
| WORLDWIDE | | | | | | | | | | |
| | | | | | | | | | |
| U.S. | | 50,302 | | 46,444 | | 41,981 | | 8.3 | | | 10.6 | |
| International | | 38,519 | | 38,715 | | 38,009 | | (0.5) | | | 1.9 | |
| Worldwide | | $88,821 | | 85,159 | | 79,990 | | 4.3 | % | | 6.5 | |
* percentage greater than 100% or not meaningful
(1)Previously referred to as Interventional Solutions
(2)Acquired on December 22, 2022
(3)Acquired on May 31, 2024
| | | | | | | | | | | | | | | | | | | | | | | | | | | | | | | | |
| | Income Before Tax by Segment |
| (Dollars in Millions) | | 2024 (3) | 2023 (4) | 2022 (5) |
| | Innovative
Medicine | MedTech | Total | Innovative
Medicine | MedTech | Total | Innovative
Medicine | MedTech | Total |
| Sales to customers | | $56,964 | 31,857 | | 54,759 | 30,400 | | 52,563 | 27,427 | |
| Cost of products sold | | 14,036 | 13,345 | | 13,715 | 12,722 | | 14,066 | 10,397 | |
| Selling, marketing and administrative | | 10,906 | 10,812 | | 9,842 | 10,476 | | 9,714 | 9,537 | |
| Research and development expense | | 13,529 | 3,703 | | 11,963 | 3,122 | | 11,642 | 2,493 | |
Other segment items (1) | | (426) | 257 | | 993 | (589) | | 1,494 | 553 | |
| Segment income before tax | | $18,919 | 3,740 | 22,659 | 18,246 | 4,669 | 22,915 | 15,647 | 4,447 | 20,094 |
Less: Expense not allocated to segments (2) | | | | 5,972 | | | 7,853 | | | 735 |
| Worldwide total | | | | $16,687 | | | 15,062 | | | 19,359 |
| | | | | | | | | | | | | | | | | | | | | | |
| | | | | Identifiable Assets |
| (Dollars in Millions) | | | | | | | | 2024 | | 2023 |
| Innovative Medicine | | | | | | | | $57,070 | | 58,324 |
| MedTech | | | | | | | | 84,322 | | 74,710 |
| Total | | | | | | | | 141,392 | | 133,034 |
General corporate (6) | | | | | | | | 38,712 | | 34,524 |
| Worldwide total | | | | | | | | $180,104 | | 167,558 |
| | | | | | | | | | | | | | | | | | | | | | | | | | | | | | | | | | | | | | |
| | Additions to Property,
Plant & Equipment | | Depreciation and
Amortization |
| (Dollars in Millions) | | 2024 | | 2023 | | 2022 | | 2024 | | 2023 | | 2022 |
| Innovative Medicine | | $1,710 | | 1,653 | | 1,374 | | $3,760 | | 3,847 | | 3,687 |
| MedTech | | 2,443 | | 2,372 | | 2,120 | | 3,237 | | 2,943 | | 2,302 |
| Segments total | | 4,153 | | 4,025 | | 3,494 | | 6,997 | | 6,790 | | 5,989 |
| Discontinued operations | | — | | 162 | | 303 | | — | | 383 | | 641 |
| General corporate | | 271 | | 356 | | 212 | | 342 | | 313 | | 340 |
| Worldwide total | | $4,424 | | 4,543 | | 4,009 | | $7,339 | | 7,486 | | 6,970 |
| | | | | | | | | | | | | | | | | | | | | | | | | | | | | | | | |
| | | Sales to Customers | | Long-Lived Assets (7) |
| (Dollars in Millions) | | 2024 | | 2023 | | 2022 | | 2024 | | 2023 |
| United States | | $50,302 | | 46,444 | | 41,981 | | $70,670 | | 54,832 |
| Europe | | 20,212 | | 20,410 | | 20,664 | | 27,267 | | 31,616 |
| Western Hemisphere excluding U.S. | | 4,714 | | 4,549 | | 4,108 | | 1,728 | | 1,491 |
| Asia-Pacific, Africa | | 13,593 | | 13,756 | | 13,237 | | 1,454 | | 1,500 |
| Segments total | | 88,821 | | 85,159 | | 79,990 | | 101,119 | | 89,439 |
| General corporate | | | | | | | | 1,217 | | 1,192 |
| Other non long-lived assets | | | | | | | | 77,768 | | 76,927 |
| Worldwide total | | $88,821 | | 85,159 | | 79,990 | | $180,104 | | 167,558 |
See Note 1 for a description of the segments in which the Company operates.
Export sales are not significant. In fiscal year 2024, the Company utilized three wholesalers distributing products for both segments that represented approximately 20.5%, 15.6% and 12.3% of the total gross revenues. In fiscal year 2023, the Company had three wholesalers distributing products for both segments that represented approximately 18.2%, 15.1% and 14.2% of the total gross revenues. In fiscal year 2022, the Company had three wholesalers distributing products for all three segments that represented approximately 18.9%, 15.0%, and 13.8% of the total gross revenues.
(1)Other segment expenses for each reportable segment include charges related to other income and expenses, restructuring activities and impairment charges related to in-process research and development.
(2)Amounts not allocated to segments include interest (income)/expense and general corporate (income)/expense. The fiscal years 2024 and 2023 include charges for talc matters of approximately $5.1 billion and $7 billion, respectively (See Note 19, Legal proceedings, for additional details). The fiscal year 2024 includes a loss of approximately $0.4 billion related to the debt to equity exchange of the Company's remaining shares of Kenvue Common Stock. The fiscal year 2023 includes the unfavorable change in the fair value of the retained stake in Kenvue of approximately $0.4 billion.
(3)Innovative Medicine segment income before tax includes:
•Acquired in-process research & development expense of $1.25 billion to secure the global rights to the NM26 bispecific antibody (Yellow Jersey acquisition)
•Monetization of royalty rights of $0.3 billion
•Litigation expense of $0.3 billion primarily related to Risperdal Gynecomastia
•An intangible asset impairment charge of approximately $0.2 billion associated with the M710 (biosimilar) asset acquired as part of the acquisition of Momenta Pharmaceuticals in 2020.
•A restructuring related charge of $0.1 billion
•One-time COVID-19 Vaccine manufacturing exit related costs of $0.1 billion
•Favorable changes in the fair value of securities of $0.1 billion
MedTech segment income before tax includes:
•Acquisition and integration related costs of $1.0 billion primarily related to the acquisition of Shockwave
•Acquired in-process research and development expense of $0.5 billion from the V-Wave acquisition
•A gain of $0.2 billion related to the Acclarent divestiture
•A Medical Device Regulation charge of $0.2 billion
•A restructuring related charge of $0.2 billion
(4)Innovative Medicine segment income before tax includes:
•One-time COVID-19 Vaccine manufacturing exit related costs of $0.7 billion
•A restructuring related charge of $0.5 billion
•Unfavorable changes in the fair value of securities of $0.4 billion
•Favorable litigation related items of $0.1 billion
•Loss on divestiture of $0.2 billion.
•An intangible asset impairment charge of approximately $0.2 billion related to market dynamics associated with a non-strategic asset (M710) acquired as part of the acquisition of Momenta Pharmaceuticals in 2020.
MedTech segment income before tax includes:
•Acquired in-process research and development expense of $0.4 billion related to the Laminar acquisition in 2023
•A restructuring related charge of $0.3 billion
•Acquisition and integration related costs of $0.2 billion primarily related to the acquisition of Abiomed
•A Medical Device Regulation charge of $0.3 billion
•Income from litigation settlements of $0.1 billion
(5)Innovative Medicine segment income before tax includes:
•One-time COVID-19 Vaccine manufacturing exit related costs of $1.5 billion
•An intangible asset impairment charge of approximately $0.8 billion related to an in-process research and development asset, bermekimab (JnJ-77474462), an investigational drug for the treatment of Atopic Dermatitis (AD) and Hidradenitis Suppurativa (HS) acquired with the acquisition of XBiotech, Inc. in the fiscal year 2020. Additional information regarding efficacy of the AD and HS indications became available which led the Company to the decision to terminate the development of bermekimab for AD and HS
•Litigation expense of $0.1 billion
•Unfavorable changes in the fair value of securities of $0.7 billion
•A restructuring related charge of $0.1 billion
MedTech segment income before tax includes:
•Litigation expense of $0.6 billion primarily for pelvic mesh related costs
•A restructuring related charge of $0.3 billion
•Acquisition and integration related costs of $0.3 billion primarily related to the acquisition of Abiomed
•A Medical Device Regulation charge of $0.3 billion
(6) General corporate includes cash, cash equivalents, marketable securities and other corporate assets.
(7)Long-lived assets include property, plant and equipment, net for fiscal years 2024, and 2023 of $20,518 and $19,898, respectively, and intangible assets and goodwill, net for fiscal years 2024 and 2023 of $81,818 and $70,733, respectively.
18. Acquisitions and divestitures
Subsequent to the fiscal year end 2024, the Company announced it has entered into a definitive agreement to acquire Intra-Cellular Therapies, Inc. (Nasdaq: ITCI), a biopharmaceutical company focused on the development and commercialization of therapeutics for central nervous system (CNS) disorders, for $132.00 per share in cash for a total equity value of approximately $14.6 billion. The Company expects to fund the transaction through a combination of cash on hand and debt. The closing of the transaction is expected to occur later this year subject to applicable regulatory approvals, approval by Intra-Cellular Therapies’ stockholders and other customary closing conditions for a transaction of this type. The results of operations will be included in the Innovative Medicine segment beginning on the acquisition date.
Business combinations
Acquisitions of a business are accounted for as business combinations applying the acquisition method of accounting. Under this method, the assets acquired and liabilities assumed are recorded at their respective fair values as of the acquisition date in the Company’s consolidated financial statements. The excess of the purchase price over the fair value of the acquired net assets, where applicable, is recorded as goodwill. The results of operations of these acquisitions have been included in the Company’s financial statements from their respective dates of acquisition.
During the fiscal year 2024, certain businesses were acquired for $15.1 billion, net of cash acquired. The fiscal year 2024 acquisitions primarily included; Ambrx Biopharma, Inc., Shockwave Medical Inc., and Proteologix, Inc. The remaining acquisitions were not material.
On June 20, 2024, the Company completed the acquisition of Proteologix, Inc., a privately held biotechnology company focused on bispecific antibodies for immune-mediated diseases, for approximately $0.8 billion net of cash acquired, with potential for an additional milestone payment. The results of operations are included in the Innovative Medicine segment as of the acquisition date. The fair value of the acquisition was allocated to assets acquired of $1.2 billion, primarily non-amortizable intangible assets, inclusive of purchased IPR&D, for $0.9 billion, goodwill for $0.3 billion, and $0.3 billion of liabilities assumed which included $0.1 billion related to a contingent consideration. The preliminary purchase price allocation is subject to any subsequent valuation adjustments within the measurement period. A probability of success factor ranging from 30% to 45% was used in the fair value calculation to reflect inherent regulatory and commercial risk of the IPR&D. The discount rate applied was approximately 16%. The goodwill is primarily attributable to synergies expected to arise from the business acquisition and is not expected to be deductible for tax purposes. Acquisition related costs before tax for the fiscal 2024 were not material.
On May 31, 2024, the Company completed the acquisition of Shockwave Medical Inc. (SWAV)(Shockwave), a leading, first-to-market provider of innovative intravascular lithotripsy (IVL) technology for the treatment of calcified coronary artery disease (CAD) and peripheral artery disease (PAD) in an all-cash merger transaction. The Company acquired all the outstanding shares of Shockwave’s common stock for $335.00 per share through a merger of Shockwave with a subsidiary of the Company. The results of operations were included in the MedTech segment as of the acquisition date.
Details of the fair value amounts recognized for assets acquired and liabilities assumed as of the purchase date and at the end of fiscal year 2024, which includes measurement period adjustments, are included in the table below. As the acquisition occurred in May 2024, the Company is still finalizing the allocation of the purchase price to the individual assets acquired and liabilities assumed. The allocation of the purchase price included in the current period balance sheet is based on the best estimate of management and is preliminary and subject to change.
| | | | | | | | | | | | | | |
| (Dollars in Billions) | | May 31, 2024 | | December 29, 2024 |
| Assets acquired: | | | | |
| Cash | | $1.1 | | $1.1 |
| Goodwill | | 7.5 | | 7.6 |
| Amortizable intangibles | | 5.3 | | 5.3 |
| IPR&D | | 0.6 | | 0.6 |
| Inventory | | 0.5 | | 0.5 |
| Other assets | | 0.5 | | 0.4 |
| Total assets acquired | | $15.5 | | $15.5 |
| | | | |
| Liabilities assumed: | | | | |
| Deferred taxes | | $1.5 | | $1.5 |
| Notes payable* | | 1.0 | | 1.0 |
| Accrued liabilities** | | 0.4 | | 0.4 |
| Total liabilities assumed | | $2.9 | | $2.9 |
| | | | |
| Net assets acquired | | $12.6 | | $12.6 |
| | | | |
| Net assets acquired as of May 31, 2024 | | $12.6 | | |
| Less: Cash acquired | | 1.1 | | |
| Equity awards settled | | 0.6 | | |
| Settlement of Note payable* | | 1.0 | | |
| Total enterprise value as of June 30, 2024 | | $13.1 | | |
* Represents the convertible debt which was subsequently paid in the fiscal second quarter of 2024.
** Includes $0.2 billion of equity awards
The goodwill is primarily attributable to synergies expected to arise from the business acquisition and is not expected to be deductible for tax purposes. Acquisition related costs before tax for the fiscal 2024 were $0.9 billion of which $0.4 billion was related to the fair value of the inventory step-up and was recorded in Cost of products sold and $0.5 billion primarily related to equity awards and was recorded in Other (income) expense. The amortizable intangible assets were primarily comprised of already in-market CAD and PAD IVL products with the average weighted lives of 14 years. The IPR&D assets were valued for technology programs for unapproved products. The value of the IPR&D was calculated using a probability-adjusted cash flow projection discounted for the risk inherent in such projects with the weighted average probability of success factors of approximately 50%. The discount rate applied was 9.0%.
On March 7, 2024, the Company completed the acquisition of Ambrx Biopharma, Inc., (Ambrx), a clinical-stage biopharmaceutical company with a proprietary synthetic biology technology platform to design and develop next-generation antibody drug conjugates (ADCs), in an all-cash merger transaction for a total equity value of approximately $2.0 billion, or $1.8 billion net of cash acquired. The Company acquired all of the outstanding shares of Ambrx’s common stock for $28.00 per share through a merger of Ambrx with a subsidiary of the Company. The results of operations were included in the Innovative Medicine segment as of the acquisition date. The fair value of the acquisition was allocated to assets acquired of $2.3 billion, primarily non-amortizable intangible assets, inclusive of purchased IPR&D, for $1.9 billion, goodwill for $0.3 billion and liabilities assumed of $0.5 billion, which includes deferred taxes of $0.4 billion. The preliminary purchase price allocation is subject to any subsequent valuation adjustments within the measurement period. A probability of success factor ranging from 40% to
70% was used in the fair value calculation to reflect inherent regulatory and commercial risk of the IPR&D. The discount rate applied was approximately 17%. The goodwill is primarily attributable to synergies expected to arise from the business acquisition and is not expected to be deductible for tax purposes. Acquisition related costs before tax for the fiscal year 2024 were not material.
During the fiscal year 2023, the Company did not make any acquisitions that qualified as a business combination.
During the fiscal year 2022, certain businesses were acquired for $17.7 billion, net of cash acquired. The fiscal year 2022 acquisitions primarily included Abiomed, Inc. (Abiomed). The remaining acquisitions were not material.
On December 22, 2022, the Company completed the acquisition of Abiomed, a leading, first-to-market provider of cardiovascular medical technology with a first-in-kind portfolio for the treatment of coronary artery disease and heart failure which also has an extensive innovation pipeline of life-saving technologies. The transaction broadens the Company’s position as a growing cardiovascular innovator, advancing the standard of care in heart failure and recovery, one of healthcare’s largest areas of unmet need. The results of operations were included in the MedTech segment as of the date of the acquisition. The acquisition was completed through a tender offer for all outstanding shares. The consideration paid in the acquisition consisted of an upfront payment of $380.00 per share in cash, amounting to $17.1 billion, net of cash acquired, as well as a non-tradeable contingent value right (“CVR”) entitling the holder to receive up to $35.00 per share in cash (which with respect to the CVRs total approximately $1.6 billion in the aggregate) if certain commercial and clinical milestones are achieved. The corresponding enterprise value (without taking into account the CVRs) of approximately $16.5 billion includes cash, cash equivalents and marketable securities acquired.
The milestones of the CVR consist of:
a.$17.50 per share, payable if net sales for Abiomed products exceeds $3.7 billion during Johnson & Johnson’s fiscal second quarter of 2027 through fiscal first quarter of 2028, or if this threshold is not met during this period and is subsequently met during any rolling four quarter period up to the end of Johnson & Johnson’s fiscal first quarter of 2029, $8.75 per share;
b.$7.50 per share payable upon FDA premarket application approval of the use of Impella® products in ST-elevated myocardial infarction (STEMI) patients without cardiogenic shock by January 1, 2028; and
c.$10.00 per share payable upon the first publication of a Class I recommendation for the use of Impella® products in high risk PCI or STEMI with or without cardiogenic shock within four years from their respective clinical endpoint publication dates, but in all cases no later than December 31, 2029.
During the fiscal fourth quarter of 2023, the Company finalized the purchase price allocation. In fiscal 2023, there were purchase price allocation adjustments netting to approximately $0.2 billion with an offsetting increase to goodwill. The fair value of the acquisition was allocated to assets acquired of $20.1 billion (net of $0.3 billion cash acquired), primarily to goodwill for $11.1 billion, amortizable intangible assets for $6.6 billion, IPR&D for $1.1 billion, marketable securities of $0.6 billion and liabilities assumed of $3.0 billion, which includes the fair value of the contingent consideration mentioned above for $0.7 billion and deferred taxes of $2.0 billion. The goodwill is primarily attributable to the commercial acceleration and expansion of the portfolio and is not expected to be deductible for tax purposes. The contingent consideration was recorded in Other Liabilities and adjusted to fair value through the fiscal year end 2024 on the Consolidated Balance Sheet.
The amortizable intangible assets were primarily comprised of already in-market products of the Impella® platform with an average weighted life of 14 years. The IPR&D assets were valued for technology programs for unapproved products. The value of the IPR&D was calculated using probability-adjusted cash flow projections discounted for the risk inherent in such projects. The probability of success factor ranged from 52% to 70%. The discount rate applied was 9.5%.
In the fiscal years 2024, 2023 and 2022, the Company recorded acquisition related costs before tax of approximately $0.3 billion, $0.2 billion and $0.3 billion, which was primarily recorded in Other (income)/expense.
In accordance with U.S. GAAP standards related to business combinations, and goodwill and other intangible assets, supplemental pro forma information for fiscal years 2024, 2023 and 2022 is not provided, as the impact of the aforementioned acquisitions did not have a material effect on the Company’s results of operations.
Asset acquisitions
Acquired In-process research and development (IPR&D) in an asset acquisition is immediately expensed as research and development expense in the Company's consolidated financial statements. Milestone payments incurred prior to regulatory approval are expensed as research and development expense when the milestone event occurs.
The fiscal year 2024 asset acquisitions expensed as research and development included V-Wave Ltd. and the global rights to the NM26 bispecific antibody (Yellow Jersey acquisition). The remaining activity was not material.
On October 8, 2024, the Company completed the acquisition of V-Wave Ltd, a privately-held company focused on developing innovative treatment options for patients with heart failure, for an upfront payment of $0.6 billion, with the potential for additional regulatory and commercial milestone payments up to approximately $1.1 billion. The Company recorded an IPR&D charge of approximately $0.5 billion, net of a gain recorded on the Company's existing investment in V-Wave and the results of operations are included in the MedTech segment as of the acquisition date.
On July 11, 2024, the Company completed the acquisition of Yellow Jersey, a demerged subsidiary of Numab Therapeutics AG, to secure the global rights to NM26, a novel, investigational first-in-class bispecific antibody targeting two clinically proven pathways in atopic dermatitis (AD), in an all-cash transaction for approximately $1.25 billion. The Company recorded an IPR&D charge of approximately $1.25 billion, and the results of operations are included in the Innovative Medicine segment as of the acquisition date.
The fiscal year 2023 asset acquisitions expensed as research and development included Laminar Inc. The remaining activity was not material.
During the fiscal year 2023, the Company completed the acquisition of Laminar Inc., a privately-held medical device company focused on eliminating the left atrial appendage (LAA) in patients with non-valvular atrial fibrillation (AFib), for an upfront payment of $0.4 billion. The Company recorded an IPR&D charge of approximately $0.4 billion and the results of operations are included in the MedTech segment as of the acquisition date.
There were no significant asset acquisitions in 2022.
Divestitures
During the fiscal year 2024, the Company completed the divestiture of Acclarent resulting in approximately $0.3 billion in proceeds and the divestiture of Ponvory outside of the U.S. resulting in approximately $0.2 billion in proceeds. All other divestitures were not material.
During the fiscal year 2023, the Company executed divestitures resulting in approximately $0.2 billion in proceeds resulting in gains or losses that were not material. At fiscal year end 2023, the Company held assets, primarily intangibles, on its Consolidated Balance Sheet of approximately $0.3 billion, primarily related to Acclarent and Ponvory, that were subsequently divested in fiscal 2024.
During fiscal year 2022, the Company did not make any material divestitures.
19. Legal proceedings
Johnson & Johnson and certain of its subsidiaries are involved in various lawsuits and claims regarding product liability; intellectual property; commercial; indemnification and other matters; governmental investigations; and other legal proceedings that arise from time to time in the ordinary course of their business.
The Company records accruals for loss contingencies associated with these legal matters when it is probable that a liability will be incurred, and the amount of the loss can be reasonably estimated. As of December 29, 2024, the Company has determined that the liabilities associated with certain litigation matters are probable and can be reasonably estimated. The Company has accrued for these matters and will continue to monitor each related legal issue and adjust accruals as might be warranted based on new information and further developments in accordance with ASC 450-20-25. For these and other litigation and regulatory matters discussed below for which a loss is probable or reasonably possible, the Company is unable to estimate the possible loss or range of loss beyond the amounts accrued. Amounts accrued for legal contingencies often result from a complex series of judgments about future events and uncertainties that rely heavily on estimates and assumptions including timing of related payments. The ability to make such estimates and judgments can be affected by various factors including, among other things, whether damages sought in the proceedings are unsubstantiated or indeterminate; scientific and legal discovery has not commenced or is not complete; proceedings are in early stages; matters present legal uncertainties; there are significant facts in dispute; procedural or jurisdictional issues; the uncertainty and unpredictability of the number of
potential claims; ability to achieve comprehensive multi-party settlements; complexity of related cross-claims and counterclaims; and/or there are numerous parties involved. To the extent adverse awards, judgments or verdicts have been rendered against the Company, the Company does not record an accrual until a loss is determined to be probable and can be reasonably estimated.
In the Company’s opinion, based on its examination of these matters, its experience to date and discussions with counsel, the ultimate outcome of legal proceedings, net of liabilities accrued in the Company’s balance sheet, is not expected to have a material adverse effect on the Company’s financial position. However, the resolution of, or increase in accruals for, one or more of these matters in any reporting period may have a material adverse effect on the Company’s results of operations and cash flows for that period.
Matters concerning talc
A significant number of personal injury claims alleging that talc causes cancer have been asserted against the Company and its affiliates arising out of the use of body powders containing talc, primarily JOHNSON’S Baby Powder.
In talc cases that have gone to trial, the Company has obtained a number of defense verdicts, but there also have been verdicts against the Company, many of which have been reversed on appeal. In June 2020, the Missouri Court of Appeals reversed in part and affirmed in part a July 2018 verdict of $4.7 billion in Ingham v. Johnson & Johnson, et al., No. ED 207476 (Mo. App.), reducing the overall award to $2.1 billion. An application for transfer of the case to the Missouri Supreme Court was subsequently denied, and in June 2021, a petition for certiorari, seeking a review of the Ingham decision by the United States Supreme Court, was denied. In June 2021, the Company paid the award, which, including interest, totaled approximately $2.5 billion. The facts and circumstances, including the terms of the award, were unique to the Ingham decision and not representative of other claims brought against the Company. The Company continues to believe that it has strong legal grounds to contest the other talc verdicts that it has appealed. Notwithstanding the Company’s confidence in the safety of its talc products, in certain circumstances the Company has settled cases.
In June 2014, the Mississippi Attorney General filed a complaint against the Company alleging violation of the Mississippi Consumer Protection Act by failing to disclose alleged health risks associated with female consumers’ use of talc contained in JOHNSON’S Baby Powder and JOHNSON’S Shower to Shower (a product divested in 2012). The Company has reached an agreement to resolve this matter.
In January 2020, the State of New Mexico filed a consumer protection case alleging that the Company deceptively marketed and sold its talcum powder products by making misrepresentations about the safety of the products and the presence of carcinogens, including asbestos. The Company has reached an agreement to resolve this matter.
Forty-two states and the District of Columbia commenced a joint investigation into the Company’s marketing of its talcum powder products. In January 2024, the Company reached an agreement in principle with the multi-state group of state Attorneys General, subject to ongoing negotiation of non-monetary terms. In June 2024, the settlements were finalized.
In October 2021, Johnson & Johnson Consumer Inc. (Old JJCI) implemented a corporate restructuring (the 2021 Corporate Restructuring). As a result of that restructuring, Old JJCI ceased to exist and three new entities were created: (a) LTL Management LLC, a North Carolina limited liability company (LTL or Debtor); (b) Royalty A&M LLC, a North Carolina limited liability company and a direct subsidiary of LTL (RAM); and (c) the Debtor’s direct parent, Johnson & Johnson Consumer Inc., a New Jersey company (New JJCI). The Debtor received certain of Old JJCI’s assets and became solely responsible for the talc-related liabilities of Old JJCI, including all liabilities related in any way to injury or damage, or alleged injury or damage, sustained or incurred in the purchase or use of, or exposure to, talc, including talc contained in any product, or to the risk of, or responsibility for, any such damage or injury, except for any liabilities for which the exclusive remedy is provided under a workers’ compensation statute or act (the Talc-Related Liabilities).
In October 2021, notwithstanding the Company’s confidence in the safety of its talc products, the Debtor filed a voluntary petition with the United States Bankruptcy Court for the Western District of North Carolina, Charlotte Division, seeking relief under Chapter 11 of the Bankruptcy Code (the LTL Bankruptcy Case). All litigation against LTL, Old JJCI, New JJCI, the Company, other of their corporate affiliates, identified retailers, insurance companies, and certain other parties (the Protected Parties) was stayed. The LTL Bankruptcy Case was transferred to the United States Bankruptcy Court for the District of New Jersey. Claimants filed motions to dismiss the LTL Bankruptcy Case and, following a multiple day hearing, the New Jersey Bankruptcy Court denied those motions in March 2022.
The claimants subsequently filed notices of appeal as to the denial of the motions to dismiss the LTL Bankruptcy Case and the extension of the stay to the Protected Parties. On January 30, 2023, the Third Circuit reversed the Bankruptcy Court’s ruling and remanded to the Bankruptcy Court to dismiss the LTL bankruptcy.
In April 2023, the New Jersey Bankruptcy Court dismissed the LTL Bankruptcy Case, effectively lifting the stay as to all parties and returning the talc litigation to the tort system. LTL re-filed in the United States Bankruptcy Court for the District of New Jersey seeking relief under Chapter 11 of the Bankruptcy Code (the LTL 2 Bankruptcy Case). As a result of the new filing, all talc claims against LTL were again automatically stayed pursuant to section 362 of the Bankruptcy Code. Additionally, the New Jersey Bankruptcy Court issued a temporary restraining order staying all litigation as to LTL, Old JJCI, New JJCI, the Company, identified retailers, and certain other parties (the New Protected Parties).
Also in April 2023, the New Jersey Bankruptcy Court issued a decision that granted limited injunctive relief to the Company and the New Protected Parties (the LTL 2 Preliminary Injunction). The LTL 2 Preliminary Injunction remained in force until late August 2023, following the Bankruptcy Court’s extension of the initial LTL 2 Preliminary Injunction in June 2023. Under the LTL 2 Preliminary Injunction, except for those cases filed in the federal court ovarian cancer multi-district litigation, discovery in all personal injury and wrongful death matters was permitted to proceed.
Furthermore, in April 2023, the Talc Claimants' Committee filed a motion to dismiss the LTL 2 Bankruptcy followed by similar motions from other claimants. Hearings on the motions to dismiss occurred in June 2023. In July 2023, the court dismissed the LTL 2 Bankruptcy case and, the same day, the Company stated its intent to appeal the decision and to continue its efforts to obtain a resolution of the talc claims. In September 2023, the Bankruptcy Court entered an order granting LTL leave to seek a direct appeal to the Third Circuit Court of Appeals. In October 2023, the Third Circuit granted LTL’s petition for a direct appeal. In July 2024, the Third Circuit issued a non-precedential opinion affirming the Bankruptcy Court's decision to dismiss the LTL Bankruptcy case.
In October 2023, the Company stated that it was pursuing the following four parallel and alternative pathways to achieve a comprehensive and final resolution of the talc claims: (i) the appeal of the LTL 2 dismissal decision; (ii) pursuing a consensual “prepackaged” bankruptcy case, as “strongly encouraged” by the Bankruptcy Court in its dismissal decision; (iii) aggressively litigating the talc claims in the tort system; and (iv) pursuing affirmative claims against experts for false and defamatory narratives regarding the Company’s talc powder products. In December 2023, LTL changed its state of formation to Texas and its name to LLT Management LLC ("LLT").
Following the dismissal of LTL 2, new lawsuits were filed, cases across the country that had been stayed were reactivated, and trials have commenced. The majority of the cases are pending in federal court, organized in a multi-district litigation (MDL) in the United States District Court for the District of New Jersey. In the MDL, case-specific discovery proceeded. The MDL proceedings have been stayed by order of the bankruptcy court in the Red River Bankruptcy case discussed below. In March 2024, the court granted the Company's motion for a renewed Daubert hearing prior to the trial. The briefing on the renewed Daubert issues was completed in August 2024.
In May 2024, the Company commenced a three-month solicitation period of its proposed consensual “prepackaged” Chapter 11 bankruptcy plan (the “Proposed Plan”) for the comprehensive and final resolution of all current and future claims related to cosmetic talc in the United States, excluding claims related to mesothelioma or State consumer protection claims, in exchange for the payment by the Company of present value of approximately $6.475 billion payable over 25 years (nominal value of approximately $8.0 billion, discounted at a rate of 4.4%). The claims encompassed by the Proposed Plan constitute 99.75% of pending lawsuits against the Company relating to its talc powder products.
In August 2024, LLT engaged in a restructuring that resulted in the creation of three new Texas limited liability companies: (a) Red River Talc, LLC ("Red River"); (b) Pecos River Talc LLC ("Pecos River"); and (3) New Holdco (Texas) LLC. As a result of this restructuring, all claims related to ovarian and other gynecological cancers were separated and allocated to Red River, and mesothelioma, governmental unit and certain other claims were allocated to Pecos River.
In September 2024, while reiterating the Company's continued confidence in the safety of its talc products, Red River filed a voluntary petition with the United States Bankruptcy Court for the Southern District of Texas, seeking relief under Chapter 11 of the Bankruptcy Code (the Red River Bankruptcy Case), in furtherance of the Company's consensual "prepackaged" Proposed Plan. Red River also filed a motion for a temporary restraining order, seeking to extend the automatic stay to additional non-debtor entities. Prior to filing, the initial proposed plan was amended to, among other things, increase the proposed resolution by $1.75 billion.
Shortly after Red River filed its Chapter 11 petition, the U.S. Trustee's office filed a motion to transfer venue in the New Jersey Bankruptcy Court, and thereafter, a motion to transfer venue and a motion to dismiss in the Texas Bankruptcy Court. A coalition of six plaintiff law firms also filed a motion to transfer venue and a motion to dismiss in the Texas Bankruptcy Court. In September 2024, the Texas Bankruptcy Court entered a temporary order enjoining the commencement or prosecution of all claims against Red River and certain non-debtor entities, including the Company, until October 11, 2024. The temporary order was extended in October 2024 and again in December 2024. The commencement and prosecution of all claims against Red River and certain non-debtor entities are currently enjoined until March 15, 2025. Also in September 2024, the New Jersey Bankruptcy Court denied the U.S. Trustee's motion to transfer venue without prejudice. In October 2024, the Texas Bankruptcy Court denied the motion to transfer venue from Texas to New Jersey Bankruptcy Court. A consolidated hearing to address, among other things, the motions to dismiss and plan confirmation is currently scheduled to begin on February 18, 2025.
Mesothelioma and State consumer protection claims are being addressed outside the Proposed Plan. The Company separately has resolved 95% of the mesothelioma lawsuits filed to date and has resolved the State claims.
To account for these settlements and the contemplated comprehensive resolution through the Proposed Plan, the Company recorded a cumulative incremental charge of approximately $5.0 billion, through the fourth fiscal quarter 2024. As of December 29, 2024, the total present value of the reserve is approximately $11.6 billion (or nominal value of approximately $13.5 billion), net of payments made in fiscal 2024. Approximately ten percent of the reserve is recorded as a current liability. The recorded amount remains the Company's best estimate of probable loss.
In February 2019, the Company’s talc supplier, Imerys Talc America, Inc. and two of its affiliates, Imerys Talc Vermont, Inc. and Imerys Talc Canada, Inc. (collectively, Imerys) filed a voluntary petition for relief under Chapter 11 of the United States Code (the Bankruptcy Code) in the United States Bankruptcy Court for the District of Delaware (Imerys Bankruptcy). The Imerys Bankruptcy relates to Imerys’s potential liability for personal injury from exposure to talcum powder sold by Imerys. In its bankruptcy, Imerys alleges it has claims against the Company for indemnification and rights to joint insurance proceeds. In its bankruptcy, Imerys proposed a Chapter 11 plan (the Imerys Plan) that contemplated all talc-related claims against it being channeled to a trust along with its alleged indemnification rights against the Company. Following confirmation and consummation of the plan, the trust would pay talc claims pursuant to proposed trust distribution procedures (the TDP) and then seek indemnification from the Company.
In February 2021, Cyprus Mines Corporation (Cyprus), which had owned certain Imerys talc mines, filed a voluntary petition for relief under Chapter 11 of the Bankruptcy Code and filed its Disclosure Statement and Plan (the Cyprus Plan). The Cyprus Plan contemplates a settlement with Imerys and talc claimants where Cyprus would make a monetary contribution to a trust established under the Imerys Plan in exchange for an injunction against talc claims asserted against it and certain affiliated parties. Cyprus also asserts it has claims for indemnity against the Company arising out of talc personal injury claims. Under the Cyprus Plan, Cyprus would also contribute its alleged indemnification rights to the trust.
In September 2023, Imerys and Cyprus filed amended plans of reorganization. The amended plans contemplate a similar construct as the prior Imerys and Cyprus Plans, including all talc claims against Imerys and Cyprus (and certain other protected parties) being channeled to a trust along with Imerys’s and Cyprus’s alleged indemnification rights against the Company. The Company opposed both plans on the basis that the plans inflated Imerys’s and Cyprus’s liability for talc claims and had the potential effect of imposing those inflated liabilities on the Company through the Company’s alleged indemnification obligations.
In July 2024, the Company, Imerys, and Cyprus and certain of their affiliates (including their parent entities), and the tort claimants' committees and future claimants' representatives appointed in their respective Chapter 11 cases entered into a global settlement agreement (the Imerys Settlement Agreement) to resolve their ongoing disputes, including disputes raised in the Imerys and Cyprus bankruptcies. In August 2024, Imerys and Cyprus filed amended Chapter 11 plans and disclosure statements incorporating the terms of the settlement with the Company. In October 2024, the Imerys Bankruptcy Court entered an order approving the Imerys Settlement Agreement (the Settlement Order). The effectiveness of certain provisions of the settlement, including mutual releases, are subject to certain conditions, including the Imerys and Cyprus Plans being accepted by a sufficient number and amount of voting creditors to be confirmed under the Bankruptcy Code. Certain insurers have appealed the Settlement Order and sought a stay of the order pending appeal, which the Court denied on January 13, 2025. The briefing of the appeal in the District Court is scheduled to be completed in April 2025. On January 5, 2025, Imerys and Cyprus each filed a certification of voting results, indicating that their respective plan had been accepted by each voting class of creditors. A joint confirmation hearing for the plans is scheduled for April 2025.
In February 2018, a securities class action lawsuit was filed against the Company and certain named officers in the United States District Court for the District of New Jersey, alleging that the Company violated the federal securities laws by failing to disclose alleged asbestos contamination in body powders containing talc, primarily JOHNSON’S Baby Powder, and that purchasers of the Company’s shares suffered losses as a result. In April 2019, the Company moved to dismiss the complaint. In December 2019, the Court denied, in part, the motion to dismiss. The case was stayed in May 2022 pursuant to the LTL Bankruptcy Case and was reopened in May 2023. In December 2023, the Court granted Plaintiff’s motion for class certification. In January 2024, Defendants filed a petition with the Third Circuit under Federal Rule of Civil Procedure 23(f) for permission to appeal the Court’s order granting class certification, and in February 2024, the Third Circuit granted Defendants' petition. In February 2024, fact discovery closed, the Court ordered the parties to mediate, and stayed the case pending mediation. In May 2024, the parties participated in an unsuccessful mediation. In June 2024, at the parties' request, the Court lifted the stay for certain limited discovery, but otherwise kept the stay in place pending a decision from the Third Circuit on the 23(f) petition. Briefing on the 23(f) petition was completed in September 2024. In January 2025, the Third Circuit listed the appeal for oral argument in March 2025.
Matters concerning opioids
Beginning in 2014 and continuing to the present, the Company and Janssen Pharmaceuticals, Inc. (JPI), along with other pharmaceutical companies, have been named in close to 3,500 lawsuits related to the marketing of opioids, including DURAGESIC, NUCYNTA and NUCYNTA ER. Similar lawsuits have also been filed by private plaintiffs and organizations, including but not limited to the following: individual plaintiffs on behalf of children born with Neonatal Abstinence Syndrome (NAS); hospitals; and health insurers/payors.
To date, the Company and JPI have litigated two of the cases to judgment and have prevailed in both, either at trial or on appeal.
In July 2021, the Company announced finalization of an agreement to settle the state and subdivision claims for up to $5.0 billion. Approximately 70% of the all-in settlement was paid by the end of fiscal fourth quarter 2024. A few government entities opted out of the settlement. In September 2024, the Company reached an agreement to resolve the hospital cases.
The Company and JPI continue to defend the cases brought by the remaining government entity litigants as well as the cases brought by private litigants. In total, there are approximately 35 remaining opioid cases against the Company and JPI in various state courts, 390 remaining cases in the Ohio multi-district litigation (MDL), and 4 additional cases in other federal courts.
In addition, the Province of British Columbia filed suit against the Company and its Canadian affiliate Janssen Inc., and many other industry members, in Canada. That action was certified as an opt in class action on behalf of other provincial/territorial and the federal governments in Canada in January 2025. Additional proposed class actions have been filed in Canada against the Company and Janssen Inc., and many other industry members, by and on behalf of people who used opioids (for personal injuries), municipalities and First Nations bands. The proposed class action in Quebec on behalf of residents diagnosed with opioid use disorder was authorized to proceed against Janssen Inc. and other industry members in April 2024; and leave to appeal was denied in October 2024.
Starting in November 2019, a series of shareholder derivative complaints were filed against the Company as the nominal defendant and certain current and former directors and officers as defendants in the Superior Court of New Jersey. The complaint alleges breaches of fiduciary duties related to the marketing of opioids, and that the Company has suffered damages as a result of those alleged breaches. As of September 2024, all the complaints had been dismissed, and all appeals exhausted.
Product liability
The Company and certain of its subsidiaries are involved in numerous product liability claims and lawsuits involving multiple products. Claimants in these cases seek substantial compensatory and, where available, punitive damages. While the Company believes it has substantial defenses, it is not feasible to predict the ultimate outcome of litigation. From time to time, even if it has substantial defenses, the Company considers isolated settlements based on a variety of circumstances. The Company has accrued for these matters and will continue to monitor each related legal issue and adjust accruals as might be warranted based on new information and further developments in accordance with ASC 450-20-25, Contingencies. The Company accrues an estimate of the legal defense costs needed to defend each matter when those costs are probable and can be reasonably estimated. For certain of these matters, the Company has accrued additional amounts such as estimated costs associated with settlements, damages and other losses. Product liability accruals can represent projected product liability for thousands of claims around the world, each in different litigation environments and with different fact patterns. Changes to the accruals may be required in the future as additional information becomes available.
The table below contains the most significant of these cases and provides the approximate number of plaintiffs in the United States with direct claims in pending lawsuits regarding injuries allegedly due to the relevant product or product category as of December 29, 2024:
| | | | | | | | |
| Product or product category | | Number of plaintiffs |
| Body powders containing talc, primarily JOHNSON’S Baby Powder | | 62,830 | |
| DePuy ASR XL Acetabular System and DePuy ASR Hip Resurfacing System | | 60 | |
| PINNACLE Acetabular Cup System | | 910 | |
| Pelvic meshes | | 5,990 | |
| ETHICON PHYSIOMESH Flexible Composite Mesh | | 130 | |
| RISPERDAL | | 7 | |
| ELMIRON | | 2,170 | |
The number of pending lawsuits is expected to fluctuate as certain lawsuits are settled or dismissed and additional lawsuits are filed. There may be additional claims that have not yet been filed.
MedTech
DePuy ASR XL Acetabular System and ASR Hip Resurfacing System
In August 2010, DePuy Orthopaedics, Inc. (DePuy) announced a worldwide voluntary recall of its ASR XL Acetabular System and DePuy ASR Hip Resurfacing System (ASR Hip) used in hip replacement surgery. Claims for personal injury have been made against DePuy and the Company. Cases filed in federal courts in the United States have been organized as a multi-district litigation in the United States District Court for the Northern District of Ohio. Litigation has also been filed in countries outside of the United States, primarily in the United Kingdom, Ireland, India and Italy. In November 2013, DePuy reached an agreement with a Court-appointed committee of lawyers representing ASR Hip plaintiffs to establish a program to settle claims with eligible ASR Hip patients in the United States. This settlement program has resolved more than 10,000 claims, thereby bringing to resolution significant ASR Hip litigation activity in the United States. However, lawsuits in the United States remain, and the settlement program does not address litigation outside of the United States. The Company continues to receive information with respect to potential additional costs associated with this recall on a worldwide basis. The Company has established accruals for the costs associated with the United States settlement program and ASR Hip-related product liability litigation.
DePuy PINNACLE Acetabular Cup System
Claims for personal injury have also been made against DePuy Orthopaedics, Inc. and the Company (collectively, DePuy) relating to the PINNACLE Acetabular Cup System used in hip replacement surgery. Product liability lawsuits continue to be filed, and the Company continues to receive information with respect to potential costs and the anticipated number of cases. Most cases filed in federal courts in the United States have been organized as a multi-district litigation in the United States District Court for the Northern District of Texas (Texas MDL). Beginning on June 1, 2022, the Judicial Panel on Multidistrict Litigation ceased transfer of new cases into the Texas MDL, and there are now cases pending in federal court outside the Texas MDL. Litigation also has been filed in state courts and in countries outside of the United States. During the first quarter of 2019, DePuy established a United States settlement program to resolve these cases. As part of the settlement program, adverse verdicts have been settled. The Company has established an accrual for product liability litigation associated with the PINNACLE Acetabular Cup System and the related settlement program.
Ethicon Pelvic Mesh
Claims for personal injury have been made against Ethicon, Inc. (Ethicon) and the Company arising out of Ethicon’s pelvic mesh devices used to treat stress urinary incontinence and pelvic organ prolapse. The Company continues to receive information with respect to potential costs and additional cases. Cases filed in federal courts in the United States had been organized as a multi-district litigation (MDL) in the United States District Court for the Southern District of West Virginia. In March 2021, the MDL Court entered an order closing the MDL. The MDL Court has remanded cases for trial to the jurisdictions where the case was originally filed and additional pelvic mesh lawsuits have been filed, and remain, outside of the MDL. The Company has settled or otherwise resolved the majority of the United States cases and the estimated costs associated with these settlements and the remaining cases are reflected in the Company’s accruals. In addition, class actions and individual personal injury cases or claims seeking damages for alleged injury resulting from Ethicon’s pelvic mesh devices have been commenced in
various countries outside of the United States, including claims and cases in the United Kingdom, the Netherlands, and Ireland, and class actions in Israel, Australia, Canada and South Africa. The vast majority of these actions are now resolved. The Company has established accruals with respect to product liability litigation associated with Ethicon’s pelvic mesh products.
Ethicon Physiomesh
Following a June 2016 worldwide market withdrawal of Ethicon Physiomesh Flexible Composite Mesh (Physiomesh), claims for personal injury have been made against Ethicon, Inc. (Ethicon) and the Company alleging personal injury arising out of the use of this hernia mesh device. Cases filed in federal courts in the United States have been organized as a multi-district litigation (MDL) in the United States District Court for the Northern District of Georgia. A multi-county litigation (MCL) also has been formed in New Jersey state court and assigned to Atlantic County for cases pending in New Jersey. In addition to the matters in the MDL and MCL, there are additional lawsuits pending in the United States District Court for the Southern District of Ohio, which are part of the MDL for polypropylene mesh devices manufactured by C.R. Bard, Inc., and lawsuits pending in two New Jersey MCLs formed for Proceed/Proceed Ventral Patch and Prolene Hernia systems, and lawsuits pending outside the United States. In May 2021, Ethicon and lead counsel for the plaintiffs entered into a term sheet to resolve approximately 3,600 Physiomesh cases (covering approximately 4,300 plaintiffs) pending in the MDL and MCL at that time. A master settlement agreement (MSA) was entered into in September 2021 and includes 3,729 cases in the MDL and MCL. Other than a small number of cases still pending in the MDL, all Physiomesh matters in the United States have been resolved or are undergoing formal review for purposes of settlement.
Claims have also been filed against Ethicon and the Company alleging personal injuries arising from the PROCEED Mesh and PROCEED Ventral Patch hernia mesh products. In March 2019, the New Jersey Supreme Court entered an order consolidating these cases pending in New Jersey as an MCL in Atlantic County Superior Court. Additional cases have been filed in various federal and state courts in the United States, and in jurisdictions outside the United States.
Ethicon and the Company also have been subject to claims for personal injuries arising from the PROLENE Polypropylene Hernia System. In January 2020, the New Jersey Supreme Court created an MCL in Atlantic County Superior Court to handle such cases. Cases involving this product have also been filed in other federal and state courts in the United States.
In October 2022, an agreement in principle, subject to various conditions, was reached to settle the majority of the pending cases involving Proceed, Proceed Ventral Patch, Prolene Hernia System and related multi-layered mesh products, as well as a number of unfiled claims. All litigation activities in the two New Jersey MCLs are stayed pending effectuation of the proposed settlement. Future cases that are filed in the New Jersey MCLs will be subject to docket control orders requiring early expert reports and discovery requirements.
The Company has established accruals with respect to product liability litigation associated with Ethicon Physiomesh Flexible Composite Mesh, PROCEED Mesh and PROCEED Ventral Patch, and PROLENE Polypropylene Hernia System products.
Innovative Medicine
RISPERDAL
Claims for personal injury have been made against Janssen Pharmaceuticals, Inc. and the Company arising out of the use of RISPERDAL, and related compounds, indicated for the treatment of schizophrenia, acute manic or mixed episodes associated with bipolar I disorder and irritability associated with autism. Lawsuits primarily have been filed in state courts in Pennsylvania, California, and Missouri. Other actions are pending in various courts in the United States and Canada. The Company continues to defend RISPERDAL product liability lawsuits, and continues to evaluate potential costs related to those claims. The Company has successfully defended a number of these cases but there have been verdicts against the Company, including a verdict in October 2019 of $8.0 billion of punitive damages related to one plaintiff, which the trial judge reduced to $6.8 million in January 2020. In September 2021, the Company entered into a settlement in principle with the counsel representing plaintiffs in this matter and in substantially all of the outstanding cases in the United States. The costs associated with this and other settlements are reflected in the Company's accruals.
ELMIRON
Claims for personal injury have been made against a number of Johnson & Johnson companies, including Janssen Pharmaceuticals, Inc. and the Company, arising out of the use of ELMIRON, a prescription medication indicated for the relief of bladder pain or discomfort associated with interstitial cystitis. These lawsuits, which allege that ELMIRON contributes to the development of permanent retinal injury and vision loss, have been filed in both state and federal courts across the United States. In December 2020, lawsuits filed in federal courts in the United States, including putative class action cases seeking medical monitoring, were organized as a multi-district litigation in the United States District Court for the District of New
Jersey (MDL). In addition, cases have been filed in various state courts of New Jersey, which have been coordinated in a multi-county litigation in Bergen County, as well as the Court of Common Pleas in Philadelphia, which have been coordinated and granted mass tort designation. In addition, three class action lawsuits have been filed in Canada. The Company continues to defend ELMIRON product liability lawsuits and continues to evaluate potential costs related to those claims. All U.S. based ELMIRON matters have been resolved or are undergoing formal review for purposes of settlement. The Company has established accruals for defense and indemnity costs associated with ELMIRON related product liability litigation.
Intellectual property
Certain subsidiaries of the Company are subject, from time to time, to legal proceedings and claims related to patent, trademark and other intellectual property matters arising out of their businesses. Many of these matters involve challenges to the scope and/or validity of patents that relate to various products and allegations that certain of the Company’s products infringe the intellectual property rights of third parties. Although these subsidiaries believe that they have substantial defenses to these challenges and allegations with respect to all significant patents, there can be no assurance as to the outcome of these matters. A loss in any of these cases could adversely affect the ability of these subsidiaries to sell their products, result in loss of sales due to loss of market exclusivity, require the payment of past damages and future royalties, and may result in a non-cash impairment charge for any associated intangible asset.
Innovative Medicine - litigation against filers of abbreviated new drug applications (ANDAs)
The Company’s subsidiaries have brought lawsuits against generic companies that have filed ANDAs with the U.S. FDA (or similar lawsuits outside of the United States) seeking to market generic versions of products sold by various subsidiaries of the Company prior to expiration of the applicable patents covering those products. These lawsuits typically include allegations of non-infringement and/or invalidity of patents listed in FDA’s publication “Approved Drug Products with Therapeutic Equivalence Evaluations” (commonly known as the Orange Book). In each of these lawsuits, the Company’s subsidiaries are seeking an order enjoining the defendant from marketing a generic version of a product before the expiration of the relevant patents (Orange Book Listed Patents). In the event the Company’s subsidiaries are not successful in an action, or any automatic statutory stay expires before the court rulings are obtained, the generic companies involved would have the ability, upon regulatory approval, to introduce generic versions of their products to the market, resulting in the potential for substantial market share and revenue losses for the applicable products, and which may result in a non-cash impairment charge in any associated intangible asset. In addition, from time to time, the Company’s subsidiaries may settle these types of actions and such settlements can involve the introduction of generic versions of the products at issue to the market prior to the expiration of the relevant patents.
The Inter Partes Review (IPR) process with the United States Patent and Trademark Office (USPTO), created under the 2011 America Invents Act, is also being used at times by generic companies in conjunction with ANDAs and lawsuits to challenge the applicable patents.
XARELTO
Beginning in March 2021, Janssen Pharmaceuticals, Inc.; Bayer Pharma AG; Bayer AG; and Bayer Intellectual Property GmbH filed patent infringement lawsuits in United States district courts against generic manufacturers who have filed ANDAs seeking approval to market generic versions of XARELTO before expiration of certain Orange Book Listed Patents. The following entities are named defendants: Dr. Reddy’s Laboratories, Inc.; Dr. Reddy’s Laboratories, Ltd.; Lupin Limited; Lupin Pharmaceuticals, Inc.; Taro Pharmaceutical Industries Ltd.; Taro Pharmaceuticals U.S.A., Inc.; Teva Pharmaceuticals USA, Inc.; Mylan Pharmaceuticals Inc.; Mylan Inc.; Mankind Pharma Limited; Apotex Inc.; Apotex Corp.; Auson Pharmaceuticals Inc.; Shanghai Auson Pharmaceuticals Co. Ltd.; Cipla Ltd.; Cipla USA Inc.; InvaGen Pharmaceuticals, Inc.; Prinston Pharmaceuticals, Inc.; Ascent Pharmaceuticals, Inc.; and Hetero Labs Limited. In October 2024, the Company entered into a confidential settlement agreement with Auson Pharmaceuticals Inc. and Shanghai Auson Pharmaceuticals Co., Ltd. and the case was dismissed. In November 2024, the Company entered into confidential settlement agreements with Ascent Pharmaceuticals Inc. that resulted in dismissal of litigation against Ascent Pharmaceuticals, Inc. and Hetero Labs Limited. In January 2025, the Company entered into a confidential settlement agreement with Prinston Pharmaceutical, Inc. (as to U.S. Patent No. 9,539,218). The following U.S. patents are included in one or more cases: 9,539,218 and 10,828,310.
U.S. Patent No. 10,828,310 was also under consideration by the USPTO in an IPR proceeding. In July 2023, the USPTO issued a final written decision finding the claims of the patent invalid. In September 2023, Bayer Pharma AG filed an appeal to the U.S. Court of Appeals for the Federal Circuit.
INVEGA SUSTENNA
Beginning in January 2018, Janssen Pharmaceutica NV and Janssen Pharmaceuticals, Inc. filed patent infringement lawsuits in United States district courts against generic manufacturers who have filed ANDAs seeking approval to market generic versions of INVEGA SUSTENNA before expiration of the Orange Book Listed Patent. The following entities are named defendants: Teva Pharmaceuticals USA, Inc.; Mylan Laboratories Limited; Pharmascience Inc.; Mallinckrodt PLC; Specgx LLC; Tolmar, Inc.; Accord Healthcare, Inc.; Qilu Pharmaceutical Co. Ltd.; and Qilu Pharma Inc. The following U.S. patent is included in one or more cases: 9,439,906. In October 2020, the district court issued a decision in the case against Teva Pharmaceuticals USA, Inc., finding that United States Patent No. 9,439,906 is not invalid. Teva previously stipulated to infringement. Teva appealed the decision, and, in April 2024, the United States Court of Appeals for the Federal Circuit vacated and remanded the case to the district court for further proceedings. In November 2024, the district court issued its decision on remand, finding that United States Patent No. 9,439,906 is not invalid. Teva appealed to the Court of Appeals for the Federal Circuit, and oral argument is scheduled for April 2025. In February 2024, the district court issued a decision in the case against Tolmar Inc. finding that United States Patent No. 9,439,906 is not invalid. Tolmar previously stipulated to infringement. Tolmar has appealed the decision.
Beginning in February 2018, Janssen Inc. and Janssen Pharmaceutica NV initiated a Statement of Claim under Section 6 of the Patented Medicines (Notice of Compliance) Regulations against generic manufacturers who have filed ANDSs seeking approval to market generic versions of INVEGA SUSTENNA before expiration of the listed patent. The following entities are named defendants: Pharmascience Inc. and Apotex Inc. The following Canadian patent is included in one or more cases: 2,655,335. In June 2024, the Supreme Court dismissed the Apotex case. In September 2024, the Supreme Court granted Pharmascience's motion to appeal the Federal Court's decision that the 2,655,335 Patent is not invalid.
INVEGA TRINZA
Beginning in September 2020, Janssen Pharmaceuticals, Inc., Janssen Pharmaceutica NV, and Janssen Research & Development, LLC filed patent infringement lawsuits in United States district courts against generic manufacturers who have filed ANDAs seeking approval to market generic versions of INVEGA TRINZA before expiration of the Orange Book Listed Patent. The following entities are named defendants: Mylan Laboratories Limited; Mylan Pharmaceuticals Inc.; and Mylan Institutional LLC. The following U.S. patent is included in one or more cases: 10,143,693. In May 2023, the District Court issued a decision finding that Mylan’s proposed generic product infringes the asserted patent and that the patent is not invalid. Mylan has appealed the decision. Oral argument before the Court of Appeals for the Federal Circuit was held in February 2025.
SYMTUZA
Beginning in November 2021, Janssen Products, L.P., Janssen Sciences Ireland Unlimited Company, Gilead Sciences, Inc. and Gilead Sciences Ireland UC filed patent infringement lawsuits in United States district courts against generic manufacturers who have filed ANDAs seeking approval to market generic versions of SYMTUZA before expiration of certain Orange Book Listed Patents. The following entities are named defendants: Lupin Limited; Lupin Pharmaceuticals, Inc.; MSN Laboratories Private Ltd.; MSN Life Sciences Private Ltd.; MSN Pharmaceuticals Inc.; Apotex Inc.; and Apotex Corp. The following U.S. patents are included in one or more cases: 10,039,718 and 10,786,518. A trial is scheduled to begin in February 2025.
ERLEADA
Beginning in May 2022, Aragon Pharmaceuticals, Inc., Janssen Biotech, Inc. (collectively, Janssen), Sloan Kettering Institute for Cancer Research (SKI) and The Regents of the University of California filed patent infringement lawsuits in United States district courts against generic manufacturers who have filed ANDAs seeking approval to market generic versions of ERLEADA before expiration of certain Orange Book Listed Patents. The following entities are named defendants: Zydus Worldwide DMCC; Zydus Pharmaceuticals (USA), Inc.; Zydus Lifesciences Limited; Hetero Labs Limited Unit V; and Hetero USA, Inc. The following U.S. patents are included in one or more cases: 9,481,663; 9,884,054; 10,052,314 (which reissued as RE49,353); 10,702,508; 10,849,888; 8,445,507; 8,802,689; 9,388,159; 9,987,261; RE49,353; and 11,963,952. In October 2024, Janssen, The Regents of the University of California, SKI, Hetero Labs Limited Unit V, and Hetero USA, Inc. entered into a confidential settlement, and the case was dismissed. In November 2024, Janssen, The Regents of the University of California, Zydus Worldwide DMCC, Zydus Pharmaceuticals (USA), Inc., and Zydus Lifesciences Limited entered into confidential settlements, and the cases were dismissed.
SPRAVATO
Beginning in May 2023, Janssen Pharmaceuticals, Inc. and Janssen Pharmaceutica NV filed patent infringement lawsuits in United States district courts against generic manufacturers who have filed ANDAs seeking approval to market generic versions of SPRAVATO before expiration of certain Orange Book Listed Patents. The following entities are named defendants: Sandoz
Inc.; Hikma Pharmaceuticals Inc. USA; Hikma Pharmaceuticals PLC; and Alkem Laboratories Ltd. The following U.S. patents are included in one or more cases: 10,869,844; 11,173,134; 11,311,500; and 11,446,260.
INVOKANA
Beginning in January 2024, Janssen Inc. and Mitsubishi Tanabe Pharma Corporation initiated Statements of Claim under Section 6 of the Patented Medicines (Notice of Compliance) Regulations against generic manufacturers who filed ANDSs seeking approval to market generic versions of INVOKANA before expiration of the listed patents. The following entities are named defendants: Jamp Pharma Corporation and Apotex Inc. The following Canadian patents are included in one or more cases: 2,534,024 and 2,671,357. Trial in the Jamp action is scheduled for September 2025, and trial in the Apotex action is scheduled for December 2025.
MedTech
In March 2016, Abiomed, Inc. (Abiomed) filed a declaratory judgment action against Maquet Cardiovascular LLC (Maquet) in U.S. District Court for the District of Massachusetts seeking a declaration that the Impella does not infringe certain Maquet patents, currently U.S. Patent Nos. 7,022,100 (’100); 8,888,728; 9,327,068; 9,545,468; 9,561,314; and 9,597,437. Maquet counterclaimed for infringement of each of those patents. After claim construction, Maquet alleged infringement of only the ’100 patent. In September 2021, the court granted Abiomed’s motion for summary judgment of non-infringement of the ’100 patent, and in September 2023, the district court entered final judgment in favor of Abiomed on all patents-in-suit. Maquet appealed.
Government proceedings
Like other companies in the pharmaceutical and medical technologies industries, the Company and certain of its subsidiaries are subject to extensive regulation by national, state and local government agencies in the United States and other countries in which they operate. Such regulation has been the basis of government investigations and litigations. The most significant litigation brought by, and investigations conducted by, government agencies are listed below. It is possible that criminal charges and substantial fines and/or civil penalties or damages could result from government investigations or litigation.
MedTech
In July 2018, the Public Prosecution Service in Rio de Janeiro and representatives from the Brazilian antitrust authority CADE inspected the offices of more than 30 companies including Johnson & Johnson do Brasil Indústria e Comércio de Produtos para Saúde Ltda. The authorities appear to be investigating allegations of possible anti-competitive behavior and possible improper payments in the medical device industry. The Company continues to respond to inquiries regarding the Foreign Corrupt Practices Act from the United States Department of Justice (DOJ) and the United States Securities and Exchange Commission. The Company has been informed DOJ has closed its investigation.
In July 2023, the DOJ issued Civil Investigative Demands to the Company, Johnson & Johnson Surgical Vision, Inc., and Johnson & Johnson Vision Care, Inc. (collectively, J&J Vision) in connection with a civil investigation under the False Claims Act relating to free or discounted intraocular lenses and equipment used in eye surgery, such as phacoemulsification and laser systems. J&J Vision has begun producing documents and information responsive to the Civil Investigative Demands. J&J Vision is in ongoing discussions with the DOJ regarding its inquiry.
Innovative Medicine
In July 2016, the Company and Janssen Products, LP were served with a qui tam complaint pursuant to the False Claims Act filed in the United States District Court for the District of New Jersey alleging the off-label promotion of two HIV products, PREZISTA and INTELENCE, and anti-kickback violations in connection with the promotion of these products. The complaint was filed under seal in December 2012. The federal and state governments have declined to intervene, and the lawsuit is being prosecuted by the relators. The Court denied summary judgment on all claims in December 2021. Daubert motions were granted in part and denied in part in January 2022, and trial commenced in May 2024. On June 13, 2024, a jury found no liability regarding the anti-kickback violations but found liability for a portion of the off-label promotion claims. The Company is pursuing post-trial briefing challenging the verdict on the off-label claims.
In March 2017, Janssen Biotech, Inc. (JBI) received a Civil Investigative Demand from the United States Department of Justice regarding a False Claims Act investigation concerning management and advisory services provided to rheumatology and gastroenterology practices that purchased REMICADE or SIMPONI ARIA. In August 2019, the United States Department of Justice notified JBI that it was closing the investigation. Subsequently, the United States District Court for the District of Massachusetts unsealed a qui tam False Claims Act complaint, which was served on the Company. The Department of Justice
had declined to intervene in the qui tam lawsuit in August 2019. The Company filed a motion to dismiss, which was granted in part and denied in part. Discovery is underway.
General litigation
The Company or its subsidiaries are also parties to various proceedings brought under the Comprehensive Environmental Response, Compensation, and Liability Act, commonly known as Superfund, and comparable state, local or foreign laws in which the primary relief sought is the Company’s agreement to implement remediation activities at designated hazardous waste sites or to reimburse the government or third parties for the costs they have incurred in performing remediation as such sites.
In October 2017, certain United States service members and their families brought a complaint against a number of pharmaceutical and medical devices companies, including Johnson & Johnson and certain of its subsidiaries in United States District Court for the District of Columbia, alleging that the defendants violated the United States Anti-Terrorism Act. The complaint alleges that the defendants provided funding for terrorist organizations through their sales practices pursuant to pharmaceutical and medical device contracts with the Iraqi Ministry of Health. In July 2020, the District Court dismissed the complaint. In January 2022, the United States Court of Appeals for the District of Columbia Circuit reversed the District Court’s decision. In June 2023, defendants filed a petition for a writ of certiorari to the United States Supreme Court. In June 2024, the Supreme Court vacated the D.C. Circuit's decision and remanded the case to the D.C. Circuit. Oral argument was held in November 2024.
In February 2024, a putative class action was filed against the Company, the Pension & Benefits Committee of Johnson & Johnson (Committee), and certain named officers and employees, in United States District Court for the District of New Jersey. In May 2024, the plaintiff filed an amended complaint against the Company and the Committee. The complaint alleges that defendants breached fiduciary duties under the Employee Retirement Income Security Act (ERISA) by allegedly mismanaging the Company’s prescription-drug benefits program. The complaint seeks damages and other relief. In January 2025, the Court granted in part and denied in part defendants’ motion to dismiss.
MedTech
In October 2020, Fortis Advisors LLC (Fortis), in its capacity as representative of the former stockholders of Auris Health Inc. (Auris), filed a complaint against the Company, Ethicon Inc., and certain named officers and employees (collectively, Ethicon) in the Court of Chancery of the State of Delaware. The complaint alleges breach of contract, fraud, and other causes of action against Ethicon in connection with Ethicon’s acquisition of Auris in 2019. The complaint seeks damages and other relief. In December 2021, the Court granted in part and denied in part defendants’ motion to dismiss certain causes of action. All claims against the individual defendants were dismissed. The trial occurred in January 2024. In September 2024, the court found liability with respect to certain claims and no liability with respect to other claims. The Company has appealed the decision.
In October 2019, Innovative Health, LLC filed a complaint against Biosense Webster, Inc (BWI) in the United States District Court for the Central District of California. The complaint alleges that certain of BWI's business practices and contractual terms violate the antitrust laws of the United States and the State of California by restricting competition in the sale of High Density Mapping Catheters and Ultrasound Catheters. Trial is scheduled for April 2025.
Innovative Medicine
In June 2019, the United States Federal Trade Commission (FTC) issued a Civil Investigative Demand to the Company and Janssen Biotech, Inc. (collectively, Janssen) in connection with its investigation of whether Janssen’s REMICADE contracting practices violate federal antitrust laws. The Company has produced documents and information responsive to the Civil Investigative Demand. Janssen is in ongoing discussions with the FTC staff regarding its inquiry.
In February 2022, the United States Federal Trade Commission (FTC) issued Civil Investigative Demands to Johnson & Johnson and Janssen Biotech, Inc. (collectively, Janssen) in connection with its investigation of whether advertising practices for REMICADE violate federal law. Janssen has produced documents and information responsive to the Civil Investigative Demands. In January 2025, the FTC Bureau of Consumer Protection informed Janssen that it was closing its investigation.
In October 2018, two separate putative class actions were filed against Actelion Pharmaceutical Ltd., Actelion Pharmaceuticals U.S., Inc., and Actelion Clinical Research, Inc. (collectively Actelion) in United States District Court for the District of Maryland and United States District Court for the District of Columbia. The complaints allege that Actelion violated state and federal antitrust and unfair competition laws by allegedly refusing to supply generic pharmaceutical manufacturers with samples of TRACLEER. TRACLEER is subject to a Risk Evaluation and Mitigation Strategy required by the U.S. Food and Drug Administration, which imposes restrictions on distribution of the product. In January 2019, the plaintiffs dismissed the District of Columbia case and filed a consolidated complaint in the United States District Court for the District of Maryland. In September 2024, the district court granted plaintiff's motion for class certification. Trial is scheduled for March 2026.
In December 2023, a putative class action lawsuit was filed against the Company and Janssen Biotech Inc. (collectively Janssen) in the United States District Court for the Eastern District of Virginia. The complaint alleges that Janssen violated federal and state antitrust laws and other state laws by delaying biosimilar competition with STELARA through Janssen's enforcement of patent rights covering STELARA. The complaint seeks damages and other relief. In February 2024, plaintiffs filed an amended complaint, which Janssen moved to dismiss in March 2024. In August 2024, the court granted in part and denied in part Janssen's motion to dismiss.
In December 2018, Janssen Biotech, Inc., Janssen Oncology, Inc., Janssen Research & Development, LLC, and Johnson & Johnson (collectively, Janssen) were served with a qui tam complaint on behalf of the United States, certain states, and the District of Columbia. The complaint alleges that Janssen violated the federal False Claims Act and state law when providing pricing information for ZYTIGA to the government in connection with direct sales and reimbursement programs. At this time, the federal and state governments have declined to intervene. In December 2021, the United States District Court for the District of New Jersey denied Janssen's motion to dismiss.
20. Restructuring
In fiscal 2023, the Company commenced restructuring actions within its Innovative Medicine and MedTech segments. The amounts and details of the current year programs are included below.
In fiscal 2023, the Company completed a prioritization of its research and development (R&D) investment within its Innovative Medicine segment to focus on the most promising medicines with the greatest benefit to patients. This resulted in the exit of certain programs within certain therapeutic areas. The R&D program exits are primarily in infectious diseases and vaccines including the discontinuation of its respiratory syncytial virus (RSV) adult vaccine program, hepatitis and HIV development. Pre-tax Restructuring expenses of $0.1 billion in the fiscal year 2024, included the termination of partnered and non-partnered development program costs, asset impairments and asset divestments. Pre-tax Restructuring expenses of $0.5 billion in the fiscal year 2023, included the termination of partnered and non-partnered development program costs and asset impairments. Total project costs of approximately $0.6 billion have been recorded since the restructuring was announced. The program was completed in the fiscal fourth quarter of 2024.
In fiscal 2023, the Company initiated a restructuring program of its Orthopaedics franchise within the MedTech segment to streamline operations by exiting certain markets, product lines and distribution network arrangements. The pre-tax restructuring expense of $0.2 billion in the fiscal year 2024 primarily included costs related to market and product exits. The pre-tax restructuring expense of $0.3 billion in the fiscal year 2023 primarily included inventory and instrument charges related to market and product exits. Total project costs of approximately $0.5 billion have been recorded since the restructuring was announced. The estimated costs of the total program are between $0.7 billion - $0.8 billion and is expected to be completed by the end of fiscal year 2025.
The following table summarizes the restructuring expenses for the fiscal years 2024 and 2023:
| | | | | | | | | | |
| (Pre-tax Dollars in Millions) | | 2024 | 2023 |
Innovative Medicine Segment(1) | | | $102 | 479 |
MedTech Segment(2) | | | 167 | 319 |
| Total Programs | | | $269 | $798 |
(1)The fiscal year of 2024 included $102 million in Restructuring on the Consolidated Statement of Earnings. The fiscal year of 2023 included $449 million in Restructuring and $30 million in Cost of products sold on the Consolidated Statement of Earnings.
(2)The fiscal year of 2024 included $132 million in Restructuring and $35 million in Cost of products sold on the Consolidated Statement of Earnings. The fiscal year of 2023 Included $40 million in Restructuring and $279 million in Cost of products sold on the Consolidated Statement of Earnings.
Restructuring reserves as of December 29, 2024 and December 31, 2023 were insignificant.
21. Kenvue separation and discontinued operations
The results of the Consumer Health business (previously reported as a separate business segment) have been reflected as discontinued operations in the Company’s consolidated statements of earnings as Net earnings from discontinued operations, net of taxes through August 23, 2023, the date of the exchange offer. Prior periods have been recast to reflect this presentation.
On May 15, 2024, the Company issued $3.6 billion aggregate principal amount of commercial paper and received $3.6 billion of net cash proceeds to be used for general corporate purposes. On May 17, 2024, the Company completed a Debt-for-Equity Exchange of its remaining 182,329,550 shares of Kenvue Common Stock for the outstanding Commercial Paper. Upon completion of the Debt-for-Equity Exchange, the Commercial Paper was satisfied and discharged and the Company no longer owns any shares of Kenvue Common Stock. This exchange resulted in a loss of approximately $0.4 billion recorded in Other (income) expense.
On May 8, 2023, Kenvue, completed an initial public offering (the IPO) resulting in the issuance of 198,734,444 shares of its common stock, par value $0.01 per share (the “Kenvue Common Stock”), at an initial public offering of $22.00 per share for net proceeds of $4.2 billion. The excess of the net proceeds from the IPO over the net book value of the Johnson & Johnson divested interest was $2.5 billion and was recorded to additional paid-in capital. As of the closing of the IPO, Johnson & Johnson owned approximately 89.6% of the total outstanding shares of Kenvue Common Stock and at July 2, 2023, the non-controlling interest of $1.3 billion associated with Kenvue was reflected in equity attributable to non-controlling interests in the consolidated balance sheet in the fiscal second quarter of 2023.
On August 23, 2023, Johnson & Johnson completed the disposition of an additional 80.1% ownership of Kenvue Common Stock through an exchange offer, which resulted in Johnson & Johnson acquiring 190,955,436 shares of the Company’s common stock in exchange for 1,533,830,450 shares of Kenvue Common Stock. The $31.4 billion of Johnson & Johnson common stock received in the exchange offer is recorded in Treasury stock. Following the exchange offer, the Company owned 9.5% of the total outstanding shares of Kenvue Common Stock that was recorded in other assets within continuing operations at the fair market value of $4.3 billion as of August 23, 2023. Subsequent changes are reflected in other income/expense and amounted to $0.4 billion expense through December 31, 2023.
Johnson & Johnson divested net assets of $11.6 billion as of August 23, 2023, and the accumulated other comprehensive loss attributable to the Consumer Health business at that date was $4.3 billion. Additionally, at the date of the exchange offer, Johnson & Johnson decreased the non-controlling interest by $1.2 billion to record the deconsolidation of Kenvue. This resulted in a non-cash gain on the exchange offer of $21.0 billion that was recorded in Net earnings from discontinued operations, net of taxes in the consolidated statements of earnings for the fiscal third quarter of 2023. This one-time gain includes a gain of $2.8 billion on the Kenvue Common Stock retained by Johnson & Johnson. The gain on the exchange offer qualifies as a tax-free transaction for U.S. federal income tax purposes.
Also in connection with the separation, Johnson & Johnson and Kenvue entered into a separation agreement and also entered into various other agreements that provide for certain transactions to effect the transfer of the assets and liabilities of the Consumer Health business to Kenvue and to govern various interim and ongoing relationships between Kenvue and Johnson & Johnson following the completion of the Kenvue IPO, including transition services agreements (TSAs), transition manufacturing agreements (TMAs), trademark agreements, intellectual property agreements, an employee matters agreement, and a tax matters agreement. Under the TSAs, Johnson & Johnson will provide Kenvue various services and, similarly, Kenvue will provide Johnson & Johnson various services. The provision of services under the TSAs generally will terminate within 24 months following the Kenvue IPO. Additionally, Johnson & Johnson and Kenvue entered into TMAs pursuant to which Johnson & Johnson will manufacture and supply to Kenvue certain products and, similarly, Kenvue will manufacture and supply to Johnson & Johnson certain products. The terms of the TMAs range in initial duration from 3 months to 5 years.
Amounts related to the TSAs and TMAs included in the consolidated statements of earnings were immaterial for both fiscal years 2024 and 2023. Additionally, the amounts due to and from Kenvue for the above agreements was not material as of December 31, 2023.
The results of the Consumer Health business (previously reported as a separate business segment), as well as the associated gain, have been reflected as discontinued operations in the Company’s consolidated statements of earnings as Net earnings from discontinued operations, net of taxes. As a result of the separation of Kenvue, Johnson & Johnson incurred separation costs of $145 million in the fiscal year 2024, which was included in Net Earnings and incurred separation costs of $986 million and $1,089 million in the fiscal years 2023 and 2022, respectively, which were included in Net earnings from discontinued operations, net of taxes. These costs were primarily related to external advisory, legal, accounting, contractor and other
incremental costs directly related to separation activities. In the fiscal 2022, as part of the planned separation of the Company’s Consumer Health business, the Company recognized approximately $0.5 billion in net incremental tax costs.
Details of Net Earnings from Discontinued Operations, net of taxes are as follows:
| | | | | | | | | | | | | | |
| | | | |
| (Dollars in Millions) | | | | 2023(1) | 2022 | |
| Sales to customers | | | | $10,036 | 14,953 | |
| Cost of products sold | | | | 4,369 | 6,494 | |
| Gross profit | | | | 5,667 | 8,459 | |
| Selling, marketing and administrative expenses | | | | 3,085 | 4,519 | |
| Research and development expense | | | | 258 | 468 | |
| Interest Income | | | | (117) | — | |
| Interest expense, net of portion capitalized | | | | 199 | — | |
| Other (income) expense, net | | | | 1,092 | 1,060 | |
| (Gain) on separation of Kenvue | | | | (20,984) | — | |
| Restructuring | | | | — | 46 | |
| Earnings from Discontinued Operations Before Provision for Taxes on Income | | | | 22,134 | 2,366 | |
| Provision for taxes on income | | | | 307 | 795 | |
| Net earnings from Discontinued Operations | | | | $21,827 | 1,571 | |
(1)The Company ceased consolidating the results of the Consumer Health business on August 23, 2023, the date of the exchange offer, but continued to reflect any separation costs incurred as part of discontinued operations through the end of the fiscal fourth quarter.
The following table presents depreciation, amortization and capital expenditures of the discontinued operations related to Kenvue:
| | | | | | | | | |
| | |
| (Dollars in Millions) | 2023(1) | 2022 | |
| Depreciation and Amortization | $383 | 641 | |
| Capital expenditures | $162 | 303 | |
Report of Independent Registered Public Accounting Firm
To the Board of Directors and Shareholders of Johnson & Johnson
Opinions on the Financial Statements and Internal Control over Financial Reporting
We have audited the accompanying consolidated balance sheets of Johnson & Johnson and its subsidiaries (the “Company”) as of December 29, 2024 and December 31, 2023, and the related consolidated statements of earnings, of comprehensive income, of equity and of cash flows for each of the three fiscal years in the period ended December 29, 2024, including the related notes (collectively referred to as the “consolidated financial statements”). We also have audited the Company's internal control over financial reporting as of December 29, 2024, based on criteria established in Internal Control - Integrated Framework (2013) issued by the Committee of Sponsoring Organizations of the Treadway Commission (COSO).
In our opinion, the consolidated financial statements referred to above present fairly, in all material respects, the financial position of the Company as of December 29, 2024 and December 31, 2023, and the results of its operations and its cash flows for each of the three fiscal years in the period ended December 29, 2024 in conformity with accounting principles generally accepted in the United States of America. Also in our opinion, the Company maintained, in all material respects, effective internal control over financial reporting as of December 29, 2024, based on criteria established in Internal Control - Integrated Framework (2013) issued by the COSO.
Basis for Opinions
The Company's management is responsible for these consolidated financial statements, for maintaining effective internal control over financial reporting, and for its assessment of the effectiveness of internal control over financial reporting, included in the accompanying Management’s report on internal control over financial reporting. Our responsibility is to express opinions on the Company’s consolidated financial statements and on the Company's internal control over financial reporting based on our audits. We are a public accounting firm registered with the Public Company Accounting Oversight Board (United States) (PCAOB) and are required to be independent with respect to the Company in accordance with the U.S. federal securities laws and the applicable rules and regulations of the Securities and Exchange Commission and the PCAOB.
We conducted our audits in accordance with the standards of the PCAOB. Those standards require that we plan and perform the audits to obtain reasonable assurance about whether the consolidated financial statements are free of material misstatement, whether due to error or fraud, and whether effective internal control over financial reporting was maintained in all material respects.
Our audits of the consolidated financial statements included performing procedures to assess the risks of material misstatement of the consolidated financial statements, whether due to error or fraud, and performing procedures that respond to those risks. Such procedures included examining, on a test basis, evidence regarding the amounts and disclosures in the consolidated financial statements. Our audits also included evaluating the accounting principles used and significant estimates made by management, as well as evaluating the overall presentation of the consolidated financial statements. Our audit of internal control over financial reporting included obtaining an understanding of internal control over financial reporting, assessing the risk that a material weakness exists, and testing and evaluating the design and operating effectiveness of internal control based on the assessed risk. Our audits also included performing such other procedures as we considered necessary in the circumstances. We believe that our audits provide a reasonable basis for our opinions.
As described in Management’s report on internal control over financial reporting, management has excluded Shockwave Medical, Inc., (“Shockwave”) from its assessment of internal control over financial reporting as of December 29, 2024 because it was acquired by the Company in a purchase business combination during 2024. We have also excluded Shockwave from our audit of internal control over financial reporting. Shockwave is a wholly-owned subsidiary whose total assets and total sales excluded from management’s assessment and our audit of internal control over financial reporting represent less than 1% of each of the related consolidated financial statement amounts as of and for the fiscal year ended December 29, 2024.
Definition and Limitations of Internal Control over Financial Reporting
A company’s internal control over financial reporting is a process designed to provide reasonable assurance regarding the reliability of financial reporting and the preparation of financial statements for external purposes in accordance with generally accepted accounting principles. A company’s internal control over financial reporting includes those policies and procedures that (i) pertain to the maintenance of records that, in reasonable detail, accurately and fairly reflect the transactions and dispositions of the assets of the company; (ii) provide reasonable assurance that transactions are recorded as necessary to permit preparation of financial statements in accordance with generally accepted accounting principles, and that receipts and expenditures of the company are being made only in accordance with authorizations of management and directors of the company; and (iii) provide reasonable assurance regarding prevention or timely detection of unauthorized acquisition, use, or disposition of the company’s assets that could have a material effect on the financial statements.
Because of its inherent limitations, internal control over financial reporting may not prevent or detect misstatements. Also, projections of any evaluation of effectiveness to future periods are subject to the risk that controls may become inadequate because of changes in conditions, or that the degree of compliance with the policies or procedures may deteriorate.
Critical Audit Matters
The critical audit matters communicated below are matters arising from the current period audit of the consolidated financial statements that were communicated or required to be communicated to the audit committee and that (i) relate to accounts or disclosures that are material to the consolidated financial statements and (ii) involved our especially challenging, subjective, or complex judgments. The communication of critical audit matters does not alter in any way our opinion on the consolidated financial statements, taken as a whole, and we are not, by communicating the critical audit matters below, providing separate opinions on the critical audit matters or on the accounts or disclosures to which they relate.
U.S. Innovative Medicine Rebate Reserves – Managed Care, Medicare and Medicaid
As described in Note 1 to the consolidated financial statements, the Company recognizes revenue from product sales when obligations under the terms of a contract with the customer are satisfied. Rebates and discounts provided to customers are accounted for as variable consideration and recorded as a reduction in sales. The liability for such rebates and discounts is recognized within Accrued rebates, returns, and promotions on the consolidated balance sheet. A significant portion of the liability related to rebates is from the sale of pharmaceutical products within the U.S., primarily the Managed Care, Medicare and Medicaid programs, which amounted to $12.3 billion as of December 29, 2024. For significant rebate programs, which include the U.S. Managed Care, Medicare and Medicaid rebate programs, rebates and discounts estimated by management are based on contractual terms, historical experience, patient outcomes, trend analysis, and projected market conditions in the various markets served.
The principal considerations for our determination that performing procedures relating to U.S. Innovative Medicine rebate reserves - Managed Care, Medicare and Medicaid is a critical audit matter are (i) the significant judgment by management due to the significant measurement uncertainty when developing the estimate of these reserves and (ii) a high degree of auditor judgment, subjectivity, and effort in performing procedures and evaluating the assumptions related to contractual terms, historical experience, patient outcomes, trend analysis, and projected market conditions in the U.S. pharmaceutical market.
Addressing the matter involved performing procedures and evaluating audit evidence in connection with forming our overall opinion on the consolidated financial statements. These procedures included testing the effectiveness of controls relating to management’s estimate of the U.S. Innovative Medicine rebate reserves - Managed Care, Medicare and Medicaid, including controls over the assumptions used to estimate these rebates. These procedures also included, among others (i) developing an independent estimate of the rebates by utilizing third party information on price and market conditions in the U.S. pharmaceutical market, the terms of the specific rebate programs, and the historical experience and trend analysis of actual rebate claims paid; (ii) testing, on a sample basis, rebate claims processed by the Company, including evaluating those claims for consistency with the contractual and mandated terms of the Company’s rebate arrangements; and (iii) comparing the independent estimates to management’s estimates to evaluate the reasonableness of management’s estimates.
Litigation Contingencies – Talc
As described in Notes 1 and 19 to the consolidated financial statements, the Company records accruals for loss contingencies associated with legal matters, including talc, when it is probable that a liability will be incurred and the amount of the loss can be reasonably estimated. To the extent adverse awards, judgments, or verdicts have been rendered against the Company, management does not record an accrual until a loss is determined to be probable and can be reasonably estimated. For these matters, management is unable to estimate the possible loss or range of loss beyond the amounts accrued. Amounts accrued for legal contingencies often result from a complex series of judgments about future events and uncertainties that rely heavily on estimates and assumptions including timing of related payments. The ability to make such estimates and judgments can be affected by various factors, including, among other things, whether damages sought in the proceedings are unsubstantiated or indeterminate; scientific and legal discovery has not commenced or is not complete; proceedings are in early stages; matters present legal uncertainties; there are significant facts in dispute; procedural or jurisdictional issues; the uncertainty and unpredictability of the number of potential claims; ability to achieve comprehensive multi-party settlements; complexity of related cross-claims and counterclaims; and/or there are numerous parties involved. Management continues to believe that the Company has strong legal grounds to contest the talc verdicts it has appealed. Notwithstanding management’s confidence in the safety of the Company’s talc products, in certain circumstances the Company has settled cases. In May 2024, the Company proposed a consensual “prepackaged” Chapter 11 bankruptcy plan (the “Proposed Plan”) for the final resolution of all current and future claims related to cosmetic talc in the United States, excluding claims related to mesothelioma or State consumer protection claims. In September 2024, the Company’s subsidiary Red River Talc, LLC filed a voluntary petition, seeking relief under Chapter 11 of the Bankruptcy Code, in furtherance of the Company’s consensual “prepackaged” Proposed Plan. As of December 29, 2024, the total present value of the reserve to resolve the talc claims is approximately $11.6 billion, of which approximately ten percent is recorded as a current liability. The recorded amount remains the Company's best estimate of probable loss. The Company is unable to estimate the possible loss or range of loss beyond the amounts accrued.
The principal considerations for our determination that performing procedures relating to the litigation contingencies - talc is a critical audit matter are (i) the significant judgment by management when assessing the likelihood of a loss being incurred for the remaining unresolved talc claims, when determining whether a reasonable estimate of the loss or range of loss for the remaining unresolved talc claims can be made, and when determining the timing of settlement payments for the remaining unresolved talc claims, and (ii) a high degree of auditor judgment, subjectivity, and effort in performing procedures and evaluating audit evidence related to management’s assessment of the loss contingencies associated with the talc litigation.
Addressing the matter involved performing procedures and evaluating audit evidence in connection with forming our overall opinion on the consolidated financial statements. These procedures included testing the effectiveness of controls relating to management’s assessment of the litigation contingencies – talc, including controls over determining whether a loss is probable and whether the amount of loss can be reasonably estimated, as well as financial statement disclosures. These procedures also included, among others (i) gaining an understanding of the Company’s process around the accounting and reporting for the talc litigation; (ii) obtaining and evaluating certain executed settlement agreements related to the talc litigation; (iii) discussing the status of significant known actual and potential litigation and settlements activity with the Company’s in-house legal counsel, as well as external counsel when deemed necessary; (iv) obtaining and evaluating the letters of audit inquiry with internal and external legal counsel related to the talc litigation; (v) evaluating the reasonableness of management’s assessment regarding whether an unfavorable outcome is reasonably possible or probable and reasonably estimable; and (vi) evaluating the sufficiency of the Company’s litigation contingencies disclosures.
/s/ PricewaterhouseCoopers LLP
Florham Park, New Jersey
February 13, 2025
We have served as the Company’s auditor since at least 1920. We have not been able to determine the specific year we began serving as auditor of the Company.
Management’s report on internal control over financial reporting
Under Section 404 of the Sarbanes-Oxley Act of 2002, management is required to assess the effectiveness of the Company’s internal control over financial reporting as of the end of each fiscal year and report, based on that assessment, whether the Company’s internal control over financial reporting is effective.
Management of the Company is responsible for establishing and maintaining adequate internal control over financial reporting. The Company’s internal control over financial reporting is designed to provide reasonable assurance as to the reliability of the Company’s financial reporting and the preparation of external financial statements in accordance with generally accepted accounting principles.
Internal controls over financial reporting, no matter how well designed, have inherent limitations. Therefore, internal control over financial reporting determined to be effective can provide only reasonable assurance with respect to financial statement preparation and may not prevent or detect all misstatements. Moreover, projections of any evaluation of effectiveness to future periods are subject to the risk that controls may become inadequate because of changes in conditions, or that the degree of compliance with the policies or procedures may deteriorate.
The Company’s management has assessed the effectiveness of the Company’s internal control over financial reporting as of December 29, 2024. In making this assessment, the Company used the criteria established by the Committee of Sponsoring Organizations of the Treadway Commission (COSO) in “Internal Control-Integrated Framework (2013).” These criteria are in the areas of control environment, risk assessment, control activities, information and communication, and monitoring. The Company’s assessment included extensive documenting, evaluating and testing the design and operating effectiveness of its internal controls over financial reporting.
The Company acquired Shockwave Medical, Inc. (Shockwave), in a business combination in May 2024. Shockwave’s total assets, excluding intangible assets and goodwill, and total sales represented less than 1% of each of the related consolidated financial statement amounts as of and for the fiscal year ended December 29, 2024. As the acquisition occurred in the fiscal year 2024, the scope of the Company's assessment of the design and effectiveness of internal control over financial reporting for the fiscal year 2024 excluded the above mentioned acquisition. This exclusion is in accordance with the SEC's general guidance that an assessment of a recently acquired business may be omitted from the scope in the year of acquisition.
Based on the Company’s processes and assessment, as described above, management has concluded that, as of December 29, 2024, the Company’s internal control over financial reporting was effective.
The effectiveness of the Company’s internal control over financial reporting as of December 29, 2024 has been audited by PricewaterhouseCoopers LLP, an independent registered public accounting firm, as stated in their report, which appears herein.
| | | | | |
/s/ J. Duato | /s/ J. J. Wolk |
| Joaquin Duato | Joseph J. Wolk |
| Chairman, Board of Directors | Executive Vice President, Chief Financial Officer |
| Chief Executive Officer | |
Shareholder return performance graphs
Set forth below are line graphs comparing the cumulative total shareholder return on the Company’s Common Stock for periods of five years and ten years ending December 31, 2024, against the cumulative total return of the Standard & Poor’s 500 Stock Index, the Standard & Poor’s Pharmaceutical Index and the Standard & Poor’s Healthcare Equipment Index. The graphs and tables assume that $100 was invested on December 31, 2019 and December 31, 2014 in each of the Company’s Common Stock, the Standard & Poor’s 500 Stock Index, the Standard & Poor’s Pharmaceutical Index and the Standard & Poor’s Healthcare Equipment Index and that all dividends were reinvested.
5 Year Shareholder Return Performance J&J vs. Indices
| | | | | |
| Johnson & Johnson |
| S&P 500 Index |
| S&P Pharmaceutical Index |
| S&P Healthcare Equipment Index |
| | | | | |
| 5-year CAGR |
| J&J | 2.6 | % |
| S&P 500 | 14.5 | % |
| S&P Pharm | 9.8 | % |
| S&P H/C Equip | 6.6 | % |
| | | | | | | | | | | | | | | | | | | | | | | | | | | | | | | | | | | |
| 2019 | | 2020 | | 2021 | | 2022 | | 2023 | | 2024 |
| Johnson & Johnson | $100.00 | | $110.85 | | $123.54 | | $130.91 | | $119.65 | | $113.91 |
| S&P 500 Index | $100.00 | | $118.39 | | $152.36 | | $124.75 | | $157.52 | | $196.90 |
| S&P Pharmaceutical Index | $100.00 | | $107.53 | | $135.34 | | $146.78 | | $147.27 | | $159.35 |
| S&P Healthcare Equipment Index | $100.00 | | $117.63 | | $140.40 | | $113.92 | | $124.22 | | $137.81 |
10 Year Shareholder Return Performance J&J vs. Indices
| | | | | |
| Johnson & Johnson |
| S&P 500 Index |
| S&P Pharmaceutical Index |
| S&P Healthcare Equipment Index |
| | | | | |
| 10-year CAGR |
| J&J | 6.2 | % |
| S&P 500 | 13.1 | % |
| S&P Pharm | 8.8 | % |
| S&P H/C Equip | 11.8 | % |
| | | | | | | | | | | | | | | | | | | | | | | | | | | | | | | | | | | |
| 2014 | 2015 | 2016 | 2017 | 2018 | 2019 | 2020 | 2021 | 2022 | 2023 | 2024 |
| Johnson & Johnson | $100.00 | $101.16 | $116.66 | $145.13 | $137.67 | $159.99 | $177.35 | $197.66 | $209.45 | $191.43 | $182.25 |
| S&P 500 Index | $100.00 | $101.37 | $113.48 | $138.25 | $132.18 | $173.81 | $205.78 | $264.82 | $216.83 | $273.79 | $342.24 |
| S&P Pharmaceutical Index | $100.00 | $105.79 | $104.13 | $117.22 | $126.71 | $145.83 | $156.80 | $197.36 | $214.04 | $214.75 | $232.38 |
| S&P Healthcare Equipment Index | $100.00 | $105.97 | $112.85 | $147.71 | $171.70 | $222.04 | $261.19 | $311.74 | $252.95 | $275.82 | $306.00 |
Item 9. Changes in and disagreements with accountants on accounting and financial disclosure
Not applicable.
Item 9A. Controls and procedures
Disclosure controls and procedures. At the end of the period covered by this Report, the Company evaluated the effectiveness of the design and operation of its disclosure controls and procedures. The Company’s disclosure controls and procedures are designed to ensure that information required to be disclosed by the Company in the reports that it files or submits under the Exchange Act is recorded, processed, summarized and reported within the time periods specified in the SEC’s rules and forms. Disclosure controls and procedures include, without limitation, controls and procedures designed to ensure that information required to be disclosed by the Company in the reports that it files or submits under the Exchange Act is accumulated and communicated to the Company’s management, including its principal executive and principal financial officers, or persons performing similar functions, as appropriate to allow timely decisions regarding required disclosure. Joaquin Duato, Chairman and Chief Executive Officer, and Joseph J. Wolk, Executive Vice President, Chief Financial Officer, reviewed and participated in this evaluation. Based on this evaluation, Messrs. Duato and Wolk concluded that, as of the end of the period covered by this Report, the Company’s disclosure controls and procedures were effective.
Reports on internal control over financial reporting. The information called for by this item is incorporated herein by reference to Management’s report on internal control over financial reporting, and the attestation regarding internal controls over financial reporting included in the report of independent registered public accounting firm included in Item 8 of this Report.
Changes in internal control over financial reporting. During the fiscal quarter ended December 29, 2024, there were no changes in the Company’s internal control over financial reporting identified in connection with the evaluation required under Rules 13a-15 and 15d-15 under the Exchange Act that have materially affected, or are reasonably likely to materially affect, the Company’s internal control over financial reporting. The Company continues to monitor and assess the effectiveness of the design and operation of its disclosure controls and procedures.
The Company is implementing a multi-year, enterprise-wide initiative to integrate, simplify and standardize processes and systems for the human resources, information technology, procurement, supply chain and finance functions. These are enhancements to support the growth of the Company’s financial shared service capabilities and standardize financial systems. This initiative is not in response to any identified deficiency or weakness in the Company’s internal control over financial reporting. In response to this initiative, the Company has and will continue to align and streamline the design and operation of its financial control environment.
Item 9B. Other information
Securities trading plans of Directors and Executive Officers. During the fiscal fourth quarter of 2024, none of our directors or officers (as defined in Rule 16a-1(f) of the Exchange Act) informed us of the adoption or termination of a “Rule 10b5-1 trading arrangement” or “non-Rule 10b5-1 trading arrangement,” each as defined in Item 408 of Regulation S-K.
Item 9C. Disclosure regarding foreign jurisdictions that prevent inspections
Not applicable.
Part III
Item 10. Directors, executive officers and corporate governance
The information called for by this item is incorporated herein by reference to the discussion of the Audit Committee under the caption Item 1. Election of Directors - Board committees; and the material under the captions Item 1. Election of Directors and, if applicable, Delinquent Section 16(a) reporting in the Proxy Statement; and the material under the caption “Executive Officers of the Registrant” in Part I of this Report.
The Company’s Code of Business Conduct, which covers all employees (including the Chief Executive Officer, Chief Financial Officer and Controller), meets the requirements of the SEC rules promulgated under Section 406 of the Sarbanes-Oxley Act of 2002. The Code of Business Conduct is available on the Company’s website at www.jnj.com/code-of-business-conduct, and copies are available to shareholders without charge upon written request to the Secretary at the Company’s principal executive offices. Any substantive amendment to the Code of Business Conduct or any waiver of the Code granted to the Chief Executive Officer, the Chief Financial Officer or the Controller will be posted on the Company’s website at www.jnj.com/code-of-business-conduct within five business days (and retained on the website for at least one year).
In addition, the Company has adopted a Code of Business Conduct & Ethics for Members of the Board of Directors and Executive Officers. The Code of Business Conduct & Ethics for Members of the Board of Directors and Executive Officers is available on the Company’s website at www.investor.jnj.com/governance/corporate-governance-overview/code-of-business-conduct--ethics, and copies are available to shareholders without charge upon written request to the Secretary at the Company’s principal executive offices. Any substantive amendment to the Code or any waiver of the Code granted to any member of the Board of Directors or any executive officer will be posted on the Company’s website at www.investor.jnj.com/governance/corporate-governance-overview/code-of-business-conduct--ethics within five business days (and retained on the website for at least one year).
In addition to the prohibition on insider trading for all employees covered in our Code of Business Conduct, the Company has adopted an insider trading policy governing the purchase, sale and other dispositions of its securities by directors, officers and certain other insiders that is reasonably designed to promote compliance with insider trading laws, rules and regulations and any applicable listing standards. A copy of this policy is filed with this Annual Report on Form 10-K as Exhibit 19.
Item 11. Executive compensation
The information called for by this item is incorporated herein by reference to the material under the captions Item 1. Election of Directors – Director compensation, and Item 2. Compensation Committee report, Compensation discussion and analysis and Executive compensation tables in the Proxy Statement.
The material incorporated herein by reference to the material under the caption Compensation Committee report in the Proxy Statement shall be deemed furnished, and not filed, in this Report and shall not be deemed incorporated by reference into any filing under the Securities Act of 1933, as amended, or the Securities Exchange Act of 1934, as amended, as a result of this furnishing, except to the extent that the Company specifically incorporates it by reference.
Item 12. Security ownership of certain beneficial owners and management and related stockholder matters
The information called for by this item is incorporated herein by reference to the material under the caption Stock ownership in the Proxy Statement; and Note 16 Common stock, stock option plans and stock compensation agreements of the Notes to Consolidated Financial Statements in Item 8 of this Report.
Equity compensation plan information
The following table provides certain information as of December 29, 2024 concerning the shares of the Company’s Common Stock that may be issued under existing equity compensation plans.
| | | | | | | | | | | |
| Plan Category | Number of
Securities to
be Issued Upon
Exercise of
Outstanding
Options and Rights | Weighted Average
Exercise Price of
Outstanding
Options
and Rights | Number of Securities Remaining Available for Future Issuance Under Equity Compensation Plans(2)(3) |
Equity Compensation Plans Approved by Security Holders(1) | 127,682,644 | $127.63 | 111,042,139 |
| Equity Compensation Plans Not Approved by Security Holders | — | — | — |
| Total | 127,682,644 | $127.63 | 111,042,139 |
(1)Included in this category are the following equity compensation plans which have been approved by the Company’s shareholders: 2012 Long-Term Incentive Plan and 2022 Long-Term Incentive Plan.
(2)This column excludes shares reflected under the column “Number of Securities to be Issued Upon Exercise of Outstanding Options and Rights.”
(3)The 2012 Long-Term Incentive Plan expired April 26, 2022. All options and restricted shares granted subsequent to that date were under the 2022 Long-Term Incentive Plan.
Item 13. Certain relationships and related transactions, and director independence
The information called for by this item is incorporated herein by reference to the material under the captions Item 1. Election of Directors - Related person transactions & Director independence in the Proxy Statement.
Item 14. Principal accountant fees and services
The information called for by this item is incorporated herein by reference to the material under the caption Item 3. Ratification of appointment of independent registered public accounting firm in the Proxy Statement.
Part IV
Item 15. Exhibits and financial statement schedules
The following documents are filed as part of this report:
1.Financial Statements
Consolidated balance sheets at end of fiscal years 2024 and 2023
Consolidated statements of earnings for fiscal years 2024, 2023 and 2022
Consolidated statements of comprehensive income for Fiscal Years 2024, 2023 and 2022
Consolidated statements of equity for fiscal years 2024, 2023 and 2022
Consolidated statements of cash flows for fiscal years 2024, 2023 and 2022
Notes to Consolidated Financial Statements
Report of independent registered public accounting firm
All schedules are omitted because they are not applicable or the required information is included in the financial statements or notes.
2.Exhibits required to be filed by item 60l of regulation S-K
The information called for by this item is incorporated herein by reference to the Exhibit Index in this Report.
Item 16. Form 10-K summary
Registrants may voluntarily include a summary of information required by Form 10-K under this Item 16. The Company has elected not to include such summary information.
Signatures
Pursuant to the requirements of Section 13 of the Securities Exchange Act of 1934, the registrant has duly caused this Report to be signed on its behalf by the undersigned, thereunto duly authorized.
| | |
| JOHNSON & JOHNSON |
| (Registrant) |
| | | | | |
| By | /s/ J. Duato |
| J. Duato, Chairman of the Board and Chief Executive Officer |
Pursuant to the requirements of the Securities Exchange Act of 1934, this report has been signed below by the following persons on behalf of the registrant and in the capacities and on the dates indicated.
| | | | | | | | |
| Signature | Title | Date |
| | |
/s/ J. Duato | Chairman of the Board | February 13, 2025 |
| J. Duato | Chief Executive Officer
(Principal Executive Officer) | |
| | |
/s/ J. J. Wolk | Chief Financial Officer | February 13, 2025 |
| J. J. Wolk | (Principal Financial Officer) | |
| | |
/s/ R. J. Decker Jr. | Controller and Chief Accounting Officer | February 13, 2025 |
| R. J. Decker Jr. | (Principal Accounting Officer) | |
| | |
/s/ D. Adamczyk | Director | February 13, 2025 |
| D. Adamczyk | | |
| | |
/s/ M. C. Beckerle | Director | February 13, 2025 |
| M. C. Beckerle | | |
| | |
/s/ J. A. Doudna | Director | February 13, 2025 |
| J. A. Doudna | | |
| | | | | | | | |
| Signature | Title | Date |
| | |
/s/ M. A. Hewson | Director | February 13, 2025 |
| M. A. Hewson | | |
| | |
/s/ P. A. Johnson | Director | February 13, 2025 |
| P. A. Johnson | | |
| | |
/s/ H. Joly | Director | February 13, 2025 |
| H. Joly | | |
| | |
/s/ M. B. McClellan | Director | February 13, 2025 |
| M. B. McClellan | | |
| | |
/s/ A. M. Mulcahy | Director | February 13, 2025 |
| A. M. Mulcahy | | |
| | |
/s/ M. A. Weinberger | Director | February 13, 2025 |
| M. A. Weinberger | | |
| | |
/s/ N. Y. West | Director | February 13, 2025 |
| N. Y. West | | |
| | |
/s/ E. A. Woods | Director | February 13, 2025 |
| E. A. Woods | | |
Exhibit index
| | | | | | | | |
Reg. S-K
Exhibit Table
Item No. | | Description
of Exhibit |
| | Agreement and Plan of Merger, dated as of October 31, 2022, by and among Johnson & Johnson, Athos Merger Sub, Inc. and ABIOMED, Inc. – Incorporated herein by reference to Exhibit 2.1 of the Registrant’s Form 8-K Current Report filed November 1, 2022.† |
| | Restated Certificate of Incorporation effective February 19, 2016 — Incorporated herein by reference to Exhibit 3(i) of the Registrant’s Form 10-K Annual Report for the fiscal year ended January 3, 2016. |
| | Certificate of Amendment to the Certificate of Incorporation of Johnson & Johnson effective April 30, 2020 — Incorporated herein by reference to Exhibit 3.1 of the Registrant's Form 8-K Current Report filed April 29, 2020. |
| | Amended and Restated By-Laws of the Company, as amended effective April 25, 2024 — Incorporated herein by reference to Exhibit 3.1 of the Registrant’s Form 8-K Current Report filed April 29, 2024. |
| 4(a) | | Upon the request of the Securities and Exchange Commission, the Registrant will furnish a copy of all instruments defining the rights of holders of long-term debt of the Registrant. |
| | Description of Securities Registered Pursuant to Section 12 of the Securities Exchange Act of 1934 — Filed with this document. |
| 4(c)** | | Indenture, dated as of September 15, 1987 – Incorporated herein by reference to Exhibit 4(a) to the Registrant’s Form S-3 Registration Statement filed on October 11, 1994 |
| 4(d)** | | First Supplemental Indenture, dated as of September 1, 1990 – Incorporated herein by reference to Exhibit 4(b) to the Registrant’s Form S-3 Registration Statement filed on October 11, 1994 |
| | Second Supplemental Indenture, dated as of November 9, 2017 – Incorporated herein by reference to Exhibit 4.1 to the Registrant’s Form 8-K Current Report filed on November 13, 2017 |
| | 2012 Long-Term Incentive Plan — Incorporated herein by reference to Appendix A of the Registrant’s Proxy Statement filed on March 15, 2012.* |
| | Form of Stock Option Certificate under the 2012 Long-Term Incentive Plan — Incorporated herein by reference to Exhibit 10.2 of the Registrant’s Form 10-Q Quarterly Report for the quarter ended April 1, 2012.* |
| | Global NonQualified Stock Option Award Agreement under the 2012 Long-Term Incentive Plan — Incorporated herein by reference to Exhibit 10.1 of the Registrant’s Form 10-Q Quarterly Report for the quarter ended April 1, 2018.* |
| | Global Restricted Share Unit Award Agreement under the 2012 Long-Term Incentive Plan — Incorporated herein by reference to Exhibit 10.2 of the Registrant’s Form 10-Q Quarterly Report for the quarter ended April 1, 2018.* |
| | Global Performance Share Unit Award Agreement under the 2012 Long-Term Incentive Plan — Incorporated herein by reference to Exhibit 10.3 of the Registrant’s Form 10-Q Quarterly Report for the quarter ended April 1, 2018.* |
| | Global Restricted Share Unit Award Agreement granted to John Reed on May 1, 2023 under the 2022 Long-Term Incentive Plan — Incorporated herein by reference to Exhibit 10(h) of the Registrant’s Form 10-K Annual Report for the fiscal year ended December 31, 2023* |
| | Domestic Deferred Compensation (Certificate of Extra Compensation) Plan — Incorporated herein by reference to Exhibit 10(g) of the Registrant’s Form 10-K Annual Report for the year ended December 28, 2003.* |
| | Amendments to the Certificate of Extra Compensation Plan effective as of January 1, 2009 — Incorporated herein by reference to Exhibit 10(j) of the Registrant’s Form 10-K Annual Report for the year ended December 28, 2008.* |
| | Amended and Restated Deferred Fee Plan for Directors (Amended as of January 17, 2012) — Incorporated herein by reference to Exhibit 10(k) of the Registrant's Form 10-K Annual Report for the fiscal year ended January 1, 2012.* |
| | | | | | | | |
Reg. S-K
Exhibit Table
Item No. | | Description
of Exhibit |
| | The Johnson & Johnson Executive Income Deferral Plan Amended and Restated Effective January 1, 2010 — Incorporated herein by reference to Exhibit 10.1 of the Registrant’s Form 10-Q Quarterly Report for the quarter ended September 30, 2012.* |
| | The Johnson & Johnson Excess Savings Plan (amended and restated as of January 1, 2022) — Incorporated herein by reference to Exhibit 10(l) of the Registrant’s Form 10-K Annual Report for the fiscal year ended January 1, 2023.* |
| | Excess Benefit Plan of Johnson & Johnson and Affiliated Companies (amended and restated as of January 1, 2020) — incorporated by reference to Exhibit 10(m) of the Registrant’s Form 10-K Annual Report for the fiscal year ended January 3, 2021. |
| 10(m)** | | Executive Life Plan Agreement — Incorporated herein by reference to Exhibit 10(i) of the Registrant’s Form 10-K Annual Report for the fiscal year ended January 3, 1993.* |
| | Executive Life Plan Agreement Closure Letter — Incorporated herein by reference to Exhibit 10.1 of the Registrant’s Form 10-Q Quarterly Report for the quarter ended March 29, 2015.* |
| | 2022 Long-Term Incentive Plan — Incorporated by reference to Appendix A of the Registrant’s Proxy Statement filed on March 16, 2022.* |
| | Severance Pay Plan of Johnson & Johnson and U.S. Affiliated Companies, Amended and Restated as of October 1, 2014 — Incorporated herein by reference to Exhibit 10.1 of the Registrant's Form 10-Q Quarterly Report for the quarter ended September 28, 2014.* |
| | First Amendment to the Severance Pay Plan of Johnson & Johnson and U.S. Affiliated Companies (as amended and restated effective October 1, 2014) — Incorporated herein by reference to Exhibit 10.1 of the Registrant's Form 10-Q Quarterly Report for the quarter ended June 28, 2015.* |
| | Second Amendment to the Severance Pay Plan of Johnson & Johnson and U.S. Affiliated Companies (as amended and restated effective October 1, 2014) — Incorporated herein by reference to Exhibit 10(x) of the Registrant's Form 10-K Annual Report for the fiscal year ended January 3, 2016.* |
| | Contingent Value Rights Agreement, dated as of December 22, 2022, by and between Johnson & Johnson and American Stock Transfer & Trust Company, LLC – Incorporated herein by reference to Exhibit 10.1 of the Registrant’s Form 8-K Current Report filed December 22, 2022.† |
| | Intellectual Property Agreement, dated as of May 3, 2023, by and between Johnson & Johnson and Kenvue Inc. — Incorporated herein by reference to Exhibit 10.4 of the Registrant's Form 8-K Current Report filed May 8, 2023. |
| | Trademark Phase-Out License Agreement, dated as of April 3, 2023, by and between Johnson & Johnson and Johnson & Johnson Consumer Inc. — Incorporated herein by reference to Exhibit 10.5 of the Registrant's Form 8-K Current Report filed May 8, 2023. |
| | Johnson & Johnson Deferred Compensation Plan — Incorporated herein by reference to Exhibit 10.1 of the Registrant's Form 8-K Current Report filed November 27, 2023.* |
| | Global Performance Share Unit Award Agreement under the Johnson & Johnson 2022 Long-Term Incentive Plan — Incorporated herein by reference to Exhibit 10.1 of the Registrant’s Form 10-Q Quarterly Report for the quarter year ended April 2, 2023.* |
| | Global Restricted Share Unit Award Agreement under the Johnson & Johnson 2022 Long-Term Incentive Plan — Incorporated herein by reference to Exhibit 10.2 of the Registrant’s Form 10-Q Quarterly Report for the quarter year ended April 2, 2023.* |
| | Global Nonqualified Stock Option Award Agreement under the Johnson & Johnson 2022 Long-Term Incentive Plan — Incorporated herein by reference to Exhibit 10.3 of the Registrant’s Form 10-Q Quarterly Report for the quarter year ended April 2, 2023.* |
| | Amendment One to the Johnson & Johnson Excess Savings Plan (amended and restated effective as of January 1, 2022) — Incorporated herein by reference to Exhibit 10.1 of the Registrant’s Form 10-Q Quarterly Report for the quarter ended October 1, 2023.* |
| | | | | | | | |
Reg. S-K
Exhibit Table
Item No. | | Description
of Exhibit |
| | Johnson & Johnson Executive Incentive Plan (Amended as of September 7, 2023) — Incorporated herein by reference to Exhibit 10.2 of the Registrant’s Form 10-Q Quarterly Report for the quarter ended October 1, 2023.* |
| | Johnson & Johnson Executive Officer Cash Severance Policy — Filed with this document.* |
| | Johnson & Johnson Stock Trading Policy for Directors, Executive Officers and Insiders (Amended as of April 27, 2023) — Incorporated herein by reference to Exhibit 19 of the Registrant’s Form 10-K Annual Report for the fiscal year ended December 31, 2023. |
| | Subsidiaries — Filed with this document. |
| | Consent of Independent Registered Public Accounting Firm — Filed with this document. |
| | Certification of Chief Executive Officer Pursuant to Section 302 of the Sarbanes-Oxley Act — Filed with this document. |
| | Certification of Chief Financial Officer Pursuant to Section 302 of the Sarbanes-Oxley Act — Filed with this document. |
| | Certification of Chief Executive Officer Pursuant to Section 906 of the Sarbanes-Oxley Act — Furnished with this document. |
| | Certification of Chief Financial Officer Pursuant to Section 906 of the Sarbanes-Oxley Act — Furnished with this document. |
| | Johnson & Johnson Clawback Policy (effective as of August 8, 2023) — Incorporated herein by reference to
Exhibit 97 of the Registrant’s Form 10-K Annual Report for the fiscal year ended December 31, 2023. |
| Exhibit 101: | | |
| EX-101.INS | | Instance Document - the instance document does not appear in the Interactive Data File because its XBRL tags are embedded within the Inline XBRL document |
| EX-101.SCH | | Inline XBRL Taxonomy Extension Schema |
| EX-101.CAL | | Inline XBRL Taxonomy Extension Calculation Linkbase |
| EX-101.LAB | | Inline XBRL Taxonomy Extension Label Linkbase |
| EX-101.PRE | | Inline XBRL Taxonomy Extension Presentation Linkbase |
| EX-101.DEF | | Inline XBRL Taxonomy Extension Definition Document |
| Exhibit 104: | | Cover Page Interactive Data File––the cover page interactive data file does not appear in the Interactive Data File because its XBRL tags are embedded within the Inline XBRL document. |
| | | | | |
| * | Management contract or compensatory plan. |
| ** | Paper filing. |
| † | Certain exhibits and schedules have been omitted pursuant to Item 601(b)(2)(ii) or 601(b)(10)(iv) of Regulation S-K, as applicable. |
A copy of any of the Exhibits listed above will be provided without charge to any shareholder submitting a written request specifying the desired exhibit(s) to the Secretary at the principal executive offices of the Company. Pursuant to Item 601(b)(4)(iii)(A) of Regulation S-K, the Company has not filed as exhibits to this Form 10-K certain long-term debt instruments, under which the total amount of securities authorized does not exceed 10% of the total assets of the Company and its subsidiaries on a consolidated basis. The Company hereby agrees to furnish a copy of any such instrument to the SEC upon request.