Table of Contents
UNITED STATES
SECURITIES AND EXCHANGE COMMISSION
Washington, D.C. 20549
FORM N-CSR
CERTIFIED SHAREHOLDER REPORT OF
REGISTERED MANAGEMENT INVESTMENT COMPANIES
Investment Company Act file number 811-2031
MFS SERIES TRUST V
(Exact name of registrant as specified in charter)
111 Huntington Avenue, Boston, Massachusetts 02199
(Address of principal executive offices) (Zip code)
Susan S. Newton
Massachusetts Financial Services Company
111 Huntington Avenue
Boston, Massachusetts 02199
(Name and address of agents for service)
Registrant’s telephone number, including area code: (617) 954-5000
Date of fiscal year end: September 30
Date of reporting period: September 30, 2014
Table of Contents
| ITEM 1. | REPORTS TO STOCKHOLDERS. |
Table of Contents
ANNUAL REPORT
September 30, 2014

MFS® INTERNATIONAL NEW DISCOVERY FUND

MIO-ANN
Table of Contents
MFS® INTERNATIONAL NEW DISCOVERY FUND
The report is prepared for the general information of shareholders.
It is authorized for distribution to prospective investors only when preceded or accompanied by a current prospectus.
NOT FDIC INSURED Ÿ MAY LOSE VALUE Ÿ NO BANK GUARANTEE
Table of Contents

LETTER FROM THE CHAIRMAN AND CEO
Dear Shareholders:
A rift is growing between U.S. and global economic growth. The U.S. economy has regained momentum, with a more robust labor market and steadily declining
unemployment, increased consumer confidence and growing industrial output. Corporate earnings remain strong overall.
However, the rest of the global economy is struggling. The sluggish eurozone economy is now the largest impediment to global growth. With high unemployment and low inflation, the region has been unable to gain traction since the 2008 – 2009 financial crisis. The European Central Bank’s efforts to stimulate growth have had limited success.
In Asia, China is struggling to boost its industrial output and Japan’s economic momentum has slowed after its sales tax increase in April.
As always at MFS®, active risk management is integral to how we manage your investments. We use a collaborative process, sharing insights across asset classes, regions and economic sectors. Our global team of investment professionals uses a multidisciplined, long-term, diversified investment approach.
We understand that these are challenging economic times. Applying proven principles, such as asset allocation and diversification, can best serve investors over the long term. We are confident that this approach can help you as you work with your financial advisors to reach your goals in the years ahead.
Respectfully,

Robert J. Manning
Chairman and Chief Executive Officer
MFS Investment Management
November 14, 2014
The opinions expressed in this letter are subject to change and may not be relied upon for investment advice. No forecasts can be guaranteed.
1
Table of Contents
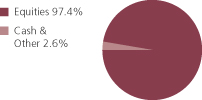
Portfolio structure
| Top ten holdings | ||||
| Bunzl PLC | 3.2% | |||
| Bellway PLC | 1.3% | |||
| Croda International PLC | 1.3% | |||
| OBIC Co. Ltd. | 1.3% | |||
| Amadeus Holdings AG | 1.3% | |||
| NEXT PLC | 1.2% | |||
| Sonova Holding AG | 1.1% | |||
| Symrise AG | 0.9% | |||
| Schroders PLC | 0.9% | |||
| Christian Dior S.A. | 0.9% | |||
| Equity sectors | ||||
| Financial Services | 17.0% | |||
| Special Products & Services | 15.5% | |||
| Retailing | 9.0% | |||
| Health Care | 7.7% | |||
| Consumer Staples | 7.5% | |||
| Industrial Goods & Services | 6.9% | |||
| Technology | 6.9% | |||
| Basic Materials | 6.5% | |||
| Leisure | 5.9% | |||
| Autos & Housing | 5.5% | |||
| Transportation | 3.5% | |||
| Energy | 2.9% | |||
| Utilities & Communications | 2.6% | |||
| Issuer country weightings (x) | ||||
| United Kingdom | 27.5% | |||
| Japan | 15.4% | |||
| Germany | 6.1% | |||
| France | 4.8% | |||
| Brazil | 3.6% | |||
| United States | 3.5% | |||
| Canada | 3.3% | |||
| Denmark | 3.2% | |||
| Switzerland | 2.9% | |||
| Other Countries | 29.7% | |||
| Currency exposure weightings (y) | ||||
| British Pound Sterling | 27.5% | |||
| Euro | 15.6% | |||
| Japanese Yen | 15.4% | |||
| United States Dollar | 5.2% | |||
| Hong Kong Dollar | 4.0% | |||
| Brazilian Real | 3.6% | |||
| Canadian Dollar | 3.3% | |||
| Danish Krone | 3.2% | |||
| Swiss Franc | 2.9% | |||
| Other Currencies | 19.3% | |||
2
Table of Contents
Portfolio Composition – continued
| (x) | Represents the portfolio’s exposure to issuer countries as a percentage of a portfolio’s net assets. For purposes of this presentation, United States includes Cash & Other. |
| (y) | Represents the portfolio’s exposure to a particular currency as a percentage of a portfolio’s net assets. For purposes of this presentation, United States Dollar includes Cash & Other. |
Cash & Other can include cash, other assets less liabilities, offsets to derivative positions, and short-term securities.
Percentages are based on net assets as of 9/30/14.
The portfolio is actively managed and current holdings may be different.
3
Table of Contents
Summary of Results
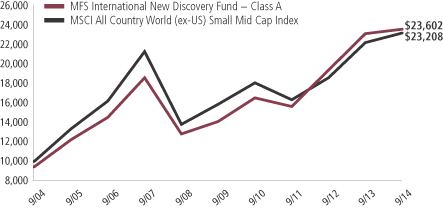
For the twelve months ended September 30, 2014, Class A shares of the MFS International New Discovery Fund (“fund”) provided a total return of 1.97%, at net asset value. This compares with a return of 4.52% for the fund’s benchmark, the MSCI All Country World (ex-US) Small Mid Cap Index.
Market Environment
Early in the period, equity markets advanced in response to improved economic fundamentals, having recovered from prior weakness stemming from concerns that the US Federal Reserve (“Fed”) would begin tapering its quantitative easing (“QE”) program. A general theme in the market was a rotation in investor allocations from fixed income to equities and emerging markets (“EM”) to developed markets, reflecting an anticipated acceleration in developed market growth rates relative to EM as well as a more equity-friendly macro backdrop amid increased volatility in EM debt. As the period progressed, the Fed’s decision to postpone QE tapering surprised markets. Favorable market reactions were tempered, however, by tense negotiations over US fiscal policy which resulted in a 16-day partial shutdown of the federal government and a short-term extension in the debt ceiling. The volatility was short-lived, however, as an extension of budget and debt ceiling deadlines allowed the government to re-open, and subsequent economic data reflected moderate but resilient US growth. Also well-received was the decision by the European Central Bank (“ECB”) to cut its policy rate as inflation pressures waned in the region. In addition, equity investors appeared to have concluded that there would be no major change in US monetary policy as a result of the nomination of Janet Yellen as the new Fed Chair for a term beginning in early 2014 and that tapering would have no major impact on the trajectory.
Later in the period, financial markets were forced to contend with a series of positive and negative return episodes. Geopolitical tensions flared in the Middle East and Russia/Ukraine. Market setbacks were short-lived, as improving economic growth in the US coupled with prospects for easier monetary policy in regions with slowing growth such as Japan, Europe and China, supported risk assets. For example, the ECB cut policy interest rates into negative territory and by the end of the period expectations were for additional rate cuts and the announcement for non-conventional easing measures. The decline in developed market government bond yields and credit spreads were also supportive for equity markets. At the end of the period, the US equity market was trading at all-time highs.
Detractors from Performance
Stock selection in the industrial goods & services sector was a key driver to underperformance relative to the MSCI All Country World (ex-US) Small Mid Cap Index. Holdings of poor-performing specialty engineering and construction company JGC (b) (Japan) detracted from relative performance. Shares came under pressure after the company reduced earnings guidance in response to lower realized profit margins on their current projects.
4
Table of Contents
Management Review – continued
Security selection and an overweight position in the retailing sector dampened relative performance. Holdings of fashion and beauty products maker Christian Dior (b) (France) weighed on relative performance. The stock struggled to gain ground during the reporting period due to downgrades by industry analysts and flat earnings results. Weak performance from LVMH (Louis Vuitton Moet Hennessy), in which the company owns forty percent of their stock, contributed to the company’s downgrade.
Stock selection in the energy and transortation sectors hindered relative performance. Within the energy sector, there were no individual securities that were among the fund’s top relative detractors. Within the transportation sector, the timing of the fund’s overweight position in Mexican aircraft transportation services company Controladora Vuela weighed on relative performance.
Elsewhere, the fund’s overweight positions in specialty chemical products maker Croda International (United Kingdom), U.K.-based customer services provider Serco Group, automobile parts manufacturer Ford Otomotiv Sanayi, Turkish mining company Iluka Resources, South Korean LED device manufacturer Seoul Semiconductor, and insurance company Brasil Insurance Participacoes dampened relative performance.
The fund’s cash and/or cash equivalents position during the period was also a detractor from relative performance. Under normal market conditions, the fund strives to be fully invested and generally holds cash to buy new holdings and to provide liquidity. In a period when equity markets rose, as measured by the fund’s benchmark, holding cash hurt performance versus the benchmark, which has no cash position.
Contributors to Performance
Stock selection in special products & services sector contributed to relative performance during the reporting period. The fund’s overweight position in distribution and outsourcing service provider Bunzl (United Kingdom) supported relative results. Shares of Bunzl spiked as the company benefited from consistent organic growth, accretion from their acquisitions, and increased demand during the reporting period. The timing of the fund’s overweight position in shares of strong-performing education services provider Kroton Educacional (Brazil) also helped.
Elsewhere, the fund’s out-of-benchmark holdings of automobile component manufacturer Motherson Sumi Systems (b) (India) and commercial bank Federal Bank (b) (India) bolstered relative performance as both stocks beat the benchmark during the reporting period. The fund’s overweight positions in apparel retailer Next Group (United Kingdom), home building company Bellway (United Kingdom), Switzerland-based medical device company Sonova, independent power producer Glow Energy (Thailand) contributed to relative performance. Holdings of Canada-based convenience store operator Alimentation Couche (b) and an overweight position in medical device maker Fisher & Paykel Healthcare (New Zealand) also helped.
During the reporting period, the fund’s relative currency exposure, resulting primarily from differences between the fund’s and the benchmark’s exposures to holdings of securities denominated in foreign currencies, was another contributor to relative
5
Table of Contents
Management Review – continued
performance. All of MFS’ investment decisions are driven by the fundamentals of each individual opportunity and as such, it is common for our funds to have different currency exposure than the benchmark.
Respectfully,
| David Antonelli | Peter Fruzzetti | Jose Luis Garcia | Robert Lau | |||
| Portfolio Manager | Portfolio Manager | Portfolio Manager | Portfolio Manager |
| (b) | Security is not a benchmark constituent. |
The views expressed in this report are those of the portfolio managers only through the end of the period of the report as stated on the cover and do not necessarily reflect the views of MFS or any other person in the MFS organization. These views are subject to change at any time based on market or other conditions, and MFS disclaims any responsibility to update such views. These views may not be relied upon as investment advice or an indication of trading intent on behalf of any MFS portfolio. References to specific securities are not recommendations of such securities, and may not be representative of any MFS portfolio’s current or future investments.
6
Table of Contents
PERFORMANCE SUMMARY THROUGH 9/30/14
The following chart illustrates a representative class of the fund’s historical performance in comparison to its benchmark(s). Performance results include the deduction of the maximum applicable sales charge and reflect the percentage change in net asset value, including reinvestment of dividends and capital gains distributions. The performance of other share classes will be greater than or less than that of the class depicted below. Benchmarks are unmanaged and may not be invested in directly. Benchmark returns do not reflect sales charges, commissions or expenses. (See Notes to Performance Summary.)
Performance data shown represents past performance and is no guarantee of future results. Investment return and principal value fluctuate so your shares, when sold, may be worth more or less than the original cost; current performance may be lower or higher than quoted. The performance shown does not reflect the deduction of taxes, if any, that a shareholder would pay on fund distributions or the redemption of fund shares.
Growth of a Hypothetical $10,000 Investment
7
Table of Contents
Performance Summary – continued
Total Returns through 9/30/14
Average annual without sales charge
| Share class | Class inception date | 1-yr | 5-yr | 10-yr | Life (t) | |||||||||
| A | 10/09/97 | 1.97% | 10.87% | 9.61% | N/A | |||||||||
| B | 10/02/00 | 1.18% | 10.05% | 8.83% | N/A | |||||||||
| C | 10/02/00 | 1.21% | 10.05% | 8.83% | N/A | |||||||||
| I | 10/09/97 | 2.19% | 11.14% | 9.92% | N/A | |||||||||
| R1 | 4/01/05 | 1.17% | 10.03% | N/A | 7.54% | |||||||||
| R2 | 10/31/03 | 1.68% | 10.60% | 9.31% | N/A | |||||||||
| R3 | 4/01/05 | 1.94% | 10.87% | N/A | 8.34% | |||||||||
| R4 | 4/01/05 | 2.23% | 11.14% | N/A | 8.63% | |||||||||
| R5 | 6/01/12 | 2.28% | N/A | N/A | 14.98% | |||||||||
| 529A | 7/31/02 | 1.92% | 10.80% | 9.46% | N/A | |||||||||
| 529B | 7/31/02 | 1.15% | 9.98% | 8.68% | N/A | |||||||||
| 529C | 7/31/02 | 1.13% | 9.97% | 8.68% | N/A | |||||||||
| Comparative benchmark | ||||||||||||||
| MSCI All Country World (ex-US) Small Mid Cap Index (f) | 4.52% | 7.90% | 8.78% | N/A | ||||||||||
| Average annual with sales charge | ||||||||||||||
| A With initial Sales Charge (5.75%) | (3.89)% | 9.56% | 8.97% | N/A | ||||||||||
| B With CDSC (Declining over six years from 4% to 0%) (v) | (2.82)% | 9.77% | 8.83% | N/A | ||||||||||
| C With CDSC (1% for 12 months) (v) | 0.21% | 10.05% | 8.83% | N/A | ||||||||||
| 529A With initial Sales Charge (5.75%) | (3.94)% | 9.50% | 8.81% | N/A | ||||||||||
| 529B With CDSC (Declining over six years from 4% to 0%) (v) | (2.85)% | 9.70% | 8.68% | N/A | ||||||||||
| 529C With CDSC (1% for 12 months) (v) | 0.13% | 9.97% | 8.68% | N/A | ||||||||||
CDSC – Contingent Deferred Sales Charge.
Class I, R1, R2, R3, R4, and R5 shares do not have a sales charge.
| (f) | Source: FactSet Research Systems Inc. |
| (t) | For the period from the class inception date through the stated period end (for those share classes with less than 10 years of performance history). No comparative benchmark performance information is provided for “life” periods. (See Notes to Performance Summary.) |
| (v) | Assuming redemption at the end of the applicable period. |
8
Table of Contents
Performance Summary – continued
Benchmark Definition
MSCI All Country World (ex-US) Small Mid Cap Index – a free float weighted index that is designed to measure equity market performance of small and mid cap companies across global developed and emerging market countries, excluding the United States.
It is not possible to invest directly in an index.
Notes to Performance Summary
Class 529 shares are only available in conjunction with qualified tuition programs, such as the MFS 529 Savings Plan. There also is an additional fee, which is detailed in the program description, on qualified tuition programs. If this fee was reflected, the performance for Class 529 shares would have been lower. This annual fee is waived for Oregon residents and for those accounts with assets of $25,000 or more.
Average annual total return represents the average annual change in value for each share class for the periods presented. Life returns are presented where the share class has less than 10 years of performance history and represent the average annual total return from the class inception date to the stated period end date. As the fund’s share classes may have different inception dates, the life returns may represent different time periods and may not be comparable. As a result, no comparative benchmark performance information is provided for life periods.
Performance results reflect any applicable expense subsidies and waivers in effect during the periods shown. Without such subsidies and waivers the fund’s performance results would be less favorable. Please see the prospectus and financial statements for complete details.
Performance results do not include adjustments made for financial reporting purposes in accordance with U.S. generally accepted accounting principles and may differ from amounts reported in the financial highlights.
From time to time the fund may receive proceeds from litigation settlements, without which performance would be lower.
9
Table of Contents
Fund expenses borne by the shareholders during the period, April 1, 2014 through September 30, 2014
As a shareholder of the fund, you incur two types of costs: (1) transaction costs, including sales charges (loads) on certain purchase or redemption payments, and (2) ongoing costs, including management fees; distribution and service (12b-1) fees; and other fund expenses. This example is intended to help you understand your ongoing costs (in dollars) of investing in the fund and to compare these costs with the ongoing costs of investing in other mutual funds.
The example is based on an investment of $1,000 invested at the beginning of the period and held for the entire period April 1, 2014 through September 30, 2014.
Actual Expenses
The first line for each share class in the following table provides information about actual account values and actual expenses. You may use the information in this line, together with the amount you invested, to estimate the expenses that you paid over the period. Simply divide your account value by $1,000 (for example, an $8,600 account value divided by $1,000 = 8.6), then multiply the result by the number in the first line under the heading entitled “Expenses Paid During Period” to estimate the expenses you paid on your account during this period.
Hypothetical Example for Comparison Purposes
The second line for each share class in the following table provides information about hypothetical account values and hypothetical expenses based on the fund’s actual expense ratio and an assumed rate of return of 5% per year before expenses, which is not the fund’s actual return. The hypothetical account values and expenses may not be used to estimate the actual ending account balance or expenses you paid for the period. You may use this information to compare the ongoing costs of investing in the fund and other funds. To do so, compare this 5% hypothetical example with the 5% hypothetical examples that appear in the shareholder reports of the other funds.
Please note that the expenses shown in the table are meant to highlight your ongoing costs only and do not reflect any transactional costs, such as sales charges (loads). Therefore, the second line for each share class in the table is useful in comparing ongoing costs only, and will not help you determine the relative total costs of owning different funds. In addition, if these transactional costs were included, your costs would have been higher.
10
Table of Contents
Expense Table – continued
Share Class | Annualized Ratio | Beginning Account Value 4/01/14 | Ending Account Value | Expenses Paid During | ||||||||||||||
| A | Actual | 1.34% | $1,000.00 | $969.16 | $6.61 | |||||||||||||
| Hypothetical (h) | 1.34% | $1,000.00 | $1,018.35 | $6.78 | ||||||||||||||
| B | Actual | 2.09% | $1,000.00 | $965.27 | $10.30 | |||||||||||||
| Hypothetical (h) | 2.09% | $1,000.00 | $1,014.59 | $10.56 | ||||||||||||||
| C | Actual | 2.09% | $1,000.00 | $965.53 | $10.30 | |||||||||||||
| Hypothetical (h) | 2.09% | $1,000.00 | $1,014.59 | $10.56 | ||||||||||||||
| I | Actual | 1.09% | $1,000.00 | $970.33 | $5.38 | |||||||||||||
| Hypothetical (h) | 1.09% | $1,000.00 | $1,019.60 | $5.52 | ||||||||||||||
| R1 | Actual | 2.09% | $1,000.00 | $965.32 | $10.30 | |||||||||||||
| Hypothetical (h) | 2.09% | $1,000.00 | $1,014.59 | $10.56 | ||||||||||||||
| R2 | Actual | 1.59% | $1,000.00 | $967.99 | $7.84 | |||||||||||||
| Hypothetical (h) | 1.59% | $1,000.00 | $1,017.10 | $8.04 | ||||||||||||||
| R3 | Actual | 1.34% | $1,000.00 | $969.28 | $6.62 | |||||||||||||
| Hypothetical (h) | 1.34% | $1,000.00 | $1,018.35 | $6.78 | ||||||||||||||
| R4 | Actual | 1.09% | $1,000.00 | $970.55 | $5.38 | |||||||||||||
| Hypothetical (h) | 1.09% | $1,000.00 | $1,019.60 | $5.52 | ||||||||||||||
| R5 | Actual | 0.98% | $1,000.00 | $970.69 | $4.84 | |||||||||||||
| Hypothetical (h) | 0.98% | $1,000.00 | $1,020.16 | $4.96 | ||||||||||||||
| 529A | Actual | 1.34% | $1,000.00 | $969.06 | $6.61 | |||||||||||||
| Hypothetical (h) | 1.34% | $1,000.00 | $1,018.35 | $6.78 | ||||||||||||||
| 529B | Actual | 2.13% | $1,000.00 | $965.41 | $10.49 | |||||||||||||
| Hypothetical (h) | 2.13% | $1,000.00 | $1,014.39 | $10.76 | ||||||||||||||
| 529C | Actual | 2.14% | $1,000.00 | $965.27 | $10.54 | |||||||||||||
| Hypothetical (h) | 2.14% | $1,000.00 | $1,014.34 | $10.81 | ||||||||||||||
| (h) | 5% class return per year before expenses. |
| (p) | “Expenses Paid During Period” are equal to each class’s annualized expense ratio, as shown above, multiplied by the average account value over the period, multiplied by 183/365 (to reflect the one-half year period). Expenses paid do not include any applicable sales charges (loads). If these transaction costs had been included, your costs would have been higher. |
Notes to Expense Table
Each class with a Rule 12b-1 service fee is subject to a rebate of a portion of such fee. Such rebates are included in the expense ratios above. For Class 529A and Class 529B shares, this rebate reduced the expense ratios above by 0.05% and 0.01%, respectively. See Note 3 in the Notes to Financial Statements for additional information.
11
Table of Contents
Expense Table – continued
Changes to the fund’s fee arrangements occurred during the six month period. Had these fee changes been in effect throughout the entire six month period, the annualized expense ratios, the actual expenses paid during the period and the hypothetical expenses paid during the period would have been approximately 1.31%, $6.47 and $6.63 for Class A, 2.06%, $10.15 and $10.40 for Class B, 2.06%, $10.15 and $10.40 for Class C, 1.06%, $5.24 and $5.37 for Class I, 2.06%, $10.15 and $10.40 for Class R1, 1.56%, $7.70 and $7.89 for Class R2, 1.31%, $6.47 and $6.63 for Class R3, 1.06%, $5.24 and $5.37 for Class R4, 0.95%, $4.69 and $4.81 for Class R5, 1.31%, $6.47 and $6.63 for Class 529A, 2.10%, $10.35 and $10.61 for Class 529B, and 2.11%, $10.40 and $10.66 for Class 529C, respectively. For further information about the fund’s fee arrangements and changes to those fee arrangements, please see Note 3 in the Notes to Financial Statements.
12
Table of Contents
9/30/14
The Portfolio of Investments is a complete list of all securities owned by your fund. It is categorized by broad-based asset classes.
| Common Stocks - 96.9% | ||||||||
| Issuer | Shares/Par | Value ($) | ||||||
| Aerospace - 0.9% | ||||||||
| Cobham PLC | 2,610,209 | $ | 12,250,708 | |||||
| Meggitt PLC | 2,361,020 | 17,269,985 | ||||||
| MTU Aero Engines AG | 155,880 | 13,289,117 | ||||||
| Saab AB, “B” | 199,440 | 4,891,258 | ||||||
|
| |||||||
| $ | 47,701,068 | |||||||
| Airlines - 1.9% | ||||||||
| Controladora Vuela Compania de Aviacion S.A.B. de C.V., ADR (a) | 1,050,450 | $ | 9,117,906 | |||||
| Copa Holdings S.A., “A” | 308,483 | 33,097,141 | ||||||
| Koninklijke Vopak N.V. | 184,240 | 9,919,982 | ||||||
| Stagecoach Group PLC | 6,988,526 | 41,562,728 | ||||||
|
| |||||||
| $ | 93,697,757 | |||||||
| Alcoholic Beverages - 0.4% | ||||||||
| Carlsberg Group | 147,199 | $ | 13,058,442 | |||||
| Davide Campari-Milano S.p.A. | 1,242,119 | 8,966,026 | ||||||
|
| |||||||
| $ | 22,024,468 | |||||||
| Apparel Manufacturers - 2.0% | ||||||||
| Burberry Group PLC | 506,753 | $ | 12,361,307 | |||||
| Christian Dior S.A. | 263,947 | 44,137,942 | ||||||
| Cia. Hering S.A. | 430,500 | 4,361,720 | ||||||
| Gerry Weber International AG | 380,243 | 15,015,514 | ||||||
| Global Brands Group Holding Ltd. (a) | 4,225,138 | 930,473 | ||||||
| Li & Fung Ltd. | 4,225,138 | 4,799,284 | ||||||
| Stella International Holdings Ltd. | 7,507,591 | 19,482,406 | ||||||
|
| |||||||
| $ | 101,088,646 | |||||||
| Automotive - 2.6% | ||||||||
| D’Ieteren S.A. | 261,869 | $ | 10,164,059 | |||||
| ElringKlinger AG | 270,538 | 7,995,190 | ||||||
| Ford Otomotiv Sanayi S.A. (a) | 290,456 | 3,336,375 | ||||||
| GKN PLC | 2,397,446 | 12,310,226 | ||||||
| Guangzhou Automobile Group Co. Ltd., “H” | 25,307,750 | 24,477,125 | ||||||
| Koito Manufacturing Co. Ltd. | 715,000 | 19,420,880 | ||||||
| Motherson Sumi Systems Ltd. | 2,453,687 | 15,718,932 | ||||||
| Takata Corp. | 725,300 | 16,453,580 | ||||||
| Tofas Turk Otomobil Fabriikasi A.S. | 595,860 | 3,350,248 | ||||||
| USS Co. Ltd. | 1,161,900 | 17,797,967 | ||||||
|
| |||||||
| $ | 131,024,582 | |||||||
13
Table of Contents
Portfolio of Investments – continued
| Issuer | Shares/Par | Value ($) | ||||||
| Common Stocks - continued | ||||||||
| Biotechnology - 0.2% | ||||||||
| Abcam PLC | 550,379 | $ | 3,582,757 | |||||
| Lonza Group AG | 57,685 | 6,958,705 | ||||||
|
| |||||||
| $ | 10,541,462 | |||||||
| Broadcasting - 0.8% | ||||||||
| Havas S.A. | 2,199,204 | $ | 16,979,836 | |||||
| Nippon Television Holdings, Inc. | 610,800 | 9,322,810 | ||||||
| ProSiebenSat.1 Media AG | 160,644 | 6,394,152 | ||||||
| Proto Corp. | 568,700 | 8,291,327 | ||||||
|
| |||||||
| $ | 40,988,125 | |||||||
| Brokerage & Asset Managers - 4.9% | ||||||||
| Aberdeen Asset Management PLC | 6,458,597 | $ | 41,705,316 | |||||
| Bolsa Mexicana de Valores S.A. de C.V. | 5,397,996 | 11,643,643 | ||||||
| CETIP S.A. Mercados Organizados | 985,273 | 12,196,414 | ||||||
| Computershare Ltd. | 2,134,790 | 22,728,442 | ||||||
| Daiwa Securities Group, Inc. | 2,388,000 | 18,918,926 | ||||||
| Hargreaves Lansdown PLC | 1,114,687 | 16,972,585 | ||||||
| ICAP PLC | 1,982,375 | 12,394,700 | ||||||
| IG Group Holdings PLC | 2,141,489 | 20,639,107 | ||||||
| Osaka Securities Exchange Co. Ltd. | 222,700 | 5,285,508 | ||||||
| Rathbone Brothers PLC | 947,957 | 29,306,403 | ||||||
| Schroders PLC | 1,156,966 | 44,612,855 | ||||||
| Yuanta Financial Holding Co. Ltd. | 26,005,644 | 12,823,507 | ||||||
|
| |||||||
| $ | 249,227,406 | |||||||
| Business Services - 12.1% | ||||||||
| Amadeus Fire AG | 183,730 | $ | 12,846,851 | |||||
| Amadeus Holdings AG | 1,729,808 | 64,432,755 | ||||||
| Ashtead Group PLC | 521,672 | 8,760,565 | ||||||
| Brenntag AG | 506,043 | 24,845,847 | ||||||
| Brunel International N.V. | 295,818 | 6,744,348 | ||||||
| Bunzl PLC | 6,163,489 | 160,136,345 | ||||||
| Capgemini | 157,646 | 11,290,957 | ||||||
| Capita PLC | 1,705,503 | 32,063,566 | ||||||
| Cognizant Technology Solutions Corp., “A” (a) | 446,266 | 19,979,329 | ||||||
| Compass Group PLC | 2,423,482 | 39,150,769 | ||||||
| CTS Eventim AG | 270,894 | 7,653,955 | ||||||
| DKSH Holding Ltd. | 50,944 | 3,779,768 | ||||||
| Edenred | 303,993 | 7,490,673 | ||||||
| Electrocomponents PLC | 1,448,122 | 5,202,008 | ||||||
| Exova Group PLC (a) | 3,324,060 | 9,511,232 | ||||||
| Intertek Group PLC | 632,964 | 26,804,570 | ||||||
| LPS Brasil - Consultoria de Imoveis S.A. | 1,362,800 | 6,074,210 | ||||||
14
Table of Contents
Portfolio of Investments – continued
| Issuer | Shares/Par | Value ($) | ||||||
| Common Stocks - continued | ||||||||
| Business Services - continued | ||||||||
| LSL Property Services PLC | 2,219,605 | $ | 11,730,499 | |||||
| MITIE Group PLC | 1,841,882 | 8,566,871 | ||||||
| Nomura Research Institute Ltd. | 741,800 | 23,977,032 | ||||||
| Premier Farnell PLC | 2,240,743 | 6,611,296 | ||||||
| Rightmove PLC | 823,202 | 28,536,142 | ||||||
| Serco Group PLC | 3,846,675 | 17,841,302 | ||||||
| Sodexo | 371,989 | 36,307,663 | ||||||
| Travis Perkins PLC | 386,837 | 10,381,674 | ||||||
| Wolseley PLC | 75,502 | 3,968,210 | ||||||
| Zoopla Property Group PLC (a) | 4,860,060 | 18,641,444 | ||||||
|
| |||||||
| $ | 613,329,881 | |||||||
| Cable TV - 2.1% | ||||||||
| Astro Malaysia Holdings Berhad | 34,486,259 | $ | 35,216,878 | |||||
| Eutelsat Communications | 534,604 | 17,237,749 | ||||||
| SES | 490,340 | 16,953,993 | ||||||
| Ziggo N.V. (a) | 738,569 | 34,481,925 | ||||||
|
| |||||||
| $ | 103,890,545 | |||||||
| Chemicals - 0.5% | ||||||||
| Orica Ltd. | 766,603 | $ | 12,685,666 | |||||
| Victrex PLC | 478,278 | 12,452,287 | ||||||
|
| |||||||
| $ | 25,137,953 | |||||||
| Computer Software - 1.9% | ||||||||
| AVEVA Group PLC | 202,796 | $ | 5,059,658 | |||||
| Dassault Systemes S.A. | 106,732 | 6,831,213 | ||||||
| OBIC Business Consultants Co. Ltd. | 316,800 | 9,055,555 | ||||||
| OBIC Co. Ltd. | 1,853,600 | 66,251,306 | ||||||
| Totvs S.A. | 625,528 | 9,514,210 | ||||||
|
| |||||||
| $ | 96,711,942 | |||||||
| Computer Software - Systems - 1.5% | ||||||||
| Brother Industries Ltd. | 1,293,000 | $ | 23,920,647 | |||||
| Konica Minolta, Inc. | 1,102,000 | 11,896,677 | ||||||
| Linx S.A. | 421,700 | 8,820,770 | ||||||
| NICE Systems Ltd. | 413,463 | 16,749,801 | ||||||
| Venture Corp. Ltd. | 2,177,000 | 12,986,572 | ||||||
|
| |||||||
| $ | 74,374,467 | |||||||
| Conglomerates - 1.1% | ||||||||
| DCC PLC | 470,603 | $ | 26,014,741 | |||||
| First Pacific Co. Ltd. | 20,751,150 | 21,620,096 | ||||||
| Smiths Group PLC | 335,505 | 6,874,946 | ||||||
|
| |||||||
| $ | 54,509,783 | |||||||
15
Table of Contents
Portfolio of Investments – continued
| Issuer | Shares/Par | Value ($) | ||||||
| Common Stocks - continued | ||||||||
| Construction - 2.9% | ||||||||
| Bellway PLC | 2,694,534 | $ | 68,094,231 | |||||
| DuluxGroup Ltd. | 2,762,757 | 13,449,261 | ||||||
| Geberit AG | 94,956 | 30,588,833 | ||||||
| Semen Indonesia Persero Tbk PT | 5,152,720 | 6,522,832 | ||||||
| Techtronic Industries Co. Ltd. | 9,657,500 | 27,922,094 | ||||||
|
| |||||||
| $ | 146,577,251 | |||||||
| Consumer Products - 2.5% | ||||||||
| Beiersdorf AG | 267,000 | $ | 22,304,680 | |||||
| Dabur India Ltd. | 7,147,854 | 25,710,748 | ||||||
| Kimberly-Clark de Mexico S.A. de C.V., “A” | 3,253,524 | 7,679,290 | ||||||
| LG Household & Healthcare Ltd. | 32,999 | 15,854,530 | ||||||
| Milbon Co. Ltd. | 241,596 | 8,018,322 | ||||||
| PZ Cussons | 531,867 | 3,153,198 | ||||||
| Shiseido Co. Ltd. | 222,500 | 3,670,971 | ||||||
| Societe BIC S.A. | 49,516 | 6,369,804 | ||||||
| Uni-Charm Corp. | 1,405,500 | 32,044,247 | ||||||
|
| |||||||
| $ | 124,805,790 | |||||||
| Consumer Services - 2.3% | ||||||||
| Abril Educacao S.A. (a) | 1,550,670 | $ | 8,203,933 | |||||
| Dignity PLC | 1,700,539 | 40,387,541 | ||||||
| Estacio Participacoes S.A. | 1,736,620 | 18,049,071 | ||||||
| GAEC Anima Educacao S.A. | 734,900 | 8,883,951 | ||||||
| Kakaku.com, Inc. | 289,200 | 4,108,262 | ||||||
| Kroton Educacional S.A. | 2,718,816 | 17,083,195 | ||||||
| Localiza Rent a Car S.A. | 701,513 | 10,171,258 | ||||||
| Park24 Co Ltd. | 321,000 | 5,121,951 | ||||||
| Rakuten | 180,200 | 2,075,155 | ||||||
|
| |||||||
| $ | 114,084,317 | |||||||
| Containers - 0.8% | ||||||||
| Klabin S.A., IEU | 1,813,300 | $ | 8,771,105 | |||||
| Mayr-Melnhof Karton AG | 127,604 | 13,536,633 | ||||||
| Viscofan S.A. | 320,593 | 17,545,697 | ||||||
|
| |||||||
| $ | 39,853,435 | |||||||
| Electrical Equipment - 2.1% | ||||||||
| Bajaj Electricals Ltd. | 2,117,960 | $ | 9,173,483 | |||||
| Domino Printing Sciences PLC | 1,206,483 | 11,950,487 | ||||||
| IMI PLC | 595,477 | 11,822,851 | ||||||
| Kaba Holding AG | 4,278 | 1,984,933 | ||||||
| Keyence Corp. | 15,500 | 6,736,335 | ||||||
| Legrand S.A. | 238,002 | 12,344,358 | ||||||
16
Table of Contents
Portfolio of Investments – continued
| Issuer | Shares/Par | Value ($) | ||||||
| Common Stocks - continued | ||||||||
| Electrical Equipment - continued | ||||||||
| OMRON Corp. | 103,621 | $ | 4,705,107 | |||||
| Pfeiffer Vacuum Technology AG | 69,906 | 5,884,847 | ||||||
| Sensata Technologies Holding B.V. (a) | 312,284 | 13,906,007 | ||||||
| Spectris PLC | 920,877 | 26,874,852 | ||||||
|
| |||||||
| $ | 105,383,260 | |||||||
| Electronics - 2.9% | ||||||||
| Advantech Co. Ltd. | 2,079,893 | $ | 14,700,340 | |||||
| ASM International N.V. | 601,480 | 21,823,141 | ||||||
| Chroma Ate, Inc. | 8,414,000 | 23,372,606 | ||||||
| Halma PLC | 1,384,817 | 13,677,385 | ||||||
| Hirose Electric Co. Ltd. | 79,708 | 9,840,404 | ||||||
| Infineon Technologies AG | 1,431,553 | 14,813,952 | ||||||
| Seoul Semiconductor Co. Ltd. | 515,028 | 11,689,098 | ||||||
| Siliconware Precision Industries Co. | 15,848,000 | 21,750,982 | ||||||
| Stanley Electric Co. Ltd. | 612,531 | 13,247,536 | ||||||
|
| |||||||
| $ | 144,915,444 | |||||||
| Energy - Independent - 1.7% | ||||||||
| Cairn Energy PLC (a) | 1,719,978 | $ | 4,891,703 | |||||
| Canadian Oil Sands Ltd. | 620,200 | 11,440,986 | ||||||
| Gran Tierra Energy, Inc. (a) | 5,518,989 | 30,503,631 | ||||||
| Japan Petroleum Exploration Co. Ltd. | 158,700 | 6,091,881 | ||||||
| MEG Energy Corp. (a) | 438,942 | 13,474,553 | ||||||
| TORC Oil & Gas Ltd. (l) | 1,105,029 | 12,649,200 | ||||||
| Tourmaline Oil Corp. (a) | 163,093 | 7,227,381 | ||||||
|
| |||||||
| $ | 86,279,335 | |||||||
| Engineering - Construction - 1.1% | ||||||||
| JGC Corp. | 965,000 | $ | 26,343,378 | |||||
| Mills Estruturas e Servicos de Engenharia S.A. | 1,379,600 | 10,088,792 | ||||||
| Outotec Oyj (l) | 428,741 | 3,239,797 | ||||||
| Promotora y Operadora de Infraestructura S.A.B. de C.V. (a) | 954,760 | 13,124,440 | ||||||
| Toshiba Plant Kensetsu Co. Ltd. | 291,000 | 4,897,980 | ||||||
|
| |||||||
| $ | 57,694,387 | |||||||
| Food & Beverages - 3.7% | ||||||||
| Arca Continental S.A.B de C.V. | 1,341,874 | $ | 9,200,936 | |||||
| Booker Group PLC | 15,095,999 | 29,905,857 | ||||||
| Britvic PLC | 833,189 | 8,974,439 | ||||||
| Calbee, Inc. | 399,400 | 13,073,590 | ||||||
| Chr. Hansen Holding A.S. | 429,346 | 16,595,264 | ||||||
| Coca-Cola HBC AG | 320,235 | 6,906,076 | ||||||
| Grupo Lala S.A.B. de C.V. | 3,858,600 | 9,409,117 | ||||||
17
Table of Contents
Portfolio of Investments – continued
| Issuer | Shares/Par | Value ($) | ||||||
| Common Stocks - continued | ||||||||
| Food & Beverages - continued | ||||||||
| Kerry Group PLC | 292,910 | $ | 20,651,166 | |||||
| M. Dias Branco S.A. Industria e Comercio de Alimentos | 408,800 | 16,303,567 | ||||||
| P/f Bakkafrost | 794,729 | 17,132,179 | ||||||
| Shenguan Holdings Group Ltd. | 44,005,505 | 14,791,576 | ||||||
| Super Group Ltd. | 4,392,000 | 4,389,590 | ||||||
| Tate & Lyle PLC | 488,682 | 4,660,928 | ||||||
| Want Want China Holdings Ltd. | 14,159,146 | 17,651,408 | ||||||
|
| |||||||
| $ | 189,645,693 | |||||||
| Food & Drug Stores - 2.2% | ||||||||
| Alimentation Couche-Tard, Inc. | 813,141 | $ | 25,999,892 | |||||
| Cosmos Pharmaceutical Corp. | 108,000 | 13,697,561 | ||||||
| Dairy Farm International Holdings Ltd. | 2,009,409 | 19,149,668 | ||||||
| E-Mart Co. Ltd. | 40,821 | 8,916,598 | ||||||
| FamilyMart Co. Ltd. | 130,000 | 4,960,565 | ||||||
| Lawson, Inc. | 303,700 | 21,238,924 | ||||||
| Sundrug Co. Ltd. | 280,100 | 12,450,308 | ||||||
| Welcia Holdings Co. Ltd. | 65,800 | 1,961,851 | ||||||
| Wumart Stores, Inc. | 5,319,514 | 4,973,653 | ||||||
|
| |||||||
| $ | 113,349,020 | |||||||
| Furniture & Appliances - 0.1% | ||||||||
| SEB S.A. | 39,266 | $ | 2,961,809 | |||||
| Gaming & Lodging - 1.2% | ||||||||
| Ladbrokes PLC | 1,528,474 | $ | 3,206,384 | |||||
| Minor International Public Co. Ltd. | 19,505,259 | 22,257,350 | ||||||
| Paddy Power PLC | 161,279 | 11,603,839 | ||||||
| Shangri-La Asia Ltd. | 9,386,495 | 13,925,887 | ||||||
| William Hill PLC | 1,783,087 | 10,644,968 | ||||||
|
| |||||||
| $ | 61,638,428 | |||||||
| General Merchandise - 1.9% | ||||||||
| B&M European Value Retail S.A. (a) | 4,007,940 | $ | 17,868,047 | |||||
| Dollarama, Inc. | 520,242 | 44,129,640 | ||||||
| Mitra Adiperkasa Tbk. | 16,240,692 | 7,330,637 | ||||||
| Poundland Group PLC (a) | 1,324,210 | 6,779,414 | ||||||
| Seria Co. Ltd. | 108,300 | 4,127,595 | ||||||
| Woolworths Holdings Ltd. | 2,783,123 | 17,244,743 | ||||||
|
| |||||||
| $ | 97,480,076 | |||||||
| Health Maintenance Organizations - 0.5% | ||||||||
| Odontoprev S.A. | 4,081,100 | $ | 14,838,848 | |||||
18
Table of Contents
Portfolio of Investments – continued
| Issuer | Shares/Par | Value ($) | ||||||
| Common Stocks - continued | ||||||||
| Health Maintenance Organizations - continued | ||||||||
| Qualicorp S.A. (a) | 1,117,165 | $ | 11,054,126 | |||||
|
| |||||||
| $ | 25,892,974 | |||||||
| Insurance - 3.5% | ||||||||
| Admiral Group PLC | 354,924 | $ | 7,357,939 | |||||
| Amlin PLC | 2,552,151 | 17,937,207 | ||||||
| Austbrokers Holdings Ltd. | 1,685,572 | 14,905,605 | ||||||
| Brasil Insurance Paticipaco e Administracao S.A. | 1,536,800 | 5,022,735 | ||||||
| Catlin Group Ltd. | 3,478,177 | 29,410,718 | ||||||
| Hiscox Ltd. | 4,010,417 | 40,959,370 | ||||||
| Insurance Australia Group Ltd. | 1,020,578 | 5,468,630 | ||||||
| Jardine Lloyd Thompson Group PLC | 1,478,438 | 23,320,569 | ||||||
| Samsung Fire & Marine Insurance Co. Ltd. | 40,976 | 10,969,647 | ||||||
| Sony Financial Holdings, Inc. | 876,900 | 14,183,912 | ||||||
| Storebrand A.S.A. (a) | 1,722,818 | 9,589,162 | ||||||
|
| |||||||
| $ | 179,125,494 | |||||||
| Internet - 0.4% | ||||||||
| 51job, Inc., ADR (a)(l) | 600,240 | $ | 17,965,183 | |||||
| Leisure & Toys - 0.1% | ||||||||
| Shimano, Inc. | 57,700 | $ | 7,018,172 | |||||
| Machinery & Tools - 2.5% | ||||||||
| Aalberts Industries N.V. | 242,140 | $ | 6,263,420 | |||||
| Burckhardt Compression Holding AG | 33,597 | 15,517,864 | ||||||
| Faiveley S.A. | 35,347 | 2,253,235 | ||||||
| Finning International, Inc. | 386,833 | 10,911,250 | ||||||
| GEA Group AG | 862,720 | 37,509,225 | ||||||
| GLORY Ltd. | 95,200 | 2,686,519 | ||||||
| Haitian International Holdings Ltd. | 1,788,000 | 4,061,936 | ||||||
| Neopost S.A. | 167,887 | 12,339,171 | ||||||
| Rotork PLC | 213,210 | 9,529,656 | ||||||
| Spirax-Sarco Engineering PLC | 288,928 | 13,153,031 | ||||||
| T.K. Corp. (a) | 850,765 | 12,536,741 | ||||||
|
| |||||||
| $ | 126,762,048 | |||||||
| Medical & Health Technology & Services - 1.1% | ||||||||
| Hogy Medical Co. Ltd. | 51,200 | $ | 2,712,305 | |||||
| Kobayashi Pharmaceutical Co. Ltd. | 401,300 | 24,515,250 | ||||||
| Miraca Holdings, Inc. | 630,400 | 26,066,688 | ||||||
|
| |||||||
| $ | 53,294,243 | |||||||
19
Table of Contents
Portfolio of Investments – continued
| Issuer | Shares/Par | Value ($) | ||||||
| Common Stocks - continued | ||||||||
| Medical Equipment - 3.9% | ||||||||
| Ansell Ltd. | 1,323,372 | $ | 22,536,293 | |||||
| Fisher & Paykel Healthcare Corp. Ltd. | 7,085,395 | 28,706,996 | ||||||
| Nakanishi, Inc. | 466,000 | 17,165,626 | ||||||
| Nihon Kohden Corp. | 260,800 | 13,696,904 | ||||||
| ResMed, Inc. (l) | 2,865,570 | 14,250,835 | ||||||
| Smith & Nephew PLC | 846,063 | 14,211,452 | ||||||
| Sonova Holding AG | 346,486 | 55,294,149 | ||||||
| Sysmex Corp. | 181,600 | 7,302,083 | ||||||
| Terumo Corp. | 366,600 | 8,787,704 | ||||||
| Top Glove Corp. | 8,069,577 | 12,176,316 | ||||||
| William Demant Holdings A/S (a) | 60,376 | 4,631,502 | ||||||
|
| |||||||
| $ | 198,759,860 | |||||||
| Metals & Mining - 0.5% | ||||||||
| Iluka Resources Ltd. | 1,062,416 | $ | 7,311,359 | |||||
| MOIL Ltd. | 4,200,697 | 19,466,313 | ||||||
|
| |||||||
| $ | 26,777,672 | |||||||
| Network & Telecom - 0.3% | ||||||||
| VTech Holdings Ltd. | 1,051,665 | $ | 12,975,074 | |||||
| Oil Services - 1.2% | ||||||||
| AMEC PLC | 627,913 | $ | 11,177,766 | |||||
| Fugro N.V. | 176,598 | 5,345,444 | ||||||
| John Wood Group PLC | 955,796 | 11,692,237 | ||||||
| Petroleum Geo-Services A.S.A | 239,848 | 1,516,983 | ||||||
| Technip | 215,380 | 18,071,827 | ||||||
| WorleyParsons Ltd. | 841,730 | 11,305,222 | ||||||
|
| |||||||
| $ | 59,109,479 | |||||||
| Other Banks & Diversified Financials - 6.0% | ||||||||
| Aeon Financial Service Co. Ltd. | 730,200 | $ | 15,625,980 | |||||
| Aeon Thana Sinsap (Thailand) PLC, NVDR | 1,330,200 | 4,594,677 | ||||||
| AEON Thana Sinsap Public Co. Ltd. | 1,588,300 | 5,486,187 | ||||||
| BDO Unibank, Inc. | 14,266,390 | 31,169,730 | ||||||
| Canadian Western Bank | 361,061 | 12,702,177 | ||||||
| Chiba Bank Ltd. | 2,538,451 | 17,659,796 | ||||||
| Credicorp Ltd. | 211,464 | 32,436,463 | ||||||
| E.Sun Financial Holding Co. Ltd. | 40,660,586 | 24,661,412 | ||||||
| Federal Bank Ltd. | 14,223,575 | 28,983,758 | ||||||
| Julius Baer Group Ltd. | 175,283 | 7,820,461 | ||||||
| Jyske Bank (a) | 664,957 | 35,805,175 | ||||||
| Public Bank Berhad | 2,503,377 | 14,422,748 | ||||||
20
Table of Contents
Portfolio of Investments – continued
| Issuer | Shares/Par | Value ($) | ||||||
| Common Stocks - continued | ||||||||
| Other Banks & Diversified Financials - continued | ||||||||
| Security Bank Corp. | 7,267,050 | $ | 23,771,443 | |||||
| Shizuoka Bank Ltd. | 1,025,000 | 10,551,402 | ||||||
| Sydbank A/S (a) | 1,301,137 | 39,585,772 | ||||||
|
| |||||||
| $ | 305,277,181 | |||||||
| Pharmaceuticals - 2.0% | ||||||||
| Genomma Lab Internacional S.A., “B” (a) | 5,479,288 | $ | 13,165,305 | |||||
| Hisamitsu Pharmaceutical Co., Inc. | 97,000 | 3,484,659 | ||||||
| KYORIN Holdings Ltd. | 377,000 | 7,651,716 | ||||||
| Santen Pharmaceutical Co. Ltd. | 570,600 | 31,944,235 | ||||||
| Tsumura & Co. | 513,000 | 11,445,735 | ||||||
| Virbac SA | 153,803 | 32,293,550 | ||||||
|
| |||||||
| $ | 99,985,200 | |||||||
| Pollution Control - 0.3% | ||||||||
| Daiseki Co. Ltd. | 741,100 | $ | 13,798,279 | |||||
| Railroad & Shipping - 0.3% | ||||||||
| Pacific Basin Shipping Ltd. | 16,090,752 | $ | 8,703,472 | |||||
| Precious Shipping Public Co. Ltd. | 9,349,818 | 6,920,451 | ||||||
|
| |||||||
| $ | 15,623,923 | |||||||
| Real Estate - 2.5% | ||||||||
| Ascendas India Trust, REIT | 33,778,000 | $ | 20,520,459 | |||||
| Brasil Brokers Participacoes S.A. | 2,511,100 | 3,395,666 | ||||||
| Concentradora Fibra Danhos S.A. de C.V., REIT | 4,554,566 | 12,276,184 | ||||||
| Concentradora Fibra Hotelera Mexicana S.A. de C.V., REIT | 10,217,900 | 17,901,581 | ||||||
| Deutsche Wohnen AG | 1,186,399 | 25,354,303 | ||||||
| Foxtons Group PLC | 2,017,570 | 6,983,339 | ||||||
| IGB Trust, REIT | 17,393,700 | 6,998,837 | ||||||
| LEG Immobilien AG | 179,700 | 12,453,848 | ||||||
| Macquarie Mexico Real Estate S.A. de C.V., REIT | 768,656 | 1,353,540 | ||||||
| Midland Holdings Ltd. (a) | 10,572,000 | 5,105,701 | ||||||
| Prologis Peroperty Mexico S.A. de C.V., REIT | 5,076,339 | 10,673,900 | ||||||
| TAG Immobilien AG | 237,520 | 2,684,414 | ||||||
|
| |||||||
| $ | 125,701,772 | |||||||
| Restaurants - 1.7% | ||||||||
| Ajisen (China) Holdings Ltd. | 13,082,037 | $ | 10,327,680 | |||||
| Domino’s Pizza UK & IRL PLC | 3,926,472 | 36,005,789 | ||||||
| Whitbread PLC | 576,043 | 38,792,216 | ||||||
|
| |||||||
| $ | 85,125,685 | |||||||
21
Table of Contents
Portfolio of Investments – continued
| Issuer | Shares/Par | Value ($) | ||||||
| Common Stocks - continued | ||||||||
| Specialty Chemicals - 4.7% | ||||||||
| Air Water, Inc. | 376,000 | $ | 5,595,003 | |||||
| Croda International PLC | 2,018,334 | 66,928,148 | ||||||
| Elementis PLC | 3,641,079 | 15,003,318 | ||||||
| Filtrona PLC | 890,916 | 11,455,642 | ||||||
| Fuchs Petrolub SE | 604,462 | 22,980,318 | ||||||
| Japan Pure Chemical Co. Ltd. | 41,700 | 896,545 | ||||||
| Kansai Paint Co. Ltd. | 1,037,000 | 15,487,632 | ||||||
| Marine Harvest A.S.A. | 1,252,087 | 17,537,746 | ||||||
| Sika AG | 7,849 | 27,108,018 | ||||||
| SK KAKEN Co. Ltd. | 58,000 | 4,733,075 | ||||||
| Symrise AG | 885,210 | 47,055,613 | ||||||
| Tikkurila Oyj | 145,978 | 3,036,246 | ||||||
|
| |||||||
| $ | 237,817,304 | |||||||
| Specialty Stores - 2.8% | ||||||||
| ABC-Mart, Inc. | 362,200 | $ | 18,493,914 | |||||
| Cj O Shopping Co. Ltd. | 66,126 | 20,158,952 | ||||||
| Delticom AG (l) | 42,431 | 929,561 | ||||||
| Esprit Holdings Ltd. | 6,542,399 | 8,459,363 | ||||||
| MonotaRO Co. Ltd. (l) | 607,100 | 15,205,869 | ||||||
| NEXT PLC | 578,170 | 61,908,683 | ||||||
| Nitori Co. Ltd. | 174,900 | 10,828,092 | ||||||
| Point, Inc. | 55,910 | 1,090,927 | ||||||
| Shimamura Co. Ltd. | 52,800 | 4,852,738 | ||||||
|
| |||||||
| $ | 141,928,099 | |||||||
| Telecommunications - Wireless - 0.7% | ||||||||
| Turkcell Iletisim Hizmetleri AS (a) | 6,564,910 | $ | 34,316,149 | |||||
| Telephone Services - 1.0% | ||||||||
| Bezeq - The Israel Telecommunication Corp. Ltd. | 6,073,425 | $ | 10,489,704 | |||||
| PT XL Axiata Tbk | 41,911,387 | 21,325,449 | ||||||
| TDC A.S. | 2,666,167 | 20,185,759 | ||||||
|
| |||||||
| $ | 52,000,912 | |||||||
| Tobacco - 0.4% | ||||||||
| Swedish Match AB | 581,683 | $ | 18,782,010 | |||||
| Trucking - 1.3% | ||||||||
| DSV A.S. | 1,132,621 | $ | 31,819,150 | |||||
| Kintetsu World Express, Inc. | 185,300 | 7,062,266 | ||||||
| Yamato Holdings Co. Ltd. | 1,480,100 | 27,550,710 | ||||||
|
| |||||||
| $ | 66,432,126 | |||||||
22
Table of Contents
Portfolio of Investments – continued
| Issuer | Shares/Par | Value ($) | ||||||
| Common Stocks - continued | ||||||||
| Utilities - Electric Power - 0.9% | ||||||||
| Alupar Investimento S.A., IEU | 1,151,100 | $ | 8,159,160 | |||||
| CESC Ltd. | 429,738 | 5,218,993 | ||||||
| Glow Energy PLC | 11,338,300 | 33,306,803 | ||||||
|
| |||||||
| $ | 46,684,956 | |||||||
| Total Common Stocks (Identified Cost, $3,927,041,257) | $ | 4,900,070,125 | ||||||
| Preferred Stocks - 0.5% | ||||||||
| Consumer Products - 0.5% | ||||||||
| Henkel KGaA (Identified Cost, $13,056,939) | 264,562 | $ | 26,418,297 | |||||
| Collateral for Securities Loaned - 0.5% | ||||||||
| JPMorgan Prime Money Market Fund, 0.06%, at Cost and Net Asset Value (j) | 24,985,963 | $ | 24,985,963 | |||||
| Money Market Funds - 2.5% | ||||||||
| MFS Institutional Money Market Portfolio, 0.09%, at Cost and Net Asset Value (v) | 125,995,560 | $ | 125,995,560 | |||||
| Total Investments (Identified Cost, $4,091,079,719) | $ | 5,077,469,945 | ||||||
| Other Assets, Less Liabilities - (0.4)% | (20,710,941 | ) | ||||||
| Net Assets - 100.0% | $ | 5,056,759,004 | ||||||
| (a) | Non-income producing security. |
| (j) | The rate quoted is the annualized seven-day yield of the fund at period end. |
| (l) | A portion of this security is on loan. |
| (v) | Underlying affiliated fund that is available only to investment companies managed by MFS. The rate quoted for the MFS Institutional Money Market Portfolio is the annualized seven-day yield of the fund at period end. |
The following abbreviations are used in this report and are defined:
| ADR | American Depositary Receipt |
| IEU | International Equity Unit |
| PLC | Public Limited Company |
| REIT | Real Estate Investment Trust |
See Notes to Financial Statements
23
Table of Contents
Financial Statements
STATEMENT OF ASSETS AND LIABILITIES
At 9/30/14
This statement represents your fund’s balance sheet, which details the assets and liabilities comprising the total value of the fund.
| Assets | ||||
Investments- | ||||
Non-affiliated issuers, at value (identified cost, $3,965,084,159) | $4,951,474,385 | |||
Underlying affiliated funds, at cost and value | 125,995,560 | |||
Total investments, at value, including $23,488,268 of securities on loan (identified cost, $4,091,079,719) | $5,077,469,945 | |||
Cash | 1,336,218 | |||
Receivables for | ||||
Investments sold | 17,592,814 | |||
Fund shares sold | 7,048,533 | |||
Interest and dividends | 12,424,850 | |||
Other assets | 3,267 | |||
Total assets | $5,115,875,627 | |||
| Liabilities | ||||
Payables for | ||||
Investments purchased | $7,804,060 | |||
Fund shares reacquired | 15,116,748 | |||
Collateral for securities loaned, at value | 24,985,963 | |||
Payable to affiliates | ||||
Investment adviser | 229,300 | |||
Shareholder servicing costs | 4,300,862 | |||
Distribution and service fees | 32,029 | |||
Program manager fees | 24 | |||
Payable for independent Trustees’ compensation | 3,442 | |||
Deferred country tax expense payable | 5,902,655 | |||
Accrued expenses and other liabilities | 741,540 | |||
Total liabilities | $59,116,623 | |||
Net assets | $5,056,759,004 | |||
| Net assets consist of | ||||
Paid-in capital | $4,222,133,414 | |||
Unrealized appreciation (depreciation) on investments and translation of assets and liabilities in foreign currencies (net of $5,902,655 deferred country tax) | 980,167,697 | |||
Accumulated net realized gain (loss) on investments and foreign currency | (206,389,525 | ) | ||
Undistributed net investment income | 60,847,418 | |||
Net assets | $5,056,759,004 | |||
Shares of beneficial interest outstanding | 180,636,546 |
24
Table of Contents
Statement of Assets and Liabilities – continued
| Net assets | Shares outstanding | Net asset value per share (a) | ||||||||||
Class A | $1,555,606,754 | 56,273,055 | $27.64 | |||||||||
Class B | 23,690,414 | 888,004 | 26.68 | |||||||||
Class C | 184,613,505 | 7,013,100 | 26.32 | |||||||||
Class I | 1,871,617,677 | 65,793,361 | 28.45 | |||||||||
Class R1 | 7,402,534 | 289,063 | 25.61 | |||||||||
Class R2 | 75,354,552 | 2,800,862 | 26.90 | |||||||||
Class R3 | 155,508,606 | 5,666,060 | 27.45 | |||||||||
Class R4 | 350,429,934 | 12,662,942 | 27.67 | |||||||||
Class R5 | 823,847,130 | 28,925,301 | 28.48 | |||||||||
Class 529A | 6,174,463 | 226,565 | 27.25 | |||||||||
Class 529B | 498,850 | 19,430 | 25.67 | |||||||||
Class 529C | 2,014,585 | 78,803 | 25.56 | |||||||||
| (a) | Maximum offering price per share was equal to the net asset value per share for all share classes, except for Classes A and 529A, for which the maximum offering prices per share were $29.33 [100 / 94.25 x $27.64] and $28.91 [100 / 94.25 x $27.25], respectively. On sales of $50,000 or more, the maximum offering prices of Class A and Class 529A shares are reduced. A contingent deferred sales charge may be imposed on redemptions of Class A, Class B, Class C, Class 529B, and Class 529C shares. Redemption price per share was equal to the net asset value per share for Classes I, R1, R2, R3, R4, R5, and 529A. |
See Notes to Financial Statements
25
Table of Contents
Financial Statements
Year ended 9/30/14
This statement describes how much your fund earned in investment income and accrued in expenses. It also describes any gains and/or losses generated by fund operations.
| Net investment income | ||||
Income | ||||
Dividends | $124,874,879 | |||
Interest | 977,497 | |||
Dividends from underlying affiliated funds | 158,147 | |||
Foreign taxes withheld | (8,123,995 | ) | ||
Total investment income | $117,886,528 | |||
Expenses | ||||
Management fee | $47,259,467 | |||
Distribution and service fees | 7,296,635 | |||
Program manager fees | 8,980 | |||
Shareholder servicing costs | 5,311,594 | |||
Administrative services fee | 501,563 | |||
Independent Trustees’ compensation | 52,610 | |||
Custodian fee | 1,480,427 | |||
Shareholder communications | 368,051 | |||
Audit and tax fees | 92,672 | |||
Legal fees | 48,525 | |||
Miscellaneous | 327,156 | |||
Total expenses | $62,747,680 | |||
Fees paid indirectly | (229 | ) | ||
Reduction of expenses by investment adviser and distributor | (587,652 | ) | ||
Net expenses | $62,159,799 | |||
Net investment income | $55,726,729 | |||
| Realized and unrealized gain (loss) on investments and foreign currency | ||||
Realized gain (loss) (identified cost basis) | ||||
Investments: | ||||
Non-affiliated issuers (net of $131,828 country tax) | $83,920,883 | |||
Other affiliated issuers | 7,557,130 | |||
Foreign currency | (546,883 | ) | ||
Net realized gain (loss) on investments and foreign currency | $90,931,130 | |||
Change in unrealized appreciation (depreciation) | ||||
Investments (net of $4,741,276 increase in deferred country tax) | $(53,980,595 | ) | ||
Translation of assets and liabilities in foreign currencies | (504,544 | ) | ||
Net unrealized gain (loss) on investments and foreign currency translation | $(54,485,139 | ) | ||
Net realized and unrealized gain (loss) on investments and foreign currency | $36,445,991 | |||
Change in net assets from operations | $92,172,720 | |||
See Notes to Financial Statements
26
Table of Contents
Financial Statements
STATEMENTS OF CHANGES IN NET ASSETS
These statements describe the increases and/or decreases in net assets resulting from operations, any distributions, and any shareholder transactions.
| Years ended 9/30 | ||||||||
| 2014 | 2013 | |||||||
| Change in net assets | ||||||||
| From operations | ||||||||
Net investment income | $55,726,729 | $46,084,221 | ||||||
Net realized gain (loss) on investments and foreign currency | 90,931,130 | 144,163,804 | ||||||
Net unrealized gain (loss) on investments and foreign currency translation | (54,485,139 | ) | 504,038,518 | |||||
Change in net assets from operations | $92,172,720 | $694,286,543 | ||||||
| Distributions declared to shareholders | ||||||||
From net investment income | $(56,530,561 | ) | $(40,380,082 | ) | ||||
Change in net assets from fund share transactions | $383,162,243 | $634,512,606 | ||||||
Total change in net assets | $418,804,402 | $1,288,419,067 | ||||||
| Net assets | ||||||||
At beginning of period | 4,637,954,602 | 3,349,535,535 | ||||||
At end of period (including undistributed net investment income of $60,847,418 and $56,101,828, respectively) | $5,056,759,004 | $4,637,954,602 | ||||||
See Notes to Financial Statements
27
Table of Contents
Financial Statements
The financial highlights table is intended to help you understand the fund’s financial performance for the past 5 years (or life of a particular share class, if shorter). Certain information reflects financial results for a single fund share. The total returns in the table represent the rate by which an investor would have earned (or lost) on an investment in the fund share class (assuming reinvestment of all distributions) held for the entire period.
| Class A | Years ended 9/30 | |||||||||||||||||||
| 2014 | 2013 | 2012 | 2011 | 2010 | ||||||||||||||||
Net asset value, beginning of period | $27.41 | $23.23 | $18.94 | $20.24 | $17.43 | |||||||||||||||
| Income (loss) from investment operations | ||||||||||||||||||||
Net investment income (d) | $0.27 | $0.27 | $0.25 | $0.24 | $0.21 | |||||||||||||||
Net realized and unrealized gain (loss) | 0.26 | 4.17 | 4.28 | (1.34 | ) | 2.80 | ||||||||||||||
Total from investment operations | $0.53 | $4.44 | $4.53 | $(1.10 | ) | $3.01 | ||||||||||||||
| Less distributions declared to shareholders | ||||||||||||||||||||
From net investment income | $(0.30 | ) | $(0.26 | ) | $(0.24 | ) | $(0.20 | ) | $(0.20 | ) | ||||||||||
Net asset value, end of period (x) | $27.64 | $27.41 | $23.23 | $18.94 | $20.24 | |||||||||||||||
Total return (%) (r)(s)(t)(x) | 1.93 | 19.29 | 24.13 | (5.53 | ) | 17.43 | ||||||||||||||
| Ratios (%) (to average net assets) and Supplemental data: | ||||||||||||||||||||
Expenses before expense reductions (f) | 1.36 | 1.39 | 1.41 | 1.43 | 1.44 | |||||||||||||||
Expenses after expense reductions (f) | 1.34 | 1.39 | 1.41 | 1.42 | 1.44 | |||||||||||||||
Net investment income | 0.96 | 1.07 | 1.19 | 1.12 | 1.14 | |||||||||||||||
Portfolio turnover | 14 | 15 | 21 | 44 | 34 | |||||||||||||||
Net assets at end of period (000 omitted) | $1,555,607 | $1,581,384 | $1,309,494 | $1,199,483 | $1,359,614 | |||||||||||||||
See Notes to Financial Statements
28
Table of Contents
Financial Highlights – continued
| Class B | Years ended 9/30 | |||||||||||||||||||
| 2014 | 2013 | 2012 | 2011 | 2010 | ||||||||||||||||
Net asset value, beginning of period | $26.40 | $22.34 | $18.15 | $19.38 | $16.70 | |||||||||||||||
| Income (loss) from investment operations | ||||||||||||||||||||
Net investment income (d) | $0.03 | $0.04 | $0.07 | $0.07 | $0.06 | |||||||||||||||
Net realized and unrealized gain (loss) | 0.28 | 4.06 | 4.14 | (1.27 | ) | 2.70 | ||||||||||||||
Total from investment operations | $0.31 | $4.10 | $4.21 | $(1.20 | ) | $2.76 | ||||||||||||||
| Less distributions declared to shareholders | ||||||||||||||||||||
From net investment income | $(0.03 | ) | $(0.04 | ) | $(0.02 | ) | $(0.03 | ) | $(0.08 | ) | ||||||||||
Net asset value, end of period (x) | $26.68 | $26.40 | $22.34 | $18.15 | $19.38 | |||||||||||||||
Total return (%) (r)(s)(t)(x) | 1.18 | 18.39 | 23.21 | (6.21 | ) | 16.59 | ||||||||||||||
| Ratios (%) (to average net assets) and Supplemental data: | ||||||||||||||||||||
Expenses before expense reductions (f) | 2.11 | 2.14 | 2.16 | 2.17 | 2.19 | |||||||||||||||
Expenses after expense reductions (f) | 2.10 | 2.13 | 2.16 | 2.17 | 2.19 | |||||||||||||||
Net investment income | 0.12 | 0.19 | 0.36 | 0.32 | 0.33 | |||||||||||||||
Portfolio turnover | 14 | 15 | 21 | 44 | 34 | |||||||||||||||
Net assets at end of period (000 omitted) | $23,690 | $33,509 | $45,496 | $57,379 | $85,229 | |||||||||||||||
| Class C | Years ended 9/30 | |||||||||||||||||||
| 2014 | 2013 | 2012 | 2011 | 2010 | ||||||||||||||||
Net asset value, beginning of period | $26.14 | $22.17 | $18.06 | $19.31 | $16.66 | |||||||||||||||
| Income (loss) from investment operations | ||||||||||||||||||||
Net investment income (d) | $0.06 | $0.08 | $0.09 | $0.08 | $0.07 | |||||||||||||||
Net realized and unrealized gain (loss) | 0.25 | 3.99 | 4.08 | (1.27 | ) | 2.68 | ||||||||||||||
Total from investment operations | $0.31 | $4.07 | $4.17 | $(1.19 | ) | $2.75 | ||||||||||||||
| Less distributions declared to shareholders | ||||||||||||||||||||
From net investment income | $(0.13 | ) | $(0.10 | ) | $(0.06 | ) | $(0.06 | ) | $(0.10 | ) | ||||||||||
Net asset value, end of period (x) | $26.32 | $26.14 | $22.17 | $18.06 | $19.31 | |||||||||||||||
Total return (%) (r)(s)(t)(x) | 1.17 | 18.41 | 23.17 | (6.20 | ) | 16.57 | ||||||||||||||
| Ratios (%) (to average net assets) and Supplemental data: | ||||||||||||||||||||
Expenses before expense reductions (f) | 2.11 | 2.14 | 2.16 | 2.18 | 2.19 | |||||||||||||||
Expenses after expense reductions (f) | 2.10 | 2.14 | 2.16 | 2.17 | 2.19 | |||||||||||||||
Net investment income | 0.21 | 0.32 | 0.45 | 0.37 | 0.38 | |||||||||||||||
Portfolio turnover | 14 | 15 | 21 | 44 | 34 | |||||||||||||||
Net assets at end of period (000 omitted) | $184,614 | $184,560 | $152,757 | $142,778 | $170,747 | |||||||||||||||
See Notes to Financial Statements
29
Table of Contents
Financial Highlights – continued
| Class I | Years ended 9/30 | |||||||||||||||||||
| 2014 | 2013 | 2012 | 2011 | 2010 | ||||||||||||||||
Net asset value, beginning of period | $28.20 | $23.88 | $19.48 | $20.80 | $17.90 | |||||||||||||||
| Income (loss) from investment operations | ||||||||||||||||||||
Net investment income (d) | $0.36 | $0.35 | $0.33 | $0.32 | $0.27 | |||||||||||||||
Net realized and unrealized gain (loss) | 0.26 | 4.29 | 4.37 | (1.39 | ) | 2.87 | ||||||||||||||
Total from investment operations | $0.62 | $4.64 | $4.70 | $(1.07 | ) | $3.14 | ||||||||||||||
| Less distributions declared to shareholders | ||||||||||||||||||||
From net investment income | $(0.37 | ) | $(0.32 | ) | $(0.30 | ) | $(0.25 | ) | $(0.24 | ) | ||||||||||
Net asset value, end of period (x) | $28.45 | $28.20 | $23.88 | $19.48 | $20.80 | |||||||||||||||
Total return (%) (r)(s)(x) | 2.19 | 19.63 | 24.40 | (5.27 | ) | 17.72 | ||||||||||||||
| Ratios (%) (to average net assets) and Supplemental data: | ||||||||||||||||||||
Expenses before expense reductions (f) | 1.11 | 1.14 | 1.16 | 1.18 | 1.19 | |||||||||||||||
Expenses after expense reductions (f) | 1.10 | 1.14 | 1.16 | 1.18 | 1.19 | |||||||||||||||
Net investment income | 1.24 | 1.34 | 1.52 | 1.42 | 1.42 | |||||||||||||||
Portfolio turnover | 14 | 15 | 21 | 44 | 34 | |||||||||||||||
Net assets at end of period (000 omitted) | $1,871,618 | $1,530,692 | $968,523 | $845,262 | $774,647 | |||||||||||||||
| Class R1 | Years ended 9/30 | |||||||||||||||||||
| 2014 | 2013 | 2012 | 2011 | 2010 | ||||||||||||||||
Net asset value, beginning of period | $25.52 | $21.64 | $17.65 | $18.89 | $16.33 | |||||||||||||||
| Income (loss) from investment operations | ||||||||||||||||||||
Net investment income (d) | $0.04 | $0.17 | $0.09 | $0.07 | $0.07 | |||||||||||||||
Net realized and unrealized gain (loss) | 0.26 | 3.80 | 3.99 | (1.24 | ) | 2.61 | ||||||||||||||
Total from investment operations | $0.30 | $3.97 | $4.08 | $(1.17 | ) | $2.68 | ||||||||||||||
| Less distributions declared to shareholders | ||||||||||||||||||||
From net investment income | $(0.21 | ) | $(0.09 | ) | $(0.09 | ) | $(0.07 | ) | $(0.12 | ) | ||||||||||
Net asset value, end of period (x) | $25.61 | $25.52 | $21.64 | $17.65 | $18.89 | |||||||||||||||
Total return (%) (r)(s)(x) | 1.17 | 18.43 | 23.20 | (6.21 | ) | 16.51 | ||||||||||||||
| Ratios (%) (to average net assets) and Supplemental data: | ||||||||||||||||||||
Expenses before expense reductions (f) | 2.11 | 2.15 | 2.16 | 2.18 | 2.19 | |||||||||||||||
Expenses after expense reductions (f) | 2.10 | 2.15 | 2.16 | 2.18 | 2.19 | |||||||||||||||
Net investment income | 0.17 | 0.70 | 0.46 | 0.35 | 0.41 | |||||||||||||||
Portfolio turnover | 14 | 15 | 21 | 44 | 34 | |||||||||||||||
Net assets at end of period (000 omitted) | $7,403 | $8,642 | $2,869 | $2,560 | $2,881 | |||||||||||||||
See Notes to Financial Statements
30
Table of Contents
Financial Highlights – continued
| Class R2 | Years ended 9/30 | |||||||||||||||||||
| 2014 | 2013 | 2012 | 2011 | 2010 | ||||||||||||||||
Net asset value, beginning of period | $26.72 | $22.66 | $18.47 | $19.75 | $17.02 | |||||||||||||||
| Income (loss) from investment operations | ||||||||||||||||||||
Net investment income (d) | $0.19 | $0.22 | $0.20 | $0.19 | $0.16 | |||||||||||||||
Net realized and unrealized gain (loss) | 0.25 | 4.06 | 4.17 | (1.31 | ) | 2.74 | ||||||||||||||
Total from investment operations | $0.44 | $4.28 | $4.37 | $(1.12 | ) | $2.90 | ||||||||||||||
| Less distributions declared to shareholders | ||||||||||||||||||||
From net investment income | $(0.26 | ) | $(0.22 | ) | $(0.18 | ) | $(0.16 | ) | $(0.17 | ) | ||||||||||
Net asset value, end of period (x) | $26.90 | $26.72 | $22.66 | $18.47 | $19.75 | |||||||||||||||
Total return (%) (r)(s)(x) | 1.65 | 19.03 | 23.82 | (5.76 | ) | 17.17 | ||||||||||||||
| Ratios (%) (to average net assets) and Supplemental data: | ||||||||||||||||||||
Expenses before expense reductions (f) | 1.61 | 1.64 | 1.66 | 1.68 | 1.69 | |||||||||||||||
Expenses after expense reductions (f) | 1.60 | 1.64 | 1.66 | 1.67 | 1.69 | |||||||||||||||
Net investment income | 0.70 | 0.89 | 0.99 | 0.91 | 0.89 | |||||||||||||||
Portfolio turnover | 14 | 15 | 21 | 44 | 34 | |||||||||||||||
Net assets at end of period (000 omitted) | $75,355 | $76,634 | $48,637 | $40,259 | $42,679 | |||||||||||||||
| Class R3 | Years ended 9/30 | |||||||||||||||||||
| 2014 | 2013 | 2012 | 2011 | 2010 | ||||||||||||||||
Net asset value, beginning of period | $27.23 | $23.09 | $18.85 | $20.16 | $17.36 | |||||||||||||||
| Income (loss) from investment operations | ||||||||||||||||||||
Net investment income (d) | $0.27 | $0.29 | $0.27 | $0.32 | $0.21 | |||||||||||||||
Net realized and unrealized gain (loss) | 0.26 | 4.12 | 4.23 | (1.42 | ) | 2.80 | ||||||||||||||
Total from investment operations | $0.53 | $4.41 | $4.50 | $(1.10 | ) | $3.01 | ||||||||||||||
| Less distributions declared to shareholders | ||||||||||||||||||||
From net investment income | $(0.31 | ) | $(0.27 | ) | $(0.26 | ) | $(0.21 | ) | $(0.21 | ) | ||||||||||
Net asset value, end of period (x) | $27.45 | $27.23 | $23.09 | $18.85 | $20.16 | |||||||||||||||
Total return (%) (r)(s)(x) | 1.94 | 19.29 | 24.15 | (5.55 | ) | 17.48 | ||||||||||||||
| Ratios (%) (to average net assets) and Supplemental data: | ||||||||||||||||||||
Expenses before expense reductions (f) | 1.36 | 1.39 | 1.41 | 1.44 | 1.44 | |||||||||||||||
Expenses after expense reductions (f) | 1.34 | 1.39 | 1.41 | 1.44 | 1.44 | |||||||||||||||
Net investment income | 0.96 | 1.15 | 1.29 | 1.46 | 1.18 | |||||||||||||||
Portfolio turnover | 14 | 15 | 21 | 44 | 34 | |||||||||||||||
Net assets at end of period (000 omitted) | $155,509 | $144,977 | $93,526 | $57,720 | $21,895 | |||||||||||||||
See Notes to Financial Statements
31
Table of Contents
Financial Highlights – continued
| Class R4 | Years ended 9/30 | |||||||||||||||||||
| 2014 | 2013 | 2012 | 2011 | 2010 | ||||||||||||||||
Net asset value, beginning of period | $27.43 | $23.25 | $18.97 | $20.26 | $17.44 | |||||||||||||||
| Income (loss) from investment operations | ||||||||||||||||||||
Net investment income (d) | $0.33 | $0.34 | $0.34 | $0.35 | $0.29 | |||||||||||||||
Net realized and unrealized gain (loss) | 0.27 | 4.16 | 4.24 | (1.39 | ) | 2.77 | ||||||||||||||
Total from investment operations | $0.60 | $4.50 | $4.58 | $(1.04 | ) | $3.06 | ||||||||||||||
| Less distributions declared to shareholders | ||||||||||||||||||||
From net investment income | $(0.36 | ) | $(0.32 | ) | $(0.30 | ) | $(0.25 | ) | $(0.24 | ) | ||||||||||
Net asset value, end of period (x) | $27.67 | $27.43 | $23.25 | $18.97 | $20.26 | |||||||||||||||
Total return (%) (r)(s)(x) | 2.19 | 19.56 | 24.42 | (5.26 | ) | 17.73 | ||||||||||||||
| Ratios (%) (to average net assets) and Supplemental data: | ||||||||||||||||||||
Expenses before expense reductions (f) | 1.11 | 1.14 | 1.16 | 1.19 | 1.20 | |||||||||||||||
Expenses after expense reductions (f) | 1.10 | 1.14 | 1.16 | 1.19 | 1.20 | |||||||||||||||
Net investment income | 1.15 | 1.36 | 1.60 | 1.61 | 1.56 | |||||||||||||||
Portfolio turnover | 14 | 15 | 21 | 44 | 34 | |||||||||||||||
Net assets at end of period (000 omitted) | $350,430 | $416,387 | $282,570 | $143,620 | $50,050 | |||||||||||||||
| Class R5 | Years ended 9/30 | |||||||||||
| 2014 | 2013 | 2012 (i) | ||||||||||
Net asset value, beginning of period | $28.22 | $23.88 | $21.12 | |||||||||
| Income (loss) from investment operations | ||||||||||||
Net investment income (d) | $0.40 | $0.38 | $0.12 | |||||||||
Net realized and unrealized gain on investments and foreign currency | 0.25 | 4.28 | 2.64 | (g) | ||||||||
Total from investment operations | $0.65 | $4.66 | $2.76 | |||||||||
| Less distributions declared to shareholders | ||||||||||||
From net investment income | $(0.39 | ) | $(0.32 | ) | $— | |||||||
Net asset value, end of period (x) | $28.48 | $28.22 | $23.88 | |||||||||
Total return (%) (r)(s)(x) | 2.31 | 19.74 | 13.07 | (n) | ||||||||
| Ratios (%) (to average net assets) and Supplemental data: | ||||||||||||
Expenses before expense reductions (f) | 1.00 | 1.02 | 1.05 | (a) | ||||||||
Expenses after expense reductions (f) | 0.99 | 1.02 | 1.05 | (a) | ||||||||
Net investment income | 1.36 | 1.48 | 1.61 | (a) | ||||||||
Portfolio turnover | 14 | 15 | 21 | |||||||||
Net assets at end of period (000 omitted) | $823,847 | $652,771 | $438,906 | |||||||||
See Notes to Financial Statements
32
Table of Contents
Financial Highlights – continued
| Class 529A | Years ended 9/30 | |||||||||||||||||||
| 2014 | 2013 | 2012 | 2011 | 2010 | ||||||||||||||||
Net asset value, beginning of period | $27.03 | $22.90 | $18.68 | $19.97 | $17.21 | |||||||||||||||
| Income (loss) from investment operations | ||||||||||||||||||||
Net investment income (d) | $0.28 | $0.26 | $0.25 | $0.23 | $0.20 | |||||||||||||||
Net realized and unrealized gain (loss) | 0.24 | 4.12 | 4.20 | (1.33 | ) | 2.75 | ||||||||||||||
Total from investment operations | $0.52 | $4.38 | $4.45 | $(1.10 | ) | $2.95 | ||||||||||||||
| Less distributions declared to shareholders | ||||||||||||||||||||
From net investment income | $(0.30 | ) | $(0.25 | ) | $(0.23 | ) | $(0.19 | ) | $(0.19 | ) | ||||||||||
Net asset value, end of period (x) | $27.25 | $27.03 | $22.90 | $18.68 | $19.97 | |||||||||||||||
Total return (%) (r)(s)(t)(x) | 1.92 | 19.32 | 24.03 | (5.60 | ) | 17.29 | ||||||||||||||
| Ratios (%) (to average net assets) and Supplemental data: | ||||||||||||||||||||
Expenses before expense reductions (f) | 1.46 | 1.49 | 1.51 | 1.53 | 1.54 | |||||||||||||||
Expenses after expense reductions (f) | 1.34 | 1.40 | 1.46 | 1.51 | 1.54 | |||||||||||||||
Net investment income | 0.98 | 1.06 | 1.18 | 1.08 | 1.11 | |||||||||||||||
Portfolio turnover | 14 | 15 | 21 | 44 | 34 | |||||||||||||||
Net assets at end of period (000 omitted) | $6,174 | $5,740 | $4,637 | $3,788 | $3,607 | |||||||||||||||
| Class 529B | Years ended 9/30 | |||||||||||||||||||
| 2014 | 2013 | 2012 | 2011 | 2010 | ||||||||||||||||
Net asset value, beginning of period | $25.50 | $21.62 | $17.60 | $18.84 | $16.27 | |||||||||||||||
| Income (loss) from investment operations | ||||||||||||||||||||
Net investment income (d) | $0.02 | $0.06 | $0.07 | $0.05 | $0.05 | |||||||||||||||
Net realized and unrealized gain (loss) | 0.26 | 3.90 | 4.00 | (1.23 | ) | 2.61 | ||||||||||||||
Total from investment operations | $0.28 | $3.96 | $4.07 | $(1.18 | ) | $2.66 | ||||||||||||||
| Less distributions declared to shareholders | ||||||||||||||||||||
From net investment income | $(0.11 | ) | $(0.08 | ) | $(0.05 | ) | $(0.06 | ) | $(0.09 | ) | ||||||||||
Net asset value, end of period (x) | $25.67 | $25.50 | $21.62 | $17.60 | $18.84 | |||||||||||||||
Total return (%) (r)(s)(t)(x) | 1.11 | 18.37 | 23.16 | (6.31 | ) | 16.44 | ||||||||||||||
| Ratios (%) (to average net assets) and Supplemental data: | ||||||||||||||||||||
Expenses before expense reductions (f) | 2.20 | 2.24 | 2.26 | 2.27 | 2.29 | |||||||||||||||
Expenses after expense reductions (f) | 2.13 | 2.17 | 2.21 | 2.26 | 2.29 | |||||||||||||||
Net investment income | 0.06 | 0.27 | 0.35 | 0.25 | 0.28 | |||||||||||||||
Portfolio turnover | 14 | 15 | 21 | 44 | 34 | |||||||||||||||
Net assets at end of period (000 omitted) | $499 | $748 | $627 | $634 | $834 | |||||||||||||||
See Notes to Financial Statements
33
Table of Contents
Financial Highlights – continued
| Class 529C | Years ended 9/30 | |||||||||||||||||||
| 2014 | 2013 | 2012 | 2011 | 2010 | ||||||||||||||||
Net asset value, beginning of period | $25.41 | $21.59 | $17.63 | $18.88 | $16.32 | |||||||||||||||
| Income (loss) from investment operations | ||||||||||||||||||||
Net investment income (d) | $0.04 | $0.06 | $0.10 | $0.08 | $0.06 | |||||||||||||||
Net realized and unrealized gain (loss) | 0.24 | 3.89 | 3.96 | (1.26 | ) | 2.61 | ||||||||||||||
Total from investment operations | $0.28 | $3.95 | $4.06 | $(1.18 | ) | $2.67 | ||||||||||||||
| Less distributions declared to shareholders | ||||||||||||||||||||
From net investment income | $(0.13 | ) | $(0.13 | ) | $(0.10 | ) | $(0.07 | ) | $(0.11 | ) | ||||||||||
Net asset value, end of period (x) | $25.56 | $25.41 | $21.59 | $17.63 | $18.88 | |||||||||||||||
Total return (%) (r)(s)(t)(x) | 1.09 | 18.38 | 23.12 | (6.29 | ) | 16.45 | ||||||||||||||
| Ratios (%) (to average net assets) and Supplemental data: | ||||||||||||||||||||
Expenses before expense reductions (f) | 2.21 | 2.24 | 2.26 | 2.28 | 2.29 | |||||||||||||||
Expenses after expense reductions (f) | 2.14 | 2.19 | 2.21 | 2.26 | 2.29 | |||||||||||||||
Net investment income | 0.15 | 0.27 | 0.51 | 0.40 | 0.33 | |||||||||||||||
Portfolio turnover | 14 | 15 | 21 | 44 | 34 | |||||||||||||||
Net assets at end of period (000 omitted) | $2,015 | $1,913 | $1,494 | $1,026 | $770 | |||||||||||||||
| (a) | Annualized. |
| (d) | Per share data is based on average shares outstanding. |
| (f) | Ratios do not reflect reductions from fees paid indirectly, if applicable. |
| (g) | The per share amount varies from the net realized and unrealized gain/loss for the period because of the timing of sales of fund shares and the per share amount of realized and unrealized gains and losses at such time. |
| (i) | For the period from the class inception, June 1, 2012, through the stated period end. |
| (n) | Not annualized. |
| (r) | Certain expenses have been reduced without which performance would have been lower. |
| (s) | From time to time the fund may receive proceeds from litigation settlements, without which performance would be lower. |
| (t) | Total returns do not include any applicable sales charges. |
| (x) | The net asset values per share and total returns have been calculated on net assets which include adjustments made in accordance with U.S. generally accepted accounting principles required at period end for financial reporting purposes. |
See Notes to Financial Statements
34
Table of Contents
(1) Business and Organization
MFS International New Discovery Fund (the fund) is a diversified series of MFS Series Trust V (the trust). The trust is organized as a Massachusetts business trust and is registered under the Investment Company Act of 1940, as amended, as an open-end management investment company.
The fund is an investment company and accordingly follows the investment company accounting and reporting guidance of the Financial Accounting Standards Board (FASB) Accounting Standards Codification Topic 946 Financial Services – Investment Companies.
(2) Significant Accounting Policies
General – The preparation of financial statements in conformity with U.S. generally accepted accounting principles requires management to make estimates and assumptions that affect the reported amounts of assets and liabilities, and disclosure of contingent assets and liabilities at the date of the financial statements and the reported amounts of increases and decreases in net assets from operations during the reporting period. Actual results could differ from those estimates. In the preparation of these financial statements, management has evaluated subsequent events occurring after the date of the fund’s Statement of Assets and Liabilities through the date that the financial statements were issued. The fund invests in foreign securities, including securities of emerging market issuers. Investments in foreign securities are vulnerable to the effects of changes in the relative values of the local currency and the U.S. dollar and to the effects of changes in each country’s legal, political, and economic environment. The markets of emerging markets countries are generally more volatile than the markets of developed countries with more mature economies. All of the risks of investing in foreign securities previously described are heightened when investing in emerging markets countries.
In June 2014, FASB issued Accounting Standards Update 2014-11, Transfers and Servicing (Topic 860) – Repurchase-to-Maturity Transactions, Repurchase Financings, and Disclosures (“ASU 2014-11”). ASU 2014-11 changes the accounting for repurchase-to-maturity transactions (i.e., repurchase agreements that settle at the same time as the maturity of the transferred financial asset) and enhances the required disclosures for repurchase agreements and other similar transactions. Although still evaluating the potential impacts of ASU 2014-11 to the fund, management expects that the impact of the fund’s adoption will be limited to additional financial statement disclosures which would first be effective for interim reporting periods beginning after March 15, 2015.
Balance Sheet Offsetting – The fund’s accounting policy with respect to balance sheet offsetting is that, absent an event of default by the counterparty or a termination of the agreement, the International Swaps and Derivatives Association (ISDA) Master Agreement does not result in an offset of reported amounts of financial assets and financial liabilities in the Statement of Assets and Liabilities across transactions between the fund and the applicable counterparty. The fund’s right to setoff may be restricted or prohibited by the bankruptcy or insolvency laws of the particular jurisdiction to which a specific master netting agreement counterparty is subject. Balance sheet
35
Table of Contents
Notes to Financial Statements – continued
offsetting disclosures, to the extent applicable to the fund, have been included in the fund’s Significant Accounting Policies note under the captions for each of the fund’s in-scope financial instruments and transactions.
Investment Valuations – Equity securities, including restricted equity securities, are generally valued at the last sale or official closing price as provided by a third-party pricing service on the market or exchange on which they are primarily traded. Equity securities, for which there were no sales reported that day, are generally valued at the last quoted daily bid quotation as provided by a third-party pricing service on the market or exchange on which such securities are primarily traded. Short-term instruments with a maturity at issuance of 60 days or less may be valued at amortized cost, which approximates market value. Open-end investment companies are generally valued at net asset value per share. Securities and other assets generally valued on the basis of information from a third-party pricing service may also be valued at a broker/dealer bid quotation. Values obtained from third-party pricing services can utilize both transaction data and market information such as yield, quality, coupon rate, maturity, type of issue, trading characteristics, and other market data. The values of foreign securities and other assets and liabilities expressed in foreign currencies are converted to U.S. dollars using the mean of bid and asked prices for rates provided by a third-party pricing service.
The Board of Trustees has delegated primary responsibility for determining or causing to be determined the value of the fund’s investments (including any fair valuation) to the adviser pursuant to valuation policies and procedures approved by the Board. If the adviser determines that reliable market quotations are not readily available, investments are valued at fair value as determined in good faith by the adviser in accordance with such procedures under the oversight of the Board of Trustees. Under the fund’s valuation policies and procedures, market quotations are not considered to be readily available for most types of debt instruments and floating rate loans and many types of derivatives. These investments are generally valued at fair value based on information from third-party pricing services. In addition, investments may be valued at fair value if the adviser determines that an investment’s value has been materially affected by events occurring after the close of the exchange or market on which the investment is principally traded (such as foreign exchange or market) and prior to the determination of the fund’s net asset value, or after the halting of trading of a specific security where trading does not resume prior to the close of the exchange or market on which the security is principally traded. Events that occur on a frequent basis after foreign markets close (such as developments in foreign markets and significant movements in the U.S. markets) and prior to the determination of the fund’s net asset value may be deemed to have a material effect on the value of securities traded in foreign markets. Accordingly, the fund’s foreign equity securities may often be valued at fair value. The adviser generally relies on third-party pricing services or other information (such as the correlation with price movements of similar securities in the same or other markets; the type, cost and investment characteristics of the security; the business and financial condition of the issuer; and trading and other market data) to assist in determining whether to fair value and at what value to fair value an investment. The value of an investment for purposes of calculating the fund’s net asset value can differ depending on the source and method used to determine value. When fair valuation is used, the
36
Table of Contents
Notes to Financial Statements – continued
value of an investment used to determine the fund’s net asset value may differ from quoted or published prices for the same investment. There can be no assurance that the fund could obtain the fair value assigned to an investment if it were to sell the investment at the same time at which the fund determines its net asset value per share.
Various inputs are used in determining the value of the fund’s assets or liabilities. These inputs are categorized into three broad levels. In certain cases, the inputs used to measure fair value may fall into different levels of the fair value hierarchy. In such cases, an investment’s level within the fair value hierarchy is based on the lowest level of input that is significant to the fair value measurement. The fund’s assessment of the significance of a particular input to the fair value measurement in its entirety requires judgment, and considers factors specific to the investment. Level 1 includes unadjusted quoted prices in active markets for identical assets or liabilities. Level 2 includes other significant observable market-based inputs (including quoted prices for similar securities, interest rates, prepayment speed, and credit risk). Level 3 includes unobservable inputs, which may include the adviser’s own assumptions in determining the fair value of investments. The following is a summary of the levels used as of September 30, 2014 in valuing the fund’s assets or liabilities:
| Investments at Value | Level 1 | Level 2 | Level 3 | Total | ||||||||||||
| Equity Securities: | ||||||||||||||||
United Kingdom | $477,288,905 | $911,613,340 | $— | $1,388,902,245 | ||||||||||||
Japan | 777,097,874 | — | — | 777,097,874 | ||||||||||||
Germany | 166,656,126 | 139,773,558 | — | 306,429,684 | ||||||||||||
France | 34,508,207 | 209,355,571 | — | 243,863,778 | ||||||||||||
Brazil | 180,992,730 | — | — | 180,992,730 | ||||||||||||
Canada | 169,038,711 | — | — | 169,038,711 | ||||||||||||
Denmark | 21,226,766 | 140,454,298 | — | 161,681,064 | ||||||||||||
Switzerland | — | 149,052,730 | — | 149,052,730 | ||||||||||||
Hong Kong | 143,073,519 | — | — | 143,073,519 | ||||||||||||
Other Countries | 1,103,029,516 | 303,326,571 | — | 1,406,356,087 | ||||||||||||
| Mutual Funds | 150,981,523 | — | — | 150,981,523 | ||||||||||||
| Total Investments | $3,223,893,877 | $1,853,576,068 | $— | $5,077,469,945 | ||||||||||||
For further information regarding security characteristics, see the Portfolio of Investments.
Of the level 2 investments presented above, equity investments amounting to $1,750,417,095 would have been considered level 1 investments at the beginning of the period. Of the level 1 investments presented above, equity investments amounting to $826,449,653 would have been considered level 2 investments at the beginning of the period. The primary reason for changes in the classifications between levels 1 and 2 occurs when foreign equity securities are fair valued using other observable market-based inputs in place of the closing exchange price due to events occurring after the close of the exchange or market on which the investment is principally traded. The fund’s foreign equity securities may often be valued at fair value. The fund’s policy is to recognize transfers between the levels as of the end of the period.
Repurchase Agreements – The fund enters into repurchase agreements under the terms of Master Repurchase Agreements with approved counterparties. Each
37
Table of Contents
Notes to Financial Statements – continued
repurchase agreement is recorded at cost. The fund requires that the securities collateral in a repurchase transaction be transferred to a custodian. The fund monitors, on a daily basis, the value of the collateral to ensure that its value, including accrued interest, is greater than amounts owed to the fund under each such repurchase agreement. Upon an event of default under a Master Repurchase Agreement, the non-defaulting party may close out all transactions traded under such agreement and net amounts owed under each transaction to one net amount payable by one party to the other. Absent an event of default, the Master Repurchase Agreement does not result in an offset of reported amounts of assets and liabilities in the Statement of Assets and Liabilities across transactions between the fund and the applicable counterparty.
Foreign Currency Translation – Purchases and sales of foreign investments, income, and expenses are converted into U.S. dollars based upon currency exchange rates prevailing on the respective dates of such transactions or on the reporting date for foreign denominated receivables and payables. Gains and losses attributable to foreign currency exchange rates on sales of securities are recorded for financial statement purposes as net realized gains and losses on investments. Gains and losses attributable to foreign exchange rate movements on receivables, payables, income and expenses are recorded for financial statement purposes as foreign currency transaction gains and losses. That portion of both realized and unrealized gains and losses on investments that results from fluctuations in foreign currency exchange rates is not separately disclosed.
Security Loans – Under its Securities Lending Agency Agreement with the fund, JPMorgan Chase and Co. (“Chase”), as lending agent, loans the securities of the fund to certain qualified institutions (the “Borrowers”) approved by the fund. The loans are collateralized by cash and/or U.S. Treasury and federal agency obligations in an amount typically at least equal to the market value of the securities loaned. On loans collateralized by cash, the cash collateral is invested in a money market fund. The market value of the loaned securities is determined at the close of business of the fund and any additional required collateral is delivered to the fund on the next business day. Chase provides the fund with indemnification against Borrower default. In the event of Borrower default, Chase will for the benefit of the fund either purchase securities identical to those loaned or, when such purchase is commercially impracticable, pay the fund the market value of the loaned securities. In return, Chase assumes the fund’s rights to the related collateral. If the collateral value is less than the cost to purchase identical securities, Chase is responsible for the shortfall, but only to the extent that such shortfall is not due to a decline in collateral value resulting from collateral reinvestment for which the fund bears the risk of loss. At period end, the fund had investment securities on loan with a fair value of $23,488,268 and a related liability of $24,985,963 for cash collateral received on securities loaned, both of which are presented gross in the Statement of Assets and Liabilities. The collateral received on securities loaned exceeded the value of securities on loan at period end. The liability for cash collateral for securities loaned is carried at fair value, which is categorized as level 2 within the fair value hierarchy. A portion of the income generated upon investment of the collateral is remitted to the Borrowers, and the remainder is allocated between the fund and the lending agent. On loans collateralized by U.S. Treasury
38
Table of Contents
Notes to Financial Statements – continued
and/or federal agency obligations, a fee is received from the Borrower, and is allocated between the fund and the lending agent. Income from securities lending is included in “Interest” income in the Statement of Operations. The dividend and interest income earned on the securities loaned is accounted for in the same manner as other dividend and interest income.
Indemnifications – Under the fund’s organizational documents, its officers and Trustees may be indemnified against certain liabilities and expenses arising out of the performance of their duties to the fund. Additionally, in the normal course of business, the fund enters into agreements with service providers that may contain indemnification clauses. The fund’s maximum exposure under these agreements is unknown as this would involve future claims that may be made against the fund that have not yet occurred.
Investment Transactions and Income – Investment transactions are recorded on the trade date. Interest income is recorded on the accrual basis. Dividends received in cash are recorded on the ex-dividend date. Certain dividends from foreign securities will be recorded when the fund is informed of the dividend if such information is obtained subsequent to the ex-dividend date. Dividend and interest payments received in additional securities are recorded on the ex-dividend or ex-interest date in an amount equal to the value of the security on such date.
The fund may receive proceeds from litigation settlements. Any proceeds received from litigation involving portfolio holdings are reflected in the Statement of Operations in realized gain/loss if the security has been disposed of by the fund or in unrealized gain/loss if the security is still held by the fund. Any other proceeds from litigation not related to portfolio holdings are reflected as other income in the Statement of Operations.
Fees Paid Indirectly – The fund’s custody fee may be reduced according to an arrangement that measures the value of cash deposited with the custodian by the fund. This amount, for the year ended September 30, 2014, is shown as a reduction of total expenses in the Statement of Operations.
Tax Matters and Distributions – The fund intends to qualify as a regulated investment company, as defined under Subchapter M of the Internal Revenue Code, and to distribute all of its taxable income, including realized capital gains. As a result, no provision for federal income tax is required. The fund’s federal tax returns, when filed, will remain subject to examination by the Internal Revenue Service for a three year period. Management has analyzed the fund’s tax positions taken on federal and state tax returns for all open tax years and does not believe that there are any uncertain tax positions that require recognition of a tax liability. Foreign taxes, if any, have been accrued by the fund in the accompanying financial statements in accordance with the applicable foreign tax law. Foreign income taxes may be withheld by certain countries in which the fund invests. Additionally, capital gains realized by the fund on securities issued in or by certain foreign countries may be subject to capital gains tax imposed by those countries.
Distributions to shareholders are recorded on the ex-dividend date. Income and capital gain distributions are determined in accordance with income tax regulations, which may differ from U.S. generally accepted accounting principles. Certain capital accounts
39
Table of Contents
Notes to Financial Statements – continued
in the financial statements are periodically adjusted for permanent differences in order to reflect their tax character. These adjustments have no impact on net assets or net asset value per share. Temporary differences which arise from recognizing certain items of income, expense, gain or loss in different periods for financial statement and tax purposes will reverse at some time in the future. Distributions in excess of net investment income or net realized gains are temporary overdistributions for financial statement purposes resulting from differences in the recognition or classification of income or distributions for financial statement and tax purposes.
Book/tax differences primarily relate to passive foreign investment companies and wash sale loss deferrals.
The tax character of distributions declared to shareholders for the last two fiscal years is as follows:
| 9/30/14 | 9/30/13 | |||||||
| Ordinary income (including any short-term capital gains) | $56,530,561 | $40,380,082 | ||||||
The federal tax cost and the tax basis components of distributable earnings were as follows:
| As of 9/30/14 | ||||
| Cost of investments | $4,119,227,660 | |||
| Gross appreciation | 1,182,281,203 | |||
| Gross depreciation | (224,038,918 | ) | ||
| Net unrealized appreciation (depreciation) | $958,242,285 | |||
| Undistributed ordinary income | 61,556,400 | |||
| Capital loss carryforwards | (151,115,712 | ) | ||
| Post-October capital loss deferral | (27,069,243 | ) | ||
| Other temporary differences | (6,988,140 | ) | ||
Under the Regulated Investment Company Modernization Act of 2010 (the “Act”), net capital losses recognized for fund fiscal years beginning after September 30, 2011 may be carried forward indefinitely, and their character is retained as short-term and/or long-term losses (“post-enactment losses”). Previously, net capital losses were carried forward for eight years and treated as short-term losses (“pre-enactment losses”). As a transition rule, the Act requires that all post-enactment net capital losses be used before pre-enactment net capital losses.
As of September 30, 2014, the fund had capital loss carryforwards available to offset future realized gains. Such pre-enactment losses expire as follows:
| 9/30/18 | $(151,115,712 | ) |
Multiple Classes of Shares of Beneficial Interest – The fund offers multiple classes of shares, which differ in their respective distribution, service, and program manager fees. The fund’s income, realized and unrealized gain (loss), and common expenses are allocated to shareholders based on the daily net assets of each class. Dividends are declared separately for each class. Differences in per share dividend rates are generally due to differences in separate class expenses. Class B and Class 529B shares will convert to Class A and Class 529A shares, respectively, approximately eight years after
40
Table of Contents
Notes to Financial Statements – continued
purchase. The fund’s distributions declared to shareholders as reported in the Statements of Changes in Net Assets are presented by class as follows:
| From net investment income | ||||||||
| Year ended 9/30/14 | Year ended 9/30/13 | |||||||
| Class A | $17,382,127 | $14,369,907 | ||||||
| Class B | 37,531 | 77,374 | ||||||
| Class C | 904,534 | 649,081 | ||||||
| Class I | 20,620,255 | 13,545,285 | ||||||
| Class R1 | 70,238 | 12,110 | ||||||
| Class R2 | 767,979 | 483,056 | ||||||
| Class R3 | 1,696,140 | 1,139,762 | ||||||
| Class R4 | 5,187,185 | 4,118,307 | ||||||
| Class R5 | 9,787,055 | 5,921,317 | ||||||
| Class 529A | 64,627 | 52,230 | ||||||
| Class 529B | 3,281 | 2,327 | ||||||
| Class 529C | 9,609 | 9,326 | ||||||
| Total | $56,530,561 | $40,380,082 | ||||||
(3) Transactions with Affiliates
Investment Adviser – The fund has an investment advisory agreement with MFS to provide overall investment management and related administrative services and facilities to the fund. The management fee is computed daily and paid monthly at the following annual rates:
| First $500 million of average daily net assets | 0.975 | % | ||
| Next $4.5 billion of average daily net assets | 0.925 | % | ||
| Average daily net assets in excess of $5 billion | 0.850 | % |
Effective August 1, 2014, the investment adviser has agreed in writing to reduce its management fee to 0.90% of average daily net assets in excess of $1 billion up to $3 billion, 0.85% of average daily net assets in excess of $3 billion up to $5 billion, 0.80% of average daily net assets in excess of $5 billion up to $10 billion, and 0.75% of average daily net assets in excess of $10 billion. This written agreement will continue until modified by the fund’s Board of Trustees, but such agreement will continue at least until January 31, 2016. For the period August 1, 2014 through September 30, 2014, this management fee reduction amounted to $355,763, which is included in the reduction of total expenses in the Statement of Operations. MFS has also agreed in writing to reduce its management fee by a specified amount if certain MFS mutual fund assets exceed thresholds agreed to by MFS and the fund’s Board of Trustees. For the year ended September 30, 2014, this management fee reduction amounted to $188,138, which is included in the reduction of total expenses in the Statements of Operations. The management fee incurred for the year ended September 30, 2014 was equivalent to an annual effective rate of 0.92% of the fund’s average daily net assets.
Distributor – MFS Fund Distributors, Inc. (MFD), a wholly-owned subsidiary of MFS, as distributor, received $894,833 and $2,424 for the year ended September 30, 2014, as its portion of the initial sales charge on sales of Class A and Class 529A shares of the
41
Table of Contents
Notes to Financial Statements – continued
fund, respectively. The Board of Trustees has adopted a distribution plan for certain share classes pursuant to Rule 12b-1 of the Investment Company Act of 1940.
The fund’s distribution plan provides that the fund will pay MFD for services provided by MFD and financial intermediaries in connection with the distribution and servicing of certain share classes. One component of the plan is a distribution fee paid to MFD and another component of the plan is a service fee paid to MFD. MFD may subsequently pay all, or a portion, of the distribution and/or service fees to financial intermediaries.
Distribution Plan Fee Table:
Distribution Fee Rate (d) | Service Fee Rate (d) | Total Distribution Plan (d) | Annual Effective Rate (e) | Distribution and Service Fee | ||||||||||||||||
| Class A | — | 0.25% | 0.25% | 0.25% | $4,152,502 | |||||||||||||||
| Class B | 0.75% | 0.25% | 1.00% | 1.00% | 291,540 | |||||||||||||||
| Class C | 0.75% | 0.25% | 1.00% | 1.00% | 1,928,166 | |||||||||||||||
| Class R1 | 0.75% | 0.25% | 1.00% | 1.00% | 82,330 | |||||||||||||||
| Class R2 | 0.25% | 0.25% | 0.50% | 0.50% | 400,960 | |||||||||||||||
| Class R3 | — | 0.25% | 0.25% | 0.25% | 398,661 | |||||||||||||||
| Class 529A | — | 0.25% | 0.25% | 0.20% | 15,776 | |||||||||||||||
| Class 529B | 0.75% | 0.25% | 1.00% | 0.99% | 6,448 | |||||||||||||||
| Class 529C | 0.75% | 0.25% | 1.00% | 1.00% | 20,252 | |||||||||||||||
| Total Distribution and Service Fees | $7,296,635 | |||||||||||||||||||
| (d) | In accordance with the distribution plan for certain classes, the fund pays distribution and/or service fees equal to these annual percentage rates of each class’s average daily net assets. The distribution and service fee rates disclosed by class represent the current rates in effect at the end of the reporting period. Any rate changes, if applicable, are detailed below. |
| (e) | The annual effective rates represent actual fees incurred under the distribution plan for the year ended September 30, 2014 based on each class’s average daily net assets. MFD has voluntarily agreed to rebate a portion of each class’s 0.25% service fee attributable to accounts for which MFD retains the 0.25% service fee except for accounts attributable to MFS or its affiliates’ seed money. For the year ended September 30, 2014, this rebate amounted to $25,679, $106, $521, $1,348, $3,378, $95, and $44 for Class A, Class B, Class C, Class R3, Class 529A, Class 529B, and Class 529C, respectively, and is included in the reduction of total expenses in the Statement of Operations. |
Certain Class A shares are subject to a contingent deferred sales charge (CDSC) in the event of a shareholder redemption within 18 months of purchase for shares purchased on or after August 1, 2012, and within 24 months of purchase for shares purchased prior to August 1, 2012. Class C and Class 529C shares are subject to a CDSC in the event of a shareholder redemption within 12 months of purchase. Class B and Class 529B shares are subject to a CDSC in the event of a shareholder redemption within six years of purchase. All contingent deferred sales charges are paid to MFD and during the year ended September 30, 2014, were as follows:
| Amount | ||||
| Class A | $4,354 | |||
| Class B | 27,454 | |||
| Class C | 12,452 | |||
| Class 529B | — | |||
| Class 529C | 107 | |||
42
Table of Contents
Notes to Financial Statements – continued
The fund has entered into and may from time to time enter into contracts with program managers and other parties which administer the tuition programs through which an investment in the fund’s 529 share classes is made. The fund has entered into an agreement with MFD pursuant to which MFD receives an annual fee of up to 0.10% of the average daily net assets attributable to each 529 share class. MFD has agreed to waive a portion of this fee in an amount equal to 0.05% of the average daily net assets for each 529 share class. This waiver agreement will expire on January 31, 2016, unless MFD elects to extend the waiver. For the year ended September 30, 2014, this waiver amounted to $4,490 and is included in the reduction of total expenses in the Statement of Operations. The program manager fee incurred for the year ended September 30, 2014 was equivalent to an annual effective rate of 0.05% of the average daily net assets attributable to each 529 share class. The services provided by MFD, or a third party with which MFD contracts, include recordkeeping and tax reporting and account services, as well as services designed to maintain the program’s compliance with the Internal Revenue Code and other regulatory requirements. Program manager fees and waivers for the year ended September 30, 2014, were as follows:
| Fee | Waiver | |||||||
| Class 529A | $6,310 | $3,155 | ||||||
| Class 529B | 645 | 322 | ||||||
| Class 529C | 2,025 | 1,013 | ||||||
| Total Program Manager Fees and Waivers | $8,980 | $4,490 | ||||||
Shareholder Servicing Agent – MFS Service Center, Inc. (MFSC), a wholly-owned subsidiary of MFS, receives a fee from the fund for its services as shareholder servicing agent calculated as a percentage of the average daily net assets of the fund as determined periodically under the supervision of the fund’s Board of Trustees. For the year ended September 30, 2014, the fee was $379,343, which equated to 0.0075% annually of the fund’s average daily net assets. MFSC also receives payment from the fund for out-of-pocket expenses, sub-accounting and other shareholder servicing costs which may be paid to affiliated and unaffiliated service providers. Class R5 shares do not incur sub-accounting fees. For the year ended September 30, 2014, these out-of-pocket expenses, sub-accounting and other shareholder servicing costs amounted to $4,932,251.
Administrator – MFS provides certain financial, legal, shareholder communications, compliance, and other administrative services to the fund. Under an administrative services agreement, the fund partially reimburses MFS the costs incurred to provide these services. The fund is charged an annual fixed amount of $17,500 plus a fee based on average daily net assets. The administrative services fee incurred for the year ended September 30, 2014 was equivalent to an annual effective rate of 0.0099% of the fund’s average daily net assets.
Trustees’ and Officers’ Compensation – The fund pays compensation to independent Trustees in the form of a retainer, attendance fees, and additional compensation to Board and Committee chairpersons. The fund does not pay compensation directly to Trustees or officers of the fund who are also officers of the
43
Table of Contents
Notes to Financial Statements – continued
investment adviser, all of whom receive remuneration for their services to the fund from MFS. Certain officers and Trustees of the fund are officers or directors of MFS, MFD, and MFSC.
Prior to December 31, 2001, the fund had an unfunded defined benefit plan (“DB plan”) for independent Trustees. As of December 31, 2001, the Board took action to terminate the DB plan with respect to then-current and any future independent Trustees, such that the DB plan covers only certain of those former independent Trustees who retired on or before December 31, 2001. Effective January 1, 2002, accrued benefits under the DB plan for then-current independent Trustees who continued were credited to an unfunded retirement deferral plan (the “Retirement Deferral plan”), which was established for and exists solely with respect to these credited amounts, and is not available for other deferrals by these or other independent Trustees. Although the Retirement Deferral plan is unfunded, amounts deferred under the plan are periodically adjusted for investment experience as if they had been invested in shares of the fund. The Retirement Deferral plan resulted in an expense of $511 and is included in independent Trustees’ compensation for the year ended September 30, 2014. The liability for deferred retirement benefits payable to certain independent Trustees under the Retirement Deferral plan amounted to $3,416 at September 30, 2014, and is included in “Payable for independent Trustees’ compensation” in the Statement of Assets and Liabilities.
Other – This fund and certain other funds managed by MFS (the funds) have entered into services agreements (the Agreements) which provide for payment of fees by the funds to Tarantino LLC and Griffin Compliance LLC in return for the provision of services of an Independent Chief Compliance Officer (ICCO) and Assistant ICCO, respectively, for the funds. The funds can terminate the Agreements with Tarantino LLC and Griffin Compliance LLC at any time under the terms of the Agreements. Frank L. Tarantino serves as the ICCO and is an officer of the funds and the sole member of Tarantino LLC. Prior to June 1, 2014, Robyn L. Griffin served as the Assistant ICCO and was an officer of the funds. Ms. Griffin is the sole member of Griffin Compliance LLC. Effective May 31, 2014, Ms. Griffin resigned as Assistant ICCO and the service agreement between the funds and Griffin Compliance LLC was terminated. For the year ended September 30, 2014, the aggregate fees paid by the fund to Tarantino LLC and Griffin Compliance LLC were $25,406 and are included in “Miscellaneous” expense in the Statement of Operations. MFS has agreed to reimburse the fund for a portion of the payments made by the fund in the amount of $8,090, which is included in the reduction of total expenses in the Statement of Operations. Additionally, MFS has agreed to bear all expenses associated with office space, other administrative support, and supplies provided to the ICCO and Assistant ICCO. On October 31, 2014, Mr. Tarantino resigned as ICCO and the service agreement between the funds and Tarantino LLC for the services of an ICCO was terminated. Effective November 1, 2014, the funds entered into a service agreement which provides for payment of fees solely by the funds to Tarantino LLC in return for the provision of services of an Independent Senior Officer (ISO). Additionally, MFS has agreed to bear all expenses associated with office space, other administrative support, and supplies provided to the ISO.
The fund invests in the MFS Institutional Money Market Portfolio which is managed by MFS and seeks current income consistent with preservation of capital and liquidity.
44
Table of Contents
Notes to Financial Statements – continued
Income earned on this investment is included in “Dividends from underlying affiliated funds” in the Statement of Operations. This money market fund does not pay a management fee to MFS.
(4) Portfolio Securities
For the year ended September 30, 2014, purchases and sales of investments and short-term obligations, aggregated $1,124,295,347 and $703,620,737, respectively.
(5) Shares of Beneficial Interest
The fund’s Declaration of Trust permits the Trustees to issue an unlimited number of full and fractional shares of beneficial interest. Transactions in fund shares were as follows:
| Year ended 9/30/14 | Year ended 9/30/13 | |||||||||||||||
| Shares | Amount | Shares | Amount | |||||||||||||
| Shares sold | ||||||||||||||||
Class A | 12,642,057 | $358,551,224 | 14,782,603 | $371,539,911 | ||||||||||||
Class B | 78,344 | 2,140,117 | 117,643 | 2,845,161 | ||||||||||||
Class C | 864,294 | 23,374,341 | 1,185,817 | 28,536,247 | ||||||||||||
Class I | 24,069,078 | 700,713,130 | 28,338,203 | 738,481,251 | ||||||||||||
Class R1 | 88,942 | 2,339,199 | 294,470 | 6,984,603 | ||||||||||||
Class R2 | 926,207 | 25,548,471 | 1,605,372 | 39,374,181 | ||||||||||||
Class R3 | 1,664,401 | 46,708,132 | 2,322,354 | 57,634,108 | ||||||||||||
Class R4 | 3,897,569 | 110,347,485 | 6,928,004 | 173,353,935 | ||||||||||||
Class R5 | 6,794,689 | 199,001,515 | 5,190,932 | 136,307,128 | ||||||||||||
Class 529A | 43,876 | 1,220,416 | 27,309 | 681,072 | ||||||||||||
Class 529B | 1,046 | 27,670 | 3,736 | 88,382 | ||||||||||||
Class 529C | 16,212 | 428,066 | 12,680 | 289,401 | ||||||||||||
| 51,086,715 | $1,470,399,766 | 60,809,123 | $1,556,115,380 | |||||||||||||
| Shares issued to shareholders in reinvestment of distributions | ||||||||||||||||
Class A | 591,977 | $16,356,339 | 556,157 | $13,158,677 | ||||||||||||
Class B | 1,341 | 35,984 | 3,150 | 72,187 | ||||||||||||
Class C | 29,397 | 778,145 | 23,895 | 542,407 | ||||||||||||
Class I | 557,856 | 15,831,952 | 437,697 | 10,631,660 | ||||||||||||
Class R1 | 2,728 | 70,237 | 546 | 12,110 | ||||||||||||
Class R2 | 25,679 | 692,046 | 18,516 | 427,895 | ||||||||||||
Class R3 | 61,835 | 1,696,140 | 48,501 | 1,139,762 | ||||||||||||
Class R4 | 162,867 | 4,495,126 | 141,109 | 3,334,395 | ||||||||||||
Class R5 | 344,857 | 9,787,055 | 243,776 | 5,921,317 | ||||||||||||
Class 529A | 2,373 | 64,627 | 2,239 | 52,230 | ||||||||||||
Class 529B | 127 | 3,281 | 105 | 2,327 | ||||||||||||
Class 529C | 374 | 9,609 | 423 | 9,326 | ||||||||||||
| 1,781,411 | $49,820,541 | 1,476,114 | $35,304,293 | |||||||||||||
45
Table of Contents
Notes to Financial Statements – continued
| Year ended 9/30/14 | Year ended 9/30/13 | |||||||||||||||
| Shares | Amount | Shares | Amount | |||||||||||||
| Shares reacquired | ||||||||||||||||
Class A | (14,648,009 | ) | $(418,106,160 | ) | (14,022,073 | ) | $(350,005,160 | ) | ||||||||
Class B | (460,969 | ) | (12,632,560 | ) | (888,445 | ) | (21,393,906 | ) | ||||||||
Class C | (939,908 | ) | (25,515,095 | ) | (1,039,632 | ) | (24,697,746 | ) | ||||||||
Class I | (13,122,109 | ) | (382,941,595 | ) | (15,041,838 | ) | (389,203,963 | ) | ||||||||
Class R1 | (141,263 | ) | (3,718,620 | ) | (88,930 | ) | (2,073,033 | ) | ||||||||
Class R2 | (1,019,578 | ) | (28,231,951 | ) | (901,599 | ) | (22,241,170 | ) | ||||||||
Class R3 | (1,384,726 | ) | (38,942,143 | ) | (1,097,495 | ) | (27,453,983 | ) | ||||||||
Class R4 | (6,575,101 | ) | (186,006,645 | ) | (4,047,007 | ) | (101,775,662 | ) | ||||||||
Class R5 | (1,341,749 | ) | (39,431,369 | ) | (683,793 | ) | (17,322,220 | ) | ||||||||
Class 529A | (32,039 | ) | (895,086 | ) | (19,659 | ) | (495,537 | ) | ||||||||
Class 529B | (11,062 | ) | (293,172 | ) | (3,523 | ) | (83,751 | ) | ||||||||
Class 529C | (13,097 | ) | (343,668 | ) | (6,976 | ) | (160,936 | ) | ||||||||
| (39,689,610 | ) | $(1,137,058,064 | ) | (37,840,970 | ) | $(956,907,067 | ) | |||||||||
| Net change | ||||||||||||||||
Class A | (1,413,975 | ) | $(43,198,597 | ) | 1,316,687 | $34,693,428 | ||||||||||
Class B | (381,284 | ) | (10,456,459 | ) | (767,652 | ) | (18,476,558 | ) | ||||||||
Class C | (46,217 | ) | (1,362,609 | ) | 170,080 | 4,380,908 | ||||||||||
Class I | 11,504,825 | 333,603,487 | 13,734,062 | 359,908,948 | ||||||||||||
Class R1 | (49,593 | ) | (1,309,184 | ) | 206,086 | 4,923,680 | ||||||||||
Class R2 | (67,692 | ) | (1,991,434 | ) | 722,289 | 17,560,906 | ||||||||||
Class R3 | 341,510 | 9,462,129 | 1,273,360 | 31,319,887 | ||||||||||||
Class R4 | (2,514,665 | ) | (71,164,034 | ) | 3,022,106 | 74,912,668 | ||||||||||
Class R5 | 5,797,797 | 169,357,201 | 4,750,915 | 124,906,225 | ||||||||||||
Class 529A | 14,210 | 389,957 | 9,889 | 237,765 | ||||||||||||
Class 529B | (9,889 | ) | (262,221 | ) | 318 | 6,958 | ||||||||||
Class 529C | 3,489 | 94,007 | 6,127 | 137,791 | ||||||||||||
| 13,178,516 | $383,162,243 | 24,444,267 | $634,512,606 | |||||||||||||
The fund is one of several mutual funds in which the MFS funds-of-funds may invest. The MFS funds-of-funds do not invest in the underlying funds for the purpose of exercising management or control. At the end of the period, the MFS International Diversification Fund, the MFS Growth Allocation Fund, the MFS Aggressive Growth Allocation Fund, and the MFS Moderate Allocation Fund were the owners of record of approximately 8%, 2%, 1%, and 1%, respectively, of the value of outstanding voting shares of the fund. In addition, the MFS Lifetime 2020 Fund, the MFS Lifetime 2025 Fund, the MFS Lifetime 2030 Fund, the MFS Lifetime 2035 Fund, the MFS Lifetime 2040 Fund, the MFS Lifetime 2045 Fund, the MFS Lifetime 2050 Fund, and the MFS Lifetime 2055 Fund were each the owners of record of less than 1% of the value of outstanding voting shares of the fund.
(6) Line of Credit
The fund and certain other funds managed by MFS participate in a $1.1 billion unsecured committed line of credit, subject to a $1 billion sublimit, provided by a
46
Table of Contents
Notes to Financial Statements – continued
syndication of banks under a credit agreement. Borrowings may be made for temporary financing needs. Interest is charged to each fund, based on its borrowings, generally at a rate equal to the higher of the Federal Reserve funds rate or one month LIBOR plus an agreed upon spread. A commitment fee, based on the average daily, unused portion of the committed line of credit, is allocated among the participating funds at the end of each calendar quarter. In addition, the fund and other funds managed by MFS have established unsecured uncommitted borrowing arrangements with certain banks for temporary financing needs. Interest is charged to each fund, based on its borrowings, at a rate equal to the Federal Reserve funds rate plus an agreed upon spread. For the year ended September 30, 2014, the fund’s commitment fee and interest expense were $19,624 and $0, respectively, and are included in “Miscellaneous” expense in the Statement of Operations.
(7) Transactions in Underlying Affiliated Funds-Affiliated Issuers
An affiliated issuer may be considered one in which the fund owns 5% or more of the outstanding voting securities, or a company which is under common control. For the purposes of this report, the fund assumes the following to be an affiliated issuer:
| Underlying Affiliated Fund | Beginning Shares/Par Amount | Acquisitions Shares/Par Amount | Dispositions Shares/Par Amount | Ending Shares/Par | ||||||||||||
| MFS Institutional Money Market Portfolio | 183,801,198 | 639,279,088 | (697,084,726 | ) | 125,995,560 | |||||||||||
| Underlying Affiliated Fund | Realized Gain (Loss) | Capital Gain Distributions | Dividend Income | Ending Value | ||||||||||||
| MFS Institutional Money Market Portfolio | $— | $— | $158,147 | $125,995,560 | ||||||||||||
47
Table of Contents
REPORT OF INDEPENDENT REGISTERED PUBLIC ACCOUNTING FIRM
To the Board of Trustees of MFS Series Trust V and Shareholders of
MFS International New Discovery Fund:
We have audited the accompanying statement of assets and liabilities of MFS International New Discovery Fund (the Fund) (one of the series constituting MFS Series Trust V), including the portfolio of investments, as of September 30, 2014, and the related statement of operations for the year then ended, the statements of changes in net assets for each of the two years in the period then ended and the financial highlights for each of the periods indicated therein. These financial statements and financial highlights are the responsibility of the Fund’s management. Our responsibility is to express an opinion on these financial statements and financial highlights based on our audits.
We conducted our audits in accordance with the standards of the Public Company Accounting Oversight Board (United States). Those standards require that we plan and perform the audit to obtain reasonable assurance about whether the financial statements and financial highlights are free of material misstatement. We were not engaged to perform an audit of the Fund’s internal control over financial reporting. Our audits included consideration of internal control over financial reporting as a basis for designing audit procedures that are appropriate in the circumstances, but not for the purpose of expressing an opinion on the effectiveness of the Fund’s internal control over financial reporting. Accordingly, we express no such opinion. An audit also includes examining, on a test basis, evidence supporting the amounts and disclosures in the financial statements and financial highlights, assessing the accounting principles used and significant estimates made by management, and evaluating the overall financial statement presentation. Our procedures included confirmation of securities owned as of September 30, 2014, by correspondence with the custodian and others or by other appropriate auditing procedures where replies from others were not received. We believe that our audits provide a reasonable basis for our opinion.
In our opinion, the financial statements and financial highlights referred to above present fairly, in all material respects, the financial position of MFS International New Discovery Fund (one of the series constituting MFS Series Trust V) at September 30, 2014, the results of its operations for the year then ended, the changes in its net assets for each of the two years in the period then ended and the financial highlights for each of the periods indicated therein, in conformity with U.S. generally accepted accounting principles.

Boston, Massachusetts
November 14, 2014
48
Table of Contents
TRUSTEES AND OFFICERS — IDENTIFICATION AND BACKGROUND
The Trustees and Officers of the Trust, as of November 1, 2014, are listed below, together with their principal occupations during the past five years. (Their titles may have varied during that period.) The address of each Trustee and Officer is 111 Huntington Avenue, Boston, Massachusetts 02199-7618.
Name, Age | Position(s) Held with Fund | Trustee/Officer Since (h) | Principal the Past Five Years | Other Directorships (j) | ||||
| INTERESTED TRUSTEES | ||||||||
Robert J. Manning (k) (age 51) | Trustee | February 2004 | Massachusetts Financial Services Company, Chairman, Chief Executive Officer and Director; President (until 2009); Chief Investment Officer (until 2010) | N/A | ||||
Robin A. Stelmach (k) (age 53) | Trustee and President | January 2014 | Massachusetts Financial Services Company, Executive Vice President and Chief Operating Officer | N/A | ||||
| INDEPENDENT TRUSTEES | ||||||||
David H. Gunning (age 72) | Trustee and Chair of Trustees | January 2004 | Private investor | Lincoln Electric Holdings, Inc. (welding equipment manufacturer), Director; Development Alternatives, Inc. (consulting), Director/ Non-Executive Chairman | ||||
Steven E. Buller (age 63) | Trustee | February 2014 | Chairman, Financial Accounting Standards Advisory Council; Standing Advisory Group, Public Company Accounting Oversight Board, Member; BlackRock, Inc. (investment management), Managing Director (until 2014), BlackRock Finco UK (investment management), Director (until 2014) | N/A | ||||
49
Table of Contents
Trustees and Officers – continued
Name, Age | Position(s) Held with Fund | Trustee/Officer Since (h) | Principal the Past Five Years | Other Directorships (j) | ||||
Robert E. Butler (age 72) | Trustee | January 2006 | Consultant – investment company industry regulatory and compliance matters | N/A | ||||
Maureen R. Goldfarb (age 59) | Trustee | January 2009 | Private investor | N/A | ||||
William R. Gutow (age 73) | Trustee | December 1993 | Private investor and real estate consultant; Capitol Entertainment Management Company (video franchise), Vice Chairman | Texas Donuts (donut franchise), Vice Chairman (until 2010) | ||||
Michael Hegarty (age 69) | Trustee | December 2004 | Private investor | Brookfield Office Properties, Inc. (real estate), Director; Rouse Properties Inc. (real estate), Director; Capmark Financial Group Inc. (real estate), Director | ||||
John P. Kavanaugh (age 59) | Trustee | January 2009 | Private investor | N/A | ||||
Maryanne L. Roepke (age 58) | Trustee | May 2014 | American Century Investments (investment management), Senior Vice President and Chief Compliance Officer (until 2014) | N/A | ||||
Laurie J. Thomsen (age 57) | Trustee | March 2005 | Private investor; New Profit, Inc. (venture philanthropy), Executive Partner (until 2010) | The Travelers Companies (insurance), Director | ||||
Robert W. Uek (age 73) | Trustee | January 2006 | Consultant to investment company industry | N/A | ||||
| OFFICERS | ||||||||
Christopher R. Bohane (k) (age 40) | Assistant Secretary and Assistant Clerk | July 2005 | Massachusetts Financial Services Company, Vice President and Assistant General Counsel | N/A | ||||
Kino Clark (k) (age 46) | Assistant Treasurer | January 2012 | Massachusetts Financial Services Company, Vice President | N/A |
50
Table of Contents
Trustees and Officers – continued
Name, Age | Position(s) Held with Fund | Trustee/Officer Since (h) | Principal the Past Five Years | Other Directorships (j) | ||||
Thomas H. Connors (k) (age 55) | Assistant Secretary and Assistant Clerk | September 2012 | Massachusetts Financial Services Company, Vice President and Senior Counsel; Deutsche Investment Management Americas Inc. (financial service provider), Director and Senior Counsel (until 2012) | N/A | ||||
Ethan D. Corey (k) (age 50) | Assistant Secretary and Assistant Clerk | July 2005 | Massachusetts Financial Services Company, Senior Vice President and Associate General Counsel | N/A | ||||
David L. DiLorenzo (k) (age 46) | Treasurer | July 2005 | Massachusetts Financial Services Company, Senior Vice President | N/A | ||||
Timothy M. Fagan (k) (age 46) | Chief Compliance Officer | November 2014 | Massachusetts Financial Services Company, Chief Compliance Officer; Vice President and Senior Counsel (until 2012) | N/A | ||||
Brian E. Langenfeld (k) (age 41) | Assistant Secretary and Assistant Clerk | June 2006 | Massachusetts Financial Services Company, Vice President and Senior Counsel | N/A | ||||
Susan S. Newton (k) (age 64) | Assistant Secretary and Assistant Clerk | May 2005 | Massachusetts Financial Services Company, Senior Vice President and Associate General Counsel | N/A | ||||
Susan A. Pereira (k) (age 43) | Assistant Secretary and Assistant Clerk | July 2005 | Massachusetts Financial Services Company, Vice President and Senior Counsel | N/A | ||||
Kasey L. Phillips (k) (age 43) | Assistant Treasurer | September 2012 | Massachusetts Financial Services Company, Vice President; Wells Fargo Funds Management, LLC, Senior Vice President, Fund Treasurer (until 2012) | N/A |
51
Table of Contents
Trustees and Officers – continued
Name, Age | Position(s) Held with Fund | Trustee/Officer Since (h) | Principal the Past Five Years | Other Directorships (j) | ||||
Mark N. Polebaum (k) (age 62) | Secretary and Clerk | January 2006 | Massachusetts Financial Services Company, Executive Vice President, General Counsel and Secretary | N/A | ||||
Matthew A. Stowe (age 39) | Assistant Secretary and Assistant Clerk | October 2014 | Massachusetts Financial Services Company, Vice President and Senior Counsel | N/A | ||||
Frank L. Tarantino (age 70) | Independent Senior Officer | June 2004 | Tarantino LLC (provider of compliance services), Principal | N/A | ||||
Richard S. Weitzel (k) (age 44) | Assistant Secretary and Assistant Clerk | October 2007 | Massachusetts Financial Services Company, Senior Vice President and Associate General Counsel | N/A | ||||
James O. Yost (k) (age 54) | Deputy Treasurer | September 1990 | Massachusetts Financial Services Company, Senior Vice President | N/A |
| (h) | Date first appointed to serve as Trustee/officer of an MFS Fund. Each Trustee has served continuously since appointment unless indicated otherwise. For the period from December 15, 2004 until February 22, 2005, Mr. Manning served as Advisory Trustee. Prior to January 2012, Messrs. DiLorenzo and Yost served as Assistant Treasurers of the Funds. Ms. Stelmach was appointed as President of the Funds as of October 1, 2014. |
| (j) | Directorships or trusteeships of companies required to report to the Securities and Exchange Commission (i.e., “public companies”). |
| (k) | “Interested person” of the Trust within the meaning of the Investment Company Act of 1940 (referred to as the 1940 Act), which is the principal federal law governing investment companies like the fund, as a result of position with MFS. The address of MFS is 111 Huntington Avenue, Boston, Massachusetts 02199-7618. |
Each Trustee (except Ms. Stelmach, Mr. Buller and Ms. Roepke) has been elected by shareholders and each Trustee and officer holds office until his or her successor is chosen and qualified or until his or her earlier death, resignation, retirement or removal. The Trust does not hold annual meetings for the purpose of electing Trustees, and Trustees are not elected for fixed terms. Messrs. Butler, Kavanaugh, Uek and Mses. Thomsen and Roepke are members of the Trust’s Audit Committee.
Each of the Fund’s Trustees and officers holds comparable positions with certain other funds of which MFS or a subsidiary is the investment adviser or distributor, and, in the case of the officers, with certain affiliates of MFS. As of January 1, 2014, the Trustees served as board members of 142 funds within the MFS Family of Funds.
52
Table of Contents
Trustees and Officers – continued
The Statement of Additional Information for the Fund includes further information about the Trustees and is available without charge upon request by calling 1-800-225-2606.
| Investment Adviser | Custodian | |
| Massachusetts Financial Services Company 111 Huntington Avenue Boston, MA 02199-7618 | JPMorgan Chase Bank, NA 4 Metrotech Center New York, NY 11245 | |
| Distributor | Independent Registered Public Accounting Firm | |
| MFS Fund Distributors, Inc. 111 Huntington Avenue Boston, MA 02199-7618 | Ernst & Young LLP 200 Clarendon Street Boston, MA 02116 | |
| Portfolio Managers | ||
David Antonelli Peter Fruzzetti Jose Luis Garcia Robert Lau |
53
Table of Contents
BOARD REVIEW OF INVESTMENT ADVISORY AGREEMENT
The Investment Company Act of 1940 requires that both the full Board of Trustees and a majority of the non-interested (“independent”) Trustees, voting separately, annually approve the continuation of the Fund’s investment advisory agreement with MFS. The Trustees consider matters bearing on the Fund and its advisory arrangements at their meetings throughout the year, including a review of performance data at each regular meeting. In addition, the independent Trustees met several times over the course of three months beginning in May and ending in July, 2014 (“contract review meetings”) for the specific purpose of considering whether to approve the continuation of the investment advisory agreement for the Fund and the other investment companies that the Board oversees (the “MFS Funds”). The independent Trustees were assisted in their evaluation of the Fund’s investment advisory agreement by independent legal counsel, from whom they received separate legal advice and with whom they met separately from MFS during various contract review meetings. The independent Trustees were also assisted in this process by the MFS Funds’ Independent Chief Compliance Officer, a full-time senior officer appointed by and reporting to the independent Trustees.
In connection with their deliberations regarding the continuation of the investment advisory agreement, the Trustees, including the independent Trustees, considered such information and factors as they believed, in light of the legal advice furnished to them and their own business judgment, to be relevant. The investment advisory agreement for the Fund was considered separately, although the Trustees also took into account the common interests of all MFS Funds in their review. As described below, the Trustees considered the nature, quality, and extent of the various investment advisory, administrative, and shareholder services performed by MFS under the existing investment advisory agreement and other arrangements with the Fund.
In connection with their contract review meetings, the Trustees received and relied upon materials that included, among other items: (i) information provided by Lipper Inc., an independent third party, on the investment performance of the Fund for various time periods ended December 31, 2013 and the investment performance of a group of funds with substantially similar investment classifications/objectives (the “Lipper performance universe”), (ii) information provided by Lipper Inc. on the Fund’s advisory fees and other expenses and the advisory fees and other expenses of comparable funds identified by Lipper Inc. (the “Lipper expense group”), (iii) information provided by MFS on the advisory fees of comparable portfolios of other clients of MFS, including institutional separate accounts and other clients, (iv) information as to whether and to what extent applicable expense waivers, reimbursements or fee “breakpoints” are observed for the Fund, (v) information regarding MFS’ financial results and financial condition, including MFS’ and certain of its affiliates’ estimated profitability from services performed for the Fund and the MFS Funds as a whole, and compared to MFS’ institutional business, (vi) MFS’ views regarding the outlook for the mutual fund industry and the strategic business plans of MFS, (vii) descriptions of various functions performed by MFS for the Funds, such as compliance monitoring and portfolio trading practices, and (viii) information regarding the overall organization of MFS, including information about MFS’ senior management and other personnel providing investment advisory, administrative and other services to
54
Table of Contents
Board Review of Investment Advisory Agreement – continued
the Fund and the other MFS Funds. The comparative performance, fee and expense information prepared and provided by Lipper Inc. was not independently verified and the independent Trustees did not independently verify any information provided to them by MFS.
The Trustees’ conclusion as to the continuation of the investment advisory agreement was based on a comprehensive consideration of all information provided to the Trustees and not the result of any single factor. Some of the factors that figured particularly in the Trustees’ deliberations are described below, although individual Trustees may have evaluated the information presented differently from one another, giving different weights to various factors. It is also important to recognize that the fee arrangements for the Fund and other MFS Funds are the result of years of review and discussion between the independent Trustees and MFS, that certain aspects of such arrangements may receive greater scrutiny in some years than in others, and that the Trustees’ conclusions may be based, in part, on their consideration of these same arrangements during the course of the year and in prior years.
Based on information provided by Lipper Inc. and MFS, the Trustees reviewed the Fund’s total return investment performance as well as the performance of peer groups of funds over various time periods. The Trustees placed particular emphasis on the total return performance of the Fund’s Class A shares in comparison to the performance of funds in its Lipper performance universe over the three-year period ended December 31, 2013, which the Trustees believed was a long enough period to reflect differing market conditions. The total return performance of the Fund’s Class A shares was in the 2nd quintile relative to the other funds in the universe for this three-year period (the 1st quintile being the best performers and the 5th quintile being the worst performers). The total return performance of the Fund’s Class A shares was in the 5th quintile for the one-year period and the 3rd quintile for the five-year period ended December 31, 2013 relative to the Lipper performance universe. Because of the passage of time, these performance results may differ from the performance results for more recent periods, including those shown elsewhere in this report.
In the course of their deliberations, the Trustees took into account information provided by MFS in connection with the contract review meetings, including more recent performance information, as well as during investment review meetings conducted with portfolio management personnel during the course of the year regarding the Fund’s performance. After reviewing these and related factors, the Trustees concluded, within the context of their overall conclusions regarding the investment advisory agreement, that they were satisfied with MFS’ responses and efforts relating to investment performance.
In assessing the reasonableness of the Fund’s advisory fee, the Trustees considered, among other information, the Fund’s advisory fee and the total expense ratio of the Fund’s Class A shares as a percentage of average daily net assets and the advisory fee and total expense ratios of peer groups of funds based on information provided by Lipper Inc. The Trustees considered that, according to the Lipper data (which takes into account any fee reductions or expense limitations that were in effect during the Fund’s last fiscal year), the Fund’s effective advisory fee rate was higher than the Lipper expense group median and the Fund’s total expense ratio was lower than the Lipper expense group median.
55
Table of Contents
Board Review of Investment Advisory Agreement – continued
The Trustees also considered the advisory fees charged by MFS to any comparable institutional accounts. In comparing these fees, the Trustees considered information provided by MFS as to the generally broader scope of services provided by MFS to the Fund in comparison to institutional accounts, the higher demands placed on MFS’ investment personnel and trading infrastructure as a result of the daily cash in-flows and out-flows of the Fund, and the impact on MFS and expenses associated with the more extensive regulatory regime to which the Fund is subject in comparison to institutional accounts.
The Trustees also considered whether the Fund may benefit from any economies of scale in the management of the Fund in the event of growth in assets of the Fund and/or growth in assets of the MFS Funds as a whole. They noted that the Fund’s advisory fee rate schedule is subject to contractual breakpoints that reduce the Fund’s advisory fee rate on average daily net assets over $500 million and $5 billion and that MFS has agreed in writing to implement additional breakpoints that further reduce its advisory fee rate on the Fund’s average daily net assets over $1 billion, $3 billion, $5 billion and $10 billion, each of which may not be changed without the Trustees’ approval. The Trustees also noted that MFS has agreed in writing to waive a portion of the management fees of certain MFS Funds, including the Fund, if the total combined assets of certain funds within the MFS Funds’ complex increase above agreed upon thresholds (the “group fee waiver”), enabling the Fund’s shareholders to share in the benefits from any economies of scale at the complex level. The group fee waiver is reviewed and renewed annually between the Board and MFS. The Trustees concluded that the breakpoints and the group fee waiver were sufficient to allow the Fund to benefit from economies of scale as its assets and overall complex assets grow.
The Trustees also considered information prepared by MFS relating to MFS’ costs and profits with respect to the Fund, the MFS Funds considered as a group, and other investment companies and accounts advised by MFS, as well as MFS’ methodologies used to determine and allocate its costs to the MFS Funds, the Fund and other accounts and products for purposes of estimating profitability.
After reviewing these and other factors described herein, the Trustees concluded, within the context of their overall conclusions regarding the investment advisory agreement, that the advisory fees charged to the Fund represent reasonable compensation in light of the services being provided by MFS to the Fund.
In addition, the Trustees considered MFS’ resources and related efforts to continue to retain, attract and motivate capable personnel to serve the Fund. The Trustees also considered current and developing conditions in the financial services industry, including the presence of large and well-capitalized companies which are spending, and appear to be prepared to continue to spend, substantial sums to engage personnel and to provide services to competing investment companies. In this regard, the Trustees also considered the financial resources of MFS and its ultimate parent, Sun Life Financial Inc. The Trustees also considered the advantages and possible disadvantages to the Fund of having an adviser that also serves other investment companies as well as other accounts.
The Trustees also considered the nature, quality, cost, and extent of administrative, transfer agency, and distribution services provided to the Fund by MFS and its affiliates
56
Table of Contents
Board Review of Investment Advisory Agreement – continued
under agreements and plans other than the investment advisory agreement, including any 12b-1 fees the Fund pays to MFS Fund Distributors, Inc., an affiliate of MFS. The Trustees also considered the nature, extent and quality of certain other services MFS performs or arranges for on the Fund’s behalf, which may include securities lending programs, directed expense payment programs, class action recovery programs, and MFS’ interaction with third-party service providers, principally custodians and sub-custodians. The Trustees concluded that the various non-advisory services provided by MFS and its affiliates on behalf of the Fund were satisfactory.
The Trustees also considered benefits to MFS from the use of the Fund’s portfolio brokerage commissions, if applicable, to pay for investment research and various other factors. Additionally, the Trustees considered so-called “fall-out benefits” to MFS such as reputational value derived from serving as investment manager to the Fund.
Based on their evaluation of factors that they deemed to be material, including those factors described above, the Board of Trustees, including the independent Trustees, concluded that the Fund’s investment advisory agreement with MFS should be continued for an additional one-year period, commencing August 1, 2014.
57
Table of Contents
PROXY VOTING POLICIES AND INFORMATION
MFS votes proxies on behalf of the fund pursuant to proxy voting policies and procedures that are available without charge, upon request, by calling 1-800-225-2606, by visiting the Proxy Voting section of mfs.com or by visiting the SEC’s Web site at http://www.sec.gov.
Information regarding how the fund voted proxies relating to portfolio securities during the most recent twelve-month period ended June 30 is available without charge by visiting the Proxy Voting section of mfs.com or by visiting the SEC’s Web site at http://www.sec.gov.
QUARTERLY PORTFOLIO DISCLOSURE
The fund will file a complete schedule of portfolio holdings with the Securities and Exchange Commission (the Commission) for the first and third quarters of each fiscal year on Form N-Q. A shareholder can obtain the quarterly portfolio holdings report at mfs.com. The fund’s Form N-Q is also available on the EDGAR database on the Commission’s Internet Web site at http://www.sec.gov, and may be reviewed and copied at the:
Public Reference Room
Securities and Exchange Commission
100 F Street, NE, Room 1580
Washington, D.C. 20549
Information on the operation of the Public Reference Room may be obtained by calling the Commission at 1-800-SEC-0330. Copies of the fund’s Form N-Q also may be obtained, upon payment of a duplicating fee, by electronic request at the following e-mail address: publicinfo@sec.gov or by writing the Public Reference Section at the above address.
From time to time, MFS may post important information about the fund or the MFS funds on the MFS web site (mfs.com). This information is available by visiting the “Market Commentary” and “Announcements” sub sections in the “Market Outlooks” section of mfs.com or by clicking on the fund’s name under “Mutual Funds” in the “Products” section of mfs.com.
FEDERAL TAX INFORMATION (unaudited)
The fund will notify shareholders of amounts for use in preparing 2014 income tax forms in January 2015. The following information is provided pursuant to provisions of the Internal Revenue Code.
The fund designates the maximum amount allowable as qualified dividend income eligible to be taxed at the same rate as long-term capital gain.
Income derived from foreign sources was $112,514,202. The fund intends to pass through foreign tax credits of $5,884,641 for the fiscal year.
58
Table of Contents
rev. 3/11
| WHAT DOES MFS DO WITH YOUR PERSONAL INFORMATION? |  | ||
| Why? | Financial companies choose how they share your personal information. Federal law gives consumers the right to limit some but not all sharing. Federal law also requires us to tell you how we collect, share, and protect your personal information. Please read this notice carefully to understand what we do. |
| What? | The types of personal information we collect and share depend on the product or service you have with us. This information can include:
• Social Security number and account balances • Account transactions and transaction history • Checking account information and wire transfer instructions
When you are no longer our customer, we continue to share your information as described in this notice. |
| How? | All financial companies need to share customers’ personal information to run their everyday business. In the section below, we list the reasons financial companies can share their customers’ personal information; the reasons MFS chooses to share; and whether you can limit this sharing. |
| Reasons we can share your personal information | Does MFS share? | Can you limit this sharing? | ||
For our everyday business purposes – such as to process your transactions, maintain your account(s), respond to court orders and legal investigations, or report to credit bureaus | Yes | No | ||
For our marketing purposes – to offer our products and services to you | No | We don’t share | ||
| For joint marketing with other financial companies | No | We don’t share | ||
For our affiliates’ everyday business purposes – information about your transactions and experiences | No | We don’t share | ||
For our affiliates’ everyday business purposes – information about your creditworthiness | No | We don’t share | ||
| For nonaffiliates to market to you | No | We don’t share |
| Questions? | Call 800-225-2606 or go to mfs.com. |
59
Table of Contents
| Page 2 |
| Who we are | ||
| Who is providing this notice? | MFS Funds, MFS Investment Management, MFS Institutional Advisors, Inc., MFS Fund Distributors, Inc., MFS Heritage Trust Company, and MFS Service Center, Inc. | |
| What we do | ||
| How does MFS protect my personal information? | To protect your personal information from unauthorized access and use, we use security measures that comply with federal law. These measures include procedural, electronic, and physical safeguards for the protection of the personal information we collect about you. | |
| How does MFS collect my personal information? | We collect your personal information, for example, when you
• open an account or provide account information • direct us to buy securities or direct us to sell your securities • make a wire transfer
We also collect your personal information from others, such as credit bureaus, affiliates and other companies. | |
| Why can’t I limit all sharing? | Federal law gives you the right to limit only
• sharing for affiliates’ everyday business purposes – information about your creditworthiness • affiliates from using your information to market to you • sharing for nonaffiliates to market to you
State laws and individual companies may give you additional rights to limit sharing. | |
| Definitions | ||
| Affiliates | Companies related by common ownership or control. They can be financial and nonfinancial companies.
• MFS does not share personal information with affiliates, except for everyday business purposes as described on page one of this notice. | |
| Nonaffiliates | Companies not related by common ownership or control. They can be financial and nonfinancial companies.
• MFS does not share with nonaffiliates so they can market to you. | |
| Joint Marketing | A formal agreement between nonaffiliated financial companies that together market financial products or services to you.
• MFS doesn’t jointly market. | |
| Other important information | ||
| If you own an MFS product or receive an MFS service in the name of a third party such as a bank or broker-dealer, their privacy policy may apply to you instead of ours. | ||
60
Table of Contents
Save paper with eDelivery.
| MFS® will send you prospectuses, |

reports, and proxies directly via e-mail so you will get information faster with less mailbox clutter.
To sign up:
1. Go to mfs.com.
2. Log in via MFS® Access.
3. Select eDelivery.
If you own your MFS fund shares through a financial institution or a retirement plan, MFS® TALK, MFS® Access, or eDelivery may not be available to you.
WEB SITE
mfs.com
MFS TALK
1-800-637-8255
24 hours a day
ACCOUNT SERVICE AND LITERATURE
Shareholders
1-800-225-2606
Financial advisors
1-800-343-2829
Retirement plan services
1-800-637-1255
MAILING ADDRESS
MFS Service Center, Inc.
P.O. Box 55824
Boston, MA 02205-5824
OVERNIGHT MAIL
MFS Service Center, Inc.
c/o Boston Financial Data Services
30 Dan Road
Canton, MA 02021-2809
Table of Contents
ANNUAL REPORT
September 30, 2014

MFS® RESEARCH FUND

MFR-ANN
Table of Contents
MFS® RESEARCH FUND
The report is prepared for the general information of shareholders.
It is authorized for distribution to prospective investors only when preceded or accompanied by a current prospectus.
NOT FDIC INSURED Ÿ MAY LOSE VALUE Ÿ NO BANK GUARANTEE
Table of Contents

LETTER FROM THE CHAIRMAN AND CEO
Dear Shareholders:
A rift is growing between U.S. and global economic growth. The U.S. economy has regained momentum, with a more robust labor market and steadily declining
unemployment, increased consumer confidence and growing industrial output. Corporate earnings remain strong overall.
However, the rest of the global economy is struggling. The sluggish eurozone economy is now the largest impediment to global growth. With high unemployment and low inflation, the region has been unable to gain traction since the 2008 – 2009 financial crisis. The European Central Bank’s efforts to stimulate growth have had limited success.
In Asia, China is struggling to boost its industrial output and Japan’s economic momentum has slowed after its sales tax increase in April.
As always at MFS®, active risk management is integral to how we manage your investments. We use a collaborative process, sharing insights across asset classes, regions and economic sectors. Our global team of investment professionals uses a multidisciplined, long-term, diversified investment approach.
We understand that these are challenging economic times. Applying proven principles, such as asset allocation and diversification, can best serve investors over the long term. We are confident that this approach can help you as you work with your financial advisors to reach your goals in the years ahead.
Respectfully,

Robert J. Manning
Chairman and Chief Executive Officer
MFS Investment Management
November 14, 2014
The opinions expressed in this letter are subject to change and may not be relied upon for investment advice. No forecasts can be guaranteed.
1
Table of Contents
Portfolio structure (i)

| Top ten holdings (i) | ||||
| Apple, Inc. | 3.0% | |||
| Exxon Mobil Corp. | 2.6% | |||
| Danaher Corp. | 2.0% | |||
| Visa, Inc., “A” | 1.9% | |||
| Google, Inc., “A” | 1.8% | |||
| JPMorgan Chase & Co. | 1.7% | |||
| Wells Fargo & Co. | 1.7% | |||
| MetLife, Inc. | 1.4% | |||
| EMC Corp. | 1.4% | |||
| Coca-Cola Co. | 1.3% |
| Global equity sectors (i) | ||||
| Technology | 18.3% | |||
| Financial Services | 16.7% | |||
| Capital Goods | 14.1% | |||
| Health Care | 13.6% | |||
| Energy | 12.8% | |||
| Consumer Cyclicals | 12.3% | |||
| Consumer Staples | 7.4% | |||
| Telecommunications/Cable Television | 4.0% |
| (i) | For purposes of this presentation, the components include the value of securities, less any securities sold short, and reflect the impact of the equivalent exposure of derivative positions. These amounts may be negative from time to time. Equivalent exposure is a calculated amount that translates the derivative position into a reasonable approximation of the amount of the underlying asset that the portfolio would have to hold at a given point in time to have the same price sensitivity that results from the portfolio’s ownership of the derivative contract. When dealing with derivatives, equivalent exposure is a more representative measure of the potential impact of a position on portfolio performance than value. |
Cash & Other can include cash, other assets less liabilities, offsets to derivative positions, and short-term securities.
Percentages are based on net assets as of 9/30/14.
The portfolio is actively managed and current holdings may be different.
2
Table of Contents
Summary of Results
For the twelve months ended September 30, 2014, Class A shares of the MFS Research Fund (“fund”) provided a total return of 16.27%, at net asset value. This compares with a return of 19.73% for the fund’s benchmark, the Standard & Poor’s 500 Stock Index (“S&P 500 Index”).
Market Environment
Early in the period, equity markets advanced in response to improved economic fundamentals, having recovered from prior weakness stemming from concerns that the US Federal Reserve (“Fed”) would begin tapering its quantitative easing (“QE”) program. A general theme in the market was a rotation in investor allocations from fixed income to equities and emerging markets (“EM”) to developed markets, reflecting an anticipated acceleration in developed market growth rates relative to EM as well as a more equity-friendly macro backdrop amid increased volatility in EM debt. As the period progressed, the Fed’s decision to postpone QE tapering surprised markets. Favorable market reactions were tempered, however, by tense negotiations over US fiscal policy which resulted in a 16-day partial shutdown of the federal government and a short-term extension in the debt ceiling. The volatility was short-lived, however, as an extension of budget and debt ceiling deadlines allowed the government to re-open, and subsequent economic data reflected moderate but resilient US growth. Also well-received was the decision by the European Central Bank (“ECB”) to cut its policy rate as inflation pressures waned in the region. In addition, equity investors appeared to have concluded that there would be no major change in US monetary policy as a result of the nomination of Janet Yellen as the new Fed Chair for a term beginning in early 2014 and that tapering would have no major impact on the trajectory.
Later in the period, financial markets were forced to contend with a series of positive and negative return episodes. Geopolitical tensions flared in the Middle East and Russia/Ukraine. Market setbacks were short-lived, as improving economic growth in the US coupled with prospects for easier monetary policy in regions with slowing growth such as Japan, Europe and China, supported risk assets. For example, the ECB cut policy interest rates into negative territory and by the end of the period expectations were for additional rate cuts and the announcement for non-conventional easing measures. The decline in developed market government bond yields and credit spreads were also supportive for equity markets. At the end of the period, the US equity market was trading at all-time highs.
Detractors from Performance
Weak stock selection in the capital goods sector was a primary detractor from the fund’s performance relative to the S&P 500 Index. Within this sector, the fund’s unfavorable timing in tools and home-hardware manufacturer Stanley Black & Decker (h) and overweight position in global logistics services provider Expeditors International (h) of Washington held back relative returns as both stocks underperformed the benchmark. Shares of Stanley Black & Decker remained volatile for much of the first half of the reporting period, as lower organic growth and a slow
3
Table of Contents
Management Review – continued
turnaround in its security business segment resulted in third-quarter operating shortfalls and reduced fourth quarter outlook. In the latter half of the period, the stock recovered after the company posted above-consensus earnings that were up double figures year-on-year.
Weak stock selection in the technology sector also weighed on relative performance. Most notably, not owning shares of software giant Microsoft (h) and owning put options in semiconductor company Intel detracted from relative returns. Shares of Microsoft gained on news that the software giant will undergo a restructuring plan to simplify its operations and align the recently acquired Nokia Devices and Services business with its overall strategy. The strategic acquisition of Minecraft-maker Majong further benefited the stock.
Weak stock selection in consumer staples hindered relative performance. However, there were no individual securities within this sector that were among the fund’s top relative detractors.
Elsewhere, holding shares of ITT Educational Services (b)(h) and unfavorable timing in strong-performing biotech firm Gilead Sciences (h) held back relative results. Overweight positions in independent oil and gas company Cabot Oil & Gas, retail giant Target and retail store chain Bed Bath & Beyond also detracted from relative performance.
Contributors to Performance
Stock selection in the telecommunications/cable television sector was a positive factor for relative performance. However, there were no individual securities within this sector that were among the fund’s top relative contributors for the reporting period.
Stock selection in the energy sector also contributed positively to relative performance. Not owning shares of integrated energy company Chevron was a primary contributor to relative performance. The stock came under pressure as investors appeared to have reacted unfavorably to management’s cut to its fiscal year production guidance due to a variety of issues, including the shutdown of its Angolan LNG plant, weather issues and asset sales.
Top relative contributors in other sectors included overweight positions in computer and personal electronics maker Hewlett-Packard, specialty pharmaceutical company Actavis, healthcare products manufacturer Covidien and railroad transportation services provider Union Pacific. Shares of Hewlett-Packard rallied over the reporting period as total company sales grew from strong performance in the PC segment. The company also posted very strong free cash flows that can potentially provide adequate funds for stock repurchases, dividends and strategic Mergers & Acquisitions (M&A) activity.
Elsewhere, the fund’s avoidance of weak-performing diversified technology products and services company International Business Machines (IBM), diversified industrial conglomerate General Electric and automotive company Ford Motor contributed to
4
Table of Contents
Management Review – continued
relative performance. The fund’s out-of-benchmark holdings of semiconductor manufacturer NXP Semiconductors and retail store operator Burlington Stores were also positive factors for relative results.
Respectfully,
Joseph MacDougall
Portfolio Manager
| (b) | Security is not a benchmark constituent. |
| (h) | Security was not held in the portfolio at period end. |
The views expressed in this report are those of the portfolio manager only through the end of the period of the report as stated on the cover and do not necessarily reflect the views of MFS or any other person in the MFS organization. These views are subject to change at any time based on market or other conditions, and MFS disclaims any responsibility to update such views. These views may not be relied upon as investment advice or an indication of trading intent on behalf of any MFS portfolio. References to specific securities are not recommendations of such securities, and may not be representative of any MFS portfolio’s current or future investments.
5
Table of Contents
PERFORMANCE SUMMARY THROUGH 9/30/14
The following chart illustrates a representative class of the fund’s historical performance in comparison to its benchmark(s). Performance results include the deduction of the maximum applicable sales charge and reflect the percentage change in net asset value, including reinvestment of dividends and capital gains distributions. The performance of other share classes will be greater than or less than that of the class depicted below. Benchmarks are unmanaged and may not be invested in directly. Benchmark returns do not reflect sales charges, commissions or expenses. (See Notes to Performance Summary.)
Performance data shown represents past performance and is no guarantee of future results. Investment return and principal value fluctuate so your shares, when sold, may be worth more or less than the original cost; current performance may be lower or higher than quoted. The performance shown does not reflect the deduction of taxes, if any, that a shareholder would pay on fund distributions or the redemption of fund shares.
Growth of a Hypothetical $10,000 Investment
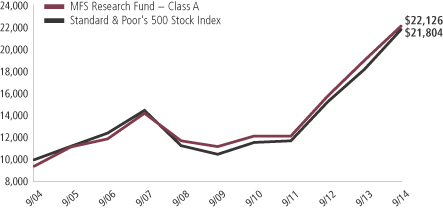
6
Table of Contents
Performance Summary – continued
Total Returns through 9/30/14
Average annual without sales charge
| Share class | Class inception date | 1-yr | 5-yr | 10-yr | Life (t) | |||||||||
| A | 10/13/71 | 16.27% | 14.60% | 8.91% | N/A | |||||||||
| B | 9/07/93 | 15.41% | 13.75% | 8.14% | N/A | |||||||||
| C | 1/03/94 | 15.40% | 13.74% | 8.14% | N/A | |||||||||
| I | 1/02/97 | 16.54% | 14.88% | 9.23% | N/A | |||||||||
| R1 | 4/01/05 | 15.41% | 13.74% | N/A | 7.40% | |||||||||
| R2 | 10/31/03 | 15.99% | 14.32% | 8.62% | N/A | |||||||||
| R3 | 4/01/05 | 16.29% | 14.60% | N/A | 8.20% | |||||||||
| R4 | 4/01/05 | 16.56% | 14.87% | N/A | 8.48% | |||||||||
| R5 | 5/01/06 | 16.62% | 14.87% | N/A | 7.78% | |||||||||
| Comparative benchmark | ||||||||||||||
| Standard & Poor’s 500 Stock Index (f) | 19.73% | 15.70% | 8.11% | N/A | ||||||||||
| Average annual with sales charge | ||||||||||||||
| A With initial Sales Charge (5.75%) | 9.59% | 13.25% | 8.27% | N/A | ||||||||||
| B With CDSC (Declining over six years from 4% to 0%) (v) | 11.41% | 13.51% | 8.14% | N/A | ||||||||||
| C With CDSC (1% for 12 months) (v) | 14.40% | 13.74% | 8.14% | N/A | ||||||||||
CDSC – Contingent Deferred Sales Charge.
Class I, R1, R2, R3, R4, and R5 shares do not have a sales charge.
On May 30, 2012, Class W shares were redesignated Class R5 shares. Total returns for Class R5 shares prior to May 30, 2012 reflect the performance history of Class W shares which had different fees and expenses than Class R5 shares.
| (f) | Source: FactSet Research Systems Inc. |
| (t) | For the period from the class inception date through the stated period end (for those share classes with less than 10 years of performance history). No comparative benchmark performance information is provided for “life” periods. (See Notes to Performance Summary.) |
| (v) | Assuming redemption at the end of the applicable period. |
Benchmark Definition
Standard & Poor’s 500 Stock Index – a market capitalization-weighted index of 500 widely held equity securities, designed to measure broad U.S. equity performance.
It is not possible to invest directly in an index.
Notes to Performance Summary
Average annual total return represents the average annual change in value for each share class for the periods presented. Life returns are presented where the share class has less than 10 years of performance history and represent the average annual total
7
Table of Contents
Performance Summary – continued
return from the class inception date to the stated period end date. As the fund’s share classes may have different inception dates, the life returns may represent different time periods and may not be comparable. As a result, no comparative benchmark performance information is provided for life periods.
Performance results reflect any applicable expense subsidies and waivers in effect during the periods shown. Without such subsidies and waivers the fund’s performance results would be less favorable. Please see the prospectus and financial statements for complete details.
Performance results do not include adjustments made for financial reporting purposes in accordance with U.S. generally accepted accounting principles and may differ from amounts reported in the financial highlights.
From time to time the fund may receive proceeds from litigation settlements, without which performance would be lower.
8
Table of Contents
Fund expenses borne by the shareholders during the period, April 1, 2014 through September 30, 2014
As a shareholder of the fund, you incur two types of costs: (1) transaction costs, including sales charges (loads) on certain purchase or redemption payments, and (2) ongoing costs, including management fees; distribution and service (12b-1) fees; and other fund expenses. This example is intended to help you understand your ongoing costs (in dollars) of investing in the fund and to compare these costs with the ongoing costs of investing in other mutual funds.
The example is based on an investment of $1,000 invested at the beginning of the period and held for the entire period April 1, 2014 through September 30, 2014.
Actual Expenses
The first line for each share class in the following table provides information about actual account values and actual expenses. You may use the information in this line, together with the amount you invested, to estimate the expenses that you paid over the period. Simply divide your account value by $1,000 (for example, an $8,600 account value divided by $1,000 = 8.6), then multiply the result by the number in the first line under the heading entitled “Expenses Paid During Period” to estimate the expenses you paid on your account during this period.
Hypothetical Example for Comparison Purposes
The second line for each share class in the following table provides information about hypothetical account values and hypothetical expenses based on the fund’s actual expense ratio and an assumed rate of return of 5% per year before expenses, which is not the fund’s actual return. The hypothetical account values and expenses may not be used to estimate the actual ending account balance or expenses you paid for the period. You may use this information to compare the ongoing costs of investing in the fund and other funds. To do so, compare this 5% hypothetical example with the 5% hypothetical examples that appear in the shareholder reports of the other funds.
Please note that the expenses shown in the table are meant to highlight your ongoing costs only and do not reflect any transactional costs, such as sales charges (loads). Therefore, the second line for each share class in the table is useful in comparing ongoing costs only, and will not help you determine the relative total costs of owning different funds. In addition, if these transactional costs were included, your costs would have been higher.
9
Table of Contents
Expense Table – continued
| Share Class | Annualized Ratio | Beginning Account Value 4/01/14 | Ending Account Value | Expenses Paid During 4/01/14-9/30/14 | ||||||||||||||
| A | Actual | 0.78% | $1,000.00 | $1,045.57 | $4.00 | |||||||||||||
| Hypothetical (h) | 0.78% | $1,000.00 | $1,021.16 | $3.95 | ||||||||||||||
| B | Actual | 1.53% | $1,000.00 | $1,041.73 | $7.83 | |||||||||||||
| Hypothetical (h) | 1.53% | $1,000.00 | $1,017.40 | $7.74 | ||||||||||||||
| C | Actual | 1.53% | $1,000.00 | $1,041.92 | $7.83 | |||||||||||||
| Hypothetical (h) | 1.53% | $1,000.00 | $1,017.40 | $7.74 | ||||||||||||||
| I | Actual | 0.54% | $1,000.00 | $1,046.80 | $2.77 | |||||||||||||
| Hypothetical (h) | 0.54% | $1,000.00 | $1,022.36 | $2.74 | ||||||||||||||
| R1 | Actual | 1.54% | $1,000.00 | $1,041.54 | $7.88 | |||||||||||||
| Hypothetical (h) | 1.54% | $1,000.00 | $1,017.35 | $7.79 | ||||||||||||||
| R2 | Actual | 1.04% | $1,000.00 | $1,044.25 | $5.33 | |||||||||||||
| Hypothetical (h) | 1.04% | $1,000.00 | $1,019.85 | $5.27 | ||||||||||||||
| R3 | Actual | 0.79% | $1,000.00 | $1,045.81 | $4.05 | |||||||||||||
| Hypothetical (h) | 0.79% | $1,000.00 | $1,021.11 | $4.00 | ||||||||||||||
| R4 | Actual | 0.53% | $1,000.00 | $1,046.94 | $2.72 | |||||||||||||
| Hypothetical (h) | 0.53% | $1,000.00 | $1,022.41 | $2.69 | ||||||||||||||
| R5 | Actual | 0.47% | $1,000.00 | $1,047.21 | $2.41 | |||||||||||||
| Hypothetical (h) | 0.47% | $1,000.00 | $1,022.71 | $2.38 | ||||||||||||||
| (h) | 5% class return per year before expenses. |
| (p) | “Expenses Paid During Period” are equal to each class’s annualized expense ratio, as shown above, multiplied by the average account value over the period, multiplied by 183/365 (to reflect the one-half year period). Expenses paid do not include any applicable sales charges (loads). If these transaction costs had been included, your costs would have been higher. |
10
Table of Contents
9/30/14
The Portfolio of Investments is a complete list of all securities owned by your fund. It is categorized by broad-based asset classes.
| Common Stocks - 99.3% | ||||||||
| Issuer | Shares/Par | Value ($) | ||||||
| Aerospace - 3.1% | ||||||||
| Honeywell International, Inc. | 489,105 | $ | 45,545,458 | |||||
| Precision Castparts Corp. | 161,226 | 38,191,215 | ||||||
| United Technologies Corp. | 531,538 | 56,130,413 | ||||||
|
| |||||||
| $ | 139,867,086 | |||||||
| Alcoholic Beverages - 0.8% | ||||||||
| Constellation Brands, Inc., “A” (a) | 249,783 | $ | 21,771,086 | |||||
| Molson Coors Brewing Co. | 182,870 | 13,612,843 | ||||||
|
| |||||||
| $ | 35,383,929 | |||||||
| Apparel Manufacturers - 1.2% | ||||||||
| Global Brands Group Holding Ltd. (a) | 24,060,000 | $ | 5,298,570 | |||||
| Li & Fung Ltd. | 4,588,000 | 5,211,454 | ||||||
| NIKE, Inc., “B” | 157,022 | 14,006,362 | ||||||
| PVH Corp. | 232,629 | 28,183,003 | ||||||
|
| |||||||
| $ | 52,699,389 | |||||||
| Automotive - 0.7% | ||||||||
| Delphi Automotive PLC | 520,361 | $ | 31,918,944 | |||||
| Biotechnology - 1.7% | ||||||||
| Alexion Pharmaceuticals, Inc. (a) | 188,164 | $ | 31,201,354 | |||||
| Biogen Idec, Inc. (a) | 136,521 | 45,162,512 | ||||||
|
| |||||||
| $ | 76,363,866 | |||||||
| Broadcasting - 2.7% | ||||||||
| Time Warner, Inc. | 516,893 | $ | 38,875,523 | |||||
| Twenty-First Century Fox, Inc. | 1,489,342 | 51,069,537 | ||||||
| Walt Disney Co. | 337,251 | 30,025,457 | ||||||
|
| |||||||
| $ | 119,970,517 | |||||||
| Brokerage & Asset Managers - 2.3% | ||||||||
| BlackRock, Inc. | 106,238 | $ | 34,880,060 | |||||
| Franklin Resources, Inc. | 722,076 | 39,432,570 | ||||||
| Intercontinental Exchange, Inc. | 160,220 | 31,250,911 | ||||||
|
| |||||||
| $ | 105,563,541 | |||||||
| Business Services - 1.9% | ||||||||
| Accenture PLC, “A” | 364,766 | $ | 29,662,771 | |||||
| Fidelity National Information Services, Inc. | 432,089 | 24,326,611 | ||||||
11
Table of Contents
Portfolio of Investments – continued
| Issuer | Shares/Par | Value ($) | ||||||
| Common Stocks - continued | ||||||||
| Business Services - continued | ||||||||
| FleetCor Technologies, Inc. (a) | 155,436 | $ | 22,090,564 | |||||
| Gartner, Inc. (a) | 128,693 | 9,455,075 | ||||||
|
| |||||||
| $ | 85,535,021 | |||||||
| Cable TV - 1.8% | ||||||||
| Charter Communications, Inc., “A” (a) | 146,242 | $ | 22,136,652 | |||||
| Comcast Corp., “Special A” | 683,175 | 36,549,863 | ||||||
| Time Warner Cable, Inc. | 145,084 | 20,818,103 | ||||||
|
| |||||||
| $ | 79,504,618 | |||||||
| Chemicals - 0.8% | ||||||||
| E.I. du Pont de Nemours & Co. | 510,099 | $ | 36,604,704 | |||||
| Computer Software - 3.1% | ||||||||
| Adobe Systems, Inc. (a) | 133,639 | $ | 9,246,482 | |||||
| Citrix Systems, Inc. (a) | 438,477 | 31,280,949 | ||||||
| Oracle Corp. | 1,211,319 | 46,369,291 | ||||||
| Qlik Technologies, Inc. (a) | 608,492 | 16,453,624 | ||||||
| Salesforce.com, Inc. (a) | 627,784 | 36,116,413 | ||||||
|
| |||||||
| $ | 139,466,759 | |||||||
| Computer Software - Systems - 5.9% | ||||||||
| Apple, Inc. (s) | 1,321,202 | $ | 133,111,102 | |||||
| CDW Corp. | 275,994 | 8,569,614 | ||||||
| EMC Corp. | 2,199,724 | 64,363,924 | ||||||
| Hewlett-Packard Co. | 1,432,797 | 50,821,310 | ||||||
| NCR Corp. (a) | 303,258 | 10,131,850 | ||||||
|
| |||||||
| $ | 266,997,800 | |||||||
| Construction - 0.8% | ||||||||
| Sherwin-Williams Co. | 172,867 | $ | 37,856,144 | |||||
| Consumer Products - 2.6% | ||||||||
| Colgate-Palmolive Co. | 645,844 | $ | 42,121,946 | |||||
| Estee Lauder Cos., Inc., “A” | 296,481 | 22,153,060 | ||||||
| Newell Rubbermaid, Inc. | 846,127 | 29,115,230 | ||||||
| Procter & Gamble Co. | 295,350 | 24,732,609 | ||||||
|
| |||||||
| $ | 118,122,845 | |||||||
| Consumer Services - 0.7% | ||||||||
| Priceline Group, Inc. (a) | 25,705 | $ | 29,781,299 | |||||
| Containers - 0.6% | ||||||||
| Crown Holdings, Inc. (a) | 594,630 | $ | 26,472,928 | |||||
12
Table of Contents
Portfolio of Investments – continued
| Issuer | Shares/Par | Value ($) | ||||||
| Common Stocks - continued | ||||||||
| Electrical Equipment - 2.7% | ||||||||
| Danaher Corp. (s) | 1,157,063 | $ | 87,913,647 | |||||
| W.W. Grainger, Inc. | 128,982 | 32,458,320 | ||||||
|
| |||||||
| $ | 120,371,967 | |||||||
| Electronics - 2.0% | ||||||||
| Altera Corp. | 747,983 | $ | 26,762,832 | |||||
| Mellanox Technologies Ltd. (a) | 324,013 | 14,538,463 | ||||||
| Microchip Technology, Inc. | 471,558 | 22,271,684 | ||||||
| NXP Semiconductors N.V. (a) | 354,433 | 24,253,850 | ||||||
|
| |||||||
| $ | 87,826,829 | |||||||
| Energy - Independent - 4.7% | ||||||||
| Anadarko Petroleum Corp. | 385,431 | $ | 39,098,121 | |||||
| Cabot Oil & Gas Corp. | 754,923 | 24,678,433 | ||||||
| EOG Resources, Inc. | 199,455 | 19,750,034 | ||||||
| EQT Corp. | 204,519 | 18,721,669 | ||||||
| Marathon Petroleum Corp. | 138,648 | 11,739,326 | ||||||
| Memorial Resource Development Corp. (a) | 610,824 | 16,559,439 | ||||||
| Noble Energy, Inc. | 435,559 | 29,774,813 | ||||||
| Pioneer Natural Resources Co. | 151,548 | 29,850,410 | ||||||
| Whiting Petroleum Corp. (a) | 266,101 | 20,636,133 | ||||||
|
| |||||||
| $ | 210,808,378 | |||||||
| Energy - Integrated - 2.6% | ||||||||
| Exxon Mobil Corp. (s) | 1,255,275 | $ | 118,058,614 | |||||
| Engineering - Construction - 0.3% | ||||||||
| Fluor Corp. | 235,419 | $ | 15,723,635 | |||||
| Food & Beverages - 2.8% | ||||||||
| Coca-Cola Co. | 1,409,261 | $ | 60,119,074 | |||||
| General Mills, Inc. | 538,064 | 27,145,329 | ||||||
| Mondelez International, Inc. | 1,112,081 | 38,105,455 | ||||||
|
| |||||||
| $ | 125,369,858 | |||||||
| Food & Drug Stores - 0.7% | ||||||||
| CVS Health Corp. | 421,060 | $ | 33,512,165 | |||||
| Gaming & Lodging - 0.4% | ||||||||
| Wynn Resorts Ltd. | 97,329 | $ | 18,208,309 | |||||
| General Merchandise - 1.3% | ||||||||
| Kohl’s Corp. | 470,556 | $ | 28,718,033 | |||||
| Target Corp. | 507,141 | 31,787,598 | ||||||
|
| |||||||
| $ | 60,505,631 | |||||||
13
Table of Contents
Portfolio of Investments – continued
| Issuer | Shares/Par | Value ($) | ||||||
| Common Stocks - continued | ||||||||
| Health Maintenance Organizations - 1.0% | ||||||||
| UnitedHealth Group, Inc. | 536,650 | $ | 46,286,062 | |||||
| Insurance - 3.0% | ||||||||
| ACE Ltd. | 239,061 | $ | 25,070,327 | |||||
| American International Group, Inc. | 849,831 | 45,907,871 | ||||||
| MetLife, Inc. | 1,198,871 | 64,403,350 | ||||||
|
| |||||||
| $ | 135,381,548 | |||||||
| Internet - 5.5% | ||||||||
| eBay, Inc. (a) | 487,391 | $ | 27,600,952 | |||||
| Facebook, Inc., “A “ (a) | 633,226 | 50,050,183 | ||||||
| Google, Inc., “A” (a) | 140,702 | 82,790,464 | ||||||
| Google, Inc., “C” (a) | 86,873 | 50,156,995 | ||||||
| LinkedIn Corp., “A” (a) | 122,523 | 25,459,054 | ||||||
| Yelp, Inc. (a) | 166,110 | 11,337,008 | ||||||
|
| |||||||
| $ | 247,394,656 | |||||||
| Machinery & Tools - 2.4% | ||||||||
| Eaton Corp. PLC | 454,150 | $ | 28,779,486 | |||||
| Joy Global, Inc. | 436,757 | 23,820,727 | ||||||
| Roper Industries, Inc. | 393,020 | 57,494,896 | ||||||
|
| |||||||
| $ | 110,095,109 | |||||||
| Major Banks - 6.3% | ||||||||
| Bank of America Corp. | 2,039,607 | $ | 34,775,299 | |||||
| Goldman Sachs Group, Inc. | 158,913 | 29,171,659 | ||||||
| JPMorgan Chase & Co. | 1,283,966 | 77,346,112 | ||||||
| Morgan Stanley | 988,665 | 34,178,149 | ||||||
| State Street Corp. | 408,603 | 30,077,267 | ||||||
| Wells Fargo & Co. | 1,485,728 | 77,064,711 | ||||||
|
| |||||||
| $ | 282,613,197 | |||||||
| Medical & Health Technology & Services - 1.1% | ||||||||
| Express Scripts Holding Co. (a) | 366,679 | $ | 25,898,538 | |||||
| McKesson Corp. | 119,183 | 23,201,355 | ||||||
|
| |||||||
| $ | 49,099,893 | |||||||
| Medical Equipment - 3.8% | ||||||||
| Abbott Laboratories | 1,181,724 | $ | 49,147,901 | |||||
| Covidien PLC | 310,847 | 26,891,374 | ||||||
| DENTSPLY International, Inc. | 343,750 | 15,675,000 | ||||||
| Stryker Corp. | 424,539 | 34,281,524 | ||||||
| Thermo Fisher Scientific, Inc. | 377,294 | 45,916,680 | ||||||
|
| |||||||
| $ | 171,912,479 | |||||||
14
Table of Contents
Portfolio of Investments – continued
| Issuer | Shares/Par | Value ($) | ||||||
| Common Stocks - continued | ||||||||
| Natural Gas - Distribution - 0.5% | ||||||||
| Sempra Energy | 215,458 | $ | 22,704,964 | |||||
| Natural Gas - Pipeline - 0.6% | ||||||||
| Williams Cos., Inc. | 471,715 | $ | 26,109,425 | |||||
| Oil Services - 2.0% | ||||||||
| Cameron International Corp. (a) | 317,227 | $ | 21,057,528 | |||||
| Halliburton Co. | 673,351 | 43,437,873 | ||||||
| Schlumberger Ltd. | 232,215 | 23,613,943 | ||||||
|
| |||||||
| $ | 88,109,344 | |||||||
| Other Banks & Diversified Financials - 5.1% | ||||||||
| American Express Co. | 507,045 | $ | 44,386,719 | |||||
| BB&T Corp. | 491,834 | 18,301,143 | ||||||
| Citigroup, Inc. | 1,153,644 | 59,781,832 | ||||||
| Discover Financial Services | 351,930 | 22,660,773 | ||||||
| Visa, Inc., “A” | 394,393 | 84,151,634 | ||||||
|
| |||||||
| $ | 229,282,101 | |||||||
| Pharmaceuticals - 6.0% | ||||||||
| AbbVie, Inc. | 780,761 | $ | 45,096,755 | |||||
| Actavis PLC (a) | 225,627 | 54,439,283 | ||||||
| Bristol-Myers Squibb Co. | 769,393 | 39,377,534 | ||||||
| Endo International PLC (a) | 317,224 | 21,679,088 | ||||||
| Merck & Co., Inc. | 984,797 | 58,378,766 | ||||||
| Valeant Pharmaceuticals International, Inc. (a) | 253,979 | 33,322,045 | ||||||
| Zoetis, Inc. | 496,044 | 18,328,826 | ||||||
|
| |||||||
| $ | 270,622,297 | |||||||
| Railroad & Shipping - 1.7% | ||||||||
| Canadian Pacific Railway Ltd. | 79,599 | $ | 16,514,405 | |||||
| Union Pacific Corp. | 543,128 | 58,885,938 | ||||||
|
| |||||||
| $ | 75,400,343 | |||||||
| Restaurants - 1.2% | ||||||||
| McDonald’s Corp. | 377,192 | $ | 35,761,574 | |||||
| YUM! Brands, Inc. | 274,747 | 19,776,289 | ||||||
|
| |||||||
| $ | 55,537,863 | |||||||
| Specialty Chemicals - 1.0% | ||||||||
| Albemarle Corp. | 357,472 | $ | 21,055,101 | |||||
| W.R. Grace & Co. (a) | 244,811 | 22,263,112 | ||||||
|
| |||||||
| $ | 43,318,213 | |||||||
15
Table of Contents
Portfolio of Investments – continued
| Issuer | Shares/Par | Value ($) | ||||||
| Common Stocks - continued | ||||||||
| Specialty Stores - 4.1% | ||||||||
| Amazon.com, Inc. (a) | 76,322 | $ | 24,609,266 | |||||
| AutoZone, Inc. (a) | 44,342 | 22,599,344 | ||||||
| Bed Bath & Beyond, Inc. (a) | 330,428 | 21,752,075 | ||||||
| Burlington Stores, Inc. (a) | 569,110 | 22,684,725 | ||||||
| L Brands, Inc. | 420,365 | 28,156,048 | ||||||
| Ross Stores, Inc. | 287,101 | 21,699,094 | ||||||
| Sally Beauty Holdings, Inc. (a) | 607,544 | 16,628,479 | ||||||
| Urban Outfitters, Inc. (a) | 662,442 | 24,311,621 | ||||||
|
| |||||||
| $ | 182,440,652 | |||||||
| Telecommunications - Wireless - 1.0% | ||||||||
| American Tower Corp., REIT | 347,218 | $ | 32,510,021 | |||||
| SBA Communications Corp. (a) | 121,528 | 13,477,455 | ||||||
|
| |||||||
| $ | 45,987,476 | |||||||
| Telephone Services - 1.2% | ||||||||
| Verizon Communications, Inc. | 1,083,079 | $ | 54,143,119 | |||||
| Tobacco - 1.2% | ||||||||
| Philip Morris International, Inc. | 655,656 | $ | 54,681,710 | |||||
| Utilities - Electric Power - 2.4% | ||||||||
| American Electric Power Co., Inc. | 429,566 | $ | 22,427,641 | |||||
| CMS Energy Corp. | 1,070,146 | 31,740,530 | ||||||
| Northeast Utilities | 604,334 | 26,771,996 | ||||||
| NRG Energy, Inc. | 918,313 | 27,990,180 | ||||||
|
| |||||||
| $ | 108,930,347 | |||||||
| Total Common Stocks (Identified Cost, $3,389,454,188) | $ | 4,472,545,574 | ||||||
| Put Options Purchased - 0.0% | ||||||||
| Intel Corp. - October 2014 @ $31 (Premiums Paid, $552,852) | 2,746 | $ | 27,460 | |||||
| Money Market Funds - 0.8% | ||||||||
| MFS Institutional Money Market Portfolio, 0.09%, at Cost and Net Asset Value (v) | 35,567,026 | $ | 35,567,026 | |||||
| Total Investments (Identified Cost, $3,425,574,066) | $ | 4,508,140,060 | ||||||
| Other Assets, Less Liabilities - (0.1)% | (2,459,169 | ) | ||||||
| Net Assets - 100.0% | $ | 4,505,680,891 | ||||||
| (a) | Non-income producing security. |
| (s) | Security or a portion of the security was pledged to cover collateral requirements for certain derivative contracts. |
16
Table of Contents
Portfolio of Investments – continued
| (v) | Underlying affiliated fund that is available only to investment companies managed by MFS. The rate quoted for the MFS Institutional Money Market Portfolio is the annualized seven-day yield of the fund at period end. |
At September 30, 2014, the fund had cash collateral of $9,954 and other liquid securities with an aggregate value of $481,585 to cover any commitments for derivative contracts. Cash collateral is comprised of “Deposits with brokers” in the Statement of Assets and Liabilities.
The following abbreviations are used in this report and are defined:
| PLC | Public Limited Company |
| REIT | Real Estate Investment Trust |
See Notes to Financial Statements
17
Table of Contents
Financial Statements
STATEMENT OF ASSETS AND LIABILITIES
At 9/30/14
This statement represents your fund’s balance sheet, which details the assets and liabilities comprising the total value of the fund.
| Assets | ||||
Investments- | ||||
Non-affiliated issuers, at value (identified cost, $3,390,007,040) | $4,472,573,034 | |||
Underlying affiliated funds, at cost and value | 35,567,026 | |||
Total investments, at value (identified cost, $3,425,574,066) | $4,508,140,060 | |||
Deposits with brokers | 9,954 | |||
Receivables for | ||||
Fund shares sold | 4,833,573 | |||
Interest and dividends | 4,037,209 | |||
Other assets | 49,320 | |||
Total assets | $4,517,070,116 | |||
| Liabilities | ||||
Payables for | ||||
Investments purchased | $220,092 | |||
Fund shares reacquired | 7,842,476 | |||
Payable to affiliates | ||||
Investment adviser | 110,289 | |||
Shareholder servicing costs | 2,858,811 | |||
Distribution and service fees | 24,405 | |||
Payable for independent Trustees’ compensation | 155,733 | |||
Accrued expenses and other liabilities | 177,419 | |||
Total liabilities | $11,389,225 | |||
Net assets | $4,505,680,891 | |||
| Net assets consist of | ||||
Paid-in capital | $3,215,968,264 | |||
Unrealized appreciation (depreciation) on investments and translation of assets and liabilities in foreign currencies | 1,082,565,957 | |||
Accumulated net realized gain (loss) on investments and foreign currency | 183,695,399 | |||
Undistributed net investment income | 23,451,271 | |||
Net assets | $4,505,680,891 | |||
Shares of beneficial interest outstanding | 116,160,245 |
18
Table of Contents
Statement of Assets and Liabilities – continued
| Net assets | Shares outstanding | Net asset value per share (a) | ||||||||||
Class A | $2,131,105,725 | 54,957,966 | $38.78 | |||||||||
Class B | 29,834,147 | 829,844 | 35.95 | |||||||||
Class C | 129,358,672 | 3,614,693 | 35.79 | |||||||||
Class I | 705,199,739 | 17,811,506 | 39.59 | |||||||||
Class R1 | 4,422,245 | 125,094 | 35.35 | |||||||||
Class R2 | 37,003,235 | 979,969 | 37.76 | |||||||||
Class R3 | 58,407,245 | 1,514,127 | 38.57 | |||||||||
Class R4 | 46,234,695 | 1,191,243 | 38.81 | |||||||||
Class R5 | 1,364,115,188 | 35,135,803 | 38.82 | |||||||||
| (a) | Maximum offering price per share was equal to the net asset value per share for all share classes, except for Class A, for which the maximum offering price per share was $41.15 [100 / 94.25 x $38.78]. On sales of $50,000 or more, the maximum offering price of Class A shares is reduced. A contingent deferred sales charge may be imposed on redemptions of Class A, Class B, and Class C shares. Redemption price per share was equal to the net asset value per share for Classes I, R1, R2, R3, R4, and R5. |
See Notes to Financial Statements
19
Table of Contents
Financial Statements
Year ended 9/30/14
This statement describes how much your fund earned in investment income and accrued in expenses. It also describes any gains and/or losses generated by fund operations.
| Net investment income | ||||
Income | ||||
Dividends | $63,409,097 | |||
Interest | 50,420 | |||
Dividends from underlying affiliated funds | 43,848 | |||
Foreign taxes withheld | (7,740 | ) | ||
Total investment income | $63,495,625 | |||
Expenses | ||||
Management fee | $18,725,810 | |||
Distribution and service fees | 7,133,649 | |||
Shareholder servicing costs | 3,334,239 | |||
Administrative services fee | 500,943 | |||
Independent Trustees’ compensation | 70,498 | |||
Custodian fee | 183,430 | |||
Shareholder communications | 123,422 | |||
Audit and tax fees | 55,234 | |||
Legal fees | 41,916 | |||
Dividend and interest expense on securities sold short | 34,830 | |||
Miscellaneous | 279,662 | |||
Total expenses | $30,483,633 | |||
Fees paid indirectly | (52 | ) | ||
Reduction of expenses by investment adviser and distributor | (97,812 | ) | ||
Net expenses | $30,385,769 | |||
Net investment income | $33,109,856 | |||
| Realized and unrealized gain (loss) on investments and foreign currency | ||||
Realized gain (loss) (identified cost basis) | ||||
Investments | $217,497,411 | |||
Written options | 24,998 | |||
Securities sold short | 1,989,973 | |||
Foreign currency | (16,542 | ) | ||
Net realized gain (loss) on investments and foreign currency | $219,495,840 | |||
Change in unrealized appreciation (depreciation) | ||||
Investments | $396,324,383 | |||
Securities sold short | (2,088,977 | ) | ||
Translation of assets and liabilities in foreign currencies | (11,334 | ) | ||
Net unrealized gain (loss) on investments and foreign currency translation | $394,224,072 | |||
Net realized and unrealized gain (loss) on investments and foreign currency | $613,719,912 | |||
Change in net assets from operations | $646,829,768 | |||
See Notes to Financial Statements
20
Table of Contents
Financial Statements
STATEMENTS OF CHANGES IN NET ASSETS
These statements describe the increases and/or decreases in net assets resulting from operations, any distributions, and any shareholder transactions.
| Years ended 9/30 | ||||||||
| 2014 | 2013 | |||||||
| Change in net assets | ||||||||
| From operations | ||||||||
Net investment income | $33,109,856 | $34,410,345 | ||||||
Net realized gain (loss) on investments and foreign currency | 219,495,840 | 268,894,727 | ||||||
Net unrealized gain (loss) on investments and foreign currency translation | 394,224,072 | 314,717,464 | ||||||
Change in net assets from operations | $646,829,768 | $618,022,536 | ||||||
| Distributions declared to shareholders | ||||||||
From net investment income | $(43,890,103 | ) | $(24,130,435 | ) | ||||
From net realized gain on investments | (77,681,194 | ) | — | |||||
Total distributions declared to shareholders | $(121,571,297 | ) | $(24,130,435 | ) | ||||
Change in net assets from fund share transactions | $120,015,527 | $467,187,438 | ||||||
Total change in net assets | $645,273,998 | $1,061,079,539 | ||||||
| Net assets | ||||||||
At beginning of period | 3,860,406,893 | 2,799,327,354 | ||||||
At end of period (including undistributed net investment income of $23,451,271 and $34,248,060, respectively) | $4,505,680,891 | $3,860,406,893 | ||||||
See Notes to Financial Statements
21
Table of Contents
Financial Statements
The financial highlights table is intended to help you understand the fund’s financial performance for the past 5 years. Certain information reflects financial results for a single fund share. The total returns in the table represent the rate by which an investor would have earned (or lost) on an investment in the fund share class (assuming reinvestment of all distributions) held for the entire period.
| Class A | Years ended 9/30 | |||||||||||||||||||
| 2014 | 2013 | 2012 | 2011 | 2010 | ||||||||||||||||
Net asset value, beginning of period | $34.33 | $28.74 | $22.31 | $22.43 | $20.86 | |||||||||||||||
| Income (loss) from investment operations | ||||||||||||||||||||
Net investment income (d) | $0.24 | $0.30 | $0.25 | $0.20 | $0.17 | |||||||||||||||
Net realized and unrealized gain (loss) on | 5.24 | 5.51 | 6.38 | (0.15 | ) | 1.60 | ||||||||||||||
Total from investment operations | $5.48 | $5.81 | $6.63 | $0.05 | $1.77 | |||||||||||||||
| Less distributions declared to shareholders | ||||||||||||||||||||
From net investment income | $(0.35 | ) | $(0.22 | ) | $(0.20 | ) | $(0.17 | ) | $(0.20 | ) | ||||||||||
From net realized gain on investments | (0.68 | ) | — | — | — | — | ||||||||||||||
Total distributions declared to shareholders | $(1.03 | ) | $(0.22 | ) | $(0.20 | ) | $(0.17 | ) | $(0.20 | ) | ||||||||||
Net asset value, end of period (x) | $38.78 | $34.33 | $28.74 | $22.31 | $22.43 | |||||||||||||||
Total return (%) (r)(s)(t)(x) | 16.27 | 20.36 | 29.92 | 0.16 | 8.54 | |||||||||||||||
| Ratios (%) (to average net assets) and Supplemental data: | ||||||||||||||||||||
Expenses before expense reductions (f) | 0.81 | 0.88 | 0.90 | 0.90 | 0.92 | |||||||||||||||
Expenses after expense reductions (f) | 0.80 | 0.87 | 0.90 | 0.90 | 0.92 | |||||||||||||||
Net investment income | 0.65 | 0.95 | 0.97 | 0.82 | 0.77 | |||||||||||||||
Portfolio turnover | 39 | 46 | 61 | 69 | 73 | |||||||||||||||
Net assets at end of period (000 omitted) | $2,131,106 | $1,915,947 | $1,541,284 | $1,204,531 | $1,279,176 | |||||||||||||||
| Supplemental Ratios (%): | ||||||||||||||||||||
Ratio of expenses to average net assets after | 0.80 | 0.87 | 0.88 | 0.89 | 0.92 | |||||||||||||||
See Notes to Financial Statements
22
Table of Contents
Financial Highlights – continued
| Class B | Years ended 9/30 | |||||||||||||||||||
| 2014 | 2013 | 2012 | 2011 | 2010 | ||||||||||||||||
Net asset value, beginning of period | $31.89 | $26.70 | $20.70 | $20.83 | $19.37 | |||||||||||||||
| Income (loss) from investment operations | ||||||||||||||||||||
Net investment income (loss) (d) | $(0.03 | ) | $0.06 | $0.05 | $0.02 | $0.00 | (w) | |||||||||||||
Net realized and unrealized gain (loss) on | 4.87 | 5.13 | 5.95 | (0.15 | ) | 1.50 | ||||||||||||||
Total from investment operations | $4.84 | $5.19 | $6.00 | $(0.13 | ) | $1.50 | ||||||||||||||
| Less distributions declared to shareholders | ||||||||||||||||||||
From net investment income | $(0.10 | ) | $— | $— | $— | $(0.04 | ) | |||||||||||||
From net realized gain on investments | (0.68 | ) | — | — | — | — | ||||||||||||||
Total distributions declared to shareholders | $(0.78 | ) | $— | $— | $— | $(0.04 | ) | |||||||||||||
Net asset value, end of period (x) | $35.95 | $31.89 | $26.70 | $20.70 | $20.83 | |||||||||||||||
Total return (%) (r)(s)(t)(x) | 15.41 | 19.44 | 28.99 | (0.62 | ) | 7.77 | ||||||||||||||
| Ratios (%) (to average net assets) and Supplemental data: | ||||||||||||||||||||
Expenses before expense reductions (f) | 1.56 | 1.62 | 1.65 | 1.65 | 1.67 | |||||||||||||||
Expenses after expense reductions (f) | 1.55 | 1.62 | 1.65 | 1.65 | 1.67 | |||||||||||||||
Net investment income (loss) | (0.09 | ) | 0.22 | 0.22 | 0.07 | 0.02 | ||||||||||||||
Portfolio turnover | 39 | 46 | 61 | 69 | 73 | |||||||||||||||
Net assets at end of period (000 omitted) | $29,834 | $31,773 | $33,019 | $34,609 | $49,123 | |||||||||||||||
| Supplemental Ratios (%): | ||||||||||||||||||||
Ratio of expenses to average net assets after | 1.55 | 1.62 | 1.63 | 1.64 | 1.67 | |||||||||||||||
See Notes to Financial Statements
23
Table of Contents
Financial Highlights – continued
| Class C | Years ended 9/30 | |||||||||||||||||||
| 2014 | 2013 | 2012 | 2011 | 2010 | ||||||||||||||||
Net asset value, beginning of period | $31.80 | $26.64 | $20.68 | $20.80 | $19.39 | |||||||||||||||
| Income (loss) from investment operations | ||||||||||||||||||||
Net investment income (loss) (d) | $(0.03 | ) | $0.06 | $0.05 | $0.02 | $0.00 | (w) | |||||||||||||
Net realized and unrealized gain (loss) on | 4.85 | 5.12 | 5.93 | (0.14 | ) | 1.49 | ||||||||||||||
Total from investment operations | $4.82 | $5.18 | $5.98 | $(0.12 | ) | $1.49 | ||||||||||||||
| Less distributions declared to shareholders | ||||||||||||||||||||
From net investment income | $(0.15 | ) | $(0.02 | ) | $(0.02 | ) | $(0.00 | )(w) | $(0.08 | ) | ||||||||||
From net realized gain on investments | (0.68 | ) | — | — | — | — | ||||||||||||||
Total distributions declared to shareholders | $(0.83 | ) | $(0.02 | ) | $(0.02 | ) | $(0.00 | )(w) | $(0.08 | ) | ||||||||||
Net asset value, end of period (x) | $35.79 | $31.80 | $26.64 | $20.68 | $20.80 | |||||||||||||||
Total return (%) (r)(s)(t)(x) | 15.40 | 19.47 | 28.94 | (0.56 | ) | 7.69 | ||||||||||||||
| Ratios (%) (to average net assets) and Supplemental data: | ||||||||||||||||||||
Expenses before expense reductions (f) | 1.56 | 1.63 | 1.65 | 1.65 | 1.67 | |||||||||||||||
Expenses after expense reductions (f) | 1.55 | 1.63 | 1.65 | 1.65 | 1.67 | |||||||||||||||
Net investment income (loss) | (0.10 | ) | 0.20 | 0.22 | 0.07 | 0.02 | ||||||||||||||
Portfolio turnover | 39 | 46 | 61 | 69 | 73 | |||||||||||||||
Net assets at end of period (000 omitted) | $129,359 | $107,173 | $85,428 | $72,558 | $81,879 | |||||||||||||||
| Supplemental Ratios (%): | ||||||||||||||||||||
Ratio of expenses to average net assets after | 1.55 | 1.62 | 1.63 | 1.64 | 1.67 | |||||||||||||||
See Notes to Financial Statements
24
Table of Contents
Financial Highlights – continued
| Class I | Years ended 9/30 | |||||||||||||||||||
| 2014 | 2013 | 2012 | 2011 | 2010 | ||||||||||||||||
Net asset value, beginning of period | $35.03 | $29.31 | $22.75 | $22.86 | $21.26 | |||||||||||||||
| Income (loss) from investment operations | ||||||||||||||||||||
Net investment income (d) | $0.34 | $0.37 | $0.33 | $0.27 | $0.23 | |||||||||||||||
Net realized and unrealized gain (loss) on | 5.34 | 5.63 | 6.50 | (0.15 | ) | 1.62 | ||||||||||||||
Total from investment operations | $5.68 | $6.00 | $6.83 | $0.12 | $1.85 | |||||||||||||||
| Less distributions declared to shareholders | ||||||||||||||||||||
From net investment income | $(0.44 | ) | $(0.28 | ) | $(0.27 | ) | $(0.23 | ) | $(0.25 | ) | ||||||||||
From net realized gain on investments | (0.68 | ) | — | — | — | — | ||||||||||||||
Total distributions declared to shareholders | $(1.12 | ) | $(0.28 | ) | $(0.27 | ) | $(0.23 | ) | $(0.25 | ) | ||||||||||
Net asset value, end of period (x) | $39.59 | $35.03 | $29.31 | $22.75 | $22.86 | |||||||||||||||
Total return (%) (r)(s)(x) | 16.54 | 20.67 | 30.27 | 0.42 | 8.78 | |||||||||||||||
| Ratios (%) (to average net assets) and Supplemental data: | ||||||||||||||||||||
Expenses before expense reductions (f) | 0.56 | 0.64 | 0.65 | 0.65 | 0.67 | |||||||||||||||
Expenses after expense reductions (f) | 0.56 | 0.64 | 0.65 | 0.65 | 0.67 | |||||||||||||||
Net investment income | 0.90 | 1.15 | 1.26 | 1.07 | 1.02 | |||||||||||||||
Portfolio turnover | 39 | 46 | 61 | 69 | 73 | |||||||||||||||
Net assets at end of period (000 omitted) | $705,200 | $559,067 | $237,389 | $608,723 | $554,786 | |||||||||||||||
| Supplemental Ratios (%): | ||||||||||||||||||||
Ratio of expenses to average net assets after | 0.56 | 0.63 | 0.63 | 0.64 | 0.67 | |||||||||||||||
See Notes to Financial Statements
25
Table of Contents
Financial Highlights – continued
| Class R1 | Years ended 9/30 | |||||||||||||||||||
| 2014 | 2013 | 2012 | 2011 | 2010 | ||||||||||||||||
Net asset value, beginning of period | $31.42 | $26.32 | $20.42 | $20.54 | $19.16 | |||||||||||||||
| Income (loss) from investment operations | ||||||||||||||||||||
Net investment income (loss) (d) | $(0.03 | ) | $0.05 | $0.05 | $0.02 | $(0.00 | )(w) | |||||||||||||
Net realized and unrealized gain (loss) on | 4.79 | 5.06 | 5.87 | (0.14 | ) | 1.47 | ||||||||||||||
Total from investment operations | $4.76 | $5.11 | $5.92 | $(0.12 | ) | $1.47 | ||||||||||||||
| Less distributions declared to shareholders | ||||||||||||||||||||
From net investment income | $(0.15 | ) | $(0.01 | ) | $(0.02 | ) | $— | $(0.09 | ) | |||||||||||
From net realized gain on investments | (0.68 | ) | — | — | — | — | ||||||||||||||
Total distributions declared to shareholders | $(0.83 | ) | $(0.01 | ) | $(0.02 | ) | $— | $(0.09 | ) | |||||||||||
Net asset value, end of period (x) | $35.35 | $31.42 | $26.32 | $20.42 | $20.54 | |||||||||||||||
Total return (%) (r)(s)(x) | 15.41 | 19.43 | 28.99 | (0.58 | ) | 7.68 | ||||||||||||||
| Ratios (%) (to average net assets) and Supplemental data: | ||||||||||||||||||||
Expenses before expense reductions (f) | 1.56 | 1.63 | 1.65 | 1.65 | 1.67 | |||||||||||||||
Expenses after expense reductions (f) | 1.56 | 1.63 | 1.65 | 1.65 | 1.67 | |||||||||||||||
Net investment income (loss) | (0.10 | ) | 0.19 | 0.22 | 0.07 | 0.02 | ||||||||||||||
Portfolio turnover | 39 | 46 | 61 | 69 | 73 | |||||||||||||||
Net assets at end of period (000 omitted) | $4,422 | $3,671 | $2,688 | $2,434 | $2,863 | |||||||||||||||
| Supplemental Ratios (%): | ||||||||||||||||||||
Ratio of expenses to average net assets after | 1.56 | 1.62 | 1.63 | 1.64 | 1.67 | |||||||||||||||
See Notes to Financial Statements
26
Table of Contents
Financial Highlights – continued
| Class R2 | Years ended 9/30 | |||||||||||||||||||
| 2014 | 2013 | 2012 | 2011 | 2010 | ||||||||||||||||
Net asset value, beginning of period | $33.48 | $28.07 | $21.80 | $21.95 | $20.43 | |||||||||||||||
| Income (loss) from investment operations | ||||||||||||||||||||
Net investment income (d) | $0.15 | $0.21 | $0.18 | $0.14 | $0.11 | |||||||||||||||
Net realized and unrealized gain (loss) on | 5.10 | 5.37 | 6.25 | (0.16 | ) | 1.58 | ||||||||||||||
Total from investment operations | $5.25 | $5.58 | $6.43 | $(0.02 | ) | $1.69 | ||||||||||||||
| Less distributions declared to shareholders | ||||||||||||||||||||
From net investment income | $(0.29 | ) | $(0.17 | ) | $(0.16 | ) | $(0.13 | ) | $(0.17 | ) | ||||||||||
From net realized gain on investments | (0.68 | ) | — | — | — | — | ||||||||||||||
Total distributions declared to shareholders | $(0.97 | ) | $(0.17 | ) | $(0.16 | ) | $(0.13 | ) | $(0.17 | ) | ||||||||||
Net asset value, end of period (x) | $37.76 | $33.48 | $28.07 | $21.80 | $21.95 | |||||||||||||||
Total return (%) (r)(s)(x) | 15.99 | 20.01 | 29.66 | (0.13 | ) | 8.32 | ||||||||||||||
| Ratios (%) (to average net assets) and Supplemental data: | ||||||||||||||||||||
Expenses before expense reductions (f) | 1.06 | 1.13 | 1.15 | 1.15 | 1.17 | |||||||||||||||
Expenses after expense reductions (f) | 1.06 | 1.13 | 1.15 | 1.15 | 1.17 | |||||||||||||||
Net investment income | 0.40 | 0.67 | 0.71 | 0.57 | 0.52 | |||||||||||||||
Portfolio turnover | 39 | 46 | 61 | 69 | 73 | |||||||||||||||
Net assets at end of period (000 omitted) | $37,003 | $33,970 | $17,583 | $11,711 | $9,733 | |||||||||||||||
| Supplemental Ratios (%): | ||||||||||||||||||||
Ratio of expenses to average net assets after | 1.06 | 1.13 | 1.13 | 1.14 | 1.17 | |||||||||||||||
See Notes to Financial Statements
27
Table of Contents
Financial Highlights – continued
| Class R3 | Years ended 9/30 | |||||||||||||||||||
| 2014 | 2013 | 2012 | 2011 | 2010 | ||||||||||||||||
Net asset value, beginning of period | $34.16 | $28.64 | $22.24 | $22.37 | $20.82 | |||||||||||||||
| Income (loss) from investment operations | ||||||||||||||||||||
Net investment income (d) | $0.24 | $0.29 | $0.26 | $0.21 | $0.17 | |||||||||||||||
Net realized and unrealized gain (loss) on | �� | 5.21 | 5.49 | 6.35 | (0.15 | ) | 1.59 | |||||||||||||
Total from investment operations | $5.45 | $5.78 | $6.61 | $0.06 | $1.76 | |||||||||||||||
| Less distributions declared to shareholders | ||||||||||||||||||||
From net investment income | $(0.36 | ) | $(0.26 | ) | $(0.21 | ) | $(0.19 | ) | $(0.21 | ) | ||||||||||
From net realized gain on investments | (0.68 | ) | — | — | — | — | ||||||||||||||
Total distributions declared to shareholders | $(1.04 | ) | $(0.26 | ) | $(0.21 | ) | $(0.19 | ) | $(0.21 | ) | ||||||||||
Net asset value, end of period (x) | $38.57 | $34.16 | $28.64 | $22.24 | $22.37 | |||||||||||||||
Total return (%) (r)(s)(x) | 16.26 | 20.33 | 29.93 | 0.19 | 8.52 | |||||||||||||||
| Ratios (%) (to average net assets) and Supplemental data: | ||||||||||||||||||||
Expenses before expense reductions (f) | 0.81 | 0.88 | 0.90 | 0.90 | 0.93 | |||||||||||||||
Expenses after expense reductions (f) | 0.81 | 0.88 | 0.90 | 0.90 | 0.92 | |||||||||||||||
Net investment income | 0.65 | 0.92 | 0.96 | 0.84 | 0.77 | |||||||||||||||
Portfolio turnover | 39 | 46 | 61 | 69 | 73 | |||||||||||||||
Net assets at end of period (000 omitted) | $58,407 | $61,690 | $35,774 | $8,582 | $8,954 | |||||||||||||||
| Supplemental Ratios (%): | ||||||||||||||||||||
Ratio of expenses to average net assets after | 0.81 | 0.88 | 0.89 | 0.89 | 0.92 | |||||||||||||||
See Notes to Financial Statements
28
Table of Contents
Financial Highlights – continued
| Class R4 | Years ended 9/30 | |||||||||||||||||||
| 2014 | 2013 | 2012 | 2011 | 2010 | ||||||||||||||||
Net asset value, beginning of period | $34.35 | $28.75 | $22.32 | $22.45 | $20.88 | |||||||||||||||
| Income (loss) from investment operations | ||||||||||||||||||||
Net investment income (d) | $0.34 | $0.37 | $0.32 | $0.26 | $0.22 | |||||||||||||||
Net realized and unrealized gain (loss) on | 5.23 | 5.51 | 6.38 | (0.16 | ) | 1.60 | ||||||||||||||
Total from investment operations | $5.57 | $5.88 | $6.70 | $0.10 | $1.82 | |||||||||||||||
| Less distributions declared to shareholders | ||||||||||||||||||||
From net investment income | $(0.43 | ) | $(0.28 | ) | $(0.27 | ) | $(0.23 | ) | $(0.25 | ) | ||||||||||
From net realized gain on investments | (0.68 | ) | — | — | — | — | ||||||||||||||
Total distributions declared to shareholders | $(1.11 | ) | $(0.28 | ) | $(0.27 | ) | $(0.23 | ) | $(0.25 | ) | ||||||||||
Net asset value, end of period (x) | $38.81 | $34.35 | $28.75 | $22.32 | $22.45 | |||||||||||||||
Total return (%) (r)(s)(x) | 16.56 | 20.65 | 30.27 | 0.34 | 8.80 | |||||||||||||||
| Ratios (%) (to average net assets) and Supplemental data: | ||||||||||||||||||||
Expenses before expense reductions (f) | 0.55 | 0.63 | 0.65 | 0.64 | 0.67 | |||||||||||||||
Expenses after expense reductions (f) | 0.55 | 0.63 | 0.65 | 0.64 | 0.67 | |||||||||||||||
Net investment income | 0.90 | 1.19 | 1.21 | 1.02 | 1.01 | |||||||||||||||
Portfolio turnover | 39 | 46 | 61 | 69 | 73 | |||||||||||||||
Net assets at end of period (000 omitted) | $46,235 | $27,088 | $20,829 | $12,225 | $739 | |||||||||||||||
| Supplemental Ratios (%): | ||||||||||||||||||||
Ratio of expenses to average net assets after | 0.55 | 0.62 | 0.63 | 0.64 | 0.67 | |||||||||||||||
See Notes to Financial Statements
29
Table of Contents
Financial Highlights – continued
| Class R5 (y) | Years ended 9/30 | |||||||||||||||||||
| 2014 | 2013 | 2012 | 2011 | 2010 | ||||||||||||||||
Net asset value, beginning of period | $34.37 | $28.75 | $22.30 | $22.42 | $20.86 | |||||||||||||||
| Income (loss) from investment operations | ||||||||||||||||||||
Net investment income (d) | $0.36 | $0.40 | $0.31 | $0.24 | $0.20 | |||||||||||||||
Net realized and unrealized gain (loss) on | 5.23 | 5.51 | 6.38 | (0.15 | ) | 1.60 | ||||||||||||||
Total from investment operations | $5.59 | $5.91 | $6.69 | $0.09 | $1.80 | |||||||||||||||
| Less distributions declared to shareholders | ||||||||||||||||||||
From net investment income | $(0.46 | ) | $(0.29 | ) | $(0.24 | ) | $(0.21 | ) | $(0.24 | ) | ||||||||||
From net realized gain on investments | (0.68 | ) | — | — | — | — | ||||||||||||||
Total distributions declared to shareholders | $(1.14 | ) | $(0.29 | ) | $(0.24 | ) | $(0.21 | ) | $(0.24 | ) | ||||||||||
Net asset value, end of period (x) | $38.82 | $34.37 | $28.75 | $22.30 | $22.42 | |||||||||||||||
Total return (%) (r)(s)(x) | 16.62 | 20.74 | 30.25 | 0.31 | 8.69 | |||||||||||||||
| Ratios (%) (to average net assets) and Supplemental data: | ||||||||||||||||||||
Expenses before expense reductions (f) | 0.49 | 0.54 | 0.60 | 0.75 | 0.77 | |||||||||||||||
Expenses after expense reductions (f) | 0.49 | 0.54 | 0.60 | 0.75 | 0.77 | |||||||||||||||
Net investment income | 0.97 | 1.28 | 1.13 | 0.96 | 0.93 | |||||||||||||||
Portfolio turnover | 39 | 46 | 61 | 69 | 73 | |||||||||||||||
Net assets at end of period (000 omitted) | $1,364,115 | $1,120,028 | $825,334 | $219 | $197 | |||||||||||||||
| Supplemental Ratios (%): | ||||||||||||||||||||
Ratio of expenses to average net assets after | 0.48 | 0.54 | 0.58 | 0.74 | 0.77 | |||||||||||||||
| (d) | Per share data is based on average shares outstanding. |
| (f) | Ratios do not reflect reductions from fees paid indirectly, if applicable. |
| (r) | Certain expenses have been reduced without which performance would have been lower. |
| (s) | From time to time the fund may receive proceeds from litigation settlements, without which performance would be lower. |
| (t) | Total returns do not include any applicable sales charges. |
| (w) | Per share amount was less than $0.01. |
| (x) | The net asset values per share and total returns have been calculated on net assets which include adjustments made in accordance with U.S. generally accepted accounting principles required at period end for financial reporting purposes. |
| (y) | On May 10, 2012, sales of Class W shares (including exchanges) were suspended. On May 11, 2012, certain Class W shares were automatically converted to Class I shares. Shareholders of certain Class W shares became shareholders of Class I and received Class I shares with a total net asset value equal to their Class W shares at the time of the conversion. On May 30, 2012, remaining Class W shares, which represented MFS seed money, were redesignated Class R5. Class R5 shares are generally available only to certain eligible retirement plans and to funds distributed by MFD. Class R5 shares do not pay a 12b-1 distribution fee or sub-accounting costs. On June 1, 2012, Class R5 shares were offered for sale to the public. |
See Notes to Financial Statements
30
Table of Contents
(1) Business and Organization
MFS Research Fund (the fund) is a diversified series of MFS Series Trust V (the trust). The trust is organized as a Massachusetts business trust and is registered under the Investment Company Act of 1940, as amended, as an open-end management investment company.
The fund is an investment company and accordingly follows the investment company accounting and reporting guidance of the Financial Accounting Standards Board (FASB) Accounting Standards Codification Topic 946 Financial Services – Investment Companies.
(2) Significant Accounting Policies
General – The preparation of financial statements in conformity with U.S. generally accepted accounting principles requires management to make estimates and assumptions that affect the reported amounts of assets and liabilities, and disclosure of contingent assets and liabilities at the date of the financial statements and the reported amounts of increases and decreases in net assets from operations during the reporting period. Actual results could differ from those estimates. In the preparation of these financial statements, management has evaluated subsequent events occurring after the date of the fund’s Statement of Assets and Liabilities through the date that the financial statements were issued.
In June 2014, FASB issued Accounting Standards Update 2014-11, Transfers and Servicing (Topic 860) – Repurchase-to-Maturity Transactions, Repurchase Financings, and Disclosures (“ASU 2014-11”). ASU 2014-11 changes the accounting for repurchase-to-maturity transactions (i.e., repurchase agreements that settle at the same time as the maturity of the transferred financial asset) and enhances the required disclosures for repurchase agreements and other similar transactions. Although still evaluating the potential impacts of ASU 2014-11 to the fund, management expects that the impact of the fund’s adoption will be limited to additional financial statement disclosures which would first be effective for interim reporting periods beginning after March 15, 2015.
Balance Sheet Offsetting – The fund’s accounting policy with respect to balance sheet offsetting is that, absent an event of default by the counterparty or a termination of the agreement, the International Swaps and Derivatives Association (ISDA) Master Agreement does not result in an offset of reported amounts of financial assets and financial liabilities in the Statement of Assets and Liabilities across transactions between the fund and the applicable counterparty. The fund’s right to setoff may be restricted or prohibited by the bankruptcy or insolvency laws of the particular jurisdiction to which a specific master netting agreement counterparty is subject. Balance sheet offsetting disclosures, to the extent applicable to the fund, have been included in the fund’s Significant Accounting Policies note under the captions for each of the fund’s in-scope financial instruments and transactions.
Investment Valuations – Equity securities, including restricted equity securities, are generally valued at the last sale or official closing price as provided by a third-party pricing service on the market or exchange on which they are primarily traded. Equity
31
Table of Contents
Notes to Financial Statements – continued
securities, for which there were no sales reported that day, are generally valued at the last quoted daily bid quotation as provided by a third-party pricing service on the market or exchange on which such securities are primarily traded. Equity securities held short, for which there were no sales reported for that day, are generally valued at the last quoted daily ask quotation as provided by a third-party pricing service on the market or exchange on which such securities are primarily traded. Short-term instruments with a maturity at issuance of 60 days or less may be valued at amortized cost, which approximates market value. Exchange-traded options are generally valued at the last sale or official closing price as provided by a third-party pricing service on the exchange on which such options are primarily traded. Exchange-traded options for which there were no sales reported that day are generally valued at the last daily bid quotation as provided by a third-party pricing service on the exchange on which such options are primarily traded. Options not traded on an exchange are generally valued at a broker/dealer bid quotation. Foreign currency options are generally valued at valuations provided by a third-party pricing service. Open-end investment companies are generally valued at net asset value per share. Securities and other assets generally valued on the basis of information from a third-party pricing service may also be valued at a broker/dealer bid quotation. Values obtained from third-party pricing services can utilize both transaction data and market information such as yield, quality, coupon rate, maturity, type of issue, trading characteristics, and other market data. The values of foreign securities and other assets and liabilities expressed in foreign currencies are converted to U.S. dollars using the mean of bid and asked prices for rates provided by a third-party pricing service.
The Board of Trustees has delegated primary responsibility for determining or causing to be determined the value of the fund’s investments (including any fair valuation) to the adviser pursuant to valuation policies and procedures approved by the Board. If the adviser determines that reliable market quotations are not readily available, investments are valued at fair value as determined in good faith by the adviser in accordance with such procedures under the oversight of the Board of Trustees. Under the fund’s valuation policies and procedures, market quotations are not considered to be readily available for most types of debt instruments and floating rate loans and many types of derivatives. These investments are generally valued at fair value based on information from third-party pricing services. In addition, investments may be valued at fair value if the adviser determines that an investment’s value has been materially affected by events occurring after the close of the exchange or market on which the investment is principally traded (such as foreign exchange or market) and prior to the determination of the fund’s net asset value, or after the halting of trading of a specific security where trading does not resume prior to the close of the exchange or market on which the security is principally traded. Events that occur on a frequent basis after foreign markets close (such as developments in foreign markets and significant movements in the U.S. markets) and prior to the determination of the fund’s net asset value may be deemed to have a material effect on the value of securities traded in foreign markets. Accordingly, the fund’s foreign equity securities may often be valued at fair value. The adviser generally relies on third-party pricing services or other information (such as the correlation with price movements of similar securities in the same or other markets; the type, cost and investment characteristics of the security; the business and financial condition of the issuer; and trading and other market data) to assist in determining
32
Table of Contents
Notes to Financial Statements – continued
whether to fair value and at what value to fair value an investment. The value of an investment for purposes of calculating the fund’s net asset value can differ depending on the source and method used to determine value. When fair valuation is used, the value of an investment used to determine the fund’s net asset value may differ from quoted or published prices for the same investment. There can be no assurance that the fund could obtain the fair value assigned to an investment if it were to sell the investment at the same time at which the fund determines its net asset value per share.
Various inputs are used in determining the value of the fund’s assets or liabilities. These inputs are categorized into three broad levels. In certain cases, the inputs used to measure fair value may fall into different levels of the fair value hierarchy. In such cases, an investment’s level within the fair value hierarchy is based on the lowest level of input that is significant to the fair value measurement. The fund’s assessment of the significance of a particular input to the fair value measurement in its entirety requires judgment, and considers factors specific to the investment. Level 1 includes unadjusted quoted prices in active markets for identical assets or liabilities. Level 2 includes other significant observable market-based inputs (including quoted prices for similar securities, interest rates, prepayment speed, and credit risk). Level 3 includes unobservable inputs, which may include the adviser’s own assumptions in determining the fair value of investments. The following is a summary of the levels used as of September 30, 2014 in valuing the fund’s assets or liabilities:
| Investments at Value | Level 1 | Level 2 | Level 3 | Total | ||||||||||||
| Equity Securities | $4,472,573,034 | $— | $— | $4,472,573,034 | ||||||||||||
| Mutual Funds | 35,567,026 | — | — | 35,567,026 | ||||||||||||
| Total Investments | $4,508,140,060 | $— | $— | $4,508,140,060 | ||||||||||||
For further information regarding security characteristics, see the Portfolio of Investments.
Repurchase Agreements – The fund enters into repurchase agreements under the terms of Master Repurchase Agreements with approved counterparties. Each repurchase agreement is recorded at cost. The fund requires that the securities collateral in a repurchase transaction be transferred to a custodian. The fund monitors, on a daily basis, the value of the collateral to ensure that its value, including accrued interest, is greater than amounts owed to the fund under each such repurchase agreement. Upon an event of default under a Master Repurchase Agreement, the non-defaulting party may close out all transactions traded under such agreement and net amounts owed under each transaction to one net amount payable by one party to the other. Absent an event of default, the Master Repurchase Agreement does not result in an offset of reported amounts of assets and liabilities in the Statement of Assets and Liabilities across transactions between the fund and the applicable counterparty.
Foreign Currency Translation – Purchases and sales of foreign investments, income, and expenses are converted into U.S. dollars based upon currency exchange rates prevailing on the respective dates of such transactions or on the reporting date for foreign denominated receivables and payables. Gains and losses attributable to foreign currency exchange rates on sales of securities are recorded for financial statement purposes as net realized gains and losses on investments. Gains and losses attributable
33
Table of Contents
Notes to Financial Statements – continued
to foreign exchange rate movements on receivables, payables, income and expenses are recorded for financial statement purposes as foreign currency transaction gains and losses. That portion of both realized and unrealized gains and losses on investments that results from fluctuations in foreign currency exchange rates is not separately disclosed.
Derivatives – The fund uses derivatives for different purposes, primarily to increase or decrease exposure to a particular market or segment of the market, or security, to increase or decrease interest rate or currency exposure, or as alternatives to direct investments. Derivatives are used for hedging or non-hedging purposes. While hedging can reduce or eliminate losses, it can also reduce or eliminate gains. When the fund uses derivatives as an investment to increase market exposure, or for hedging purposes, gains and losses from derivative instruments may be substantially greater than the derivative’s original cost.
The derivative instruments used by the fund were written options and purchased options. The fund’s period end derivatives, as presented in the Portfolio of Investments, generally are indicative of the volume of its derivative activity during the period.
The following table presents, by major type of derivative contract, the fair value, on a gross basis, of the asset and liability components of derivatives held by the fund at September 30, 2014 as reported in the Statement of Assets and Liabilities:
| Fair Value (a) | ||||||||||
| Risk | Derivative Contracts | Asset Derivatives | Liability Derivatives | |||||||
| Equity | Purchased Equity Options | $27,460 | $— | |||||||
| (a) | The value of purchased options outstanding is included in total investments, at value, within the fund’s Statement of Assets and Liabilities. |
The following table presents, by major type of derivative contract, the realized gain (loss) on derivatives held by the fund for the year ended September 30, 2014 as reported in the Statement of Operations:
| Risk | Investments (Purchased Options) | Written Options | ||||||
| Equity | $440,441 | $24,998 | ||||||
The following table presents, by major type of derivative contract, the change in unrealized appreciation (depreciation) on derivatives held by the fund for the year ended September 30, 2014 as reported in the Statement of Operations:
| Risk | Investments (Purchased Options) | |||
| Equity | $(525,392 | ) | ||
Derivative counterparty credit risk is managed through formal evaluation of the creditworthiness of all potential counterparties. On certain, but not all, over-the-counter derivatives, the fund attempts to reduce its exposure to counterparty credit risk whenever possible by entering into an ISDA Master Agreement on a bilateral basis with each of the counterparties with whom it undertakes a significant volume of transactions. The ISDA Master Agreement gives each party to the agreement the right
34
Table of Contents
Notes to Financial Statements – continued
to terminate all transactions traded under such agreement if there is a certain deterioration in the credit quality of the other party. Upon an event of default or a termination of the ISDA Master Agreement, the non-defaulting party has the right to close out all transactions traded under such agreement and to net amounts owed under each transaction to one net amount payable by one party to the other. This right to close out and net payments across all transactions traded under the ISDA Master Agreement could result in a reduction of the fund’s credit risk to such counterparty equal to any amounts payable by the fund under the applicable transactions, if any. The fund’s right to setoff may be restricted or prohibited by the bankruptcy or insolvency laws of the particular jurisdiction to which a specific ISDA counterparty is subject.
Collateral and margin requirements differ by type of derivative. Margin requirements are set by the broker or clearing house for cleared derivatives (i.e., futures contracts, cleared swaps, and exchange-traded options) while collateral terms are contract specific for over-the-counter traded derivatives (i.e., forward foreign currency exchange contracts, uncleared swap agreements, and over-the-counter options). For derivatives traded under an ISDA Master Agreement, the collateral requirements are netted across all transactions traded under such agreement and one amount is posted from one party to the other to collateralize such obligations. Cash that has been segregated to cover the fund’s collateral or margin obligations under derivative contracts, if any, will be reported separately in the Statement of Assets and Liabilities as “Restricted cash” or “Deposits with brokers.” Securities pledged as collateral or margin for the same purpose, if any, are noted in the Portfolio of Investments.
Written Options – In exchange for a premium, the fund wrote call options on securities that it anticipated the price would decline. At the time the option was written, the fund believed the premium received exceeded the potential loss that could result from adverse price changes in the options’ underlying securities. In a written option, the fund as the option writer grants the buyer the right to purchase from, or sell to, the fund a specified number of shares or units of a particular security, currency or index at a specified price within a specified period of time.
The premium received is initially recorded as a liability in the Statement of Assets and Liabilities. The option is subsequently marked-to-market daily with the difference between the premium received and the market value of the written option being recorded as unrealized appreciation or depreciation. When a written option expires, the fund realizes a gain equal to the amount of the premium received. The difference between the premium received and the amount paid on effecting a closing transaction is considered a realized gain or loss. When a written call option is exercised, the premium received is offset against the proceeds to determine the realized gain or loss.
At the initiation of the written option contract, for exchange traded options, the fund is required to deposit securities or cash as collateral with the custodian for the benefit of the broker. For over-the-counter options, the fund may post collateral subject to the terms of an ISDA Master Agreement as generally described above if the market value of the options contract moves against it. The fund, as writer of an option, may have no control over whether the underlying securities may be sold (call) or purchased (put) and, as a result, bears the market risk of an unfavorable change in the price of the securities underlying the written option. Losses from writing options can exceed the
35
Table of Contents
Notes to Financial Statements – continued
premium received and can exceed the potential loss from an ordinary buy and sell transaction. Although the fund’s market risk may be significant, the maximum counterparty credit risk to the fund is equal to the market value of any collateral posted to the broker. For over-the-counter options, this risk is mitigated in cases where there is an ISDA Master Agreement between the fund and the counterparty providing for netting as described above.
The following table represents the written option activity in the fund during the year ended September 30, 2014:
| Number of contracts | Premiums received | |||||||
| Outstanding, beginning of period | — | $— | ||||||
| Options written | 662 | 24,998 | ||||||
| Options expired | (662 | ) | (24,998 | ) | ||||
| Outstanding, end of period | — | $— | ||||||
Purchased Options – The fund purchased put options for a premium. Purchased put options entitle the holder to sell a specified number of shares or units of a particular security, currency or index at a specified price at a specified date or within a specified period of time. Purchasing put options may hedge against an anticipated decline in the value of portfolio securities or currency or decrease the fund’s exposure to an underlying instrument.
The premium paid is initially recorded as an investment in the Statement of Assets and Liabilities. That investment is subsequently marked-to-market daily with the difference between the premium paid and the market value of the purchased option being recorded as unrealized appreciation or depreciation. Premiums paid for purchased put options which have expired are treated as realized losses on investments in the Statement of Operations. Upon the exercise or closing of a purchased put option, the premium paid is offset against the proceeds on the sale of the underlying security or financial instrument in order to determine the realized gain or loss on investments.
Whether or not the option is exercised, the fund’s maximum risk of loss from purchasing an option is the amount of premium paid. All option contracts involve credit risk if the counterparty to the option contract fails to perform. For over-the-counter options, this risk is mitigated in cases where there is an ISDA Master Agreement between the fund and the counterparty providing for netting as described above and for posting of collateral by the counterparty to the fund to cover the fund’s exposure to the counterparty under such ISDA Master Agreement.
Short Sales – The fund entered into short sales whereby it sells a security it does not own in anticipation of a decline in the value of that security. The fund will realize a gain if the security price decreases and a loss if the security price increases between the date of the short sale and the date on which the fund replaces the borrowed security. Losses from short sales can exceed the proceeds of the security sold; and they can also exceed the potential loss from an ordinary buy and sell transaction. The amount of any premium, dividends, or interest the fund may be required to pay in connection with a short sale will be recognized as a fund expense. During the year ended September 30, 2014, this expense amounted to $34,830. The fund segregates cash or marketable securities in an amount that, when combined with the amount of proceeds from the
36
Table of Contents
Notes to Financial Statements – continued
short sale deposited with the broker, at least equals the current market value of the security sold short. At September 30, 2014, the fund had no short sales outstanding.
Security Loans – Under its Securities Lending Agency Agreement with the fund, JPMorgan Chase and Co. (“Chase”), as lending agent, loans the securities of the fund to certain qualified institutions (the “Borrowers”) approved by the fund. The loans are collateralized by cash and/or U.S. Treasury and federal agency obligations in an amount typically at least equal to the market value of the securities loaned. On loans collateralized by cash, the cash collateral is invested in a money market fund. The market value of the loaned securities is determined at the close of business of the fund and any additional required collateral is delivered to the fund on the next business day. Chase provides the fund with indemnification against Borrower default. In the event of Borrower default, Chase will for the benefit of the fund either purchase securities identical to those loaned or, when such purchase is commercially impracticable, pay the fund the market value of the loaned securities. In return, Chase assumes the fund’s rights to the related collateral. If the collateral value is less than the cost to purchase identical securities, Chase is responsible for the shortfall, but only to the extent that such shortfall is not due to a decline in collateral value resulting from collateral reinvestment for which the fund bears the risk of loss. A portion of the income generated upon investment of the collateral is remitted to the Borrowers, and the remainder is allocated between the fund and the lending agent. On loans collateralized by U.S. Treasury and/or federal agency obligations, a fee is received from the Borrower, and is allocated between the fund and the lending agent. Income from securities lending is included in “Interest” income in the Statement of Operations. The dividend and interest income earned on the securities loaned is accounted for in the same manner as other dividend and interest income. At September 30, 2014, there were no securities on loan or collateral outstanding.
Indemnifications – Under the fund’s organizational documents, its officers and Trustees may be indemnified against certain liabilities and expenses arising out of the performance of their duties to the fund. Additionally, in the normal course of business, the fund enters into agreements with service providers that may contain indemnification clauses. The fund’s maximum exposure under these agreements is unknown as this would involve future claims that may be made against the fund that have not yet occurred.
Investment Transactions and Income – Investment transactions are recorded on the trade date. Interest income is recorded on the accrual basis. Dividends received in cash are recorded on the ex-dividend date. Certain dividends from foreign securities will be recorded when the fund is informed of the dividend if such information is obtained subsequent to the ex-dividend date. Dividend and interest payments received in additional securities are recorded on the ex-dividend or ex-interest date in an amount equal to the value of the security on such date.
The fund may receive proceeds from litigation settlements. Any proceeds received from litigation involving portfolio holdings are reflected in the Statement of Operations in realized gain/loss if the security has been disposed of by the fund or in unrealized gain/loss if the security is still held by the fund. Any other proceeds from litigation not related to portfolio holdings are reflected as other income in the Statement of Operations.
37
Table of Contents
Notes to Financial Statements – continued
Fees Paid Indirectly – The fund’s custody fee may be reduced according to an arrangement that measures the value of cash deposited with the custodian by the fund. This amount, for the year ended September 30, 2014, is shown as a reduction of total expenses in the Statement of Operations.
Tax Matters and Distributions – The fund intends to qualify as a regulated investment company, as defined under Subchapter M of the Internal Revenue Code, and to distribute all of its taxable income, including realized capital gains. As a result, no provision for federal income tax is required. The fund’s federal tax returns, when filed, will remain subject to examination by the Internal Revenue Service for a three year period. Management has analyzed the fund’s tax positions taken on federal and state tax returns for all open tax years and does not believe that there are any uncertain tax positions that require recognition of a tax liability. Foreign taxes, if any, have been accrued by the fund in the accompanying financial statements in accordance with the applicable foreign tax law. Foreign income taxes may be withheld by certain countries in which the fund invests. Additionally, capital gains realized by the fund on securities issued in or by certain foreign countries may be subject to capital gains tax imposed by those countries.
Distributions to shareholders are recorded on the ex-dividend date. Income and capital gain distributions are determined in accordance with income tax regulations, which may differ from U.S. generally accepted accounting principles. Certain capital accounts in the financial statements are periodically adjusted for permanent differences in order to reflect their tax character. These adjustments have no impact on net assets or net asset value per share. Temporary differences which arise from recognizing certain items of income, expense, gain or loss in different periods for financial statement and tax purposes will reverse at some time in the future. Distributions in excess of net investment income or net realized gains are temporary overdistributions for financial statement purposes resulting from differences in the recognition or classification of income or distributions for financial statement and tax purposes.
Book/tax differences primarily relate to wash sale loss deferrals and treating a portion of the proceeds from redemptions as a distribution for tax purposes.
The tax character of distributions declared to shareholders for the last two fiscal years is as follows:
| 9/30/14 | 9/30/13 | |||||||
| Ordinary income (including any short-term capital gains) | $48,900,693 | $24,130,435 | ||||||
| Long-term capital gains | 72,670,604 | — | ||||||
| Total distributions | $121,571,297 | $24,130,435 | ||||||
38
Table of Contents
Notes to Financial Statements – continued
The federal tax cost and the tax basis components of distributable earnings were as follows:
| As of 9/30/14 | ||||
| Cost of investments | $3,427,213,811 | |||
| Gross appreciation | 1,096,443,101 | |||
| Gross depreciation | (15,516,852 | ) | ||
| Net unrealized appreciation (depreciation) | $1,080,926,249 | |||
| Undistributed ordinary income | 54,025,324 | |||
| Undistributed long-term capital gain | 155,088,079 | |||
| Other temporary differences | (327,025 | ) | ||
Multiple Classes of Shares of Beneficial Interest – The fund offers multiple classes of shares, which differ in their respective distribution and service fees. The fund’s income, realized and unrealized gain (loss), and common expenses are allocated to shareholders based on the daily net assets of each class. Dividends are declared separately for each class. Differences in per share dividend rates are generally due to differences in separate class expenses. Class B shares will convert to Class A shares approximately eight years after purchase. The fund’s distributions declared to shareholders as reported in the Statements of Changes in Net Assets are presented by class as follows:
| From net investment income | From net realized gain on investments | |||||||||||||||
| Year ended 9/30/14 | Year ended 9/30/13 | Year ended 9/30/14 | Year ended 9/30/13 | |||||||||||||
| Class A | $19,451,208 | $12,248,800 | $38,073,954 | $— | ||||||||||||
| Class B | 93,400 | — | 656,471 | — | ||||||||||||
| Class C | 505,888 | 71,423 | 2,379,834 | — | ||||||||||||
| Class I | 7,306,546 | 2,556,786 | 11,477,084 | — | ||||||||||||
| Class R1 | 17,737 | 1,148 | 81,284 | — | ||||||||||||
| Class R2 | 305,384 | 117,394 | 710,407 | — | ||||||||||||
| Class R3 | 643,254 | 332,823 | 1,237,629 | — | ||||||||||||
| Class R4 | 358,515 | 211,113 | 569,105 | — | ||||||||||||
| Class R5 | 15,208,171 | 8,590,948 | 22,495,426 | — | ||||||||||||
| Total | $43,890,103 | $24,130,435 | $77,681,194 | $— | ||||||||||||
(3) Transactions with Affiliates
Investment Adviser – The fund has an investment advisory agreement with MFS to provide overall investment management and related administrative services and facilities to the fund. The management fee is computed daily and paid monthly at an annual rate of 0.43% of the fund’s average daily net assets.
Effective August 1, 2014, the investment adviser has agreed in writing to reduce its management fee to 0.40% of average daily net assets in excess of $5 billion. This written agreement will continue until modified by the fund’s Board of Trustees, but such agreement will continue at least until January 31, 2016. For the period
39
Table of Contents
Notes to Financial Statements – continued
August 1, 2014 through September 30, 2014, the fund’s average daily net assets did not exceed $5 billion and therefore, the management fee was not reduced in accordance with this agreement.
Distributor – MFS Fund Distributors, Inc. (MFD), a wholly-owned subsidiary of MFS, as distributor, received $185,417 for the year ended September 30, 2014, as its portion of the initial sales charge on sales of Class A shares of the fund.
The Board of Trustees has adopted a distribution plan for certain share classes pursuant to Rule 12b-1 of the Investment Company Act of 1940.
The fund’s distribution plan provides that the fund will pay MFD for services provided by MFD and financial intermediaries in connection with the distribution and servicing of certain share classes. One component of the plan is a distribution fee paid to MFD and another component of the plan is a service fee paid to MFD. MFD may subsequently pay all, or a portion, of the distribution and/or service fees to financial intermediaries.
Distribution Plan Fee Table:
Distribution Fee Rate (d) | Service Fee Rate (d) | Total Plan (d) | Annual Rate (e) | Distribution Fee | ||||||||||||||||
| Class A | — | 0.25% | 0.25% | 0.25% | $5,200,318 | |||||||||||||||
| Class B | 0.75% | 0.25% | 1.00% | 1.00% | 314,521 | |||||||||||||||
| Class C | 0.75% | 0.25% | 1.00% | 1.00% | 1,228,112 | |||||||||||||||
| Class R1 | 0.75% | 0.25% | 1.00% | 1.00% | 41,367 | |||||||||||||||
| Class R2 | 0.25% | 0.25% | 0.50% | 0.50% | 188,328 | |||||||||||||||
| Class R3 | — | 0.25% | 0.25% | 0.25% | 161,003 | |||||||||||||||
| Total Distribution and Service Fees | $7,133,649 | |||||||||||||||||||
| (d) | In accordance with the distribution plan for certain classes, the fund pays distribution and/or service fees equal to these annual percentage rates of each class’s average daily net assets. The distribution and service fee rates disclosed by class represent the current rates in effect at the end of the reporting period. Any rate changes, if applicable, are detailed below. |
| (e) | The annual effective rates represent actual fees incurred under the distribution plan for the year ended September 30, 2014 based on each class’s average daily net assets. MFD has voluntarily agreed to rebate a portion of each class’s 0.25% service fee attributable to accounts for which MFD retains the 0.25% service fee except for accounts attributable to MFS or its affiliates’ seed money. For the year ended September 30, 2014, this rebate amounted to $86,669, $1,330, $2,579, and $318 for Class A, Class B, Class C, and Class R3, respectively, and is included in the reduction of total expenses in the Statement of Operations. |
Certain Class A shares are subject to a contingent deferred sales charge (CDSC) in the event of a shareholder redemption within 18 months of purchase for shares purchased on or after August 1, 2012, and within 24 months of purchase for shares purchased prior to August 1, 2012. Class C shares are subject to a CDSC in the event of a shareholder redemption within 12 months of purchase. Class B shares are subject to a
40
Table of Contents
Notes to Financial Statements – continued
CDSC in the event of a shareholder redemption within six years of purchase. All contingent deferred sales charges are paid to MFD and during the year ended September 30, 2014, were as follows:
| Amount | ||||
| Class A | $2,024 | |||
| Class B | 26,164 | |||
| Class C | 10,319 | |||
Shareholder Servicing Agent – MFS Service Center, Inc. (MFSC), a wholly-owned subsidiary of MFS, receives a fee from the fund for its services as shareholder servicing agent calculated as a percentage of the average daily net assets of the fund as determined periodically under the supervision of the fund’s Board of Trustees. For the year ended September 30, 2014, the fee was $589,919, which equated to 0.0135% annually of the fund’s average daily net assets. MFSC also receives payment from the fund for out-of-pocket expenses, sub-accounting and other shareholder servicing costs which may be paid to affiliated and unaffiliated service providers. Class R5 shares do not incur sub-accounting fees. For the year ended September 30, 2014, these out-of-pocket expenses, sub-accounting and other shareholder servicing costs amounted to $2,369,377.
Under a Special Servicing Agreement among MFS, each MFS fund which invests in other MFS funds (“MFS fund-of-funds”) and certain underlying funds in which a MFS fund-of-funds invests (“underlying funds”), each underlying fund may pay a portion of each MFS fund-of-funds’ transfer agent-related expenses, including sub-accounting fees payable to financial intermediaries, to the extent such payments do not exceed the benefits realized or expected to be realized by the underlying fund from the investment in the underlying fund by the MFS fund-of-funds. For the year ended September 30, 2014, these costs for the fund amounted to $374,943 and are included in “Shareholder servicing costs” in the Statement of Operations. Effective January 1, 2014, the fund no longer participates in this agreement.
Administrator – MFS provides certain financial, legal, shareholder communications, compliance, and other administrative services to the fund. Under an administrative services agreement, the fund partially reimburses MFS the costs incurred to provide these services. The fund is charged an annual fixed amount of $17,500 plus a fee based on average daily net assets. The administrative services fee incurred for the year ended September 30, 2014 was equivalent to an annual effective rate of 0.0115% of the fund’s average daily net assets.
Trustees’ and Officers’ Compensation – The fund pays compensation to independent Trustees in the form of a retainer, attendance fees, and additional compensation to Board and Committee chairpersons. The fund does not pay compensation directly to Trustees or officers of the fund who are also officers of the investment adviser, all of whom receive remuneration for their services to the fund from MFS. Certain officers and Trustees of the fund are officers or directors of MFS, MFD, and MFSC.
Prior to December 31, 2001, the fund had an unfunded defined benefit plan (“DB plan”) for independent Trustees. As of December 31, 2001, the Board took action to terminate the DB plan with respect to then-current and any future independent
41
Table of Contents
Notes to Financial Statements – continued
Trustees, such that the DB plan covers only certain of those former independent Trustees who retired on or before December 31, 2001. Effective January 1, 2002, accrued benefits under the DB plan for then-current independent Trustees who continued were credited to an unfunded retirement deferral plan (the “Retirement Deferral plan”), which was established for and exists solely with respect to these credited amounts, and is not available for other deferrals by these or other independent Trustees. Although the Retirement Deferral plan is unfunded, amounts deferred under the plan are periodically adjusted for investment experience as if they had been invested in shares of the fund. The DB plan resulted in a pension expense of $3,768 and the Retirement Deferral plan resulted in an expense of $16,993. Both amounts are included in independent Trustees’ compensation for the year ended September 30, 2014. The liability for deferred retirement benefits payable to certain independent Trustees under both plans amounted to $109,160 at September 30, 2014, and is included in “Payable for independent Trustees’ compensation” in the Statement of Assets and Liabilities.
Deferred Trustee Compensation – Under a Deferred Compensation Plan (the “Plan”), independent Trustees previously were allowed to elect to defer receipt of all or a portion of their annual compensation. Effective January 1, 2005, the Board elected to no longer allow Trustees to defer receipt of future compensation under the Plan. Amounts deferred under the Plan are invested in shares of certain MFS Funds selected by the independent Trustees as notional investments. Deferred amounts represent an unsecured obligation of the fund until distributed in accordance with the Plan. Included in “Other assets” and “Payable for independent Trustees’ compensation” in the Statement of Assets and Liabilities is $46,559 of deferred Trustees’ compensation. There is no current year expense associated with the Plan.
Other – This fund and certain other funds managed by MFS (the funds) have entered into services agreements (the Agreements) which provide for payment of fees by the funds to Tarantino LLC and Griffin Compliance LLC in return for the provision of services of an Independent Chief Compliance Officer (ICCO) and Assistant ICCO, respectively, for the funds. The funds can terminate the Agreements with Tarantino LLC and Griffin Compliance LLC at any time under the terms of the Agreements. Frank L. Tarantino serves as the ICCO and is an officer of the funds and the sole member of Tarantino LLC. Prior to June 1, 2014, Robyn L. Griffin served as the Assistant ICCO and was an officer of the funds. Ms. Griffin is the sole member of Griffin Compliance LLC. Effective May 31, 2014, Ms. Griffin resigned as Assistant ICCO and the service agreement between the funds and Griffin Compliance LLC was terminated. For the year ended September 30, 2014, the aggregate fees paid by the fund to Tarantino LLC and Griffin Compliance LLC were $21,743 and are included in “Miscellaneous” expense in the Statement of Operations. MFS has agreed to reimburse the fund for a portion of the payments made by the fund in the amount of $6,916, which is included in the reduction of total expenses in the Statement of Operations. Additionally, MFS has agreed to bear all expenses associated with office space, other administrative support, and supplies provided to the ICCO and Assistant ICCO. On October 31, 2014, Mr. Tarantino resigned as ICCO and the service agreement between the funds and Tarantino LLC for the services of an ICCO was terminated. Effective November 1, 2014, the funds entered into a service agreement which provides for
42
Table of Contents
Notes to Financial Statements – continued
payment of fees solely by the funds to Tarantino LLC in return for the provision of services of an Independent Senior Officer (ISO). Additionally, MFS has agreed to bear all expenses associated with office space, other administrative support, and supplies provided to the ISO.
The fund invests in the MFS Institutional Money Market Portfolio which is managed by MFS and seeks current income consistent with preservation of capital and liquidity. Income earned on this investment is included in “Dividends from underlying affiliated funds” in the Statement of Operations. This money market fund does not pay a management fee to MFS.
(4) Portfolio Securities
For the year ended September 30, 2014, purchases and sales of investments, other than purchased option transactions and short-term obligations, aggregated $1,724,384,530 and $1,680,344,571, respectively.
(5) Shares of Beneficial Interest
The fund’s Declaration of Trust permits the Trustees to issue an unlimited number of full and fractional shares of beneficial interest. Transactions in fund shares were as follows:
| Year ended 9/30/14 | Year ended 9/30/13 | |||||||||||||||
| Shares | Amount | Shares | Amount | |||||||||||||
| Shares sold | ||||||||||||||||
Class A | 6,913,906 | $255,347,730 | 11,059,118 | $340,610,784 | ||||||||||||
Class B | 81,793 | 2,808,375 | 131,317 | 3,825,706 | ||||||||||||
Class C | 594,647 | 20,272,178 | 612,221 | 18,209,812 | ||||||||||||
Class I | 7,655,875 | 286,081,137 | 10,097,746 | 329,168,412 | ||||||||||||
Class R1 | 22,968 | 783,379 | 32,463 | 946,827 | ||||||||||||
Class R2 | 205,342 | 7,349,923 | 591,809 | 18,293,482 | ||||||||||||
Class R3 | 338,940 | 12,369,380 | 987,895 | 30,855,221 | ||||||||||||
Class R4 | 800,176 | 29,713,452 | 368,857 | 11,270,965 | ||||||||||||
Class R5 | 3,126,935 | 113,714,538 | 4,644,143 | 143,903,562 | ||||||||||||
| 19,740,582 | $728,440,092 | 28,525,569 | $897,084,771 | |||||||||||||
Shares issued to shareholders in reinvestment of distributions |
| |||||||||||||||
Class A | 1,528,023 | $53,816,975 | 380,245 | $10,969,844 | ||||||||||||
Class B | 22,062 | 724,749 | — | — | ||||||||||||
Class C | 75,079 | 2,455,190 | 2,277 | 61,264 | ||||||||||||
Class I | 518,785 | 18,619,191 | 86,162 | 2,531,434 | ||||||||||||
Class R1 | 3,066 | 99,020 | 43 | 1,148 | ||||||||||||
Class R2 | 26,869 | 923,482 | 3,698 | 104,278 | ||||||||||||
Class R3 | 53,579 | 1,877,419 | 11,574 | 332,296 | ||||||||||||
Class R4 | 26,360 | 927,620 | 7,325 | 211,113 | ||||||||||||
Class R5 | 1,071,734 | 37,703,597 | 298,193 | 8,590,948 | ||||||||||||
| 3,325,557 | $117,147,243 | 789,517 | $22,802,325 | |||||||||||||
43
Table of Contents
Notes to Financial Statements – continued
| Year ended 9/30/14 | Year ended 9/30/13 | |||||||||||||||
| Shares | Amount | Shares | Amount | |||||||||||||
| Shares reacquired | ||||||||||||||||
Class A | (9,295,999 | ) | $(344,285,399 | ) | (9,251,680 | ) | $(289,414,077 | ) | ||||||||
Class B | (270,232 | ) | (9,293,630 | ) | (371,748 | ) | (10,733,003 | ) | ||||||||
Class C | (425,527 | ) | (14,640,845 | ) | (450,477 | ) | (12,862,465 | ) | ||||||||
Class I | (6,324,155 | ) | (243,431,715 | ) | (2,321,627 | ) | (75,460,100 | ) | ||||||||
Class R1 | (17,761 | ) | (598,543 | ) | (17,816 | ) | (505,271 | ) | ||||||||
Class R2 | (266,757 | ) | (9,708,848 | ) | (207,484 | ) | (6,334,322 | ) | ||||||||
Class R3 | (684,218 | ) | (25,393,252 | ) | (442,813 | ) | (14,007,818 | ) | ||||||||
Class R4 | (423,760 | ) | (16,201,561 | ) | (312,069 | ) | (10,004,632 | ) | ||||||||
Class R5 | (1,651,122 | ) | (62,018,015 | ) | (1,063,876 | ) | (33,377,970 | ) | ||||||||
| (19,359,531 | ) | $(725,571,808 | ) | (14,439,590 | ) | $(452,699,658 | ) | |||||||||
| Net change | ||||||||||||||||
Class A | (854,070 | ) | $(35,120,694 | ) | 2,187,683 | $62,166,551 | ||||||||||
Class B | (166,377 | ) | (5,760,506 | ) | (240,431 | ) | (6,907,297 | ) | ||||||||
Class C | 244,199 | 8,086,523 | 164,021 | 5,408,611 | ||||||||||||
Class I | 1,850,505 | 61,268,613 | 7,862,281 | 256,239,746 | ||||||||||||
Class R1 | 8,273 | 283,856 | 14,690 | 442,704 | ||||||||||||
Class R2 | (34,546 | ) | (1,435,443 | ) | 388,023 | 12,063,438 | ||||||||||
Class R3 | (291,699 | ) | (11,146,453 | ) | 556,656 | 17,179,699 | ||||||||||
Class R4 | 402,776 | 14,439,511 | 64,113 | 1,477,446 | ||||||||||||
Class R5 | 2,547,547 | 89,400,120 | 3,878,460 | 119,116,540 | ||||||||||||
| 3,706,608 | $120,015,527 | 14,875,496 | $467,187,438 | |||||||||||||
The fund is one of several mutual funds in which certain MFS funds may invest. The MFS funds do not invest in the underlying funds for the purpose of exercising management or control. At the end of the period, the MFS Moderate Allocation Fund, the MFS Growth Allocation Fund, the MFS Conservative Allocation Fund, and the MFS Aggressive Growth Allocation Fund were the owners of record of approximately 11%, 9%, 4% and 3%, respectively, of the value of outstanding voting shares of the fund. In addition, the MFS Lifetime 2015 Fund, the MFS Lifetime 2020 Fund, the MFS Lifetime 2025 Fund, the MFS Lifetime 2030 Fund, the MFS Lifetime 2035 Fund, the MFS Lifetime 2040 Fund, the MFS Lifetime 2045 Fund, the MFS Lifetime 2050 Fund, the MFS Lifetime 2055 Fund, and the MFS Lifetime Income Fund, were each the owners of record of less than 1% of the value of outstanding voting shares of the fund.
(6) Line of Credit
The fund and certain other funds managed by MFS participate in a $1.1 billion unsecured committed line of credit, subject to a $1 billion sublimit, provided by a syndication of banks under a credit agreement. Borrowings may be made for temporary financing needs. Interest is charged to each fund, based on its borrowings, generally at a rate equal to the higher of the Federal Reserve funds rate or one month LIBOR plus an agreed upon spread. A commitment fee, based on the average daily, unused portion of the committed line of credit, is allocated among the participating funds at the end of each calendar quarter. In addition, the fund and other funds
44
Table of Contents
Notes to Financial Statements – continued
managed by MFS have established unsecured uncommitted borrowing arrangements with certain banks for temporary financing needs. Interest is charged to each fund, based on its borrowings, at a rate equal to the Federal Reserve funds rate plus an agreed upon spread. For the year ended September 30, 2014, the fund’s commitment fee and interest expense were $16,757 and $0, respectively, and are included in “Miscellaneous” expense in the Statement of Operations.
(7) Transactions in Underlying Affiliated Funds-Affiliated Issuers
An affiliated issuer may be considered one in which the fund owns 5% or more of the outstanding voting securities, or a company which is under common control. For the purposes of this report, the fund assumes the following to be an affiliated issuer:
| Underlying Affiliated Fund | Beginning Shares/Par Amount | Acquisitions Shares/Par Amount | Dispositions Shares/Par Amount | Ending Shares/Par Amount | ||||||||||||
| MFS Institutional Money Market Portfolio | 28,559,515 | 531,939,364 | (524,931,853 | ) | 35,567,026 | |||||||||||
| Underlying Affiliated Fund | Realized Gain (Loss) | Capital Gain Distributions | Dividend Income | Ending Value | ||||||||||||
| MFS Institutional Money Market Portfolio | $— | $— | $43,848 | $35,567,026 | ||||||||||||
45
Table of Contents
REPORT OF INDEPENDENT REGISTERED PUBLIC ACCOUNTING FIRM
To the Board of Trustees of MFS Series Trust V and the Shareholders of MFS Research Fund:
We have audited the accompanying statement of assets and liabilities, including the portfolio of investments, of MFS Research Fund (one of the series of MFS Series Trust V) (the “Fund”) as of September 30, 2014, and the related statement of operations for the year then ended, the statements of changes in net assets for each of the two years in the period then ended, and the financial highlights for each of the five years in the period then ended. These financial statements and financial highlights are the responsibility of the Fund’s management. Our responsibility is to express an opinion on these financial statements and financial highlights based on our audits.
We conducted our audits in accordance with the standards of the Public Company Accounting Oversight Board (United States). Those standards require that we plan and perform the audit to obtain reasonable assurance about whether the financial statements and financial highlights are free of material misstatement. The Fund is not required to have, nor were we engaged to perform, an audit of its internal control over financial reporting. Our audits included consideration of internal control over financial reporting as a basis for designing audit procedures that are appropriate in the circumstances, but not for the purpose of expressing an opinion on the effectiveness of the Fund’s internal control over financial reporting. Accordingly, we express no such opinion. An audit also includes examining, on a test basis, evidence supporting the amounts and disclosures in the financial statements, assessing the accounting principles used and significant estimates made by management, as well as evaluating the overall financial statement presentation. Our procedures included confirmation of securities owned as of September 30, 2014, by correspondence with the custodian and brokers; where replies were not received from brokers, we performed other auditing procedures. We believe that our audits provide a reasonable basis for our opinion.
In our opinion, the financial statements and financial highlights referred to above present fairly, in all material respects, the financial position of MFS Research Fund as of September 30, 2014, the results of its operations for the year then ended, the changes in its net assets for each of the two years in the period then ended, and the financial highlights for each of the five years in the period then ended, in conformity with accounting principles generally accepted in the United States of America.
DELOITTE & TOUCHE LLP
Boston, Massachusetts
November 14, 2014
46
Table of Contents
TRUSTEES AND OFFICERS — IDENTIFICATION AND BACKGROUND
The Trustees and Officers of the Trust, as of November 1, 2014, are listed below, together with their principal occupations during the past five years. (Their titles may have varied during that period.) The address of each Trustee and Officer is 111 Huntington Avenue, Boston, Massachusetts 02199-7618.
Name, Age | Position(s) Held with Fund | Trustee/Officer Since (h) | Principal the Past Five Years | Other Directorships (j) | ||||
| INTERESTED TRUSTEES | ||||||||
Robert J. Manning (k) (age 51) | Trustee | February 2004 | Massachusetts Financial Services Company, Chairman, Chief Executive Officer and Director; President (until 2009); Chief Investment Officer (until 2010) | N/A | ||||
Robin A. Stelmach (k) (age 53) | Trustee and President | January 2014 | Massachusetts Financial Services Company, Executive Vice President and Chief Operating Officer | N/A | ||||
| INDEPENDENT TRUSTEES | ||||||||
David H. Gunning (age 72) | Trustee and Chair of Trustees | January 2004 | Private investor | Lincoln Electric Holdings, Inc. (welding equipment manufacturer), Director; Development Alternatives, Inc. (consulting), Director/ Non-Executive Chairman | ||||
Steven E. Buller (age 63) | Trustee | February 2014 | Chairman, Financial Accounting Standards Advisory Council; Standing Advisory Group, Public Company Accounting Oversight Board, Member; BlackRock, Inc. (investment management), Managing Director (until 2014), BlackRock Finco UK (investment management), Director (until 2014) | N/A | ||||
47
Table of Contents
Trustees and Officers – continued
Name, Age | Position(s) Held with Fund | Trustee/Officer Since (h) | Principal the Past Five Years | Other Directorships (j) | ||||
Robert E. Butler (age 72) | Trustee | January 2006 | Consultant – investment company industry regulatory and compliance matters | N/A | ||||
Maureen R. Goldfarb (age 59) | Trustee | January 2009 | Private investor | N/A | ||||
William R. Gutow (age 73) | Trustee | December 1993 | Private investor and real estate consultant; Capitol Entertainment Management Company (video franchise), Vice Chairman | Texas Donuts (donut franchise), Vice Chairman (until 2010) | ||||
Michael Hegarty (age 69) | Trustee | December 2004 | Private investor | Brookfield Office Properties, Inc. (real estate), Director; Rouse Properties Inc. (real estate), Director; Capmark Financial Group Inc. (real estate), Director | ||||
John P. Kavanaugh (age 59) | Trustee | January 2009 | Private investor | N/A | ||||
Maryanne L. Roepke (age 58) | Trustee | May 2014 | American Century Investments (investment management), Senior Vice President and Chief Compliance Officer (until 2014) | N/A | ||||
Laurie J. Thomsen (age 57) | Trustee | March 2005 | Private investor; New Profit, Inc. (venture philanthropy), Executive Partner (until 2010) | The Travelers Companies (insurance), Director | ||||
Robert W. Uek (age 73) | Trustee | January 2006 | Consultant to investment company industry | N/A | ||||
| OFFICERS | ||||||||
Christopher R. Bohane (k) (age 40) | Assistant Secretary and Assistant Clerk | July 2005 | Massachusetts Financial Services Company, Vice President and Assistant General Counsel | N/A | ||||
Kino Clark (k) (age 46) | Assistant Treasurer | January 2012 | Massachusetts Financial Services Company, Vice President | N/A |
48
Table of Contents
Trustees and Officers – continued
Name, Age | Position(s) Held with Fund | Trustee/Officer Since (h) | Principal the Past Five Years | Other Directorships (j) | ||||
Thomas H. Connors (k) (age 55) | Assistant Secretary and Assistant Clerk | September 2012 | Massachusetts Financial Services Company, Vice President and Senior Counsel; Deutsche Investment Management Americas Inc. (financial service provider), Director and Senior Counsel (until 2012) | N/A | ||||
Ethan D. Corey (k) (age 50) | Assistant Secretary and Assistant Clerk | July 2005 | Massachusetts Financial Services Company, Senior Vice President and Associate General Counsel | N/A | ||||
David L. DiLorenzo (k) (age 46) | Treasurer | July 2005 | Massachusetts Financial Services Company, Senior Vice President | N/A | ||||
Timothy M. Fagan (k) (age 46) | Chief Compliance Officer | November 2014 | Massachusetts Financial Services Company, Chief Compliance Officer; Vice President and Senior Counsel (until 2012) | N/A | ||||
Brian E. Langenfeld (k) (age 41) | Assistant Secretary and Assistant Clerk | June 2006 | Massachusetts Financial Services Company, Vice President and Senior Counsel | N/A | ||||
Susan S. Newton (k) (age 64) | Assistant Secretary and Assistant Clerk | May 2005 | Massachusetts Financial Services Company, Senior Vice President and Associate General Counsel | N/A | ||||
Susan A. Pereira (k) (age 43) | Assistant Secretary and Assistant Clerk | July 2005 | Massachusetts Financial Services Company, Vice President and Senior Counsel | N/A | ||||
Kasey L. Phillips (k) (age 43) | Assistant Treasurer | September 2012 | Massachusetts Financial Services Company, Vice President; Wells Fargo Funds Management, LLC, Senior Vice President, Fund Treasurer (until 2012) | N/A |
49
Table of Contents
Trustees and Officers – continued
Name, Age | Position(s) Held with Fund | Trustee/Officer Since (h) | Principal the Past Five Years | Other Directorships (j) | ||||
Mark N. Polebaum (k) (age 62) | Secretary and Clerk | January 2006 | Massachusetts Financial Services Company, Executive Vice President, General Counsel and Secretary | N/A | ||||
Matthew A. Stowe (age 39) | Assistant Secretary and Assistant Clerk | October 2014 | Massachusetts Financial Services Company, Vice President and Senior Counsel | N/A | ||||
Frank L. Tarantino (age 70) | Independent Senior Officer | June 2004 | Tarantino LLC (provider of compliance services), Principal | N/A | ||||
Richard S. Weitzel (k) (age 44) | Assistant Secretary and Assistant Clerk | October 2007 | Massachusetts Financial Services Company, Senior Vice President and Associate General Counsel | N/A | ||||
James O. Yost (k) (age 54) | Deputy Treasurer | September 1990 | Massachusetts Financial Services Company, Senior Vice President | N/A |
| (h) | Date first appointed to serve as Trustee/officer of an MFS Fund. Each Trustee has served continuously since appointment unless indicated otherwise. For the period from December 15, 2004 until February 22, 2005, Mr. Manning served as Advisory Trustee. Prior to January 2012, Messrs. DiLorenzo and Yost served as Assistant Treasurers of the Funds. Ms. Stelmach was appointed as President of the Funds as of October 1, 2014. |
| (j) | Directorships or trusteeships of companies required to report to the Securities and Exchange Commission (i.e., “public companies”). |
| (k) | “Interested person” of the Trust within the meaning of the Investment Company Act of 1940 (referred to as the 1940 Act), which is the principal federal law governing investment companies like the fund, as a result of position with MFS. The address of MFS is 111 Huntington Avenue, Boston, Massachusetts 02199-7618. |
Each Trustee (except Ms. Stelmach, Mr. Buller and Ms. Roepke) has been elected by shareholders and each Trustee and officer holds office until his or her successor is chosen and qualified or until his or her earlier death, resignation, retirement or removal. The Trust does not hold annual meetings for the purpose of electing Trustees, and Trustees are not elected for fixed terms. Messrs. Butler, Kavanaugh, Uek and Mses. Thomsen and Roepke are members of the Trust’s Audit Committee.
Each of the Fund’s Trustees and officers holds comparable positions with certain other funds of which MFS or a subsidiary is the investment adviser or distributor, and, in the case of the officers, with certain affiliates of MFS. As of January 1, 2014, the Trustees served as board members of 142 funds within the MFS Family of Funds.
50
Table of Contents
Trustees and Officers – continued
The Statement of Additional Information for the Fund includes further information about the Trustees and is available without charge upon request by calling 1-800-225-2606.
| Investment Adviser | Custodian | |
| Massachusetts Financial Services Company 111 Huntington Avenue Boston, MA 02199-7618 | JPMorgan Chase Bank, NA 4 Metrotech Center New York, NY 11245 | |
| Distributor | Independent Registered Public Accounting Firm | |
| MFS Fund Distributors, Inc. 111 Huntington Avenue Boston, MA 02199-7618 | Deloitte & Touche LLP 200 Berkeley Street Boston, MA 02116 | |
| Portfolio Manager | ||
Joseph MacDougall |
51
Table of Contents
BOARD REVIEW OF INVESTMENT ADVISORY AGREEMENT
The Investment Company Act of 1940 requires that both the full Board of Trustees and a majority of the non-interested (“independent”) Trustees, voting separately, annually approve the continuation of the Fund’s investment advisory agreement with MFS. The Trustees consider matters bearing on the Fund and its advisory arrangements at their meetings throughout the year, including a review of performance data at each regular meeting. In addition, the independent Trustees met several times over the course of three months beginning in May and ending in July, 2014 (“contract review meetings”) for the specific purpose of considering whether to approve the continuation of the investment advisory agreement for the Fund and the other investment companies that the Board oversees (the “MFS Funds”). The independent Trustees were assisted in their evaluation of the Fund’s investment advisory agreement by independent legal counsel, from whom they received separate legal advice and with whom they met separately from MFS during various contract review meetings. The independent Trustees were also assisted in this process by the MFS Funds’ Independent Chief Compliance Officer, a full-time senior officer appointed by and reporting to the independent Trustees.
In connection with their deliberations regarding the continuation of the investment advisory agreement, the Trustees, including the independent Trustees, considered such information and factors as they believed, in light of the legal advice furnished to them and their own business judgment, to be relevant. The investment advisory agreement for the Fund was considered separately, although the Trustees also took into account the common interests of all MFS Funds in their review. As described below, the Trustees considered the nature, quality, and extent of the various investment advisory, administrative, and shareholder services performed by MFS under the existing investment advisory agreement and other arrangements with the Fund.
In connection with their contract review meetings, the Trustees received and relied upon materials that included, among other items: (i) information provided by Lipper Inc., an independent third party, on the investment performance of the Fund for various time periods ended December 31, 2013 and the investment performance of a group of funds with substantially similar investment classifications/objectives (the “Lipper performance universe”), (ii) information provided by Lipper Inc. on the Fund’s advisory fees and other expenses and the advisory fees and other expenses of comparable funds identified by Lipper Inc. (the “Lipper expense group”), (iii) information provided by MFS on the advisory fees of comparable portfolios of other clients of MFS, including institutional separate accounts and other clients, (iv) information as to whether and to what extent applicable expense waivers, reimbursements or fee “breakpoints” are observed for the Fund, (v) information regarding MFS’ financial results and financial condition, including MFS’ and certain of its affiliates’ estimated profitability from services performed for the Fund and the MFS Funds as a whole, and compared to MFS’ institutional business, (vi) MFS’ views regarding the outlook for the mutual fund industry and the strategic business plans of MFS, (vii) descriptions of various functions performed by MFS for the Funds, such as compliance monitoring and portfolio trading practices, and (viii) information regarding the overall organization of MFS, including information about MFS’ senior management and other personnel providing investment advisory, administrative and other services to
52
Table of Contents
Board Review of Investment Advisory Agreement – continued
the Fund and the other MFS Funds. The comparative performance, fee and expense information prepared and provided by Lipper Inc. was not independently verified and the independent Trustees did not independently verify any information provided to them by MFS.
The Trustees’ conclusion as to the continuation of the investment advisory agreement was based on a comprehensive consideration of all information provided to the Trustees and not the result of any single factor. Some of the factors that figured particularly in the Trustees’ deliberations are described below, although individual Trustees may have evaluated the information presented differently from one another, giving different weights to various factors. It is also important to recognize that the fee arrangements for the Fund and other MFS Funds are the result of years of review and discussion between the independent Trustees and MFS, that certain aspects of such arrangements may receive greater scrutiny in some years than in others, and that the Trustees’ conclusions may be based, in part, on their consideration of these same arrangements during the course of the year and in prior years.
Based on information provided by Lipper Inc. and MFS, the Trustees reviewed the Fund’s total return investment performance as well as the performance of peer groups of funds over various time periods. The Trustees placed particular emphasis on the total return performance of the Fund’s Class A shares in comparison to the performance of funds in its Lipper performance universe over the three-year period ended December 31, 2013, which the Trustees believed was a long enough period to reflect differing market conditions. The total return performance of the Fund’s Class A shares was in the 2nd quintile relative to the other funds in the universe for this three-year period (the 1st quintile being the best performers and the 5th quintile being the worst performers). The total return performance of the Fund’s Class A shares was in the 3rd quintile for the one-year period and the 1st quintile for the five-year period ended December 31, 2013 relative to the Lipper performance universe. Because of the passage of time, these performance results may differ from the performance results for more recent periods, including those shown elsewhere in this report.
In the course of their deliberations, the Trustees took into account information provided by MFS in connection with the contract review meetings, as well as during investment review meetings conducted with portfolio management personnel during the course of the year regarding the Fund’s performance. After reviewing these and related factors, the Trustees concluded, within the context of their overall conclusions regarding the investment advisory agreement, that they were satisfied with MFS’ responses and efforts relating to investment performance.
In assessing the reasonableness of the Fund’s advisory fee, the Trustees considered, among other information, the Fund’s advisory fee and the total expense ratio of the Fund’s Class A shares as a percentage of average daily net assets and the advisory fee and total expense ratios of peer groups of funds based on information provided by Lipper Inc. The Trustees considered that, according to the Lipper data (which takes into account any fee reductions or expense limitations that were in effect during the Fund’s last fiscal year), the Fund’s effective advisory fee rate and total expense ratio were each lower than the Lipper expense group median.
53
Table of Contents
Board Review of Investment Advisory Agreement – continued
The Trustees also considered the advisory fees charged by MFS to any comparable institutional accounts. In comparing these fees, the Trustees considered information provided by MFS as to the generally broader scope of services provided by MFS to the Fund in comparison to institutional accounts, the higher demands placed on MFS’ investment personnel and trading infrastructure as a result of the daily cash in-flows and out-flows of the Fund, and the impact on MFS and expenses associated with the more extensive regulatory regime to which the Fund is subject in comparison to institutional accounts.
The Trustees also considered whether the Fund may benefit from any economies of scale in the management of the Fund in the event of growth in assets of the Fund. They noted that MFS has agreed in writing to implement a breakpoint that reduces its advisory fee rate on the Fund’s average daily net assets over $5 billion, which may not be changed without the Trustees’ approval. The Trustees concluded that the breakpoint was sufficient to allow the Fund to benefit from economies of scale as its assets grow.
The Trustees also considered information prepared by MFS relating to MFS’ costs and profits with respect to the Fund, the MFS Funds considered as a group, and other investment companies and accounts advised by MFS, as well as MFS’ methodologies used to determine and allocate its costs to the MFS Funds, the Fund and other accounts and products for purposes of estimating profitability.
After reviewing these and other factors described herein, the Trustees concluded, within the context of their overall conclusions regarding the investment advisory agreement, that the advisory fees charged to the Fund represent reasonable compensation in light of the services being provided by MFS to the Fund.
In addition, the Trustees considered MFS’ resources and related efforts to continue to retain, attract and motivate capable personnel to serve the Fund. The Trustees also considered current and developing conditions in the financial services industry, including the presence of large and well-capitalized companies which are spending, and appear to be prepared to continue to spend, substantial sums to engage personnel and to provide services to competing investment companies. In this regard, the Trustees also considered the financial resources of MFS and its ultimate parent, Sun Life Financial Inc. The Trustees also considered the advantages and possible disadvantages to the Fund of having an adviser that also serves other investment companies as well as other accounts.
The Trustees also considered the nature, quality, cost, and extent of administrative, transfer agency, and distribution services provided to the Fund by MFS and its affiliates under agreements and plans other than the investment advisory agreement, including any 12b-1 fees the Fund pays to MFS Fund Distributors, Inc., an affiliate of MFS. The Trustees also considered the nature, extent and quality of certain other services MFS performs or arranges for on the Fund’s behalf, which may include securities lending programs, directed expense payment programs, class action recovery programs, and MFS’ interaction with third-party service providers, principally custodians and sub-custodians. The Trustees concluded that the various non-advisory services provided by MFS and its affiliates on behalf of the Fund were satisfactory.
54
Table of Contents
Board Review of Investment Advisory Agreement – continued
The Trustees also considered benefits to MFS from the use of the Fund’s portfolio brokerage commissions, if applicable, to pay for investment research and various other factors. Additionally, the Trustees considered so-called “fall-out benefits” to MFS such as reputational value derived from serving as investment manager to the Fund.
Based on their evaluation of factors that they deemed to be material, including those factors described above, the Board of Trustees, including the independent Trustees, concluded that the Fund’s investment advisory agreement with MFS should be continued for an additional one-year period, commencing August 1, 2014.
55
Table of Contents
PROXY VOTING POLICIES AND INFORMATION
MFS votes proxies on behalf of the fund pursuant to proxy voting policies and procedures that are available without charge, upon request, by calling 1-800-225-2606, by visiting the Proxy Voting section of mfs.com or by visiting the SEC’s Web site at http://www.sec.gov.
Information regarding how the fund voted proxies relating to portfolio securities during the most recent twelve-month period ended June 30 is available without charge by visiting the Proxy Voting section of mfs.com or by visiting the SEC’s Web site at http://www.sec.gov.
QUARTERLY PORTFOLIO DISCLOSURE
The fund will file a complete schedule of portfolio holdings with the Securities and Exchange Commission (the Commission) for the first and third quarters of each fiscal year on Form N-Q. A shareholder can obtain the quarterly portfolio holdings report at mfs.com. The fund’s Form N-Q is also available on the EDGAR database on the Commission’s Internet Web site at http://www.sec.gov, and may be reviewed and copied at the:
Public Reference Room
Securities and Exchange Commission
100 F Street, NE, Room 1580
Washington, D.C. 20549
Information on the operation of the Public Reference Room may be obtained by calling the Commission at 1-800-SEC-0330. Copies of the fund’s Form N-Q also may be obtained, upon payment of a duplicating fee, by electronic request at the following e-mail address: publicinfo@sec.gov or by writing the Public Reference Section at the above address.
From time to time, MFS may post important information about the fund or the MFS funds on the MFS web site (mfs.com). This information is available by visiting the “Market Commentary” and “Announcements” sub sections in the “Market Outlooks” section of mfs.com or by clicking on the fund’s name under “Mutual Funds” in the “Products” section of mfs.com.
FEDERAL TAX INFORMATION (unaudited)
The fund will notify shareholders of amounts for use in preparing 2014 income tax forms in January 2015. The following information is provided pursuant to provisions of the Internal Revenue Code.
The fund designates the maximum amount allowable as qualified dividend income eligible to be taxed at the same rate as long-term capital gain.
The fund designates $97,134,000 as capital gain dividends paid during the fiscal year.
For corporate shareholders, 95.80% of the ordinary income dividends paid during the fiscal year qualify for the corporate dividends received deduction.
56
Table of Contents
rev. 3/11
| WHAT DOES MFS DO WITH YOUR PERSONAL INFORMATION? |  | ||
| Why? | Financial companies choose how they share your personal information. Federal law gives consumers the right to limit some but not all sharing. Federal law also requires us to tell you how we collect, share, and protect your personal information. Please read this notice carefully to understand what we do. |
| What? | The types of personal information we collect and share depend on the product or service you have with us. This information can include:
• Social Security number and account balances • Account transactions and transaction history • Checking account information and wire transfer instructions
When you are no longer our customer, we continue to share your information as described in this notice. |
| How? | All financial companies need to share customers’ personal information to run their everyday business. In the section below, we list the reasons financial companies can share their customers’ personal information; the reasons MFS chooses to share; and whether you can limit this sharing. |
| Reasons we can share your personal information | Does MFS share? | Can you limit this sharing? | ||
For our everyday business purposes – such as to process your transactions, maintain your account(s), respond to court orders and legal investigations, or report to credit bureaus | Yes | No | ||
For our marketing purposes – to offer our products and services to you | No | We don’t share | ||
| For joint marketing with other financial companies | No | We don’t share | ||
For our affiliates’ everyday business purposes – information about your transactions and experiences | No | We don’t share | ||
For our affiliates’ everyday business purposes – information about your creditworthiness | No | We don’t share | ||
| For nonaffiliates to market to you | No | We don’t share |
| Questions? | Call 800-225-2606 or go to mfs.com. |
57
Table of Contents
| Page 2 |
| Who we are | ||
| Who is providing this notice? | MFS Funds, MFS Investment Management, MFS Institutional Advisors, Inc., MFS Fund Distributors, Inc., MFS Heritage Trust Company, and MFS Service Center, Inc. | |
| What we do | ||
| How does MFS protect my personal information? | To protect your personal information from unauthorized access and use, we use security measures that comply with federal law. These measures include procedural, electronic, and physical safeguards for the protection of the personal information we collect about you. | |
| How does MFS collect my personal information? | We collect your personal information, for example, when you
•open an account or provide account information •direct us to buy securities or direct us to sell your securities •make a wire transfer
We also collect your personal information from others, such as credit bureaus, affiliates and other companies. | |
| Why can’t I limit all sharing? | Federal law gives you the right to limit only
•sharing for affiliates’ everyday business purposes – information about your creditworthiness •affiliates from using your information to market to you •sharing for nonaffiliates to market to you
State laws and individual companies may give you additional rights to limit sharing. | |
| Definitions | ||
| Affiliates | Companies related by common ownership or control. They can be financial and nonfinancial companies.
•MFS does not share personal information with affiliates, except for everyday business purposes as described on page one of this notice. | |
| Nonaffiliates | Companies not related by common ownership or control. They can be financial and nonfinancial companies.
•MFS does not share with nonaffiliates so they can market to you. | |
| Joint Marketing | A formal agreement between nonaffiliated financial companies that together market financial products or services to you.
•MFS doesn’t jointly market. | |
| Other important information | ||
| If you own an MFS product or receive an MFS service in the name of a third party such as a bank or broker-dealer, their privacy policy may apply to you instead of ours. | ||
58
Table of Contents
Save paper with eDelivery.
| MFS® will send you prospectuses, |

reports, and proxies directly via e-mail so you will get information faster with less mailbox clutter.
To sign up:
1. Go to mfs.com.
2. Log in via MFS® Access.
3. Select eDelivery.
If you own your MFS fund shares through a financial institution or a retirement plan, MFS® TALK, MFS® Access, or eDelivery may not be available to you.
WEB SITE
mfs.com
MFS TALK
1-800-637-8255
24 hours a day
ACCOUNT SERVICE AND LITERATURE
Shareholders
1-800-225-2606
Financial advisors
1-800-343-2829
Retirement plan services
1-800-637-1255
MAILING ADDRESS
MFS Service Center, Inc.
P.O. Box 55824
Boston, MA 02205-5824
OVERNIGHT MAIL
MFS Service Center, Inc.
c/o Boston Financial Data Services
30 Dan Road
Canton, MA 02021-2809
Table of Contents
ANNUAL REPORT
September 30, 2014

MFS® TOTAL RETURN FUND

MTR-ANN
Table of Contents
MFS® TOTAL RETURN FUND
The report is prepared for the general information of shareholders.
It is authorized for distribution to prospective investors only when preceded or accompanied by a current prospectus.
NOT FDIC INSURED Ÿ MAY LOSE VALUE Ÿ NO BANK GUARANTEE
Table of Contents

LETTER FROM THE CHAIRMAN AND CEO
Dear Shareholders:
A rift is growing between U.S. and global economic growth. The U.S. economy has regained momentum, with a more robust labor market and steadily declining
unemployment, increased consumer confidence and growing industrial output. Corporate earnings remain strong overall.
However, the rest of the global economy is struggling. The sluggish eurozone economy is now the largest impediment to global growth. With high unemployment and low inflation, the region has been unable to gain traction since the 2008 – 2009 financial crisis. The European Central Bank’s efforts to stimulate growth have had limited success.
In Asia, China is struggling to boost its industrial output and Japan’s economic momentum has slowed after its sales tax increase in April.
As always at MFS®, active risk management is integral to how we manage your investments. We use a collaborative process, sharing insights across asset classes, regions and economic sectors. Our global team of investment professionals uses a multidisciplined, long-term, diversified investment approach.
We understand that these are challenging economic times. Applying proven principles, such as asset allocation and diversification, can best serve investors over the long term. We are confident that this approach can help you as you work with your financial advisors to reach your goals in the years ahead.
Respectfully,

Robert J. Manning
Chairman and Chief Executive Officer
MFS Investment Management
November 14, 2014
The opinions expressed in this letter are subject to change and may not be relied upon for investment advice. No forecasts can be guaranteed.
1
Table of Contents
Portfolio structure (i)

| Top ten holdings (i) | ||||
| U.S. Treasury Notes, 0.875%, 12/31/16 | 3.0% | |||
| U.S. Treasury Bonds, 4.5%, 8/15/39 | 2.6% | |||
| JPMorgan Chase & Co. | 2.4% | |||
| U.S. Treasury Notes, 3.125%, 5/15/21 | 2.3% | |||
| U.S. Treasury Notes, 2.125%, 5/31/15 | 2.0% | |||
| Fannie Mae, 4%, 30 Years | 1.7% | |||
| Wells Fargo & Co. | 1.6% | |||
| Philip Morris International, Inc. | 1.5% | |||
| Johnson & Johnson | 1.5% | |||
| Pfizer, Inc. | 1.4% | |||
| Composition including fixed income credit quality (a)(i) | ||||
| AAA | 1.1% | |||
| AA | 1.0% | |||
| A | 4.8% | |||
| BBB | 5.7% | |||
| BB | 0.3% | |||
| CCC | 0.1% | |||
| C | 0.1% | |||
| U.S. Government | 14.3% | |||
| Federal Agencies | 11.5% | |||
| Not Rated (o) | 0.0% | |||
| Non-Fixed Income | 59.8% | |||
| Cash & Other | 1.3% | |||
| Equity sectors | ||||
| Financial Services | 13.7% | |||
| Health Care | 7.8% | |||
| Consumer Staples | 5.8% | |||
| Industrial Goods & Services | 5.4% | |||
| Technology | 4.9% | |||
| Energy | 4.9% | |||
| Utilities & Communications | 4.1% | |||
| Leisure | 4.0% | |||
| Retailing | 3.4% | |||
| Basic Materials | 2.6% | |||
| Autos & Housing | 1.4% | |||
| Special Products & Services | 1.0% | |||
| Transportation | 0.8% | |||
| Fixed income sectors (i) | ||||
| U.S. Treasury Securities | 14.3% | |||
| Mortgage-Backed Securities | 11.1% | |||
| Investment Grade Corporates | 9.5% | |||
| Commercial Mortgage-Backed Securities | 1.6% | |||
| Emerging Markets Bonds | 0.8% | |||
| Non-U.S. Government Bonds | 0.4% | |||
| U.S. Government Agencies | 0.4% | |||
| Collateralized Debt Obligations | 0.3% | |||
| High Yield Corporates | 0.3% | |||
| Asset-Backed Securities | 0.2% | |||
| Residential Mortgage-Backed Securities (o) | 0.0% | |||
2
Table of Contents
Portfolio Composition – continued
| (a) | For all securities other than those specifically described below, ratings are assigned to underlying securities utilizing ratings from Moody’s, Fitch, and Standard & Poor’s rating agencies and applying the following hierarchy: If all three agencies provide a rating, the middle rating (after dropping the highest and lowest ratings) is assigned; if two of the three agencies rate a security, the lower of the two is assigned. Ratings are shown in the S&P and Fitch scale (e.g., AAA). Securities rated BBB or higher are considered investment grade. All ratings are subject to change. U.S. Government includes securities issued by the U.S. Department of the Treasury. Federal Agencies includes rated and unrated U.S. Agency fixed-income securities, U.S. Agency mortgage-backed securities, and collateralized mortgage obligations of U.S. Agency mortgage-backed securities. Not Rated includes fixed income securities, including fixed income futures contracts, which have not been rated by any rating agency. Non-Fixed Income includes equity securities (including convertible bonds and equity derivatives) and commodities. The fund may not hold all of these instruments. The fund is not rated by these agencies. |
| (i) | For purposes of this presentation, the components include the value of securities, and reflect the impact of the equivalent exposure of derivative positions, if any. These amounts may be negative from time to time. Equivalent exposure is a calculated amount that translates the derivative position into a reasonable approximation of the amount of the underlying asset that the portfolio would have to hold at a given point in time to have the same price sensitivity that results from the portfolio’s ownership of the derivative contract. When dealing with derivatives, equivalent exposure is a more representative measure of the potential impact of a position on portfolio performance than value. The bond component will include any accrued interest amounts. |
| (o) | Less than 0.1%. |
Where the fund holds convertible bonds, these are treated as part of the equity portion of the portfolio.
Cash & Other can include cash, other assets less liabilities, offsets to derivative positions, and short-term securities.
Percentages are based on net assets as of 9/30/14.
The portfolio is actively managed and current holdings may be different.
3
Table of Contents
Summary of Results
For the twelve months ended September 30, 2014, Class A shares of the MFS Total Return Fund (“fund”) provided a total return of 11.55%, at net asset value. This compares with a return of 19.73% and 3.96% for the fund’s benchmarks, the Standard & Poor’s 500 Stock Index (“S&P 500 Index”) and the Barclays U.S. Aggregate Bond Index (“Barclays Index”), respectively. The fund’s other benchmark, the MFS Total Return Blended Index (“Blended Index”), generated a return of 13.28%. The Blended Index reflects the blended returns of the equity and fixed income market indices, with percentage allocations to each index designed to resemble the equity and fixed income allocations of the fund. The market indices and related percentage allocations used to compile the Blended Index are set forth in the Performance Summary.
Market Environment
Early in the period, equity markets advanced in response to improved economic fundamentals, having recovered from prior weakness stemming from concerns that the US Federal Reserve (“Fed”) would begin tapering its quantitative easing (“QE”) program. A general theme in the market was a rotation in investor allocations from fixed income to equities and emerging markets (“EM”) to developed markets, reflecting an anticipated acceleration in developed market growth rates relative to EM as well as a more equity-friendly macro backdrop amid increased volatility in EM debt. As the period progressed, the Fed’s decision to postpone QE tapering surprised markets. Favorable market reactions were tempered, however, by tense negotiations over US fiscal policy which resulted in a 16-day partial shutdown of the federal government and a short-term extension in the debt ceiling. The volatility was short-lived, however, as an extension of budget and debt ceiling deadlines allowed the government to re-open, and subsequent economic data reflected moderate but resilient US growth. Also well-received was the decision by the European Central Bank (“ECB”) to cut its policy rate as inflation pressures waned in the region. In addition, equity investors appeared to have concluded that there would be no major change in US monetary policy as a result of the nomination of Janet Yellen as the new Fed Chair for a term beginning in early 2014 and that tapering would have no major impact on the trajectory.
Later in the period, financial markets were forced to contend with a series of positive and negative return episodes. Geopolitical tensions flared in the Middle East and Russia/Ukraine. Market setbacks were short-lived, as improving economic growth in the US coupled with prospects for easier monetary policy in regions with slowing growth such as Japan, Europe and China, supported risk assets. For example, the ECB cut policy interest rates into negative territory and by the end of the period expectations were for additional rate cuts and the announcement for non-conventional easing measures. The decline in developed market government bond yields and credit spreads were also supportive for equity markets. At the end of the period, the US equity market was trading at all-time highs.
4
Table of Contents
Management Review – continued
Detractors from Performance
Within the equity portion of the fund, an underweight position in the technology sector detracted from relative performance relative to the S&P 500 index. Underweight positions in computer and personal electronics maker Apple, software company Microsoft, semiconductor company Intel and internet search giant Google weighed on relative performance. Shares of Apple rose during the period as the company announced strong second and third-quarter 2014 results, driven by sales of the iPhone and Mac products. Additionally, the much-anticipated release of the iPhone 6 and iPhone 6 Plus models aided the stock’s performance. Shares of Microsoft rose on news that the software giant would reduce its workforce to simplify its operations and align the recently acquired Nokia Devices and Services business with the company’s overall strategy. The company’s strategic acquisition of Minecraft-maker Mojang further benefited the stock.
Stock selection in the health care sector was also among the top relative detractors. Not owning equity shares of biotechnology firm Gilead Sciences hampered relative performance during the reporting period. The company reported strong earnings and higher-than-expected revenue guidance driven by sales of their hepatitis C infection drug Sovaldi.
Security selection in consumer staples was an additional factor that weakened relative results. The fund’s overweight position in tobacco company Philip Morris International and holdings of spirits maker Diageo (b) (United Kingdom) hurt relative performance. Shares of Philip Morris declined as the company experienced substantial headwinds from its foreign currency exposure and weaker volume trends during the reporting period. Diageo’s shares fell after the world’s largest spirits company reported weaker-than-expected results during the period due to slowing growth in emerging markets.
Elsewhere, the portfolio’s holding in mining and metals company Vale (b) (Brazil) and the fund’s overweight position in shares of building systems and aerospace products and services provider United Technologies detracted from relative performance as both stocks underperformed the benchmark.
Within the fixed income portion of the fund, yield curve (y) positioning relative to the Barclays Index, particularly the fund’s lesser exposure to shifts in the middle (centered around 7 to 10 years) of the yield curve was an area of relative weakness. The fund’s lesser exposure to bonds in the agency and telecom sectors also weakened relative results.
During the reporting period, the fund’s relative currency exposure, resulting primarily from differences between the portfolio’s and the benchmark’s exposures to holdings of securities denominated in foreign currencies, detracted from relative performance. All of MFS’ investment decisions are driven by the fundamentals of each individual opportunity and as such, it is common for our portfolios to have different currency exposure than the benchmark.
Contributors to Performance
Within the equity portion of the fund, stock selection in retailing contributed to performance relative to the S&P 500 Index. An overweight position in drug store
5
Table of Contents
Management Review – continued
retailer CVS Health and not holding internet retailer Amazon supported relative returns. CVS Health posted results that were ahead of market consensus, led largely by better-than-expected results from its pharmacy benefit manager business segment (PBM).
Elsewhere, overweight positions in computer defense contractor Lockheed Martin, personal electronics maker Hewlett-Packard, tobacco company Lorillard, telecommunications firm Frontier Communications and global healthcare products company Covidien helped relative returns. Shares of Hewlett-Packard appreciated on the back of growth in its Enterprise Group, coupled with business stabilization in Printing and PCs. Shares of Lorillard also bolstered relative performance on news that Reynolds American would be acquiring the company at a significant premium. In addition, the company noted improving cigarette pricing trends. An underweight position in diversified financial services firm Citigroup and not holding equity shares of diversified industrial conglomerate General Electric and global auto maker Ford Motor also strengthened relative results.
Within the fixed income portion of the fund, return from yield, which was greater than that of the Barclays Index, aided relative returns. Additionally, yield curve (y) positioning, particularly the fund’s greater exposure to shifts in the long end (centered around maturities of 10 or more years) of the yield curve was an area of relative strength. The fund’s greater exposure to bonds in the finance sector also contributed to relative performance.
Respectfully,
| Nevin Chitkara | William Douglas | Steven Gorham | Richard Hawkins | |||
| Portfolio Manager | Portfolio Manager | Portfolio Manager | Portfolio Manager | |||
| Joshua Marston | Jonathan Sage | Brooks Taylor | ||||
| Portfolio Manager | Portfolio Manager | Portfolio Manager | ||||
| (b) | Security is not a benchmark constituent. |
| (h) | Security was not held in the portfolio at period end. |
| (y) | A yield curve graphically depicts the yields of different maturity bonds of the same credit quality and type. A normal yield curve is upward-sloping, with short term-rates lower than long term rates. |
The views expressed in this report are those of the portfolio managers only through the end of the period of the report as stated on the cover and do not necessarily reflect the views of MFS or any other person in the MFS organization. These views are subject to change at any time based on market or other conditions, and MFS disclaims any responsibility to update such views. These views may not be relied upon as investment advice or an indication of trading intent on behalf of any MFS portfolio. References to specific securities are not recommendations of such securities, and may not be representative of any MFS portfolio’s current or future investments.
6
Table of Contents
PERFORMANCE SUMMARY THROUGH 9/30/14
The following chart illustrates a representative class of the fund’s historical performance in comparison to its benchmark(s). Performance results include the deduction of the maximum applicable sales charge and reflect the percentage change in net asset value, including reinvestment of dividends and capital gains distributions. The performance of other share classes will be greater than or less than that of the class depicted below. Benchmarks are unmanaged and may not be invested in directly. Benchmark returns do not reflect sales charges, commissions or expenses. (See Notes to Performance Summary.)
Performance data shown represents past performance and is no guarantee of future results. Investment return and principal value fluctuate so your shares, when sold, may be worth more or less than the original cost; current performance may be lower or higher than quoted. The performance shown does not reflect the deduction of taxes, if any, that a shareholder would pay on fund distributions or the redemption of fund shares.
Growth of a Hypothetical $10,000 Investment
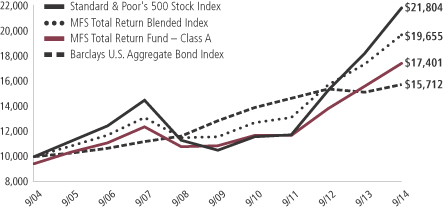
7
Table of Contents
Performance Summary – continued
Total Returns through 9/30/14
Average annual without sales charge
| Share class | Class inception date | 1-yr | 5-yr | 10-yr | Life (t) | |||||||||
| A | 10/06/70 | 11.55% | 9.89% | 6.32% | N/A | |||||||||
| B | 8/23/93 | 10.75% | 9.10% | 5.60% | N/A | |||||||||
| C | 8/01/94 | 10.65% | 9.08% | 5.59% | N/A | |||||||||
| I | 1/02/97 | 11.76% | 10.18% | 6.66% | N/A | |||||||||
| R1 | 4/01/05 | 10.72% | 9.09% | N/A | 5.23% | |||||||||
| R2 | 10/31/03 | 11.29% | 9.64% | 6.06% | N/A | |||||||||
| R3 | 4/01/05 | 11.54% | 9.91% | N/A | 6.01% | |||||||||
| R4 | 4/01/05 | 11.82% | 10.18% | N/A | 6.29% | |||||||||
| R5 | 6/01/12 | 11.91% | N/A | N/A | 14.04% | |||||||||
| 529A | 7/31/02 | 11.53% | 9.81% | 6.19% | N/A | |||||||||
| 529B | 7/31/02 | 10.63% | 9.02% | 5.46% | N/A | |||||||||
| 529C | 7/31/02 | 10.66% | 9.02% | 5.45% | N/A | |||||||||
| Comparative benchmarks | ||||||||||||||
| Standard & Poor’s 500 Stock Index (f) | 19.73% | 15.70% | 8.11% | N/A | ||||||||||
| Barclays U.S. Aggregate Bond Index (f) | 3.96% | 4.12% | 4.62% | N/A | ||||||||||
| MFS Total Return Blended Index (f)(w) | 13.28% | 11.19% | 6.99% | N/A | ||||||||||
| Average annual with sales charge | ||||||||||||||
| A With initial Sales Charge (5.75%) | 5.14% | 8.59% | 5.70% | N/A | ||||||||||
| B With CDSC (Declining over six years from 4% to 0%) (v) | 6.75% | 8.81% | 5.60% | N/A | ||||||||||
| C With CDSC (1% for 12 months) (v) | 9.65% | 9.08% | 5.59% | N/A | ||||||||||
| 529A With initial Sales Charge (5.75%) | 5.12% | 8.52% | 5.56% | N/A | ||||||||||
| 529B With CDSC (Declining over six years from 4% to 0%) (v) | 6.63% | 8.73% | 5.46% | N/A | ||||||||||
| 529C With CDSC (1% for 12 months) (v) | 9.66% | 9.02% | 5.45% | N/A | ||||||||||
CDSC – Contingent Deferred Sales Charge.
Class I, R1, R2, R3, R4, and R5 shares do not have a sales charge.
| (f) | Source: FactSet Research Systems Inc. |
8
Table of Contents
Performance Summary – continued
| (t) | For the period from the class inception date through the stated period end (for those share classes with less than 10 years of performance history). No comparative benchmark performance information is provided for “life” periods. (See Notes to Performance Summary.) |
| (v) | Assuming redemption at the end of the applicable period. |
| (w) | MFS Total Return Blended Index is at a point in time and allocations during the period can change. As of September 30, 2014, the blended index was comprised of 60% Standard & Poor’s 500 Stock Index and 40% Barclays U.S. Aggregate Bond Index. |
Benchmark Definitions
Barclays U.S. Aggregate Bond Index – a market capitalization-weighted index that measures the performance of the U.S. investment-grade, fixed rate bond market, with index components for government and corporate securities, mortgage pass-through securities, and asset-backed securities with at least one year to final maturity.
Standard & Poor’s 500 Stock Index – a market capitalization-weighted index of 500 widely held equity securities, designed to measure broad U.S. equity performance.
It is not possible to invest directly in an index.
Notes to Performance Summary
Class 529 shares are only available in conjunction with qualified tuition programs, such as the MFS 529 Savings Plan. There also is an additional fee, which is detailed in the program description, on qualified tuition programs. If this fee was reflected, the performance for Class 529 shares would have been lower. This annual fee is waived for Oregon residents and for those accounts with assets of $25,000 or more.
Average annual total return represents the average annual change in value for each share class for the periods presented. Life returns are presented where the share class has less than 10 years of performance history and represent the average annual total return from the class inception date to the stated period end date. As the fund’s share classes may have different inception dates, the life returns may represent different time periods and may not be comparable. As a result, no comparative benchmark performance information is provided for life periods.
Performance results reflect any applicable expense subsidies and waivers in effect during the periods shown. Without such subsidies and waivers the fund’s performance results would be less favorable. Please see the prospectus and financial statements for complete details.
Performance results do not include adjustments made for financial reporting purposes in accordance with U.S. generally accepted accounting principles and may differ from amounts reported in the financial highlights.
From time to time the fund may receive proceeds from litigation settlements, without which performance would be lower.
9
Table of Contents
Fund expenses borne by the shareholders during the period,
April 1, 2014 through September 30, 2014
As a shareholder of the fund, you incur two types of costs: (1) transaction costs, including sales charges (loads) on certain purchase or redemption payments, and (2) ongoing costs, including management fees; distribution and service (12b-1) fees; and other fund expenses. This example is intended to help you understand your ongoing costs (in dollars) of investing in the fund and to compare these costs with the ongoing costs of investing in other mutual funds.
The example is based on an investment of $1,000 invested at the beginning of the period and held for the entire period April 1, 2014 through September 30, 2014.
Actual Expenses
The first line for each share class in the following table provides information about actual account values and actual expenses. You may use the information in this line, together with the amount you invested, to estimate the expenses that you paid over the period. Simply divide your account value by $1,000 (for example, an $8,600 account value divided by $1,000 = 8.6), then multiply the result by the number in the first line under the heading entitled “Expenses Paid During Period” to estimate the expenses you paid on your account during this period.
Hypothetical Example for Comparison Purposes
The second line for each share class in the following table provides information about hypothetical account values and hypothetical expenses based on the fund’s actual expense ratio and an assumed rate of return of 5% per year before expenses, which is not the fund’s actual return. The hypothetical account values and expenses may not be used to estimate the actual ending account balance or expenses you paid for the period. You may use this information to compare the ongoing costs of investing in the fund and other funds. To do so, compare this 5% hypothetical example with the 5% hypothetical examples that appear in the shareholder reports of the other funds.
Please note that the expenses shown in the table are meant to highlight your ongoing costs only and do not reflect any transactional costs, such as sales charges (loads). Therefore, the second line for each share class in the table is useful in comparing ongoing costs only, and will not help you determine the relative total costs of owning different funds. In addition, if these transactional costs were included, your costs would have been higher.
10
Table of Contents
Expense Table – continued
| Share Class | Annualized Expense Ratio | Beginning Account Value 4/01/14 | Ending Account Value 9/30/14 | Expenses Paid During Period (p) 4/01/14-9/30/14 | ||||||||||||||
| A | Actual | 0.72% | $1,000.00 | $1,029.94 | $3.66 | |||||||||||||
| Hypothetical (h) | 0.72% | $1,000.00 | $1,021.46 | $3.65 | ||||||||||||||
| B | Actual | 1.48% | $1,000.00 | $1,026.49 | $7.52 | |||||||||||||
| Hypothetical (h) | 1.48% | $1,000.00 | $1,017.65 | $7.49 | ||||||||||||||
| C | Actual | 1.48% | $1,000.00 | $1,025.84 | $7.52 | |||||||||||||
| Hypothetical (h) | 1.48% | $1,000.00 | $1,017.65 | $7.49 | ||||||||||||||
| I | Actual | 0.48% | $1,000.00 | $1,031.24 | $2.44 | |||||||||||||
| Hypothetical (h) | 0.48% | $1,000.00 | $1,022.66 | $2.43 | ||||||||||||||
| R1 | Actual | 1.48% | $1,000.00 | $1,026.00 | $7.52 | |||||||||||||
| Hypothetical (h) | 1.48% | $1,000.00 | $1,017.65 | $7.49 | ||||||||||||||
| R2 | Actual | 0.98% | $1,000.00 | $1,029.08 | $4.98 | |||||||||||||
| Hypothetical (h) | 0.98% | $1,000.00 | $1,020.16 | $4.96 | ||||||||||||||
| R3 | Actual | 0.73% | $1,000.00 | $1,029.91 | $3.71 | |||||||||||||
| Hypothetical (h) | 0.73% | $1,000.00 | $1,021.41 | $3.70 | ||||||||||||||
| R4 | Actual | 0.48% | $1,000.00 | $1,031.20 | $2.44 | |||||||||||||
| Hypothetical (h) | 0.48% | $1,000.00 | $1,022.66 | $2.43 | ||||||||||||||
| R5 | Actual | 0.41% | $1,000.00 | $1,032.16 | $2.09 | |||||||||||||
| Hypothetical (h) | 0.41% | $1,000.00 | $1,023.01 | $2.08 | ||||||||||||||
| 529A | Actual | 0.76% | $1,000.00 | $1,029.82 | $3.87 | |||||||||||||
| Hypothetical (h) | 0.76% | $1,000.00 | $1,021.26 | $3.85 | ||||||||||||||
| 529B | Actual | 1.53% | $1,000.00 | $1,025.62 | $7.77 | |||||||||||||
| Hypothetical (h) | 1.53% | $1,000.00 | $1,017.40 | $7.74 | ||||||||||||||
| 529C | Actual | 1.53% | $1,000.00 | $1,026.17 | $7.77 | |||||||||||||
| Hypothetical (h) | 1.53% | $1,000.00 | $1,017.40 | $7.74 | ||||||||||||||
| (h) | 5% class return per year before expenses. |
| (p) | “Expenses Paid During Period” are equal to each class’s annualized expense ratio, as shown above, multiplied by the average account value over the period, multiplied by 183/365 (to reflect the one-half year period). Expenses paid do not include any applicable sales charges (loads). If these transaction costs had been included, your costs would have been higher. |
Notes to Expense Table
Each class with a Rule 12b-1 service fee is subject to a rebate of a portion of such fee. Such rebates are included in the expense ratios above. For Class A and Class 529A shares, this rebate reduced the expense ratios above by 0.01% and 0.02%, respectively. See Note 3 in the Notes to Financial Statements for additional information.
11
Table of Contents
9/30/14
The Portfolio of Investments is a complete list of all securities owned by your fund. It is categorized by broad-based asset classes.
| Common Stocks - 59.4% | ||||||||
| Issuer | Shares/Par | Value ($) | ||||||
| Aerospace - 3.0% | ||||||||
| General Dynamics Corp. | 77,654 | $ | 9,869,047 | |||||
| Honeywell International, Inc. | 518,366 | 48,270,242 | ||||||
| Lockheed Martin Corp. | 365,127 | 66,737,913 | ||||||
| Northrop Grumman Corp. | 162,095 | 21,357,637 | ||||||
| Precision Castparts Corp. | 24,374 | 5,773,713 | ||||||
| United Technologies Corp. | 518,047 | 54,705,763 | ||||||
|
| |||||||
| $ | 206,714,315 | |||||||
| Airlines - 0.1% | ||||||||
| Copa Holdings S.A., “A” | 43,899 | $ | 4,709,924 | |||||
| Alcoholic Beverages - 0.4% | ||||||||
| Diageo PLC | 1,012,334 | $ | 29,270,596 | |||||
| Apparel Manufacturers - 0.2% | ||||||||
| Hanesbrands, Inc. | 100,750 | $ | 10,824,580 | |||||
| Automotive - 1.2% | ||||||||
| Delphi Automotive PLC | 414,279 | $ | 25,411,874 | |||||
| General Motors Co. | 271,510 | 8,672,029 | ||||||
| Johnson Controls, Inc. | 608,873 | 26,790,412 | ||||||
| Magna International, Inc. | 220,620 | 20,940,137 | ||||||
|
| |||||||
| $ | 81,814,452 | |||||||
| Broadcasting - 1.6% | ||||||||
| Omnicom Group, Inc. | 315,542 | $ | 21,728,222 | |||||
| Time Warner, Inc. | 400,916 | 30,152,892 | ||||||
| Twenty-First Century Fox, Inc. | 308,741 | 10,586,729 | ||||||
| Viacom, Inc., “B” | 130,030 | 10,004,508 | ||||||
| Walt Disney Co. | 397,488 | 35,388,357 | ||||||
|
| |||||||
| $ | 107,860,708 | |||||||
| Brokerage & Asset Managers - 0.9% | ||||||||
| BlackRock, Inc. | 70,902 | $ | 23,278,545 | |||||
| Franklin Resources, Inc. | 516,767 | 28,220,646 | ||||||
| NASDAQ OMX Group, Inc. | 204,526 | 8,675,993 | ||||||
|
| |||||||
| $ | 60,175,184 | |||||||
| Business Services - 1.0% | ||||||||
| Accenture PLC, “A” | 568,217 | $ | 46,207,406 | |||||
| Adecco S.A. | 100,500 | 6,781,228 | ||||||
12
Table of Contents
Portfolio of Investments – continued
| Issuer | Shares/Par | Value ($) | ||||||
| Common Stocks - continued | ||||||||
| Business Services - continued | ||||||||
| Fidelity National Information Services, Inc. | 114,275 | $ | 6,433,683 | |||||
| Fiserv, Inc. (a) | 139,331 | 9,005,659 | ||||||
|
| |||||||
| $ | 68,427,976 | |||||||
| Cable TV - 1.4% | ||||||||
| Comcast Corp., “Special A” | 1,165,421 | $ | 62,350,024 | |||||
| Time Warner Cable, Inc. | 230,339 | 33,051,343 | ||||||
|
| |||||||
| $ | 95,401,367 | |||||||
| Chemicals - 1.6% | ||||||||
| 3M Co. | 362,362 | $ | 51,339,448 | |||||
| Celanese Corp. | 139,907 | 8,187,358 | ||||||
| LyondellBasell Industries N.V., “A” | 94,650 | 10,284,669 | ||||||
| PPG Industries, Inc. | 191,605 | 37,696,368 | ||||||
|
| |||||||
| $ | 107,507,843 | |||||||
| Computer Software - 1.3% | ||||||||
| Aspen Technology, Inc. (a) | 148,370 | $ | 5,596,516 | |||||
| CA, Inc. | 273,780 | 7,649,413 | ||||||
| Citrix Systems, Inc. (a) | 197,100 | 14,061,114 | ||||||
| Microsoft Corp. | 476,200 | 22,076,632 | ||||||
| Oracle Corp. | 769,835 | 29,469,284 | ||||||
| Symantec Corp. | 436,100 | 10,252,711 | ||||||
|
| |||||||
| $ | 89,105,670 | |||||||
| Computer Software - Systems - 1.2% | ||||||||
| Apple, Inc. | 112,294 | $ | 11,313,621 | |||||
| EMC Corp. | 246,980 | 7,226,635 | ||||||
| Hewlett-Packard Co. | 405,057 | 14,367,372 | ||||||
| International Business Machines Corp. | 244,849 | 46,479,686 | ||||||
|
| |||||||
| $ | 79,387,314 | |||||||
| Construction - 0.2% | ||||||||
| Stanley Black & Decker, Inc. | 161,498 | $ | 14,339,407 | |||||
| Consumer Products - 0.7% | ||||||||
| Procter & Gamble Co. | 438,038 | $ | 36,681,302 | |||||
| Reckitt Benckiser Group PLC | 89,458 | 7,743,024 | ||||||
|
| |||||||
| $ | 44,424,326 | |||||||
| Containers - 0.2% | ||||||||
| Crown Holdings, Inc. (a) | 143,400 | $ | 6,384,168 | |||||
| Packaging Corp. of America | 86,450 | 5,517,239 | ||||||
|
| |||||||
| $ | 11,901,407 | |||||||
13
Table of Contents
Portfolio of Investments – continued
| Issuer | Shares/Par | Value ($) | ||||||
| Common Stocks - continued | ||||||||
| Electrical Equipment - 1.4% | ||||||||
| Danaher Corp. | 645,473 | $ | 49,043,039 | |||||
| Pentair PLC | 189,259 | 12,394,572 | ||||||
| Siemens AG | 82,653 | 9,851,744 | ||||||
| Tyco International Ltd. | 495,656 | 22,091,388 | ||||||
|
| |||||||
| $ | 93,380,743 | |||||||
| Electronics - 1.5% | ||||||||
| Broadcom Corp., “A” | 752,290 | $ | 30,407,562 | |||||
| Hoya Corp. | 216,100 | 7,258,832 | ||||||
| Intel Corp. | 261,240 | 9,096,377 | ||||||
| Microchip Technology, Inc. | 673,930 | 31,829,714 | ||||||
| Taiwan Semiconductor Manufacturing Co. Ltd., ADR | 455,380 | 9,189,568 | ||||||
| Texas Instruments, Inc. | 357,922 | 17,069,300 | ||||||
|
| |||||||
| $ | 104,851,353 | |||||||
| Energy - Independent - 2.0% | ||||||||
| Anadarko Petroleum Corp. | 181,381 | $ | 18,399,289 | |||||
| Apache Corp. | 235,408 | 22,097,749 | ||||||
| Canadian Natural Resources Ltd. | 171,458 | 6,659,429 | ||||||
| EOG Resources, Inc. | 54,322 | 5,378,964 | ||||||
| EQT Corp. | 106,721 | 9,769,240 | ||||||
| Marathon Petroleum Corp. | 109,240 | 9,249,351 | ||||||
| Noble Energy, Inc. | 292,274 | 19,979,851 | ||||||
| Occidental Petroleum Corp. | 308,034 | 29,617,469 | ||||||
| Valero Energy Corp. | 354,150 | 16,386,521 | ||||||
|
| |||||||
| $ | 137,537,863 | |||||||
| Energy - Integrated - 2.5% | ||||||||
| Chevron Corp. | 452,938 | $ | 54,044,562 | |||||
| Exxon Mobil Corp. | 896,107 | 84,278,863 | ||||||
| Petroleo Brasileiro S.A., ADR | 632,450 | 9,417,181 | ||||||
| Royal Dutch Shell PLC, “A” | 534,907 | 20,402,498 | ||||||
|
| |||||||
| $ | 168,143,104 | |||||||
| Engineering - Construction - 0.1% | ||||||||
| Fluor Corp. | 78,204 | $ | 5,223,245 | |||||
| Food & Beverages - 2.0% | ||||||||
| Coca-Cola Co. | 197,658 | $ | 8,432,090 | |||||
| Dr Pepper Snapple Group, Inc. | 120,571 | 7,753,921 | ||||||
| General Mills, Inc. | 802,227 | 40,472,352 | ||||||
| Groupe Danone | 252,746 | 16,873,349 | ||||||
| Ingredion, Inc. | 76,020 | 5,761,556 | ||||||
| Kellogg Co. | 61,474 | 3,786,798 | ||||||
14
Table of Contents
Portfolio of Investments – continued
| Issuer | Shares/Par | Value ($) | ||||||
| Common Stocks - continued | ||||||||
| Food & Beverages - continued | ||||||||
| Kraft Foods Group, Inc. | 39,438 | $ | 2,224,303 | |||||
| Mondelez International, Inc. | 214,975 | 7,366,118 | ||||||
| Nestle S.A. | 550,789 | 40,400,206 | ||||||
|
| |||||||
| $ | 133,070,693 | |||||||
| Food & Drug Stores - 1.4% | ||||||||
| CVS Health Corp. | 861,600 | $ | 68,574,744 | |||||
| Kroger Co. | 563,100 | 29,281,200 | ||||||
|
| |||||||
| $ | 97,855,944 | |||||||
| Gaming & Lodging - 0.2% | ||||||||
| Hilton Worldwide Holdings, Inc. (a) | 213,490 | $ | 5,258,259 | |||||
| Wynn Resorts Ltd. | 48,147 | 9,007,341 | ||||||
|
| |||||||
| $ | 14,265,600 | |||||||
| General Merchandise - 1.5% | ||||||||
| Kohl’s Corp. | 663,285 | $ | 40,480,284 | |||||
| Macy’s, Inc. | 417,930 | 24,315,167 | ||||||
| Target Corp. | 565,817 | 35,465,410 | ||||||
|
| |||||||
| $ | 100,260,861 | |||||||
| Health Maintenance Organizations - 0.1% | ||||||||
| Health Net, Inc. (a) | 112,820 | $ | 5,202,130 | |||||
| Insurance - 4.0% | ||||||||
| ACE Ltd. | 359,959 | $ | 37,748,900 | |||||
| American International Group, Inc. | 105,980 | 5,725,040 | ||||||
| Aon PLC | 278,436 | 24,410,484 | ||||||
| Chubb Corp. | 107,510 | 9,792,011 | ||||||
| Delta Lloyd N.V. | 585,760 | 14,062,734 | ||||||
| Everest Re Group Ltd. | 63,588 | 10,301,892 | ||||||
| MetLife, Inc. | 1,213,410 | 65,184,385 | ||||||
| Prudential Financial, Inc. | 404,729 | 35,591,868 | ||||||
| Travelers Cos., Inc. | 408,872 | 38,409,436 | ||||||
| Validus Holdings Ltd. | 431,520 | 16,889,693 | ||||||
| Zurich Insurance Group AG | 53,891 | 16,025,022 | ||||||
|
| |||||||
| $ | 274,141,465 | |||||||
| Internet - 0.9% | ||||||||
| Facebook, Inc., “A“ (a) | 509,190 | $ | 40,246,378 | |||||
| Google, Inc., “A” (a) | 16,845 | 9,911,766 | ||||||
| Google, Inc., “C” (a) | 16,845 | 9,725,629 | ||||||
|
| |||||||
| $ | 59,883,773 | |||||||
15
Table of Contents
Portfolio of Investments – continued
| Issuer | Shares/Par | Value ($) | ||||||
| Common Stocks - continued | ||||||||
| Leisure & Toys - 0.2% | ||||||||
| Hasbro, Inc. | 221,343 | $ | 12,172,758 | |||||
| Mattel, Inc. | 63,717 | 1,952,926 | ||||||
|
| |||||||
| $ | 14,125,684 | |||||||
| Machinery & Tools - 0.9% | ||||||||
| Caterpillar, Inc. | 53,220 | $ | 5,270,377 | |||||
| Cummins, Inc. | 149,678 | 19,754,502 | ||||||
| Eaton Corp. PLC | 316,605 | 20,063,259 | ||||||
| Illinois Tool Works, Inc. | 192,737 | 16,270,858 | ||||||
|
| |||||||
| $ | 61,358,996 | |||||||
| Major Banks - 6.8% | ||||||||
| Bank of America Corp. | 1,058,916 | $ | 18,054,518 | |||||
| Bank of New York Mellon Corp. | 983,141 | 38,077,051 | ||||||
| BOC Hong Kong Holdings Ltd. | 1,341,500 | 4,275,952 | ||||||
| Goldman Sachs Group, Inc. | 257,005 | 47,178,408 | ||||||
| HSBC Holdings PLC | 769,874 | 7,835,280 | ||||||
| JPMorgan Chase & Co. | 2,657,532 | 160,089,728 | ||||||
| Mizuho Financial Group, Inc. | 4,917,900 | 8,784,286 | ||||||
| Morgan Stanley | 340,892 | 11,784,636 | ||||||
| PNC Financial Services Group, Inc. | 194,534 | 16,648,220 | ||||||
| State Street Corp. | 386,303 | 28,435,764 | ||||||
| Sumitomo Mitsui Financial Group, Inc. | 171,400 | 6,987,275 | ||||||
| Wells Fargo & Co. | 2,148,940 | 111,465,518 | ||||||
|
| |||||||
| $ | 459,616,636 | |||||||
| Medical & Health Technology & Services - 0.5% | ||||||||
| AmerisourceBergen Corp. | 102,624 | $ | 7,932,835 | |||||
| Cardinal Health, Inc. | 66,224 | 4,961,502 | ||||||
| Express Scripts Holding Co. (a) | 300,114 | 21,197,052 | ||||||
| Quest Diagnostics, Inc. | 22,188 | 1,346,368 | ||||||
|
| |||||||
| $ | 35,437,757 | |||||||
| Medical Equipment - 2.0% | ||||||||
| Abbott Laboratories | 835,168 | $ | 34,734,637 | |||||
| Covidien PLC | 241,570 | 20,898,221 | ||||||
| Medtronic, Inc. | 384,193 | 23,800,756 | ||||||
| St. Jude Medical, Inc. | 354,327 | 21,305,683 | ||||||
| Thermo Fisher Scientific, Inc. | 298,713 | 36,353,372 | ||||||
|
| |||||||
| $ | 137,092,669 | |||||||
| Metals & Mining - 0.4% | ||||||||
| Rio Tinto PLC | 309,640 | $ | 15,217,308 | |||||
| Vale S.A., ADR | 841,400 | 9,263,814 | ||||||
|
| |||||||
| $ | 24,481,122 | |||||||
16
Table of Contents
Portfolio of Investments – continued
| Issuer | Shares/Par | Value ($) | ||||||
| Common Stocks - continued | ||||||||
| Natural Gas - Distribution - 0.2% | ||||||||
| GDF Suez | 579,695 | $ | 14,498,578 | |||||
| Natural Gas - Pipeline - 0.3% | ||||||||
| Williams Cos., Inc. | 315,785 | $ | 17,478,700 | |||||
| Oil Services - 0.4% | ||||||||
| Ensco PLC, “A” | 466,370 | $ | 19,265,745 | |||||
| Schlumberger Ltd. | 68,150 | 6,930,174 | ||||||
|
| |||||||
| $ | 26,195,919 | |||||||
| Other Banks & Diversified Financials - 1.4% | ||||||||
| American Express Co. | 86,457 | $ | 7,568,446 | |||||
| BB&T Corp. | 298,710 | 11,114,999 | ||||||
| Citigroup, Inc. | 209,660 | 10,864,581 | ||||||
| Discover Financial Services | 261,020 | 16,807,078 | ||||||
| SunTrust Banks, Inc. | 151,424 | 5,758,655 | ||||||
| U.S. Bancorp | 537,412 | 22,479,944 | ||||||
| Visa, Inc., “A” | 78,251 | 16,696,416 | ||||||
| Western Union Co. | 219,853 | 3,526,442 | ||||||
|
| |||||||
| $ | 94,816,561 | |||||||
| Pharmaceuticals - 5.2% | ||||||||
| Actavis PLC (a) | 48,960 | $ | 11,813,069 | |||||
| Bayer AG | 62,288 | 8,724,820 | ||||||
| Bristol-Myers Squibb Co. | 675,512 | 34,572,704 | ||||||
| Eli Lilly & Co. | 345,820 | 22,426,427 | ||||||
| GlaxoSmithKline PLC | 698,695 | 15,991,729 | ||||||
| Johnson & Johnson | 963,440 | 102,693,070 | ||||||
| Merck & Co., Inc. | 555,510 | 32,930,633 | ||||||
| Novartis AG | 48,430 | 4,561,045 | ||||||
| Pfizer, Inc. | 3,273,825 | 96,807,005 | ||||||
| Roche Holding AG | 13,894 | 4,114,042 | ||||||
| Valeant Pharmaceuticals International, Inc. (a) | 75,210 | 9,867,552 | ||||||
| Zoetis, Inc. | 239,220 | 8,839,179 | ||||||
|
| |||||||
| $ | 353,341,275 | |||||||
| Printing & Publishing - 0.1% | ||||||||
| McGraw-Hill Cos., Inc. | 68,917 | $ | 5,820,041 | |||||
| Moody’s Corp. | 14,471 | 1,367,510 | ||||||
| Time, Inc. (a) | 15,506 | 363,306 | ||||||
|
| |||||||
| $ | 7,550,857 | |||||||
17
Table of Contents
Portfolio of Investments – continued
| Issuer | Shares/Par | Value ($) | ||||||
| Common Stocks - continued | ||||||||
| Railroad & Shipping - 0.3% | ||||||||
| Canadian National Railway Co. | 143,438 | $ | 10,178,360 | |||||
| Union Pacific Corp. | 69,404 | 7,524,782 | ||||||
|
| |||||||
| $ | 17,703,142 | |||||||
| Real Estate - 0.5% | ||||||||
| Annaly Mortgage Management, Inc., REIT | 370,310 | $ | 3,954,911 | |||||
| Corio N.V., REIT | 69,890 | 3,427,260 | ||||||
| EPR Properties, REIT | 98,370 | 4,985,392 | ||||||
| Medical Properties Trust, Inc., REIT | 422,000 | 5,173,720 | ||||||
| Starwood Property Trust, Inc., REIT | 296,390 | 6,508,724 | ||||||
| Washington Prime Group, Inc. REIT | 772,890 | 13,510,117 | ||||||
|
| |||||||
| $ | 37,560,124 | |||||||
| Restaurants - 0.5% | ||||||||
| McDonald’s Corp. | 210,551 | $ | 19,962,334 | |||||
| YUM! Brands, Inc. | 158,380 | 11,400,192 | ||||||
|
| |||||||
| $ | 31,362,526 | |||||||
| Specialty Chemicals - 0.3% | ||||||||
| FMC Corp. | 72,044 | $ | 4,120,196 | |||||
| Marine Harvest A.S.A. | 526,700 | 7,377,387 | ||||||
| Praxair, Inc. | 50,036 | 6,454,644 | ||||||
| Valspar Corp. | 16,800 | 1,327,032 | ||||||
|
| |||||||
| $ | 19,279,259 | |||||||
| Specialty Stores - 0.3% | ||||||||
| Advance Auto Parts, Inc. | 60,611 | $ | 7,897,613 | |||||
| Bed Bath & Beyond, Inc. (a) | 49,700 | 3,271,751 | ||||||
| Staples, Inc. | 873,939 | 10,574,662 | ||||||
|
| |||||||
| $ | 21,744,026 | |||||||
| Telecommunications - Wireless - 0.1% | ||||||||
| Vodafone Group PLC | 2,290,342 | $ | 7,549,715 | |||||
| Telephone Services - 1.9% | ||||||||
| AT&T, Inc. | 313,756 | $ | 11,056,761 | |||||
| Bezeq - The Israel Telecommunication Corp. Ltd. | 854,610 | 1,476,038 | ||||||
| CenturyLink, Inc. | 299,620 | 12,251,462 | ||||||
| Frontier Communications Corp. (l) | 3,966,530 | 25,822,110 | ||||||
| TDC A.S. | 1,091,566 | 8,264,332 | ||||||
| Telecom Italia S.p.A. | 6,115,113 | 5,419,623 | ||||||
| Telefonica Brasil S.A., ADR (l) | 283,210 | 5,573,573 | ||||||
| Verizon Communications, Inc. | 1,162,615 | 58,119,124 | ||||||
| Windstream Holdings, Inc. (l) | 421,180 | 4,540,320 | ||||||
|
| |||||||
| $ | 132,523,343 | |||||||
18
Table of Contents
Portfolio of Investments – continued
| Issuer | Shares/Par | Value ($) | ||||||
| Common Stocks - continued | ||||||||
| Tobacco - 2.7% | ||||||||
| Altria Group, Inc. | 559,170 | $ | 25,688,270 | |||||
| Imperial Tobacco Group PLC | 64,521 | 2,775,434 | ||||||
| Japan Tobacco, Inc. | 448,100 | 14,573,720 | ||||||
| Lorillard, Inc. | 589,105 | 35,293,281 | ||||||
| Philip Morris International, Inc. | 1,245,116 | 103,842,674 | ||||||
|
| |||||||
| $ | 182,173,379 | |||||||
| Trucking - 0.4% | ||||||||
| United Parcel Service, Inc., “B” | 303,235 | $ | 29,804,968 | |||||
| Utilities - Electric Power - 1.4% | ||||||||
| American Electric Power Co., Inc. | 318,240 | $ | 16,615,310 | |||||
| Duke Energy Corp. | 138,260 | 10,337,700 | ||||||
| E.ON AG | 668,538 | 12,239,533 | ||||||
| Edison International | 174,291 | 9,746,353 | ||||||
| NRG Energy, Inc. | 281,041 | 8,566,130 | ||||||
| PG&E Corp. | 197,506 | 8,895,670 | ||||||
| PPL Corp. | 730,173 | 23,978,881 | ||||||
| Public Service Enterprise Group, Inc. | 192,594 | 7,172,201 | ||||||
|
| |||||||
| $ | 97,551,778 | |||||||
| Total Common Stocks (Identified Cost, $2,830,363,858) | $ | 4,028,928,857 | ||||||
| Bonds - 38.7% | ||||||||
| Agency - Other - 0.1% | ||||||||
| Financing Corp., 9.65%, 11/02/18 | $ | 2,850,000 | $ | 3,743,070 | ||||
| Asset-Backed & Securitized - 2.2% | ||||||||
| Bayview Financial Revolving Mortgage Loan Trust, FRN, 1.752%, 12/28/40 (z) | $ | 6,051,591 | $ | 3,609,734 | ||||
| BlackRock Capital Finance LP, 7.75%, 9/25/26 (z) | 540,963 | 68,421 | ||||||
| Cent LP, 2013-17A, “A1”, CLO, FRN, 1.536%, 1/30/25 (z) | 5,792,000 | 5,742,670 | ||||||
| Citigroup/Deutsche Bank Commercial Mortgage Trust, 5.322%, 12/11/49 | 7,105,112 | 7,590,263 | ||||||
| Credit Suisse Mortgage Capital Certificate, FRN, 5.695%, 9/15/40 | 11,759,829 | 12,773,620 | ||||||
| Dryden Senior Loan Fund, 2013-26A, “A”, CLO, FRN, 1.334%, 7/15/25 (z) | 7,443,000 | 7,335,300 | ||||||
| Ford Credit Auto Owner Trust, 2014-1,“A”, 2.26%, 11/15/25 (n) | 3,369,000 | 3,366,362 | ||||||
| GMAC Mortgage Corp. Loan Trust, FRN, 5.805%, 10/25/36 | 2,612,470 | 2,493,655 | ||||||
| Goldman Sachs Mortgage Securities Corp., FRN, 5.991%, 8/10/45 | 19,672,058 | 21,483,875 | ||||||
19
Table of Contents
Portfolio of Investments – continued
| Issuer | Shares/Par | Value ($) | ||||||
| Bonds - continued | ||||||||
| Asset-Backed & Securitized - continued | ||||||||
| ING Investment Management Ltd., 2013-2A, “A1”, CLO, FRN, 1.384%, 4/25/25 (z) | $ | 6,757,000 | $ | 6,669,774 | ||||
| JPMorgan Chase Commercial Mortgage Securities Corp., 4.78%, 7/15/42 | 828,000 | 844,601 | ||||||
| JPMorgan Chase Commercial Mortgage Securities Corp., “A3”, FRN, 5.929%, 2/15/51 | 1,275,947 | 1,279,134 | ||||||
| JPMorgan Chase Commercial Mortgage Securities Corp., “A4”, FRN, 5.981%, 6/15/49 | 13,257,080 | 14,361,488 | ||||||
| JPMorgan Chase Commercial Mortgage Securities Corp., FRN, 4.948%, 9/12/37 | 1,200,000 | 1,235,633 | ||||||
| Merrill Lynch Mortgage Trust, “A3”, FRN, 6.028%, 6/12/50 | 905,860 | 907,194 | ||||||
| Merrill Lynch/Countrywide Commercial Mortgage Trust, FRN, 5.81%, 6/12/50 | 22,737,134 | 24,737,911 | ||||||
| Morgan Stanley Capital I, Inc., FRN, 0.938%, 11/15/30 (i)(n) | 13,010,386 | 327,797 | ||||||
| Race Point CLO Ltd., “A1A”, FRN, 0.44%, 8/01/21 (n) | 3,311,539 | 3,289,431 | ||||||
| Residential Funding Mortgage Securities, Inc., FRN, 5.32%, 12/25/35 | 6,030,093 | 4,891,931 | ||||||
| Wachovia Bank Commercial Mortgage Trust, “A4”, FRN, 6.14%, 2/15/51 | 9,386,275 | 10,117,850 | ||||||
| Wachovia Bank Commercial Mortgage Trust, FRN, 5.933%, 6/15/49 | 13,568,423 | 14,676,841 | ||||||
|
| |||||||
| $ | 147,803,485 | |||||||
| Automotive - 0.2% | ||||||||
| Nissan Motor Acceptance Corp., 2.35%, 3/04/19 (n) | $ | 2,097,000 | $ | 2,099,890 | ||||
| Toyota Motor Credit Corp., 3.2%, 6/17/15 | 3,480,000 | 3,549,819 | ||||||
| Toyota Motor Credit Corp., 3.4%, 9/15/21 | 4,890,000 | 5,065,820 | ||||||
| Volkswagen International Finance N.V., 2.375%, 3/22/17 (n) | 4,856,000 | 4,982,790 | ||||||
|
| |||||||
| $ | 15,698,319 | |||||||
| Broadcasting - 0.2% | ||||||||
| Discovery Communications, Inc., 4.875%, 4/01/43 | $ | 3,740,000 | $ | 3,700,681 | ||||
| Grupo Televisa S.A.B., 5%, 5/13/45 | 1,839,000 | 1,816,730 | ||||||
| News America, Inc., 8.5%, 2/23/25 | 5,903,000 | 7,881,172 | ||||||
|
| |||||||
| $ | 13,398,583 | |||||||
| Cable TV - 0.3% | ||||||||
| Comcast Corp., 2.85%, 1/15/23 | $ | 6,030,000 | $ | 5,908,435 | ||||
| DIRECTV Holdings LLC, 4.6%, 2/15/21 | 3,220,000 | 3,499,387 | ||||||
| Time Warner Entertainment Co. LP, 8.375%, 7/15/33 | 7,170,000 | 10,591,022 | ||||||
|
| |||||||
| $ | 19,998,844 | |||||||
| Computer Software - Systems - 0.0% | ||||||||
| Apple, Inc., 3.85%, 5/04/43 | $ | 2,060,000 | $ | 1,910,116 | ||||
20
Table of Contents
Portfolio of Investments – continued
| Issuer | Shares/Par | Value ($) | ||||||
| Bonds - continued | ||||||||
| Conglomerates - 0.1% | ||||||||
| ABB Finance (USA), Inc., 2.875%, 5/08/22 | $ | 1,772,000 | $ | 1,751,349 | ||||
| General Electric Co., 2.7%, 10/09/22 | 5,120,000 | 4,983,491 | ||||||
| United Technologies Corp., 3.1%, 6/01/22 | 2,450,000 | 2,448,645 | ||||||
|
| |||||||
| $ | 9,183,485 | |||||||
| Consumer Products - 0.1% | ||||||||
| Reckitt Benckiser Treasury Services PLC, 3.625%, 9/21/23 (n) | $ | 6,003,000 | $ | 6,135,606 | ||||
| Defense Electronics - 0.1% | ||||||||
| BAE Systems Holdings, Inc., 5.2%, 8/15/15 (n) | $ | 3,942,000 | $ | 4,097,354 | ||||
| Emerging Market Quasi-Sovereign - 0.3% | ||||||||
| CNOOC Finance (2012) Ltd., 3.875%, 5/02/22 (n) | $ | 5,880,000 | $ | 5,890,290 | ||||
| Corporacion Nacional del Cobre de Chile, 3.75%, 11/04/20 (n) | 1,789,000 | 1,837,210 | ||||||
| Petroleos Mexicanos, 3.125%, 1/23/19 (z) | 2,358,000 | 2,416,950 | ||||||
| Petroleos Mexicanos, 8%, 5/03/19 | 4,145,000 | 5,034,103 | ||||||
| Ras Laffan Liquefied Natural Gas Co. Ltd., 5.832%, 9/30/16 (n) | 2,402,860 | 2,536,123 | ||||||
| State Grid Overseas Investment (2014) Ltd., 2.75%, 5/07/19 (z) | 5,329,000 | 5,340,079 | ||||||
|
| |||||||
| $ | 23,054,755 | |||||||
| Emerging Market Sovereign - 0.1% | ||||||||
| Republic of Peru, 7.35%, 7/21/25 | $ | 551,000 | $ | 717,678 | ||||
| United Mexican States, 4.75%, 3/08/44 | 7,817,000 | 7,758,373 | ||||||
|
| |||||||
| $ | 8,476,051 | |||||||
| Energy - Independent - 0.1% | ||||||||
| Apache Corp., 3.25%, 4/15/22 | $ | 2,382,000 | $ | 2,386,990 | ||||
| Apache Corp., 4.75%, 4/15/43 | 1,827,000 | 1,825,789 | ||||||
| EOG Resources, Inc., 2.625%, 3/15/23 | 1,718,000 | 1,639,470 | ||||||
| Hess Corp., 8.125%, 2/15/19 | 1,740,000 | 2,144,955 | ||||||
|
| |||||||
| $ | 7,997,204 | |||||||
| Energy - Integrated - 0.6% | ||||||||
| BP Capital Markets PLC, 4.5%, 10/01/20 | $ | 1,661,000 | $ | 1,814,113 | ||||
| BP Capital Markets PLC, 4.742%, 3/11/21 | 4,892,000 | 5,397,221 | ||||||
| Husky Energy, Inc., 7.25%, 12/15/19 | 4,453,000 | 5,422,841 | ||||||
| Petro-Canada, 6.05%, 5/15/18 | 9,475,000 | 10,804,371 | ||||||
| Total Capital International S.A., 1.55%, 6/28/17 | 7,071,000 | 7,121,409 | ||||||
| Total Capital International S.A., 3.75%, 4/10/24 | 6,370,000 | 6,540,659 | ||||||
|
| |||||||
| $ | 37,100,614 | |||||||
| Financial Institutions - 0.1% | ||||||||
| General Electric Capital Corp., 2.3%, 1/14/19 | $ | 5,500,000 | $ | 5,554,214 | ||||
| General Electric Capital Corp., 3.1%, 1/09/23 | 3,339,000 | 3,304,568 | ||||||
|
| |||||||
| $ | 8,858,782 | |||||||
21
Table of Contents
Portfolio of Investments – continued
| Issuer | Shares/Par | Value ($) | ||||||
| Bonds - continued | ||||||||
| Food & Beverages - 0.3% | ||||||||
| Anheuser-Busch InBev S.A., 8%, 11/15/39 | $ | 5,850,000 | $ | 8,730,821 | ||||
| Conagra Foods, Inc., 3.2%, 1/25/23 | 2,123,000 | 2,036,127 | ||||||
| Diageo Capital PLC, 2.625%, 4/29/23 | 6,190,000 | 5,895,257 | ||||||
| Kraft Foods Group, Inc., 3.5%, 6/06/22 | 2,361,000 | 2,389,863 | ||||||
| Kraft Foods Group, Inc., 5%, 6/04/42 | 2,130,000 | 2,226,815 | ||||||
| Wm. Wrigley Jr. Co., 2.4%, 10/21/18 (n) | 1,411,000 | 1,421,041 | ||||||
|
| |||||||
| $ | 22,699,924 | |||||||
| Insurance - 0.2% | ||||||||
| American International Group, Inc., 4.875%, 6/01/22 | $ | 10,460,000 | $ | 11,505,205 | ||||
| Insurance - Health - 0.1% | ||||||||
| WellPoint, Inc., 3.3%, 1/15/23 | $ | 3,410,000 | $ | 3,371,416 | ||||
| Insurance - Property & Casualty - 0.4% | ||||||||
| ACE Ltd., 2.7%, 3/13/23 | $ | 5,960,000 | $ | 5,724,777 | ||||
| Allstate Corp., 5.75%, 8/15/53 | 1,774,000 | 1,889,310 | ||||||
| Chubb Corp., 6.375% to 4/15/17, FRN to 3/29/67 | 8,200,000 | 8,989,250 | ||||||
| Liberty Mutual Group, Inc., 4.25%, 6/15/23 (n) | 3,278,000 | 3,350,185 | ||||||
| Marsh & McLennan Cos., Inc., 4.8%, 7/15/21 | 5,360,000 | 5,902,528 | ||||||
| ZFS Finance USA Trust V, 6.5% to 5/09/17, FRN to 5/09/67 (n) | 2,925,000 | 3,144,375 | ||||||
|
| |||||||
| $ | 29,000,425 | |||||||
| International Market Quasi-Sovereign - 0.3% | ||||||||
| Achmea Hypotheekbank N.V., 3.2%, 11/03/14 (n) | $ | 394,000 | $ | 394,969 | ||||
| KFW International Finance, Inc., 4.875%, 6/17/19 | 7,250,000 | 8,246,397 | ||||||
| Temasek Financial I Ltd., 2.375%, 1/23/23 (n) | 10,140,000 | 9,716,442 | ||||||
|
| |||||||
| $ | 18,357,808 | |||||||
| International Market Sovereign - 0.1% | ||||||||
| Republic of Iceland, 4.875%, 6/16/16 (n) | $ | 5,610,000 | $ | 5,839,337 | ||||
| Internet - 0.1% | ||||||||
| Baidu, Inc., 3.5%, 11/28/22 | $ | 6,460,000 | $ | 6,282,486 | ||||
| Local Authorities - 0.1% | ||||||||
| New Jersey Turnpike Authority Rev. (Build America Bonds), “F”, 7.414%, 1/01/40 | $ | 5,815,000 | $ | 8,328,185 | ||||
| Machinery & Tools - 0.1% | ||||||||
| Atlas Copco AB, 5.6%, 5/22/17 (n) | $ | 5,970,000 | $ | 6,583,262 | ||||
| Major Banks - 2.0% | ||||||||
| Banco Santander U.S. Debt S.A.U., 3.781%, 10/07/15 (n) | $ | 2,600,000 | $ | 2,671,302 | ||||
| Bank of America Corp., 5.49%, 3/15/19 | 4,135,000 | 4,564,866 | ||||||
22
Table of Contents
Portfolio of Investments – continued
| Issuer | Shares/Par | Value ($) | ||||||
| Bonds - continued | ||||||||
| Major Banks - continued | ||||||||
| Bank of America Corp., 7.625%, 6/01/19 | $ | 3,980,000 | $ | 4,808,067 | ||||
| Bank of America Corp., 4.1%, 7/24/23 | 7,970,000 | 8,136,549 | ||||||
| Bank of America Corp., 4.125%, 1/22/24 | 10,657,000 | 10,860,613 | ||||||
| BNP Paribas, 7.195% to 6/29/37, FRN to 6/29/49 (n) | 3,200,000 | 3,720,000 | ||||||
| Commonwealth Bank of Australia, 5%, 10/15/19 (n) | 3,930,000 | 4,386,438 | ||||||
| Credit Suisse Group AG, 6.5%, 8/08/23 (n) | 6,960,000 | 7,569,348 | ||||||
| Goldman Sachs Group, Inc., 5.625%, 1/15/17 | 7,504,000 | 8,149,427 | ||||||
| HSBC Holdings PLC, 5.1%, 4/05/21 | 3,688,000 | 4,150,110 | ||||||
| HSBC Holdings PLC, 5.25%, 3/14/44 | 1,394,000 | 1,479,947 | ||||||
| ING Bank N.V., 3.75%, 3/07/17 (n) | 4,761,000 | 5,009,139 | ||||||
| ING Bank N.V., 5.8%, 9/25/23 (n) | 6,238,000 | 6,871,251 | ||||||
| JPMorgan Chase & Co., 6.3%, 4/23/19 | 6,750,000 | 7,829,555 | ||||||
| JPMorgan Chase & Co., 3.25%, 9/23/22 | 1,884,000 | 1,854,331 | ||||||
| JPMorgan Chase & Co., 3.2%, 1/25/23 | 7,972,000 | 7,782,107 | ||||||
| JPMorgan Chase & Co., 3.875%, 2/01/24 | 7,865,000 | 8,054,987 | ||||||
| Morgan Stanley, 3.875%, 4/29/24 | 6,520,000 | 6,513,239 | ||||||
| Morgan Stanley, 6.625%, 4/01/18 | 11,740,000 | 13,444,930 | ||||||
| PNC Funding Corp., 5.625%, 2/01/17 | 6,510,000 | 7,096,766 | ||||||
| Royal Bank of Scotland PLC, 2.55%, 9/18/15 | 1,405,000 | 1,425,835 | ||||||
| Wells Fargo & Co., 2.1%, 5/08/17 | 6,600,000 | 6,731,182 | ||||||
| Wells Fargo & Co., 5.9% to 6/15/24, FRN to 12/29/49 | 3,543,000 | 3,609,431 | ||||||
|
| |||||||
| $ | 136,719,420 | |||||||
| Medical & Health Technology & Services - 0.2% | ||||||||
| CareFusion Corp., 6.375%, 8/01/19 | $ | 6,240,000 | $ | 7,197,821 | ||||
| Express Scripts Holding Co., 2.65%, 2/15/17 | 7,200,000 | 7,403,832 | ||||||
|
| |||||||
| $ | 14,601,653 | |||||||
| Metals & Mining - 0.2% | ||||||||
| Freeport-McMoRan Copper & Gold, Inc., 3.875%, 3/15/23 | $ | 5,930,000 | $ | 5,848,836 | ||||
| Rio Tinto Finance (USA) PLC, 3.5%, 3/22/22 | 5,540,000 | 5,620,934 | ||||||
|
| |||||||
| $ | 11,469,770 | |||||||
| Midstream - 0.4% | ||||||||
| Energy Transfer Partners LP, 3.6%, 2/01/23 | $ | 3,288,000 | $ | 3,200,542 | ||||
| Energy Transfer Partners LP, 4.9%, 2/01/24 | 2,630,000 | 2,748,981 | ||||||
| Enterprise Products Operating LP, 6.5%, 1/31/19 | 5,184,000 | 6,073,056 | ||||||
| Kinder Morgan Energy Partners LP, 4.15%, 2/01/24 | 5,700,000 | 5,629,075 | ||||||
| Kinder Morgan Energy Partners LP, 7.75%, 3/15/32 | 2,520,000 | 3,162,572 | ||||||
| Kinder Morgan Energy Partners LP, 5.4%, 9/01/44 | 1,888,000 | 1,856,555 | ||||||
| Spectra Energy Capital LLC, 8%, 10/01/19 | 5,327,000 | 6,590,277 | ||||||
|
| |||||||
| $ | 29,261,058 | |||||||
23
Table of Contents
Portfolio of Investments – continued
| Issuer | Shares/Par | Value ($) | ||||||
| Bonds - continued | ||||||||
| Mortgage-Backed - 11.1% | ||||||||
| Fannie Mae, 2.62%, 5/01/23 | $ | 683,752 | $ | 674,082 | ||||
| Fannie Mae, 3.5%, 7/01/43 | 11,803,404 | 12,080,848 | ||||||
| Fannie Mae, 4.96%, 1/01/15 | 84,881 | 84,770 | ||||||
| Fannie Mae, 4.877%, 4/01/15 | 1,533,517 | 1,546,904 | ||||||
| Fannie Mae, 4.78%, 8/01/15 | 2,120,289 | 2,161,354 | ||||||
| Fannie Mae, 4.856%, 8/01/15 | 592,322 | 603,607 | ||||||
| Fannie Mae, 5.19%, 11/01/15 | 1,233,102 | 1,272,755 | ||||||
| Fannie Mae, 5.662%, 2/01/16 | 1,123,172 | 1,171,342 | ||||||
| Fannie Mae, 5.732%, 7/01/16 | 1,831,647 | 1,949,241 | ||||||
| Fannie Mae, 5.09%, 12/01/16 | 1,954,140 | 2,101,000 | ||||||
| Fannie Mae, 5.05%, 1/01/17 | 2,335,174 | 2,478,026 | ||||||
| Fannie Mae, 6%, 1/01/17 - 7/01/37 | 24,111,719 | 27,059,965 | ||||||
| Fannie Mae, 5.5%, 11/01/17 - 4/01/40 | 42,923,539 | 47,880,535 | ||||||
| Fannie Mae, 3.8%, 2/01/18 | 766,975 | 816,722 | ||||||
| Fannie Mae, 3.91%, 2/01/18 | 1,140,589 | 1,211,585 | ||||||
| Fannie Mae, 5%, 2/01/18 - 3/01/41 | 27,904,855 | 30,677,963 | ||||||
| Fannie Mae, 4.5%, 6/01/18 - 4/01/44 | 49,473,208 | 53,482,083 | ||||||
| Fannie Mae, 3.849%, 7/01/18 | 1,395,439 | 1,486,468 | ||||||
| Fannie Mae, 2.578%, 9/25/18 | 4,000,000 | 4,088,436 | ||||||
| Fannie Mae, 4.6%, 9/01/19 | 750,842 | 824,031 | ||||||
| Fannie Mae, 4.88%, 3/01/20 | 428,431 | 465,903 | ||||||
| Fannie Mae, 2.67%, 3/01/22 | 957,419 | 959,478 | ||||||
| Fannie Mae, 2.73%, 4/01/23 | 683,400 | 679,261 | ||||||
| Fannie Mae, 2.41%, 5/01/23 | 1,036,353 | 1,006,302 | ||||||
| Fannie Mae, 2.55%, 5/01/23 | 977,049 | 958,413 | ||||||
| Fannie Mae, 2.59%, 5/01/23 | 1,021,499 | 1,004,450 | ||||||
| Fannie Mae, 3%, 3/01/27 - 4/01/27 | 4,130,989 | 4,269,439 | ||||||
| Fannie Mae, 2.5%, 2/01/28 - 5/01/28 | 3,933,957 | 3,979,898 | ||||||
| Fannie Mae, 6.5%, 6/01/31 - 7/01/37 | 8,525,319 | 9,819,495 | ||||||
| Fannie Mae, 4%, 2/01/41 | 1,813,293 | 1,913,528 | ||||||
| Fannie Mae, 3.5%, 11/01/41 - 6/01/43 | 11,709,444 | 12,000,334 | ||||||
| Fannie Mae, 3.5%, 4/01/43 - 9/01/43 | 46,412,655 | 47,504,932 | ||||||
| Fannie Mae, TBA, 3%, 10/01/29 | 30,743,000 | 31,665,290 | ||||||
| Fannie Mae, TBA, 4%, 10/01/44 - 11/01/44 | 105,046,000 | 110,673,788 | ||||||
| Fannie Mae, TBA, 4.5%, 10/25/44 | 7,690,000 | 8,296,789 | ||||||
| Freddie Mac, 3.034%, 10/25/20 | 1,781,000 | 1,844,129 | ||||||
| Freddie Mac, 6%, 4/01/16 - 6/01/37 | 13,644,174 | 15,415,118 | ||||||
| Freddie Mac, 3.882%, 11/25/17 | 2,574,445 | 2,745,826 | ||||||
| Freddie Mac, 5%, 12/01/17 - 7/01/39 | 16,619,308 | 18,263,079 | ||||||
| Freddie Mac, 3.154%, 2/25/18 | 712,000 | 746,662 | ||||||
| Freddie Mac, 2.412%, 8/25/18 | 1,963,000 | 2,004,519 | ||||||
| Freddie Mac, 4.5%, 1/01/19 - 10/01/39 | 11,010,293 | 11,815,677 | ||||||
| Freddie Mac, 5.5%, 1/01/19 - 10/01/35 | 11,987,702 | 13,324,682 | ||||||
24
Table of Contents
Portfolio of Investments – continued
| Issuer | Shares/Par | Value ($) | ||||||
| Bonds - continued | ||||||||
| Mortgage-Backed - continued | ||||||||
| Freddie Mac, 5.085%, 3/25/19 | $ | 6,789,000 | $ | 7,624,366 | ||||
| Freddie Mac, 1.869%, 11/25/19 | 2,200,000 | 2,166,875 | ||||||
| Freddie Mac, 2.313%, 3/25/20 | 600,000 | 601,663 | ||||||
| Freddie Mac, 3.808%, 8/25/20 | 5,900,000 | 6,330,576 | ||||||
| Freddie Mac, 2.682%, 10/25/22 | 1,960,000 | 1,943,691 | ||||||
| Freddie Mac, 3.32%, 2/25/23 | 1,059,000 | 1,095,127 | ||||||
| Freddie Mac, 3.458%, 8/25/23 | 5,373,000 | 5,593,529 | ||||||
| Freddie Mac, 6.5%, 5/01/34 - 7/01/37 | 4,816,078 | 5,534,750 | ||||||
| Freddie Mac, 4%, 11/01/40 - 11/01/43 | 28,259,642 | 29,792,556 | ||||||
| Freddie Mac, 3.5%, 2/01/42 - 8/01/43 | 29,160,498 | 29,861,474 | ||||||
| Freddie Mac, 3%, 4/01/43 - 7/01/43 | 33,223,350 | 32,955,610 | ||||||
| Freddie Mac, TBA, 4%, 10/01/44 | 19,172,000 | 20,184,512 | ||||||
| Ginnie Mae, 4.5%, 6/20/41 | 1,538,863 | 1,675,976 | ||||||
| Ginnie Mae, 4%, 2/20/42 | 4,668,621 | 4,957,987 | ||||||
| Ginnie Mae, 3%, 2/15/43 - 6/20/43 | 12,266,844 | 12,384,647 | ||||||
| Ginnie Mae, 6%, 9/15/32 - 1/15/38 | 6,866,703 | 7,905,139 | ||||||
| Ginnie Mae, 5.5%, 12/15/32 - 4/20/35 | 6,658,182 | 7,426,552 | ||||||
| Ginnie Mae, 4.5%, 7/15/33 - 10/20/43 | 23,132,331 | 25,200,125 | ||||||
| Ginnie Mae, 5%, 7/20/33 - 10/15/34 | 2,130,076 | 2,360,632 | ||||||
| Ginnie Mae, 4%, 1/20/41 - 4/20/41 | 15,450,948 | 16,444,607 | ||||||
| Ginnie Mae, 3.5%, 12/15/41 - 7/20/43 | 30,619,165 | 31,717,018 | ||||||
| Ginnie Mae, 3%, 7/20/43 | 5,008,228 | 5,051,183 | ||||||
|
| |||||||
| $ | 753,817,304 | |||||||
| Network & Telecom - 0.3% | ||||||||
| Verizon Communications, Inc., 6.4%, 9/15/33 | $ | 7,225,000 | $ | 8,801,625 | ||||
| Verizon Communications, Inc., 6.55%, 9/15/43 | 10,620,000 | 13,268,543 | ||||||
|
| |||||||
| $ | 22,070,168 | |||||||
| Oil Services - 0.0% | ||||||||
| Transocean, Inc., 3.8%, 10/15/22 | $ | 2,855,000 | $ | 2,620,290 | ||||
| Oils - 0.1% | ||||||||
| Marathon Petroleum Corp., 3.625%, 9/15/24 | $ | 7,085,000 | $ | 6,935,216 | ||||
| Other Banks & Diversified Financials - 1.0% | ||||||||
| American Express Co., 5.5%, 9/12/16 | $ | 6,317,000 | $ | 6,855,916 | ||||
| Banco Bradesco S.A., 6.75%, 9/29/19 (n) | 3,383,000 | 3,788,960 | ||||||
| Banco de Credito del Peru, 5.375%, 9/16/20 | 4,872,000 | 5,249,580 | ||||||
| Bank of Tokyo-Mitsubishi UFJ Ltd., 4.1%, 9/09/23 (n) | 4,960,000 | 5,269,598 | ||||||
| BBVA Bancomer S.A. de C.V., 6.75%, 9/30/22 (n) | 4,730,000 | 5,297,600 | ||||||
| Capital One Financial Corp., 6.15%, 9/01/16 | 8,680,000 | 9,484,297 | ||||||
| Citigroup, Inc., 2.5%, 9/26/18 | 10,880,000 | 10,950,764 | ||||||
25
Table of Contents
Portfolio of Investments – continued
| Issuer | Shares/Par | Value ($) | ||||||
| Bonds - continued | ||||||||
| Other Banks & Diversified Financials - continued | ||||||||
| Discover Bank, 4.2%, 8/08/23 | $ | 4,000,000 | $ | 4,141,076 | ||||
| Groupe BPCE S.A., 12.5% to 8/06/19, FRN to 8/29/49 (n) | 5,168,000 | 7,015,560 | ||||||
| SunTrust Banks, Inc., 2.35%, 11/01/18 | 2,541,000 | 2,547,088 | ||||||
| Swedbank AB, 2.125%, 9/29/17 (n) | 1,317,000 | 1,330,021 | ||||||
| U.S. Bancorp, 3.7%, 1/30/24 | 4,692,000 | 4,837,386 | ||||||
|
| |||||||
| $ | 66,767,846 | |||||||
| Pharmaceuticals - 0.5% | ||||||||
| AbbVie, Inc., 1.2%, 11/06/15 | $ | 10,860,000 | $ | 10,900,866 | ||||
| Gilead Sciences, Inc., 3.7%, 4/01/24 | 1,862,000 | 1,901,919 | ||||||
| Hospira, Inc., 6.05%, 3/30/17 | 5,813,000 | 6,349,209 | ||||||
| Roche Holdings, Inc., 6%, 3/01/19 (n) | 3,564,000 | 4,130,334 | ||||||
| Teva Pharmaceutical Finance IV LLC, 3.65%, 11/10/21 | 7,330,000 | 7,450,249 | ||||||
|
| |||||||
| $ | 30,732,577 | |||||||
| Real Estate - Apartment - 0.1% | ||||||||
| ERP Operating LP, REIT, 5.375%, 8/01/16 | $ | 1,460,000 | $ | 1,576,415 | ||||
| ERP Operating LP, REIT, 4.625%, 12/15/21 | 5,212,000 | 5,685,823 | ||||||
|
| |||||||
| $ | 7,262,238 | |||||||
| Real Estate - Healthcare - 0.1% | ||||||||
| HCP, Inc., REIT, 5.375%, 2/01/21 | $ | 4,146,000 | $ | 4,626,463 | ||||
| Real Estate - Office - 0.0% | ||||||||
| Boston Properties, Inc., REIT, 5%, 6/01/15 | $ | 2,006,000 | $ | 2,064,926 | ||||
| Real Estate - Retail - 0.1% | ||||||||
| Simon Property Group, Inc., REIT, 4.375%, 3/01/21 | $ | 4,500,000 | $ | 4,901,823 | ||||
| Retailers - 0.4% | ||||||||
| Gap, Inc., 5.95%, 4/12/21 | $ | 3,740,000 | $ | 4,253,360 | ||||
| Home Depot, Inc., 3.75%, 2/15/24 | 3,600,000 | 3,750,343 | ||||||
| Home Depot, Inc., 5.95%, 4/01/41 | 1,578,000 | 1,965,836 | ||||||
| Limited Brands, Inc., 5.25%, 11/01/14 | 2,262,000 | 2,266,524 | ||||||
| Wal-Mart Stores, Inc., 5.25%, 9/01/35 | 12,347,000 | 14,262,761 | ||||||
|
| |||||||
| $ | 26,498,824 | |||||||
| Supermarkets - 0.1% | ||||||||
| The Kroger Co., 4%, 2/01/24 | $ | 8,000,000 | $ | 8,209,800 | ||||
| Supranational - 0.1% | ||||||||
| Asian Development Bank, 1.125%, 3/15/17 | $ | 3,322,000 | $ | 3,334,753 | ||||
26
Table of Contents
Portfolio of Investments – continued
| Issuer | Shares/Par | Value ($) | ||||||
| Bonds - continued | ||||||||
| Telecommunications - Wireless - 0.3% | ||||||||
| American Tower Trust I, REIT, 3.07%, 3/15/23 (n) | $ | 5,960,000 | $ | 5,850,860 | ||||
| Crown Castle Towers LLC, 6.113%, 1/15/20 (n) | 3,852,000 | 4,455,897 | ||||||
| Crown Castle Towers LLC, 4.883%, 8/15/20 (n) | 2,040,000 | 2,248,588 | ||||||
| Rogers Communications, Inc., 6.8%, 8/15/18 | 8,529,000 | 9,986,120 | ||||||
|
| |||||||
| $ | 22,541,465 | |||||||
| Tobacco - 0.2% | ||||||||
| Altria Group, Inc., 2.85%, 8/09/22 | $ | 6,040,000 | $ | 5,785,329 | ||||
| B.A.T. International Finance PLC, 3.25%, 6/07/22 (n) | 5,833,000 | 5,816,014 | ||||||
|
| |||||||
| $ | 11,601,343 | |||||||
| Transportation - Services - 0.1% | ||||||||
| ERAC USA Finance Co., 7%, 10/15/37 (n) | $ | 6,381,000 | $ | 8,427,897 | ||||
| U.S. Government Agencies and Equivalents - 0.3% | ||||||||
| Aid-Egypt, 4.45%, 9/15/15 | $ | 9,559,000 | $ | 9,936,810 | ||||
| Small Business Administration, 4.35%, 7/01/23 | 481,180 | 505,755 | ||||||
| Small Business Administration, 4.77%, 4/01/24 | 1,435,997 | 1,517,760 | ||||||
| Small Business Administration, 5.18%, 5/01/24 | 2,421,649 | 2,606,671 | ||||||
| Small Business Administration, 5.52%, 6/01/24 | 1,227,373 | 1,333,850 | ||||||
| Small Business Administration, 4.99%, 9/01/24 | 1,917,977 | 2,066,337 | ||||||
| Small Business Administration, 4.95%, 3/01/25 | 1,741,073 | 1,879,719 | ||||||
|
| |||||||
| $ | 19,846,902 | |||||||
| U.S. Treasury Obligations - 14.2% | ||||||||
| U.S. Treasury Bonds, 8.5%, 2/15/20 | $ | 2,148,000 | $ | 2,880,335 | ||||
| U.S. Treasury Bonds, 6%, 2/15/26 | 1,524,000 | 2,034,065 | ||||||
| U.S. Treasury Bonds, 6.75%, 8/15/26 | 926,000 | 1,315,209 | ||||||
| U.S. Treasury Bonds, 5.25%, 2/15/29 | 5,294,000 | 6,816,025 | ||||||
| U.S. Treasury Bonds, 5.375%, 2/15/31 | 4,690,000 | 6,207,656 | ||||||
| U.S. Treasury Bonds, 4.5%, 2/15/36 | 1,557,000 | 1,921,679 | ||||||
| U.S. Treasury Bonds, 5%, 5/15/37 | 2,452,000 | 3,235,490 | ||||||
| U.S. Treasury Bonds, 4.5%, 8/15/39 | 138,888,000 | 172,373,063 | ||||||
| U.S. Treasury Bonds, 2.875%, 5/15/43 | 24,507,900 | 22,957,016 | ||||||
| U.S. Treasury Notes, 2.125%, 5/31/15 | 133,407,000 | 135,225,738 | ||||||
| U.S. Treasury Notes, 4.25%, 8/15/15 | 856,000 | 886,830 | ||||||
| U.S. Treasury Notes, 0.375%, 2/15/16 | 95,901,500 | 96,021,377 | ||||||
| U.S. Treasury Notes, 2.625%, 2/29/16 | 4,568,000 | 4,717,351 | ||||||
| U.S. Treasury Notes, 0.875%, 12/31/16 | 204,051,000 | 204,592,959 | ||||||
| U.S. Treasury Notes, 0.75%, 6/30/17 | 19,439,000 | 19,309,906 | ||||||
| U.S. Treasury Notes, 4.75%, 8/15/17 | 2,870,000 | 3,170,004 | ||||||
| U.S. Treasury Notes, 3.75%, 11/15/18 | 4,535,000 | 4,931,459 | ||||||
| U.S. Treasury Notes, 3.125%, 5/15/19 | 52,370,000 | 55,647,210 | ||||||
27
Table of Contents
Portfolio of Investments – continued
| Issuer | Shares/Par | Value ($) | ||||||
| Bonds - continued | ||||||||
| U.S. Treasury Obligations - continued | ||||||||
| U.S. Treasury Notes, 3.5%, 5/15/20 | $ | 55,133,000 | $ | 59,750,389 | ||||
| U.S. Treasury Notes, 3.125%, 5/15/21 | 147,456,000 | 156,257,354 | ||||||
|
| |||||||
| $ | 960,251,115 | |||||||
| Utilities - Electric Power - 0.7% | ||||||||
| Berkshire Hathaway Energy Co., 3.75%, 11/15/23 | $ | 3,550,000 | $ | 3,641,615 | ||||
| MidAmerican Funding LLC, 6.927%, 3/01/29 | 2,785,000 | 3,621,753 | ||||||
| Oncor Electric Delivery Co., 7%, 9/01/22 | 4,555,000 | 5,749,676 | ||||||
| Pacific Gas & Electric Co., 4.6%, 6/15/43 | 4,920,000 | 5,092,161 | ||||||
| PPL Capital Funding, Inc., 5%, 3/15/44 | 1,773,000 | 1,915,565 | ||||||
| PPL Corp., 3.4%, 6/01/23 | 4,920,000 | 4,847,971 | ||||||
| Progress Energy, Inc., 3.15%, 4/01/22 | 6,169,000 | 6,190,388 | ||||||
| PSEG Power LLC, 5.32%, 9/15/16 | 5,099,000 | 5,514,752 | ||||||
| Southern Co., 2.15%, 9/01/19 | 7,000,000 | 6,929,888 | ||||||
| Waterford 3 Funding Corp., 8.09%, 1/02/17 | 2,987,363 | 2,987,357 | ||||||
|
| |||||||
| $ | 46,491,126 | |||||||
| Total Bonds (Identified Cost, $2,528,543,655) | $ | 2,620,478,293 | ||||||
| Preferred Stocks - 0.3% | ||||||||
| Metals & Mining - 0.2% | ||||||||
| Vale S.A. | 1,281,900 | $ | 12,453,715 | |||||
| Utilities - Electric Power - 0.1% | ||||||||
| Companhia Energetica de Minas Gerais | 1,260,515 | $ | 7,719,383 | |||||
| Total Preferred Stocks (Identified Cost, $22,873,012) | $ | 20,173,098 | ||||||
| Convertible Preferred Stocks - 0.0% | ||||||||
| Aerospace - 0.0% | ||||||||
| United Technologies Corp., 7.5% (Identified Cost, $1,404,619) | 27,887 | $ | 1,642,265 | |||||
| Money Market Funds - 3.8% | ||||||||
| MFS Institutional Money Market Portfolio, 0.09%, at Cost and Net Asset Value (v) | 259,156,492 | $ | 259,156,492 | |||||
| Collateral for Securities Loaned - 0.3% | ||||||||
| JPMorgan Prime Money Market Fund, 0.06%, at Cost and Net Asset Value (j) | 18,148,950 | $ | 18,148,950 | |||||
| Total Investments (Identified Cost, $5,660,490,586) | $ | 6,948,527,955 | ||||||
| Other Assets, Less Liabilities - (2.5)% | (170,962,609 | ) | ||||||
| Net Assets - 100.0% | $ | 6,777,565,346 | ||||||
28
Table of Contents
Portfolio of Investments – continued
| (a) | Non-income producing security. |
| (i) | Interest only security for which the fund receives interest on notional principal (Par amount). Par amount shown is the notional principal and does not reflect the cost of the security. |
| (j) | The rate quoted is the annualized seven-day yield of the fund at period end. |
| (l) | A portion of this security is on loan. |
| (n) | Securities exempt from registration under Rule 144A of the Securities Act of 1933. These securities may be sold in the ordinary course of business in transactions exempt from registration, normally to qualified institutional buyers. At period end, the aggregate value of these securities was $148,871,271, representing 2.2% of net assets. |
| (v) | Underlying affiliated fund that is available only to investment companies managed by MFS. The rate quoted for the MFS Institutional Money Market Portfolio is the annualized seven-day yield of the fund at period end. |
| (z) | Restricted securities are not registered under the Securities Act of 1933 and are subject to legal restrictions on resale. These securities generally may be resold in transactions exempt from registration or to the public if the securities are subsequently registered. Disposal of these securities may involve time-consuming negotiations and prompt sale at an acceptable price may be difficult. The fund holds the following restricted securities: |
| Restricted Securities | Acquisition Date | Cost | Value | |||||||
| Bayview Financial Revolving Mortgage Loan Trust, FRN, 1.752%, 12/28/40 | 3/01/06 | $6,051,591 | $3,609,734 | |||||||
| BlackRock Capital Finance LP, 7.75%, 9/25/26 | 10/10/96 | 526,799 | 68,421 | |||||||
| Cent LP, 2013-17A, “A1”, CLO, FRN, 1.536%, 1/30/25 | 9/26/14 | 5,755,800 | 5,742,670 | |||||||
| Dryden Senior Loan Fund, 2013-26A, “A”, CLO, FRN, 1.334%, 7/15/25 | 9/26/14 | 7,333,588 | 7,335,300 | |||||||
| ING Investment Management Ltd., 2013-2A, “A1”, CLO, FRN, 1.384%, 4/25/25 | 9/26/14 | 6,675,916 | 6,669,774 | |||||||
| Petroleos Mexicanos, 3.125%, 1/23/19 | 1/15/14 | 2,358,000 | 2,416,950 | |||||||
| State Grid Overseas Investment (2014) Ltd., 2.75%, 5/07/19 | 4/28/14 | 5,283,484 | 5,340,079 | |||||||
| Total Restricted Securities | $31,182,928 | |||||||||
| % of Net assets | 0.5% | |||||||||
The following abbreviations are used in this report and are defined:
| ADR | American Depositary Receipt |
| CLO | Collateralized Loan Obligation |
| FRN | Floating Rate Note. Interest rate resets periodically and may not be the rate reported at period end. |
| PLC | Public Limited Company |
| REIT | Real Estate Investment Trust |
| TBA | To Be Announced |
See Notes to Financial Statements
29
Table of Contents
Financial Statements
STATEMENT OF ASSETS AND LIABILITIES
At 9/30/14
This statement represents your fund’s balance sheet, which details the assets and liabilities comprising the total value of the fund.
| Assets | ||||
Investments- | ||||
Non-affiliated issuers, at value (identified cost, $5,401,334,094) | $6,689,371,463 | |||
Underlying affiliated funds, at cost and value | 259,156,492 | |||
Total investments, at value, including $17,539,062 of securities on loan (identified cost, $5,660,490,586) | $6,948,527,955 | |||
Cash | 28,651,349 | |||
Receivables for | ||||
Investments sold | 80,590,301 | |||
Fund shares sold | 11,813,156 | |||
Interest and dividends | 23,941,568 | |||
Other assets | 50,700 | |||
Total assets | $7,093,575,029 | |||
| Liabilities | ||||
Payables for | ||||
Distributions | $1,061,538 | |||
Investments purchased | 108,859,444 | |||
TBA purchase commitments | 170,292,845 | |||
Fund shares reacquired | 11,959,435 | |||
Collateral for securities loaned, at value | 18,148,950 | |||
Payable to affiliates | ||||
Investment adviser | 133,776 | |||
Shareholder servicing costs | 5,022,565 | |||
Distribution and service fees | 93,824 | |||
Program manager fees | 76 | |||
Payable for independent Trustees’ compensation | 134,252 | |||
Accrued expenses and other liabilities | 302,978 | |||
Total liabilities | $316,009,683 | |||
Net assets | $6,777,565,346 | |||
| Net assets consist of | ||||
Paid-in capital | $5,405,720,002 | |||
Unrealized appreciation (depreciation) on investments and translation of assets and liabilities in foreign currencies | 1,287,984,991 | |||
Accumulated net realized gain (loss) on investments and foreign currency | 79,491,993 | |||
Undistributed net investment income | 4,368,360 | |||
Net assets | $6,777,565,346 | |||
Shares of beneficial interest outstanding | 372,935,185 |
30
Table of Contents
Statement of Assets and Liabilities – continued
| Net assets | Shares outstanding | Net asset value per share (a) | ||||||||||
Class A | $4,621,661,995 | 254,525,888 | $18.16 | |||||||||
Class B | 248,181,214 | 13,654,908 | 18.18 | |||||||||
Class C | 930,404,849 | 50,970,934 | 18.25 | |||||||||
Class I | 226,527,188 | 12,477,497 | 18.15 | |||||||||
Class R1 | 16,905,481 | 932,025 | 18.14 | |||||||||
Class R2 | 166,274,915 | 9,133,061 | 18.21 | |||||||||
Class R3 | 256,486,768 | 14,117,286 | 18.17 | |||||||||
Class R4 | 249,619,449 | 13,736,269 | 18.17 | |||||||||
Class R5 | 33,689,022 | 1,855,565 | 18.16 | |||||||||
Class 529A | 17,789,455 | 981,887 | 18.12 | |||||||||
Class 529B | 2,109,986 | 116,107 | 18.17 | |||||||||
Class 529C | 7,915,024 | 433,758 | 18.25 | |||||||||
| (a) | Maximum offering price per share was equal to the net asset value per share for all share classes, except for Classes A and 529A, for which the maximum offering prices per share were $19.27 [100 / 94.25 x $18.16] and $19.23 [100 / 94.25 x $18.12], respectively. On sales of $50,000 or more, the maximum offering prices of Class A and Class 529A shares are reduced. A contingent deferred sales charge may be imposed on redemptions of Class A, Class B, Class C, Class 529B, and Class 529C shares. Redemption price per share was equal to the net asset value per share for Classes I, R1, R2, R3, R4, R5, and 529A. |
See Notes to Financial Statements
31
Table of Contents
Financial Statements
Year ended 9/30/14
This statement describes how much your fund earned in investment income and accrued in expenses. It also describes any gains and/or losses generated by fund operations.
| Net investment income | ||||
Income | ||||
Dividends | $111,841,751 | |||
Interest | 79,619,574 | |||
Dividends from underlying affiliated funds | 211,996 | |||
Foreign taxes withheld | (1,543,628 | ) | ||
Total investment income | $190,129,693 | |||
Expenses | ||||
Management fee | $23,231,980 | |||
Distribution and service fees | 24,916,509 | |||
Program manager fees | 27,083 | |||
Shareholder servicing costs | 7,198,731 | |||
Administrative services fee | 501,563 | |||
Independent Trustees’ compensation | 110,977 | |||
Custodian fee | 290,891 | |||
Shareholder communications | 278,665 | |||
Audit and tax fees | 80,613 | |||
Legal fees | 63,403 | |||
Miscellaneous | 359,237 | |||
Total expenses | $57,059,652 | |||
Fees paid indirectly | (129 | ) | ||
Reduction of expenses by investment adviser and distributor | (281,816 | ) | ||
Net expenses | $56,777,707 | |||
Net investment income | $133,351,986 | |||
| Realized and unrealized gain (loss) on investments and foreign currency | ||||
Realized gain (loss) (identified cost basis) | ||||
Investments | $178,243,486 | |||
Foreign currency | (95,995 | ) | ||
Net realized gain (loss) on investments and foreign currency | $178,147,491 | |||
Change in unrealized appreciation (depreciation) | ||||
Investments | $394,963,642 | |||
Translation of assets and liabilities in foreign currencies | (89,219 | ) | ||
Net unrealized gain (loss) on investments and foreign currency translation | $394,874,423 | |||
Net realized and unrealized gain (loss) on investments and foreign currency | $573,021,914 | |||
Change in net assets from operations | $706,373,900 | |||
See Notes to Financial Statements
32
Table of Contents
Financial Statements
STATEMENTS OF CHANGES IN NET ASSETS
These statements describe the increases and/or decreases in net assets resulting from operations, any distributions, and any shareholder transactions.
| Years ended 9/30 | ||||||||
| 2014 | 2013 | |||||||
| Change in net assets | ||||||||
| From operations | ||||||||
Net investment income | $133,351,986 | $118,655,181 | ||||||
Net realized gain (loss) on investments and foreign currency | 178,147,491 | 580,226,693 | ||||||
Net unrealized gain (loss) on investments and foreign currency translation | 394,874,423 | 18,450,207 | ||||||
Change in net assets from operations | $706,373,900 | $717,332,081 | ||||||
| Distributions declared to shareholders | ||||||||
From net investment income | $(135,073,438 | ) | $(127,400,078 | ) | ||||
From net realized gain on investments | (52,872,854 | ) | — | |||||
Total distributions declared to shareholders | $(187,946,292 | ) | $(127,400,078 | ) | ||||
Change in net assets from fund share transactions | $15,241,464 | $(241,060,316 | ) | |||||
Total change in net assets | $533,669,072 | $348,871,687 | ||||||
| Net assets | ||||||||
At beginning of period | 6,243,896,274 | 5,895,024,587 | ||||||
At end of period (including undistributed net investment income of $4,368,360 and accumulated distributions in excess of net investment income of $1,895,880, respectively) | $6,777,565,346 | $6,243,896,274 | ||||||
See Notes to Financial Statements
33
Table of Contents
Financial Statements
The financial highlights table is intended to help you understand the fund’s financial performance for the past 5 years (or life of a particular share class, if shorter). Certain information reflects financial results for a single fund share. The total returns in the table represent the rate by which an investor would have earned (or lost) on an investment in the fund share class (assuming reinvestment of all distributions) held for the entire period.
| Class A | Years ended 9/30 | |||||||||||||||||||
| 2014 | 2013 | 2012 | 2011 | 2010 | ||||||||||||||||
Net asset value, beginning of period | $16.77 | $15.19 | $13.18 | $13.46 | $12.84 | |||||||||||||||
| Income (loss) from investment operations | ||||||||||||||||||||
Net investment income (d) | $0.38 | $0.34 | $0.34 | $0.32 | $0.31 | |||||||||||||||
Net realized and unrealized gain (loss) on | 1.53 | 1.60 | 2.04 | (0.28 | ) | 0.63 | ||||||||||||||
Total from investment operations | $1.91 | $1.94 | $2.38 | $0.04 | $0.94 | |||||||||||||||
| Less distributions declared to shareholders | ||||||||||||||||||||
From net investment income | $(0.38 | ) | $(0.36 | ) | $(0.37 | ) | $(0.32 | ) | $(0.32 | ) | ||||||||||
From net realized gain on investments | (0.14 | ) | — | — | — | — | ||||||||||||||
Total distributions declared to shareholders | $(0.52 | ) | $(0.36 | ) | $(0.37 | ) | $(0.32 | ) | $(0.32 | ) | ||||||||||
Net asset value, end of period (x) | $18.16 | $16.77 | $15.19 | $13.18 | $13.46 | |||||||||||||||
Total return (%) (r)(s)(t)(x) | 11.55 | 12.93 | 18.21 | 0.14 | 7.45 | |||||||||||||||
| Ratios (%) (to average net assets) and Supplemental data: | ||||||||||||||||||||
Expenses before expense reductions (f) | 0.73 | 0.75 | 0.77 | 0.79 | 0.88 | |||||||||||||||
Expenses after expense reductions (f) | 0.73 | 0.75 | 0.77 | 0.79 | 0.88 | |||||||||||||||
Net investment income | 2.13 | 2.11 | 2.33 | 2.28 | 2.36 | |||||||||||||||
Portfolio turnover | 35 | 53 | 23 | 24 | 32 | |||||||||||||||
Net assets at end of period (000 omitted) | $4,621,662 | $4,399,349 | $4,152,753 | $3,898,883 | $4,357,041 | |||||||||||||||
See Notes to Financial Statements
34
Table of Contents
Financial Highlights – continued
| Class B | Years ended 9/30 | |||||||||||||||||||
| 2014 | 2013 | 2012 | 2011 | 2010 | ||||||||||||||||
Net asset value, beginning of period | $16.78 | $15.20 | $13.19 | $13.47 | $12.84 | |||||||||||||||
| Income (loss) from investment operations | ||||||||||||||||||||
Net investment income (d) | $0.24 | $0.22 | $0.23 | $0.22 | $0.23 | |||||||||||||||
Net realized and unrealized gain (loss) on | 1.55 | 1.60 | 2.04 | (0.29 | ) | 0.64 | ||||||||||||||
Total from investment operations | $1.79 | $1.82 | $2.27 | $(0.07 | ) | $0.87 | ||||||||||||||
| Less distributions declared to shareholders | ||||||||||||||||||||
From net investment income | $(0.25 | ) | $(0.24 | ) | $(0.26 | ) | $(0.21 | ) | $(0.24 | ) | ||||||||||
From net realized gain on investments | (0.14 | ) | — | — | — | — | ||||||||||||||
Total distributions declared to shareholders | $(0.39 | ) | $(0.24 | ) | $(0.26 | ) | $(0.21 | ) | $(0.24 | ) | ||||||||||
Net asset value, end of period (x) | $18.18 | $16.78 | $15.20 | $13.19 | $13.47 | |||||||||||||||
Total return (%) (r)(s)(t)(x) | 10.75 | 12.05 | 17.30 | (0.60 | ) | 6.81 | ||||||||||||||
| Ratios (%) (to average net assets) and Supplemental data: | ||||||||||||||||||||
Expenses before expense reductions (f) | 1.48 | 1.50 | 1.52 | 1.52 | 1.53 | |||||||||||||||
Expenses after expense reductions (f) | 1.48 | 1.50 | 1.52 | 1.52 | 1.53 | |||||||||||||||
Net investment income | 1.38 | 1.36 | 1.59 | 1.55 | 1.72 | |||||||||||||||
Portfolio turnover | 35 | 53 | 23 | 24 | 32 | |||||||||||||||
Net assets at end of period (000 omitted) | $248,181 | $272,887 | $338,115 | $394,233 | $574,454 | |||||||||||||||
| Class C | Years ended 9/30 | |||||||||||||||||||
| 2014 | 2013 | 2012 | 2011 | 2010 | ||||||||||||||||
Net asset value, beginning of period | $16.86 | $15.27 | $13.25 | $13.53 | $12.90 | |||||||||||||||
| Income (loss) from investment operations | ||||||||||||||||||||
Net investment income (d) | $0.25 | $0.22 | $0.23 | $0.22 | $0.23 | |||||||||||||||
Net realized and unrealized gain (loss) on | 1.53 | 1.61 | 2.05 | (0.29 | ) | 0.64 | ||||||||||||||
Total from investment operations | $1.78 | $1.83 | $2.28 | $(0.07 | ) | $0.87 | ||||||||||||||
| Less distributions declared to shareholders | ||||||||||||||||||||
From net investment income | $(0.25 | ) | $(0.24 | ) | $(0.26 | ) | $(0.21 | ) | $(0.24 | ) | ||||||||||
From net realized gain on investments | (0.14 | ) | — | — | — | — | ||||||||||||||
Total distributions declared to shareholders | $(0.39 | ) | $(0.24 | ) | $(0.26 | ) | $(0.21 | ) | $(0.24 | ) | ||||||||||
Net asset value, end of period (x) | $18.25 | $16.86 | $15.27 | $13.25 | $13.53 | |||||||||||||||
Total return (%) (r)(s)(t)(x) | 10.65 | 12.08 | 17.31 | (0.59 | ) | 6.79 | ||||||||||||||
| Ratios (%) (to average net assets) and Supplemental data: | ||||||||||||||||||||
Expenses before expense reductions (f) | 1.48 | 1.50 | 1.52 | 1.52 | 1.53 | |||||||||||||||
Expenses after expense reductions (f) | 1.48 | 1.50 | 1.52 | 1.52 | 1.53 | |||||||||||||||
Net investment income | 1.38 | 1.35 | 1.58 | 1.56 | 1.71 | |||||||||||||||
Portfolio turnover | 35 | 53 | �� | 23 | 24 | 32 | ||||||||||||||
Net assets at end of period (000 omitted) | $930,405 | $836,471 | $769,540 | $734,645 | $840,204 | |||||||||||||||
See Notes to Financial Statements
35
Table of Contents
Financial Highlights – continued
| Class I | Years ended 9/30 | |||||||||||||||||||
| 2014 | 2013 | 2012 | 2011 | 2010 | ||||||||||||||||
Net asset value, beginning of period | $16.77 | $15.19 | $13.18 | $13.46 | $12.84 | |||||||||||||||
| Income (loss) from investment operations | ||||||||||||||||||||
Net investment income (d) | $0.42 | $0.38 | $0.37 | $0.36 | $0.36 | |||||||||||||||
Net realized and unrealized gain (loss) on | 1.53 | 1.60 | 2.05 | (0.28 | ) | 0.63 | ||||||||||||||
Total from investment operations | $1.95 | $1.98 | $2.42 | $0.08 | $0.99 | |||||||||||||||
| Less distributions declared to shareholders | ||||||||||||||||||||
From net investment income | $(0.43 | ) | $(0.40 | ) | $(0.41 | ) | $(0.36 | ) | $(0.37 | ) | ||||||||||
From net realized gain on investments | (0.14 | ) | — | — | — | — | ||||||||||||||
Total distributions declared to shareholders | $(0.57 | ) | $(0.40 | ) | $(0.41 | ) | $(0.36 | ) | $(0.37 | ) | ||||||||||
Net asset value, end of period (x) | $18.15 | $16.77 | $15.19 | $13.18 | $13.46 | |||||||||||||||
Total return (%) (r)(s)(x) | 11.76 | 13.21 | 18.50 | 0.42 | 7.83 | |||||||||||||||
| Ratios (%) (to average net assets) and Supplemental data: | ||||||||||||||||||||
Expenses before expense reductions (f) | 0.48 | 0.50 | 0.52 | 0.52 | 0.53 | |||||||||||||||
Expenses after expense reductions (f) | 0.48 | 0.50 | 0.52 | 0.52 | 0.53 | |||||||||||||||
Net investment income | 2.37 | 2.35 | 2.59 | 2.57 | 2.72 | |||||||||||||||
Portfolio turnover | 35 | 53 | 23 | 24 | 32 | |||||||||||||||
Net assets at end of period (000 omitted) | $226,527 | $160,246 | $121,687 | $109,575 | $98,214 | |||||||||||||||
| Class R1 | Years ended 9/30 | |||||||||||||||||||
| 2014 | 2013 | 2012 | 2011 | 2010 | ||||||||||||||||
Net asset value, beginning of period | $16.75 | $15.18 | $13.17 | $13.45 | $12.83 | |||||||||||||||
| Income (loss) from investment operations | ||||||||||||||||||||
Net investment income (d) | $0.25 | $0.22 | $0.23 | $0.22 | $0.23 | |||||||||||||||
Net realized and unrealized gain (loss) on | 1.53 | 1.59 | 2.04 | (0.29 | ) | 0.63 | ||||||||||||||
Total from investment operations | $1.78 | $1.81 | $2.27 | $(0.07 | ) | $0.86 | ||||||||||||||
| Less distributions declared to shareholders | ||||||||||||||||||||
From net investment income | $(0.25 | ) | $(0.24 | ) | $(0.26 | ) | $(0.21 | ) | $(0.24 | ) | ||||||||||
From net realized gain on investments | (0.14 | ) | — | — | — | — | ||||||||||||||
Total distributions declared to shareholders | $(0.39 | ) | $(0.24 | ) | $(0.26 | ) | $(0.21 | ) | $(0.24 | ) | ||||||||||
Net asset value, end of period (x) | $18.14 | $16.75 | $15.18 | $13.17 | $13.45 | |||||||||||||||
Total return (%) (r)(s)(x) | 10.72 | 12.02 | 17.36 | (0.58 | ) | 6.76 | ||||||||||||||
| Ratios (%) (to average net assets) and Supplemental data: | ||||||||||||||||||||
Expenses before expense reductions (f) | 1.48 | 1.50 | 1.52 | 1.52 | 1.53 | |||||||||||||||
Expenses after expense reductions (f) | 1.48 | 1.50 | 1.52 | 1.52 | 1.53 | |||||||||||||||
Net investment income | 1.38 | 1.36 | 1.58 | 1.56 | 1.71 | |||||||||||||||
Portfolio turnover | 35 | 53 | 23 | 24 | 32 | |||||||||||||||
Net assets at end of period (000 omitted) | $16,905 | $16,134 | $17,900 | $15,441 | $17,670 | |||||||||||||||
See Notes to Financial Statements
36
Table of Contents
Financial Highlights – continued
| Class R2 | Years ended 9/30 | |||||||||||||||||||
| 2014 | 2013 | 2012 | 2011 | 2010 | ||||||||||||||||
Net asset value, beginning of period | $16.81 | $15.23 | $13.22 | $13.50 | $12.87 | |||||||||||||||
| Income (loss) from investment operations | ||||||||||||||||||||
Net investment income (d) | $0.33 | $0.30 | $0.30 | $0.29 | $0.29 | |||||||||||||||
Net realized and unrealized gain (loss) on | 1.55 | 1.60 | 2.04 | (0.28 | ) | 0.64 | ||||||||||||||
Total from investment operations | $1.88 | $1.90 | $2.34 | $0.01 | $0.93 | |||||||||||||||
| Less distributions declared to shareholders | ||||||||||||||||||||
From net investment income | $(0.34 | ) | $(0.32 | ) | $(0.33 | ) | $(0.29 | ) | $(0.30 | ) | ||||||||||
From net realized gain on investments | (0.14 | ) | — | — | — | — | ||||||||||||||
Total distributions declared to shareholders | $(0.48 | ) | $(0.32 | ) | $(0.33 | ) | $(0.29 | ) | $(0.30 | ) | ||||||||||
Net asset value, end of period (x) | $18.21 | $16.81 | $15.23 | $13.22 | $13.50 | |||||||||||||||
Total return (%) (r)(s)(x) | 11.29 | 12.61 | 17.86 | (0.08 | ) | 7.35 | ||||||||||||||
| Ratios (%) (to average net assets) and Supplemental data: | ||||||||||||||||||||
Expenses before expense reductions (f) | 0.98 | 1.00 | 1.02 | 1.02 | 1.03 | |||||||||||||||
Expenses after expense reductions (f) | 0.98 | 1.00 | 1.02 | 1.02 | 1.03 | |||||||||||||||
Net investment income | 1.87 | 1.85 | 2.08 | 2.06 | 2.21 | |||||||||||||||
Portfolio turnover | 35 | 53 | 23 | 24 | 32 | |||||||||||||||
Net assets at end of period (000 omitted) | $166,275 | $162,091 | $154,925 | $151,437 | $166,794 | |||||||||||||||
| Class R3 | Years ended 9/30 | |||||||||||||||||||
| 2014 | 2013 | 2012 | 2011 | 2010 | ||||||||||||||||
Net asset value, beginning of period | $16.78 | $15.20 | $13.19 | $13.47 | $12.85 | |||||||||||||||
| Income (loss) from investment operations | ||||||||||||||||||||
Net investment income (d) | $0.38 | $0.34 | $0.34 | $0.33 | $0.32 | |||||||||||||||
Net realized and unrealized gain (loss) on | 1.53 | 1.60 | 2.04 | (0.29 | ) | 0.64 | ||||||||||||||
Total from investment operations | $1.91 | $1.94 | $2.38 | $0.04 | $0.96 | |||||||||||||||
| Less distributions declared to shareholders | ||||||||||||||||||||
From net investment income | $(0.38 | ) | $(0.36 | ) | $(0.37 | ) | $(0.32 | ) | $(0.34 | ) | ||||||||||
From net realized gain on investments | (0.14 | ) | — | — | — | — | ||||||||||||||
Total distributions declared to shareholders | $(0.52 | ) | $(0.36 | ) | $(0.37 | ) | $(0.32 | ) | $(0.34 | ) | ||||||||||
Net asset value, end of period (x) | $18.17 | $16.78 | $15.20 | $13.19 | $13.47 | |||||||||||||||
Total return (%) (r)(s)(x) | 11.54 | 12.92 | 18.20 | 0.17 | 7.55 | |||||||||||||||
| Ratios (%) (to average net assets) and Supplemental data: | ||||||||||||||||||||
Expenses before expense reductions (f) | 0.73 | 0.75 | 0.77 | 0.77 | 0.78 | |||||||||||||||
Expenses after expense reductions (f) | 0.73 | 0.75 | 0.77 | 0.77 | 0.78 | |||||||||||||||
Net investment income | 2.13 | 2.11 | 2.32 | 2.31 | 2.46 | |||||||||||||||
Portfolio turnover | 35 | 53 | 23 | 24 | 32 | |||||||||||||||
Net assets at end of period (000 omitted) | $256,487 | $178,646 | $192,389 | $153,259 | $160,057 | |||||||||||||||
See Notes to Financial Statements
37
Table of Contents
Financial Highlights – continued
| Class R4 | Years ended 9/30 | |||||||||||||||||||
| 2014 | 2013 | 2012 | 2011 | 2010 | ||||||||||||||||
Net asset value, beginning of period | $16.78 | $15.21 | $13.19 | $13.47 | $12.85 | |||||||||||||||
| Income (loss) from investment operations | ||||||||||||||||||||
Net investment income (d) | $0.42 | $0.38 | $0.38 | $0.36 | $0.36 | |||||||||||||||
Net realized and unrealized gain (loss) on | 1.54 | 1.59 | 2.04 | (0.28 | ) | 0.63 | ||||||||||||||
Total from investment operations | $1.96 | $1.97 | $2.42 | $0.08 | $0.99 | |||||||||||||||
| Less distributions declared to shareholders | ||||||||||||||||||||
From net investment income | $(0.43 | ) | $(0.40 | ) | $(0.40 | ) | $(0.36 | ) | $(0.37 | ) | ||||||||||
From net realized gain on investments | (0.14 | ) | — | — | — | — | ||||||||||||||
Total distributions declared to shareholders | $(0.57 | ) | $(0.40 | ) | $(0.40 | ) | $(0.36 | ) | $(0.37 | ) | ||||||||||
Net asset value, end of period (x) | $18.17 | $16.78 | $15.21 | $13.19 | $13.47 | |||||||||||||||
Total return (%) (r)(s)(x) | 11.82 | 13.13 | 18.49 | 0.42 | 7.82 | |||||||||||||||
| Ratios (%) (to average net assets) and Supplemental data: | ||||||||||||||||||||
Expenses before expense reductions (f) | 0.48 | 0.50 | 0.52 | 0.52 | 0.53 | |||||||||||||||
Expenses after expense reductions (f) | 0.48 | 0.50 | 0.52 | 0.52 | 0.53 | |||||||||||||||
Net investment income | 2.38 | 2.34 | 2.64 | 2.56 | 2.71 | |||||||||||||||
Portfolio turnover | 35 | 53 | 23 | 24 | 32 | |||||||||||||||
Net assets at end of period (000 omitted) | $249,619 | $182,332 | $125,421 | $268,667 | $291,138 | |||||||||||||||
| Class R5 | Years ended 9/30 | |||||||||||
| 2014 | 2013 | 2012 (i) | ||||||||||
Net asset value, beginning of period | $16.77 | $15.19 | $14.30 | |||||||||
| Income (loss) from investment operations | ||||||||||||
Net investment income (d) | $0.44 | $0.40 | $0.11 | |||||||||
Net realized and unrealized gain (loss) on | 1.53 | 1.59 | 0.91 | (g) | ||||||||
Total from investment operations | $1.97 | $1.99 | $1.02 | |||||||||
| Less distributions declared to shareholders | ||||||||||||
From net investment income | $(0.44 | ) | $(0.41 | ) | $(0.13 | ) | ||||||
From net realized gain on investments | (0.14 | ) | — | — | ||||||||
Total distributions declared to shareholders | $(0.58 | ) | $(0.41 | ) | $(0.13 | ) | ||||||
Net asset value, end of period (x) | $18.16 | $16.77 | $15.19 | |||||||||
Total return (%) (r)(s)(x) | 11.91 | 13.30 | 7.17 | (n) | ||||||||
| Ratios (%) (to average net assets) and Supplemental data: | ||||||||||||
Expenses before expense reductions (f) | 0.41 | 0.41 | 0.44 | (a) | ||||||||
Expenses after expense reductions (f) | 0.41 | 0.41 | 0.44 | (a) | ||||||||
Net investment income | 2.46 | 2.42 | 2.29 | (a)(l) | ||||||||
Portfolio turnover | 35 | 53 | 23 | |||||||||
Net assets at end of period (000 omitted) | $33,689 | $10,800 | $107 | |||||||||
See Notes to Financial Statements
38
Table of Contents
Financial Highlights – continued
| Class 529A | Years ended 9/30 | |||||||||||||||||||
| 2014 | 2013 | 2012 | 2011 | 2010 | ||||||||||||||||
Net asset value, beginning of period | $16.73 | $15.16 | $13.16 | $13.44 | $12.82 | |||||||||||||||
| Income (loss) from investment operations | ||||||||||||||||||||
Net investment income (d) | $0.37 | $0.33 | $0.33 | $0.31 | $0.30 | |||||||||||||||
Net realized and unrealized gain (loss) on | 1.54 | 1.59 | 2.03 | (0.28 | ) | 0.63 | ||||||||||||||
Total from investment operations | $1.91 | $1.92 | $2.36 | $0.03 | $0.93 | |||||||||||||||
| Less distributions declared to shareholders | ||||||||||||||||||||
From net investment income | $(0.38 | ) | $(0.35 | ) | $(0.36 | ) | $(0.31 | ) | $(0.31 | ) | ||||||||||
From net realized gain on investments | (0.14 | ) | — | — | — | — | ||||||||||||||
Total distributions declared to shareholders | $(0.52 | ) | $(0.35 | ) | $(0.36 | ) | $(0.31 | ) | $(0.31 | ) | ||||||||||
Net asset value, end of period (x) | $18.12 | $16.73 | $15.16 | $13.16 | $13.44 | |||||||||||||||
Total return (%) (r)(s)(t)(x) | 11.53 | 12.84 | 18.11 | 0.06 | 7.36 | |||||||||||||||
| Ratios (%) (to average net assets) and Supplemental data: | ||||||||||||||||||||
Expenses before expense reductions (f) | 0.83 | 0.85 | 0.87 | 0.89 | 0.98 | |||||||||||||||
Expenses after expense reductions (f) | 0.77 | 0.80 | 0.82 | 0.88 | 0.98 | |||||||||||||||
Net investment income | 2.09 | 2.05 | 2.27 | 2.20 | 2.26 | |||||||||||||||
Portfolio turnover | 35 | 53 | 23 | 24 | 32 | |||||||||||||||
Net assets at end of period (000 omitted) | $17,789 | $15,581 | $13,064 | $9,758 | $8,965 | |||||||||||||||
| Class 529B | Years ended 9/30 | |||||||||||||||||||
| 2014 | 2013 | 2012 | 2011 | 2010 | ||||||||||||||||
Net asset value, beginning of period | $16.78 | $15.20 | $13.19 | $13.46 | $12.84 | |||||||||||||||
| Income (loss) from investment operations | ||||||||||||||||||||
Net investment income (d) | $0.24 | $0.21 | $0.22 | $0.21 | $0.21 | |||||||||||||||
Net realized and unrealized gain (loss) on | 1.53 | 1.60 | 2.04 | (0.28 | ) | 0.64 | ||||||||||||||
Total from investment operations | $1.77 | $1.81 | $2.26 | $(0.07 | ) | $0.85 | ||||||||||||||
| Less distributions declared to shareholders | ||||||||||||||||||||
From net investment income | $(0.24 | ) | $(0.23 | ) | $(0.25 | ) | $(0.20 | ) | $(0.23 | ) | ||||||||||
From net realized gain on investments | (0.14 | ) | — | — | — | — | ||||||||||||||
Total distributions declared to shareholders | $(0.38 | ) | $(0.23 | ) | $(0.25 | ) | $(0.20 | ) | $(0.23 | ) | ||||||||||
Net asset value, end of period (x) | $18.17 | $16.78 | $15.20 | $13.19 | $13.46 | |||||||||||||||
Total return (%) (r)(s)(t)(x) | 10.63 | 11.99 | 17.24 | (0.60 | ) | 6.65 | ||||||||||||||
| Ratios (%) (to average net assets) and Supplemental data: | ||||||||||||||||||||
Expenses before expense reductions (f) | 1.58 | 1.60 | 1.62 | 1.62 | 1.63 | |||||||||||||||
Expenses after expense reductions (f) | 1.53 | 1.55 | 1.57 | 1.61 | 1.63 | |||||||||||||||
Net investment income | 1.33 | 1.31 | 1.54 | 1.47 | 1.61 | |||||||||||||||
Portfolio turnover | 35 | 53 | 23 | 24 | 32 | |||||||||||||||
Net assets at end of period (000 omitted) | $2,110 | $2,369 | $3,095 | $4,007 | $4,828 | |||||||||||||||
See Notes to Financial Statements
39
Table of Contents
Financial Highlights – continued
| Class 529C | Years ended 9/30 | |||||||||||||||||||
| 2014 | 2013 | 2012 | 2011 | 2010 | ||||||||||||||||
Net asset value, beginning of period | $16.85 | $15.27 | $13.25 | $13.53 | $12.90 | |||||||||||||||
| Income (loss) from investment operations | ||||||||||||||||||||
Net investment income (d) | $0.24 | $0.21 | $0.22 | $0.21 | $0.21 | |||||||||||||||
Net realized and unrealized gain (loss) on | 1.54 | 1.60 | 2.05 | (0.29 | ) | 0.65 | ||||||||||||||
Total from investment operations | $1.78 | $1.81 | $2.27 | $(0.08 | ) | $0.86 | ||||||||||||||
| Less distributions declared to shareholders | ||||||||||||||||||||
From net investment income | $(0.24 | ) | $(0.23 | ) | $(0.25 | ) | $(0.20 | ) | $(0.23 | ) | ||||||||||
From net realized gain on investments | (0.14 | ) | — | — | — | — | ||||||||||||||
Total distributions declared to shareholders | $(0.38 | ) | $(0.23 | ) | $(0.25 | ) | $(0.20 | ) | $(0.23 | ) | ||||||||||
Net asset value, end of period (x) | $18.25 | $16.85 | $15.27 | $13.25 | $13.53 | |||||||||||||||
Total return (%) (r)(s)(t)(x) | 10.66 | 11.97 | 17.26 | (0.66 | ) | 6.69 | ||||||||||||||
| Ratios (%) (to average net assets) and Supplemental data: | ||||||||||||||||||||
Expenses before expense reductions (f) | 1.58 | 1.60 | 1.62 | 1.62 | 1.63 | |||||||||||||||
Expenses after expense reductions (f) | 1.53 | 1.55 | 1.57 | 1.61 | 1.63 | |||||||||||||||
Net investment income | 1.33 | 1.30 | 1.53 | 1.47 | 1.60 | |||||||||||||||
Portfolio turnover | 35 | 53 | 23 | 24 | 32 | |||||||||||||||
Net assets at end of period (000 omitted) | $7,915 | $6,989 | $6,028 | $5,091 | $4,973 | |||||||||||||||
| (a) | Annualized. |
| (d) | Per share data is based on average shares outstanding. |
| (f) | Ratios do not reflect reductions from fees paid indirectly, if applicable. |
| (g) | The per share amount varies from the net realized and unrealized gain/loss for the period because of the timing of sales of fund shares and the per share amount of realized and unrealized gains and losses at such time. |
| (i) | For the period from the class inception, June 1, 2012, through the stated period end. |
| (l) | Recognition of net investment income by the fund may be affected by the timing of the declaration of dividends by companies in which the fund invests and the actual annual net investment income ratio may differ. |
| (n) | Not annualized. |
| (r) | Certain expenses have been reduced without which performance would have been lower. |
| (s) | From time to time the fund may receive proceeds from litigation settlements, without which performance would be lower. |
| (t) | Total returns do not include any applicable sales charges. |
| (x) | The net asset values per share and total returns have been calculated on net assets which include adjustments made in accordance with U.S. generally accepted accounting principles required at period end for financial reporting purposes. |
See Notes to Financial Statements
40
Table of Contents
(1) Business and Organization
MFS Total Return Fund (the fund) is a diversified series of MFS Series Trust V (the trust). The trust is organized as a Massachusetts business trust and is registered under the Investment Company Act of 1940, as amended, as an open-end management investment company.
The fund is an investment company and accordingly follows the investment company accounting and reporting guidance of the Financial Accounting Standards Board (FASB) Accounting Standards Codification Topic 946 Financial Services – Investment Companies.
(2) Significant Accounting Policies
General – The preparation of financial statements in conformity with U.S. generally accepted accounting principles requires management to make estimates and assumptions that affect the reported amounts of assets and liabilities, and disclosure of contingent assets and liabilities at the date of the financial statements and the reported amounts of increases and decreases in net assets from operations during the reporting period. Actual results could differ from those estimates. In the preparation of these financial statements, management has evaluated subsequent events occurring after the date of the fund’s Statement of Assets and Liabilities through the date that the financial statements were issued.
In June 2014, FASB issued Accounting Standards Update 2014-11, Transfers and Servicing (Topic 860) – Repurchase-to-Maturity Transactions, Repurchase Financings, and Disclosures (“ASU 2014-11”). ASU 2014-11 changes the accounting for repurchase-to-maturity transactions (i.e., repurchase agreements that settle at the same time as the maturity of the transferred financial asset) and enhances the required disclosures for repurchase agreements and other similar transactions. Although still evaluating the potential impacts of ASU 2014-11 to the fund, management expects that the impact of the fund’s adoption will be limited to additional financial statement disclosures which would first be effective for interim reporting periods beginning after March 15, 2015.
Balance Sheet Offsetting – The fund’s accounting policy with respect to balance sheet offsetting is that, absent an event of default by the counterparty or a termination of the agreement, the International Swaps and Derivatives Association (ISDA) Master Agreement does not result in an offset of reported amounts of financial assets and financial liabilities in the Statement of Assets and Liabilities across transactions between the fund and the applicable counterparty. The fund’s right to setoff may be restricted or prohibited by the bankruptcy or insolvency laws of the particular jurisdiction to which a specific master netting agreement counterparty is subject. Balance sheet offsetting disclosures, to the extent applicable to the fund, have been included in the fund’s Significant Accounting Policies note under the captions for each of the fund’s in-scope financial instruments and transactions.
Investment Valuations – Equity securities, including restricted equity securities, are generally valued at the last sale or official closing price as provided by a third-party pricing service on the market or exchange on which they are primarily traded. Equity
41
Table of Contents
Notes to Financial Statements – continued
securities, for which there were no sales reported that day, are generally valued at the last quoted daily bid quotation as provided by a third-party pricing service on the market or exchange on which such securities are primarily traded. Debt instruments and floating rate loans, including restricted debt instruments, are generally valued at an evaluated or composite bid as provided by a third-party pricing service. Short-term instruments with a maturity at issuance of 60 days or less may be valued at amortized cost, which approximates market value. Open-end investment companies are generally valued at net asset value per share. Securities and other assets generally valued on the basis of information from a third-party pricing service may also be valued at a broker/dealer bid quotation. Values obtained from third-party pricing services can utilize both transaction data and market information such as yield, quality, coupon rate, maturity, type of issue, trading characteristics, and other market data. The values of foreign securities and other assets and liabilities expressed in foreign currencies are converted to U.S. dollars using the mean of bid and asked prices for rates provided by a third-party pricing service.
The Board of Trustees has delegated primary responsibility for determining or causing to be determined the value of the fund’s investments (including any fair valuation) to the adviser pursuant to valuation policies and procedures approved by the Board. If the adviser determines that reliable market quotations are not readily available, investments are valued at fair value as determined in good faith by the adviser in accordance with such procedures under the oversight of the Board of Trustees. Under the fund’s valuation policies and procedures, market quotations are not considered to be readily available for most types of debt instruments and floating rate loans and many types of derivatives. These investments are generally valued at fair value based on information from third-party pricing services. In addition, investments may be valued at fair value if the adviser determines that an investment’s value has been materially affected by events occurring after the close of the exchange or market on which the investment is principally traded (such as foreign exchange or market) and prior to the determination of the fund’s net asset value, or after the halting of trading of a specific security where trading does not resume prior to the close of the exchange or market on which the security is principally traded. Events that occur on a frequent basis after foreign markets close (such as developments in foreign markets and significant movements in the U.S. markets) and prior to the determination of the fund’s net asset value may be deemed to have a material effect on the value of securities traded in foreign markets. Accordingly, the fund’s foreign equity securities may often be valued at fair value. The adviser generally relies on third-party pricing services or other information (such as the correlation with price movements of similar securities in the same or other markets; the type, cost and investment characteristics of the security; the business and financial condition of the issuer; and trading and other market data) to assist in determining whether to fair value and at what value to fair value an investment. The value of an investment for purposes of calculating the fund’s net asset value can differ depending on the source and method used to determine value. When fair valuation is used, the value of an investment used to determine the fund’s net asset value may differ from quoted or published prices for the same investment. There can be no assurance that the fund could obtain the fair value assigned to an investment if it were to sell the investment at the same time at which the fund determines its net asset value per share.
42
Table of Contents
Notes to Financial Statements – continued
Various inputs are used in determining the value of the fund’s assets or liabilities. These inputs are categorized into three broad levels. In certain cases, the inputs used to measure fair value may fall into different levels of the fair value hierarchy. In such cases, an investment’s level within the fair value hierarchy is based on the lowest level of input that is significant to the fair value measurement. The fund’s assessment of the significance of a particular input to the fair value measurement in its entirety requires judgment, and considers factors specific to the investment. Level 1 includes unadjusted quoted prices in active markets for identical assets or liabilities. Level 2 includes other significant observable market-based inputs (including quoted prices for similar securities, interest rates, prepayment speed, and credit risk). Level 3 includes unobservable inputs, which may include the adviser’s own assumptions in determining the fair value of investments. The following is a summary of the levels used as of September 30, 2014 in valuing the fund’s assets or liabilities:
| Investments at Value | Level 1 | Level 2 | Level 3 | Total | ||||||||||||
| Equity Securities: | ||||||||||||||||
United States | $3,622,008,996 | $— | $— | $3,622,008,996 | ||||||||||||
United Kingdom | 15,217,308 | 91,568,276 | — | 106,785,584 | ||||||||||||
Switzerland | — | �� | 71,881,544 | — | 71,881,544 | |||||||||||
Canada | 47,645,478 | — | — | 47,645,478 | ||||||||||||
Brazil | 44,427,666 | — | — | 44,427,666 | ||||||||||||
Japan | 37,604,113 | — | — | 37,604,113 | ||||||||||||
France | — | 31,371,928 | — | 31,371,928 | ||||||||||||
Germany | 30,816,097 | — | — | 30,816,097 | ||||||||||||
Netherlands | 3,427,260 | 14,062,734 | — | 17,489,994 | ||||||||||||
Other Countries | 19,651,480 | 21,061,340 | — | 40,712,820 | ||||||||||||
| U.S. Treasury Bonds & U.S. Government Agency & Equivalents | — | 983,841,087 | — | 983,841,087 | ||||||||||||
| Non-U.S. Sovereign Debt | — | 59,062,704 | — | 59,062,704 | ||||||||||||
| U.S. Corporate Bonds | — | 497,437,711 | — | 497,437,711 | ||||||||||||
| Residential Mortgage-Backed Securities | — | 761,271,309 | — | 761,271,309 | ||||||||||||
| Commercial Mortgage-Backed Securities | — | 110,336,207 | — | 110,336,207 | ||||||||||||
| Asset-Backed Securities (including CDOs) | — | 30,013,271 | — | 30,013,271 | ||||||||||||
| Foreign Bonds | — | 178,516,004 | — | 178,516,004 | ||||||||||||
| Mutual Funds | 277,305,442 | — | — | 277,305,442 | ||||||||||||
| Total Investments | $4,098,103,840 | $2,850,424,115 | $— | $6,948,527,955 | ||||||||||||
For further information regarding security characteristics, see the Portfolio of Investments.
Of the level 2 investments presented above, equity investments amounting to $192,459,001 would have been considered level 1 investments at the beginning of the period. Of the level 1 investments presented above, equity investments amounting to $27,306,345 would have been considered level 2 investments at the beginning of the period. The primary reason for changes in the classifications between levels 1 and 2 occurs when foreign equity securities are fair valued using other observable
43
Table of Contents
Notes to Financial Statements – continued
market-based inputs in place of the closing exchange price due to events occurring after the close of the exchange or market on which the investment is principally traded. The fund’s foreign equity securities may often be valued at fair value. The fund’s policy is to recognize transfers between the levels as of the end of the period.
Repurchase Agreements – The fund enters into repurchase agreements under the terms of Master Repurchase Agreements with approved counterparties. Each repurchase agreement is recorded at cost. The fund requires that the securities collateral in a repurchase transaction be transferred to a custodian. The fund monitors, on a daily basis, the value of the collateral to ensure that its value, including accrued interest, is greater than amounts owed to the fund under each such repurchase agreement. Upon an event of default under a Master Repurchase Agreement, the non-defaulting party may close out all transactions traded under such agreement and net amounts owed under each transaction to one net amount payable by one party to the other. Absent an event of default, the Master Repurchase Agreement does not result in an offset of reported amounts of assets and liabilities in the Statement of Assets and Liabilities across transactions between the fund and the applicable counterparty.
Foreign Currency Translation – Purchases and sales of foreign investments, income, and expenses are converted into U.S. dollars based upon currency exchange rates prevailing on the respective dates of such transactions or on the reporting date for foreign denominated receivables and payables. Gains and losses attributable to foreign currency exchange rates on sales of securities are recorded for financial statement purposes as net realized gains and losses on investments. Gains and losses attributable to foreign exchange rate movements on receivables, payables, income and expenses are recorded for financial statement purposes as foreign currency transaction gains and losses. That portion of both realized and unrealized gains and losses on investments that results from fluctuations in foreign currency exchange rates is not separately disclosed.
Security Loans – Under its Securities Lending Agency Agreement with the fund, JPMorgan Chase and Co. (“Chase”), as lending agent, loans the securities of the fund to certain qualified institutions (the “Borrowers”) approved by the fund. The loans are collateralized by cash and/or U.S. Treasury and federal agency obligations in an amount typically at least equal to the market value of the securities loaned. On loans collateralized by cash, the cash collateral is invested in a money market fund. The market value of the loaned securities is determined at the close of business of the fund and any additional required collateral is delivered to the fund on the next business day. Chase provides the fund with indemnification against Borrower default. In the event of Borrower default, Chase will for the benefit of the fund either purchase securities identical to those loaned or, when such purchase is commercially impracticable, pay the fund the market value of the loaned securities. In return, Chase assumes the fund’s rights to the related collateral. If the collateral value is less than the cost to purchase identical securities, Chase is responsible for the shortfall, but only to the extent that such shortfall is not due to a decline in collateral value resulting from collateral reinvestment for which the fund bears the risk of loss. At period end, the fund had investment securities on loan with a fair value of $17,539,062 and a related liability of $18,148,950 for cash collateral received on securities loaned, both of which are
44
Table of Contents
Notes to Financial Statements – continued
presented gross in the Statement of Assets and Liabilities. The collateral received on securities loaned exceeded the value of securities on loan at period end. The liability for cash collateral for securities loaned is carried at fair value, which is categorized as level 2 within the fair value hierarchy. A portion of the income generated upon investment of the collateral is remitted to the Borrowers, and the remainder is allocated between the fund and the lending agent. On loans collateralized by U.S. Treasury and/or federal agency obligations, a fee is received from the Borrower, and is allocated between the fund and the lending agent. Income from securities lending is included in “Interest” income in the Statement of Operations. The dividend and interest income earned on the securities loaned is accounted for in the same manner as other dividend and interest income.
Dollar Roll Transactions – The fund enters into dollar roll transactions, with respect to mortgage-backed securities issued by Ginnie Mae, Fannie Mae, and Freddie Mac, in which the fund sells mortgage backed securities to financial institutions and simultaneously agrees to purchase similar (same issuer, type and coupon) securities at a later date at an agreed-upon price. During the period between the sale and repurchase in a dollar roll transaction the fund will not be entitled to receive interest and principal payments on the securities sold but is compensated by interest earned on the proceeds of the initial sale and by a lower purchase price on the securities to be repurchased which enhances the fund’s total return. The fund accounts for dollar roll transactions as purchases and sales and realizes gains and losses on these transactions.
Indemnifications – Under the fund’s organizational documents, its officers and Trustees may be indemnified against certain liabilities and expenses arising out of the performance of their duties to the fund. Additionally, in the normal course of business, the fund enters into agreements with service providers that may contain indemnification clauses. The fund’s maximum exposure under these agreements is unknown as this would involve future claims that may be made against the fund that have not yet occurred.
Investment Transactions and Income – Investment transactions are recorded on the trade date. Interest income is recorded on the accrual basis. All premium and discount is amortized or accreted for financial statement purposes in accordance with U.S. generally accepted accounting principles. Some securities may be purchased on a “when-issued” or “forward delivery” basis, which means that the securities will be delivered to the fund at a future date, usually beyond customary settlement time. Dividends received in cash are recorded on the ex-dividend date. Certain dividends from foreign securities will be recorded when the fund is informed of the dividend if such information is obtained subsequent to the ex-dividend date. Dividend and interest payments received in additional securities are recorded on the ex-dividend or ex-interest date in an amount equal to the value of the security on such date.
The fund may receive proceeds from litigation settlements. Any proceeds received from litigation involving portfolio holdings are reflected in the Statement of Operations in realized gain/loss if the security has been disposed of by the fund or in unrealized gain/loss if the security is still held by the fund. Any other proceeds from litigation not related to portfolio holdings are reflected as other income in the Statement of Operations.
45
Table of Contents
Notes to Financial Statements – continued
The fund invests a significant portion of its assets in asset-backed and/or mortgage-backed securities. The value of these securities may depend, in part, on the issuer’s or borrower’s credit quality or ability to pay principal and interest when due and may fall if an issuer or borrower defaults on its obligation to pay principal or interest or if the instrument’s credit rating is downgraded by a credit rating agency. U.S. Government securities not supported as to the payment of principal or interest by the U.S. Treasury, such as those issued by Fannie Mae, Freddie Mac, and the Federal Home Loan Banks, are subject to greater credit risk than are U.S. Government securities supported by the U.S. Treasury, such as those issued by Ginnie Mae.
The fund purchased or sold debt securities on a when-issued or delayed delivery basis, or in a “To Be Announced” (TBA) or “forward commitment” transaction with delivery or payment to occur at a later date beyond the normal settlement period. At the time a fund enters into a commitment to purchase or sell a security, the transaction is recorded and the value of the security acquired is reflected in the fund’s net asset value. The price of such security and the date that the security will be delivered and paid for are fixed at the time the transaction is negotiated. The value of the security may vary with market fluctuations. TBA securities resulting from these transactions are included in the Portfolio of Investments. TBA purchase commitments are held at carrying amount, which approximates fair value and are categorized as level 2 within the fair value hierarchy. No interest accrues to the fund until payment takes place. At the time that a fund enters into this type of transaction, the fund is required to have sufficient cash and/or liquid securities to cover its commitments. Losses may arise due to changes in the value of the underlying securities or if the counterparty does not perform under the contract’s terms, or if the issuer does not issue the securities due to political, economic or other factors. Additionally, losses may arise due to declines in the value of the securities prior to settlement date.
To mitigate this risk of loss on TBA securities and other types of forward settling mortgage-backed securities, the fund whenever possible enters into a Master Securities Forward Transaction Agreement (“MSFTA”) on a bilateral basis with each of the counterparties with whom it undertakes a significant volume of transactions. The MSFTA gives each party to the agreement the right to terminate all transactions traded under such agreement if there is a certain deterioration in the credit quality of the other party. Upon an event of default or a termination of the MSFTA, the non-defaulting party has the right to close out all transactions traded under such agreement and to net amounts owed under each transaction to one net amount payable by one party to the other. This right to close out and net payments across all transactions traded under the MSFTA could result in a reduction of the fund’s credit risk to such counterparty equal to any amounts payable by the fund under the applicable transactions, if any.
For mortgage-backed securities traded under a MSFTA, the collateral and margining requirements are contract specific. Collateral amounts across all transactions traded under such agreement are netted and one amount is posted from one party to the other to collateralize such obligations. Cash that has been pledged to cover the fund’s collateral or margin obligations under a MSFTA, if any, will be reported separately on the Statement of Assets and Liabilities as restricted cash. Securities pledged as collateral or margin for the same purpose, if any, are noted in the Portfolio of Investments.
46
Table of Contents
Notes to Financial Statements – continued
Fees Paid Indirectly – The fund’s custody fee may be reduced according to an arrangement that measures the value of cash deposited with the custodian by the fund. This amount, for the year ended September 30, 2014, is shown as a reduction of total expenses in the Statement of Operations.
Tax Matters and Distributions – The fund intends to qualify as a regulated investment company, as defined under Subchapter M of the Internal Revenue Code, and to distribute all of its taxable income, including realized capital gains. As a result, no provision for federal income tax is required. The fund’s federal tax returns, when filed, will remain subject to examination by the Internal Revenue Service for a three year period. Management has analyzed the fund’s tax positions taken on federal and state tax returns for all open tax years and does not believe that there are any uncertain tax positions that require recognition of a tax liability. Foreign taxes, if any, have been accrued by the fund in the accompanying financial statements in accordance with the applicable foreign tax law. Foreign income taxes may be withheld by certain countries in which the fund invests. Additionally, capital gains realized by the fund on securities issued in or by certain foreign countries may be subject to capital gains tax imposed by those countries.
Distributions to shareholders are recorded on the ex-dividend date. Income and capital gain distributions are determined in accordance with income tax regulations, which may differ from U.S. generally accepted accounting principles. Certain capital accounts in the financial statements are periodically adjusted for permanent differences in order to reflect their tax character. These adjustments have no impact on net assets or net asset value per share. Temporary differences which arise from recognizing certain items of income, expense, gain or loss in different periods for financial statement and tax purposes will reverse at some time in the future. Distributions in excess of net investment income or net realized gains are temporary overdistributions for financial statement purposes resulting from differences in the recognition or classification of income or distributions for financial statement and tax purposes.
Book/tax differences primarily relate to amortization and accretion of debt securities, wash sale loss deferrals, and treating a portion of the proceeds from redemptions as a distribution for tax purposes.
The tax character of distributions declared to shareholders for the last two fiscal years is as follows:
| 9/30/14 | 9/30/13 | |||||||
| Ordinary income (including any short-term capital gains) | $135,073,438 | $127,400,078 | ||||||
| Long-term capital gains | 52,872,854 | — | ||||||
| Total distributions | $187,946,292 | $127,400,078 | ||||||
47
Table of Contents
Notes to Financial Statements – continued
The federal tax cost and the tax basis components of distributable earnings were as follows:
| As of 9/30/14 | ||||
| Cost of investments | $5,731,066,508 | |||
| Gross appreciation | 1,275,047,022 | |||
| Gross depreciation | (57,585,575 | ) | ||
| Net unrealized appreciation (depreciation) | $1,217,461,447 | |||
| Undistributed ordinary income | 35,220,399 | |||
| Undistributed long-term capital gain | 131,233,990 | |||
| Other temporary differences | (12,070,492 | ) | ||
Multiple Classes of Shares of Beneficial Interest – The fund offers multiple classes of shares, which differ in their respective distribution, service, and program manager fees. The fund’s income, realized and unrealized gain (loss) and common expenses are allocated to shareholders based on the daily net assets of each class. Dividends are declared separately for each class. Differences in per share dividend rates are generally due to differences in separate class expenses. Class B and Class 529B shares will convert to Class A and Class 529A shares, respectively, approximately eight years after purchase. The fund’s distributions declared to shareholders as reported in the Statements of Changes in Net Assets are presented by class as follows:
| From net investment income | From net realized gain on investments | |||||||||||||||
| Year ended 9/30/14 | Year ended 9/30/13 | Year ended 9/30/14 | Year ended 9/30/13 | |||||||||||||
| Class A | $99,800,404 | $95,698,620 | $36,966,691 | $— | ||||||||||||
| Class B | 3,614,199 | 4,526,965 | 2,228,939 | — | ||||||||||||
| Class C | 12,549,041 | 11,789,351 | 7,074,755 | — | ||||||||||||
| Class I | 4,555,166 | 3,453,649 | 1,448,279 | — | ||||||||||||
| Class R1 | 235,348 | 251,731 | 135,153 | — | ||||||||||||
| Class R2 | 3,157,219 | 3,108,354 | 1,331,830 | — | ||||||||||||
| Class R3 | 4,872,366 | 4,236,128 | 1,757,452 | — | ||||||||||||
| Class R4 | 5,144,517 | 3,837,284 | 1,624,013 | — | ||||||||||||
| Class R5 | 646,869 | 46,974 | 92,808 | — | ||||||||||||
| Class 529A | 364,603 | 317,509 | 133,546 | — | ||||||||||||
| Class 529B | 30,680 | 37,884 | 19,872 | — | ||||||||||||
| Class 529C | 103,026 | 95,629 | 59,516 | — | ||||||||||||
| Total | $135,073,438 | $127,400,078 | $52,872,854 | $— | ||||||||||||
(3) Transactions with Affiliates
Investment Adviser – The fund has an investment advisory agreement with MFS to provide overall investment management and related administrative services and facilities to the fund. The management fee is computed daily and paid monthly at the following annual rates:
| First $6.3 billion of average daily net assets | 0.35 | % | ||
| Average daily net assets in excess of $6.3 billion | 0.34 | % |
48
Table of Contents
Notes to Financial Statements – continued
The management fee incurred for the year ended September 30, 2014 was equivalent to an annual effective rate of 0.35% of the fund’s average daily net assets.
Distributor – MFS Fund Distributors, Inc. (MFD), a wholly-owned subsidiary of MFS, as distributor, received $1,343,526 and $9,966 for the year ended September 30, 2014, as its portion of the initial sales charge on sales of Class A and Class 529A shares of the fund, respectively.
The Board of Trustees has adopted a distribution plan for certain share classes pursuant to Rule 12b-1 of the Investment Company Act of 1940.
The fund’s distribution plan provides that the fund will pay MFD for services provided by MFD and financial intermediaries in connection with the distribution and servicing of certain share classes. One component of the plan is a distribution fee paid to MFD and another component of the plan is a service fee paid to MFD. MFD may subsequently pay all, or a portion, of the distribution and/or service fees to financial intermediaries.
Distribution Plan Fee Table:
| Distribution Fee Rate (d) | Service Fee Rate (d) | Total Distribution Plan (d) | Annual Effective Rate (e) | Distribution and Service Fee | ||||||||||||||||
| Class A | — | 0.25% | 0.25% | 0.24% | $11,559,745 | |||||||||||||||
| Class B | 0.75% | 0.25% | 1.00% | 1.00% | 2,641,017 | |||||||||||||||
| Class C | 0.75% | 0.25% | 1.00% | 1.00% | 9,011,987 | |||||||||||||||
| Class R1 | 0.75% | 0.25% | 1.00% | 1.00% | 168,573 | |||||||||||||||
| Class R2 | 0.25% | 0.25% | 0.50% | 0.50% | 835,048 | |||||||||||||||
| Class R3 | — | 0.25% | 0.25% | 0.25% | 557,634 | |||||||||||||||
| Class 529A | — | 0.25% | 0.25% | 0.24% | 42,775 | |||||||||||||||
| Class 529B | 0.75% | 0.25% | 1.00% | 1.00% | 23,299 | |||||||||||||||
| Class 529C | 0.75% | 0.25% | 1.00% | 1.00% | 76,431 | |||||||||||||||
| Total Distribution and Service Fees | $24,916,509 | |||||||||||||||||||
| (d) | In accordance with the distribution plan for certain classes, the fund pays distribution and/or service fees equal to these annual percentage rates of each class’s average daily net assets. The distribution and service fee rates disclosed by class represent the current rates in effect at the end of the reporting period. Any rate changes, if applicable, are detailed below. |
| (e) | The annual effective rates represent actual fees incurred under the distribution plan for the year ended September 30, 2014 based on each class’s average daily net assets. MFD has voluntarily agreed to rebate a portion of each class’s 0.25% service fee attributable to accounts for which MFD retains the 0.25% service fee except for accounts attributable to MFS or its affiliates’ seed money. For the year ended September 30, 2014, this rebate amounted to $246,375, $2,336, $5,213, $1,425, $2,237, $24, and $211 for Class A, Class B, Class C, Class R3, Class 529A, Class 529B, and Class 529C, respectively, and is included in the reduction of total expenses in the Statement of Operations. |
Certain Class A shares are subject to a contingent deferred sales charge (CDSC) in the event of a shareholder redemption within 18 months of purchase for shares purchased on or after August 1, 2012, and within 24 months of purchase for shares purchased prior to August 1, 2012. Class C and Class 529C shares are subject to a CDSC in the event of a shareholder redemption within 12 months of purchase. Class B and Class 529B shares are subject to a CDSC in the event of a shareholder redemption
49
Table of Contents
Notes to Financial Statements – continued
within six years of purchase. All contingent deferred sales charges are paid to MFD and during the year ended September 30, 2014, were as follows:
| Amount | ||||
| Class A | $13,303 | |||
| Class B | 237,923 | |||
| Class C | 46,948 | |||
| Class 529B | 668 | |||
| Class 529C | 96 | |||
The fund has entered into and may from time to time enter into contracts with program managers and other parties which administer the tuition programs through which an investment in the fund’s 529 share classes is made. The fund has entered into an agreement with MFD pursuant to which MFD receives an annual fee of up to 0.10% of the average daily net assets attributable to each 529 share class. MFD has agreed to waive a portion of this fee in an amount equal to 0.05% of the average daily net assets for each 529 share class. This waiver agreement will expire on January 31, 2016, unless MFD elects to extend the waiver. For the year ended September 30, 2014, this waiver amounted to $13,542 and is included in the reduction of total expenses in the Statement of Operations. The program manager fee incurred for the year ended September 30, 2014 was equivalent to an annual effective rate of 0.05% of the average daily net assets attributable to each 529 share class. The services provided by MFD, or a third party with which MFD contracts, include recordkeeping and tax reporting and account services, as well as services designed to maintain the program’s compliance with the Internal Revenue Code and other regulatory requirements. Program manager fees and waivers for the year ended September 30, 2014, were as follows:
| Fee | Waiver | |||||||
| Class 529A | $17,110 | $8,555 | ||||||
| Class 529B | 2,330 | 1,165 | ||||||
| Class 529C | 7,643 | 3,822 | ||||||
| Total Program Manager Fees and Waivers | $27,083 | $13,542 | ||||||
Shareholder Servicing Agent – MFS Service Center, Inc. (MFSC), a wholly-owned subsidiary of MFS, receives a fee from the fund for its services as shareholder servicing agent calculated as a percentage of the average daily net assets of the fund as determined periodically under the supervision of the fund’s Board of Trustees. For the year ended September 30, 2014, the fee was $1,584,067, which equated to 0.0238% annually of the fund’s average daily net assets. MFSC also receives payment from the fund for out-of-pocket expenses, sub-accounting and other shareholder servicing costs which may be paid to affiliated and unaffiliated service providers. Class R5 shares do not incur sub-accounting fees. For the year ended September 30, 2014, these out-of-pocket expenses, sub-accounting and other shareholder servicing costs amounted to $5,614,664.
Administrator – MFS provides certain financial, legal, shareholder communications, compliance, and other administrative services to the fund. Under an administrative services agreement, the fund partially reimburses MFS the costs incurred to provide these services. The fund is charged an annual fixed amount of $17,500 plus a fee
50
Table of Contents
Notes to Financial Statements – continued
based on average daily net assets. The administrative services fee incurred for the year ended September 30, 2014 was equivalent to an annual effective rate of 0.0075% of the fund’s average daily net assets.
Trustees’ and Officers’ Compensation – The fund pays compensation to independent Trustees in the form of a retainer, attendance fees, and additional compensation to Board and Committee chairpersons. The fund does not pay compensation directly to Trustees or officers of the fund who are also officers of the investment adviser, all of whom receive remuneration for their services to the fund from MFS. Certain officers and Trustees of the fund are officers or directors of MFS, MFD, and MFSC.
Prior to December 31, 2001, the fund had an unfunded defined benefit plan (“DB plan”) for independent Trustees. As of December 31, 2001, the Board took action to terminate the DB plan with respect to then-current and any future independent Trustees, such that the DB plan covers only certain of those former independent Trustees who retired on or before December 31, 2001. Effective January 1, 2002, accrued benefits under the DB plan for then-current independent Trustees who continued were credited to an unfunded retirement deferral plan (the “Retirement Deferral plan”), which was established for and exists solely with respect to these credited amounts, and is not available for other deferrals by these or other independent Trustees. Although the Retirement Deferral plan is unfunded, amounts deferred under the plan are periodically adjusted for investment experience as if they had been invested in shares of the fund. The DB plan resulted in a pension expense of $4,628 and the Retirement Deferral plan resulted in an expense of $8,666. Both amounts are included in independent Trustees’ compensation for the year ended September 30, 2014. The liability for deferred retirement benefits payable to certain independent Trustees under both plans amounted to $87,685 at September 30, 2014, and is included in “Payable for independent Trustees’ compensation” in the Statement of Assets and Liabilities.
Deferred Trustee Compensation – Under a Deferred Compensation Plan (the “Plan”), independent Trustees previously were allowed to elect to defer receipt of all or a portion of their annual compensation. Effective January 1, 2005, the Board elected to no longer allow Trustees to defer receipt of future compensation under the Plan. Amounts deferred under the Plan are invested in shares of certain MFS Funds selected by the independent Trustees as notional investments. Deferred amounts represent an unsecured obligation of the fund until distributed in accordance with the Plan. Included in “Other assets” and “Payable for independent Trustees’ compensation” in the Statement of Assets and Liabilities is $46,560 of deferred Trustees’ compensation. There is no current year expense associated with the Plan.
Other – This fund and certain other funds managed by MFS (the funds) have entered into services agreements (the Agreements) which provide for payment of fees by the funds to Tarantino LLC and Griffin Compliance LLC in return for the provision of services of an Independent Chief Compliance Officer (ICCO) and Assistant ICCO, respectively, for the funds. The funds can terminate the Agreements with Tarantino LLC and Griffin Compliance LLC at any time under the terms of the Agreements. Frank L. Tarantino serves as the ICCO and is an officer of the funds and the sole member of Tarantino LLC. Prior to June 1, 2014, Robyn L. Griffin served as the Assistant ICCO and was an officer of the funds. Ms. Griffin is the sole member of Griffin Compliance LLC. Effective May 31, 2014, Ms. Griffin resigned as Assistant ICCO
51
Table of Contents
Notes to Financial Statements – continued
and the service agreement between the funds and Griffin Compliance LLC was terminated. For the year ended September 30, 2014, the aggregate fees paid by the fund to Tarantino LLC and Griffin Compliance LLC were $33,653 and are included in “Miscellaneous” expense in the Statement of Operations. MFS has agreed to reimburse the fund for a portion of the payments made by the fund in the amount of $10,453, which is included in the reduction of total expenses in the Statement of Operations. Additionally, MFS has agreed to bear all expenses associated with office space, other administrative support, and supplies provided to the ICCO and Assistant ICCO. On October 31, 2014, Mr. Tarantino resigned as ICCO and the service agreement between the funds and Tarantino LLC for the services of an ICCO was terminated. Effective November 1, 2014, the funds entered into a service agreement which provides for payment of fees solely by the funds to Tarantino LLC in return for the provision of services of an Independent Senior Officer (ISO). Additionally, MFS has agreed to bear all expenses associated with office space, other administrative support, and supplies provided to the ISO.
The fund invests in the MFS Institutional Money Market Portfolio which is managed by MFS and seeks current income consistent with preservation of capital and liquidity. Income earned on this investment is included in “Dividends from underlying affiliated funds” in the Statement of Operations. This money market fund does not pay a management fee to MFS.
(4) Portfolio Securities
For the year ended September 30, 2014, purchases and sales of investments, other than short-term obligations, were as follows:
| Purchases | Sales | |||||||
| U.S. Government securities | $1,336,551,301 | $1,276,297,092 | ||||||
| Investments (non-U.S. Government securities) | $956,185,334 | $1,042,717,986 | ||||||
(5) Shares of Beneficial Interest
The fund’s Declaration of Trust permits the Trustees to issue an unlimited number of full and fractional shares of beneficial interest. Transactions in fund shares were as follows:
| Year ended 9/30/14 | Year ended 9/30/13 | |||||||||||||||
| Shares | Amount | Shares | Amount | |||||||||||||
| Shares sold | ||||||||||||||||
Class A | 26,720,918 | $474,805,818 | 28,587,194 | $462,225,296 | ||||||||||||
Class B | 1,707,369 | 30,335,427 | 1,817,829 | 29,363,962 | ||||||||||||
Class C | 7,681,898 | 137,041,572 | 6,734,514 | 109,724,622 | ||||||||||||
Class I | 4,694,486 | 84,285,999 | 3,292,430 | 53,482,173 | ||||||||||||
Class R1 | 140,252 | 2,483,335 | 142,348 | 2,272,583 | ||||||||||||
Class R2 | 1,563,168 | 27,806,634 | 2,000,520 | 32,319,484 | ||||||||||||
Class R3 | 7,238,038 | 129,331,952 | 2,622,978 | 42,281,654 | ||||||||||||
Class R4 | 5,468,706 | 97,224,459 | 3,892,116 | 62,372,951 | ||||||||||||
Class R5 | 1,354,351 | 23,871,832 | 654,694 | 10,906,838 | ||||||||||||
Class 529A | 162,835 | 2,892,072 | 176,141 | 2,814,514 | ||||||||||||
Class 529B | 16,199 | 286,907 | 15,927 | 255,439 | ||||||||||||
Class 529C | 65,910 | 1,175,391 | 70,818 | 1,131,300 | ||||||||||||
| 56,814,130 | $1,011,541,398 | 50,007,509 | $809,150,816 | |||||||||||||
52
Table of Contents
Notes to Financial Statements – continued
| Year ended 9/30/14 | Year ended 9/30/13 | |||||||||||||||
| Shares | Amount | Shares | Amount | |||||||||||||
| Shares issued to shareholders in reinvestment of distributions | ||||||||||||||||
Class A | 7,189,229 | $127,373,219 | 5,477,174 | $87,322,887 | ||||||||||||
Class B | 302,657 | 5,346,775 | 262,015 | 4,154,060 | ||||||||||||
Class C | 862,066 | 15,316,298 | 551,090 | 8,809,130 | ||||||||||||
Class I | 293,975 | 5,214,499 | 174,926 | 2,801,697 | ||||||||||||
Class R1 | 20,992 | 370,483 | 15,860 | 251,523 | ||||||||||||
Class R2 | 224,701 | 3,988,282 | 173,195 | 2,765,582 | ||||||||||||
Class R3 | 373,706 | 6,629,603 | 265,893 | 4,235,639 | ||||||||||||
Class R4 | 332,160 | 5,897,491 | 216,627 | 3,467,673 | ||||||||||||
Class R5 | 41,424 | 739,677 | 2,846 | 46,974 | ||||||||||||
Class 529A | 28,142 | 497,804 | 19,914 | 317,269 | ||||||||||||
Class 529B | 2,863 | 50,552 | 2,392 | 37,884 | ||||||||||||
Class 529C | 9,144 | 162,431 | 5,984 | 95,618 | ||||||||||||
| 9,681,059 | $171,587,114 | 7,167,916 | $114,305,936 | |||||||||||||
| Shares reacquired | ||||||||||||||||
Class A | (41,711,551 | ) | $(742,975,632 | ) | (45,049,721 | ) | $(718,786,408 | ) | ||||||||
Class B | (4,614,501 | ) | (81,934,444 | ) | (8,060,850 | ) | (129,303,032 | ) | ||||||||
Class C | (7,197,741 | ) | (128,385,694 | ) | (8,057,529 | ) | (129,289,867 | ) | ||||||||
Class I | (2,067,766 | ) | (36,663,011 | ) | (1,920,550 | ) | (30,998,768 | ) | ||||||||
Class R1 | (192,312 | ) | (3,411,172 | ) | (374,542 | ) | (5,925,846 | ) | ||||||||
Class R2 | (2,295,668 | ) | (40,800,712 | ) | (2,704,051 | ) | (43,158,089 | ) | ||||||||
Class R3 | (4,140,874 | ) | (74,323,116 | ) | (4,897,623 | ) | (78,578,597 | ) | ||||||||
Class R4 | (2,928,662 | ) | (51,818,416 | ) | (1,493,102 | ) | (23,911,214 | ) | ||||||||
Class R5 | (184,310 | ) | (3,281,681 | ) | (20,495 | ) | (339,003 | ) | ||||||||
Class 529A | (140,143 | ) | (2,498,686 | ) | (126,666 | ) | (2,020,297 | ) | ||||||||
Class 529B | (44,146 | ) | (788,008 | ) | (80,740 | ) | (1,286,883 | ) | ||||||||
Class 529C | (56,076 | ) | (1,006,476 | ) | (56,914 | ) | (919,064 | ) | ||||||||
| (65,573,750 | ) | $(1,167,887,048 | ) | (72,842,783 | ) | $(1,164,517,068 | ) | |||||||||
| Net change | ||||||||||||||||
Class A | (7,801,404 | ) | $(140,796,595 | ) | (10,985,353 | ) | $(169,238,225 | ) | ||||||||
Class B | (2,604,475 | ) | (46,252,242 | ) | (5,981,006 | ) | (95,785,010 | ) | ||||||||
Class C | 1,346,223 | 23,972,176 | (771,925 | ) | (10,756,115 | ) | ||||||||||
Class I | 2,920,695 | 52,837,487 | 1,546,806 | 25,285,102 | ||||||||||||
Class R1 | (31,068 | ) | (557,354 | ) | (216,334 | ) | (3,401,740 | ) | ||||||||
Class R2 | (507,799 | ) | (9,005,796 | ) | (530,336 | ) | (8,073,023 | ) | ||||||||
Class R3 | 3,470,870 | 61,638,439 | (2,008,752 | ) | (32,061,304 | ) | ||||||||||
Class R4 | 2,872,204 | 51,303,534 | 2,615,641 | 41,929,410 | ||||||||||||
Class R5 | 1,211,465 | 21,329,828 | 637,045 | 10,614,809 | ||||||||||||
Class 529A | 50,834 | 891,190 | 69,389 | 1,111,486 | ||||||||||||
Class 529B | (25,084 | ) | (450,549 | ) | (62,421 | ) | (993,560 | ) | ||||||||
Class 529C | 18,978 | 331,346 | 19,888 | 307,854 | ||||||||||||
| 921,439 | $15,241,464 | (15,667,358 | ) | $(241,060,316 | ) | |||||||||||
53
Table of Contents
Notes to Financial Statements – continued
(6) Line of Credit
The fund and certain other funds managed by MFS participate in a $1.1 billion unsecured committed line of credit, subject to a $1 billion sublimit, provided by a syndication of banks under a credit agreement. Borrowings may be made for temporary financing needs. Interest is charged to each fund, based on its borrowings, generally at a rate equal to the higher of the Federal Reserve funds rate or one month LIBOR plus an agreed upon spread. A commitment fee, based on the average daily, unused portion of the committed line of credit, is allocated among the participating funds at the end of each calendar quarter. In addition, the fund and other funds managed by MFS have established unsecured uncommitted borrowing arrangements with certain banks for temporary financing needs. Interest is charged to each fund, based on its borrowings, at a rate equal to the Federal Reserve funds rate plus an agreed upon spread. For the year ended September 30, 2014, the fund’s commitment fee and interest expense were $25,206 and $0, respectively, and are included in “Miscellaneous” expense in the Statement of Operations.
(7) Transactions in Underlying Affiliated Funds-Affiliated Issuers
An affiliated issuer may be considered one in which the fund owns 5% or more of the outstanding voting securities, or a company which is under common control. For the purposes of this report, the fund assumes the following to be an affiliated issuer:
| Underlying Affiliated Fund | Beginning Shares/Par Amount | Acquisitions Shares/Par Amount | Dispositions Shares/Par Amount | Ending Shares/Par Amount | ||||||||||||
| MFS Institutional Money Market Portfolio | 216,107,428 | 656,031,311 | (612,982,247 | ) | 259,156,492 | |||||||||||
| Underlying Affiliated Fund | Realized Gain (Loss) | Capital Gain Distributions | Dividend Income | Ending Value | ||||||||||||
| MFS Institutional Money Market Portfolio | $— | $— | $211,996 | $259,156,492 | ||||||||||||
54
Table of Contents
REPORT OF INDEPENDENT REGISTERED PUBLIC ACCOUNTING FIRM
To the Board of Trustees of MFS Series Trust V and the Shareholders of MFS Total Return Fund:
We have audited the accompanying statement of assets and liabilities, including the portfolio of investments, of MFS Total Return Fund (one of the series of MFS Series Trust V) (the “Fund”) as of September 30, 2014, and the related statement of operations for the year then ended, the statements of changes in net assets for each of the two years in the period then ended, and the financial highlights for each of the five years in the period then ended. These financial statements and financial highlights are the responsibility of the Fund’s management. Our responsibility is to express an opinion on these financial statements and financial highlights based on our audits.
We conducted our audits in accordance with the standards of the Public Company Accounting Oversight Board (United States). Those standards require that we plan and perform the audit to obtain reasonable assurance about whether the financial statements and financial highlights are free of material misstatement. The Fund is not required to have, nor were we engaged to perform, an audit of its internal control over financial reporting. Our audits included consideration of internal control over financial reporting as a basis for designing audit procedures that are appropriate in the circumstances, but not for the purpose of expressing an opinion on the effectiveness of the Fund’s internal control over financial reporting. Accordingly, we express no such opinion. An audit also includes examining, on a test basis, evidence supporting the amounts and disclosures in the financial statements, assessing the accounting principles used and significant estimates made by management, as well as evaluating the overall financial statement presentation. Our procedures included confirmation of securities owned as of September 30, 2014, by correspondence with the custodian and brokers; where replies were not received from brokers, we performed other auditing procedures. We believe that our audits provide a reasonable basis for our opinion.
In our opinion, the financial statements and financial highlights referred to above present fairly, in all material respects, the financial position of MFS Total Return Fund as of September 30, 2014, the results of its operations for the year then ended, the changes in its net assets for each of the two years in the period then ended, and the financial highlights for each of the five years in the period then ended, in conformity with accounting principles generally accepted in the United States of America.
DELOITTE & TOUCHE LLP
Boston, Massachusetts
November 14, 2014
55
Table of Contents
TRUSTEES AND OFFICERS — IDENTIFICATION AND BACKGROUND
The Trustees and Officers of the Trust, as of November 1, 2014, are listed below, together with their principal occupations during the past five years. (Their titles may have varied during that period.) The address of each Trustee and Officer is 111 Huntington Avenue, Boston, Massachusetts 02199-7618.
Name, Age | Position(s) Held with Fund | Trustee/Officer Since (h) | Principal the Past Five Years | Other Directorships (j) | ||||
| INTERESTED TRUSTEES | ||||||||
Robert J. Manning (k) (age 51) | Trustee | February 2004 | Massachusetts Financial Services Company, Chairman, Chief Executive Officer and Director; President (until 2009); Chief Investment Officer (until 2010) | N/A | ||||
Robin A. Stelmach (k) (age 53) | Trustee and President | January 2014 | Massachusetts Financial Services Company, Executive Vice President and Chief Operating Officer | N/A | ||||
| INDEPENDENT TRUSTEES | ||||||||
David H. Gunning (age 72) | Trustee and Chair of Trustees | January 2004 | Private investor | Lincoln Electric Holdings, Inc. (welding equipment manufacturer), Director; Development Alternatives, Inc. (consulting), Director/ Non-Executive Chairman | ||||
Steven E. Buller (age 63) | Trustee | February 2014 | Chairman, Financial Accounting Standards Advisory Council; Standing Advisory Group, Public Company Accounting Oversight Board, Member; BlackRock, Inc. (investment management), Managing Director (until 2014), BlackRock Finco UK (investment management), Director (until 2014) | N/A | ||||
56
Table of Contents
Trustees and Officers – continued
Name, Age | Position(s) Held with Fund | Trustee/Officer Since (h) | Principal the Past Five Years | Other Directorships (j) | ||||
Robert E. Butler (age 72) | Trustee | January 2006 | Consultant – investment company industry regulatory and compliance matters | N/A | ||||
Maureen R. Goldfarb (age 59) | Trustee | January 2009 | Private investor | N/A | ||||
William R. Gutow (age 73) | Trustee | December 1993 | Private investor and real estate consultant; Capitol Entertainment Management Company (video franchise), Vice Chairman | Texas Donuts (donut franchise), Vice Chairman (until 2010) | ||||
Michael Hegarty (age 69) | Trustee | December 2004 | Private investor | Brookfield Office Properties, Inc. (real estate), Director; Rouse Properties Inc. (real estate), Director; Capmark Financial Group Inc. (real estate), Director | ||||
John P. Kavanaugh (age 59) | Trustee | January 2009 | Private investor | N/A | ||||
Maryanne L. Roepke (age 58) | Trustee | May 2014 | American Century Investments (investment management), Senior Vice President and Chief Compliance Officer (until 2014) | N/A | ||||
Laurie J. Thomsen (age 57) | Trustee | March 2005 | Private investor; New Profit, Inc. (venture philanthropy), Executive Partner (until 2010) | The Travelers Companies (insurance), Director | ||||
Robert W. Uek (age 73) | Trustee | January 2006 | Consultant to investment company industry | N/A | ||||
| OFFICERS | ||||||||
Christopher R. Bohane (k) (age 40) | Assistant Secretary and Assistant Clerk | July 2005 | Massachusetts Financial Services Company, Vice President and Assistant General Counsel | N/A | ||||
Kino Clark (k) (age 46) | Assistant Treasurer | January 2012 | Massachusetts Financial Services Company, Vice President | N/A |
57
Table of Contents
Trustees and Officers – continued
Name, Age | Position(s) Held with Fund | Trustee/Officer Since (h) | Principal the Past Five Years | Other Directorships (j) | ||||
Thomas H. Connors (k) (age 55) | Assistant Secretary and Assistant Clerk | September 2012 | Massachusetts Financial Services Company, Vice President and Senior Counsel; Deutsche Investment Management Americas Inc. (financial service provider), Director and Senior Counsel (until 2012) | N/A | ||||
Ethan D. Corey (k) (age 50) | Assistant Secretary and Assistant Clerk | July 2005 | Massachusetts Financial Services Company, Senior Vice President and Associate General Counsel | N/A | ||||
David L. DiLorenzo (k) (age 46) | Treasurer | July 2005 | Massachusetts Financial Services Company, Senior Vice President | N/A | ||||
Timothy M. Fagan (k) (age 46) | Chief Compliance Officer | November 2014 | Massachusetts Financial Services Company, Chief Compliance Officer; Vice President and Senior Counsel (until 2012) | N/A | ||||
Brian E. Langenfeld (k) (age 41) | Assistant Secretary and Assistant Clerk | June 2006 | Massachusetts Financial Services Company, Vice President and Senior Counsel | N/A | ||||
Susan S. Newton (k) (age 64) | Assistant Secretary and Assistant Clerk | May 2005 | Massachusetts Financial Services Company, Senior Vice President and Associate General Counsel | N/A | ||||
Susan A. Pereira (k) (age 43) | Assistant Secretary and Assistant Clerk | July 2005 | Massachusetts Financial Services Company, Vice President and Senior Counsel | N/A | ||||
Kasey L. Phillips (k) (age 43) | Assistant Treasurer | September 2012 | Massachusetts Financial Services Company, Vice President; Wells Fargo Funds Management, LLC, Senior Vice President, Fund Treasurer (until 2012) | N/A |
58
Table of Contents
Trustees and Officers – continued
Name, Age | Position(s) Held with Fund | Trustee/Officer Since (h) | Principal the Past Five Years | Other Directorships (j) | ||||
Mark N. Polebaum (k) (age 62) | Secretary and Clerk | January 2006 | Massachusetts Financial Services Company, Executive Vice President, General Counsel and Secretary | N/A | ||||
Matthew A. Stowe (age 39) | Assistant Secretary and Assistant Clerk | October 2014 | Massachusetts Financial Services Company, Vice President and Senior Counsel | N/A | ||||
Frank L. Tarantino (age 70) | Independent Senior Officer | June 2004 | Tarantino LLC (provider of compliance services), Principal | N/A | ||||
Richard S. Weitzel (k) (age 44) | Assistant Secretary and Assistant Clerk | October 2007 | Massachusetts Financial Services Company, Senior Vice President and Associate General Counsel | N/A | ||||
James O. Yost (k) (age 54) | Deputy Treasurer | September 1990 | Massachusetts Financial Services Company, Senior Vice President | N/A |
| (h) | Date first appointed to serve as Trustee/officer of an MFS Fund. Each Trustee has served continuously since appointment unless indicated otherwise. For the period from December 15, 2004 until February 22, 2005, Mr. Manning served as Advisory Trustee. Prior to January 2012, Messrs. DiLorenzo and Yost served as Assistant Treasurers of the Funds. Ms. Stelmach was appointed as President of the Funds as of October 1, 2014. |
| (j) | Directorships or trusteeships of companies required to report to the Securities and Exchange Commission (i.e., “public companies”). |
| (k) | “Interested person” of the Trust within the meaning of the Investment Company Act of 1940 (referred to as the 1940 Act), which is the principal federal law governing investment companies like the fund, as a result of position with MFS. The address of MFS is 111 Huntington Avenue, Boston, Massachusetts 02199-7618. |
Each Trustee (except Ms. Stelmach, Mr. Buller and Ms. Roepke) has been elected by shareholders and each Trustee and officer holds office until his or her successor is chosen and qualified or until his or her earlier death, resignation, retirement or removal. The Trust does not hold annual meetings for the purpose of electing Trustees, and Trustees are not elected for fixed terms. Messrs. Butler, Kavanaugh, Uek and Mses. Thomsen and Roepke are members of the Trust’s Audit Committee.
Each of the Fund’s Trustees and officers holds comparable positions with certain other funds of which MFS or a subsidiary is the investment adviser or distributor, and, in the case of the officers, with certain affiliates of MFS. As of January 1, 2014, the Trustees served as board members of 142 funds within the MFS Family of Funds.
59
Table of Contents
Trustees and Officers – continued
The Statement of Additional Information for the Fund includes further information about the Trustees and is available without charge upon request by calling 1-800-225-2606.
| Investment Adviser | Custodian | |
| Massachusetts Financial Services Company 111 Huntington Avenue Boston, MA 02199-7618 | JPMorgan Chase Bank, NA 4 Metrotech Center New York, NY 11245 | |
| Distributor | Independent Registered Public Accounting Firm | |
| MFS Fund Distributors, Inc. 111 Huntington Avenue Boston, MA 02199-7618 | Deloitte & Touche LLP 200 Berkeley Street Boston, MA 02116 | |
| Portfolio Managers | ||
Nevin Chitkara William Douglas Steven Gorham Richard Hawkins Joshua Marston Jonathan Sage Brooks Taylor |
60
Table of Contents
BOARD REVIEW OF INVESTMENT ADVISORY AGREEMENT
The Investment Company Act of 1940 requires that both the full Board of Trustees and a majority of the non-interested (“independent”) Trustees, voting separately, annually approve the continuation of the Fund’s investment advisory agreement with MFS. The Trustees consider matters bearing on the Fund and its advisory arrangements at their meetings throughout the year, including a review of performance data at each regular meeting. In addition, the independent Trustees met several times over the course of three months beginning in May and ending in July, 2014 (“contract review meetings”) for the specific purpose of considering whether to approve the continuation of the investment advisory agreement for the Fund and the other investment companies that the Board oversees (the “MFS Funds”). The independent Trustees were assisted in their evaluation of the Fund’s investment advisory agreement by independent legal counsel, from whom they received separate legal advice and with whom they met separately from MFS during various contract review meetings. The independent Trustees were also assisted in this process by the MFS Funds’ Independent Chief Compliance Officer, a full-time senior officer appointed by and reporting to the independent Trustees.
In connection with their deliberations regarding the continuation of the investment advisory agreement, the Trustees, including the independent Trustees, considered such information and factors as they believed, in light of the legal advice furnished to them and their own business judgment, to be relevant. The investment advisory agreement for the Fund was considered separately, although the Trustees also took into account the common interests of all MFS Funds in their review. As described below, the Trustees considered the nature, quality, and extent of the various investment advisory, administrative, and shareholder services performed by MFS under the existing investment advisory agreement and other arrangements with the Fund.
In connection with their contract review meetings, the Trustees received and relied upon materials that included, among other items: (i) information provided by Lipper Inc., an independent third party, on the investment performance of the Fund for various time periods ended December 31, 2013 and the investment performance of a group of funds with substantially similar investment classifications/objectives (the “Lipper performance universe”), (ii) information provided by Lipper Inc. on the Fund’s advisory fees and other expenses and the advisory fees and other expenses of comparable funds identified by Lipper Inc. (the “Lipper expense group”), (iii) information provided by MFS on the advisory fees of comparable portfolios of other clients of MFS, including institutional separate accounts and other clients, (iv) information as to whether and to what extent applicable expense waivers, reimbursements or fee “breakpoints” are observed for the Fund, (v) information regarding MFS’ financial results and financial condition, including MFS’ and certain of its affiliates’ estimated profitability from services performed for the Fund and the MFS Funds as a whole, and compared to MFS’ institutional business, (vi) MFS’ views regarding the outlook for the mutual fund industry and the strategic business plans of MFS, (vii) descriptions of various functions performed by MFS for the Funds, such as compliance monitoring and portfolio trading practices, and (viii) information regarding the overall organization of MFS, including information about MFS’ senior management and other personnel providing investment advisory, administrative and other services to
61
Table of Contents
Board Review of Investment Advisory Agreement – continued
the Fund and the other MFS Funds. The comparative performance, fee and expense information prepared and provided by Lipper Inc. was not independently verified and the independent Trustees did not independently verify any information provided to them by MFS.
The Trustees’ conclusion as to the continuation of the investment advisory agreement was based on a comprehensive consideration of all information provided to the Trustees and not the result of any single factor. Some of the factors that figured particularly in the Trustees’ deliberations are described below, although individual Trustees may have evaluated the information presented differently from one another, giving different weights to various factors. It is also important to recognize that the fee arrangements for the Fund and other MFS Funds are the result of years of review and discussion between the independent Trustees and MFS, that certain aspects of such arrangements may receive greater scrutiny in some years than in others, and that the Trustees’ conclusions may be based, in part, on their consideration of these same arrangements during the course of the year and in prior years.
Based on information provided by Lipper Inc. and MFS, the Trustees reviewed the Fund’s total return investment performance as well as the performance of peer groups of funds over various time periods. The Trustees placed particular emphasis on the total return performance of the Fund’s Class A shares in comparison to the performance of funds in its Lipper performance universe over the three-year period ended December 31, 2013, which the Trustees believed was a long enough period to reflect differing market conditions. The total return performance of the Fund’s Class A shares was in the 1st quintile relative to the other funds in the universe for this three-year period (the 1st quintile being the best performers and the 5th quintile being the worst performers). The total return performance of the Fund’s Class A shares was in the 1st quintile for the one-year period and the 3rd quintile for the five-year period ended December 31, 2013 relative to the Lipper performance universe. Because of the passage of time, these performance results may differ from the performance results for more recent periods, including those shown elsewhere in this report.
In the course of their deliberations, the Trustees took into account information provided by MFS in connection with the contract review meetings, as well as during investment review meetings conducted with portfolio management personnel during the course of the year regarding the Fund’s performance. After reviewing these and related factors, the Trustees concluded, within the context of their overall conclusions regarding the investment advisory agreement, that they were satisfied with MFS’ responses and efforts relating to investment performance.
In assessing the reasonableness of the Fund’s advisory fee, the Trustees considered, among other information, the Fund’s advisory fee and the total expense ratio of the Fund’s Class A shares as a percentage of average daily net assets and the advisory fee and total expense ratios of peer groups of funds based on information provided by Lipper Inc. The Trustees considered that, according to the Lipper data (which takes into account any fee reductions or expense limitations that were in effect during the Fund’s last fiscal year), the Fund’s effective advisory fee rate and total expense ratio were each lower than the Lipper expense group median.
62
Table of Contents
Board Review of Investment Advisory Agreement – continued
The Trustees also considered the advisory fees charged by MFS to any comparable institutional accounts. In comparing these fees, the Trustees considered information provided by MFS as to the generally broader scope of services provided by MFS to the Fund in comparison to institutional accounts, the higher demands placed on MFS’ investment personnel and trading infrastructure as a result of the daily cash in-flows and out-flows of the Fund, and the impact on MFS and expenses associated with the more extensive regulatory regime to which the Fund is subject in comparison to institutional accounts.
The Trustees also considered whether the Fund may benefit from any economies of scale in the management of the Fund in the event of growth in assets of the Fund. They noted that the Fund’s advisory fee rate schedule is subject to a contractual breakpoint that reduces the Fund’s advisory fee rate on average daily net assets over $6.3 billion. The Trustees concluded that the breakpoint was sufficient to allow the Fund to benefit from economies of scale as its assets grow.
The Trustees also considered information prepared by MFS relating to MFS’ costs and profits with respect to the Fund, the MFS Funds considered as a group, and other investment companies and accounts advised by MFS, as well as MFS’ methodologies used to determine and allocate its costs to the MFS Funds, the Fund and other accounts and products for purposes of estimating profitability.
After reviewing these and other factors described herein, the Trustees concluded, within the context of their overall conclusions regarding the investment advisory agreement, that the advisory fees charged to the Fund represent reasonable compensation in light of the services being provided by MFS to the Fund.
In addition, the Trustees considered MFS’ resources and related efforts to continue to retain, attract and motivate capable personnel to serve the Fund. The Trustees also considered current and developing conditions in the financial services industry, including the presence of large and well-capitalized companies which are spending, and appear to be prepared to continue to spend, substantial sums to engage personnel and to provide services to competing investment companies. In this regard, the Trustees also considered the financial resources of MFS and its ultimate parent, Sun Life Financial Inc. The Trustees also considered the advantages and possible disadvantages to the Fund of having an adviser that also serves other investment companies as well as other accounts.
The Trustees also considered the nature, quality, cost, and extent of administrative, transfer agency, and distribution services provided to the Fund by MFS and its affiliates under agreements and plans other than the investment advisory agreement, including any 12b-1 fees the Fund pays to MFS Fund Distributors, Inc., an affiliate of MFS. The Trustees also considered the nature, extent and quality of certain other services MFS performs or arranges for on the Fund’s behalf, which may include securities lending programs, directed expense payment programs, class action recovery programs, and MFS’ interaction with third-party service providers, principally custodians and sub-custodians. The Trustees concluded that the various non-advisory services provided by MFS and its affiliates on behalf of the Fund were satisfactory.
The Trustees also considered benefits to MFS from the use of the Fund’s portfolio brokerage commissions, if applicable, to pay for investment research and various other
63
Table of Contents
Board Review of Investment Advisory Agreement – continued
factors. Additionally, the Trustees considered so-called “fall-out benefits” to MFS such as reputational value derived from serving as investment manager to the Fund.
Based on their evaluation of factors that they deemed to be material, including those factors described above, the Board of Trustees, including the independent Trustees, concluded that the Fund’s investment advisory agreement with MFS should be continued for an additional one-year period, commencing August 1, 2014.
64
Table of Contents
PROXY VOTING POLICIES AND INFORMATION
MFS votes proxies on behalf of the fund pursuant to proxy voting policies and procedures that are available without charge, upon request, by calling 1-800-225-2606, by visiting the Proxy Voting section of mfs.com or by visiting the SEC’s Web site at http://www.sec.gov.
Information regarding how the fund voted proxies relating to portfolio securities during the most recent twelve-month period ended June 30 is available without charge by visiting the Proxy Voting section of mfs.com or by visiting the SEC’s Web site at http://www.sec.gov.
QUARTERLY PORTFOLIO DISCLOSURE
The fund will file a complete schedule of portfolio holdings with the Securities and Exchange Commission (the Commission) for the first and third quarters of each fiscal year on Form N-Q. A shareholder can obtain the quarterly portfolio holdings report at mfs.com. The fund’s Form N-Q is also available on the EDGAR database on the Commission’s Internet Web site at http://www.sec.gov, and may be reviewed and copied at the:
Public Reference Room
Securities and Exchange Commission
100 F Street, NE, Room 1580
Washington, D.C. 20549
Information on the operation of the Public Reference Room may be obtained by calling the Commission at 1-800-SEC-0330. Copies of the fund’s Form N-Q also may be obtained, upon payment of a duplicating fee, by electronic request at the following e-mail address: publicinfo@sec.gov or by writing the Public Reference Section at the above address.
From time to time, MFS may post important information about the fund or the MFS funds on the MFS web site (mfs.com). This information is available by visiting the “Market Commentary” and “Announcements” sub sections in the “Market Outlooks” section of mfs.com or by clicking on the fund’s name under “Mutual Funds” in the “Products” section of mfs.com.
FEDERAL TAX INFORMATION (unaudited)
The fund will notify shareholders of amounts for use in preparing 2014 income tax forms in January 2015. The following information is provided pursuant to provisions of the Internal Revenue Code.
The fund designates the maximum amount allowable as qualified dividend income eligible to be taxed at the same rate as long-term capital gain.
The fund designates $71,752,000 as capital gain dividends paid during the fiscal year.
For corporate shareholders, 49.96% of the ordinary income dividends paid during the fiscal year qualify for the corporate dividends received deduction.
65
Table of Contents
rev. 3/11
| WHAT DOES MFS DO WITH YOUR PERSONAL INFORMATION? |  | ||
| Why? | Financial companies choose how they share your personal information. Federal law gives consumers the right to limit some but not all sharing. Federal law also requires us to tell you how we collect, share, and protect your personal information. Please read this notice carefully to understand what we do. |
| What? | The types of personal information we collect and share depend on the product or service you have with us. This information can include:
• Social Security number and account balances • Account transactions and transaction history • Checking account information and wire transfer instructions
When you are no longer our customer, we continue to share your information as described in this notice. |
| How? | All financial companies need to share customers’ personal information to run their everyday business. In the section below, we list the reasons financial companies can share their customers’ personal information; the reasons MFS chooses to share; and whether you can limit this sharing. |
| Reasons we can share your personal information | Does MFS share? | Can you limit this sharing? | ||
For our everyday business purposes – such as to process your transactions, maintain your account(s), respond to court orders and legal investigations, or report to credit bureaus | Yes | No | ||
For our marketing purposes – to offer our products and services to you | No | We don’t share | ||
| For joint marketing with other financial companies | No | We don’t share | ||
For our affiliates’ everyday business purposes – information about your transactions and experiences | No | We don’t share | ||
For our affiliates’ everyday business purposes – information about your creditworthiness | No | We don’t share | ||
| For nonaffiliates to market to you | No | We don’t share |
| Questions? | Call 800-225-2606 or go to mfs.com. |
66
Table of Contents
| Page 2 |
| Who we are | ||
| Who is providing this notice? | MFS Funds, MFS Investment Management, MFS Institutional Advisors, Inc., MFS Fund Distributors, Inc., MFS Heritage Trust Company, and MFS Service Center, Inc. | |
| What we do | ||
| How does MFS protect my personal information? | To protect your personal information from unauthorized access and use, we use security measures that comply with federal law. These measures include procedural, electronic, and physical safeguards for the protection of the personal information we collect about you. | |
| How does MFS collect my personal information? | We collect your personal information, for example, when you
• open an account or provide account information • direct us to buy securities or direct us to sell your securities • make a wire transfer
We also collect your personal information from others, such as credit bureaus, affiliates and other companies. | |
| Why can’t I limit all sharing? | Federal law gives you the right to limit only
• sharing for affiliates’ everyday business purposes – information about your creditworthiness • affiliates from using your information to market to you • sharing for nonaffiliates to market to you
State laws and individual companies may give you additional rights to limit sharing. | |
| Definitions | ||
| Affiliates | Companies related by common ownership or control. They can be financial and nonfinancial companies.
• MFS does not share personal information with affiliates, except for everyday business purposes as described on page one of this notice. | |
| Nonaffiliates | Companies not related by common ownership or control. They can be financial and nonfinancial companies.
• MFS does not share with nonaffiliates so they can market to you. | |
| Joint Marketing | A formal agreement between nonaffiliated financial companies that together market financial products or services to you.
• MFS doesn’t jointly market. | |
| Other important information | ||
| If you own an MFS product or receive an MFS service in the name of a third party such as a bank or broker-dealer, their privacy policy may apply to you instead of ours. | ||
67
Table of Contents
Save paper with eDelivery.
| MFS® will send you prospectuses, |

reports, and proxies directly via e-mail so you will get information faster with less mailbox clutter.
To sign up:
1. Go to mfs.com.
2. Log in via MFS® Access.
3. Select eDelivery.
If you own your MFS fund shares through a financial institution or a retirement plan, MFS® TALK, MFS® Access, or eDelivery may not be available to you.
WEB SITE
mfs.com
MFS TALK
1-800-637-8255
24 hours a day
ACCOUNT SERVICE AND LITERATURE
Shareholders
1-800-225-2606
Financial advisors
1-800-343-2829
Retirement plan services
1-800-637-1255
MAILING ADDRESS
MFS Service Center, Inc.
P.O. Box 55824
Boston, MA 02205-5824
OVERNIGHT MAIL
MFS Service Center, Inc.
c/o Boston Financial Data Services
30 Dan Road
Canton, MA 02021-2809
Table of Contents
| ITEM 2. | CODE OF ETHICS. |
The Registrant has adopted a Code of Ethics pursuant to Section 406 of the Sarbanes-Oxley Act and as defined in Form N-CSR that applies to the Registrant’s principal executive officer and principal financial and accounting officer. The Registrant has not amended any provision in its Code of Ethics (the “Code”) that relates to an element of the Code’s definitions enumerated in paragraph (b) of Item 2 of this Form N-CSR. The Registrant has not granted a waiver, including an implicit waiver, from any provision of the Code.
A copy of the Code of Ethics is filed as an exhibit to this Form N-CSR.
| ITEM 3. | AUDIT COMMITTEE FINANCIAL EXPERT. |
Messrs. Robert E. Butler, John P. Kavanaugh and Robert W. Uek and Mses. Laurie J. Thomsen and Maryanne L. Roepke, members of the Audit Committee, have been determined by the Board of Trustees in their reasonable business judgment to meet the definition of “audit committee financial expert” as such term is defined in Form N-CSR. In addition, Messrs. Butler, Kavanaugh and Uek and Mses. Roepke and Thomsen are “independent” members of the Audit Committee (as such term has been defined by the Securities and Exchange Commission in regulations implementing Section 407 of the Sarbanes-Oxley Act of 2002). The Securities and Exchange Commission has stated that the designation of a person as an audit committee financial expert pursuant to this Item 3 on the Form N-CSR does not impose on such a person any duties, obligations or liability that are greater than the duties, obligations or liability imposed on such person as a member of the Audit Committee and the Board of Trustees in the absence of such designation or identification.
| ITEM 4. | PRINCIPAL ACCOUNTANT FEES AND SERVICES. |
Items 4(a) through 4(d) and 4(g):
The Board of Trustees has appointed Deloitte & Touche LLP (“Deloitte”) to serve as independent accountants to certain series of the Registrant and Ernst & Young LLP (“E&Y”) to serve in the same capacity to certain other series of the Registrant (the series referred to collectively as the “Funds” and singularly as a “Fund”). The tables below set forth the audit fees billed to the Funds as well as fees for non-audit services provided to the Funds and/or to the Funds’ investment adviser, Massachusetts Financial Services Company (“MFS”), and to various entities either controlling, controlled by, or under common control with MFS that provide ongoing services to the Funds (“MFS Related Entities”).
Table of Contents
For the fiscal years ended September 30, 2014 and 2013, audit fees billed to the Funds by Deloitte and E&Y were as follows:
| Audit Fees | ||||||||
| 2014 | 2013 | |||||||
Fees billed by Deloitte: | ||||||||
MFS Research Fund | 42,155 | 41,665 | ||||||
MFS Total Return Fund | 66,593 | 65,813 | ||||||
|
|
|
| |||||
Total | 108,748 | 107,478 | ||||||
| Audit Fees | ||||||||
| 2014 | 2013 | |||||||
Fees billed by E&Y: | ||||||||
MFS International New Discovery Fund | 46,546 | 46,003 | ||||||
For the fiscal years ended September 30, 2014 and 2013, fees billed by Deloitte and E&Y for audit-related, tax and other services provided to the Funds and for audit-related, tax and other services provided to MFS and MFS Related Entities were as follows:
| Audit-Related Fees1 | Tax Fees2 | All Other Fees3 | ||||||||||||||||||||||
| 2014 | 2013 | 2014 | 2013 | 2014 | 20135 | |||||||||||||||||||
Fees billed by Deloitte: | ||||||||||||||||||||||||
To MFS Research Fund | 0 | 0 | 6,491 | 6,414 | 1,476 | 748 | ||||||||||||||||||
To MFS Total Return Fund | 0 | 0 | 8,982 | 8,875 | 1,812 | 955 | ||||||||||||||||||
Total fees billed by Deloitte To above Funds: | 0 | 0 | 15,473 | 15,289 | 3,288 | 1,703 | ||||||||||||||||||
| Audit-Related Fees1 | Tax Fees2 | All Other Fees3 | ||||||||||||||||||||||
| 2014 | 20135 | 2014 | 2013 | 2014 | 2013 | |||||||||||||||||||
Fees billed by Deloitte: | ||||||||||||||||||||||||
To MFS and MFS Related Entities of MFS Research Fund* | 1,412,837 | 1,540,972 | 0 | 0 | 0 | 0 | ||||||||||||||||||
To MFS and MFS Related Entities of MFS Total Return Fund* | 1,412,837 | 1,540,972 | 0 | 0 | 0 | 0 | ||||||||||||||||||
Aggregate Fees for Non-audit Services | ||||||||
| 2014 | 20135 | |||||||
Fees billed by Deloitte | ||||||||
To MFS Research Fund, MFS and MFS Related Entities# | 1,424,142 | 1,577,245 | ||||||
To MFS Total Return Fund, MFS and MFS Related Entities# | 1,426,969 | 1,579,913 | ||||||
| Audit-Related Fees1 | Tax Fees2 | All Other Fees4 | ||||||||||||||||||||||
| 2014 | 2013 | 2014 | 2013 | 2014 | 2013 | |||||||||||||||||||
Fees billed by E&Y: | ||||||||||||||||||||||||
To MFS International New Discovery Fund | 0 | 0 | 8,844 | 8,784 | 0 | 0 | ||||||||||||||||||
| Audit-Related Fees1 | Tax Fees2 | All Other Fees4 | ||||||||||||||||||||||
| 2014 | 2013 | 2014 | 2013 | 2014 | 2013 | |||||||||||||||||||
Fees billed by E&Y: | ||||||||||||||||||||||||
To MFS and MFS Related Entities of MFS International New Discovery Fund* | 0 | 0 | 0 | 0 | 0 | 0 | ||||||||||||||||||
Table of Contents
| Aggregate Fees for Non-audit Services | ||||||||
| 2014 | 2013 | |||||||
Fees billed by E&Y: | ||||||||
To MFS International New Discovery Fund, MFS and MFS Related Entities# | 93,844 | 56,784 | ||||||
| * | This amount reflects the fees billed to MFS and MFS Related Entities for non-audit services relating directly to the operations and financial reporting of the Funds (portions of which services also related to the operations and financial reporting of other funds within the MFS Funds complex). |
| # | This amount reflects the aggregate fees billed by Deloitte or E&Y for non-audit services rendered to the Funds and for non-audit services rendered to MFS and the MFS Related Entities. |
| 1 | The fees included under “Audit-Related Fees” are fees related to assurance and related services that are reasonably related to the performance of the audit or review of financial statements, but not reported under ‘‘Audit Fees,’’ including accounting consultations, agreed-upon procedure reports, attestation reports, comfort letters and internal control reviews. |
| 2 | The fees included under “Tax Fees” are fees associated with tax compliance, tax advice and tax planning, including services relating to the filing or amendment of federal, state or local income tax returns, regulated investment company qualification reviews and tax distribution and analysis. |
| 3 | The fees included under “All Other Fees” are fees for products and services provided by Deloitte other than those reported under “Audit Fees,” “Audit-Related Fees” and “Tax Fees,” including fees for services related to review of internal controls and review of Rule 38a-1 compliance program. |
| 4 | The fees under “All Other Fees” are fees for products and services provided by E&Y other than those reported under “Audit Fees,” “Audit-Related Fees” and “Tax Fees”. |
| 5 | Certain fees reported in 2013 have been restated in this filing from those reported in the Registrant’s filing for the reporting period ended September 30, 2013. |
Item 4(e)(1):
Set forth below are the policies and procedures established by the Audit Committee of the Board of Trustees relating to the pre-approval of audit and non-audit related services:
To the extent required by applicable law, pre-approval by the Audit Committee of the Board is needed for all audit and permissible non-audit services rendered to the Funds and all permissible non-audit services rendered to MFS or MFS Related Entities if the services relate directly to the operations and financial reporting of the Registrant. Pre-approval is currently on an engagement-by-engagement basis. In the event pre-approval of such services is necessary between regular meetings of the Audit Committee and it is not practical to wait to seek pre-approval at the next regular meeting of the Audit Committee, pre-approval of such services may be referred to the Chair of the Audit Committee for approval; provided that the Chair may not pre-approve any individual engagement for such services exceeding $50,000 or multiple engagements for such services in the aggregate exceeding $100,000 in each period between regular meetings of the Audit Committee. Any engagement pre-approved by the Chair between regular meetings of the Audit Committee shall be presented for ratification by the entire Audit Committee at its next regularly scheduled meeting.
Table of Contents
Item 4(e)(2):
None, or 0%, of the services relating to the Audit-Related Fees, Tax Fees and All Other Fees paid by the Fund and MFS and MFS Related Entities relating directly to the operations and financial reporting of the Registrant disclosed above were approved by the audit committee pursuant to paragraphs (c)(7)(i)(C) of Rule 2-01 of Regulation S-X (which permits audit committee approval after the start of the engagement with respect to services other than audit, review or attest services, if certain conditions are satisfied).
Item 4(f): Not applicable.
Item 4(h): The Registrant’s Audit Committee has considered whether the provision by a Registrant’s independent registered public accounting firm of non-audit services to MFS and MFS Related Entities that were not pre-approved by the Committee (because such services did not relate directly to the operations and financial reporting of the Registrant) was compatible with maintaining the independence of the independent registered public accounting firm as the Registrant’s principal auditors.
| ITEM 5. | AUDIT COMMITTEE OF LISTED REGISTRANTS. |
Not applicable to the Registrant.
| ITEM 6. | INVESTMENTS |
A schedule of investments of each series of the Registrant is included as part of the report to shareholders of such series under Item 1 of this Form N-CSR.
| ITEM 7. | DISCLOSURE OF PROXY VOTING POLICIES AND PROCEDURES FOR CLOSED-END MANAGEMENT INVESTMENT COMPANIES. |
Not applicable to the Registrant.
| ITEM 8. | PORTFOLIO MANAGERS OF CLOSED-END MANAGEMENT INVESTMENT COMPANIES. |
Not applicable to the Registrant.
| ITEM 9. | PURCHASES OF EQUITY SECURITIES BY CLOSED-END MANAGEMENT INVESTMENT COMPANY AND AFFILIATED PURCHASERS. |
Not applicable to the Registrant.
| ITEM 10. | SUBMISSION OF MATTERS TO A VOTE OF SECURITY HOLDERS. |
There were no material changes to the procedures by which shareholders may send recommendations to the Board for nominees to the Registrant’s Board since the Registrant last provided disclosure as to such procedures in response to the requirements of Item 407 (c)(2)(iv) of Regulation S-K or this Item.
Table of Contents
| ITEM 11. | CONTROLS AND PROCEDURES. |
| (a) | Based upon their evaluation of the effectiveness of the registrant’s disclosure controls and procedures (as defined in Rule 30a-3(c) under the Investment Company Act of 1940 (the “Act”)) as conducted within 90 days of the filing date of this report on Form N-CSR, the registrant’s principal financial officer and principal executive officer have concluded that those disclosure controls and procedures provide reasonable assurance that the material information required to be disclosed by the registrant on this report is recorded, processed, summarized and reported within the time periods specified in the Securities and Exchange Commission’s rules and forms. |
| (b) | There were no changes in the registrant’s internal controls over financial reporting (as defined in Rule 30a-3(d) under the Act) that occurred during the second fiscal quarter of the period covered by the report that have materially affected, or are reasonably likely to materially affect, the registrant’s internal control over financial reporting. |
| ITEM 12. | EXHIBITS. |
| (a) | File the exhibits listed below as part of this form. Letter or number the exhibits in the sequence indicated. |
| (1) | Any code of ethics, or amendment thereto, that is the subject of the disclosure required by Item 2, to the extent that the registrant intends to satisfy the Item 2 requirements through filing of an exhibit: Code of Ethics attached hereto. |
| (2) | A separate certification for each principal executive officer and principal financial officer of the registrant as required by Rule 30a-2(a) under the Act (17 CFR 270.30a-2): Attached hereto. |
| (b) | If the report is filed under Section 13(a) or 15(d) of the Exchange Act, provide the certifications required by Rule 30a-2(b) under the Act (17 CFR 270.30a-2(b)), Rule 13a-14(b) or Rule 15d-14(b) under the Exchange Act (17 CFR 240.13a-14(b) or 240.15d-14(b)) and Section 1350 of Chapter 63 of Title 18 of the United States Code (18 U.S.C. 1350) as an exhibit. A certification furnished pursuant to this paragraph will not be deemed “filed” for the purposes of Section 18 of the Exchange Act (15 U.S.C. 78r), or otherwise subject to the liability of that section. Such certification will not be deemed to be incorporated by reference into any filing under the Securities Act of 1933 or the Exchange Act, except to the extent that the registrant specifically incorporates it by reference: Attached hereto. |
Table of Contents
Notice
A copy of the Amended and Restated Declaration of Trust, as amended, of the Registrant is on file with the Secretary of State of The Commonwealth of Massachusetts and notice is hereby given that this instrument is executed on behalf of the Registrant by an officer of the Registrant as an officer and not individually and the obligations of or arising out of this instrument are not binding upon any of the Trustees or shareholders individually, but are binding only upon the assets and property of the respective constituent series of the Registrant.
Table of Contents
SIGNATURES
Pursuant to the requirements of the Securities Exchange Act of 1934 and the Investment Company Act of 1940, the registrant has duly caused this report to be signed on its behalf by the undersigned, thereunto duly authorized.
(Registrant) MFS SERIES TRUST V
| By (Signature and Title)* | ROBIN A. STELMACH | |
| Robin A. Stelmach, President |
Date: November 14, 2014
Pursuant to the requirements of the Securities Exchange Act of 1934 and the Investment Company Act of 1940, this report has been signed below by the following persons on behalf of the registrant and in the capacities and on the dates indicated.
| By (Signature and Title)* | ROBIN A. STELMACH | |
| Robin A. Stelmach, President (Principal Executive Officer) |
Date: November 14, 2014
| By (Signature and Title)* | DAVID L. DILORENZO | |
| David L. DiLorenzo, Treasurer (Principal Financial Officer and Accounting Officer) |
Date: November 14, 2014
| * | Print name and title of each signing officer under his or her signature. |