UNITED STATES
SECURITIES AND EXCHANGE COMMISSION
Washington, D.C. 20549
FORM N-CSR
CERTIFIED SHAREHOLDER REPORT OF
REGISTERED MANAGEMENT INVESTMENT COMPANIES
Investment Company Act file number 811-02031
MFS SERIES TRUST V
(Exact name of registrant as specified in charter)
111 Huntington Avenue, Boston, Massachusetts 02199
(Address of principal executive offices) (Zip code)
Christopher R. Bohane
Massachusetts Financial Services Company
111 Huntington Avenue, Boston, Massachusetts 02199
(Name and address of agents for service)
Registrant’s telephone number, including area code: (617) 954-5000
Date of fiscal year end: September 30
Date of reporting period: March 31, 2021
| ITEM 1. | REPORTS TO STOCKHOLDERS. |
1(a):
Semiannual Report
March 31, 2021
MFS® International New Discovery Fund
MFS® International New Discovery Fund
The report is prepared for the general information of shareholders. It is authorized for distribution to prospective investors only when preceded or accompanied by a current prospectus.
NOT FDIC INSURED • MAY LOSE VALUE • NO BANK GUARANTEE
LETTER FROM THE CEO
Dear Shareholders:
Markets have experienced dramatic swings since the coronavirus pandemic brought the global economy to a standstill for several months early in 2020. The speedy development of vaccines and therapeutics brightened the economic and market outlook, but uncertainty remains as new variants of the virus appear and questions persist over how fast vaccines can be made widely available outside the United States. In the U.S., political uncertainty eased after former Vice President Joe Biden won the presidential election and the Democrats gained control of a closely divided Senate.
Global central banks have taken aggressive steps to cushion the economic and market fallout related to the virus, and governments are deploying unprecedented levels of fiscal support. Having passed a $1.9 trillion stimulus package in March, the U.S. Congress is expected to approve additional stimulus later this year, some of it focused on infrastructure. Along with extraordinary government expenditures, pent-up consumer demand could fuel a surge in economic activity as coronavirus restrictions are eased further. Because of this, markets anticipate at least temporary inflation pressures in the months ahead and have pushed up yields on global government bonds, resulting in ripple effects being felt across most financial markets. The measures already put in place have helped build a supportive environment and are encouraging economic recovery; however, if markets disconnect from fundamentals, they can sow the seeds of instability. As such, recent dramatic increases in speculative retail trading bear watching.
In the aftermath of the crisis, we could see societal changes as households, businesses, and governments adjust to a new reality, and any such alterations could affect the investment landscape. For investors, events such as the COVID-19 outbreak demonstrate the importance of having a deep understanding of company fundamentals, and we have built our global research platform to do just that.
At MFS®, we put our clients’ assets to work responsibly by carefully navigating the increasing complexity of global markets and economies. Guided by our long-term philosophy and adhering to our commitment to sustainable investing, we tune out the noise and aim to uncover what we believe are the best, most durable investment opportunities in the market. Our unique global investment platform combines collective expertise, long-term discipline, and thoughtful risk management to create sustainable value for investors.
Respectfully,
Michael W. Roberge
Chief Executive Officer
MFS Investment Management
May 14, 2021
The opinions expressed in this letter are subject to change and may not be relied upon for investment advice. No forecasts can be guaranteed.
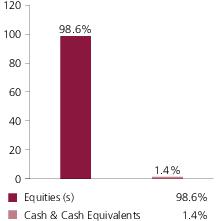
Portfolio structure
Top ten holdings
| OBIC Co. Ltd. | 1.9% |
| Croda International PLC | 1.5% |
| LEG Immobilien AG | 1.3% |
| Symrise AG | 1.2% |
| Cellnex Telecom S.A. | 1.2% |
| Just Eat Takeaway.com N.V. | 1.0% |
| SG Holdings Co. Ltd. | 1.0% |
| Nomura Research Institute Ltd. | 0.9% |
| Flutter Entertainment PLC | 0.9% |
| Daiseki Co. Ltd. | 0.8% |
GICS equity sectors (g)
| Industrials | 19.6% |
| Information Technology | 13.1% |
| Consumer Discretionary | 12.8% |
| Materials | 12.1% |
| Consumer Staples | 9.8% |
| Financials | 8.8% |
| Health Care | 7.7% |
| Communication Services | 6.0% |
| Real Estate | 4.4% |
| Utilities | 1.7% |
| Energy | 1.5% |
Issuer country weightings (x)
| Japan | 31.4% |
| United Kingdom | 13.3% |
| Germany | 6.4% |
| Australia | 4.3% |
| Netherlands | 3.0% |
| Hong Kong | 3.0% |
| China | 2.8% |
| India | 2.8% |
| Switzerland | 2.8% |
| Other Countries | 30.2% |
Currency exposure weightings (y)
| Japanese Yen | 31.4% |
| Euro | 18.2% |
| British Pound Sterling | 14.4% |
| Hong Kong Dollar | 4.5% |
| Australian Dollar | 4.3% |
| United States Dollar | 3.7% |
| Swiss Franc | 2.8% |
| Indian Rupee | 2.4% |
| Brazilian Real | 2.3% |
| Other Currencies | 16.0% |
Portfolio Composition - continued
| (g) | The Global Industry Classification Standard (GICS®) was developed by and/or is the exclusive property of MSCI, Inc. and S&P Global Market Intelligence Inc. (“S&P Global Market Intelligence”). GICS is a service mark of MSCI and S&P Global Market Intelligence and has been licensed for use by MFS. MFS has applied its own internal sector/industry classification methodology for equity securities and non-equity securities that are unclassified by GICS. |
| (x) | Represents the portfolio’s exposure to issuer countries as a percentage of a portfolio’s net assets. For purposes of this presentation, United States includes Cash & Cash Equivalents. |
| (y) | Represents the portfolio’s exposure to a particular currency as a percentage of a portfolio's net assets. For purposes of this presentation, United States Dollar includes Cash & Cash Equivalents. |
Cash & Cash Equivalents includes any cash, investments in money market funds, short-term securities, and other assets less liabilities. Please see the Statement of Assets and Liabilities for additional information related to the fund’s cash position and other assets and liabilities.
Percentages are based on net assets as of March 31, 2021.
The portfolio is actively managed and current holdings may be different.
Expense Table
Fund expenses borne by the shareholders during the period,
October 1, 2020 through March 31, 2021
As a shareholder of the fund, you incur two types of costs: (1) transaction costs, including sales charges (loads) on certain purchase or redemption payments, and (2) ongoing costs, including management fees; distribution and service (12b-1) fees; and other fund expenses. This example is intended to help you understand your ongoing costs (in dollars) of investing in the fund and to compare these costs with the ongoing costs of investing in other mutual funds.
The example is based on an investment of $1,000 invested at the beginning of the period and held for the entire period October 1, 2020 through March 31, 2021.
Actual Expenses
The first line for each share class in the following table provides information about actual account values and actual expenses. You may use the information in this line, together with the amount you invested, to estimate the expenses that you paid over the period. Simply divide your account value by $1,000 (for example, an $8,600 account value divided by $1,000 = 8.6), then multiply the result by the number in the first line under the heading entitled “Expenses Paid During Period” to estimate the expenses you paid on your account during this period.
Hypothetical Example for Comparison Purposes
The second line for each share class in the following table provides information about hypothetical account values and hypothetical expenses based on the fund’s actual expense ratio and an assumed rate of return of 5% per year before expenses, which is not the fund’s actual return. The hypothetical account values and expenses may not be used to estimate the actual ending account balance or expenses you paid for the period. You may use this information to compare the ongoing costs of investing in the fund and other funds. To do so, compare this 5% hypothetical example with the 5% hypothetical examples that appear in the shareholder reports of the other funds.
Please note that the expenses shown in the table are meant to highlight your ongoing costs only and do not reflect any transactional costs, such as sales charges (loads). Therefore, the second line for each share class in the table is useful in comparing ongoing costs only, and will not help you determine the relative total costs of owning different funds. In addition, if these transactional costs were included, your costs would have been higher.
Expense Table - continued
Share
Class | | Annualized
Expense
Ratio | Beginning
Account Value
10/01/20 | Ending
Account Value
3/31/21 | Expenses
Paid During
Period (p)
10/01/20-3/31/21 |
| A | Actual | 1.27% | $1,000.00 | $1,130.14 | $6.74 |
| Hypothetical (h) | 1.27% | $1,000.00 | $1,018.60 | $6.39 |
| B | Actual | 2.02% | $1,000.00 | $1,126.04 | $10.71 |
| Hypothetical (h) | 2.02% | $1,000.00 | $1,014.86 | $10.15 |
| C | Actual | 2.02% | $1,000.00 | $1,126.18 | $10.71 |
| Hypothetical (h) | 2.02% | $1,000.00 | $1,014.86 | $10.15 |
| I | Actual | 1.02% | $1,000.00 | $1,131.67 | $5.42 |
| Hypothetical (h) | 1.02% | $1,000.00 | $1,019.85 | $5.14 |
| R1 | Actual | 2.02% | $1,000.00 | $1,125.92 | $10.71 |
| Hypothetical (h) | 2.02% | $1,000.00 | $1,014.86 | $10.15 |
| R2 | Actual | 1.52% | $1,000.00 | $1,128.71 | $8.07 |
| Hypothetical (h) | 1.52% | $1,000.00 | $1,017.35 | $7.64 |
| R3 | Actual | 1.27% | $1,000.00 | $1,130.15 | $6.74 |
| Hypothetical (h) | 1.27% | $1,000.00 | $1,018.60 | $6.39 |
| R4 | Actual | 1.02% | $1,000.00 | $1,131.85 | $5.42 |
| Hypothetical (h) | 1.02% | $1,000.00 | $1,019.85 | $5.14 |
| R6 | Actual | 0.89% | $1,000.00 | $1,132.15 | $4.73 |
| Hypothetical (h) | 0.89% | $1,000.00 | $1,020.49 | $4.48 |
| 529A | Actual | 1.29% | $1,000.00 | $1,130.19 | $6.85 |
| Hypothetical (h) | 1.29% | $1,000.00 | $1,018.50 | $6.49 |
| 529B | Actual | 1.32% | $1,000.00 | $1,129.73 | $7.01 |
| Hypothetical (h) | 1.32% | $1,000.00 | $1,018.35 | $6.64 |
| 529C | Actual | 2.07% | $1,000.00 | $1,125.77 | $10.97 |
| Hypothetical (h) | 2.07% | $1,000.00 | $1,014.61 | $10.40 |
| (h) | 5% class return per year before expenses. |
| (p) | “Expenses Paid During Period” are equal to each class’s annualized expense ratio, as shown above, multiplied by the average account value over the period, multiplied by 182/365 (to reflect the one-half year period). Expenses paid do not include any applicable sales charges (loads). If these transaction costs had been included, your costs would have been higher. |
Notes to Expense Table
For the period from October 1, 2020 through March 31, 2021, the distribution fee for Class 529B was not imposed. Had the distribution fee been imposed throughout the entire six month period, the annualized expense ratio, the actual expenses paid during the period, and the hypothetical expenses paid during the period would have been approximately 2.07%, $10.99, and $10.40 for Class 529B. See Note 3 in the Notes to Financial Statements for additional information.
Expense Table - continued
Each class with a Rule 12b-1 service fee is subject to a rebate of a portion of such fee. Such rebates are included in the expense ratios above. For Class 529A shares, this rebate reduced the expense ratio above by 0.04%. See Note 3 in the Notes to Financial Statements for additional information.
Portfolio of Investments
3/31/21 (unaudited)
The Portfolio of Investments is a complete list of all securities owned by your fund. It is categorized by broad-based asset classes.
| Issuer | | | Shares/Par | Value ($) |
| Common Stocks – 97.3% |
| Aerospace – 1.0% | |
| LISI Group (a) | | 608,820 | $ 17,741,986 |
| MTU Aero Engines Holding AG | | 38,986 | 9,175,780 |
| Saab AB, “B” | | 568,022 | 15,544,517 |
| Singapore Technologies Engineering Ltd. | | 12,378,800 | 35,948,552 |
| | | | | $78,410,835 |
| Airlines – 0.7% | |
| Auckland International Airport Ltd. (a) | | 2,773,766 | $ 15,187,634 |
| Enav S.p.A. | | 4,662,291 | 22,679,060 |
| Grupo Aeroportuario del Pacifico S.A.B. de C.V. (a) | | 516,082 | 5,394,754 |
| Grupo Aeroportuario del Sureste S.A.B. de C.V., ADR (a) | | 45,460 | 8,082,334 |
| | | | | $51,343,782 |
| Alcoholic Beverages – 0.5% | |
| Carlsberg Group | | 132,479 | $ 20,354,555 |
| China Resources Beer Holdings Co. Ltd. | | 1,518,000 | 11,928,116 |
| Compania Cervecerias Unidas S.A., ADR | | 435,271 | 7,691,239 |
| | | | | $39,973,910 |
| Apparel Manufacturers – 0.6% | |
| Burberry Group PLC (a) | | 574,654 | $ 15,040,259 |
| Coats Group PLC | | 5,250,030 | 4,118,246 |
| Pacific Textiles Holdings Ltd. | | 38,809,000 | 24,900,556 |
| | | | | $44,059,061 |
| Automotive – 3.1% | |
| Autoliv, Inc., SDR (a) | | 72,648 | $ 6,709,591 |
| Cie Plastic Omnium S.A. | | 319,197 | 11,693,830 |
| Daikyonishikawa Corp. | | 332,421 | 2,337,076 |
| Hella KGaA Hueck & Co. (a) | | 117,496 | 6,589,001 |
| Hero MotoCorp Ltd. | | 591,167 | 23,558,143 |
| Koito Manufacturing Co. Ltd. | | 645,800 | 43,539,645 |
| Mahindra & Mahindra Ltd. | | 3,436,522 | 37,470,314 |
| NGK Spark Plug Co. Ltd | | 837,800 | 14,540,210 |
| PT United Tractors Tbk | | 21,991,700 | 33,631,367 |
| Stanley Electric Co. Ltd. | | 871,131 | 26,042,359 |
| USS Co. Ltd. | | 1,960,700 | 38,422,758 |
| | | | | $244,534,294 |
| Biotechnology – 0.1% | |
| Abcam PLC (a) | | 495,341 | $ 9,498,821 |
Portfolio of Investments (unaudited) – continued
| Issuer | | | Shares/Par | Value ($) |
| Common Stocks – continued |
| Broadcasting – 0.3% | |
| 4imprint Group PLC (a) | | 170,992 | $ 5,775,375 |
| iClick Interactive Asia Group Ltd. (a) | | 901,311 | 10,608,430 |
| Nippon Television Holdings, Inc. | | 767,100 | 10,116,117 |
| | | | | $26,499,922 |
| Brokerage & Asset Managers – 3.2% | |
| ASX Ltd. | | 329,604 | $ 17,809,760 |
| Bolsa Mexicana de Valores S.A. de C.V. | | 3,203,400 | 6,464,945 |
| Daiwa Securities Group, Inc. | | 10,116,400 | 52,511,039 |
| Euronext N.V. | | 163,274 | 16,447,395 |
| Hargreaves Lansdown PLC | | 770,285 | 16,369,418 |
| JAFCO Group Co. | | 65,700 | 3,917,596 |
| Japan Exchange Group, Inc. | | 145,300 | 3,415,344 |
| Moscow Exchange MICEX-RTS PJSC | | 7,428,305 | 17,074,984 |
| Omni Bridgeway Ltd. | | 4,742,622 | 12,674,133 |
| Partners Group Holding AG | | 3,641 | 4,649,724 |
| Rathbone Brothers PLC | | 1,046,540 | 25,392,577 |
| Schroders PLC | | 815,686 | 39,357,666 |
| TMX Group Ltd. | | 366,031 | 38,036,117 |
| | | | | $254,120,698 |
| Business Services – 8.1% | |
| AEON Delight Co. Ltd. | | 295,700 | $ 8,635,402 |
| Amadeus Fire AG (a) | | 165,357 | 24,200,487 |
| Auto Trader Group PLC (a) | | 4,004,305 | 30,604,737 |
| Bunzl PLC | | 774,450 | 24,801,667 |
| Cancom SE | | 431,801 | 24,883,171 |
| Central Automotive Products Ltd. | | 47,300 | 1,187,874 |
| Cerved Information Solutions S.p.A. (a) | | 4,383,395 | 48,474,041 |
| Compass Group PLC (a) | | 1,481,700 | 29,853,646 |
| Comture Corp. | | 667,200 | 16,202,970 |
| DKSH Holding Ltd. | | 45,850 | 3,519,460 |
| Doshisha Co. Ltd. | | 141,800 | 2,403,374 |
| Electrocomponents PLC | | 4,855,902 | 66,474,861 |
| EPS Holdings, Inc. | | 1,022,100 | 10,462,412 |
| Eurofins Scientific SE (a) | | 37,120 | 3,548,181 |
| Fuji Soft, Inc. | | 339,500 | 17,631,279 |
| Fullcast Holdings Co., Ltd. | | 492,800 | 8,892,431 |
| Intertek Group PLC | | 495,834 | 38,292,850 |
| IPH Ltd. | | 6,793,970 | 34,245,346 |
| Iwatani Corp. | | 493,800 | 30,581,999 |
| Johnson Service Group PLC (a) | | 1,680,493 | 3,447,291 |
| Karnov Group AB | | 1,201,680 | 7,182,465 |
| Nomura Research Institute Ltd. | | 2,417,100 | 75,130,215 |
Portfolio of Investments (unaudited) – continued
| Issuer | | | Shares/Par | Value ($) |
| Common Stocks – continued |
| Business Services – continued | |
| NS Solutions Corp. | | 1,963,700 | $ 62,249,600 |
| SAN-AI OIL Co. Ltd. | | 2,304,200 | 27,418,686 |
| SCSK Corp. | | 282,900 | 16,817,243 |
| Sohgo Security Services Co. Ltd. | | 569,000 | 26,935,863 |
| | | | | $644,077,551 |
| Cable TV – 0.1% | |
| NOS, SGPS S.A. | | 2,643,538 | $ 9,622,639 |
| Chemicals – 0.8% | |
| IMCD Group N.V. | | 267,104 | $ 37,118,095 |
| KH Neochem Co. Ltd. | | 409,600 | 10,350,515 |
| Orica Ltd. | | 1,258,415 | 13,333,816 |
| | | | | $60,802,426 |
| Computer Software – 3.1% | |
| ARGO GRAPHICS, Inc. | | 509,800 | $ 14,656,473 |
| OBIC Business Consultants Co. Ltd. | | 91,900 | 4,826,805 |
| OBIC Co. Ltd. | | 817,200 | 150,360,697 |
| Oracle Corp. | | 255,700 | 25,134,723 |
| PCA Corp. | | 352,100 | 13,530,688 |
| Sage Group PLC | | 679,854 | 5,743,448 |
| Totvs S.A. | | 1,920,700 | 9,871,968 |
| Wisetech Global Ltd. | | 932,215 | 20,823,019 |
| | | | | $244,947,821 |
| Computer Software - Systems – 2.1% | |
| Alten S.A. (a) | | 261,738 | $ 30,724,710 |
| Amadeus IT Group S.A. (a) | | 732,307 | 51,852,921 |
| EMIS Group PLC | | 489,193 | 7,418,416 |
| Globant S.A. (a) | | 42,937 | 8,914,151 |
| SimCorp A/S | | 61,945 | 7,670,799 |
| Temenos AG | | 86,543 | 12,457,467 |
| Toshiba Tec Corp. (a) | | 209,700 | 7,705,753 |
| Venture Corp. Ltd. | | 2,727,700 | 40,783,531 |
| | | | | $167,527,748 |
| Conglomerates – 0.9% | |
| Ansell Ltd. | | 1,061,273 | $ 31,713,841 |
| DCC PLC | | 419,603 | 36,385,430 |
| | | | | $68,099,271 |
Portfolio of Investments (unaudited) – continued
| Issuer | | | Shares/Par | Value ($) |
| Common Stocks – continued |
| Construction – 3.2% | |
| Bellway PLC | | 610,687 | $ 28,649,622 |
| Breedon Group PLC (a) | | 16,317,666 | 21,010,829 |
| Forterra PLC (h) | | 15,323,819 | 60,629,947 |
| Grupo Cementos de Chihuahua S.A.B. de C.V. | | 2,221,736 | 15,419,921 |
| Ibstock PLC | | 4,572,917 | 13,881,900 |
| Kingspan Group PLC | | 84,112 | 7,131,538 |
| Marshalls PLC | | 938,311 | 8,854,388 |
| PT Indocement Tunggal Prakarsa Tbk | | 24,754,200 | 20,901,142 |
| Rinnai Corp. | | 89,900 | 10,090,167 |
| Somfy S.A. | | 110,711 | 18,513,871 |
| Techtronic Industries Co. Ltd. | | 1,918,000 | 32,970,754 |
| Toto Ltd. | | 145,700 | 8,994,195 |
| Zhejiang Supor Co. Ltd. | | 815,145 | 8,897,578 |
| | | | | $255,945,852 |
| Consumer Products – 3.0% | |
| Amorepacific Corp. | | 188,200 | $ 43,079,024 |
| Dabur India Ltd. | | 1,800,271 | 13,308,666 |
| Essity AB (l) | | 864,312 | 27,304,637 |
| Kobayashi Pharmaceutical Co. Ltd. | | 273,600 | 25,525,292 |
| Lion Corp. | | 1,082,500 | 21,107,406 |
| Milbon Co. Ltd. | | 39,792 | 2,189,770 |
| Mitsubishi Pencil Co. Ltd. | | 231,500 | 3,352,680 |
| PZ Cussons PLC | | 364,404 | 1,341,321 |
| T. Hasegawa Co. Ltd. (h) | | 3,028,900 | 58,040,665 |
| Takasago International Corp. | | 161,300 | 3,840,931 |
| Uni-Charm Corp. | | 883,600 | 37,067,708 |
| | | | | $236,158,100 |
| Consumer Services – 2.0% | |
| 51job, Inc., ADR (a) | | 498,506 | $ 31,206,476 |
| Anima Holdings S.A. (a) | | 7,282,161 | 12,937,669 |
| Asante, Inc. | | 170,200 | 2,762,243 |
| Heian Ceremony Service Co. | | 363,967 | 2,899,245 |
| Localiza Rent a Car S.A. | | 445,900 | 4,731,793 |
| MakeMyTrip Ltd. (a) | | 1,069,505 | 33,774,968 |
| Meitec Corp. | | 371,900 | 20,585,816 |
| Moneysupermarket.com Group PLC | | 5,518,542 | 20,282,560 |
| Park24 Co. Ltd. | | 358,200 | 6,693,302 |
| Seek Ltd. (a) | | 663,791 | 14,415,654 |
| Webjet Ltd. (a)(l) | | 2,591,938 | 11,036,925 |
| | | | | $161,326,651 |
Portfolio of Investments (unaudited) – continued
| Issuer | | | Shares/Par | Value ($) |
| Common Stocks – continued |
| Containers – 2.2% | |
| Gerresheimer AG | | 485,954 | $ 48,268,689 |
| Mayr-Melnhof Karton AG | | 133,652 | 27,491,091 |
| SIG Combibloc Group AG | | 2,162,064 | 50,005,522 |
| Toyo Seikan Group Holdings, Ltd. | | 1,427,000 | 17,040,547 |
| Verallia | | 175,016 | 6,311,169 |
| Viscofan S.A. | | 372,627 | 25,738,104 |
| | | | | $174,855,122 |
| Electrical Equipment – 2.5% | |
| Advantech Co. Ltd. | | 1,855,191 | $ 23,072,129 |
| Bharat Heavy Electricals Ltd. (a) | | 14,453,222 | 9,672,168 |
| Cembre S.p.A. | | 542,000 | 14,745,999 |
| Halma PLC | | 670,891 | 21,956,897 |
| Legrand S.A. | | 604,998 | 56,276,046 |
| LS Electric Co. Ltd. | | 524,371 | 28,359,680 |
| OMRON Corp. | | 208,121 | 16,310,534 |
| Sagami Rubber Industries Co. Ltd. | | 264,700 | 2,690,356 |
| TAKUMA Co. Ltd. | | 212,600 | 4,625,637 |
| Voltronic Power Technology Corp. | | 590,659 | 23,013,214 |
| | | | | $200,722,660 |
| Electronics – 3.4% | |
| Amano Corp. | | 246,720 | $ 6,007,833 |
| ASM International N.V. | | 167,688 | 48,768,635 |
| ASM Pacific Technology Ltd. | | 1,795,700 | 23,005,533 |
| Chroma Ate, Inc. | | 4,438,000 | 29,611,392 |
| Fukui Computer Holdings, Inc. | | 205,100 | 7,344,516 |
| Hirose Electric Co. Ltd. | | 87,800 | 13,547,172 |
| Iriso Electronics Co. Ltd. | | 218,500 | 9,798,469 |
| Kardex Holding AG | | 105,770 | 21,575,894 |
| Melexis N.V. | | 178,211 | 18,861,171 |
| Silicon Motion Technology Corp., ADR | | 488,986 | 29,040,879 |
| Tripod Technology Corp. | | 7,316,000 | 36,111,740 |
| Win Semiconductors Corp. | | 656,000 | 9,067,533 |
| Zuken, Inc. | | 559,300 | 14,274,841 |
| | | | | $267,015,608 |
| Energy - Independent – 0.3% | |
| Oil Search Ltd. | | 6,729,806 | $ 20,896,105 |
| Energy - Integrated – 0.1% | |
| Cairn Energy PLC | | 2,040,461 | $ 4,787,691 |
| Galp Energia SGPS S.A. | | 394,349 | 4,587,535 |
| | | | | $9,375,226 |
Portfolio of Investments (unaudited) – continued
| Issuer | | | Shares/Par | Value ($) |
| Common Stocks – continued |
| Engineering - Construction – 0.2% | |
| Babcock International Group PLC (a) | | 1,393,969 | $ 4,393,065 |
| JGC Holdings Corp. | | 257,000 | 3,171,225 |
| NIPPO Corp. | | 415,000 | 11,353,534 |
| | | | | $18,917,824 |
| Entertainment – 1.2% | |
| CTS Eventim AG (a) | | 947,076 | $ 54,909,845 |
| Toei Co. Ltd. | | 71,600 | 15,499,580 |
| Toho Co. Ltd. | | 605,800 | 24,653,321 |
| | | | | $95,062,746 |
| Food & Beverages – 4.9% | |
| ARIAKE JAPAN Co. Ltd. | | 143,600 | $ 8,717,177 |
| AVI Ltd. | | 4,871,301 | 24,620,532 |
| Bakkafrost P/f | | 603,953 | 47,839,469 |
| Britvic PLC | | 655,513 | 7,568,406 |
| Cranswick PLC | | 548,024 | 27,470,194 |
| Ezaki Glico Co. Ltd. | | 454,000 | 18,225,604 |
| Greencore Group PLC (a) | | 1,183,806 | 2,565,496 |
| Gruma S.A.B. de C.V. | | 815,362 | 9,629,406 |
| JBS S.A. | | 1,558,538 | 8,384,343 |
| Kato Sangyo Co. Ltd. | | 547,900 | 17,738,096 |
| Kerry Group PLC | | 206,732 | 25,867,774 |
| Kikkoman Corp. | | 121,900 | 7,278,992 |
| Morinaga & Co. Ltd. | | 666,200 | 23,837,176 |
| Orion Corp. | | 269,950 | 31,353,561 |
| Ridley Corp. NPV (h) | | 21,241,987 | 19,401,299 |
| S Foods, Inc. | | 841,000 | 28,811,296 |
| Shenguan Holdings Group Ltd. | | 13,203,505 | 628,407 |
| Tata Consumer Products Ltd. | | 1,203,509 | 10,537,623 |
| Tate & Lyle PLC | | 439,814 | 4,651,745 |
| Tingyi (Cayman Islands) Holdings Corp. | | 17,074,000 | 31,362,694 |
| Universal Robina Corp. | | 10,155,080 | 27,826,436 |
| | | | | $384,315,726 |
| Food & Drug Stores – 1.8% | |
| Cosmos Pharmaceutical Corp. | | 59,200 | $ 9,246,377 |
| Dairy Farm International Holdings Ltd. | | 6,359,109 | 27,437,253 |
| JM Holdings Co. Ltd. | | 253,700 | 5,227,853 |
| Matsumotokiyoshi Holdings Co. Ltd. | | 90,800 | 4,054,347 |
| Patlac Corp. | | 279,300 | 15,142,810 |
| San-A Co. Ltd. | | 87,700 | 3,654,689 |
| Sendas Distribuidora S.A. (a) | | 787,400 | 10,329,584 |
| Spencer's Retail Ltd. (a) | | 723,473 | 698,599 |
Portfolio of Investments (unaudited) – continued
| Issuer | | | Shares/Par | Value ($) |
| Common Stocks – continued |
| Food & Drug Stores – continued | |
| Sugi Holdings Co. Ltd. | | 234,200 | $ 18,588,432 |
| Sundrug Co. Ltd. | | 849,700 | 31,146,916 |
| WM Morrison Supermarkets PLC | | 5,473,985 | 13,768,472 |
| | | | | $139,295,332 |
| Forest & Paper Products – 0.2% | |
| Suzano S.A. (a) | | 1,122,200 | $ 13,667,009 |
| Furniture & Appliances – 1.1% | |
| Howden Joinery Group PLC | | 3,364,217 | $ 33,995,877 |
| Hunter Douglas N.V. (a) | | 316,639 | 24,952,876 |
| SEB S.A. | | 162,083 | 28,587,240 |
| Zojirushi Corp. | | 177,300 | 3,107,482 |
| | | | | $90,643,475 |
| Gaming & Lodging – 1.5% | |
| Flutter Entertainment PLC (a) | | 317,160 | $ 67,793,563 |
| Shangri-La Asia Ltd. (a) | | 29,944,000 | 29,928,208 |
| Tabcorp Holdings Ltd. | | 5,767,252 | 20,595,654 |
| | | | | $118,317,425 |
| General Merchandise – 0.9% | |
| B&M European Value Retail S.A. | | 986,148 | $ 7,175,460 |
| Dollarama, Inc. | | 841,907 | 37,194,777 |
| Lojas Renner S.A. | | 1,716,010 | 12,984,440 |
| Magazine Luiza S.A. | | 1,918,400 | 6,898,353 |
| Seria Co. Ltd. | | 183,200 | 6,394,834 |
| | | | | $70,647,864 |
| Health Maintenance Organizations – 0.0% | |
| Odontoprev S.A. | | 1,233,600 | $ 2,882,012 |
| Insurance – 1.6% | |
| Admiral Group PLC | | 212,870 | $ 9,100,275 |
| AUB Group Ltd. | | 2,508,681 | 36,784,286 |
| Hiscox Ltd. (a) | | 1,978,378 | 23,466,480 |
| Samsung Fire & Marine Insurance Co. Ltd. | | 200,389 | 33,699,624 |
| Steadfast Group Ltd. | | 7,183,503 | 20,823,826 |
| | | | | $123,874,491 |
| Internet – 1.4% | |
| Allegro.EU S.A. (a) | | 349,332 | $ 4,912,164 |
| Demae-Can Co. Ltd. (a)(l) | | 607,900 | 13,430,166 |
| Kakaku.com, Inc. | | 289,200 | 7,921,405 |
| Proto Corp. | | 1,137,400 | 12,077,528 |
Portfolio of Investments (unaudited) – continued
| Issuer | | | Shares/Par | Value ($) |
| Common Stocks – continued |
| Internet – continued | |
| Rakuten | | 119,300 | $ 1,421,149 |
| Rightmove PLC | | 3,865,561 | 31,025,801 |
| Scout24 AG | | 461,819 | 35,039,912 |
| Temairazu, Inc. | | 35,300 | 1,689,697 |
| | | | | $107,517,822 |
| Leisure & Toys – 0.8% | |
| BANDAI NAMCO Holdings, Inc. | | 105,300 | $ 7,528,491 |
| DeNA Co. Ltd. | | 339,900 | 6,667,838 |
| GungHo Online Entertainment, Inc. | | 326,600 | 6,474,778 |
| Kawai Musical Instruments Manufacturing Co. Ltd. | | 119,800 | 3,797,114 |
| Konami Holdings Corp. | | 161,300 | 9,645,049 |
| Thule Group AB | | 743,910 | 32,300,027 |
| | | | | $66,413,297 |
| Machinery & Tools – 6.1% | |
| Aalberts Industries N.V. | | 440,996 | $ 22,341,140 |
| Azbil Corp. | | 820,800 | 35,504,667 |
| Carel Industries S.p.A. | | 183,606 | 3,737,864 |
| Doosan Bobcat, Inc. (a) | | 1,026,172 | 38,281,927 |
| Fuji Seal International, Inc. | | 1,662,300 | 37,141,840 |
| Fujitec Co. Ltd. | | 1,443,300 | 30,736,522 |
| Fujitsu General Ltd. | | 248,000 | 6,909,731 |
| Fukushima Galilei Co. Ltd. | | 610,000 | 24,019,869 |
| GEA Group AG | | 1,447,925 | 59,344,459 |
| Haitian International Holdings Ltd. | | 11,009,000 | 43,899,487 |
| METAWATER Co. Ltd. | | 548,600 | 10,990,401 |
| MISUMI Group, Inc. | | 225,900 | 6,576,815 |
| MonotaRO Co. Ltd. | | 778,600 | 21,171,804 |
| Nabtesco Corp. | | 815,900 | 37,505,639 |
| Nissei ASB Machine Co. Ltd. | | 151,400 | 7,241,033 |
| NOHMI BOSAI Ltd. | | 678,100 | 13,198,012 |
| Obara Group, Inc. | | 128,500 | 4,406,366 |
| Rational AG | | 2,758 | 2,142,728 |
| Rotork PLC | | 855,644 | 4,206,421 |
| Shima Seiki Manufacturing Ltd. | | 191,900 | 4,473,181 |
| Spirax-Sarco Engineering PLC | | 126,386 | 19,862,875 |
| T.K. Corp. | | 828,332 | 6,460,377 |
| THK Co. Ltd. | | 133,700 | 4,624,710 |
| Valmet Oyj | | 516,500 | 18,782,743 |
| VAT Group AG | | 75,145 | 21,053,162 |
| | | | | $484,613,773 |
Portfolio of Investments (unaudited) – continued
| Issuer | | | Shares/Par | Value ($) |
| Common Stocks – continued |
| Medical & Health Technology & Services – 1.5% | |
| AS ONE Corp. | | 179,200 | $ 22,512,278 |
| BML, Inc. | | 587,500 | 20,295,213 |
| Burning Rock Biotech Ltd. (a) | | 344,591 | 9,276,390 |
| Fleury S.A. | | 143,546 | 652,870 |
| Hapvida Participacoes e Investimentos S.A. | | 3,481,800 | 9,204,549 |
| Hogy Medical Co. Ltd. | | 79,600 | 2,426,281 |
| ICON PLC (a) | | 45,930 | 9,019,274 |
| Medipal Holdings Corp. | | 724,100 | 13,926,001 |
| Ramsay Health Care Ltd. | | 357,306 | 18,259,491 |
| Selcuk Ecza Deposu Ticaret ve Sanayi A.S. | | 2,590,718 | 3,297,520 |
| Sonic Healthcare Ltd. | | 484,031 | 12,944,152 |
| | | | | $121,814,019 |
| Medical Equipment – 3.1% | |
| ConvaTec Group PLC | | 3,915,066 | $ 10,584,125 |
| Demant A.S. (a) | | 271,692 | 11,508,870 |
| Eiken Chemical Co. Ltd. | | 753,900 | 14,727,349 |
| Fukuda Denshi Co. Ltd. | | 248,900 | 18,930,968 |
| JEOL Ltd. | | 279,000 | 11,105,235 |
| Nakanishi, Inc. | | 2,268,700 | 47,310,052 |
| Nihon Kohden Corp. | | 521,600 | 15,252,031 |
| PerkinElmer, Inc. | | 25,787 | 3,308,214 |
| Shimadzu Corp. | | 624,700 | 22,725,803 |
| Smith & Nephew PLC | | 1,794,613 | 34,092,457 |
| Sonova Holding AG (a) | | 122,207 | 32,376,483 |
| Straumann Holding AG | | 1,171 | 1,460,730 |
| Terumo Corp. | | 520,000 | 18,849,376 |
| | | | | $242,231,693 |
| Metals & Mining – 0.3% | |
| Iluka Resources Ltd. | | 2,666,873 | $ 14,679,740 |
| MOIL Ltd. | | 6,090,545 | 12,541,164 |
| | | | | $27,220,904 |
| Natural Gas - Distribution – 1.0% | |
| China Resources Gas Group Ltd. | | 6,742,000 | $ 37,481,896 |
| Italgas S.p.A. | | 5,939,723 | 38,554,116 |
| | | | | $76,036,012 |
| Network & Telecom – 0.4% | |
| VTech Holdings Ltd. | | 3,825,465 | $ 34,502,377 |
Portfolio of Investments (unaudited) – continued
| Issuer | | | Shares/Par | Value ($) |
| Common Stocks – continued |
| Other Banks & Diversified Financials – 3.4% | |
| AEON Financial Service Co. Ltd. | | 2,490,600 | $ 33,298,727 |
| AEON Thana Sinsap Public Co. Ltd. | | 2,563,700 | 17,556,218 |
| Banco Santander Chile S.A. | | 157,118,269 | 9,813,963 |
| Bancolombia S.A., ADR | | 188,347 | 6,025,220 |
| Bank of Kyoto Ltd. | | 323,000 | 19,957,761 |
| Chiba Bank Ltd. | | 2,538,451 | 16,580,995 |
| E.Sun Financial Holding Co. Ltd. | | 34,330,866 | 31,430,491 |
| FinecoBank S.p.A. (a) | | 988,057 | 16,169,581 |
| Grupo Financiero Inbursa S.A. de C.V. (a) | | 2,689,101 | 2,443,142 |
| Julius Baer Group Ltd. | | 391,642 | 25,044,535 |
| Jyske Bank (a) | | 285,747 | 13,631,347 |
| Metropolitan Bank & Trust Co. | | 27,226,417 | 24,905,545 |
| Shizuoka Bank Ltd. | | 1,025,000 | 8,053,737 |
| Shriram Transport Finance Co. Ltd. | | 2,154,616 | 42,064,461 |
| | | | | $266,975,723 |
| Pharmaceuticals – 2.0% | |
| Daito Pharmaceutical Co. Ltd. | | 458,900 | $ 14,934,037 |
| Genomma Lab Internacional S.A., “B” (a) | | 10,367,073 | 10,453,552 |
| Hypera S.A. | | 2,281,199 | 12,981,231 |
| Kalbe Farma Tbk PT | | 333,929,300 | 36,094,251 |
| Santen Pharmaceutical Co. Ltd. | | 2,042,300 | 28,156,231 |
| Suzuken Co. Ltd./Aichi Japan | | 339,200 | 13,274,257 |
| Virbac S.A. (a) | | 88,791 | 22,855,483 |
| Yunnan Baiyao Group Co. Ltd. | | 907,041 | 16,704,039 |
| | | | | $155,453,081 |
| Pollution Control – 1.0% | |
| Bingo Industries Ltd. | | 4,918,421 | $ 11,311,656 |
| Daiseki Co. Ltd. | | 1,846,200 | 66,861,702 |
| | | | | $78,173,358 |
| Precious Metals & Minerals – 0.5% | |
| Agnico-Eagle Mines Ltd. | | 620,986 | $ 35,899,286 |
| Compania de Minas Buenaventura S.A.A., ADR (a) | | 392,797 | 3,939,754 |
| | | | | $39,839,040 |
| Printing & Publishing – 0.5% | |
| China Literature Ltd. (a) | | 2,235,200 | $ 22,230,394 |
| Wolters Kluwer N.V. | | 201,689 | 17,530,914 |
| | | | | $39,761,308 |
Portfolio of Investments (unaudited) – continued
| Issuer | | | Shares/Par | Value ($) |
| Common Stocks – continued |
| Railroad & Shipping – 0.6% | |
| DFDS A.S. (a) | | 147,164 | $ 7,535,391 |
| Rumo S.A. (a) | | 2,763,468 | 9,942,033 |
| Sankyu, Inc. | | 610,100 | 26,778,830 |
| Senko Group Holdings Co. Ltd. | | 657,300 | 6,234,910 |
| | | | | $50,491,164 |
| Real Estate – 4.4% | |
| Ascendas India Trust, REIT | | 12,556,800 | $ 13,878,606 |
| Big Yellow Group PLC, REIT | | 1,051,241 | 16,159,036 |
| City Developments Ltd. | | 2,898,600 | 17,231,384 |
| Concentradora Fibra Danhos S.A. de C.V., REIT | | 2,803,415 | 3,497,497 |
| Deutsche Wohnen SE | | 322,516 | 15,045,373 |
| Embassy Office Parks REIT | | 3,371,200 | 15,028,540 |
| ESR Cayman Ltd. (a) | | 6,615,600 | 21,747,524 |
| Hibernia PLC, REIT | | 4,300,372 | 5,567,523 |
| LEG Immobilien AG | | 807,166 | 106,166,571 |
| Mapletree Commercial Trust, REIT | | 18,072,300 | 28,549,492 |
| Midland Holdings Ltd. (a)(h) | | 43,113,000 | 5,323,893 |
| Multiplan Empreendimentos Imobiliarios S.A. | | 5,249,892 | 22,842,041 |
| Prologis Peroperty Mexico S.A. de C.V., REIT | | 2,375,819 | 5,103,951 |
| Shaftesbury PLC, REIT (a) | | 1,325,995 | 11,726,727 |
| TAG Immobilien AG | | 639,688 | 18,258,946 |
| Unite Group PLC, REIT (a) | | 3,010,336 | 44,281,026 |
| | | | | $350,408,130 |
| Restaurants – 1.1% | |
| Cafe de Coral Holdings Ltd. | | 16,092,000 | $ 34,857,962 |
| Greggs PLC (a) | | 1,766,374 | 54,644,165 |
| | | | | $89,502,127 |
| Special Products & Services – 0.1% | |
| Deterra Royalties Ltd. | | 2,666,873 | $ 7,966,155 |
| Specialty Chemicals – 6.2% | |
| Air Water, Inc. | | 783,300 | $ 13,724,109 |
| Croda International PLC | | 1,384,892 | 121,196,786 |
| Essentra PLC | | 8,369,828 | 33,462,070 |
| Japan Pure Chemical Co. Ltd. | | 41,700 | 1,054,504 |
| JCU Corp. | | 676,100 | 25,539,718 |
| Kansai Paint Co. Ltd. | | 1,037,000 | 27,778,166 |
| Kureha Corp. | | 137,000 | 9,489,533 |
| Nihon Parkerizing Co. Ltd. | | 1,049,600 | 11,327,812 |
| Nitto Denko Corp. | | 144,400 | 12,397,144 |
| NOF Corp. | | 320,000 | 16,733,348 |
Portfolio of Investments (unaudited) – continued
| Issuer | | | Shares/Par | Value ($) |
| Common Stocks – continued |
| Specialty Chemicals – continued | |
| Orbia Advance Corp. S.A.B. de C.V. | | 5,260,384 | $ 14,044,334 |
| Sika AG | | 180,793 | 51,646,945 |
| SK KAKEN Co. Ltd. | | 118,100 | 41,224,340 |
| Symrise AG | | 810,743 | 98,308,411 |
| Taisei Lamick Co. Ltd. | | 219,800 | 5,688,476 |
| Tikkurila Oyj | | 131,380 | 5,215,247 |
| | | | | $488,830,943 |
| Specialty Stores – 2.2% | |
| ABC-Mart, Inc. | | 192,300 | $ 10,863,919 |
| Esprit Holdings Ltd. (a) | | 6,185,199 | 615,635 |
| Just Eat Takeaway.com (a) | | 75,723 | 6,981,719 |
| Just Eat Takeaway.com N.V. (a) | | 848,851 | 78,262,089 |
| Kitanotatsujin Corp. | | 1,132,600 | 6,530,160 |
| Ryohin Keikaku Co. Ltd. | | 1,186,100 | 28,044,342 |
| Shimamura Co. Ltd. | | 52,800 | 6,089,465 |
| Zozo, Inc. | | 1,281,600 | 37,957,678 |
| | | | | $175,345,007 |
| Telecommunications - Wireless – 1.2% | |
| Cellnex Telecom S.A. | | 1,681,690 | $ 96,830,988 |
| Telephone Services – 0.8% | |
| Helios Towers PLC (a) | | 3,888,393 | $ 9,059,310 |
| Hellenic Telecommunications Organization S.A. | | 2,120,009 | 34,010,321 |
| Infrastrutture Wireless Italiane S.p.A. | | 1,249,006 | 13,914,739 |
| Telesites S.A.B. de C.V. (a) | | 4,881,500 | 5,075,069 |
| | | | | $62,059,439 |
| Tobacco – 0.3% | |
| Swedish Match AB | | 323,101 | $ 25,223,739 |
| Trucking – 2.9% | |
| Freightways Ltd. | | 1,868,239 | $ 14,743,993 |
| Hamakyorex Co. Ltd. | | 114,900 | 3,378,829 |
| Kintetsu World Express, Inc. | | 277,200 | 7,208,544 |
| Mainfreight Ltd. | | 262,213 | 12,709,191 |
| Seino Holdings Co. Ltd. | | 3,715,600 | 51,744,910 |
| SG Holdings Co. Ltd. | | 3,331,200 | 76,636,028 |
| Trancom Co. Ltd. | | 95,100 | 7,583,951 |
| Yamato Holdings Co. Ltd. | | 1,901,400 | 52,117,851 |
| | | | | $226,123,297 |
Portfolio of Investments (unaudited) – continued
| Issuer | | | Shares/Par | Value ($) |
| Common Stocks – continued |
| Utilities - Electric Power – 0.6% | |
| CESC Ltd. | | 3,095,481 | $ 25,201,618 |
| Energisa S.A., IEU | | 1,100,800 | 8,843,715 |
| Equatorial Energia S.A. | | 1,668,800 | 7,352,783 |
| Transmissora Alianca de Energia Eletrica S.A., IEU | | 1,333,873 | 9,223,231 |
| | | | | $50,621,347 |
| Utilities - Water – 0.2% | |
| Aguas Andinas S.A., “A” | | 27,052,934 | $ 8,369,705 |
| Companhia de Saneamento Basico do Estado de Sao Paulo | | 485,700 | 3,555,176 |
| | | | | $11,924,881 |
| Total Common Stocks (Identified Cost, $5,374,933,725) | | $ 7,703,317,631 |
| Preferred Stocks – 0.2% |
| Metals & Mining – 0.2% | | | | |
| Gerdau S.A. (Identified Cost, $10,492,018) | | 2,660,500 | $ 14,284,120 |
| | Strike
Price | First
Exercise | | |
| Rights – 0.0% |
| Specialty Stores – 0.0% |
| Esprit Holdings Ltd. (0.5 share for 1 right, Expiration 04/28/2021) (a) (Identified Cost, $0) | HKD 0.75 | 4/14/21 | 3,092,599 | $ 14,321 |
| | | | | |
| Investment Companies (h) – 2.2% |
| Money Market Funds – 2.2% | |
| MFS Institutional Money Market Portfolio, 0.05% (v) (Identified Cost, $174,312,329) | | | 174,312,691 | $ 174,312,691 |
| Collateral for Securities Loaned – 0.1% |
| JPMorgan U.S. Government Money Market Fund, 0.04% (j) (Identified Cost, $14,196,325) | | | 14,196,325 | $ 14,196,325 |
| Other Assets, Less Liabilities – 0.2% | | 12,610,271 |
| Net Assets – 100.0% | $7,918,735,359 |
| (a) | Non-income producing security. | | | |
| (h) | An affiliated issuer, which may be considered one in which the fund owns 5% or more of the outstanding voting securities, or a company which is under common control. At period end, the aggregate values of the fund's investments in affiliated issuers and in unaffiliated issuers were $317,708,495 and $7,588,416,593, respectively. | | | |
| (j) | The rate quoted is the annualized seven-day yield of the fund at period end. | | | |
| (l) | A portion of this security is on loan. See Note 2 for additional information. | | | |
Portfolio of Investments (unaudited) – continued
| (v) | Affiliated issuer that is available only to investment companies managed by MFS. The rate quoted for the MFS Institutional Money Market Portfolio is the annualized seven-day yield of the fund at period end. | | | |
| The following abbreviations are used in this report and are defined: |
| ADR | American Depositary Receipt |
| IEU | International Equity Unit |
| REIT | Real Estate Investment Trust |
| SDR | Swedish Depository Receipt |
| Abbreviations indicate amounts shown in currencies other than the U.S. dollar. All amounts are stated in U.S. dollars unless otherwise indicated. A list of abbreviations is shown below: |
| HKD | Hong Kong Dollar |
See Notes to Financial Statements
Financial Statements
Statement of Assets and Liabilities
At 3/31/21 (unaudited)
This statement represents your fund’s balance sheet, which details the assets and liabilities comprising the total value of the fund.
| Assets | |
| Investments in unaffiliated issuers, at value, including $24,607,367 of securities on loan (identified cost, $5,265,807,229) | $7,588,416,593 |
| Investments in affiliated issuers, at value (identified cost, $308,127,168) | 317,708,495 |
| Cash | 552,135 |
| Receivables for | |
| Investments sold | 2,413,568 |
| Fund shares sold | 16,361,991 |
| Interest and dividends | 28,946,558 |
| Other assets | 21,249 |
| Total assets | $7,954,420,589 |
| Liabilities | |
| Payable to custodian | $147 |
| Payables for | |
| Investments purchased | 8,621,109 |
| Fund shares reacquired | 6,580,189 |
| Collateral for securities loaned, at value (c) | 14,196,325 |
| Payable to affiliates | |
| Investment adviser | 367,626 |
| Administrative services fee | 3,089 |
| Shareholder servicing costs | 1,215,871 |
| Distribution and service fees | 17,435 |
| Program manager fees | 29 |
| Payable for independent Trustees' compensation | 20,690 |
| Deferred country tax expense payable | 4,032,820 |
| Accrued expenses and other liabilities | 629,900 |
| Total liabilities | $35,685,230 |
| Net assets | $7,918,735,359 |
| Net assets consist of | |
| Paid-in capital | $5,472,532,960 |
| Total distributable earnings (loss) | 2,446,202,399 |
| Net assets | $7,918,735,359 |
| Shares of beneficial interest outstanding | 209,203,060 |
| (c) | Non-cash collateral is not included. |
Statement of Assets and Liabilities (unaudited) – continued
| | Net assets | Shares
outstanding | Net asset value
per share (a) |
| Class A | $923,502,205 | 25,046,051 | $36.87 |
| Class B | 5,483,295 | 154,722 | 35.44 |
| Class C | 34,485,492 | 994,190 | 34.69 |
| Class I | 1,228,164,222 | 32,245,954 | 38.09 |
| Class R1 | 1,659,866 | 49,283 | 33.68 |
| Class R2 | 25,504,472 | 713,545 | 35.74 |
| Class R3 | 187,737,483 | 5,144,681 | 36.49 |
| Class R4 | 230,896,571 | 6,273,241 | 36.81 |
| Class R6 | 5,270,701,328 | 138,285,905 | 38.11 |
| Class 529A | 9,590,941 | 265,314 | 36.15 |
| Class 529B | 131,198 | 3,846 | 34.11 |
| Class 529C | 878,286 | 26,328 | 33.36 |
| (a) | Maximum offering price per share was equal to the net asset value per share for all share classes, except for Classes A and 529A, for which the maximum offering prices per share were $39.12 [100 / 94.25 x $36.87] and $38.36 [100 / 94.25 x $36.15], respectively. On sales of $50,000 or more, the maximum offering prices of Class A and Class 529A shares are reduced. A contingent deferred sales charge may be imposed on redemptions of Class A, Class B, Class C, Class 529B, and Class 529C shares. Redemption price per share was equal to the net asset value per share for Classes I, R1, R2, R3, R4, R6, and 529A. |
See Notes to Financial Statements
Financial Statements
Statement of Operations
Six months ended 3/31/21 (unaudited)
This statement describes how much your fund earned in investment income and accrued in expenses. It also describes any gains and/or losses generated by fund operations.
| Net investment income (loss) | |
| Income | |
| Dividends | $50,099,303 |
| Non-cash dividends (including $439,753 from affiliated issuers) | 9,517,139 |
| Dividends from affiliated issuers | 614,265 |
| Income on securities loaned | 122,835 |
| Foreign taxes withheld | (5,436,946) |
| Total investment income | $54,916,596 |
| Expenses | |
| Management fee | $32,157,166 |
| Distribution and service fees | 1,642,541 |
| Shareholder servicing costs | 1,916,538 |
| Program manager fees | 2,603 |
| Administrative services fee | 269,213 |
| Independent Trustees' compensation | 47,331 |
| Custodian fee | 813,808 |
| Shareholder communications | 157,307 |
| Audit and tax fees | 86,687 |
| Legal fees | 26,580 |
| Miscellaneous | 141,623 |
| Total expenses | $37,261,397 |
| Fees paid indirectly | (185) |
| Reduction of expenses by investment adviser and distributor | (414,973) |
| Net expenses | $36,846,239 |
| Net investment income (loss) | $18,070,357 |
| Realized and unrealized gain (loss) |
| Realized gain (loss) (identified cost basis) | |
| Unaffiliated issuers (net of $1,514,903 country tax) | $169,817,446 |
| Affiliated issuers | 2,290 |
| Foreign currency | (32,152) |
| Net realized gain (loss) | $169,787,584 |
| Change in unrealized appreciation or depreciation | |
| Unaffiliated issuers (net of $220,411 increase in deferred country tax) | $673,073,869 |
| Affiliated issuers | 31,385,308 |
| Translation of assets and liabilities in foreign currencies | (128,287) |
| Net unrealized gain (loss) | $704,330,890 |
| Net realized and unrealized gain (loss) | $874,118,474 |
| Change in net assets from operations | $892,188,831 |
See Notes to Financial Statements
Financial Statements
Statements of Changes in Net Assets
These statements describe the increases and/or decreases in net assets resulting from operations, any distributions, and any shareholder transactions.
| | Six months ended | Year ended |
| | 3/31/21 | 9/30/20 |
| Change in net assets | | |
| From operations | | |
| Net investment income (loss) | $18,070,357 | $45,549,752 |
| Net realized gain (loss) | 169,787,584 | 276,632,618 |
| Net unrealized gain (loss) | 704,330,890 | 93,081,912 |
| Change in net assets from operations | $892,188,831 | $415,264,282 |
| Total distributions to shareholders | $(294,377,310) | $(200,001,992) |
| Change in net assets from fund share transactions | $539,551,355 | $(420,485,944) |
| Total change in net assets | $1,137,362,876 | $(205,223,654) |
| Net assets | | |
| At beginning of period | 6,781,372,483 | 6,986,596,137 |
| At end of period | $7,918,735,359 | $6,781,372,483 |
See Notes to Financial Statements
Financial Statements
Financial Highlights
The financial highlights table is intended to help you understand the fund's financial performance for the semiannual period and the past 5 fiscal years. Certain information reflects financial results for a single fund share. The total returns in the table represent the rate that an investor would have earned (or lost) on an investment in the fund share class (assuming reinvestment of all distributions) held for the entire period.
Financial Highlights – continued
| Class A | Six months
ended | Year ended |
| | 3/31/21
(unaudited) | 9/30/20 | 9/30/19 | 9/30/18 | 9/30/17 | 9/30/16 |
| Net asset value, beginning of period | $33.91 | $32.56 | $35.00 | $33.42 | $29.34 | $26.70 |
| Income (loss) from investment operations |
| Net investment income (loss) (d) | $0.03 | $0.13 | $0.29 | $0.22 | $0.20(c) | $0.26 |
| Net realized and unrealized gain (loss) | 4.32 | 2.09 | (0.82) | 2.22 | 4.54 | 2.62 |
| Total from investment operations | $4.35 | $2.22 | $(0.53) | $2.44 | $4.74 | $2.88 |
| Less distributions declared to shareholders |
| From net investment income | $(0.03) | $(0.35) | $(0.20) | $(0.28) | $(0.36) | $(0.24) |
| From net realized gain | (1.36) | (0.52) | (1.71) | (0.58) | (0.30) | — |
| Total distributions declared to shareholders | $(1.39) | $(0.87) | $(1.91) | $(0.86) | $(0.66) | $(0.24) |
| Net asset value, end of period (x) | $36.87 | $33.91 | $32.56 | $35.00 | $33.42 | $29.34 |
| Total return (%) (r)(s)(t)(x) | 12.98(n) | 6.83 | (0.85) | 7.40 | 16.69(c) | 10.87 |
Ratios (%) (to average net assets)
and Supplemental data: |
| Expenses before expense reductions (f) | 1.28(a) | 1.29 | 1.29 | 1.30 | 1.33(c) | 1.37 |
| Expenses after expense reductions (f) | 1.27(a) | 1.28 | 1.28 | 1.29 | 1.30(c) | 1.33 |
| Net investment income (loss) | 0.19(a)(l) | 0.39 | 0.90 | 0.62 | 0.68(c) | 0.92 |
| Portfolio turnover | 8(n) | 25 | 14 | 21 | 17 | 13 |
| Net assets at end of period (000 omitted) | $923,502 | $871,605 | $1,015,817 | $1,163,703 | $1,224,654 | $1,359,996 |
See Notes to Financial Statements
Financial Highlights – continued
| Class B | Six months
ended | Year ended |
| | 3/31/21
(unaudited) | 9/30/20 | 9/30/19 | 9/30/18 | 9/30/17 | 9/30/16 |
| Net asset value, beginning of period | $32.73 | $31.42 | $33.86 | $32.36 | $28.40 | $25.83 |
| Income (loss) from investment operations |
| Net investment income (loss) (d) | $(0.10) | $(0.13) | $0.04 | $(0.05) | $(0.02)(c) | $0.04 |
| Net realized and unrealized gain (loss) | 4.17 | 2.02 | (0.77) | 2.16 | 4.41 | 2.55 |
| Total from investment operations | $4.07 | $1.89 | $(0.73) | $2.11 | $4.39 | $2.59 |
| Less distributions declared to shareholders |
| From net investment income | $— | $(0.06) | $— | $(0.03) | $(0.13) | $(0.02) |
| From net realized gain | (1.36) | (0.52) | (1.71) | (0.58) | (0.30) | — |
| Total distributions declared to shareholders | $(1.36) | $(0.58) | $(1.71) | $(0.61) | $(0.43) | $(0.02) |
| Net asset value, end of period (x) | $35.44 | $32.73 | $31.42 | $33.86 | $32.36 | $28.40 |
| Total return (%) (r)(s)(t)(x) | 12.57(n) | 6.03 | (1.57) | 6.59 | 15.81(c) | 10.04 |
Ratios (%) (to average net assets)
and Supplemental data: |
| Expenses before expense reductions (f) | 2.03(a) | 2.04 | 2.04 | 2.05 | 2.07(c) | 2.12 |
| Expenses after expense reductions (f) | 2.02(a) | 2.03 | 2.03 | 2.03 | 2.05(c) | 2.08 |
| Net investment income (loss) | (0.58)(a)(l) | (0.43) | 0.12 | (0.14) | (0.06)(c) | 0.16 |
| Portfolio turnover | 8(n) | 25 | 14 | 21 | 17 | 13 |
| Net assets at end of period (000 omitted) | $5,483 | $5,875 | $9,834 | $13,212 | $15,120 | $17,469 |
See Notes to Financial Statements
Financial Highlights – continued
| Class C | Six months
ended | Year ended |
| | 3/31/21
(unaudited) | 9/30/20 | 9/30/19 | 9/30/18 | 9/30/17 | 9/30/16 |
| Net asset value, beginning of period | $32.06 | $30.80 | $33.24 | $31.78 | $27.93 | $25.42 |
| Income (loss) from investment operations |
| Net investment income (loss) (d) | $(0.10) | $(0.12) | $0.03 | $(0.08) | $(0.01)(c) | $0.05 |
| Net realized and unrealized gain (loss) | 4.09 | 1.98 | (0.76) | 2.15 | 4.32 | 2.50 |
| Total from investment operations | $3.99 | $1.86 | $(0.73) | $2.07 | $4.31 | $2.55 |
| Less distributions declared to shareholders |
| From net investment income | $— | $(0.08) | $— | $(0.03) | $(0.16) | $(0.04) |
| From net realized gain | (1.36) | (0.52) | (1.71) | (0.58) | (0.30) | — |
| Total distributions declared to shareholders | $(1.36) | $(0.60) | $(1.71) | $(0.61) | $(0.46) | $(0.04) |
| Net asset value, end of period (x) | $34.69 | $32.06 | $30.80 | $33.24 | $31.78 | $27.93 |
| Total return (%) (r)(s)(t)(x) | 12.58(n) | 6.04 | (1.60) | 6.58 | 15.81(c) | 10.06 |
Ratios (%) (to average net assets)
and Supplemental data: |
| Expenses before expense reductions (f) | 2.03(a) | 2.04 | 2.04 | 2.04 | 2.07(c) | 2.12 |
| Expenses after expense reductions (f) | 2.02(a) | 2.03 | 2.03 | 2.03 | 2.05(c) | 2.08 |
| Net investment income (loss) | (0.59)(a)(l) | (0.40) | 0.10 | (0.25) | (0.04)(c) | 0.17 |
| Portfolio turnover | 8(n) | 25 | 14 | 21 | 17 | 13 |
| Net assets at end of period (000 omitted) | $34,485 | $42,312 | $60,916 | $84,044 | $152,036 | $166,306 |
See Notes to Financial Statements
Financial Highlights – continued
| Class I | Six months
ended | Year ended |
| | 3/31/21
(unaudited) | 9/30/20 | 9/30/19 | 9/30/18 | 9/30/17 | 9/30/16 |
| Net asset value, beginning of period | $35.02 | $33.59 | $36.06 | $34.41 | $30.20 | $27.48 |
| Income (loss) from investment operations |
| Net investment income (loss) (d) | $0.08 | $0.18 | $0.39 | $0.32 | $0.32(c) | $0.33 |
| Net realized and unrealized gain (loss) | 4.47 | 2.21 | (0.86) | 2.27 | 4.63 | 2.71 |
| Total from investment operations | $4.55 | $2.39 | $(0.47) | $2.59 | $4.95 | $3.04 |
| Less distributions declared to shareholders |
| From net investment income | $(0.12) | $(0.44) | $(0.29) | $(0.36) | $(0.44) | $(0.32) |
| From net realized gain | (1.36) | (0.52) | (1.71) | (0.58) | (0.30) | — |
| Total distributions declared to shareholders | $(1.48) | $(0.96) | $(2.00) | $(0.94) | $(0.74) | $(0.32) |
| Net asset value, end of period (x) | $38.09 | $35.02 | $33.59 | $36.06 | $34.41 | $30.20 |
| Total return (%) (r)(s)(t)(x) | 13.13(n) | 7.12 | (0.62) | 7.65 | 16.98(c) | 11.14 |
Ratios (%) (to average net assets)
and Supplemental data: |
| Expenses before expense reductions (f) | 1.03(a) | 1.04 | 1.04 | 1.05 | 1.07(c) | 1.12 |
| Expenses after expense reductions (f) | 1.02(a) | 1.03 | 1.03 | 1.04 | 1.05(c) | 1.08 |
| Net investment income (loss) | 0.43(a)(l) | 0.55 | 1.18 | 0.87 | 1.03(c) | 1.15 |
| Portfolio turnover | 8(n) | 25 | 14 | 21 | 17 | 13 |
| Net assets at end of period (000 omitted) | $1,228,164 | $1,230,970 | $2,049,197 | $2,094,665 | $1,876,295 | $1,670,850 |
See Notes to Financial Statements
Financial Highlights – continued
| Class R1 | Six months
ended | Year ended |
| | 3/31/21
(unaudited) | 9/30/20 | 9/30/19 | 9/30/18 | 9/30/17 | 9/30/16 |
| Net asset value, beginning of period | $31.16 | $30.01 | $32.44 | $31.03 | $27.32 | $24.82 |
| Income (loss) from investment operations |
| Net investment income (loss) (d) | $(0.09) | $(0.13) | $0.04 | $(0.07) | $(0.01)(c) | $0.05 |
| Net realized and unrealized gain (loss) | 3.97 | 1.94 | (0.76) | 2.09 | 4.21 | 2.45 |
| Total from investment operations | $3.88 | $1.81 | $(0.72) | $2.02 | $4.20 | $2.50 |
| Less distributions declared to shareholders |
| From net investment income | $— | $(0.14) | $— | $(0.03) | $(0.19) | $— |
| From net realized gain | (1.36) | (0.52) | (1.71) | (0.58) | (0.30) | — |
| Total distributions declared to shareholders | $(1.36) | $(0.66) | $(1.71) | $(0.61) | $(0.49) | $— |
| Net asset value, end of period (x) | $33.68 | $31.16 | $30.01 | $32.44 | $31.03 | $27.32 |
| Total return (%) (r)(s)(t)(x) | 12.59(n) | 6.03 | (1.61) | 6.59 | 15.79(c) | 10.07 |
Ratios (%) (to average net assets)
and Supplemental data: |
| Expenses before expense reductions (f) | 2.03(a) | 2.04 | 2.04 | 2.05 | 2.07(c) | 2.12 |
| Expenses after expense reductions (f) | 2.02(a) | 2.03 | 2.03 | 2.04 | 2.05(c) | 2.08 |
| Net investment income (loss) | (0.56)(a)(l) | (0.45) | 0.14 | (0.21) | (0.02)(c) | 0.19 |
| Portfolio turnover | 8(n) | 25 | 14 | 21 | 17 | 13 |
| Net assets at end of period (000 omitted) | $1,660 | $1,622 | $2,320 | $2,471 | $3,928 | $3,265 |
See Notes to Financial Statements
Financial Highlights – continued
| Class R2 | Six months
ended | Year ended |
| | 3/31/21
(unaudited) | 9/30/20 | 9/30/19 | 9/30/18 | 9/30/17 | 9/30/16 |
| Net asset value, beginning of period | $32.92 | $31.63 | $34.02 | $32.51 | $28.56 | $25.98 |
| Income (loss) from investment operations |
| Net investment income (loss) (d) | $(0.01) | $0.01 | $0.22 | $0.12 | $0.13(c) | $0.18 |
| Net realized and unrealized gain (loss) | 4.19 | 2.07 | (0.81) | 2.17 | 4.41 | 2.57 |
| Total from investment operations | $4.18 | $2.08 | $(0.59) | $2.29 | $4.54 | $2.75 |
| Less distributions declared to shareholders |
| From net investment income | $— | $(0.27) | $(0.09) | $(0.20) | $(0.29) | $(0.17) |
| From net realized gain | (1.36) | (0.52) | (1.71) | (0.58) | (0.30) | — |
| Total distributions declared to shareholders | $(1.36) | $(0.79) | $(1.80) | $(0.78) | $(0.59) | $(0.17) |
| Net asset value, end of period (x) | $35.74 | $32.92 | $31.63 | $34.02 | $32.51 | $28.56 |
| Total return (%) (r)(s)(t)(x) | 12.84(n) | 6.58 | (1.10) | 7.13 | 16.37(c) | 10.61 |
Ratios (%) (to average net assets)
and Supplemental data: |
| Expenses before expense reductions (f) | 1.53(a) | 1.54 | 1.54 | 1.55 | 1.57(c) | 1.62 |
| Expenses after expense reductions (f) | 1.52(a) | 1.53 | 1.53 | 1.54 | 1.55(c) | 1.58 |
| Net investment income (loss) | (0.07)(a)(l) | 0.03 | 0.71 | 0.35 | 0.46(c) | 0.66 |
| Portfolio turnover | 8(n) | 25 | 14 | 21 | 17 | 13 |
| Net assets at end of period (000 omitted) | $25,504 | $24,546 | $43,493 | $48,630 | $52,892 | $54,065 |
See Notes to Financial Statements
Financial Highlights – continued
| Class R3 | Six months
ended | Year ended |
| | 3/31/21
(unaudited) | 9/30/20 | 9/30/19 | 9/30/18 | 9/30/17 | 9/30/16 |
| Net asset value, beginning of period | $33.58 | $32.25 | $34.69 | $33.14 | $29.11 | $26.50 |
| Income (loss) from investment operations |
| Net investment income (loss) (d) | $0.05 | $0.13 | $0.29 | $0.20 | $0.22(c) | $0.25 |
| Net realized and unrealized gain (loss) | 4.26 | 2.08 | (0.83) | 2.21 | 4.48 | 2.61 |
| Total from investment operations | $4.31 | $2.21 | $(0.54) | $2.41 | $4.70 | $2.86 |
| Less distributions declared to shareholders |
| From net investment income | $(0.04) | $(0.36) | $(0.19) | $(0.28) | $(0.37) | $(0.25) |
| From net realized gain | (1.36) | (0.52) | (1.71) | (0.58) | (0.30) | — |
| Total distributions declared to shareholders | $(1.40) | $(0.88) | $(1.90) | $(0.86) | $(0.67) | $(0.25) |
| Net asset value, end of period (x) | $36.49 | $33.58 | $32.25 | $34.69 | $33.14 | $29.11 |
| Total return (%) (r)(s)(t)(x) | 12.98(n) | 6.86 | (0.88) | 7.39 | 16.70(c) | 10.85 |
Ratios (%) (to average net assets)
and Supplemental data: |
| Expenses before expense reductions (f) | 1.28(a) | 1.29 | 1.29 | 1.30 | 1.32(c) | 1.37 |
| Expenses after expense reductions (f) | 1.27(a) | 1.28 | 1.28 | 1.29 | 1.30(c) | 1.33 |
| Net investment income (loss) | 0.26(a)(l) | 0.42 | 0.92 | 0.58 | 0.73(c) | 0.92 |
| Portfolio turnover | 8(n) | 25 | 14 | 21 | 17 | 13 |
| Net assets at end of period (000 omitted) | $187,737 | $142,713 | $132,789 | $146,726 | $174,621 | $157,360 |
See Notes to Financial Statements
Financial Highlights – continued
| Class R4 | Six months
ended | Year ended |
| | 3/31/21
(unaudited) | 9/30/20 | 9/30/19 | 9/30/18 | 9/30/17 | 9/30/16 |
| Net asset value, beginning of period | $33.89 | $32.54 | $35.00 | $33.43 | $29.36 | $26.72 |
| Income (loss) from investment operations |
| Net investment income (loss) (d) | $0.07 | $0.21 | $0.36 | $0.31 | $0.29(c) | $0.32 |
| Net realized and unrealized gain (loss) | 4.33 | 2.10 | (0.82) | 2.21 | 4.52 | 2.64 |
| Total from investment operations | $4.40 | $2.31 | $(0.46) | $2.52 | $4.81 | $2.96 |
| Less distributions declared to shareholders |
| From net investment income | $(0.12) | $(0.44) | $(0.29) | $(0.37) | $(0.44) | $(0.32) |
| From net realized gain | (1.36) | (0.52) | (1.71) | (0.58) | (0.30) | — |
| Total distributions declared to shareholders | $(1.48) | $(0.96) | $(2.00) | $(0.95) | $(0.74) | $(0.32) |
| Net asset value, end of period (x) | $36.81 | $33.89 | $32.54 | $35.00 | $33.43 | $29.36 |
| Total return (%) (r)(s)(t)(x) | 13.15(n) | 7.10 | (0.61) | 7.65 | 16.98(c) | 11.16 |
Ratios (%) (to average net assets)
and Supplemental data: |
| Expenses before expense reductions (f) | 1.03(a) | 1.04 | 1.04 | 1.05 | 1.07(c) | 1.12 |
| Expenses after expense reductions (f) | 1.02(a) | 1.03 | 1.03 | 1.04 | 1.05(c) | 1.08 |
| Net investment income (loss) | 0.39(a)(l) | 0.66 | 1.14 | 0.87 | 0.96(c) | 1.15 |
| Portfolio turnover | 8(n) | 25 | 14 | 21 | 17 | 13 |
| Net assets at end of period (000 omitted) | $230,897 | $260,005 | $276,550 | $318,571 | $330,370 | $312,467 |
See Notes to Financial Statements
Financial Highlights – continued
| Class R6 | Six months
ended | Year ended |
| | 3/31/21
(unaudited) | 9/30/20 | 9/30/19 | 9/30/18 | 9/30/17 | 9/30/16 |
| Net asset value, beginning of period | $35.06 | $33.64 | $36.11 | $34.45 | $30.24 | $27.51 |
| Income (loss) from investment operations |
| Net investment income (loss) (d) | $0.11 | $0.28 | $0.44 | $0.37 | $0.35(c) | $0.38 |
| Net realized and unrealized gain (loss) | 4.47 | 2.13 | (0.87) | 2.27 | 4.64 | 2.70 |
| Total from investment operations | $4.58 | $2.41 | $(0.43) | $2.64 | $4.99 | $3.08 |
| Less distributions declared to shareholders |
| From net investment income | $(0.17) | $(0.47) | $(0.33) | $(0.40) | $(0.48) | $(0.35) |
| From net realized gain | (1.36) | (0.52) | (1.71) | (0.58) | (0.30) | — |
| Total distributions declared to shareholders | $(1.53) | $(0.99) | $(2.04) | $(0.98) | $(0.78) | $(0.35) |
| Net asset value, end of period (x) | $38.11 | $35.06 | $33.64 | $36.11 | $34.45 | $30.24 |
| Total return (%) (r)(s)(t)(x) | 13.22(n) | 7.20 | (0.47) | 7.79 | 17.10(c) | 11.30 |
Ratios (%) (to average net assets)
and Supplemental data: |
| Expenses before expense reductions (f) | 0.91(a) | 0.92 | 0.92 | 0.93 | 0.96(c) | 1.00 |
| Expenses after expense reductions (f) | 0.89(a) | 0.91 | 0.91 | 0.92 | 0.94(c) | 0.95 |
| Net investment income (loss) | 0.58(a)(l) | 0.84 | 1.34 | 1.02 | 1.13(c) | 1.32 |
| Portfolio turnover | 8(n) | 25 | 14 | 21 | 17 | 13 |
| Net assets at end of period (000 omitted) | $5,270,701 | $4,191,916 | $3,385,991 | $2,654,886 | $2,131,042 | $1,027,737 |
See Notes to Financial Statements
Financial Highlights – continued
| Class 529A | Six months
ended | Year ended |
| | 3/31/21
(unaudited) | 9/30/20 | 9/30/19 | 9/30/18 | 9/30/17 | 9/30/16 |
| Net asset value, beginning of period | $33.28 | $31.97 | $34.42 | $32.89 | $28.90 | $26.31 |
| Income (loss) from investment operations |
| Net investment income (loss) (d) | $0.03 | $0.13 | $0.29 | $0.22 | $0.22(c) | $0.25 |
| Net realized and unrealized gain (loss) | 4.24 | 2.05 | (0.83) | 2.18 | 4.44 | 2.59 |
| Total from investment operations | $4.27 | $2.18 | $(0.54) | $2.40 | $4.66 | $2.84 |
| Less distributions declared to shareholders |
| From net investment income | $(0.04) | $(0.35) | $(0.20) | $(0.29) | $(0.37) | $(0.25) |
| From net realized gain | (1.36) | (0.52) | (1.71) | (0.58) | (0.30) | — |
| Total distributions declared to shareholders | $(1.40) | $(0.87) | $(1.91) | $(0.87) | $(0.67) | $(0.25) |
| Net asset value, end of period (x) | $36.15 | $33.28 | $31.97 | $34.42 | $32.89 | $28.90 |
| Total return (%) (r)(s)(t)(x) | 12.99(n) | 6.84 | (0.88) | 7.41 | 16.67(c) | 10.87 |
Ratios (%) (to average net assets)
and Supplemental data: |
| Expenses before expense reductions (f) | 1.33(a) | 1.34 | 1.34 | 1.36 | 1.42(c) | 1.47 |
| Expenses after expense reductions (f) | 1.29(a) | 1.29 | 1.29 | 1.29 | 1.30(c) | 1.33 |
| Net investment income (loss) | 0.17(a)(l) | 0.42 | 0.91 | 0.64 | 0.74(c) | 0.93 |
| Portfolio turnover | 8(n) | 25 | 14 | 21 | 17 | 13 |
| Net assets at end of period (000 omitted) | $9,591 | $8,460 | $8,131 | $8,529 | $7,540 | $6,193 |
See Notes to Financial Statements
Financial Highlights – continued
| Class 529B | Six months
ended | Year ended |
| | 3/31/21
(unaudited) | 9/30/20 | 9/30/19 | 9/30/18 | 9/30/17 | 9/30/16 |
| Net asset value, beginning of period | $31.48 | $30.11 | $32.70 | $31.15 | $27.51 | $24.85 |
| Income (loss) from investment operations |
| Net investment income (loss) (d) | $0.02 | $0.09 | $0.05 | $0.20 | $0.08(c) | $0.20 |
| Net realized and unrealized gain (loss) | 4.02 | 1.94 | (0.77) | 2.08 | 4.22 | 2.46 |
| Total from investment operations | $4.04 | $2.03 | $(0.72) | $2.28 | $4.30 | $2.66 |
| Less distributions declared to shareholders |
| From net investment income | $(0.05) | $(0.14) | $(0.16) | $(0.15) | $(0.36) | $— |
| From net realized gain | (1.36) | (0.52) | (1.71) | (0.58) | (0.30) | — |
| Total distributions declared to shareholders | $(1.41) | $(0.66) | $(1.87) | $(0.73) | $(0.66) | $— |
| Net asset value, end of period (x) | $34.11 | $31.48 | $30.11 | $32.70 | $31.15 | $27.51 |
| Total return (%) (r)(s)(t)(x) | 12.97(n) | 6.75 | (1.55) | 7.43 | 16.19(c) | 10.70 |
Ratios (%) (to average net assets)
and Supplemental data: |
| Expenses before expense reductions (f) | 1.33(a) | 1.38 | 1.97 | 1.31 | 1.79(c) | 1.61 |
| Expenses after expense reductions (f) | 1.32(a) | 1.37 | 1.95 | 1.27 | 1.71(c) | 1.50 |
| Net investment income (loss) | 0.12(a)(l) | 0.29 | 0.17 | 0.62 | 0.30(c) | 0.76 |
| Portfolio turnover | 8(n) | 25 | 14 | 21 | 17 | 13 |
| Net assets at end of period (000 omitted) | $131 | $149 | $209 | $269 | $297 | $330 |
See Notes to Financial Statements
Financial Highlights – continued
| Class 529C | Six months
ended | Year ended |
| | 3/31/21
(unaudited) | 9/30/20 | 9/30/19 | 9/30/18 | 9/30/17 | 9/30/16 |
| Net asset value, beginning of period | $30.89 | $29.71 | $32.15 | $30.78 | $27.08 | $24.66 |
| Income (loss) from investment operations |
| Net investment income (loss) (d) | $(0.10) | $(0.12) | $0.03 | $(0.06) | $(0.02)(c) | $0.04 |
| Net realized and unrealized gain (loss) | 3.93 | 1.90 | (0.76) | 2.06 | 4.18 | 2.43 |
| Total from investment operations | $3.83 | $1.78 | $(0.73) | $2.00 | $4.16 | $2.47 |
| Less distributions declared to shareholders |
| From net investment income | $— | $(0.08) | $— | $(0.05) | $(0.16) | $(0.05) |
| From net realized gain | (1.36) | (0.52) | (1.71) | (0.58) | (0.30) | — |
| Total distributions declared to shareholders | $(1.36) | $(0.60) | $(1.71) | $(0.63) | $(0.46) | $(0.05) |
| Net asset value, end of period (x) | $33.36 | $30.89 | $29.71 | $32.15 | $30.78 | $27.08 |
| Total return (%) (r)(s)(t)(x) | 12.54(n) | 5.99 | (1.66) | 6.56 | 15.75(c) | 10.03 |
Ratios (%) (to average net assets)
and Supplemental data: |
| Expenses before expense reductions (f) | 2.08(a) | 2.09 | 2.09 | 2.11 | 2.17(c) | 2.22 |
| Expenses after expense reductions (f) | 2.07(a) | 2.08 | 2.08 | 2.08 | 2.10(c) | 2.12 |
| Net investment income (loss) | (0.63)(a)(l) | (0.40) | 0.09 | (0.20) | (0.08)(c) | 0.14 |
| Portfolio turnover | 8(n) | 25 | 14 | 21 | 17 | 13 |
| Net assets at end of period (000 omitted) | $878 | $1,200 | $1,350 | $1,686 | $2,020 | $1,909 |
See Notes to Financial Statements
Financial Highlights – continued
| (a) | Annualized. |
| (c) | Amount reflects a one-time reimbursement of expenses by the custodian (or former custodian) without which net investment income and performance would be lower and expenses would be higher. |
| (d) | Per share data is based on average shares outstanding. |
| (f) | Ratios do not reflect reductions from fees paid indirectly, if applicable. |
| (l) | Recognition of net investment income by the fund may be affected by the timing of the declaration of dividends by companies in which the fund invests and the actual annual net investment income ratio may differ. |
| (n) | Not annualized. |
| (r) | Certain expenses have been reduced without which performance would have been lower. |
| (s) | From time to time the fund may receive proceeds from litigation settlements, without which performance would be lower. |
| (t) | Total returns do not include any applicable sales charges. |
| (x) | The net asset values and total returns have been calculated on net assets which include adjustments made in accordance with U.S. generally accepted accounting principles required at period end for financial reporting purposes. |
See Notes to Financial Statements
Notes to Financial Statements
(unaudited)
(1) Business and Organization
MFS International New Discovery Fund (the fund) is a diversified series of MFS Series Trust V (the trust). The trust is organized as a Massachusetts business trust and is registered under the Investment Company Act of 1940, as amended, as an open-end management investment company.
The fund is an investment company and accordingly follows the investment company accounting and reporting guidance of the Financial Accounting Standards Board (FASB) Accounting Standards Codification Topic 946 Financial Services - Investment Companies.
(2) Significant Accounting Policies
General — The preparation of financial statements in conformity with U.S. generally accepted accounting principles requires management to make estimates and assumptions that affect the reported amounts of assets and liabilities, and disclosure of contingent assets and liabilities at the date of the financial statements and the reported amounts of increases and decreases in net assets from operations during the reporting period. Actual results could differ from those estimates. In the preparation of these financial statements, management has evaluated subsequent events occurring after the date of the fund’s Statement of Assets and Liabilities through the date that the financial statements were issued. The fund invests in foreign securities, including securities of emerging market issuers. Investments in foreign securities are vulnerable to the effects of changes in the relative values of the local currency and the U.S. dollar and to the effects of changes in each country’s market, economic, industrial, political, regulatory, geopolitical, environmental, public health, and other conditions. Investments in emerging markets can involve additional and greater risks than the risks associated with investments in developed foreign markets. Emerging markets can have less developed markets, greater custody and operational risk, less developed legal, regulatory, accounting, and auditing systems, and greater political, social, and economic instability than developed markets.
In March 2020, the FASB issued Accounting Standards Update 2020-04, Reference Rate Reform (Topic 848) – Facilitation of the Effects of Reference Rate Reform on Financial Reporting (“ASU 2020-04”), which provides optional, temporary relief with respect to the financial reporting of contracts subject to certain types of modifications due to the planned discontinuation of certain tenors of the London Interbank Offered Rate (LIBOR) and other IBOR-based reference rates as of the end of 2021. The temporary relief provided by ASU 2020-04 is effective for certain reference rate-related contract modifications that occur during the period from March 12, 2020 through December 31, 2022. Management is evaluating the impact of ASU 2020-04 on the fund's investments, derivatives, debt and other contracts that will undergo reference rate-related modifications as a result of the reference rate reform.
Balance Sheet Offsetting — The fund's accounting policy with respect to balance sheet offsetting is that, absent an event of default by the counterparty or a termination of the agreement, the International Swaps and Derivatives Association (ISDA) Master Agreement, or similar agreement, does not result in an offset of reported amounts of financial assets and financial liabilities in the Statement of Assets and Liabilities across transactions between the fund and the applicable counterparty. The fund's right to setoff may be restricted or prohibited by the bankruptcy or insolvency laws of the
Notes to Financial Statements (unaudited) - continued
particular jurisdiction to which a specific master netting agreement counterparty is subject. Balance sheet offsetting disclosures, to the extent applicable to the fund, have been included in the fund’s Significant Accounting Policies note under the captions for each of the fund’s in-scope financial instruments and transactions.
Investment Valuations — Equity securities, including restricted equity securities, are generally valued at the last sale or official closing price on their primary market or exchange as provided by a third-party pricing service. Equity securities, for which there were no sales reported that day, are generally valued at the last quoted daily bid quotation on their primary market or exchange as provided by a third-party pricing service. Short-term instruments with a maturity at issuance of 60 days or less may be valued at amortized cost, which approximates market value. Open-end investment companies are generally valued at net asset value per share. Securities and other assets generally valued on the basis of information from a third-party pricing service may also be valued at a broker/dealer bid quotation. In determining values, third-party pricing services can utilize both transaction data and market information such as yield, quality, coupon rate, maturity, type of issue, trading characteristics, and other market data. The values of foreign securities and other assets and liabilities expressed in foreign currencies are converted to U.S. dollars using the mean of bid and asked prices for rates provided by a third-party pricing service.
The Board of Trustees has delegated primary responsibility for determining or causing to be determined the value of the fund’s investments (including any fair valuation) to the adviser pursuant to valuation policies and procedures approved by the Board. If the adviser determines that reliable market quotations are not readily available, investments are valued at fair value as determined in good faith by the adviser in accordance with such procedures under the oversight of the Board of Trustees. Under the fund’s valuation policies and procedures, market quotations are not considered to be readily available for most types of debt instruments and floating rate loans and many types of derivatives. These investments are generally valued at fair value based on information from third-party pricing services. In addition, investments may be valued at fair value if the adviser determines that an investment’s value has been materially affected by events occurring after the close of the exchange or market on which the investment is principally traded (such as foreign exchange or market) and prior to the determination of the fund’s net asset value, or after the halt of trading of a specific security where trading does not resume prior to the close of the exchange or market on which the security is principally traded. Events that occur after foreign markets close (such as developments in foreign markets and significant movements in the U.S. markets) and prior to the determination of the fund’s net asset value may be deemed to have a material effect on the value of securities traded in foreign markets. Accordingly, the fund’s foreign equity securities may often be valued at fair value. The adviser generally relies on third-party pricing services or other information (such as the correlation with price movements of similar securities in the same or other markets; the type, cost and investment characteristics of the security; the business and financial condition of the issuer; and trading and other market data) to assist in determining whether to fair value and at what value to fair value an investment. The value of an investment for purposes of calculating the fund’s net asset value can differ depending on the source and method used to determine value. When fair valuation is used, the value of an investment used to determine the fund’s net asset value may differ from quoted or
Notes to Financial Statements (unaudited) - continued
published prices for the same investment. There can be no assurance that the fund could obtain the fair value assigned to an investment if it were to sell the investment at the same time at which the fund determines its net asset value per share.
Various inputs are used in determining the value of the fund's assets or liabilities. These inputs are categorized into three broad levels. In certain cases, the inputs used to measure fair value may fall into different levels of the fair value hierarchy. In such cases, an investment's level within the fair value hierarchy is based on the lowest level of input that is significant to the fair value measurement. The fund's assessment of the significance of a particular input to the fair value measurement in its entirety requires judgment, and considers factors specific to the investment. Level 1 includes unadjusted quoted prices in active markets for identical assets or liabilities. Level 2 includes other significant observable market-based inputs (including quoted prices for similar securities, interest rates, prepayment speed, and credit risk). Level 3 includes unobservable inputs, which may include the adviser's own assumptions in determining the fair value of investments. The following is a summary of the levels used as of March 31, 2021 in valuing the fund's assets or liabilities:
| Financial Instruments | Level 1 | Level 2 | Level 3 | Total |
| Equity Securities: | | | | |
| Japan | $733,472,068 | $1,753,582,550 | $— | $2,487,054,618 |
| United Kingdom | 1,055,366,822 | — | — | 1,055,366,822 |
| Germany | 502,333,373 | — | — | 502,333,373 |
| Australia | 13,333,816 | 326,381,042 | — | 339,714,858 |
| Netherlands | 235,955,468 | — | — | 235,955,468 |
| Hong Kong | 70,124,384 | 165,179,632 | — | 235,304,016 |
| China | 135,879,462 | 88,344,445 | — | 224,223,907 |
| India | 83,881,540 | 139,974,724 | — | 223,856,264 |
| Switzerland | 223,789,922 | — | — | 223,789,922 |
| Other Countries | 1,630,920,856 | 559,095,968 | — | 2,190,016,824 |
| Mutual Funds | 188,509,016 | — | — | 188,509,016 |
| Total | $4,873,566,727 | $3,032,558,361 | $— | $7,906,125,088 |
For further information regarding security characteristics, see the Portfolio of Investments.
Foreign Currency Translation — Purchases and sales of foreign investments, income, and expenses are converted into U.S. dollars based upon currency exchange rates prevailing on the respective dates of such transactions or on the reporting date for foreign denominated receivables and payables. Gains and losses attributable to foreign currency exchange rates on sales of securities are recorded for financial statement purposes as net realized gains and losses on investments. Gains and losses attributable to foreign exchange rate movements on receivables, payables, income and expenses are recorded for financial statement purposes as foreign currency transaction gains and losses. That portion of both realized and unrealized gains and losses on investments that results from fluctuations in foreign currency exchange rates is not separately disclosed.
Security Loans — Under its Securities Lending Agency Agreement with the fund, JPMorgan Chase and Co., as lending agent, loans the securities of the fund to certain qualified institutions (the “Borrowers”) approved by the fund. Security loans can be terminated at the discretion of either the lending agent or the fund and the related
Notes to Financial Statements (unaudited) - continued
securities must be returned within the earlier of the standard trade settlement period for such securities or within three business days. The loans are collateralized by cash and/or U.S. Treasury and federal agency obligations in an amount typically at least equal to the market value of the securities loaned. On loans collateralized by cash, the cash collateral is invested in a money market fund. The market value of the loaned securities is determined at the close of business of the fund and any additional required collateral is delivered to the fund on the next business day. The lending agent provides the fund with indemnification against Borrower default. In the event of Borrower default, the lending agent will, for the benefit of the fund, either purchase securities identical to those loaned or, when such purchase is commercially impracticable, pay the fund the market value of the loaned securities. In return, the lending agent assumes the fund's rights to the related collateral. If the collateral value is less than the cost to purchase identical securities, the lending agent is responsible for the shortfall, but only to the extent that such shortfall is not due to a decline in collateral value resulting from collateral reinvestment for which the fund bears the risk of loss. At period end, the fund had investment securities on loan, all of which were classified as equity securities in the fund's Portfolio of Investments, with a fair value of $24,607,367. The fair value of the fund's investment securities on loan and a related liability of $14,196,325 for cash collateral received on securities loaned are both presented gross in the Statement of Assets and Liabilities. Additionally, these loans were collateralized by U.S. Treasury Obligations of $11,517,676 held by the lending agent. The collateral on securities loaned exceeded the value of securities on loan at period end. The liability for cash collateral for securities loaned is carried at fair value, which is categorized as level 2 within the fair value hierarchy. A portion of the income generated upon investment of the collateral is remitted to the Borrowers, and the remainder is allocated between the fund and the lending agent. On loans collateralized by U.S. Treasury and/or federal agency obligations, a fee is received from the Borrower, and is allocated between the fund and the lending agent. Income from securities lending is separately reported in the Statement of Operations. The dividend and interest income earned on the securities loaned is accounted for in the same manner as other dividend and interest income.
Indemnifications — Under the fund's organizational documents, its officers and Trustees may be indemnified against certain liabilities and expenses arising out of the performance of their duties to the fund. Additionally, in the normal course of business, the fund enters into agreements with service providers that may contain indemnification clauses. The fund's maximum exposure under these agreements is unknown as this would involve future claims that may be made against the fund that have not yet occurred.
Investment Transactions and Income — Investment transactions are recorded on the trade date. Interest income is recorded on the accrual basis. Dividends received in cash are recorded on the ex-dividend date. Certain dividends from foreign securities will be recorded when the fund is informed of the dividend if such information is obtained subsequent to the ex-dividend date. Dividend payments received in additional securities are recorded on the ex-dividend date in an amount equal to the value of the security on such date.
Notes to Financial Statements (unaudited) - continued
The fund may receive proceeds from litigation settlements. Any proceeds received from litigation involving portfolio holdings are reflected in the Statement of Operations in realized gain/loss if the security has been disposed of by the fund or in unrealized gain/loss if the security is still held by the fund. Any other proceeds from litigation not related to portfolio holdings are reflected as other income in the Statement of Operations.
Fees Paid Indirectly — The fund's custody fee may be reduced by a credit earned under an arrangement that measures the value of U.S. dollars deposited with the custodian by the fund. The amount of the credit, for the six months ended March 31, 2021, is shown as a reduction of total expenses in the Statement of Operations.
Tax Matters and Distributions — The fund intends to qualify as a regulated investment company, as defined under Subchapter M of the Internal Revenue Code, and to distribute all of its taxable income, including realized capital gains. As a result, no provision for federal income tax is required. The fund’s federal tax returns, when filed, will remain subject to examination by the Internal Revenue Service for a three year period. Management has analyzed the fund’s tax positions taken on federal and state tax returns for all open tax years and does not believe that there are any uncertain tax positions that require recognition of a tax liability. Foreign taxes, if any, have been accrued by the fund in the accompanying financial statements in accordance with the applicable foreign tax law. Foreign income taxes may be withheld by certain countries in which the fund invests. Additionally, capital gains realized by the fund on securities issued in or by certain foreign countries may be subject to capital gains tax imposed by those countries.
Distributions to shareholders are recorded on the ex-dividend date. Income and capital gain distributions are determined in accordance with income tax regulations, which may differ from U.S. generally accepted accounting principles. Certain capital accounts in the financial statements are periodically adjusted for permanent differences in order to reflect their tax character. These adjustments have no impact on net assets or net asset value per share. Temporary differences which arise from recognizing certain items of income, expense, gain or loss in different periods for financial statement and tax purposes will reverse at some time in the future.
Book/tax differences primarily relate to passive foreign investment companies, wash sale loss deferrals, treating a portion of the proceeds from redemptions as a distribution for tax purposes, and foreign taxes.
The tax character of distributions made during the current period will be determined at fiscal year end. The tax character of distributions declared to shareholders for the last fiscal year is as follows:
| | Year ended
9/30/20 |
| Ordinary income (including any short-term capital gains) | $91,000,636 |
| Long-term capital gains | 109,001,356 |
| Total distributions | $200,001,992 |
Notes to Financial Statements (unaudited) - continued
The federal tax cost and the tax basis components of distributable earnings were as follows:
| As of 3/31/21 | |
| Cost of investments | $5,608,324,033 |
| Gross appreciation | 2,622,252,491 |
| Gross depreciation | (324,451,436) |
| Net unrealized appreciation (depreciation) | $2,297,801,055 |
| As of 9/30/20 | |
| Undistributed ordinary income | 26,183,169 |
| Undistributed long-term capital gain | 230,422,136 |
| Other temporary differences | (1,335,895) |
| Net unrealized appreciation (depreciation) | 1,593,121,468 |
The aggregate cost above includes prior fiscal year end tax adjustments, if applicable.
Multiple Classes of Shares of Beneficial Interest — The fund offers multiple classes of shares, which differ in their respective distribution, service, and program manager fees. The fund's income, realized and unrealized gain (loss), and common expenses are allocated to shareholders based on the daily net assets of each class. Dividends are declared separately for each class. Differences in per share dividend rates are generally due to differences in separate class expenses. Class B and Class 529B shares will convert to Class A and Class 529A shares, respectively, approximately eight years after purchase. In addition, Class C and Class 529C shares will convert to Class A and Class 529A shares, respectively, approximately eight years after purchase. The fund’s distributions declared to shareholders as reported in the Statements of Changes in Net Assets are presented by class as follows:
| | Six months
ended
3/31/21 | | Year
ended
9/30/20 |
| Class A | $34,439,503 | | $26,406,418 |
| Class B | 226,041 | | 169,796 |
| Class C | 1,691,213 | | 1,112,066 |
| Class I | 49,800,067 | | 56,642,556 |
| Class R1 | 63,826 | | 50,392 |
| Class R2 | 985,810 | | 1,025,511 |
| Class R3 | 5,729,175 | | 3,792,677 |
| Class R4 | 10,931,144 | | 7,982,678 |
| Class R6 | 190,105,108 | | 102,569,301 |
| Class 529A | 353,468 | | 220,057 |
| Class 529B | 5,469 | | 4,469 |
| Class 529C | 46,486 | | 26,071 |
| Total | $294,377,310 | | $200,001,992 |
Notes to Financial Statements (unaudited) - continued
(3) Transactions with Affiliates
Investment Adviser — The fund has an investment advisory agreement with MFS to provide overall investment management and related administrative services and facilities to the fund. The management fee is computed daily and paid monthly at the following annual rates based on the fund's average daily net assets:
| Up to $500 million | 0.975% |
| In excess of $500 million and up to $1 billion | 0.925% |
| In excess of $1 billion and up to $3 billion | 0.90% |
| In excess of $3 billion and up to $5 billion | 0.85% |
| In excess of $5 billion and up to $10 billion | 0.80% |
| In excess of $10 billion | 0.75% |
MFS has agreed in writing to reduce its management fee by a specified amount if certain MFS mutual fund assets exceed thresholds agreed to by MFS and the fund's Board of Trustees. For the six months ended March 31, 2021, this management fee reduction amounted to $412,942, which is included in the reduction of total expenses in the Statement of Operations. The management fee incurred for the six months ended March 31, 2021 was equivalent to an annual effective rate of 0.85% of the fund's average daily net assets.
Distributor — MFS Fund Distributors, Inc. (MFD), a wholly-owned subsidiary of MFS, as distributor, received $14,161 and $2,001 for the six months ended March 31, 2021, as its portion of the initial sales charge on sales of Class A and Class 529A shares of the fund, respectively.
The Board of Trustees has adopted a distribution plan for certain share classes pursuant to Rule 12b-1 of the Investment Company Act of 1940.
The fund's distribution plan provides that the fund will pay MFD for services provided by MFD and financial intermediaries in connection with the distribution and servicing of certain share classes. One component of the plan is a distribution fee paid to MFD and another component of the plan is a service fee paid to MFD. MFD may subsequently pay all, or a portion, of the distribution and/or service fees to financial intermediaries.
Notes to Financial Statements (unaudited) - continued
Distribution Plan Fee Table:
| | Distribution
Fee Rate (d) | Service
Fee Rate (d) | Total
Distribution
Plan (d) | Annual
Effective
Rate (e) | Distribution
and Service
Fee |
| Class A | — | 0.25% | 0.25% | 0.25% | $ 1,139,356 |
| Class B | 0.75% | 0.25% | 1.00% | 1.00% | 28,949 |
| Class C | 0.75% | 0.25% | 1.00% | 1.00% | 196,196 |
| Class R1 | 0.75% | 0.25% | 1.00% | 1.00% | 8,059 |
| Class R2 | 0.25% | 0.25% | 0.50% | 0.50% | 63,757 |
| Class R3 | — | 0.25% | 0.25% | 0.25% | 189,364 |
| Class 529A | — | 0.25% | 0.25% | 0.21% | 11,569 |
| Class 529B | 0.75% | 0.25% | 1.00% | 0.25% | 165 |
| Class 529C | 0.75% | 0.25% | 1.00% | 1.00% | 5,126 |
| Total Distribution and Service Fees | | | | | $1,642,541 |
| (d) | In accordance with the distribution plan for certain classes, the fund pays distribution and/or service fees equal to these annual percentage rates of each class’s average daily net assets. The distribution and service fee rates disclosed by class represent the current rates in effect at the end of the reporting period. Any rate changes, if applicable, are detailed below. |
| (e) | The annual effective rates represent actual fees incurred under the distribution plan for the six months ended March 31, 2021 based on each class's average daily net assets. MFD has voluntarily agreed to rebate a portion of each class's 0.25% service fee attributable to accounts for which there is no financial intermediary specified on the account except for accounts attributable to MFS or its affiliates' seed money. For the six months ended March 31, 2021, this rebate amounted to $303, $2, $1, $10, $1,713, and $2 for Class A, Class B, Class C, Class R2, Class 529A, and Class 529C, respectively, and is included in the reduction of total expenses in the Statement of Operations. For the six months ended March 31, 2021, the 0.75% distribution fee was not imposed for Class 529B shares due to the sales charge limitation contained in the Financial Industry Regulatory Authority (“FINRA”) Rule 2341. |
Certain Class A shares are subject to a contingent deferred sales charge (CDSC) in the event of a shareholder redemption within 18 months of purchase. Class B and Class 529B shares are subject to a CDSC in the event of a shareholder redemption within six years of purchase. Class C and Class 529C shares are subject to a CDSC in the event of a shareholder redemption within 12 months of purchase. All contingent deferred sales charges are paid to MFD and during the six months ended March 31, 2021, were as follows:
| | Amount |
| Class A | $116 |
| Class B | 1,850 |
| Class C | 851 |
| Class 529B | — |
| Class 529C | 31 |
The fund has entered into and may from time to time enter into contracts with program managers and other parties which administer the tuition programs through which an investment in the fund’s 529 share classes is made. The fund has entered into an agreement with MFD pursuant to which MFD receives an annual fee of up to 0.05% of the average daily net assets attributable to each 529 share class. The services
Notes to Financial Statements (unaudited) - continued
provided by MFD, or a third party with which MFD contracts, include recordkeeping and tax reporting and account services, as well as services designed to maintain the program’s compliance with the Internal Revenue Code and other regulatory requirements. Program manager fees for the six months ended March 31, 2021, were as follows:
| | Fee |
| Class 529A | $2,314 |
| Class 529B | 33 |
| Class 529C | 256 |
| Total Program Manager Fees | $2,603 |
Shareholder Servicing Agent — MFS Service Center, Inc. (MFSC), a wholly-owned subsidiary of MFS, receives a fee from the fund for its services as shareholder servicing agent calculated as a percentage of the average daily net assets of the fund as determined periodically under the supervision of the fund's Board of Trustees. For the six months ended March 31, 2021, the fee was $103,961, which equated to 0.0028% annually of the fund's average daily net assets. MFSC also receives reimbursement from the fund for out-of-pocket expenses, sub-accounting and other shareholder servicing costs which may be paid to affiliated and unaffiliated service providers. Class R6 shares do not incur sub-accounting fees. For the six months ended March 31, 2021, these out-of-pocket expenses, sub-accounting and other shareholder servicing costs amounted to $1,812,577.
Administrator — MFS provides certain financial, legal, shareholder communications, compliance, and other administrative services to the fund. Under an administrative services agreement, the fund reimburses MFS the costs incurred to provide these services. The fund is charged an annual fixed amount of $17,500 plus a fee based on average daily net assets. The administrative services fee incurred for the six months ended March 31, 2021 was equivalent to an annual effective rate of 0.0072% of the fund's average daily net assets.
Trustees’ and Officers’ Compensation — The fund pays compensation to independent Trustees in the form of a retainer, attendance fees, and additional compensation to Board and Committee chairpersons. The fund does not pay compensation directly to Trustees or officers of the fund who are also officers of the investment adviser, all of whom receive remuneration from MFS for their services to the fund. Certain officers and Trustees of the fund are officers or directors of MFS, MFD, and MFSC.
Other — The fund invests in the MFS Institutional Money Market Portfolio which is managed by MFS and seeks current income consistent with preservation of capital and liquidity. This money market fund does not pay a management fee to MFS but does incur investment and operating costs.
The fund is permitted to engage in purchase and sale transactions with funds and accounts for which MFS serves as investment adviser or sub-adviser (“cross-trades”) pursuant to a policy adopted by the Board of Trustees. This policy has been designed to ensure that cross-trades conducted by the fund comply with Rule 17a-7 under the Investment Company Act of 1940. During the six months ended March 31, 2021, the fund engaged in purchase transactions pursuant to this policy, which amounted to $9,286,886.
Notes to Financial Statements (unaudited) - continued
(4) Portfolio Securities
For the six months ended March 31, 2021, purchases and sales of investments, other than short-term obligations, aggregated $667,848,535 and $572,647,615, respectively.
(5) Shares of Beneficial Interest
The fund's Declaration of Trust permits the Trustees to issue an unlimited number of full and fractional shares of beneficial interest. Transactions in fund shares were as follows:
| | Six months ended
3/31/21 | | Year ended
9/30/20 |
| | Shares | Amount | | Shares | Amount |
| Shares sold | | | | | |
| Class A | 1,031,222 | $37,326,000 | | 2,600,496 | $80,931,701 |
| Class B | 62 | 2,341 | | 776 | 24,640 |
| Class C | 11,769 | 402,694 | | 59,247 | 1,820,573 |
| Class I | 1,691,869 | 63,291,652 | | 6,380,843 | 208,231,953 |
| Class R1 | 3,841 | 128,616 | | 21,545 | 652,024 |
| Class R2 | 46,752 | 1,648,816 | | 197,296 | 6,106,880 |
| Class R3 | 1,493,868 | 53,684,500 | | 1,422,289 | 43,337,490 |
| Class R4 | 562,392 | 20,474,800 | | 1,497,904 | 46,286,463 |
| Class R6 | 19,276,777 | 726,643,615 | | 29,655,893 | 937,470,504 |
| Class 529A | 26,709 | 950,093 | | 24,909 | 766,176 |
| Class 529B | — | 3 | | — | — |
| Class 529C | 810 | 26,662 | | 6,241 | 184,586 |
| | 24,146,071 | $904,579,792 | | 41,867,439 | $1,325,812,990 |
Shares issued to shareholders
in reinvestment of distributions | | | | | |
| Class A | 852,189 | $30,389,063 | | 702,847 | $23,784,330 |
| Class B | 6,527 | 224,197 | | 5,133 | 168,651 |
| Class C | 49,239 | 1,655,408 | | 31,749 | 1,022,005 |
| Class I | 1,273,747 | 46,886,629 | | 1,416,222 | 49,397,834 |
| Class R1 | 1,955 | 63,826 | | 1,611 | 50,392 |
| Class R2 | 28,076 | 971,154 | | 29,051 | 956,353 |
| Class R3 | 162,346 | 5,729,175 | | 113,163 | 3,792,099 |
| Class R4 | 291,429 | 10,366,130 | | 223,643 | 7,550,198 |
| Class R6 | 4,773,203 | 175,749,343 | | 2,760,920 | 96,328,499 |
| Class 529A | 9,862 | 344,770 | | 6,624 | 220,057 |
| Class 529B | 166 | 5,469 | | 142 | 4,469 |
| Class 529C | 1,437 | 46,486 | | 840 | 26,071 |
| | 7,450,176 | $272,431,650 | | 5,291,945 | $183,300,958 |
Notes to Financial Statements (unaudited) - continued
| | Six months ended
3/31/21 | | Year ended
9/30/20 |
| | Shares | Amount | | Shares | Amount |
| Shares reacquired | | | | | |
| Class A | (2,544,103) | $(91,543,173) | | (8,798,044) | $(276,566,703) |
| Class B | (31,382) | (1,091,135) | | (139,435) | (4,169,126) |
| Class C | (386,634) | (13,180,348) | | (748,840) | (22,693,596) |
| Class I | (5,873,798) | (219,744,235) | | (33,644,188) | (1,035,097,460) |
| Class R1 | (8,575) | (280,733) | | (48,405) | (1,510,330) |
| Class R2 | (106,985) | (3,753,038) | | (855,674) | (27,203,886) |
| Class R3 | (761,999) | (27,235,272) | | (1,401,881) | (44,428,680) |
| Class R4 | (2,252,663) | (81,244,948) | | (2,547,593) | (80,193,139) |
| Class R6 | (5,316,843) | (197,966,077) | | (13,531,532) | (436,269,431) |
| Class 529A | (25,482) | (905,491) | | (31,618) | (1,008,514) |
| Class 529B | (1,053) | (33,789) | | (2,336) | (69,535) |
| Class 529C | (14,770) | (481,848) | | (13,662) | (389,492) |
| | (17,324,287) | $(637,460,087) | | (61,763,208) | $(1,929,599,892) |
| Net change | | | | | |
| Class A | (660,692) | $(23,828,110) | | (5,494,701) | $(171,850,672) |
| Class B | (24,793) | (864,597) | | (133,526) | (3,975,835) |
| Class C | (325,626) | (11,122,246) | | (657,844) | (19,851,018) |
| Class I | (2,908,182) | (109,565,954) | | (25,847,123) | (777,467,673) |
| Class R1 | (2,779) | (88,291) | | (25,249) | (807,914) |
| Class R2 | (32,157) | (1,133,068) | | (629,327) | (20,140,653) |
| Class R3 | 894,215 | 32,178,403 | | 133,571 | 2,700,909 |
| Class R4 | (1,398,842) | (50,404,018) | | (826,046) | (26,356,478) |
| Class R6 | 18,733,137 | 704,426,881 | | 18,885,281 | 597,529,572 |
| Class 529A | 11,089 | 389,372 | | (85) | (22,281) |
| Class 529B | (887) | (28,317) | | (2,194) | (65,066) |
| Class 529C | (12,523) | (408,700) | | (6,581) | (178,835) |
| | 14,271,960 | $539,551,355 | | (14,603,824) | $(420,485,944) |
Effective June 1, 2019, purchases of the fund’s Class B and Class 529B shares are closed to new and existing investors subject to certain exceptions. Effective at the close of business on November 29, 2019, purchases of the fund are closed to new investors subject to certain exceptions. Please see the fund’s prospectus for details.
The fund is one of several mutual funds in which certain MFS funds may invest. The MFS funds do not invest in the underlying funds for the purpose of exercising management or control. At the end of the period, the MFS International Diversification Fund, the MFS Growth Allocation Fund, the MFS Aggressive Growth Allocation Fund, and the MFS Moderate Allocation Fund were the owners of record of approximately 44%, 2%, 1%, and 1%, respectively, of the value of outstanding voting shares of the fund. In addition, the MFS Lifetime 2030 Fund, the MFS Lifetime 2035 Fund, the
Notes to Financial Statements (unaudited) - continued
MFS Lifetime 2040 Fund, the MFS Lifetime 2045 Fund, the MFS Lifetime 2050 Fund, the MFS Lifetime 2055 Fund, and the MFS Lifetime 2060 Fund were each the owners of record of less than 1% of the value of outstanding voting shares of the fund.
(6) Line of Credit
The fund and certain other funds managed by MFS participate in a $1.25 billion unsecured committed line of credit of which $1 billion is reserved for use by the fund and certain other U.S. funds. The line of credit is provided by a syndicate of banks under a credit agreement. Borrowings may be made for temporary financing needs. Interest is charged to each fund, based on its borrowings, generally at a rate equal to the highest of one month LIBOR, the Federal Funds Effective Rate and the Overnight Bank Funding Rate, plus an agreed upon spread. A commitment fee, based on the average daily, unused portion of the committed line of credit, is allocated among the participating funds. In addition, the fund and other funds managed by MFS have established unsecured uncommitted borrowing arrangements with certain banks for temporary financing needs. Interest is charged to each fund, based on its borrowings, at rates equal to customary reference rates plus an agreed upon spread. For the six months ended March 31, 2021, the fund’s commitment fee and interest expense were $15,545 and $0, respectively, and are included in “Miscellaneous” expense in the Statement of Operations.
(7) Investments in Affiliated Issuers
An affiliated issuer may be considered one in which the fund owns 5% or more of the outstanding voting securities, or a company which is under common control. For the purposes of this report, the following were affiliated issuers:
| Affiliated Issuers | Beginning
Value | Purchases | Sales
Proceeds | Realized
Gain
(Loss) | Change in
Unrealized
Appreciation or
Depreciation | Ending
Value |
| Forterra PLC | $34,998,369 | $— | $— | $— | $25,631,578 | $60,629,947 |
| MFS Institutional Money Market Portfolio | 41,803,333 | 774,682,734 | 642,173,375 | 2,290 | (2,291) | 174,312,691 |
| Midland Holdings Ltd. | 3,894,052 | — | — | — | 1,429,841 | 5,323,893 |
| Ridley Corp. NPV | 12,438,203 | — | — | — | 6,963,096 | 19,401,299 |
| T. Hasegawa Co. Ltd. | 53,547,491 | 7,130,090 | — | — | (2,636,916) | 58,040,665 |
| | $146,681,448 | $781,812,824 | $642,173,375 | $2,290 | $31,385,308 | $317,708,495 |
| Affiliated Issuers | Dividend
Income | Capital Gain
Distributions |
| Forterra PLC | $— | $— |
| MFS Institutional Money Market Portfolio | 83,457 | — |
| Midland Holdings Ltd. | 439,753 | — |
| Ridley Corp. NPV | — | — |
| T. Hasegawa Co. Ltd. | 530,808 | — |
| | $1,054,018 | $— |
Notes to Financial Statements (unaudited) - continued
(8) Impacts of COVID-19
The pandemic related to the global spread of novel coronavirus disease (COVID-19), which was first detected in December 2019, has resulted in significant disruptions to global business activity and the global economy, as well as the economies of individual countries, the financial performance of individual companies and sectors, and the securities and commodities markets in general. Multiple surges in cases globally, the availability and widespread adoption of vaccines, and the emergence of variant strains of the virus continue to create uncertainty as to the future and long-term impacts resulting from the pandemic including impacts to the prices and liquidity of the fund's investments and the fund's performance.
Proxy Voting Policies and Information
MFS votes proxies on behalf of the fund pursuant to proxy voting policies and procedures that are available without charge, upon request, by calling 1-800-225-2606, by visiting mfs.com/proxyvoting, or by visiting the SEC’s Web site at http://www.sec.gov.
Information regarding how the fund voted proxies relating to portfolio securities during the most recent twelve-month period ended June 30 is available by August 31 of each year without charge by visiting mfs.com/proxyvoting, or by visiting the SEC’s Web site at http://www.sec.gov.
Quarterly Portfolio Disclosure
The fund files a complete schedule of portfolio holdings with the SEC for the first and third quarters of each fiscal year as an exhibit to its reports on Form N-PORT. The fund's Form N-PORT reports are available on the SEC's Web site at http://www.sec.gov. A shareholder can obtain the portfolio holdings report for the first and third quarters of the fund's fiscal year at mfs.com/openendfunds by choosing the fund's name and then scrolling to the “Resources” section and clicking on the “Prospectus and Reports” tab.
Further Information
From time to time, MFS may post important information about the fund or the MFS Funds on the MFS Web site (mfs.com). This information is available at https://www.mfs.com/announcements or at mfs.com/openendfunds by choosing the fund’s name and then scrolling to the “Resources” section and clicking on the “Announcements” tab, if any.
Information About Fund Contracts and Legal Claims
The fund has entered into contractual arrangements with an investment adviser, administrator, distributor, shareholder servicing agent, 529 program manager (if applicable), and custodian who each provide services to the fund. Unless expressly stated otherwise, shareholders are not parties to, or intended beneficiaries of these contractual arrangements, and these contractual arrangements are not intended to create any shareholder right to enforce them against the service providers or to seek any remedy under them against the service providers, either directly or on behalf of the fund.
Under the Trust’s By-Laws and Declaration of Trust, any claims asserted against or on behalf of the MFS Funds, including claims against Trustees and Officers, must be brought in state and federal courts located within the Commonwealth of Massachusetts.
Provision of Financial Reports and Summary Prospectuses
The fund produces financial reports every six months and updates its summary prospectus and prospectus annually. To avoid sending duplicate copies of materials to households, only one copy of the fund’s annual and semiannual report and summary prospectus may be mailed to shareholders having the same last name and residential address on the fund’s records. However, any shareholder may contact MFSC (please see back cover for address and telephone number) to request that copies of these reports and summary prospectuses be sent personally to that shareholder.
Save paper with eDelivery.
MFS® will send you prospectuses, reports, and proxies directly via e-mail so you will get information faster with less mailbox clutter.
To sign up:
1. Go to mfs.com.
2. Log in via MFS® Access.
3. Select eDelivery.
If you own your MFS fund shares through a financial institution or a retirement plan, MFS® TALK, MFS® Access, or eDelivery may not be available to you.
CONTACT
WEB SITE
mfs.com
MFS TALK
1-800-637-8255
24 hours a day
ACCOUNT SERVICE AND LITERATURE
Shareholders
1-800-225-2606
Financial advisors
1-800-343-2829
Retirement plan services
1-800-637-1255
MAILING ADDRESS
MFS Service Center, Inc.
P.O. Box 219341
Kansas City, MO 64121-9341
OVERNIGHT MAIL
MFS Service Center, Inc.
Suite 219341
430 W 7th Street
Kansas City, MO 64105-1407
Semiannual Report
March 31, 2021
The report is prepared for the general information of shareholders. It is authorized for distribution to prospective investors only when preceded or accompanied by a current prospectus.
NOT FDIC INSURED • MAY LOSE VALUE • NO BANK GUARANTEE
LETTER FROM THE CEO
Dear Shareholders:
Markets have experienced dramatic swings since the coronavirus pandemic brought the global economy to a standstill for several months early in 2020. The speedy development of vaccines and therapeutics brightened the economic and market outlook, but uncertainty remains as new variants of the virus appear and questions persist over how fast vaccines can be made widely available outside the United States. In the U.S., political uncertainty eased after former Vice President Joe Biden won the presidential election and the Democrats gained control of a closely divided Senate.
Global central banks have taken aggressive steps to cushion the economic and market fallout related to the virus, and governments are deploying unprecedented levels of fiscal support. Having passed a $1.9 trillion stimulus package in March, the U.S. Congress is expected to approve additional stimulus later this year, some of it focused on infrastructure. Along with extraordinary government expenditures, pent-up consumer demand could fuel a surge in economic activity as coronavirus restrictions are eased further. Because of this, markets anticipate at least temporary inflation pressures in the months ahead and have pushed up yields on global government bonds, resulting in ripple effects being felt across most financial markets. The measures already put in place have helped build a supportive environment and are encouraging economic recovery; however, if markets disconnect from fundamentals, they can sow the seeds of instability. As such, recent dramatic increases in speculative retail trading bear watching.
In the aftermath of the crisis, we could see societal changes as households, businesses, and governments adjust to a new reality, and any such alterations could affect the investment landscape. For investors, events such as the COVID-19 outbreak demonstrate the importance of having a deep understanding of company fundamentals, and we have built our global research platform to do just that.
At MFS®, we put our clients’ assets to work responsibly by carefully navigating the increasing complexity of global markets and economies. Guided by our long-term philosophy and adhering to our commitment to sustainable investing, we tune out the noise and aim to uncover what we believe are the best, most durable investment opportunities in the market. Our unique global investment platform combines collective expertise, long-term discipline, and thoughtful risk management to create sustainable value for investors.
Respectfully,
Michael W. Roberge
Chief Executive Officer
MFS Investment Management
May 14, 2021
The opinions expressed in this letter are subject to change and may not be relied upon for investment advice. No forecasts can be guaranteed.
Portfolio structure
Top ten holdings
| Microsoft Corp. | 6.4% |
| Amazon.com, Inc. | 4.7% |
| Alphabet, Inc., “A” | 4.3% |
| Apple, Inc. | 2.8% |
| Facebook, Inc., “A” | 2.8% |
| Visa, Inc., “A” | 2.1% |
| Adobe Systems, Inc. | 1.9% |
| Bank of America Corp. | 1.7% |
| salesforce.com, inc. | 1.6% |
| Charles Schwab Corp. | 1.5% |
Global equity sectors (k)
| Technology | 31.0% |
| Financial Services | 14.2% |
| Capital Goods | 13.8% |
| Consumer Cyclicals | 13.4% |
| Health Care (s) | 13.1% |
| Energy | 5.3% |
| Consumer Staples | 4.6% |
| Telecommunications/Cable Television (s) | 3.2% |
| (k) | The sectors set forth above and the associated portfolio composition are based on MFS’ own custom sector classification methodology. |
| (s) | Includes securities sold short. |
Cash & Cash Equivalents includes any cash, investments in money market funds, short-term securities, and other assets less liabilities. Please see the Statement of Assets and Liabilities for additional information related to the fund’s cash position and other assets and liabilities.
Percentages are based on net assets as of March 31, 2021.
The portfolio is actively managed and current holdings may be different.
Expense Table
Fund expenses borne by the shareholders during the period,
October 1, 2020 through March 31, 2021
As a shareholder of the fund, you incur two types of costs: (1) transaction costs, including sales charges (loads) on certain purchase or redemption payments, and (2) ongoing costs, including management fees; distribution and service (12b-1) fees; and other fund expenses. This example is intended to help you understand your ongoing costs (in dollars) of investing in the fund and to compare these costs with the ongoing costs of investing in other mutual funds.
The example is based on an investment of $1,000 invested at the beginning of the period and held for the entire period October 1, 2020 through March 31, 2021.
Actual Expenses
The first line for each share class in the following table provides information about actual account values and actual expenses. You may use the information in this line, together with the amount you invested, to estimate the expenses that you paid over the period. Simply divide your account value by $1,000 (for example, an $8,600 account value divided by $1,000 = 8.6), then multiply the result by the number in the first line under the heading entitled “Expenses Paid During Period” to estimate the expenses you paid on your account during this period.
Hypothetical Example for Comparison Purposes
The second line for each share class in the following table provides information about hypothetical account values and hypothetical expenses based on the fund’s actual expense ratio and an assumed rate of return of 5% per year before expenses, which is not the fund’s actual return. The hypothetical account values and expenses may not be used to estimate the actual ending account balance or expenses you paid for the period. You may use this information to compare the ongoing costs of investing in the fund and other funds. To do so, compare this 5% hypothetical example with the 5% hypothetical examples that appear in the shareholder reports of the other funds.
Please note that the expenses shown in the table are meant to highlight your ongoing costs only and do not reflect any transactional costs, such as sales charges (loads). Therefore, the second line for each share class in the table is useful in comparing ongoing costs only, and will not help you determine the relative total costs of owning different funds. In addition, if these transactional costs were included, your costs would have been higher.
Expense Table - continued
Share
Class | | Annualized
Expense
Ratio | Beginning
Account Value
10/01/20 | Ending
Account Value
3/31/21 | Expenses
Paid During
Period (p)
10/01/20-3/31/21 |
| A | Actual | 0.78% | $1,000.00 | $1,163.84 | $4.21 |
| Hypothetical(h) | 0.78% | $1,000.00 | $1,021.04 | $3.93 |
| B | Actual | 1.53% | $1,000.00 | $1,159.64 | $8.24 |
| Hypothetical(h) | 1.53% | $1,000.00 | $1,017.30 | $7.70 |
| C | Actual | 1.53% | $1,000.00 | $1,159.38 | $8.24 |
| Hypothetical(h) | 1.53% | $1,000.00 | $1,017.30 | $7.70 |
| I | Actual | 0.54% | $1,000.00 | $1,165.23 | $2.92 |
| Hypothetical(h) | 0.54% | $1,000.00 | $1,022.24 | $2.72 |
| R1 | Actual | 1.53% | $1,000.00 | $1,159.39 | $8.24 |
| Hypothetical(h) | 1.53% | $1,000.00 | $1,017.30 | $7.70 |
| R2 | Actual | 1.03% | $1,000.00 | $1,162.17 | $5.55 |
| Hypothetical(h) | 1.03% | $1,000.00 | $1,019.80 | $5.19 |
| R3 | Actual | 0.78% | $1,000.00 | $1,163.71 | $4.21 |
| Hypothetical(h) | 0.78% | $1,000.00 | $1,021.04 | $3.93 |
| R4 | Actual | 0.54% | $1,000.00 | $1,165.09 | $2.91 |
| Hypothetical(h) | 0.54% | $1,000.00 | $1,022.24 | $2.72 |
| R6 | Actual | 0.47% | $1,000.00 | $1,165.41 | $2.54 |
| Hypothetical(h) | 0.47% | $1,000.00 | $1,022.59 | $2.37 |
| (h) | 5% fund return per year before expenses. |
| (p) | “Expenses Paid During Period” are equal to each class’s annualized expense ratio, as shown above, multiplied by the average account value over the period, multiplied by 182/365 (to reflect the one-half year period). Expenses paid do not include any applicable sales charges (loads). If these transaction costs had been included, your costs would have been higher. |
Notes to Expense Table
Expense ratios include 0.02% of investment related expenses from short sales (See Note 2 of the Notes to Financial Statements).
Portfolio of Investments
3/31/21 (unaudited)
The Portfolio of Investments is a complete list of all securities owned by your fund. It is categorized by broad-based asset classes.
| Issuer | | | Shares/Par | Value ($) |
| Common Stocks – 98.9% |
| Aerospace – 3.1% | |
| Honeywell International, Inc. | | 407,372 | $ 88,428,240 |
| L3Harris Technologies, Inc. | | 252,984 | 51,274,797 |
| Northrop Grumman Corp. | | 107,720 | 34,862,501 |
| Raytheon Technologies Corp. | | 848,112 | 65,533,614 |
| | | | | $240,099,152 |
| Alcoholic Beverages – 0.6% | |
| Constellation Brands, Inc., “A” | | 196,787 | $ 44,867,436 |
| Apparel Manufacturers – 1.2% | |
| NIKE, Inc., “B” | | 708,493 | $ 94,151,635 |
| Biotechnology – 1.0% | |
| Illumina, Inc. (a) | | 94,255 | $ 36,199,575 |
| Vertex Pharmaceuticals, Inc. (a) | | 203,275 | 43,681,765 |
| | | | | $79,881,340 |
| Brokerage & Asset Managers – 1.9% | |
| Cboe Global Markets, Inc. | | 347,913 | $ 34,335,534 |
| Charles Schwab Corp. | | 1,745,461 | 113,769,148 |
| | | | | $148,104,682 |
| Business Services – 4.1% | |
| Accenture PLC, “A” | | 248,322 | $ 68,598,953 |
| Fidelity National Information Services, Inc. | | 641,787 | 90,241,670 |
| Fiserv, Inc. (a) | | 722,181 | 85,968,426 |
| Global Payments, Inc. | | 352,286 | 71,013,812 |
| | | | | $315,822,861 |
| Cable TV – 1.5% | |
| Cable One, Inc. | | 14,369 | $ 26,271,705 |
| Charter Communications, Inc., “A” (a) | | 143,924 | 88,803,986 |
| | | | | $115,075,691 |
| Chemicals – 0.5% | |
| FMC Corp. | | 336,373 | $ 37,206,218 |
| Computer Software – 11.3% | |
| Adobe Systems, Inc. (a) | | 312,909 | $ 148,747,551 |
| Atlassian Corp. PLC, “A” (a) | | 169,670 | 35,759,649 |
| Cadence Design Systems, Inc. (a) | | 548,520 | 75,141,755 |
| Microsoft Corp. (s) | | 2,120,063 | 499,847,254 |
Portfolio of Investments (unaudited) – continued
| Issuer | | | Shares/Par | Value ($) |
| Common Stocks – continued |
| Computer Software – continued | |
| salesforce.com, inc. (a) | | 579,161 | $ 122,706,841 |
| | | | | $882,203,050 |
| Computer Software - Systems – 4.6% | |
| Apple, Inc. | | 1,782,024 | $ 217,674,232 |
| Constellation Software, Inc. | | 38,172 | 53,308,973 |
| EPAM Systems, Inc. (a) | | 120,607 | 47,843,591 |
| TransUnion | | 459,267 | 41,334,030 |
| | | | | $360,160,826 |
| Construction – 2.8% | |
| AvalonBay Communities, Inc., REIT | | 105,446 | $ 19,455,842 |
| AZEK Co. LLC (a) | | 616,971 | 25,943,630 |
| Masco Corp. | | 776,080 | 46,487,192 |
| Otis Worldwide Corp. | | 592,442 | 40,552,655 |
| Sherwin-Williams Co. | | 63,180 | 46,627,472 |
| Vulcan Materials Co. | | 225,390 | 38,034,562 |
| | | | | $217,101,353 |
| Consumer Products – 1.3% | |
| Colgate-Palmolive Co. | | 706,978 | $ 55,731,076 |
| Kimberly-Clark Corp. | | 342,044 | 47,561,218 |
| | | | | $103,292,294 |
| Electrical Equipment – 1.6% | |
| Johnson Controls International PLC | | 946,022 | $ 56,449,133 |
| Sensata Technologies Holding PLC (a) | | 650,837 | 37,716,004 |
| TE Connectivity Ltd. | | 245,189 | 31,656,352 |
| | | | | $125,821,489 |
| Electronics – 3.4% | |
| Applied Materials, Inc. | | 812,505 | $ 108,550,668 |
| Lam Research Corp. | | 122,255 | 72,771,066 |
| NXP Semiconductors N.V. | | 421,459 | 84,856,555 |
| | | | | $266,178,289 |
| Energy - Independent – 1.9% | |
| ConocoPhillips | | 1,136,306 | $ 60,190,129 |
| Diamondback Energy, Inc. | | 271,104 | 19,923,433 |
| Pioneer Natural Resources Co. | | 271,516 | 43,122,171 |
| Valero Energy Corp. | | 349,735 | 25,041,026 |
| | | | | $148,276,759 |
Portfolio of Investments (unaudited) – continued
| Issuer | | | Shares/Par | Value ($) |
| Common Stocks – continued |
| Food & Beverages – 2.0% | |
| Hostess Brands, Inc. (a) | | 1,519,297 | $ 21,786,719 |
| Mondelez International, Inc. | | 1,029,009 | 60,227,897 |
| PepsiCo, Inc. | | 522,489 | ��� 73,906,069 |
| | | | | $155,920,685 |
| Food & Drug Stores – 1.3% | |
| Wal-Mart Stores, Inc. | | 726,452 | $ 98,673,975 |
| Gaming & Lodging – 0.6% | |
| Penn National Gaming, Inc. (a) | | 171,419 | $ 17,971,568 |
| Wyndham Hotels & Resorts, Inc. | | 411,462 | 28,711,818 |
| | | | | $46,683,386 |
| General Merchandise – 0.9% | |
| Dollar General Corp. | | 349,124 | $ 70,739,505 |
| Health Maintenance Organizations – 1.7% | |
| Cigna Corp. | | 335,577 | $ 81,122,384 |
| Humana, Inc. | | 131,169 | 54,992,603 |
| | | | | $136,114,987 |
| Insurance – 2.9% | |
| Aon PLC | | 481,768 | $ 110,859,635 |
| Chubb Ltd. | | 431,622 | 68,183,327 |
| Reinsurance Group of America, Inc. | | 323,867 | 40,823,435 |
| Willis Towers Watson PLC | | 32,836 | 7,515,504 |
| | | | | $227,381,901 |
| Internet – 7.0% | |
| Alphabet, Inc., “A” (a)(s) | | 161,253 | $ 332,587,538 |
| Facebook, Inc., “A” (a) | | 729,283 | 214,795,722 |
| | | | | $547,383,260 |
| Leisure & Toys – 1.1% | |
| Electronic Arts, Inc. | | 606,542 | $ 82,107,591 |
| Machinery & Tools – 2.0% | |
| Ingersoll Rand, Inc. (a) | | 1,207,858 | $ 59,438,692 |
| Roper Technologies, Inc. | | 150,547 | 60,721,627 |
| Trane Technologies PLC | | 193,303 | 32,003,245 |
| | | | | $152,163,564 |
Portfolio of Investments (unaudited) – continued
| Issuer | | | Shares/Par | Value ($) |
| Common Stocks – continued |
| Major Banks – 4.2% | |
| Bank of America Corp. | | 3,415,696 | $ 132,153,278 |
| Goldman Sachs Group, Inc. | | 340,235 | 111,256,845 |
| PNC Financial Services Group, Inc. | | 496,351 | 87,064,929 |
| | | | | $330,475,052 |
| Medical & Health Technology & Services – 1.9% | |
| ICON PLC (a) | | 263,249 | $ 51,694,206 |
| Laboratory Corp. of America Holdings (a) | | 196,776 | 50,183,783 |
| McKesson Corp. | | 224,842 | 43,853,184 |
| | | | | $145,731,173 |
| Medical Equipment – 4.7% | |
| Becton, Dickinson and Co. | | 258,086 | $ 62,753,611 |
| Boston Scientific Corp. (a) | | 1,774,587 | 68,587,787 |
| Danaher Corp. | | 469,301 | 105,630,269 |
| Medtronic PLC | | 754,597 | 89,140,544 |
| STERIS PLC | | 205,844 | 39,209,165 |
| | | | | $365,321,376 |
| Metals & Mining – 0.3% | |
| Howmet Aerospace, Inc. (a) | | 638,445 | $ 20,513,238 |
| Natural Gas - Pipeline – 0.5% | |
| Enterprise Products Partners LP | | 1,658,763 | $ 36,525,961 |
| Network & Telecom – 0.5% | |
| Equinix, Inc., REIT | | 62,965 | $ 42,790,384 |
| Other Banks & Diversified Financials – 4.0% | |
| Northern Trust Corp. | | 516,078 | $ 54,244,958 |
| Truist Financial Corp. | | 1,612,927 | 94,065,903 |
| Visa, Inc., “A” | | 781,253 | 165,414,698 |
| | | | | $313,725,559 |
| Pharmaceuticals – 3.8% | |
| Eli Lilly & Co. | | 393,560 | $ 73,524,879 |
| Johnson & Johnson | | 547,896 | 90,046,708 |
| Merck & Co., Inc. | | 1,092,369 | 84,210,726 |
| Zoetis, Inc. | | 311,709 | 49,087,933 |
| | | | | $296,870,246 |
| Railroad & Shipping – 1.8% | |
| Canadian Pacific Railway Ltd. | | 160,603 | $ 60,915,112 |
| Kansas City Southern Co. | | 291,210 | 76,856,143 |
| | | | | $137,771,255 |
Portfolio of Investments (unaudited) – continued
| Issuer | | | Shares/Par | Value ($) |
| Common Stocks – continued |
| Real Estate – 1.1% | |
| Extra Space Storage, Inc., REIT | | 289,548 | $ 38,379,587 |
| STORE Capital Corp., REIT | | 1,366,344 | 45,772,524 |
| | | | | $84,152,111 |
| Restaurants – 1.7% | |
| Starbucks Corp. | | 959,515 | $ 104,846,204 |
| Texas Roadhouse, Inc. (a) | | 279,415 | 26,807,075 |
| | | | | $131,653,279 |
| Specialty Chemicals – 1.9% | |
| Air Products & Chemicals, Inc. | | 165,844 | $ 46,658,551 |
| Axalta Coating Systems Ltd. (a) | | 1,402,646 | 41,490,268 |
| DuPont de Nemours, Inc. | | 725,117 | 56,037,042 |
| | | | | $144,185,861 |
| Specialty Stores – 6.6% | |
| Amazon.com, Inc. (a)(s) | | 119,423 | $ 369,504,316 |
| Home Depot, Inc. | | 280,299 | 85,561,270 |
| Ross Stores, Inc. | | 512,606 | 61,466,585 |
| | | | | $516,532,171 |
| Telecommunications - Wireless – 2.0% | |
| SBA Communications Corp., REIT | | 339,627 | $ 94,263,474 |
| T-Mobile USA, Inc. (a) | | 493,559 | 61,838,007 |
| | | | | $156,101,481 |
| Tobacco – 0.7% | |
| Philip Morris International, Inc. | | 653,039 | $ 57,950,681 |
| Utilities - Electric Power – 2.9% | |
| American Electric Power Co., Inc. | | 374,311 | $ 31,704,142 |
| Duke Energy Corp. | | 607,036 | 58,597,185 |
| NextEra Energy, Inc. | | 778,998 | 58,900,039 |
| PG&E Corp. (a) | | 2,593,441 | 30,369,194 |
| Southern Co. | | 760,443 | 47,269,137 |
| | | | | $226,839,697 |
| Total Common Stocks (Identified Cost, $4,579,061,749) | | $7,702,551,454 |
| Investment Companies (h) – 1.3% |
| Money Market Funds – 1.3% | |
| MFS Institutional Money Market Portfolio, 0.05% (v) (Identified Cost, $100,749,696) | | | 100,749,696 | $ 100,749,696 |
Portfolio of Investments (unaudited) – continued
| Issuer | | | Shares/Par | Value ($) |
| Securities Sold Short – (0.3)% |
| Telecommunications - Wireless – (0.3)% |
| Crown Castle International Corp., REIT (Proceeds Received, $9,666,704) | | | (116,649) | $ (20,078,792) |
| Other Assets, Less Liabilities – 0.1% | | 7,708,131 |
| Net Assets – 100.0% | $7,790,930,489 |
| (a) | Non-income producing security. | | | |
| (h) | An affiliated issuer, which may be considered one in which the fund owns 5% or more of the outstanding voting securities, or a company which is under common control. At period end, the aggregate values of the fund's investments in affiliated issuers and in unaffiliated issuers were $100,749,696 and $7,702,551,454, respectively. | | | |
| (s) | Security or a portion of the security was pledged to cover collateral requirements for securities sold short. | | | |
| (v) | Affiliated issuer that is available only to investment companies managed by MFS. The rate quoted for the MFS Institutional Money Market Portfolio is the annualized seven-day yield of the fund at period end. | | | |
| The following abbreviations are used in this report and are defined: |
| REIT | Real Estate Investment Trust |
At March 31, 2021, the fund had cash collateral of $594,285 and other liquid securities with an aggregate value of $52,643,926 to cover any collateral or margin obligations for securities sold short. Restricted cash and/or deposits with brokers in the Statement of Assets and Liabilities are comprised of cash collateral.
See Notes to Financial Statements
Financial Statements
Statement of Assets and Liabilities
At 3/31/21 (unaudited)
This statement represents your fund’s balance sheet, which details the assets and liabilities comprising the total value of the fund.
| Assets | |
| Investments in unaffiliated issuers, at value (identified cost, $4,579,061,749) | $7,702,551,454 |
| Investments in affiliated issuers, at value (identified cost, $100,749,696) | 100,749,696 |
| Cash | 15,638 |
| Deposits with brokers for | |
| Securities sold short | 594,285 |
| Receivables for | |
| Fund shares sold | 14,125,717 |
| Dividends | 6,384,751 |
| Other assets | 60,358 |
| Total assets | $7,824,481,899 |
| Liabilities | |
| Payables for | |
| Securities sold short, at value (proceeds received, $9,666,704) | $20,078,792 |
| Fund shares reacquired | 11,478,306 |
| Payable to affiliates | |
| Investment adviser | 178,725 |
| Administrative services fee | 3,089 |
| Shareholder servicing costs | 1,524,651 |
| Distribution and service fees | 23,761 |
| Payable for independent Trustees' compensation | 23,090 |
| Accrued expenses and other liabilities | 240,996 |
| Total liabilities | $33,551,410 |
| Net assets | $7,790,930,489 |
| Net assets consist of | |
| Paid-in capital | $4,519,420,797 |
| Total distributable earnings (loss) | 3,271,509,692 |
| Net assets | $7,790,930,489 |
| Shares of beneficial interest outstanding | 142,813,155 |
Statement of Assets and Liabilities (unaudited) – continued
| | Net assets | Shares
outstanding | Net asset value
per share (a) |
| Class A | $1,440,319,374 | 26,761,327 | $53.82 |
| Class B | 13,126,106 | 274,573 | 47.81 |
| Class C | 69,383,088 | 1,464,655 | 47.37 |
| Class I | 4,288,813,134 | 77,407,214 | 55.41 |
| Class R1 | 3,136,330 | 67,659 | 46.35 |
| Class R2 | 22,113,479 | 427,701 | 51.70 |
| Class R3 | 43,929,539 | 823,827 | 53.32 |
| Class R4 | 15,008,998 | 278,964 | 53.80 |
| Class R6 | 1,895,100,441 | 35,307,235 | 53.67 |
| (a) | Maximum offering price per share was equal to the net asset value per share for all share classes, except for Class A, for which the maximum offering price per share was $57.10 [100 / 94.25 x $53.82]. On sales of $50,000 or more, the maximum offering price of Class A shares is reduced. A contingent deferred sales charge may be imposed on redemptions of Class A, Class B, and Class C shares. Redemption price per share was equal to the net asset value per share for Classes I, R1, R2, R3, R4, and R6. |
See Notes to Financial Statements
Financial Statements
Statement of Operations
Six months ended 3/31/21 (unaudited)
This statement describes how much your fund earned in investment income and accrued in expenses. It also describes any gains and/or losses generated by fund operations.
| Net investment income (loss) | |
| Income | |
| Dividends | $43,917,086 |
| Income on securities loaned | 210,809 |
| Other | 197,229 |
| Dividends from affiliated issuers | 24,316 |
| Foreign taxes withheld | (114,899) |
| Total investment income | $44,234,541 |
| Expenses | |
| Management fee | $14,880,285 |
| Distribution and service fees | 2,250,482 |
| Shareholder servicing costs | 2,109,535 |
| Administrative services fee | 269,213 |
| Independent Trustees' compensation | 44,485 |
| Custodian fee | 113,766 |
| Shareholder communications | 80,086 |
| Audit and tax fees | 29,573 |
| Legal fees | 25,281 |
| Dividend and interest expense on securities sold short | 631,752 |
| Interest expense and fees | 16,938 |
| Miscellaneous | 157,756 |
| Total expenses | $20,609,152 |
| Fees paid indirectly | (24) |
| Reduction of expenses by distributor | (9,285) |
| Net expenses | $20,599,843 |
| Net investment income (loss) | $23,634,698 |
Statement of Operations (unaudited) – continued
| Realized and unrealized gain (loss) |
| Realized gain (loss) (identified cost basis) | |
| Unaffiliated issuers | $155,905,575 |
| Securities sold short | (796,289) |
| Foreign currency | 2,057 |
| Net realized gain (loss) | $155,111,343 |
| Change in unrealized appreciation or depreciation | |
| Unaffiliated issuers | $896,685,350 |
| Securities sold short | (4,967,050) |
| Translation of assets and liabilities in foreign currencies | 154 |
| Net unrealized gain (loss) | $891,718,454 |
| Net realized and unrealized gain (loss) | $1,046,829,797 |
| Change in net assets from operations | $1,070,464,495 |
See Notes to Financial Statements
Financial Statements
Statements of Changes in Net Assets
These statements describe the increases and/or decreases in net assets resulting from operations, any distributions, and any shareholder transactions.
| | Six months ended | Year ended |
| | 3/31/21
(unaudited) | 9/30/20 |
| Change in net assets | | |
| From operations | | |
| Net investment income (loss) | $23,634,698 | $55,505,186 |
| Net realized gain (loss) | 155,111,343 | 351,966,796 |
| Net unrealized gain (loss) | 891,718,454 | 398,521,518 |
| Change in net assets from operations | $1,070,464,495 | $805,993,500 |
| Total distributions to shareholders | $(353,381,538) | $(231,258,947) |
| Change in net assets from fund share transactions | $496,733,343 | $104,049,057 |
| Total change in net assets | $1,213,816,300 | $678,783,610 |
| Net assets | | |
| At beginning of period | 6,577,114,189 | 5,898,330,579 |
| At end of period | $7,790,930,489 | $6,577,114,189 |
See Notes to Financial Statements
Financial Statements
Financial Highlights
The financial highlights table is intended to help you understand the fund's financial performance for the semiannual period and the past 5 fiscal years. Certain information reflects financial results for a single fund share. The total returns in the table represent the rate that an investor would have earned (or lost) on an investment in the fund share class (assuming reinvestment of all distributions) held for the entire period.
| Class A | Six months
ended | Year ended |
| | 3/31/21
(unaudited) | 9/30/20 | 9/30/19 | 9/30/18 | 9/30/17 | 9/30/16 |
| Net asset value, beginning of period | $48.66 | $44.50 | $46.73 | $43.26 | $38.88 | $36.37 |
| Income (loss) from investment operations |
| Net investment income (loss) (d) | $0.12 | $0.33 | $0.37 | $0.35 | $0.33(c) | $0.46 |
| Net realized and unrealized gain (loss) | 7.65 | 5.52 | 1.90 | 6.83 | 6.15 | 4.56 |
| Total from investment operations | $7.77 | $5.85 | $2.27 | $7.18 | $6.48 | $5.02 |
| Less distributions declared to shareholders |
| From net investment income | $(0.28) | $(0.35) | $(0.28) | $(0.46) | $(0.38) | $(0.29) |
| From net realized gain | (2.33) | (1.34) | (4.22) | (3.25) | (1.72) | (2.22) |
| Total distributions declared to shareholders | $(2.61) | $(1.69) | $(4.50) | $(3.71) | $(2.10) | $(2.51) |
| Net asset value, end of period (x) | $53.82 | $48.66 | $44.50 | $46.73 | $43.26 | $38.88 |
| Total return (%) (r)(s)(t)(x) | 16.38(n) | 13.46 | 6.46 | 17.51 | 17.46(c) | 14.39 |
Ratios (%) (to average net assets)
and Supplemental data: |
| Expenses before expense reductions (f) | 0.78(a) | 0.79 | 0.80 | 0.82 | 0.82(c) | 0.83 |
| Expenses after expense reductions (f) | 0.78(a) | 0.78 | 0.79 | 0.81 | 0.82(c) | 0.82 |
| Net investment income (loss) | 0.46(a) | 0.72 | 0.89 | 0.81 | 0.82(c) | 1.25 |
| Portfolio turnover | 17(n) | 36 | 32 | 33 | 38 | 47 |
| Net assets at end of period (000 omitted) | $1,440,319 | $1,290,401 | $1,452,740 | $1,456,897 | $2,643,928 | $2,331,409 |
| Supplemental Ratios (%): |
| Ratios of expenses to average net assets after expense reductions excluding short sale expenses and interest expense and fees (f) | 0.77(a) | 0.77 | 0.77 | 0.80 | 0.81(c) | 0.82 |
See Notes to Financial Statements
Financial Highlights – continued
| Class B | Six months
ended | Year ended |
| | 3/31/21
(unaudited) | 9/30/20 | 9/30/19 | 9/30/18 | 9/30/17 | 9/30/16 |
| Net asset value, beginning of period | $43.39 | $39.84 | $42.40 | $39.55 | $35.70 | $33.56 |
| Income (loss) from investment operations |
| Net investment income (loss) (d) | $(0.07) | $(0.01) | $0.05 | $0.03 | $0.03(c) | $0.16 |
| Net realized and unrealized gain (loss) | 6.82 | 4.93 | 1.66 | 6.21 | 5.64 | 4.21 |
| Total from investment operations | $6.75 | $4.92 | $1.71 | $6.24 | $5.67 | $4.37 |
| Less distributions declared to shareholders |
| From net investment income | $— | $(0.03) | $(0.05) | $(0.14) | $(0.10) | $(0.01) |
| From net realized gain | (2.33) | (1.34) | (4.22) | (3.25) | (1.72) | (2.22) |
| Total distributions declared to shareholders | $(2.33) | $(1.37) | $(4.27) | $(3.39) | $(1.82) | $(2.23) |
| Net asset value, end of period (x) | $47.81 | $43.39 | $39.84 | $42.40 | $39.55 | $35.70 |
| Total return (%) (r)(s)(t)(x) | 15.96(n) | 12.61 | 5.63 | 16.65 | 16.59(c) | 13.54 |
Ratios (%) (to average net assets)
and Supplemental data: |
| Expenses before expense reductions (f) | 1.53(a) | 1.54 | 1.55 | 1.57 | 1.57(c) | 1.58 |
| Expenses after expense reductions (f) | 1.53(a) | 1.54 | 1.54 | 1.56 | 1.57(c) | 1.57 |
| Net investment income (loss) | (0.30)(a) | (0.03) | 0.14 | 0.06 | 0.07(c) | 0.47 |
| Portfolio turnover | 17(n) | 36 | 32 | 33 | 38 | 47 |
| Net assets at end of period (000 omitted) | $13,126 | $13,373 | $17,765 | $21,445 | $22,131 | $24,104 |
| Supplemental Ratios (%): |
| Ratios of expenses to average net assets after expense reductions excluding short sale expenses and interest expense and fees (f) | 1.52(a) | 1.52 | 1.52 | 1.55 | 1.56(c) | 1.57 |
See Notes to Financial Statements
Financial Highlights – continued
| Class C | Six months
ended | Year ended |
| | 3/31/21
(unaudited) | 9/30/20 | 9/30/19 | 9/30/18 | 9/30/17 | 9/30/16 |
| Net asset value, beginning of period | $43.02 | $39.53 | $42.05 | $39.27 | $35.48 | $33.39 |
| Income (loss) from investment operations |
| Net investment income (loss) (d) | $(0.07) | $(0.01) | $0.05 | $0.01 | $0.03(c) | $0.16 |
| Net realized and unrealized gain (loss) | 6.75 | 4.90 | 1.65 | 6.17 | 5.60 | 4.17 |
| Total from investment operations | $6.68 | $4.89 | $1.70 | $6.18 | $5.63 | $4.33 |
| Less distributions declared to shareholders |
| From net investment income | $— | $(0.06) | $— | $(0.15) | $(0.12) | $(0.02) |
| From net realized gain | (2.33) | (1.34) | (4.22) | (3.25) | (1.72) | (2.22) |
| Total distributions declared to shareholders | $(2.33) | $(1.40) | $(4.22) | $(3.40) | $(1.84) | $(2.24) |
| Net asset value, end of period (x) | $47.37 | $43.02 | $39.53 | $42.05 | $39.27 | $35.48 |
| Total return (%) (r)(s)(t)(x) | 15.94(n) | 12.62 | 5.64 | 16.62 | 16.61(c) | 13.51 |
Ratios (%) (to average net assets)
and Supplemental data: |
| Expenses before expense reductions (f) | 1.53(a) | 1.55 | 1.55 | 1.57 | 1.57(c) | 1.58 |
| Expenses after expense reductions (f) | 1.53(a) | 1.54 | 1.55 | 1.56 | 1.57(c) | 1.58 |
| Net investment income (loss) | (0.30)(a) | (0.03) | 0.13 | 0.03 | 0.07(c) | 0.49 |
| Portfolio turnover | 17(n) | 36 | 32 | 33 | 38 | 47 |
| Net assets at end of period (000 omitted) | $69,383 | $70,785 | $71,371 | $78,122 | $133,255 | $134,406 |
| Supplemental Ratios (%): |
| Ratios of expenses to average net assets after expense reductions excluding short sale expenses and interest expense and fees (f) | 1.52(a) | 1.53 | 1.53 | 1.55 | 1.56(c) | 1.57 |
See Notes to Financial Statements
Financial Highlights – continued
| Class I | Six months
ended | Year ended |
| | 3/31/21
(unaudited) | 9/30/20 | 9/30/19 | 9/30/18 | 9/30/17 | 9/30/16 |
| Net asset value, beginning of period | $50.09 | $45.74 | $48.03 | $44.35 | $39.81 | $37.18 |
| Income (loss) from investment operations |
| Net investment income (loss) (d) | $0.19 | $0.45 | $0.49 | $0.50 | $0.44(c) | $0.57 |
| Net realized and unrealized gain (loss) | 7.87 | 5.70 | 1.93 | 6.99 | 6.29 | 4.66 |
| Total from investment operations | $8.06 | $6.15 | $2.42 | $7.49 | $6.73 | $5.23 |
| Less distributions declared to shareholders |
| From net investment income | $(0.41) | $(0.46) | $(0.49) | $(0.56) | $(0.47) | $(0.38) |
| From net realized gain | (2.33) | (1.34) | (4.22) | (3.25) | (1.72) | (2.22) |
| Total distributions declared to shareholders | $(2.74) | $(1.80) | $(4.71) | $(3.81) | $(2.19) | $(2.60) |
| Net asset value, end of period (x) | $55.41 | $50.09 | $45.74 | $48.03 | $44.35 | $39.81 |
| Total return (%) (r)(s)(t)(x) | 16.52(n) | 13.76 | 6.68 | 17.83 | 17.74(c) | 14.68 |
Ratios (%) (to average net assets)
and Supplemental data: |
| Expenses before expense reductions (f) | 0.54(a) | 0.55 | 0.55 | 0.57 | 0.57(c) | 0.58 |
| Expenses after expense reductions (f) | N/A | N/A | N/A | N/A | 0.57(c) | 0.58 |
| Net investment income (loss) | 0.72(a) | 0.97 | 1.13 | 1.09 | 1.07(c) | 1.52 |
| Portfolio turnover | 17(n) | 36 | 32 | 33 | 38 | 47 |
| Net assets at end of period (000 omitted) | $4,288,813 | $3,492,027 | $2,835,696 | $2,752,743 | $1,065,739 | $927,500 |
| Supplemental Ratios (%): |
| Ratios of expenses to average net assets after expense reductions excluding short sale expenses and interest expense and fees (f) | 0.52(a) | 0.53 | 0.53 | 0.56 | 0.56(c) | 0.57 |
See Notes to Financial Statements
Financial Highlights – continued
| Class R1 | Six months
ended | Year ended |
| | 3/31/21
(unaudited) | 9/30/20 | 9/30/19 | 9/30/18 | 9/30/17 | 9/30/16 |
| Net asset value, beginning of period | $42.14 | $38.72 | $41.37 | $38.69 | $34.99 | $32.95 |
| Income (loss) from investment operations |
| Net investment income (loss) (d) | $(0.07) | $(0.02) | $0.04 | $0.03 | $0.02(c) | $0.17 |
| Net realized and unrealized gain (loss) | 6.61 | 4.81 | 1.60 | 6.06 | 5.52 | 4.11 |
| Total from investment operations | $6.54 | $4.79 | $1.64 | $6.09 | $5.54 | $4.28 |
| Less distributions declared to shareholders |
| From net investment income | $— | $(0.03) | $(0.07) | $(0.16) | $(0.12) | $(0.02) |
| From net realized gain | (2.33) | (1.34) | (4.22) | (3.25) | (1.72) | (2.22) |
| Total distributions declared to shareholders | $(2.33) | $(1.37) | $(4.29) | $(3.41) | $(1.84) | $(2.24) |
| Net asset value, end of period (x) | $46.35 | $42.14 | $38.72 | $41.37 | $38.69 | $34.99 |
| Total return (%) (r)(s)(t)(x) | 15.94(n) | 12.62 | 5.62 | 16.64 | 16.59(c) | 13.53 |
Ratios (%) (to average net assets)
and Supplemental data: |
| Expenses before expense reductions (f) | 1.53(a) | 1.54 | 1.55 | 1.57 | 1.57(c) | 1.58 |
| Expenses after expense reductions (f) | 1.53(a) | N/A | N/A | N/A | 1.57(c) | 1.58 |
| Net investment income (loss) | (0.30)(a) | (0.04) | 0.12 | 0.07 | 0.07(c) | 0.50 |
| Portfolio turnover | 17(n) | 36 | 32 | 33 | 38 | 47 |
| Net assets at end of period (000 omitted) | $3,136 | $3,596 | $4,187 | $4,947 | $4,189 | $4,500 |
| Supplemental Ratios (%): |
| Ratios of expenses to average net assets after expense reductions excluding short sale expenses and interest expense and fees (f) | 1.52(a) | 1.53 | 1.53 | 1.56 | 1.56(c) | 1.57 |
See Notes to Financial Statements
Financial Highlights – continued
| Class R2 | Six months
ended | Year ended |
| | 3/31/21
(unaudited) | 9/30/20 | 9/30/19 | 9/30/18 | 9/30/17 | 9/30/16 |
| Net asset value, beginning of period | $46.78 | $42.85 | $45.23 | $41.97 | $37.77 | $35.37 |
| Income (loss) from investment operations |
| Net investment income (loss) (d) | $0.05 | $0.20 | $0.25 | $0.24 | $0.22(c) | $0.35 |
| Net realized and unrealized gain (loss) | 7.34 | 5.33 | 1.82 | 6.60 | 5.98 | 4.44 |
| Total from investment operations | $7.39 | $5.53 | $2.07 | $6.84 | $6.20 | $4.79 |
| Less distributions declared to shareholders |
| From net investment income | $(0.14) | $(0.26) | $(0.23) | $(0.33) | $(0.28) | $(0.17) |
| From net realized gain | (2.33) | (1.34) | (4.22) | (3.25) | (1.72) | (2.22) |
| Total distributions declared to shareholders | $(2.47) | $(1.60) | $(4.45) | $(3.58) | $(2.00) | $(2.39) |
| Net asset value, end of period (x) | $51.70 | $46.78 | $42.85 | $45.23 | $41.97 | $37.77 |
| Total return (%) (r)(s)(t)(x) | 16.22(n) | 13.19 | 6.18 | 17.21 | 17.19(c) | 14.10 |
Ratios (%) (to average net assets)
and Supplemental data: |
| Expenses before expense reductions (f) | 1.03(a) | 1.04 | 1.05 | 1.07 | 1.07(c) | 1.08 |
| Expenses after expense reductions (f) | N/A | N/A | N/A | N/A | 1.07(c) | 1.08 |
| Net investment income (loss) | 0.20(a) | 0.47 | 0.63 | 0.56 | 0.57(c) | 0.97 |
| Portfolio turnover | 17(n) | 36 | 32 | 33 | 38 | 47 |
| Net assets at end of period (000 omitted) | $22,113 | $19,726 | $21,738 | $21,137 | $26,054 | $27,545 |
| Supplemental Ratios (%): |
| Ratios of expenses to average net assets after expense reductions excluding short sale expenses and interest expense and fees (f) | 1.02(a) | 1.03 | 1.03 | 1.06 | 1.06(c) | 1.07 |
See Notes to Financial Statements
Financial Highlights – continued
| Class R3 | Six months
ended | Year ended |
| | 3/31/21
(unaudited) | 9/30/20 | 9/30/19 | 9/30/18 | 9/30/17 | 9/30/16 |
| Net asset value, beginning of period | $48.23 | $44.12 | $46.46 | $43.02 | $38.67 | $36.17 |
| Income (loss) from investment operations |
| Net investment income (loss) (d) | $0.12 | $0.32 | $0.37 | $0.36 | $0.33(c) | $0.46 |
| Net realized and unrealized gain (loss) | 7.57 | 5.48 | 1.86 | 6.77 | 6.11 | 4.53 |
| Total from investment operations | $7.69 | $5.80 | $2.23 | $7.13 | $6.44 | $4.99 |
| Less distributions declared to shareholders |
| From net investment income | $(0.27) | $(0.35) | $(0.35) | $(0.44) | $(0.37) | $(0.27) |
| From net realized gain | (2.33) | (1.34) | (4.22) | (3.25) | (1.72) | (2.22) |
| Total distributions declared to shareholders | $(2.60) | $(1.69) | $(4.57) | $(3.69) | $(2.09) | $(2.49) |
| Net asset value, end of period (x) | $53.32 | $48.23 | $44.12 | $46.46 | $43.02 | $38.67 |
| Total return (%) (r)(s)(t)(x) | 16.37(n) | 13.46 | 6.44 | 17.50 | 17.46(c) | 14.39 |
Ratios (%) (to average net assets)
and Supplemental data: |
| Expenses before expense reductions (f) | 0.78(a) | 0.79 | 0.80 | 0.82 | 0.82(c) | 0.83 |
| Expenses after expense reductions (f) | N/A | N/A | N/A | N/A | 0.82(c) | 0.83 |
| Net investment income (loss) | 0.46(a) | 0.72 | 0.88 | 0.81 | 0.83(c) | 1.24 |
| Portfolio turnover | 17(n) | 36 | 32 | 33 | 38 | 47 |
| Net assets at end of period (000 omitted) | $43,930 | $40,434 | $44,941 | $45,930 | $45,780 | $56,488 |
| Supplemental Ratios (%): |
| Ratios of expenses to average net assets after expense reductions excluding short sale expenses and interest expense and fees (f) | 0.77(a) | 0.78 | 0.78 | 0.81 | 0.81(c) | 0.82 |
See Notes to Financial Statements
Financial Highlights – continued
| Class R4 | Six months
ended | Year ended |
| | 3/31/21
(unaudited) | 9/30/20 | 9/30/19 | 9/30/18 | 9/30/17 | 9/30/16 |
| Net asset value, beginning of period | $48.71 | $44.53 | $46.88 | $43.31 | $38.91 | $36.40 |
| Income (loss) from investment operations |
| Net investment income (loss) (d) | $0.18 | $0.43 | $0.47 | $0.43 | $0.43(c) | $0.56 |
| Net realized and unrealized gain (loss) | 7.64 | 5.55 | 1.88 | 6.88 | 6.16 | 4.55 |
| Total from investment operations | $7.82 | $5.98 | $2.35 | $7.31 | $6.59 | $5.11 |
| Less distributions declared to shareholders |
| From net investment income | $(0.40) | $(0.46) | $(0.48) | $(0.49) | $(0.47) | $(0.38) |
| From net realized gain | (2.33) | (1.34) | (4.22) | (3.25) | (1.72) | (2.22) |
| Total distributions declared to shareholders | $(2.73) | $(1.80) | $(4.70) | $(3.74) | $(2.19) | $(2.60) |
| Net asset value, end of period (x) | $53.80 | $48.71 | $44.53 | $46.88 | $43.31 | $38.91 |
| Total return (%) (r)(s)(t)(x) | 16.51(n) | 13.76 | 6.69 | 17.84 | 17.77(c) | 14.66 |
Ratios (%) (to average net assets)
and Supplemental data: |
| Expenses before expense reductions (f) | 0.54(a) | 0.54 | 0.55 | 0.57 | 0.57(c) | 0.58 |
| Expenses after expense reductions (f) | N/A | N/A | N/A | N/A | 0.57(c) | 0.58 |
| Net investment income (loss) | 0.71(a) | 0.97 | 1.13 | 0.97 | 1.08(c) | 1.52 |
| Portfolio turnover | 17(n) | 36 | 32 | 33 | 38 | 47 |
| Net assets at end of period (000 omitted) | $15,009 | $14,246 | $16,869 | $17,148 | $49,141 | $57,922 |
| Supplemental Ratios (%): |
| Ratios of expenses to average net assets after expense reductions excluding short sale expenses and interest expense and fees (f) | 0.52(a) | 0.53 | 0.53 | 0.56 | 0.56(c) | 0.57 |
See Notes to Financial Statements
Financial Highlights – continued
| Class R6 | Six months
ended | Year ended |
| | 3/31/21
(unaudited) | 9/30/20 | 9/30/19 | 9/30/18 | 9/30/17 | 9/30/16 |
| Net asset value, beginning of period | $48.62 | $44.44 | $46.82 | $43.33 | $38.94 | $36.42 |
| Income (loss) from investment operations |
| Net investment income (loss) (d) | $0.20 | $0.47 | $0.50 | $0.51 | $0.46(c) | $0.58 |
| Net realized and unrealized gain (loss) | 7.62 | 5.53 | 1.86 | 6.83 | 6.16 | 4.58 |
| Total from investment operations | $7.82 | $6.00 | $2.36 | $7.34 | $6.62 | $5.16 |
| Less distributions declared to shareholders |
| From net investment income | $(0.44) | $(0.48) | $(0.52) | $(0.60) | $(0.51) | $(0.42) |
| From net realized gain | (2.33) | (1.34) | (4.22) | (3.25) | (1.72) | (2.22) |
| Total distributions declared to shareholders | $(2.77) | $(1.82) | $(4.74) | $(3.85) | $(2.23) | $(2.64) |
| Net asset value, end of period (x) | $53.67 | $48.62 | $44.44 | $46.82 | $43.33 | $38.94 |
| Total return (%) (r)(s)(t)(x) | 16.54(n) | 13.85 | 6.75 | 17.92 | 17.86(c) | 14.80 |
Ratios (%) (to average net assets)
and Supplemental data: |
| Expenses before expense reductions (f) | 0.47(a) | 0.48 | 0.48 | 0.48 | 0.49(c) | 0.48 |
| Expenses after expense reductions (f) | N/A | N/A | N/A | N/A | 0.49(c) | 0.48 |
| Net investment income (loss) | 0.78(a) | 1.04 | 1.19 | 1.15 | 1.16(c) | 1.57 |
| Portfolio turnover | 17(n) | 36 | 32 | 33 | 38 | 47 |
| Net assets at end of period (000 omitted) | $1,895,100 | $1,632,527 | $1,433,024 | $1,441,866 | $1,393,491 | $1,374,807 |
| Supplemental Ratios (%): |
| Ratios of expenses to average net assets after expense reductions excluding short sale expenses and interest expense and fees (f) | 0.45(a) | 0.46 | 0.46 | 0.47 | 0.47(c) | 0.48 |
| (a) | Annualized. |
| (c) | Amount reflects a one-time reimbursement of expenses by the custodian (or former custodian) without which net investment income and performance would be lower and expenses would be higher. |
| (d) | Per share data is based on average shares outstanding. |
| (f) | Ratios do not reflect reductions from fees paid indirectly, if applicable. |
| (n) | Not annualized. |
| (r) | Certain expenses have been reduced without which performance would have been lower. |
| (s) | From time to time the fund may receive proceeds from litigation settlements, without which performance would be lower. |
| (t) | Total returns do not include any applicable sales charges. |
| (x) | The net asset values and total returns have been calculated on net assets which include adjustments made in accordance with U.S. generally accepted accounting principles required at period end for financial reporting purposes. |
See Notes to Financial Statements
Notes to Financial Statements
(unaudited)
(1) Business and Organization
MFS Research Fund (the fund) is a diversified series of MFS Series Trust V (the trust). The trust is organized as a Massachusetts business trust and is registered under the Investment Company Act of 1940, as amended, as an open-end management investment company.
The fund is an investment company and accordingly follows the investment company accounting and reporting guidance of the Financial Accounting Standards Board (FASB) Accounting Standards Codification Topic 946 Financial Services - Investment Companies.
(2) Significant Accounting Policies
General — The preparation of financial statements in conformity with U.S. generally accepted accounting principles requires management to make estimates and assumptions that affect the reported amounts of assets and liabilities, and disclosure of contingent assets and liabilities at the date of the financial statements and the reported amounts of increases and decreases in net assets from operations during the reporting period. Actual results could differ from those estimates. In the preparation of these financial statements, management has evaluated subsequent events occurring after the date of the fund’s Statement of Assets and Liabilities through the date that the financial statements were issued.
In March 2020, the FASB issued Accounting Standards Update 2020-04, Reference Rate Reform (Topic 848) – Facilitation of the Effects of Reference Rate Reform on Financial Reporting (“ASU 2020-04”), which provides optional, temporary relief with respect to the financial reporting of contracts subject to certain types of modifications due to the planned discontinuation of certain tenors of the London Interbank Offered Rate (LIBOR) and other IBOR-based reference rates as of the end of 2021. The temporary relief provided by ASU 2020-04 is effective for certain reference rate-related contract modifications that occur during the period from March 12, 2020 through December 31, 2022. Management is evaluating the impact of ASU 2020-04 on the fund's investments, derivatives, debt and other contracts that will undergo reference rate-related modifications as a result of the reference rate reform.
Balance Sheet Offsetting — The fund's accounting policy with respect to balance sheet offsetting is that, absent an event of default by the counterparty or a termination of the agreement, the International Swaps and Derivatives Association (ISDA) Master Agreement, or similar agreement, does not result in an offset of reported amounts of financial assets and financial liabilities in the Statement of Assets and Liabilities across transactions between the fund and the applicable counterparty. The fund's right to setoff may be restricted or prohibited by the bankruptcy or insolvency laws of the particular jurisdiction to which a specific master netting agreement counterparty is subject. Balance sheet offsetting disclosures, to the extent applicable to the fund, have been included in the fund’s Significant Accounting Policies note under the captions for each of the fund’s in-scope financial instruments and transactions.
Investment Valuations — Equity securities, including restricted equity securities and equity securities sold short, are generally valued at the last sale or official closing price on their primary market or exchange as provided by a third-party pricing service. Equity securities, for which there were no sales reported that day, are generally valued at the
Notes to Financial Statements (unaudited) - continued
last quoted daily bid quotation on their primary market or exchange as provided by a third-party pricing service. Equity securities sold short, for which there were no sales reported that day, are generally valued at the last quoted daily ask quotation on their primary market or exchange as provided by a third-party pricing service. Short-term instruments with a maturity at issuance of 60 days or less may be valued at amortized cost, which approximates market value. Open-end investment companies are generally valued at net asset value per share. Securities and other assets generally valued on the basis of information from a third-party pricing service may also be valued at a broker/dealer bid quotation. In determining values, third-party pricing services can utilize both transaction data and market information such as yield, quality, coupon rate, maturity, type of issue, trading characteristics, and other market data. The values of foreign securities and other assets and liabilities expressed in foreign currencies are converted to U.S. dollars using the mean of bid and asked prices for rates provided by a third-party pricing service.
The Board of Trustees has delegated primary responsibility for determining or causing to be determined the value of the fund’s investments (including any fair valuation) to the adviser pursuant to valuation policies and procedures approved by the Board. If the adviser determines that reliable market quotations are not readily available, investments are valued at fair value as determined in good faith by the adviser in accordance with such procedures under the oversight of the Board of Trustees. Under the fund’s valuation policies and procedures, market quotations are not considered to be readily available for most types of debt instruments and floating rate loans and many types of derivatives. These investments are generally valued at fair value based on information from third-party pricing services. In addition, investments may be valued at fair value if the adviser determines that an investment’s value has been materially affected by events occurring after the close of the exchange or market on which the investment is principally traded (such as foreign exchange or market) and prior to the determination of the fund’s net asset value, or after the halt of trading of a specific security where trading does not resume prior to the close of the exchange or market on which the security is principally traded. Events that occur after foreign markets close (such as developments in foreign markets and significant movements in the U.S. markets) and prior to the determination of the fund’s net asset value may be deemed to have a material effect on the value of securities traded in foreign markets. Accordingly, the fund’s foreign equity securities may often be valued at fair value. The adviser generally relies on third-party pricing services or other information (such as the correlation with price movements of similar securities in the same or other markets; the type, cost and investment characteristics of the security; the business and financial condition of the issuer; and trading and other market data) to assist in determining whether to fair value and at what value to fair value an investment. The value of an investment for purposes of calculating the fund’s net asset value can differ depending on the source and method used to determine value. When fair valuation is used, the value of an investment used to determine the fund’s net asset value may differ from quoted or published prices for the same investment. There can be no assurance that the fund could obtain the fair value assigned to an investment if it were to sell the investment at the same time at which the fund determines its net asset value per share.
Various inputs are used in determining the value of the fund's assets or liabilities. These inputs are categorized into three broad levels. In certain cases, the inputs used to measure fair value may fall into different levels of the fair value hierarchy. In such cases, an investment's level within the fair value hierarchy is based on the lowest level of
Notes to Financial Statements (unaudited) - continued
input that is significant to the fair value measurement. The fund's assessment of the significance of a particular input to the fair value measurement in its entirety requires judgment, and considers factors specific to the investment. Level 1 includes unadjusted quoted prices in active markets for identical assets or liabilities. Level 2 includes other significant observable market-based inputs (including quoted prices for similar securities, interest rates, prepayment speed, and credit risk). Level 3 includes unobservable inputs, which may include the adviser's own assumptions in determining the fair value of investments. The following is a summary of the levels used as of March 31, 2021 in valuing the fund's assets or liabilities:
| Financial Instruments | Level 1 | Level 2 | Level 3 | Total |
| Equity Securities | $7,702,551,454 | $— | $— | $7,702,551,454 |
| Mutual Funds | 100,749,696 | — | — | 100,749,696 |
| Total | $7,803,301,150 | $— | $— | $7,803,301,150 |
| Securities Sold Short | $(20,078,792) | $— | $— | $(20,078,792) |
For further information regarding security characteristics, see the Portfolio of Investments.
Foreign Currency Translation — Purchases and sales of foreign investments, income, and expenses are converted into U.S. dollars based upon currency exchange rates prevailing on the respective dates of such transactions or on the reporting date for foreign denominated receivables and payables. Gains and losses attributable to foreign currency exchange rates on sales of securities are recorded for financial statement purposes as net realized gains and losses on investments. Gains and losses attributable to foreign exchange rate movements on receivables, payables, income and expenses are recorded for financial statement purposes as foreign currency transaction gains and losses. That portion of both realized and unrealized gains and losses on investments that results from fluctuations in foreign currency exchange rates is not separately disclosed.
Short Sales — The fund entered into short sales whereby it sells a security it does not own in anticipation of a decline in the value of that security. The fund will realize a gain if the security price decreases and a loss if the security price increases between the date of the short sale and the date on which the fund replaces the borrowed security. Losses from short sales can exceed the proceeds of the security sold; and they can also exceed the potential loss from an ordinary buy and sell transaction. The amount of any premium, dividends, or interest the fund may be required to pay in connection with a short sale will be recognized as a fund expense. During the six months ended March 31, 2021, this expense amounted to $631,752. The fund segregates cash or marketable securities in an amount that, when combined with the amount of proceeds from the short sale deposited with the broker, at least equals the current market value of the security sold short.
Security Loans — Under its Securities Lending Agency Agreement with the fund, JPMorgan Chase and Co., as lending agent, loans the securities of the fund to certain qualified institutions (the “Borrowers”) approved by the fund. Security loans can be terminated at the discretion of either the lending agent or the fund and the related securities must be returned within the earlier of the standard trade settlement period for such securities or within three business days. The loans are collateralized by cash and/or U.S. Treasury and federal agency obligations in an amount typically at least equal to the market value of the securities loaned. On loans collateralized by cash, the
Notes to Financial Statements (unaudited) - continued
cash collateral is invested in a money market fund. The market value of the loaned securities is determined at the close of business of the fund and any additional required collateral is delivered to the fund on the next business day. The lending agent provides the fund with indemnification against Borrower default. In the event of Borrower default, the lending agent will, for the benefit of the fund, either purchase securities identical to those loaned or, when such purchase is commercially impracticable, pay the fund the market value of the loaned securities. In return, the lending agent assumes the fund's rights to the related collateral. If the collateral value is less than the cost to purchase identical securities, the lending agent is responsible for the shortfall, but only to the extent that such shortfall is not due to a decline in collateral value resulting from collateral reinvestment for which the fund bears the risk of loss. A portion of the income generated upon investment of the collateral is remitted to the Borrowers, and the remainder is allocated between the fund and the lending agent. On loans collateralized by U.S. Treasury and/or federal agency obligations, a fee is received from the Borrower, and is allocated between the fund and the lending agent. Income from securities lending is separately reported in the Statement of Operations. The dividend and interest income earned on the securities loaned is accounted for in the same manner as other dividend and interest income. At March 31, 2021, there were no securities on loan or collateral outstanding.
Indemnifications — Under the fund's organizational documents, its officers and Trustees may be indemnified against certain liabilities and expenses arising out of the performance of their duties to the fund. Additionally, in the normal course of business, the fund enters into agreements with service providers that may contain indemnification clauses. The fund's maximum exposure under these agreements is unknown as this would involve future claims that may be made against the fund that have not yet occurred.
Investment Transactions and Income — Investment transactions are recorded on the trade date. Dividends received in cash are recorded on the ex-dividend date. Certain dividends from foreign securities will be recorded when the fund is informed of the dividend if such information is obtained subsequent to the ex-dividend date. Dividend payments received in additional securities are recorded on the ex-dividend date in an amount equal to the value of the security on such date.
The fund may receive proceeds from litigation settlements. Any proceeds received from litigation involving portfolio holdings are reflected in the Statement of Operations in realized gain/loss if the security has been disposed of by the fund or in unrealized gain/loss if the security is still held by the fund. Any other proceeds from litigation not related to portfolio holdings are reflected as other income in the Statement of Operations.
Fees Paid Indirectly — The fund's custody fee may be reduced by a credit earned under an arrangement that measures the value of U.S. dollars deposited with the custodian by the fund. The amount of the credit, for the six months ended March 31, 2021, is shown as a reduction of total expenses in the Statement of Operations.
Tax Matters and Distributions — The fund intends to qualify as a regulated investment company, as defined under Subchapter M of the Internal Revenue Code, and to distribute all of its taxable income, including realized capital gains. As a result, no provision for federal income tax is required. The fund’s federal tax returns, when filed, will remain subject to examination by the Internal Revenue Service for a three year period. Management has analyzed the fund’s tax positions taken on federal and
Notes to Financial Statements (unaudited) - continued
state tax returns for all open tax years and does not believe that there are any uncertain tax positions that require recognition of a tax liability. Foreign taxes, if any, have been accrued by the fund in the accompanying financial statements in accordance with the applicable foreign tax law. Foreign income taxes may be withheld by certain countries in which the fund invests. Additionally, capital gains realized by the fund on securities issued in or by certain foreign countries may be subject to capital gains tax imposed by those countries.
Distributions to shareholders are recorded on the ex-dividend date. Income and capital gain distributions are determined in accordance with income tax regulations, which may differ from U.S. generally accepted accounting principles. Certain capital accounts in the financial statements are periodically adjusted for permanent differences in order to reflect their tax character. These adjustments have no impact on net assets or net asset value per share. Temporary differences which arise from recognizing certain items of income, expense, gain or loss in different periods for financial statement and tax purposes will reverse at some time in the future.
Book/tax differences primarily relate to wash sale loss deferrals, treating a portion of the proceeds from redemptions as a distribution for tax purposes and partnership adjustments.
The tax character of distributions made during the current period will be determined at fiscal year end. The tax character of distributions declared to shareholders for the last fiscal year is as follows:
| | Year ended
9/30/20 |
| Ordinary income (including any short-term capital gains) | $71,259,895 |
| Long-term capital gains | 159,999,052 |
| Total distributions | $231,258,947 |
The federal tax cost and the tax basis components of distributable earnings were as follows:
| As of 3/31/21 | |
| Cost of investments | $4,686,379,440 |
| Gross appreciation | 3,140,853,042 |
| Gross depreciation | (23,931,332) |
| Net unrealized appreciation (depreciation) | $3,116,921,710 |
| As of 9/30/20 | |
| Undistributed ordinary income | 40,190,903 |
| Undistributed long-term capital gain | 293,885,359 |
| Other temporary differences | 12,844,408 |
| Net unrealized appreciation (depreciation) | 2,207,506,065 |
The aggregate cost above includes prior fiscal year end tax adjustments, if applicable.
Multiple Classes of Shares of Beneficial Interest — The fund offers multiple classes of shares, which differ in their respective distribution and service fees. The fund's income, realized and unrealized gain (loss), and common expenses are allocated to shareholders based on the daily net assets of each class. Dividends are declared separately for each class. Differences in per share dividend rates are generally due to
Notes to Financial Statements (unaudited) - continued
differences in separate class expenses. Class B shares will convert to Class A shares approximately eight years after purchase. In addition, Class C shares will convert to Class A shares approximately eight years after purchase. The fund’s distributions declared to shareholders as reported in the Statements of Changes in Net Assets are presented by class as follows:
| | Six months
ended
3/31/21 | | Year
ended
9/30/20 |
| Class A | $67,772,858 | | $54,649,668 |
| Class B | 678,032 | | 588,792 |
| Class C | 3,758,024 | | 2,470,790 |
| Class I | 184,417,277 | | 111,319,986 |
| Class R1 | 154,178 | | 140,647 |
| Class R2 | 965,562 | | 824,722 |
| Class R3 | 2,113,247 | | 1,734,371 |
| Class R4 | 792,558 | | 684,330 |
| Class R6 | 92,729,802 | | 58,845,641 |
| Total | $353,381,538 | | $231,258,947 |
(3) Transactions with Affiliates
Investment Adviser — The fund has an investment advisory agreement with MFS to provide overall investment management and related administrative services and facilities to the fund. The management fee is computed daily and paid monthly at the following annual rates based on the fund's average daily net assets:
| Up to $5 billion | 0.43% |
| In excess of $5 billion and up to $10 billion | 0.40% |
| In excess of $10 billion | 0.37% |
The management fee incurred for the six months ended March 31, 2021 was equivalent to an annual effective rate of 0.42% of the fund's average daily net assets.
Distributor — MFS Fund Distributors, Inc. (MFD), a wholly-owned subsidiary of MFS, as distributor, received $45,329 for the six months ended March 31, 2021, as its portion of the initial sales charge on sales of Class A shares of the fund.
The Board of Trustees has adopted a distribution plan for certain share classes pursuant to Rule 12b-1 of the Investment Company Act of 1940.
The fund's distribution plan provides that the fund will pay MFD for services provided by MFD and financial intermediaries in connection with the distribution and servicing of certain share classes. One component of the plan is a distribution fee paid to MFD and another component of the plan is a service fee paid to MFD. MFD may subsequently pay all, or a portion, of the distribution and/or service fees to financial intermediaries.
Notes to Financial Statements (unaudited) - continued
Distribution Plan Fee Table:
| | Distribution
Fee Rate (d) | Service
Fee Rate (d) | Total
Distribution
Plan (d) | Annual
Effective
Rate (e) | Distribution
and Service
Fee |
| Class A | — | 0.25% | 0.25% | 0.25% | $ 1,707,053 |
| Class B | 0.75% | 0.25% | 1.00% | 1.00% | 66,354 |
| Class C | 0.75% | 0.25% | 1.00% | 1.00% | 356,029 |
| Class R1 | 0.75% | 0.25% | 1.00% | 1.00% | 15,745 |
| Class R2 | 0.25% | 0.25% | 0.50% | 0.50% | 52,750 |
| Class R3 | — | 0.25% | 0.25% | 0.25% | 52,551 |
| Total Distribution and Service Fees | | | | | $2,250,482 |
| (d) | In accordance with the distribution plan for certain classes, the fund pays distribution and/or service fees equal to these annual percentage rates of each class’s average daily net assets. The distribution and service fee rates disclosed by class represent the current rates in effect at the end of the reporting period. Any rate changes, if applicable, are detailed below. |
| (e) | The annual effective rates represent actual fees incurred under the distribution plan for the six months ended March 31, 2021 based on each class's average daily net assets. MFD has voluntarily agreed to rebate a portion of each class's 0.25% service fee attributable to accounts for which there is no financial intermediary specified on the account except for accounts attributable to MFS or its affiliates' seed money. For the six months ended March 31, 2021, this rebate amounted to $9,270, $2, $12, and $1 for Class A, Class B, Class C, and Class R1, respectively, and is included in the reduction of total expenses in the Statement of Operations. |
Certain Class A shares are subject to a contingent deferred sales charge (CDSC) in the event of a shareholder redemption within 18 months of purchase. Class B shares are subject to a CDSC in the event of a shareholder redemption within six years of purchase. Class C shares are subject to a CDSC in the event of a shareholder redemption within 12 months of purchase. All contingent deferred sales charges are paid to MFD and during the six months ended March 31, 2021, were as follows:
| | Amount |
| Class A | $2,374 |
| Class B | 3,959 |
| Class C | 3,442 |
Shareholder Servicing Agent — MFS Service Center, Inc. (MFSC), a wholly-owned subsidiary of MFS, receives a fee from the fund for its services as shareholder servicing agent calculated as a percentage of the average daily net assets of the fund as determined periodically under the supervision of the fund's Board of Trustees. For the six months ended March 31, 2021, the fee was $221,226, which equated to 0.0062% annually of the fund's average daily net assets. MFSC also receives reimbursement from the fund for out-of-pocket expenses, sub-accounting and other shareholder servicing costs which may be paid to affiliated and unaffiliated service providers. Class R6 shares do not incur sub-accounting fees. For the six months ended March 31, 2021, these out-of-pocket expenses, sub-accounting and other shareholder servicing costs amounted to $1,888,309.
Notes to Financial Statements (unaudited) - continued
Administrator — MFS provides certain financial, legal, shareholder communications, compliance, and other administrative services to the fund. Under an administrative services agreement, the fund reimburses MFS the costs incurred to provide these services. The fund is charged an annual fixed amount of $17,500 plus a fee based on average daily net assets. The administrative services fee incurred for the six months ended March 31, 2021 was equivalent to an annual effective rate of 0.0076% of the fund's average daily net assets.
Trustees’ and Officers’ Compensation — The fund pays compensation to independent Trustees in the form of a retainer, attendance fees, and additional compensation to Board and Committee chairpersons. The fund does not pay compensation directly to Trustees or officers of the fund who are also officers of the investment adviser, all of whom receive remuneration from MFS for their services to the fund. Certain officers and Trustees of the fund are officers or directors of MFS, MFD, and MFSC.
Prior to December 31, 2001, the fund had an unfunded defined benefit plan (“DB plan”) for independent Trustees. As of December 31, 2001, the Board took action to terminate the DB plan with respect to then-current and any future independent Trustees, such that the DB plan covers only certain of those former independent Trustees who retired on or before December 31, 2001. The DB plan resulted in a net decrease in pension expense of $596 and is included in “Independent Trustees’ compensation” in the Statement of Operations for the six months ended March 31, 2021. The liability for deferred retirement benefits payable to those former independent Trustees under the DB plan amounted to $4,565 at March 31, 2021, and is included in “Payable for independent Trustees’ compensation” in the Statement of Assets and Liabilities.
Other — The fund invests in the MFS Institutional Money Market Portfolio which is managed by MFS and seeks current income consistent with preservation of capital and liquidity. This money market fund does not pay a management fee to MFS but does incur investment and operating costs.
The fund is permitted to engage in purchase and sale transactions with funds and accounts for which MFS serves as investment adviser or sub-adviser (“cross-trades”) pursuant to a policy adopted by the Board of Trustees. This policy has been designed to ensure that cross-trades conducted by the fund comply with Rule 17a-7 under the Investment Company Act of 1940. During the six months ended March 31, 2021, the fund engaged in sale transactions pursuant to this policy, which amounted to $4,441,887. The sales transactions resulted in net realized gains (losses) of $675,451.
The adviser has voluntarily undertaken to reimburse the fund from its own resources on a quarterly basis for the cost of investment research embedded in the cost of the fund’s securities trades. This agreement may be rescinded at any time. For the six months ended March 31, 2021, this reimbursement amounted to $197,228, which is included in “Other” income in the Statement of Operations.
(4) Portfolio Securities
For the six months ended March 31, 2021, purchases and sales of investments, other than short sales and short-term obligations, aggregated $1,295,031,170 and $1,168,991,199, respectively.
Notes to Financial Statements (unaudited) - continued
(5) Shares of Beneficial Interest
The fund's Declaration of Trust permits the Trustees to issue an unlimited number of full and fractional shares of beneficial interest. Transactions in fund shares were as follows:
| | Six months ended
3/31/21 | | Year ended
9/30/20 |
| | Shares | Amount | | Shares | Amount |
| Shares sold | | | | | |
| Class A | 776,571 | $39,824,904 | | 2,146,837 | $94,779,226 |
| Class B | 1,645 | 78,127 | | 2,808 | 105,101 |
| Class C | 104,935 | 4,750,917 | | 360,794 | 14,082,771 |
| Class I | 17,689,393 | 944,996,487 | | 23,413,170 | 1,067,432,087 |
| Class R1 | 1,499 | 66,465 | | 5,829 | 224,965 |
| Class R2 | 89,581 | 4,363,603 | | 111,513 | 4,718,386 |
| Class R3 | 78,774 | 3,973,926 | | 223,615 | 9,797,456 |
| Class R4 | 23,954 | 1,231,155 | | 91,918 | 3,958,285 |
| Class R6 | 1,071,172 | 54,047,034 | | 4,459,462 | 193,327,059 |
| | 19,837,524 | $1,053,332,618 | | 30,815,946 | $1,388,425,336 |
Shares issued to shareholders
in reinvestment of distributions | | | | | |
| Class A | 1,254,443 | $62,533,851 | | 1,111,543 | $50,199,664 |
| Class B | 15,157 | 672,687 | | 14,312 | 579,770 |
| Class C | 82,820 | 3,642,408 | | 58,284 | 2,341,264 |
| Class I | 3,558,640 | 182,487,033 | | 2,376,892 | 110,264,003 |
| Class R1 | 3,583 | 154,178 | | 3,574 | 140,647 |
| Class R2 | 20,034 | 960,037 | | 18,326 | 797,170 |
| Class R3 | 42,787 | 2,113,247 | | 38,748 | 1,734,371 |
| Class R4 | 14,773 | 735,552 | | 14,365 | 648,021 |
| Class R6 | 1,825,081 | 90,651,764 | | 1,277,717 | 57,497,281 |
| | 6,817,318 | $343,950,757 | | 4,913,761 | $224,202,191 |
| Shares reacquired | | | | | |
| Class A | (1,786,481) | $(91,444,208) | | (9,390,942) | $(424,020,468) |
| Class B | (50,406) | (2,292,140) | | (154,851) | (6,093,574) |
| Class C | (368,510) | (16,673,927) | | (579,017) | (22,979,229) |
| Class I | (13,560,141) | (714,501,301) | | (18,063,926) | (819,703,317) |
| Class R1 | (22,748) | (1,011,627) | | (32,199) | (1,290,411) |
| Class R2 | (103,626) | (5,130,243) | | (215,438) | (9,175,266) |
| Class R3 | (136,061) | (6,857,427) | | (442,642) | (19,888,632) |
| Class R4 | (52,245) | (2,663,948) | | (192,636) | (8,923,401) |
| Class R6 | (1,168,937) | (59,975,211) | | (4,401,221) | (196,504,172) |
| | (17,249,155) | $(900,550,032) | | (33,472,872) | $(1,508,578,470) |
Notes to Financial Statements (unaudited) - continued
| | Six months ended
3/31/21 | | Year ended
9/30/20 |
| | Shares | Amount | | Shares | Amount |
| Net change | | | | | |
| Class A | 244,533 | $10,914,547 | | (6,132,562) | $(279,041,578) |
| Class B | (33,604) | (1,541,326) | | (137,731) | (5,408,703) |
| Class C | (180,755) | (8,280,602) | | (159,939) | (6,555,194) |
| Class I | 7,687,892 | 412,982,219 | | 7,726,136 | 357,992,773 |
| Class R1 | (17,666) | (790,984) | | (22,796) | (924,799) |
| Class R2 | 5,989 | 193,397 | | (85,599) | (3,659,710) |
| Class R3 | (14,500) | (770,254) | | (180,279) | (8,356,805) |
| Class R4 | (13,518) | (697,241) | | (86,353) | (4,317,095) |
| Class R6 | 1,727,316 | 84,723,587 | | 1,335,958 | 54,320,168 |
| | 9,405,687 | $496,733,343 | | 2,256,835 | $104,049,057 |
Effective June 1, 2019, purchases of the fund’s Class B shares are closed to new and existing investors subject to certain exceptions. Please see the fund’s prospectus for details.
The fund is one of several mutual funds in which certain MFS funds may invest. The MFS funds do not invest in the underlying funds for the purpose of exercising management or control. At the end of the period, the MFS Moderate Allocation Fund, the MFS Growth Allocation Fund, the MFS Conservative Allocation Fund, and the MFS Aggressive Growth Allocation Fund were the owners of record of approximately 7%, 6%, 3%, and 3%, respectively, of the value of outstanding voting shares of the fund. In addition, the MFS Lifetime 2020 Fund, the MFS Lifetime 2025 Fund, the MFS Lifetime 2030 Fund, the MFS Lifetime 2035 Fund, the MFS Lifetime 2040 Fund, the MFS Lifetime 2045 Fund, the MFS Lifetime 2050 Fund, the MFS Lifetime 2055 Fund, the MFS Lifetime 2060 Fund, and the MFS Lifetime Income Fund were each the owners of record of less than 1% of the value of outstanding voting shares of the fund.
(6) Line of Credit
The fund and certain other funds managed by MFS participate in a $1.25 billion unsecured committed line of credit of which $1 billion is reserved for use by the fund and certain other U.S. funds. The line of credit is provided by a syndicate of banks under a credit agreement. Borrowings may be made for temporary financing needs. Interest is charged to each fund, based on its borrowings, generally at a rate equal to the highest of one month LIBOR, the Federal Funds Effective Rate and the Overnight Bank Funding Rate, plus an agreed upon spread. A commitment fee, based on the average daily, unused portion of the committed line of credit, is allocated among the participating funds. In addition, the fund and other funds managed by MFS have established unsecured uncommitted borrowing arrangements with certain banks for temporary financing needs. Interest is charged to each fund, based on its borrowings, at rates equal to customary reference rates plus an agreed upon spread. For the six months ended March 31, 2021, the fund’s commitment fee and interest expense were $14,994 and $0, respectively, and are included in “Interest expense and fees” in the Statement of Operations.
Notes to Financial Statements (unaudited) - continued
(7) Investments in Affiliated Issuers
An affiliated issuer may be considered one in which the fund owns 5% or more of the outstanding voting securities, or a company which is under common control. For the purposes of this report, the following were affiliated issuers:
| Affiliated Issuers | Beginning
Value | Purchases | Sales
Proceeds | Realized
Gain
(Loss) | Change in
Unrealized
Appreciation or
Depreciation | Ending
Value |
| MFS Institutional Money Market Portfolio | $67,432,432 | $498,581,905 | $465,264,641 | $— | $— | $100,749,696 |
| Affiliated Issuers | Dividend
Income | Capital Gain
Distributions |
| MFS Institutional Money Market Portfolio | $24,316 | $— |
(8) Impacts of COVID-19
The pandemic related to the global spread of novel coronavirus disease (COVID-19), which was first detected in December 2019, has resulted in significant disruptions to global business activity and the global economy, as well as the economies of individual countries, the financial performance of individual companies and sectors, and the securities and commodities markets in general. Multiple surges in cases globally, the availability and widespread adoption of vaccines, and the emergence of variant strains of the virus continue to create uncertainty as to the future and long-term impacts resulting from the pandemic including impacts to the prices and liquidity of the fund's investments and the fund's performance.
Proxy Voting Policies and Information
MFS votes proxies on behalf of the fund pursuant to proxy voting policies and procedures that are available without charge, upon request, by calling 1-800-225-2606, by visiting mfs.com/proxyvoting, or by visiting the SEC’s Web site at http://www.sec.gov.
Information regarding how the fund voted proxies relating to portfolio securities during the most recent twelve-month period ended June 30 is available by August 31 of each year without charge by visiting mfs.com/proxyvoting, or by visiting the SEC’s Web site at http://www.sec.gov.
Quarterly Portfolio Disclosure
The fund files a complete schedule of portfolio holdings with the SEC for the first and third quarters of each fiscal year as an exhibit to its reports on Form N-PORT. The fund's Form N-PORT reports are available on the SEC's Web site at http://www.sec.gov. A shareholder can obtain the portfolio holdings report for the first and third quarters of the fund's fiscal year at mfs.com/openendfunds by choosing the fund's name and then scrolling to the “Resources” section and clicking on the “Prospectus and Reports” tab.
Further Information
From time to time, MFS may post important information about the fund or the MFS Funds on the MFS Web site (mfs.com). This information is available at https://www.mfs.com/announcements or at mfs.com/openendfunds by choosing the fund’s name and then scrolling to the “Resources” section and clicking on the “Announcements” tab, if any.
Information About Fund Contracts and Legal Claims
The fund has entered into contractual arrangements with an investment adviser, administrator, distributor, shareholder servicing agent, 529 program manager (if applicable), and custodian who each provide services to the fund. Unless expressly stated otherwise, shareholders are not parties to, or intended beneficiaries of these contractual arrangements, and these contractual arrangements are not intended to create any shareholder right to enforce them against the service providers or to seek any remedy under them against the service providers, either directly or on behalf of the fund.
Under the Trust’s By-Laws and Declaration of Trust, any claims asserted against or on behalf of the MFS Funds, including claims against Trustees and Officers, must be brought in state and federal courts located within the Commonwealth of Massachusetts.
Provision of Financial Reports and Summary Prospectuses
The fund produces financial reports every six months and updates its summary prospectus and prospectus annually. To avoid sending duplicate copies of materials to households, only one copy of the fund’s annual and semiannual report and summary prospectus may be mailed to shareholders having the same last name and residential address on the fund’s records. However, any shareholder may contact MFSC (please see back cover for address and telephone number) to request that copies of these reports and summary prospectuses be sent personally to that shareholder.
Save paper with eDelivery.
MFS® will send you prospectuses, reports, and proxies directly via e-mail so you will get information faster with less mailbox clutter.
To sign up:
1. Go to mfs.com.
2. Log in via MFS® Access.
3. Select eDelivery.
If you own your MFS fund shares through a financial institution or a retirement plan, MFS® TALK, MFS® Access, or eDelivery may not be available to you.
CONTACT
WEB SITE
mfs.com
MFS TALK
1-800-637-8255
24 hours a day
ACCOUNT SERVICE AND LITERATURE
Shareholders
1-800-225-2606
Financial advisors
1-800-343-2829
Retirement plan services
1-800-637-1255
MAILING ADDRESS
MFS Service Center, Inc.
P.O. Box 219341
Kansas City, MO 64121-9341
OVERNIGHT MAIL
MFS Service Center, Inc.
Suite 219341
430 W 7th Street
Kansas City, MO 64105-1407
Semiannual Report
March 31, 2021
The report is prepared for the general information of shareholders. It is authorized for distribution to prospective investors only when preceded or accompanied by a current prospectus.
NOT FDIC INSURED • MAY LOSE VALUE • NO BANK GUARANTEE
LETTER FROM THE CEO
Dear Shareholders:
Markets have experienced dramatic swings since the coronavirus pandemic brought the global economy to a standstill for several months early in 2020. The speedy development of vaccines and therapeutics brightened the economic and market outlook, but uncertainty remains as new variants of the virus appear and questions persist over how fast vaccines can be made widely available outside the United States. In the U.S., political uncertainty eased after former Vice President Joe Biden won the presidential election and the Democrats gained control of a closely divided Senate.
Global central banks have taken aggressive steps to cushion the economic and market fallout related to the virus, and governments are deploying unprecedented levels of fiscal support. Having passed a $1.9 trillion stimulus package in March, the U.S. Congress is expected to approve additional stimulus later this year, some of it focused on infrastructure. Along with extraordinary government expenditures, pent-up consumer demand could fuel a surge in economic activity as coronavirus restrictions are eased further. Because of this, markets anticipate at least temporary inflation pressures in the months ahead and have pushed up yields on global government bonds, resulting in ripple effects being felt across most financial markets. The measures already put in place have helped build a supportive environment and are encouraging economic recovery; however, if markets disconnect from fundamentals, they can sow the seeds of instability. As such, recent dramatic increases in speculative retail trading bear watching.
In the aftermath of the crisis, we could see societal changes as households, businesses, and governments adjust to a new reality, and any such alterations could affect the investment landscape. For investors, events such as the COVID-19 outbreak demonstrate the importance of having a deep understanding of company fundamentals, and we have built our global research platform to do just that.
At MFS®, we put our clients’ assets to work responsibly by carefully navigating the increasing complexity of global markets and economies. Guided by our long-term philosophy and adhering to our commitment to sustainable investing, we tune out the noise and aim to uncover what we believe are the best, most durable investment opportunities in the market. Our unique global investment platform combines collective expertise, long-term discipline, and thoughtful risk management to create sustainable value for investors.
Respectfully,
Michael W. Roberge
Chief Executive Officer
MFS Investment Management
May 14, 2021
The opinions expressed in this letter are subject to change and may not be relied upon for investment advice. No forecasts can be guaranteed.
Portfolio structure (i)
Top ten holdings (i)
| U.S. Treasury Notes, 0.125%, 12/31/2022 | 2.7% |
| Goldman Sachs Group, Inc. | 2.1% |
| U.S. Treasury Notes, 1.375%, 1/31/2025 | 2.1% |
| Comcast Corp., “A” | 2.0% |
| Microsoft Corp. | 1.9% |
| Johnson & Johnson | 1.8% |
| JPMorgan Chase & Co. | 1.8% |
| Cigna Corp. | 1.6% |
| Charles Schwab Corp. | 1.5% |
| U.S. Treasury Notes, 0.375%, 11/30/2025 | 1.5% |
Composition including fixed income credit quality (a)(i)
| AAA | 4.3% |
| AA | 1.0% |
| A | 4.2% |
| BBB | 8.5% |
| BB | 0.2% |
| B (o) | 0.0% |
| CCC (o) | 0.0% |
| U.S. Government | 8.9% |
| Federal Agencies | 11.7% |
| Not Rated | 0.4% |
| Non-Fixed Income | 60.5% |
| Cash & Cash Equivalents | 0.3% |
GICS equity sectors (g)
| Financials | 14.9% |
| Health Care | 9.6% |
| Industrials | 9.6% |
| Information Technology | 8.4% |
| Consumer Staples | 5.2% |
| Communication Services | 3.5% |
| Utilities | 2.4% |
| Consumer Discretionary | 2.1% |
| Materials | 1.9% |
| Energy | 1.3% |
| Convertible Debt | 1.1% |
| Real Estate | 0.5% |
Portfolio Composition - continued
Fixed income sectors (i)
| Investment Grade Corporates | 12.9% |
| Mortgage-Backed Securities | 11.7% |
| U.S. Treasury Securities | 8.9% |
| Commercial Mortgage-Backed Securities | 2.3% |
| Collateralized Debt Obligations | 2.1% |
| Asset-Backed Securities | 0.5% |
| Municipal Bonds | 0.3% |
| Emerging Markets Bonds | 0.2% |
| High Yield Corporates | 0.2% |
| Non-U.S. Government Bonds | 0.1% |
| U.S. Government Agencies (o) | 0.0% |
| (a) | For all securities other than those specifically described below, ratings are assigned to underlying securities utilizing ratings from Moody’s, Fitch, and Standard & Poor’s rating agencies and applying the following hierarchy: If all three agencies provide a rating, the middle rating (after dropping the highest and lowest ratings) is assigned; if two of the three agencies rate a security, the lower of the two is assigned. If none of the 3 rating agencies above assign a rating, but the security is rated by DBRS Morningstar, then the DBRS Morningstar rating is assigned. Ratings are shown in the S&P and Fitch scale (e.g., AAA). Securities rated BBB or higher are considered investment grade. All ratings are subject to change. U.S. Government includes securities issued by the U.S. Department of the Treasury. Federal Agencies includes rated and unrated U.S. Agency fixed-income securities, U.S. Agency mortgage-backed securities, and collateralized mortgage obligations of U.S. Agency mortgage-backed securities. Not Rated includes fixed income securities and fixed income derivatives that have not been rated by any rating agency. Non-Fixed Income includes equity securities (including convertible bonds and equity derivatives) and/or commodity-linked derivatives. The fund may or may not have held all of these instruments on this date. The fund is not rated by these agencies. |
| (g) | The Global Industry Classification Standard (GICS®) was developed by and/or is the exclusive property of MSCI, Inc. and S&P Global Market Intelligence Inc. (“S&P Global Market Intelligence”). GICS is a service mark of MSCI and S&P Global Market Intelligence and has been licensed for use by MFS. MFS has applied its own internal sector/industry classification methodology for equity securities and non-equity securities that are unclassified by GICS. |
| (i) | For purposes of this presentation, the components include the value of securities, and reflect the impact of the equivalent exposure of derivative positions, if any. These amounts may be negative from time to time. Equivalent exposure is a calculated amount that translates the derivative position into a reasonable approximation of the amount of the underlying asset that the portfolio would have to hold at a given point in time to have the same price sensitivity that results from the portfolio’s ownership of the derivative contract. When dealing with derivatives, equivalent exposure is a more representative measure of the potential impact of a position on portfolio performance than value. The bond component will include any accrued interest amounts. |
Where the fund holds convertible bonds, they are treated as part of the equity portion of the portfolio.
Cash & Cash Equivalents includes any cash, investments in money market funds, short-term securities, and other assets less liabilities. Please see the Statement of Assets and Liabilities for additional information related to the fund’s cash position and other assets and liabilities.
Portfolio Composition - continued
Percentages are based on net assets as of March 31, 2021.
The portfolio is actively managed and current holdings may be different.
Expense Table
Fund expenses borne by the shareholders during the period,
October 1, 2020 through March 31, 2021
As a shareholder of the fund, you incur two types of costs: (1) transaction costs, including sales charges (loads) on certain purchase or redemption payments, and (2) ongoing costs, including management fees; distribution and service (12b-1) fees; and other fund expenses. This example is intended to help you understand your ongoing costs (in dollars) of investing in the fund and to compare these costs with the ongoing costs of investing in other mutual funds.
The example is based on an investment of $1,000 invested at the beginning of the period and held for the entire period October 1, 2020 through March 31, 2021.
Actual Expenses
The first line for each share class in the following table provides information about actual account values and actual expenses. You may use the information in this line, together with the amount you invested, to estimate the expenses that you paid over the period. Simply divide your account value by $1,000 (for example, an $8,600 account value divided by $1,000 = 8.6), then multiply the result by the number in the first line under the heading entitled “Expenses Paid During Period” to estimate the expenses you paid on your account during this period.
Hypothetical Example for Comparison Purposes
The second line for each share class in the following table provides information about hypothetical account values and hypothetical expenses based on the fund’s actual expense ratio and an assumed rate of return of 5% per year before expenses, which is not the fund’s actual return. The hypothetical account values and expenses may not be used to estimate the actual ending account balance or expenses you paid for the period. You may use this information to compare the ongoing costs of investing in the fund and other funds. To do so, compare this 5% hypothetical example with the 5% hypothetical examples that appear in the shareholder reports of the other funds.
Please note that the expenses shown in the table are meant to highlight your ongoing costs only and do not reflect any transactional costs, such as sales charges (loads). Therefore, the second line for each share class in the table is useful in comparing ongoing costs only, and will not help you determine the relative total costs of owning different funds. In addition, if these transactional costs were included, your costs would have been higher.
Expense Table - continued
Share
Class | | Annualized
Expense
Ratio | Beginning
Account Value
10/01/20 | Ending
Account Value
3/31/21 | Expenses
Paid During
Period (p)
10/01/20-3/31/21 |
| A | Actual | 0.72% | $1,000.00 | $1,142.91 | $3.85 |
| Hypothetical (h) | 0.72% | $1,000.00 | $1,021.34 | $3.63 |
| B | Actual | 1.46% | $1,000.00 | $1,138.80 | $7.79 |
| Hypothetical (h) | 1.46% | $1,000.00 | $1,017.65 | $7.34 |
| C | Actual | 1.46% | $1,000.00 | $1,139.06 | $7.79 |
| Hypothetical (h) | 1.46% | $1,000.00 | $1,017.65 | $7.34 |
| I | Actual | 0.47% | $1,000.00 | $1,144.37 | $2.51 |
| Hypothetical (h) | 0.47% | $1,000.00 | $1,022.59 | $2.37 |
| R1 | Actual | 1.46% | $1,000.00 | $1,138.89 | $7.79 |
| Hypothetical (h) | 1.46% | $1,000.00 | $1,017.65 | $7.34 |
| R2 | Actual | 0.97% | $1,000.00 | $1,141.47 | $5.18 |
| Hypothetical (h) | 0.97% | $1,000.00 | $1,020.09 | $4.89 |
| R3 | Actual | 0.72% | $1,000.00 | $1,143.33 | $3.85 |
| Hypothetical (h) | 0.72% | $1,000.00 | $1,021.34 | $3.63 |
| R4 | Actual | 0.47% | $1,000.00 | $1,144.14 | $2.51 |
| Hypothetical (h) | 0.47% | $1,000.00 | $1,022.59 | $2.37 |
| R6 | Actual | 0.39% | $1,000.00 | $1,145.32 | $2.09 |
| Hypothetical (h) | 0.39% | $1,000.00 | $1,022.99 | $1.97 |
| 529A | Actual | 0.74% | $1,000.00 | $1,142.68 | $3.95 |
| Hypothetical (h) | 0.74% | $1,000.00 | $1,021.24 | $3.73 |
| 529B | Actual | 0.75% | $1,000.00 | $1,142.94 | $4.01 |
| Hypothetical (h) | 0.75% | $1,000.00 | $1,021.19 | $3.78 |
| 529C | Actual | 1.51% | $1,000.00 | $1,138.80 | $8.05 |
| Hypothetical (h) | 1.51% | $1,000.00 | $1,017.40 | $7.59 |
| (h) | 5% class return per year before expenses. |
| (p) | “Expenses Paid During Period” are equal to each class’s annualized expense ratio, as shown above, multiplied by the average account value over the period, multiplied by 182/365 (to reflect the one-half year period). Expenses paid do not include any applicable sales charges (loads). If these transaction costs had been included, your costs would have been higher. |
Notes to Expense Table
For the period from October 1, 2020 through March 31, 2021, the distribution fee for Class 529B was not imposed. Had the distribution fee been imposed throughout the entire six month period, the annualized expense ratio, the actual expenses paid during the period, and the hypothetical expenses paid during the period would have been approximately 1.52%, $8.12, and $7.64 for Class 529B. See Note 3 in the Notes to Financial Statements for additional information.
Each class with a Rule 12b-1 service fee is subject to a rebate of a portion of such fee. Such rebates are included in the expense ratios above. For Class 529A and Class529C shares, this
Expense Table - continued
rebate reduced the expense ratios above by 0.02% and 0.01%, respectively. See Note 3 in the Notes to Financial Statements for additional information.
Portfolio of Investments
3/31/21 (unaudited)
The Portfolio of Investments is a complete list of all securities owned by your fund. It is categorized by broad-based asset classes.
| Issuer | | | Shares/Par | Value ($) |
| Common Stocks – 59.2% |
| Aerospace – 2.5% | |
| Honeywell International, Inc. | | 428,838 | $ 93,087,865 |
| L3Harris Technologies, Inc. | | 260,199 | 52,737,133 |
| Lockheed Martin Corp. | | 76,437 | 28,243,472 |
| Northrop Grumman Corp. | | 105,088 | 34,010,680 |
| | | | | $208,079,150 |
| Alcoholic Beverages – 0.6% | |
| Constellation Brands, Inc., “A” | | 75,448 | $ 17,202,144 |
| Diageo PLC | | 788,739 | 32,506,495 |
| | | | | $49,708,639 |
| Automotive – 1.2% | |
| Aptiv PLC (a) | | 98,455 | $ 13,576,945 |
| Lear Corp. | | 287,467 | 52,103,394 |
| LKQ Corp. (a) | | 847,550 | 35,876,791 |
| | | | | $101,557,130 |
| Biotechnology – 0.2% | |
| Vertex Pharmaceuticals, Inc. (a) | | 90,649 | $ 19,479,564 |
| Broadcasting – 0.3% | |
| Discovery Communications, Inc., “A” (a) | | 351,334 | $ 15,268,975 |
| Omnicom Group, Inc. | | 113,438 | 8,411,428 |
| | | | | $23,680,403 |
| Brokerage & Asset Managers – 3.4% | |
| BlackRock, Inc. | | 35,482 | $ 26,752,009 |
| Blackstone Group, Inc. | | 354,904 | 26,450,995 |
| Cboe Global Markets, Inc. | | 264,585 | 26,111,894 |
| Charles Schwab Corp. | | 1,938,346 | 126,341,392 |
| Invesco Ltd. | | 1,049,964 | 26,480,092 |
| NASDAQ, Inc. | | 185,585 | 27,366,364 |
| T. Rowe Price Group, Inc. | | 138,152 | 23,706,883 |
| | | | | $283,209,629 |
| Business Services – 2.7% | |
| Accenture PLC, “A” | | 274,904 | $ 75,942,230 |
| Amdocs Ltd. | | 451,681 | 31,685,422 |
| Equifax, Inc. | | 145,756 | 26,400,784 |
| Fidelity National Information Services, Inc. | | 309,835 | 43,565,900 |
Portfolio of Investments (unaudited) – continued
| Issuer | | | Shares/Par | Value ($) |
| Common Stocks – continued |
| Business Services – continued | |
| Fiserv, Inc. (a) | | 398,579 | $ 47,446,844 |
| | | | | $225,041,180 |
| Cable TV – 2.0% | |
| Comcast Corp., “A” | | 3,143,102 | $ 170,073,249 |
| Chemicals – 1.2% | |
| 3M Co. | | 218,399 | $ 42,081,119 |
| PPG Industries, Inc. | | 386,193 | 58,029,360 |
| | | | | $100,110,479 |
| Computer Software – 2.3% | |
| Microsoft Corp. | | 693,489 | $ 163,503,901 |
| Oracle Corp. | | 426,916 | 29,956,696 |
| | | | | $193,460,597 |
| Construction – 1.6% | |
| Masco Corp. | | 1,274,766 | $ 76,358,483 |
| Otis Worldwide Corp. | | 177,019 | 12,116,951 |
| Stanley Black & Decker, Inc. | | 149,405 | 29,831,696 |
| Vulcan Materials Co. | | 105,558 | 17,812,913 |
| | | | | $136,120,043 |
| Consumer Products – 0.7% | |
| Colgate-Palmolive Co. | | 407,369 | $ 32,112,898 |
| Kimberly-Clark Corp. | | 199,097 | 27,684,438 |
| | | | | $59,797,336 |
| Electrical Equipment – 1.1% | |
| Johnson Controls International PLC | | 1,582,452 | $ 94,424,911 |
| Electronics – 3.5% | |
| Applied Materials, Inc. | | 378,186 | $ 50,525,650 |
| Intel Corp. | | 1,234,010 | 78,976,640 |
| NXP Semiconductors N.V. | | 208,816 | 42,043,013 |
| Taiwan Semiconductor Manufacturing Co. Ltd., ADR | | 428,871 | 50,726,862 |
| Texas Instruments, Inc. | | 364,834 | 68,949,978 |
| | | | | $291,222,143 |
| Energy - Independent – 1.1% | |
| ConocoPhillips | | 464,668 | $ 24,613,464 |
| Hess Corp. | | 560,767 | 39,679,873 |
| Pioneer Natural Resources Co. | | 92,530 | 14,695,615 |
| Valero Energy Corp. | | 220,067 | 15,756,797 |
| | | | | $94,745,749 |
Portfolio of Investments (unaudited) – continued
| Issuer | | | Shares/Par | Value ($) |
| Common Stocks – continued |
| Food & Beverages – 2.2% | |
| Archer Daniels Midland Co. | | 535,654 | $ 30,532,278 |
| Danone S.A. | | 401,430 | 27,539,282 |
| General Mills, Inc. | | 436,128 | 26,743,369 |
| J.M. Smucker Co. | | 124,315 | 15,729,577 |
| Mondelez International, Inc. | | 359,739 | 21,055,524 |
| Nestle S.A. | | 362,570 | 40,409,590 |
| PepsiCo, Inc. | | 170,205 | 24,075,497 |
| | | | | $186,085,117 |
| Food & Drug Stores – 0.7% | |
| Wal-Mart Stores, Inc. | | 405,550 | $ 55,085,856 |
| Health Maintenance Organizations – 1.7% | |
| Cigna Corp. | | 570,923 | $ 138,014,926 |
| Insurance – 3.2% | |
| Aon PLC | | 298,229 | $ 68,625,475 |
| Chubb Ltd. | | 472,542 | 74,647,460 |
| Marsh & McLennan Cos., Inc. | | 204,246 | 24,877,163 |
| Reinsurance Group of America, Inc. | | 103,328 | 13,024,494 |
| Travelers Cos., Inc. | | 321,892 | 48,412,557 |
| Willis Towers Watson PLC | | 172,986 | 39,593,036 |
| | | | | $269,180,185 |
| Internet – 0.4% | |
| Alphabet, Inc., “A” (a) | | 17,363 | $ 35,811,535 |
| Leisure & Toys – 0.3% | |
| Electronic Arts, Inc. | | 206,587 | $ 27,965,682 |
| Machinery & Tools – 2.4% | |
| Caterpillar, Inc. | | 125,016 | $ 28,987,460 |
| Eaton Corp. PLC | | 819,620 | 113,337,053 |
| Ingersoll Rand, Inc. (a) | | 630,586 | 31,031,137 |
| Trane Technologies PLC | | 186,755 | 30,919,158 |
| | | | | $204,274,808 |
| Major Banks – 5.9% | |
| Bank of America Corp. | | 2,720,507 | $ 105,256,416 |
| Goldman Sachs Group, Inc. | | 539,875 | 176,539,125 |
| JPMorgan Chase & Co. | | 979,641 | 149,130,749 |
| Morgan Stanley | | 193,086 | 14,995,059 |
| PNC Financial Services Group, Inc. | | 259,099 | 45,448,556 |
| | | | | $491,369,905 |
Portfolio of Investments (unaudited) – continued
| Issuer | | | Shares/Par | Value ($) |
| Common Stocks – continued |
| Medical & Health Technology & Services – 1.5% | |
| ICON PLC (a) | | 100,269 | $ 19,689,824 |
| McKesson Corp. | | 264,316 | 51,552,193 |
| Quest Diagnostics, Inc. | | 390,022 | 50,055,423 |
| | | | | $121,297,440 |
| Medical Equipment – 2.7% | |
| Becton, Dickinson and Co. | | 108,306 | $ 26,334,604 |
| Danaher Corp. | | 332,920 | 74,933,633 |
| Medtronic PLC | | 755,051 | 89,194,175 |
| Thermo Fisher Scientific, Inc. | | 78,411 | 35,785,212 |
| | | | | $226,247,624 |
| Metals & Mining – 0.2% | |
| Rio Tinto PLC | | 231,081 | $ 17,680,539 |
| Natural Gas - Pipeline – 0.2% | |
| Enterprise Products Partners LP | | 748,664 | $ 16,485,581 |
| Other Banks & Diversified Financials – 2.5% | |
| Northern Trust Corp. | | 265,527 | $ 27,909,543 |
| Truist Financial Corp. | | 1,995,463 | 116,375,402 |
| U.S. Bancorp | | 1,159,840 | 64,150,750 |
| | | | | $208,435,695 |
| Pharmaceuticals – 3.6% | |
| Bayer AG | | 235,318 | $ 14,890,662 |
| Johnson & Johnson | | 920,325 | 151,255,414 |
| Merck & Co., Inc. | | 1,259,757 | 97,114,667 |
| Roche Holding AG | | 115,896 | 37,454,831 |
| | | | | $300,715,574 |
| Railroad & Shipping – 1.1% | |
| Union Pacific Corp. | | 423,921 | $ 93,436,428 |
| Real Estate – 0.5% | |
| Public Storage, Inc., REIT | | 53,514 | $ 13,205,115 |
| STORE Capital Corp., REIT | | 876,908 | 29,376,418 |
| | | | | $42,581,533 |
| Specialty Chemicals – 0.8% | |
| Axalta Coating Systems Ltd. (a) | | 1,102,673 | $ 32,617,067 |
| DuPont de Nemours, Inc. | | 399,491 | 30,872,665 |
| | | | | $63,489,732 |
Portfolio of Investments (unaudited) – continued
| Issuer | | | Shares/Par | Value ($) |
| Common Stocks – continued |
| Specialty Stores – 0.9% | |
| Home Depot, Inc. | | 150,687 | $ 45,997,207 |
| Target Corp. | | 139,272 | 27,585,605 |
| | | | | $73,582,812 |
| Telecommunications - Wireless – 0.4% | |
| T-Mobile USA, Inc. (a) | | 288,819 | $ 36,186,132 |
| Tobacco – 1.0% | |
| Philip Morris International, Inc. | | 952,516 | $ 84,526,270 |
| Trucking – 0.2% | |
| United Parcel Service, Inc., “B” | | 108,720 | $ 18,481,313 |
| Utilities - Electric Power – 2.4% | |
| Duke Energy Corp. | | 680,827 | $ 65,720,230 |
| Exelon Corp. | | 760,218 | 33,251,935 |
| PG&E Corp. (a) | | 2,357,531 | 27,606,688 |
| Pinnacle West Capital Corp. | | 216,513 | 17,613,333 |
| Southern Co. | | 870,861 | 54,132,720 |
| | | | | $198,324,906 |
| Total Common Stocks (Identified Cost, $2,769,807,520) | | $ 4,959,969,795 |
| Bonds – 39.0% |
| Aerospace – 0.2% |
| BAE Systems PLC, 3.4%, 4/15/2030 (n) | | $ | 3,048,000 | $ 3,233,137 |
| Huntington Ingalls Industries, Inc., 3.844%, 5/01/2025 | | | 1,837,000 | 2,003,549 |
| L3Harris Technologies, Inc., 3.85%, 6/15/2023 | | | 6,859,000 | 7,317,361 |
| Raytheon Technologies Corp., 4.125%, 11/16/2028 | | | 4,900,000 | 5,514,897 |
| | | | | $18,068,944 |
| Apparel Manufacturers – 0.0% |
| NIKE, Inc., “B”, 3.25%, 3/27/2040 | | $ | 2,500,000 | $ 2,618,492 |
| Asset-Backed & Securitized – 4.9% |
| ALM Loan Funding, CLO, 2013-7R2A, “A1B2”, FLR, 1.641% (LIBOR - 3mo. + 1.4%), 10/15/2027 (n) | | $ | 13,305,000 | $ 13,084,337 |
| Arbor Realty Trust, Inc., CLO, 2020-FL1, “AS”, FLR, 1.506% (LIBOR - 1mo. + 1.4%), 2/15/2035 (n) | | | 3,610,000 | 3,609,040 |
| Arbor Realty Trust, Inc., CLO, 2021-FL1, “AS”, FLR, 1.33% (LIBOR - 1mo. + 1.2%) 12/15/2035 (n) | | | 6,771,500 | 6,737,643 |
| AREIT CRE Trust, 2018-CRE2, “A”, FLR, 1.086% (LIBOR - 1mo. + 0.98%), 11/14/2035 (n) | | | 3,651,138 | 3,649,067 |
| AREIT CRE Trust, 2019-CRE3, “AS”, FLR, 1.406% (LIBOR - 1mo. + 1.3%), 9/14/2036 (n) | | | 10,151,500 | 10,139,196 |
Portfolio of Investments (unaudited) – continued
| Issuer | | | Shares/Par | Value ($) |
| Bonds – continued |
| Asset-Backed & Securitized – continued |
| Avis Budget Rental Car Funding LLC, 2019-1A, “A”, 3.45%, 3/20/2023 (n) | | $ | 11,630,000 | $ 11,888,954 |
| Bancorp Commercial Mortgage Trust, 2019-CRE6, “AS”, FLR, 1.406% (LIBOR - 1mo. + 1.3%), 9/15/2036 (n) | | | 10,512,013 | 10,512,009 |
| Bayview Financial Revolving Mortgage Loan Trust, FLR, 1.709% (LIBOR - 1mo. + 1.6%), 12/28/2040 (n) | | | 1,946,008 | 2,036,984 |
| BDS Ltd., 2019-FL4, “A”, FLR, 1.208% (LIBOR - 1mo. + 1.10%), 8/15/2036 (n) | | | 7,275,500 | 7,266,406 |
| BPCRE Holder LLC, 0.956%, 2/15/2037 (n) | | | 4,188,000 | 4,189,290 |
| BSPRT Issuer Ltd., 2021-FL6, “AS”, FLR, 1.403% (LIBOR - 1mo. + 1.3%) 3/15/2036 (n) | | | 15,922,500 | 15,882,694 |
| Business Jet Securities LLC, 2021-1A, “A”, 2.162%, 4/15/2036 (n) | | | 5,007,000 | 4,974,014 |
| CHCP 2021-FL1 Ltd., “AS”, FLR, 1.406% (LIBOR - 1mo. + 1.3%) 2/15/2038 (n) | | | 7,049,000 | 7,055,636 |
| Chesapeake Funding II LLC, 2018-1A, “A1”, 3.04%, 4/15/2030 (n) | | | 1,353,496 | 1,361,126 |
| Commercial Mortgage Pass-Through Certificates, 2019-BN17, “A4”, 3.714%, 4/15/2052 | | | 8,356,000 | 9,186,784 |
| Commercial Mortgage Trust, 2015-DC1, “A5”, 3.35%, 2/10/2048 | | | 7,000,000 | 7,534,654 |
| Commercial Mortgage Trust, 2015-LC21, “A4”, 3.708%, 7/10/2048 | | | 9,641,397 | 10,553,402 |
| Commercial Mortgage Trust, 2015-PC1, “A5”, 3.902%, 7/10/2050 | | | 11,000,000 | 12,098,235 |
| CSAIL Commercial Mortgage Trust, 2015-C2, “A4”, 3.504%, 6/15/2057 | | | 5,534,308 | 5,973,786 |
| Cutwater Ltd., 2015-1A, “AR”, FLR, 1.461% (LIBOR - 3mo. + 1.22%), 1/15/2029 (n) | | | 12,108,176 | 12,108,381 |
| Dryden Senior Loan Fund, 2013-26A, “AR”, CLO, FLR, 1.141% (LIBOR - 3mo. + 0.9%), 4/15/2029 (n) | | | 8,528,000 | 8,517,988 |
| Dryden Senior Loan Fund, 2018-55A, “A1”, CLO, FLR, 1.261% (LIBOR - 3mo. + 1.02%), 4/15/2031 (n) | | | 11,647,598 | 11,652,478 |
| Exantas Capital Corp. CLO Ltd., 2019-RS07, “A”, FLR, 1.108% (LIBOR - 1mo. + 1%), 4/15/2036 (n) | | | 589,235 | 588,386 |
| Exeter Automobile Receivables Trust, 2020-1, 2.26%, 4/15/2024 (n) | | | 2,195,000 | 2,214,879 |
| Figueroa CLO Ltd., 2014-1A, “BR”, FLR, 1.741% (LIBOR - 3mo. + 1.5%), 1/15/2027 (n) | | | 3,980,000 | 3,990,264 |
| Fort CRE LLC, 2018-1A, “A1”, FLR, 1.458% (LIBOR - 1mo. + 1.35%), 11/16/2035 (n) | | | 3,888,635 | 3,888,631 |
| GLS Auto Receivables Trust, 2020-1A, ��A”, 2.17%, 2/15/2024 (n) | | | 1,514,565 | 1,527,175 |
| GMAC Mortgage Corp. Loan Trust, FGIC, 5.805%, 10/25/2036 | | | 450,774 | 475,562 |
Portfolio of Investments (unaudited) – continued
| Issuer | | | Shares/Par | Value ($) |
| Bonds – continued |
| Asset-Backed & Securitized – continued |
| GS Mortgage Securities Trust, 2015-GC30, “A4”, 3.382%, 5/10/2050 | | $ | 10,734,280 | $ 11,582,643 |
| GS Mortgage Securities Trust, 2019-GSA1, “A4”, 3.047%, 11/10/2052 | | | 6,631,389 | 6,964,817 |
| JPMBB Commercial Mortgage Securities Trust, 2015-C28, “A4”, 3.227%, 10/15/2048 | | | 13,361,337 | 14,284,241 |
| KKR Real Estate Financial Trust, Inc., 2018-FL1, “A”, FLR, 1.208% (LIBOR - 1mo. + 1.1%), 6/15/2036 (n) | | | 6,559,027 | 6,559,027 |
| Magnetite XVI Ltd., 2015-16A, “AR”, FLR, 1.023% (LIBOR - 3mo. + 0.8%), 1/18/2028 (n) | | | 4,884,590 | 4,868,348 |
| MF1 CLO Ltd., 2019-FL2, “A”, FLR, 1.239% (LIBOR - 1mo. + 1.13%), 12/25/2034 (n) | | | 9,635,525 | 9,628,664 |
| MF1 CLO Ltd., 2021-FL5, “AS”, FLR, 1.308% (LIBOR - 1mo. + 1.2%), 7/15/2036 (n) | | | 17,497,000 | 17,497,000 |
| MF1 Multi-Family Housing Mortgage Loan Trust, 2020-FL4, “A”, FLR, 1.806% (LIBOR - 1mo. + 1.7%), 11/15/2035 (n) | | | 5,349,000 | 5,387,170 |
| Morgan Stanley Bank of America Merrill Lynch Trust, 2017-C34, “A4”, 3.536%, 11/15/2052 | | | 4,195,516 | 4,578,981 |
| Morgan Stanley Capital I Trust, 2017-H1, “A5”, 3.53%, 6/15/2050 | | | 3,903,759 | 4,259,181 |
| Mountain Hawk CLO Ltd., 2014-3A, “BR”, FLR, 2.023% (LIBOR - 3mo. + 1.8%), 4/18/2025 (n) | | | 13,096,831 | 13,117,851 |
| Neuberger Berman CLO Ltd., 2015-20, “AR”, FLR, 1.041% (LIBOR - 3mo. + 0.8%), 1/15/2028 (n) | | | 4,868,516 | 4,861,369 |
| Oaktree CLO Ltd., 2015-1A, “A2AR”, FLR, 1.574% (LIBOR - 3mo. + 1.35%), 10/20/2027 (n) | | | 2,435,945 | 2,434,722 |
| PFP III Ltd., 2021-7, “AS”, FLR, 1.25% (LIBOR - 1mo. + 1.15%), 4/14/2038 (n) | | | 12,526,000 | 12,479,028 |
| Ready Capital Mortgage Financing LLC, 2021-FL5, FLR, 1.11% (LIBOR - 1mo. + 1%) 4/25/2038 (n) | | | 10,100,000 | 10,100,212 |
| Residential Funding Mortgage Securities, Inc., FGIC, 5.32%, 12/25/2035 | | | 226,384 | 224,834 |
| Santander Retail Auto Lease Trust, 2020-A, “B”, 1.88%, 3/20/2024 (n) | | | 4,984,000 | �� 5,099,639 |
| Sound Point CLO Ltd., 2015-3A, “AR”, FLR, 1.114% (LIBOR - 3mo. + 0.89%), 1/20/2028 (n) | | | 739,124 | 738,970 |
| TPG Real Estate Finance Trust (TRTX), 2021-FL4, “A”, FLR, 1.306% (LIBOR - 1mo. + 1.2%), 3/15/2038 (n) | | | 16,676,500 | 16,686,923 |
| UBS Commercial Mortgage Trust, 2017-C8, “A4”, 3.983%, 2/15/2051 | | | 8,990,000 | 9,970,812 |
| UBS Commercial Mortgage Trust, 2019-C16, “A4”, 3.605%, 4/15/2052 | | | 30,000,000 | 32,768,304 |
Portfolio of Investments (unaudited) – continued
| Issuer | | | Shares/Par | Value ($) |
| Bonds – continued |
| Asset-Backed & Securitized – continued |
| UBS Commercial Mortgage Trust, 2019-C17, “A4”, 2.921%, 9/15/2052 | | $ | 7,465,644 | $ 7,733,402 |
| Verizon Owner Trust, 2020-A, “B”, 1.98%, 7/22/2024 | | | 7,967,000 | 8,184,452 |
| Veros Auto Receivables Trust, 2020-1, “A”, 1.67%, 9/15/2023 (n) | | | 2,615,253 | 2,624,119 |
| Wells Fargo Commercial Mortgage Trust, 2015-NXS1, “A5”, 3.148%, 5/15/2048 | | | 6,507,931 | 6,970,206 |
| | | | | $412,301,916 |
| Automotive – 0.5% |
| General Motors Co., 6.75%, 4/01/2046 | | $ | 2,985,000 | $ 4,019,676 |
| Hyundai Capital America, 2.65%, 2/10/2025 (n) | | | 3,063,000 | 3,162,991 |
| Hyundai Capital America, 3%, 2/10/2027 (n) | | | 5,234,000 | 5,442,696 |
| Lear Corp., 3.8%, 9/15/2027 | | | 6,786,000 | 7,384,584 |
| Lear Corp., 4.25%, 5/15/2029 | | | 2,537,000 | 2,809,035 |
| Magna International, Inc., 2.45%, 6/15/2030 | | | 7,173,000 | 7,179,915 |
| Volkswagen Group of America Finance LLC, 3.35%, 5/13/2025 (n) | | | 12,752,000 | 13,686,877 |
| | | | | $43,685,774 |
| Broadcasting – 0.1% |
| RELX Capital, Inc., 3%, 5/22/2030 | | $ | 2,015,000 | $ 2,088,406 |
| Walt Disney Co., 3.5%, 5/13/2040 | | | 4,720,000 | 4,981,304 |
| Walt Disney Co., 3.6%, 1/13/2051 | | | 2,898,000 | 3,057,713 |
| | | | | $10,127,423 |
| Brokerage & Asset Managers – 0.4% |
| E*TRADE Financial Corp., 2.95%, 8/24/2022 | | $ | 2,032,000 | $ 2,098,316 |
| E*TRADE Financial Corp., 4.5%, 6/20/2028 | | | 3,038,000 | 3,463,596 |
| Intercontinental Exchange, Inc., 2.35%, 9/15/2022 | | | 1,111,000 | 1,139,453 |
| Intercontinental Exchange, Inc., 4%, 10/15/2023 | | | 2,712,000 | 2,942,249 |
| Intercontinental Exchange, Inc., 2.1%, 6/15/2030 | | | 6,958,000 | 6,698,745 |
| Intercontinental Exchange, Inc., 1.85%, 9/15/2032 | | | 2,066,000 | 1,888,987 |
| National Securities Clearing Corp., 1.5%, 4/23/2025 (n) | | | 4,047,000 | 4,086,835 |
| Raymond James Financial, Inc., 4.95%, 7/15/2046 | | | 5,992,000 | 7,324,605 |
| | | | | $29,642,786 |
| Building – 0.3% |
| CRH America Finance, Inc., 4.5%, 4/04/2048 (n) | | $ | 2,978,000 | $ 3,420,023 |
| Martin Marietta Materials, Inc., 3.5%, 12/15/2027 | | | 2,501,000 | 2,736,450 |
| Martin Marietta Materials, Inc., 2.5%, 3/15/2030 | | | 730,000 | 725,534 |
| Masco Corp., 2%, 2/15/2031 | | | 13,605,000 | 12,891,928 |
| Vulcan Materials Co., 3.5%, 6/01/2030 | | | 1,246,000 | 1,335,109 |
| | | | | $21,109,044 |
Portfolio of Investments (unaudited) – continued
| Issuer | | | Shares/Par | Value ($) |
| Bonds – continued |
| Business Services – 0.7% |
| Equinix, Inc., 2.625%, 11/18/2024 | | $ | 9,037,000 | $ 9,516,676 |
| Equinix, Inc., 1.8%, 7/15/2027 | | | 5,883,000 | 5,768,385 |
| Fiserv, Inc., 2.65%, 6/01/2030 | | | 1,391,000 | 1,399,923 |
| Fiserv, Inc., 4.4%, 7/01/2049 | | | 4,754,000 | 5,469,785 |
| Global Payments, Inc., 1.2%, 3/01/2026 | | | 7,558,000 | 7,436,861 |
| Tencent Holdings Ltd., 2.39%, 6/03/2030 (n) | | | 5,676,000 | 5,477,821 |
| Verisk Analytics, Inc., 4.125%, 3/15/2029 | | | 7,035,000 | 7,813,029 |
| Visa, Inc., 3.15%, 12/14/2025 | | | 13,528,000 | 14,747,737 |
| Western Union Co., 2.85%, 1/10/2025 | | | 1,860,000 | 1,949,083 |
| | | | | $59,579,300 |
| Cable TV – 0.4% |
| Charter Communications Operating LLC/Charter Communications Operating Capital Corp., 4.908%, 7/23/2025 | | $ | 4,865,000 | $ 5,517,684 |
| Charter Communications Operating LLC/Charter Communications Operating Capital Corp., 3.5%, 6/01/2041 | | | 6,803,000 | 6,452,673 |
| Charter Communications Operating LLC/Charter Communications Operating Capital Corp., 5.375%, 5/01/2047 | | | 1,390,000 | 1,610,994 |
| Comcast Corp., 2.8%, 1/15/2051 | | | 3,124,000 | 2,854,704 |
| Cox Communications, Inc., 1.8%, 10/01/2030 (n) | | | 4,310,000 | 3,985,005 |
| Time Warner Entertainment Co. LP, 8.375%, 7/15/2033 | | | 6,553,000 | 9,477,024 |
| | | | | $29,898,084 |
| Chemicals – 0.1% |
| Sherwin-Williams Co., 2.3%, 5/15/2030 | | $ | 5,104,000 | $ 5,023,131 |
| Sherwin-Williams Co., 4.5%, 6/01/2047 | | | 4,928,000 | 5,740,972 |
| | | | | $10,764,103 |
| Computer Software – 0.1% |
| Dell International LLC/EMC Corp., 4.9%, 10/01/2026 (n) | | $ | 5,400,000 | $ 6,123,455 |
| Microsoft Corp., 2.525%, 6/01/2050 | | | 5,955,000 | 5,423,099 |
| | | | | $11,546,554 |
| Computer Software - Systems – 0.2% |
| Apple, Inc., 2.85%, 5/11/2024 | | $ | 6,161,000 | $ 6,571,092 |
| Apple, Inc., 2.05%, 9/11/2026 | | | 1,228,000 | 1,268,766 |
| Apple, Inc., 3.35%, 2/09/2027 | | | 1,532,000 | 1,682,326 |
| Apple, Inc., 3.85%, 5/04/2043 | | | 4,830,000 | 5,448,212 |
| | | | | $14,970,396 |
| Conglomerates – 0.3% |
| Carrier Global Corp., 3.377%, 4/05/2040 | | $ | 9,457,000 | $ 9,360,881 |
| Roper Technologies, Inc., 4.2%, 9/15/2028 | | | 2,435,000 | 2,740,218 |
| Roper Technologies, Inc., 2.95%, 9/15/2029 | | | 1,537,000 | 1,599,579 |
Portfolio of Investments (unaudited) – continued
| Issuer | | | Shares/Par | Value ($) |
| Bonds – continued |
| Conglomerates – continued |
| Roper Technologies, Inc., 2%, 6/30/2030 | | $ | 4,923,000 | $ 4,685,093 |
| Westinghouse Air Brake Technologies Corp., 4.4%, 3/15/2024 | | | 966,000 | 1,050,214 |
| Westinghouse Air Brake Technologies Corp., 3.2%, 6/15/2025 | | | 2,623,000 | 2,773,900 |
| Westinghouse Air Brake Technologies Corp., 4.95%, 9/15/2028 | | | 5,675,000 | 6,462,342 |
| | | | | $28,672,227 |
| Consumer Products – 0.2% |
| Kimberly-Clark Corp., 3.1%, 3/26/2030 | | $ | 822,000 | $ 882,885 |
| Reckitt Benckiser Treasury Services PLC, 3.625%, 9/21/2023 (n) | | | 5,562,000 | 5,920,259 |
| Reckitt Benckiser Treasury Services PLC, 2.75%, 6/26/2024 (n) | | | 5,870,000 | 6,207,296 |
| | | | | $13,010,440 |
| Consumer Services – 0.5% |
| Amazon.com, Inc., 2.5%, 6/03/2050 | | $ | 5,163,000 | $ 4,599,754 |
| Booking Holdings, Inc., 2.75%, 3/15/2023 | | | 10,635,000 | 11,081,787 |
| Booking Holdings, Inc., 4.5%, 4/13/2027 | | | 1,489,000 | 1,726,859 |
| Booking Holdings, Inc., 4.625%, 4/13/2030 | | | 4,593,000 | 5,346,680 |
| Experian Finance PLC, 4.25%, 2/01/2029 (n) | | | 4,705,000 | 5,276,847 |
| IHS Markit Ltd., 3.625%, 5/01/2024 | | | 1,115,000 | 1,196,200 |
| IHS Markit Ltd., 4.75%, 2/15/2025 (n) | | | 1,803,000 | 2,018,458 |
| IHS Markit Ltd., 4%, 3/01/2026 (n) | | | 5,470,000 | 6,022,470 |
| IHS Markit Ltd., 4.25%, 5/01/2029 | | | 1,676,000 | 1,889,665 |
| | | | | $39,158,720 |
| Electronics – 0.4% |
| Broadcom Corp./Broadcom Cayman Finance Ltd., 3.5%, 1/15/2028 | | $ | 8,597,000 | $ 9,122,825 |
| Broadcom, Inc., 4.15%, 11/15/2030 | | | 1,932,000 | 2,087,533 |
| Broadcom, Inc., 4.3%, 11/15/2032 | | | 5,034,000 | 5,476,271 |
| Broadcom, Inc., 3.469%, 4/15/2034 (n) | | | 3,962,000 | 3,985,823 |
| Intel Corp., 4.75%, 3/25/2050 | | | 6,881,000 | 8,619,428 |
| | | | | $29,291,880 |
| Energy - Independent – 0.0% |
| Diamondback Energy, Inc., 4.4%, 3/24/2051 | | $ | 1,158,000 | $ 1,180,022 |
| Energy - Integrated – 0.1% |
| Eni S.p.A., 4.75%, 9/12/2028 (n) | | $ | 5,494,000 | $ 6,301,227 |
| Total Capital International S.A., 3.127%, 5/29/2050 | | | 5,602,000 | 5,256,724 |
| | | | | $11,557,951 |
| Financial Institutions – 0.3% |
| AerCap Ireland Capital DAC, 4.875%, 1/16/2024 | | $ | 1,093,000 | $ 1,189,176 |
| AerCap Ireland Capital DAC, 3.65%, 7/21/2027 | | | 7,729,000 | 8,105,995 |
| Avolon Holdings Funding Ltd., 4.375%, 5/01/2026 (n) | | | 2,248,000 | 2,349,032 |
Portfolio of Investments (unaudited) – continued
| Issuer | | | Shares/Par | Value ($) |
| Bonds – continued |
| Financial Institutions – continued |
| Avolon Holdings Funding Ltd., 3.25%, 2/15/2027 (n) | | $ | 2,344,000 | $ 2,323,607 |
| Park Aerospace Holdings Ltd., 5.5%, 2/15/2024 (n) | | | 7,358,000 | 7,997,846 |
| | | | | $21,965,656 |
| Food & Beverages – 0.5% |
| Anheuser-Busch InBev S.A., 8%, 11/15/2039 | | $ | 5,349,000 | $ 8,428,406 |
| Constellation Brands, Inc., 3.5%, 5/09/2027 | | | 9,041,000 | 9,830,068 |
| Diageo Capital PLC, 2.375%, 10/24/2029 | | | 8,369,000 | 8,442,962 |
| General Mills, Inc., 4%, 4/17/2025 | | | 6,879,000 | 7,603,453 |
| General Mills, Inc., 2.875%, 4/15/2030 | | | 1,416,000 | 1,460,809 |
| Keurig Dr Pepper, Inc., 3.2%, 5/01/2030 | | | 1,157,000 | 1,223,412 |
| Keurig Dr Pepper, Inc., 3.8%, 5/01/2050 | | | 2,366,000 | 2,506,969 |
| PepsiCo, Inc., 3.5%, 3/19/2040 | | | 1,843,000 | 1,978,063 |
| | | | | $41,474,142 |
| Gaming & Lodging – 0.3% |
| GLP Capital LP/GLP Financing II, Inc., 5.3%, 1/15/2029 | | $ | 5,014,000 | $ 5,620,443 |
| Las Vegas Sands Corp., 3.9%, 8/08/2029 | | | 2,905,000 | 2,990,957 |
| Marriott International, Inc., 4%, 4/15/2028 | | | 5,953,000 | 6,335,656 |
| Marriott International, Inc., 4.625%, 6/15/2030 | | | 5,630,000 | 6,294,096 |
| Marriott International, Inc., 2.85%, 4/15/2031 | | | 23,000 | 22,602 |
| | | | | $21,263,754 |
| Insurance – 0.0% |
| AIA Group Ltd., 3.375%, 4/07/2030 (n) | | $ | 2,277,000 | $ 2,424,914 |
| Insurance - Health – 0.1% |
| UnitedHealth Group, Inc., 3.75%, 7/15/2025 | | $ | 8,953,000 | $ 9,911,612 |
| UnitedHealth Group, Inc., 3.5%, 8/15/2039 | | | 1,189,000 | 1,276,907 |
| | | | | $11,188,519 |
| Insurance - Property & Casualty – 0.5% |
| American International Group, Inc., 4.875%, 6/01/2022 | | $ | 9,557,000 | $ 10,035,918 |
| American International Group, Inc., 3.75%, 7/10/2025 | | | 6,297,000 | 6,873,229 |
| Aon Corp., 3.75%, 5/02/2029 | | | 12,218,000 | 13,435,316 |
| Hartford Financial Services Group, Inc., 3.6%, 8/19/2049 | | | 2,896,000 | 2,998,538 |
| Liberty Mutual Group, Inc., 3.951%, 10/15/2050 (n) | | | 3,061,000 | 3,148,012 |
| Marsh & McLennan Cos., Inc., 4.75%, 3/15/2039 | | | 2,598,000 | 3,196,106 |
| | | | | $39,687,119 |
| International Market Quasi-Sovereign – 0.1% |
| Temasek Financial I Ltd. (Republic of Singapore), 2.375%, 1/23/2023 (n) | | $ | 10,140,000 | $ 10,499,298 |
Portfolio of Investments (unaudited) – continued
| Issuer | | | Shares/Par | Value ($) |
| Bonds – continued |
| Internet – 0.0% |
| Alphabet, Inc., 1.9%, 8/15/2040 | | $ | 3,078,000 | $ 2,651,928 |
| Machinery & Tools – 0.1% |
| CNH Industrial Capital LLC, 4.2%, 1/15/2024 | | $ | 5,288,000 | $ 5,763,878 |
| CNH Industrial Capital LLC, 1.875%, 1/15/2026 | | | 1,459,000 | 1,476,293 |
| | | | | $7,240,171 |
| Major Banks – 1.9% |
| Bank of America Corp., 4.1%, 7/24/2023 | | $ | 7,282,000 | $ 7,866,419 |
| Bank of America Corp., 3.004%, 12/20/2023 | | | 1,671,000 | 1,737,858 |
| Bank of America Corp., 4.125%, 1/22/2024 | | | 9,739,000 | 10,643,918 |
| Bank of America Corp., 3.366% to 1/23/2025, FLR (LIBOR - 3mo. + 0.81%) to 1/23/2026 | | | 4,937,000 | 5,303,382 |
| Bank of America Corp., 3.5%, 4/19/2026 | | | 8,221,000 | 9,008,211 |
| Bank of America Corp., 2.676% to 6/19/2040, FLR (SOFR + 1.93%) to 6/19/2041 | | | 6,422,000 | 5,999,707 |
| Bank of New York Mellon Corp., 1.6%, 4/24/2025 | | | 5,925,000 | 6,035,996 |
| Goldman Sachs Group, Inc., 2.6%, 2/07/2030 | | | 16,055,000 | 16,239,158 |
| HSBC Holdings PLC, 4% to 9/09/2026, FLR (CMT - 1yr. + 3.222%) to 3/02/2071 | | | 1,426,000 | 1,418,870 |
| HSBC Holdings PLC, 4.7% to 9/09/2031, FLR (CMT - 1yr. + 3.25%) to 3/02/2071 | | | 3,604,000 | 3,549,940 |
| JPMorgan Chase & Co., 3.2%, 1/25/2023 | | | 13,381,000 | 14,055,040 |
| JPMorgan Chase & Co., 3.782% to 2/01/2027, FLR (LIBOR - 3mo. + 1.337%) to 2/01/2028 | | | 14,911,000 | 16,455,104 |
| JPMorgan Chase & Co., 2.956% to 5/13/2030, FLR (SOFR + 2.515%) to 5/13/2031 | | | 1,814,000 | 1,844,933 |
| JPMorgan Chase & Co., 3.109% to 4/22/2040, FLR (SOFR + 2.46%) to 4/22/2041 | | | 9,236,000 | 9,166,248 |
| JPMorgan Chase & Co., 3.897% to 1/23/2048, FLR (LIBOR - 3mo. + 1.22%) to 1/23/2049 | | | 3,340,000 | 3,664,712 |
| Morgan Stanley, 3.125%, 1/23/2023 | | | 912,000 | 954,876 |
| Morgan Stanley, 3.875%, 4/29/2024 | | | 5,957,000 | 6,504,167 |
| Morgan Stanley, 4%, 7/23/2025 | | | 2,685,000 | 2,978,545 |
| Morgan Stanley, 2.699% to 1/22/2030, FLR (SOFR + 1.143%) to 1/22/2031 | | | 13,558,000 | 13,786,054 |
| PNC Bank N.A., 2.7%, 10/22/2029 | | | 2,565,000 | 2,610,012 |
| Royal Bank of Canada, 1.15%, 6/10/2025 | | | 8,937,000 | 8,913,332 |
| State Street Corp., 2.901% to 3/30/2025, FLR (SOFR + 2.6%) to 3/30/2026 | | | 1,315,000 | 1,398,540 |
| UBS Group AG, 2.095% to 2/11/2031, FLR (CMT - 1yr. + 1.0%) to 2/11/2032 (n) | | | 12,248,000 | 11,579,300 |
| | | | | $161,714,322 |
Portfolio of Investments (unaudited) – continued
| Issuer | | | Shares/Par | Value ($) |
| Bonds – continued |
| Medical & Health Technology & Services – 0.6% |
| Alcon, Inc., 2.6%, 5/27/2030 (n) | | $ | 944,000 | $ 945,939 |
| Alcon, Inc., 3.8%, 9/23/2049 (n) | | | 4,513,000 | 4,668,237 |
| Becton, Dickinson and Co., 4.669%, 6/06/2047 | | | 5,389,000 | 6,415,136 |
| Cigna Corp., 3.2%, 3/15/2040 | | | 1,780,000 | 1,777,425 |
| HCA, Inc., 4.125%, 6/15/2029 | | | 6,805,000 | 7,536,608 |
| HCA, Inc., 5.125%, 6/15/2039 | | | 6,696,000 | 8,000,323 |
| Laboratory Corp. of America Holdings, 3.2%, 2/01/2022 | | | 1,361,000 | 1,392,518 |
| Laboratory Corp. of America Holdings, 4.7%, 2/01/2045 | | | 4,836,000 | 5,504,486 |
| Northwell Healthcare, Inc., 3.979%, 11/01/2046 | | | 490,000 | 520,548 |
| Northwell Healthcare, Inc., 4.26%, 11/01/2047 | | | 3,797,000 | 4,259,432 |
| Thermo Fisher Scientific, Inc., 2.95%, 9/19/2026 | | | 3,907,000 | 4,181,105 |
| Thermo Fisher Scientific, Inc., 3.2%, 8/15/2027 | | | 7,086,000 | 7,673,155 |
| | | | | $52,874,912 |
| Medical Equipment – 0.2% |
| Boston Scientific Corp., 3.75%, 3/01/2026 | | $ | 7,432,000 | $ 8,202,212 |
| Boston Scientific Corp., 2.65%, 6/01/2030 | | | 5,104,000 | 5,143,649 |
| Zimmer Biomet Holdings, Inc., 3.55%, 4/01/2025 | | | 6,531,000 | 7,073,718 |
| | | | | $20,419,579 |
| Metals & Mining – 0.3% |
| Anglo American Capital PLC, 5.625%, 4/01/2030 (n) | | $ | 2,982,000 | $ 3,558,329 |
| Anglo American Capital PLC, 2.625%, 9/10/2030 (n) | | | 8,665,000 | 8,487,109 |
| Glencore Funding LLC, 4.125%, 5/30/2023 (n) | | | 3,717,000 | 3,974,848 |
| Glencore Funding LLC, 2.5%, 9/01/2030 (n) | | | 5,444,000 | 5,231,268 |
| | | | | $21,251,554 |
| Midstream – 0.6% |
| Cheniere Corpus Christi Holdings LLC, 3.7%, 11/15/2029 | | $ | 4,814,000 | $ 5,070,583 |
| Enbridge, Inc., 2.5%, 1/15/2025 | | | 3,055,000 | 3,182,311 |
| Enterprise Products Operating LLC, 4.2%, 1/31/2050 | | | 2,536,000 | 2,673,090 |
| Galaxy Pipeline Assets Bidco Ltd., 2.16%, 3/31/2034 (n) | | | 7,971,000 | 7,721,895 |
| Kinder Morgan Energy Partners LP, 4.15%, 2/01/2024 | | | 5,207,000 | 5,652,295 |
| ONEOK, Inc., 4.95%, 7/13/2047 | | | 7,267,000 | 7,589,217 |
| Plains All American Pipeline LP, 3.8%, 9/15/2030 | | | 5,064,000 | 5,153,757 |
| Sabine Pass Liquefaction LLC, 5%, 3/15/2027 | | | 6,594,000 | 7,502,101 |
| Sabine Pass Liquefaction LLC, 4.5%, 5/15/2030 | | | 1,665,000 | 1,867,240 |
| Spectra Energy Partners LP, 3.375%, 10/15/2026 | | | 2,677,000 | 2,876,900 |
| | | | | $49,289,389 |
| Mortgage-Backed – 11.7% | |
| Fannie Mae, 2.73%, 4/01/2023 | | $ | 592,974 | $ 613,100 |
| Fannie Mae, 2.41%, 5/01/2023 | | | 899,514 | 926,774 |
| Fannie Mae, 2.55%, 5/01/2023 | | | 845,100 | 872,643 |
Portfolio of Investments (unaudited) – continued
| Issuer | | | Shares/Par | Value ($) |
| Bonds – continued |
| Mortgage-Backed – continued | |
| Fannie Mae, 2.59%, 5/01/2023 | | $ | 890,263 | $ 919,892 |
| Fannie Mae, 2.62%, 5/01/2023 | | | 590,582 | 610,506 |
| Fannie Mae, 5.25%, 8/01/2024 | | | 909,418 | 1,000,458 |
| Fannie Mae, 5%, 3/25/2025 - 3/01/2042 | | | 7,122,656 | 8,204,585 |
| Fannie Mae, 3.5%, 5/25/2025 - 7/01/2046 | | | 50,880,647 | 54,847,573 |
| Fannie Mae, 2.7%, 7/01/2025 | | | 1,007,000 | 1,073,752 |
| Fannie Mae, 3.43%, 6/01/2026 | | | 1,108,939 | 1,219,958 |
| Fannie Mae, 4.54%, 7/01/2026 | | | 925,224 | 1,035,492 |
| Fannie Mae, 2.66%, 12/25/2026 | | | 4,546,939 | 4,850,014 |
| Fannie Mae, 3.95%, 1/01/2027 | | | 891,516 | 995,219 |
| Fannie Mae, 3%, 11/01/2028 - 9/01/2050 | | | 34,185,327 | 35,868,970 |
| Fannie Mae, 4.96%, 6/01/2030 | | | 473,691 | 547,206 |
| Fannie Mae, 6.5%, 6/01/2031 - 7/01/2037 | | | 2,103,570 | 2,420,810 |
| Fannie Mae, 2.5%, 11/01/2031 - 3/01/2051 | | | 19,910,269 | 20,515,794 |
| Fannie Mae, 5.5%, 2/01/2033 - 4/01/2040 | | | 10,230,464 | 11,818,952 |
| Fannie Mae, 3%, 2/25/2033 (i) | | | 1,223,777 | 122,880 |
| Fannie Mae, 4.5%, 8/01/2033 - 6/01/2044 | | | 19,299,518 | 21,613,411 |
| Fannie Mae, 6%, 1/01/2034 - 7/01/2037 | | | 5,508,942 | 6,372,802 |
| Fannie Mae, 3.25%, 5/25/2040 | | | 449,709 | 484,002 |
| Fannie Mae, 4%, 9/01/2040 - 6/01/2047 | | | 43,221,336 | 47,502,492 |
| Fannie Mae, 2%, 10/25/2040 - 2/01/2051 | | | 3,400,550 | 3,448,276 |
| Fannie Mae, 4%, 7/25/2046 (i) | | | 1,093,083 | 208,826 |
| Fannie Mae, TBA, 2%, 4/19/2036 - 5/13/2051 | | | 149,750,000 | 149,904,794 |
| Fannie Mae, TBA, 2.5%, 4/19/2036 - 5/13/2051 | | | 93,950,000 | 96,628,469 |
| Fannie Mae, TBA, 3%, 4/19/2036 - 6/14/2051 | | | 76,550,000 | 79,855,412 |
| Fannie Mae, TBA, 1.5%, 5/18/2036 | | | 9,975,000 | 10,001,288 |
| Fannie Mae, TBA, 3.5%, 5/25/2036 - 5/13/2051 | | | 18,175,000 | 19,217,577 |
| Fannie Mae, TBA, 4%, 4/14/2051 - 5/13/2051 | | | 10,350,000 | 11,107,813 |
| Freddie Mac, 6%, 5/01/2021 - 6/01/2037 | | | 2,274,428 | 2,676,916 |
| Freddie Mac, 2.791%, 1/25/2022 | | | 3,187,229 | 3,232,533 |
| Freddie Mac, 2.51%, 11/25/2022 | | | 4,700,000 | 4,849,303 |
| Freddie Mac, 3.111%, 2/25/2023 | | | 5,200,000 | 5,436,209 |
| Freddie Mac, 3.32%, 2/25/2023 | | | 2,023,000 | 2,125,576 |
| Freddie Mac, 3.25%, 4/25/2023 | | | 6,006,000 | 6,314,233 |
| Freddie Mac, 3.06%, 7/25/2023 | | | 1,116,000 | 1,177,231 |
| Freddie Mac, 3.458%, 8/25/2023 | | | 2,578,000 | 2,746,268 |
| Freddie Mac, 0.88%, 4/25/2024 (i) | | | 9,780,826 | 207,072 |
| Freddie Mac, 0.504%, 7/25/2024 (i) | | | 40,823,000 | 683,797 |
| Freddie Mac, 0.604%, 7/25/2024 (i) | | | 13,750,245 | 209,730 |
| Freddie Mac, 4.5%, 8/01/2024 - 5/01/2042 | | | 3,111,149 | 3,473,242 |
| Freddie Mac, 0.315%, 8/25/2024 (i) | | | 44,106,000 | 538,133 |
| Freddie Mac, 0.411%, 8/25/2024 (i) | | | 80,856,787 | 929,974 |
| Freddie Mac, 3.064%, 8/25/2024 | | | 2,295,000 | 2,456,749 |
Portfolio of Investments (unaudited) – continued
| Issuer | | | Shares/Par | Value ($) |
| Bonds – continued |
| Mortgage-Backed – continued | |
| Freddie Mac, 0.36%, 10/25/2024 (i) | | $ | 56,994,954 | $ 607,663 |
| Freddie Mac, 3.171%, 10/25/2024 | | | 3,005,000 | 3,248,337 |
| Freddie Mac, 0.278%, 11/25/2024 (i) | | | 44,690,000 | 466,085 |
| Freddie Mac, 2.67%, 12/25/2024 | | | 3,687,000 | 3,927,994 |
| Freddie Mac, 3.329%, 5/25/2025 | | | 4,698,000 | 5,138,231 |
| Freddie Mac, 3.01%, 7/25/2025 | | | 1,275,000 | 1,379,408 |
| Freddie Mac, 3.151%, 11/25/2025 | | | 2,984,000 | 3,251,058 |
| Freddie Mac, 3.5%, 12/01/2025 - 10/25/2058 | | | 31,632,919 | 34,025,232 |
| Freddie Mac, 0.635%, 6/25/2027 (i) | | | 39,273,000 | 1,544,709 |
| Freddie Mac, 0.75%, 6/25/2027 (i) | | | 12,701,028 | 524,052 |
| Freddie Mac, 0.576%, 7/25/2027 (i) | | | 34,041,070 | 1,131,498 |
| Freddie Mac, 0.329%, 8/25/2027 (i) | | | 27,934,000 | 626,060 |
| Freddie Mac, 0.431%, 8/25/2027 (i) | | | 18,020,582 | 463,998 |
| Freddie Mac, 0.279%, 9/25/2027 (i) | | | 30,183,000 | 583,117 |
| Freddie Mac, 0.196%, 11/25/2027 (i) | | | 47,333,000 | 694,153 |
| Freddie Mac, 0.29%, 11/25/2027 (i) | | | 33,889,330 | 611,919 |
| Freddie Mac, 0.325%, 11/25/2027 (i) | | | 30,213,685 | 625,647 |
| Freddie Mac, 0.24%, 12/25/2027 (i) | | | 29,308,000 | 517,981 |
| Freddie Mac, 0.288%, 12/25/2027 (i) | | | 32,765,000 | 664,225 |
| Freddie Mac, 0.368%, 12/25/2027 (i) | | | 51,979,299 | 1,186,880 |
| Freddie Mac, 3.65%, 2/25/2028 | | | 2,634,000 | 2,977,387 |
| Freddie Mac, 3.9%, 4/25/2028 | | | 4,975,000 | 5,697,282 |
| Freddie Mac, 3.926%, 7/25/2028 | | | 160,692 | 184,811 |
| Freddie Mac, 1.089%, 7/25/2029 (i) | | | 857,633 | 68,626 |
| Freddie Mac, 1.144%, 8/25/2029 (i) | | | 13,424,971 | 1,126,958 |
| Freddie Mac, 1.799%, 4/25/2030 (i) | | | 2,500,000 | 360,315 |
| Freddie Mac, 1.868%, 4/25/2030 (i) | | | 7,819,828 | 1,180,208 |
| Freddie Mac, 1.662%, 5/25/2030 (i) | | | 4,048,749 | 551,741 |
| Freddie Mac, 1.796%, 5/25/2030 (i) | | | 8,995,049 | 1,306,454 |
| Freddie Mac, 1.341%, 6/25/2030 (i) | | | 3,687,431 | 409,006 |
| Freddie Mac, 1.6%, 8/25/2030 (i) | | | 3,331,192 | 446,424 |
| Freddie Mac, 1.169%, 9/25/2030 (i) | | | 2,196,896 | 218,656 |
| Freddie Mac, 1.081%, 11/25/2030 (i) | | | 4,320,889 | 404,466 |
| Freddie Mac, 0.423%, 1/25/2031 (i) | | | 17,132,376 | 474,658 |
| Freddie Mac, 0.936%, 1/25/2031 (i) | | | 4,767,487 | 389,384 |
| Freddie Mac, 0.781%, 2/25/2031 (i) | | | 6,541,106 | 455,118 |
| Freddie Mac, 0.307%, 11/25/2032 (i) | | | 25,777,221 | 710,887 |
| Freddie Mac, 3%, 2/15/2033 (i) | | | 1,695,655 | 130,303 |
| Freddie Mac, 5%, 9/01/2033 - 7/01/2041 | | | 4,199,267 | 4,854,685 |
| Freddie Mac, 5.5%, 12/01/2033 - 10/01/2035 | | | 2,177,102 | 2,519,874 |
| Freddie Mac, 6.5%, 5/01/2034 - 7/01/2037 | | | 1,142,666 | 1,291,427 |
| Freddie Mac, 5.5%, 2/15/2036 (i) | | | 243,807 | 44,977 |
| Freddie Mac, 4%, 8/01/2037 - 8/01/2047 | | | 24,046,291 | 26,156,469 |
Portfolio of Investments (unaudited) – continued
| Issuer | | | Shares/Par | Value ($) |
| Bonds – continued |
| Mortgage-Backed – continued | |
| Freddie Mac, 3%, 1/01/2038 - 2/25/2059 | | $ | 36,937,220 | $ 39,100,319 |
| Freddie Mac, 2.5%, 8/01/2040 | | | 1,042,306 | 1,082,622 |
| Freddie Mac, 4.5%, 12/15/2040 (i) | | | 237,726 | 22,397 |
| Freddie Mac, 4%, 8/15/2044 (i) | | | 303,665 | 39,164 |
| Ginnie Mae, 6%, 9/15/2032 - 1/15/2038 | | | 2,062,397 | 2,449,182 |
| Ginnie Mae, 5.5%, 12/15/2032 - 4/20/2035 | | | 1,651,105 | 1,911,257 |
| Ginnie Mae, 4.5%, 7/15/2033 - 7/20/2049 | | | 8,389,501 | 9,287,281 |
| Ginnie Mae, 5%, 7/20/2033 - 10/15/2034 | | | 545,654 | 632,299 |
| Ginnie Mae, 4%, 1/20/2041 - 2/20/2042 | | | 4,806,952 | 5,325,278 |
| Ginnie Mae, 3.5%, 12/15/2041 - 3/20/2048 | | | 13,960,207 | 15,109,699 |
| Ginnie Mae, 3%, 4/20/2045 - 9/20/2050 | | | 33,512,079 | 35,361,701 |
| Ginnie Mae, 2.5%, 12/20/2050 | | | 13,468,785 | 13,899,420 |
| Ginnie Mae, 0.566%, 2/16/2059 (i) | | | 10,122,431 | 449,413 |
| Ginnie Mae, TBA, 2.5%, 2/20/2051 - 5/15/2051 | | | 34,304,623 | 35,350,488 |
| Ginnie Mae, TBA, 2%, 4/15/2051 | | | 20,825,000 | 21,015,760 |
| Ginnie Mae, TBA, 3.5%, 4/15/2051 - 5/20/2051 | | | 32,569,718 | 34,383,201 |
| Ginnie Mae, TBA, 4%, 5/15/2051 | | | 5,050,000 | 5,397,977 |
| Ginnie Mae, TBA, 3%, 5/20/2051 | | | 13,025,000 | 13,573,220 |
| | | | | $979,435,747 |
| Municipals – 0.3% |
| New Jersey Economic Development Authority State Pension Funding Rev., “A”, NPFG, 7.425%, 2/15/2029 | | $ | 8,500,000 | $ 10,872,881 |
| New Jersey Turnpike Authority Rev. (Build America Bonds), “F”, 7.414%, 1/01/2040 | | | 5,815,000 | 9,136,197 |
| State of Florida, “A”, 2.154%, 7/01/2030 | | | 4,514,000 | 4,510,317 |
| | | | | $24,519,395 |
| Natural Gas - Distribution – 0.1% |
| NiSource, Inc., 2.95%, 9/01/2029 | | $ | 4,669,000 | $ 4,802,866 |
| NiSource, Inc., 5.65%, 2/01/2045 | | | 2,282,000 | 2,924,347 |
| | | | | $7,727,213 |
| Natural Gas - Pipeline – 0.1% |
| APT Pipelines Ltd., 4.2%, 3/23/2025 (n) | | $ | 8,334,000 | $ 9,071,713 |
| APT Pipelines Ltd., 4.25%, 7/15/2027 (n) | | | 777,000 | 859,608 |
| | | | | $9,931,321 |
| Network & Telecom – 0.3% |
| AT&T, Inc., 3%, 6/30/2022 | | $ | 5,547,000 | $ 5,701,192 |
| AT&T, Inc., 3.65%, 9/15/2059 (n) | | | 5,210,000 | 4,745,958 |
| Verizon Communications, Inc., 2.1%, 3/22/2028 | | | 878,000 | 882,556 |
| Verizon Communications, Inc., 2.55%, 3/21/2031 | | | 1,646,000 | 1,641,610 |
| Verizon Communications, Inc., 4.272%, 1/15/2036 | | | 4,812,000 | 5,433,504 |
Portfolio of Investments (unaudited) – continued
| Issuer | | | Shares/Par | Value ($) |
| Bonds – continued |
| Network & Telecom – continued |
| Verizon Communications, Inc., 4.812%, 3/15/2039 | | $ | 6,030,000 | $ 7,200,759 |
| | | | | $25,605,579 |
| Oils – 0.3% |
| Marathon Petroleum Corp., 4.75%, 9/15/2044 | | $ | 3,338,000 | $ 3,693,047 |
| Phillips 66 Co., 2.15%, 12/15/2030 | | | 11,084,000 | 10,477,676 |
| Valero Energy Corp., 4.9%, 3/15/2045 | | | 7,194,000 | 8,063,987 |
| | | | | $22,234,710 |
| Other Banks & Diversified Financials – 0.3% |
| BBVA Bancomer S.A. de C.V., 6.75%, 9/30/2022 (n) | | $ | 4,730,000 | $ 5,089,291 |
| Branch Banking & Trust Co., 2.25%, 3/11/2030 | | | 7,823,000 | 7,628,233 |
| Capital One Financial Corp., 3.75%, 3/09/2027 | | | 5,440,000 | 5,968,685 |
| Citigroup, Inc., 2.666% to 1/29/2030, FLR (SOFR + 1.146%) to 1/29/2031 | | | 9,244,000 | 9,281,217 |
| | | | | $27,967,426 |
| Pollution Control – 0.1% |
| Republic Services, Inc., 3.95%, 5/15/2028 | | $ | 3,824,000 | $ 4,265,681 |
| Republic Services, Inc., 1.45%, 2/15/2031 | | | 3,244,000 | 2,963,310 |
| | | | | $7,228,991 |
| Real Estate - Office – 0.0% |
| Boston Properties, Inc., REIT, 2.55%, 4/01/2032 | | $ | 4,222,000 | $ 4,044,119 |
| Real Estate - Other – 0.0% |
| Prologis LP, REIT, 2.25%, 4/15/2030 | | $ | 2,305,000 | $ 2,277,485 |
| Real Estate - Retail – 0.2% |
| Brixmor Operating Partnership LP, REIT, 4.125%, 5/15/2029 | | $ | 567,000 | $ 611,740 |
| Brixmor Operating Partnership LP, REIT, 4.05%, 7/01/2030 | | | 5,371,000 | 5,781,529 |
| Realty Income Corp., REIT, 3.25%, 1/15/2031 | | | 1,870,000 | 1,972,482 |
| VEREIT Operating Partnership LP, REIT, 3.1%, 12/15/2029 | | | 4,964,000 | 5,067,346 |
| | | | | $13,433,097 |
| Retailers – 0.3% |
| Best Buy Co., Inc., 4.45%, 10/01/2028 | | $ | 6,509,000 | $ 7,417,010 |
| Home Depot, Inc., 5.95%, 4/01/2041 | | | 1,440,000 | 1,994,014 |
| Home Depot, Inc., 3.9%, 6/15/2047 | | | 3,505,000 | 3,927,757 |
| Target Corp., 2.25%, 4/15/2025 | | | 9,228,000 | 9,664,772 |
| | | | | $23,003,553 |
Portfolio of Investments (unaudited) – continued
| Issuer | | | Shares/Par | Value ($) |
| Bonds – continued |
| Specialty Stores – 0.0% |
| TJX Cos., Inc., 3.75%, 4/15/2027 | | $ | 1,229,000 | $ 1,367,730 |
| TJX Cos., Inc., 3.875%, 4/15/2030 | | | 1,474,000 | 1,640,094 |
| | | | | $3,007,824 |
| Telecommunications - Wireless – 0.5% |
| American Tower Corp., REIT, 3%, 6/15/2023 | | $ | 2,827,000 | $ 2,974,660 |
| American Tower Corp., REIT, 3.6%, 1/15/2028 | | | 3,431,000 | 3,699,059 |
| American Tower Corp., REIT, 3.1%, 6/15/2050 | | | 5,084,000 | 4,658,442 |
| American Tower Trust I, REIT, 3.07%, 3/15/2023 (n) | | | 5,228,000 | 5,288,922 |
| Crown Castle International Corp., 1.35%, 7/15/2025 | | | 2,267,000 | 2,261,349 |
| Crown Castle International Corp., 3.65%, 9/01/2027 | | | 7,941,000 | 8,648,954 |
| T-Mobile USA, Inc., 2.05%, 2/15/2028 (n) | | | 5,133,000 | 5,041,581 |
| T-Mobile USA, Inc., 4.5%, 4/15/2050 (n) | | | 7,223,000 | 8,094,383 |
| | | | | $40,667,350 |
| Telephone Services – 0.0% |
| Deutsche Telekom AG, 3.625%, 1/21/2050 (n) | | $ | 3,648,000 | $ 3,691,423 |
| Transportation - Services – 0.1% |
| ERAC USA Finance LLC, 7%, 10/15/2037 (n) | | $ | 5,241,000 | $ 7,542,204 |
| U.S. Government Agencies and Equivalents – 0.0% |
| Small Business Administration, 4.35%, 7/01/2023 | | $ | 45,186 | $ 46,721 |
| Small Business Administration, 4.77%, 4/01/2024 | | | 139,502 | 144,993 |
| Small Business Administration, 5.18%, 5/01/2024 | | | 225,835 | 236,915 |
| Small Business Administration, 5.52%, 6/01/2024 | | | 123,235 | 129,798 |
| Small Business Administration, 4.99%, 9/01/2024 | | | 249,916 | 262,220 |
| Small Business Administration, 4.95%, 3/01/2025 | | | 228,295 | 239,793 |
| | | | | $1,060,440 |
| U.S. Treasury Obligations – 8.8% |
| U.S. Treasury Bonds, 3.5%, 2/15/2039 | | $ | 5,140,000 | $ 6,150,532 |
| U.S. Treasury Bonds, 1.375%, 11/15/2040 | | | 15,000,000 | 12,724,219 |
| U.S. Treasury Bonds, 2.875%, 5/15/2043 | | | 55,466,000 | 60,533,773 |
| U.S. Treasury Bonds, 2.5%, 2/15/2045 | | | 5,313,000 | 5,410,751 |
| U.S. Treasury Bonds, 3%, 11/15/2045 | | | 215,000 | 239,414 |
| U.S. Treasury Bonds, 2.875%, 11/15/2046 | | | 14,148,000 | 15,413,583 |
| U.S. Treasury Bonds, 3%, 2/15/2048 | | | 22,502,000 | 25,146,864 |
| U.S. Treasury Bonds, 2.375%, 11/15/2049 | | | 93,310,000 | 92,435,219 |
| U.S. Treasury Notes, 0.125%, 12/31/2022 | | | 227,750,000 | 227,643,242 |
| U.S. Treasury Notes, 1.375%, 1/31/2025 | | | 167,000,000 | 171,768,633 |
| U.S. Treasury Notes, 0.375%, 11/30/2025 | | | 127,000,000 | 124,167,304 |
| | | | | $741,633,534 |
Portfolio of Investments (unaudited) – continued
| Issuer | | | Shares/Par | Value ($) |
| Bonds – continued |
| Utilities - Electric Power – 0.9% |
| Berkshire Hathaway Energy Co., 3.75%, 11/15/2023 | | $ | 3,241,000 | $ 3,477,094 |
| Berkshire Hathaway Energy Co., 4.25%, 10/15/2050 | | | 841,000 | 960,518 |
| Duke Energy Corp., 2.65%, 9/01/2026 | | | 1,449,000 | 1,515,430 |
| Duke Energy Progress LLC, 3.45%, 3/15/2029 | | | 6,550,000 | 7,115,317 |
| Enel Finance International N.V., 2.65%, 9/10/2024 | | | 2,783,000 | 2,927,108 |
| Enel Finance International N.V., 4.875%, 6/14/2029 (n) | | | 5,515,000 | 6,420,838 |
| Enel Finance International N.V., 4.75%, 5/25/2047 (n) | | | 2,194,000 | 2,588,863 |
| Evergy, Inc., 2.9%, 9/15/2029 | | | 5,207,000 | 5,303,213 |
| Exelon Corp., 4.05%, 4/15/2030 | | | 6,154,000 | 6,826,484 |
| FirstEnergy Corp., 3.4%, 3/01/2050 | | | 3,479,000 | 3,026,730 |
| Georgia Power Co., 3.7%, 1/30/2050 | | | 482,000 | 492,729 |
| Jersey Central Power & Light Co., 4.3%, 1/15/2026 (n) | | | 4,141,000 | 4,523,471 |
| Northern States Power Co., 2.6%, 6/01/2051 | | | 6,156,000 | 5,493,213 |
| Oncor Electric Delivery Co. LLC, 5.75%, 3/15/2029 | | | 4,162,000 | 5,146,945 |
| Pacific Gas & Electric Co., 2.1%, 8/01/2027 | | | 1,561,000 | 1,527,919 |
| Pacific Gas & Electric Co., 3.3%, 8/01/2040 | | | 3,004,000 | 2,707,803 |
| PPL Capital Funding, Inc., 5%, 3/15/2044 | | | 1,618,000 | 1,923,744 |
| PPL Corp., 3.4%, 6/01/2023 | | | 4,493,000 | 4,727,966 |
| Xcel Energy, Inc., 3.4%, 6/01/2030 | | | 3,122,000 | 3,353,264 |
| Xcel Energy, Inc., 3.5%, 12/01/2049 | | | 3,681,000 | 3,671,908 |
| | | | | $73,730,557 |
| Utilities - Gas – 0.1% |
| East Ohio Gas Co., 2%, 6/15/2030 (n) | | $ | 4,317,000 | $ 4,127,170 |
| Total Bonds (Identified Cost, $3,190,547,696) | | $ 3,273,998,451 |
| Convertible Preferred Stocks – 1.0% |
| Automotive – 0.2% | |
| Aptiv PLC, 5.5% | | 122,000 | $ 19,262,580 |
| Medical Equipment – 0.4% | |
| Boston Scientific Corp., 5.5% | | 214,080 | $ 22,962,221 |
| Danaher Corp., 4.75% | | 3,976 | 6,083,717 |
| | | | | $29,045,938 |
| Telecommunications - Wireless – 0.2% | |
| T-Mobile USA, Inc., 5.25% | | 16,855 | $ 18,994,068 |
| Utilities - Electric Power – 0.2% | |
| CenterPoint Energy, Inc., 7% | | 493,865 | $ 20,579,355 |
| Total Convertible Preferred Stocks (Identified Cost, $79,675,432) | $ 87,881,941 |
Portfolio of Investments (unaudited) – continued
| Issuer | | | Shares/Par | Value ($) |
| Preferred Stocks – 0.3% |
| Computer Software - Systems – 0.3% | | | | |
| Samsung Electronics Co. Ltd. (Identified Cost, $14,047,615) | | 371,167 | $ 24,013,797 |
| Investment Companies (h) – 5.6% |
| Money Market Funds – 5.6% | |
| MFS Institutional Money Market Portfolio, 0.05% (v) (Identified Cost, $470,239,594) | | | 470,239,593 | $ 470,239,593 |
| Other Assets, Less Liabilities – (5.1)% | | (430,765,205) |
| Net Assets – 100.0% | $ 8,385,338,372 |
| (a) | Non-income producing security. | | | |
| (h) | An affiliated issuer, which may be considered one in which the fund owns 5% or more of the outstanding voting securities, or a company which is under common control. At period end, the aggregate values of the fund's investments in affiliated issuers and in unaffiliated issuers were $470,239,593 and $8,345,863,984, respectively. | | | |
| (i) | Interest only security for which the fund receives interest on notional principal (Par amount). Par amount shown is the notional principal and does not reflect the cost of the security. | | | |
| (n) | Securities exempt from registration under Rule 144A of the Securities Act of 1933. These securities may be sold in the ordinary course of business in transactions exempt from registration, normally to qualified institutional buyers. At period end, the aggregate value of these securities was $485,303,899, representing 5.8% of net assets. | | | |
| (v) | Affiliated issuer that is available only to investment companies managed by MFS. The rate quoted for the MFS Institutional Money Market Portfolio is the annualized seven-day yield of the fund at period end. | | | |
| The following abbreviations are used in this report and are defined: |
| ADR | American Depositary Receipt |
| CLO | Collateralized Loan Obligation |
| CMT | Constant Maturity Treasury |
| FGIC | Financial Guaranty Insurance Co. |
| FLR | Floating Rate. Interest rate resets periodically based on the parenthetically disclosed reference rate plus a spread (if any). The period-end rate reported may not be the current rate. All reference rates are USD unless otherwise noted. |
| LIBOR | London Interbank Offered Rate |
| NPFG | National Public Finance Guarantee Corp. |
| REIT | Real Estate Investment Trust |
| SOFR | Secured Overnight Financing Rate |
| TBA | To Be Announced |
See Notes to Financial Statements
Financial Statements
Statement of Assets and Liabilities
At 3/31/21 (unaudited)
This statement represents your fund’s balance sheet, which details the assets and liabilities comprising the total value of the fund.
| Assets | |
| Investments in unaffiliated issuers, at value (identified cost, $6,054,078,263) | $8,345,863,984 |
| Investments in affiliated issuers, at value (identified cost, $470,239,594) | 470,239,593 |
| Cash | 551,437 |
| Receivables for | |
| Investments sold | 28,239,182 |
| TBA sale commitments | 316,218,280 |
| Fund shares sold | 9,148,268 |
| Interest and dividends | 24,844,387 |
| Other assets | 61,593 |
| Total assets | $9,195,166,724 |
| Liabilities | |
| Payables for | |
| Distributions | $885,921 |
| Investments purchased | 7,734,139 |
| TBA purchase commitments | 789,189,324 |
| Fund shares reacquired | 9,373,682 |
| Payable to affiliates | |
| Investment adviser | 160,157 |
| Administrative services fee | 3,089 |
| Shareholder servicing costs | 2,043,071 |
| Distribution and service fees | 102,190 |
| Program manager fees | 109 |
| Payable for independent Trustees' compensation | 26,790 |
| Accrued expenses and other liabilities | 309,880 |
| Total liabilities | $809,828,352 |
| Net assets | $8,385,338,372 |
| Net assets consist of | |
| Paid-in capital | $5,847,174,123 |
| Total distributable earnings (loss) | 2,538,164,249 |
| Net assets | $8,385,338,372 |
| Shares of beneficial interest outstanding | 393,507,667 |
Statement of Assets and Liabilities (unaudited) – continued
| | Net assets | Shares
outstanding | Net asset value
per share (a) |
| Class A | $5,069,464,931 | 238,032,417 | $21.30 |
| Class B | 92,888,139 | 4,351,138 | 21.35 |
| Class C | 464,577,430 | 21,638,801 | 21.47 |
| Class I | 937,951,553 | 44,052,141 | 21.29 |
| Class R1 | 10,180,474 | 478,647 | 21.27 |
| Class R2 | 128,287,863 | 6,001,033 | 21.38 |
| Class R3 | 301,007,391 | 14,121,242 | 21.32 |
| Class R4 | 269,537,764 | 12,640,687 | 21.32 |
| Class R6 | 1,071,620,828 | 50,318,737 | 21.30 |
| Class 529A | 33,087,228 | 1,558,614 | 21.23 |
| Class 529B | 743,486 | 34,840 | 21.34 |
| Class 529C | 5,991,285 | 279,370 | 21.45 |
| (a) | Maximum offering price per share was equal to the net asset value per share for all share classes, except for Classes A and 529A, for which the maximum offering prices per share were $22.60 [100 / 94.25 x $21.30] and $22.53 [100 / 94.25 x $21.23], respectively. On sales of $50,000 or more, the maximum offering prices of Class A and Class 529A shares are reduced. A contingent deferred sales charge may be imposed on redemptions of Class A, Class B, Class C, Class 529B, and Class 529C shares. Redemption price per share was equal to the net asset value per share for Classes I, R1, R2, R3, R4, R6, and 529A. |
See Notes to Financial Statements
Financial Statements
Statement of Operations
Six months ended 3/31/21 (unaudited)
This statement describes how much your fund earned in investment income and accrued in expenses. It also describes any gains and/or losses generated by fund operations.
| Net investment income (loss) | |
| Income | |
| Dividends | $52,631,026 |
| Interest | 34,010,630 |
| Dividends from affiliated issuers | 170,559 |
| Income on securities loaned | 156,054 |
| Other | 51,208 |
| Foreign taxes withheld | (400,546) |
| Total investment income | $86,618,931 |
| Expenses | |
| Management fee | $13,872,125 |
| Distribution and service fees | 9,653,480 |
| Shareholder servicing costs | 3,508,166 |
| Program manager fees | 9,367 |
| Administrative services fee | 269,213 |
| Independent Trustees' compensation | 47,999 |
| Custodian fee | 145,252 |
| Shareholder communications | 128,768 |
| Audit and tax fees | 66,891 |
| Legal fees | 29,669 |
| Miscellaneous | 183,985 |
| Total expenses | $27,914,915 |
| Fees paid indirectly | (166) |
| Reduction of expenses by distributor | (20,762) |
| Net expenses | $27,893,987 |
| Net investment income (loss) | $58,724,944 |
Statement of Operations (unaudited) – continued
| Realized and unrealized gain (loss) |
| Realized gain (loss) (identified cost basis) | |
| Unaffiliated issuers | $339,011,689 |
| Affiliated issuers | (23,612) |
| Foreign currency | 37,144 |
| Net realized gain (loss) | $339,025,221 |
| Change in unrealized appreciation or depreciation | |
| Unaffiliated issuers | $663,866,780 |
| Affiliated issuers | 23,612 |
| Translation of assets and liabilities in foreign currencies | (84,139) |
| Net unrealized gain (loss) | $663,806,253 |
| Net realized and unrealized gain (loss) | $1,002,831,474 |
| Change in net assets from operations | $1,061,556,418 |
See Notes to Financial Statements
Financial Statements
Statements of Changes in Net Assets
These statements describe the increases and/or decreases in net assets resulting from operations, any distributions, and any shareholder transactions.
| | Six months ended | Year ended |
| | 3/31/21
(unaudited) | 9/30/20 |
| Change in net assets | | |
| From operations | | |
| Net investment income (loss) | $58,724,944 | $137,534,398 |
| Net realized gain (loss) | 339,025,221 | 387,515,245 |
| Net unrealized gain (loss) | 663,806,253 | (158,487,426) |
| Change in net assets from operations | $1,061,556,418 | $366,562,217 |
| Total distributions to shareholders | $(469,929,158) | $(242,786,662) |
| Change in net assets from fund share transactions | $290,075,226 | $(168,398,465) |
| Total change in net assets | $881,702,486 | $(44,622,910) |
| Net assets | | |
| At beginning of period | 7,503,635,886 | 7,548,258,796 |
| At end of period | $8,385,338,372 | $7,503,635,886 |
See Notes to Financial Statements
Financial Statements
Financial Highlights
The financial highlights table is intended to help you understand the fund's financial performance for the semiannual period and the past 5 fiscal years. Certain information reflects financial results for a single fund share. The total returns in the table represent the rate that an investor would have earned (or lost) on an investment in the fund share class (assuming reinvestment of all distributions) held for the entire period.
| Class A | Six months
ended | Year ended |
| | 3/31/21
(unaudited) | 9/30/20 | 9/30/19 | 9/30/18 | 9/30/17 | 9/30/16 |
| Net asset value, beginning of period | $19.78 | $19.42 | $19.09 | $19.29 | $18.19 | $17.38 |
| Income (loss) from investment operations |
| Net investment income (loss) (d) | $0.15 | $0.36 | $0.41 | $0.37 | $0.38(c) | $0.35 |
| Net realized and unrealized gain (loss) | 2.61 | 0.63 | 0.78 | 0.53 | 1.36 | 1.41 |
| Total from investment operations | $2.76 | $0.99 | $1.19 | $0.90 | $1.74 | $1.76 |
| Less distributions declared to shareholders |
| From net investment income | $(0.19) | $(0.37) | $(0.39) | $(0.38) | $(0.39) | $(0.44) |
| From net realized gain | (1.05) | (0.26) | (0.47) | (0.72) | (0.25) | (0.51) |
| Total distributions declared to shareholders | $(1.24) | $(0.63) | $(0.86) | $(1.10) | $(0.64) | $(0.95) |
| Net asset value, end of period (x) | $21.30 | $19.78 | $19.42 | $19.09 | $19.29 | $18.19 |
| Total return (%) (r)(s)(t)(x) | 14.29(n) | 5.21 | 6.73 | 4.71 | 9.78(c) | 10.50 |
Ratios (%) (to average net assets)
and Supplemental data: |
| Expenses before expense reductions (f) | 0.72(a) | 0.73 | 0.73 | 0.73 | 0.74(c) | 0.74 |
| Expenses after expense reductions (f) | 0.72(a) | 0.72 | 0.72 | 0.72 | 0.73(c) | 0.73 |
| Net investment income (loss) | 1.45(a) | 1.87 | 2.20 | 1.95 | 2.03(c) | 1.99 |
| Portfolio turnover | 58(n) | 92 | 39 | 33 | 38 | 32 |
| Net assets at end of period (000 omitted) | $5,069,465 | $4,476,559 | $4,666,095 | $4,838,039 | $4,779,558 | $4,733,090 |
See Notes to Financial Statements
Financial Highlights – continued
| Class B | Six months
ended | Year ended |
| | 3/31/21
(unaudited) | 9/30/20 | 9/30/19 | 9/30/18 | 9/30/17 | 9/30/16 |
| Net asset value, beginning of period | $19.82 | $19.45 | $19.12 | $19.31 | $18.21 | $17.40 |
| Income (loss) from investment operations |
| Net investment income (loss) (d) | $0.07 | $0.22 | $0.27 | $0.23 | $0.24(c) | $0.22 |
| Net realized and unrealized gain (loss) | 2.62 | 0.63 | 0.77 | 0.53 | 1.36 | 1.40 |
| Total from investment operations | $2.69 | $0.85 | $1.04 | $0.76 | $1.60 | $1.62 |
| Less distributions declared to shareholders |
| From net investment income | $(0.11) | $(0.22) | $(0.24) | $(0.23) | $(0.25) | $(0.30) |
| From net realized gain | (1.05) | (0.26) | (0.47) | (0.72) | (0.25) | (0.51) |
| Total distributions declared to shareholders | $(1.16) | $(0.48) | $(0.71) | $(0.95) | $(0.50) | $(0.81) |
| Net asset value, end of period (x) | $21.35 | $19.82 | $19.45 | $19.12 | $19.31 | $18.21 |
| Total return (%) (r)(s)(t)(x) | 13.88(n) | 4.44 | 5.90 | 3.94 | 8.94(c) | 9.66 |
Ratios (%) (to average net assets)
and Supplemental data: |
| Expenses before expense reductions (f) | 1.46(a) | 1.48 | 1.48 | 1.48 | 1.49(c) | 1.49 |
| Expenses after expense reductions (f) | 1.46(a) | 1.48 | 1.47 | 1.48 | 1.48(c) | 1.49 |
| Net investment income (loss) | 0.70(a) | 1.12 | 1.44 | 1.19 | 1.29(c) | 1.24 |
| Portfolio turnover | 58(n) | 92 | 39 | 33 | 38 | 32 |
| Net assets at end of period (000 omitted) | $92,888 | $94,906 | $124,982 | $152,200 | $184,889 | $205,806 |
See Notes to Financial Statements
Financial Highlights – continued
| Class C | Six months
ended | Year ended |
| | 3/31/21
(unaudited) | 9/30/20 | 9/30/19 | 9/30/18 | 9/30/17 | 9/30/16 |
| Net asset value, beginning of period | $19.92 | $19.55 | $19.21 | $19.40 | $18.29 | $17.48 |
| Income (loss) from investment operations |
| Net investment income (loss) (d) | $0.07 | $0.22 | $0.27 | $0.23 | $0.24(c) | $0.22 |
| Net realized and unrealized gain (loss) | 2.64 | 0.63 | 0.78 | 0.53 | 1.37 | 1.41 |
| Total from investment operations | $2.71 | $0.85 | $1.05 | $0.76 | $1.61 | $1.63 |
| Less distributions declared to shareholders |
| From net investment income | $(0.11) | $(0.22) | $(0.24) | $(0.23) | $(0.25) | $(0.31) |
| From net realized gain | (1.05) | (0.26) | (0.47) | (0.72) | (0.25) | (0.51) |
| Total distributions declared to shareholders | $(1.16) | $(0.48) | $(0.71) | $(0.95) | $(0.50) | $(0.82) |
| Net asset value, end of period (x) | $21.47 | $19.92 | $19.55 | $19.21 | $19.40 | $18.29 |
| Total return (%) (r)(s)(t)(x) | 13.91(n) | 4.41 | 5.92 | 3.91 | 8.95(c) | 9.62 |
Ratios (%) (to average net assets)
and Supplemental data: |
| Expenses before expense reductions (f) | 1.46(a) | 1.48 | 1.48 | 1.48 | 1.49(c) | 1.49 |
| Expenses after expense reductions (f) | 1.46(a) | 1.48 | 1.48 | 1.48 | 1.49(c) | 1.49 |
| Net investment income (loss) | 0.70(a) | 1.12 | 1.44 | 1.18 | 1.28(c) | 1.24 |
| Portfolio turnover | 58(n) | 92 | 39 | 33 | 38 | 32 |
| Net assets at end of period (000 omitted) | $464,577 | $482,340 | $602,145 | $695,252 | $1,054,574 | $1,102,670 |
See Notes to Financial Statements
Financial Highlights – continued
| Class I | Six months
ended | Year ended |
| | 3/31/21
(unaudited) | 9/30/20 | 9/30/19 | 9/30/18 | 9/30/17 | 9/30/16 |
| Net asset value, beginning of period | $19.77 | $19.41 | $19.08 | $19.28 | $18.18 | $17.38 |
| Income (loss) from investment operations |
| Net investment income (loss) (d) | $0.18 | $0.41 | $0.45 | $0.42 | $0.39(c) | $0.39 |
| Net realized and unrealized gain (loss) | 2.61 | 0.63 | 0.78 | 0.52 | 1.40 | 1.40 |
| Total from investment operations | $2.79 | $1.04 | $1.23 | $0.94 | $1.79 | $1.79 |
| Less distributions declared to shareholders |
| From net investment income | $(0.22) | $(0.42) | $(0.43) | $(0.42) | $(0.44) | $(0.48) |
| From net realized gain | (1.05) | (0.26) | (0.47) | (0.72) | (0.25) | (0.51) |
| Total distributions declared to shareholders | $(1.27) | $(0.68) | $(0.90) | $(1.14) | $(0.69) | $(0.99) |
| Net asset value, end of period (x) | $21.29 | $19.77 | $19.41 | $19.08 | $19.28 | $18.18 |
| Total return (%) (r)(s)(t)(x) | 14.44(n) | 5.47 | 6.99 | 4.97 | 10.06(c) | 10.71 |
Ratios (%) (to average net assets)
and Supplemental data: |
| Expenses before expense reductions (f) | 0.47(a) | 0.48 | 0.48 | 0.48 | 0.49(c) | 0.49 |
| Expenses after expense reductions (f) | N/A | N/A | N/A | N/A | N/A | N/A |
| Net investment income (loss) | 1.70(a) | 2.11 | 2.44 | 2.20 | 2.10(c) | 2.22 |
| Portfolio turnover | 58(n) | 92 | 39 | 33 | 38 | 32 |
| Net assets at end of period (000 omitted) | $937,952 | $848,687 | $663,464 | $662,998 | $593,250 | $329,965 |
See Notes to Financial Statements
Financial Highlights – continued
| Class R1 | Six months
ended | Year ended |
| | 3/31/21
(unaudited) | 9/30/20 | 9/30/19 | 9/30/18 | 9/30/17 | 9/30/16 |
| Net asset value, beginning of period | $19.75 | $19.39 | $19.06 | $19.26 | $18.17 | $17.36 |
| Income (loss) from investment operations |
| Net investment income (loss) (d) | $0.07 | $0.22 | $0.27 | $0.23 | $0.24(c) | $0.22 |
| Net realized and unrealized gain (loss) | 2.62 | 0.63 | 0.77 | 0.52 | 1.35 | 1.41 |
| Total from investment operations | $2.69 | $0.85 | $1.04 | $0.75 | $1.59 | $1.63 |
| Less distributions declared to shareholders |
| From net investment income | $(0.12) | $(0.23) | $(0.24) | $(0.23) | $(0.25) | $(0.31) |
| From net realized gain | (1.05) | (0.26) | (0.47) | (0.72) | (0.25) | (0.51) |
| Total distributions declared to shareholders | $(1.17) | $(0.49) | $(0.71) | $(0.95) | $(0.50) | $(0.82) |
| Net asset value, end of period (x) | $21.27 | $19.75 | $19.39 | $19.06 | $19.26 | $18.17 |
| Total return (%) (r)(s)(t)(x) | 13.89(n) | 4.42 | 5.93 | 3.93 | 8.90(c) | 9.68 |
Ratios (%) (to average net assets)
and Supplemental data: |
| Expenses before expense reductions (f) | 1.46(a) | 1.48 | 1.48 | 1.48 | 1.49(c) | 1.49 |
| Expenses after expense reductions (f) | N/A | N/A | N/A | N/A | N/A | N/A |
| Net investment income (loss) | 0.70(a) | 1.12 | 1.44 | 1.19 | 1.28(c) | 1.24 |
| Portfolio turnover | 58(n) | 92 | 39 | 33 | 38 | 32 |
| Net assets at end of period (000 omitted) | $10,180 | $9,119 | $10,508 | $12,068 | $12,517 | $14,031 |
See Notes to Financial Statements
Financial Highlights – continued
| Class R2 | Six months
ended | Year ended |
| | 3/31/21
(unaudited) | 9/30/20 | 9/30/19 | 9/30/18 | 9/30/17 | 9/30/16 |
| Net asset value, beginning of period | $19.85 | $19.48 | $19.15 | $19.34 | $18.24 | $17.43 |
| Income (loss) from investment operations |
| Net investment income (loss) (d) | $0.12 | $0.31 | $0.36 | $0.32 | $0.33(c) | $0.31 |
| Net realized and unrealized gain (loss) | 2.63 | 0.64 | 0.78 | 0.54 | 1.36 | 1.40 |
| Total from investment operations | $2.75 | $0.95 | $1.14 | $0.86 | $1.69 | $1.71 |
| Less distributions declared to shareholders |
| From net investment income | $(0.17) | $(0.32) | $(0.34) | $(0.33) | $(0.34) | $(0.39) |
| From net realized gain | (1.05) | (0.26) | (0.47) | (0.72) | (0.25) | (0.51) |
| Total distributions declared to shareholders | $(1.22) | $(0.58) | $(0.81) | $(1.05) | $(0.59) | $(0.90) |
| Net asset value, end of period (x) | $21.38 | $19.85 | $19.48 | $19.15 | $19.34 | $18.24 |
| Total return (%) (r)(s)(t)(x) | 14.15(n) | 4.97 | 6.43 | 4.48 | 9.48(c) | 10.19 |
Ratios (%) (to average net assets)
and Supplemental data: |
| Expenses before expense reductions (f) | 0.97(a) | 0.98 | 0.98 | 0.98 | 0.99(c) | 0.99 |
| Expenses after expense reductions (f) | N/A | N/A | 0.98 | 0.98 | 0.99(c) | N/A |
| Net investment income (loss) | 1.20(a) | 1.62 | 1.94 | 1.69 | 1.76(c) | 1.73 |
| Portfolio turnover | 58(n) | 92 | 39 | 33 | 38 | 32 |
| Net assets at end of period (000 omitted) | $128,288 | $125,160 | $165,893 | $194,859 | $229,263 | $205,848 |
See Notes to Financial Statements
Financial Highlights – continued
| Class R3 | Six months
ended | Year ended |
| | 3/31/21
(unaudited) | 9/30/20 | 9/30/19 | 9/30/18 | 9/30/17 | 9/30/16 |
| Net asset value, beginning of period | $19.79 | $19.43 | $19.10 | $19.30 | $18.20 | $17.39 |
| Income (loss) from investment operations |
| Net investment income (loss) (d) | $0.15 | $0.36 | $0.41 | $0.37 | $0.37(c) | $0.35 |
| Net realized and unrealized gain (loss) | 2.62 | 0.63 | 0.78 | 0.53 | 1.37 | 1.41 |
| Total from investment operations | $2.77 | $0.99 | $1.19 | $0.90 | $1.74 | $1.76 |
| Less distributions declared to shareholders |
| From net investment income | $(0.19) | $(0.37) | $(0.39) | $(0.38) | $(0.39) | $(0.44) |
| From net realized gain | (1.05) | (0.26) | (0.47) | (0.72) | (0.25) | (0.51) |
| Total distributions declared to shareholders | $(1.24) | $(0.63) | $(0.86) | $(1.10) | $(0.64) | $(0.95) |
| Net asset value, end of period (x) | $21.32 | $19.79 | $19.43 | $19.10 | $19.30 | $18.20 |
| Total return (%) (r)(s)(t)(x) | 14.33(n) | 5.20 | 6.71 | 4.70 | 9.77(c) | 10.48 |
Ratios (%) (to average net assets)
and Supplemental data: |
| Expenses before expense reductions (f) | 0.72(a) | 0.73 | 0.73 | 0.73 | 0.74(c) | 0.74 |
| Expenses after expense reductions (f) | N/A | N/A | N/A | 0.73 | N/A | N/A |
| Net investment income (loss) | 1.45(a) | 1.86 | 2.19 | 1.94 | 2.01(c) | 1.99 |
| Portfolio turnover | 58(n) | 92 | 39 | 33 | 38 | 32 |
| Net assets at end of period (000 omitted) | $301,007 | $284,813 | $290,210 | $325,625 | $331,072 | $297,313 |
See Notes to Financial Statements
Financial Highlights – continued
| Class R4 | Six months
ended | Year ended |
| | 3/31/21
(unaudited) | 9/30/20 | 9/30/19 | 9/30/18 | 9/30/17 | 9/30/16 |
| Net asset value, beginning of period | $19.80 | $19.44 | $19.11 | $19.31 | $18.20 | $17.40 |
| Income (loss) from investment operations |
| Net investment income (loss) (d) | $0.18 | $0.41 | $0.46 | $0.42 | $0.43(c) | $0.39 |
| Net realized and unrealized gain (loss) | 2.61 | 0.63 | 0.77 | 0.52 | 1.37 | 1.40 |
| Total from investment operations | $2.79 | $1.04 | $1.23 | $0.94 | $1.80 | $1.79 |
| Less distributions declared to shareholders |
| From net investment income | $(0.22) | $(0.42) | $(0.43) | $(0.42) | $(0.44) | $(0.48) |
| From net realized gain | (1.05) | (0.26) | (0.47) | (0.72) | (0.25) | (0.51) |
| Total distributions declared to shareholders | $(1.27) | $(0.68) | $(0.90) | $(1.14) | $(0.69) | $(0.99) |
| Net asset value, end of period (x) | $21.32 | $19.80 | $19.44 | $19.11 | $19.31 | $18.20 |
| Total return (%) (r)(s)(t)(x) | 14.41(n) | 5.47 | 6.98 | 4.96 | 10.10(c) | 10.69 |
Ratios (%) (to average net assets)
and Supplemental data: |
| Expenses before expense reductions (f) | 0.47(a) | 0.48 | 0.48 | 0.48 | 0.49(c) | 0.49 |
| Expenses after expense reductions (f) | N/A | N/A | N/A | N/A | N/A | N/A |
| Net investment income (loss) | 1.70(a) | 2.11 | 2.45 | 2.19 | 2.29(c) | 2.23 |
| Portfolio turnover | 58(n) | 92 | 39 | 33 | 38 | 32 |
| Net assets at end of period (000 omitted) | $269,538 | $251,641 | $236,165 | $249,073 | $291,662 | $297,677 |
See Notes to Financial Statements
Financial Highlights – continued
| Class R6 | Six months
ended | Year ended |
| | 3/31/21
(unaudited) | 9/30/20 | 9/30/19 | 9/30/18 | 9/30/17 | 9/30/16 |
| Net asset value, beginning of period | $19.77 | $19.42 | $19.09 | $19.29 | $18.19 | $17.38 |
| Income (loss) from investment operations |
| Net investment income (loss) (d) | $0.18 | $0.42 | $0.47 | $0.44 | $0.42(c) | $0.41 |
| Net realized and unrealized gain (loss) | 2.62 | 0.63 | 0.78 | 0.52 | 1.38 | 1.41 |
| Total from investment operations | $2.80 | $1.05 | $1.25 | $0.96 | $1.80 | $1.82 |
| Less distributions declared to shareholders |
| From net investment income | $(0.22) | $(0.44) | $(0.45) | $(0.44) | $(0.45) | $(0.50) |
| From net realized gain | (1.05) | (0.26) | (0.47) | (0.72) | (0.25) | (0.51) |
| Total distributions declared to shareholders | $(1.27) | $(0.70) | $(0.92) | $(1.16) | $(0.70) | $(1.01) |
| Net asset value, end of period (x) | $21.30 | $19.77 | $19.42 | $19.09 | $19.29 | $18.19 |
| Total return (%) (r)(s)(t)(x) | 14.53(n) | 5.50 | 7.07 | 5.06 | 10.14(c) | 10.86 |
Ratios (%) (to average net assets)
and Supplemental data: |
| Expenses before expense reductions (f) | 0.39(a) | 0.40 | 0.40 | 0.40 | 0.40(c) | 0.41 |
| Expenses after expense reductions (f) | N/A | N/A | N/A | N/A | N/A | N/A |
| Net investment income (loss) | 1.78(a) | 2.19 | 2.52 | 2.29 | 2.27(c) | 2.31 |
| Portfolio turnover | 58(n) | 92 | 39 | 33 | 38 | 32 |
| Net assets at end of period (000 omitted) | $1,071,621 | $895,481 | $753,666 | $632,943 | $389,609 | $169,348 |
See Notes to Financial Statements
Financial Highlights – continued
| Class 529A | Six months
ended | Year ended |
| | 3/31/21
(unaudited) | 9/30/20 | 9/30/19 | 9/30/18 | 9/30/17 | 9/30/16 |
| Net asset value, beginning of period | $19.72 | $19.36 | $19.03 | $19.24 | $18.14 | $17.34 |
| Income (loss) from investment operations |
| Net investment income (loss) (d) | $0.15 | $0.35 | $0.40 | $0.36 | $0.37(c) | $0.34 |
| Net realized and unrealized gain (loss) | 2.60 | 0.64 | 0.78 | 0.52 | 1.36 | 1.40 |
| Total from investment operations | $2.75 | $0.99 | $1.18 | $0.88 | $1.73 | $1.74 |
| Less distributions declared to shareholders |
| From net investment income | $(0.19) | $(0.37) | $(0.38) | $(0.37) | $(0.38) | $(0.43) |
| From net realized gain | (1.05) | (0.26) | (0.47) | (0.72) | (0.25) | (0.51) |
| Total distributions declared to shareholders | $(1.24) | $(0.63) | $(0.85) | $(1.09) | $(0.63) | $(0.94) |
| Net asset value, end of period (x) | $21.23 | $19.72 | $19.36 | $19.03 | $19.24 | $18.14 |
| Total return (%) (r)(s)(t)(x) | 14.27(n) | 5.19 | 6.71 | 4.63 | 9.77(c) | 10.42 |
Ratios (%) (to average net assets)
and Supplemental data: |
| Expenses before expense reductions (f) | 0.77(a) | 0.78 | 0.78 | 0.79 | 0.84(c) | 0.84 |
| Expenses after expense reductions (f) | 0.74(a) | 0.76 | 0.76 | 0.77 | 0.77(c) | 0.77 |
| Net investment income (loss) | 1.43(a) | 1.83 | 2.16 | 1.91 | 1.97(c) | 1.95 |
| Portfolio turnover | 58(n) | 92 | 39 | 33 | 38 | 32 |
| Net assets at end of period (000 omitted) | $33,087 | $27,080 | $26,158 | $24,945 | $23,275 | $21,204 |
See Notes to Financial Statements
Financial Highlights – continued
| Class 529B | Six months
ended | Year ended |
| | 3/31/21
(unaudited) | 9/30/20 | 9/30/19 | 9/30/18 | 9/30/17 | 9/30/16 |
| Net asset value, beginning of period | $19.81 | $19.45 | $19.11 | $19.31 | $18.21 | $17.40 |
| Income (loss) from investment operations |
| Net investment income (loss) (d) | $0.15 | $0.36 | $0.30 | $0.22 | $0.23(c) | $0.21 |
| Net realized and unrealized gain (loss) | 2.62 | 0.64 | 0.79 | 0.52 | 1.36 | 1.41 |
| Total from investment operations | $2.77 | $1.00 | $1.09 | $0.74 | $1.59 | $1.62 |
| Less distributions declared to shareholders |
| From net investment income | $(0.19) | $(0.38) | $(0.28) | $(0.22) | $(0.24) | $(0.30) |
| From net realized gain | (1.05) | (0.26) | (0.47) | (0.72) | (0.25) | (0.51) |
| Total distributions declared to shareholders | $(1.24) | $(0.64) | $(0.75) | $(0.94) | $(0.49) | $(0.81) |
| Net asset value, end of period (x) | $21.34 | $19.81 | $19.45 | $19.11 | $19.31 | $18.21 |
| Total return (%) (r)(s)(t)(x) | 14.29(n) | 5.21 | 6.16 | 3.86 | 8.88(c) | 9.60 |
Ratios (%) (to average net assets)
and Supplemental data: |
| Expenses before expense reductions (f) | 0.75(a) | 0.71 | 1.29 | 1.54 | 1.59(c) | 1.59 |
| Expenses after expense reductions (f) | N/A | N/A | N/A | 1.53 | 1.53(c) | 1.54 |
| Net investment income (loss) | 1.41(a) | 1.88 | 1.63 | 1.14 | 1.23(c) | 1.19 |
| Portfolio turnover | 58(n) | 92 | 39 | 33 | 38 | 32 |
| Net assets at end of period (000 omitted) | $743 | $753 | $981 | $1,228 | $1,483 | $1,580 |
See Notes to Financial Statements
Financial Highlights – continued
| Class 529C | Six months
ended | Year ended |
| | 3/31/21
(unaudited) | 9/30/20 | 9/30/19 | 9/30/18 | 9/30/17 | 9/30/16 |
| Net asset value, beginning of period | $19.90 | $19.53 | $19.20 | $19.39 | $18.28 | $17.47 |
| Income (loss) from investment operations |
| Net investment income (loss) (d) | $0.07 | $0.21 | $0.26 | $0.22 | $0.23(c) | $0.21 |
| Net realized and unrealized gain (loss) | 2.63 | 0.64 | 0.77 | 0.53 | 1.37 | 1.41 |
| Total from investment operations | $2.70 | $0.85 | $1.03 | $0.75 | $1.60 | $1.62 |
| Less distributions declared to shareholders |
| From net investment income | $(0.10) | $(0.22) | $(0.23) | $(0.22) | $(0.24) | $(0.30) |
| From net realized gain | (1.05) | (0.26) | (0.47) | (0.72) | (0.25) | (0.51) |
| Total distributions declared to shareholders | $(1.15) | $(0.48) | $(0.70) | $(0.94) | $(0.49) | $(0.81) |
| Net asset value, end of period (x) | $21.45 | $19.90 | $19.53 | $19.20 | $19.39 | $18.28 |
| Total return (%) (r)(s)(t)(x) | 13.88(n) | 4.38 | 5.82 | 3.89 | 8.91(c) | 9.57 |
Ratios (%) (to average net assets)
and Supplemental data: |
| Expenses before expense reductions (f) | 1.51(a) | 1.53 | 1.53 | 1.54 | 1.59(c) | 1.59 |
| Expenses after expense reductions (f) | 1.51(a) | 1.52 | 1.53 | 1.53 | 1.53(c) | 1.54 |
| Net investment income (loss) | 0.66(a) | 1.07 | 1.39 | 1.14 | 1.22(c) | 1.18 |
| Portfolio turnover | 58(n) | 92 | 39 | 33 | 38 | 32 |
| Net assets at end of period (000 omitted) | $5,991 | $7,096 | $7,994 | $9,088 | $11,223 | $10,428 |
| (a) | Annualized. |
| (c) | Amount reflects a one-time reimbursement of expenses by the custodian (or former custodian) without which net investment income and performance would be lower and expenses would be higher. |
| (d) | Per share data is based on average shares outstanding. |
| (f) | Ratios do not reflect reductions from fees paid indirectly, if applicable. |
| (n) | Not annualized. |
| (r) | Certain expenses have been reduced without which performance would have been lower. |
| (s) | From time to time the fund may receive proceeds from litigation settlements, without which performance would be lower. |
| (t) | Total returns do not include any applicable sales charges. |
| (x) | The net asset values and total returns have been calculated on net assets which include adjustments made in accordance with U.S. generally accepted accounting principles required at period end for financial reporting purposes. |
See Notes to Financial Statements
Notes to Financial Statements
(unaudited)
(1) Business and Organization
MFS Total Return Fund (the fund) is a diversified series of MFS Series Trust V (the trust). The trust is organized as a Massachusetts business trust and is registered under the Investment Company Act of 1940, as amended, as an open-end management investment company.
The fund is an investment company and accordingly follows the investment company accounting and reporting guidance of the Financial Accounting Standards Board (FASB) Accounting Standards Codification Topic 946 Financial Services - Investment Companies.
(2) Significant Accounting Policies
General — The preparation of financial statements in conformity with U.S. generally accepted accounting principles requires management to make estimates and assumptions that affect the reported amounts of assets and liabilities, and disclosure of contingent assets and liabilities at the date of the financial statements and the reported amounts of increases and decreases in net assets from operations during the reporting period. Actual results could differ from those estimates. In the preparation of these financial statements, management has evaluated subsequent events occurring after the date of the fund’s Statement of Assets and Liabilities through the date that the financial statements were issued.
In March 2020, the FASB issued Accounting Standards Update 2020-04, Reference Rate Reform (Topic 848) – Facilitation of the Effects of Reference Rate Reform on Financial Reporting (“ASU 2020-04”), which provides optional, temporary relief with respect to the financial reporting of contracts subject to certain types of modifications due to the planned discontinuation of certain tenors of the London Interbank Offered Rate (LIBOR) and other IBOR-based reference rates as of the end of 2021. The temporary relief provided by ASU 2020-04 is effective for certain reference rate-related contract modifications that occur during the period from March 12, 2020 through December 31, 2022. Management is evaluating the impact of ASU 2020-04 on the fund's investments, derivatives, debt and other contracts that will undergo reference rate-related modifications as a result of the reference rate reform.
Balance Sheet Offsetting — The fund's accounting policy with respect to balance sheet offsetting is that, absent an event of default by the counterparty or a termination of the agreement, the International Swaps and Derivatives Association (ISDA) Master Agreement, or similar agreement, does not result in an offset of reported amounts of financial assets and financial liabilities in the Statement of Assets and Liabilities across transactions between the fund and the applicable counterparty. The fund's right to setoff may be restricted or prohibited by the bankruptcy or insolvency laws of the particular jurisdiction to which a specific master netting agreement counterparty is subject. Balance sheet offsetting disclosures, to the extent applicable to the fund, have been included in the fund’s Significant Accounting Policies note under the captions for each of the fund’s in-scope financial instruments and transactions.
Investment Valuations — Equity securities, including restricted equity securities, are generally valued at the last sale or official closing price on their primary market or exchange as provided by a third-party pricing service. Equity securities, for which there were no sales reported that day, are generally valued at the last quoted daily bid
Notes to Financial Statements (unaudited) - continued
quotation on their primary market or exchange as provided by a third-party pricing service. Debt instruments and floating rate loans, including restricted debt instruments, are generally valued at an evaluated or composite bid as provided by a third-party pricing service. Short-term instruments with a maturity at issuance of 60 days or less may be valued at amortized cost, which approximates market value. Open-end investment companies are generally valued at net asset value per share. Securities and other assets generally valued on the basis of information from a third-party pricing service may also be valued at a broker/dealer bid quotation. In determining values, third-party pricing services can utilize both transaction data and market information such as yield, quality, coupon rate, maturity, type of issue, trading characteristics, and other market data. The values of foreign securities and other assets and liabilities expressed in foreign currencies are converted to U.S. dollars using the mean of bid and asked prices for rates provided by a third-party pricing service.
The Board of Trustees has delegated primary responsibility for determining or causing to be determined the value of the fund’s investments (including any fair valuation) to the adviser pursuant to valuation policies and procedures approved by the Board. If the adviser determines that reliable market quotations are not readily available, investments are valued at fair value as determined in good faith by the adviser in accordance with such procedures under the oversight of the Board of Trustees. Under the fund’s valuation policies and procedures, market quotations are not considered to be readily available for most types of debt instruments and floating rate loans and many types of derivatives. These investments are generally valued at fair value based on information from third-party pricing services. In addition, investments may be valued at fair value if the adviser determines that an investment’s value has been materially affected by events occurring after the close of the exchange or market on which the investment is principally traded (such as foreign exchange or market) and prior to the determination of the fund’s net asset value, or after the halt of trading of a specific security where trading does not resume prior to the close of the exchange or market on which the security is principally traded. Events that occur after foreign markets close (such as developments in foreign markets and significant movements in the U.S. markets) and prior to the determination of the fund’s net asset value may be deemed to have a material effect on the value of securities traded in foreign markets. Accordingly, the fund’s foreign equity securities may often be valued at fair value. The adviser generally relies on third-party pricing services or other information (such as the correlation with price movements of similar securities in the same or other markets; the type, cost and investment characteristics of the security; the business and financial condition of the issuer; and trading and other market data) to assist in determining whether to fair value and at what value to fair value an investment. The value of an investment for purposes of calculating the fund’s net asset value can differ depending on the source and method used to determine value. When fair valuation is used, the value of an investment used to determine the fund’s net asset value may differ from quoted or published prices for the same investment. There can be no assurance that the fund could obtain the fair value assigned to an investment if it were to sell the investment at the same time at which the fund determines its net asset value per share.
Various inputs are used in determining the value of the fund's assets or liabilities. These inputs are categorized into three broad levels. In certain cases, the inputs used to measure fair value may fall into different levels of the fair value hierarchy. In such cases, an investment's level within the fair value hierarchy is based on the lowest level of input that is significant to the fair value measurement. The fund's assessment of the
Notes to Financial Statements (unaudited) - continued
significance of a particular input to the fair value measurement in its entirety requires judgment, and considers factors specific to the investment. Level 1 includes unadjusted quoted prices in active markets for identical assets or liabilities. Level 2 includes other significant observable market-based inputs (including quoted prices for similar securities, interest rates, prepayment speed, and credit risk). Level 3 includes unobservable inputs, which may include the adviser's own assumptions in determining the fair value of investments. The following is a summary of the levels used as of March 31, 2021 in valuing the fund's assets or liabilities:
| Financial Instruments | Level 1 | Level 2 | Level 3 | Total |
| Equity Securities: | | | | |
| United States | $4,745,916,570 | $18,994,068 | $— | $4,764,910,638 |
| Switzerland | 77,864,421 | — | — | 77,864,421 |
| Taiwan | 50,726,862 | — | — | 50,726,862 |
| United Kingdom | 50,187,034 | — | — | 50,187,034 |
| Netherlands | 42,043,013 | — | — | 42,043,013 |
| France | 27,539,282 | — | — | 27,539,282 |
| South Korea | — | 24,013,797 | — | 24,013,797 |
| Ireland | 19,689,824 | — | — | 19,689,824 |
| Germany | 14,890,662 | — | — | 14,890,662 |
| U.S. Treasury Bonds & U.S. Government Agencies & Equivalents | — | 742,693,974 | — | 742,693,974 |
| Non - U.S. Sovereign Debt | — | 10,499,298 | — | 10,499,298 |
| Municipal Bonds | — | 24,519,395 | — | 24,519,395 |
| U.S. Corporate Bonds | — | 905,357,429 | — | 905,357,429 |
| Residential Mortgage-Backed Securities | — | 980,136,143 | — | 980,136,143 |
| Commercial Mortgage-Backed Securities | — | 195,645,088 | — | 195,645,088 |
| Asset-Backed Securities (including CDOs) | — | 215,956,432 | — | 215,956,432 |
| Foreign Bonds | — | 199,190,692 | — | 199,190,692 |
| Mutual Funds | 470,239,593 | — | — | 470,239,593 |
| Total | $5,499,097,261 | $3,317,006,316 | $— | $8,816,103,577 |
For further information regarding security characteristics, see the Portfolio of Investments.
Foreign Currency Translation — Purchases and sales of foreign investments, income, and expenses are converted into U.S. dollars based upon currency exchange rates prevailing on the respective dates of such transactions or on the reporting date for foreign denominated receivables and payables. Gains and losses attributable to foreign currency exchange rates on sales of securities are recorded for financial statement purposes as net realized gains and losses on investments. Gains and losses attributable to foreign exchange rate movements on receivables, payables, income and expenses are recorded for financial statement purposes as foreign currency transaction gains and losses. That portion of both realized and unrealized gains and losses on investments that results from fluctuations in foreign currency exchange rates is not separately disclosed.
Notes to Financial Statements (unaudited) - continued
Security Loans — Under its Securities Lending Agency Agreement with the fund, JPMorgan Chase and Co., as lending agent, loans the securities of the fund to certain qualified institutions (the “Borrowers”) approved by the fund. Security loans can be terminated at the discretion of either the lending agent or the fund and the related securities must be returned within the earlier of the standard trade settlement period for such securities or within three business days. The loans are collateralized by cash and/or U.S. Treasury and federal agency obligations in an amount typically at least equal to the market value of the securities loaned. On loans collateralized by cash, the cash collateral is invested in a money market fund. The market value of the loaned securities is determined at the close of business of the fund and any additional required collateral is delivered to the fund on the next business day. The lending agent provides the fund with indemnification against Borrower default. In the event of Borrower default, the lending agent will, for the benefit of the fund, either purchase securities identical to those loaned or, when such purchase is commercially impracticable, pay the fund the market value of the loaned securities. In return, the lending agent assumes the fund's rights to the related collateral. If the collateral value is less than the cost to purchase identical securities, the lending agent is responsible for the shortfall, but only to the extent that such shortfall is not due to a decline in collateral value resulting from collateral reinvestment for which the fund bears the risk of loss. A portion of the income generated upon investment of the collateral is remitted to the Borrowers, and the remainder is allocated between the fund and the lending agent. On loans collateralized by U.S. Treasury and/or federal agency obligations, a fee is received from the Borrower, and is allocated between the fund and the lending agent. Income from securities lending is separately reported in the Statement of Operations. The dividend and interest income earned on the securities loaned is accounted for in the same manner as other dividend and interest income. At March 31, 2021, there were no securities on loan or collateral outstanding.
Indemnifications — Under the fund's organizational documents, its officers and Trustees may be indemnified against certain liabilities and expenses arising out of the performance of their duties to the fund. Additionally, in the normal course of business, the fund enters into agreements with service providers that may contain indemnification clauses. The fund's maximum exposure under these agreements is unknown as this would involve future claims that may be made against the fund that have not yet occurred.
Investment Transactions and Income — Investment transactions are recorded on the trade date. Some securities may be purchased or sold on an extended settlement basis, which means that the receipt or delivery of the securities by the fund and related payments occur at a future date, usually beyond the customary settlement period.
Interest income is recorded on the accrual basis. All premium and discount is amortized or accreted for financial statement purposes in accordance with U.S. generally accepted accounting principles. Dividends received in cash are recorded on the ex-dividend date. Certain dividends from foreign securities will be recorded when the fund is informed of the dividend if such information is obtained subsequent to the ex-dividend date. Dividend and interest payments received in additional securities are recorded on the ex-dividend or ex-interest date in an amount equal to the value of the security on such date.
Notes to Financial Statements (unaudited) - continued
The fund may receive proceeds from litigation settlements. Any proceeds received from litigation involving portfolio holdings are reflected in the Statement of Operations in realized gain/loss if the security has been disposed of by the fund or in unrealized gain/loss if the security is still held by the fund. Any other proceeds from litigation not related to portfolio holdings are reflected as other income in the Statement of Operations.
The fund invests a significant portion of its assets in asset-backed and/or mortgage-backed securities. For these securities, the value of the debt instrument also depends on the credit quality and adequacy of the underlying assets or collateral as well as whether there is a security interest in the underlying assets or collateral. Enforcing rights, if any, against the underlying assets or collateral may be difficult. U.S. Government securities not supported as to the payment of principal or interest by the U.S. Treasury, such as those issued by Fannie Mae, Freddie Mac, and the Federal Home Loan Banks, are subject to greater credit risk than are U.S. Government securities supported by the U.S. Treasury, such as those issued by Ginnie Mae.
The fund may purchase or sell mortgage-backed securities on a “To Be Announced” (TBA) basis. A TBA transaction is subject to extended settlement and typically does not designate the actual security to be delivered, but instead includes an approximate principal amount. The price of the TBA security and the date that it will be settled are fixed at the time the transaction is negotiated. The value of the security varies with market fluctuations and no interest accrues to the fund until settlement takes place. TBA purchase and sale commitments are held at carrying amount, which approximates fair value and are categorized as level 2 within the fair value hierarchy and included in TBA purchase and TBA sale commitments in the Statement of Assets and Liabilities. Losses may arise as a result of changes in the value of the TBA investment prior to settlement date or due to counterparty non-performance. At the time that it enters into a TBA transaction, the fund is required to have sufficient cash and/or liquid securities to cover its commitments.
The fund may also enter into mortgage dollar rolls, typically TBA dollar rolls, in which the fund sells TBA mortgage-backed securities to financial institutions and simultaneously agrees to repurchase similar (same issuer, type and coupon) securities at a later date at an agreed-upon price. During the period between the sale and repurchase, the fund will not be entitled to receive interest and principal payments on the securities sold. The fund accounts for dollar roll transactions as purchases and sales and realizes gains and losses on these transactions. Dollar roll transactions involve the risk that the market value of the securities that the fund is required to purchase may decline below the agreed upon repurchase price of those securities.
To mitigate the counterparty credit risk on TBA transactions, mortgage dollar rolls, and other types of forward settling mortgage-backed and asset-backed security transactions, the fund whenever possible enters into a Master Securities Forward Transaction Agreement (“MSFTA”) on a bilateral basis with each of the counterparties with whom it undertakes a significant volume of transactions. The MSFTA gives each party to the agreement the right to terminate all transactions traded under such agreement if there is a specified deterioration in the credit quality of the other party. Upon an event of default or a termination of the MSFTA, the non-defaulting party has the right to close out all transactions traded under such agreement and to net amounts owed under each transaction to one net amount payable by one party to the other.
Notes to Financial Statements (unaudited) - continued
This right to close out and net payments across all transactions traded under the MSFTA could result in a reduction of the fund's credit risk to such counterparty equal to any amounts payable by the fund under the applicable transactions, if any.
For mortgage-backed and asset-backed securities traded under a MSFTA, the collateral and margining requirements are contract specific. Collateral amounts across all transactions traded under such agreement are netted and an amount is posted from one party to the other to collateralize such obligations. Cash that has been pledged to cover the fund's collateral or margin obligations under a MSFTA, if any, will be reported separately on the Statement of Assets and Liabilities as restricted cash. Securities pledged as collateral or margin for the same purpose, if any, are noted in the Portfolio of Investments.
Fees Paid Indirectly — The fund's custody fee may be reduced by a credit earned under an arrangement that measures the value of U.S. dollars deposited with the custodian by the fund. The amount of the credit, for the six months ended March 31, 2021, is shown as a reduction of total expenses in the Statement of Operations.
Tax Matters and Distributions — The fund intends to qualify as a regulated investment company, as defined under Subchapter M of the Internal Revenue Code, and to distribute all of its taxable income, including realized capital gains. As a result, no provision for federal income tax is required. The fund’s federal tax returns, when filed, will remain subject to examination by the Internal Revenue Service for a three year period. Management has analyzed the fund’s tax positions taken on federal and state tax returns for all open tax years and does not believe that there are any uncertain tax positions that require recognition of a tax liability. Foreign taxes, if any, have been accrued by the fund in the accompanying financial statements in accordance with the applicable foreign tax law. Foreign income taxes may be withheld by certain countries in which the fund invests. Additionally, capital gains realized by the fund on securities issued in or by certain foreign countries may be subject to capital gains tax imposed by those countries.
Distributions to shareholders are recorded on the ex-dividend date. Income and capital gain distributions are determined in accordance with income tax regulations, which may differ from U.S. generally accepted accounting principles. Certain capital accounts in the financial statements are periodically adjusted for permanent differences in order to reflect their tax character. These adjustments have no impact on net assets or net asset value per share. Temporary differences which arise from recognizing certain items of income, expense, gain or loss in different periods for financial statement and tax purposes will reverse at some time in the future.
Book/tax differences primarily relate to amortization and accretion of debt securities, wash sale loss deferrals, treating a portion of the proceeds from redemptions as a distribution for tax purposes, and partnership adjustments.
Notes to Financial Statements (unaudited) - continued
The tax character of distributions made during the current period will be determined at fiscal year end. The tax character of distributions declared to shareholders for the last fiscal year is as follows:
| | Year ended
9/30/20 |
| Ordinary income (including any short-term capital gains) | $142,526,798 |
| Long-term capital gains | 100,259,864 |
| Total distributions | $242,786,662 |
The federal tax cost and the tax basis components of distributable earnings were as follows:
| As of 3/31/21 | |
| Cost of investments | $6,555,389,620 |
| Gross appreciation | 2,313,332,691 |
| Gross depreciation | (52,618,734) |
| Net unrealized appreciation (depreciation) | $2,260,713,957 |
| As of 9/30/20 | |
| Undistributed ordinary income | 19,871,793 |
| Undistributed long-term capital gain | 347,077,815 |
| Other temporary differences | (10,076,626) |
| Net unrealized appreciation (depreciation) | 1,589,664,007 |
The aggregate cost above includes prior fiscal year end tax adjustments, if applicable.
Multiple Classes of Shares of Beneficial Interest — The fund offers multiple classes of shares, which differ in their respective distribution, service, and program manager fees. The fund's income, realized and unrealized gain (loss), and common expenses are allocated to shareholders based on the daily net assets of each class. Dividends are declared separately for each class. Differences in per share dividend rates are generally due to differences in separate class expenses. Class B and Class 529B shares will convert to Class A and Class 529A shares, respectively, approximately eight years after purchase. In addition, Class C and Class 529C shares will convert to Class A and Class
Notes to Financial Statements (unaudited) - continued
529A shares, respectively, approximately eight years after purchase. The fund’s distributions declared to shareholders as reported in the Statements of Changes in Net Assets are presented by class as follows:
| | Six months
ended
3/31/21 | | Year
ended
9/30/20 |
| Class A | $280,851,115 | | $148,579,563 |
| Class B | 5,259,851 | | 2,841,336 |
| Class C | 27,196,881 | | 14,004,622 |
| Class I | 54,124,915 | | 24,450,966 |
| Class R1 | 535,307 | | 255,049 |
| Class R2 | 7,261,680 | | 4,494,387 |
| Class R3 | 17,410,125 | | 9,409,536 |
| Class R4 | 15,165,634 | | 8,493,195 |
| Class R6 | 59,958,910 | | 29,176,726 |
| Class 529A | 1,731,255 | | 861,670 |
| Class 529B | 45,070 | | 29,330 |
| Class 529C | 388,415 | | 190,282 |
| Total | $469,929,158 | | $242,786,662 |
(3) Transactions with Affiliates
Investment Adviser — The fund has an investment advisory agreement with MFS to provide overall investment management and related administrative services and facilities to the fund. The management fee is computed daily and paid monthly at the following annual rates based on the fund's average daily net assets:
| Up to $6.3 billion | 0.35% |
| In excess of $6.3 billion | 0.34% |
The management fee incurred for the six months ended March 31, 2021 was equivalent to an annual effective rate of 0.35% of the fund's average daily net assets.
Distributor — MFS Fund Distributors, Inc. (MFD), a wholly-owned subsidiary of MFS, as distributor, received $232,554 and $4,784 for the six months ended March 31, 2021, as its portion of the initial sales charge on sales of Class A and Class 529A shares of the fund, respectively.
The Board of Trustees has adopted a distribution plan for certain share classes pursuant to Rule 12b-1 of the Investment Company Act of 1940.
The fund's distribution plan provides that the fund will pay MFD for services provided by MFD and financial intermediaries in connection with the distribution and servicing of certain share classes. One component of the plan is a distribution fee paid to MFD and another component of the plan is a service fee paid to MFD. MFD may subsequently pay all, or a portion, of the distribution and/or service fees to financial intermediaries.
Notes to Financial Statements (unaudited) - continued
Distribution Plan Fee Table:
| | Distribution
Fee Rate (d) | Service
Fee Rate (d) | Total
Distribution
Plan (d) | Annual
Effective
Rate (e) | Distribution
and Service
Fee |
| Class A | — | 0.25% | 0.25% | 0.25% | $ 5,991,346 |
| Class B | 0.75% | 0.25% | 1.00% | 1.00% | 474,475 |
| Class C | 0.75% | 0.25% | 1.00% | 1.00% | 2,386,529 |
| Class R1 | 0.75% | 0.25% | 1.00% | 1.00% | 48,481 |
| Class R2 | 0.25% | 0.25% | 0.50% | 0.50% | 315,105 |
| Class R3 | — | 0.25% | 0.25% | 0.25% | 366,284 |
| Class 529A | — | 0.25% | 0.25% | 0.23% | 37,742 |
| Class 529B | 0.75% | 0.25% | 1.00% | 0.24% | 899 |
| Class 529C | 0.75% | 0.25% | 1.00% | 0.99% | 32,619 |
| Total Distribution and Service Fees | | | | | $9,653,480 |
| (d) | In accordance with the distribution plan for certain classes, the fund pays distribution and/or service fees equal to these annual percentage rates of each class’s average daily net assets. The distribution and service fee rates disclosed by class represent the current rates in effect at the end of the reporting period. Any rate changes, if applicable, are detailed below. |
| (e) | The annual effective rates represent actual fees incurred under the distribution plan for the six months ended March 31, 2021 based on each class's average daily net assets. MFD has voluntarily agreed to rebate a portion of each class's 0.25% service fee attributable to accounts for which there is no financial intermediary specified on the account except for accounts attributable to MFS or its affiliates' seed money. For the six months ended March 31, 2021, this rebate amounted to $17,082, $21, $175, $3,287, and $197 for Class A, Class B, Class C, Class 529A, and Class 529C, respectively, and is included in the reduction of total expenses in the Statement of Operations. For the six months ended March 31, 2021, the 0.75% distribution fee was not imposed for Class 529B shares due to the sales charge limitations contained in Financial Industry Regulatory Authority (“FINRA”) Rule 2341. |
Certain Class A shares are subject to a contingent deferred sales charge (CDSC) in the event of a shareholder redemption within 18 months of purchase. Class B and Class 529B shares are subject to a CDSC in the event of a shareholder redemption within six years of purchase. Class C and Class 529C shares are subject to a CDSC in the event of a shareholder redemption within 12 months of purchase. All contingent deferred sales charges are paid to MFD and during the six months ended March 31, 2021, were as follows:
| | Amount |
| Class A | $19,882 |
| Class B | 38,846 |
| Class C | 11,560 |
| Class 529B | — |
| Class 529C | 58 |
During the six months ended March 31, 2021, to meet the requirements of FINRA Rule 2341, MFD returned $50 of the CDSC collected for Class 529B which had the effect of further reducing the annual effective distribution fee rate for this class by 0.01%.
Notes to Financial Statements (unaudited) - continued
The fund has entered into and may from time to time enter into contracts with program managers and other parties which administer the tuition programs through which an investment in the fund’s 529 share classes is made. The fund has entered into an agreement with MFD pursuant to which MFD receives an annual fee of up to 0.05% of the average daily net assets attributable to each 529 share class. The services provided by MFD, or a third party with which MFD contracts, include recordkeeping and tax reporting and account services, as well as services designed to maintain the program’s compliance with the Internal Revenue Code and other regulatory requirements. Program manager fees for the six months ended March 31, 2021, were as follows:
| | Fee |
| Class 529A | $7,548 |
| Class 529B | 190 |
| Class 529C | 1,629 |
| Total Program Manager Fees | $9,367 |
Shareholder Servicing Agent — MFS Service Center, Inc. (MFSC), a wholly-owned subsidiary of MFS, receives a fee from the fund for its services as shareholder servicing agent calculated as a percentage of the average daily net assets of the fund as determined periodically under the supervision of the fund's Board of Trustees. For the six months ended March 31, 2021, the fee was $576,398, which equated to 0.0144% annually of the fund's average daily net assets. MFSC also receives reimbursement from the fund for out-of-pocket expenses, sub-accounting and other shareholder servicing costs which may be paid to affiliated and unaffiliated service providers. Class R6 shares do not incur sub-accounting fees. For the six months ended March 31, 2021, these out-of-pocket expenses, sub-accounting and other shareholder servicing costs amounted to $2,931,768.
Administrator — MFS provides certain financial, legal, shareholder communications, compliance, and other administrative services to the fund. Under an administrative services agreement, the fund reimburses MFS the costs incurred to provide these services. The fund is charged an annual fixed amount of $17,500 plus a fee based on average daily net assets. The administrative services fee incurred for the six months ended March 31, 2021 was equivalent to an annual effective rate of 0.0067% of the fund's average daily net assets.
Trustees’ and Officers’ Compensation — The fund pays compensation to independent Trustees in the form of a retainer, attendance fees, and additional compensation to Board and Committee chairpersons. The fund does not pay compensation directly to Trustees or officers of the fund who are also officers of the investment adviser, all of whom receive remuneration from MFS for their services to the fund. Certain officers and Trustees of the fund are officers or directors of MFS, MFD, and MFSC.
Prior to December 31, 2001, the fund had an unfunded defined benefit plan (“DB plan”) for independent Trustees. As of December 31, 2001, the Board took action to terminate the DB plan with respect to then-current and any future independent Trustees, such that the DB plan covers only certain of those former independent Trustees who retired on or before December 31, 2001. The DB plan resulted in a pension expense of $428 and is included in “Independent Trustees’ compensation” in the Statement of Operations for the six months ended March 31, 2021. The liability for
Notes to Financial Statements (unaudited) - continued
deferred retirement benefits payable to those former independent Trustees under the DB plan amounted to $5,923 at March 31, 2021, and is included in “Payable for independent Trustees’ compensation” in the Statement of Assets and Liabilities.
Other — The fund invests in the MFS Institutional Money Market Portfolio which is managed by MFS and seeks current income consistent with preservation of capital and liquidity. This money market fund does not pay a management fee to MFS but does incur investment and operating costs.
The fund is permitted to engage in purchase and sale transactions with funds and accounts for which MFS serves as investment adviser or sub-adviser (“cross-trades”) pursuant to a policy adopted by the Board of Trustees. This policy has been designed to ensure that cross-trades conducted by the fund comply with Rule 17a-7 under the Investment Company Act of 1940. During the six months ended March 31, 2021, the fund engaged in sale transactions pursuant to this policy, which amounted to $499,687. The sales transactions resulted in net realized gains (losses) of $(311,552).
The adviser has voluntarily undertaken to reimburse the fund from its own resources on a quarterly basis for the cost of investment research embedded in the cost of the fund’s securities trades. This agreement may be rescinded at any time. For the six months ended March 31, 2021, this reimbursement amounted to $51,208, which is included in “Other” income in the Statement of Operations.
(4) Portfolio Securities
For the six months ended March 31, 2021, purchases and sales of investments, other than short-term obligations, were as follows:
| | Purchases | Sales |
| U.S. Government securities | $3,955,175,822 | $3,504,869,819 |
| Non-U.S. Government securities | 587,549,576 | 1,096,617,734 |
Notes to Financial Statements (unaudited) - continued
(5) Shares of Beneficial Interest
The fund's Declaration of Trust permits the Trustees to issue an unlimited number of full and fractional shares of beneficial interest. Transactions in fund shares were as follows:
| | Six months ended
3/31/21 | | Year ended
9/30/20 |
| | Shares | Amount | | Shares | Amount |
| Shares sold | | | | | |
| Class A | 18,787,804 | $388,040,560 | | 24,244,922 | $467,717,424 |
| Class B | 30,470 | 627,110 | | 69,578 | 1,339,708 |
| Class C | 1,273,046 | 26,549,624 | | 3,147,838 | 60,751,269 |
| Class I | 3,975,450 | 82,632,240 | | 15,604,973 | 302,663,094 |
| Class R1 | 17,182 | 356,641 | | 48,451 | 914,084 |
| Class R2 | 447,574 | 9,354,466 | | 629,504 | 12,161,205 |
| Class R3 | 1,247,406 | 25,895,465 | | 3,050,178 | 59,042,685 |
| Class R4 | 899,616 | 18,654,143 | | 3,077,902 | 58,668,724 |
| Class R6 | 8,918,461 | 184,595,323 | | 15,939,311 | 305,273,223 |
| Class 529A | 212,814 | 4,363,377 | | 205,668 | 3,982,163 |
| Class 529B | 999 | 20,907 | | 2,310 | 43,644 |
| Class 529C | 13,378 | 275,667 | | 42,487 | 810,891 |
| | 35,824,200 | $741,365,523 | | 66,063,122 | $1,273,368,114 |
Shares issued to shareholders
in reinvestment of distributions | | | | | |
| Class A | 13,008,973 | $264,780,244 | | 7,175,980 | $140,010,597 |
| Class B | 238,212 | 4,854,810 | | 133,761 | 2,628,215 |
| Class C | 1,250,146 | 25,615,133 | | 621,418 | 12,264,023 |
| Class I | 2,295,037 | 46,715,534 | | 1,058,122 | 20,629,701 |
| Class R1 | 26,354 | 535,307 | | 13,036 | 255,049 |
| Class R2 | 352,177 | 7,191,312 | | 221,662 | 4,348,411 |
| Class R3 | 853,391 | 17,385,086 | | 481,858 | 9,409,536 |
| Class R4 | 701,741 | 14,305,533 | | 396,633 | 7,738,472 |
| Class R6 | 2,598,486 | 52,904,727 | | 1,305,621 | 25,430,628 |
| Class 529A | 84,690 | 1,718,714 | | 44,283 | 861,670 |
| Class 529B | 2,210 | 45,070 | | 1,500 | 29,330 |
| Class 529C | 18,847 | 385,723 | | 9,650 | 190,282 |
| | 21,430,264 | $436,437,193 | | 11,463,524 | $223,795,914 |
Notes to Financial Statements (unaudited) - continued
| | Six months ended
3/31/21 | | Year ended
9/30/20 |
| | Shares | Amount | | Shares | Amount |
| Shares reacquired | | | | | |
| Class A | (20,128,908) | $(415,846,956) | | (45,371,858) | $(871,739,779) |
| Class B | (706,210) | (14,643,023) | | (1,839,462) | (35,132,306) |
| Class C | (5,092,340) | (105,372,942) | | (10,354,610) | (199,543,720) |
| Class I | (5,144,963) | (106,079,338) | | (7,915,480) | (149,700,779) |
| Class R1 | (26,572) | (545,928) | | (141,680) | (2,667,322) |
| Class R2 | (1,105,314) | (22,859,949) | | (3,059,965) | (57,869,272) |
| Class R3 | (2,369,959) | (48,823,147) | | (4,076,529) | (78,305,802) |
| Class R4 | (1,671,113) | (34,377,267) | | (2,913,685) | (55,522,481) |
| Class R6 | (6,481,888) | (134,479,353) | | (10,777,935) | (208,327,064) |
| Class 529A | (112,436) | (2,317,077) | | (227,508) | (4,398,205) |
| Class 529B | (6,375) | (132,710) | | (16,245) | (312,994) |
| Class 529C | (109,375) | (2,249,800) | | (104,830) | (2,042,769) |
| | (42,955,453) | $(887,727,490) | | (86,799,787) | $(1,665,562,493) |
| Net change | | | | | |
| Class A | 11,667,869 | $236,973,848 | | (13,950,956) | $(264,011,758) |
| Class B | (437,528) | (9,161,103) | | (1,636,123) | (31,164,383) |
| Class C | (2,569,148) | (53,208,185) | | (6,585,354) | (126,528,428) |
| Class I | 1,125,524 | 23,268,436 | | 8,747,615 | 173,592,016 |
| Class R1 | 16,964 | 346,020 | | (80,193) | (1,498,189) |
| Class R2 | (305,563) | (6,314,171) | | (2,208,799) | (41,359,656) |
| Class R3 | (269,162) | (5,542,596) | | (544,493) | (9,853,581) |
| Class R4 | (69,756) | (1,417,591) | | 560,850 | 10,884,715 |
| Class R6 | 5,035,059 | 103,020,697 | | 6,466,997 | 122,376,787 |
| Class 529A | 185,068 | 3,765,014 | | 22,443 | 445,628 |
| Class 529B | (3,166) | (66,733) | | (12,435) | (240,020) |
| Class 529C | (77,150) | (1,588,410) | | (52,693) | (1,041,596) |
| | 14,299,011 | $290,075,226 | | (9,273,141) | $(168,398,465) |
Effective June 1, 2019, purchases of the fund’s Class B and Class 529B shares are closed to new and existing investors subject to certain exceptions. Please see the fund’s prospectus for details.
(6) Line of Credit
The fund and certain other funds managed by MFS participate in a $1.25 billion unsecured committed line of credit of which $1 billion is reserved for use by the fund and certain other U.S. funds. The line of credit is provided by a syndicate of banks under a credit agreement. Borrowings may be made for temporary financing needs. Interest is charged to each fund, based on its borrowings, generally at a rate equal to the highest of one month LIBOR, the Federal Funds Effective Rate and the Overnight Bank Funding Rate, plus an agreed upon spread. A commitment fee, based on the average daily, unused portion of the committed line of credit, is allocated among the
Notes to Financial Statements (unaudited) - continued
participating funds. In addition, the fund and other funds managed by MFS have established unsecured uncommitted borrowing arrangements with certain banks for temporary financing needs. Interest is charged to each fund, based on its borrowings, at rates equal to customary reference rates plus an agreed upon spread. For the six months ended March 31, 2021, the fund’s commitment fee and interest expense were $17,397 and $0, respectively, and are included in “Miscellaneous” expense in the Statement of Operations.
(7) Investments in Affiliated Issuers
An affiliated issuer may be considered one in which the fund owns 5% or more of the outstanding voting securities, or a company which is under common control. For the purposes of this report, the following were affiliated issuers:
| Affiliated Issuers | Beginning
Value | Purchases | Sales
Proceeds | Realized
Gain
(Loss) | Change in
Unrealized
Appreciation or
Depreciation | Ending
Value |
| MFS Institutional Money Market Portfolio | $335,623,836 | $968,878,404 | $834,262,647 | $(23,612) | $23,612 | $470,239,593 |
| Affiliated Issuers | Dividend
Income | Capital Gain
Distributions |
| MFS Institutional Money Market Portfolio | $170,559 | $— |
(8) Impacts of COVID-19
The pandemic related to the global spread of novel coronavirus disease (COVID-19), which was first detected in December 2019, has resulted in significant disruptions to global business activity and the global economy, as well as the economies of individual countries, the financial performance of individual companies and sectors, and the securities and commodities markets in general. Multiple surges in cases globally, the availability and widespread adoption of vaccines, and the emergence of variant strains of the virus continue to create uncertainty as to the future and long-term impacts resulting from the pandemic including impacts to the prices and liquidity of the fund's investments and the fund's performance.
Proxy Voting Policies and Information
MFS votes proxies on behalf of the fund pursuant to proxy voting policies and procedures that are available without charge, upon request, by calling 1-800-225-2606, by visiting mfs.com/proxyvoting, or by visiting the SEC’s Web site at http://www.sec.gov.
Information regarding how the fund voted proxies relating to portfolio securities during the most recent twelve-month period ended June 30 is available by August 31 of each year without charge by visiting mfs.com/proxyvoting, or by visiting the SEC’s Web site at http://www.sec.gov.
Quarterly Portfolio Disclosure
The fund files a complete schedule of portfolio holdings with the SEC for the first and third quarters of each fiscal year as an exhibit to its reports on Form N-PORT. The fund's Form N-PORT reports are available on the SEC's Web site at http://www.sec.gov. A shareholder can obtain the portfolio holdings report for the first and third quarters of the fund's fiscal year at mfs.com/openendfunds by choosing the fund's name and then scrolling to the “Resources” section and clicking on the “Prospectus and Reports” tab.
Further Information
From time to time, MFS may post important information about the fund or the MFS Funds on the MFS Web site (mfs.com). This information is available at https://www.mfs.com/announcements or at mfs.com/openendfunds by choosing the fund’s name and then scrolling to the “Resources” section and clicking on the “Announcements” tab, if any.
Information About Fund Contracts and Legal Claims
The fund has entered into contractual arrangements with an investment adviser, administrator, distributor, shareholder servicing agent, 529 program manager (if applicable), and custodian who each provide services to the fund. Unless expressly stated otherwise, shareholders are not parties to, or intended beneficiaries of these contractual arrangements, and these contractual arrangements are not intended to create any shareholder right to enforce them against the service providers or to seek any remedy under them against the service providers, either directly or on behalf of the fund.
Under the Trust’s By-Laws and Declaration of Trust, any claims asserted against or on behalf of the MFS Funds, including claims against Trustees and Officers, must be brought in state and federal courts located within the Commonwealth of Massachusetts.
Provision of Financial Reports and Summary Prospectuses
The fund produces financial reports every six months and updates its summary prospectus and prospectus annually. To avoid sending duplicate copies of materials to households, only one copy of the fund’s annual and semiannual report and summary prospectus may be mailed to shareholders having the same last name and residential address on the fund’s records. However, any shareholder may contact MFSC (please see back cover for address and telephone number) to request that copies of these reports and summary prospectuses be sent personally to that shareholder.
Save paper with eDelivery.
MFS® will send you prospectuses, reports, and proxies directly via e-mail so you will get information faster with less mailbox clutter.
To sign up:
1. Go to mfs.com.
2. Log in via MFS® Access.
3. Select eDelivery.
If you own your MFS fund shares through a financial institution or a retirement plan, MFS® TALK, MFS® Access, or eDelivery may not be available to you.
CONTACT
WEB SITE
mfs.com
MFS TALK
1-800-637-8255
24 hours a day
ACCOUNT SERVICE AND LITERATURE
Shareholders
1-800-225-2606
Financial advisors
1-800-343-2829
Retirement plan services
1-800-637-1255
MAILING ADDRESS
MFS Service Center, Inc.
P.O. Box 219341
Kansas City, MO 64121-9341
OVERNIGHT MAIL
MFS Service Center, Inc.
Suite 219341
430 W 7th Street
Kansas City, MO 64105-1407
1(b):
Not applicable.
During the period covered by this report, the Registrant has not amended any provision in its Code of Ethics (the “Code”) that relates to an element of the Code’s definitions enumerated in paragraph (b) of Item 2 of this Form N-CSR. During the period covered by this report, the Registrant did not grant a waiver, including an implicit waiver, from any provision of the Code.
| ITEM 3. | AUDIT COMMITTEE FINANCIAL EXPERT. |
Not applicable for semi-annual reports.
| ITEM 4. | PRINCIPAL ACCOUNTANT FEES AND SERVICES. |
Not applicable for semi-annual reports.
| ITEM 5. | AUDIT COMMITTEE OF LISTED REGISTRANTS. |
Not applicable to the Registrant.
A schedule of investments for each series of the Registrant is included as part of the report to shareholders of such series under Item 1(a) of this Form N-CSR.
| ITEM 7. | DISCLOSURE OF PROXY VOTING POLICIES AND PROCEDURES FOR CLOSED-END MANAGEMENT INVESTMENT COMPANIES. |
Not applicable to the Registrant.
| ITEM 8. | PORTFOLIO MANAGERS OF CLOSED-END MANAGEMENT INVESTMENT COMPANIES. |
Not applicable to the Registrant.
| ITEM 9. | PURCHASES OF EQUITY SECURITIES BY CLOSED-END MANAGEMENT INVESTMENT COMPANY AND AFFILIATED PURCHASERS. |
Not applicable to the Registrant.
| ITEM 10. | SUBMISSION OF MATTERS TO A VOTE OF SECURITY HOLDERS. |
There were no material changes to the procedures by which shareholders may send recommendations to the Board for nominees to the Registrant’s Board since the Registrant last provided disclosure as to such procedures in response to the requirements of Item 407 (c)(2)(iv) of Regulation S-K or this Item.
| ITEM 11. | CONTROLS AND PROCEDURES. |
| (a) | Based upon their evaluation of the effectiveness of the registrant’s disclosure controls and procedures (as defined in Rule 30a-3(c) under the Investment Company Act of 1940 (the “Act”)) as conducted within 90 days of the filing date of this report on Form N-CSR, the registrant’s principal financial officer and principal executive officer have concluded that those disclosure controls and procedures provide reasonable assurance that the material information required to be disclosed by the registrant on this report is recorded, processed, summarized and reported within the time periods specified in the Securities and Exchange Commission’s rules and forms. |
| (b) | There were no changes in the registrant’s internal controls over financial reporting (as defined in Rule 30a-3(d) under the Act) that occurred during the period covered by the report that have materially affected, or are reasonably likely to materially affect, the registrant’s internal control over financial reporting. |
| ITEM 12. | DISCLOSURE OF SECURITIES LENDING ACTIVITIES FOR CLOSED-END MANAGEMENT INVESTMENT COMPANIES. |
Not applicable to the Registrant.
| (a) | File the exhibits listed below as part of this form. Letter or number the exhibits in the sequence indicated. |
| | (1) | Any code of ethics, or amendment thereto, that is the subject of the disclosure required by Item 2, to the extent that the registrant intends to satisfy the Item 2 requirements through filing of an exhibit. Not applicable. |
| | (2) | A separate certification for each principal executive officer and principal financial officer of the registrant as required by Rule 30a-2(a) under the Act (17 CFR 270.30a-2): Attached hereto as EX-99.302CERT. |
| | (3) | Any written solicitation to purchase securities under Rule 23c-1 under the Act (17 CFR 270.23c-1) sent or given during the period covered by the report by or on behalf of the registrant to 10 or more persons. Not applicable. |
| | (4) | Change in the registrant’s independent public accountant. Not applicable. |
| (b) | If the report is filed under Section 13(a) or 15(d) of the Exchange Act, provide the certifications required by Rule 30a-2(b) under the Act (17 CFR 270.30a-2(b)), Rule 13a-14(b) or Rule 15d-14(b) under the Exchange Act (17 CFR 240.13a-14(b) or 240.15d-14(b)) and Section 1350 of Chapter 63 of Title 18 of the United States Code (18 U.S.C. 1350) as an exhibit. A certification furnished pursuant to this paragraph will not be deemed “filed” for the purposes of Section 18 of the Exchange Act (15 U.S.C. 78r), or otherwise subject to the liability of that section. Such certification will not be deemed to be incorporated by reference into any filing under the Securities Act of 1933 or the Exchange Act, except to the extent that the registrant specifically incorporates it by reference: Attached hereto as EX-99.906CERT. |
Notice
A copy of the Amended and Restated Declaration of Trust, as amended, of the Registrant is on file with the Secretary of State of The Commonwealth of Massachusetts and notice is hereby given that this instrument is executed on behalf of the Registrant by an officer of the Registrant as an officer and not individually and the obligations of or arising out of this instrument are not binding upon any of the Trustees or shareholders individually, but are binding only upon the assets and property of the respective constituent series of the Registrant.
SIGNATURES
Pursuant to the requirements of the Securities Exchange Act of 1934 and the Investment Company Act of 1940, the registrant has duly caused this report to be signed on its behalf by the undersigned, thereunto duly authorized.
(Registrant) MFS SERIES TRUST V
| | |
| By (Signature and Title)* | | /S/ DAVID L. DILORENZO |
| | David L. DiLorenzo, President |
Date: May 14, 2021
Pursuant to the requirements of the Securities Exchange Act of 1934 and the Investment Company Act of 1940, this report has been signed below by the following persons on behalf of the registrant and in the capacities and on the dates indicated.
| | |
| By (Signature and Title)* | | /S/ DAVID L. DILORENZO |
| | David L. DiLorenzo, President (Principal Executive Officer) |
Date: May 14, 2021
| | |
| By (Signature and Title)* | | /S/ JAMES O. YOST |
| | James O. Yost, Treasurer (Principal Financial Officer and Accounting Officer) |
Date: May 14, 2021
| * | Print name and title of each signing officer under his or her signature. |