UNITED STATES
SECURITIES AND EXCHANGE COMMISSION
WASHINGTON, D.C. 20549
FORM N-CSR
CERTIFIED SHAREHOLDER REPORT OF REGISTERED
MANAGEMENT INVESTMENT COMPANIES
Investment Company Act file number: 811-23939
AB CARVAL CREDIT OPPORTUNITIES FUND
(Exact name of registrant as specified in charter)
1601 Utica Avenue South, Suite 1000
Minneapolis, MN 55416
(Address of principal executive offices) (Zip code)
Matthew Johnson
AB CarVal Investors L.P.
1601 Utica Avenue South, Suite 1000
Minneapolis, MN 55416
(Name and address of agent for service)
Registrant’s telephone number, including area code: 952-444-4780
Date of fiscal year end: June 30, 2025
Date of reporting period: December 31, 2024
ITEM 1. REPORTS TO STOCKHOLDERS.
December 31, 2024

SEMI-ANNUAL REPORT
AB CARVAL CREDIT OPPORTUNITIES FUND

| Investment Products Offered | • Are Not FDIC Insured • May Lose Value • Are Not Bank Guaranteed | |
You may obtain a description of the Fund’s proxy voting policies and procedures, and information regarding how the Fund voted proxies relating to portfolio securities during the most recent 12-month period ended June 30, without charge. Simply visit AB’s website at www.abfunds.com, or go to the Securities and Exchange Commission’s (the “Commission”) website at www.sec.gov, or call AB at (800) 227 4618.
The Fund files its complete schedule of portfolio holdings with the Commission for the first and third quarters of each fiscal year as an exhibit to its reports on Form N-PORT. The Fund’s Form N-PORT reports are available on the Commission’s website at www.sec.gov.
The [A/B] logo and AllianceBernstein® are registered trademarks used by permission of the owner, AllianceBernstein L.P.
MANAGEMENT REPORT
February 27, 2025
This report provides certain information for the AB CarVal Credit Opportunities Fund (the “Fund”) for the annual reporting period ended December 31, 2024
Returns as of December 31, 2024
Average Annual Total Return
| QTD | YTD | 1 Yr. | 3 Yr. | 5 Yr. | 10 Yr. | Since Inception* | ||||||||||||||||||||||
| AB CarVal Credit Opportunities Fund^ | 0.50% | — | — | — | — | — | 5.33% | |||||||||||||||||||||
| ICE BofA US High Yield Index | 0.16% | — | — | — | — | — | 8.05% | |||||||||||||||||||||
| * | The Fund commenced operations on February 23, 2024. |
| ^ | The returns shown are based on net asset values calculated for shareholder transactions and may differ from the returns shown in the Financial Highlights, which reflect adjustments made to the net asset values in accordance with accounting principles generally accepted in the United States of America. |
The performance shown represents past performance and does not guarantee future results. Current performance may be lower or higher than the performance information shown. The investment return and principal value of an investment in the Fund will fluctuate, so that shares, when redeemed, may be worth more or less than their original cost. For performance current to the most recent month-end, visit alliancebernstein.com. Performance assumes reinvestment of distributions and does not account for taxes. |
MANAGEMENT DISCUSSION OF FUND PERFORMANCE
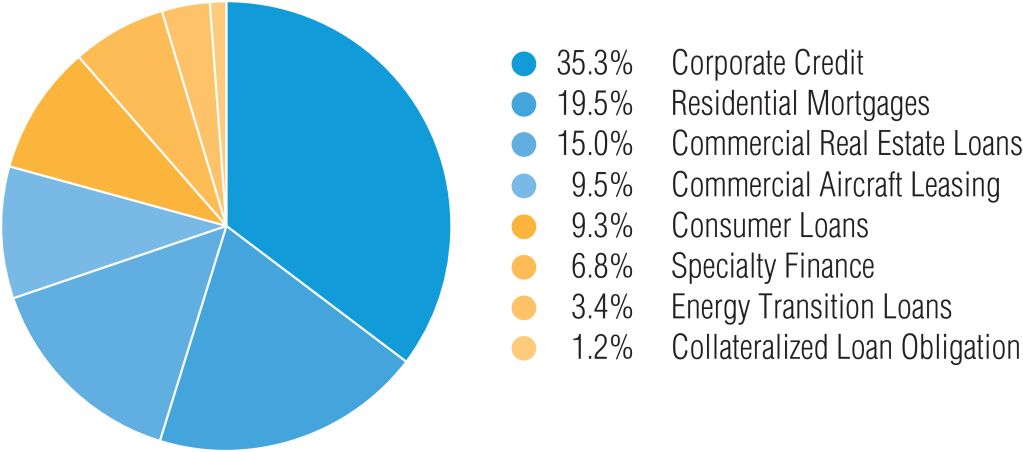
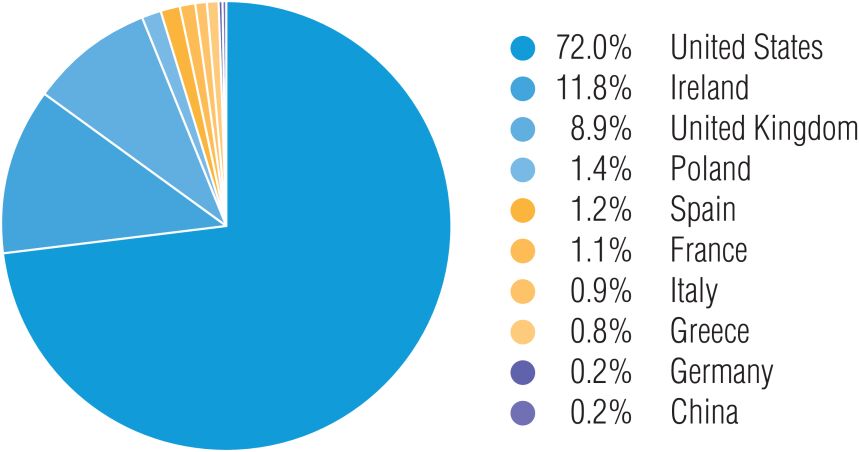
The AB CarVal Credit Opportunities Fund seeks to maximize total return, consisting of current income and capital appreciation. The Fund provides differentiated credit exposure by employing a barbell strategy between credit opportunities in both private and public credit. The current private credit focus includes specialty finance, aircraft leasing and energy transition investments. Public investments include structured products, leveraged loans and high yield bonds. Further, the Fund provides geographic diversification by sourcing opportunities in the US as well as Western Europe.
In private credit in the second half of 2024, we continued to build a robust pipeline of investment opportunities. These opportunities were spread across specialty finance, aviation leasing and energy. The specialty finance transactions were primarily in consumer and included both purchases and forward-flow agreements for loan portfolios. As banks continue to sell assets and reduce lending we will continue to seek to capitalize on this opportunity. In aviation, we remain focused on the purchase and lease of mid-life narrowbody aircraft to airlines. Returns for lessors are elevated as the supply/demand imbalance remains in place due to strong passenger demand, airline profitability and long lead times for new deliveries. In energy transition, we closed a financing for the acquisition and construction solar assets in Europe during the second quarter of 2024. These opportunities provide high current yield, low volatility, and have less correlation to public markets.
| ABFunds.com | AB CarVal Credit Opportunities Fund 1 | |
In public credit, spreads remained tight across structured credit, leveraged loans and high yield bonds. However, we found pockets of opportunity that were compelling alternatives to US high yield bonds. In structured credit, we continued to add to single asset single borrower commercial mortgage-backed securities with a focus on hospitality and industrial collateral. The asset class remains attractive because office weighed on the sector, dragging it down. In addition, as spreads tightened in the space, it brought about new issue opportunities that created liquidity to add exposure. We are also seeing positive risk-adjusted returns in high-quality structured products especially with new issue asset-backed securities in the consumer space in both the US and Europe. In corporate credit, we continued to add exposure to secured leveraged loans which in many cases offered a pickup to the unsecured bonds of the same issuer.
The performance of the Fund has been in line with our expectations. We believe that the Fund may significantly outperform in weaker markets, outperform from higher carry in trending markets and underperform in months where either spreads gap tighter or rates gap lower as we saw in July. Our focus is on cash-flowing assets that generate high carry and provide principal protection with upside optionality. By avoiding the draw down months, we believe the Fund will outperform over the cycle. Looking forward, we are looking to extend the rate duration of the Fund through both interest rate swaps given the exposure to floating rate assets we have and by adding more fixed rate longer duration credit investments.
2 AB CarVal Credit Opportunities Fund | ABFunds.com | |
PORTFOLIO SUMMARY
December 31, 2024
The below breakdown is based on the Investment Manager’s internal classification and is expressed as a percentage of total investment exposure (see “Consolidated Portfolio of Investments” section of the report for additional details).
Investment Strategy
Country Breakout
| ABFunds.com | AB CarVal Credit Opportunities Fund 3 | |
CONSOLIDATED PORTFOLIO OF INVESTMENTS
December 31, 2024 (unaudited)
| Principal Amount (000) | U.S. $ Value | |||||||||||
| ||||||||||||
ASSET BACKED – 40.3% | ||||||||||||
Bonds – 40.3% | ||||||||||||
Alternative Energy – 0.8% | ||||||||||||
Dividend Solar Loans LLC | U.S.$ | 501 | $ | 434,705 | ||||||||
Mill City Solar Loan Ltd. | 117 | 98,533 | ||||||||||
7.14%, 03/20/2043(a)(b) | 109 | 76,284 | ||||||||||
Series 2019-2GS | 421 | 282,200 | ||||||||||
11.88%, 07/20/2043(a)(b)(c)(d)(k) | 735 | 386,975 | ||||||||||
Series 2020-1 | 1,189 | 364,818 | ||||||||||
|
| |||||||||||
| 1,643,515 | ||||||||||||
|
| |||||||||||
Asset Backed Securities – 2.0% | ||||||||||||
Nightingale CRE Ltd. | GBP | 2,813 | 3,495,445 | |||||||||
Turbine Engines Securitization Ltd. | U.S.$ | 883 | 800,123 | |||||||||
6.375%, 12/13/2048(a)(c)(d) | 168 | 141,694 | ||||||||||
|
| |||||||||||
| 4,437,262 | ||||||||||||
|
| |||||||||||
Collateralized Loan Obligations – 1.1% | ||||||||||||
ARES LXVII CLO Ltd. | 412 | 418,240 | ||||||||||
Nassau Euro CLO I DAC | EUR | 1,820 | 1,899,865 | |||||||||
|
| |||||||||||
| 2,318,105 | ||||||||||||
|
| |||||||||||
Commercial Loan Portfolios – 0.0% | ||||||||||||
London Office DAC | GBP | 0 | ** | 125 | ||||||||
10.330% (SONIA + 5.60%), 10/22/2026(a)(c)(d)(f) | 624 | – 0 | – | |||||||||
|
| |||||||||||
| 125 | ||||||||||||
|
| |||||||||||
Commercial Mortgage-Backed Securities – 13.3% | ||||||||||||
Atrium Hotel Portfolio Trust | U.S.$ | 2,680 | 2,668,008 | |||||||||
4 AB CarVal Credit Opportunities Fund | ABFunds.com | |
CONSOLIDATED PORTFOLIO OF INVESTMENTS (continued)
| Principal Amount (000) | U.S. $ Value | |||||||||
| ||||||||||
BOCA Commercial Mortgage Trust | U.S.$ | 930 | $ | 928,812 | ||||||
BX Commercial Mortgage Trust | 399 | 401,450 | ||||||||
Series 2024 | 2,000 | 1,994,989 | ||||||||
BX Trust | 2,012 | 1,989,195 | ||||||||
Series 2022-PSB, Class F | 510 | 509,730 | ||||||||
BXSC Commercial Mortgage Trust | 1,750 | 1,730,765 | ||||||||
Commercial Mortgage Trust | 2,000 | 1,920,396 | ||||||||
CSMC Trust | 220 | 210,254 | ||||||||
Extended Stay America Trust | 353 | 353,316 | ||||||||
GS Mortgage Securities Corp. Trust | 500 | 475,797 | ||||||||
Series 2024-70P, Class E | 2,009 | 2,045,420 | ||||||||
HIH Trust | 1,900 | 1,896,818 | ||||||||
JPMorgan Chase Commercial Mortgage Securities Trust | 1,608 | 1,594,181 | ||||||||
| ABFunds.com | AB CarVal Credit Opportunities Fund 5 | |
CONSOLIDATED PORTFOLIO OF INVESTMENTS (continued)
| Principal Amount (000) | U.S. $ Value | |||||||||||
| ||||||||||||
Series 2021-HTL5, Class F | U.S.$ | 591 | $ | 579,356 | ||||||||
MTN Commercial Mortgage Trust | 2,007 | 1,997,823 | ||||||||||
PGA National Resort Commercial | 500 | 505,450 | ||||||||||
Series 2024-RSR2, Class F | 1,375 | 1,372,475 | ||||||||||
SHR Trust | 700 | 706,932 | ||||||||||
SMRT Commercial Mortgage Trust | 1,780 | 1,701,715 | ||||||||||
Series 2022-MINI, Class F | 2,000 | 1,891,401 | ||||||||||
Tharaldson Hotel Portfolio Trust | 1,386 | 1,399,791 | ||||||||||
|
| |||||||||||
| 28,874,074 | ||||||||||||
|
| |||||||||||
Consumer Asset-Backed Securities – 6.5% | ||||||||||||
BBVA Consumer Auto FTA | EUR | 447 | 465,134 | |||||||||
FCT Eurotruck Lease | 380 | 393,623 | ||||||||||
16.617% (EURIBOR 1 Month + 5.25%), 04/30/2049(c)(d)(f) | 1,790 | 1,854,171 | ||||||||||
Foundation Finance Trust | U.S.$ | 1,076 | 1,083,881 | |||||||||
Jeronimo Funding DAC | EUR | 941 | 913,268 | |||||||||
6.612% (EURIBOR 3 Month + 4.00%), 10/25/2064(a)(f) | 471 | 448,127 | ||||||||||
6 AB CarVal Credit Opportunities Fund | ABFunds.com | |
CONSOLIDATED PORTFOLIO OF INVESTMENTS (continued)
| Principal Amount (000) | U.S. $ Value | |||||||||||
| ||||||||||||
5.612% (EURIBOR 3 Month + 3.00%), 10/25/2064(a)(f) | EUR | 400 | $ | 396,163 | ||||||||
Newday Funding Master Issuer PLC | GBP | 800 | 1,020,268 | |||||||||
PPC Zeus DAC | EUR | 1,517 | 1,569,648 | |||||||||
SC Germany SA Compartment Consumer | 631 | 674,622 | ||||||||||
11.339% (EURIBOR 1 Month + 8.50%), 10/14/2036(a)(f) | 561 | 622,830 | ||||||||||
Series 2024-1 | 354 | 366,611 | ||||||||||
Securitisation of Catalogue Assets Ltd. | GBP | 567 | 713,802 | |||||||||
12.158% (SONIA + 6.97%), 01/01/2027(c)(d)(f) | 986 | 1,242,767 | ||||||||||
16.188% (SONIA + 11.00%), 01/01/2027(c)(d)(f) | 540 | 686,639 | ||||||||||
Stream Innovations Issuer Trust | U.S.$ | 1,500 | 1,523,912 | |||||||||
|
| |||||||||||
| 13,975,466 | ||||||||||||
|
| |||||||||||
Residential Mortgage-Backed Securities – 16.6% | ||||||||||||
CFMT LLC | 1,878 | 1,567,594 | ||||||||||
Clavel Residential 3 DAC | EUR | 513 | 526,685 | |||||||||
EFMT | U.S.$ | 2,765 | 2,660,790 | |||||||||
Mill City Mortgage Loan Trust | 140 | 55,146 | ||||||||||
3.045%, 04/25/2066(a)(b)(c)(d) | 571 | 286,054 | ||||||||||
3.25%, 04/25/2066(a)(b) | 427 | 317,921 | ||||||||||
10.70%, 04/25/2066(a)(b)(c)(d)(e)(k) | 7,842 | 17,217 | ||||||||||
Series 2019-1 | 858 | 445,226 | ||||||||||
12.83%, 10/25/2069(a)(b)(c)(d)(e)(k) | 7,549 | 16,339 | ||||||||||
| ABFunds.com | AB CarVal Credit Opportunities Fund 7 | |
CONSOLIDATED PORTFOLIO OF INVESTMENTS (continued)
| Principal Amount (000) | U.S. $ Value | |||||||||
| ||||||||||
Series 2019-GS2 | U.S.$ | 3,220 | $ | 15,682 | ||||||
3.25%, 08/25/2059(a)(b)(c)(d) | 340 | 232,154 | ||||||||
3.25%, 08/25/2059(a)(b) | 256 | 206,319 | ||||||||
3.885%, 08/25/2059(a)(b)(c)(d) | 652 | 367,691 | ||||||||
12.82%, 08/25/2059(a)(b)(c)(d)(e)(k) | 3,616 | 64,013 | ||||||||
Series 2023-NQM1 | 462 | 425,349 | ||||||||
6.123%, 10/25/2067(a)(b) | 126 | 123,505 | ||||||||
Morgan Stanley Residential Mortgage Loan Trust | 1,115 | 1,097,881 | ||||||||
New Residential Mortgage Loan Trust | 204 | 132,601 | ||||||||
Series 2016-2 | 259 | 189,641 | ||||||||
Series 2018-1 | 683 | 479,861 | ||||||||
Series 2018-2 | 2,031 | 1,478,453 | ||||||||
Series 2019-2 | 2,583 | 1,650,871 | ||||||||
Series 2019-5 | 3,022 | 1,852,415 | ||||||||
Series 2019-6 | 2,918 | 1,785,779 | ||||||||
Series 2019-RPL2 | 2,618 | 1,369,659 | ||||||||
Series 2023 | 2,000 | 1,953,892 | ||||||||
PRPM LLC | 1,000 | 864,414 | ||||||||
Shamrock Residential | EUR | 487 | 512,076 | |||||||
8.276% (EURIBOR 1 Month + 5.50%), 06/24/2071(a)(c)(d)(f) | 326 | 277,409 | ||||||||
9.276% (EURIBOR 1 Month + 6.50%), 06/24/2071(a)(c)(d)(f) | 165 | 119,867 | ||||||||
10.276% (EURIBOR 1 Month + 7.50%), 06/24/2071(a)(c)(d)(f) | 348 | 198,945 | ||||||||
Shamrock Residential DAC | 679 | 722,648 | ||||||||
8 AB CarVal Credit Opportunities Fund | ABFunds.com | |
CONSOLIDATED PORTFOLIO OF INVESTMENTS (continued)
| Principal Amount (000) | U.S. $ Value | |||||||||||
| ||||||||||||
6.526% (EURIBOR 1 Month + 3.75%), 02/24/2071(a)(f) | EUR | 538 | $ | 582,305 | ||||||||
8.276% (EURIBOR 1 Month + 5.50%), 02/24/2071(a)(f) | 643 | 720,579 | ||||||||||
9.276% (EURIBOR 1 Month + 6.50%), 02/24/2071(a)(f) | 181 | 207,076 | ||||||||||
10.276% (EURIBOR 1 Month + 7.50%), 02/24/2071(a)(f) | 570 | 663,057 | ||||||||||
Verus Securitization Trust | U.S.$ | 500 | 486,815 | |||||||||
7.633%, 10/25/2069(a)(c)(d) | 785 | 755,588 | ||||||||||
8.06%, 06/25/2069(a)(c)(d) | 2,000 | 1,949,004 | ||||||||||
Series 2023-6 | 1,890 | 1,849,221 | ||||||||||
Series 2023-INV2 | 3,139 | 3,095,951 | ||||||||||
Series 2024-6 | 1,402 | 1,359,700 | ||||||||||
Series 2024-7 | 2,264 | 2,169,415 | ||||||||||
|
| |||||||||||
| 35,852,808 | ||||||||||||
|
| |||||||||||
Total Asset Backed | 87,101,355 | |||||||||||
|
| |||||||||||
CORPORATE SECURITIES – 36.3% |
| |||||||||||
Bank Debt – 21.2% |
| |||||||||||
Agriculture/Food – 0.9% |
| |||||||||||
Max US Bidco, Inc. | 1,995 | 1,938,457 | ||||||||||
|
| |||||||||||
Asset Backed Securities – 0.5% |
| |||||||||||
Lorca Holdco Ltd. | 992 | 999,101 | ||||||||||
|
| |||||||||||
Auto/Motor Carrier – 1.7% |
| |||||||||||
Carnaby Inventory III LLC | 2,400 | 2,353,200 | ||||||||||
First Brands Group LLC | 1,260 | 1,237,068 | ||||||||||
|
| |||||||||||
| 3,590,268 | ||||||||||||
|
| |||||||||||
Building/Construction Products – 0.4% | ||||||||||||
White Cap Buyer LLC | 933 | 933,774 | ||||||||||
|
| |||||||||||
| ABFunds.com | AB CarVal Credit Opportunities Fund 9 | |
CONSOLIDATED PORTFOLIO OF INVESTMENTS (continued)
| Principal Amount (000) | U.S. $ Value | |||||||||||
| ||||||||||||
Commercial Services – 0.8% | ||||||||||||
United Talent Agency LLC | U.S.$ | 1,737 | $ | 1,745,559 | ||||||||
|
| |||||||||||
Communications – 3.5% | ||||||||||||
Arches Buyer, Inc. | 2,000 | 1,950,560 | ||||||||||
MH Sub I LLC | 1,597 | 1,596,555 | ||||||||||
Univision Communications, Inc. | 2,000 | 1,979,639 | ||||||||||
Vmed O2 U.K. Holdco 4 Ltd. | EUR | 2,045 | 2,121,663 | |||||||||
|
| |||||||||||
| 7,648,417 | ||||||||||||
|
| |||||||||||
Financial Services – 3.3% | ||||||||||||
Advisor Group, Inc. | U.S.$ | 1,889 | 1,894,108 | |||||||||
AllSpring Buyer LLC | 1,137 | 1,137,565 | ||||||||||
Series 2024 | 500 | 500,125 | ||||||||||
Howden Group Holdings Ltd. | 995 | 1,000,933 | ||||||||||
Nexus Buyer LLC | 1,453 | 1,456,401 | ||||||||||
USI, Inc. | 142 | 142,013 | ||||||||||
VFH Parent LLC | 1,000 | 1,001,880 | ||||||||||
|
| |||||||||||
| 7,133,025 | ||||||||||||
|
| |||||||||||
10 AB CarVal Credit Opportunities Fund | ABFunds.com | |
CONSOLIDATED PORTFOLIO OF INVESTMENTS (continued)
| Principal Amount (000) | U.S. $ Value | |||||||||||
| ||||||||||||
Health Care – 3.2% |
| |||||||||||
AthenaHealth Group, Inc. | U.S.$ | 988 | $ | 989,050 | ||||||||
Centrient Holding BV | EUR | 2,000 | 2,079,034 | |||||||||
Heartland Dental LLC | U.S.$ | 1,995 | 1,996,431 | |||||||||
Hunter US Bidco, Inc. | 98 | 96,481 | ||||||||||
Phoenix Guarantor, Inc. | 142 | 142,992 | ||||||||||
Star Parent, Inc. | 1,627 | 1,587,542 | ||||||||||
|
| |||||||||||
| 6,891,530 | ||||||||||||
|
| |||||||||||
Insurance – 0.9% |
| |||||||||||
Asurion LLC | 1,995 | 1,994,924 | ||||||||||
|
| |||||||||||
Leisure/Entertainment – 4.5% | ||||||||||||
Banijay Entertainment SAS | 1,124 | 1,129,533 | ||||||||||
Hoya Midco LLC | 143 | 144,372 | ||||||||||
Ren10 Holding AB | EUR | 500 | 518,733 | |||||||||
Route 66 Development Authority | U.S.$ | 4,075 | 4,064,812 | |||||||||
Scientific Games Holdings LP | 998 | 998,996 | ||||||||||
Spectacle Gary Holdings LLC | 2,839 | 2,827,593 | ||||||||||
|
| |||||||||||
| 9,684,039 | ||||||||||||
|
| |||||||||||
| ABFunds.com | AB CarVal Credit Opportunities Fund 11 | |
CONSOLIDATED PORTFOLIO OF INVESTMENTS (continued)
| Principal Amount (000) | U.S. $ Value | |||||||||||
| ||||||||||||
Packaging & Containers – 0.7% |
| |||||||||||
Radar Bidco SARL | U.S.$ | 1,466 | $ | 1,481,498 | ||||||||
|
| |||||||||||
Technology – 0.8% | ||||||||||||
Genuine Financial Holdings LLC | 142 | 143,460 | ||||||||||
Peraton Corp. | 1,625 | 1,508,964 | ||||||||||
Virtusa Corp. | 129 | 130,226 | ||||||||||
|
| |||||||||||
| 1,782,650 | ||||||||||||
|
| |||||||||||
| 45,823,242 | ||||||||||||
|
| |||||||||||
Bonds – 11.8% |
| |||||||||||
Agriculture/Food – 0.3% |
| |||||||||||
Albertsons Cos., Inc./Safeway, Inc./New Albertsons LP/Albertsons LLC | 675 | 682,594 | ||||||||||
|
| |||||||||||
Auto/Motor Carrier – 0.3% |
| |||||||||||
Clarios Global LP/Clarios U.S. Finance Co. | 675 | 687,103 | ||||||||||
|
| |||||||||||
Building/Construction Products – 0.2% |
| |||||||||||
Country Garden Holdings Co. Ltd. | 792 | 79,827 | ||||||||||
5.125%, 01/17/2025(a)(h)(i) | 2,458 | 250,506 | ||||||||||
|
| |||||||||||
| 330,333 | ||||||||||||
|
| |||||||||||
Chemicals – 0.3% |
| |||||||||||
INEOS Finance PLC | 300 | 302,249 | ||||||||||
7.50%, 04/15/2029(a) | 375 | 384,141 | ||||||||||
|
| |||||||||||
| 686,390 | ||||||||||||
|
| |||||||||||
Communications – 0.7% |
| |||||||||||
Jazz Securities DAC | 675 | 636,333 | ||||||||||
Telenet Finance Luxembourg Notes SARL | 800 | 770,450 | ||||||||||
|
| |||||||||||
| 1,406,783 | ||||||||||||
|
| |||||||||||
12 AB CarVal Credit Opportunities Fund | ABFunds.com | |
CONSOLIDATED PORTFOLIO OF INVESTMENTS (continued)
| Principal Amount (000) | U.S. $ Value | |||||||||||
| ||||||||||||
Consumer – 0.9% |
| |||||||||||
Garda World Security Corp. | U.S.$ | 675 | $ | 695,137 | ||||||||
Stonegate Pub Co. Financing PLC | EUR | 605 | 645,908 | |||||||||
10.75%, 07/31/2029(a) | GBP | 511 | 664,053 | |||||||||
|
| |||||||||||
| 2,005,098 | ||||||||||||
|
| |||||||||||
Energy – 1.3% |
| |||||||||||
Calpine Corp. | U.S.$ | 300 | 291,042 | |||||||||
5.25%, 06/01/2026(a) | 125 | 124,980 | ||||||||||
Expand Energy Corp | 375 | 378,866 | ||||||||||
Hess Midstream Operations LP | 300 | 289,982 | ||||||||||
5.625%, 02/15/2026(a) | 375 | 373,661 | ||||||||||
KCA Deutag U.K. Finance PLC | 597 | 597,896 | ||||||||||
Tallgrass Energy Partners LP/Tallgrass Energy Finance Corp. | 675 | 675,844 | ||||||||||
|
| |||||||||||
| 2,732,271 | ||||||||||||
|
| |||||||||||
Financial Services – 0.9% |
| |||||||||||
AG Issuer LLC | 675 | 669,056 | ||||||||||
Alliant Holdings Intermediate LLC/Alliant Holdings Co-Issuer | 375 | 375,403 | ||||||||||
7.00%, 01/15/2031(a) | 300 | 301,191 | ||||||||||
AmWINS Group, Inc. | 300 | 281,825 | ||||||||||
6.375%, 02/15/2029(a) | 375 | 376,345 | ||||||||||
|
| |||||||||||
| 2,003,820 | ||||||||||||
|
| |||||||||||
General Manufacturing – 0.6% |
| |||||||||||
Clydesdale Acquisition Holdings, Inc. | 675 | 677,695 | ||||||||||
TK Elevator U.S. Newco, Inc. | 675 | 659,812 | ||||||||||
|
| |||||||||||
| 1,337,507 | ||||||||||||
|
| |||||||||||
Health Care – 0.9% |
| |||||||||||
IQVIA, Inc. | 300 | 294,528 | ||||||||||
6.50%, 05/15/2030(a) | 375 | 381,627 | ||||||||||
Medline Borrower LP/Medline Co-Issuer, Inc. | 675 | 682,142 | ||||||||||
| ABFunds.com | AB CarVal Credit Opportunities Fund 13 | |
CONSOLIDATED PORTFOLIO OF INVESTMENTS (continued)
| Principal Amount (000) | U.S. $ Value | |||||||||||
| ||||||||||||
Tenet Healthcare Corp. | U.S.$ | 675 | $ | 682,883 | ||||||||
|
| |||||||||||
| 2,041,180 | ||||||||||||
|
| |||||||||||
Industrials – 0.9% |
| |||||||||||
Albion Financing 1 SARL/Aggreko Holdings, Inc. | 675 | 675,155 | ||||||||||
GFL Environmental, Inc. | 300 | 298,509 | ||||||||||
6.75%, 01/15/2031(a) | 375 | 385,596 | ||||||||||
TransDigm, Inc. | 675 | 680,063 | ||||||||||
|
| |||||||||||
| 2,039,323 | ||||||||||||
|
| |||||||||||
Leisure/Entertainment – 2.2% |
| |||||||||||
Banijay Entertainment SAS | 675 | 699,802 | ||||||||||
Caesars Entertainment, Inc. | 675 | 688,041 | ||||||||||
Carnival Corp. | 675 | 675,074 | ||||||||||
Light & Wonder International, Inc. | 300 | 300,375 | ||||||||||
7.50%, 09/01/2031(a) | 375 | 386,719 | ||||||||||
Scientific Games Holdings LP/Scientific Games U.S. FinCo, Inc. | 675 | 645,568 | ||||||||||
TEGNA, Inc. | 675 | 666,415 | ||||||||||
VOC Escrow Ltd. | 675 | 656,881 | ||||||||||
|
| |||||||||||
| 4,718,875 | ||||||||||||
|
| |||||||||||
Miscellaneous Industries – 0.7% |
| |||||||||||
Blackstone Mortgage Trust, Inc. | 139 | 142,722 | ||||||||||
Diebold Nixdorf, Inc. | 141 | 144,732 | ||||||||||
Goat Holdco LLC | 141 | 139,623 | ||||||||||
Gruenenthal GmbH | EUR | 139 | 145,308 | |||||||||
Iron Mountain, Inc. | U.S.$ | 279 | 277,800 | |||||||||
Planet Financial Group LLC | 141 | 143,468 | ||||||||||
Starwood Property Trust, Inc. | 141 | 141,198 | ||||||||||
14 AB CarVal Credit Opportunities Fund | ABFunds.com | |
CONSOLIDATED PORTFOLIO OF INVESTMENTS (continued)
| Principal Amount (000) | U.S. $ Value | |||||||||||
| ||||||||||||
UWM Holdings LLC | U.S.$ | 282 | $ | 279,922 | ||||||||
|
| |||||||||||
| 1,414,773 | ||||||||||||
|
| |||||||||||
Retailing – 1.0% | ||||||||||||
Bellis Acquisition Co. PLC | GBP | 1,750 | 2,114,047 | |||||||||
|
| |||||||||||
Technology – 0.3% | ||||||||||||
Match Group Holdings II LLC | U.S.$ | 675 | 655,452 | |||||||||
|
| |||||||||||
Transportation (Non Auto) – 0.3% | ||||||||||||
Fortress Transportation & Infrastructure Investors LLC | 675 | 689,195 | ||||||||||
|
| |||||||||||
| 25,544,744 | ||||||||||||
|
| |||||||||||
| Shares | ||||||||||||
Equity Investments – 3.3% | ||||||||||||
Alternative Energy – 0.3% | ||||||||||||
Intersect Power LLC(c)(d)(h) | 95,560 | 530,232 | ||||||||||
|
| |||||||||||
Financial Services – 3.0% | ||||||||||||
CVI Symmetry Holding LLC(c)(d)(h) | 6,579,336 | 6,579,336 | ||||||||||
|
| |||||||||||
| 7,109,568 | ||||||||||||
|
| |||||||||||
Total Corporate Securities | 78,477,554 | |||||||||||
|
| |||||||||||
LOAN PORTFOLIOS – 10.3% | ||||||||||||
Equity Investments – 8.9% | ||||||||||||
Alternative Energy – 0.8% | ||||||||||||
Coral Reef SPV SARL(b)(c)(d)(h) | 1,665,979 | 1,777,259 | ||||||||||
|
| |||||||||||
Commercial Loan Portfolios – 0.5% | ||||||||||||
Powis Finance SARL(b)(c)(d)(h) | 945,766 | 988,380 | ||||||||||
|
| |||||||||||
Commercial Real Estate Loans – 1.6% | ||||||||||||
CVI Thompson Holdings LLC(c)(d)(h) | 3,561,119 | 3,580,926 | ||||||||||
|
| |||||||||||
Consumer Loan Portfolios – 5.9% | ||||||||||||
CVI CB Holdings IV LLC(b)(c)(d)(h) | 2,310,669 | 2,562,600 | ||||||||||
CVI MF Acquisition Trust II(b)(c)(d)(h) | 730,128 | 743,059 | ||||||||||
CVI OCT Acquisition Trust(b)(c)(d)(h) | 5,944,351 | 6,050,531 | ||||||||||
Kielder Funding, Ltd.(b)(c)(d)(h) | 2,556,645 | 3,374,901 | ||||||||||
|
| |||||||||||
| 12,731,091 | ||||||||||||
|
| |||||||||||
Residential Loan Portfolios – 0.1% | ||||||||||||
Kutxabank SA(b)(c)(d)(h) | 321,755 | 184,977 | ||||||||||
|
| |||||||||||
| 19,262,633 | ||||||||||||
|
| |||||||||||
| ABFunds.com | AB CarVal Credit Opportunities Fund 15 | |
CONSOLIDATED PORTFOLIO OF INVESTMENTS (continued)
| Principal Amount (000) | U.S. $ Value | |||||||||||
| ||||||||||||
Debt Investments – 1.4% | ||||||||||||
Alternative Energy – 1.4% | ||||||||||||
GoldenPeaks Capital | EUR | 2,875 | $ | 2,968,156 | ||||||||
|
| |||||||||||
Total Loan Portfolios | 22,230,789 | |||||||||||
|
| |||||||||||
| Shares | ||||||||||||
SPECIAL OPPORTUNITIES – 8.3% | ||||||||||||
Equity Investments – 8.3% | ||||||||||||
Aviation – 8.3% | ||||||||||||
Aergo Capital Ltd.(b)(c)(d)(h) | 18,105,438 | 17,936,857 | ||||||||||
|
| |||||||||||
SHORT-TERM INVESTMENTS – 6.5% | ||||||||||||
Investment Companies – 6.5% | ||||||||||||
Northern Institutional Treasury Portfolio, 4.43%(j) | 14,200,226 | 14,200,226 | ||||||||||
|
| |||||||||||
Total Investments – 101.7% | 219,946,781 | |||||||||||
Other assets less liabilities – (1.7)% | (3,724,430 | ) | ||||||||||
|
| |||||||||||
Net Assets – 100.0% | $ | 216,222,351 | ||||||||||
|
| |||||||||||
FORWARD CURRENCY EXCHANGE CONTRACTS (see Note D)
| Counterparty | Contracts to Deliver (000) | In Exchange For (000) | Settlement Date | Unrealized Appreciation (Depreciation) | ||||||||||||||||||||
HSBC Bank Plc | EUR | 46,871 | USD | 51,788 | 03/19/2025 | $ | 3,074,283 | |||||||||||||||||
HSBC Bank Plc | USD | 26,047 | EUR | 24,188 | 03/19/2025 | (907,879 | ) | |||||||||||||||||
HSBC Bank Plc | GBP | 11,007 | USD | 13,938 | 06/18/2025 | 175,981 | ||||||||||||||||||
|
| |||||||||||||||||||||||
| $ | 2,342,385 | |||||||||||||||||||||||
|
| |||||||||||||||||||||||
CENTRALLY CLEARED INTEREST RATE SWAPS (see Note D)
| Rate Type | ||||||||||||||||||||||||||
| Notional Amount (000) | Termination Date | Payments made by the Fund | Payments received by the Fund | Payment Frequency Paid/ Received | Market Value | Upfront Premiums Paid (Received) | Unrealized Appreciation (Depreciation) | |||||||||||||||||||
| USD | 15,700 | 08/05/2027 | 1 Day SOFR | 3.496% | Annual | $ | (177,033 | ) | $ | 5,354 | $ | (182,387 | ) | |||||||||||||
| USD | 12,800 | 08/05/2027 | 1 Day SOFR | 3.496% | Annual | (144,294 | ) | 4,654 | (148,948 | ) | ||||||||||||||||
16 AB CarVal Credit Opportunities Fund | ABFunds.com | |
CONSOLIDATED PORTFOLIO OF INVESTMENTS (continued)
| Rate Type | ||||||||||||||||||||||||||
| Notional Amount (000) | Termination Date | Payments made by the Fund | Payments received by the Fund | Payment Frequency Paid/ Received | Market Value | Upfront Premiums Paid (Received) | Unrealized Appreciation (Depreciation) | |||||||||||||||||||
| USD | 45,758 | 09/03/2027 | 1 Day SOFR | 3.799% | Annual | $ | (854,799 | ) | $ | – 0 | – | $ | (854,799 | ) | ||||||||||||
| USD | 11,439 | 09/03/2027 | 1 Day SOFR | 3.799% | Annual | (213,700 | ) | – 0 | – | (213,700 | ) | |||||||||||||||
|
|
|
|
|
| |||||||||||||||||||||
| $ | (1,389,826 | ) | $ | 10,008 | $ | (1,399,834 | ) | |||||||||||||||||||
|
|
|
|
|
| |||||||||||||||||||||
CREDIT DEFAULT SWAPS (see Note D)
| Swap Counterparty & Referenced Obligation | Fixed Rate (Pay) Receive | Payment Frequency | Implied Credit Spread at December 31, 2024 | Notional Amount (000) | Market Value | Upfront Premiums Paid (Received) | Unrealized Appreciation (Depreciation) | |||||||||||||||||||||||||
Buy Contracts |
| |||||||||||||||||||||||||||||||
Barclay Bank PLC | ||||||||||||||||||||||||||||||||
Republic of Poland Government Bond, 06/20/2029* | (1.00 | %) | Annual | 7.50 | % | USD | 1,551 | $ | (26,888 | ) | $ | (17,484 | ) | $ | (9,404 | ) | ||||||||||||||||
Republic of Poland Government Bond, 06/20/2029* | (1.00 | %) | Annual | 7.50 | % | USD | 705 | (10,460 | ) | (7,628 | ) | (2,832 | ) | |||||||||||||||||||
Republic of Poland Government Bond, 12/20/2029* | (1.00 | %) | Annual | 7.50 | % | USD | 470 | (6,549 | ) | (7,407 | ) | 858 | ||||||||||||||||||||
|
|
|
|
|
| |||||||||||||||||||||||||||
| $ | (43,897 | ) | $ | (32,519 | ) | $ | (11,378 | ) | ||||||||||||||||||||||||
|
|
|
|
|
| |||||||||||||||||||||||||||
| * | Termination date |
| ** | Principal Amount less than 500. |
| (a) | Security is exempt from registration under Rule 144A or Regulation S of the Securities Act of 1933. These securities are considered restricted, but liquid and may be resold in transactions exempt from registration. At December 31, 2024, the aggregate market value of these securities amounted to $107,072,214 or 49.5% of net assets. |
| (b) | Affiliated investments. |
| (c) | Fair valued by the Adviser. |
| (d) | Security in which significant unobservable inputs (Level 3) were used in determining fair value. |
| (e) | IO – Interest Only. |
| (f) | Variable or Floating rate security. Rate shown is the rate in effect as of period end. Certain variable rate securities are not based on a published reference rate and spread, rather are determined by the issuer or agent and are based on current market conditions. Reference rate is as of reset date, which may vary by security. These securities may not indicate a reference rate and/or spread in their description. |
| (g) | This position or a portion of this position represents an unsettled loan purchase. The coupon rate will be determined at the time of settlement and will be based upon a published reference rate and spread, which was determined at the time of purchase. |
| (h) | Non-income producing security. |
| (i) | Defaulted. |
| (j) | The rate shown represents the 7-day yield as of period end. |
| (k) | The subordinated notes represented are considered equity positions in the securitized vehicle. The securitized equity investments are entitled to recurring distributions which are generally equal to the excess cash flow generated from the underlying investments after payment of the contractual payments to senior debt holders and other expenses. The current estimated yield that is disclosed, calculated using amortized cost, is based on the current projections of this excess cash flow taking into account assumptions which have been made regarding |
| ABFunds.com | AB CarVal Credit Opportunities Fund 17 | |
CONSOLIDATED PORTFOLIO OF INVESTMENTS (continued)
| expected prepayments, losses and future reinvestment rates. These assumptions are periodically reviewed and adjusted. Ultimately, the actual yield may be higher or lower than the estimated yield if actual results differ from those used for the assumptions. |
Currency Abbreviations:
EUR – Euro
GBP – Great British Pound
USD – United States Dollar
Glossary:
CLO – Collateralized Loan Obligations
EURIBOR – Euro Interbank Offered Rate
SOFR – Secured Overnight Financing Rate
SONIA – Sterling Overnight Index Average
See notes to consolidated financial statements.
18 AB CarVal Credit Opportunities Fund | ABFunds.com | |
CONSOLIDATED STATEMENT OF ASSETS & LIABILITIES
December 31, 2024 (unaudited)
| Assets |
| |||
Investments in securities, at value |
| |||
Unaffiliated issuers (cost $190,584,355) | $ | 188,939,574 | ||
Affiliated issuers (cost $31,049,285) | 31,007,207 | |||
Cash | 259,143 | |||
Cash collateral due from broker | 1,895,296 | |||
Foreign currencies, at value (cost $538,127) | 524,152 | |||
Receivable for investment securities sold | 14,936,132 | |||
Interest receivable | 3,848,039 | |||
Unrealized appreciation on forward currency exchange contracts | 3,250,264 | |||
Deferred offering expense | 647,827 | |||
Receivable for capital stock sold | 209,976 | |||
Receivable for variation margin on centrally cleared swaps | 160,673 | |||
Receivable due from Adviser | 133,410 | |||
Other assets | 1,466,843 | |||
|
| |||
Total assets | 247,278,536 | |||
|
| |||
| Liabilities |
| |||
Payable for investment securities purchased | 28,587,138 | |||
Unrealized depreciation on forward currency exchange contracts | 907,879 | |||
Payable to Adviser—deferred offering costs | 336,403 | |||
Advisory fee payable | 259,571 | |||
Administrative fee payable | 179,485 | |||
Trustees’ fees payable | 154,935 | |||
Transfer Agent fee payable | 74,586 | |||
Market value on credit default swaps (net premiums received $32,519) | 43,897 | |||
Accrued expenses | 512,291 | |||
|
| |||
Total liabilities | 31,056,185 | |||
|
| |||
Net Assets | $ | 216,222,351 | ||
|
| |||
| Composition of Net Assets |
| |||
Paid-in capital | $ | 216,295,380 | ||
Accumulated loss | (73,029 | ) | ||
|
| |||
Net Assets | $ | 216,222,351 | ||
|
| |||
Net Asset Value Per Share—unlimited shares authorized, no par value (based on 21,755,674 shares outstanding)
| Class | Net Assets | Shares Outstanding | Net Asset Value | |||||||||
| ||||||||||||
| A | $ | 10,067 | 1,013 | $ | 9.93 | * | ||||||
| ||||||||||||
| Advisor | $ | 216,192,158 | 21,752,634 | $ | 9.94 | |||||||
| ||||||||||||
| C | $ | 10,059 | 1,013 | $ | 9.93 | |||||||
| ||||||||||||
| U | $ | 10,067 | 1,014 | $ | 9.93 | |||||||
| ||||||||||||
| * | The maximum offering price per share for Class A shares was $10.38 which reflects a sales charge of 4.25%. |
See notes to consolidated financial statements.
| ABFunds.com | AB CarVal Credit Opportunities Fund 19 | |
CONSOLIDATED STATEMENT OF OPERATIONS
Six Months Ended December 31, 2024 (unaudited)
| Investment Income | ||||||||
Interest | $ | 6,731,880 | ||||||
Affiliated Interest | 169,051 | |||||||
Other income | 22,865 | |||||||
Operational earnings on equity investments | 1,289,560 | $ | 8,213,356 | |||||
|
| |||||||
| Expenses | ||||||||
Advisory fee (see Note B) | 1,465,397 | |||||||
Distribution fee—Class A | 22 | |||||||
Distribution fee—Class C | 29 | |||||||
Distribution fee—Class U | 22 | |||||||
Transfer agency—Class A | 3 | |||||||
Transfer agency—Advisor | 71,385 | |||||||
Transfer agency—Class C | 3 | |||||||
Transfer agency—Class U | 3 | |||||||
Amortization of offering expenses | 400,555 | |||||||
Loan fees | 228,580 | |||||||
Administrative | 203,081 | |||||||
Legal | 160,162 | |||||||
Audit and tax | 141,150 | |||||||
Trustees’ fees | 91,080 | |||||||
Registration fees | 40,739 | |||||||
Printing | 29,219 | |||||||
Custody and accounting | 10,304 | |||||||
Miscellaneous | 126,277 | |||||||
|
| |||||||
Total expenses before interest expense | 2,968,011 | |||||||
Interest expense | 17,767 | |||||||
|
| |||||||
Total expenses | 2,985,778 | |||||||
Less: expenses waived and reimbursed by the Adviser (see Notes B) | (750,575 | ) | ||||||
|
| |||||||
Net expenses | 2,235,203 | |||||||
|
| |||||||
Net investment income | 5,978,153 | |||||||
|
| |||||||
| Realized and Unrealized Gain (Loss) on Investment and Foreign Currency Transactions | ||||||||
Net realized gain (loss) on: | ||||||||
Affiliated investment transactions | 1,840 | |||||||
Unaffiliated investment transactions | 734,971 | |||||||
Forward currency exchange contracts | (204,961 | ) | ||||||
Swaps | (6,891 | ) | ||||||
Foreign currency transactions | (213,462 | ) | ||||||
Net change in unrealized appreciation (depreciation) of: | ||||||||
Affiliated Underlying Portfolios | (150,710 | ) | ||||||
Investments | (1,602,991 | ) | ||||||
Forward currency exchange contracts | 1,697,666 | |||||||
Swaps | (1,396,873 | ) | ||||||
Foreign currency denominated assets and liabilities | (129,845 | ) | ||||||
|
| |||||||
Net loss on investment and foreign currency transactions | (1,271,256 | ) | ||||||
|
| |||||||
Net Increase in Net Assets from Operations | $ | 4,706,897 | ||||||
|
| |||||||
See notes to consolidated financial statements.
20 AB CarVal Credit Opportunities Fund | ABFunds.com | |
CONSOLIDATED STATEMENT OF CHANGES IN NET ASSETS
| Six Months Ended December 31, 2024 (unaudited) | February 23, 2024(a) to June 30, 2024 | |||||||
| Increase (Decrease) in Net Assets from Operations | ||||||||
Net investment income | $ | 5,978,153 | $ | 3,663,548 | ||||
Net realized gain (loss) on investment and foreign currency transactions | 311,497 | (191,189 | ) | |||||
Net change in unrealized appreciation (depreciation) of investments and foreign currency denominated assets and liabilities | (1,582,753 | ) | 725,778 | |||||
|
|
|
| |||||
Net increase in net assets from operations | 4,706,897 | 4,198,137 | ||||||
Distributions to Shareholders |
| |||||||
Class A | (358 | ) | – 0 | – | ||||
Advisor Class | (9,574,134 | ) | (1,430,475 | ) | ||||
Class C | (354 | ) | – 0 | – | ||||
Class U | (358 | ) | – 0 | – | ||||
| Capital Stock Transactions | ||||||||
Net increase | 43,845,419 | 174,477,577 | ||||||
|
|
|
| |||||
Total increase | 38,977,112 | 177,245,239 | ||||||
| Net Assets |
| |||||||
Beginning of period | 177,245,239 | – 0 | – | |||||
|
|
|
| |||||
End of period | $ | 216,222,351 | $ | 177,245,239 | ||||
|
|
|
| |||||
| (a) | Commencement of operations. |
See notes to consolidated financial statements.
| ABFunds.com | AB CarVal Credit Opportunities Fund 21 | |
CONSOLIDATED STATEMENT OF CASH FLOWS
For the six months ended December 31, 2024 (unaudited)
| Cash flows from operating activities | ||||||||
Net increase in net assets from operations | $ | 4,706,897 | ||||||
Reconciliation of net increase in net assets from operations to cash provided by (used in) operating activities | ||||||||
Purchases of long-term investments | $ | (184,843,320 | ) | |||||
Purchases of short-term investments | (14,200,226 | ) | ||||||
Proceeds from disposition of long-term investments | 123,016,821 | |||||||
Proceeds from disposition of short-term investments | 45,806,048 | |||||||
Net realized gain on investment transactions and foreign currency transactions | (311,497 | ) | ||||||
Net realized loss on forward currency exchange contracts | (204,961 | ) | ||||||
Net change in unrealized appreciation (depreciation) of investments and foreign currency denominated assets and liabilities | 1,582,753 | |||||||
Net accretion of bond discount and amortization of bond premium | (694,583 | ) | ||||||
Increase in receivable for investments sold | (14,722,792 | ) | ||||||
Increase in interest receivable | (2,260,559 | ) | ||||||
Increase in affiliated dividends receivable | (147,079 | ) | ||||||
Decrease in receivable due from Adviser | 1,634,020 | |||||||
Increase in deferred offering expense | (232,964 | ) | ||||||
Increase in other assets | (1,199,559 | ) | ||||||
Increase in payable for investments purchased | 7,785,977 | |||||||
Decrease in advisory fee payable | (529,343 | ) | ||||||
Increase in administrative fee payable | 59,548 | |||||||
Increase in Transfer Agent fee payable | 64,074 | |||||||
Increase in Trustees’ fee payable | 91,080 | |||||||
Increase in accrued expenses | 186,988 | |||||||
Decrease in offering expenses payable | (1,178,637 | ) | ||||||
Proceeds on swaps, net | 516 | |||||||
|
| |||||||
Total adjustments | (40,297,695 | ) | ||||||
|
| |||||||
Net cash provided by (used in) operating activities | (35,590,798 | ) | ||||||
| Cash flows from financing activities | ||||||||
Subscriptions of capital stock, net | 38,243,724 | |||||||
Cash dividends paid (net of dividend reinvestments)† | (3,658,485 | ) | ||||||
|
| |||||||
Net cash provided by (used in) financing activities | 34,585,239 | |||||||
Effect of exchange rate on cash | (343,307 | ) | ||||||
|
| |||||||
Net decrease in cash | (1,348,866 | ) | ||||||
Cash at beginning of period | 5,587,964 | |||||||
|
| |||||||
Cash at end of period | $ | 4,239,098 | ||||||
|
| |||||||
| Supplemental disclosure of cash flow information | ||||||||
† Reinvestment of dividends | $ | 5,916,719 | ||||||
Interest expense paid during the period | $ | 17,767 |
In accordance with U.S. GAAP, the Fund has included a Statement of Cash Flows as a result of its significant investments in Level 3 securities throughout the period.
See notes to consolidated financial statements.
22 AB CarVal Credit Opportunities Fund | ABFunds.com | |
NOTES TO CONSOLIDATED FINANCIAL STATEMENTS
December 31, 2024 (unaudited)
NOTE A
Significant Accounting Policies
The AB CarVal Credit Opportunities Fund (the “Fund”) is organized as a Delaware statutory trust and is registered under the Investment Company Act of 1940, as amended (the “1940 Act”) as a non-diversified, closed-end management investment company that operates as an interval fund. The Fund commenced operations on February 23, 2024. The Fund currently offers four separate classes of shares designated as Class A Shares, Advisor Shares, Class C Shares and Class U Shares (“Shares”). The Fund may offer other additional classes of Shares in the future. The Fund’s investment objective is to seek to maximize total return, consisting of current income and capital appreciation. The Fund seeks to achieve its investment objective by investing primarily in credit-related investments, either directly or through separate investment structures or vehicles that provide the Fund with exposure to such securities (collectively, the “Credit Investments”). Under normal circumstances, the Fund will invest at least 80% its net assets plus any borrowings for investment purposes (measured at the time of purchase) in a portfolio of Credit Investments. The Credit Investments include debt securities, directly originated debt investments, syndicated debt positions acquired in the primary and secondary markets, and structured investments, where the returns are based upon the performance of underlying credit instruments, such as asset backed securitizations.
As part of the Fund’s investment strategy, the Fund may seek to gain exposure to credit investments and derivatives through investments in AB Opportunistic Credit Fund Cayman Corporation (organized under the laws of the Cayman Islands), AB Opportunistic Credit Fund Cayman Ltd. (organized under the laws of the Cayman Islands) and AB Opportunistic Credit Fund US Corporation (organized as a taxable corporation in Delaware), each a wholly-owned subsidiary of the Fund (collectively, the “Subsidiaries” and each, a “Subsidiary”). Each Subsidiary commenced operations on February 23, 2024. The Fund is the sole shareholder of each Subsidiary and it is intended that the Fund will remain the sole shareholder and will continue to control each Subsidiary.
As of December 31, 2024 net assets of the Fund were $216,222,351, of which $28,054,575, or approximately 13%, represented the Fund’s ownership of all issued shares and voting rights of the Subsidiaries. This report presents the consolidated financial statements of the Fund and the Subsidiaries. All intercompany transactions and balances have been eliminated in consolidation.
The investment adviser to the Fund is AB CarVal Investors, L.P. (the “Adviser”), an investment adviser registered with the Securities and Exchange Commission under the Investment Advisers Act of 1940, as amended. Subject to the supervision of the Board of Trustees (the “Board”), the Adviser is responsible for the day-to-day management of investments for the Fund.
| ABFunds.com | AB CarVal Credit Opportunities Fund 23 | |
NOTES TO CONSOLIDATED FINANCIAL STATEMENTS (continued)
The consolidated financial statements have been prepared in conformity with U.S. generally accepted accounting principles (“U.S. GAAP”), which require management to make certain estimates and assumptions that affect the reported amounts of assets and liabilities in the consolidated financial statements and amounts of income and expenses during the reporting period. Actual results could differ from those estimates. The Fund is an investment company under U.S. GAAP and follows the accounting and reporting guidance in the Financial Accounting Standards Board Accounting Standards Codification Topic 946, Financial Services – Investment Companies. The Fund maintains its financial records in U.S. dollars. The following is a summary of significant accounting policies followed by the Fund.
1. Valuation of Investments
The Fund’s Board has approved pricing and valuation policies and procedures pursuant to which the Fund’s investments are valued at fair value (the “Valuation Procedures”). Among other matters, the Valuation Procedures set forth the Fund’s valuation policies and the mechanisms and processes to be employed on a daily basis to implement such policies.
The Adviser has established a Valuation Committee (the “Committee”) made up of representatives of portfolio management, fund operations, compliance and risk management which operates under the Valuation Procedures and is responsible for overseeing the pricing and valuation of all securities held in the Fund. The Committee’s responsibilities include: 1) fair value determinations (and oversight of any third parties to whom any responsibility for fair value determinations is delegated), and 2) regular monitoring of the Valuation Procedures and modification or enhancement of the Valuation Procedures (or recommendation of the modification of the Valuation Procedures) as the Committee believes appropriate. Prior to investing in any portfolio securities, and periodically thereafter, the Adviser will conduct a due diligence review of the valuation methodology utilized. Valuations are required to be supported by market data, industry-accepted third-party valuation models or other methods the Valuation Committee deems to be appropriate, including the use of internal proprietary valuation models. The Adviser periodically tests its valuations through back testing of sales by comparing the amounts realized against the most recent fair values reported, and if necessary, uses the findings to calibrate its valuation procedures.
Portfolio securities are valued at market value determined on the basis of market quotations or, if market quotations are not readily available or are unreliable, at “fair value” as determined in accordance with procedures approved by and under the oversight of the Board. Pursuant to these procedures, the Adviser serves as the Fund’s valuation designee pursuant to Rule 2a-5 under the 1940 Act. In this capacity, the Adviser is responsible, among other things, for making all fair value determinations relating to the Fund’s portfolio investments, subject to the Board’s oversight.
24 AB CarVal Credit Opportunities Fund | ABFunds.com | |
NOTES TO CONSOLIDATED FINANCIAL STATEMENTS (continued)
The Adviser conducts the valuation of the Fund’s investments, upon which the Fund’s net asset value (“NAV”) is based, at all times consistent with GAAP and the 1940 Act. Investments for which market quotations are readily available are valued using market quotations, which are generally obtained from independent pricing services, broker-dealers or market makers.
Securities for which market quotations are not readily available (including restricted securities) or are deemed unreliable are valued at fair value as deemed appropriate by the Adviser, and in accordance with the valuation policy approved by the Board. Factors considered in making this determination may include, but are not limited to, information obtained by contacting the issuer, analysts, analysis of the issuer’s financial statements or other available documents. In addition, the Fund may use fair value pricing for securities primarily traded in non-U.S. markets because most foreign markets close well before the Fund values its securities at 4:00 p.m., Eastern Time. The earlier close of these foreign markets gives rise to the possibility that significant events, including broad market moves, may have occurred in the interim and may materially affect the value of those securities.
U.S. GAAP establishes a framework for measuring fair value, and a three-level hierarchy for fair value measurements based upon the transparency of inputs to the valuation of an asset or liability. Inputs may be observable or unobservable and refer broadly to the assumptions that market participants would use in pricing the asset or liability. Observable inputs reflect the assumptions market participants would use in pricing the asset or liability based on market data obtained from sources independent of the Fund. Unobservable inputs reflect the Fund’s own assumptions about the assumptions that market participants would use in pricing the asset or liability based on the best information available in the circumstances. Each investment is assigned a level based upon the observability of the inputs which are significant to the overall valuation. The three-tier hierarchy of inputs is summarized below.
| • | Level 1—quoted prices in active markets for identical investments |
| • | Level 2—other significant observable inputs |
| • | Level 3—significant unobservable inputs |
The Fund’s investments in corporate securities and derivatives are primarily valued using Level 2 inputs which generally consist of vendor pricing and multiple broker quotes based on the yield, maturity, credit quality and bids or trading activity in the security or similar securities, thereby demonstrating consensus pricing. Corporate securities valued using Level 1 inputs generally represent an immaterial portion of the investment portfolio; however, they would be valued using the readily available market prices. Inputs from Level 3 are also utilized for corporate securities and derivatives, depending on the information available and characteristics of the asset type. Investments in asset backed, loan portfolios, and special opportunities are valued with Level 3 inputs primarily using a discounted cash flow analysis. This analysis takes into consideration risk adjusted
| ABFunds.com | AB CarVal Credit Opportunities Fund 25 | |
NOTES TO CONSOLIDATED FINANCIAL STATEMENTS (continued)
rates of return as applied to the cash inflows and outflows anticipated in connection with managing and/or disposing each specific investment. This analysis may include factors such as income streams, local market activity, timing, collateral, payment history, comparative sales values, and other similar factors that have or will influence the exit of the investment. However, certain structured credit and special opportunities investments may be valued using a market approach depending on the availability of broker quotes or other information. Further, certain asset backed investments may be valued using Level 2 inputs depending on the information available. All forward foreign currency contracts held at December 31, 2024 were valued using Level 2 inputs which include forward rates.
The Fund may use Special Purpose Vehicles (“SPVs”) or other similar vehicles to facilitate its investments in various strategies. The Fund will provide funding to the SPVs in a form of a loan receivable and/or an equity contribution. The SPVs, in turn purchase and own the underlying investment assets. In these instances, the Fund’s loan receivable and/or equity contributions represent the instrument that is fair valued.
Valuations reflected in this report are as of the report date. As a result, changes in valuation due to market events and/or issuer related events after the report date and prior to issuance of the report are not reflected herein.
The following table summarizes the valuation of the Fund’s investments by the above fair value hierarchy levels as of December 31, 2024:
Investments in | Level 1 | Level 2 | Level 3 | Total | ||||||||||||
Assets: |
| |||||||||||||||
Asset Backed | $ | – 0 | – | $ | 45,045,302 | $ | 42,056,053 | (a) | $ | 87,101,355 | ||||||
Corporate Securities | – 0 | – | 67,777,718 | 10,699,836 | 78,477,554 | |||||||||||
Loan Portfolios | – 0 | – | – 0 | – | 22,230,789 | 22,230,789 | ||||||||||
Special Opportunities | – 0 | – | – 0 | – | 17,936,857 | 17,936,857 | ||||||||||
Short-Term Investments | 14,200,226 | – 0 | – | – 0 | – | 14,200,226 | ||||||||||
|
|
|
|
|
|
|
| |||||||||
Total Investments in Securities | 14,200,226 | 112,823,020 | 92,923,535 | (a) | 219,946,781 | |||||||||||
Other Financial Instruments(b): | ||||||||||||||||
Assets: |
| |||||||||||||||
Forward Currency Exchange Contracts | – 0 | – | 3,250,264 | – 0 | – | 3,250,264 | ||||||||||
Liabilities: |
| |||||||||||||||
Forward Currency Exchange Contracts | – 0 | – | (907,879 | ) | – 0 | – | (907,879 | ) | ||||||||
Centrally Cleared Interest Rate Swaps | – 0 | – | (1,399,834 | ) | – 0 | – | (1,399,834 | )(c) | ||||||||
Credit Default Swaps | – 0 | – | (43,897 | ) | – 0 | – | (43,897 | ) | ||||||||
|
|
|
|
|
|
|
| |||||||||
Total | $ | 14,200,226 | $ | 113,721,674 | $ | 92,923,535 | (a) | $ | 220,845,435 | |||||||
|
|
|
|
|
|
|
| |||||||||
| (a) | The Fund held securities with zero market value at period end. |
| (b) | Other financial instruments include reverse repurchase agreements and derivative instruments, such as futures, forwards, swaps, options and warrants, which are valued at market value. |
26 AB CarVal Credit Opportunities Fund | ABFunds.com | |
NOTES TO CONSOLIDATED FINANCIAL STATEMENTS (continued)
| (c) | Only variation margin receivable (payable) at period end is reported within the statement of assets and liabilities. This amount reflects cumulative unrealized appreciation (depreciation) on futures and centrally cleared swaps as reported in the portfolio of investments. Where applicable, centrally cleared swaps with upfront premiums are presented here at market value. |
The following is a reconciliation of investments in which significant unobservable inputs (Level 3) were used in determining fair value.
| Asset- Backed | Corporate Securities | Loan Portfolios | ||||||||||
Balance as of 06/30/2024 | $ | 32,941,831 | $ | 4,122,659 | $ | 2,634,908 | ||||||
Accrued discounts/(premiums) | 57,397 | – 0 | – | – 0 | – | |||||||
Realized gain (loss) | 717,282 | – 0 | – | 1,270 | ||||||||
Change in unrealized appreciation/depreciation | (700,710 | ) | (2,159 | ) | 301,048 | |||||||
Purchases | 14,142,968 | 12,197,815 | 27,605,794 | |||||||||
Sales/Paydowns | (5,102,715 | ) | (5,618,479 | ) | (8,312,231 | ) | ||||||
Transfers in to Level 3 | – 0 | – | – 0 | – | – 0 | – | ||||||
Transfers out of Level 3 | – 0 | – | – 0 | – | – 0 | – | ||||||
|
|
|
|
|
| |||||||
Balance as of 12/31/2024 | $ | 42,056,053 | $ | 10,699,836 | $ | 22,230,789 | ||||||
|
|
|
|
|
| |||||||
Net change in unrealized appreciation/depreciation from investments held as of 12/31/2024 | $ | (398,621 | ) | $ | (2,159 | ) | $ | 301,048 | ||||
|
|
|
|
|
| |||||||
| Special Opportunities | Total | |||||||||||
Balance as of 06/30/2024 | $ | 14,813,252 | $ | 54,512,650 | ||||||||
Accrued discounts/(premiums) | – 0 | – | 57,397 | |||||||||
Realized gain (loss) | – 0 | – | 718,552 | |||||||||
Change in unrealized appreciation/depreciation | (290,508 | ) | (692,329 | ) | ||||||||
Purchases | 8,745,743 | 62,692,320 | ||||||||||
Sales/Paydowns | (5,331,630 | ) | (24,365,055 | ) | ||||||||
Transfers in to Level 3 | – 0 | – | – 0 | – | ||||||||
Transfers out of Level 3 | – 0 | – | – 0 | – | ||||||||
|
|
|
| |||||||||
Balance as of 12/31/2024 | $ | 17,936,857 | $ | 92,923,535 | ||||||||
|
|
|
| |||||||||
Net change in unrealized appreciation/depreciation from investments held as of 12/31/2024 | $ | (290,508 | ) | $ | (390,240 | ) | ||||||
|
|
|
| |||||||||
| ABFunds.com | AB CarVal Credit Opportunities Fund 27 | |
NOTES TO CONSOLIDATED FINANCIAL STATEMENTS (continued)
The following presents information about significant unobservable inputs related to the Fund’s Level 3 investments at December 31, 2024.
Quantitative Information about Level 3 Fair Value Measurements
| Fair Value at 12/31/24 | Valuation | Unobservable | Input Range/ | |||||||
Asset Backed | $ | 3,595,808 | Broker Quotes and/or 3rd Party Pricing Services** | N/A | N/A | |||||
| $ | 8,650,118 | Discounted Cash Flow | Discount Rate | 3.75-26.04% /8.37% | ||||||
| $ | 29,810,002 | Market Comparables | Market Spread* | 210-757bps /442bps | ||||||
| $ | 125 | Market Comparables | Recent Transaction | N/A | ||||||
|
| |||||||||
| $ | 42,056,053 | |||||||||
|
| |||||||||
Corporate Securities | $ | 3,590,268 | Market Comparables | Discount Rate | 22.70% | |||||
| $ | 6,579,336 | Market Comparables | Recent Transaction | |||||||
| $ | 530,232 | Discounted Cash Flow | Discount Rate | 14.00-20.00% / 17.52% | ||||||
|
| |||||||||
| $ | 10,699,836 | |||||||||
|
| |||||||||
Loan Portfolios | $ | 19,262,633 | Discounted Cash Flow | Discount Rate | 11.20-18.50% / 14.13% | |||||
| $ | 2,968,156 | Discounted Cash Flow | Discount Rate | 14.93% | ||||||
|
| |||||||||
| $ | 22,230,789 | |||||||||
|
| |||||||||
Special Opportunities | $ | 705,944 | Market Approach | Recent Transaction | N/A | |||||
| $ | 17,230,913 | Discounted Cash Flow | Discount Rate | 10.00-30.62% / 14.85% | ||||||
|
| |||||||||
| $ | 17,936,857 | |||||||||
|
| |||||||||
| * | The Market Spreads are compared to related U.S. Treasuries and used to calculate the fair value. |
| ** | The valuation is based on non-binding broker quotes or market comparables where quantitative inputs are not observable. Broker quotes or market comparables have been reviewed and substantiated by the Adviser and may be adjusted for timing or other market events, if necessary. |
| *** | Represents the range of discount rates or spreads that are utilized as an input by the Adviser for purposes of generating a fair value. Weighted average excludes investments that have been marked to zero fair market value when applicable. |
Generally, a change in the assumptions used in any input in isolation may be accompanied by a change in another input. Significant changes in any of the unobservable inputs may significantly impact the fair value measurement. Significant increases (decreases) in Discount Rate and Market Spread in isolation would be expected to result in a significantly higher (lower) fair value measurement.
28 AB CarVal Credit Opportunities Fund | ABFunds.com | |
NOTES TO CONSOLIDATED FINANCIAL STATEMENTS (continued)
2. Organizational and Offering Costs
Organizational and offering costs of the Fund were initially paid by the Adviser on behalf of the Fund. Organizational costs may include, among other things, the cost of organizing as a Delaware statutory trust, including the cost of legal services, statutory seed audit and other fees pertaining to the Fund’s organization. Any organizational costs paid by the Adviser are recorded as a Payable to Adviser – organizational expenses in the consolidated statement of assets and liabilities. These costs are expensed as incurred by the Fund.
Offering costs may include, among other things, legal, printing and other expenses pertaining to the offering of the Fund. Any offering costs paid by the Adviser will be recorded as a Payable to Adviser – deferred offering costs in the consolidated statement of assets and liabilities and will be amortized over 12 months on a straight-line basis. Ongoing offering costs will be amortized over the shorter of the offering period or 12 months on a straight-line basis.
The Adviser will bear the Fund’s organizational costs and the offering costs associated with the Fund’s continuous offering of Shares pursuant to the expense limitation agreement, as described in Note B, between the Fund and the Adviser. The Adviser may recoup from the Fund any waived amount or reimbursed expenses with respect to the Fund pursuant to the expense limitation agreement if such recoupment does not cause the Fund to exceed the current expense limit or the expense limit in place at the time of the waiver or reimbursement, and the recoupment is made within three years from the date the amount was initially waived or reimbursed.
3. Currency Translation
Assets and liabilities denominated in foreign currencies and commitments under forward currency exchange contracts are translated into U.S. dollars at the mean rates of exchange on the reporting date of such currencies against the U.S. dollar. Purchases and sales of portfolio securities are translated into U.S. dollars at the rates of exchange prevailing when such securities were acquired or sold. Income and expenses are translated into U.S. dollars at rates of exchange prevailing when accrued.
Net realized gain or loss on foreign currency transactions represents foreign exchange gains and losses from sales and maturities of foreign fixed income investments, holding of foreign currencies, currency gains or losses realized between the trade and settlement dates on foreign investment transactions, and the difference between the amounts of dividends, interest and foreign withholding taxes recorded on the Fund’s books and the U.S. dollar equivalent amounts actually received or paid. Net unrealized currency gains and losses from valuing foreign currency denominated assets and liabilities at period end exchange rates are reflected as a component of net unrealized appreciation or depreciation of foreign currency denominated assets and liabilities.
| ABFunds.com | AB CarVal Credit Opportunities Fund 29 | |
NOTES TO CONSOLIDATED FINANCIAL STATEMENTS (continued)
4. Taxes
It is the Fund’s policy to meet the requirements of the Internal Revenue Code applicable to regulated investment companies (“RIC”) and to distribute all of its investment company taxable income and net realized gains, if any, to shareholders. Therefore, no provisions for federal income or excise taxes are required. The Fund may be subject to taxes imposed by countries in which it invests. Such taxes are generally based on income and/or capital gains earned or repatriated. Taxes are accrued and applied to net investment income, net realized gains and net unrealized appreciation/ depreciation as such income and/or gains are earned. The Fund files withholding tax reclaims in certain jurisdictions to recover a portion of amounts previously withheld. The Fund may record a reclaim receivable based on among other things, a jurisdiction’s legal obligation to pay reclaims as well as payment history and market convention.
If, during a taxable year, the Subsidiaries’ taxable losses (and other deductible items) exceed its income and gains, the net loss will not pass through to the Fund as a deductible amount for federal income tax purposes. Note that the loss from the Subsidiaries’ contemplated activities also cannot be carried forward to reduce future Subsidiaries’ income in subsequent years. However, if the Subsidiaries’ taxable gains exceed its losses and other deductible items during a taxable year, the net gain will pass through to the Fund as income for federal income tax purposes.
In accordance with U.S. GAAP requirements regarding accounting for uncertainties in income taxes, management has analyzed the Fund’s tax positions taken or expected to be taken on federal and state income tax returns for all open tax years and has concluded that no provision for income tax is required in the Fund’s consolidated financial statements.
5. Investment Income and Investment Transactions
Realized gains and losses on securities transactions are determined on a specific identification basis when sold. For equity investments into SPVs, distributions received are recorded as operational earnings or a recovery of the investment which may result in realized gains and losses depending on the nature of the underlying investment activity. Interest income is accrued on debt investments as earned, net of any applicable withholding taxes. Premiums and discounts are amortized/accreted on performing positions. Dividends are recorded as earned. Expenses are recorded on an accrual basis as incurred, including interest expense and dividend expense on short positions.
To the extent loans or debt investments contain payment-in-kind (“PIK”) provisions, PIK interest is generally accrued at the agreed upon rate and recorded as interest income. The settlement of PIK is typically received as cash or is capitalized into the principal balance of the investment and included in the valuation, as determined by the investment provisions, determination of the borrower and the overall market for the investment.
30 AB CarVal Credit Opportunities Fund | ABFunds.com | |
NOTES TO CONSOLIDATED FINANCIAL STATEMENTS (continued)
Debt investments are generally placed on non-accrual status and a reserve is provided for accrued interest receivable when there is reasonable doubt that principal or interest will be collected in full. Interest payments received on non-accrual debt investments would be recognized as income or applied to principal depending on the treatment by the borrower and market treatment.
6. Cash and Cash Equivalents
Cash and cash equivalents consists primarily of bank deposits. Cash deposits are held at major financial institutions and are subject to credit risk to the extent those balances exceed applicable FDIC or SIPC limitations.
7. Fund Valuation
The NAV of the Fund’s Shares is calculated daily on each day that the New York Stock Exchange is open for business as of the close of the regular trading session. NAV per Share is calculated by dividing the value of the Fund’s total assets minus liabilities by the total number of Shares outstanding.
8. Issuance of Shares
Subscriptions are accepted by the Fund when an executed subscription agreement is received and the Fund has made a determination the investor satisfies all of the terms and conditions of the subscription agreement, including the qualification as an “accredited investor” as defined in Regulation D under the 1933 Act. An investor becomes a Shareholder, and the shares are issued as of the date of settlement. The number of shares issued to an investor is calculated based on the NAV per Share in effect on the date the Fund receives the subscription.
Shareholders are able to liquidate their investment through the Fund’s share repurchase program.
9. Repurchase of Shares
The Fund conducts quarterly repurchase offers to repurchase between 5% and 25% of its outstanding Shares at NAV, as determined by the Board. The quarterly repurchases commence in the months of January, April, July and October. During the period ended December 31, 2024, there were two quarterly repurchase offers completed. As a part of these offers, 2,375,702.752 shares were redeemed.
The Fund determines the NAV applicable to repurchases on the repurchase request deadline (i.e., the date by which Shareholders can tender their Shares in response to a repurchase offer).
If Shareholders tender for repurchase more than the repurchase offer amount determined by the Board, the Fund will repurchase the Shares on a pro-rata basis.
| ABFunds.com | AB CarVal Credit Opportunities Fund 31 | |
NOTES TO CONSOLIDATED FINANCIAL STATEMENTS (continued)
10. Distributions
The Fund has adopted a distribution reinvestment plan (the “DRIP”) for its Shareholders, which is an “opt out” dividend reinvestment plan. Shareholders automatically participate in the DRIP, unless and until an election is made to withdraw from the plan on behalf of such participating Shareholder. Under this plan, if the Fund declares a cash dividend or other distribution, each Shareholder will have their cash distribution automatically reinvested in additional Shares, rather than receiving the cash distribution, unless such Shareholder opts out of the DRIP. Shares are issued pursuant to the DRIP at their NAV. If a Shareholder has elected to “opt out” that Shareholder will receive cash dividends or other distributions.
Dividends and distributions to Shareholders, if any, are recorded on the ex-dividend date. Income dividends and capital gains distributions are determined in accordance with federal tax regulations and may differ from those determined in accordance with U.S. GAAP. To the extent these differences are permanent, such amounts are reclassified within the capital accounts based on their federal tax basis treatment; temporary differences do not require such reclassification.
The Fund makes a distribution each quarter to its Shareholders of the net investment income of the Fund after payment of Fund operating expenses, as required by the rules to maintain its status as a RIC. There were two ordinary dividends made. The first on August 20, 2024 was a dividend of $0.1146 per share for the Advisor Class. The second on November 21, 2024 was a dividend of $0.2887 per share for Class A, $0.3046 per share for the Advisor Class, $0.2843 per share for Class C, and $0.2887 per share for Class U. On December 17, 2024, a long term capital gain dividends was made for $0.0476 per share, $0.0476 per share, $0.0476 per share and $0.0476 per share for Class A, Advisor Class, Class C and Class U, respectively. Additionally, a short term capital gain dividend was made for $0.0277 per share, $0.0277 per share, $0.0277 per share and $0.0277 per share for Class A, Advisor Class, Class C and Class U, respectively. The total cash payout for the Shareholders that had elected to “opt out” of the DRIP resulted in cash distributions of $7.4 million.
11. Guarantees and Commitments
The Fund has an obligation to fund a credit facility for a Polish solar development company. The company has the ability to draw on the credit facility for a period of 60 months, with an expiration in May, 2029. The Fund’s expected future investment is estimated to be approximately $977,189.
The Fund also has an obligation to purchase both near-prime consumer powersports loans and non-prime consumer vehicle equity loans under separate forward flow agreements. The investment agreements expire upon the earlier of reaching the purchase commitment amount and August 2025. The Fund may
32 AB CarVal Credit Opportunities Fund | ABFunds.com | |
NOTES TO CONSOLIDATED FINANCIAL STATEMENTS (continued)
terminate the agreement upon the occurrence of certain conditions. The Fund’s expected future investment in these agreements is estimated to be $69,754,645.
NOTE B
Advisory Fee and Other Transactions with Affiliates
Under the terms of the investment advisory agreement, the Fund pays the Adviser an advisory fee at an annual rate of 1.50% of the Fund’s average daily net assets. The fee is accrued daily and paid monthly.
The Adviser has contractually agreed to reimburse expenses (exclusive of management fees, distribution and/or servicing fees, investment-related expenses, borrowing costs, borrowing-related costs, taxes, brokerage expenses, litigation, acquired fund fees and expenses, and extraordinary expenses) (and inclusive of organizational and initial offering costs) to the extent necessary to limit “Other Expenses” to 0.48% of the Fund’s average daily net assets (“Expense Cap”). This contractual arrangement will remain in effect at least until September 30, 2025, unless the Board approves its earlier termination.
For the six months ended December 31, 2024, reimbursements amounted to $750,575. The Adviser may recoup from the Fund any waived amount or reimbursed expenses with respect to the Fund pursuant to the expense limitation agreement if such recoupment does not cause the fund to exceed the current expense limit or the expense limit in place at the time of the waiver or reimbursement (whichever is lower) and the recoupment is made within three years from the date the amount was initially waived or reimbursed. Such reimbursements that are subject to repayment amount to $2,518,005, which include recoupment expiration in February 2027 of $835,622; March 2027 of $158,227; April 2027 of $153,152; May 2027 of $150,243, June 2027 of $470,186, July 2027 of $221,769, August 2027 of $9,072, September 2027 of $106,357, October 2027 of $155,779, November 2027 of $124,188 and December 2027 of $133,410.
Under a separate Administrative Reimbursement Agreement, AB CarVal Investors, L.P. serves as the administrator to the Fund (in such capacity, the “Administrator”). The Administrator provides, or arranges for the provision of, the administrative services necessary for the Fund to operate. In accordance with the Administrative Reimbursement Agreement, the Fund has agreed to reimburse the Administrator for the expenses it incurs on the Fund’s behalf in connection with providing such administrative services, including the Fund’s allocable portion of the salaries of any administrative personnel retained by the Administrator that provide services to the Fund, as well as the allocable portion of overhead, including rent, attributable to such administrative personnel. For the six months ended December 31, 2024, the Fund reimbursed the Adviser under the Administrative Reimbursement Agreement in the amount of $118,809. This amount is subject to the Expense Cap.
| ABFunds.com | AB CarVal Credit Opportunities Fund 33 | |
NOTES TO CONSOLIDATED FINANCIAL STATEMENTS (continued)
The Fund compensates AllianceBernstein Investor Services, Inc. (“ABIS”), which is also an affiliate of the parent company of the Adviser, AllianceBernstein LP, under a Transfer Agency Agreement for providing personnel and facilities to perform transfer agency services for the Fund. Such compensation paid to ABIS amounted to $60,352 for the six months ended December 31, 2024. This amount is subject to the Expense Cap.
AllianceBernstein Investments, Inc. (the “Distributor”), which is also an affiliate of the parent company of the Adviser, AllianceBernstein LP, serves as the distributor of the Fund’s shares. The Distributor has advised the Fund that it has retained front-end sales charges of $0 from the sale of Class A shares and received $0, $0 and $0 in contingent deferred sales charges imposed upon redemptions by shareholders of Class A, Class C and Class U shares, respectively, for the six months ended December 31, 2024. The Adviser Class shares are not subject to a contingent deferred sales charge.
A summary of the Fund’s transactions in affiliated entities controlled by the Adviser for the six months ended December 31, 2024 is as follows:
| Issuer | Market Value 06/30/2024 (000) | Purchases at Cost (000) | Sales Proceeds (000) | Realized Gain (Loss) (000) | Change in Unrealized Appr./ (Depr.) (000) | Amortization of Premium/ Discount (000) | Market Value 12/31/2024 (000) | Income (000) | ||||||||||||||||||||||||
Italy Hotels Srl, | 1,170 | – 0 | – | 1,180 | (7 | ) | 16 | 1 | – 0 | – | 52 | |||||||||||||||||||||
Italy Hotels Srl, | 1,072 | – 0 | – | 1,075 | (14 | ) | 16 | 1 | – 0 | – | 32 | |||||||||||||||||||||
Kutxabank SA | 306 | – 0 | – | 74 | (0 | )* | (47 | ) | – 0 | – | 185 | – 0 | – | |||||||||||||||||||
Mill City Mortgage Loan Trust, | 54 | – 0 | – | – 0 | – | – 0 | – | 2 | (1 | ) | 55 | 0 | * | |||||||||||||||||||
Mill City Mortgage Loan Trust, | 17 | – 0 | – | – 0 | – | (0 | )* | 0 | * | – 0 | – | 17 | – 0 | – | ||||||||||||||||||
Mill City Mortgage Loan Trust, | 120 | – 0 | – | – 0 | – | – 0 | – | (6 | ) | 0 | * | 114 | 3 | |||||||||||||||||||
Mill City Mortgage Loan Trust, | 106 | – 0 | – | – 0 | – | – 0 | – | (3 | ) | 0 | * | 103 | 3 | |||||||||||||||||||
Mill City Mortgage Loan Trust, | 72 | – 0 | – | – 0 | – | – 0 | – | (3 | ) | 0 | * | 69 | 3 | |||||||||||||||||||
Mill City Mortgage Loan Trust, | 292 | – 0 | – | – 0 | – | – 0 | – | 25 | 1 | 318 | 7 | |||||||||||||||||||||
34 AB CarVal Credit Opportunities Fund | ABFunds.com | |
NOTES TO CONSOLIDATED FINANCIAL STATEMENTS (continued)
| Issuer | Market Value 06/30/2024 (000) | Purchases at Cost (000) | Sales Proceeds (000) | Realized Gain (Loss) (000) | Change in Unrealized Appr./ (Depr.) (000) | Amortization of Premium/ Discount (000) | Market Value 12/31/2024 (000) | Income (000) | ||||||||||||||||||||||||
Mill City Mortgage Loan Trust, | 17 | – 0 | – | – 0 | – | (0 | )* | (0 | ) | – 0 | – | 17 | – 0 | – | ||||||||||||||||||
Mill City Mortgage Loan Trust, | 137 | – 0 | – | – 0 | – | – 0 | – | (5 | ) | 1 | 133 | 4 | ||||||||||||||||||||
Mill City Mortgage Loan Trust, | 125 | – 0 | – | – 0 | – | – 0 | – | (3 | ) | 1 | 123 | 3 | ||||||||||||||||||||
Mill City Mortgage Loan Trust, | 109 | – 0 | – | – 0 | – | – 0 | – | (3 | ) | 0 | * | 106 | 4 | |||||||||||||||||||
Mill City Mortgage Loan Trust, | 88 | – 0 | – | – 0 | – | – 0 | – | (4 | ) | 0 | * | 84 | 4 | |||||||||||||||||||
Mill City Mortgage Loan Trust, | 70 | – 0 | – | 5 | (2 | ) | 1 | – 0 | – | 64 | – 0 | – | ||||||||||||||||||||
Mill City Mortgage Loan Trust, | 16 | – 0 | – | – 0 | – | – 0 | – | (1 | ) | – 0 | – | 15 | 1 | |||||||||||||||||||
Mill City Mortgage Loan Trust, | 276 | – 0 | – | 80 | 11 | (2 | ) | 1 | 206 | 4 | ||||||||||||||||||||||
Mill City Mortgage Loan Trust, | 213 | – 0 | – | – 0 | – | – 0 | – | 18 | 1 | 232 | 6 | |||||||||||||||||||||
Mill City Mortgage Loan Trust, | 124 | – 0 | – | – 0 | – | – 0 | – | (2 | ) | 0 | * | 122 | 4 | |||||||||||||||||||
Mill City Mortgage Loan Trust, | 106 | – 0 | – | – 0 | – | – 0 | – | (2 | ) | 0 | * | 104 | 3 | |||||||||||||||||||
Mill City Mortgage Loan Trust, | 78 | – 0 | – | – 0 | – | – 0 | – | (1 | ) | 0 | * | 77 | 3 | |||||||||||||||||||
Mill City Mortgage Loan Trust, | 66 | – 0 | – | – 0 | – | – 0 | – | (1 | ) | 0 | * | 65 | 3 | |||||||||||||||||||
Mill City Mortgage Loan Trust, | 174 | – 0 | – | 53 | 1 | 2 | 0 | * | 124 | 4 | ||||||||||||||||||||||
| ABFunds.com | AB CarVal Credit Opportunities Fund 35 | |
NOTES TO CONSOLIDATED FINANCIAL STATEMENTS (continued)
| Issuer | Market Value 06/30/2024 (000) | Purchases at Cost (000) | Sales Proceeds (000) | Realized Gain (Loss) (000) | Change in Unrealized Appr./ (Depr.) (000) | Amortization of Premium/ Discount (000) | Market Value 12/31/2024 (000) | Income (000) | ||||||||||||||||||||||||
Mill City Mortgage Loan Trust, | 219 | – 0 | – | – 0 | – | – 0 | – | 5 | 0 | * | 224 | 7 | ||||||||||||||||||||
Mill City Mortgage Loan Trust, | 186 | – 0 | – | – 0 | – | – 0 | – | 15 | 0 | * | 201 | 7 | ||||||||||||||||||||
Mill City Solar Loan, 0.00%, 03/20/2043 | 239 | – 0 | – | 241 | (1 | ) | 1 | 2 | – 0 | – | – 0 | – | ||||||||||||||||||||
Mill City Solar Loan, 0.00%, 07/20/2043 | 428 | – 0 | – | – 0 | – | – 0 | – | (46 | ) | 5 | 387 | – 0 | – | |||||||||||||||||||
Mill City Solar Loan, 0.00%, 06/20/2047 | 406 | – 0 | – | 40 | – 0 | – | (1 | ) | – 0 | – | 365 | – 0 | – | |||||||||||||||||||
Mill City Solar Loan, 2.00%, 07/20/2043 | 296 | – 0 | – | 25 | 9 | (1 | ) | 3 | 282 | 4 | ||||||||||||||||||||||
Mill City Solar Loan, 5.92%, 03/20/2043 | 107 | – 0 | – | 8 | 1 | (2 | ) | 0 | * | 98 | 4 | |||||||||||||||||||||
Mill City Solar Loan, 7.14%, 03/20/2043 | 84 | – 0 | – | 11 | 4 | (1 | ) | 0 | * | 76 | 4 | |||||||||||||||||||||
Coral Reef SPV SARL | – 0 | – | 2,878 | 1,087 | – 0 | – | (14 | ) | – 0 | – | 1,777 | – 0 | – | |||||||||||||||||||
Powis Finance SARL | – 0 | – | 1,025 | – 0 | – | – 0 | – | (37 | ) | – 0 | – | 988 | – 0 | – | ||||||||||||||||||
CVI CB Holdings IV LLC | – 0 | – | 3,225 | 914 | – 0 | – | 252 | – 0 | – | 2,563 | – 0 | – | ||||||||||||||||||||
CVI MF Acquisition Trust II | – 0 | – | 998 | 268 | – 0 | – | 13 | – 0 | – | 743 | – 0 | – | ||||||||||||||||||||
CVI OCT Acquisition Trust | – 0 | – | 12,920 | 6,975 | – 0 | – | 106 | – 0 | – | 6,051 | 2 | |||||||||||||||||||||
Kielder Funding, Ltd. | – 0 | – | 3,369 | 79 | – 0 | – | 85 | – 0 | – | 3,375 | – 0 | – | ||||||||||||||||||||
Aergo Capital Ltd. | 14,813 | – 0 | – | 2,746 | – 0 | – | (523 | ) | – 0 | – | 11,544 | 1,288 | ||||||||||||||||||||
|
|
|
|
|
|
|
|
|
| |||||||||||||||||||||||
Total | $ | 2 | $ | (151 | ) | $ | 16 | $ | 31,007 | $ | 1,459 | |||||||||||||||||||||
|
|
|
|
|
|
|
|
|
| |||||||||||||||||||||||
| * | Less than $500 |
As of December 31, 2024, Aergo Capital Limited, which is the Fund’s investment into Aergo Holdings Limited, is deemed to be a significant subsidiary of the Fund in accordance with the definition of a “significant subsidiary” as defined by Regulation S-X 1-02(w)(2), Definitions of terms used in Regulation S-X (amendment effective January 1, 2021). Pursuant to Regulation S-X 4-08(g), Summarized financial information of subsidiaries not consolidated and 50 percent or less owned persons, summarized financial information for Aergo Holdings Limited is included below.
36 AB CarVal Credit Opportunities Fund | ABFunds.com | |
NOTES TO CONSOLIDATED FINANCIAL STATEMENTS (continued)
The following tables show summarized financial statement information for Aergo Holdings Limited for the six months ended December 31, 2024. Amounts are presented in thousands and are unaudited.
Summary Balance Sheet | 6 months ended December 31, 2024 | |||
Non-Current Assets | 1,825,871 | |||
Current Assets | 158,159 | |||
|
| |||
Total Assets | 1,984,030 | |||
Non-Current Liabilities | (2,266,997 | ) | ||
Current Liabilities | (52,674 | ) | ||
|
| |||
Total Liabilities | (2,319,671 | ) | ||
Total Net (Liabilities)/Assets | (335,641 | ) | ||
Summary Income Statement | ||||
Total Revenue | 167,731 | |||
Total Operating Expenses | (15,812 | ) | ||
|
| |||
Total Operating Income | 151,919 | |||
Depreciation & Amortisation | (54,565 | ) | ||
Interest Expense | (93,891 | ) | ||
Gain (Loss) on Derivative Financial Instruments | 421 | |||
Tax Benefit | (485 | ) | ||
|
| |||
Net Income (loss) after Tax | 3,399 | |||
NOTE C
Distribution Services Agreement
The Fund has adopted a Distribution Services Agreement (the “Agreement”) pursuant to Rule 12b-1 under 1940 Act. Under the Agreement, Advisor Shares are not subject to distribution and servicing fees. Under the Agreement, the Fund pays distribution and servicing fees to the Distributor at an annual rate of .75% of the Fund’s average daily net assets attributable to Class A shares, 1.00% of the average daily net assets attributable to Class C shares and .75% of the average daily net assets attributable to Class U shares. There are no distribution and servicing fees on the Advisor Class shares. The fees are accrued daily and paid monthly. The Agreement provides that the Distributor will use such payments in their entirety to compensate broker-dealers or other persons for providing distribution assistance and promotional activities.
NOTE D
Investment Transactions
1. Purchases and Sales
Purchases and sales of investment securities (excluding short-term investments) for the six months ended December 31, 2024 were as follows:
| Purchases | Sales | |||||||
Investment securities (excluding U.S. government securities) | $ | 184,846,574 | $ | 112,248,188 | ||||
U.S. government securities | – 0 | – | – 0 | – | ||||
| ABFunds.com | AB CarVal Credit Opportunities Fund 37 | |
NOTES TO CONSOLIDATED FINANCIAL STATEMENTS (continued)
The cost of investments for federal income tax purposes was substantially the same as the cost for financial reporting purposes. Accordingly, gross unrealized appreciation and unrealized depreciation are as follows:
Gross unrealized appreciation | $ | 6,313,115 | ||
Gross unrealized depreciation | (7,068,801 | ) | ||
|
| |||
Net unrealized depreciation | $ | (755,686 | ) | |
|
|
2. Derivative Financial Instruments
The Fund may use derivatives in an effort to earn income and enhance returns, to replace more traditional direct investments, to obtain exposure to otherwise inaccessible markets (collectively, “investment purposes”), or to hedge or adjust the risk profile of its portfolio.
The principal types of derivatives utilized by the Fund, as well as the methods in which they may be used are:
| • | Forward Currency Exchange Contracts |
The Fund enters into forward currency exchange contracts in order to manage the foreign exchange rate risk related to investments denominated in foreign currency.
A forward currency exchange contract is a commitment to purchase or sell a foreign currency at a future date at a negotiated forward rate. The gain or loss arising from the difference between the original contract and the closing of such contract would be included in net realized gain or loss on forward currency exchange contracts. Fluctuations in the value of open forward currency exchange contracts are recorded for financial reporting purposes as unrealized appreciation and/or depreciation by the Fund. Risks may arise from the potential inability of a counterparty to meet the terms of a contract and from unanticipated movements in the value of a foreign currency relative to the U.S. dollar.
During the six months ended December 31, 2024, the Fund held forward currency exchange contracts for hedging purposes.
| • | Swaps |
The Fund enters into various swap arrangements to manage its exposure to the market or certain sectors of the market, to reduce its risk exposure to defaults of corporate and sovereign issuers or to create exposure to corporate or sovereign issuers to which it is not otherwise exposed. The Fund is subject to credit price risk in the normal course of pursuing its investment objectives. A swap is an agreement that obligates two parties to exchange a series of cash flows at specified intervals based upon or calculated by reference to changes in specified prices or rates for a specified amount of an underlying asset. The payment flows are usually netted against each other, with the difference being paid by one party to the
38 AB CarVal Credit Opportunities Fund | ABFunds.com | |
NOTES TO CONSOLIDATED FINANCIAL STATEMENTS (continued)
other. In addition, collateral may be pledged or received by the Fund in accordance with the terms of the respective swaps to provide value and recourse to the Fund or its counterparties in the event of default, bankruptcy or insolvency by one of the parties to the swap.
Risks may arise as a result of the failure of the counterparty to the swap to comply with the terms of the swap. The loss incurred by the failure of a counterparty is generally limited to the net interim payment to be received by the Fund, and/or the termination value at the end of the contract. Therefore, the Fund considers the creditworthiness of each counterparty to a swap in evaluating potential counterparty risk. This risk is mitigated by having a netting arrangement between the Fund and the counterparty and by the posting of collateral by the counterparty to the Fund to cover the Fund’s exposure to the counterparty. Additionally, risks may arise from unanticipated movements in interest rates or in the value of the underlying securities. The Fund accrues for the interim payments on swaps on a daily basis, with the net amount recorded within unrealized appreciation (depreciation) of swaps on the consolidated statement of assets and liabilities, where applicable. Once the interim payments are settled in cash, the net amount is recorded as realized gain/(loss) on swaps on the consolidated statement of operations, in addition to any realized gain/(loss) recorded upon the termination of swaps. Upfront premiums paid or received for swaps are recognized as cost or proceeds on the consolidated statement of assets and liabilities. Amortized upfront premiums are included in net realized gain/(loss) from swaps on the consolidated statement of operations. Fluctuations in the value of swaps are recorded as a component of net change in unrealized appreciation/depreciation of swaps on the consolidated statement of operations.
Interest Rate Swaps:
The Fund is subject to interest rate risk exposure in the normal course of pursuing its investment objectives. Because the Fund holds fixed rate bonds, the value of these bonds may decrease if interest rates rise. To help hedge against this risk and to maintain its ability to generate income at prevailing market rates, the Fund may enter into interest rate swaps. Interest rate swaps are agreements between two parties to exchange cash flows based on a notional amount. The Fund may elect to pay a fixed rate and receive a floating rate, or, receive a fixed rate and pay a floating rate on a notional amount.
In addition, the Fund may also enter into interest rate swap transactions to preserve a return or spread on a particular investment or portion of its portfolio, or protecting against an increase in the price of securities the Fund anticipates purchasing at a later date. Interest rate swaps involve the exchange by the Fund with another party of their respective commitments to pay or receive interest (e.g., an exchange of floating rate payments for
| ABFunds.com | AB CarVal Credit Opportunities Fund 39 | |
NOTES TO CONSOLIDATED FINANCIAL STATEMENTS (continued)
fixed rate payments) computed based on a contractually-based principal (or “notional”) amount. Interest rate swaps are entered into on a net basis (i.e., the two payment streams are netted out, with the Fund receiving or paying, as the case may be, only the net amount of the two payments).
During the six months ended December 31, 2024, the Fund held interest rate swaps for hedging purposes.
Credit Default Swaps:
The Fund may enter into credit default swaps, including to manage its exposure to the market or certain sectors of the market, to reduce its risk exposure to defaults by corporate and sovereign issuers held by the Fund, or to create exposure to corporate or sovereign issuers to which it is not otherwise exposed. The Fund may purchase credit protection (“Buy Contract”) or provide credit protection (“Sale Contract”) on the referenced obligation of the credit default swap. During the term of the swap, the Fund receives/(pays) fixed payments from/(to) the respective counterparty, calculated at the agreed upon rate applied to the notional amount. If the Fund is a buyer/(seller) of protection and a credit event occurs, as defined under the terms of the swap, the Fund will either (i) receive from the seller/(pay to the buyer) of protection an amount equal to the notional amount of the swap (the “Maximum Payout Amount”) and deliver/(take delivery of) the referenced obligation or (ii) receive/(pay) a net settlement amount in the form of cash or securities equal to the notional amount of the swap less the recovery value of the referenced obligation. In certain circumstances Maximum Payout Amounts may be partially offset by recovery values of the respective referenced obligations, upfront premium received upon entering into the agreement, or net amounts received from settlement of buy protection credit default swaps entered into by the Fund for the same referenced obligations with the same counterparty. Credit default swaps may involve greater risks than if the Fund had invested in the referenced obligation directly. Credit default swaps are subject to general market risk, liquidity risk, counterparty risk and credit risk. If the Fund is a buyer of protection and no credit event occurs, it will lose the payments it made to its counterparty. If the Fund is a seller of protection and a credit event occurs, the value of the referenced obligation received by the Fund coupled with the periodic payments previously received, may be less than the Maximum Payout Amount it pays to the buyer, resulting in a net loss to the Fund.
Implied credit spreads over U.S. Treasuries of comparable maturity utilized in determining the market value of credit default swaps on issuers as of period end are disclosed in the portfolio of investments. The implied spreads serve as an indicator of the current status of the payment/performance risk and typically reflect the likelihood of default by the issuer of the referenced obligation. The implied credit spread of a particular reference
40 AB CarVal Credit Opportunities Fund | ABFunds.com | |
NOTES TO CONSOLIDATED FINANCIAL STATEMENTS (continued)
obligation also reflects the cost of buying/selling protection and may reflect upfront payments required to be made to enter into the agreement. Widening credit spreads typically represent a deterioration of the referenced obligation’s credit soundness and greater likelihood of default or other credit event occurring as defined under the terms of the agreement. A credit spread identified as “Defaulted” indicates a credit event has occurred for the referenced obligation.
During the six months ended December 31, 2024, the Fund held credit default swaps to manage its exposure to the market or certain sectors of the market, and to reduce its risk exposure to defaults by corporate and sovereign issuers held by the Fund.
The Fund and the Subsidiary typically enter into International Swaps and Derivatives Association, Inc. Master Agreements (“ISDA Master Agreement”) with their OTC derivative contract counterparties in order to, among other things, reduce their credit risk to OTC counterparties. ISDA Master Agreements include provisions for general obligations, representations, collateral and events of default or termination. Under an ISDA Master Agreement, the Fund and the Subsidiary typically may offset with the OTC counterparty certain derivative financial instruments’ payables and/or receivables with collateral held and/or posted and create one single net payment (close-out netting) in the event of default or termination. In the event of a default by an OTC counterparty, the return of collateral with market value in excess of the Fund’s and the Subsidiary’s net liability, held by the defaulting party, may be delayed or denied.
The Fund’s and Subsidiary’s ISDA Master Agreements may contain provisions for early termination of OTC derivative transactions in the event the net assets of the Fund or the Subsidiary decline below specific levels (“net asset contingent features”). If these levels are triggered, the Fund’s and the Subsidiary’s OTC counterparty has the right to terminate such transaction and require the Fund or the Subsidiary to pay or receive a settlement amount in connection with the terminated transaction. For additional details, please refer to netting arrangements by the OTC counterparty tables below.
| ABFunds.com | AB CarVal Credit Opportunities Fund 41 | |
NOTES TO CONSOLIDATED FINANCIAL STATEMENTS (continued)
During the six months ended December 31, 2024, the Fund had entered into the following derivatives:
Asset Derivatives | Liability Derivatives | |||||||||||
Derivative Type | Statement of | Fair Value | Statement of | Fair Value | ||||||||
Interest rate contracts |
Receivable/Payable for variation margin on centrally cleared swaps |
$ |
1,399,834 |
* | ||||||||
Foreign currency contracts |
Unrealized appreciation on forward currency exchange contracts |
$ |
3,250,264 |
|
Unrealized depreciation on forward currency exchange contracts |
|
907,879 |
| ||||
Credit contracts | Market value on credit default swaps | 43,897 | ||||||||||
|
|
|
| |||||||||
Total | $ | 3,250,264 | $ | 2,351,610 | ||||||||
|
|
|
| |||||||||
| * | Only variation margin receivable/payable at period end is reported within the consolidated statement of assets and liabilities. |
This amount reflects cumulative unrealized appreciation/(depreciation) on centrally cleared swaps as reported in the consolidated portfolio of investments. |
Derivative Type | Location of | Realized Gain or (Loss) on Derivatives | Change in Unrealized Appreciation or (Depreciation) | |||||||||
Foreign currency contracts | Net realized gain (loss) on forward currency exchange contracts; Net change in unrealized appreciation (depreciation) of forward currency exchange contracts | $ | (204,961 | ) | $ | 1,697,666 | ||||||
Interest rate contracts | Net realized gain (loss) on swaps; Net change in unrealized appreciation/depreciation of swaps | – 0 | – | (1,399,834 | ) | |||||||
Credit contracts | Net realized gain (loss) on swaps; Net change in unrealized appreciation/depreciation of swaps | (6,891 | ) | 2,961 | ||||||||
|
|
|
| |||||||||
Total | $ | (211,852 | ) | $ | 300,793 | |||||||
|
|
|
| |||||||||
42 AB CarVal Credit Opportunities Fund | ABFunds.com | |
NOTES TO CONSOLIDATED FINANCIAL STATEMENTS (continued)
The following table represents the average monthly volume of the Fund’s derivative transactions during the six months ended December 31, 2024:
Forward Currency Exchange Contracts: | ||||
Average principal amount of buy contracts | $ | 9,326,646 | ||
Average principal amount of sale contracts | $ | 55,477,056 | ||
Centrally Cleared Interest Rate Swaps: | ||||
Average notional amount | $ | 85,697,064 | ||
Credit Default Swaps: | ||||
Average notional amount of buy contracts | $ | 2,256,000 |
For financial reporting purposes, the Fund does not offset derivative assets and derivative liabilities that are subject to netting arrangements in the consolidated statement of assets and liabilities.
All OTC derivatives held at period end were subject to netting arrangements. The following table presents the Fund’s derivative assets and liabilities by OTC counterparty net of amounts available for offset under ISDA Master Agreements (“MA”) and net of the related collateral received/pledged by the Fund as of December 31, 2024. Exchange-traded derivatives and centrally cleared swaps are not subject to netting arrangements and as such are excluded from the table.
Counterparty | Derivative Assets Subject to a MA | Derivatives Available for Offset | Cash Collateral Received* | Security Collateral Received* | Net Amount of Derivative Assets | |||||||||||||||
HSBC Bank USA | $ | 3,250,264 | $ | (907,879 | ) | $ | – 0 | – | $ | – 0 | – | $ | 2,342,385 | |||||||
|
|
|
|
|
|
|
|
|
| |||||||||||
Total | $ | 3,250,264 | $ | (907,879 | ) | $ | – 0 | – | $ | – 0 | – | $ | 2,342,385 | ^ | ||||||
|
|
|
|
|
|
|
|
|
| |||||||||||
Counterparty | Derivative Liabilities Subject to a MA | Derivatives Available for Offset | Cash Collateral Pledged* | Security Collateral Pledged* | Net Amount of Derivative Liabilities | |||||||||||||||
Barclay Bank PLC | $ | 43,897 | $ | – 0 | – | $ | – 0 | – | $ | – 0 | – | $ | 43,897 | |||||||
HSBC Bank USA | 907,879 | (907,879 | ) | – 0 | – | – 0 | – | – 0 | – | |||||||||||
|
|
|
|
|
|
|
|
|
| |||||||||||
Total | $ | 951,776 | $ | (907,879 | ) | $ | – 0 | – | $ | – 0 | – | $ | 43,897 | |||||||
|
|
|
|
|
|
|
|
|
| |||||||||||
| * | The actual collateral received/pledged may be more than the amount reported due to over-collateralization. |
| ^ | Net amount represents the net receivable/payable that would be due from/to the counterparty in the event of default or termination. The net amount from OTC financial derivative instruments can only be netted across transactions governed under the same master agreement with the same counterparty. |
3. Currency Transactions
The Fund may invest in non-U.S. Dollar-denominated securities on a currency hedged or unhedged basis. The Fund may seek investment opportunities by taking long or short positions in currencies through the use of currency-related derivatives, including forward currency exchange contracts, and options on futures, swaps, and other options. The Fund may enter into transactions for investment opportunities when it anticipates that a foreign currency will appreciate or depreciate in value but securities denominated in that currency are not held by the Fund and do not present attractive investment opportunities. Such transactions may also be used when the Adviser believes that it may be more
| ABFunds.com | AB CarVal Credit Opportunities Fund 43 | |
NOTES TO CONSOLIDATED FINANCIAL STATEMENTS (continued)
efficient than a direct investment in a foreign currency-denominated security. The Fund may also conduct currency exchange contracts on a spot basis (i.e., for cash at the spot rate prevailing in the currency exchange market for buying or selling currencies).
NOTE E
Shares of Beneficial Interest
Transactions in shares of beneficial interest were as follows:
| Shares | Amount | |||||||||||||||||||||||
| Six Months Ended December 31, 2024 (unaudited) | February 23, 2024(a) to June 30, 2024 | Six Months Ended December 31, 2024 (unaudited) | February 23, 2024(a) to June 30, 2024 | |||||||||||||||||||||
|
| |||||||||||||||||||||||
| Class A(b) |
| |||||||||||||||||||||||
Shares sold | 977 | – 0 | – | $ | 10,031 | $ | – 0 | – | ||||||||||||||||
| ||||||||||||||||||||||||
Shares issued in reinvestment of dividends and distributions | 36 | – 0 | – | 358 | – 0 | – | ||||||||||||||||||
| ||||||||||||||||||||||||
Net increase | 1,013 | – 0 | – | $ | 10,389 | $ | – 0 | – | ||||||||||||||||
| ||||||||||||||||||||||||
| Advisor Class | ||||||||||||||||||||||||
Shares sold | 6,123,102 | 17,312,103 | $ | 62,247,779 | $ | 173,445,929 | ||||||||||||||||||
| ||||||||||||||||||||||||
Shares issued on reinvestment of dividends | 590,786 | 102,346 | 5,915,650 | 1,031,648 | ||||||||||||||||||||
| ||||||||||||||||||||||||
Shares redeemed | (2,375,703 | ) | – 0 | – | (24,349,172 | ) | – 0 | – | ||||||||||||||||
| ||||||||||||||||||||||||
Net increase | 4,338,185 | 17,414,449 | $ | 43,814,257 | $ | 174,477,577 | ||||||||||||||||||
| ||||||||||||||||||||||||
| Class C(b) |
| |||||||||||||||||||||||
Shares sold | 978 | – 0 | – | $ | 10,031 | – 0 | – | |||||||||||||||||
| ||||||||||||||||||||||||
Shares issued in reinvestment of dividends and distributions | 35 | – 0 | – | 353 | – 0 | – | ||||||||||||||||||
| ||||||||||||||||||||||||
Net increase | 1,013 | – 0 | – | $ | 10,384 | $ | – 0 | – | ||||||||||||||||
| ||||||||||||||||||||||||
| Class U(b) | ||||||||||||||||||||||||
Shares sold | 978 | – 0 | – | $ | 10,031 | – 0 | – | |||||||||||||||||
| ||||||||||||||||||||||||
Shares issued in reinvestment of dividends and distributions | 36 | – 0 | – | 358 | – 0 | – | ||||||||||||||||||
| ||||||||||||||||||||||||
Net increase | 1,014 | – 0 | – | $ | 10,389 | $ | – 0 | – | ||||||||||||||||
| ||||||||||||||||||||||||
| (a) | Commenced operations. |
| (b) | Commenced operations September 17, 2024 |
44 AB CarVal Credit Opportunities Fund | ABFunds.com | |
NOTES TO CONSOLIDATED FINANCIAL STATEMENTS (continued)
NOTE F
Risks Involved in Investing in the Fund
Investing in the Fund involves certain risks and the Fund may not be able to achieve its intended results for a variety of reasons, including, among others, the possibility that the Adviser may not be able to structure the Fund’s investment program as anticipated.
Any investment in financial instruments carries certain market risks. An investment in the Fund is highly speculative and involves a high degree of risk due to the nature of the Fund’s investments and the investment strategies and trading strategies to be employed by the Fund. An investment in the Fund should not in itself be considered a balanced investment program. Shareholders should be able to withstand the loss of their entire investment.
The success of the Fund may be affected by general economic and market conditions, such as changes in interest rates, availability of credit, credit defaults, inflation rates, economic uncertainty, changes in laws (including laws relating to taxation of the Fund’s investments), trade barriers and sanctions, currency exchange controls, market structure, liquidity, transparency and access, capital and margin requirements affecting the Fund and its intermediaries, and national and international political circumstances (including wars, terrorist acts or security operations). These factors may affect the level and volatility of financial instruments’ prices and the liquidity of the Fund’s investments. Volatility or illiquidity could impair the Fund’s profitability or result in losses. The Fund may maintain substantial trading positions that can be adversely affected by the level of volatility in the financial markets, the larger the positions, the greater the potential for loss.
Market disruption can be caused by economic, financial or political events and factors, including but not limited to, international wars or conflicts (including Russia’s military invasion of Ukraine or the conflict between Israel and Hamas), geopolitical developments (including trading and tariff arrangements, sanctions and cybersecurity attacks), instability in regions such as Asia, Eastern Europe and the Middle East, terrorism, natural disasters and public health epidemics and pandemics (including the outbreak of COVID-19 globally). The extent and duration of such events and resulting market disruptions cannot be predicted but could be substantial and could magnify the impact of other risks to the Fund. These and other similar events could adversely affect the U.S. and foreign financial markets and lead to increased market volatility, reduced liquidity in the securities markets, significant negative impacts on issuers and the markets for certain securities and commodities and/or government intervention. They may also cause short- or long-term economic uncertainties in the United States and worldwide. As a result, whether or not the Fund invests in securities of issuers located in or with significant exposure to the countries directly affected, the value and liquidity of the Fund’s investments may be negatively impacted. Further, due
| ABFunds.com | AB CarVal Credit Opportunities Fund 45 | |
NOTES TO CONSOLIDATED FINANCIAL STATEMENTS (continued)
to closures of certain markets and restrictions on trading certain securities, the value of certain securities held by the Fund could be significantly impacted.
Widespread disease, including the outbreak of COVID-19 as well as other pandemics and epidemics, and natural or environmental disasters, such as earthquakes, droughts, fires, floods, hurricanes, tsunamis and climate-related phenomena generally, have been and can be highly disruptive to economies and markets, adversely impacting individual companies, sectors, industries, markets, currencies, interest and inflation rates, credit ratings, investor sentiment, and other factors affecting the value of the Fund’s investments. Economies and financial markets throughout the world have become increasingly interconnected, which increases the likelihood that events or conditions in one region or country will adversely affect markets or issuers in other regions or countries, including the United States. Additionally, market disruptions may result in increased market volatility; regulatory trading halts; closure of domestic or foreign exchanges, markets or governments; or market participants operating pursuant to business continuity plans for indeterminate periods of time. Further, market disruptions can (i) prevent the Fund from executing advantageous investment decisions in a timely manner, (ii) negatively impact the Fund’s ability to achieve its investment objective, as well as the operations of the Fund and the Adviser, and (iii) may exacerbate the risks discussed elsewhere in this prospectus, including political, social and economic risks.
Global economies and financial markets have become increasingly interconnected, which increases the possibility that economic, financial or political events and factors in one country or region might adversely impact issuers in a different country or region or worldwide.
The performance of the Fund may be volatile and subject to risk. The use of leverage will allow the Fund to make additional investments, thereby increasing its exposure to assets, such that its total assets may be greater than its capital. However, leverage will also magnify the volatility of changes in the value of the Fund’s portfolio. The effect of the use of leverage by the Fund in a market that moves adversely to its investments could result in substantial losses to the Fund, which would be greater than if the Fund were not leveraged.
The Fund may have exposure to interest rate risks, meaning that changes in prevailing interest rates could negatively affect the value of the Fund. Interest rate changes may affect the cash flows of an investment directly; the discount rate applied to those cash flows to determine present value; the cost of leverage; or the market yield requirement (and thereby realizable value) of a debt or equity instrument, real asset or item of collateral.
The Fund may utilize investments for risk management purposes in order to: (i) protect against possible changes in the market value of the Fund’s investment portfolio resulting from fluctuations in the markets and changes in interest rates;
46 AB CarVal Credit Opportunities Fund | ABFunds.com | |
NOTES TO CONSOLIDATED FINANCIAL STATEMENTS (continued)
(ii) protect the Fund’s unrealized gains in the value of its investment portfolio; (iii) facilitate the sale of any investments; (iv) enhance or preserve returns, spreads or gains on any investment in the Fund’s portfolio; (v) hedge against a directional trade; (vi) hedge the interest rate, credit or currency exchange rate on any of the Fund’s investments; (vii) protect against any increase in the price of any investments the Fund anticipates purchasing at a later date; or (viii) act for any other reason that the Adviser deems appropriate. The Fund will not be required to hedge any particular risk in connection with a particular transaction or its portfolio generally. The Adviser may be unable to anticipate the occurrence of a particular risk and, therefore, may be unable to attempt to hedge against it. While the Fund may enter into hedging transactions to seek to reduce risk, such transactions may result in a poorer overall performance for the Fund than if it had not engaged in any such hedging transaction. Moreover, the portfolio will always be exposed to certain risks that cannot be hedged.
Certain investments may be illiquid because, for example, they are subject to legal or other restrictions on transfer or there is no liquid market for such investments. Valuation of such investments may be difficult or uncertain because there may be limited information available about the issuers of such investments. The market prices, if any, for such investments tend to be volatile and may not be readily ascertainable, and the Fund may not be able to sell them when it desires to do so or to realize what it perceives to be their fair value in the event of a sale. The sale of restricted and illiquid investments often requires more time and results in higher brokerage charges or dealer discounts and other selling expenses than does the sale of investments eligible for trading on national securities exchanges or in the over-the-counter markets. The Fund may not be able to readily dispose of such illiquid investments and, in some cases, may be contractually prohibited from disposing of such investments for a specified period of time. As a result, the Fund may be required to hold such investments despite adverse price movements. Even those markets which the Adviser expects to be liquid can experience periods, possibly extended periods, of illiquidity. Occasions have arisen in the past where previously liquid investments have rapidly become illiquid.
Securities that are not listed on a stock exchange or traded on an over the counter market may be subject to higher risks than listed securities. Because of the absence of any trading market for unlisted securities, it may take longer to liquidate, or it may not be possible to liquidate, positions in unlisted securities than would be the case for publicly traded securities. Companies whose securities are not publicly traded may not be subject to public disclosure and other investor protection requirements applicable to publicly traded securities.
The Fund may invest in “below investment grade” securities (commonly referred to as “high yield” securities or “junk bonds”) and obligations of issuers in weak financial condition, experiencing poor operating results, having substantial capital
| ABFunds.com | AB CarVal Credit Opportunities Fund 47 | |
NOTES TO CONSOLIDATED FINANCIAL STATEMENTS (continued)
needs or negative net worth, facing special competitive or product obsolescence problems (including companies involved in bankruptcy or other reorganization and liquidation proceedings). Below investment grade securities in which the Fund may invest also include defaulted and partially defaulted loans. Such investments are likely to be particularly risky although they also may offer the potential for correspondingly high returns. Any one or all of the issuers of the securities in which the Fund may invest may be unsuccessful or not show any return for a considerable period of time.
Among the risks inherent in investments in troubled entities is the risk that it frequently may be difficult to obtain information as to the true condition of such issuers. Such investments may also be adversely affected by laws relating to, among other things, fraudulent transfers and other voidable transfers or payments, lender liability and the bankruptcy court’s power to disallow, reduce, subordinate, recharacterize debt as equity or disenfranchise particular claims. Such companies’ obligations may be considered speculative, and the ability of such companies to pay their debts on schedule could be affected by adverse interest rate movements, changes in the general economic climate, economic factors affecting a particular industry or specific developments within such companies. In addition, there is no minimum credit standard that is a prerequisite to the Fund’s investments. There is no assurance that value of the assets collateralizing the Fund’s investments will be sufficient or that prospects for a successful reorganization or similar action will become available. Unless such loans are most senior, in any reorganization or liquidation proceeding relating to a company in which the Fund invests, the Fund may lose its entire investment, may be required to accept cash or securities with a value less than its original investment and/or may be required to accept payment over an extended period of time. Under such circumstances, the returns generated from the Fund’s investments may not compensate investors adequately for the risks assumed. In addition, under certain circumstances, payments and distributions may be disgorged if any such payment is later determined to have been a fraudulent conveyance or a preferential payment.
Certain fixed-income securities invested in by the Fund could be subject to U.S. federal, state or non-U.S. bankruptcy laws or fraudulent transfer or conveyance laws, if such securities were issued with the intent of hindering, delaying or defrauding creditors or, in certain circumstances, if the issuer receives less than reasonably equivalent value or fair consideration in return for issuing such securities. If a court were to find that the issuance of the securities was a fraudulent transfer or conveyance, the court could void the payment obligations under the securities, further subordinate the securities to other existing and future indebtedness of the issuer or require the Fund to repay any amounts received by it with respect to the securities. In the event of a finding that a fraudulent transfer or conveyance occurred, the Fund may not receive any payment on the securities. If the Fund or the Adviser is found to have interfered with the affairs of a
48 AB CarVal Credit Opportunities Fund | ABFunds.com | |
NOTES TO CONSOLIDATED FINANCIAL STATEMENTS (continued)
company in which the Fund holds a debt investment, to the detriment of other creditors or common shareholders of such company, the Fund may be held liable for damages to injured parties or a bankruptcy court. While the Fund will attempt to avoid taking the types of action that would lead to such liability, there can be no assurance that such claims will not be asserted or that the Fund will be able to successfully defend against them. Moreover, such debt may be disallowed or subordinated to the claims of other creditors or treated as equity.
Insofar as the Fund’s portfolio includes obligations of non-U.S. obligors, the laws of certain foreign jurisdictions may provide for avoidance remedies under factual circumstances similar to those described above or under different circumstances, with consequences that may or may not be analogous to those described above under U.S. federal or state laws. Changes in bankruptcy laws (including U.S. federal and state laws and applicable non-U.S. laws) may adversely impact the Fund’s securities.
Debt securities of all types of issuers may have speculative characteristics, regardless of whether they are rated. The issuers of such instruments (including sovereign issuers) may face significant ongoing uncertainties and exposure to adverse conditions that may undermine the issuer’s ability to make timely payment of interest and principal in accordance with the terms of the obligations.
The Fund may enter into options, futures, forwards, swaps and other derivative instruments, such as credit derivatives. Derivative instruments may be subject to various types of risks, including market risk, liquidity risk, the risk of non-performance by the counterparty, including risks relating to the financial soundness and creditworthiness of the counterparty, legal risk and operations risk. The prices of derivative instruments can be highly volatile. Depending on the nature of the derivative, price movements may be influenced by interest rates, changing supply and demand relationships, trade, fiscal, monetary and exchange control programs and policies of governments, and national and international political and economic events and policies. Additional regulation of derivatives may make derivatives more costly, limit their availability or utility, otherwise adversely affect their performance, or disrupt markets. In addition, the Fund may, in the future, take advantage of opportunities with respect to certain other derivative instruments that are not presently contemplated for use or that are currently not available. Special risks may apply in the future that cannot be determined at this time. The regulatory and tax environment for derivative instruments in which the Fund may participate is evolving, and changes in the regulation or taxation of such financial instruments may have a material adverse effect on the Fund.
Debt portfolios of the kind the Fund will acquire typically comprise large numbers of heterogeneous, bilaterally negotiated loans which may be performing, sub- or non-performing and possibly in default. Furthermore, the obligor or relevant
| ABFunds.com | AB CarVal Credit Opportunities Fund 49 | |
NOTES TO CONSOLIDATED FINANCIAL STATEMENTS (continued)
guarantor may also be in bankruptcy or liquidation. In addition to credit risk and interest rate risk, these portfolios may carry a number of idiosyncratic risks, including: limited representations and warranties from the selling institution; risk that liens over collateral are improperly recorded; incomplete or inconsistent documentation; incomplete payment history; impairment or illiquidity of collateral; inability to secure title to collateral; and the effectiveness of the loan servicer. There can be no assurance as to the amount and timing of payments, if any, with respect to the loans.
The Fund may invest in securities of non-U.S. companies and non-U.S. countries. Investing in the securities of such companies and countries involves certain considerations not usually associated with investing in securities of U.S. companies or the U.S. Government, including political and economic considerations, such as greater risks of expropriation and nationalization, confiscatory taxation, the potential difficulty of repatriating funds, general social, political and economic instability and adverse diplomatic developments; the possibility of imposition of withholding or other taxes on dividends, interest, capital gain, sale proceeds or other income; the small size of the securities markets in such countries and the low volume of trading, resulting in potential lack of liquidity and in price volatility; fluctuations in the rate of exchange between currencies and costs associated with currency conversion; and certain government policies that may restrict the Fund’s investment opportunities. The economies of non-U.S. countries may differ favorably or unfavorably from the U.S. economy in such respects as growth of gross domestic product, rate of inflation, currency depreciation, asset reinvestment, resource self-sufficiency and balance of payments position. Further, certain non-U.S. economies are heavily dependent upon international trade and accordingly have been and may continue to be adversely affected by trade barriers, exchange controls, managed adjustments in relative currency values and other protectionist measures imposed or negotiated by the countries with which they trade. The economies of certain non-U.S. countries may be based, predominantly, on only a few industries and may be vulnerable to changes in trade conditions and may have higher levels of debt or inflation. In addition, accounting and financial reporting standards that prevail in non-U.S. countries generally are not equivalent to U.S. standards and, consequently, less information may be available to investors in companies located in non-U.S. countries than is available to investors in companies located in the U.S. There also may be less regulation, generally, of the securities markets in non-U.S. countries than there is in the U.S. The values and relative yields of investments in the securities markets of different countries, and their associated risks, are expected to change independently of each other.
Investing in emerging markets involves additional risks and special considerations not typically associated with investing in other more established economies or markets. Among other things, emerging market investments may be subject to the following risks: less publicly available information; more volatile
50 AB CarVal Credit Opportunities Fund | ABFunds.com | |
NOTES TO CONSOLIDATED FINANCIAL STATEMENTS (continued)
markets and unstable market conditions; dependence on exports and international trade; changes in interest rates; availability of credit and inflation rates; less liquidity or available credit; uncertainty in enforceability of documents; changes in local laws and regulations (including nationalization of industries); political, social or economic instability (including wars, terrorist acts or security operations); the relatively small size of the securities markets in such countries and the low volume of trading and less strict securities market regulation; less favorable tax or legal provisions; price controls and other restrictive governmental actions; changes in or non-approval of tariffs or other fees or rates charged by or to portfolio companies; potential severe inflation or other serious adverse economic developments; unstable currency; expropriation of property; confiscatory taxation; imposition of withholding or other taxes, duties or levies on dividends, interest, capital gains, other income or gross sale or disposition proceeds; limitations on the removal of funds or other assets of the Fund; less government supervision and regulation of business and industry practices, stock exchanges, over-the-counter markets, brokers and dealers; poverty and unemployment; fluctuations in the rate of exchange between currencies, non-convertibility of currencies which can result in the inability to repatriate funds; costs associated with currency conversion; certain government policies that may restrict the Fund’s investment opportunities; longer settlement periods for transactions and less reliable clearance and custody arrangements; differences in accounting, auditing and financial reporting standards which may result in the unavailability of material information about issuers; difficulties pursuing legal remedies or in obtaining or enforcing judgments in non-U.S. courts; less-developed corporate laws regarding fiduciary duties of officers and directors and the protection of investors; and certain considerations regarding the maintenance of the Fund’s financial instruments with non-U.S. brokers and securities depositories. The foregoing may result in lack of liquidity and in price volatility.
The Fund may acquire assets related to the aviation industry. Investments in securitizations and other financial instruments backed by aircraft and aircraft equipment are subject to a number of risks relating to the aviation industry including reduced leasing of aircraft and related equipment by commercial airlines and the commercial aviation industry generally, reduction in demand for any one aircraft or type of aircraft, the maintenance and operating history of the specific aircraft or components that back such securities, maintenance or performance issues with the model and type of aircraft that back such securities, and regulatory risk relating to the aviation industry. Adverse developments with respect to any of the foregoing may adversely affect the value of securities collateralized or otherwise backed by aircraft or aircraft equipment. In addition, the bankruptcy of the lessors or lessees of the aircraft or aircraft equipment that back such securities may complicate financial recoveries in connection with such securities and therefore have a negative impact on their value. Market events such as economic declines and recessions, geopolitical conflicts and the occurrence or threat of pandemics, terrorism or war may also have an adverse effect
| ABFunds.com | AB CarVal Credit Opportunities Fund 51 | |
NOTES TO CONSOLIDATED FINANCIAL STATEMENTS (continued)
on the aviation industry generally and securities related to the same, especially when such market events cause declines in travel, increases in costs or future uncertainty for airlines, aircraft or the commercial aviation industry generally. For example, as a result of the COVID-19 pandemic, air travel substantially declined, and many airlines became dependent, at least in part, on government aid. There can be no assurance that future events will not have a negative impact on the aviation industry or securities collateralized or otherwise backed by aircraft or aircraft equipment.
The performance of certain of the Fund’s investments may be substantially dependent upon prevailing prices of electricity, oil, natural gas, natural gas liquids, coal and other commodities (such as metals) and the differential between prices of specific commodities that are a primary factor in the profitability of certain conversion activities such as petroleum refining (“crack spread”) and power generation (“spark spread”). Commodity prices have been, and are likely to continue to be, volatile and subject to wide fluctuations in response to any of the following factors: (i) relatively minor changes in the supply of and demand for electricity or such other commodities; (ii) market uncertainty and the condition of various economies (including interest rates, levels of economic activity, the price of securities and the participation by other investors in the financial markets); (iii) political conditions in the U.S. and other project locations; (iv) the extent of domestic production and importation of oil, natural gas, natural gas liquids, coal or metals in certain relevant markets; (v) the foreign supply of oil, natural gas and metals; (vi) the prices of foreign imports; (vii) the level of consumer demand; (viii) the price and availability of alternative electric generation options; (ix) the price of steel and the outlook for steel production; (x) pandemics, wars, sanctions and weather conditions; (xi) the competitive position of electricity, ethanol/biodiesel, oil, gas or coal as a source of energy as compared with other energy sources; (xii) the industry-wide or local refining, transportation or processing capacity for natural gas or transmission capacity for electric energy; (xiii) the effect of U.S. and non-U.S. national, state and local regulation on the production, transportation and sale of electric energy and other commodities; (xiv) breakthrough technologies (such as improved storage or clean coal technologies) or government subsidies, tax credits or other support that allow alternative fuel generation projects to produce more reliable electric energy or lower the cost of such production compared to natural gas fueled electric generation projects; (xv) with respect to the price of oil, actions of the Organization of Petroleum Exporting Countries; or (xvi) the expected consumption of coking coal in steel production. While the Adviser will endeavor to take into account existing and anticipated future applicable greenhouse gas regulation in its investment decisions, changes in the regulation of greenhouse gases could impact an investment or make future investments undesirable.
The Fund may directly or indirectly invest in mortgage real estate investment trusts (“REITs”). A mortgage REIT is a real estate investment trust that invests
52 AB CarVal Credit Opportunities Fund | ABFunds.com | |
NOTES TO CONSOLIDATED FINANCIAL STATEMENTS (continued)
primarily in loans that are secured by real estate collateral and other fixed income instruments. Mortgage REITs are subject to certain risks that are generally associated with real estate debt investments (e.g., real estate market risk, interest rate risk, leverage risk, credit risk, and prepayment risk).
While loans and most other assets invested in by the Fund may be collateralized, the Fund may be exposed to losses resulting from default. Therefore, the value of the underlying collateral, the creditworthiness of the borrower or other counterparty and the priority of the lien are each of great importance. The Fund cannot guarantee the adequacy of the protection of the Fund’s interests, including the validity or enforceability of the applicable investment contract and the maintenance of the anticipated priority and perfection of the applicable security interests. Furthermore, the Fund cannot assure that claims may not be asserted that might interfere with enforcement of the Fund’s rights. In the event of a foreclosure, the Fund may assume direct ownership of the underlying asset. The liquidation proceeds upon sale of such asset may not satisfy the entire outstanding balance of principal and interest payable, resulting in a loss to the Fund. Any costs or delays involved in the effectuation of a foreclosure of the asset or a liquidation of the underlying property will further reduce the proceeds and thus increase the loss.
The Fund’s portfolios may include investments in structured finance securities. Structured finance securities are, generally, debt securities that entitle the holders thereof to receive payments of interest and principal that depend primarily on the cash flow from or sale proceeds of a specified pool of assets, either fixed or revolving, that by their terms convert into cash within a finite time period, together with rights or other assets designed to assure the servicing or timely distribution of proceeds to holders of such securities. If a particular asset or pool of assets held by the Fund becomes securitized with other assets, the value of such asset or pool of assets may be negatively impacted by the value of such other assets in such securitization transaction and may decrease as a result of the securitization.
The investment characteristics of asset-backed securities (“ABS”) and mortgage-backed securities (“MBS”) differ from traditional debt securities. Among the major differences are that interest and principal payments are made more frequently, usually monthly, and that the principal may be prepaid at any time because the underlying loans or other assets generally may be prepaid at any time. The value of MBS and ABS may be particularly sensitive to changes in prevailing interest rates. Early payments of principal on some MBS may occur during periods of falling mortgage interest rates and expose the Fund to a lower rate of return upon reinvestment of principal. Early payments associated with MBS cause these securities to experience significantly greater price and yield volatility than is experienced by traditional fixed-income securities. During periods of rising interest
| ABFunds.com | AB CarVal Credit Opportunities Fund 53 | |
NOTES TO CONSOLIDATED FINANCIAL STATEMENTS (continued)
rates, a reduction in prepayments may increase the effective life of MBS, subjecting them to greater risk of decline in market value in response to rising interest rates. If the life of a MBS is inaccurately predicted, the Fund may not be able to realize the rate of return it expected.
CLOs and other structured finance securities are generally backed by a pool of credit-related assets that serve as collateral. Accordingly, CLO and structured finance securities present risks similar to those of other types of credit investments, including default (credit), interest rate and prepayment risks. In addition, CLOs and other structured finance securities are often governed by a complex series of legal documents and contracts, which increases the risk of dispute over the interpretation and enforceability of such documents relative to other types of investments. There is also a risk that the trustee of a CLO does not properly carry out its duties to the CLO, potentially resulting in loss to the CLO. CLOs are also inherently leveraged vehicles and are subject to leverage risk.
Structured notes, variable rate mortgage-backed and asset-backed securities each have rates of interest that vary based on a designated floating rate formula or index. The value of these investments is closely tied to the absolute levels of such rates or indices, or the market’s perception of anticipated changes in those rates or indices. The movements in specific indices or interest rates may be difficult or impossible to hedge.
The Fund is classified as a “non-diversified” investment company under the 1940 Act. Therefore, the Fund may invest a relatively higher percentage of its assets in a relatively smaller number of issuers and may invest a larger proportion of its assets in a single issuer. As a result, the gains and losses on a single investment may have a greater impact on the Fund’s NAV and may make the Fund more volatile than more diversified funds.
Although the Fund intends to implement a quarterly Share repurchase program, there is no guarantee that an investor will be able to sell all of the Shares that the investor desires to sell. The Fund should therefore be considered to offer limited liquidity.
Although the Fund intends to elect to be treated as a RIC under Subchapter M of the Internal Revenue Code (the “Code”), no assurance can be given that the Fund will be able to qualify for and maintain RIC status. If the Fund qualifies as a RIC under the Code, the Fund generally will not be subject to corporate-level federal income taxes on its income and capital gains that are timely distributed (or deemed distributed) as dividends for U.S. federal income tax purposes to its shareholders. To qualify as a RIC under the Code and to be relieved of federal taxes on income and gains distributed as dividends for U.S. federal income tax purposes to the Fund’s shareholders, the Fund must, among other things, meet certain source-of-income, asset diversification and distribution requirements. The
54 AB CarVal Credit Opportunities Fund | ABFunds.com | |
NOTES TO CONSOLIDATED FINANCIAL STATEMENTS (continued)
distribution requirement for a RIC is satisfied if the Fund distributes to its shareholders dividends each tax year for U.S. federal income tax purposes of an amount generally at least equal to the sum of 90% of the Fund’s investment company taxable income (generally, the sum of its net ordinary income and net short-term capital gains in excess of net long-term capital losses, if any), and 90% of the Fund’s net tax-exempt interest income (if any).
The Fund cannot assure investors that the Fund will achieve investment results that will allow the Fund to make a specified level of cash distributions or year-to-year increases in cash distributions. All distributions will be paid at the discretion of the Board and may depend on the Fund’s earnings, the Fund’s net investment income, the Fund’s financial condition, maintenance of the Fund’s and the Fund’s RIC status, compliance with applicable regulations and such other factors as the Board may deem relevant from time to time.
The Fund will employ certain strategies which depend upon the reliability, accuracy and analysis of the Adviser’s analytical models. To the extent such models (or the assumptions underlying them) do not prove to be correct, the Fund may not perform as anticipated, which could result in substantial losses. All models ultimately depend upon the Adviser’s judgment and the assumptions embedded in them. To the extent that with respect to any investment, the judgment or assumptions are incorrect, the Fund can suffer losses.
The Fund has limited operating history. There can be no assurance that the Fund will grow to or maintain an economically viable size, in which case the Board may determine to liquidate the Fund if it determines that liquidation is in the best interest of shareholders. Liquidation of the Fund can be initiated without shareholder approval. As a result, the timing of the Fund’s liquidation may not be favorable to a shareholder.
NOTE G
Tax Information
The tax character of distributions to be paid for the year ending June 30, 2025 will be determined at the end of the current fiscal year.
The tax character of distributions paid during the fiscal period ended June 30, 2024 was as follows:
| 2024 | ||||
Distributions paid from: | ||||
Ordinary income | $ | 1,430,475 | ||
|
| |||
Total distributions paid | $ | 1,430,475 | ||
|
| |||
| ABFunds.com | AB CarVal Credit Opportunities Fund 55 | |
NOTES TO CONSOLIDATED FINANCIAL STATEMENTS (continued)
As of June 30, 2024, the components of accumulated earnings (deficit) on a tax basis were as follows:
Undistributed ordinary income | $ | 3,583,609 | ||
Unrealized appreciation (depreciation) | 1,457,028 | (a) | ||
Other temporary differences | (245,359 | )(b) | ||
|
| |||
Total accumulated earnings (deficit) | $ | 4,795,278 | ||
|
|
| (a) | The differences between book-basis and tax-basis unrealized appreciation (depreciation) are attributable primarily to the recognition for tax purposes of unrealized gains/losses on certain derivative instruments, the tax treatment of earnings from the Subsidiaries, investments in partnerships, swaps and debt instruments, and the tax deferral of losses on wash sales. |
| (b) | Other temporary differences is attributable to amortization of organizational costs. |
NOTE H
Subsequent Events
Management has evaluated subsequent events for possible recognition or disclosure in the consolidated financial statements through the date the consolidated financial statements are issued. Management has determined that there are no material events that would require disclosure in the Fund’s consolidated financial statements through this date.
56 AB CarVal Credit Opportunities Fund | ABFunds.com | |
CONSOLIDATED FINANCIAL HIGHLIGHTS
Selected Data For A Share Of Capital Stock Outstanding Throughout Each Period
| Class A | ||||
| September 17, 2024(a) to December 31, 2024 (unaudited) | ||||
|
| |||
Net asset value, beginning of period | $ 10.00 | |||
|
| |||
Income From Investment Operations | ||||
Net investment income(b)(c) | .20 | |||
Net realized and unrealized gain on investment and foreign currency transactions | .09 | |||
|
| |||
Net increase in net asset value from operations | .29 | |||
|
| |||
Less: Dividends and Distributions | ||||
Dividends from net investment income | (.28 | ) | ||
Distributions from net realized gain on investment transactions | (.08 | ) | ||
|
| |||
Total dividends and distributions | (.36 | ) | ||
|
| |||
Net asset value, end of period | $ 9.93 | |||
|
| |||
Total Return | ||||
Total investment return based on net asset value(d) | .34 | % | ||
Ratios/Supplemental Data | ||||
Net assets, end of period (000’s omitted) | $10 | |||
Ratio to average net assets of: | ||||
Expenses, net of waivers/reimbursements | 3.05 | %^ | ||
Expenses, before waivers/reimbursements | 3.85 | %^ | ||
Net investment income(c) | 6.65 | %^ | ||
Portfolio turnover rate | 47 | % | ||
See footnote summary on page 60.
| ABFunds.com | AB CarVal Credit Opportunities Fund 57 | |
CONSOLIDATED FINANCIAL HIGHLIGHTS
Selected Data For A Share Of Capital Stock Outstanding Throughout Each Period
| Advisor Class | ||||||||
| Six Months Ended December 31, 2024 (unaudited) | February 23, 2024(a) to Ended June 30, | |||||||
|
|
|
| |||||
Net asset value, beginning of period | $ 10.18 | $ 10.00 | ||||||
|
|
|
| |||||
Income From Investment Operations | ||||||||
Net investment income(b)(c) | .31 | .25 | ||||||
Net realized and unrealized gain (loss) on investment and foreign currency transactions | (.06 | ) | .02 | |||||
|
|
|
| |||||
Net increase (decrease) in net asset value from operations | .25 | .27 | ||||||
|
|
|
| |||||
Less: Dividends and Distributions | ||||||||
Dividends from net investment income | (.41 | ) | (.09 | ) | ||||
Distributions from net realized gain on investment transactions | (.08 | ) | – 0 | – | ||||
|
|
|
| |||||
Total dividends and distributions | (.49 | ) | (.09 | ) | ||||
|
|
|
| |||||
Net asset value, end of period | $ 9.94 | $ 10.18 | ||||||
|
|
|
| |||||
Total Return | ||||||||
Total investment return based on net asset value(d) | 2.73 | % | 2.73 | %(e) | ||||
Ratios/Supplemental Data | ||||||||
Net assets, end of period (000’s omitted) | $216,192 | $177,245 | ||||||
Ratio to average net assets of: | ||||||||
Expenses, net of waivers/reimbursements | 2.29 | %^ | 2.03 | %(f)^ | ||||
Expenses, before waivers/reimbursements | 3.06 | %^ | 5.39 | %^ | ||||
Net investment income(c) | 6.12 | %^ | 6.97 | %^ | ||||
Portfolio turnover rate | 47 | % | 32 | % | ||||
See footnote summary on page 60.
58 AB CarVal Credit Opportunities Fund | ABFunds.com | |
CONSOLIDATED FINANCIAL HIGHLIGHTS
Selected Data For A Share Of Capital Stock Outstanding Throughout Each Period
| Class C | ||||
| September 17, 2024(a) to December 31, 2024 (unaudited) | ||||
|
| |||
Net asset value, beginning of period | $ 10.00 | |||
|
| |||
Income From Investment Operations | ||||
Net investment income(b)(c) | .19 | |||
Net realized and unrealized gain on investment and foreign currency transactions | .10 | |||
|
| |||
Net increase in net asset value from operations | .29 | |||
|
| |||
Less: Dividends and Distributions | ||||
Dividends from net investment income | (.28 | ) | ||
Distributions from net realized gain on investment transactions | (.08 | ) | ||
|
| |||
Total dividends and distributions | (.36 | ) | ||
|
| |||
Net asset value, end of period | $ 9.93 | |||
|
| |||
Total Return | ||||
Total investment return based on net asset value(d) | .29 | % | ||
Ratios/Supplemental Data | ||||
Net assets, end of period (000’s omitted) | $10 | |||
Ratio to average net assets of: | ||||
Expenses, net of waivers/reimbursements | 3.29 | %^ | ||
Expenses, before waivers/reimbursements | 4.05 | %^ | ||
Net investment income(c) | 6.41 | %^ | ||
Portfolio turnover rate | 47 | % | ||
See footnote summary on page 60.
| ABFunds.com | AB CarVal Credit Opportunities Fund 59 | |
CONSOLIDATED FINANCIAL HIGHLIGHTS
Selected Data For A Share Of Capital Stock Outstanding Throughout Each Period
| Class U | ||||
| September 17, 2024(a) to December 31, 2024 (unaudited) | ||||
|
| |||
Net asset value, beginning of period | $ 10.00 | |||
|
| |||
Income From Investment Operations | ||||
Net investment income(b)(c) | .20 | |||
Net realized and unrealized gain on investment and foreign currency transactions | .09 | |||
|
| |||
Net increase in net asset value from operations | .29 | |||
|
| |||
Less: Dividends and Distributions | ||||
Dividends from net investment income | (.28 | ) | ||
Distributions from net realized gain on investment transactions | (.08 | ) | ||
|
| |||
Total dividends and distributions | (.36 | ) | ||
|
| |||
Net asset value, end of period | $ 9.93 | |||
|
| |||
Total Return | ||||
Total investment return based on net asset value(d) | .34 | % | ||
Ratios/Supplemental Data | ||||
Net assets, end of period (000’s omitted) | $10 | |||
Ratio to average net assets of: | ||||
Expenses, net of waivers/reimbursements | 3.05 | %^ | ||
Expenses, before waivers/reimbursements | 3.85 | %^ | ||
Net investment income(c) | 6.65 | %^ | ||
Portfolio turnover rate | 47 | % | ||
| (a) | Commencement of operations. |
| (b) | Based on average shares outstanding. |
| (c) | Net of fees waived and expenses reimbursed. |
| (d) | Total investment return is calculated assuming an initial investment made at the net asset value at the beginning of the period, reinvestment of all dividends and distributions at net asset value during the period, and redemption on the last day of the period. Initial sales charges or contingent deferred sales charges are not reflected in the calculation of total investment return. Total return does not reflect the deduction of taxes that a shareholder would pay on fund distributions or the redemption of fund shares. Total investment return calculated for a period of less than one year is not annualized. |
| (e) | The net asset value and total return include adjustments in accordance with accounting principles generally accepted in the United States of America for financial reporting purposes. As such, the net asset value and total return for shareholder transactions may differ from financial statements. |
| (f) | Expenses, net of waivers/reimbursements is inclusive of financing and investment specific expenses, which are excluded from the expense limitation agreement. These expenses were .32%, .31%, .31% and .32% of the total for Class A, Advisor Class, Class C and Class U, respectively. Excluding these costs, the expense ratio to average net assets would have been 2.73%, 2.73%, 1.98% and 2.98% for Class A, Advisor Class, Class C and Class U, respectively. |
| ^ | Annualized. |
See notes to consolidated financial statements.
60 AB CarVal Credit Opportunities Fund | ABFunds.com | |
Privacy Notice
AllianceBernstein and its affiliates (collectively referred to as “AllianceBernstein”, “we”, “our”, and similar pronouns) understand the importance of maintaining the confidentiality and security of our clients’ nonpublic personal information. Nonpublic personal information is personally identifiable financial information about our clients who are natural persons. To provide financial products and services to our clients, we collect nonpublic personal information from a variety of sources, including: (1) information we receive from clients, such as through applications or other forms, which can include a client’s name, address, phone number, social security number, assets, income and other household information, (2) information about client transactions with us, our affiliates and non-affiliated third parties, which can include account balances and transactions history, and (3) information from visitors to our websites provided through online forms, site visitorship data and online information-collecting devices known as “cookies.”
We may disclose all of the nonpublic personal information that we collect about our current and former clients, as described above, to non-affiliated third parties to manage our business and as otherwise required or permitted by law, including those that perform transaction processing or servicing functions, marketing services providers that provide marketing services on our behalf pursuant to a joint marketing agreement, and professional services firms that provide knowledge-based services such as accountants, consultants, lawyers and auditors to help manage client accounts. We require all the third-party providers to adhere to our privacy policy or a functional equivalent.
We may also disclose the nonpublic personal information that we collect about current and former clients, as described above, to our affiliated investment, brokerage, service and insurance companies for the purpose of marketing their products or services to clients under circumstances that are permitted by law, such as if our affiliate has its own relationship with you. We have policies and procedures to ensure that certain conditions are met before an AllianceBernstein affiliated company may use information obtained from another affiliate to solicit clients for marketing purposes.
We will also use nonpublic personal information about our clients for our own internal analysis, analytics, research and development, and to improve and add to our client offerings.
We have policies and procedures designed to safeguard the confidentiality and security of nonpublic personal information about our clients that include restricting access to nonpublic personal information to personnel that have been screened and undergone security and privacy training; to personnel who need it to perform their work functions such as our operations, customer service, account management, finance, quality, vendor management and compliance teams as required to provide services, communicate with you and fulfill our legal obligations.
We employ reasonably designed physical, electronic and procedural safeguards to secure and protect client nonpublic personal information.
If you are in the European Economic Area (“EEA”) or Switzerland, we will comply with applicable legal requirements providing adequate protection for the transfer of personal information to recipients in countries outside of the EEA and Switzerland.
For more information, our Privacy Policy statement can be viewed here: https://www.alliancebernstein.com/abcom/Privacy_Terms/PrivacyPolicy.htm.
AB CarVal Credit Opportunities Fund
66 Hudson Boulevard East
New York, NY 10001
800 221 5672
IVF-COF-0152 
ITEM 2. CODE OF ETHICS.
Not applicable when filing a semi-annual report to shareholders.
ITEM 3. AUDIT COMMITTEE FINANCIAL EXPERT.
Not applicable when filing a semi-annual report to shareholders.
ITEM 4. PRINCIPAL ACCOUNTANT FEES AND SERVICES.
Not applicable when filing a semi-annual report to shareholders.
ITEM 5. AUDIT COMMITTEE OF LISTED REGISTRANTS.
Not applicable.
ITEM 6. INVESTMENTS.
| (a) | Please see Schedule of Investments contained in the Report to Shareholders included under Item 1 of this Form N-CSR. |
| (b) | Not applicable. |
ITEM 7. FINANCIAL STATEMENTS AND FINANCIAL HIGHLIGHTS FOR OPEN-END MANAGEMENT INVESTMENT COMPANIES
Not applicable.
ITEM 8. CHANGES IN AND DISAGREEMENTS WITH ACCOUNTANTS FOR OPEN-END MANAGEMENT INVESTMENT COMPANIES
Not applicable.
ITEM 9. PROXY DISCLOSURES FOR OPEN-END MANAGEMENT INVESTMENT COMPANIES.
Not applicable.
ITEM 10. REMUNERATION PAID TO DIRECTORS, OFFICERS, AND OTHERS OF OPEN-END MANAGEMENT INVESTMENT COMPANIES.
Not applicable.
ITEM 11. STATEMENT REGARDING BASIS FOR APPROVAL OF INVESTMENT ADVISORY CONTRACT.
Not applicable.
ITEM 12. DISCLOSURE OF PROXY VOTING POLICIES AND PROCEDURES FOR CLOSED-END MANAGEMENT INVESTMENT COMPANIES.
Not applicable when filing a semi-annual report to shareholders.
ITEM 13. PORTFOLIO MANAGERS OF CLOSED-END MANAGEMENT INVESTMENT COMPANIES
Not applicable when filing a semi-annual report to shareholders.
ITEM 14. PURCHASES OF EQUITY SECURITIES BY CLOSED-END MANAGEMENT INVESTMENT COMPANY AND AFFILIATED PURCHASERS.
There have been no purchases of equity securities by the Fund or by affiliated parties for the reporting period.
ITEM 15. SUBMISSION OF MATTERS TO A VOTE OF SECURITY HOLDERS.
There have been no material changes to the procedures by which shareholders may recommend nominees to the Fund’s Board of Trustees since the Fund last provided disclosure in response to this item.
ITEM 16. CONTROLS AND PROCEDURES.
(a) The registrant’s principal executive officer and principal financial officer have concluded that the registrant’s disclosure controls and procedures (as defined in Rule 30a-3(c) under the Investment Company Act of 1940, as amended) are effective at the reasonable assurance level based on their evaluation of these controls and procedures as of a date within 90 days of the filing date of this document.
(b) There were no changes in the registrant’s internal controls over financial reporting that occurred during the period covered by this report that has materially affected, or is reasonably likely to materially affect, the registrant’s internal control over financial reporting.
ITEM 17. DISCLOSURE OF SECURITIES LENDING ACTIVITIES FOR CLOSED-END MANAGEMENT INVESTMENT COMPANIES.
The registrant did not engage in securities lending during its most recent fiscal year.
ITEM 18. RECOVERY OF ERRONEOUSLY AWARDED COMPENSATION.
Not applicable.
ITEM 19. EXHIBITS.
SIGNATURES
Pursuant to the requirements of the Securities Exchange Act of 1934 and the Investment Company Act of 1940, the registrant has duly caused this report to be signed on its behalf by the undersigned, thereunto duly authorized.
| (Registrant): AB CarVal Credit Opportunities Fund | ||
| By: | /s/ James Ganley | |
| James Ganley | ||
| Principal Executive Officer | ||
Date: | March 5, 2025 | |
Pursuant to the requirements of the Securities Exchange Act of 1934 and the Investment Company Act of 1940, this report has been signed below by the following persons on behalf of the registrant and in the capacities and on the dates indicated.
| By: | /s/ James Ganley | |
James Ganley | ||
Principal Executive Officer | ||
Date: | March 5, 2025 | |
| By: | /s/ Matthew Johnson | |
Matthew Johnson | ||
Treasurer, Principal Financial Officer and Principal Accounting Officer | ||
Date: | March 5, 2025 | |