Exhibit 4
Management’s Discussion and Analysis
Highlights
| | 2002 | | 2001 | | Change (%) | |
Cash flow(1) | | 2.6 billion | | 2.5 billion | | 6 | |
Net income(2) | | 524 million | | 733 million | | (29 | ) |
Per share | | | | | | | |
Cash flow(1) | | 19.73 | | 18.48 | | 7 | |
Net income(2) | | 3.73 | | 5.25 | | (29 | ) |
Diluted per share | | | | | | | |
Cash flow(1) | | 19.43 | | 18.15 | | 7 | |
Net income(2) | | 3.67 | | 5.16 | | (29 | ) |
Production | | 445 mboe/d | | 419 mboe/d | | 6 | |
Average sales price | | 32.10/boe | | 32.91/boe | | (2 | ) |
Operating costs | | 6.48/boe | | 5.79/boe | | 12 | |
Exploration and development spending | | 1.8 billion | | 1.9 billion | | (2 | ) |
Proved reserve additions (including acquisitions) | | 159 mmboe | | 462 mmboe | | (66 | ) |
Finding,development and acquisition costs | | 12.15/boe | | 7.08/boe | | 72 | |
Production per share | | 1.21 boe/share | | 1.13 boe/share | | 7 | |
(1) | | Cash flow and cash flow per share are non-GAAP measures that represent net income before exploration costs, DD&A, future taxes and other non-cash expenses. The components of cash flow are set out in note 14 to the Consolidated Financial Statements. |
(2) | | Prior year’s comparative has been restated for a new CICA accounting standard (see note 2 to the Consolidated Financial Statements). |
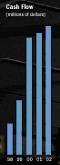

Cash Flow | | Cash Flow Per Share | |
(millions of dollars) | | (dollars) | |
98 | | 631 | | 98 | | 5.64 | |
99 | | 1,111 | | 99 | | 8.91 | |
00 | | 2,413 | | 00 | | 17.51 | |
01 | | 2,494 | | 01 | | 18.48 | |
02 | | 2,645 | | 02 | | 19.73 | |
This discussion and analysis should be read in conjunction with the audited Consolidated Financial Statements of the Company. In particular, note 16 provides segmented financial information that forms the basis for much of the following discussion and analysis. The calculation of barrels of oil equivalent (boe) is based on a conversion rate of six thousand cubic feet (mcf) of natural gas for one barrel of oil. All comparative percentages are between the years ended December 31, 2002 and December 31, 2001, unless stated otherwise. Reported production represents Talisman’s working interest share before royalties unless otherwise noted. Selected quarterly unaudited financial data, including product netbacks, may be found on pages 69 and 70 of this Annual Report.
Included in the Management’s Discussion and Analysis (MD&A) are references to terms commonly used in the oil and gas industry such as cash flow, cash flow per share and EBITDAX. These terms are not defined by Generally Accepted Accounting Principles in either Canada or the US. Consequently these are referred to as non-GAAP measures. Cash flow, as commonly used, appears as a separate caption on the Company’s cash flow statement and is reconciled to both net income and cash flow from operations. EBITDAX is defined on page 27 of this Annual Report.
18

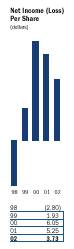
Net Income (Loss) | | Net Income (Loss) Per Share | |
(millions of dollars) | | (dollars) | |
98 | | (314 | ) | 98 | | (2.80 | ) |
99 | | 255 | | 99 | | 1.93 | |
00 | | 857 | | 00 | | 6.05 | |
01 | | 733 | | 01 | | 5.25 | |
02 | | 524 | | 02 | | 3.73 | |
2003 OUTLOOK
Talisman anticipates at least 5% production per share growth in 2003 and 10% in 2004 (after adjusting for Sudan).
• Production is expected to average 395,000-415,000 boe/d, including Sudan volumes in the first quarter.
• Startup of the Malaysia/Vietnam PM-3 CAA Phase 2 and Algeria MLN developments.
• Production of 60-70 mmcf/d in the US.
• Planned exploration and development spending of $2.1 billion ($975 million in North America).
• The Sudan sale is expected to close in the first quarter of 2003.
• Average unit operating costs are expected to increase to $7/boe reflecting the absence of Sudan and a higher operating cost environment.
2002 VARIANCES
The significant variances from 2001 are:
• Increased production volumes contributed $300 million of additional cash flow.
• Lower natural gas prices ($447 million) mostly offset by higher oil and liquids prices ($330 million) and increased hedging gains ($67 million).
• Higher operating expense ($169 million).
• Reduced current taxes ($95 million) mostly on lower natural gas prices in North America.
• Higher DD&A with increased production ($182 million).
• Dry hole and exploration expense increased $99 million.
• Increased future tax due to one time non-cash charge on new UK supplemental oil and gas tax.
Cash flow of $2.6 billion ($19.73/share)(1)
Net income of $524 million ($3.73/share)(1)
NET INCOME AND CASH FLOW VARIANCE
(millions) | | | |
2001 Net income | | 733 | |
Favorable (unfavorable) | | | |
Cash flow variance | | | |
Oil and liquids volumes | | 254 | |
Natural gas volumes | | 46 | |
Natural gas prices | | (447 | ) |
Oil and liquids prices | | 330 | |
Hedging | | 67 | |
Royalties | | 62 | |
Other revenue | | (2 | ) |
Operating expense | | (169 | ) |
Interest expense | | (25 | ) |
Current taxes (including PRT) | | 95 | |
General and administration | | (30 | ) |
Other | | (30 | ) |
Total cash flow variance | | 151 | |
Non-cash items | | | |
Depreciation,depletion and amortization expense | | (182 | ) |
Dry hole expense | | (61 | ) |
Exploration expense | | (38 | ) |
Future taxes (including PRT) | | (76 | ) |
Other | | (3 | ) |
Total non-cash items | | (360 | ) |
2002 Net income(1) | | 524 | |
(1) | | Net income, cash flow and cash flow per share are before preferred security charges of $24 million, net of tax ($42 million, before tax). The components of cash flow are set out in note 14 to the Consolidated Financial Statements. |
TALISMAN’S PERFORMANCE HIGHLIGHTS IN 2002
In 2002, Talisman posted record cash flow of $2.6 billion ($19.73/share). Production also grew to a record 445,000 boe/d.
Progress was made on the Company’s key development projects. The Malaysia/Vietnam PM-3 CAA project is expected to come on stream in 2003. Production commenced in Algeria at year end and is expected to increase through 2003. An expansion at the Corridor gas plant facility in Indonesia was completed in 2002 to support additional future sales under gas sales agreements and memoranda of understanding. Project sanction has been received for the Trinidad development with first production expected in early 2005. The Company also announced a North Sea oil discovery at J-1 and is in the process of establishing a natural gas core area in the US.
On October 30, the Company announced an agreement for the sale of its Sudan operations for $1.2 billion. During 2002 and the early part of 2003, 5.8 million shares (4.5% of shares currently outstanding) were repurchased at an average price of $57.05/share.
19
Cash flow in 2002 was $2.6 billion ($19.73/share), increasing for the fourth straight year and up 6% from last year. Net income was $524 million ($3.73/share), down from 2001, with over half of the decrease due to a one time non-cash expense of $128 million relating to a supplemental 10% tax on UK oil and gas profits. The UK also eliminated government royalties effective January 2003 and accelerated capital allowance deductions. Based on current expected capital expenditures, Talisman anticipates the short term impact of the supplemental tax will be more than offset by the abolition of royalties and accelerated capital allowance deductions and will have a positive impact on cash flow through the end of 2004.
The Company grew production by 6% to average 445,000 boe/d, slightly below the target originally set at the beginning of 2002, due in part to higher than anticipated maintenance in the North Sea. Talisman drilled 439 successful wells in 2002 adding 196 mmboe of reserves, excluding net reserves revisions and acquisitions, replacing 121% of production. Net of revisions and including acquisitions, the Company added 159 mmboe of reserves, replacing 99% of production.
Operating costs were up 12% to $6.48/boe, above the $6/boe target set last year, largely due to higher oil field service and maintenance costs, a higher percentage of North Sea volumes and the strengthening UK Pound Sterling.
SEGMENTED RESULTS REVIEW
Talisman’s operations in 2002 were conducted principally in four geographic segments which are North America, North Sea, Southeast Asia and Sudan. Production had also started in Algeria at year end with the first sale in January 2003. Exploration is being conducted in other areas outside the principal geographic segments. On October 30, 2002, the Company signed an agreement for the sale of its operations in Sudan subject to government and consortium member approvals and other closing conditions.
The following is a brief summary of the financial results of each geographic segment. Additional geographic financial results disclosure may be found in note 16 of the Consolidated Financial Statements. More detailed analysis on the Company’s results can be found after this Segmented Results Review.
NORTH AMERICA
During 2002, the North American operations contributed $437 million or 32% of the Company’s pre-tax segmented income of $1.4 billion, down from $746 million (46% of $1.6 billion) in 2001. The Company’s pre-tax segmented income is before corporate G&A, interest, taxes and non-segmented foreign exchange gains and losses. Net revenue in North America decreased 7% to $1.7 billion due principally to lower natural gas revenue as a result of reduced prices. Total North American operating expenses increased by 4% to $357 million due to industry wide cost pressures, higher processing fees and increased natural gas volumes. DD&A increased to $614 million, up from $585 million due to a full year of amortization of the costs associated with the Petromet acquisition. Dry hole expense increased to $128 million due to the expanded exploration budget, the drilling of deeper natural gas targets and a strategic property review.
NORTH SEA
The North Sea pre-tax segmented income increased slightly to $542 million and accounted for 40% of the Company’s segmented income during 2002, up from 33% in 2001. North Sea net revenue increased 20% to $1.9 billion on higher production volumes and higher oil and liquids prices. Operating
SEGMENTED PRE-TAX INCOME(1)
| | North America | | North Sea | | Southeast Asia | | Sudan | | Other(2) | | Total | |
(millions of dollars) | | 2002 | | 2001 | | 2002 | | 2001 | | 2002 | | 2001 | | 2002 | | 2001 | | 2002 | | 2001 | | 2002 | | 2001 | |
Revenue | | 2,014 | | 2,332 | | 1,971 | | 1,638 | | 486 | | 439 | | 828 | | 638 | | — | | — | | 5,299 | | 5,047 | |
Royalties | | (373 | ) | (558 | ) | (96 | ) | (93 | ) | (130 | ) | (90 | ) | (328 | ) | (248 | ) | — | | — | | (927 | ) | (989 | ) |
Other income | | 38 | | 34 | | 40 | | 46 | | 1 | | 1 | | 1 | | 1 | | — | | — | | 80 | | 82 | |
Net Revenue | | 1,679 | | 1,808 | | 1,915 | | 1,591 | | 357 | | 350 | | 501 | | 391 | | | | | | 4,452 | | 4,140 | |
Expenses | | | | | | | | | | | | | | | | | | | | | | | | | |
Operating | | (357 | ) | (343 | ) | (588 | ) | (467 | ) | (86 | ) | (70 | ) | (84 | ) | (66 | ) | — | | — | | (1,115 | ) | (946 | ) |
DD&A | | (614 | ) | (585 | ) | (701 | ) | (558 | ) | (87 | ) | (93 | ) | (93 | ) | (77 | ) | — | | — | | (1,495 | ) | (1,313 | ) |
Dry hole | | (128 | ) | (54 | ) | (9 | ) | (21 | ) | (4 | ) | (8 | ) | (13 | ) | (16 | ) | (20 | ) | (14 | ) | (174 | ) | (113 | ) |
Exploration | | (66 | ) | (69 | ) | (20 | ) | (30 | ) | (19 | ) | (8 | ) | (6 | ) | (11 | ) | (74 | ) | (29 | ) | (185 | ) | (147 | ) |
Other | | (77 | ) | (11 | ) | (55 | ) | 23 | | (11 | ) | 2 | | 5 | | (11 | ) | 7 | | (8 | ) | (131 | ) | (5 | ) |
| | 437 | | 746 | | 542 | | 538 | | 150 | | 173 | | 310 | | 210 | | (87 | ) | (51 | ) | 1,352 | | 1,616 | |
(1) Segmented pre-tax income is before corporate G&A,interest,taxes and non-segmented foreign exchange gains and losses.
(2) Other in 2002 and 2001 primarily relates to exploration activities in Trinidad, Algeria and Colombia.
20
expense increased to $588 million, up 26% from 2001 with higher volumes, the strengthening Pound Sterling and increased maintenance and well workovers. DD&A increased to $701 million, up from $558 million, due to increased volumes and higher depreciation rates at certain fields. Other expense includes property impairments of $74 million.
SOUTHEAST ASIA
Southeast Asia contributed 11% ($150 million) to the Company’s pre-tax segmented income in both 2002 and 2001. An increase in oil revenues, primarily from the inclusion of a full year of production from PM-3 CAA in Malaysia/Vietnam, more than offset higher royalties in Indonesia to increase net revenues to $357 million. Net revenue from natural gas sales were unchanged. Operating costs increased $16 million to $86 million with the inclusion of a full year of operating costs from PM-3 CAA and higher overhead costs at Corridor in Indonesia. DD&A decreased $6 million to $87 million in 2002 due to 2001 including minor asset impairments. Exploration expense increased $11 million due to the increased spending in Malaysia and Vietnam.
SUDAN
The Sudan operations in 2002 generated a pre-tax income of $310 million, up from $210 million in 2001. Higher oil production and prices increased Sudan’s corporate contribution to 23%. Operating costs and DD&A increased primarily due to higher volumes.
CORPORATE RESULTS REVIEW
REVENUE
Revenues from oil and natural gas sales in 2002 were $5.3 billion, up $252 million from 2001, on higher oil volumes ($254 million) and oil prices ($330 million), substantially offset by lower natural gas prices ($447 million).
DAILY PRODUCTION VOLUMES
| | 2002 | | 2001 | | 2000 | |
Oil and liquids (mbbls/d) | | | | | | | |
North America | | 62.7 | | 66.0 | | 66.4 | |
North Sea | | 127.5 | | 110.8 | | 111.9 | |
Southeast Asia(1) | | 22.5 | | 20.9 | | 20.2 | |
Sudan | | 60.0 | | 53.3 | | 45.9 | |
| | 272.7 | | 251.0 | | 244.4 | |
Natural gas (mmcf/d) | | | | | | | |
North America | | 820 | | 809 | | 755 | |
North Sea | | 122 | | 108 | | 122 | |
Southeast Asia(1) | | 94 | | 93 | | 111 | |
| | 1,036 | | 1,010 | | 988 | |
Total (mboe/d @ 6:1) | | 445 | | 419 | | 409 | |
(1) Includes operations in Indonesia and Malaysia/Vietnam.

Oil & Liquids Production
(mbbls/d) | | Natural Gas Production
(mmcf/d) | | Total Production
(mboe/d) | |
| | North
America | | North
Sea | | Southeast
Asia | | Sudan | | Total | | | | North
America | | North
Sea | | Southeast
Asia | | Total | | | | North
America | | North
Sea | | Southeast
Asia | | Sudan | | Total | |
98 | | 57.5 | | 57.5 | | 31.7 | | — | | 146.7 | | 98 | | 631 | | 104 | | 13 | | 748 | | 98 | | 163 | | 75 | | 34 | | — | | 271 | |
99 | | 58.5 | | 59.3 | | 28.8 | | 11.7 | | 158.3 | | 99 | | 681 | | 115 | | 108 | | 904 | | 99 | | 172 | | 79 | | 47 | | 12 | | 309 | |
00 | | 66.4 | | 111.9 | | 20.2 | | 45.9 | | 244.4 | | 00 | | 755 | | 122 | | 111 | | 988 | | 00 | | 192 | | 132 | | 39 | | 46 | | 409 | |
01 | | 66.0 | | 110.8 | | 20.9 | | 53.3 | | 251.0 | | 01 | | 809 | | 108 | | 93 | | 1,010 | | 01 | | 201 | | 129 | | 36 | | 53 | | 419 | |
02 | | 62.7 | | 127.5 | | 22.5 | | 60.0 | | 272.7 | | 02 | | 820 | | 122 | | 94 | | 1,036 | | 02 | | 199 | | 148 | | 38 | | 60 | | 445 | |
21
In 2002, Talisman increased its daily production by 6% to 445 mboe/d with oil and liquids production up 9% to 272,740 bbls/d and natural gas increasing 3% to 1,036 mmcf/d.
Talisman’s natural gas production in North America averaged 820 mmcf/d, up 11 mmcf/d. A successful drilling program (223 successful gas wells) and the inclusion of a full year of production from the Petromet Resources Limited properties acquired in mid-2001 offset natural declines. Increased lead times to tie in new production, minor property dispositions and localized infrastructure constraints delayed some expected production volumes in 2002. Fourth quarter natural gas production averaged 826 mmcf/d with the tie in of new wells and an acquisition in the Appalachia area of the US which contributed 10 mmcf/d. Canadian oil and liquids production for 2002 averaged 62,676 bbls/d, down 5%, due to natural declines, regulatory delays and minor property dispositions offset by drilling at Chauvin and other core areas (146 successful oil wells).
North Sea oil and liquids production averaged 127,486 bbls/d, up 16,658 bbls/d or 15%. Growth came from the Hannay and Halley developments (on stream in 2002), a full year’s production from Beatrice and Blake and development drilling in other core areas. Production at Halley averaged 2,300 bbls/d while Hannay averaged 2,400 bbls/d. Incremental production from Beatrice added 5,250 bbls/d and Ross/Blake increased 11,000 bbls/d over 2001. Beatrice was shut in during the first half of 2001 for pipeline repairs. Ross had been shut in for the second quarter of 2001 to allow production vessel modifications for Blake production. Development program delays, unsuccessful development wells and natural decline in other fields kept volumes below last year’s forecast of 144,000-155,000 bbls/d. North Sea fourth quarter production was impacted by maintenance work at the Ross/Blake FPSO and reduced production at Halley pending the drilling of a water injector planned for 2003. Natural gas production in 2002 increased 13% to 122 mmcf/d, slightly above forecast, due to a temporary increase in pipeline capacity available to Talisman and the acquisition of Lundin Oil’s carried interest in the Brae Field.
Southeast Asia natural gas production averaged 94 mmcf/d. Production from OK Block (5 mmcf/d), which commenced at the end of the first quarter, offset lower Caltex demand for Corridor natural gas (89 mmcf/d). Caltex is currently the sole purchaser of Corridor natural gas; however, gas sales agreements have been signed with other parties, which will result in additional gas sales in the future. The construction of a pipeline and an expansion of the Corridor gas facilities are currently underway to support the additional anticipated gas sales. As a result of sales to Caltex declining below their committed gas quantity of approximately 100 mmcf/d, Talisman recorded $10 million of deferred revenue for the year ($18 million to date).
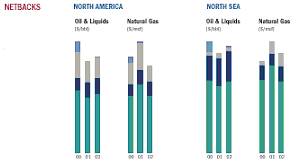
| | NORTH AMERICA | | | | NORTH SEA | |
| | | | | | |
| | Oil & Liquids
($/bbl) | | | | Oil & Liquids
($/bbl) | |
| Netbacks | | Operating
Costs | | Royalties | | Hedging
(gain) | | Price | | | | Netbacks | | Operating
Costs | | Royalties | | Hedging
(gain) | | Price | |
| | | | | | | | | | | | | | | | | | | | | | | |
00 | | 21.29 | | 4.17 | | 8.74 | | 3.44 | | 37.64 | | 00 | | 26.24 | | 9.13 | | 1.57 | | 3.44 | | 40.38 | |
01 | | 18.82 | | 5.22 | | 6.88 | | (0.12 | ) | 30.80 | | 01 | | 24.33 | | 10.06 | | 1.85 | | (0.17 | ) | 36.07 | |
02 | | 19.97 | | 5.55 | | 6.85 | | 0.06 | | 32.43 | | 02 | | 25.93 | | 11.11 | | 1.60 | | 0.12 | | 38.76 | |
| | Natural Gas
($/mcf) | | | | Natural Gas
($/mcf) | |
| | | | | | | | | | | | | | | | | | | | | | | |
00 | | 2.77 | | 0.56 | | 1.07 | | 0.26 | | 4.66 | | 00 | | 2.87 | | 0.57 | | 0.14 | | — | | 3.58 | |
01 | | 3.36 | | 0.67 | | 1.34 | | 0.02 | | 5.39 | | 01 | | 3.43 | | 0.46 | | 0.46 | | — | | 4.35 | |
02 | | 2.78 | | 0.71 | | 0.75 | | (0.28 | ) | 3.96 | | 02 | | 2.80 | | 0.61 | | 0.48 | | — | | 3.89 | |
22
Southeast Asia liquids production averaged 22,469 bbls/d with PM-3 CAA in Malaysia/Vietnam, acquired from Lundin Oil in 2001, contributing 5,617 bbls/d.
Sudan production averaged 60,109 bbls/d, up 13% with the tie in of new wells, increased pipeline capacity and the increased use of pipeline drag reducing agents and electrical submersible pumps.
COMMODITY PRICES
| | 2002 | | 2001 | | 2000 | |
Oil and liquids ($/bbl) | | | | | | | |
North America | | 32.43 | | 30.80 | | 37.64 | |
North Sea | | 38.76 | | 36.07 | | 40.38 | |
Southeast Asia(1) | | 39.46 | | 35.97 | | 42.50 | |
Sudan | | 37.79 | | 32.66 | | 38.52 | |
| | 37.20 | | 33.99 | | 39.48 | |
Natural gas ($/mcf) | | | | | | | |
North America | | 3.96 | | 5.39 | | 4.66 | |
North Sea | | 3.89 | | 4.35 | | 3.58 | |
Southeast Asia(1) | | 4.72 | | 4.80 | | 5.64 | |
| | 4.03 | | 5.22 | | 4.63 | |
Company ($/boe) | | 32.10 | | 32.91 | | 34.74 | |
(1) Includes operations in Indonesia and Malaysia/Vietnam.
Prices are before hedging activities and do not include synthetic oil.
World oil prices were slightly higher in 2002 and continued to increase throughout 2002 and into 2003, when they surpassed US$35/bbl. Political uncertainty in the Middle East and Venezuela, modest growth in demand and lower US oil inventories have exerted upward pressure on prices.
Talisman’s North American oil and liquids price averaged $32.43/bbl, up 5% from last year on improved crude oil differentials. The benchmark West Texas Intermediate (WTI) crude oil price averaged US$26.15/bbl in 2002, up 1% from 2001. The Company’s natural gas price in North America averaged $3.96/mcf, down 27% from last year. North American natural gas prices were well below 2001 levels early in the year. However, concerns over gas supplies for the winter season led to NYMEX prices approaching US$5/mcf by year end.
The Company’s North Sea oil price averaged $38.76/bbl. Both Talisman’s average oil price and Brent price are up from 2001. The Company’s North Sea natural gas price decreased 11% as a result of higher spot sales during the summer months when gas prices are typically lower.
The Company’s Southeast Asia oil price averaged $39.46/bbl, up 10% over 2001. The natural gas price in Southeast Asia averaged $4.72/mcf, down slightly from 2001. Corridor gas production, which constitutes the majority of the Company’s gas sales in Southeast Asia, is exchanged for Duri crude oil on an energy equivalent basis and is sold offshore with payment in US dollars. However, an adjustment to Corridor’s gas price in 2002, relating to 2001, decreased Talisman’s average Southeast Asia
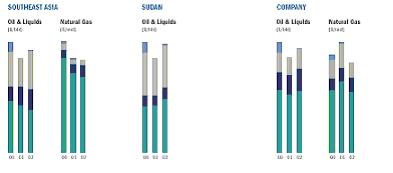
| | SOUTHEAST ASIA | | | | SUDAN | | | | COMPANY | |
| | | | | | | | | | | |
| | Oil & Liquids | | | | Oil & Liquids | | | | Oil & Liquids | |
| | Netbacks | | Operating Costs | | Royalties | | Hedging (gain) | | Price | | | | Netbacks | | Operating Costs | | Royalties | | Hedging (gain) | | Price | | | | Netbacks | | Operating Costs | | Royalties | | Hedging (gain) | | Price | |
00 | | 20.30 | | 5.40 | | 13.36 | | 3.44 | | 42.50 | | 00 | | 16.28 | | 3.80 | | 15.00 | �� | 3.44 | | 38.52 | | 00 | | 22.55 | | 6.50 | | 6.99 | | 3.44 | | 39.48 | |
01 | | 18.45 | | 7.13 | | 10.69 | | (0.30 | ) | 35.97 | | 01 | | 16.61 | | 3.40 | | 12.78 | | (0.13 | ) | 32.66 | | 01 | | 20.78 | | 7.15 | | 6.22 | | (0.16 | ) | 33.99 | |
02 | | 16.64 | | 7.93 | | 14.83 | | 0.06 | | 39.46 | | 02 | | 18.96 | | 3.82 | | 14.94 | | 0.07 | | 37.79 | | 02 | | 22.29 | | 7.99 | | 6.83 | | 0.09 | | 37.20 | |
| | Natural Gas | | | | | | | | | | | | | | | | Natural Gas | |
00 | | 4.87 | | 0.39 | | 0.34 | | 0.04 | | 5.64 | | | | | | | | | | | | | | 00 | | 3.01 | | 0.54 | | 0.88 | | 0.20 | | 4.63 | |
01 | | 4.07 | | 0.47 | | 0.24 | | 0.02 | | 4.80 | | | | | | | | | | | | | | 01 | | 3.43 | | 0.63 | | 1.14 | | 0.02 | | 5.22 | |
02 | | 3.88 | | 0.59 | | 0.25 | | — | | 4.72 | | | | | | | | | | | | | | 02 | | 2.89 | | 0.69 | | 0.67 | | (0.22 | ) | 4.03 | |
| | | | | | | | | | | | | | | | | | | | | | | | | | | | | | | | | | | | | | | | | | | | |
23
reported gas price by $0.22/mcf. OK Block gas, which came on stream in 2002, is sold under contract at approximately $1.35/mcf and reduced Talisman’s average price for the region.
The Sudan oil price increased 16% to $37.79/bbl due to an increase in the Minas benchmark price and reduced transportation costs.
The Company’s average sales prices are before a net hedging gain of $75 million, comprised of a $0.22/mcf gain on gas hedges (2001 $0.02/mcf loss) and a $0.09/bbl loss on oil hedges (2001 $0.16/bbl gain). The physical and financial commodity price contracts for 2003 outstanding at year end are disclosed in notes 9 and 10 of the Consolidated Financial Statements with additional discussion in the MD&A section entitled Derivative Financial Instruments and Commodity Sales Contracts. Additional discussion of the expected impact of commodity price contracts on the Company’s 2003 results can be found in the Outlook section of this MD&A. The Company’s accounting policy with respect to derivative financial instruments and commodity contracts is disclosed in note 1(k) of the Consolidated Financial Statements.
ROYALTIES
Average royalty rates (%) | | 2002 | | 2001 | | 2000 | |
Oil and liquids | | | | | | | |
North America | | 21 | | 22 | | 23 | |
North Sea | | 4 | | 5 | | 4 | |
Southeast Asia(1) | | 38 | | 30 | | 31 | |
Sudan | | 40 | | 39 | | 39 | |
| | 18 | | 18 | | 18 | |
Natural gas | | | | | | | |
North America | | 19 | | 25 | | 23 | |
North Sea | | 12 | | 11 | | 4 | |
Southeast Asia(1) | | 5 | | 5 | | 6 | |
| | 17 | | 22 | | 19 | |
Company | | 18 | | 20 | | 18 | |
(1) Includes operations in Indonesia and Malaysia/Vietnam.
Royalty rates do not include synthetic oil or pipeline operations.
The consolidated royalty expense decreased to $927 million in 2002, with lower royalties paid in North America due primarily to lower natural gas prices partially offset by higher royalties in Southeast Asia and Sudan. The overall corporate royalty rate dropped to 18% due to the impact of lower natural gas prices more than offsetting other factors.
North American natural gas royalties, which are largely determined on a sliding scale based on price, averaged 19%, down from 25% in 2001. The Corporate royalty rate for oil and liquids was the same, year-over-year, at 18% with an increase in Southeast Asia offsetting small decreases in other operating areas. Royalties increased in Southeast Asia due to the depletion of a cost recovery pool at Tanjung. Oil from PM-3 CAA in Malaysia/Vietnam has a current royalty rate of 30%. Sudan royalties increased in the fourth quarter to 47%, which resulted in the annual rate being 40%. The fourth quarter Sudan royalties increased due to higher production and prices and the annual royalty adjustment where the average production, price and operating costs for the year are applied in recalculating the total royalty due for 2002.
The UK abolished government oil and gas royalties effective January 2003. Talisman’s remaining North Sea royalties are in respect of non-government royalty payments. The Company’s North Sea royalty rate is expected to average less than 2%, down from 5% in 2002.
OPERATING EXPENSE
| | 2002 | | 2001 | | 2000 | |
Oil and liquids ($/bbl) | | | | | | | |
North America | | 5.55 | | 5.22 | | 4.17 | |
North Sea | | 11.11 | | 10.06 | | 9.13 | |
Southeast Asia(1) | | 7.93 | | 7.13 | | 5.40 | |
Sudan | | 3.82 | | 3.40 | | 3.80 | |
| | 7.99 | | 7.15 | | 6.50 | |
Natural gas ($/mcf) | | | | | | | |
North America | | 0.71 | | 0.67 | | 0.56 | |
North Sea | | 0.61 | | 0.46 | | 0.57 | |
Southeast Asia(1) | | 0.59 | | 0.47 | | 0.39 | |
| | 0.69 | | 0.63 | | 0.54 | |
Company ($/boe) | | 6.48 | | 5.79 | | 5.19 | |
(1) Includes operations in Indonesia and Malaysia/Vietnam.
Unit operating costs do not include synthetic oil or pipeline operations.
Total operating expense for the Company increased $169 million to $1.1 billion due to increased maintenance and oil field service costs, higher production volumes and the strengthening UK Pound Sterling. On a per unit basis, costs increased 12% to $6.48/boe.
Unit operating costs in North America averaged $4.65/boe, up 5% from 2001. Oil and liquids unit operating costs increased 6% to $5.55/bbl, largely due to lower production and higher oil field service costs. Unit operating costs for natural gas increased to $0.71/mcf with higher processing and maintenance costs.
North Sea oil and liquids unit operating costs increased $1.05/bbl or 10% to average $11.11/bbl. The strengthening UK Pound Sterling accounted for over half of the unit cost increase with the remainder due to higher maintenance and well workover costs. North Sea natural gas costs averaged $0.61/mcf, up from $0.46/mcf in 2001, due to higher maintenance costs at Brae.
Southeast Asia unit operating costs averaged $6.13/boe, up from $5.29/boe in 2001. Operating costs at Corridor averaged $0.60/mcf, up from $0.47/mcf in 2001, partly due to higher overhead allocations from the operator. OK Block natural gas production costs averaged $0.12/mcf. Oil and liquids unit costs were $7.93/bbl in Southeast Asia with operating costs at PM-3 CAA averaging $8.18/bbl. In Indonesia, oil and liquids unit costs increased in 2002 due to declining production.
Sudan operating costs averaged $3.82/bbl, up 12% with the increased use of drag reducing agents and electrical submersible pumps.
24
DEPRECIATION, DEPLETION AND AMORTIZATION EXPENSE
| | 2002 | | 2001 | | 2000 | |
| | $/boe | | $millions | | $/boe | | $millions | | $/boe | | $millions | |
North America | | 8.44 | | 614 | | 7.98 | | 585 | | 6.79 | | 478 | |
North Sea | | 12.99 | | 701 | | 11.86 | | 558 | | 10.59 | | 512 | |
Southeast Asia(1) | | 6.24 | | 87 | | 7.00 | | 93 | | 5.87 | | 83 | |
Sudan | | 4.24 | | 93 | | 3.98 | | 77 | | 4.72 | | 80 | |
Company | | 9.19 | | 1,495 | | 8.58 | | 1,313 | | 7.70 | | 1,153 | |
(1) Includes operations in Indonesia and Malaysia/Vietnam.
The Company’s depreciation, depletion and amortization (DD&A) expense increased to $1.5 billion or $9.19/boe, with half the increase due to higher production volumes in the North Sea. The DD&A rate in North America increased with a full year of amortization of the costs associated with the Petromet acquisition. The 2001 DD&A expense in North America included $10 million of goodwill amortization. Goodwill ceased being amortized effective 2002. In the North Sea, higher DD&A, primarily at Beatrice and Ross/Blake, contributed to the $1.13/boe increase. The Southeast Asia rate decreased in 2002 as the 2001 expense included $8 million of minor property impairments. Sudan’s DD&A rate increased slightly to $4.24/bbl.
For additional information relating to DD&A refer to the MD&A section entitled Application of Critical Accounting Policies and to note 5 of the Consolidated Financial Statements.
DRY HOLE EXPENSE
(millions of dollars) | | 2002 | | 2001 | | 2000 | |
North America | | 128 | | 54 | | 29 | |
North Sea | | 9 | | 21 | | 15 | |
Southeast Asia(1) | | 4 | | 8 | | 17 | |
Sudan | | 13 | | 16 | | 3 | |
Other(2) | | 20 | | 14 | | 13 | |
| | 174 | | 113 | | 77 | |
(1) Includes operations in Indonesia and Malaysia/Vietnam.
(2) Other includes Algeria (2002 – $nil; 2001 – $5 million; 2000 – $13 million) and Trinidad (2002 – $20 million; 2001 – $9 million, 2000 – $nil).
Dry hole expense in North America increased with the write-off of 40 wells, higher exploration expenditures, a strategic property review and the focus on deeper higher value targets. In the North Sea, most of the expense related to the Remus (Beatrice) well. Two wells were written off in each of Malaysia, Indonesia and Trinidad. In Sudan, seven wells were dry resulting in a $13 million expense.
Under the Successful Efforts method of accounting for oil and gas activities, the costs of unsuccessful exploration wells are written-off to dry hole expense in the year such determination is made. Until such determination, the costs are included in non-depleted capital. At year end, $309 million of costs relating to exploration wells, down from $399 million in 2001, were included in non-depleted capital and not subject to DD&A.
EXPLORATION EXPENSE
(millions of dollars) | | 2002 | | 2001 | | 2000 | |
North America | | 66 | | 69 | | 54 | |
North Sea | | 20 | | 30 | | 13 | |
Southeast Asia(1) | | 19 | | 8 | | 7 | |
Sudan | | 6 | | 11 | | 8 | |
Other | | 74 | | 29 | | 18 | |
| | 185 | | 147 | | 100 | |
(1) Includes operations in Indonesia and Malaysia/Vietnam.
Exploration expense consists of geological and geophysical costs, seismic, land lease rentals and indirect exploration expenses. There has been a steady increase in the Company’s exploration spending since 1999. Exploration expense is closely tied to the total amount of exploration capital spent in a year. Expenses constituting Other in 2002 relate mostly to activities in Trinidad and Colombia.
CORPORATE EXPENSE
(millions of dollars) | | 2002 | | 2001 | | 2000 | |
G&A expense | | 138 | | 108 | | 95 | |
Interest expense | | 164 | | 139 | | 136 | |
Capitalized interest | | 25 | | 19 | | 16 | |
Preferred securities charges, net of tax | | 24 | | 24 | | 22 | |
Other revenue | | 80 | | 82 | | 99 | |
Other expenses (income)(1) | | 113 | | 78 | | 64 | |
(1) Prior year comparatives have been restated for a new CICA accounting standard (see note 2 to the Consolidated Financial Statements)
General and administrative (G&A) expense increased due to higher legal and pension costs, salary increases and additional personnel due to expanding investment and operations. On a per unit basis, G&A was $0.85/boe in 2002, compared to $0.71/boe in 2001.
As a result of higher average debt levels during the year, interest on long-term debt, including capitalized interest, increased to $189 million. Interest capitalized in 2002 is associated with the Malaysia/Vietnam PM-3 CAA development.
Preferred securities charges, net of taxes, have been charged directly to retained earnings and are deducted from net income to determine net income per share. Preferred security charges, before tax, totaled $42 million (2001 – $42 million).
Other revenue includes pipeline and custom treating revenues and miscellaneous income. Other expenses for 2002 include the Kildrummy and Beechnut write-offs ($74 million), foreign exchange losses ($28 million) and losses on property dispositions ($10 million). The 2001 other expenses included foreign exchange losses ($51 million), a write-off associated with the early repayment of the Corridor project loan facility ($17 million) and a gain on property disposition ($11 million). The detailed breakdown of other revenue and other expenses (income) can be found in notes 11 and 12 to the Consolidated Financial Statements.
25
INCOME TAXES
EFFECTIVE INCOME TAX RATE
(millions of dollars) | | 2002 | | 2001 | | 2000 | |
Income before tax | | 1,068 | | 1,296 | | 1,537 | |
Less PRT | | 124 | | 149 | | 150 | |
| | 944 | | 1,147 | | 1,387 | |
Income tax expense | | | | | | | |
Current | | 258 | | 342 | | 334 | |
Future | | 162 | | 72 | | 196 | |
| | 420 | | 414 | | 530 | |
Effective income tax rate (%) | | 44 | | 36 | | 38 | |
The Company’s effective tax rate for 2002, after deducting Production Revenue Tax (PRT), was 44%, compared to 36% in 2001. This increase over 2001 is due to the UK enacting a 10% supplemental tax on North Sea oil and gas profits. See note 13 of the Consolidated Financial Statements for additional information on the Company’s income taxes.
Current income tax expense decreased to $258 million in 2002 from $342 million in 2001, with the largest drop being in North America due to lower natural gas prices. Lower current income tax was incurred in the UK while higher production and oil prices increased current income tax expense in Sudan.
Partially offsetting the impact of the 10% supplemental UK tax was the acceleration of capital allowance deductions. The net effect of these changes is expected to be cash flow positive in the near term as the acceleration of capital allowances will more than offset the new 10% tax. On a non-cash basis, the UK provision for future tax liability was increased $128 million due to the supplemental tax. The 2002 future tax expense is net of a $12 million reduction in North America, which resulted from a decrease in the Alberta corporate tax rate.
The UK Government levies PRT on North Sea fields which received development approval before April 1993, based on gross profit after deducting allowable expenditures, a cost uplift, a portion of losses from certain other fields, abandonment costs and government royalties. PRT is deductible for purposes of calculating corporate income tax.
CAPITAL SPENDING(1)
(millions of dollars) | | 2002 | | 2001 | | 2000 | |
North America | | 939 | | 976 | | 813 | |
North Sea | | 518 | | 664 | | 527 | |
Southeast Asia(2) | | 269 | | 149 | | 69 | |
Sudan | | 98 | | 117 | | 70 | |
Other | | 228 | | 115 | | 50 | |
| | 2,052 | | 2,021 | | 1,529 | |
(1) Includes exploration, development and net asset acquisitions expenditures but excludes corporate acquisitions.
(2) Includes operations in Indonesia and Malaysia/Vietnam.
Natural gas continues to be the focus of the Company’s exploration activities in North America, supplemented by low risk oil projects. Of the $939 million of capital spending in North America, $321 million related to exploration activities while development accounted for $502 million. The Company participated in 424 wells in North America. Development spending was concentrated in the predominantly gas producing core areas in the Alberta Foothills, Greater Arch and Edson. Other spending included $90 million to acquire additional lands in the US with approximately 10 mmcf/d of production. Subsequent to year end, additional acquisitions were made in the US for $390 million, adding an incremental 55 mmcf/d of gas production.
Total capital spending in the North Sea of $518 million included $134 million for exploration and $297 million for development, with the remainder for property acquisitions. Expenditures included the Halley and Hannay developments, development drilling at Claymore, Buchan, Piper, Saltire, MacCulloch and the Tartan, Highlander and Petronella core area as well as topside refurbishments at Claymore and Tartan. Exploration spending primarily related to drilling the successful J-1 (Buchan) well, the Drum (Claymore) and Eta 2 (Clyde) wells, as well as the Remus (Beatrice) and Kildrummy (Piper) wells. The total North Sea capital spending in 2002 was below plan due to the cancellation of the Kildrummy development and delays in other programs. Interests were acquired in the producing fields Rubie, Renee and Ivanhoe/Rob Roy as well as minor additional working interests in the Claymore and Balmoral fields.
The PM-3 CAA development in Malaysia/Vietnam accounted for $175 million (including $25 million of capitalized interest) or 65% of total capital spending in Southeast Asia. A total of $73 million was spent in Indonesia with the majority on the Corridor gas facilities expansion and development drilling to support additional anticipated gas sales to Singapore. In addition to the $269 million of capital spending in Southeast Asia, a $36 million investment was made to acquire a 15% interest in Transasia Pipeline Company Pvt. Ltd., which owns a 40% interest in PT Transportasi Gas Indonesia, an Indonesian pipeline company that owns and operates the Duri pipeline in Indonesia and is currently building a pipeline from Indonesia to service gas markets in Batam and Singapore. This investment is included in other assets and will be carried at cost.
Capital spending in Sudan of $98 million was focused on ongoing development drilling and the addition of new pipeline pumping stations.
Other areas accounted for $228 million of the 2002 capital spending. Talisman spent $78 million in Trinidad, $107 million in Algeria and $22 million in Colombia. During 2002, five exploration wells were drilled in Trinidad; one on Block 2(ab) and four on Block 2(c). Based on the Company’s review of the drilling results and seismic information, a decision was made to proceed with the Greater Angostura Project on Block 2(c) and to relinquish Block 2(ab). The Algeria spending advanced the Ourhoud project to first oil production at the end of 2002, while MLN is expected to come on stream in mid-2003. A 2D seismic program was completed in Colombia and a 3D seismic program is ongoing.
26
RESERVE REPLACEMENT
Talisman drilled 439 successful wells in 2002, adding 196 mmboe of reserves (before revisions and transfers), replacing 121% of production at a cost of $8.87/boe. Including net revisions and acquisitions, 159 mmboe of reserves were replaced (99% of production) at a cost of $12.15/boe.
During the year, the Company undertook an extensive review of thousands of oil and gas wells on smaller properties in Canada. These reviews, combined with the decision not to develop the Kildrummy field in the North Sea, contributed to a downward revision in total proved reserves of approximately 38 mmboe, or less than 3% of the total.
Finding and development costs in any one year can be misleading due to the long lead times associated with exploration and development. Therefore, five year weighted averages are better indicators. Over the last five years, the Company has replaced approximately 210% of production at a cost of $7.29/boe. Net revisions and transfers over the past five years have resulted in 54 mmboe of reserves being added to the Company’s proved reserve base, or approximately 7%.
FINDING, DEVELOPMENT AND ACQUISITION COSTS
Proved F&D costs ($/boe) | | 2002 | | 3-year
Average | | 5-year
Average | |
F&D costs (excluding revisions and transfers) | | 8.87 | | 6.98 | | 7.15 | |
F&D costs | | 11.03 | | 6.86 | | 6.58 | |
Total including acquisitions (FD&A) | | 12.15 | | 7.66 | | 7.29 | |
LIQUIDITY AND CAPITAL RESOURCES
Talisman’s long-term debt at year end was $3 billion, including $265 million drawn on the Company’s $1,049 million bank lines of credit. The Company also maintains a shelf prospectus under which it may issue up to $500 million of medium term notes in aggregate in the Canadian public debt market. The shelf prospectus expires in March 2004.
During 2002, the Company issued $1,055 million of long-term debt including $325 million of medium term notes under its previous shelf prospectus, a $571 million (£250 million) Eurobond notes offering and a private debt placement in the US for $159 million (US$100 million). Subsequent to year end, the Company spent $390 million on acquisitions to expand the Company’s operations and land base in the US Appalachia area. During the first quarter of 2003, the Company expects to complete the Sudan sale. Refer to note 17 of the Consolidated Financial Statements for additional information on the sale of the Sudan operations.
In June 2003, $180 million of medium term notes mature and will be repaid. No amount of the long-term debt has been classified as a current liability as the Company has the ability to refinance amounts due within one year with existing bank facilities.
The Company repurchased 3,847,500 of its common shares under its normal course issuer bid (“NCIB”) during 2002 at a cost of $220 million ($57.24/share). Subsequent to year end, an additional 1,986,200 common shares were repurchased for $113 million ($56.70/share). The total common shares repurchased under the existing NCIB represents 87% of the 6,716,781 common shares currently permitted to be repurchased. The NCIB expires on March 25, 2003 and it is expected to be renewed for an additional 5% of the Company’s outstanding common shares.
Two dividends of $0.30/share were paid in 2002 (total dividends were $0.60/share). The Company’s dividend is determined semi-annually by the Board of Directors.
Talisman maintains targets for long-term debt of less than 2:1 debt to cash flow and 40% debt to debt-plus-equity. At the end of 2002, Talisman met the debt targets with ratios of 1.1:1 for debt to cash flow and 40% for debt to debt-plus-equity. For purposes of these calculations, the Company’s preferred securities have been classified as equity.
The projected 2003 year end net debt position of the Company is expected to decrease as a result of the proceeds from the Sudan sale. The 2003 anticipated cash flow is expected to be more than sufficient to fund the $2.1 billion of planned capital expenditures. Significant acquisitions, a prolonged drop in commodity prices and the continuation of share repurchases would impact the anticipated reduction in the Company’s projected 2003 year end net debt position.
For additional information regarding the Company’s liquidity and capital resources, refer to note 6 of the Consolidated Financial Statements.
Talisman’s investment grade corporate credit and senior unsecured long-term debt credit ratings remain unchanged with Dominion Bond Rating Service (“DBRS”), Moody’s Investor Service, Inc. (“Moody’s”) and Standard & Poor’s (“S&P”) at BBB (high), Baa1 and BBB+ respectively. Due to the subordinated nature of the preferred securities, they have a lower rating. DBRS, Moody’s and S&P have rated the preferred securities as Pfd-3 (high), Baa3 and BBB-, respectively.
FINANCIAL LEVERAGE AND COVERAGE RATIOS(1)
| | 2002 | | 2001 | | 2000 | |
Long-term debt(2) to cash flow(3) (times) | | 1.1 | | 1.2 | | 0.7 | |
Interest coverage — cash flow(3,4) (times) | | 16 | | 19 | | 19 | |
EBITDAX(5) (millions of dollars) | | 3,036 | | 2,859 | | 2,853 | |
Interest coverage — EBITDAX(5),(6) (times) | | 16 | | 18 | | 18 | |
Long-term debt to debt-plus-equity(2) (%) | | 40 | | 41 | | 32 | |
(1) | | Preferred securities are classified as equity and the related charges have been excluded from interest expense. |
(2) | | Based on balances at December 31. |
(3) | | Cash flow is a non-GAAP measure the components of which are set out in note 14 of the Consolidated Financial Statements. |
(4) | | Cash flow plus current income taxes and interest expense, divided by the sum of interest expense and capitalized interest. |
(5) | | EBITDAX is a non-GAAP measure and represents earnings before interest, income taxes, depreciation, depletion, amortization, impairment writedowns, dry hole and exploration expense. |
(6) | | EBITDAX divided by the sum of interest expense and capitalized interest. |
27
COMMITMENTS AND OFF BALANCE SHEET ARRANGEMENTS
As part of its normal business, the Company entered into arrangements and incurred obligations that will impact the Company’s future operations and liquidity, some of which are reflected as liabilities in the Consolidated Financial Statements at year end. The principal commitments of the Company are in the form of: debt repayments; abandonment obligations; settlements of derivative financial instruments; lease commitments relating to corporate offices and vessels; firm commitments for gathering, processing and transmission services; minimum work commitments under various international agreements; other service contracts and fixed price commodity sales contracts.
Additional disclosure of the Company’s debt repayment obligations and significant commitments can be found in notes 6 and 10 of the Consolidated Financial Statements. A discussion of the Company’s derivative financial instruments and commodity sales contracts can be found in the next section of this MD&A.
DERIVATIVE FINANCIAL INSTRUMENTS AND COMMODITY SALES CONTRACTS
The Company may manage its exposure to fluctuations in foreign exchange rates, interest rates, electricity costs and commodity prices in part through the use of derivative financial instruments and commodity sales contracts. Commodity price derivative financial instruments resulted in a net increase to recorded sales of $75 million (2001 – $8 million increase; 2000 – $377 million decrease). The accounting policy with respect to derivative financial instruments is set out in note 1(k) of the Consolidated Financial Statements.
At December 31, 2002, the Company had outstanding commodity price derivative contracts that cover approximately 60,500 mcf/d (7%) of the Company’s anticipated 2003 North American natural gas production and 75,000 bbls/d (35%) of the Company’s anticipated 2003 worldwide oil and liquids production. An additional 85,750 mcf/d (10%) of anticipated 2003 North American natural gas production had been committed under commodity sales contracts. At year end, the Company had also committed 48,450 mcf/d of 2004 North American gas production under commodity sales contracts. See notes 9 and 10 of the Consolidated Financial Statements for additional details regarding the contracts outstanding at year end.
Subsequent to year end, the Company entered into natural gas derivative contracts for 57,500 mcf/d at US$4.86/mcf (NYMEX) for the period February 2003 to October 2004. The Company also entered into contracts for the period April to October 2003 for an additional 14,000 mcf/d of collars with ceiling and floor prices referenced to AECO of $7.50/mcf and $6.24/mcf and 9,500 mcf/d referenced to Sumas with ceiling and floor prices of US$4.96/mcf and US$3.92/mcf. In addition, the Company entered into a commodity sales contract to sell 4,800 mcf/d for the period April to October 2003 at $4.24/mcf.
The following table includes the Company’s expected future payment commitments and estimated timing of such payments.
| | | | | | Payments expected(2),(3) (millions of dollars) | |
Commitments | | Recognized in
financial statements | | Total | | Due within
1 year | | Due within
2-3 years | | Due within
4-5 years | | Due within
6-10 years | | Due within
11-15 years | | Due after
15 years | |
Long-term debt | | Yes — Liability | | 2,997 | | 180 | | 695 | | 693 | | 379 | | 576 | | 474 | |
| | | | | | | | | | | | | | | | | |
Preferred securities | | Yes — Equity | | 474 | | — | | — | | — | | — | | — | | 474 | |
Office leases | | No | | 191 | | 18 | | 30 | | 30 | | 75 | | 38 | | — | |
Vessel leases | | No | | 115 | | 52 | | 63 | | — | | — | | — | | — | |
Transportation and processing commitments | | No | | 942 | | 145 | | 173 | | 133 | | 250 | | 203 | | 38 | |
Abandonment obligations(1) | | Yes — Partially accrued as liability | | 1,731 | | 24 | | 49 | | 109 | | 232 | | 649 | | 668 | |
Min. work commitments(4) | | No | | 461 | | 262 | | 152 | | 47 | | — | | — | | — | |
Other service contracts | | No | | 160 | | 16 | | 32 | | 22 | | 30 | | 30 | | 30 | |
Total | | | | 7,071 | | 697 | | 1,194 | | 1,034 | | 966 | | 1,496 | | 1,684 | |
(1) | | The abandonment obligation represents management’s best estimate of the cost and timing of future dismantlement, site restoration and abandonment obligations based on engineering estimates using current costs and technology in accordance with existing legislation and industry practice. |
(2) | | Payments exclude ongoing operating costs related to certain leases, interest on long-term debt, preferred securities charges and payments made to settle derivative contracts. |
(3) | | Payments denominated in foreign currencies have been translated at the December 31, 2002 exchange rate. |
(4) | | Minimum work commitments include contracts awarded for capital projects and those commitments related to exploration or drilling obligations. |
28
The Company also entered into agreements to sell 15,000 mcf/d of North Sea natural gas production for the period April to September 2003 at $4.40/mcf.
Subsequent to the Eurobond notes offering, the Company entered into US dollar cross currency swap contracts and interest rate swap contracts for an equivalent amount of the bond which have in effect converted this indebtedness into US dollars with a floating interest rate based on three month US LIBOR. These swap contracts expire on December 5, 2009. In addition, the Company entered into a forward rate swap agreement to effectively fix the rate of the next three month US LIBOR payment due in March 2003 under the interest rate swap contract.
The Company entered into US dollar/UK Pound Sterling forward swap agreements to purchase £178 million over the first six months of 2003. These swap agreements fix the exchange rate used to convert a portion of the Company’s US dollar denominated revenues received in the UK into Pounds Sterling for purposes of paying its operating costs and capital expenditures.
The Company has systems and processes in place to minimize risks associated with its derivatives program and credit risk associated with derivatives counterparties. Management believes its commodity derivatives and fixed priced sales program to be prudent in that it provides a degree of price support during periods of falling commodity prices while providing the ability to participate in price increases and, in the case of certain fixed price sales contracts, guaranteed market access. The US dollar cross currency swap of the Eurobond and the US dollar/UK Pound Sterling forward swap agreements reduce the Company’s exposure to foreign exchange movements.
APPLICATION OF CRITICAL ACCOUNTING POLICIES
The preparation of financial statements requires management to make estimates and assumptions that affect reported assets and liabilities, disclosures of contingencies and revenues and expenses. Management is also required to adopt accounting policies that require significant estimates. Actual results could differ from those estimates. A summary of significant accounting policies adopted by Talisman can be found in note 1 to the December 31, 2002, Consolidated Financial Statements. Changes to these policies during the current year are disclosed in note 2. In assisting the Audit Committee’s review and approval or recommendations for approval, of the Company’s financial statements, management regularly meets and reviews with the committee, the Company’s significant accounting policies, estimates and any significant changes thereto including those discussed below.
Management believes the most critical accounting policies, including judgments in their application, that may have an impact on the Company’s financial results relate to the accounting for property, plant and equipment, abandonment and goodwill. The rate at which the Company’s assets are depreciated or otherwise written-off and the abandonment liability provided for are subject to a number of judgments about future events, many of which are beyond management’s control.
RESERVE RECOGNITION
Underpinning Talisman’s oil and gas assets and goodwill are its oil and gas reserves. Detailed rules and industry practice to which Talisman adheres have been developed to attempt to provide uniform reserve recognition criteria. However, the process of estimating oil and gas reserves is inherently judgmental. The reserve estimates are made using all available geological and reservoir data as well as production performance data. As new data becomes available, including actual reservoir performance, reserve estimates may change. Reserves can be classified as proved, probable or possible with decreasing levels of certainty as to the likelihood that the reserves will be ultimately produced.
Reserve recognition is also impacted by economic considerations. In order for reserves to be recognized, they must be producible under existing economic and operating conditions, which is viewed as being at year end commodity prices with an operating cost profile based on current operations. As economic conditions change, primarily as a result of changes in commodity prices, and to a lesser extent, operating and capital costs, marginally profitable production, typically experienced in the later years of a field’s life cycle, may no longer qualify for reserve recognition.
The Company’s reserves and revisions to those reserves, though not separately reported on the Company’s balance sheet or income statement, impact the Company’s reported net income primarily through the amortization of the Company’s Property, Plant and Equipment (PP&E), asset impairments and the provision for future abandonment and reclamation costs. As disclosed in the Historical Proved Reserves table, net revisions during the past three years have resulted in 12 mmbbls of oil equivalent being added to the Company’s proved reserve base, or approximately 1%.
DEPRECIATION, DEPLETION AND AMORTIZATION EXPENSE
A significant portion of the Company’s Property, Plant and Equipment is amortized based on the unit of production method with the remaining assets being amortized equally over their expected useful lives. The unit of production method attempts to amortize the asset’s cost over its reserve base. Accordingly, revisions to reserves or changes to management’s view as to the operational life span of an asset will impact the Company’s future DD&A expense. As indicated above, the Company’s proved estimated reserves have been revised upward 1% over the last three years. This degree of change would have resulted in an insignificant reduction to the DD&A expense during the past year.
29
As outlined in the Company’s DD&A accounting policy and PP&E note (notes 1(d) and 5 of the Consolidated Financial Statements), $1.2 billion of the Company’s Property, Plant and Equipment is not currently subject to DD&A. A significant portion of these costs ($730 million) relate to development projects that will soon be on production, at which time amortization will commence. Also included in the $1.2 billion of non-depleted capital is $463 million related to the costs of acquired probable reserves ($154 million) and incomplete drilling activities, including those wells under evaluation or awaiting production to commence ($309 million). Uncertainty exists with these costs, for example, if the evaluation of the acquired probable reserves or recently drilled exploration wells were determined to be unsuccessful, the associated capitalized costs would be expensed in the year such determination is made, except that in the case of acquired probable reserves associated with producing fields, these costs would be amortized over the reserve base of the associated producing field. Accordingly, the rate at which these costs are written-off depends on management’s view of the likelihood of the existence of producible reserves.
ASSET IMPAIRMENTS
The Company’s oil and gas assets and goodwill are subject to impairment tests. An impairment charge is recorded in the year an asset is determined to be impaired. Individual oil and gas assets are considered impaired under the Successful Efforts method if their undiscounted future cash flows fall below their carrying value. Goodwill is considered to be impaired if its fair value, principally determined based on discounted cash flows, falls below its carrying value. Both tests require management to make assumptions regarding cash flows well into the distant future that are subject to revisions due to changes in commodity prices, costs, recoverable reserves, production profiles and in the case of goodwill, discount rates. During the past three years, isolated asset impairments have occurred (2002 — $74 million; 2001 — $8 million; 2000 — $nil) however, it is possible that future impairments may be material.
As an indication of the volatility of cash flow projections, at December 31, 2002, the estimated undiscounted future net cash flow before tax from proved reserves at year end prices was $28.7 billion and it is estimated that a $1/boe change in the commodity price assumption would change this amount by approximately $1.1 billion. As indicated above, in determining whether an asset is impaired, management uses its best estimate of future prices and costs and risk-adjusted recoverable reserves including those classified as probable.
PURCHASE PRICE ALLOCATIONS
The costs of corporate and asset acquisitions are allocated to the acquired assets and liabilities based on their fair value at the time of acquisition. In many cases the determination of fair value requires management to make certain assumptions and estimates regarding future events. Typically, in determining fair value, management develops a number of possible future cash flow scenarios to which probabilities are judgmentally assigned. The allocation process, including the determination of the appropriate discount rate, is inherently subjective and impacts the amounts assigned to the various individually identifiable assets and liabilities as well as goodwill. The acquired assets and liabilities may span multiple geographical segments and may be amortized at different rates, or not at all as in the case of goodwill or acquired probable reserves. Accordingly, the allocation process impacts the Company’s reported assets and liabilities and future net income due to the impact on future depreciation, depletion and amortization expense and impairment tests.
FUTURE ABANDONMENT AND SITE RESTORATION ACTIVITIES
Upon retirement of its oil and gas assets, the Company anticipates incurring substantial costs associated with abandonment and reclamation activities. Estimates of the associated costs are subject to uncertainty associated with the method, timing and extent of future retirement activities. A liability for these costs is accrued based on estimated future production. Accordingly, the annual expense associated with future abandonment and reclamation activities is impacted by changes in the estimates of the expected costs, timing of abandonment and future production (reserves) over which the remaining unrecorded liability is amortized. During 2002, the abandonment expense included in DD&A was $147 million. The total abandonment liability is currently estimated at $1.7 billion, which is based on current costs and technology and in accordance with existing legislation and industry practice. If this liability had been estimated to be 10% higher, an additional $15 million may have been recorded as DD&A during 2002. Past revisions to the abandonment estimate have not been significant.
FAIR VALUE OF DERIVATIVE FINANCIAL INSTRUMENTS UNDER US GAAP
As disclosed in note 1(k) of the Consolidated Financial Statements, the Company’s derivative financial instruments are treated as hedges under Canadian GAAP. Accordingly, gains and losses on these instruments are not recorded in the income statement until the hedged transaction is realized. These instruments are carried at cost. For US GAAP purposes, these instruments are recorded on the balance sheet at fair value with changes in fair value being recorded as either income or an expense. The fair value of certain commodity based instruments are highly volatile. The determination of fair value for certain non-market traded instruments requires management to make significant estimates. In addition, the meaningfulness of an instrument’s fair value on December 31, 2002 and the appropriateness of recognizing income based on such daily values should be viewed with caution. In determining the fair value of its commodity based instruments, the Company uses an options pricing model based on market determined price forecasts. For other fair values such as those for its interest rate swaps, forward currency contracts and preferred securities, the Company obtains multiple price quotes from external sources.
30
ACCOUNTING CHANGES DURING THE CURRENT YEAR
CHANGE IN THE COMPANY’S FUNCTIONAL CURRENCY
Talisman’s worldwide operations expose the Company to transactions denominated in a number of different currencies, which are required to be translated into one currency for financial statement reporting purposes. Talisman’s foreign currency translation policy, as detailed in note 1(i) of the Consolidated Financial Statements, is designed to reflect the economic exposure of the Company’s operations to the various currencies.
The adoption of the US dollar, effective for 2002, as the Company’s functional currency is a reflection of Talisman’s overall exposure to US dollar denominated transactions, assets and liabilities; oil prices are largely denominated in US dollars as is much of the Company’s corporate debt and international capital spending and operating costs.
The Company’s operations in the UK and Canada are largely self-sufficient (self-sustaining) and their economic exposure is more closely tied to their respective domestic currencies. Accordingly, these operations are measured in UK Pounds Sterling and Canadian dollars, respectively.
Currently, the Company’s foreign exchange exposure principally relates to UK oil sales denominated in US dollars and Canadian dollar denominated long-term debt that has not been allocated to the Canadian operations.
The Company adopted the US dollar as its functional currency effective January 1, 2002, due to its increased exposure to the US dollar as a result of the growth in international operations. Prior to January 1, 2002, the functional currency of the Company was the Canadian dollar. The impact of this change was to decrease net income by $15 million during 2002.
ACCOUNTING FOR FOREIGN EXCHANGE GAINS AND LOSSES ON LONG-TERM DEBT
Effective January 1, 2002, as disclosed in note 2 of the Consolidated Financial Statements, in accordance with a Canadian Institute of Chartered Accountants (CICA) accounting standard, the Company no longer defers and amortizes the gains or losses on foreign currency denominated long-term debt. The impact of the change in accounting as a result of the new accounting standard was to decrease net income in 2002 by $3 million. The Company’s comparative historical financial results have been restated for this required accounting change. The previously reported net income for 2001 and 2000 was decreased $53 million and $49 million, respectively.
At December 31, 2002, the Company’s debt was denominated in US and Canadian dollars and UK Pounds Sterling. The UK Pounds Sterling debt has been effectively swapped into US dollars. A portion of the Company’s debt (net of cash) is allocated to the self-sustaining Canadian operations based on the Company’s net investment in Canada. Foreign exchange gains and losses may result from the debt allocation if the total amount of net debt allocated exceeds or is less than the Company’s total Canadian dollar denominated debt.
The Company’s foreign exchange accounting policy, including the rationale and implications of adopting the US dollar as the Company’s functional currency, was discussed with the Audit Committee of Talisman’s Board of Directors.
NEW ACCOUNTING PRONOUNCEMENTS
The CICA has issued a number of accounting pronouncements, some of which may impact the Company’s reported results and financial position in future periods. These new pronouncements include the following:
IMPAIRMENTS OF LONG-LIVED ASSETS
Effective for 2004, if a long-term asset is identified as being impaired, as determined by its undiscounted future cash flows, the amount of impairment is to be calculated based on the asset’s fair value (present value of expected future cash flows). This is consistent with the US GAAP methodology. Currently, the impairment is calculated based on the asset’s undiscounted future cash flows.
DISPOSAL OF LONG-LIVED ASSETS AND DISCONTINUED OPERATIONS
Effective for disposition activities initiated after May 1, 2003, this pronouncement expands the scope of what assets or operations are to be reclassified as Discontinued Operations and the conditions required to reclassify them as such. This treatment eliminates a difference between US and Canadian GAAP.
ASSET RETIREMENT OBLIGATIONS (FUTURE SITE RESTORATION AND ABANDONMENT LIABILITIES)
Effective January 1, 2004, the CICA has adopted a new accounting standard, which will change the method of accruing for costs associated with the retirement of fixed assets. The standard will require entities to record the fair value of a liability for an asset retirement obligation in the period it is incurred and a corresponding increase in the carrying amount of the related long-lived asset. Currently, these obligations are provided for using the unit of production method or, for certain assets, using the straight-line method over the estimated remaining lives of the assets. The US has adopted a similar rule commencing January 1, 2003.
SALE OF SUDAN OPERATIONS
As disclosed in note 17 of the Consolidated Financial Statements, the Company has executed an agreement for the sale of its operations in Sudan subject to government and consortium member approvals and other closing conditions. The impact of the sale of Sudan operations is not included in the financial results of the Company as at December 31, 2002. Readers are referred to note 16 in which the Sudan operations are reported as a separate geographic segment.
31
RISKS AND UNCERTAINTIES
Talisman is exposed to operational risks inherent in exploring for, developing and producing crude oil and natural gas. The process of estimating oil and gas reserves is complex and involves a significant number of decisions and assumptions in evaluating available geological, geophysical, engineering and economic data for each reservoir; therefore, reserve estimates are inherently imprecise. The Company may adjust estimates of proved reserves based on production history, results of exploration and development drilling, prevailing oil and gas prices and other factors, many of which are beyond the Company’s control. In addition, there are numerous uncertainties in projecting future production, costs and expenses and the results, timing and costs of exploration and development projects. Total amounts or time of production may vary significantly from reserves and production estimates.
The Company’s future success depends largely on its ability to find, develop or acquire additional oil and gas reserves that are economically recoverable. Unless produced reserves are replaced through successful development, exploration or acquisition activities at acceptable costs, proved reserves will decline over time. Exploration and development drilling may not result in commercially productive reserves. Successful acquisitions require an assessment of a number of factors, many of which are uncertain. These factors include recoverable reserves, exploration potential, future oil and gas prices, operating costs and potential environmental and other liabilities. Such assessments are inexact and their accuracy is inherently uncertain.
Oil and gas drilling and producing operations are hazardous. They are subject to many risks including the possibility of fire, mechanical failure, pipe failure, chemical spills, uncontrollable flows of oil, natural gas or well fluids, and other accidents or occurrences which could result in personal injury or loss of life, damage or destruction of properties, pollution or other environmental damage, interruption of business, regulatory investigations and penalties and liability to third parties. The Company seeks to mitigate risks and to protect against significant losses by maintaining a comprehensive insurance program, while maintaining levels of risk within the Company which management believes to be acceptable. Talisman believes its liability, property and business interruption insurance is appropriate to its business and consistent with common industry practice, although such insurance will not provide coverage in all circumstances.
The energy industry is extremely competitive. This is especially true with regard to exploration for, and development and production of, new sources of oil and natural gas. As an independent producer of oil and natural gas, the Company frequently competes against companies that are larger with greater financial resources to acquire properties suitable for exploration, to contract for drilling equipment and other services and to secure trained personnel.
Talisman is subject to extensive governmental regulation in the countries in which it does business with respect to protection of the environment and responsibility for environmental damage and site remediation. A trend toward stricter environmental regulation and protection controls could increase costs for Talisman and others in the industry. Although Talisman maintains comprehensive programs to control health, safety and environmental risks across its operations and to comply with applicable governmental regulations and standards, accidental discharge of pollutants or other environmental damage or violations of applicable law may occur and may result in significant liability to Talisman. Talisman records provisions for abandonment and restoration of its properties in accordance with generally accepted accounting principles; however, the estimated costs associated with abandonment and restoration are subject to uncertainties and actual costs may exceed Talisman’s estimates.
The Company’s operations may be adversely affected by changes in governmental policies or social instability or other political, economic or diplomatic developments which are not within the control of Talisman including, among other things, a change in crude oil or natural gas pricing policy, the risks of war, terrorism, abduction, expropriation, nationalization, renegotiation or nullification of existing concessions and contracts, taxation policies, foreign exchange and repatriation restrictions, economic sanctions, changing political conditions, the imposition of specific drilling obligations, the development and abandonment of fields (including restrictions on production), international monetary fluctuations and currency controls. Indonesia, Algeria, Sudan and Colombia have been subject to recent economic or political instability and social unrest, military or rebel hostilities. Although the Company has entered into a definitive agreement for the sale of its interest in the Greater Nile Oil Project in Sudan, as of the date of this document, the transaction was not completed. Accordingly, Talisman continues to have an interest in Sudan. There is civil unrest in Sudan, which apart from short periods of calm, has continued inconclusively since 1956. There have been isolated, politically motivated attacks on the oilfields and pipeline in Sudan. Minor production interruptions occurred as a result of pipeline attacks. Although security measures are in place to reduce the risk of future attacks, the oilfields and pipeline may be targets of future attacks.
The US has imposed comprehensive economic sanctions against Sudan. These sanctions apply to certain Sudan related transactions and activities in the US, activities by US individuals and entities wherever located and transactions by US and non-US persons involving US origin goods, technology or services. With limited exceptions, the sanctions prohibit “US persons” from engaging in or facilitating virtually all direct or indirect commercial, financial or trade transactions of any nature with Sudan or the Government of Sudan, including its entities and agents. As of the date hereof, Talisman (Greater Nile) B.V. (“TGNBV”), a subsidiary of Talisman, holds a 25% interest in the Greater Nile Petroleum Operating Company Limited (“GNPOC”) and the Greater Nile Oil Project. GNPOC, which operates the Greater Nile Oil Project, and Sudapet, which is the national oil company of Sudan and holds a 5% interest in GNPOC and the Greater Nile Oil Project, are treated as the Government of Sudan for purposes of the sanctions. Although neither TGNBV nor the Company is a “US person”and therefore are not bound by the
32
sanctions, new laws or regulations could be enacted or the scope of the sanctions could be expanded in a manner that could have an adverse effect upon the Company’s business and financial condition. Talisman has implemented comprehensive procedures to identify and avoid potential activities or transactions that may result in a contravention of the Sudanese sanctions by any US person. The Canadian government has not imposed unilateral economic sanctions on Sudan. In addition, in 2001 the United Nations removed its sanctions on Sudan. Those sanctions were diplomatic and not economic.
On October 21, 2002, the President of the United States signed into law the Sudan Peace Act. The legislation is designed to facilitate a comprehensive solution to the civil war in Sudan, but does not contain any capital market sanctions, as were included in an earlier version passed by the US House of Representatives in June 2001.
From time to time, Talisman is the subject of litigation arising out of its operations. Damages claimed under such litigation may be material or may be indeterminate and the outcome of such litigation may materially impact the Company’s financial results. A suit, which seeks class action status, was filed against the Company by the Presbyterian Church of Sudan and others on November 8, 2001 in the United States District Court for the Southern District of New York under the Alien Tort Claims Act and has been subsequently amended. The Republic of the Sudan is named in the suit. The suit seeks, among other things, a declaration that Talisman Energy Inc. has violated international law in connection with oil exploration and drilling activities in Sudan, an injunction permanently restraining Talisman from continuing to cooperate with the Government of Sudan, and unquantified compensatory and punitive damages. Talisman intends to fully defend itself against this suit and has filed a motion to dismiss the suit, which is currently under consideration by the United States District Court.
OUTLOOK FOR 2003
Talisman expects production per share, after adjusting for the Sudan sale, to increase 5% in 2003. Production for 2003 is expected to average approximately 395,000-415,000 boe/d with the sale of Sudan expected to close in the first quarter and the commencement of production from Algeria, the PM-3 CAA development project in Southeast Asia and the recently acquired US gas properties.
The Company expects cash flow per share of over $21 in 2003 ($2.8 billion), assuming US$28.50/bbl WTI oil and US$5.00/mcf NYMEX gas. Unit operating costs are expected to average approximately $7/boe, which reflects small increases in Canada and the North Sea, startup costs in Algeria and the sale of Sudan. Net capital spending is expected to be $2.1 billion and excludes corporate and asset acquisitions and the proceeds from the sale of Sudan.
NORTH AMERICA
Natural gas continues to be the focus of the Company’s exploration activities in North America supplemented by low risk oil projects. Recently announced acquisitions in northeast US have provided the Company’s first US based production in the Appalachia area. North American production in 2003 is expected to average between 860-880 mmcf/d and 58,000-60,000 bbls/d for a total of 200-205 mboe/d.
Estimated total capital spending of $975 million in 2003 will be over 80% directed at natural gas. The Company plans to participate in approximately 590 wells in 2003. Drilling costs are expected to increase in 2003 due to higher rig utilization and the Company’s continuing shift in focus from shallow natural gas targets to deeper more technically challenging prospects. Several infrastructure projects are planned to ease capacity constraints in some of the Company’s core areas including the Alberta Foothills and Greater Arch. Unit operating costs are expected to increase 5% with higher processing costs, an increase in the number of facilities and higher lifting costs associated with activities designed to maintain or increase production.
NORTH SEA
The Company’s North Sea strategy is to focus on low risk development projects and adjacent exploration opportunities around core operated properties and infrastructure. Of the $532 million of planned capital spending, 75% will be related to development projects. A total of eight exploration and 27 development wells are planned for 2003. The Blake Flank development is expected to deliver first oil in the third quarter. Natural decline offsetting the development work is expected to result in North Sea production averaging between 115,000-120,000 bbls/d and 125-130 mmcf/d in 2003, for a total of 136-142 mboe/d. Unit operating costs are expected to increase 7% with the reduced production.
SOUTHEAST ASIA
Natural gas sales in Indonesia have decreased due to reduced demand under the current gas supply contract with Caltex. Indonesian natural gas sales are expected to average 95-100 mmcf/d in 2003. Additional sales are expected in early 2004 when the pipeline to supply Singapore Power with natural gas from Corridor PSC is completed. An expansion of the gas plant facilities at Corridor PSC from 300-700 mmcf/d over the next three years is currently underway in order to accommodate additional anticipated gas sales. Natural gas production from the PM-3 CAA development in Malaysia/Vietnam is expected to commence in the fourth quarter of 2003 with an annualized production rate of 10-15 mmcf/d. The PM-3 CAA natural gas will be sold under a 10-year firm supply contract for approximately 100,000 mcf/d at market price. This contract is extendable on mutual agreement of the parties for an additional 10 years.
33
Oil and liquids production is expected to average between 20,000-22,000 bbls/d, with production from PM-3 CAA increasing to between 6,000-7,000 bbls/d (annualized) as a result of production from the Phase 2 development scheduled to start in the third quarter. Oil and liquids production in the Indonesian blocks is expected to average 14,000-15,000 bbls/d due to natural decline. Operating costs in Southeast Asia are expected to average $6/boe.
Talisman expects to spend $296 million (including capitalized interest) in Malaysia/Vietnam during 2003, primarily on the PM-3 CAA development project. Malaysia/Vietnam is expected to account for approximately 80% of the $366 million Southeast Asia exploration and development spending in 2003. In addition to the construction of the related facilities, 21 development and six exploration wells will be drilled in PM-3 CAA. Talisman also plans to drill three to four exploration and appraisal wells, two to three on PM-305 in Malaysia and one on Block 46/02 in Vietnam. The $70 million planned spending in Indonesia will primarily relate to the facilities expansion at Corridor and the drilling of additional wells at Corridor and the other Indonesian blocks. Exploration activities will account for $25 million of the $70 million in Indonesia.
ALGERIA
Production in the Ourhoud field commenced at year end. The pipeline has been filled and production is currently averaging 1,800 bbls/d (net to Talisman). Production from the second Algerian field, MLN, is expected to commence mid-year. Total combined production is expected to average 9,000-10,000 bbls/d in 2003. Initial operating costs, which include startup costs, are anticipated to be $8/bbl. A capital budget of $60 million will be used to drill 13 development wells, complete and commission the Central Process Facility and tie in wells.
SUDAN
The sale of the Sudan operations is expected to be completed during the first quarter of 2003. The Sudan operating results will continue to be reported as part of ongoing operations in 2003 until such time as the sales transaction is completed. Additional information regarding the sale is included in note 17 of the Consolidated Financial Statements. Readers are also referred to note 16 where the Sudan operations are disclosed as a separate reporting segment. Production for the first quarter is expected to average 60,000 bbls/d.
REST OF WORLD
Trinidad is expected to account for $149 million of capital spending with $99 million related to the Greater Angostura development project on offshore Block 2(c). First production is expected in early 2005. Talisman expects to spend $50 million in Trinidad to drill five offshore exploration wells and conduct onshore seismic in the Eastern Block.
In Colombia, the exploration program of $33 million is expected to include a seismic program and drilling two wells with the possibility of an additional two wells in the latter part of the year.
COMMODITY PRICES
Management currently expects commodity prices in 2003 will average US$28.50/bbl WTI oil and US$5/mcf NYMEX gas. However, continuing heightened world tension, including the possibility of military conflict in the Middle East and uncertainty over supply, makes price forecasting unusually difficult.
Including those contracts entered into during the early part of 2003, Talisman has committed 25% of its anticipated 2003 North American natural gas production under both commodity sales contracts and commodity price derivative contracts. Approximately 161 mmcf/d has been fixed at an average price of $5.83/mcf and 30 mmcf/d is under collars with an average floor and ceiling price of $6.17/mcf and $7.21/mcf.An additional 26 mmcf/d is under three-way collars that allow the Company to participate in gas prices up to an average $3.56/mcf and will provide a $0.60/mcf premium to spot prices should natural gas prices average below $2.73/mcf.
The Company has hedged 75,000 bbls/d of crude oil for 2003, of which 40,000 bbls/d have been fixed at US$24.45/bbl and 35,000 bbls/d are under crude oil collars with a ceiling price of US$27.53/bbl and a floor price of US$22.82/bbl.
A summary of the contracts outstanding at year end can be found in notes 9 and 10 of the Consolidated Financial Statements.
SENSITIVITIES
Talisman’s financial performance is affected by factors such as changes in production volumes, commodity prices and exchange rates. The estimated impact of these factors on 2003 financial performance is summarized in the following table and is based on a WTI oil price of US$28.50/bbl, a NYMEX natural gas price of US$5.00/mcf and an exchange rate of US$0.67/C$1.
APPROXIMATE IMPACT IN 2003
(millions of dollars) | | Net Income | | Cash Flow(1) | |
Volume changes | | | | | |
Oil — 1,000 bbls/d | | 4 | | 8 | |
Natural gas — 10 mmcf/d | | 5 | | 13 | |
Price changes(2) | | | | | |
Oil — US$1.00/bbl | | | | | |
Increase | | 38 | | 36 | |
Decrease | | (49 | ) | (54 | ) |
Natural gas (North America)(3) — C$0.10/mcf | | 11 | | 17 | |
Exchange rate changes | | | | | |
US increased by US$0.01 | | 27 | | 44 | |
£ increase by C$0.035 | | (9 | ) | 2 | |
(1) | | Cash flow is a non-GAAP measure, the components of which are set out in note 14 of the Consolidated Financial Statements. |
(2) | | The impact of commodity contracts outstanding for 2003 has been included. |
(3) | | Price sensitivity on natural gas relates to North American natural gas only. The Company’s exposure to changes in North Sea and Malaysia/Vietnam natural gas prices is not material. Most of the Indonesia natural gas price is based on the price of crude oil and accordingly has been included in the price sensitivity for oil except for a small portion which is sold at a fixed price. |
34