EXHIBIT 99.4
ANNUAL INFORMATION FORM FOR THE YEAR ENDED DECEMBER 31, 2016 FEBRUARY 23, 2017 REPSOL OIL & GAS CANADA INC. | | 
|
INDEX
INTRODUCTION | | 1 |
CORPORATE STRUCTURE | | 1 |
GENERAL DEVELOPMENT OF THE BUSINESS | | 2 |
DESCRIPTION OF THE BUSINESS | | 2 |
RESERVES AND OTHER OIL AND GAS INFORMATION | | 7 |
COMPETITIVE CONDITIONS | | 7 |
SOCIAL, SAFETY AND ENVIRONMENTAL POLICIES | | 7 |
EMPLOYEES | | 8 |
DESCRIPTION OF CAPITAL STRUCTURE | | 9 |
MARKET FOR THE SECURITIES OF THE COMPANY | | 10 |
DIRECTORS AND OFFICERS | | 10 |
AUDIT COMMITTEE INFORMATION | | 13 |
LEGAL PROCEEDINGS | | 13 |
RISK FACTORS | | 14 |
TRANSFER AGENTS AND REGISTRARS | | 23 |
INTERESTS OF EXPERTS | | 23 |
ADVISORIES | | 23 |
EXCHANGE RATE INFORMATION | | 25 |
ABBREVIATIONS | | 26 |
ADDITIONAL INFORMATION | | 27 |
SCHEDULE A — RESERVES DATA AND OTHER OIL AND GAS INFORMATION | | 28 |
SCHEDULE B — AUDIT COMMITTEE INFORMATION | | 61 |
SCHEDULE C — CORPORATE GOVERNANCE | | 69 |
SCHEDULE D — EXECUTIVE COMPENSATION | | 78 |
INTRODUCTION
This document is the Annual Information Form of Repsol Oil & Gas Canada Inc. (“ROGCI” or the “Company”), formerly Talisman Energy Inc., for the year ended December 31, 2016. All information in this Annual Information Form relating to assets owned or held by the Company is as of December 31, 2016, unless otherwise indicated.
On May 8, 2015, Repsol S.A. (“Repsol”) indirectly acquired all of the outstanding shares of the Company. The Company continues to be a reporting issuer under applicable Canadian and United States securities laws and thus continues to be subject to the continuous disclosure obligations applicable to reporting issuers. This Annual Information Form is being filed in accordance with those obligations. Since the Company’s shares are no longer publicly held, the Company will not be preparing and filing with the applicable securities regulators the management proxy circular that would be required for an annual meeting of shareholders. This Annual Information Form includes certain information that the Company is required to disclose that would otherwise be disclosed in a management proxy circular.
Unless the context indicates otherwise, references in this Annual Information Form to “ROGCI” or the “Company” include, for reporting purposes only, the direct or indirect subsidiaries of the Company, partnership interests held by the Company and its subsidiaries, and the Company’s equity interests in Equiόn Energía Limited (“Equiόn”) and Repsol Sinopec Resources UK Limited (“RSRUK”, formerly Talisman Sinopec Energy UK Limited or “TSEUK”) as noted below. Use of “ROGCI” or the “Company” to refer to these subsidiaries, partnership interests and equity interests does not constitute a waiver by the Company or such entities or partnerships of their separate legal status, for any purpose.
The Company has a 49% equity interest in Equiόn and a 51% equity interest in RSRUK. The Company accounts for its investments in Equiόn and RSRUK using the equity method of accounting. All reserves, production and other operating data reported herein which includes information relating to Equiόn and RSRUK, reflects the Company’s 49% equity interest in Equiόn and the Company’s 51% equity interest in RSRUK.
All dollar amounts in this Annual Information Form are presented in US dollars, except where otherwise indicated.
Readers are directed to the “Forward-Looking Information” section contained in the Advisories in this Annual Information Form.
CORPORATE STRUCTURE
The Company is an upstream oil and gas company wholly-owned by a subsidiary of its ultimate parent company, Repsol. It is incorporated under the Canada Business Corporations Act and its registered and head office is located at Suite 2000, 888 - 3rd Street SW, Calgary, Alberta, T2P 5C5.
The following table lists the material operating subsidiaries owned directly or indirectly by the Company, their jurisdictions of incorporation and the percentage of voting securities beneficially owned, controlled or directed by the Company as at December 31, 2016.
Name of Subsidiary | | Jurisdiction of
Incorporation/Formation | | Percentage of Voting
Securities Owned(1) | |
Repsol Canada Energy Partnership(2) | | Alberta | | 100 | % |
Repsol Oil & Gas USA, LLC(3) | | Texas | | 80 | %(4) |
Repsol Alberta Shale Partnership | | Alberta | | 100 | % |
Talisman (Corridor) Ltd. | | Barbados | | 100 | % |
Talisman (Vietnam15-2/01) Ltd. | | Alberta | | 100 | % |
Repsol Oil & Gas Malaysia Limited | | Barbados | | 100 | % |
Repsol Oil & Gas Malaysia (PM3) Limited | | Barbados | | 100 | % |
Talisman (Algeria) B.V. | | The Netherlands | | 100 | % |
(1) None of the subsidiaries listed in the above table have any non-voting securities outstanding.
(2) Repsol Canada Energy Partnership, formerly Talisman Energy Canada, is an Alberta general partnership which currently carries on substantially all of the Company’s conventional Canadian oil and gas operations.
(3) Formerly Talisman Energy USA Inc.
(4) See “Three Year History” herein.
The above table does not include all of the subsidiaries of the Company. The assets, sales and operating revenues of unnamed operating subsidiaries individually did not exceed 10% and, in the aggregate, did not exceed 20% of the total consolidated
1
assets or total consolidated sales and operating revenues, respectively, of the Company, as at and for the year ended December 31, 2016.
GENERAL DEVELOPMENT OF THE BUSINESS
General
The Company’s main business activities include exploration, development, production, transportation and marketing of crude oil, natural gas and natural gas liquids.
For the purposes of financial reporting, the Company’s 2016 activities were conducted in four geographic segments: North America, Southeast Asia, North Sea, and Other. The North America segment includes operations and exploration activities in Canada and the US. The Southeast Asia segment includes operations and exploration activities in Indonesia, Malaysia, Vietnam and Papua New Guinea, and operations in Australia/Timor-Leste. The North Sea segment includes operations and exploration activities in the UK. As at year-end 2016, the Company also has operations in Algeria, operations and exploration activities in Colombia and exploration activities in the Kurdistan Region of Iraq. For ease of reference, activities in Algeria, Colombia, the Kurdistan Region of Iraq and Peru (which the Company is in the process of exiting), are referred to collectively as the “Other” geographic segment or “Rest of World”, except where otherwise noted.
This Annual Information Form aligns with the Company’s geographic segments for the purposes of financial reporting.
Three-Year History
On December 15, 2014, the Company entered into an arrangement agreement with Repsol and an indirect, wholly-owned subsidiary of Repsol, providing for Repsol’s acquisition of the Company (the “Repsol Transaction”) by way of an arrangement under the Canada Business Corporations Act. On May 8, 2015, the Repsol Transaction was completed. Repsol acquired all of the Company’s outstanding common shares (“Common Shares”) and preferred shares. Upon the completion of the Repsol Transaction, the Common Shares were delisted from the Toronto Stock Exchange and the New York Stock Exchange, and the preferred shares were delisted from the Toronto Stock Exchange and subsequently converted into Common Shares.
During 2015, the Company completed a number of dispositions. On September 1, 2015, the Company completed the sale of all of the assets and liabilities of the Company’s Norwegian operations to Repsol Exploration Norge AS, a subsidiary of Repsol. In December 2015, the Company agreed to sell its 50% interest in Block CPE-6 located in Colombia to Meta Petroleum Corporation, a subsidiary of Pacific Exploration & Production Corp. On December 30, 2015, the Company completed the sale of 26% (being a net 13% working interest) of its interests in the Eagle Ford area of southeast Texas to certain subsidiaries of Statoil ASA (“Statoil”). As part of this transaction, the Company also agreed to amend the South Texas Joint Development Agreement with Statoil and transfer operatorship of that portion of the Eagle Ford operated by the Company to Statoil.
On January 1, 2016, the Articles of the Company were amended to change the name of the Company from Talisman Energy Inc. to Repsol Oil & Gas Canada Inc. In November, 2016, the Agencia Nacional De Hidrocarburos (“ANH”) approved the assignment of interests, rights and obligations in the Block CPE-6 E&P contract in Colombia. The transfer was finalized by the ANH in February 2017. In December, 2016, the Company divested its interest in the Tangguh LNG project in Indonesia, through the sale of all of its shares in Talisman Wiriagar Overseas Limited, a wholly owned subsidiary of the Company. On December 30, 2016, Talisman Energy USA Inc., a wholly-owned subsidiary of ROGCI, converted from a Delaware corporation to a Texas limited liability corporation named Repsol Oil & Gas USA, LLC (“ROGUSA”). On December 31, 2016, ROGCI sold a 20% interest in ROGUSA to a wholly-owned subsidiary of Repsol.
DESCRIPTION OF THE BUSINESS
General
The Company’s aggregate production from its consolidated entities and equity investments for the year ended December 31, 2016 was 338 mboe/d, comprised of 38 mbbls/d of oil and liquids and 783 mmcf/d of gas from North America; 28 mbbls/d of oil and liquids and 443 mmcf/d of gas from Southeast Asia; 21 mbbls/d of oil and liquids and 3 mmcf/d of gas from the North Sea; and 26 mbbls/d of oil and liquids and 31 mmcf/d of gas from other areas. Approximately 33% of the Company’s production is liquids and 67% is natural gas (on a 5.615 mcf:1 bbl equivalency basis).
2
North America
The Company’s North America operations are organized into two distinct businesses: Canada and United States. The Company has operations in the Greater Edson (oil and gas production), Chauvin (heavy oil production) and Duvernay (liquids rich shale gas) areas, located in the Western Canadian Sedimentary Basin, primarily in Alberta, Canada; the Marcellus dry gas shale play located in northeast Pennsylvania; and the Eagle Ford liquids-rich, shale gas play located in southeast Texas. In 2016, North America production accounted for 52% of total Company production.
Canada
The Company’s Canadian interests are focused around liquids and gas opportunities in the Greater Edson area of Alberta, conventional heavy oil in the Chauvin area of Alberta/Saskatchewan and liquids-rich gas in Alberta’s Duvernay play. The Company spent approximately $120 million to explore and develop its assets in Canada in 2016, resulting in total production of 64 mboe/d. In 2017, the Company plans to continue to develop land positions in Greater Edson, Chauvin and Duvernay. The Company holds approximately 1.03 million net acres of land in Western Canada. The Company’s operations include four operated gas plants in the Edson area and an oil treatment facility in Chauvin, and extensive oil and gas gathering facilities in both Edson and Chauvin.
Greater Edson
The Company’s Greater Edson assets are primarily located in the liquids and gas formations in the Edson area of Alberta and Groundbirch area of British Columbia. The Company continued to develop its Greater Edson assets throughout 2016 with exploration and development spending of $72 million, resulting in total production of 289 mmcfe/d (51.4 mboe/d), which represents 80% of total Canadian production. In total, 27 gross (20.3 net) wells were drilled in 2016. The Company holds approximately 598,000 net acres in the Greater Edson area.
Chauvin
In the Chauvin area of Alberta/Saskatchewan, production for 2016 was 9.7 mboe/d (95% heavy oil), which represents 15% of total Canada production. A total of 2 horizontal producers were drilled in 2016. The Company holds approximately 126,000 net acres in the Chauvin area.
Duvernay
In the liquids-rich Duvernay play in west-central Alberta, the Company currently holds interests in approximately 309,000 acres of land. During 2016, the Company drilled 2 horizontal wells in the Duvernay play. Total production in 2016 was 17.3 mmcfe/d (3.1 mboe/d), representing 5% of total Canada production.
United States
The Company has interests in two shale gas plays in the United States - a dry shale gas play in the Marcellus and a liquids-rich shale gas play in the Eagle Ford. In 2016, the Company spent approximately $195 million on exploration and development with respect to these shale gas plays. Production from these plays totaled approximately 112.5 mboe/d in 2016.
Marcellus Shale
The Company’s interests in the Marcellus shale play are located in New York and Pennsylvania. The Company’s main area of focus in 2016 was in Pennsylvania. At year end, the Company’s full year production in the Marcellus shale play averaged 499 mmcf/d (100% gas), which represents 54% of the Company’s total North America gas production. In total, 32 gross (29.8 net) wells were put on-stream in 2016, the majority of which were in the areas of Friendsville (9), Chaffee (10), Columbia (9) and State lands (4). During 2016, the Company acquired approximately 7,500 net acres of land in Pennsylvania. The Company currently holds approximately 166,000 net acres in the Marcellus gas play in Pennsylvania and a 33,000 acre land position in the Utica shale play underlying the Marcellus rights.
In Pennsylvania, the Company has midstream assets consisting of approximately 300 miles of production/gathering pipelines serviced by eight compression/gas dehydration facilities. The pipeline system has throughput capacity of approximately 1.5 bcf/d. In 2016, these facilities delivered 490 mmcf/d into outlets on various transmission lines. The New York midstream assets currently consist of approximately 174 miles of production/gathering pipelines and 4 compression/gas processing facilities with throughput capacity of 125 mmcf/d. During 2016, these facilities delivered 9 mmcf/d from the Trenton Black River formation production to third-party pipelines. All of these systems currently gather mostly volumes from wells in which the Company currently has a working interest, although additional capacity is available for future use by the Company
3
or third parties. The Company currently holds approximately 625 mmcf/d of gas pipeline take away capacity from the Marcellus area and excess pipeline capacity is mitigated when possible.
In December 2014, the New York Governor’s office announced that it was banning high volume hydraulic fracturing in New York State, following the completion of a review conducted by the state’s Department of Environmental Conservation. The Company has no immediate plans to drill in New York and will continue to monitor regulatory changes applicable to future operations in New York.
Eagle Ford Shale
The Company’s interests in the Eagle Ford shale play are located in southeast Texas. The Company now holds a net 37% working interest in the play comprising approximately 41,700 net acres of land. Operatorship of the western portion of this joint venture was transferred to its co-venturer, Statoil, in June 2016.
The Company’s full year production in the Eagle Ford averaged 24 mboe/d (39% natural gas, 31% natural gas liquids and 30% oil), which represents 13.5% of total North America production. In total, 26 gross (8 net) joint venture wells and 16 gross (1 net) third-party non-operated wells were drilled in 2016.
Southeast Asia
The Company has interests in Indonesia, Malaysia, Vietnam, Australia/Timor Leste and Papua New Guinea. In 2016, Southeast Asia production averaged 107 mboe/d, which accounted for approximately 32% of the Company’s production worldwide. As at year-end 2016, the Company operated approximately 32% of its Southeast Asia production.
Indonesia
The Company’s Indonesian assets included interests in production sharing contracts (“PSCs”) at Corridor, Ogan Komering, East Jabung and Jambi Merang in South Sumatra. The Company’s 3.06% interest in the Tangguh LNG project in West Papua was divested by the Company on December 2, 2016 and at year end was no longer part of the Company’s portfolio. In 2016, the Company’s working interest production from the Tangguh LNG project contributed 5.6 mboe/d from January until the divestment date (5.1 mboe/d annualized for 2016).
The Company also holds exploration acreage in South and North Sumatra through the Sakakemang and Andaman III PSCs, respectively. The Company also has an indirect, 6% interest in the Grissik-to-Duri pipeline and the Grissik-to-Singapore pipeline which is used to transport gas from the Corridor PSC.
In the Corridor PSC, the Company has a 36% non-operated interest in all but two of the producing fields, the exceptions being the Gelam and Suban fields which are unitized with adjoining blocks, where the Company’s unit interests are 30.96% and 32.4%, respectively.
The majority of the Company’s natural gas production from the Corridor block is currently sold under long-term sales agreements with PT Chevron Pacific Indonesia, Gas Supply Pte. Ltd. and PT Perusahaan Gas Negara (Persero), Tbk. (“PGN”). Gas sales from Corridor to PGN for sale into PGN’s markets in West Java are sold under a long-term contract with no associated transportation costs. During 2016, the Corridor PSC commenced selling gas volumes to the State Electricity Company PT Perusahaan Listrik Negara (Persero), (“PLN”), under a new Gas Sales Agreement.
In 2016, the Company’s share of production from the Corridor PSC was approximately 53 mboe/d. Corridor production accounted for approximately 50% of the Company’s Southeast Asia production. In 2016, production from the Company’s 25% interest in the Jambi Merang PSC averaged 4.3 mboe/d.
Malaysia
The Company holds a 41.44% operated interest in Block PM3 PSC between Malaysia and Vietnam and associated production facilities (with the exception of Bunga Kekwa 8G-31 sub-blocks in which the Company holds a 35% interest). In addition, the Company holds a 33.154% interest in Block 46-Cai Nuoc adjacent to PM-3 CAA and a 60% interest in each of Block PM-305, Block PM-314 and Kinabalu.
In Block PM3, the Company operates facilities referred to as the “Southern Fields” and the “Northern Fields”. In April 2016, the Company was awarded a 10-year extension, commencing from the end of the original term until 2027. In addition, the Company also completed a new BOC-BOD gas pipeline replacement and sanctioned the Bunga Pakma project, which is
4
expected to fulfil a gas delivery commitment to Malaysia and Vietnam upon completion in 2018. During 2016, production from PM-3 averaged approximately 28 mboe/d. Production from Block 46-Cai Nuoc averaged 1.4 mboe/d in 2016.
In Block PM-305 and Block PM-314, the Company operates South Angsi-A (SAA) facilities. Upon SAA’s Floating Storage Offloading contract expiry in August 2016, the Company secured four, one-year extension options, which allow for an annual economics assessment of the fields’ viability. Production from Block PM-305 and Block PM-314 averaged an aggregate of 1.5 mboe/d in 2016.
The Company holds a 60% equity interest in and operatorship of the Kinabalu Oil PSC, which is a mature offshore oilfield in the Malaysian Sabah Basin. In 2016, the Company successfully completed several preventative maintenance and intervention programs. The Kinabalu redevelopment project, sanctioned in July 2015, consists of a wellhead platform bridge linked to the existing Kinabalu facilities and ten oil production wells. Engineering, procurement and fabrication activities were ongoing in 2016. Production from Kinabalu averaged approximately 5.4 mboe/d in 2016.
In 2016, the Company’s net share of production in Malaysia averaged 36 mboe/d, which accounted for approximately 34% of the Company’s total Southeast Asia production.
Vietnam
The Company holds a 60% interest in Block 15-2/01 as a partner in the Thang Long Joint Operating Company, which operates the Block. Block 15-2/01 lies in the Cuu Long Basin, the predominant oil producing basin in Vietnam. The Company holds a 49% operated interest in Blocks 133 and 134, a 40% operated interest in Blocks 135 and 136, a 100% operated interest in Blocks 156-159, a 46.75% operated interest in Block 07/03, including the Ca Rong Do Discovery adjacent to Blocks 135 and 136 in the Nam Con Son basin, and an 80% operated interest in Blocks 146 and 147.
During 2016, a 40% operated interest in Block 05-2/10 was relinquished after fulfilling the initial exploration phase commitments. Combined production from the Company’s interest in the HST/HSD project, situated in Block 15-2/01, and its interest in the adjacent TGT Unit, averaged 6.5 mboe/d in 2016, accounting for approximately 6% of the Company’s total Southeast Asia production.
In 2016, exploration prospect generation and well planning has been undertaken for both Block 135 and 136, and Block 07/03 for potential exploration drilling in 2017.
Australia/Timor-Leste
In September 2015, a wholly-owned subsidiary of the Company entered into a sale agreement pursuant to which it would sell its shareholdings in another wholly-owned subsidiary which in turn held license interests in the Laminaria and Corallina fields offshore Australia and an interest in the Northern Endeavour Floating Production Storage and Offloading facility. This transaction closed on April 29, 2016.
The first phase of the decommissioning and abandonment of the Kitan project (in the JPDA 06-105 PSC, located offshore between Timor Leste and Australia) ended in February 2016. The operator estimates that the second and last phase of the decommissioning and abandonment, if it proceeds, will occur in 2018-2019.
Papua New Guinea
In Papua New Guinea, the Company continues with its gas aggregation strategy. In 2016, two exploratory wells — Strickland-1 and Strickland-2, were completed and recorded as dry holes. As a result the minimum work obligations of license PPL269 were fulfilled.
North Sea
The Company’s North Sea business consists of its equity investment in RSRUK in the United Kingdom. The Company’s North Sea business delivered total production of approximately 22 mboe/d in 2016.
United Kingdom
The Company holds a 51% equity interest in RSRUK. The remaining 49% is held by Addax Petroleum UK Limited, a wholly-owned subsidiary of the Sinopec Group. RSRUK is governed through its Executive Committee and Board of Directors. The Executive Committee, comprised of shareholder representatives, is the primary decision-making body for items beyond the authority limit of RSRUK’s management team. RSRUK’s Board of Directors, comprised of an equal number of shareholder representatives plus an independent director, is the decision-making body for items beyond the
5
authority limit of the Executive Committee. As a shareholder, the Company does not have control of the day-to-day operations of RSRUK.
RSRUK
The Company’s share of capital investment in exploration and development activities during 2016 was $203 million. At year end, RSRUK operated approximately 95% of its production.
RSRUK’s principal operating areas encompass a total of 46 fields in the UK, 35 of which are operated and 11 of which are non-operated. RSRUK’s working interests in these fields range from 4.95% to 100%. RSRUK also has interests in production facilities and pipelines, including a 100% interest in the Flotta Terminal. Pursuant to the RSRUK shareholders’ agreement, the Company agreed to spend up to $2.5 billion over five years (2012-2016) on projects that meet a prescribed economic threshold.
RSRUK continued to make progress on the Montrose Area Redevelopment Project, which was sanctioned in 2012. The project is expected to deliver first oil in the second quarter of 2017, with peak production currently expected in 2018. The project was 95% complete as at year-end 2016. Flyndre development is ongoing with first oil expected in first quarter 2017 (non operated). The Decommissioning Working Program for 2017 is budgeted for $260 million to be performed mainly in the Beatrice, Tartan and Buchan fields.
Rest of World
The Company’s other interests as at December 31, 2016 include non-operated production and exploration activities in Colombia, non-operated production in Algeria and exploration activities in the Kurdistan Region of Iraq.
Colombia
This section describes the Company’s operations in Colombia. Operations relating to the Company’s 49% interest in Equiόn, accounted for using the equity method, are described in a separate section below.
The Company currently holds an interest in 3.84 million net acres in Colombia (excluding the acreage owned by Equiόn).
In Block CPO-9, 2016 production averaged 0.7 mbbls/d, consisting only of oil production. Operations were suspended from March to October 2016 due to market conditions. Production was resumed in October, starting with one well. The year ended with three wells producing.
On November 29, 2016, the ANH approved the assignment of interests, rights and obligations in the Block CPE-6 E&P contract to Meta Petroleum Corp. The transfer was finalized by the ANH in February, 2017.
The Block CPE-8 TEA force majeure condition was extended indefinitely by the ANH. The contract has been in this state since September 2015.
In Block Niscota, the Payero well was drilled and declared dry in November.
Equiόn
The Company holds a 49% equity interest in Equiόn. The remaining 51% interest is held by Ecopetrol. Currently, Equiόn holds upstream licenses in three blocks and also holds equity and capacity interests in three pipelines. Production averaged 19 mboe/d.
In 2016, Equiόn completed Pauto MP-9, Pauto CP-10 and started drilling the Floreña IPD-5A wells. In March, Buenos Aires WA35 and WA42 wells were abandoned. The Tauramena license, part of the Unified Exploitation of Cusiana field, expired on July 3, 2016. The Company’s participation in the Cusiana field decreased from 9.3% to 0.65%.
6
Algeria
The Company holds a 35% non-operated interest in Block 405a under a PSC with Algeria’s national oil company, Sonatrach. Through its participation in Block 405a, the Company currently holds a 35% interest in the producing Greater Menzel Lejmat North (“MLN”) fields and the Menzel Lejmat Southeast field, a 2% interest in the producing unitized Ourhoud field, and a 9% interest in the unitized EMK field produced through the El Merk facility. The Company’s Algeria production is 100% liquids. Production from the area averaged 13 mboe/d in 2016.
The Kurdistan Region of Iraq
The Company has an interest in two blocks in the Kurdistan Region of Iraq. The Company holds a 40% and 60% interest in the Kurdamir and Topkhana Blocks respectively, covering approximately 120,000 net acres.
RESERVES AND OTHER OIL AND GAS INFORMATION
Information on the Company’s reserves and other oil and gas information, prepared in accordance with Canadian disclosure requirements, is set forth in Schedule A.
COMPETITIVE CONDITIONS
The oil and gas industry, both within North America and internationally, is highly competitive in all aspects of the business. The Company actively competes for the acquisition of properties, the exploration for and development of new sources of supply, the contractual services for oil and gas drilling and production equipment and services, the transportation and marketing of current production, and industry personnel. With respect to the exploration, development and marketing of oil and natural gas, the Company’s competitors include major integrated oil and gas companies, numerous independent oil and gas companies, individual producers and operators, and national oil companies. A number of the Company’s competitors have financial and other resources substantially in excess of those available to the Company. However, as part of the larger Repsol integrated oil and gas group, the Company has greater access to additional financial and other resources than previously available. In addition, oil and gas producers in general compete indirectly against others engaged in supplying alternative forms of energy, fuel and related products to consumers.
SOCIAL, SAFETY AND ENVIRONMENTAL POLICIES
Code of Ethics and Business Conduct and Ethics Channel
From January 1 to September 15, 2016, the Company maintained a standalone Code of Business Conduct and Ethics which was applicable to all directors, officers, employees and contractors of the Company and its subsidiaries. In September 2016, Repsol adopted a new global Code of Ethics and Business Conduct (“CEBC”), which applies to all directors, officers, executives and temporary and permanent employees of Repsol and its subsidiaries and affiliates. The Board of Directors of the Company formally approved the adoption of the CEBC in September 2016, with the same effective date as its ultimate parent company.
The CEBC requires the immediate reporting of issues that could conflict with the CEBC, internal policies or laws or regulations. Personnel can report possible concerns in confidence. The CEBC states that Repsol will not tolerate any retaliation against anyone who in good faith asks questions, makes a report under the CEBC or who assists in an investigation of wrongdoing. The CEBC also states that any concerns with respect to the CEBC can be discussed with a direct supervisor, any other supervisor or a member of management.
The CEBC can be obtained at www.repsol.com/ca_en/ or upon request from: Communications and External Relations Department, Repsol Oil & Gas Canada Inc., 2000, 888 — 3rd Street S.W., Calgary, Alberta, T2P 5C5 or by email at: infocanada@repsol.com. The CEBC has been filed with Canadian securities regulators and can be accessed through www.sedar.com.
Pursuant to its Terms of Reference, the Board of Directors of the Company reviews any requests for waivers from the CEBC from officers and directors of the Company, and all material waivers from the CEBC are required to be disclosed promptly to the shareholder. No waivers from the CBCE were granted for the benefit of the Company’s directors or officers during the year ended December 31, 2016.
Repsol has also instituted the Repsol Ethics and Compliance Channel (the “Ethics Channel”), a confidential and anonymous reporting hotline for submitting enquiries or complaints under the CEBC. The Ethics Channel is available twenty-four hours
7
a day, seven days a week, and can be accessed by telephone or online at ethicscompliancechannel.repsol.com. The Ethics Channel is also available to internal and external users. Reports are received by an independent third-party provider and, if they relate to ROGCI or its subsidiaries, are subsequently forwarded to the Company’s Ethics Coordinator. In addition, the Company’s Audit Committee has developed procedures for the receipt, retention and treatment of complaints received regarding accounting, internal accounting controls or auditing matters. Any reports made through the Ethics Channel which relate to these areas are subject to the parameters and notification protocols embedded in the Audit Committee procedures.
Safety and Environmental Protection
The Board of Directors and all executive officers oversee and are accountable for the Company’s safety, environment and operational performance. The Company’s Board and the Company’s executive officers regularly review policies, management systems, internal controls, performance reports, significant issues, exposures and strategic initiatives in the area of safety and the environment (“S&E”).
In 2015, after the closing of the Repsol Transaction, the Company initiated an integration process with Repsol on S&E matters. Effective February 2016, the Company’s Board of Directors approved the new Repsol global Health, Safety and Environment Policy which replaces the Company’s previous Policy on Safe Operations. The contents of these two policies are consistent. The Company’s Safety, Environment and Sustainbility Division has led an ongoing project to integrate the Company’s S&E systems and processes with those of Repsol. This effort is a multi-year process wherein the Company’s existing S&E standards and processes will remain in place until they are systematically reviewed, and either retained, revised or replaced to conform with Repsol standards and processes.
Safe operations in all Company activities forms a core value of the Company. If operational results and safety ever come into conflict, the Company’s employees and contractors are empowered and encouraged to choose safety over operational results. The Company will support that choice. The Company’s safety culture is driven by strong commitment from senior management and safety accountability at all levels of the organization.
The Company regularly reports to and consults with government agencies in its operating regions and submits to routine regulatory inspections. The Company also conducts environmental due diligence on applicable asset and corporate acquisitions to identify and properly account for pre-existing environmental liabilities.
Other Policies
Repsol also maintains other global policies which are applicable to its subsidiaries and affiliates, including the Company (collectively, the “Repsol Group”). The objective of the Community Relations Policy is to achieve and maintain strong and enduring relationships with communities where the Repsol Group has a presence, based on recognition, trust, mutual respect and shared values, through proactive engagement and responsible and transparent management of social impacts and opportunities. In addition, the Repsol Group maintains a Respect for Human Rights Policy (the “Human Rights Policy”), which formalizes Repsol’s commitment to respecting human rights and outlines what the Repsol Group expects from employees, partners, business relationships and other parties directly involved with its operations, products or services. In particular, Repsol commits to respect for human rights of people belonging to groups or populations that may be more vulnerable, such as indigenous people, women, national, ethnic, religious and linguistic minorities, children, disabled people and migrant workers and their families. In situations of armed conflict, Repsol undertakes to respect the rules of international humanitarian law. Both the Community Relations Policy and the Human Rights Policy are based on respect for internationally recognized human rights, including those in the International Bill of Human Rights and those established in the International Labor Organization Declaration on Fundamental Principles and Rights at Work, and the eight Fundamental Conventions, and specifically Convention 169, that comprise them. Repsol will do its utmost to ensure that its activities do not have a negative impact on human rights and will endeavor to mitigate or repair any such impact should it occur.
EMPLOYEES
At December 31, 2016, the Company’s permanent staff complement (excluding employees of RSRUK and Equiόn) was 1,940, as set forth in the table below.
| | Permanent Staff Complement(1)
as at December 31, 2016 | |
North America | | 1,173 | |
Southeast Asia | | 727 | |
Rest of World(2) | | 40 | |
Total | | 1,940 | |
(1) Contractors and temporary staff are not included in complement numbers.
(2) Rest of World refers to Spain, Colombia, the Kurdistan Region of Iraq and the Company’s regional finance offices.
8
DESCRIPTION OF CAPITAL STRUCTURE
Share Capital
The Company’s authorized share capital consists of an unlimited number of Common Shares without nominal or par value and an unlimited number of first and second preferred shares. The outstanding shares consist of Common Shares. Upon the completion of the Repsol Transaction, Repsol acquired all of the Company’s outstanding Common Shares and the outstanding first preferred shares. The outstanding first preferred shares were subsequently converted to Common Shares.
Ratings
The following information relating to the Company’s credit ratings is provided as it relates to the Company’s financing costs, liquidity and cost of operations. Specifically, credit ratings impact the Company’s ability to obtain externally sourced, short-term and long-term financing and the cost of such financings. A negative change in the Company’s ratings outlook or any downgrade in the Company’s current investment-grade credit ratings by its rating agencies, particularly below investment grade, could adversely affect its cost of borrowing and/or access to sources of liquidity and capital. In addition, changes in credit ratings may affect the Company’s ability to enter into, or the associated costs of entering into, ordinary course contracts on acceptable terms, and a decline in the credit ratings or outlook may require the Company to post collateral or post additional collateral under certain of its contracts. The following table outlines the ratings assigned to the Company by credit rating agencies as at December 31, 2016.
| | Standard & Poor’s
Rating Services
(“S&P”) | | Moody’s Investors
Services
(“Moody’s”) | | Fitch Rating
Services
(“Fitch”) | |
Senior Unsecured/Long-Term Rating | | BBB- | | Baa3 | | BBB- | |
Short-Term Rating | | A-3 | | WR | | F3 | |
Outlook/Trend | | Negative | | Negative | | Negative | |
Credit ratings are intended to provide investors with an independent measure of the credit quality of an issue of securities and are indicators of the likelihood of payment and of the capacity of a company to meet its financial commitment on the rated obligation in accordance with the terms of the rated obligation. The ratings agencies regularly evaluate the Company, and their ratings of the Company’s securities are based on a number of factors not entirely within the Company’s control, including conditions affecting the oil and gas industry generally, and the wider state of the economy. The credit ratings assigned to the Company’s senior unsecured long-term debt securities are not recommendations to purchase, hold or sell the securities and may be revised or withdrawn entirely at any time by a rating agency. Credit ratings may not reflect the potential impact of all risks or the value of these securities. In addition, real or anticipated changes in the rating assigned to the securities will generally affect the market value of the securities. There can be no assurance that any rating will remain in effect for any given period of time or that any rating will not be revised or withdrawn entirely by a rating agency in the future if, in its judgment, circumstances so warrant.
S&P’s credit ratings are on a long-term debt rating scale that ranges from AAA to D, representing the range from highest to lowest quality of such securities rated. The ratings from AA to CCC may be modified by the addition of a plus (+) or minus (-) sign to show relative standing within the major rating categories. The BBB rating category is the fourth highest of the eleven major ratings categories used by S&P. According to S&P’s rating system, debt securities rated BBB- are considered the lowest investment grade by market participants.
S&P’s credit rating for short-term issues range from A-1 to D, representing the range from highest to lowest quality of such securities rated. According to S&P, a short-term obligation rated A-3 exhibits adequate protection parameters. However, adverse economic conditions or changing circumstances are more likely to lead to a weakened capacity of the obligor to meet its financial commitment on the obligation.
Moody’s long-term debt credit ratings are on a scale that ranges from Aaa to C, representing the range from least credit risk to greatest credit risk of such securities rated. Moody’s applies numerical modifiers 1, 2 and 3 in each generic rating classification from Aa through Caa in its long-term debt rating system. The modifier 1 indicates that the issue ranks in the higher end of its generic rating category, the modifier 2 indicates a mid-range ranking and the modifier 3 indicates that the issue ranks in the lower end of that generic rating category. According to the Moody’s rating system, debt securities rated within the Baa category are subject to moderate credit risk. They are considered medium grade and, as such, may possess certain speculative characteristics.
9
In 2016 the Company cancelled its Commercial Paper program and requested that Moody’s withdraw their short-term debt rating.
Fitch’s long-term debt credit ratings are on a scale that ranges from AAA to RD/D, representing the range from highest to lowest quality of such securities rated. The BBB rating category is the fourth highest of the eleven major ratings categories used by Fitch. According to Fitch’s rating scale, obligations rated BBB are of good credit quality, expectations of default risk are low and the capacity for payment of financial commitments is considered adequate but adverse business or economic conditions are more likely to impair this capacity. The modifiers “+” or “-” may be appended to a rating to denote relative status within major rating categories.
Fitch’s short-term credit ratings are on a scale that ranges from F1 to D, representing the range from highest to lowest quality of such securities rated. According to Fitch’s rating scale, obligations rated F3 are of fair credit quality and have adequate intrinsic capacity for timely payment of financial commitments.
MARKET FOR THE SECURITIES OF THE COMPANY
Subsequent to the closing of the Repsol Transaction, the Common Shares of the Company were delisted on the Toronto Stock Exchange (“TSX”) and New York Stock Exchange and the Company’s Series 1 First Preferred Shares were delisted from the TSX. The Company’s UK£250 million 6.625% Notes are listed on the London Stock Exchange.
Dividends
The Company paid the following dividends on its Common Shares over the last three years, with none paid in 2016:
Date | | Rate Per
Common Share | |
March 31, 2014 | | US$ | 0.0675 | |
June 30, 2014 | | US$ | 0.0675 | |
September 30, 2014 | | US$ | 0.0675 | |
December 31, 2014 | | US$ | 0.0675 | |
April 29, 2015 | | US$ | 0.1125 | |
The Company paid the following dividends on its Series 1 First Preferred Shares over the last three years, with none paid in 2016:
Date | | Rate Per Series 1
First Preferred Share | |
March 31, 2014 | | C$ | 0.2625 | |
June 30, 2014 | | C$ | 0.2625 | |
September 30, 2014 | | C$ | 0.2625 | |
December 31, 2014 | | C$ | 0.2625 | |
March 31, 2015 | | C$ | 0.2625 | |
DIRECTORS AND OFFICERS
Information is given below with respect to each of the current directors and officers of the Company.
Directors
The directors of the Company are elected annually. The following table sets out the name, city, province or state and country of residence, year first elected or appointed to the Board of Directors, principal occupation within the past five years or more, educational qualifications and other current directorships of each of the directors of the Company as at December 31, 2016. For more information, see “Schedule “C” — Corporate Governance”.
10
Name, City, Province or
State and Country of Residence | | Year First
Became
Director
of the
Company | | Present Principal Occupation or Employment (including all officer positions currently
held with the Company), Principal Occupation or Employment for the Past Five Years or
More, Educational Qualifications, Other Current Public Company Directorships or
Directorships in Non-Public Companies, Organizations or other Entities that Require a
Significant Time Commitment |
Albrecht W.A. Bellstedt(1)
Canmore, Alberta
Canada | | 2015 | | Albrecht Bellstedt has been a professional director since February 2007. Previously (and from 1999 to 2007), Mr. Bellstedt served as Executive Vice-President and General Counsel of TransCanada Corporation and a predecessor corporation. Prior to that, he was a transactional lawyer in private practice for 27 years. Mr. Bellstedt holds a Juris Doctor from the University of Toronto and a Bachelor of Arts degree from Queen’s University. Current public company directorships(2): Canadian Western Bank, Capital Power Corporation and Stuart Olson Inc. Other current directorships(3): None |
Luis Cabra Dueñas
Madrid, Spain | | 2015 | | Luis Cabra has served as Repsol’s Executive Managing Director of Exploration and Production since May 2012 and as Chief Executive Officer of the Company since May 2015. He joined Repsol in 1984 and has since held management posts in the Refining, Technology, Engineering, Procurement and Safety and Environment areas. From September 2010 to May 2012, he served as Executive Director of Development and Production in Repsol’s Upstream Division. Mr. Cabra has represented Repsol in international associations, serving as Chairman of the Fuel Committee of the European Petroleum Industry Association, President of the European Biofuel Technology Platform as well as Member of the European Research Advisory Board. He holds a Doctorate in Chemical Engineering from the Complutense University in Madrid and has studied business management at the international centres INSEAD and IMD. He has also served as a Head Lecturer and Associate Lecturer at the Complutense University and the University of Castilla-La Mancha. Current public company directorships(2): None Other current directorships(3): None |
F. Javier Sanz Cedrόn
Madrid, Spain | | 2015 | | Javier Sanz Cedrόn is Director of Financial Development and Rating Agencies of Repsol. He joined Repsol in 1984 in the Internal Auditing department and has since held several positions in Accounting & Reporting, International Commerce and Finance. In April 1998 he was appointed Financing Director and in 2006, he was appointed Director of Finance. Mr. Sanz Cedrόn holds a degree in Economics and Business Administration from the Comillas University — ICADE (Madrid). Following university he completed postgraduate courses at the Bank of Spain and in universities at Oxford, Brussels and Paris. Current public company directorships(2): None Other current directorships(3): None |
Thomas W. Ebbern(1)
Canmore, Alberta
Canada | | 2013 | | Thomas Ebbern has been Chief Financial Officer of North West Refining Inc. since January 2012. He was formerly Managing Director, Investment Banking, of Macquarie Capital Markets Canada Ltd., a subsidiary of Macquarie Group Limited. Prior to that he was Managing Director of Tristone Capital Inc., an energy advisory firm that was acquired by Macquarie. He began his career as a geophysicist with Gulf Canada in 1982. Mr. Ebbern holds a Bachelor of Science degree in Geological Engineering from Queen’s University and a Master of Business Administration from the Richard Ivey School of Business at the University of Western Ontario. Current public company directorships(2): None Other current directorships(3): Wellspring Calgary, Palisade Capital Management Ltd., Live Out There Inc. |
11
Name, City, Province or
State and Country of Residence | | Year First
Became
Director
of the
Company | | Present Principal Occupation or Employment (including all officer positions currently
held with the Company), Principal Occupation or Employment for the Past Five Years or
More, Educational Qualifications, Other Current Public Company Directorships or
Directorships in Non-Public Companies, Organizations or other Entities that Require a
Significant Time Commitment |
Josu Jon Imaz San Miguel
Madrid, Spain | | 2015 | | Josu Jon Imaz was named Chief Executive Officer of Repsol and member of the Corporate Executive Committee by the Board of Directors in April 2014. Mr. Imaz joined the Repsol Group in 2008 as Chairman of its subsidiary Petronor. In 2012 he joined the Repsol Executive Committee as General Director of the Industrial Area and New Energy. He began his career in research at the French Technological Centre (CETIM) in Nantes, with a focus on industrial (Grupo Mondragón) and business projects linked to the energy sector. Mr. Imaz was also a visitor scholar at the Harvard Kennedy School in the United States. In addition to his business activity, Mr. Imaz has served in senior political roles within the Ministry of Industry, Trade and Tourism of the Basque Government in 1999, and the executive leadership of the EAJ-PNV. He holds a Doctorate in Chemical Sciences from the University of the Basque Country and graduated from the Faculty of Chemical Sciences in San Sebastián (with excellence). Current public company directorships(2): First Vice-Chairman and Director of Gas Natural SDG, S.A. Other current directorships(3): None |
Miguel Klingenberg Calvo
Madrid, Spain | | 2015 | | Miguel Klingenberg currently serves as Managing Director of Legal Affairs at Repsol and has been a member of the Executive Committee since May 2015. He joined Repsol as Deputy Secretary General in September 2012. Before joining Repsol, he was in private practice in several law firms, including as name partner at Hervada & Klingenberg and subsequently as partner and head of the Spanish tax practice at Freshfields Bruckhaus Deringer LLP (“Freshfields”). While at Freshfields, Mr. Klingenberg acted as managing partner of the Spanish offices between 2006 and 2010 and served in a number of the firm’s governing bodies, including the Regional Management and the CSR and Pro-Bono Committees. Miguel Klingenberg holds a law degree from Deusto University and a degree in Business Administration from ICADE. Current public company directorships(2): None Other current directorships(3): Thyssen-Bornemizsa Museum Foundation |
Michael T. Waites(1)
Vancouver, British Columbia
Canada | | 2011 | | Michael Waites was President and Chief Executive Officer of Finning International Inc. from May 2008 until his retirement from Finning in May 2013. Prior to that, Mr. Waites was Executive Vice President and Chief Financial Officer of Finning. He also served as a member of the board of directors of Finning for three years prior to his appointment as Executive Vice President and Chief Financial Officer. Prior to joining Finning in May 2006, Mr. Waites was Executive Vice President and Chief Financial Officer at Canadian Pacific Railway since July 2000, and was also Chief Executive Officer U.S. Network of Canadian Pacific Railway. Previously, he was Vice President and Chief Financial Officer at Chevron Canada Resources. Mr. Waites holds a Bachelor of Arts (Honours) in Economics from the University of Calgary, a Master of Business Administration from Saint Mary’s College of California, and a Master of Arts, Graduate Studies in Economics from the University of Calgary. He has also completed the Executive Program at The University of Michigan Business School. Current public company directorships(2): Hudbay Minerals Inc., Western Forest Products Inc. Other current directorships(3): Remcan Projects Limited |
(1) Member of the Audit Committee.
(2) Refers only to issuers that are reporting issuers in Canada or the equivalent in a foreign jurisdiction.
(3) Refers to directorships of non-public companies, organizations or other entities. Does not include positions in Company subsidiaries or Repsol affiliates.
12
Officers
The following table sets out the name, city, province and country of residence and office held for each of the executive officers of the Company as at December 31, 2016.
Name and Province or
State and Country of Residence | | Office |
| | |
Luis Cabra Dueñas(1)
Madrid, Spain | | Vice-Chairman and Chief Executive Officer |
| | |
John Rossall (2)
Calgary, Alberta, Canada | | Executive Director, North America |
| | |
David Charlton(3)
Calgary, Alberta, Canada | | Vice President, Finance, Treasurer and Chief Financial Officer |
(1) Luis Cabra Dueñas was appointed Vice-Chairman and Chief Executive Officer on May 11, 2015.
(2) John Rossall was appointed Executive Director, North America effective August 1, 2015. On closing of the Repsol Transaction he was appointed Executive Director, Canada and North America Unconventional. Prior to that (from 2012 to 2015), he was Senior Vice-President, Canadian Delivery Unit.
(3) David Charlton was appointed Vice President, Finance, Treasurer and Chief Financial Officer effective March 1, 2016. Prior to that (from December 19, 2012 to February 29, 2016) he was Vice-President, Finance, NAO; prior to that (from May 24, 2012 to December 18, 2012) he was Head of Finance, Canada; and prior to that (July 2009 — May 23, 2012) he was Vice-President, Financial Reporting.
Albrecht Bellstedt ceased being a director of Sun Times Media Group, Inc. (formerly Hollinger International Inc.) in June of 2008. Sun Times Media Group, Inc. went into Chapter 11 bankruptcy protection under the US Bankruptcy Code in 2009.
Shareholdings of Directors and Executive Officers
No director or executive officer owns, directly or indirectly, any Common Shares of the Company.
Conflicts of Interest
Certain directors of the Company and its subsidiaries are associated with other reporting issuers or other corporations, which may give rise to conflicts of interest. In accordance with the Canada Business Corporations Act, directors and officers of the Company are required to disclose to the Company the nature and extent of any interest that they have in a material contract or material transaction, whether made or proposed, with the Company, if the director or officer is: (a) a party to the contract or transaction; (b) is a director or an officer, or an individual acting in a similar capacity, of a party to the contract or transaction; or (c) has a material interest in a party to the contract or transaction. Furthermore, each director is expected to act in good faith and recuse himself or herself from such portions of Board or Board committee meetings involving any conflict between the director and the Company.
As described in “Social, Safety and Environmental Policies,” the Company has adopted the CEBC, which applies to all directors, officers, employees and contractors of the Company and its subsidiaries. As required by the CEBC, individuals representing the Company must not enter into outside activities, including business interests or other employment that might interfere with or be perceived to interfere with their performance at the Company.
AUDIT COMMITTEE INFORMATION
Information concerning the Audit Committee of the Company, as required by National Instrument 52-110, is provided in Schedule B to this Annual Information Form.
LEGAL PROCEEDINGS
From time to time, the Company is the subject of litigation arising out of the Company’s operations. Damages claimed under such litigation, including the litigation discussed below, may be material or may be indeterminate and the outcome of such litigation may materially impact the Company’s financial condition or results of operations. While the Company assesses the merits of each lawsuit and defends itself accordingly, the Company may be required to incur significant expenses or devote significant resources to defend itself against such litigation. None of these claims are currently expected to have a material impact on the Company’s financial position.
In August 2012, a portion of the Galley pipeline, in which RSRUK has a 67.41% interest, suffered an upheaval buckle. In September 2012, RSRUK submitted a notification of a claim to Oleum Insurance Company (‘‘Oleum’’), a wholly-owned
13
subsidiary of the Company. RSRUK delivered a proof of loss seeking recovery under the insuring agreement of $350 million. To date, the documentation delivered by RSRUK purporting to substantiate its claim does not support coverage. On August 8, 2016, RSRUK served its Request for Arbitration and on September 7, 2016 Oleum served its Response. The seat of the arbitration is London, while the law of New York governs the claim for damages and business interruption.
On July 13, 2015, Addax Petroleum UK Limited (“Addax”) and Sinopec International Petroleum Exploration and Production Corporation (“Sinopec”) filed a “Notice of Arbitration” against Talisman Energy Inc. (now known as “ROGCI”) and Talisman Colombia Holdco Limited (“TCHL”) in connection with the purchase of 49% shares of TSEUK (now known as “RSRUK”). ROGCI and TCHL filed their response to the Notice of Arbitration on October 1, 2015. On May 25, 2016, Addax and Sinopec filed the Statement of Claim, in which they seek, in the event that their claims were confirmed in their entirety, repayment of their initial investment in RSRUK, which was executed in 2012 through the purchase of 49% of RSRUK from TCHL, a wholly-owned subsidiary of ROGCI, together with any additional investment, past or future, in such company, and further for any loss of opportunity, and which they estimate in a total approximate amount of US$5,500 million. The Arbitral Tribunal has decided, among other procedural matters, the bifurcation of the proceedings; the hearing related to liability issues has been scheduled for January 29 to February 20, 2018, and, if necessary, the hearing related to damages will take place at a later date still undecided, although it is likely to be fixed for the beginning of 2019. The Company maintains its opinion that the claims included in the Statement of Claim are without merit.
During 2016, the Alberta Energy Regulator (“AER”) informed the Company that certain permits to construct well sites and access roads were obtained without the Company following proper procedures. The Company continues to work closely with the AER on this matter. At this time, the implications to the Company are not known.
RISK FACTORS
The Company is exposed to a number of risks inherent in exploring for, developing and producing crude oil, natural gas liquids and natural gas. This section describes the important risks and other matters that could cause actual results of the Company to differ materially from those reflected in forward-looking statements and that could affect the trading price of the Company’s outstanding securities. The risks described below may not be the only risks the Company faces, as the Company’s business and operations may also be subject to risks that the Company does not yet know of, or that the Company currently believes are immaterial. Events or circumstances described below could materially and adversely affect the Company’s business, financial condition, results of operations or cash flow and the trading price of the Company’s securities could decline. The risks described below are interconnected, and more than one of these risks could materialize simultaneously or in short sequence if certain events or circumstances described below actually occur. The following risk factors should be read in conjunction with the other information contained herein and in the Consolidated Financial Statements and the related notes.
Operational Risks
Major Incident, Major Spill / Loss of Well Control
Oil and gas drilling and producing operations are subject to many risks, including the risk of fire, explosions, mechanical failure, pipe or well cement failure, well casing collapse, pressure or irregularities in formations, chemical and other spills, unauthorized access to hydrocarbons, illegal tapping of pipelines, accidental flows of oil, natural gas or well fluids, sour gas releases, contamination, vessel collision, structural failure, loss of buoyancy, storms or other adverse weather conditions and other occurrences. If any of these should occur, the Company could incur legal defence costs and remedial costs and could suffer substantial losses due to injury or loss of life, human health risks, severe damage to or destruction of property, natural resources and equipment, pollution or other environmental damage, unplanned production outage, cleanup responsibilities, regulatory investigation and penalties, increased public interest in the Company’s operational performance and suspension of operations. The Company’s horizontal and deep drilling activities involve greater risk of mechanical problems than vertical and shallow drilling operations.
The Company maintains insurance that contemplates both first and third-party exposures for the Company’s onshore and offshore operations globally. There is no assurance that this insurance will be adequate to cover all losses or exposures to liability. The Company believes that its coverage is aligned with customary industry practices and in amounts and at costs that the Company believes to be prudent and commercially practicable. While the Company believes these policies are customary in the industry, they do not provide complete coverage against all operating risks. In addition, the Company’s insurance does not cover penalties or fines that may be assessed by a governmental authority. A loss not fully covered by insurance could have a material adverse effect on the Company’s financial position, results of operations and cash flows. The insurance coverage that the Company maintains may not be sufficient to cover every claim made against the Company in the future. In addition, a major incident could impact the Company in such a way that it could lead to a prolonged shutdown of
14
an asset which may have a material adverse effect on the Company’s business and affect the Company’s reputation as a competent operator.
The Company operates and drills wells in both mature producing areas, such as the UK and North America, and in several remote areas in multiple countries. In 2016, the Company also carried out drilling operations in Papua New Guinea and Colombia. The Company may seek new leases and/or drill in similar environments in the future.
Health Hazards and Personal Safety Incidents
The employee and contractor personnel involved in exploration and production activities and operations of the Company are subject to many inherent health and safety risks and hazards, which could result in occupational illness or health issues, personal injury, and loss of life, facility quarantine and/or facility and personnel evacuation. For example, employees and contractors are subject to the possibility of loss of containment. This could lead to exposure to the release of high pressure materials as well as collateral shrapnel from piping or vessels which could result in personal injury and loss of life.
Security Incidents
The Company’s operations may be adversely affected by security-related incidents which are not within the control of the Company, such as war (external and internal conflicts) and remnants of war, sectarian violence, civil unrest, criminal acts, terrorism and abductions in locations where the Company operates. Security-related incidents may include allegations of human rights abuse associated with the provision of security to the Company operations. In particular, the Company faces increased security risks in the Kurdistan Region of Iraq, Colombia, Papua New Guinea and Algeria within the Company’s current portfolio. A significant security incident could result in the deferral of or termination of Company activity within the impacted areas of operations, thus adversely impacting execution of the Company’s business strategy (e.g., delaying exploration and development, causing a halt to production or forcing exit strategy processes), which could adversely affect the Company’s financial condition.
Environmental Risks
General
All phases of the Company’s oil and natural gas business are subject to environmental regulation pursuant to a variety of laws and regulations in the countries where the Company does business. These laws and regulations may require the acquisition of a permit before operations commence, restrict the types, quantities and concentration of substances that can be released into the environment in connection with the Company’s drilling and production activities, limit or prohibit drilling activities on certain lands lying within wilderness, wetlands and other protected areas, and impose substantial liabilities for pollution that may result from the Company’s operations. The Company’s business is subject to the trend toward increased rigour in regulatory compliance and civil or criminal liability for environmental matters in certain regions (e.g., Canada, the United States and the European Union). Compliance with environmental legislation can require significant expenditures, and failure to comply with environmental legislation may result in the assessment of administrative, civil and criminal penalties, the cancellation or suspension of regulatory permits, the imposition of investigatory or remedial obligations or the issuance of injunctions restricting or prohibiting certain activities. Under existing environmental laws and regulations, the Company could be held strictly liable for the remediation of previously released materials or property contamination resulting from its operations, regardless of whether those operations were in compliance with all applicable laws at the time they were performed. Regulatory delays, legal proceedings and reputational impacts from an environmental incident could result in a material adverse effect on the Company’s business. Increased stakeholder concerns and regulatory actions regarding shale gas development could lead to third party or governmental claims, and could adversely affect the Company’s business and financial condition. Although the Company currently believes that the costs of complying with environmental legislation and dealing with environmental civil liabilities will not have a material adverse effect on the Company’s financial condition or results of operations, there can be no assurance that such costs will not have such an effect in the future.
Hydraulic Fracturing
The Company utilizes horizontal drilling, multi-stage hydraulic fracturing, specially formulated drilling fluids and other technologies in its drilling and completion activities. Hydraulic fracturing is a method of increasing well production by injecting fluid under high pressure down a well, which causes the surrounding rock to crack or fracture. The fluid typically consists of water, sand, chemicals and other additives and flows into the cracks where the sand remains to keep the cracks open and enable natural gas or liquids to be recovered. Fracturing fluids flow back to the surface through the wellbore and are stored for reuse or future disposal in accordance with regional regulations, which may include injection into underground wells. The design of the well bores protects groundwater aquifers from the fracturing process.
15
Hydraulic fracturing has been in use for some time in the oil and gas industry. However, the proliferation of fracturing in recent years to access hydrocarbons in unconventional reservoirs, such as shale formations, has given rise to public concerns about the environmental impacts of this technology. Public concern over the environmental impacts of the hydraulic fracturing process has focused on a number of issues, including water aquifer contamination; other qualitative and quantitative effects on water resources as large quantities of water are used and injected fluids either remain underground or flow back to the surface to be collected, treated and disposed; and the potential for fracturing activities to induce seismic events. Regulatory authorities in certain jurisdictions have announced initiatives in response to such concerns. Federal, provincial, state, and local legislative and regulatory initiatives relating to hydraulic fracturing, as well as governmental reviews of such activities, could result in increased costs, additional operating restrictions or delays, and adversely affect the Company’s production. Public perception of environmental risks associated with hydraulic fracturing can further increase pressure to adopt new laws, regulation or permitting requirements, or lead to regulatory delays, legal proceedings and/or reputational impacts. Any new laws, regulations or permitting requirements regarding hydraulic fracturing could lead to operational delay, increased operating costs, and third party or governmental claims. They could also increase the Company’s costs of compliance and doing business, as well as delay the development of hydrocarbon (natural gas and oil) resources from shale formations, which may not be commercial without the use of hydraulic fracturing.
If legal restrictions are adopted in areas where the Company is currently conducting or in the future plans to conduct operations, the Company may incur additional costs to comply with such requirements that may be significant in nature, experience delays or curtailment in the pursuit of exploration, development, or production activities, and perhaps be precluded from the drilling of wells. In addition, if hydraulic fracturing becomes more regulated, the Company’s fracturing activities could become subject to additional permitting requirements and result in permitting delays, as well as potential increases in costs. Restrictions on hydraulic fracturing could also reduce the amount of oil and natural gas that the Company is ultimately able to produce from its reserves. It is anticipated that federal, provincial and state regulatory frameworks to address concerns related to hydraulic fracturing will continue to emerge. While the Company is unable to predict the impact of any potential regulations upon its business, the implementation of new regulations with respect to water usage or hydraulic fracturing generally could increase the Company’s costs of compliance, operating costs, the risk of litigation and environmental liability, or negatively impact the Company’s prospects, any of which may have a material adverse effect on our business, financial condition and results of operations.
Seismicity
Seismicity events have been recorded as occurring at the same time that the Company has been conducting hydraulic fracturing and related operations. Although the size of these events is considered relatively low, they raise stakeholder and regulatory concerns. Due to seismic activity reported in the Fox Creek area of Alberta, the Alberta Energy Regulator (“AER”) announced seismic monitoring and reporting requirements for hydraulic fracturing operators in the Duvernay zone in the Fox Creek area. These requirements include, among others, an assessment of the potential for seismicity prior to operations, real-time monitoring of seismic activity, the implementation of a response plan to address potential events, and the suspension of operations when a seismic event above a particular threshold occurs. The AER continues to monitor seismic activity around the province and may extend these requirements to other areas of the province, or introduce more stringent measures, if deemed appropriate. This could impact the Company’s future development plans as operations may be under more regulatory scrutiny. The foregoing or any future regulatory requirements could lead to additional costs, delays or curtailment of exploration, development, or production activities, and perhaps preclude the use of hydraulic fracturing programs in the area. In addition, if monitoring seismicity becomes more regulated, the Company’s fracturing activities could become subject to additional permitting requirements and result in delays as well as potential increases in costs. Restrictions on hydraulic fracturing due to a perceived correlation to seismicity could also reduce the amount of oil and natural gas that the Company is ultimately able to produce from its reserves in the affected areas.
Greenhouse Gas Emissions
The Company is subject to various greenhouse gas (“GHG”) emissions-related legislation. Current GHG emissions legislation does not result in material compliance costs, but compliance costs may increase in the future and may impact the Company’s operations and financial results. The Company operates in jurisdictions with existing GHG legislation (e.g., UK, United States and Canada, including Alberta and British Columbia) as well as in regions which currently do not have GHG emissions legislation and jurisdictions where GHG emissions legislation is emerging or is subject to change. The Company monitors GHG legislative developments in all areas in which the Company operates. Potential new or additional GHG legislation and associated compliance costs, in particular in association with the adoption of the Paris Agreement under the United Nations Framework Convention on Climate Change, may have a material impact on the Company.
In November 2016, the Alberta Provincial Government issued regulations regarding carbon emissions that include a carbon levy across all industry sectors. This levy is payable at the time when hydrocarbons are removed or purchased from a transmission pipeline. The regulations contain exemptions for upstream producers and processors of raw materials until 2023
16
with some exceptions. The Company has applied for and received exemption certificates where available. The Company’s preliminary estimate is that the amount of carbon levy payable where an exemption is not allowed is not significant. The Canadian Federal Government has also announced the possibility of a Federal carbon levy. The Company is currently assessing the implication of these changes and will continue to do so as the new Canadian legislative frameworks evolve.
Environmental and Decommissioning Liabilities
The Company is involved in the operation and maintenance of facilities and infrastructure in difficult and challenging areas, including offshore, deepwater, jungle and desert environments. Despite the Company’s implementation of health, safety and environmental standards, there is a risk that accidents or regulatory non-compliance can occur, the outcomes of which, including remedial work or regulatory intervention, cannot be foreseen or planned for. The Company expects to incur site restoration costs over a prolonged period as existing fields are depleted. The Company provides for decommissioning liabilities in its annual Consolidated Financial Statements in accordance with International Financial Reporting Standards (“IFRS”). Additional information regarding decommissioning liabilities is set forth in the notes to the annual Consolidated Financial Statements. The process of estimating decommissioning liabilities is complex and involves significant uncertainties concerning the timing of the decommissioning activity; legislative changes; technological advancement; regulatory, environmental and political changes; and the appropriate discount rate used in estimating the liability. Any change to these assumptions could result in a change to the decommissioning liabilities to which the Company is subject. In the Company’s North Sea operations, changes in these assumptions would potentially have a significant impact on the Company’s decommissioning liabilities because of the assessed size of these future costs. Any changes to decommissioning estimates influence the value of letters of credit to be provided pursuant to the decommissioning security agreements. There can be no assurances that the cost estimates and decommissioning liabilities are materially correct and that the liabilities will occur when predicted. In addition, with respect to some operations, the Company is not the operator and may not determine the cost estimates or timing of decommissioning such that cost overruns are possible, the Company is often jointly and severally liable for the decommissioning costs associated with the Company’s various operations and could, therefore, be required to pay more than its net share. Due to the economic climate, there is an additional risk that the Company may be asked to assume an active role in the decommissioning, remediation and reclamation of an asset if the operator goes bankrupt.
Non-Operatorship and Partner Relations
Some of the Company’s projects are conducted in joint venture environments where the Company has a limited ability to influence or control operations or future development, safety and environmental standards, and amount of capital expenditures. Companies which operate these properties may not necessarily share the Company’s health, safety and environmental standards or strategic or operational goals or approach to partner relationships, which may result in accidents, regulatory noncompliance, project delays or unexpected future costs, all of which may affect the viability of these projects and the Company’s standing in the external market.
The Company is also dependent on other working interest co-participants of these projects to fund their contractual share of the capital expenditures. If these co-participants are unable to fund their contractual share of, or do not approve, the capital expenditures, the co-participants may seek to defer programs, resulting in strategic misalignments and a delay of a portion of development of the Company’s programs, or the co-participants may default, such that projects may be delayed and/or the Company may be partially or totally liable for their share.
Socio-Political Risks
The Company’s operations may be adversely affected by political or economic developments or social instability in the jurisdictions in which it operates, which are not within the control of the Company, including, among other things, a change in crude oil, natural gas liquids or natural gas pricing policy and/or related regulatory delays, the risks of war, terrorism, abduction, expropriation, nationalization, renegotiation or nullification of existing concessions and contracts, difficulties in enforcing contractual terms, a change in taxation policies, economic sanctions, the imposition of specific drilling obligations, the imposition of rules relating to development and abandonment of fields, access to or development of infrastructure, jurisdictional boundary disputes, and currency controls. As a result of the continuing evolution of an international framework for corporate responsibility and accountability for international crimes, the Company could also be exposed to potential claims for alleged breaches of international law, health, safety and environmental regulations, and other human rights-based litigation risk. Numerous countries in which the Company has interests, including, but not limited to, the Kurdistan Region of Iraq, Colombia, Algeria and Indonesia, have been subject to recent economic or political instability, disputes and social unrest, and military or rebel hostilities. The potential deterioration of socio-political security situations (i.e. political instability and/or disputes) poses increased risk, which may result in the cessation of operations as well as the delay in payment or exports such as, in the Kurdistan Region of Iraq with respect to the regularity and predictability of export payment arrangements during a state of conflict, and in Vietnam and Malaysia with respect to China’s claim over disputed
17
waters in the East Sea. In addition, the Company regularly evaluates opportunities worldwide and may, in the future, engage in projects or acquire properties in other nations that are experiencing economic or political instability, social unrest, military hostilities or United Nations, US or other international sanctions. Some of the foregoing government actions may lead to political or reputational pressures on the Company from non-governmental organizations, home governments or security holders.
Stakeholder Opposition
The Company’s planned activities may be adversely affected if there is strong community opposition to its operations. For example, local community concerns in parts of Colombia, the Kurdistan Region of Iraq and Papua New Guinea could potentially result in development and production delays in those operations. There is also heightened public concern regarding hydraulic fracturing in parts of North America, which could materially affect the Company’s shale operations. In some circumstances, this risk of community opposition may be higher in areas where the Company operates alongside indigenous communities who may have additional concerns regarding land ownership, usage or claim compensation.
Capital Allocation and Project Decisions
The Company’s long-term financial performance is sensitive to the capital allocation decisions taken and the underlying performance of the projects undertaken. Capital allocation and project decisions are undertaken after assessing reserve and production projections, capital and operating cost estimates and applicable fiscal regimes that govern the respective government take from any project. All of these factors are evaluated against common commodity pricing assumptions and the relative risks of projects. These factors are used to establish a relative ranking of projects and capital allocation, which is then calibrated to ensure the debt and liquidity of the Company is not compromised. However, material changes to project outcomes and deviation from forecasted assumptions, such as production volumes and rates, realized commodity price, cost or tax and/or royalties, could have a material impact on the Company’s cash flow and financial performance as well as assessed impacts of impairments on the Company’s assets. Adverse economic and/or fiscal conditions could impact the prioritization of projects and capital allocation to these projects, which in turn could lead to adverse effects, such as asset under investment, asset performance impairments or land access expiries.
Uncertainties around some of the Company’s projects, including, but not limited to, its equity interest in RSRUK and the projects RSRUK undertakes, could result in changes to the Company’s capital allocation or its spend target being exceeded. The Company cannot be certain that funding, if needed, will be available to the extent required or on acceptable terms. To the extent that asset sales are necessary to fund capital requirements, the Company’s ability to sell assets is subject to market interest. If the Company is unable to access funding when needed on acceptable terms, the Company may not be able to fully implement its business plans, take advantage of business opportunities or respond to competitive pressures, any of which could have a material adverse effect on the Company’s business, financial condition, cash flows, and results of operations. See also “Risk Factors — Credit and Liquidity” and “Risk Factors — Interest Rates”.
Ability to Find, Develop or Acquire Additional Reserves
The Company’s future success depends largely on its ability to find and develop, or acquire, additional oil and gas reserves that are economically recoverable. Hydrocarbons are a limited resource, and the Company is subject to increasing competition from other companies, including national oil companies. Exploration and development drilling may not result in commercially productive reserves and, if production begins, reservoir performance may be less than projected. Successful acquisitions require an assessment of a number of factors, many of which are uncertain. These factors include recoverable reserves, development potential, future oil and gas prices, operating costs and potential environmental and other liabilities. Such assessments are inexact and their accuracy is inherently uncertain. If a high impact prospect identified by the Company fails to materialize in a given year, the Company’s multi-year exploration and/or development portfolio may be compromised. See also “Risk Factors — Volatility of Crude Oil, Natural Gas Liquids and Natural Gas Prices”. Continued failure to achieve anticipated reserve and resource addition targets may result in the Company’s withdrawal from an area, which, in turn, may result in a write-down of any associated reserves and/or resources for that area.
Uncertainty of Reserves Estimates
The process of estimating oil and gas reserves is complex and involves a significant number of assumptions in evaluating available geological, geophysical, engineering and economic data. In addition, the process requires future projections of reservoir performance and economic conditions; therefore, reserves estimates are inherently uncertain. Since all reserves estimates are, to some degree, uncertain, reserves classification attempts to qualify the degree of uncertainty involved.
18
Since the evaluation of reserves involves the evaluator’s interpretation of available data and projections of price and other economic factors, estimates of the economically recoverable oil and natural gas reserves attributable to any particular group of properties, the classification of such reserves based on estimated uncertainty, and the estimates of future net revenue or future net cash flows prepared by different evaluators or by the same evaluators at different times may vary substantially.
Each year, the Company prepares evaluations of all of its reserves internally. Initial estimates of reserves are often based upon volumetric calculations and analogy to similar types of reservoirs, rather than actual well data and performance history. Estimates based on these methods generally are less certain than those based on actual performance. The Company may adjust its estimates and classification of reserves and future net revenues or cash flows based on results of exploration and development drilling and testing, additional performance history, prevailing oil and gas prices, and other factors, many of which are beyond the Company’s control. As new information becomes available, subsequent evaluations of the same reserves may continue to have variations in the estimated reserves, some of which may be material. In addition, the Company’s actual production, taxes, and development and operating expenditures with respect to its reserves will likely vary from such estimates and such variances could be material.
Fiscal Stability
Governments may amend or create new legislation that could impact the Company’s operations and that could result in increased capital, operating and compliance costs. Moreover, the Company’s operations are subject to various levels of taxation in the countries where the Company operates. Federal, provincial, and state income tax rates or incentive programs relating to the oil and gas industry in the jurisdictions where the Company operates may in the future be changed or interpreted in a manner that could materially affect the economic value of the respective assets. The UK’s vote in favour of leaving the European Union creates uncertainties that affect the stock, commodities and foreign exchange markets which may affect the Company. The Climate Leadership Act recently proclaimed in Alberta institutes a carbon levy on consumers of carbon-emitting fuels throughout the fuel supply chain, with a number of exemptions provided. The impact of the levy to the Company has not yet been fully evaluated. See also “Risk Factors - Greenhouse Gas Emissions” for further information concerning the environmental impact of the Climate Leadership Act on the Company.
Project Delivery
The Company manages a variety of projects, including exploration and development projects and the construction or expansion of facilities and pipelines. Project delays may impact expected revenues and project cost overruns could make projects uneconomic. The Company’s ability to complete projects depends upon numerous factors, many of which are beyond the Company’s control. These factors include the level of direct control by the Company, since many of the projects in which the Company is involved are not operated by the Company, and timing and project management control are the responsibility of the operator. See also “Risk Factors — Non-Operatorship and Partner Relations”. The global demand for project resources can impact the access to appropriately competent contractors and construction yards as well as to raw products, such as steel. Typical execution risks include the availability of seismic data, the availability of processing capacity, the availability and proximity of pipeline capacity, the availability of drilling and other equipment, the ability to access lands, weather, unexpected cost increases, accidents, the availability of skilled labour, including engineering and project planning personnel, the need for government approvals and permits, and regulatory matters. Subsurface challenges can also result in additional risk of cost overruns and scheduling delays if conditions are not typical of historical experiences. The Company utilizes materials and services which are subject to general industry-wide conditions. Cost escalation for materials and services may be unrelated to commodity price changes and may continue to have a significant impact on project planning and economics. The Company operates in challenging, environmentally hostile climates, such as Papua New Guinea, where logistical costs can be materially impacted by seasonal and occasionally unanticipated weather patterns. Contracts where work has been placed under a lump sum arrangement are subject to additional challenges related to scheduling, reputation and relationship management with the Company’s coventurers.
Regulatory Approvals/Compliance and Changes to Laws and Regulations
The Company’s exploration and production operations are subject to extensive regulation at many levels of government, including municipal, state, provincial and federal governments, in the countries where the Company operates, and operations are subject to interruption or termination by governmental and regulatory authorities based on environmental or other considerations. Moreover, the Company has incurred and will continue to incur costs in the Company’s efforts to comply with the requirements of various regulations, such as the Canadian Extractive Sector Transparency Measure Act. Further, the regulatory environment in the oil and gas industry could change in ways that the Company cannot predict and that might substantially increase the Company’s costs of compliance and, in turn, materially and adversely affect the Company’s business, results of operations and financial condition.
19
Failure to comply with the applicable laws or regulations may result in significant increases in costs, fines or penalties and even shutdowns or losses of operating licences or criminal sanctions. If regulatory approvals or permits required for operations are delayed or not obtained, the Company could experience delays or abandonment of projects, decreases in production and increases in costs. This could result in an inability of the Company to fully execute its strategy and adverse impacts on its financial condition. See also “Risk Factors — Fiscal Stability” and “Risk Factors — Socio-Political Risks”.
Changes to existing laws and regulations or new laws could have an adverse effect on the Company’s business by increasing costs, impacting development schedules, reducing revenue and cash flow from natural gas and oil sales, reducing liquidity or otherwise altering the way the Company conducts business. There have been various proposals to enact new, or amend existing, laws and regulations relating to greenhouse gas emissions, hydraulic fracturing (including associated additives, water use, induced seismicity, and disposal) and shale gas development generally. In Colombia, the high level of oil and gas activity in the country has resulted in significant delays in the granting of the required environmental licences. These delays may result in reduced near-term production. See also “Risk Factors — Environmental Risks”.
The Company continues to monitor and assess any new policies, legislation, regulations and treaties in the areas where the Company operates to determine the impact on the Company’s operations. Governmental organizations unilaterally control the timing, scope and effect of any currently proposed or future laws, regulations or treaties, and such enactments are subject to a myriad of factors, including political, monetary and social pressures. The Company acknowledges that the direct and indirect costs of such laws, regulations and treaties (if enacted) could materially and adversely affect the Company’s business, results of operations and financial condition.
Volatility of Crude Oil, Natural Gas Liquids and Natural Gas Prices
The Company’s financial performance is highly sensitive to the prevailing prices of crude oil, natural gas liquids and natural gas. Fluctuations in these prices could have a material effect on the Company’s operations and financial condition, the value of its liquids and natural gas reserves and its level of expenditure for liquids and gas exploration and development. Prices for liquids and natural gas fluctuate in response to changes in the supply of and demand for liquids and natural gas, market uncertainty and a variety of additional factors that are largely beyond the Company’s control. The Company does not currently use derivative instruments to hedge the Company’s expected production so as to manage the impact of fluctuations in crude oil and natural gas prices. Fluctuations in crude oil and gas prices could have a material effect on the volatility of the Company’s earnings. Oil prices are largely determined by international supply and demand. Factors which affect crude oil prices include the actions of the Organization of Petroleum Exporting Countries, world economic conditions, government regulation, political stability throughout the world, availability of alternative fuel sources, technological advances affecting energy production and consumption, and weather conditions. Natural gas prices realized by the Company in North America are affected primarily by market supply and demand, weather conditions and prices of alternative sources of energy. The Company is also affected by markets outside of North America, primarily in Southeast Asia. Natural gas prices realized in these markets are largely determined by long-term contracts, most of which are linked to international oil and/or oil equivalent prices. The development of crude oil and natural gas discoveries in offshore areas and the development of shale gas plays are particularly dependent on the outlook for liquids and natural gas prices because of the large amount of capital expenditure required for development prior to commencing production.
A substantial and extended decline in the prices of crude oil, natural gas liquids and/or natural gas has resulted in delay or cancellation of drilling, development or construction programs, and curtailment in production and/or unutilized long-term transportation commitments, all of which could have a material adverse impact on the Company. Poor economics for developing assets have resulted in a reduction of drilling activity, which may lead to loss of leases and skilled employees. The amount of cost oil required to recover the Company’s investment and costs in various PSCs is dependent on commodity prices, with higher commodity prices resulting in the booking of lower oil and gas reserves net of royalties. Moreover, changes in commodity prices may result in the Company making downward adjustments to the Company’s estimated reserves. If this occurs, or if the Company’s estimates of production or economic factors change, accounting rules may require the Company to impair, as a non-cash charge to earnings, the carrying value of the Company’s oil and gas properties. The Company is required to perform impairment tests on oil and gas properties whenever events or changes in circumstances indicate that the carrying value of properties may not be recoverable. To the extent such tests indicate a reduction of the estimated useful life or estimated future cash flows of the Company’s oil and gas properties, the carrying value may not be recoverable and, therefore, an impairment charge would be required to reduce the carrying value of the properties to their estimated fair value. The Company may incur impairment charges in the future, which could materially affect the Company’s results of operations and its balance sheet, in the period incurred.
20
Information Systems
Many of the Company’s business processes depend on the availability, capacity, reliability and security of the Company’s information technology (“IT”) infrastructure and the Company’s ability to expand and continually update this infrastructure in response to the Company’s changing needs. The Company’s IT systems are increasingly integrated in terms of geography, number of systems, and key resources supporting the delivery of IT systems. Further, as a result of the completion of the Repsol Transaction, the Company’s IT systems require integration with, or possibly replacement by, Repsol IT systems. The performance of the Company’s key suppliers is critical to ensure appropriate delivery of key services. Any failure to manage, expand and update the Company’s IT infrastructure, any failure in the extension or operation of this infrastructure, or any failure by the Company’s key resources or service providers in the performance of their services, could materially and adversely harm the Company’s business.
The ability of the IT function to support the Company’s business in the event of a disaster such as fire, flood or loss/denial of any of the Company’s data centres or major office locations, and the Company’s ability to recover key systems from unexpected interruptions cannot be fully tested. There is a risk that, if such an event occurs, the business continuity plan may not be adequate to immediately address all repercussions of the disaster. In the event of a disaster affecting a data centre or key office location, key systems may be unavailable for a number of days, leading to the inability to perform some business processes in a timely manner.
The increasing concern of cyber security threats across the industry, with the intention to disrupt business by attacks such as the use of Ransomware, phishing emails, and other more sophisticated attempts often referred to as advanced persistent threats, requires the Company to continually improve its ability to detect and prevent such occurrences. The Company actively monitors the security and resilience of its IT systems globally and works with private and government agencies, such as private cyber threat intelligence services, Canadian Cyber Incident Response Centre, and the Federal Bureau of Investigation, in order to be apprised of potential risks across the globe. Disruption of critical IT services, or breaches of information security, could have a negative effect on the Company’s operational performance and earnings, as well as on the Company’s reputation.
Litigation
From time to time, the Company is the subject of litigation arising out of the Company’s operations. Specific disclosure of current legal proceedings, and the risks associated with current proceedings and litigation generally, are disclosed under the heading “Legal Proceedings”.
Credit and Liquidity
The Company’s financial performance and cash flow is highly sensitive to the prevailing prices of crude oil, natural gas liquids and natural gas, which fluctuate in response to a variety of factors beyond the Company’s control. A substantial and extended decline in the prices of crude oil, natural gas liquids or natural gas could negatively impact the Company’s liquidity and/or credit ratings. See also “Risk Factors — Volatility of Crude Oil, Natural Gas Liquids and Natural Gas Prices”.
The volatility of credit markets can result in market conditions that may restrict timely access and limit the Company’s ability to secure and maintain cost-effective financing on acceptable terms and conditions. See also “Risk Factors — Counterparty Credit Risk”.
The credit rating agencies regularly evaluate the Company, and their ratings of the Company’s securities are based on a number of factors not entirely within the Company’s control, including the credit rating of the Company’s parent, Repsol, conditions affecting the oil and gas industry generally, and the wider state of the economy. There can be no assurance that one or more of the Company’s credit ratings will not be downgraded. A reduction in any of the Company’s current investment-grade credit ratings to below investment grade could adversely affect the cost and availability of borrowing, and access to sources of liquidity and capital. In addition, the Company relies on access to letters of credit in the normal course of business in order to support some of its operations. For example, with respect to the Company’s North Sea operations, the Company relies on access to letters of credit facilities which entitle a bank to demand cash at any time to cover the full amount of any letter of credit issued with respect to UK decommissioning obligations. There can be no assurance that the Company will be able to obtain the necessary letters of credit or repay the full amount of a letter of credit upon demand. See also “Risk Factors — Capital Allocation and Project Decisions”.
21
Counterparty Credit Risk
In the normal course of business, the Company enters into contractual relationships with counterparties in the energy industry and other industries, including suppliers and co-venturers and counterparties to commodity sale/purchase agreements. If such counterparties do not fulfil their contractual obligations or settle their liabilities to the Company, the Company may suffer losses, may have to proceed on a sole risk basis, may have to forgo opportunities or may have to relinquish leases or blocks. Fluctuations in prevailing prices of crude oil, natural gas liquids and natural gas could have a material adverse effect on the operations and financial condition of such counterparties. The Company also has credit risk arising from cash and cash equivalents held with banks and financial institutions. While the Company maintains a risk management system that limits exposures to any one counterparty, losses due to the failure by counterparties to fulfil their contractual obligations may adversely affect the Company’s financial condition.
Exchange Rate Fluctuations
Results of operations are affected primarily by the exchange rates among the US$, the C$ and UK£. These exchange rates may vary substantially. Most of the Company’s revenue is received in or is referenced to US$ denominated prices (including the Company’s Consolidated Financial Statements, which are presented in US$), while the majority of the Company’s expenditures are denominated in US$, C$ and UK£. A change in the relative value of the US$ against the C$ or the UK£ would also result in an increase or decrease in the Company’s UK£ denominated debt, as expressed in US$, and the related interest expense. The Company is also exposed to fluctuations in other foreign currencies.
Interest Rates
The Company is exposed to interest rate risk principally by virtue of its borrowings. Borrowing at floating rates exposes the Company to short-term movements in interest rates. Borrowing at fixed rates exposes the Company to reset risk associated with debt maturity. Approximately 40% of the Company’s debt has a fixed interest rate while 60% is floating rate debt borrowed from related parties. Therefore, the Company’s main exposure to changes in interest rates would occur with respect to short-term borrowings.
Competitive Risk
The global oil and gas industry is highly competitive. The Company faces significant competition and many of the Company’s competitors have resources in excess of the Company’s available resources. The Company actively competes for the acquisition and divestment of properties, the exploration for and development of new sources of supply, the contractual services for oil and gas drilling and production equipment and services, the transportation and marketing of current production, and industry personnel, including, but not limited to, geologists, geophysicists, engineers and other specialists that enable the business. Many of the Company’s competitors have the ability to pay more for seismic and lease rights in crude oil and natural gas properties and exploratory prospects. They can define, evaluate, bid for and purchase a greater number of properties and prospects than the Company’s financial or human resources permit. If the Company is not successful in the competition for oil and gas reserves or in the marketing of production, the Company’s financial condition and results of operations may be adversely affected. Many of the Company’s competitors have resources substantially greater than the Company’s and, as a consequence, the Company may be at a competitive disadvantage.
Egress and Gas & Liquids Buyers
As increasing volumes of natural gas and liquids are brought on-stream by the Company and others, transportation and processing infrastructure capacity may, at times, be exceeded before capacity additions become available. In such an event, there is a risk that the transportation and/or processing of some of the Company’s production may be restricted or delayed until pipeline connection or infrastructure additions are complete. In Canada and in the Eagle Ford area in the US, the Company has secured sufficient access to infrastructure for both liquids and gas for the near and medium term, and it is expected that any restrictions on production due to lack of infrastructure capacity would be relatively short term (more operational in nature) and would not impact a material quantity of production. Ensuring that the Company holds sufficient transportation capacity to take gas supplies from the Marcellus area, which has seen a significant growth in industry production over the past few years, to market is critical to ensuring the ability to flow production on an unrestricted basis as well as to maximize the value of the Company’s production. Another associated risk is the availability and diversity of contract and credit-enabled buyers. Should the Company be unable to secure access to infrastructure and qualified buyers for its production, the Company could face reduced production and/or materially lower prices on some portion of production which, in turn, could adversely affect the Company’s operating results.
22
Attraction, Retention and Development of Personnel
Successful execution of the Company’s plans is dependent on the Company’s ability to attract and retain talented personnel who have the skills necessary to deliver on the Company’s strategy and maintain safe operations. This includes not only key talent at a senior level, but also individuals with the professional and technical skill sets critical for the Company’s business, particularly geologists, geophysicists, engineers, accountants and other specialists.
Corruption & Fraud
The Company’s operations are governed by the laws of many jurisdictions, which generally prohibit bribery and other forms of corruption. The Company requires all employees to comply with the CEBC as well as other Company policies against giving or accepting money or gifts in certain circumstances. Despite these requirements, it is possible that the Company, or some of its employees or contractors, could be charged with bribery or corruption. If the Company is found guilty of such a violation, which could include a failure to take effective steps to prevent or address corruption by its employees or contractors, the Company could be subject to onerous penalties. Depending on its nature and scope, a mere investigation itself could lead to significant corporate disruption, high legal costs and forced settlements (such as the imposition of an internal monitor). In addition, bribery allegations or bribery or corruption convictions could impair the Company’s ability to work with governments or non-governmental organizations. Such convictions or allegations could result in the formal exclusion of the Company from a country or area, national or international lawsuits, government sanctions or fines, project suspension or delays, reduced market capitalization, reputational impacts and increased investor concern.
TRANSFER AGENTS AND REGISTRARS
Computershare Trust Company of Canada, at 600, 530 — 8th Avenue SW, Calgary, Alberta, T2P 3S8, along with its US co-transfer agent, Computershare Trust Company N.A., acts as trustee for various public debt securities. JPMorgan Chase Bank N.A., London Branch (now The Bank of New York Mellon, pursuant to bulk novation orders granted on April 3, 2007 and July 1, 2008), One Canada Square, London, UK, E14 5AL, acts as trustee for the 6.625% unsecured notes listed on the London Stock Exchange. Union Bank N.A., 120 S. San Pedro Street, Suite 400, Los Angeles, California, 90012, acts as trustee for various public debt securities. The Company has not retained transfer agents for any other outstanding securities.
INTERESTS OF EXPERTS
The Company’s auditors are Ernst & Young LLP, Chartered Professional Accountants, 2200, 215-2nd Street SW, Calgary, Alberta, T2P IM4. Ernst & Young LLP is independent in accordance with the Chartered Professional Accountants of Alberta Rules of Professional Conduct.
Mr. Brian Larson, an employee of the Company, has provided the report on reserves data, included in Schedule “A” to this Annual Information Form, in his capacity as the Company’s Internal Qualified Reserves Evaluator.
ADVISORIES
Forward-Looking Information
This Annual Information Form contains or incorporates by reference information that constitutes “forward-looking information” or “forward-looking statements” (collectively “forward-looking information”) within the meaning of applicable securities legislation. Forward-looking information is included throughout this Annual Information Form, including among other places, under the headings “General Development of the Business,” “Description of the Business,” “Social, Safety and Environmental Policies,” “Legal Proceedings” and “Risk Factors”. This forward-looking information includes, but is not limited to, statements regarding:
· business strategy, priorities and plans;
· expected capital expenditures, timing and planned focus of such spending;
· expected capital sources to fund the Company’s capital program;
· expected production and timing of such production;
· planned drilling and development;
· expected results from the Company’s portfolio of oil and gas assets;
23
· expected abandonment and reclamation timing and costs;
· anticipated funding of decommissioning liabilities;
· anticipated timing and results of legal proceedings;
· anticipated closing and timing of closing of planned dispositions; and
· other expectations, beliefs, plans, goals, objectives, assumptions, information and statements about possible future events, conditions, results of operations or performance.
Statements concerning oil and gas reserves contained in this Annual Information Form in Schedule A and elsewhere may be deemed to be forward-looking information as they involve the implied assessment that the resources described can be profitably produced in the future.
The factors or assumptions on which the forward-looking information is based include: commodity price and cost assumptions; projected capital investment levels; the flexibility of capital spending plans and the associated sources of funding; the successful and timely implementation of capital projects; the continuation of tax, royalty and regulatory regimes; the ability to obtain regulatory and partner approval; and other risks and uncertainties described in the filings made by the Company with securities regulatory authorities. The Company believes the material factors, expectations and assumptions reflected in the forward-looking information are reasonable but no assurance can be given that these factors, expectations and assumptions will prove to be correct. Forward-looking information for periods past 2016 assumes escalating commodity prices.
Undue reliance should not be placed on forward-looking information. Forward-looking information is based on current expectations, estimates and projections that involve a number of risks which could cause actual results to vary, and, in some instances, to differ materially from those anticipated by the Company and described in the forward-looking information contained in this Annual Information Form. The material risk factors include, but are not limited to:
· fluctuations in oil and gas prices, foreign currency exchange rates, interest rates and tax or royalty rates;
· the risks of the oil and gas industry, such as operational risks in exploring for, developing and producing crude oil and natural gas;
· risks and uncertainties involving geology of oil and gas deposits;
· risks associated with project management, project delays and/or cost overruns;
· uncertainty related to securing sufficient egress and access to markets;
· the uncertainty of reserves and resources estimates, reserves life and underlying reservoir risk;
· the uncertainty of estimates and projections relating to production, costs and expenses, including decommissioning liabilities;
· risks related to strategic and capital allocation decisions, including potential delays or changes in plans with respect to exploration or development projects or capital expenditures;
· health, safety, security and environmental risks, including risks related to the possibility of major accidents;
· environmental regulatory and compliance risks, including with respect to greenhouse gases and hydraulic fracturing;
· uncertainties as to access to capital, including the availability and cost of credit and other financing, and changes in capital markets;
· risks in conducting foreign operations (for example, civil, political and fiscal instability and corruption);
· uncertainties related to the UK’s vote in favour of leaving the European Union;
· risks related to cybersecurity;
· risks related to the attraction, retention and development of personnel;
· changes in general economic and business conditions;
· the possibility that government policies, regulations or laws may change or governmental approvals may be delayed or withheld; and
· results of the Company’s risk mitigation strategies, including insurance activities.
24
The foregoing list of risk factors is not exhaustive. Additional information on these and other factors which could affect the Company’s operations or financial results or strategy are included under the heading “Risk Factors” and elsewhere in this Annual Information Form. In addition, information is available in the Company’s other reports on file with Canadian securities regulatory authorities and the SEC.
Forward-looking information is based on the estimates and opinions of the Company’s management at the time the information is presented. The Company assumes no obligation to update forward-looking information should circumstances or management’s estimates or opinions change, except as required by law.
Oil and Gas Information
All references to reserves volumes in this Annual Information Form are to reserves volumes estimated in accordance with Canadian disclosure standards.
The Company makes reference to production volumes throughout this Annual Information Form. Where not otherwise indicated, such production volumes are stated on a gross basis, which means they are stated prior to the deduction of royalties and similar payments.
Natural gas is converted to a barrel of oil equivalent (boe) at the ratio of 5.615 thousand cubic feet (mcf) to one barrel (bbl) of oil. Oil is converted to natural gas equivalent (mcfe) at the ratio of one bbl to 5.615 mcf of natural gas. The boe and mcfe measures may be misleading, particularly if used in isolation. A boe conversion ratio of 5.615 mcf to 1 bbl and an mcfe conversion ratio of 1 bbl to 5.615 mcf are based on an energy equivalence conversion method primarily applicable at the burner tip and do not represent a value equivalence at the wellhead.
EXCHANGE RATE INFORMATION
Except where otherwise indicated, all dollar amounts in this Annual Information Form are stated in US dollars (“US$” or “$”). The following table sets forth the Canada/US exchange rates on the last trading day of the years indicated as well as the high, low and average rates for such years. The high, low and average exchange rates for each year were identified or calculated from spot rates in effect on each trading day during the relevant year. The exchange rates shown are expressed as the number of Canadian dollars (“C$”) required to purchase one US$. These exchange rates are based on those published on the Bank of Canada’s website as being in effect at approximately noon on each trading day (the “Bank of Canada noon rate”).
| | Year ended December 31 | |
| | 2016 | | 2015 | | 2014 | |
Year end | | 1.3427 | | 1.3903 | | 1.1601 | |
High | | 1.2544 | | 1.1728 | | 1.0614 | |
Low | | 1.4589 | | 1.3990 | | 1.1643 | |
Average | | 1.3248 | | 1.2787 | | 1.1045 | |
25
ABBREVIATIONS
The abbreviations used in this Annual Information Form have the following meanings:
bbl | | barrel |
bbls | | barrels |
bbl/d | | barrels per day |
bcf | | billion cubic feet |
boe | | barrels of oil equivalent |
mbbls | | thousand barrels |
mboe/d | | thousand barrels oil equivalent per day |
mcf | | thousand cubic feet |
mcfe | | thousand cubic feet equivalent |
mmbbls | | million barrels |
mmboe | | million barrels of oil equivalent |
mmcf/d | | million cubic feet per day |
mmcfe/d | | millions of cubic feet equivalent per day |
mmscf | | million standard cubic feet |
C$ | | Canadian dollar |
COGEH | | Canadian Oil and Gas Evaluation Handbook |
IFRS | | International Financial Reporting Standards |
IQRE | | Internal Qualified Reserves Evaluator |
LNG | | Liquefied Natural Gas |
NGL | | Natural Gas Liquids |
UK | | United Kingdom |
UK£ | | Pound sterling |
US | | United States of America |
US$ or $ | | United States dollar |
WTI | | West Texas Intermediate |
26
ADDITIONAL INFORMATION
Additional information related to the Company, including the information incorporated by reference herein, may be found on SEDAR at www.sedar.com and on Edgar at www.sec.gov.
Additional financial information is provided in the Company’s audited Consolidated Financial Statements for the year ended December 31, 2016 and related annual Management’s Discussion and Analysis.
Copies of the Company’s annual documents may be obtained upon request from: Communications and External Relations Department, Repsol Oil & Gas Canada Inc., 2000, 888 — 3rd Street SW, Calgary, Alberta, T2P 5C5, email: infocanada@repsol.com.
27
SCHEDULE A — RESERVES DATA AND OTHER OIL AND GAS INFORMATION
Table of Contents
INTRODUCTION | 29 |
INTERNAL EVALUATION | 29 |
RESERVES DATA AND OTHER OIL AND GAS INFORMATION | 30 |
REPORT ON RESERVES DATA BY THE COMPANY’S INTERNAL QUALIFIED RESERVES EVALUATOR | 59 |
REPORT OF MANAGEMENT AND DIRECTORS ON NI 51-101 RESERVES DATA AND OTHER INFORMATION | 60 |
28
INTRODUCTION
As a Canadian reporting issuer, the Company is subject to the disclosure requirements of National Instrument NI 51-101 (“NI 51-101”) of the Canadian Securities Administrators, which apply to the disclosure of reserves and other oil and gas information. The disclosure in this Schedule A has been prepared in compliance with the annual disclosure requirements of NI 51-101.
The Company’s investments in Equiόn and RSRUK are accounted for using the equity method of accounting. NI 51-101 currently requires that, in such circumstances, the Company’s share of the reserves and future net revenues of Equiόn and RSRUK be disclosed separately from the Company’s reserves and future net revenue. Accordingly, in a number of the tables which follow, information is first provided with respect to the Company and its subsidiaries which is consolidated for financial reporting purposes (under the heading “Consolidated Entities”) and then with respect to Equiόn and RSRUK (under the heading “Equity Investments”). All information with respect to Equiόn and RSRUK reflects the Company’s 49% equity interest in Equiόn and 51% equity interest in RSRUK. Unless otherwise indicated, all references in this Schedule to the Company’s reserves include the reserves attributable to its equity investments in Equiόn and RSRUK. The reserves for Equiόn and RSRUK were evaluated internally by the Company in the same manner as the consolidated reserves for the Company, as described below.
INTERNAL EVALUATION
The Company’s oil and gas reserves are evaluated internally. The Company has obtained an exemption from NI 51-101 that exempts the Company from the requirement under NI 51-101 to have its reserves evaluated or audited by independent reserves evaluators. The following discussion is provided pursuant to the requirements of the exemption.
The Company understands that the purpose of the requirement under NI 51-101 for the involvement of independent qualified evaluators or auditors is to ensure that disclosure of reserves information reflects the conclusions of qualified professionals applying consistent standards and that such conclusions are not affected by adverse influences. The Company believes that using independent evaluators or auditors would not materially enhance the reliability of its reserves estimates in light of the expertise of its internal reserves evaluation personnel and the controls applied during its reserves evaluation process. The Company believes that its internal resources are at least as extensive as, if not greater than, those which would be assigned by any independent evaluators or auditors engaged by the Company, and that its internal staff’s knowledge of and experience with the Company’s reserves enable the Company to prepare an evaluation at least equivalent to that of any independent evaluator or auditor.
As at December 31, 2016, the Company’s internal reserves evaluation staff included more than 70 persons with full-time or part-time responsibility relating to participation in the Company’s reserves process, of whom 24 were “qualified reserves evaluators” for purposes of NI 51-101. The qualified reserves evaluators have an average of approximately 13 years of relevant experience in evaluating reserves. The Company’s internal reserves evaluation management personnel are responsible for reserves evaluation management and are directly involved in evaluating reserves and/or overseeing the reserves evaluation process. The Company has appointed an Internal Qualified Reserves Evaluator (“IQRE”) who is responsible for the preparation and validation of the Company’s reserves evaluations and the submission to the Company’s Board of Directors of reports thereon and reports directly to the Chief Executive Officer in that role. The Company’s IQRE is Brian Larson, a graduate of the University of Calgary obtaining a Bachelor of Science, Engineering degree in 1978. Mr. Larson has more than 38 years of petroleum engineering experience internationally and in North America. He is a professional engineer registered in Alberta and is a member of the Association of Professional Engineers and Geoscientists of Alberta (APEGA).
The Company has adopted a corporate policy that prescribes procedures and standards to be followed in preparing its reserves data. The following summarizes the Company’s current process for preparing and approving its publicly disclosed reserves data.
All of the Company’s reserves are evaluated annually. The Company employs qualified, competent, experienced engineers and geoscientists to ensure consistently high levels of professionalism in the estimation of its reserves data. Technical, cost and economic assumptions underpinning reserves estimates are documented to provide a clear audit trail.
The Company conducts formal reviews during the reserves estimation process to ensure the reasonableness, completeness and accuracy of input data; the appropriateness of the technical subsurface methodology; the full understanding of reserves movements; and the correct use of reserves classifications. All reserves estimates are reviewed and approved by senior management responsible for the operating area to which the reserves relate, and then submitted to the Chief Executive Officer
29
for review and approval. In addition, the IQRE conducts a separate review to ensure the effectiveness of the disclosure controls and that the reserves estimates are free from material misstatement. The reserves data and the reports of the IQRE thereon are then reviewed by the Board of Directors.
Notwithstanding that the Company is exempt from the independent evaluator requirements of NI 51-101, the Company obtains annual independent audits as part of Repsol’s defined procedures for independent external audits. The independent audits are coordinated by Repsol’s reserves group. Repsol will cover at least 95% of Repsol’s reserves (based on proved plus probable volumes) over a three year audit cycle, which includes the ROGCI perimeter. At December 31, 2016, 19% of the Company’s reserves were audited in the first year of Repsol’s three year cycle. The remaining 81% of the Company’s reserves will be audited over the next two years of the cycle. For the completed audits, no material differences have been revealed. Repsol also conducts annual internal audits of the procedures, records and controls relating to the preparation of reserves data. Repsol maintains a comprehensive set of guidelines, procedures and controls, which includes appropriate sections on the evaluation and reporting of the Company’s reserves under NI 51-101. Repsol, in conjunction with the IQRE, updates these on a periodic basis, as appropriate. Accordingly, the Company considers the reliability of its internally generated reserves data to be not materially less than would be afforded by the independent evaluator requirements of NI 51-101.
RESERVES DATA AND OTHER OIL AND GAS INFORMATION
The effective date of the reserves data and other oil and gas information in this section is December 31, 2016 and the preparation date is February 23, 2017.
It should not be assumed that the estimates of future net revenues presented in the tables below represent the fair market value of the reserves. There is no assurance that the forecast prices and costs assumptions will be attained and variances could be material. The recovery and reserves estimates on the Company’s properties provided herein are estimates only and there is no guarantee that the estimated reserves will be recovered. Actual reserves may be greater than or less than the estimates provided herein.
In accordance with NI 51-101, the estimates of reserves and future net revenue set forth below are based on forecast prices and costs.
Definitions of the various terms used in the following tables are set forth under “Definitions” below. In certain of the tables set forth below, the columns may not add due to rounding.
30
Reserves Estimates (Forecast Prices and Costs)(1)
| | Light Oil
(mmbbls) | | Heavy Oil
(mmbbls) | | Tight Oil
(mmbbls) | | Shale Gas
(bcf) | | Conventional
Natural Gas
(bcf) | | Natural Gas
Liquids (mmbbls) | |
Year ended December 31, 2016 | | Gross | | Net | | Gross | | Net | | Gross | | Net | | Gross | | Net | | Gross | | Net | | Gross | | Net | |
CONSOLIDATED ENTITIES | | | | | | | | | | | | | | | | | | | | | | | | | |
Canada | | | | | | | | | | | | | | | | | | | | | | | | | |
Proved Developed Producing | | 1.5 | | 1.3 | | 22.2 | | 19.9 | | — | | — | | 23.8 | | 22.3 | | 366.3 | | 346.7 | | 20.6 | | 17.7 | |
Proved Developed Non-Producing | | — | | — | | — | | — | | — | | — | | 1.2 | | 0.9 | | 1.9 | | 1.6 | | — | | — | |
Proved Undeveloped | | — | | — | | 1.0 | | 0.9 | | — | | — | | — | | — | | 95.0 | | 91.3 | | 4.2 | | 3.9 | |
Total Proved | | 1.5 | | 1.3 | | 23.2 | | 20.8 | | — | | — | | 25.0 | | 23.2 | | 463.2 | | 439.6 | | 24.8 | | 21.6 | |
Total Probable | | 0.8 | | 0.7 | | 10.3 | | 9.0 | | — | | — | | 55.2 | | 52.6 | | 247.4 | | 235.0 | | 20.4 | | 17.9 | |
Total Proved Plus Probable | | 2.3 | | 2.0 | | 33.5 | | 29.8 | | — | | — | | 80.2 | | 75.8 | | 710.6 | | 674.6 | | 45.2 | | 39.5 | |
United States | | | | | | | | | | | | | | | | | | | | | | | | | |
Proved Developed Producing | | — | | — | | — | | — | | 3.7 | | 2.8 | | 1,242.7 | | 1,032.3 | | 15.5 | | 13.1 | | 21.7 | | 16.3 | |
Proved Developed Non-Producing | | — | | — | | — | | — | | — | | — | | 16.4 | | 13.6 | | 5.6 | | 4.7 | | 0.4 | | 0.3 | |
Proved Undeveloped | | — | | — | | — | | — | | 3.9 | | 3.0 | | 611.9 | | 506.1 | | — | | — | | 19.0 | | 14.2 | |
Total Proved | | — | | — | | — | | — | | 7.6 | | 5.8 | | 1,871.0 | | 1,552.0 | | 21.1 | | 17.8 | | 41.1 | | 30.8 | |
Total Probable | | — | | — | | — | | — | | 1.8 | | 1.3 | | 725.9 | | 604.6 | | 7.0 | | 5.9 | | 11.7 | | 8.8 | |
Total Proved Plus Probable | | — | | — | | — | | — | | 9.4 | | 7.1 | | 2,596.9 | | 2,156.6 | | 28.1 | | 23.7 | | 52.8 | | 39.6 | |
Southeast Asia(2) | | | | | | | | | | | | | | | | | | | | | | | | | |
Proved Developed Producing | | 19.0 | | 12.8 | | — | | — | | — | | — | | — | | — | | 665.5 | | 454.8 | | 6.1 | | 2.8 | |
Proved Developed Non-Producing | | 0.6 | | 0.2 | | — | | — | | — | | — | | — | | — | | 99.3 | | 73.6 | | 1.7 | | 1.0 | |
Proved Undeveloped | | 1.0 | | 0.8 | | — | | — | | — | | — | | — | | — | | 171.8 | | 124.6 | | 1.6 | | 0.8 | |
Total Proved | | 20.6 | | 13.8 | | — | | — | | — | | — | | — | | — | | 936.6 | | 653.0 | | 9.4 | | 4.6 | |
Total Probable | | 48.4 | | 37.6 | | — | | — | | — | | — | | — | | — | | 374.4 | | 278.7 | | 4.4 | | 2.4 | |
Total Proved Plus Probable | | 69.0 | | 51.4 | | — | | — | | — | | — | | — | | — | | 1,311.0 | | 931.7 | | 13.8 | | 7.0 | |
Latin America(3) | | | | | | | | | | | | | | | | | | | | | | | | | |
Proved Developed Producing | | — | | — | | 0.6 | | 0.5 | | — | | — | | — | | — | | — | | — | | — | | — | |
Proved Developed Non-Producing | | — | | — | | 3.5 | | 2.7 | | — | | — | | — | | — | | — | | — | | — | | — | |
Proved Undeveloped | | — | | — | | 2.6 | | 2.0 | | — | | — | | — | | — | | — | | — | | — | | — | |
Total Proved | | — | | — | | 6.7 | | 5.2 | | — | | — | | — | | — | | — | | — | | — | | — | |
Total Probable | | — | | — | | 1.6 | | 1.3 | | — | | — | | — | | — | | — | | — | | — | | — | |
Total Proved Plus Probable | | — | | — | | 8.3 | | 6.5 | | — | | — | | — | | — | | — | | — | | — | | — | |
Other(4) | | | | | | | | | | | | | | | | | | | | | | | | | |
Proved Developed Producing | | 10.8 | | 5.9 | | — | | — | | — | | — | | — | | — | | — | | — | | 1.2 | | 0.6 | |
Proved Developed Non-Producing | | 0.5 | | 0.3 | | — | | — | | — | | — | | — | | — | | — | | — | | 0.3 | | 0.1 | |
Proved Undeveloped | | 2.4 | | 1.5 | | — | | — | | — | | — | | — | | — | | — | | — | | 0.3 | | 0.2 | |
Total Proved | | 13.7 | | 7.7 | | — | | — | | — | | — | | — | | — | | — | | — | | 1.8 | | 0.9 | |
Total Probable | | 8.7 | | 4.0 | | — | | — | | — | | — | | — | | — | | — | | — | | 1.2 | | 0.6 | |
Total Proved Plus Probable | | 22.4 | | 11.7 | | — | | — | | — | | — | | — | | — | | — | | — | | 3.0 | | 1.5 | |
TOTAL CONSOLIDATED ENTITIES | | | | | | | | | | | | | | | | | | | | | | | | | |
Proved Developed Producing | | 31.3 | | 20.0 | | 22.8 | | 20.4 | | 3.7 | | 2.8 | | 1,266.5 | | 1,054.6 | | 1,047.3 | | 814.6 | | 49.6 | | 37.4 | |
Proved Developed Non-Producing | | 1.1 | | 0.5 | | 3.5 | | 2.7 | | — | | — | | 17.6 | | 14.5 | | 106.8 | | 79.9 | | 2.4 | | 1.4 | |
Proved Undeveloped | | 3.4 | | 2.3 | | 3.6 | | 2.9 | | 3.9 | | 3.0 | | 611.9 | | 506.1 | | 266.8 | | 215.9 | | 25.1 | | 19.1 | |
Total Proved | | 35.8 | | 22.8 | | 29.9 | | 26.0 | | 7.6 | | 5.8 | | 1,896.0 | | 1,575.2 | | 1,420.9 | | 1,110.4 | | 77.1 | | 57.9 | |
Total Probable | | 57.9 | | 42.3 | | 11.9 | | 10.3 | | 1.8 | | 1.3 | | 781.1 | | 657.2 | | 628.8 | | 519.6 | | 37.7 | | 29.7 | |
Total Proved Plus Probable | | 93.7 | | 65.1 | | 41.8 | | 36.3 | | 9.4 | | 7.1 | | 2,677.1 | | 2,232.4 | | 2,049.7 | | 1,630.0 | | 114.8 | | 87.6 | |
EQUITY INVESTMENTS | | | | | | | | | | | | | | | | | | | | | | | | | |
RSRUK | | | | | | | | | | | | | | | | | | | | | | | | | |
Proved Developed Producing | | 36.0 | | 36.0 | | — | | — | | — | | — | | — | | — | | 2.0 | | 2.0 | | 0.1 | | 0.1 | |
Proved Developed Non-Producing | | 0.4 | | 0.4 | | — | | — | | — | | — | | — | | — | | — | | — | | — | | — | |
Proved Undeveloped | | 3.5 | | 3.5 | | — | | — | | — | | — | | — | | — | | 23.7 | | 23.7 | | — | | — | |
Total Proved | | 39.9 | | 39.9 | | — | | — | | — | | — | | — | | — | | 25.7 | | 25.7 | | 0.1 | | 0.1 | |
Total Probable | | 25.0 | | 25.0 | | — | | — | | — | | — | | — | | — | | 19.5 | | 19.5 | | 0.1 | | 0.1 | |
Total Proved Plus Probable | | 64.9 | | 64.9 | | — | | — | | — | | — | | — | | — | | 45.2 | | 45.2 | | 0.2 | | 0.2 | |
Equion | | | | | | | | | | | | | | | | | | | | | | | | | |
Proved Developed Producing | | 4.6 | | 3.7 | | — | | — | | — | | — | | — | | — | | 27.0 | | 27.0 | | 1.1 | | 1.1 | |
Proved Developed Non-Producing | | — | | — | | — | | — | | — | | — | | — | | — | | — | | — | | — | | — | |
Proved Undeveloped | | 0.3 | | 0.2 | | — | | — | | — | | — | | — | | — | | 2.6 | | 2.6 | | — | | — | |
Total Proved | | 4.9 | | 3.9 | | — | | — | | — | | — | | — | | — | | 29.6 | | 29.6 | | 1.1 | | 1.1 | |
Total Probable | | 1.0 | | 0.8 | | — | | — | | — | | — | | — | | — | | — | | — | | — | | — | |
Total Proved Plus Probable | | 5.9 | | 4.7 | | — | | — | | — | | — | | — | | — | | 29.6 | | 29.6 | | 1.1 | | 1.1 | |
TOTAL EQUITY INVESTMENTS | | | | | | | | | | | | | | | | | | | | | | | | | |
Proved Developed Producing | | 40.6 | | 39.7 | | — | | — | | — | | — | | — | | — | | 29.0 | | 29.0 | | 1.2 | | 1.2 | |
Proved Developed Non-Producing | | 0.4 | | 0.4 | | — | | — | | — | | — | | — | | — | | — | | — | | — | | — | |
Proved Undeveloped | | 3.8 | | 3.7 | | — | | — | | — | | — | | — | | — | | 26.3 | | 26.3 | | — | | — | |
Total Proved | | 44.8 | | 43.8 | | — | | — | | — | | — | | — | | — | | 55.3 | | 55.3 | | 1.2 | | 1.2 | |
Total Probable | | 26.0 | | 25.8 | | — | | — | | — | | — | | — | | — | | 19.5 | | 19.5 | | 0.1 | | 0.1 | |
Total Proved Plus Probable | | 70.8 | | 69.6 | | — | | — | | — | | — | | — | | — | | 74.8 | | 74.8 | | 1.3 | | 1.3 | |
TOTAL ROGCI(5) | | | | | | | | | | | | | | | | | | | | | | | | | |
Proved Developed Producing | | 71.9 | | 59.7 | | 22.8 | | 20.4 | | 3.7 | | 2.8 | | 1,266.5 | | 1,054.6 | | 1,076.3 | | 843.6 | | 50.8 | | 38.6 | |
Proved Developed Non-Producing | | 1.5 | | 0.9 | | 3.5 | | 2.7 | | — | | — | | 17.6 | | 14.5 | | 106.8 | | 79.9 | | 2.4 | | 1.4 | |
Proved Undeveloped | | 7.2 | | 6.0 | | 3.6 | | 2.9 | | 3.9 | | 3.0 | | 611.9 | | 506.1 | | 293.1 | | 242.2 | | 25.1 | | 19.1 | |
Total Proved | | 80.6 | | 66.6 | | 29.9 | | 26.0 | | 7.6 | | 5.8 | | 1,896.0 | | 1,575.2 | | 1,476.2 | | 1,165.7 | | 78.3 | | 59.1 | |
Total Probable | | 83.9 | | 68.1 | | 11.9 | | 10.3 | | 1.8 | | 1.3 | | 781.1 | | 657.2 | | 648.3 | | 539.1 | | 37.8 | | 29.8 | |
Total Proved Plus Probable | | 164.5 | | 134.7 | | 41.8 | | 36.3 | | 9.4 | | 7.1 | | 2,677.1 | | 2,232.4 | | 2,124.5 | | 1,704.8 | | 116.1 | | 88.9 | |
(1) | The prices used for the estimates of reserves are set forth under “Pricing Assumptions” later in this section. |
(2) | Southeast Asia includes Indonesia, Malaysia, Vietnam, Australia/Timor-Leste and Papua New Guinea. |
(3) | Latin America does not include any reserves attributable to the Company’s investment in Equiόn, shown separately under “Equity Investments” in this table. |
(4) | Other refers to Algeria. |
(5) | Total Consolidated Entities plus Total Equity Investments. |
31
Net Present Value of Future Net Revenue(1)
| | Before Deducting Income Taxes
Discounted At | | After Deducting Income Taxes
Discounted At(2) | |
Year ended December 31, 2016 | | 0% | | 5% | | 10% | | 15% | | 20% | | 0% | | 5% | | 10% | | 15% | | 20% | |
CONSOLIDATED ENTITIES | | | | | | | | | | | | | | | | | | | | | |
Canada | | | | | | | | | | | | | | | | | | | | | |
Proved Developed Producing | | (429.3 | ) | 678.1 | | 672.0 | | 575.2 | | 491.6 | | (521.5 | ) | 612.1 | | 622.6 | | 537.0 | | 461.3 | |
Proved Developed Non-Producing | | (99.7 | ) | 9.2 | | 13.0 | | 11.3 | | 9.8 | | (182.2 | ) | (49.3 | ) | (30.5 | ) | (22.4 | ) | (17.0 | ) |
Proved Undeveloped | | 338.6 | | 250.0 | | 184.1 | | 138.4 | | 105.9 | | 246.8 | | 182.4 | | 131.8 | | 96.5 | | 71.4 | |
Total Proved | | (190.4 | ) | 937.3 | | 869.1 | | 724.9 | | 607.3 | | (456.9 | ) | 745.2 | | 723.9 | | 611.1 | | 515.7 | |
Total Probable | | 1,973.1 | | 1,082.5 | | 712.3 | | 517.5 | | 399.3 | | 1,546.8 | | 837.1 | | 551.9 | | 402.5 | | 311.5 | |
Total Proved Plus Probable | | 1,782.7 | | 2,019.8 | | 1,581.4 | | 1,242.4 | | 1,006.6 | | 1,089.9 | | 1,582.3 | | 1,275.8 | | 1,013.6 | | 827.2 | |
United States | | | | | | | | | | | | | | | | | | | | | |
Proved Developed Producing | | 3,715.6 | | 2,761.8 | | 2,088.3 | | 1,667.7 | | 1,390.6 | | 3,126.2 | | 2,388.2 | | 1,820.3 | | 1,459.1 | | 1,219.3 | |
Proved Developed Non-Producing | | 51.6 | | 51.3 | | 43.3 | | 36.0 | | 30.4 | | 40.6 | | 43.6 | | 37.4 | | 31.3 | | 26.4 | |
Proved Undeveloped | | 1,705.6 | | 998.1 | | 634.2 | | 414.4 | | 270.1 | | 1,336.2 | | 776.4 | | 481.0 | | 299.3 | | 179.1 | |
Total Proved | | 5,472.8 | | 3,811.2 | | 2,765.8 | | 2,118.1 | | 1,691.1 | | 4,503.0 | | 3,208.2 | | 2,338.7 | | 1,789.7 | | 1,424.8 | |
Total Probable | | 3,409.8 | | 1,112.2 | | 532.5 | | 321.4 | | 218.1 | | 2,261.6 | | 709.1 | | 340.5 | | 209.0 | | 143.0 | |
Total Proved Plus Probable | | 8,882.6 | | 4,923.4 | | 3,298.3 | | 2,439.5 | | 1,909.2 | | 6,764.6 | | 3,917.3 | | 2,679.2 | | 1,998.7 | | 1,567.8 | |
Southeast Asia(3) | | | | | | | | | | | | | | | | | | | | | |
Proved Developed Producing | | 3,012.3 | | 2,624.9 | | 2,315.3 | | 2,064.3 | | 1,858.3 | | 1,553.7 | | 1,371.8 | | 1,223.4 | | 1,101.0 | | 999.1 | |
Proved Developed Non-Producing | | 461.5 | | 396.1 | | 344.8 | | 304.0 | | 270.9 | | 456.5 | | 391.9 | | 341.2 | | 300.9 | | 268.2 | |
Proved Undeveloped | | 743.4 | | 552.5 | | 412.7 | | 308.5 | | 229.8 | | 467.0 | | 338.4 | | 243.9 | | 173.5 | | 120.3 | |
Total Proved | | 4,217.2 | | 3,573.5 | | 3,072.8 | | 2,676.8 | | 2,359.0 | | 2,477.2 | | 2,102.1 | | 1,808.5 | | 1,575.4 | | 1,387.6 | |
Total Probable | | 3,281.5 | | 2,422.7 | | 1,828.8 | | 1,407.2 | | 1,100.7 | | 2,084.3 | | 1,525.3 | | 1,136.3 | | 859.3 | | 658.0 | |
Total Proved Plus Probable | | 7,498.7 | | 5,996.2 | | 4,901.6 | | 4,084.0 | | 3,459.7 | | 4,561.5 | | 3,627.4 | | 2,944.8 | | 2,434.7 | | 2,045.6 | |
Latin America(4) | | | | | | | | | | | | | | | | | | | | | |
Proved Developed Producing | | 5.7 | | 5.2 | | 4.8 | | 4.4 | | 4.1 | | 4.8 | | 4.4 | | 4.0 | | 3.7 | | 3.4 | |
Proved Developed Non-Producing | | 28.6 | | 26.4 | | 24.2 | | 22.4 | | 20.6 | | 28.8 | | 26.5 | | 24.4 | | 22.5 | | 20.7 | |
Proved Undeveloped | | 39.9 | | 31.4 | | 24.9 | | 19.5 | | 15.3 | | 39.3 | | 31.0 | | 24.4 | | 19.1 | | 15.0 | |
Total Proved | | 74.2 | | 63.0 | | 53.9 | | 46.3 | | 40.0 | | 72.9 | | 61.9 | | 52.8 | | 45.3 | | 39.1 | |
Total Probable | | 36.6 | | 30.0 | | 24.8 | | 20.8 | | 17.5 | | 36.6 | | 29.9 | | 24.8 | | 20.8 | | 17.6 | |
Total Proved Plus Probable | | 110.8 | | 93.0 | | 78.7 | | 67.1 | | 57.5 | | 109.5 | | 91.8 | | 77.6 | | 66.1 | | 56.7 | |
Other(5) | | | | | | | | | | | | | | | | | | | | | |
Proved Developed Producing | | 216.4 | | 192.6 | | 173.2 | | 157.1 | | 143.6 | | 126.9 | | 114.7 | | 104.5 | | 95.9 | | 88.7 | |
Proved Developed Non-Producing | | 21.6 | | 18.7 | | 16.3 | | 14.4 | | 12.8 | | 11.5 | | 10.0 | | 8.9 | | 7.9 | | 7.0 | |
Proved Undeveloped | | 80.5 | | 58.6 | | 43.2 | | 32.1 | | 24.0 | | 45.0 | | 31.1 | | 21.2 | | 14.1 | | 8.9 | |
Total Proved | | 318.5 | | 269.9 | | 232.7 | | 203.6 | | 180.4 | | 183.4 | | 155.8 | | 134.6 | | 117.9 | | 104.6 | |
Total Probable | | 302.8 | | 235.6 | | 187.6 | | 152.4 | | 126.0 | | 169.2 | | 130.9 | | 103.5 | | 83.5 | | 68.4 | |
Total Proved Plus Probable | | 621.3 | | 505.5 | | 420.3 | | 356.0 | | 306.4 | | 352.6 | | 286.7 | | 238.1 | | 201.4 | | 173.0 | |
TOTAL CONSOLIDATED ENTITIES | | | | | | | | | | | | | | | | | | | | | |
Proved Developed Producing | | 6,520.7 | | 6,262.6 | | 5,253.6 | | 4,468.7 | | 3,888.2 | | 4,290.1 | | 4,491.2 | | 3,774.8 | | 3,196.7 | | 2,771.8 | |
Proved Developed Non-Producing | | 463.6 | | 501.7 | | 441.6 | | 388.1 | | 344.5 | | 355.2 | | 422.7 | | 381.4 | | 340.2 | | 305.3 | |
Proved Undeveloped | | 2,908.0 | | 1,890.6 | | 1,299.1 | | 912.9 | | 645.1 | | 2,134.3 | | 1,359.3 | | 902.3 | | 602.5 | | 394.7 | |
Total Proved | | 9,892.3 | | 8,654.9 | | 6,994.3 | | 5,769.7 | | 4,877.8 | | 6,779.6 | | 6,273.2 | | 5,058.5 | | 4,139.4 | | 3,471.8 | |
Total Probable | | 9,003.8 | | 4,883.0 | | 3,286.0 | | 2,419.3 | | 1,861.6 | | 6,098.5 | | 3,232.3 | | 2,157.0 | | 1,575.1 | | 1,198.5 | |
Total Proved Plus Probable | | 18,896.1 | | 13,537.9 | | 10,280.3 | | 8,189.0 | | 6,739.4 | | 12,878.1 | | 9,505.5 | | 7,215.5 | | 5,714.5 | | 4,670.3 | |
EQUITY INVESTMENTS | | | | | | | | | | | | | | | | | | | | | |
RSRUK | | | | | | | | | | | | | | | | | | | | | |
Proved Developed Producing | | (4,504.2 | ) | (2,894.2 | ) | (2,019.3 | ) | (1,501.5 | ) | (1,172.1 | ) | (3,429.3 | ) | (2,186.3 | ) | (1,520.8 | ) | (1,132.7 | ) | (889.1 | ) |
Proved Developed Non-Producing | | 29.2 | | 24.6 | | 21.0 | | 18.3 | | 16.1 | | 29.1 | | 18.1 | | 11.1 | | 6.7 | | 3.9 | |
Proved Undeveloped | | 213.3 | | 170.8 | | 135.9 | | 108.9 | | 88.3 | | 213.3 | | 170.7 | | 135.8 | | 108.7 | | 88.1 | |
Total Proved | | (4,261.7 | ) | (2,698.8 | ) | (1,862.4 | ) | (1,374.3 | ) | (1,067.7 | ) | (3,186.9 | ) | (1,997.5 | ) | (1,373.9 | ) | (1,017.3 | ) | (797.1 | ) |
Total Probable | | 1,756.8 | | 1,349.1 | | 1,075.4 | | 883.3 | | 743.3 | | 1,751.9 | | 1,267.5 | | 972.7 | | 781.4 | | 650.1 | |
Total Proved Plus Probable | | (2,504.9 | ) | (1,349.7 | ) | (787.0 | ) | (491.0 | ) | (324.4 | ) | (1,435.0 | ) | (730.0 | ) | (401.2 | ) | (235.9 | ) | (147.0 | ) |
Equion | | | | | | | | | | | | | | | | | | | | | |
Proved Developed Producing | | 234.7 | | 219.1 | | 205.6 | | 193.8 | | 183.3 | | 178.1 | | 166.6 | | 156.6 | | 147.7 | | 139.9 | |
Proved Developed Non-Producing | | — | | — | | — | | — | | — | | — | | — | | — | | — | | — | |
Proved Undeveloped | | 17.6 | | 16.3 | | 15.2 | | 14.2 | | 13.4 | | 8.9 | | 8.2 | | 7.6 | | 7.2 | | 6.7 | |
Total Proved | | 252.3 | | 235.4 | | 220.8 | | 208.0 | | 196.7 | | 187.0 | | 174.8 | | 164.2 | | 154.9 | | 146.6 | |
Total Probable | | 42.2 | | 38.6 | | 35.4 | | 32.8 | | 30.4 | | 26.1 | | 23.8 | | 21.8 | | 20.0 | | 18.6 | |
Total Proved Plus Probable | | 294.5 | | 274.0 | | 256.2 | | 240.8 | | 227.1 | | 213.1 | | 198.6 | | 186.0 | | 174.9 | | 165.2 | |
TOTAL EQUITY INVESTMENTS | | | | | | | | | | | | | | | | | | | | | |
Proved Developed Producing | | (4,269.5 | ) | (2,675.1 | ) | (1,813.7 | ) | (1,307.7 | ) | (988.8 | ) | (3,251.2 | ) | (2,019.7 | ) | (1,364.2 | ) | (985.0 | ) | (749.2 | ) |
Proved Developed Non-Producing | | 29.2 | | 24.6 | | 21.0 | | 18.3 | | 16.1 | | 29.1 | | 18.1 | | 11.1 | | 6.7 | | 3.9 | |
Proved Undeveloped | | 230.9 | | 187.1 | | 151.1 | | 123.1 | | 101.7 | | 222.2 | | 178.9 | | 143.4 | | 115.9 | | 94.8 | |
Total Proved | | (4,009.4 | ) | (2,463.4 | ) | (1,641.6 | ) | (1,166.3 | ) | (871.0 | ) | (2,999.9 | ) | (1,822.7 | ) | (1,209.7 | ) | (862.4 | ) | (650.5 | ) |
Total Probable | | 1,799.0 | | 1,387.7 | | 1,110.8 | | 916.1 | | 773.7 | | 1,778.0 | | 1,291.3 | | 994.5 | | 801.4 | | 668.7 | |
Total Proved Plus Probable | | (2,210.4 | ) | (1,075.7 | ) | (530.8 | ) | (250.2 | ) | (97.3 | ) | (1,221.9 | ) | (531.4 | ) | (215.2 | ) | (61.0 | ) | 18.2 | |
TOTAL ROGCI(6) | | | | | | | | | | | | | | | | | | | | | |
Proved Developed Producing | | 2,251.2 | | 3,587.5 | | 3,439.9 | | 3,161.0 | | 2,899.4 | | 1,038.9 | | 2,471.5 | | 2,410.6 | | 2,211.7 | | 2,022.6 | |
Proved Developed Non-Producing | | 492.8 | | 526.3 | | 462.6 | | 406.4 | | 360.6 | | 384.3 | | 440.8 | | 392.5 | | 346.9 | | 309.2 | |
Proved Undeveloped | | 3,138.9 | | 2,077.7 | | 1,450.2 | | 1,036.0 | | 746.8 | | 2,356.5 | | 1,538.2 | | 1,045.7 | | 718.4 | | 489.5 | |
Total Proved | | 5,882.9 | | 6,191.5 | | 5,352.7 | | 4,603.4 | | 4,006.8 | | 3,779.7 | | 4,450.5 | | 3,848.8 | | 3,277.0 | | 2,821.3 | |
Total Probable | | 10,802.8 | | 6,270.7 | | 4,396.8 | | 3,335.4 | | 2,635.3 | | 7,876.5 | | 4,523.6 | | 3,151.5 | | 2,376.5 | | 1,867.2 | |
Total Proved Plus Probable | | 16,685.7 | | 12,462.2 | | 9,749.5 | | 7,938.8 | | 6,642.1 | | 11,656.2 | | 8,974.1 | | 7,000.3 | | 5,653.5 | | 4,688.5 | |
32
(1) The prices used for the estimates of future net revenue are set forth under “Pricing Assumptions” later in this section.
(2) Future Net Revenue After Deducting Income Taxes has been calculated by deducting royalties and taxes which have been computed separately for each taxable entity using existing tax pool balances using tax pool write-off rates and tax rates and rules in accordance with existing legislation. No benefit has been included for future interest expense or the benefits of future tax planning opportunities. Values do not represent an estimate of the value at the business entity level, which may be significantly different. For information at the business entity level, see the Company’s Consolidated Financial Statements and Management’s Discussion and Analysis for the year ended December 31, 2016.
(3) Southeast Asia includes Indonesia, Malaysia, Vietnam and Australia/Timor-Leste and Papua New Guinea.
(4) Latin America does not include any future net revenue attributable to the Company’s investment in Equiόn, shown separately under “Equity Investments” in this table.
(5) Other refers to Algeria.
(6) Total Consolidated Entities plus Total Equity Investments.
Elements of Future Net Revenue
(Undiscounted) ($ Millions)
Year ended December 31, 2016 | | Revenue | | Royalties | | Operating
Costs | | Development
Costs | | Abandonment
and
Reclamation
Costs | | Future Net
Revenue
Before Taxes | | Taxes(1) | | Future Net
Revenue After
Taxes | |
CONSOLIDATED ENTITIES | | | | | | | | | | | | | | | | | |
Canada | | | | | | | | | | | | | | | | | |
Proved | | 5,132.2 | | 443.9 | | 2,426.7 | | 358.5 | | 2,093.5 | | (190.4 | ) | 266.5 | | (456.9 | ) |
Proved Plus Probable | | 8,940.8 | | 807.7 | | 3,664.0 | | 581.8 | | 2,104.6 | | 1,782.7 | | 692.8 | | 1,089.9 | |
United States | | | | | | | | | | | | | | | | | |
Proved | | 12,209.3 | | 2,289.6 | | 2,773.2 | | 1,014.6 | | 659.1 | | 5,472.8 | | 969.8 | | 4,503.0 | |
Proved Plus Probable | | 18,574.3 | | 3,451.4 | | 4,214.7 | | 1,323.6 | | 702.0 | | 8,882.6 | | 2,118.0 | | 6,764.6 | |
Southeast Asia | | | | | | | | | | | | | | | | | |
Proved | | 9,866.3 | | 3,220.3 | | 1,576.5 | | 363.9 | | 488.4 | | 4,217.2 | | 1,740.0 | | 2,477.2 | |
Proved Plus Probable | | 17,735.5 | | 5,110.3 | | 3,361.6 | | 1,190.4 | | 574.5 | | 7,498.7 | | 2,937.2 | | 4,561.5 | |
Latin America | | | | | | | | | | | | | | | | | |
Proved | | 437.7 | | 97.0 | | 232.7 | | 26.4 | | 7.4 | | 74.2 | | 1.3 | | 72.9 | |
Proved Plus Probable | | 560.1 | | 124.2 | | 291.1 | | 26.4 | | 7.6 | | 110.8 | | 1.3 | | 109.5 | |
Other | | | | | | | | | | | | | | | | | |
Proved | | 1,066.6 | | 468.0 | | 225.4 | | 52.2 | | 2.5 | | 318.5 | | 135.1 | | 183.4 | |
Proved Plus Probable | | 1,840.1 | | 882.8 | | 262.9 | | 68.9 | | 4.2 | | 621.3 | | 268.7 | | 352.6 | |
TOTAL CONSOLIDATED ENTITIES | | | | | | | | | | | | | | | | | |
Proved | | 28,712.1 | | 6,518.8 | | 7,234.5 | | 1,815.6 | | 3,250.9 | | 9,892.3 | | 3,112.7 | | 6,779.6 | |
Proved Plus Probable | | 47,650.8 | | 10,376.4 | | 11,794.3 | | 3,191.1 | | 3,392.9 | | 18,896.1 | | 6,018.0 | | 12,878.1 | |
EQUITY INVESTMENTS | | | | | | | | | | | | | | | | | |
RSRUK | | | | | | | | | | | | | | | | | |
Proved | | 3,643.4 | | — | | 3,191.9 | | 512.5 | | 4,200.7 | | (4,261.7 | ) | (1,074.8 | ) | (3,186.9 | ) |
Proved Plus Probable | | 5,912.8 | | — | | 3,617.1 | | 599.6 | | 4,201.0 | | (2,504.9 | ) | (1,069.9 | ) | (1,435.0 | ) |
Equion | | | | | | | | | | | | | | | | | |
Proved | | 397.7 | | 52.7 | | 83.0 | | 3.7 | | 6.0 | | 252.3 | | 65.3 | | 187.0 | |
Proved Plus Probable | | 461.0 | | 64.5 | | 91.9 | | 4.1 | | 6.0 | | 294.5 | | 81.4 | | 213.1 | |
TOTAL EQUITY INVESTMENTS | | | | | | | | | | | | | | | | | |
Proved | | 4,041.1 | | 52.7 | | 3,274.9 | | 516.2 | | 4,206.7 | | (4,009.4 | ) | (1,009.5 | ) | (2,999.9 | ) |
Proved Plus Probable | | 6,373.8 | | 64.5 | | 3,709.0 | | 603.7 | | 4,207.0 | | (2,210.4 | ) | (988.5 | ) | (1,221.9 | ) |
TOTAL ROGCI(2) | | | | | | | | | | | | | | | | | |
Proved | | 32,753.2 | | 6,571.5 | | 10,509.4 | | 2,331.8 | | 7,457.6 | | 5,882.9 | | 2,103.2 | | 3,779.7 | |
Proved Plus Probable | | 54,024.6 | | 10,440.9 | | 15,503.3 | | 3,794.8 | | 7,599.9 | | 16,685.7 | | 5,029.5 | | 11,656.2 | |
(1) Income Taxes include Petroleum Revenue Tax.
(2) Total Consolidated Entities plus Total Equity Investments.
33
Future Net Revenue by Production Group(1)
| | | | Future Net
Revenue Before
Income Taxes
(Discounted at
10%/year) | | | |
Reserves Category | | Production Group | | ($ Millions) | | Per Unit | |
CONSOLIDATED ENTITIES | | | | | | | |
Proved Reserves | | | | | | | |
| | Light Oil | | 598.8 | | $ | 16.75 / bbl | |
| | Conventional Natural Gas | | 2,977.1 | | $ | 2.10 / mcf | |
| | Natural Gas Liquids | | 1,031.0 | | $ | 13.35 / bbl | |
| | Shale Gas | | 1,926.3 | | $ | 1.02 / mcf | |
| | Tight Oil | | 217.9 | | $ | 28.73 / bbl | |
| | Heavy Oil | | 243.1 | | $ | 8.14 / bbl | |
Proved Plus Probable | | | | | | | |
| | Light Oil | | 1,873.4 | | $ | 20.01 / bbl | |
| | Conventional Natural Gas | | 3,957.1 | | $ | 1.93 / mcf | |
| | Natural Gas Liquids | | 1,415.0 | | $ | 12.30 / bbl | |
| | Shale Gas | | 2,397.5 | | $ | 0.90 / mcf | |
| | Tight Oil | | 232.8 | | $ | 24.87 / bbl | |
| | Heavy Oil | | 404.6 | | $ | 9.67 / bbl | |
EQUITY INVESTMENTS | | | | | | | |
Proved Reserves | | | | | | | |
| | Light Oil | | (1,374.5 | ) | $ | -30.71 / bbl | |
| | Conventional Natural Gas | | (238.8 | ) | $ | -4.32 / mcf | |
| | Natural Gas Liquids | | (28.3 | ) | $ | -24.86 / bbl | |
| | Shale Gas | | — | | $ | 0.00 / mcf | |
| | Tight Oil | | — | | $ | 0.00 / bbl | |
| | Heavy Oil | | — | | $ | 0.00 / bbl | |
Proved Plus Probable | | | | | | | |
| | Light Oil | | (326.4 | ) | $ | -4.61 / bbl | |
| | Conventional Natural Gas | | (203.3 | ) | $ | -2.72 / mcf | |
| | Natural Gas Liquids | | (1.0 | ) | $ | -0.84 / bbl | |
| | Shale Gas | | — | | $ | 0.00 / mcf | |
| | Tight Oil | | — | | $ | 0.00 / bbl | |
| | Heavy Oil | | — | | $ | 0.00 / bbl | |
(1) Includes the Company’s interest in future net revenue attributable to RSRUK and Equiόn.
34
Reconciliation of Changes in Reserves
Continuity of Gross Proved Reserves
Year ended December 31, 2016 | | Light Oil
(mmbbls) | | Heavy Oil
(mmbbls) | | Tight Oil
(mmbbls) | | Shale Gas
(bcf) | | Conventional
Natural
Gas
(bcf) | | NGL
(mmbbls) | |
CONSOLIDATED ENTITIES | | | | | | | | | | | | | |
Canada | | | | | | | | | | | | | |
At December, 31, 2015 | | 2.2 | | 26.8 | | — | | 43.4 | | 441.0 | | 27.7 | |
Discoveries | | — | | — | | — | | — | | — | | — | |
Additions & Extensions | | — | | 0.1 | | — | | 3.3 | | 99.1 | | 4.7 | |
Acquisitions | | — | | 0.3 | | — | | — | | 4.9 | | 0.4 | |
Divestment | | — | | — | | — | | — | | — | | — | |
Technical Revisions | | (0.4 | ) | (0.1 | ) | — | | (14.6 | ) | (3.3 | ) | (2.6 | ) |
Economic Revisions | | — | | (0.7 | ) | — | | (2.5 | ) | 1.7 | | (0.5 | ) |
Production(1) | | (0.3 | ) | (3.2 | ) | — | | (4.6 | ) | (80.2 | ) | (4.9 | ) |
At December, 31, 2016 | | 1.5 | | 23.2 | | — | | 25.0 | | 463.2 | | 24.8 | |
United States | | | | | | | | | | | | | |
At December, 31, 2015 | | — | | — | | 9.5 | | 1,934.9 | | 16.1 | | 38.7 | |
Discoveries | | — | | — | | — | | — | | — | | — | |
Additions & Extensions | | — | | — | | 0.3 | | 237.2 | | — | | 7.3 | |
Acquisitions | | — | | — | | — | | 6.7 | | — | | — | |
Divestment | | — | | — | | — | | — | | — | | — | |
Technical Revisions | | — | | — | | (0.8 | ) | 28.6 | | 3.9 | | 0.6 | |
Economic Revisions | | — | | — | | (0.7 | ) | (138.6 | ) | 4.7 | | (0.7 | ) |
Production(1) | | — | | — | | (0.7 | ) | (197.8 | ) | (3.6 | ) | (4.8 | ) |
At December, 31, 2016 | | — | | — | | 7.6 | | 1,871.0 | | 21.1 | | 41.1 | |
South East Asia | | | | | | | | | | | | | |
At December, 31, 2015 | | 15.6 | | — | | — | | — | | 1,120.6 | | 9.2 | |
Discoveries | | — | | — | | — | | — | | — | | — | |
Additions & Extensions | | 0.8 | | — | | — | | — | | 117.1 | | 1.0 | |
Acquisitions | | — | | — | | — | | — | | — | | — | |
Divestment | | — | | — | | — | | — | | (245.5 | ) | (1.4 | ) |
Technical Revisions | | 3.6 | | — | | — | | — | | (14.3 | ) | 0.1 | |
Economic Revisions | | 8.9 | | — | | — | | — | | 120.7 | | 2.5 | |
Production(1) | | (8.3 | ) | — | | — | | — | | (162.0 | ) | (2.0 | ) |
At December, 31, 2016 | | 20.6 | | — | | — | | — | | 936.6 | | 9.4 | |
Latin America(2) | | | | | | | | | | | | | |
At December, 31, 2015 | | — | | 9.0 | | — | | — | | — | | — | |
Discoveries | | — | | — | | — | | — | | — | | — | |
Additions & Extensions | | — | | — | | — | | — | | — | | — | |
Acquisitions | | — | | — | | — | | — | | — | | — | |
Divestment | | — | | — | | — | | — | | — | | — | |
Technical Revisions | | — | | (0.9 | ) | — | | — | | — | | — | |
Economic Revisions | | — | | (1.2 | ) | — | | — | | — | | — | |
Production(1) | | — | | (0.2 | ) | — | | — | | — | | — | |
At December, 31, 2016 | | — | | 6.7 | | — | | — | | — | | — | |
35
Year ended December 31, 2016 | | Light Oil
(mmbbls) | | Heavy Oil
(mmbbls) | | Tight Oil
(mmbbls) | | Shale Gas
(bcf) | | Conventional
Natural
Gas
(bcf) | | NGL
(mmbbls) | |
Other | | | | | | | | | | | | | |
At December, 31, 2015 | | 14.1 | | — | | — | | — | | — | | 2.0 | |
Discoveries | | — | | — | | — | | — | | — | | — | |
Additions & Extensions | | 1.4 | | — | | — | | — | | — | | 0.8 | |
Acquisitions | | — | | — | | — | | — | | — | | — | |
Divestment | | — | | — | | — | | — | | — | | — | |
Technical Revisions | | 1.8 | | — | | — | | — | | — | | (0.3 | ) |
Economic Revisions | | 0.6 | | — | | — | | — | | — | | (0.5 | ) |
Production(1) | | (4.2 | ) | — | | — | | — | | — | | (0.2 | ) |
At December, 31, 2016 | | 13.7 | | — | | — | | — | | — | | 1.8 | |
TOTAL CONSOLIDATED ENTITIES | | | | | | | | | | | | |
At December, 31, 2015 | | 31.9 | | 35.8 | | 9.5 | | 1,978.3 | | 1,577.7 | | 77.6 | |
Discoveries | | — | | — | | — | | — | | — | | — | |
Additions & Extensions | | 2.2 | | 0.1 | | 0.3 | | 240.5 | | 216.2 | | 13.8 | |
Acquisitions | | — | | 0.3 | | — | | 6.7 | | 4.9 | | 0.4 | |
Divestment | | — | | — | | — | | — | | (245.5 | ) | (1.4 | ) |
Technical Revisions | | 5.0 | | (1.0 | ) | (0.8 | ) | 14.0 | | (13.7 | ) | (2.2 | ) |
Economic Revisions | | 9.5 | | (1.9 | ) | (0.7 | ) | (141.1 | ) | 127.1 | | 0.8 | |
Production(1) | | (12.8 | ) | (3.4 | ) | (0.7 | ) | (202.4 | ) | (245.8 | ) | (11.9 | ) |
At December, 31, 2016 | | 35.8 | | 29.9 | | 7.6 | | 1,896.0 | | 1,420.9 | | 77.1 | |
EQUITY INVESTMENTS | | | | | | | | | | | | | |
RSRUK | | | | | | | | | | | | | |
At December, 31, 2015 | | 29.9 | | — | | — | | — | | 28.1 | | — | |
Discoveries | | — | | — | | — | | — | | — | | — | |
Additions & Extensions | | 0.2 | | — | | — | | — | | — | | — | |
Acquisitions | | — | | — | | — | | — | | — | | — | |
Divestment | | — | | — | | — | | — | | — | | — | |
Technical Revisions | | 9.1 | | — | | — | | — | | (1.4 | ) | 0.1 | |
Economic Revisions | | 8.3 | | — | | — | | — | | — | | — | |
Production(1) | | (7.6 | ) | — | | — | | — | | (1.0 | ) | — | |
At December, 31, 2016 | | 39.9 | | — | | — | | — | | 25.7 | | 0.1 | |
Equion | | | | | | | | | | | | | |
At December, 31, 2015 | | 8.4 | | — | | — | | — | | 42.0 | | 1.5 | |
Discoveries | | — | | — | | — | | — | | — | | — | |
Additions & Extensions | | — | | — | | — | | — | | 2.3 | | — | |
Acquisitions | | — | | — | | — | | — | | — | | — | |
Divestment | | — | | — | | — | | — | | — | | — | |
Technical Revisions | | 0.8 | | — | | — | | — | | (9.9 | ) | (0.3 | ) |
Economic Revisions | | 0.1 | | — | | — | | — | | 6.4 | | 0.2 | |
Production(1) | | (4.4 | ) | — | | — | | — | | (11.2 | ) | (0.3 | ) |
At December, 31, 2016 | | 4.9 | | — | | — | | — | | 29.6 | | 1.1 | |
TOTAL EQUITY INVESTMENTS | | | | | | | | | | | | | |
At December, 31, 2015 | | 38.3 | | — | | — | | — | | 70.1 | | 1.5 | |
Discoveries | | — | | — | | — | | — | | — | | — | |
Additions & Extensions | | 0.2 | | — | | — | | — | | 2.3 | | — | |
Acquisitions | | — | | — | | — | | — | | — | | — | |
Divestment | | — | | — | | — | | — | | — | | — | |
Technical Revisions | | 9.9 | | — | | — | | — | | (11.3 | ) | (0.2 | ) |
Economic Revisions | | 8.4 | | — | | — | | — | | 6.4 | | 0.2 | |
Production(1) | | (12.0 | ) | — | | — | | — | | (12.2 | ) | (0.3 | ) |
At December, 31, 2016 | | 44.8 | | — | | — | | — | | 55.3 | | 1.2 | |
36
Year ended December 31, 2016 | | Light Oil
(mmbbls) | | Heavy Oil
(mmbbls) | | Tight Oil
(mmbbls) | | Shale Gas
(bcf) | | Conventional
Natural
Gas
(bcf) | | NGL
(mmbbls) | |
TOTAL ROGCI | | | | | | | | | | | | | |
At December, 31, 2015 | | 70.2 | | 35.8 | | 9.5 | | 1,978.3 | | 1,647.8 | | 79.1 | |
Discoveries | | — | | — | | — | | — | | — | | — | |
Additions & Extensions | | 2.4 | | 0.1 | | 0.3 | | 240.5 | | 218.5 | | 13.8 | |
Acquisitions | | — | | 0.3 | | — | | 6.7 | | 4.9 | | 0.4 | |
Divestment | | — | | — | | — | | — | | (245.5 | ) | (1.4 | ) |
Technical Revisions | | 14.9 | | (1.0 | ) | (0.8 | ) | 14.0 | | (25.0 | ) | (2.4 | ) |
Economic Revisions | | 17.9 | | (1.9 | ) | (0.7 | ) | (141.1 | ) | 133.5 | | 1.0 | |
Production(1) | | (24.8 | ) | (3.4 | ) | (0.7 | ) | (202.4 | ) | (258.0 | ) | (12.2 | ) |
At December, 31, 2016 | | 80.6 | | 29.9 | | 7.6 | | 1,896.0 | | 1,476.2 | | 78.3 | |
(1) Production numbers reflect the best estimate of calendar year production and do not include out of period accounting adjustments.
(2) Latin America does not include any reserves attributable to the Company’s investment in Equiόn, shown separately under “Equity Investments” in this table.
37
Continuity of Gross Probable Reserves
Year ended December 31, 2016 | | Light Oil
(mmbbls) | | Heavy Oil
(mmbbls) | | Tight Oil
(mmbbls) | | Shale Gas
(bcf) | | Conventional
Natural
Gas
(bcf) | | NGL
(mmbbls) | |
CONSOLIDATED ENTITIES | | | | | | | | | | | | | |
Canada | | | | | | | | | | | | | |
At December, 31, 2015 | | 0.8 | | 7.4 | | — | | 27.3 | | 161.9 | | 12.9 | |
Discoveries | | — | | — | | — | | — | | — | | — | |
Additions & Extensions | | — | | 0.3 | | — | | 35.0 | | 89.3 | | 9.9 | |
Acquisitions | | — | | 0.6 | | — | | — | | 2.2 | | 0.2 | |
Divestment | | — | | — | | — | | — | | — | | — | |
Technical Revisions | | (0.1 | ) | 0.8 | | — | | 6.4 | | (8.3 | ) | (0.2 | ) |
Economic Revisions | | 0.1 | | 1.2 | | — | | (13.5 | ) | 2.3 | | (2.4 | ) |
Production(1) | | — | | — | | — | | — | | — | | — | |
At December, 31, 2016 | | 0.8 | | 10.3 | | — | | 55.2 | | 247.4 | | 20.4 | |
United States | | | | | | | | | | | | | |
At December, 31, 2015 | | — | | — | | 2.1 | | 749.9 | | 10.1 | | 10.1 | |
Discoveries | | — | | — | | — | | — | | — | | — | |
Additions & Extensions | | — | | — | | — | | 5.1 | | — | | 1.4 | |
Acquisitions | | — | | — | | — | | 0.6 | | — | | — | |
Divestment | | — | | — | | — | | — | | — | | — | |
Technical Revisions | | — | | — | | (0.2 | ) | 7.2 | | 2.3 | | 0.4 | |
Economic Revisions | | — | | — | | (0.1 | ) | (36.9 | ) | (5.4 | ) | (0.2 | ) |
Production(1) | | — | | — | | — | | — | | — | | — | |
At December, 31, 2016 | | — | | — | | 1.8 | | 725.9 | | 7.0 | | 11.7 | |
South East Asia | | | | | | | | | | | | | |
At December, 31, 2015 | | 63.6 | | — | | — | | — | | 691.4 | | 7.2 | |
Discoveries | | — | | — | | — | | — | | — | | ��� | |
Additions & Extensions | | 0.5 | | — | | — | | — | | (117.9 | ) | (1.0 | ) |
Acquisitions | | — | | — | | — | | — | | — | | — | |
Divestment | | — | | — | | — | | — | | (29.3 | ) | (0.2 | ) |
Technical Revisions | | (7.7 | ) | — | | — | | — | | (8.3 | ) | 2.4 | |
Economic Revisions | | (8.0 | ) | — | | — | | — | | (161.5 | ) | (4.0 | ) |
Production(1) | | — | | — | | — | | — | | — | | — | |
At December, 31, 2016 | | 48.4 | | — | | — | | — | | 374.4 | | 4.4 | |
Latin America(2) | | | | | | | | | | | | | |
At December, 31, 2015 | | — | | 13.2 | | — | | — | | — | | — | |
Discoveries | | — | | — | | — | | — | | — | | — | |
Additions & Extensions | | — | | — | | — | | — | | — | | — | |
Acquisitions | | — | | — | | — | | — | | — | | — | |
Divestment | | — | | — | | — | | — | | — | | — | |
Technical Revisions | | — | | (4.7 | ) | — | | — | | — | | — | |
Economic Revisions | | — | | (6.9 | ) | — | | — | | — | | — | |
Production(1) | | — | | — | | — | | — | | — | | — | |
At December, 31, 2016 | | — | | 1.6 | | — | | — | | — | | — | |
Other | | | | | | | | | | | | | |
At December, 31, 2015 | | 11.7 | | — | | — | | — | | — | | 0.3 | |
Discoveries | | — | | — | | — | | — | | — | | — | |
Additions & Extensions | | 0.6 | | — | | — | | — | | — | | 0.2 | |
Acquisitions | | — | | — | | — | | — | | — | | — | |
Divestment | | — | | — | | — | | — | | — | | — | |
Technical Revisions | | (3.7 | ) | — | | — | | — | | — | | 0.7 | |
Economic Revisions | | 0.1 | | — | | — | | — | | — | | — | |
Production(1) | | — | | — | | — | | — | | — | | — | |
At December, 31, 2016 | | 8.7 | | — | | — | | — | | — | | 1.2 | |
38
Year ended December 31, 2016 | | Light Oil
(mmbbls) | | Heavy Oil
(mmbbls) | | Tight Oil
(mmbbls) | | Shale Gas
(bcf) | | Conventional
Natural
Gas
(bcf) | | NGL
(mmbbls) | |
TOTAL CONSOLIDATED ENTITIES | | | | | | | | | | | | | |
At December, 31, 2015 | | 76.1 | | 20.6 | | 2.1 | | 777.2 | | 863.4 | | 30.5 | |
Discoveries | | — | | — | | — | | — | | — | | — | |
Additions & Extensions | | 1.1 | | 0.3 | | — | | 40.1 | | (28.6 | ) | 10.5 | |
Acquisitions | | — | | 0.6 | | — | | 0.6 | | 2.2 | | 0.2 | |
Divestment | | — | | — | | — | | — | | (29.3 | ) | (0.2 | ) |
Technical Revisions | | (11.5 | ) | (3.9 | ) | (0.2 | ) | 13.6 | | (14.3 | ) | 3.3 | |
Economic Revisions | | (7.8 | ) | (5.7 | ) | (0.1 | ) | (50.4 | ) | (164.6 | ) | (6.6 | ) |
Production(1) | | — | | — | | — | | — | | — | | — | |
At December, 31, 2016 | | 57.9 | | 11.9 | | 1.8 | | 781.1 | | 628.8 | | 37.7 | |
EQUITY INVESTMENTS | | | | | | | | | | | | | |
RSRUK | | | | | | | | | | | | | |
At December, 31, 2015 | | 29.0 | | — | | — | | — | | 17.9 | | 0.1 | |
Discoveries | | — | | — | | — | | — | | — | | — | |
Additions & Extensions | | 0.1 | | — | | — | | — | | — | | — | |
Acquisitions | | — | | — | | — | | — | | — | | — | |
Divestment | | — | | — | | — | | — | | — | | — | |
Technical Revisions | | (4.5 | ) | — | | — | | — | | (2.1 | ) | — | |
Economic Revisions | | 0.4 | | — | | — | | — | | 3.7 | | — | |
Production(1) | | — | | — | | — | | — | | — | | — | |
At December, 31, 2016 | | 25.0 | | — | | — | | — | | 19.5 | | 0.1 | |
Equion | | | | | | | | | | | | | |
At December, 31, 2015 | | 3.1 | | — | | — | | — | | 1.5 | | 0.1 | |
Discoveries | | — | | — | | — | | — | | — | | — | |
Additions & Extensions | | — | | — | | — | | — | | — | | — | |
Acquisitions | | — | | — | | — | | — | | — | | — | |
Divestment | | — | | — | | — | | — | | — | | — | |
Technical Revisions | | (1.9 | ) | — | | — | | — | | (1.5 | ) | (0.1 | ) |
Economic Revisions | | (0.2 | ) | — | | — | | — | | — | | — | |
Production(1) | | — | | — | | — | | — | | — | | — | |
At December, 31, 2016 | | 1.0 | | — | | — | | — | | — | | — | |
| | | | | | | | | | | | | |
TOTAL EQUITY INVESTMENTS | | | | | | | | | | | | | |
At December, 31, 2015 | | 32.1 | | — | | — | | — | | 19.4 | | 0.2 | |
Discoveries | | — | | — | | — | | — | | — | | — | |
Additions & Extensions | | 0.1 | | — | | — | | — | | — | | — | |
Acquisitions | | — | | — | | — | | — | | — | | — | |
Divestment | | — | | — | | — | | — | | — | | — | |
Technical Revisions | | (6.4 | ) | — | | — | | — | | (3.6 | ) | (0.1 | ) |
Economic Revisions | | 0.2 | | — | | — | | — | | 3.7 | | — | |
Production(1) | | — | | — | | — | | — | | — | | — | |
At December, 31, 2016 | | 26.0 | | — | | — | | — | | 19.5 | | 0.1 | |
39
Year ended December 31, 2016 | | Light Oil
(mmbbls) | | Heavy Oil
(mmbbls) | | Tight Oil
(mmbbls) | | Shale Gas
(bcf) | | Conventional
Natural
Gas
(bcf) | | NGL
(mmbbls) | |
TOTAL ROGCI | | | | | | | | | | | | | |
At December, 31, 2015 | | 108.2 | | 20.6 | | 2.1 | | 777.2 | | 882.8 | | 30.7 | |
Discoveries | | — | | — | | — | | — | | — | | — | |
Additions & Extensions | | 1.2 | | 0.3 | | — | | 40.1 | | (28.6 | ) | 10.5 | |
Acquisitions | | — | | 0.6 | | — | | 0.6 | | 2.2 | | 0.2 | |
Divestment | | — | | — | | — | | — | | (29.3 | ) | (0.2 | ) |
Technical Revisions | | (17.9 | ) | (3.9 | ) | (0.2 | ) | 13.6 | | (17.9 | ) | 3.2 | |
Economic Revisions | | (7.6 | ) | (5.7 | ) | (0.1 | ) | (50.4 | ) | (160.9 | ) | (6.6 | ) |
Production(1) | | — | | — | | — | | — | | — | | — | |
At December, 31, 2016 | | 83.9 | | 11.9 | | 1.8 | | 781.1 | | 648.3 | | 37.8 | |
(1) Production numbers reflect the best estimate of calendar year production and do not include out of period accounting adjustments.
(2) Latin America does not include any reserves attributable to the Company’s investment in Equiόn, shown separately under “Equity Investments” in this table.
40
Continuity of Gross Proved Plus Probable Reserves
Year ended December 31, 2016 | | Light Oil
(mmbbls) | | Heavy Oil
(mmbbls) | | Tight Oil
(mmbbls) | | Shale Gas
(bcf) | | Conventional
Natural
Gas
(bcf) | | NGL
(mmbbls) | |
CONSOLIDATED ENTITIES | | | | | | | | | | | | | |
Canada | | | | | | | | | | | | | |
At December, 31, 2015 | | 3.0 | | 34.2 | | — | | 70.7 | | 602.9 | | 40.6 | |
Discoveries | | — | | — | | — | | — | | — | | — | |
Additions & Extensions | | — | | 0.4 | | — | | 38.3 | | 188.4 | | 14.6 | |
Acquisitions | | — | | 0.9 | | — | | — | | 7.1 | | 0.6 | |
Divestment | | — | | — | | — | | — | | — | | — | |
Technical Revisions | | (0.5 | ) | 0.7 | | — | | (8.2 | ) | (11.6 | ) | (2.8 | ) |
Economic Revisions | | 0.1 | | 0.5 | | — | | (16.0 | ) | 4.0 | | (2.9 | ) |
Production(1) | | (0.3 | ) | (3.2 | ) | — | | (4.6 | ) | (80.2 | ) | (4.9 | ) |
At December, 31, 2016 | | 2.3 | | 33.5 | | — | | 80.2 | | 710.6 | | 45.2 | |
United States | | | | | | | | | | | | | |
At December, 31, 2015 | | — | | — | | 11.6 | | 2,684.8 | | 26.2 | | 48.8 | |
Discoveries | | — | | — | | — | | — | | — | | — | |
Additions & Extensions | | — | | — | | 0.3 | | 242.3 | | — | | 8.7 | |
Acquisitions | | — | | — | | — | | 7.3 | | — | | — | |
Divestment | | — | | — | | — | | — | | — | | — | |
Technical Revisions | | — | | — | | (1.0 | ) | 35.8 | | 6.2 | | 1.0 | |
Economic Revisions | | — | | — | | (0.8 | ) | (175.5 | ) | (0.7 | ) | (0.9 | ) |
Production(1) | | — | | — | | (0.7 | ) | (197.8 | ) | (3.6 | ) | (4.8 | ) |
At December, 31, 2016 | | — | | — | | 9.4 | | 2,596.9 | | 28.1 | | 52.8 | |
South East Asia | | | | | | | | | | | | | |
At December, 31, 2015 | | 79.2 | | — | | — | | — | | 1,812.0 | | 16.4 | |
Discoveries | | — | | — | | — | | — | | — | | — | |
Additions & Extensions | | 1.3 | | — | | — | | — | | (0.8 | ) | — | |
Acquisitions | | — | | — | | — | | — | | — | | — | |
Divestment | | — | | — | | — | | — | | (274.8 | ) | (1.6 | ) |
Technical Revisions | | (4.1 | ) | — | | — | | — | | (22.6 | ) | 2.5 | |
Economic Revisions | | 0.9 | | — | | — | | — | | (40.8 | ) | (1.5 | ) |
Production(1) | | (8.3 | ) | — | | — | | — | | (162.0 | ) | (2.0 | ) |
At December, 31, 2016 | | 69.0 | | — | | — | | — | | 1,311.0 | | 13.8 | |
Latin America(2) | | | | | | | | | | | | | |
At December, 31, 2015 | | — | | 22.2 | | — | | — | | — | | — | |
Discoveries | | — | | — | | — | | — | | — | | — | |
Additions & Extensions | | — | | — | | — | | — | | — | | — | |
Acquisitions | | — | | — | | — | | — | | — | | — | |
Divestment | | — | | — | | — | | — | | — | | — | |
Technical Revisions | | — | | (5.6 | ) | — | | — | | — | | — | |
Economic Revisions | | — | | (8.1 | ) | — | | — | | — | | — | |
Production(1) | | — | | (0.2 | ) | — | | — | | — | | — | |
At December, 31, 2016 | | — | | 8.3 | | — | | — | | — | | — | |
Other | | | | | | | | | | | | | |
At December, 31, 2015 | | 25.8 | | — | | — | | — | | — | | 2.3 | |
Discoveries | | — | | — | | — | | — | | — | | — | |
Additions & Extensions | | 2.0 | | — | | — | | — | | — | | 1.0 | |
Acquisitions | | — | | — | | — | | — | | — | | — | |
Divestment | | — | | — | | — | | — | | — | | — | |
Technical Revisions | | (1.9 | ) | — | | — | | — | | — | | 0.4 | |
Economic Revisions | | 0.7 | | — | | — | | — | | — | | (0.5 | ) |
Production(1) | | (4.2 | ) | — | | — | | — | | — | | (0.2 | ) |
At December, 31, 2016 | | 22.4 | | — | | — | | — | | — | | 3.0 | |
41
Year ended December 31, 2016 | | Light Oil
(mmbbls) | | Heavy Oil
(mmbbls) | | Tight Oil
(mmbbls) | | Shale Gas
(bcf) | | Conventional
Natural
Gas
(bcf) | | NGL
(mmbbls) | |
TOTAL CONSOLIDATED ENTITIES | | | | | | | | | | | | | |
At December, 31, 2015 | | 108.0 | | 56.4 | | 11.6 | | 2,755.5 | | 2,441.1 | | 108.1 | |
Discoveries | | — | | — | | — | | — | | — | | — | |
Additions & Extensions | | 3.3 | | 0.4 | | 0.3 | | 280.6 | | 187.6 | | 24.3 | |
Acquisitions | | — | | 0.9 | | — | | 7.3 | | 7.1 | | 0.6 | |
Divestment | | — | | — | | — | | — | | (274.8 | ) | (1.6 | ) |
Technical Revisions | | (6.5 | ) | (4.9 | ) | (1.0 | ) | 27.6 | | (28.0 | ) | 1.1 | |
Economic Revisions | | 1.7 | | (7.6 | ) | (0.8 | ) | (191.5 | ) | (37.5 | ) | (5.8 | ) |
Production(1) | | (12.8 | ) | (3.4 | ) | (0.7 | ) | (202.4 | ) | (245.8 | ) | (11.9 | ) |
At December, 31, 2016 | | 93.7 | | 41.8 | | 9.4 | | 2,677.1 | | 2,049.7 | | 114.8 | |
EQUITY INVESTMENTS | | | | | | | | | | | | | |
RSRUK | | | | | | | | | | | | | |
At December, 31, 2015 | | 58.9 | | — | | — | | — | | 46.0 | | 0.1 | |
Discoveries | | — | | — | | — | | — | | — | | — | |
Additions & Extensions | | 0.3 | | — | | — | | — | | — | | — | |
Acquisitions | | — | | — | | — | | — | | — | | — | |
Divestment | | — | | — | | — | | — | | — | | — | |
Technical Revisions | | 4.6 | | — | | — | | — | | (3.5 | ) | 0.1 | |
Economic Revisions | | 8.7 | | — | | — | | — | | 3.7 | | — | |
Production(1) | | (7.6 | ) | — | | — | | — | | (1.0 | ) | — | |
At December, 31, 2016 | | 64.9 | | — | | — | | — | | 45.2 | | 0.2 | |
Equion | | | | | | | | | | | | | |
At December, 31, 2015 | | 11.5 | | — | | — | | — | | 43.5 | | 1.6 | |
Discoveries | | — | | — | | — | | — | | — | | — | |
Additions & Extensions | | — | | — | | — | | — | | 2.3 | | — | |
Acquisitions | | — | | — | | — | | — | | — | | — | |
Divestment | | — | | — | | — | | — | | — | | — | |
Technical Revisions | | (1.1 | ) | — | | — | | — | | (11.4 | ) | (0.4 | ) |
Economic Revisions | | (0.1 | ) | — | | — | | — | | 6.4 | | 0.2 | |
Production(1) | | (4.4 | ) | — | | — | | — | | (11.2 | ) | (0.3 | ) |
At December, 31, 2016 | | 5.9 | | — | | — | | — | | 29.6 | | 1.1 | |
TOTAL EQUITY INVESTMENTS | | | | | | | | | | | | | |
At December, 31, 2015 | | 70.4 | | — | | — | | — | | 89.5 | | 1.7 | |
Discoveries | | — | | — | | — | | — | | — | | — | |
Additions & Extensions | | 0.3 | | — | | — | | — | | 2.3 | | — | |
Acquisitions | | — | | — | | — | | — | | — | | — | |
Divestment | | — | | — | | — | | — | | — | | — | |
Technical Revisions | | 3.5 | | — | | — | | — | | (14.9 | ) | (0.3 | ) |
Economic Revisions | | 8.6 | | — | | — | | — | | 10.1 | | 0.2 | |
Production(1) | | (12.0 | ) | — | | — | | — | | (12.2 | ) | (0.3 | ) |
At December, 31, 2016 | | 70.8 | | — | | — | | — | | 74.8 | | 1.3 | |
42
Year ended December 31, 2016 | | Light Oil
(mmbbls) | | Heavy Oil
(mmbbls) | | Tight Oil
(mmbbls) | | Shale Gas
(bcf) | | Conventional
Natural
Gas
(bcf) | | NGL
(mmbbls) | |
TOTAL ROGCI | | | | | | | | | | | | | |
At December, 31, 2015 | | 178.4 | | 56.4 | | 11.6 | | 2,755.5 | | 2,530.6 | | 109.8 | |
Discoveries | | — | | — | | — | | — | | — | | — | |
Additions & Extensions | | 3.6 | | 0.4 | | 0.3 | | 280.6 | | 189.9 | | 24.3 | |
Acquisitions | | — | | 0.9 | | — | | 7.3 | | 7.1 | | 0.6 | |
Divestment | | — | | — | | — | | — | | (274.8 | ) | (1.6 | ) |
Technical Revisions | | (3.0 | ) | (4.9 | ) | (1.0 | ) | 27.6 | | (42.9 | ) | 0.8 | |
Economic Revisions | | 10.3 | | (7.6 | ) | (0.8 | ) | (191.5 | ) | (27.4 | ) | (5.6 | ) |
Production(1) | | (24.8 | ) | (3.4 | ) | (0.7 | ) | (202.4 | ) | (258.0 | ) | (12.2 | ) |
At December, 31, 2016 | | 164.5 | | 41.8 | | 9.4 | | 2,677.1 | | 2,124.5 | | 116.1 | |
(1) Production numbers reflect the best estimate of calendar year production and do not include out of period accounting adjustments.
(2) Latin America does not include any reserves attributable to the Company’s investment in Equiόn, shown separately under “Equity Investments” in this table.
At the end of 2016, the Company’s proved plus probable reserves totaled 1.19 billion boe. The Company added (discoveries, additions & extensions, acquisitions) approximately 116.5 million boe, with negative technical revisions of 10.8 million boe, negative economic revisions of 42.7 million boe, and divestments of 50.5 million boe.
Undeveloped Reserves
The following tables set forth, by product type, the volumes of gross proved undeveloped reserves and gross probable undeveloped reserves that were first attributed as reserves in each of the most recent three financial years. Undeveloped reserves are those reserves where a significant expenditure (for example, when compared to the cost of drilling a well) is required to render them capable of production. Undeveloped reserves may be booked to projects that have both proved (high certainty) and probable (less certain, but expected to be recovered) reserves, and some projects that have only probable reserves. The following table presents the first attributed undeveloped reserve additions for the past four years.
43
Proved Undeveloped Reserves(1)
| | Light Oil
(mmbbls) | | Heavy Oil
(mmbbls) | | Tight Oil
(mmbbls) | | Shale Gas
(bcf) | | Conventional
Natural Gas
(bcf) | | Natural Gas
Liquids
(mmbbls) | |
CONSOLIDATED ENTITIES | | | | | | | | | | | | | |
2014 | | 4.5 | | 0.1 | | 3.0 | | 220.9 | | 29.8 | | 6.3 | |
2015 | | — | | 0.4 | | 0.9 | | 204.8 | | 20.4 | | 7.7 | |
2016(2) | | 1.7 | | 0.1 | | 0.3 | | 240.4 | | 216.3 | | 13.6 | |
EQUITY INVESTMENTS | | | | | | | | | | | | | |
2014 | | 0.8 | | — | | — | | — | | — | | — | |
2015 | | — | | — | | — | | — | | — | | — | |
2016(3) | | 0.2 | | — | | — | | — | | 2.3 | | — | |
TOTAL ROGCI | | | | | | | | | | | | | |
2016(4) | | 1.9 | | 0.1 | | 0.3 | | 240.4 | | 218.5 | | 13.6 | |
Probable Undeveloped Reserves(1)
| | Light Oil
(mmbbls) | | Heavy Oil
(mmbbls) | | Tight Oil
(mmbbls) | | Shale Gas
(bcf) | | Conventional
Natural Gas
(bcf) | | Natural Gas
Liquids
(mmbbls) | |
CONSOLIDATED ENTITIES | | | | | | | | | | | | | |
2014 | | 38.8 | | 0.3 | | 0.4 | | 186.8 | | 17.7 | | 2.9 | |
2015 | | 1.1 | | 0.2 | | 0.1 | | 176.4 | | 96.0 | | 2.8 | |
2016(2) | | 1.1 | | 0.2 | | 0.0 | | 40.0 | | 89.3 | | 11.6 | |
EQUITY INVESTMENTS | | | | | | | | | | | | | |
2014 | | 1.0 | | — | | — | | — | | 4.6 | | — | |
2015 | | — | | — | | — | | — | | — | | — | |
2016(3) | | 0.1 | | — | | — | | — | | — | | — | |
TOTAL ROGCI | | | | | | | | | | | | | |
2016(4) | | 1.3 | | 0.2 | | 0.0 | | 40.0 | | 89.3 | | 11.6 | |
(1) First attributed includes only new additions during the year and does not include revisions to previous undeveloped reserves.
(2) Does not include the Company’s investments in RSRUK or Equiόn, shown separately under “Equity Investments” in this table.
(3) The Company’s investments in RSRUK and Equiόn were accounted for based on the equity method of accounting commencing January 1, 2014.
(4) Includes the Company’s equity investments in RSRUK and Equiόn.
As at December 31, 2016, the Company’s proved undeveloped reserves were 201 mmboe and proved plus probable undeveloped reserves were 446 mmboe. These values represent 25% and 38% of the Company’s total proved and total proved plus probable reserves respectively. It is expected that all the Company’s undeveloped reserves will be developed within the next five years.
44
Future Development Costs(1)
The following tables set forth the development costs ($ millions) deducted in the estimation of future net revenue.
CONSOLIDATED ENTITIES
| | Canada | | United States | | Southeast Asia | |
Year | | Proved | | Proved Plus
Probable | | Proved | | Proved Plus
Probable | | Proved | | Proved Plus
Probable | |
2017 | | 74.1 | | 75.6 | | 237.3 | | 282.0 | | 148.7 | | 299.9 | |
2018 | | 53.4 | | 75.5 | | 288.4 | | 337.5 | | 161.7 | | 353.2 | |
2019 | | 39.9 | | 126.8 | | 142.3 | | 182.2 | | 31.6 | | 165.8 | |
2020 | | 34.6 | | 48.4 | | 111.7 | | 120.3 | | 12.4 | | 216.4 | |
2021 | | 15.6 | | 64.3 | | 59.2 | | 83.2 | | 4.8 | | 133.4 | |
Remainder | | 140.9 | | 191.2 | | 175.7 | | 318.4 | | 4.7 | | 21.7 | |
Total: Undiscounted | | 358.5 | | 581.8 | | 1,014.6 | | 1,323.6 | | 363.9 | | 1,190.4 | |
| | Latin America | | Other | |
Year | | Proved | | Proved Plus
Probable | | Proved | | Proved Plus
Probable | |
2017 | | 6.2 | | 6.2 | | 15.7 | | 15.7 | |
2018 | | 17.0 | | 17.0 | | 22.7 | | 38.3 | |
2019 | | 3.2 | | 3.2 | | 3.9 | | 3.9 | |
2020 | | — | | — | | 2.3 | | 2.3 | |
2021 | | — | | — | | 1.5 | | 1.5 | |
Remainder | | — | | — | | 6.1 | | 7.2 | |
Total: Undiscounted | | 26.4 | | 26.4 | | 52.2 | | 68.9 | |
EQUITY INVESTMENTS
| | RSRUK | | Equion | |
Year | | Proved | | Proved Plus
Probable | | Proved | | Proved Plus
Probable | |
2017 | | 77.9 | | 102.1 | | 3.7 | | 4.1 | |
2018 | | 75.8 | | 95.0 | | — | | — | |
2019 | | 105.9 | | 121.4 | | — | | — | |
2020 | | 67.5 | | 70.9 | | — | | — | |
2021 | | 43.1 | | 43.1 | | — | | — | |
Remainder | | 142.3 | | 167.1 | | — | | — | |
Total: Undiscounted | | 512.5 | | 599.6 | | 3.7 | | 4.1 | |
(1) Includes development and maintenance costs.
The Company expects to fund future development from internally generated cash flow, existing cash balances, debt financing and the proceeds of farm-out arrangements. The only costs of funding future development is the interest associated with debt financing. The interest associated with debt financing is not included in the reserves and future revenue estimates and would reduce reserves and future net revenue to some degree depending on the funding source utilized. The Company does not expect that interest or other funding costs would make the development of any property uneconomic.
Pricing Assumptions
The pricing assumptions used in the preparation of reserves and related future net revenue are set forth below. By 2026, oil prices are assuming a long-term estimate of $80.10/bbl Brent crude oil in real 2017 dollars, and gas prices are assuming a long-term estimate of $4.53/mmbtu NYMEX in real 2017 dollars.
45
| | Oil(1) | | Natural Gas | | Natural Gas Liquids | |
Year | | USA
WTI
Cushing
Oklahoma
(US$/bbl) | | Canada
Western
Canadian
Select
Hardisty
Heavy
(C$/bbl) | | UK
Dated Brent
(US$/bbl) | | USA(2)
Henry Hub
(US$/
mmbtu) | | Canada(3)
AECO-C
(C$/gj) | | UK
IPE
M-1(4)
(P/therm) | | Canada
Edmonton
Propane
(C$/bbl) | | Inflation
Rates
%/year | | Exchange
Rate
(US$ equal)
C$1.00 | | Exchange
Rate
(US$ equal)
UK £1.00 | |
2017 | | 55.00 | | 50.77 | | 55.00 | | 3.20 | | 2.79 | | 42.19 | | 14.10 | | -1.2% | | 0.78 | | 1.28 | |
2018 | | 65.00 | | 63.31 | | 65.00 | | 3.70 | | 3.51 | | 48.85 | | 29.55 | | 0% | | 0.77 | | 1.31 | |
2019 | | 75.00 | | 75.00 | | 75.00 | | 4.20 | | 4.17 | | 50.37 | | 43.83 | | 1.0% | | 0.77 | | 1.35 | |
2020 | | 85.00 | | 86.08 | | 85.00 | | 4.80 | | 4.94 | | 53.24 | | 48.42 | | 1.5% | | 0.79 | | 1.39 | |
2021 | | 86.70 | | 85.63 | | 86.70 | | 4.90 | | 4.98 | | 53.85 | | 48.17 | | 2.0% | | 0.81 | | 1.43 | |
2022 | | 88.43 | | 85.23 | | 88.43 | | 5.00 | | 5.01 | | 54.11 | | 53.27 | | 2.0% | | 0.83 | | 1.46 | |
Thereafter | | +2%/yr(5) | | +2%/yr(5) | | +2%/yr(5) | | +2%/yr(5) | | +2%/yr(5) | | +2%/yr(5) | | +2%/yr(5) | | | | | | | |
(1) Asian gas prices are generally linked to oil, except for certain contracts which contained fixed prices.
(2) US Shale gas price is based on Henry Hub
(3) Canadian shale gas price is based on AECO
(4) Oil prices in UK and Other are generally derived from Dated Brent with quality and transportation differentials
(5) Rates are approximate
Weighted average historical prices for the year ended December 31, 2016, with respect to the Company’s consolidated entities and equity investments, were $44.62/bbl for light oil, $42.86/bbl for tight oil, $30.38/bbl for heavy oil, $2.16/mcf for shale gas, $3.80/mcf for natural gas and $21.29/bbl for natural gas liquids.
46
Definitions
Conventional Natural Gas is a mixture of lighter hydrocarbons that exist either in the gaseous phase or in solution in light oil in reservoirs but are gaseous at atmospheric conditions, but which excludes shale. Natural gas may contain sulphur or other non-hydrocarbon compounds.
Developed Reserves are those reserves that are expected to be recovered from existing wells and installed facilities or, if facilities have not been installed, that would involve a low expenditure (for example, when compared to the cost of drilling a well) to put the reserves on production.
Developed Non-Producing Reserves are those reserves that either have not been on production, or have previously been on production but are shut-in, and the date of resumption of production is unknown.
Developed Producing Reserves are those reserves that are expected to be recovered from completion intervals open at the time of the estimate. These reserves may be currently producing or, if shut-in, they must have previously been on production, and the date of resumption of production must be known with reasonable certainty.
Gross Reserves are the Company’s working interest (operating or non-operating) share before deduction of royalties and without including any royalty interests of the Company.
Heavy Oil is oil that qualifies for royalties specific to heavy oil, in a jurisdiction that has a royalty regime specific to heavy oil; or is oil with a density between 10 to 22.3 degrees API (as that term is defined by the American Petroleum Institute), in a jurisdiction that has no royalty regime specific to heavy oil.
Light Oil is a mixture consisting mainly of pentanes and heavier hydrocarbons that exist in the liquid phase in reservoirs and remains liquid at atmospheric pressure and temperature. Light Oil may contain small amounts of sulphur and other non-hydrocarbons but does not include liquids obtained from the processing of natural gas.
Natural Gas Liquids are those hydrocarbon components that can be recovered from natural gas as liquids, including, but not limited to, ethane, propane, butanes, pentanes plus, condensate and small quantities of non-hydrocarbons.
Net Reserves are the Company’s working interest (operating or non-operating) share after deduction of royalty obligations, plus the Company’s royalty interests in reserves.
Probable Reserves are those additional reserves that are less certain to be recovered than proved reserves. It is equally likely that the actual remaining quantities recovered will be greater or less than the sum of the estimated proved plus probable reserves.
Proved Reserves are those reserves that can be estimated with a high degree of certainty to be recoverable. It is likely that the actual remaining quantities recovered will exceed the estimated proved reserves.
Shale Gas is derived from shales and similar low permeability formations and is typically developed with horizontal drilling and multi-stage fracture stimulations. It is a mixture of lighter hydrocarbons that exist either in the gaseous phase or in solution in shale oil in reservoirs but are gaseous at atmospheric conditions. Shale gas may contain sulphur or other non-hydrocarbon compounds. In this Annual Information Form, reserves reported under the Shale Gas product type include reserves in the Marcellus, Montney, Eagle Ford and Duvernay plays.
Tight Oil is derived from shale and is a mixture consisting mainly of pentanes and heavier hydrocarbons that exist in the liquid phase in reservoirs and remains liquid at atmospheric pressure and temperature. Tight Oil may contain small amounts of sulphur and other non-hydrocarbons but does not include liquids obtained from the processing of natural gas.
Undeveloped Reserves are those reserves expected to be recovered from known accumulations where a significant expenditure (for example, when compared to the cost of drilling a well) is required to render them capable of production. They must fully meet the requirements of the reserves classification (proved, probable, possible) to which they are assigned.
47
Wells
The following table sets forth the number of the Company’s producing and non-producing wells as at December 31, 2016.
| | Oil Wells | | Natural Gas Wells | |
| | Producing | | Non-Producing (1) | | Producing | | Non-Producing (1) | |
Year ended December 31, 2016 | | Gross (2) | | Net (2) | | Gross (2) | | Net (2) | | Gross (2) | | Net (2) | | Gross (2) | | Net (2) | |
CONSOLIDATED ENTITIES | | | | | | | | | | | | | | | | | |
Alberta | | 1,106.0 | | 909.0 | | 346.0 | | 227.0 | | 1,531.0 | | 860.0 | | 348.0 | | 163.0 | |
British Columbia | | — | | — | | 3.0 | | — | | 36.0 | | 10.0 | | 26.0 | | 14.0 | |
Saskatchewan | | 20.0 | | 19.0 | | 38.0 | | 33.0 | | 4.0 | | 2.0 | | 41.0 | | 24.0 | |
Quebec | | — | | — | | — | | — | | — | | — | | 11.0 | | 9.0 | |
Northwest Territories | | — | | — | | — | | — | | 3.0 | | — | | 9.0 | | — | |
Yukon | | — | | — | | — | | — | | — | | — | | 1.0 | | — | |
Total Canada | | 1,126.0 | | 928.0 | | 387.0 | | 260.0 | | 1,574.0 | | 872.0 | | 436.0 | | 210.0 | |
Texas | | 262.0 | | 60.5 | | — | | — | | 484.0 | | 115.7 | | — | | — | |
New York | | — | | — | | — | | — | | 44.0 | | 35.9 | | 57.0 | | 50.7 | |
Pennsylvania | | — | | — | | — | | — | | 508.0 | | 451.2 | | 31.0 | | 27.6 | |
Total United States | | 262.0 | | 60.5 | | — | | — | | 1,036.0 | | 602.8 | | 88.0 | | 78.3 | |
Indonesia | | 55.0 | | 26.7 | | 127.0 | | 55.9 | | 45.0 | | 15.6 | | 21.0 | | 7.4 | |
Malaysia | | 90.0 | | 43.4 | | 30.0 | | 12.7 | | 38.0 | | 15.8 | | 7.0 | | 2.9 | |
Australia/Timor-leste | | — | | — | | — | | — | | — | | — | | — | | — | |
Vietnam | | 28.0 | | 3.8 | | 6.0 | | 0.1 | | — | | — | | — | | — | |
Papua New Guinea | | — | | — | | — | | — | | — | | — | | 4.0 | | 1.6 | |
Colombia (3) | | 3.0 | | 1.4 | | 10.0 | | 4.5 | | — | | — | | — | | — | |
Algeria | | 91.0 | | 8.0 | | 22.0 | | 3.8 | | — | | — | | — | | — | |
Kurdistan Region of Iraq | | — | | — | | — | | — | | — | | — | | 4.0 | | 2.4 | |
Total Other | | 267.0 | | 83.2 | | 195.0 | | 77.0 | | 83.0 | | 31.4 | | 36.0 | | 14.3 | |
TOTAL CONSOLIDATED ENTITIES | | 1,655.0 | | 1,071.7 | | 582.0 | | 337.0 | | 2,693.0 | | 1,506.2 | | 560.0 | | 302.6 | |
EQUITY INVESTMENTS | | | | | | | | | | | | | | | | | |
RSRUK | | 166.0 | | 45.5 | | 215.0 | | 72.7 | | 1.0 | | 0.1 | | 2.0 | | 0.5 | |
Equion | | 22.0 | | 5.2 | | 8.0 | | 2.0 | | — | | — | | — | | — | |
TOTAL EQUITY INVESTMENTS | | 188.0 | | 50.7 | | 223.0 | | 74.7 | | 1.0 | | 0.1 | | 2.0 | | 0.5 | |
TOTAL ROGCI (4) | | 1,843.0 | | 1,122.4 | | 805.0 | | 411.7 | | 2,694.0 | | 1,506.3 | | 562.0 | | 303.1 | |
(1) Non producing includes those wells that were not producing at year end but are capable of producing.
(2) “Gross wells” means the total number of wells in which the Company has interests. “Net wells” means the number of wells obtained by aggregating the Company’s working interest in each of its gross wells.
(3) Colombia does not include wells owned by Equiόn, shown separately under “Equity Investments” in this table.
(4) Total Consolidated Entities plus Total Equity Investments.
For further information, please refer to the “Description of the Business” section of this Annual Information Form.
48
Properties with no Attributed Reserves
The following table sets out the Company’s land holdings with no attributed reserves as at December 31, 2016:
| | Properties with no Attributed
Reserves ( thousand acres ) (1) | |
Year ended December 31, 2016 | | Gross | | Net | |
CONSOLIDATED ENTITIES | | | | | |
Canada (2) | | 6,520.4 | | 3,970.3 | |
United States (2) | | 292.1 | | 267.6 | |
Southeast Asia (3) | | 23,707.0 | | 14,940.0 | |
Latin America (4) | | 7,320.7 | | 3,605.5 | |
Other (5) | | 32.6 | | 3.0 | |
TOTAL CONSOLIDATED ENTITIES | | 37,872.8 | | 22,786.3 | |
EQUITY INVESTMENTS | | | | | |
RSRUK | | 289.7 | | 112.9 | |
Equion | | 477.5 | | 100.3 | |
TOTAL EQUITY INVESTMENTS | | 767.3 | | 213.1 | |
TOTAL ROGCI (6) | | 38,640.1 | | 22,999.5 | |
(1) Where the Company holds interests in different formations under the same surface area but pursuant to separate leases, the acreage for each lease is included in total gross and net acreage.
(2) There are no work commitments for any of the lands.
(3) Southeast Asia includes Indonesia, Vietnam, Malaysia, Australia/Timor Leste and Papua New Guinea as at December 31, 2016.
(4) Latin America does not include the Company’s investment in Equiόn, shown separately under “Equity Investments” in this table.
(5) Other includes the Kurdistan Region of Iraq and Algeria.
(6) Total Consolidated Entities plus Total Equity Investments.
Work commitments, categorized as seismic acquisition, geophysical studies or well commitments (land and/or licence commitments), exist in all of the Company’s geographic areas except Canada and the United States where there are no comparable work commitments for any of the lands held. In Canada and the United States, the Company’s ultimate ability to retain land typically requires drilling activity and/or proof of productivity. In other regions in which the Company operates, the result of not fulfilling a land or licence commitment could result in the loss of a title document or imposition of a penalty. The Company’s total work commitments with respect to its consolidated entities for the next two years are estimated to be $291.5 million.
The estimated net acres of properties with no attributed reserves (thousand acres) that are expected to expire in 2017 with respect to the Company’s consolidated entities are as follows: Canada — 43.9, United States — 7.8, Southeast Asia — 725.2 and Latin America — 3,415.5.
Forward Contracts
Future commitments to buy, sell, exchange, process and transport oil or gas of the Company are described under note 21 entitled “Contingencies and Commitments” in the audited Consolidated Financial Statements of the Company for the year ended December 31, 2016, which is incorporated herein by reference.
49
Costs Incurred
The following table summarizes the capital expenditures made by the Company on oil and natural gas properties for the year ended December 31, 2016.
| | | | | | | | | |
| | Property Acquisition Costs | | Exploration | | Development | |
| | ($ Millions) | | Costs | | Costs | |
| | Proved Properties | | Unproved Properties | | ($ Millions) | | ($ Millions) | |
CONSOLIDATED ENTITIES | | | | | | | | | |
Canada | | 55 | | 1 | | 36 | | 94 | |
United States | | 4 | | 16 | | 13 | | 167 | |
Southeast Asia | | 28 | | 27 | | 140 | | 97 | |
Other(1) | | — | | — | | 50 | | 3 | |
TOTAL CONSOLIDATED ENTITIES | | 87 | | 44 | | 239 | | 361 | |
EQUITY INVESTMENTS | | | | | | | | | |
RSRUK | | — | | — | | 3 | | 204 | |
Equion | | 3 | | — | | — | | 13 | |
TOTAL EQUITY INVESTMENTS | | 3 | | — | | 3 | | 217 | |
TOTAL ROGCI | | 90 | | 44 | | 242 | | 578 | |
(1) “Other” includes Algeria, Colombia and the Kurdistan Region of Iraq.
Exploration and Development Activities
For a description of the Company’s most important current and likely exploration and development activities, please refer to the “Description of the Business” section of this Annual Information Form. The following tables set forth the number of wells completed in the year ended December 31, 2016:
| | Exploratory Wells | | Development Wells | | Total | |
| | Gross | | Net | | Gross | | Net | | Gross | | Net | |
CONSOLIDATED ENTITIES | | | | | | | | | | | | | |
Canada | | | | | | | | | | | | | |
Oil | | — | | — | | 4.0 | | 3.3 | | 4.0 | | 3.3 | |
Gas | | — | | — | | 27.0 | | 21.3 | | 27.0 | | 21.3 | |
Service | | — | | — | | — | | — | | — | | — | |
Stratigraphic Test | | — | | — | | — | | — | | — | | — | |
Dry | | — | | — | | — | | — | | — | | — | |
Total | | — | | — | | 31.0 | | 24.6 | | 31.0 | | 24.6 | |
United States | | | | | | | | | | | | | |
Oil | | — | | — | | 64.0 | | 22.6 | | 64.0 | | 22.6 | |
Gas | | — | | — | | 29.0 | | 24.3 | | 29.0 | | 24.3 | |
Service | | — | | — | | — | | — | | — | | — | |
Stratigraphic Test | | — | | — | | — | | — | | — | | — | |
Dry | | — | | — | | — | | — | | — | | — | |
Total | | — | | — | | 93.0 | | 46.9 | | 93.0 | | 46.9 | |
50
| | Exploratory Wells | | Development Wells | | Total | |
| | Gross | | Net | | Gross | | Net | | Gross | | Net | |
Southeast Asia (1) | | | | | | | | | | | | | |
Oil | | — | | — | | — | | — | | — | | — | |
Gas | | 2.0 | | 1.0 | | 1.0 | | 0.4 | | 3.0 | | 1.4 | |
Service | | — | | — | | — | | — | | — | | — | |
Stratigraphic Test | | — | | — | | — | | — | | — | | — | |
Dry | | 6.0 | | 3.3 | | | | | | 6.0 | | 3.3 | |
Total | | 8.0 | | 4.3 | | 1.0 | | 0.4 | | 9.0 | | 4.7 | |
Latin America (2) | | | | | | | | | | | | | |
Oil | | — | | — | | — | | — | | — | | — | |
Gas | | — | | — | | — | | — | | — | | — | |
Service | | — | | — | | — | | — | | — | | — | |
Stratigraphic Test | | — | | — | | — | | — | | — | | — | |
Dry | | 1.0 | | 0.3 | | — | | — | | 1.0 | | 0.3 | |
Total | | 1.0 | | 0.3 | | — | | — | | 1.0 | | 0.3 | |
Other (3) | | | | | | | | | | | | | |
Oil | | — | | — | | 1.0 | | 0.1 | | 1.0 | | 0.1 | |
Gas | | — | | — | | — | | — | | — | | — | |
Service | | — | | — | | — | | — | | — | | — | |
Stratigraphic Test | | — | | — | | — | | — | | — | | — | |
Dry | | — | | — | | — | | — | | — | | — | |
Total | | — | | — | | 1.0 | | 0.1 | | 1.0 | | 0.1 | |
TOTAL CONSOLIDATED ENTITIES | | 9.0 | | 4.6 | | 126.0 | | 71.9 | | 135.0 | | 76.5 | |
EQUITY INVESTMENTS | | | | | | | | | | | | | |
TSEUK | | | | | | | | | | | | | |
Oil | | — | | — | | 2.0 | | 0.6 | | 2.0 | | 0.6 | |
Gas | | — | | — | | — | | — | | — | | — | |
Service | | — | | — | | — | | — | | — | | — | |
Stratigraphic Test | | — | | — | | — | | — | | — | | — | |
Dry | | — | | — | | — | | — | | — | | — | |
Total | | — | | — | | 2.0 | | 0.6 | | 2.0 | | 0.6 | |
Equion | | | | | | | | | | | | | |
Oil | | — | | — | | 2.0 | | 0.5 | | 2.0 | | 0.5 | |
Gas | | — | | — | | — | | — | | — | | — | |
Service | | — | | — | | — | | — | | — | | — | |
Stratigraphic Test | | — | | — | | — | | — | | — | | — | |
Dry | | — | | — | | — | | — | | 1.0 | | 0.3 | |
Total | | — | | — | | 2.0 | | 0.5 | | 3.0 | | 0.8 | |
TOTAL EQUITY INVESTMENTS | | — | | — | | 4.0 | | 1.1 | | 5.0 | | 1.4 | |
TOTAL ROGCI | | 9.0 | | 4.6 | | 130.0 | | 73.0 | | 139.0 | | 77.6 | |
(1) Southeast Asia includes Indonesia, Malaysia, and Papua New Guinea.
(2) Latin America does not include the Company’s investment in Equiόn, shown separately under “Equity Investments” in this table.
(3) Other refers to Algeria.
51
Production Estimates
The following table sets forth the volume of working interest production, before royalties, estimated for 2017, which is reflected in the estimate of future net revenue disclosed in the tables of reserves information with respect to gross proved and probable reserves:
| | Product | |
| | Light Oil
(mbbls) | | Heavy Oil
(mbbls) | | Tight Oil
(mbbls) | | Shale Gas
(mmscf) | | Conventional
Natural Gas
(mmscf) | | Natural Gas
Liquids
(mbbls) | |
CONSOLIDATED ENTITIES | | | | | | | | | | | | | |
Canada | | | | | | | | | | | | | |
Total Proved | | 293.6 | | 2,674.3 | | — | | 4,237.3 | | 68,616.4 | | 3,825.5 | |
Total Probable | | 20.7 | | 166.1 | | — | | 988.8 | | 8,551.2 | | 676.7 | |
Total Proved Plus Probable | | 314.3 | | 2,840.4 | | — | | 5,226.1 | | 77,167.6 | | 4,502.2 | |
United States | | | | | | | | | | | | | |
Total Proved | | — | | — | | 713.7 | | 181,197.4 | | 2,949.6 | | 4,273.9 | |
Total Probable | | — | | — | | 4.3 | | 6,056.2 | | 5.5 | | 46.9 | |
Total Proved Plus Probable | | — | | — | | 718.0 | | 187,253.6 | | 2,955.1 | | 4,320.8 | |
Southeast Asia(1) | | | | | | | | | | | | | |
Total Proved | | 5,844.6 | | — | | — | | — | | 160,596.2 | | 1,856.1 | |
Total Probable | | 752.0 | | — | | — | | — | | — | | 106.9 | |
Total Proved Plus Probable | | 6,596.6 | | — | | — | | — | | 160,596.2 | | 1,962.9 | |
Latin America(2) | | | | | | | | | | | | | |
Total Proved | | — | | 815.5 | | — | | — | | — | | — | |
Total Probable | | — | | 25.9 | | — | | — | | — | | — | |
Total Proved Plus Probable | | — | | 841.4 | | — | | — | | — | | — | |
Other(3) | | | | | | | | | | | | | |
Total Proved | | 3,633.2 | | — | | — | | — | | — | | 164.1 | |
Total Probable | | 242.6 | | — | | — | | — | | — | | — | |
Total Proved Plus Probable | | 3,875.8 | | — | | — | | — | | — | | 164.1 | |
TOTAL CONSOLIDATED ENTITIES | | | | | | | | | | | | | |
Total Proved | | 9,771.4 | | 3,489.8 | | 713.7 | | 185,434.7 | | 232,162.1 | | 10,119.6 | |
Total Probable | | 1,015.3 | | 192.0 | | 4.3 | | 7,045.0 | | 8,556.7 | | 830.5 | |
Total Proved Plus Probable | | 10,786.7 | | 3,681.8 | | 718.0 | | 192,479.7 | | 240,718.8 | | 10,950.1 | |
EQUITY INVESTMENTS | | | | | | | | | | | | | |
RSRUK | | | | | | | | | | | | | |
Total Proved | | 5,850.3 | | — | | — | | — | | 2,583.2 | | 242.5 | |
Total Probable | | 2,087.6 | | — | | — | | — | | 1,259.3 | | 15.4 | |
Total Proved Plus Probable | | 7,938.0 | | — | | — | | — | | 3,842.5 | | 257.9 | |
Equion | | | | | | | | | | | | | |
Total Proved | | 2,585.3 | | — | | — | | — | | 10,093.8 | | 350.4 | |
Total Probable | | 299.8 | | — | | — | | — | | 3.6 | | 1.0 | |
Total Proved Plus Probable | | 2,885.1 | | — | | — | | — | | 10,097.4 | | 351.4 | |
TOTAL EQUITY INVESTMENTS | | | | | | | | | | | | | |
Total Proved | | 8,435.7 | | — | | — | | — | | 12,677.0 | | 592.8 | |
Total Probable | | 2,387.4 | | — | | — | | — | | 1,262.9 | | 16.4 | |
Total Proved Plus Probable | | 10,823.0 | | — | | — | | — | | 13,939.9 | | 609.3 | |
TOTAL ROGCI(4) | | | | | | | | | | | | | |
Total Proved | | 18,207.1 | | 3,489.8 | | 713.7 | | 185,434.7 | | 244,839.1 | | 10,712.4 | |
Total Probable | | 3,402.7 | | 192.0 | | 4.3 | | 7,045.0 | | 9,819.6 | | 846.9 | |
Total Proved Plus Probable | | 21,609.8 | | 3,681.8 | | 718.0 | | 192,479.7 | | 254,658.8 | | 11,559.4 | |
(1) Southeast Asia includes production in Indonesia, Malaysia and Vietnam.
(2) Latin America does not include the Company’s investment in Equiόn, shown separately under “Equity Investments” in this table.
(3) Other refers to Algeria.
(4) Total Consolidated Entities plus Total Equity Investments.
52
Production History
Average Daily Production and Netback Information
The following table sets forth certain information with respect to production, product prices received, royalties, production costs and netbacks received by the Company for each quarter in 2016 and the total for 2016:
| | Quarter Ended | | Total Year | |
| | 31-Mar | | 30-Jun | | 30-Sep | | 31-Dec | | 2016 | |
CONSOLIDATED ENTITIES | | | | | | | | | | | |
Canada | | | | | | | | | | | |
Average Daily Production | | | | | | | | | | | |
Light Oil (bbl/d) | | 474 | | 387 | | 398 | | 410 | | 417 | |
Tight Oil (bbl/d) | | — | | — | | — | | — | | — | |
Shale Gas (mmcf/d) | | 13 | | 14 | | 13 | | 11 | | 13 | |
Natural Gas (mmcf/d) | | 234 | | 225 | | 216 | | 206 | | 220 | |
Natural Gas Liquids (bbl/d) | | 13,209 | | 13,255 | | 14,197 | | 12,409 | | 13,267 | |
Heavy Oil (bbl/d) | | 9,660 | | 9,124 | | 9,467 | | 8,917 | | 9,292 | |
Average Net Prices Received | | | | | | | | | | | |
Light Oil ($/bbl) | | 28.05 | | 40.89 | | 40.53 | | 43.94 | | 37.93 | |
Tight Oil ($/bbl) | | — | | — | | — | | — | | — | |
Shale Gas ($/mcf) | | 1.67 | | 1.26 | | 2.03 | | 2.45 | | 1.81 | |
Natural Gas ($/mcf) | | 1.58 | | 1.25 | | 1.94 | | 2.38 | | 1.77 | |
Natural Gas Liquids ($/bbl) | | 15.18 | | 19.92 | | 19.37 | | 24.08 | | 19.58 | |
Heavy Oil ($/bbl) | | 20.36 | | 33.42 | | 32.38 | | 36.33 | | 30.48 | |
Royalties | | | | | | | | | | | |
Light Oil ($/bbl) | | 0.68 | | 1.76 | | 3.40 | | 1.43 | | 1.77 | |
Tight Oil ($/bbl) | | — | | — | | — | | — | | — | |
Shale Gas ($/mcf) | | (0.01 | ) | 0.05 | | (0.01 | ) | 0.18 | | 0.05 | |
Natural Gas ($/mcf) | | 0.06 | | 0.04 | | 0.07 | | 0.07 | | 0.06 | |
Natural Gas Liquids ($/bbl) | | 0.77 | | 1.04 | | 1.32 | | 0.32 | | 0.88 | |
Heavy Oil ($/bbl) | | 1.04 | | 1.55 | | 2.62 | | 2.77 | | 1.99 | |
Production Costs(2) | | | | | | | | | | | |
Light Oil ($/bbl) | | 61.29 | | 28.78 | | 34.38 | | 6.46 | | 33.80 | |
Tight Oil ($/bbl) | | — | | — | | — | | — | | — | |
Shale Gas ($/mcf) | | 2.92 | | 4.49 | | 4.16 | | 3.18 | | 3.73 | |
Natural Gas ($/mcf) | | 1.28 | | 1.61 | | 1.49 | | 1.51 | | 1.47 | |
Natural Gas Liquids ($/bbl) | | 3.84 | | 4.46 | | 4.21 | | 4.30 | | 4.19 | |
Heavy Oil ($/bbl) | | 10.77 | | 13.39 | | 11.90 | | 12.74 | | 12.17 | |
Netback Received | | | | | | | | | | | |
Light Oil ($/bbl) | | (33.92 | ) | 10.34 | | 2.75 | | 36.06 | | 2.36 | |
Tight Oil ($/bbl) | | — | | — | | — | | — | | — | |
Shale Gas ($/mcf) | | (1.25 | ) | (3.28 | ) | (2.13 | ) | (0.91 | ) | (1.96 | ) |
Natural Gas ($/mcf) | | 0.23 | | (0.40 | ) | 0.38 | | 0.80 | | 0.24 | |
Natural Gas Liquids ($/bbl) | | 10.57 | | 14.43 | | 13.85 | | 19.46 | | 14.50 | |
Heavy Oil ($/bbl) | | 8.56 | | 18.48 | | 17.86 | | 20.82 | | 16.32 | |
United States | | | | | | | | | | | |
Average Daily Production | | | | | | | | | | | |
Light Oil (bbl/d) | | — | | — | | — | | — | | — | |
Tight Oil (bbl/d) | | 7,882 | | 9,013 | | 7,068 | | 5,111 | | 7,256 | |
Shale Gas (mmcf/d) | | 538 | | 548 | | 537 | | 543 | | 541 | |
Natural Gas (mmcf/d) | | 11 | | 8 | | 8 | | 8 | | 9 | |
Natural Gas Liquids (bbl/d) | | 7,632 | | 8,290 | | 7,910 | | 6,550 | | 7,592 | |
53
| | Quarter Ended | | Total Year | |
| | 31-Mar | | 30-Jun | | 30-Sep | | 31-Dec | | 2016 | |
Average Net Prices Received | | | | | | | | | | | |
Light Oil ($/bbl) | | — | | — | | — | | — | | — | |
Tight Oil ($/bbl) | | 27.46 | | 47.26 | | 40.54 | | 61.64 | | 42.86 | |
Shale Gas ($/mcf) | | 1.90 | | 1.79 | | 2.39 | | 2.58 | | 2.16 | |
Natural Gas ($/mcf) | | 1.27 | | 1.35 | | 1.35 | | 1.78 | | 1.42 | |
Natural Gas Liquids ($/bbl) | | 12.37 | | 16.01 | | 15.86 | | 20.54 | | 16.05 | |
Royalties | | | | | | | | | | | |
Light Oil ($/bbl) | | — | | — | | — | | — | | — | |
Tight Oil ($/bbl) | | 8.07 | | 10.85 | | 9.66 | | 18.75 | | 11.22 | |
Shale Gas ($/mcf) | | 0.25 | | 0.30 | | 0.42 | | 0.49 | | 0.36 | |
Natural Gas ($/mcf) | | 0.18 | | 0.18 | | 0.18 | | 0.24 | | 0.19 | |
Natural Gas Liquids ($/bbl) | | 4.03 | | 4.20 | | 3.94 | | 6.84 | | 4.66 | |
Production Costs(2) | | | | | | | | | | | |
Light Oil ($/bbl) | | — | | — | | — | | — | | — | |
Tight Oil ($/bbl) | | 8.36 | | 9.65 | | 10.23 | | 8.08 | | 9.20 | |
Shale Gas ($/mcf) | | 1.33 | | 1.10 | | 0.95 | | 1.28 | | 1.16 | |
Natural Gas ($/mcf) | | 1.22 | | 1.33 | | 0.94 | | 0.76 | | 1.08 | |
Natural Gas Liquids ($/bbl) | | (1.43 | ) | 2.40 | | 1.29 | | 1.59 | | 0.98 | |
Netback Received | | | | | | | | | | | |
Light Oil ($/bbl) | | — | | — | | — | | — | | — | |
Tight Oil ($/bbl) | | 11.03 | | 26.76 | | 20.65 | | 34.81 | | 22.44 | |
Shale Gas ($/mcf) | | 0.32 | | 0.39 | | 1.02 | | 0.81 | | 0.64 | |
Natural Gas ($/mcf) | | (0.14 | ) | (0.16 | ) | 0.22 | | 0.78 | | 0.14 | |
Natural Gas Liquids ($/bbl) | | 9.76 | | 9.42 | | 10.63 | | 12.11 | | 10.41 | |
Southeast Asia | | | | | | | | | | | |
Average Daily Production | | | | | | | | | | | |
Light Oil (bbl/d) | | 28,296 | | 25,116 | | 21,918 | | 23,837 | | 24,782 | |
Natural Gas (mmcf/d) | | 494 | | 417 | | 423 | | 437 | | 443 | |
Natural Gas Liquids (bbl/d) | | 3,880 | | 3,377 | | 3,663 | | 3,749 | | 3,668 | |
Average Net Prices Received | | | | | | | | | | | |
Light Oil ($/bbl) | | 35.00 | | 51.04 | | 47.93 | | 55.40 | | 46.85 | |
Natural Gas ($/mcf) | | 4.15 | | 4.70 | | 5.23 | | 5.42 | | 4.85 | |
Natural Gas Liquids ($/bbl) | | 26.11 | | 42.59 | | 40.06 | | 43.57 | | 37.87 | |
Royalties | | | | | | | | | | | |
Light Oil ($/bbl) | | 10.11 | | 14.81 | | 16.67 | | 21.95 | | 15.62 | |
Natural Gas ($/mcf) | | 0.97 | | 1.04 | | 1.32 | | 1.29 | | 1.15 | |
Natural Gas Liquids ($/bbl) | | 6.02 | | 17.61 | | 16.15 | | 23.61 | | 15.74 | |
Production Costs(2) | | | | | | | | | | | |
Light Oil ($/bbl) | | 16.88 | | 19.61 | | 22.99 | | 13.81 | | 18.19 | |
Natural Gas ($/mcf) | | 0.82 | | 1.00 | | 1.10 | | 0.93 | | 0.96 | |
Natural Gas Liquids ($/bbl)(1) | | 4.59 | | 5.63 | | 6.15 | | 5.23 | | 5.37 | |
Netback Received | | | | | | | | | | | |
Light Oil ($/bbl) | | 8.00 | | 16.62 | | 8.28 | | 19.63 | | 13.04 | |
Natural Gas ($/mcf) | | 2.37 | | 2.66 | | 2.81 | | 3.20 | | 2.75 | |
Natural Gas Liquids ($/bbl) | | 15.50 | | 19.35 | | 17.75 | | 14.73 | | 16.77 | |
Latin America(3) | | | | | | | | | | | |
Average Daily Production | | | | | | | | | | | |
Natural Gas (mmcf/d) | | — | | — | | — | | — | | — | |
Natural Gas Liquids (bbl/d) | | — | | — | | — | | — | | — | |
Heavy Oil (bbl/d) | | 1,776 | | (2 | ) | (0 | ) | 829 | | 649 | |
54
| | Quarter Ended | | Total Year | |
| | 31-Mar | | 30-Jun | | 30-Sep | | 31-Dec | | 2016 | |
Average Net Prices Received | | | | | | | | | | | |
Natural Gas ($/mcf) | | — | | — | | — | | — | | — | |
Natural Gas Liquids ($/bbl) | | — | | — | | — | | — | | — | |
Heavy Oil ($/bbl) | | 21.60 | | (915.23 | ) | — | | 42.64 | | 28.99 | |
Royalties | | | | | | | | | | | |
Natural Gas ($/mcf) | | — | | — | | — | | — | | — | |
Natural Gas Liquids ($/bbl) | | — | | — | | — | | — | | — | |
Heavy Oil ($/bbl) | | 4.77 | | (210.01 | ) | — | | 9.39 | | 6.40 | |
Production Costs(2) | | | | | | | | | | | |
Natural Gas ($/mcf) | | — | | — | | — | | — | | — | |
Natural Gas Liquids ($/bbl) | | — | | — | | — | | — | | — | |
Heavy Oil ($/bbl) | | 36.52 | | (59.14 | ) | — | | 57.06 | | 47.11 | |
Netback Received | | | | | | | | | | | |
Natural Gas ($/mcf) | | — | | — | | — | | — | | — | |
Natural Gas Liquids ($/bbl) | | — | | — | | — | | — | | — | |
Heavy Oil ($/bbl) | | (19.69 | ) | (646.08 | ) | — | | (23.81 | ) | (24.52 | ) |
Other(4) | | | | | | | | | | | |
Average Daily Production | | | | | | | | | | | |
Light Oil (bbl/d) | | 8,147 | | 8,305 | | 15,232 | | 12,581 | | 11,082 | |
Natural Gas (mmcf/d) | | — | | — | | — | | — | | — | |
Natural Gas Liquids (bbl/d) | | 860 | | 984 | | 1,161 | | 1,183 | | 1,048 | |
Average Net Prices Received | | | | | | | | | | | |
Light Oil ($/bbl) | | 35.03 | | 49.93 | | 45.71 | | 49.75 | | 45.70 | |
Natural Gas ($/mcf) | | — | | — | | — | | — | | — | |
Natural Gas Liquids ($/bbl) | | 20.69 | | 34.53 | | 24.73 | | 30.79 | | 27.92 | |
Royalties | | | | | | | | | | | |
Light Oil ($/bbl) | | 17.07 | | 25.52 | | 23.74 | | 26.09 | | 23.52 | |
Natural Gas ($/mcf) | | — | | — | | — | | — | | — | |
Natural Gas Liquids ($/bbl) | | 7.80 | | 17.48 | | 12.65 | | 15.72 | | 13.66 | |
Production Costs(2) | | | | | | | | | | | |
Light Oil ($/bbl) | | 8.50 | | 9.32 | | 6.89 | | 7.57 | | 7.84 | |
Natural Gas ($/mcf) | | — | | — | | — | | — | | — | |
Natural Gas Liquids ($/bbl) | | 8.50 | | 9.32 | | 6.89 | | 7.57 | | 7.84 | |
Netback Received | | | | | | | | | | | |
Light Oil ($/bbl) | | 9.46 | | 15.08 | | 15.08 | | 16.09 | | 14.33 | |
Natural Gas ($/mcf) | | — | | — | | — | | — | | — | |
Natural Gas Liquids ($/bbl) | | 4.39 | | 7.74 | | 5.19 | | 7.49 | | 6.41 | |
TOTAL CONSOLIDATED ENTITIES | | | | | | | | | | | |
Average Daily Production | | | | | | | | | | | |
Light Oil (bbl/d) | | 36,917 | | 33,808 | | 37,548 | | 36,828 | | 36,280 | |
Tight Oil (bbl/d) | | 7,882 | | 9,013 | | 7,068 | | 5,111 | | 7,256 | |
Shale Gas (mmcf/d) | | 551 | | 562 | | 550 | | 554 | | 554 | |
Natural Gas (mmcf/d) | | 739 | | 650 | | 647 | | 651 | | 672 | |
Natural Gas Liquids (bbl/d) | | 25,581 | | 25,906 | | 26,931 | | 23,890 | | 25,574 | |
Heavy Oil (bbl/d) | | 11,436 | | 9,122 | | 9,467 | | 9,745 | | 9,942 | |
Average Net Prices Received | | | | | | | | | | | |
Light Oil ($/bbl) | | 34.91 | | 50.65 | | 46.95 | | 53.34 | | 46.39 | |
Tight Oil ($/bbl) | | 27.46 | | 47.26 | | 40.54 | | 61.64 | | 42.86 | |
Shale Gas ($/mcf) | | 1.90 | | 1.78 | | 2.38 | | 2.58 | | 2.16 | |
Natural Gas ($/mcf) | | 3.30 | | 3.47 | | 4.08 | | 4.41 | | 3.80 | |
Natural Gas Liquids ($/bbl) | | 16.19 | | 22.18 | | 21.38 | | 26.50 | | 21.50 | |
Heavy Oil ($/bbl) | | 20.55 | | 33.63 | | 32.38 | | 36.87 | | 30.38 | |
55
| | Quarter Ended | | Total Year | |
| | 31-Mar | | 30-Jun | | 30-Sep | | 31-Dec | | 2016 | |
Royalties | | | | | | | | | | | |
Light Oil ($/bbl) | | 11.53 | | 17.29 | | 19.39 | | 23.13 | | 17.87 | |
Tight Oil ($/bbl) | | 8.07 | | 10.85 | | 9.66 | | 18.75 | | 11.22 | |
Shale Gas ($/mcf) | | 0.24 | | 0.30 | | 0.41 | | 0.48 | | 0.35 | |
Natural Gas ($/mcf) | | 0.67 | | 0.68 | | 0.89 | | 0.89 | | 0.78 | |
Natural Gas Liquids ($/bbl) | | 2.78 | | 4.84 | | 4.59 | | 6.53 | | 4.66 | |
Heavy Oil ($/bbl) | | 1.62 | | 1.60 | | 2.62 | | 3.34 | | 2.28 | |
Production Costs(2) | | | | | | | | | | | |
Light Oil ($/bbl) | | 15.60 | | 17.19 | | 16.58 | | 11.60 | | 15.21 | |
Tight Oil ($/bbl) | | 8.36 | | 9.65 | | 10.23 | | 8.08 | | 9.20 | |
Shale Gas ($/mcf) | | 1.37 | | 1.19 | | 1.03 | | 1.32 | | 1.22 | |
Natural Gas ($/mcf) | | 0.97 | | 1.22 | | 1.23 | | 1.11 | | 1.13 | |
Natural Gas Liquids ($/bbl) | | 2.54 | | 4.14 | | 3.73 | | 3.86 | | 3.56 | |
Heavy Oil ($/bbl) | | 14.77 | | 13.41 | | 11.90 | | 16.51 | | 14.45 | |
Netback Received | | | | | | | | | | | |
Light Oil ($/bbl) | | 7.78 | | 16.17 | | 10.98 | | 18.60 | | 13.31 | |
Tight Oil ($/bbl) | | 11.03 | | 26.76 | | 20.65 | | 34.81 | | 22.44 | |
Shale Gas ($/mcf) | | 0.28 | | 0.30 | | 0.94 | | 0.78 | | 0.59 | |
Natural Gas ($/mcf) | | 1.66 | | 1.57 | | 1.97 | | 2.41 | | 1.89 | |
Natural Gas Liquids ($/bbl) | | 10.87 | | 13.21 | | 13.06 | | 16.11 | | 13.28 | |
Heavy Oil ($/bbl) | | 4.17 | | 18.62 | | 17.85 | | 17.02 | | 13.66 | |
EQUITY INVESTMENTS | | | | | | | | | | | |
RSRUK | | | | | | | | | | | |
Average Daily Production | | | | | | | | | | | |
Light Oil (bbl/d) | | 23,566 | | 20,024 | | 22,386 | | 17,701 | | 20,915 | |
Natural Gas (mmcf/d) | | 5 | | 3 | | 2 | | 3 | | 3 | |
Natural Gas Liquids (bbl/d) | | 164 | | 91 | | 48 | | 155 | | 114 | |
Average Net Prices Received | | | | | | | | | | | |
Light Oil ($/bbl) | | 33.95 | | 45.69 | | 46.04 | | 47.93 | | 42.97 | |
Natural Gas ($/mcf) | | 3.21 | | 3.39 | | 1.88 | | 2.98 | | 2.98 | |
Natural Gas Liquids ($/bbl) | | 37.46 | | 9.49 | | 25.86 | | 16.48 | | 23.57 | |
Royalties | | | | | | | | | | | |
Light Oil ($/bbl) | | 0.06 | | 0.21 | | 0.21 | | 0.19 | | 0.16 | |
Natural Gas ($/mcf) | | — | | — | | — | | — | | — | |
Natural Gas Liquids ($/bbl) | | — | | — | | — | | — | | — | |
Production Costs(2) | | | | | | | | | | | |
Light Oil ($/bbl) | | 42.36 | | 48.50 | | 50.40 | | 52.80 | | 48.20 | |
Natural Gas ($/mcf) | | 0.30 | | 0.33 | | 1.75 | | (0.17 | ) | 0.42 | |
Natural Gas Liquids ($/bbl)(1) | | 1.71 | | 1.83 | | 9.80 | | (0.95 | ) | 2.36 | |
Netback Received | | | | | | | | | | | |
Light Oil ($/bbl) | | (8.47 | ) | (3.02 | ) | (4.57 | ) | (5.05 | ) | (5.39 | ) |
Natural Gas ($/mcf) | | 2.91 | | 3.06 | | 0.13 | | 3.15 | | 2.55 | |
Natural Gas Liquids ($/bbl) | | 35.75 | | 7.66 | | 16.06 | | 17.43 | | 21.21 | |
Equion | | | | | | | | | | | |
Average Daily Production | | | | | | | | | | | |
Light Oil (bbl/d) | | 12,355 | | 12,594 | | 12,028 | | 12,178 | | 12,288 | |
Natural Gas (mmcf/d) | | 39 | | 38 | | 23 | | 23 | | 31 | |
Natural Gas Liquids (bbl/d) | | 1,379 | | 962 | | 737 | | 488 | | 890 | |
56
| | Quarter Ended | | Total Year | |
| | 31-Mar | | 30-Jun | | 30-Sep | | 31-Dec | | 2016 | |
Average Net Prices Received | | | | | | | | | | | |
Light Oil ($/bbl) | | 30.69 | | 41.45 | | 46.47 | | 50.22 | | 42.18 | |
Natural Gas ($/mcf) | | 4.09 | | 4.01 | | 3.52 | | 3.63 | | 3.88 | |
Natural Gas Liquids ($/bbl) | | 13.99 | | 16.09 | | 15.36 | | 15.29 | | 15.02 | |
Royalties | | | | | | | | | | | |
Light Oil ($/bbl) | | 6.14 | | 8.23 | | 9.36 | | 10.04 | | 8.44 | |
Natural Gas ($/mcf) | | 0.96 | | 0.94 | | 0.38 | | 0.16 | | 0.70 | |
Natural Gas Liquids ($/bbl) | | — | | — | | — | | — | | — | |
Production Costs(2) | | | | | | | | | | | |
Light Oil ($/bbl) | | 6.49 | | 6.07 | | 7.20 | | 8.66 | | 7.08 | |
Natural Gas ($/mcf) | | 0.88 | | 1.02 | | 1.29 | | 1.85 | | 1.18 | |
Natural Gas Liquids ($/bbl)(1) | | 4.92 | | 5.75 | | 7.24 | | 10.39 | | 6.63 | |
Netback Received | | | | | | | | | | | |
Light Oil ($/bbl) | | 18.06 | | 27.15 | | 29.92 | | 31.52 | | 26.67 | |
Natural Gas ($/mcf) | | 2.25 | | 2.05 | | 1.85 | | 1.62 | | 2.00 | |
Natural Gas Liquids ($/bbl) | | 9.07 | | 10.35 | | 8.12 | | 4.90 | | 8.38 | |
TOTAL EQUITY INVESTMENTS | | | | | | | | | | | |
Average Daily Production | | | | | | | | | | | |
Light Oil (bbl/d) | | 35,921 | | 32,618 | | 34,415 | | 29,879 | | 33,202 | |
Natural Gas (mmcf/d) | | 44 | | 40 | | 25 | | 26 | | 34 | |
Natural Gas Liquids (bbl/d) | | 1,543 | | 1,052 | | 785 | | 642 | | 1,004 | |
Average Net Prices Received | | | | | | | | | | | |
Light Oil ($/bbl) | | 32.83 | | 44.05 | | 46.19 | | 48.87 | | 42.68 | |
Natural Gas ($/mcf) | | 3.99 | | 3.97 | | 3.38 | | 3.55 | | 3.79 | |
Natural Gas Liquids ($/bbl) | | 16.48 | | 15.52 | | 16.01 | | 15.58 | | 15.99 | |
Royalties | | | | | | | | | | | |
Light Oil ($/bbl) | | 2.15 | | 3.31 | | 3.41 | | 4.20 | | 3.23 | |
Natural Gas ($/mcf) | | 0.85 | | 0.88 | | 0.35 | | 0.14 | | 0.63 | |
Natural Gas Liquids ($/bbl) | | — | | — | | — | | — | | — | |
Production Costs(2) | | | | | | | | | | | |
Light Oil ($/bbl) | | 30.02 | | 32.11 | | 35.30 | | 34.81 | | 32.98 | |
Natural Gas ($/mcf) | | 0.81 | | 0.98 | | 1.33 | | 1.60 | | 1.11 | |
Natural Gas Liquids ($/bbl)(1) | | 4.53 | | 5.49 | | 7.46 | | 8.96 | | 6.21 | |
Netback Received | | | | | | | | | | | |
Light Oil ($/bbl) | | 0.66 | | 8.63 | | 7.48 | | 9.85 | | 6.47 | |
Natural Gas ($/mcf) | | 2.33 | | 2.11 | | 1.71 | | 1.81 | | 2.05 | |
Natural Gas Liquids ($/bbl) | | 11.95 | | 10.03 | | 8.55 | | 6.62 | | 9.78 | |
TOTAL ROGCI(5) | | | | | | | | | | | |
Average Daily Production | | | | | | | | | | | |
Light Oil (bbl/d) | | 72,838 | | 66,426 | | 71,962 | | 66,707 | | 69,483 | |
Tight Oil (bbl/d) | | 7,882 | | 9,013 | | 7,068 | | 5,111 | | 7,256 | |
Shale Gas (mmcf/d) | | 551 | | 562 | | 550 | | 554 | | 554 | |
Natural Gas (mmcf/d) | | 783 | | 690 | | 671 | | 677 | | 705 | |
Natural Gas Liquids (bbl/d) | | 27,124 | | 26,958 | | 27,717 | | 24,533 | | 26,578 | |
Heavy Oil (bbl/d) | | 11,436 | | 9,122 | | 9,467 | | 9,745 | | 9,942 | |
Average Net Prices Received | | | | | | | | | | | |
Light Oil ($/bbl) | | 33.89 | | 47.41 | | 46.59 | | 51.34 | | 44.62 | |
Tight Oil ($/bbl) | | 27.46 | | 47.26 | | 40.54 | | 61.64 | | 42.86 | |
Shale Gas ($/mcf) | | 1.90 | | 1.78 | | 2.38 | | 2.58 | | 2.16 | |
Natural Gas ($/mcf) | | 3.34 | | 3.50 | | 4.06 | | 4.38 | | 3.80 | |
Natural Gas Liquids ($/bbl) | | 16.20 | | 21.92 | | 21.23 | | 26.21 | | 21.29 | |
Heavy Oil ($/bbl) | | 20.55 | | 33.63 | | 32.38 | | 36.87 | | 30.38 | |
57
| | Quarter Ended | | Total Year | |
| | 31-Mar | | 30-Jun | | 30-Sep | | 31-Dec | | 2016 | |
Royalties | | | | | | | | | | | |
Light Oil ($/bbl) | | 6.90 | | 10.42 | | 11.75 | | 14.66 | | 10.87 | |
Tight Oil ($/bbl) | | 8.07 | | 10.85 | | 9.66 | | 18.75 | | 11.22 | |
Shale Gas ($/mcf) | | 0.24 | | 0.30 | | 0.41 | | 0.48 | | 0.35 | |
Natural Gas ($/mcf) | | 0.68 | | 0.69 | | 0.87 | | 0.86 | | 0.77 | |
Natural Gas Liquids ($/bbl) | | 2.62 | | 4.65 | | 4.46 | | 6.36 | | 4.48 | |
Heavy Oil ($/bbl) | | 1.62 | | 1.60 | | 2.62 | | 3.34 | | 2.28 | |
Production Costs(2) | | | | | | | | | | | |
Light Oil ($/bbl) | | 22.71 | | 24.52 | | 25.53 | | 22.00 | | 23.70 | |
Tight Oil ($/bbl) | | 8.36 | | 9.65 | | 10.23 | | 8.08 | | 9.20 | |
Shale Gas ($/mcf) | | 1.37 | | 1.19 | | 1.03 | | 1.32 | | 1.22 | |
Natural Gas ($/mcf) | | 0.96 | | 1.20 | | 1.23 | | 1.13 | | 1.13 | |
Natural Gas Liquids ($/bbl) | | 2.65 | | 4.19 | | 3.84 | | 4.00 | | 3.66 | |
Heavy Oil ($/bbl) | | 14.77 | | 13.41 | | 11.90 | | 16.51 | | 14.45 | |
Netback Received | | | | | | | | | | | |
Light Oil ($/bbl) | | 4.27 | | 12.47 | | 9.31 | | 14.69 | | 10.04 | |
Tight Oil ($/bbl) | | 11.03 | | 26.76 | | 20.65 | | 34.81 | | 22.44 | |
Shale Gas ($/mcf) | | 0.28 | | 0.30 | | 0.94 | | 0.78 | | 0.59 | |
Natural Gas ($/mcf) | | 1.70 | | 1.60 | | 1.96 | | 2.39 | | 1.90 | |
Natural Gas Liquids ($/bbl) | | 10.93 | | 13.08 | | 12.93 | | 15.86 | | 13.15 | |
Heavy Oil ($/bbl) | | 4.17 | | 18.62 | | 17.85 | | 17.02 | | 13.66 | |
(1) NGL cost = Natural gas cost x 5.615.
(2) Production costs include transportation expense.
(3) Latin America does not include the Company’s investment in Equiόn, shown separately under “Equity Investments” in the table.
(4) Other refers to Algeria.
(5) Total Consolidated Entities plus Total Equity Investments.
58
REPORT ON RESERVES DATA BY THE COMPANY’S INTERNAL QUALIFIED RESERVES EVALUATOR
To the Board of Directors of Repsol Oil & Gas Canada Inc. (the “Company”):
1. The Company’s staff and I have evaluated the Company’s reserves data as at December 31, 2016 prepared in accordance with the requirements of National Instrument 51-101 Standards of Disclosure for Oil and Gas Activities of the Canadian Securities Administrators. The reserves data are estimates of proved reserves and probable reserves and related future net revenue as at December 31, 2016, estimated using forecast prices and costs, and include estimates in relation to the Company’s equity investees, Repsol Sinopec Resources UK Limited and Equiόn Energia Limited.
2. The reserves data are the responsibility of the Company’s management. Our responsibility is to express an opinion on the reserves data based on our evaluation.
We carried out our evaluation in accordance with standards set out in the Canadian Oil and Gas Evaluation Handbook (the “COGE Handbook”) prepared jointly by the Society of Petroleum Evaluation Engineers (Calgary Chapter) and the Canadian Institute of Mining, Metallurgy & Petroleum (Petroleum Society).
3. Those standards require that we plan and perform an evaluation to obtain reasonable assurance as to whether the reserves data are free of material misstatement. An evaluation also includes assessing whether the reserves data are in accordance with the principles and definitions presented in the COGE Handbook.
4. The following table sets forth the estimated future net revenue (before deduction of income taxes) attributed to proved plus probable reserves, estimated using forecast prices and costs and calculated using a discount rate of 10 percent, included in the reserves data of the Company evaluated by us for the year ended December 31, 2016:
Location of Reserves | | Net Present Value of Future Net Revenue
(Before Income Taxes, 10% Discount Rate)
($ millions) | |
Canada | | 1,581.4 | |
US | | 3,298.3 | |
Southeast Asia | | 4,901.6 | |
Latin America(1) | | 78.7 | |
Other | | 420.3 | |
Equity Investments(2) | | (530.8 | ) |
TOTAL | | 9,749.5 | |
(1) Latin America does not include net present value of future net revenue attributable to the Company’s equity investments, shown separately under “Equity Investments” in this table.
(2) Equity Investments includes the Company’s investments in Equiόn and RSRUK.
5. In our opinion, the reserves data evaluated by us have, in all material respects, been determined and are in accordance with the COGE Handbook, consistently applied.
6. We have no responsibility to update our evaluation for events and circumstances occurring after its preparation date.
7. Because the reserves data are based on judgments regarding future events, actual results will vary and the variations may be material.
(signed) “Brian Larson” | |
| |
Brian Larson | |
Internal Qualified Reserves Evaluator | |
Repsol Oil & Gas Canada Inc. | |
Calgary, Alberta | |
| |
February 23, 2017 | |
59
REPORT OF MANAGEMENT AND DIRECTORS ON NI 51-101 RESERVES DATA AND OTHER INFORMATION
Management of Repsol Oil & Gas Canada Inc. (the “Company”) is responsible for the preparation and disclosure of information with respect to the Company’s oil and gas activities in accordance with securities regulatory requirements. This information includes reserves data which are estimates of proved reserves and probable reserves and related future net revenue as at December 31, 2016, estimated using forecast prices and costs, prepared in accordance with the requirements of National Instrument 51-101 Standards of Disclosure for Oil and Gas Activities (“NI 51-101”) of the Canadian Securities Administrators.
The Company’s reserves evaluation staff, including its Internal Qualified Reserves Evaluator who is an employee of the Company, have evaluated the Company’s reserves data. The report of the Internal Qualified Reserves Evaluator will be filed with securities regulatory authorities concurrently with this report.
The board of directors of the Company has:
a) reviewed the Company’s procedures for providing information to the Internal Qualified Reserves Evaluator;
b) met with the Internal Qualified Reserves Evaluator to determine whether any restrictions affected the ability of the Internal Qualified Reserves Evaluator to report without reservation; and
c) reviewed the reserves data with management and the Internal Qualified Reserves Evaluator.
The board of directors of the Company has reviewed the Company’s procedures for assembling and reporting other information associated with oil and gas activities and has reviewed that information with management. The board of directors has approved:
a) the content and filing with securities regulatory authorities of the reserves data and other oil and gas information prepared in accordance with the requirements of NI 51-101, contained in the Annual Information Form of the Company;
b) the filing of Form 51-101F2, which is the report of the Internal Qualified Reserves Evaluator on the reserves data; and
c) the content and filing of this report.
Because the reserves data are based on judgments regarding future events, actual results will vary and the variations may be material.
(signed) “Luis Cabra Dueñas” | | (signed) “Josu Jon Imaz San Miguel” |
| | |
Luis Cabra Dueñas | | Josu Jon Imaz San Miguel |
Chief Executive Officer | | Chairman |
| | |
| | |
(signed) “David Charlton” | | (signed) “Michael T. Waites” |
| | |
David Charlton | | Michael T. Waites |
Vice President Finance, Treasurer | | Director |
and Chief Financial Officer | | |
February 23, 2017
60
SCHEDULE B — AUDIT COMMITTEE INFORMATION
Composition of Audit Committee
The Company’s Audit Committee consists of Michael T. Waites (Chairman), Albrecht W.A. Bellstedt, and Thomas W. Ebbern. The Board of Directors has determined that all members of the Audit Committee are “independent” and “financially literate” as defined in National Instrument 52-110 (“NI 52-110”).
NI 52-110 states that a member of an audit committee is independent if the member has no direct or indirect material relationship with the issuer. A material relationship is a relationship which could, in the view of the issuer’s Board of Directors, reasonably interfere with the exercise of a member’s independent judgment.
In addition, an individual is considered financially literate if he or she has the ability to read and understand a set of financial statements that present a breadth and level of complexity of accounting issues that are generally comparable to the breadth and complexity of the issues that can reasonably be expected to be raised by the issuer’s financial statements.
Education and Experience
The members of the Company’s Audit Committee have education and experience relevant to the performance of their responsibilities as Audit Committee members, which includes the following:
Albrecht Bellstedt has been a professional director since February 2007. Previously (and from 1999 to 2007), Mr. Bellstedt served as Executive Vice-President and General Counsel of TransCanada Corporation and a predecessor corporation. Prior to that, he was a transactional lawyer in private practice for 27 years. Mr. Bellstedt holds a Juris Doctor from the University of Toronto and a Bachelor of Arts degree from Queen’s University.
Thomas Ebbern has been Chief Financial Officer of North West Refining Inc. since January 2012. He was formerly Managing Director, Investment Banking, of Macquarie Capital Markets Canada Ltd., a subsidiary of Macquarie Group Limited. Prior to that, he was Managing Director of Tristone Capital Inc., an energy advisory firm that was acquired by Macquarie. He began his career as a geophysicist with Gulf Canada in 1982. Mr. Ebbern holds a Bachelor of Science degree in Geological Engineering from Queen’s University and a Master of Business Administration from the Richard Ivey School of Business at the University of Western Ontario.
Michael Waites was President and Chief Executive Officer of Finning International Inc. from May 2008 until his retirement from Finning in May 2013. Prior to that, Mr. Waites was Executive Vice President and Chief Financial Officer of Finning. He also served as a member of the board of directors of Finning for three years prior to his appointment as Executive Vice President and Chief Financial Officer. Prior to joining Finning in May 2006, Mr. Waites was Executive Vice President and Chief Financial Officer at Canadian Pacific Railway since July 2000, and was also Chief Executive Officer U.S. Network of Canadian Pacific Railway. Previously, he was Vice President and Chief Financial Officer at Chevron Canada Resources. Mr. Waites holds a Bachelor of Arts (Honours) in Economics from the University of Calgary, a Master of Business Administration from Saint Mary’s College of California, and a Master of Arts, Graduate Studies in Economics from the University of Calgary. He has also completed the Executive Program at The University of Michigan Business School.
Audit Fees and Pre-Approval of Audit Services
The following table presents fees for the audits of the Company’s annual Consolidated Financial Statements for 2016 and 2015 and for other services provided by Ernst & Young LLP:
(C$) | | 2016 | | 2015 | |
Audit and Internal Control Attestation Fees | | 4,678,634 | | 5,412,669 | |
Audit-Related Fees | | 162,381 | | 337,859 | |
Tax Fees | | 185,715 | | 293,167 | |
All Other Fees(1) | | 18,791 | | 13,654 | |
Total | | 5,045,521 | | 6,057,349 | |
(1) Annual subscription of online accounting and income tax database.
The audit-related fees are primarily for assistance in connection with the Company’s prospectus filings, pension plan audits and attestation procedures related to cost certifications and government compliance. Tax fees are primarily for tax
61
compliance and tax advisory services. The Audit Committee has concluded that the provision of tax services is compatible with maintaining Ernst & Young’s independence.
Under the terms of reference of the Audit Committee which follow, the Audit Committee is required to review and pre-approve the objectives and scope of the external audit work and proposed fees. In addition, the Audit Committee is required to review and pre-approve all non-audit services, including tax services, which the Company’s external auditors are to perform.
During 2003, the Audit Committee implemented specific procedures regarding the pre-approval of services to be provided by the Company’s external auditors. These procedures specify certain prohibited services that are not to be performed by the Company’s external auditors. In addition, these procedures require that, at least annually, prior to the period in which the services are proposed to be provided, the Company’s management, in conjunction with the Company’s external auditors, prepares and submits to the Audit Committee a complete list of all proposed services and related fees to be provided to the Company by the Company’s external auditors. Under the Audit Committee pre-approval procedures, for those non-audit services proposed to be provided by the Company’s external auditors that have not been previously approved by the Audit Committee, the Audit Committee has delegated to the Chairman of the Audit Committee, and to management up to a fixed value, the authority to grant pre-approvals of such services. The decision to pre-approve a service covered under this procedure is presented to the full Audit Committee at the next scheduled meeting. At each of the Audit Committee’s regular meetings, the Audit Committee is provided with an update as to the status of services previously approved.
Pursuant to these procedures since their implementation in 2003, 100% of each of the services relating to fees reported as audit-related, tax and all other were pre-approved by the Audit Committee or its delegate, the Chair of the Audit Committee, or management within its delegated authority.
The full text of the terms of reference for the Company’s Audit Committee follows.
62
TERMS OF REFERENCE
Audit Committee
Mission Statement
The Audit Committee’s mission is to assist the Board in fulfilling its obligations by overseeing and monitoring the Corporation’s financial accounting and reporting process and the integrity of the Corporation’s financial statements and its internal control over financial reporting and the external financial audit process. To fulfil this mission, the Audit Committee has received this mandate and has been delegated certain authorities that it may exercise on behalf of the Board.
Composition
At the first meeting of the Board of Directors of the Corporation after the election of Directors at the annual meeting of shareholders (or a shareholder resolution in lieu thereof), the Board shall appoint an Audit Committee comprised of not less than three Directors of the Corporation. Each member of the Audit Committee shall be independent and all members of the Audit Committee shall have an appropriate level of financial literacy, all as required under applicable securities laws and determined by the Board from time to time. The Board may replace or remove from the Audit Committee any member at any time.
The Chair of the Audit Committee shall be appointed by the Board at the meeting of the Board referred to above. The Chair shall preside as chair at each Committee meeting, lead Committee discussion on meeting agenda items and report to the Board, on behalf of the Committee, with respect to the proceedings of each Committee meeting. The Audit Committee shall designate a Secretary to the Audit Committee who may be a member of the Audit Committee or an officer or employee of the Corporation. The Secretary shall keep minutes and records of all meetings of the Audit Committee. In the event that either the Chair or the Secretary is absent from any meeting, the members present shall designate any Director present to act as Chair and shall designate any Director, officer or employee of the Corporation to act as Secretary.
Meetings
Meetings of the Audit Committee, including telephone conference meetings, shall be held at such time and place as the Chair of the Audit Committee or a majority of the Committee members may determine. In addition, at the request of the external auditor of the Corporation (the “Auditor”), the Chief Executive Officer, or the Chief Financial Officer (or persons acting in such capacity), the Chair shall call and convene a meeting of the Audit Committee.
Notice of meetings shall be given to each member not less than 24 hours before the time of the meeting, provided that meetings of the Audit Committee may be held without formal notice if all of the members are present and do not object to notice not having been given, or if those absent waive notice in any manner before or after the meeting.
Notice of meeting will be given in writing and may be delivered personally, given by mail, facsimile or other electronic communication and need not be accompanied by an agenda or any other material. The notice shall however specify the purpose or purposes for which the meeting is being held.
Fifty percent (50%) of the directors duly appointed as Committee members and in attendance shall constitute a quorum for the transaction of business at any meeting of the Audit Committee. No business may be transacted by the Audit Committee except at a meeting of its members at which a quorum of the Audit Committee is present.
The Audit Committee shall meet at least quarterly.
Representatives of the Auditor and management of the Corporation shall have access to the Audit Committee each in the absence of the other.
The Auditor shall be notified of all meetings of the Audit Committee and, when appropriate, it may attend and be heard at any such meeting and shall attend if requested to do so by a member of the Audit Committee.
Any matter the Audit Committee does not unanimously approve will be referred to the Board for consideration.
63
Amendments
No alteration to the roles and responsibilities of the Audit Committee shall be effective without the approval of the Board of Directors.
The Audit Committee shall review the adequacy of these Terms of Reference on an annual basis and recommend any changes it considers appropriate to the Board of Directors for consideration and approval.
Role and Responsibilities
A. Financial Statements and Other Financial Information
The Audit Committee shall oversee the Corporation’s financial reporting process on behalf of the Board and report on the results of these activities to the Board including:
1. review the Corporation’s interim and annual financial statements and management’s discussion and analysis of operations which accompanies such financial statements and, if determined to be satisfactory, in the case of the interim documents, approve them, and in the case of the annual documents, recommend them to the Board for approval;
2. review the interim and annual earnings press release prior to their filing or publication;
3. ensure that adequate procedures are in place for the review of the Corporation’s public disclosure of financial information extracted or derived from the Corporation’s financial statements, other than the public disclosure referred to in items 1 and 2 above, and periodically assess the adequacy of those procedures;
4. review the appropriateness of any report or opinion proposed to be rendered in connection with the year-end consolidated financial statements;
5. review the nature, substance and appropriateness of significant accruals, reserves and other estimates;
6. review the appropriateness of impairment provisions;
7. review with the Auditor and with the management of the Corporation and, if determined to be satisfactory, approve on behalf of the Board all financial statements included in a prospectus or other similar document; and
8. review and assess regularly:
(a) the quality and acceptability of accounting policies and financial reporting practices used by the Corporation;
(b) any significant new or proposed changes in financial reporting and accounting policies, practices or standards that may affect or be adopted by the Corporation;
(c) the key financial estimates and judgments of management that may be material to the financial reporting of the Corporation;
(d) policies related to financial disclosure risk assessment and management;
(e) responses by management to material information requests from government or regulatory authorities which may have an impact on the financial reporting of the Corporation; and
(f) presentations given by management and the Auditor regarding the accounting treatment of large transactions.
9. appoint and, where necessary, terminate auditors of the Corporation’s pension plans, based on advice from the Pension Management Committee.
64
B. External Audit
The Auditor shall be ultimately accountable to the shareholder of the Corporation, who shall be represented by the Board of Directors and the Audit Committee in its dealings with the Auditor. The Audit Committee shall recommend to the Board the auditor that will be proposed at the annual shareholders’ meeting (or shareholder resolution in lieu thereof) for appointment as the Auditor for the ensuing year. The Auditor shall report directly to the Audit Committee, which shall be responsible for compensation and retention of the Auditor and oversight of the Auditor’s work (including resolution of disagreements between management and the Auditor regarding financial reporting).
At least annually, the Audit Committee shall require that the Auditor provide a formal written statement describing: (i) the firm’s internal quality-control procedures; (ii) any material issues raised by the most recent internal quality control review, or peer review, of the firm, or by any inquiry or investigation by governmental or professional authorities, within the preceding five years, respecting one or more independent audits carried out by the firm, and any steps taken to deal with any such issues; and (iii) all relationships between the Auditor and the Corporation (see also section D).
With respect to (iii) above and for more clarity, annually the Audit Committee shall obtain a written letter from the Auditor pursuant to the Independence Standards Board standard #1 disclosing all relationships between the Auditor and its related entities and the Corporation and its related entities, and confirming the Auditor’s independence from the Corporation.
The Audit Committee shall not recommend to the Board that an auditor be appointed as the Auditor if the Corporation’s Chief Executive Officer, Chief Financial Officer or Controller (or persons acting in that capacity) was employed by the auditor and participated in any capacity in the Corporation’s audit during the one-year period preceding the date of the initiation of the Corporation’s audit for which the Audit Committee is recommending the appointment. The Audit Committee shall review management’s policies for hiring partners, employees and former partners and employees of the Auditor and former external auditor of the Corporation. The Audit Committee further shall ensure the independence of the Auditor by reviewing, and discussing with the Board if necessary, any relationships that may adversely affect the independence of the Auditor.
The Audit Committee shall review the planning and results of external audit activities and the ongoing relationship with the Auditor. In this regard the Audit Committee shall:
1. review and, if determined to be satisfactory, pre-approve the terms of the annual external audit engagement plan, including but not limited to the following:
(a) engagement letter;
(b) objectives and scope of the external audit work;
(c) materiality limit;
(d) areas of audit risk;
(e) staffing;
(f) timetable; and
(g) proposed fees (which for clarity, shall include “component auditor” fees related to the financial disclosures of the Corporation’s ultimate shareholder).
2. annually, or as otherwise required by the Audit Committee, review a written report from the Auditor on the critical accounting policies of the Corporation;
3. review and, if determined to be satisfactory, pre-approve all non-audit services, including tax services, the Auditor is to perform, and it shall consider the impact the provision of such services could have on the independence of the external audit work. The Audit Committee may delegate this authority to grant pre-approvals to one or more designated members of the Audit Committee, provided that such delegates present their decisions to pre-approve services to the full Audit Committee at each of its scheduled meetings. The Audit Committee shall not permit the Auditor to perform any non-audit service prohibited by law applicable to the Corporation;
4. meet with the Auditor and management to discuss the Corporation’s annual financial statements and the Auditor’s report, the interim financial statements, and management’s discussion and analysis relating to both the annual and
65
interim financial statements. Meetings with the Auditor and management shall be held separately, periodically, as scheduled by the Audit Committee;
5. review and advise the Board with respect to the conduct and reporting of the annual external audit, including but not limited to the following:
(a) any audit problems or difficulties encountered, and management’s response thereto, and any restriction imposed by management during the annual audit;
(b) any significant accounting or financial reporting issue;
(c) the Auditor’s evaluation of the Corporation’s system of internal controls and related procedures and documentation;
(d) the post audit or management letter containing any of the Auditor’s findings or recommendations, including management’s response thereto and the subsequent follow-up to any identified control weaknesses; and
(e) any other matters that the Auditor brings to the attention of the Audit Committee.
6. prepare an Audit Committee report to be included in the Corporation’s annual corporate governance disclosure; and
7. fix the remuneration of the Auditor, including component auditor fees as noted in item 1(g) above.
C. Internal Audit
The Audit Committee shall oversee the internal audit function of the Corporation and the relationship of the internal auditor with management. Periodically, the Audit Committee shall meet separately with each of the internal auditor and management. To this end, the Audit Committee shall:
1. review and consider the appropriateness of the internal audit function and organizational framework, including approving the internal audit plan and resources;
2. review and approve the internal audit charter if and as appropriate;
3. be involved in the appointment or removal of the lead internal auditor for the Corporation;
4. support the independence of the internal audit function and the internal auditor; and
5. review the findings of the internal auditor for purposes of considering the appropriateness of follow-up plans
D. Internal Financial Control and Information Systems
The Audit Committee will review and obtain reasonable assurance that the internal financial control and information systems are operating effectively to produce accurate, appropriate and timely financial information. In this regard the Audit Committee will:
1. obtain reasonable assurance by discussions with and reports from management, the internal auditor and the Auditor, that:
(a) the internal financial control information systems, security of information and disaster recovery plans are adequate and reliable; and
(b) the internal control systems and procedures are properly designed and effectively implemented.
2. review the appointment of the Chief Financial Officer (or person acting in that capacity) prior to his or her appointment and the adequacy of accounting and finance resources, as required; and
3. ensure that direct and open communication exists among the Audit Committee and the Auditor and, if requested, with the internal audit organization of the Corporation’s ultimate shareholder.
66
E. Financial Risk Oversight, Insurance
The Audit Committee shall discuss with management the Corporation’s material financial risk exposures and review the steps management has taken to monitor, control, report and mitigate such risk to the Corporation. The Audit Committee will also consider insurance coverage of significant business risks and uncertainties.
F. Subsidiaries
The Audit Committee shall receive a report on the Corporation’s material Subsidiaries, as requested from time to time, concerning any material non-routine structures e.g. special purpose entities, off balance sheet items or partnership arrangements.
G. Tax
The Audit Committee shall receive regular reports from management on the status of tax filings including:
(a) the status of accounts for withholdings from employees and remittances of source deductions, as well as any required remittances for sales taxes and excise duty;
(b) confirmation that returns, withholdings and remittances have been made during relevant periods; and
(c) if applicable, major associated issues.
H. Legal
The Audit Committee shall receive periodic reports from the General Counsel (or person acting in that capacity) on legal matters affecting financial disclosure, including claims, potential claims and changes to legislation.
I. Investigations and Access to Management
The Audit Committee shall have the authority to direct and to supervise the investigation into any matter brought to its attention within the scope of its duties. It shall establish procedures for the receipt, retention and treatment of (i) complaints the Corporation may receive regarding accounting, internal accounting controls, or auditing matters, and (ii) confidential, anonymous submissions from Corporation employees expressing concern regarding questionable accounting or auditing matters.
The Audit Committee has the authority to engage independent counsel and other advisers having special competencies, as it determines necessary to carry out its duties. The Audit Committee shall determine the appropriate amount of funding the Corporation shall provide for compensation of any such advisors.
In carrying out its responsibilities, the Audit Committee shall have access to such members of the Corporation’s management as appropriate, including the persons having responsibility for:
(d) foreign currency and interest rate exposure and related derivatives;
(e) tax exposures and related reserves;
(f) internal financial control systems security and system integrity recovery plans;
(g) compliance with domestic and international regulatory requirements (such as the Corruption of Foreign Public Officials Act and Foreign Corrupt Practices Act) and material legal exposures; and
(h) financial accounting.
The Audit Committee shall receive from management copies of any report or inquires of a material nature from regulators or government bodies which is relevant to the responsibilities of the Audit Committee set out in this mandate and of management’s responses thereto.
67
J. General
The Audit Committee shall review corporate policies that are within the scope of the roles and responsibilities specified by these terms of reference prior to submission for approval by the Board; monitor compliance on a regular basis; and ensure these policies are periodically reviewed and kept current.
The Audit Committee shall perform such other duties as may be assigned to it by the Board from time to time or as may be required by applicable law.
With respect to matters within its purview under this mandate and delegation, the Audit Committee shall assist the Board in its oversight of the Corporation’s compliance with legal and regulatory requirements.
The Audit Committee shall report to the Board at each regularly scheduled Board meeting next succeeding any Committee meeting.
The Audit Committee shall evaluate its own performance annually.
68
SCHEDULE C — CORPORATE GOVERNANCE
CORPORATE GOVERNANCE DISCLOSURE
This Schedule describes the Company’s corporate governance framework, including the structures and processes regarding the direction, management and oversight of the Company.
Background
Repsol Transaction
The Repsol Transaction was completed on May 8, 2015. The effect of the transaction was that all equity voting securities of the Company were held by a single shareholder, and the Company became an indirect wholly-owned subsidiary of Repsol. The disclosure in this Schedule reflects the Company’s approach to corporate governance practices as both a reporting issuer and a wholly-owned subsidiary.
Corporate Governance Changes in 2016
The corporate governance framework instituted at closing of the Repsol Transaction continued through 2016. In May 2016, the Board determined to reduce the size of the Board by two members and, as a result, only seven directors were nominated for re-election. The sole shareholder subsequently approved the election of those seven directors in May 2016.
Corporate Governance Principles
Code of Ethics and Business Conduct and Ethics Channel
The Company maintains a Code of Ethics and Business Conduct (previously defined as the CEBC) and an Ethics Channel, both of which are described in the “Social, Safety and Environmental Policies” section of this Annual Information Form.
ROGCI Disclosure Standard
In July 2016, the Board of Directors of the Company approved the adoption of the Repsol Group Internal Conduct Regulations regarding the Securities Market, as well as the adoption of a ROGCI specific and supplemental disclosure standard (the “ROGCI Disclosure Standard”). The ROGCI Disclosure Standard applies to officers, directors, and employees of ROGCI and its subsidiaries, as well as third parties who represent the Company and its subsidiaries. The objectives of the ROGCI Disclosure Standard are to: (1) ensure compliance with all applicable legal and regulatory requirements relating to disclosure; (2) ensure that the Company broadly disseminates information, when necessary, in a timely manner in order to keep security holders and capital markets appropriately informed regarding the Company; (3) prevent improper use or disclosure of material information and to give guidance on dealing with other confidential information pertaining to the Company; (4) raise awareness of disclosure requirements and the Company’s approach to disclosure; and (5) provide guidance concerning communicating corporate information to industry analysts, members of the media and debt holders. Pursuant to the ROGCI Disclosure Standard, a Disclosure Committee has been constituted and is comprised of members of senior management of the Company. In addition, ongoing disclosure training is provided to targeted groups within the Company. The Disclosure Standard also provides guidance on the delineation of internal responsibilities as it applies to ROGCI public disclosure.
Role of the Board and its Committees
Board Roles and Responsibilities
The principal role of the Board is stewardship of the Company and its fundamental objective is the creation of shareholder value, including the protection and enhancement of the value of the Company’s assets. The Board’s stewardship responsibility means that it oversees the conduct of the business and management, which is responsible for conducting the Company’s day-to-day business. The Board, through senior management of the Company, sets the attitude and disposition of the Company toward compliance with applicable laws, environmental, safety and health policies, financial practices and reporting. In addition to its accountability to its shareholder, the Board is also accountable to employees, government authorities and other stakeholders.
The Board has developed and approved Terms of Reference for the Board which are reproduced in their entirety in Appendix “A” to this Schedule, and which are reviewed on an annual basis.
69
Position Descriptions
The Board has developed and approved written position descriptions for the Chairman of the Board, the CEO and the Audit Committee Chair.
Chairman of the Board
The principal role of the Chairman of the Board is to manage and provide leadership to the Board. The Chairman is accountable to the Board and acts as a direct liaison between the Board and management of the Company through the CEO. In addition, the Chairman acts as a communicator for Board decisions where appropriate. The Chairman’s mandate directs him to ensure that there is opportunity for the directors to hold discussions without management present at each Board meeting, and he presides at such sessions.
Chief Executive Officer
The CEO is responsible for leading the development and execution of the Company’s long term strategy with a view to creating shareholder value. The CEO acts as a direct liaison between the Board and management. The CEO is accountable to the Board.
Audit Committee Chair
The Chair of the Audit Committee leads committee discussion on meeting agenda items and reports to the Board, on behalf of the Committee, with respect to the proceedings of each committee meeting. The Chair of each Committee also reviews agendas, work plans and, as appropriate, substantive agenda items with members of management prior to each committee meeting.
Independence Determinations — Directors
Pursuant to National Instrument 58-101 (“NI 58-101”) and NI 52-110, the Board of Directors has determined that each of Michael T. Waites, Thomas W. Ebbern and Albrecht W.A. Bellstedt is “independent”. Each of Josu Jon Imaz San Miguel, Luis Cabra Dueñas, Miguel Klingenberg Calvo and F. Javier Sanz Cedrόn is not “independent” pursuant to NI 58-101 because they are employees of the Company’s ultimate shareholder, Repsol. In addition, Luis Cabra Dueñas serves as CEO of the Company.
The Chairman of the Board, Josu Jon Imaz San Miguel, is not “independent” as noted above.
Independence Determinations — Audit Committee
The Audit Committee of the Board, including the Committee Chair, is currently composed entirely of independent directors.
Other and Interlocking Directorships
Certain directors of the Company serve as directors of other reporting issuers. The Board has not adopted a formal policy limiting the number of outside directorships of the Company’s directors.
In Camera Sessions
The Chairman of the Board is required to ensure that, regularly, upon completion of the ordinary business of a meeting of the Board, the directors have an opportunity to hold discussions without management present. For the period January 1 to December 31, 2016 the Board of Directors held two in camera sessions without management present. The non-independent directors were included in these sessions.
The Audit Committee, which is comprised entirely of independent directors, also holds in camera sessions without management present at least at the end of each regularly scheduled meeting. The Audit Committee also holds private sessions with each of the external auditor, the Director, Audit & Control, North America, and the Chief Financial Officer following each regularly scheduled committee meeting. During 2016, the Audit Committee held five in camera sessions which included non-independent directors who were present at the Audit Committee meetings.
70
Director Attendance
Board members are expected to attend Board meetings and meetings of Committees on which they are a member. The following sets forth the attendance record of each director for the period January 1 to December 31, 2016.
Director | | 2016
Board Meetings
Attended | | 2016
Committee
Meetings
Attended | | 2016 Combined
Board
and Committee
Meetings
Attended | |
Albrecht W.A. Bellstedt | | 5 / 5 | | 7 / 7 | | 12 / 12 | |
Luis Cabra Dueñas 2 | | 5 / 5 | | | | 5 / 5 | |
Thomas W. Ebbern | | 5 / 5 | | 7 / 7 | | 12 / 12 | |
M. Tomás García Blanco 1,2,4 | | 0 / 2 | | | | 0 / 2 | |
Josu Jon Imaz San Miguel 2 | | 5 / 5 | | | | 5 / 5 | |
Miguel Klingenberg Calvo 2 | | 5 / 5 | | | | 5 / 5 | |
Robert R. Rooney 2,3 | | 1 / 1 | | | | 1 / 1 | |
F. Javier Sanz Cedrόn 1,2 | | 4 / 5 | | | | 4 / 5 | |
Michael T. Waites | | 5 / 5 | | 7 / 7 | | 12 / 12 | |
(1) Due to schedule conflicts, Mr. Sanz Cedrόn could not attend one regularly scheduled Board meeting and Mr. Garcia Blanco could not attend two regularly scheduled Board meetings.
(2) Not a member of the Audit Committee.
(3) Mr. Rooney resigned from the Board of Directors on May 1, 2016. The number of meetings attended reflects the number of meetings held from January 1 to May 1, 2016.
(4) Mr. Garcia Blanco did not stand for re-election to the Board of Directors in May 2016. The number of meetings attended reflects the number of meetings held from January 1 to May 19, 2016.
Director Orientation and Continuing Education
The Company is committed to ensuring its directors have the skills and knowledge necessary to meet their obligations as directors through director orientation sessions and continuing education sessions. In 2016, there were no new directors and, as such, no director orientation sessions were held.
The Board of Directors held its February 2016 meeting at the offices of Repsol in Madrid, Spain to provide the independent directors with an opportunity to learn about Repsol and to provide them with opportunities to meet additional personnel. During the February visit, the independent directors of the Company toured Repsol’s Technology Center to learn about the research and development activities supporting upstream operations in the Company. In addition, the Chair of the Company’s Audit Committee attended and presented at a Repsol Audit Committee meeting. Throughout the year, the Board of Directors was provided with informational papers and materials on matters impacting ROGCI, including new legislation or reports.
Individual Board members may also pursue educational opportunities independently, including attendance at industry conferences and subscriptions to industry publications.
The Audit Committee also regularly receives informational papers from management and the Company’s external auditor on trends and issues related to their mandate as part of their Audit Committee mailings.
Nomination of Directors
The Company’s director nomination process is led by the Company’s ultimate shareholder and takes into account both the legal and regulatory requirements applicable to the Company as well as the internal regulations of Repsol with respect to subsidiary director appointments. Each director candidate is reviewed against his or her specific experiences and perspectives to assess his or her potential effectiveness as a director. For the composition of the Board following completion of the Repsol Transaction, Repsol determined that the ideal mix of skills and experience of the Company’s Board of Directors should be comprised of: individuals with executive or senior management experience in the Repsol group of companies, and particularly, those individuals who continued to sponsor integration and transformation initiatives post acquisition; individuals with operational experience in Repsol’s upstream division; and independent directors with financial acumen and prior experience in the oil and gas industry.
The Corporate Secretary reviews all existing and future commitments of each candidate, including other directorships, to determine: (a) if they impact a candidate’s independence or pose a potential conflict of interest; and (b) whether there are interlocking directorships.
71
Diversity
The Company has not adopted a written policy relating to the identification and nomination of women directors, given the broader focus on diversity of its ultimate parent Repsol, as noted below. With respect to the representation of women in the director identification and selection process and executive officer appointments, a nominee or candidate’s diversity of gender, ethnicity, nationality, age, experience and geographic background or other attributes will be considered favorably in his or her assessment.
Similarly, the Board has not adopted a target regarding women on the Board or women in executive officer positions. Currently, none of the Company’s Board members are women, and neither the Company nor its major subsidiaries have any women on their respective executive leadership teams.
The Company’s approach to diversity generally will be reviewed as part of the integration efforts with Repsol. In this regard, Repsol has principles on diversity which state that diversity is a source of added value for the global company, and that variety in terms of age, culture, professional profile, gender and different abilities contributes to the fostering of a culture of diversity, which in turn feeds off different and innovative ideas and perspectives. Repsol recently approved a Diversity and Work-life Balance Committee, whose mandate is to promote sustained growth by flexibly managing diverse talent through a number of initiatives, including those supporting gender and equity and providing flexible workplaces. It is expected that integration of the Company’s legacy talent management model with Repsol’s global programs will be required to comply with Repsol’s approach to diversity. Similarly, the Board Succession Policy in place prior to the closing of the Repsol Transaction (which contains term limits and commitments to diversity) will be re-examined as appropriate in support of the larger global initiative.
Performance Assessments
The Chairman of the Board, with the assistance of the CEO and the Corporate Secretary, is required to review and assess annually director attendance, performance, and the size and composition of the Board. The Chairman of the Board, with the assistance of the CEO and Corporate Secretary, is also required to assess and make recommendations to the Board annually regarding the effectiveness of the Board as a whole, the committees of the Board and when and as applicable, individual directors.
To assist in this review, all directors are provided with a questionnaire that provides for ratings in key areas and seeks subjective comment on the performance and effectiveness of the Board and the Audit Committee. Suggestions for improvement and for director education and training activities are also requested from all directors. The responses to the questionnaires are reviewed and an action list is developed by the Corporate Secretary for review by the CEO and Chairman of the Board. The Chairman briefs the directors on the summary results of the assessment at the conclusion of the process.
Board Committees
The Board fulfils its role, to act in the best interests of the Company, directly and through committees to which it delegates certain responsibilities.
As a reporting issuer, the Company has an established Audit Committee. This standing Committee of the Board convenes in accordance with an annually developed schedule. The following describes the composition, responsibilities and key activities of this standing Committee.
Audit Committee Report
The Audit Committee is responsible for assisting the Board in fulfilling its obligations by overseeing and monitoring the Company’s financial accounting and reporting process. It is also responsible for overseeing and monitoring the integrity of the Company’s financial statements, its internal control over financial reporting and the external financial audit process, evaluating the independence of the Company’s auditor and overseeing the Company’s internal audit function. In fulfilling its responsibilities, the Audit Committee meets regularly with the internal and external auditors and management. The Terms of Reference of the Audit Committee require that each member be independent and, as such, all members of the Audit Committee are unrelated, independent directors.
The Audit Committee is committed to compliance with all applicable accounting policies, procedures and related controls. In accordance with the requirements of the US Securities Exchange Act of 1934, as amended, and NI 52-110, the Audit Committee has adopted procedures for (a) the receipt, retention, and treatment of complaints received by the Company
72
regarding accounting, internal accounting controls or auditing matters; and (b) the confidential, anonymous submission by employees of the Company of concerns regarding questionable accounting or auditing matters.
Members in 2016 and to the date of this Annual Information Form are:
Michael T. Waites (Chair)
Thomas W. Ebbern
Albrecht W. A. Bellstedt
All Committee members are financially literate. Additional information on the Company’s Audit Committee, including the Terms of Reference for the Audit Committee, a description of Audit Committee members’ education and experience, and a summary of external auditor fees is contained in Schedule B to this Annual Information Form.
73
APPENDIX A — TERMS OF REFERENCE — BOARD OF DIRECTORS
Role and Responsibilities
The principal role of the Board of Directors (the “Board”) is stewardship of the Corporation with the creation of shareholder value, including the protection and enhancement of the value of its assets, as the fundamental objective. The stewardship responsibility means that the Board oversees the conduct of the business and management, which is responsible for the day-to-day conduct of the business. The Board must assess and ensure systems are in place to manage the risks of the Corporation’s business with the objective of preserving the Corporation’s assets. The Board, through senior management of the Corporation, sets the attitude and disposition of the Corporation towards compliance with applicable laws, environmental, safety and health policies, financial practices and reporting. In addition to its primary accountability to its shareholder, the Board is also accountable to employees, government authorities and other stakeholders.
Composition
The Board of Directors is elected annually by the Corporation’s shareholder and consists of that number of Directors, as determined from time to time by the Corporation’s shareholder. The number of Directors to be elected is currently set at seven. While the election of directors is ultimately determined by the Corporation’s shareholder, it is the policy of the Board that at least three Directors be independent (as defined under applicable securities laws).
The Chairman of the Board presides as Chair at all meetings of the Board. In the event the Chairman of the Board is unable to attend a meeting, the Vice-Chairman and CEO shall preside as Chair. In the absence of the Chairman of the Board and the Vice-Chairman and CEO, the Vice-Chairman, or any other director shall preside as Chair of a meeting. The Corporate Secretary or, in the absence of the Corporate Secretary, an Assistant Corporate Secretary an officer or employee of the Corporation, attends all meetings of the Board and records the proceedings thereof. The Corporate Secretary prepares and keeps minutes and records of all meetings of the Board.
Meetings
Meetings of the Board of Directors, including telephone conference meetings, are to be held at such time and place as the Chairman of the Board or a majority of the Directors may determine. Notice of meetings shall be given to each Director not less than 48 hours before the time of the meeting. Meetings of the Board of Directors may be held without formal notice if all of the Directors are present and do not object to notice not having been given, or if those absent waive notice in any manner before or after the meeting. In addition, each newly elected Board may, without notice, hold its first meeting immediately following the meeting or resolution of shareholders at which such Board was elected.
Notice of meeting will be given in writing and may be delivered personally, given by mail, facsimile or other electronic communication and need not be accompanied by an agenda or any other material. The notice shall however specify the purpose or purposes for which the meeting is being held.
Subject to the requirements of the Canada Business Corporations Act requiring resident Canadian directors to be present at any meeting of the Board, fifty percent (50%) of the directors then in office and in attendance shall constitute a quorum for the transaction of business at any meeting of the Board. No business may be transacted by the Board of Directors except at a meeting of its members at which a quorum of the Board of Directors is present.
Each Board member is expected to attend Board meetings and meetings of committees of which he or she is a member and to become familiar with deliberations and decisions as soon as possible after any missed meetings. In that regard, members of the Board are expected to prepare for Board (and committee) meetings by reviewing meeting materials distributed to members of the Board, to the extent feasible, in advance of such meetings. Matters of a confidential or sensitive nature may be discussed at Board (or committee) meetings without advance distribution of meeting materials to members of the Board. It is expected that members of the Board will actively participate in Board meetings.
The independent Directors shall have the opportunity to hold separate in camera discussions upon completion of all meetings of the Board.
A resolution in writing signed by all the Directors entitled to vote on that resolution at a meeting of the Directors is as valid as if it had been passed at a meeting of the Directors. A copy of any such resolution in writing is kept with the minutes of the proceedings of the Directors.
74
At meetings of the Board, any matter requiring a resolution of the Directors is decided by a majority of the votes cast on the question.
Amendments
No alteration to the roles and responsibilities of the Board of Directors shall be effective without the approval of the Board of Directors.
The Board of Directors shall review the adequacy of these Terms of Reference and that of its Committees on an annual basis.
Compensation
Only non-employee Directors shall receive remuneration for their service as Directors.
Non-Delegable Responsibilities
Pursuant to the Canada Business Corporations Act (the “Act”), various matters are considered of such importance so as to warrant the attention of all Directors and, accordingly, the Act prescribes that such matters either cannot be delegated or may only be delegated in a qualified or partial manner:
1. the submission of items to the Corporation’s shareholder or ultimate shareholder for its approval;
2. the filling of a vacancy among the directors or in the office of the external auditor;
3. the appointment of additional directors;
4. the issue of securities;
5. the declaration of dividends;
6. the purchase, redemption or other acquisition of the Corporation’s own shares;
7. the payment of certain commissions prescribed by the Act;
8. the approval of annual financial statements; and
9. the adoption, amendment or repeal of by-laws.
Primary Responsibilities
The principal responsibilities of the Board required to ensure the overall stewardship of the Corporation are as follows:
1. the Board must approve, on an annual basis, the Corporation’s business and financial plans, as well as the annual capital expenditure programs which take into account, among other things, the opportunities and risks of the Corporation’s business;
2. the Board must ensure that processes are in place to enable it to monitor and measure management’s performance in achieving the Corporation’s stated objectives.
3. the Board shall satisfy itself as to the business and professional integrity of the executive officers and that the executive officers create a culture of integrity throughout the Corporation;
4. the Board must ensure that the necessary internal controls and management systems are in place that effectively monitor the Corporation’s operations and ensure compliance with applicable laws, regulations and policies;
5. the Board must monitor compliance with the Corporation’s Code of Business Conduct and Ethics;
6. the Board must ensure that processes are in place to properly oversee Corporation sponsored pension plans; and
75
7. the Board must ensure that the Corporation has appropriate processes in place to effectively communicate with employees, government authorities and other stakeholders.
Typical Board Matters
The following is not an exhaustive list but typifies matters generally considered by the Board in fulfilling its responsibility for stewardship of the Corporation. The Board may determine it appropriate to delegate certain of these matters to committees of the Board:
1. appointment of officers;
2. considering the appropriate size of the Board, with a view to facilitating effective decision-making;
3. determining the number of directors and recommending nominees for election by the shareholder;
4. adopting a process to consider and assess the competencies and skills of each Board member and the Board as a whole;
5. determining the remuneration of directors and external auditors;
6. reviewing and recommending to its shareholder, changes to capital structure;
7. overseeing the overall health, safety, and environmental (“HSE”) performance of the Corporation, the Corporation’s risk management and strategies with respect to HSE and monitoring the tactical systems and processes that support the HSE strategies;
8. approving banking, borrowing and investment policies;
9. approving ethics policies or other corporate policies consistent with that of its ultimate shareholder;
10. determining dividend policy;
11. developing the Corporation’s approach to corporate governance including, without limitation, developing a set of corporate governance principles and guidelines;
12. appointing members to committees of the Board of Directors and approving terms of reference for and the matters to be delegated to such committees;
13. granting any waivers from the Corporation’s Code on Business Conduct and Ethics for the benefit of the Corporation’s directors or executive officers;
14. granting and delegating authority to designated officers and employees including the authority to commit capital, open bank accounts, sign bank requisitions and sign contracts, documents and instruments in writing;
15. approving the funding policy for the Corporation’s defined benefit pension plans, including decisions related to surplus withdrawals and contribution holidays;
16. reviewing and approving amendments to the terms and conditions of the registered and non-registered pension plans maintained by the Corporation (other than amendment that are of an administrative nature, which are within the purview of People & Organization), including ad hoc adjustments to pensions, and to consider any proposals submitted by management for the amendment of these plans;
17. reviewing any global compensation programs designed by the Corporation’s ultimate shareholder which are applicable to employees of the Corporation, and delegating authority to one or more employees of the Corporation to implement any annual allocations thereunder. In the event that the Corporation adopts any compensation plan involving equity or equity like securities of the Corporation, formal approval of such plan shall be required by the Board of Directors; and
76
18. approving the acquisition or disposition of significant corporate assets, and to consider any significant disposition or series of dispositions against any applicable contractual covenants.
Reserves Data And Other Oil And Gas Information
The Board shall:
1. annually consider whether the involvement of an independent “Qualified Reserves Evaluator/Auditor” is necessary to achieve the desired quality and reliability of reserves data disclosure. The Board shall review management’s appointment of one or more Qualified Reserves Evaluator/Auditors, whether independent or not. In the case of any proposed change in such appointment, the Board shall determine the reasons for the proposal and whether there have been disputes between the Qualified Reserves Evaluator/Auditor and management;
2. review, with reasonable frequency, the Company’s procedures relating to the disclosure of information with respect to oil and gas activities, including its procedures for complying with applicable disclosure requirements and restrictions contained in National Instrument 51-101 (“NI 51-101”);
3. review, with reasonable frequency, the Company’s procedures for providing information to the Qualified Reserves Evaluator/Auditor who reports on reserves data;
4. meet with management and the Qualified Reserves Evaluator/Auditor to:
(a) determine whether any restrictions affect the ability of the Qualified Reserves Evaluator/Auditor to report on reserves data without reservation; and
(b) review the reserves data and the report of the Qualified Reserves Evaluator/Auditor; and
5. as required by applicable law, review and approve:
(a) the content and filing of the Company’s statements of reserves data and other information required by Form 1 of NI 51-101;
(b) the filing of reports of the Qualified Reserves Evaluator/Auditor on Form 2 of NI 51-101; and
(c) the content and filing of reports of management and Directors on Form 3 of NI 51-101;
The Qualified Reserves Evaluator/Auditor shall have access to the Board of Directors. Meetings with the Qualified Reserves Evaluator/Auditor may be held separately, as requested by the Board of Directors.
Board Committees
The Board of Directors has the authority to appoint a committee or committees of the Board and may delegate powers to such committees (with the exceptions prescribed by the Act). The matters to be delegated to committees of the Board and the constitution of such committees are assessed annually or more frequently as circumstances require. The following committees are ordinarily constituted:
1. the Audit Committee, to deal with financial reporting and control systems.
Pension Management Committee
The Board of Directors has the authority to establish a Pension Management Committee, comprised of officers of the Corporation, to deal with employee pension plans and related matters and may delegate powers to such committee (with the exceptions prescribed by the Act). The members of the Pension Management Committee will be appointed following a recommendation from the Corporation’s shareholder. The matters to be delegated to the Pension Management Committee and the constitution of such committee are assessed annually or more frequently as circumstances require.
77
SCHEDULE D — EXECUTIVE COMPENSATION
COMPENSATION DISCUSSION AND ANALYSIS
This Compensation Discussion & Analysis (“CD&A”) describes ROGCI’s executive compensation programs and overall approach to executive compensation. The current Executive Director, North America, and Vice President Finance, Treasurer and Chief Financial Officer, are collectively referred to herein as “Executive Officers”. The former Senior Vice President, Finance, Treasurer and Chief Financial Officer qualifies as an NEO (as defined below) and is referred to herein as the “Former Executive Officer”. Specifically discussed in the CD&A is the compensation for the following Named Executive Officers (“NEOs”):
· Luis Cabra Dueñas, Chief Executive Officer (“CEO”);
· John Rossall, Executive Director, North America;
· David Charlton, Vice President Finance, Treasurer and Chief Financial Officer (appointed on April 1, 2016); and
· David Newby, Former Senior Vice President, Finance, Treasurer and Chief Financial Officer (employment ended on March 3, 2016).
For the purposes of this CD&A, “executive compensation” means base salary, short-term and long-term incentives, benefits (including post-employment benefits and change of control provisions), and other compensation, which are all reported in Canadian dollars.
Mr. Cabra’s compensation details have not been disclosed in this document, as he is not paid directly by ROGCI. Mr. Cabra also serves as Executive Managing Director, of Exploration and Production of Repsol and as such, his compensation is tied to his performance in that capacity.
Integration of Repsol Compensation Program
ROGCI has adopted Repsol’s total compensation philosophy which is designed to facilitate the attraction, retention, motivation and commitment of the professionals who contribute their talent to ROGCI. It is focused on promoting both the performance and recognition of individual merit as well as collective cooperation and effort, while still ensuring external competitiveness and internal equity within a global environment.
2016 is the first year that ROGCI has adopted Repsol’s global short-term incentive and long-term incentive plans. These changes are detailed under the headings “2016 Short-Term Incentives” and “2016 Long-Term Incentives”.
Annual Compensation Review Process
Compensation for the Executive Officers is reviewed on an annual basis, and involves a detailed review of corporate, unit, and individual performance, as well as market compensation data. The CEO of ROGCI for Mr. Rossall and the CFO of Repsol for Mr. Charlton, with support from the People & Organization function reviews base salaries, short-term incentives and long-term incentives. Compensation elements are reviewed both individually and in aggregate (that is, “total direct compensation” is considered in its entirety).
The ROGCI Board reviews compensation for all NEO’s paid by ROGCI with recommendations from Repsol as ROGCI’s ultimate shareholder. The ROGCI Board must approve any equity-based long-term incentive plans tied to ROGCI securities and reviews all other long-term incentive plans for the benefit of the NEOs.
Competitive Market Analysis
Mr. Rossall’s and Mr. Charlton’s total direct compensation has been benchmarked to positions with responsibilities similar to their current roles through consideration of the P50 and P75 market reference points at Canadian energy companies. This has been done using a variety of different revenue and production level data cuts run from a proprietary compensation database purchased from a third party compensation survey provider and provided to Repsol and ROGCI on an aggregate basis. Given the confidential nature of the data, the third party compensation survey provider cannot provide specific company names.
78
Executive Compensation Consultants
In 2015 and 2016, there were no services provided by executive compensation consultants.
Determining Executive Officer Compensation — Context for Decision-Making
Executive compensation for Executive Officers is linked to Repsol’s global performance against both strategic and operating targets. Repsol did not conduct a risk assessment on behalf of ROGCI related to NEO compensation elements in 2016.
The program is designed so that overall corporate results, unit results, as well as each Executive Officer’s individual performance, influence the final determination of executive compensation. For Mr. Rossall, the North America Regional Unit performance is considered and for Mr. Charlton, a combination of the Finance Unit, the Economics and Tax Policy Unit and the Canadian Business Unit performance is considered. Market data is also considered in determining executive compensation levels for Executive Officers. Finally, while the majority of the executive compensation program is tied to quantitative measures, there is always an element of informed judgment that is applied in determining pay outcomes.
The CEO of ROGCI for Mr. Rossall and the CFO of Repsol for Mr. Charlton finalize recommendations on all executive compensation elements at the same time that the annual financial results are reviewed. They are then reviewed by the ROGCI Board. This ensures that a holistic view of performance and compensation is taken.
Hedging
NEOs are prohibited from engaging in transactions that are designed to hedge a decrease in the market value of ROGCI securities which are held by or on behalf of that individual.
Executive Compensation Elements
The executive compensation program is a global Repsol program that was implemented by ROGCI in 2016. Base salary comprises the fixed compensation component of an Executive Officer’s total compensation. The variable compensation component of an Executive Officer’s total rewards is comprised of both short-term incentives and long-term incentives. A new short-term incentive program has been created to reward corporate, unit and individual Executive Officer performance on an annual basis and a new long-term incentive program has been implemented that is intended to reward Executive Officers for long-term performance of Repsol.
Base Salary
Base salary provides a fixed level of income to Executive Officers. When making base salary decisions, an Executive Officer’s skills, relevant experience, level of contribution to Repsol, and overall performance is assessed. Base salaries for Executive Officers are reviewed annually and, if applicable, adjustments are made in early April of each year.
Short-Term Incentive Program
Short-term incentives are a key element of executive compensation and provide a target total cash compensation opportunity at a market competitive level. The Short-Term Incentive Program (“STIP”) was reviewed in 2016 following the acquisition of ROGCI by Repsol and is designed to link an Executive Officer’s individual performance and impact on Repsol’s performance to the actual short-term incentive received.
The 2016 short-term incentive calculation is as follows:

The multiplier for the individual performance component can range from 0% to 110%; however, the top 15% of the employees in each professional group can achieve 150%. The multiplier for the unit performance component can range from 0% to 100%, and the multiplier for the corporate performance component can range from 80% to 120%. Short-term
79
incentives in respect of the current year’s performance are paid in April of the following year, based on the full year approved corporate, unit and individual performance multipliers.
The short-term incentive targets, opportunity ranges, and relative weightings for the Executive Officers were as follows:
| | 2016 Short-Term Incentives | | 2016 Weighting on Results | |
Position | | Target
(as a % of
salary earnings) | | Opportunity Range
(as a % of
salary earnings) | | Corporate/Unit1 | | Individual2 | |
Chief Executive Officer | | n/a | | n/a | | n/a | | n/a | |
Executive Director, North America | | 45 | | 0 – 59.4 | | 60 | | 40 | |
Vice President Finance, Treasurer and Chief Financial Officer | | 30 | | 0 – 39.6 | | 60 | | 40 | |
(1) Corporate is based on Repsol 2016 performance. By design, Mr. Rossall’s unit is comprised of the North America Regional Unit and Mr. Charlton’s unit as a corporate employee is comprised of a combination of the Finance Unit, the Economics and Tax Policy Unit and the Canadian Business Unit.
(2) The individual weighting is split into the “What” and “How” components (weighted at 10% and 30%, respectively for Executive Officers) where the individual performance is assessed for both what was accomplished in the year and also how it was accomplished.
2016 Short-Term Incentives
Repsol’s annual corporate performance and the Executive Officers’ annual unit and individual performance set out in the annual Executive Officers’ performance objectives determines the final STIP award payouts. In February 2017, the Executive Committee of Repsol determines and approves the final corporate score while the Executive Managing Director of each business unit determines and approves the final unit and individual scores, respectively. For Mr. Rossall and Mr. Charlton, the Executive Managing Directors are the CEO of ROGCI and the CFO of Repsol, respectively, who evaluate the unit and individual objectives of the Executive Officers against actual results achieved.
The following observations with respect to the corporate and unit objectives for 2016 were made.
Corporate Objectives and 2016 Results
For 2016, the Repsol corporate objective is measured based on the global performance of Repsol, which is linked to the 2016-2020 corporate strategy of creating value and resiliency through efficiency and portfolio management. The corporate objective is based on achieving the following:
a) An overall efficiency target in free cash flow by the end of 2016 split among upstream, downstream and corporate areas (weighted 70%); and
b) Accomplishment of the other transformation program targets of leadership, meritocracy, and control (weighted 30%).
The resulting corporate multiplier ranges from 80% to 120% according to the matrix below:
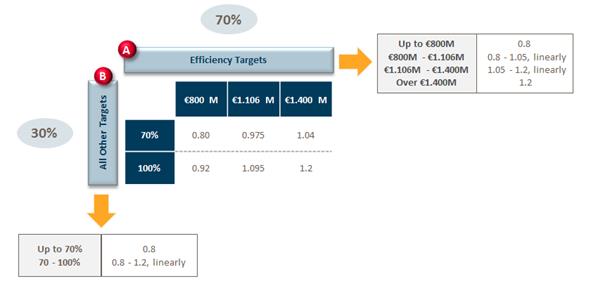
80
At the end of year, the degree of accomplishment of each objective is the following:
a) The savings of the efficiency and synergy program are more than €1.6 billion, so the degree of accomplishment is 120%; and
b) The transformation program has been implemented according to plan with a final implementation score of 90%, so the degree of accomplishment is 108%.
Taking into account both weightings, the resulting multiplier for 2016 is 116%.
Unit Objectives and 2016 results
For 2016, Mr. Rossall is evaluated based on the North America Regional Unit (100% weighted) and Mr. Charlton is evaluated based on three business units, the Finance Unit (25%), the Economics and Tax Policy Unit (25%) and the Canadian Business Unit (50%). The unit objectives are comprised of three main shared Repsol goals that are tied to efficiency, safety and environment, and people, while other objectives that also contribute to the final scores relate to business unit specific goals. The three main shared Repsol goals are defined below and must be included as objectives for all business units:
· Efficiency — improving profitability by achieving specific cost efficiency targets
· Safety and Environment — reducing Total Recordable Injury Rate and Lost Time Injury Frequency
· People — driving organizational transformation, cultural transformation and Repsol integration
The resulting unit multiplier ranges from 0% to 100%.
Executive Officers’ Performance and Compensation
John Rossall
Executive Director, North America
Mr. Rossall joined ROGCI in November, 2011 and is currently Executive Director, North America. For 2016, Mr. Rossall was responsible for the North America Regional Unit (comprised of both ROGCI and Repsol legacy assets), but does not oversee the remainder of the ROGCI perimeter assets.
At the recommendation of the CEO, a North America Regional Unit performance score of 96.25% was approved to acknowledge increasing resilience with strong efficiency indicators, CAPEX control and operations, offset partially by safety performance, mainly related to occupational and process safety. Based on Mr. Rossall’s leadership and positive impacts on global E&P initiatives, he received an individual performance score of 150%. Combining these outcomes with the corporate score of 116%, and applying the corporate/unit and individual weightings of 60%/40% resulted in a final STIP multiplier of 1.27 for Mr. Rossall. Applying this performance multiplier to Mr. Rossall’s STIP target of 45% of salary resulted in a ROGCI bonus of $315,015.
David Charlton
Vice President Finance, Treasurer and Chief Financial Officer
Mr. Charlton joined ROGCI in 2000 and in the intervening years has expanded his role progressively taking on the responsibilities of Vice President Financial Reporting and Vice President, Finance North American Operations on April 1, 2016. For 2016, Mr. Charlton was responsible for the finance, accounting and tax accounting functions of ROGCI.
At the recommendation of the CEO, a Canadian Business Unit performance score of 96.25% was approved to acknowledge that the unit exceeded its production, cost efficiency and capital expenditure targets, and met its strategy/value and people objectives, which was partially offset by safety performance that was below expectations. At the recommendation of the CFO of Repsol, a Finance Unit performance score of 94.80% was approved to acknowledge the savings in operating expenses, and improvement to financial liquidity and reporting. Also at the CFO of Repsol’s recommendation, an Economics and Tax Policy Unit performance score of 94.90% was approved to acknowledge the fulfillment of the accounting and tax integration as well as the efficiency objectives set for the year. Based on Mr. Charlton’s efforts and leadership through the integration with Repsol and the strong performance of the Canadian CFO organization, he received an individual performance score of 93%. Combining these outcomes with the corporate score of 116%, and applying the corporate/unit and individual weightings of 60%/40% resulted in a final STIP multiplier of 1.04 for Mr. Charlton. Applying this performance multiplier to Mr. Charlton’s STIP target of 30% of salary resulted in a ROGCI bonus of $78,572.
81
2016 Long-Term Incentives
Medium-Term Incentive Program (Cash-Based Awards)
In 2016, the Medium-Term Incentive Program (“IMP”) cash-based award program was implemented on a global basis by Repsol and adopted by ROGCI to replace the previous long-term incentive program that included both option-based and share-based awards. The IMP aligns rewards with Repsol performance, enhances meritocracy, and enables Repsol to retain the people needed to achieve its transformation program objectives and strategic business plan. Eligible senior level employees invited to participate in the program can receive a cash-based grant, determined as a percentage of their salary.
The IMP grant is a four-year cash-based program granted based on individual performance and potential on an annual basis at the discretion of Repsol and paid out based on individual performance and Repsol performance (known as Degree of Fulfillment of Objectives of the Program, or “DFO”). Mr. Charlton is eligible for an IMP grant between 18.75% and 56.25% of his base salary in 2016. Mr. Rossall was not eligible for an IMP grant in 2016 due to an alternative arrangement provided through a cash retention award.
The final payout is determined by the IMP granted, Repsol’s DFO as determined by the Repsol Board and the average level of individual performance during the four-year period as illustrated below:
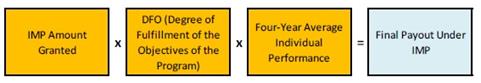
The DFO value will depend on the scale established for the achievement of the strategic objectives of the Repsol Group over the four-year period. The objectives are tied to Repsol’s upstream and downstream businesses, as well as value creation, resiliency and sustainability of the organization.
Payments will be made in April of the year following the four-year period. The award granted in 2016 would become payable in April 2020.
In April 2016, Mr. Charlton received an IMP grant but Mr. Rossall was not granted an IMP award given his existing cash retention award described below.
Retention Awards
In order to retain Mr. Rossall and Mr. Newby following the Repsol acquisition of ROGCI by Repsol, fixed cash retention awards were provided in 2015. Mr. Rossall was provided a cash retention award, a portion of which paid out in 2016 and the remaining portion will pay out in 2017. Mr. Newby was provided with a cash retention amount payable upon termination. Mr. Charlton was provided with a cash retention award in 2015 which paid out in 2016. In addition, Mr. Charlton received another cash retention award in 2016 with one-third paying out equally in 2017, 2018 and 2019.
Benefits, Savings and Pension
The Executive Officers are eligible for a benefits program offering the flexibility of making and managing their own benefit choices and creating a personal benefits program that meets their unique lifestyle requirements. Under the flexible benefit program, ROGCI provides a pool of flex credits to be used to purchase compulsory, supplemental and optional benefits, including life insurance, accidental death and dismemberment, long-term disability, supplementary medical and dental, contributions to ROGCI’s savings plan or to a health spending account. They may also contribute 5% of their annual base salary and short-term incentive to ROGCI’s savings plan, and contributions are then matched by ROGCI in the form of additional flex credits. Any unused flex credits are paid in cash as taxable earnings. Executive Officers are also eligible to participate in a contributory defined contribution pension plan.
Perquisites
Executive Officers are eligible to receive personal benefits which are not generally available to all employees. Perquisites include company parking, a corporate membership, financial services and a vehicle allowance, which remain reasonable and competitive with market practices. While perquisites generally comprise a relatively small percentage of overall total compensation, it is a prevalent market practice to maintain some level of perquisites.
82
Termination and Change of Control Benefits
Mr. Rossall has an employment contract in place with ROGCI. The employment contract contains change of control and termination provisions designed to retain Mr. Rossall in certain circumstances and promote continuity of management. The employment contract allows for the payout of severance benefits if his employment is terminated within one year following the occurrence of specified events. The practice of including change of control provisions in executive employment contracts is consistent with industry peers and is influential in attracting and retaining executive talent. Details can be found under the heading “Employment Contracts and Termination”. Mr. Rossall’s contract requires termination of employment by ROGCI following a change of control (“double-trigger”) for termination benefits to become payable. The revised contract also includes non-competition and non-solicitation provisions as well as an intellectual property provision.
Mr. Cabra does not have an employment contract with ROGCI, as he is not paid directly by ROGCI. Mr. Charlton does not have an employment contract and will follow ROGCI’s standard severance calculation in the event of a termination without cause.
EXECUTIVE COMPENSATION TABLES
The following executive compensation tables summarize, for the periods indicated, the compensation of NEOs paid by ROGCI. Figures are reported in Canadian dollars unless otherwise specified.
Summary Compensation Table
The following table contains the compensation provided to NEOs paid by ROGCI during the year in which it was earned. Cash compensation is valued at the time that it was paid, long-term incentive compensation is valued at the time that it was granted, and pension amounts are valued at their present value.
Values shown in Canadian Dollars
Named Executive
Officers | | Year | | Salary
($) | | Share-Based
Awards2
($) | | Option-
Based
Awards3
($) | | Non-Equity
Annual
Incentive Plan
Compensation4
($) | | Non-Equity
Long-Term
Incentive Plan
Compensation5
($) | | Pension
Value6
($) | | All Other
Compensation7
($) | | Total
Compensation
($) | |
Luis Cabra Dueñas 1 | | 2016 | | — | | — | | — | | — | | — | | — | | — | | — | |
Chief Executive Officer | | 2015 | | — | | — | | — | | — | | — | | — | | — | | — | |
| | 2014 | | — | | — | | — | | — | | — | | — | | — | | — | |
| | | | | | | | | | | | | | | | | | | |
John Rossall Executive Director,
North America | | 2016 | | 551,250 | | — | | — | | 315,015 | | 1,100,000 | | 28,323 | | 49,156 | | 2,043,744 | |
| 2015 | | 499,033 | | — | | — | | 249,267 | | — | | 33,845 | | 58,757 | | 840,902 | |
| 2014 | | 418,180 | | 650,005 | | — | | 252,650 | | — | | 21,443 | | 39,773 | | 1,382,051 | |
| | | | | | | | | | | | | | | | | | | |
David Charlton Vice President Finance, Treasurer and Chief Financial Officer | | 2016 | | 252,556 | | — | | — | | 253,292 | | — | | 32,097 | | 25,389 | | 563,334 | |
| 2015 | | 245,200 | | — | | — | | 101,881 | | — | | 37,470 | | 30,868 | | 415,419 | |
| 2014 | | 242,448 | | 314,483 | | — | | 96,024 | | — | | 33,600 | | 27,237 | | 713,792 | |
| | | | | | | | | | | | | | | | | | | |
David Newby Former Senior Vice President, Finance, Treasurer and Chief Financial Officer | | 2016 | | 58,333 | | — | | — | | 212,611 | | — | | 4,083 | | 1,264,847 | | 1,539,875 | |
| 2015 | | 350,000 | | — | | — | | 157,500 | | — | | 29,655 | | 41,707 | | 578,862 | |
| 2014 | | 342,530 | | 556,500 | | — | | 178,474 | | — | | 19,677 | | 35,147 | | 1,132,328 | |
(1) Mr. Cabra is not compensated by ROGCI for his role as CEO of ROGCI, as such his compensation has not been disclosed.
(2) The grant date value of global restricted share units (“GRSU”) and performance share units (“PSU”) awards under legacy Talisman Energy Inc. plans, is based on the number of units granted multiplied by the average closing price of legacy Talisman Energy Inc.’s Common Shares on the TSX for the five days immediately prior to the grant date. There were no share-based awards granted to NEOs in 2015 and 2016. The methodology used to calculate the fair value of share-based awards was chosen after reviewing market best practices.
Year
Reported | | Type of Grant | | NEO Recipients | | Grant Date | | Price | |
2014 | | PSU | | Rossall, Newby | | April 1, 2014 | | $ | 11.050 | |
| | | | | | | | | |
2014 | | GRSU | | Charlton | | April 1, 2014 | | $ | 11.050 | |
For the purpose of accounting and financial statements, share-based awards are valued as at the grant date by multiplying the share price by a forfeiture factor based on historical employee turnover. This is adjusted in subsequent periods based on the expected payout relative to target and amortized over
83
the performance period. As such, the accounting fair value changes with each financial statement issued. As at December 31, 2016, the accounting fair value of share-based awards to NEOs is $nil as no share-based awards are outstanding.
(3) There were no option-based awards granted to NEOs in 2014, 2015 and 2016.
(4) Amounts shown for Mr. Rossall, Mr. Charlton and Mr. Newby (for 2014 and 2015 only), are short-term incentive payments related to the performance year indicated, paid the following April. The amount shown for Mr. Charlton for 2016 is comprised of the following: (a) a short-term incentive payment related to the performance year indicated, paid the following April of $78,572; (b) a one-time payment of $87,360 in lieu of a long-term incentive award; and (c) a one-time retention payment of $87,360. The amount shown for Mr. Newby for 2016 is comprised of the following: (a) a pro rata portion of the annual short-term incentive target for the portion of 2016 up to the date of separation of $27,111; and (b) a retention payment of $185,500 upon termination of his employment in 2016.
(5) In 2015, Mr. Rossall entered into an arrangement with ROGCI providing for retention payments totaling $2,400,000. Mr. Rossall received a payment of $1,100,000 in 2016 and will receive another payment of $1,300,000 in 2017.
In 2016, Mr. Charlton entered into a retention arrangement with ROGCI and he will receive a payment of $88,272 in each of 2017, 2018 and 2019. In addition, Mr. Charlton received a grant in 2016 under the new IMP program that will be paid out in 2020. These incentive arrangements do not relate to compensation earned by Mr. Charlton in 2016 (and in the case of the IMP grant, cannot be quantified until the performance conditions, both corporate and individual, are determined at the end of the performance period).
(6) Represents ROGCI’s contributions to the defined contribution pension plans.
(7) Includes ROGCI’s contributions to the savings plan, the value of ROGCI’s post-retirement benefits, the flex credits provided by ROGCI for life insurance, accidental death and dismemberment, medical, dental and long-term disability coverage, fitness subsidy, and any service awards. Except for Mr. Newby, any perquisites and other personal benefits have been excluded as they do not exceed the lesser of $50,000 or 10% of the total annual salary of the Executive Officer. For Mr. Newby, this amount includes $18,135 recorded as a taxable benefit for the option to purchase his leased vehicle following the end of his employment.
For Mr. Newby, the 2016 amount includes his termination payment but excludes any short-term incentives and cash retention award that were paid at the time of termination as these have been included in the Non-Equity Annual Incentive Compensation column of the Summary Compensation Table. Detailed information on the termination payment can be found in the table under the heading “Former Executive Officer Departure and Compensation”. For NEOs who received stock options, the incremental payment has been included in 2015 as all of the option-based awards were cancelled at the closing of the Repsol Transaction on May 8, 2015 in exchange for $0.01 USD or CAD equivalent of $0.01204 per option as per outlined in the Arrangement Agreement.
Incentive Plan Awards
Outstanding Share-Based Awards & Option-Based Awards
There were no outstanding share-based and option-based awards as at December 31, 2016.
Incentive Plan Awards — Value Vested or Earned during the Year
The following table outlines the value of non-equity annual compensation earned and equity-based awards which vested during the recently completed financial year:
Values shown in Canadian Dollars
Named Executive Officers | | Non-Equity Incentive
Plan
Compensation-Value
Earned During the
Year1
($) | | Share-Based Awards —
Value Vested During
the Year2
($) | | Options-Based
Awards —
Value Vested During
the Year3
($) | |
Luis Cabra Dueñas | | n/a | | n/a | | n/a | |
Chief Executive Officer | | | | | | | |
John Rossall | | 1,415,015 | | 0 | | 0 | |
Executive Director, North America | | | | | | | |
David Charlton | | 253,292 | | 0 | | 0 | |
Vice President Finance, Treasurer and Chief Financial Officer | | | | | | | |
David Newby | | 212,611 | | 0 | | 0 | |
Former Senior Vice President, Finance, Treasurer and Chief Financial Officer | | | | | | | |
(1) Amounts shown for Mr. Rossall, Mr. Newby and Mr. Charlton include short-term incentives related to the 2016 performance year. For Mr. Rossall, the amount shown also includes a payment of $1,100,000 received in 2016 pursuant to a retention arrangement. For Mr. Charlton, the amount shown also includes a one-time payment of $87,360 in lieu of a long-term incentive award and a one-time retention payment of $87,360. For Mr. Newby, the amount shown also includes a retention payment of $185,500 received upon termination of his employment in 2016.
(2) There were no share-based awards that vested during 2016.
(3) There were no option-based awards that vested during 2016.
Pension Plan Benefits
Defined Contribution Pension Plans
ROGCI provides Mr. Rossall, Mr. Charlton and Mr. Newby with retirement benefits through two plans, both of which are defined contribution pension plans:
· The defined contribution component of the Employee Pension Plan, a registered contributory pension plan; and
· The Non-Registered Pension Plan, a non-registered non-contributory savings plan which provides the value of ROGCI pension contributions that exceeds the prescribed maximum under the Income Tax Act (Canada).
84
The Employee Pension Plan and the Non-Registered Pension Plan provide, in combination, ROGCI pension contributions of 2% to 8% of base salary and short-term incentives, depending on length of service with ROGCI, as well as a match of employee contributions of 2% of base salary and short-term incentives. All ROGCI pension contributions vest immediately.
Defined Contribution Plan Table
The following table presents the reconciliation of the accruals under the defined contribution pension plans for 2016:
Named Executive Officers | | Accumulated Value at
Start of Year1
($) | | Compensatory Change in
Value in Year2
($) | | Non-Compensatory
Change in Value in Year3
($) | | Accumulated Value at
End of Year1
($) | |
Luis Cabra Dueñas | | n/a | | n/a | | n/a | | n/a | |
John Rossall | | 80,662 | | 28,323 | | 10,047 | | 108,049 | |
David Charlton | | 398,156 | | 32,097 | | 47,278 | | 467,108 | |
David Newby | | 142,771 | | 4,083 | | (146,854 | ) | — | |
(1) Represents the accumulated value in the Employee Pension Plan, excluding the accumulated value of the Non-Registered Pension Plan since this value is not available.
(2) In addition to ROGCI contributions to the Employee Pension Plan, includes ROGCI contributions to the Non-Registered Pension Plan of $10,983 and $10,422 for Mr. Rossall and Mr. Charlton, respectively.
(3) Includes employee contributions and investment earnings in the Employee Pension Plan, and reflects the distribution of $149,251 made to Mr. Newby.
Employment Contracts and Termination
Termination Following a Change of Control or Termination Without Cause
A ROGCI employment contract is in place for Mr. Rossall. Mr. Newby had an employment contract in place upon his termination of employment on March 3, 2016. Mr. Charlton does not have an employment contract and Mr. Cabra does not have an employment contract with ROGCI. The employment contracts contain provisions for payments upon termination without cause or termination following a change of control. A change of control is deemed to have occurred as a result of any of the following events:
· Any person, partnership, entity or group acquires direct or indirect, actual or de facto control of ROGCI (where “control” means the ability to elect a majority of the Board of ROGCI and “group” refers to a combination of persons, partnerships, or entities, or any of the foregoing that act in concert);
· If there is any acquisition of 40% or more of the shares of ROGCI having entitlement to vote in the election of directors of ROGCI by any person, partnership, entity or group, any such acquisition shall be deemed to constitute an acquisition of control;
· ROGCI enters into an amalgamation, arrangement, restructuring, reorganization, merger or consolidation arrangement whereby, or the ultimate effect of which is that, any person, partnership, entity or group, whosoever composed, acquires direct or indirect, actual or de facto control of ROGCI;
· The shareholders of ROGCI approve the liquidation, winding up or other dissolution of ROGCI; and
· The shareholders of ROGCI approve the sale of all or substantially all of the assets of ROGCI.
The contracts for Mr. Rossall and Mr. Newby, include a requirement for termination of employment by ROGCI following a change of control (“double-trigger”) for the termination benefits to become payable.
Mr. Rossall was employed as at December 31, 2016. Mr. Newby’s employment ended on March 3, 2016 and his termination payment was paid in accordance with his employment contract.
A description of Mr. Rossall and Mr. Newby’s employment contracts follow, including a summary of potential payments in the event of a termination without cause or following a change of control.
| | Executive Director, North America and Former Senior Vice President, Finance,
Treasurer and Chief Financial Officer |
Conditions and Obligations of Employment | | · Confidentiality Clause (applicable any time after ceasing to be an employee of ROGCI);
· Non-Compete Clause (applicable during the term of employment with ROGCI and for a period of 12 months thereafter); and
· Non-Solicitation Clause (applicable during the term of employment with ROGCI and for a period of 12 months thereafter). |
| | Severance Payment |
85
Potential Payments in the event of Termination without Cause or Termination following a Change of Control | | · 2.0x annual base salary;
· 2.0x annual target short-term incentive;
· Annual short-term incentive target amount in respect of the year preceding the date of termination, if the date of termination precedes the date upon which such short-term incentive amount would have been paid; and
· Pro rata portion of the annual short-term incentive target for the portion of the current year up to date of termination. |
| | Pension Benefits |
| | · Participation in the defined contribution pension plans ends, and Executive Officer entitled to account balance; and
· Cash payment representing an additional 2.0 years of ROGCI contributions to the defined contribution pension plans. |
| | Additional Items |
| | · Option to purchase the personally assigned company vehicle;
· Lump sum equal to 15% of 2.0x annual base salary and 2.0x annual target short-term incentive as compensation for loss of all other benefits1;
· Management termination, legal and tax counseling services, with a maximum of $10,000 for management counseling services and $8,500 combined for legal and tax counseling services; and
· Liability insurance and/or indemnity coverage. |
| | Retention Award |
| | · Mr. Rossall will receive a prorated portion of his award for the year of accrual and Mr. Newby received the full award upon termination. |
(1) The calculation of the lump sum for loss of benefits does not include the amounts for i) the annual short-term incentive target in respect of the year preceding the date of termination, if the date of termination precedes the date upon which such short-term incentive amount would have been paid, and ii) the pro rata portion of the annual short-term incentive target for the portion of the current year up to date of termination.
Mr. Charlton does not have an employment contract and will follow ROGCI’s standard severance calculation in the event of a termination without cause. With regards to Mr. Charlton’s 2016 IMP, if a termination without cause had occurred during the first year of grant (i.e., before December 31, 2016), payment would have been made on a pro rata basis for the months worked during 2016 and would be subject to the applicable 2015 individual performance score up to a maximum of 150% and 75% of reference value DFO. If a termination without cause occurs in the years 2017 to 2019, Mr. Charlton will be entitled to the entire payment, subject to the applicable average individual performance between 2016 to 2019 and an updated DFO, if available. With regards to Mr. Charlton’s cash retention award, he will receive a prorated portion of his award for the year of accrual in the case of termination without cause and any unpaid amounts will be forfeited.
The following table reflects the estimated incremental payments current Executive Officers would have been entitled to in the event of termination without cause or following a change of control on December 31, 2016:
Values shown in Canadian Dollars
Executive Officers | | Severance
Payment1
($) | | Benefits2
($) | | Non-Equity Long-
term Incentive
Plan Termination
Without Cause3
($) | | Non-Equity Non-
Annual Incentive
Plan4
($) | | Pension5
($) | |
John Rossall | | 1,846,688 | | 239,794 | | n/a | | 655,342 | | 96,744 | |
Executive Director, North America | | | | | | | | | | | |
David Charlton6 | | n/a | | n/a | | 126,229 | | 66,506 | | n/a | |
Vice President Finance, Treasurer and Chief Financial Officer | | | | | | | | | | | |
(1) Includes the total value of severance payment as defined in the employment contract if he were terminated without cause or if a change of control occurred on December 31, 2016.
(2) Lump sum equal to 15% of 2.0x annual base salary and 2.0x annual target short-term incentive as compensation for loss of all other benefits.
(3) Includes the prorated portion of the IMP award if terminated without cause, assumes DFO of 75% and reflects actual 2015 individual performance up to a maximum of 150%.
(4) Prorated portion of their cash retention award for the year of accrual.
(5) Represents an additional 2.0 years of ROGCI contributions to the defined contribution pension plans.
(6) Mr. Charlton does not have an employment contract and will follow ROGCI’s standard severance calculation in the event of a termination without cause. The payment would include consideration of his 2016 bonus.
Termination Following Resignation, Retirement, Death and Termination for Cause
The following table illustrates the action taken for current Executive Officers in the event of resignation, retirement, death and termination for cause:
86
Salary | | Salary ends in the event of resignation, retirement, death or termination for cause. |
Benefit Programs | | Benefit programs end in the event of resignation, death or termination for cause.
Retirement: Life insurance of $50,000, reducing by 20% on the first four retirement anniversaries; medical coverage continues with lifetime maximum of $5,000 per covered person. |
Short-Term Incentives | | Resignation: Not paid.
Retirement or Death: Paid in respect of preceding year (if retirement or death precedes the date upon which the short-term incentive would have been paid) and payment for current year (on pro rata basis).
Termination for Cause: Not paid. |
Long-Term Incentives | | Resignation: Not paid.
Retirement or Death: If the event had occurred during the first year of grant (i.e., before December 31, 2016), payment would have been made on a pro rata basis for the months worked during 2016 and would be subject to the applicable 2015 individual performance score up to a maximum of 150% and 75% of reference value DFO. If the event occurs in the years 2017 to 2019, the beneficiary will be entitled to the entire payment, subject to the applicable average individual performance between 2016 to 2019 and an updated DFO, if available.
Termination for Cause: Not paid. |
Retention Awards | | Resignation: Not paid.
Retirement: Not paid.
Termination for Cause: Not paid. |
Pension Benefits | | Participation in the defined contribution pension plans ends in the event of resignation, retirement, death or termination for cause, with Executive Officer or beneficiary entitled to account balance. |
Former Executive Officer Departure and Compensation
The ROGCI Board approved the termination of Mr. Newby as Senior Vice President, Finance, Treasurer and Chief Financial Officer effective March 3, 2016. Mr. Newby received a severance payment in accordance with the terms of his employment contract. Also in accordance with the terms of his employment contract, he received reasonable financial, legal and executive career transitioning services.
The following table reflects the payments Mr. Newby received as part of his termination arrangement:
Values shown in Canadian Dollars
Former Executive Officers | | Salary1
($) | | Target
Short-term
incentives2
($) | | 2016
Short-term
incentives3
($) | | 2015
Short-term
incentives4
($) | | Benefits5
($) | | Pension6
($) | | All Other
Payments7
($) | | Total
Value of
Severance
Package
($) | |
David Newby | | 700,000 | | 315,000 | | 27,111 | | 85,837 | | 152,250 | | 71,050 | | 185,500 | | 1,536,748 | |
Former Senior Vice President, Finance, Treasurer and Chief Financial Officer | | | | | | | | | | | | | | | | | |
(1) Mr. Newby received 2.0x annual base salary.
(2) Mr. Newby received 2.0x target short-term incentive.
(3) Pro rata portion of the annual short-term incentive target for the portion of 2016 up to the date of separation.
(4) Annual short-term incentive target payout for the balance of the 2015 performance year, as Mr. Newby already received $71,663 in October 2015 as a partial variable payment.
(5) Mr. Newby received a lump sum equal to 15% of 2.0x annual base salary and 2.0x annual target short-term incentive as compensation for loss of all other benefits.
(6) Mr. Newby received a lump sum representing an additional 2.0 years of ROGCI contributions to the defined contribution pension plans.
(7) Mr. Newby received a lump sum fixed cash retention award payable upon his termination in accordance with the terms of the retention award.
87
DIRECTOR COMPENSATION
This section describes the Company’s director compensation components and approach to director compensation for the period January 1 to December 31, 2016.
All numbers/values in this section are rounded up/down to the nearest whole number/value.
Compensation Philosophy and Program Design
Directors who are salaried employees of the Company or Repsol and affiliates receive no remuneration for serving as directors. Fees to non-executive directors are paid in cash. There are no additional meeting fees or long-term incentive plan awards.
Annual Compensation Review Process
On May 10, 2016, the Board of Directors approved the remuneration structure for non-executive directors. No changes from the prior year were made. All compensation will be reviewed from time to time with support and recommendation from Repsol.
Director Compensation Elements
Quantum and Structure of Pay
For the year ended December 31, 2016, each non-executive director of the Company was remunerated according to the fee schedule provided below. All fees are paid in Canadian dollars.
Director1 Fee Schedule for Period January 1 to December 31, 2016
| | Fee | |
Annual Retainer2 | | $ | 110,000 | |
Audit Committee Chair Retainer | | $ | 20,000 | |
Audit Committee Member Retainer | | $ | 10,000 | |
(1) Directors who are salaried employees of the Company or Repsol and affiliates receive no remuneration for serving as directors.
(2) Fee is based on an estimated five Board meetings per year.
In addition to the above, directors are reimbursed for their Company-related travel expenses.
Long-Term Incentive Plans
There are no long-term incentive plans for directors of the Company.
Director Compensation Tables
Compensation
During 2016, non-executive directors earned the following compensation:
Name | | Total Fees1
($) | | All Other
Compensation
($) | | Total Compensation
($) | |
Albrecht W.A. Bellstedt | | 120,000 | | | | 120,000 | |
Thomas W. Ebbern | | 120,000 | | | | 120,000 | |
Robert R. Rooney2,3 | | 36,868 | | 4,000 | | 40,868 | |
Michael T. Waites | | 130,000 | | | | 130,000 | |
(1) Includes annual retainer and committee retainer. All fees are paid in Canadian dollars.
(2) In addition to an annual retainer, Mr. Rooney received a parking benefit.
(3) Mr. Rooney resigned from the Board on May 1, 2016. The compensation shown is for the period January 1, 2016 to May 1, 2016.
Outstanding Share-Based Awards
As at December 31, 2016, there were no share-based awards outstanding for the benefit of directors.
88

REPSOL OIL & GAS CANADA INC.
Suite 2000, 888 — 3rd Street SW
Calgary, Alberta, Canada T2P 5C5
P 403.237.1234 F 403.237.1902
E infocanada@repsol.com
www.repsol.com/ca_en/