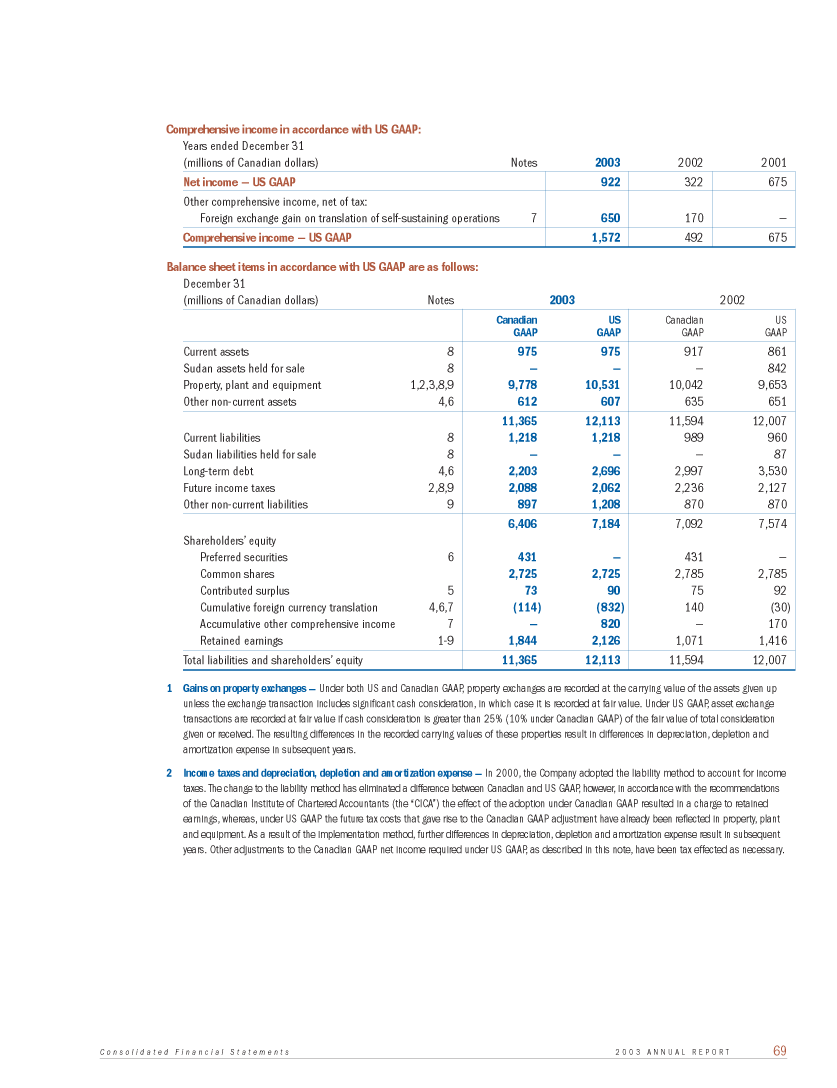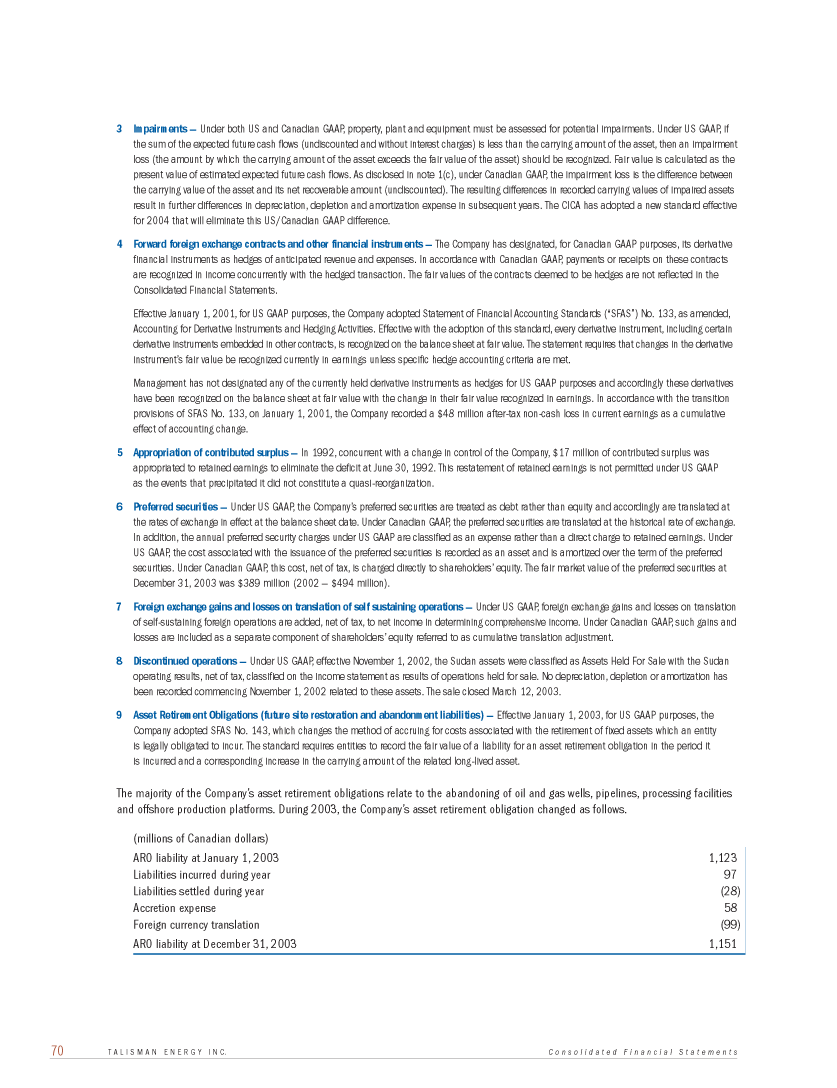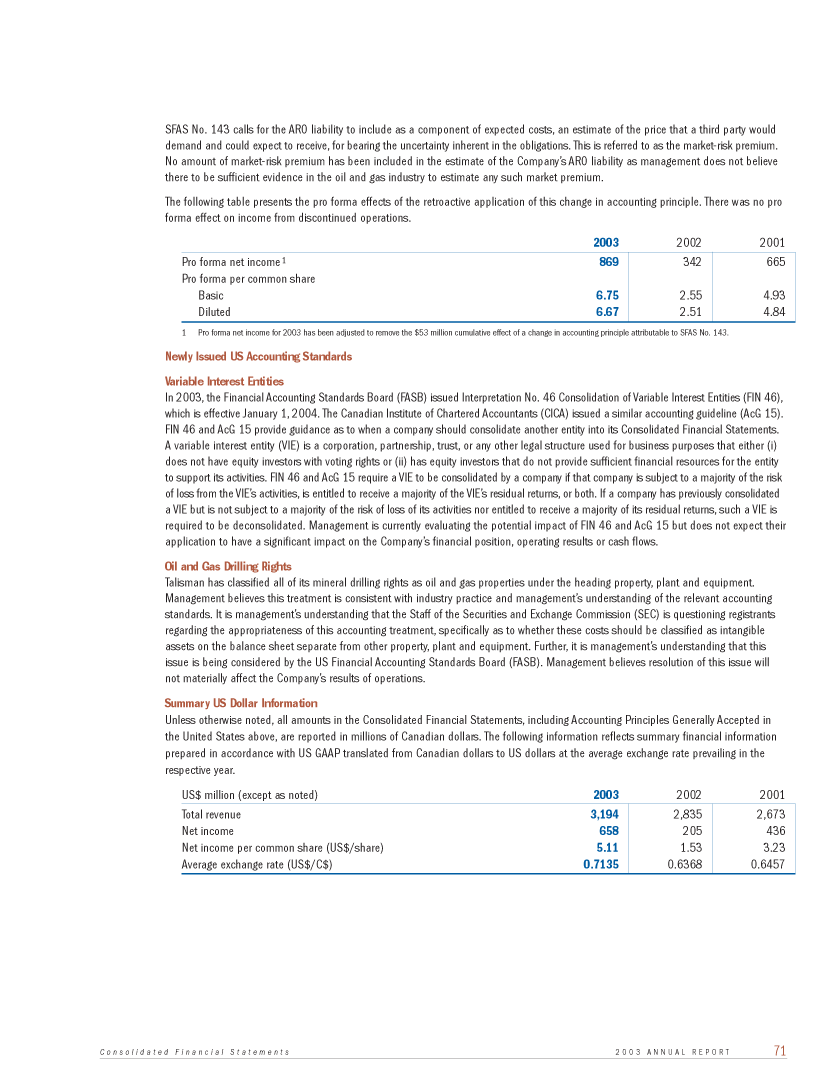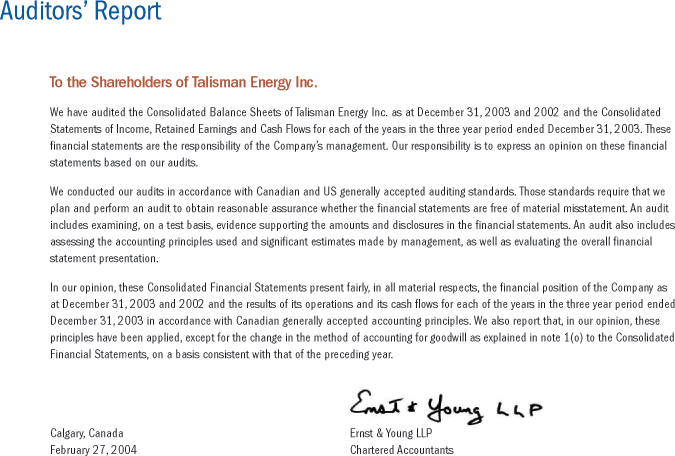

Talisman Energy Inc. Consolidated Balance Sheets
| December 31 (millions of Canadian dollars) | 2003 | | 2002 | |
|
| |
| |
| Assets | | | | |
| Current | | | | |
| Cash and cash equivalents | 98 | | 27 | |
| Accounts receivable | 760 | | 719 | |
| Inventories (note 3) | 100 | | 147 | |
| Prepaid expenses | 17 | | 24 | |
|
| |
| |
| | 975 | | 917 | |
|
| |
| |
| | | | | |
| Accrued employee pension benefit asset (note 16) | 63 | | 67 | |
| Other assets | 76 | | 99 | |
| Goodwill (note 2) | 473 | | 469 | |
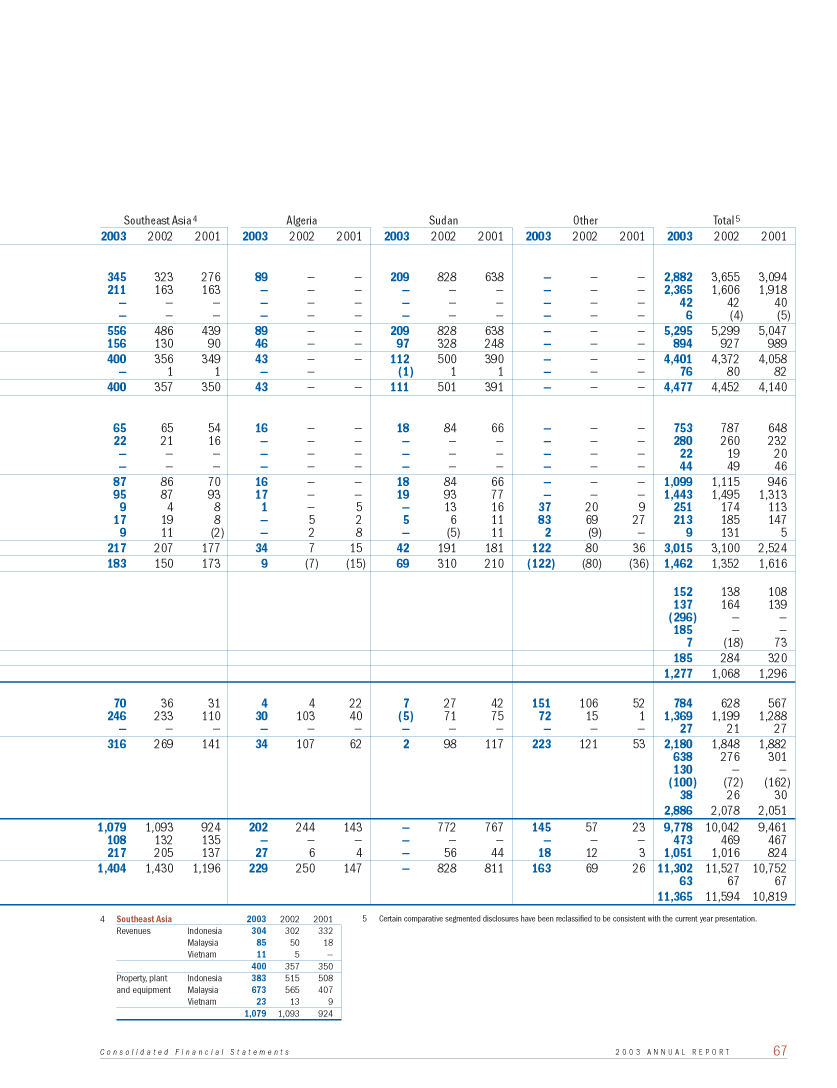
| Property, plant and equipment (note 4) | 9,778 | | 10,042 | |
|
| |
| |
| | 10,390 | | 10,677 | |
|
| |
| |
| Total assets | 11,365 | | 11,594 | |
|
| |
| |
| | | | | |
| | | | | |
| Liabilities | | | | |
| Current | | | | |
| Accounts payable and accrued liabilities | 1,064 | | 803 | |
| Income and other taxes payable | 154 | | 186 | |
|
| |
| |
| | 1,218 | | 989 | |
|
| |
| |
| | | | | |
| Deferred credits | 57 | | 57 | |
| Provision for future site restoration (note 10) | 840 | | 813 | |
| Long-term debt (note 5) | 2,203 | | 2,997 | |
| Future income taxes (note 13) | 2,088 | | 2,236 | |
|
| |
| |
| | 5,188 | | 6,103 | |
|
| |
| |
| | | | | |
| Contingencies and commitments (note 10) | | | | |
| | | | | |
| Shareholders' equity | | | | |
| Preferred securities (note 6) | 431 | | 431 | |
| Common shares (note 7) | 2,725 | | 2,785 | |
| Contributed surplus | 73 | | 75 | |
| Cumulative foreign currency translation (note 8) | (114) | | 140 | |
| Retained earnings | 1,844 | | 1,071 | |
|
| |
| |
| | 4,959 | | 4,502 | |
|
| |
| |
| Total liabilities and shareholders' equity | 11,365 | | 11,594 | |
|
| |
| |
| | | | | |
| On behalf of the Board: | | | | |
| | | | | |
| | | | | |
| | | | | |
| Douglas D. Baldwin | Dale G. Parker | | | |
| Chairman of the Board | Director | | | |
| | | | | |
| | | | | |
| | | | | |
| See accompanying notes. | | | | |
Talisman Energy Inc. Consolidated Statements of Income
| Years ended December 31 | | | | | | |
| (millions of Canadian dollars) | 2003 | | 2002 | | 2001 | |
|
| |
| |
| |
| Revenue | | | | | | |
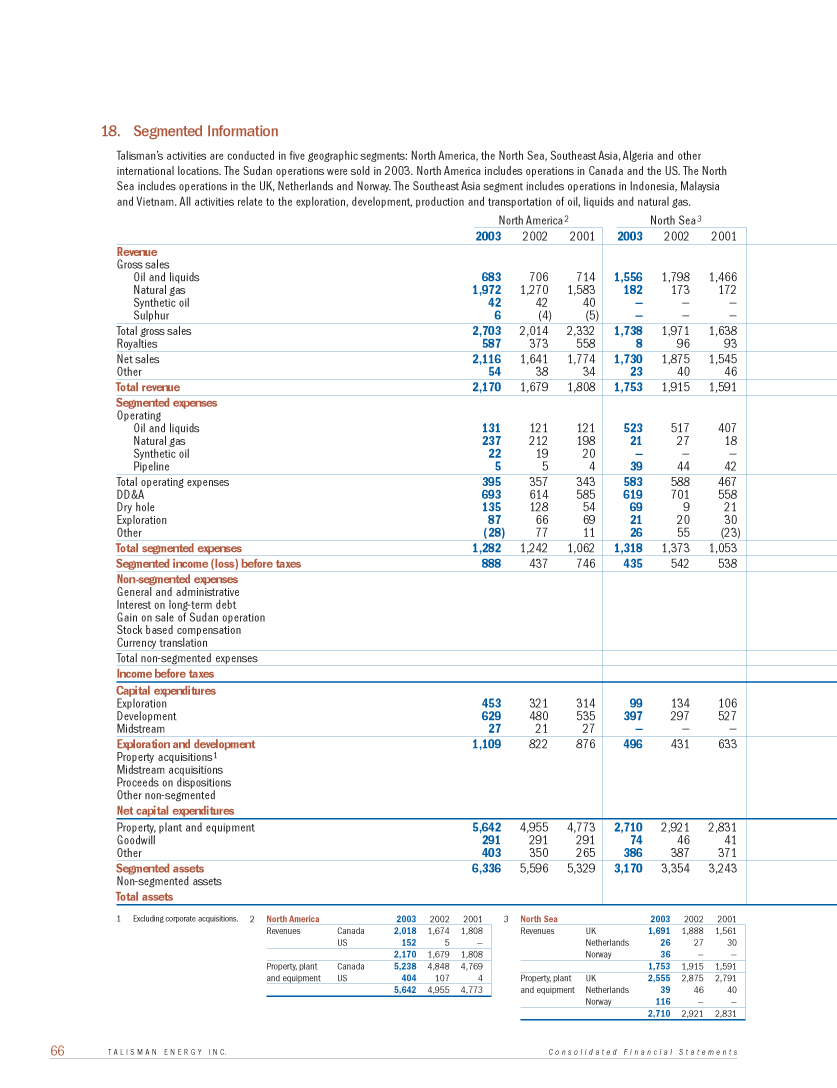
| Gross sales | 5,295 | | 5,299 | | 5,047 | |
| Less royalties | 894 | | 927 | | 989 | |
|
| |
| |
| |
| Net sales | 4,401 | | 4,372 | | 4,058 | |
| Other (note 11) | 76 | | 80 | | 82 | |
|
| |
| |
| |
| Total revenue | 4,477 | | 4,452 | | 4,140 | |
|
| |
| |
| |
| | | | | | | |
| Expenses | | | | | | |
| Operating | 1,099 | | 1,115 | | 946 | |
| General and administrative | 152 | | 138 | | 108 | |
| Depreciation, depletion and amortization | 1,443 | | 1,495 | | 1,313 | |
| Dry hole | 251 | | 174 | | 113 | |
| Exploration | 213 | | 185 | | 147 | |
| Interest on long-term debt | 137 | | 164 | | 139 | |
| Stock-based compensation (note 7) | 185 | | - | | - | |
| Other (note 12) | 16 | | 113 | | 78 | |
|
| |
| |
| |
| Total expenses | 3,496 | | 3,384 | | 2,844 | |
|
| |
| |
| |
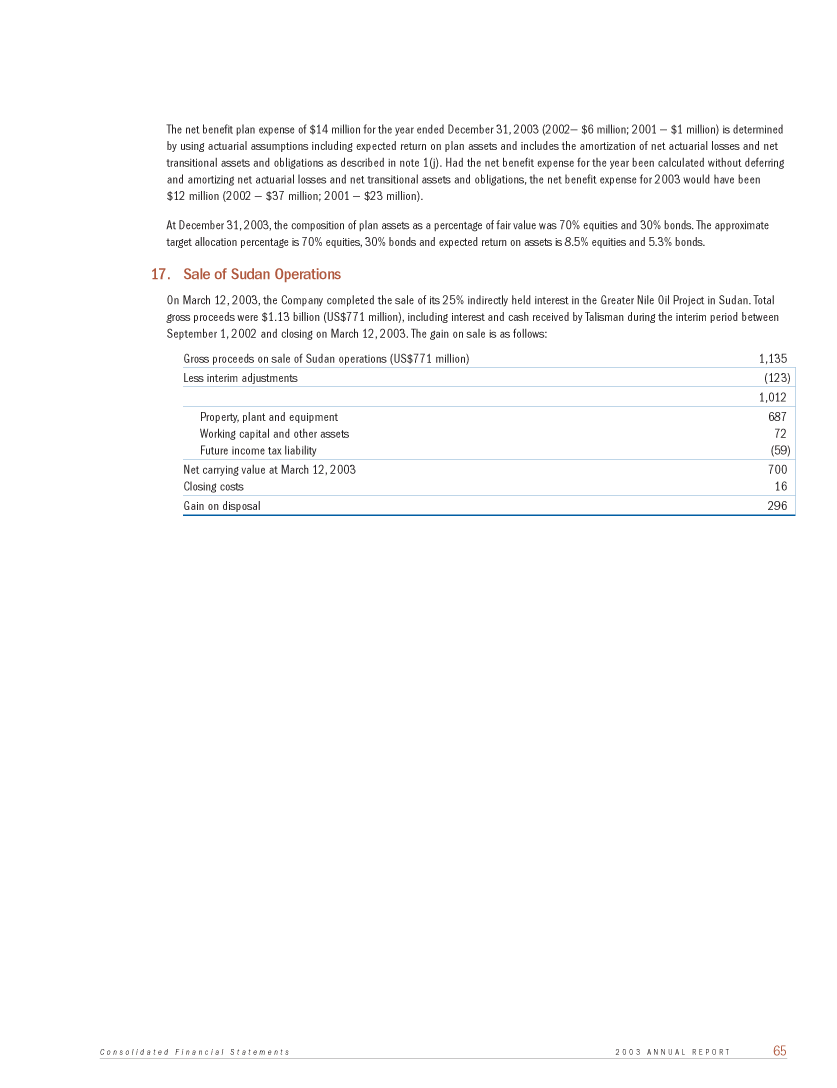
| Gain on sale of Sudan operations (note 17) | 296 | | - | | - | |
|
| |
| |
| |
| Income before taxes | 1,277 | | 1,068 | | 1,296 | |
|
| |
| |
| |
| Taxes (note 13) | | | | | | |
| Current income tax | 229 | | 258 | | 342 | |
| Future income tax (recovery) | (51) | | 162 | | 72 | |
| Petroleum revenue tax | 92 | | 124 | | 149 | |
|
| |
| |
| |
| | 270 | | 544 | | 563 | |
|
| |
| |
| |
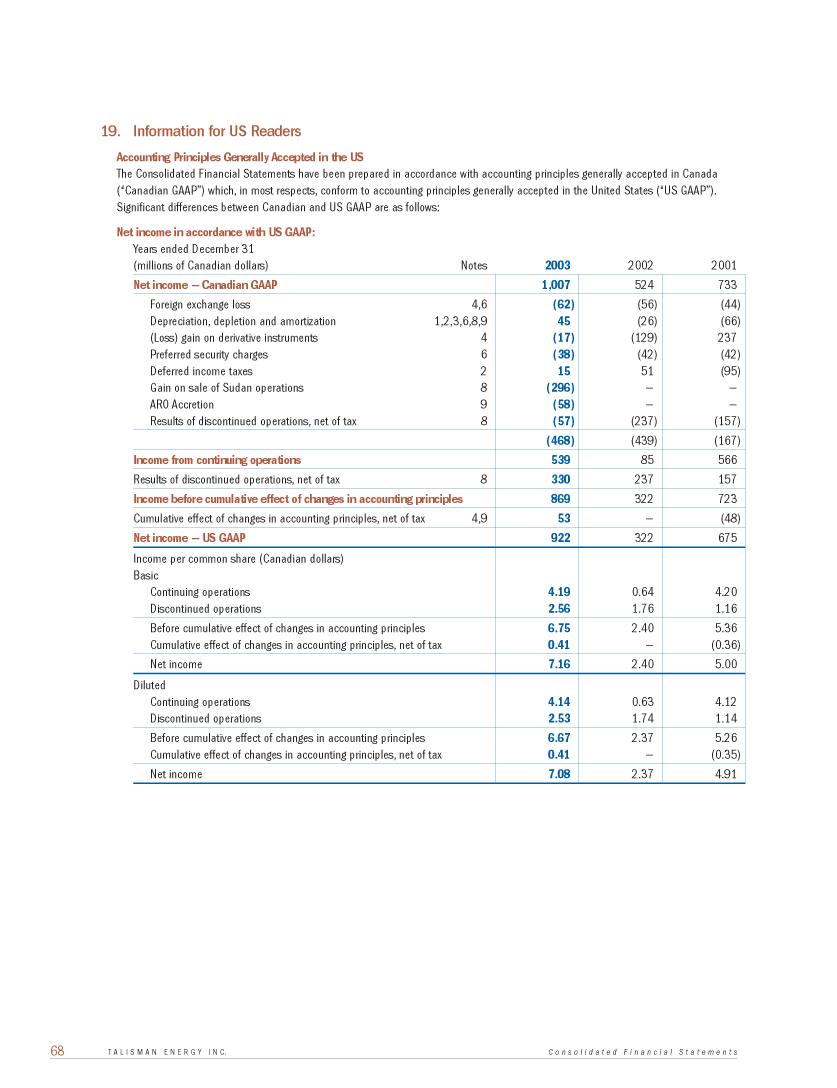
| Net income | 1,007 | | 524 | | 733 | |
| Preferred security charges, net of tax | 22 | | 24 | | 24 | |
|
| |
| |
| |
| Net income available to common shareholders | 985 | | 500 | | 709 | |
|
| |
| |
| |
| | | | | | | |
| Per common share (Canadian dollars) (note 15) | | | | | | |
| Net income | 7.65 | | 3.73 | | 5.25 | |
| Diluted net income | 7.57 | | 3.67 | | 5.16 | |
|
| |
| |
| |
| Average number of common shares outstanding (millions) | 129 | | 134 | | 135 | |
| Diluted number of common shares outstanding (millions) | 130 | | 136 | | 137 | |
|
| |
| |
| |
| | | | | | | |
| See accompanying notes. | | | | | | |
| | | | | | | |
| | | | | | | |
Consolidated Statements of Retained Earnings |
| | | | | | | |
| | | | | | | |
| Years ended December 31 (millions of Canadian dollars) | 2003 | | 2002 | | 2001 | |
|
| |
| |
| |
| | | | | | | |
| Retained earnings, beginning of year | 1,071 | | 787 | | 257 | |
| Net income | 1,007 | | 524 | | 733 | |
| Common share dividends | (90) | | (80) | | (81) | |
| Purchase of common shares | (122) | | (136) | | (98) | |
| Preferred security charges, net of tax | (22) | | (24) | | (24) | |
|
| |
| |
| |
| Retained earnings, end of year | 1,844 | | 1,071 | | 787 | |
|
| |
| |
| |
| | | | | | | |
| See accompanying notes. | | | | | | |
Talisman Energy Inc.
Consolidated Statements of Cash Flows
| Years ended December 31 | | | | | | |
| (millions of Canadian dollars) | 2003 | | 2002 | | 2001 | |
|
| |
| |
| |
| Operating | | | | | | |
| Net income | 1,007 | | 524 | | 733 | |
| Items not involving current cash flow (note 14) | 1,509 | | 1,936 | | 1,614 | |
| Exploration | 213 | | 185 | | 147 | |
|
| |
| |
| |
| Cash flow | 2,729 | | 2,645 | | 2,494 | |
| Deferred gain on unwound hedges | (9) | | (43) | | 52 | |
| Changes in non-cash working capital (note 14) | (104) | | (163) | | (177) | |
|
| |
| |
| |
| Cash provided by operating activities | 2,616 | | 2,439 | | 2,369 | |
|
| |
| |
| |
| Investing | | | | | | |
| Corporate acquisitions (note 2) | - | | - | | (1,213) | |
| Proceeds on sale of Sudan operations (note 17) | 1,012 | | - | | - | |
| Capital expenditures | | | | | | |
| Exploration, development and corporate | (2,218) | | (1,874) | | (1,912) | |
| Acquisitions (note 2) | (661) | | (244) | | (186) | |
| Proceeds of resource property dispositions | 63 | | 30 | | 47 | |
| Investments | (11) | | (36) | | - | |
| Changes in non-cash working capital | 82 | | 2 | | 52 | |
|
| |
| |
| |
| Cash used in investing activities | (1,733) | | (2,122) | | (3,212) | |
|
| |
| |
| |
| Financing | | | | | | | |
| Long-term debt repaid | | (791) | | (1,397) | | (568) | |
| Long-term debt issued | | 292 | | 1,417 | | 1,617 | |
| Common shares purchased (net of proceeds on shares issued) | (184) | | (184) | | (117) | |
| Common share dividends | | (90) | | (80) | | (81) | |
| Preferred security charges | | (38) | | (42) | | (42) | |
| Deferred credits and other | | 27 | | (21) | | (25) | |
|
|
| |
| |
| |
| Cash (used in) provided by financing activities | (784) | | (307) | | 784 | |
|
| |
| |
| |
| Effect of translation on foreign currency cash | (28) | | - | | - | |
|
| |
| |
| |
| Net increase (decrease) in cash | 71 | | 10 | | (59) | |
| Cash and cash equivalents, beginning of year | 27 | | 17 | | 76 | |
|
| |
| |
| |
| Cash and cash equivalents, end of year | 98 | | 27 | | 17 | |
|
| |
| |
| |
| | | | | | | | |
| See accompanying notes. | | | | | | | |


