
Exhibit 99.1 Second Quarter 2024 Financial Results August 9, 2024
CAUTIONARY STATEMENTS Forward-Looking Statements This Presentation has been prepared by Calumet, Inc. (the “Company,” “Calumet,” we, our or like terms) as of August 9, 2024. The information in this Presentation includes certain “forward-looking statements.” These statements can be identified by the use of forward-looking terminology including “may,” “intend,” “believe,” “expect,” “anticipate,” “estimate,” “forecast,” “outlook,” “continue” or other similar words. The statements discussed in this Presentation that are not purely historical data are forward-looking statements. These forward-looking statements discuss future expectations or state other “forward-looking” information and involve risks and uncertainties. When considering forward-looking statements, you should keep in mind the risk factors and other cautionary statements included in the most recent Annual Report on Form 10-K of Calumet Specialty Products Partners, L.P. (the “Partnership”) and other filings with the SEC by us or the Partnership. The risk factors and other factors noted in the Partnership’s most recent Annual Report on Form 10-K and other filings with the SEC by us or the Partnership could cause our actual results to differ materially from those contained in any forward-looking statement. Our forward-looking statements are not guarantees of future performance, and actual results and future performance may differ materially from those suggested in any forward-looking statement. All subsequent written and oral forward-looking statements attributable to us or to persons acting on our behalf are expressly qualified in their entirety by the foregoing. Existing and prospective investors are cautioned not to place undue reliance on such forward-looking statements, which speak only as of the date of this Presentation. We undertake no obligation to publicly update or revise any forward-looking statements after the date they are made, whether as a result of new information, future events or otherwise. Non-GAAP Financial Measures Adjusted EBITDA and net recourse debt are non-GAAP financial measures provided in this Presentation. Reconciliations to the most comparable GAAP financial measures are included in the Appendix to this Presentation. These non-GAAP financial measures are not defined by GAAP and should not be considered in isolation or as an alternative to net income (loss) or other financial measures prepared in accordance with GAAP. 2
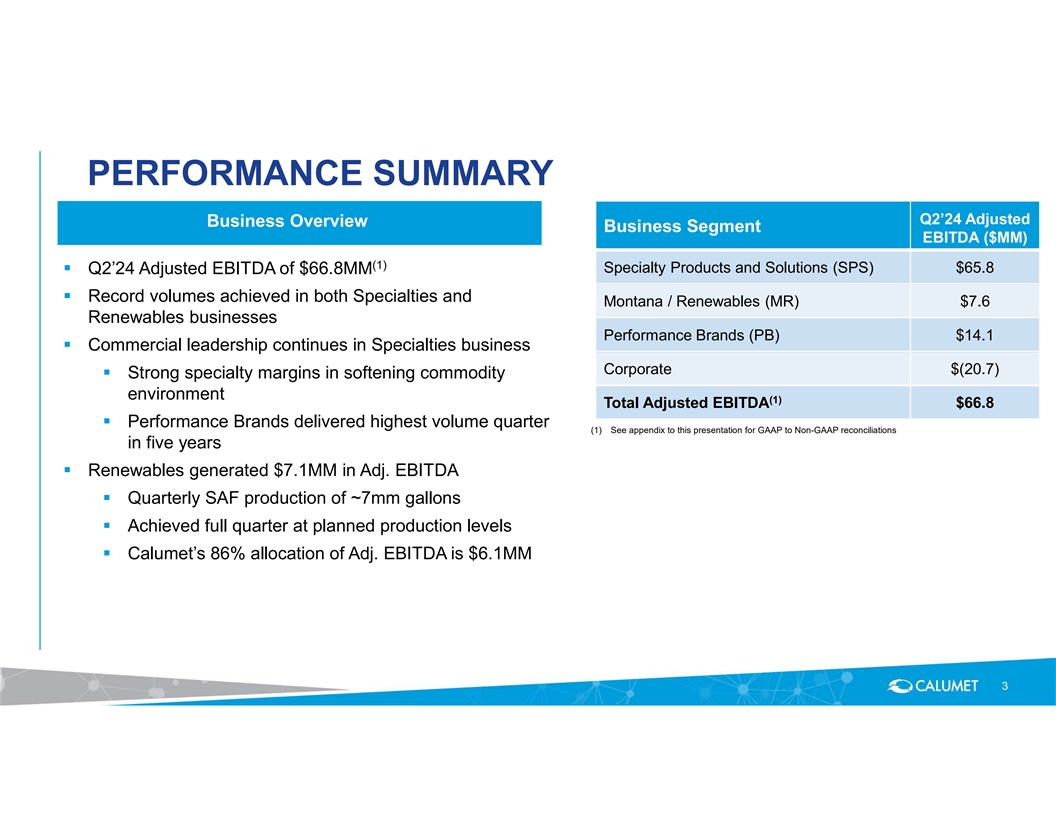
PERFORMANCE SUMMARY Q2’24 Adjusted Business Overview Business Segment EBITDA ($MM) (1) Specialty Products and Solutions (SPS) $65.8 § Q2’24 Adjusted EBITDA of $66.8MM § Record volumes achieved in both Specialties and Montana / Renewables (MR) $7.6 Renewables businesses Performance Brands (PB) $14.1 § Commercial leadership continues in Specialties business Corporate $(20.7) § Strong specialty margins in softening commodity environment (1) Total Adjusted EBITDA $66.8 § Performance Brands delivered highest volume quarter (1) See appendix to this presentation for GAAP to Non-GAAP reconciliations in five years § Renewables generated $7.1MM in Adj. EBITDA § Quarterly SAF production of ~7mm gallons § Achieved full quarter at planned production levels § Calumet’s 86% allocation of Adj. EBITDA is $6.1MM 3
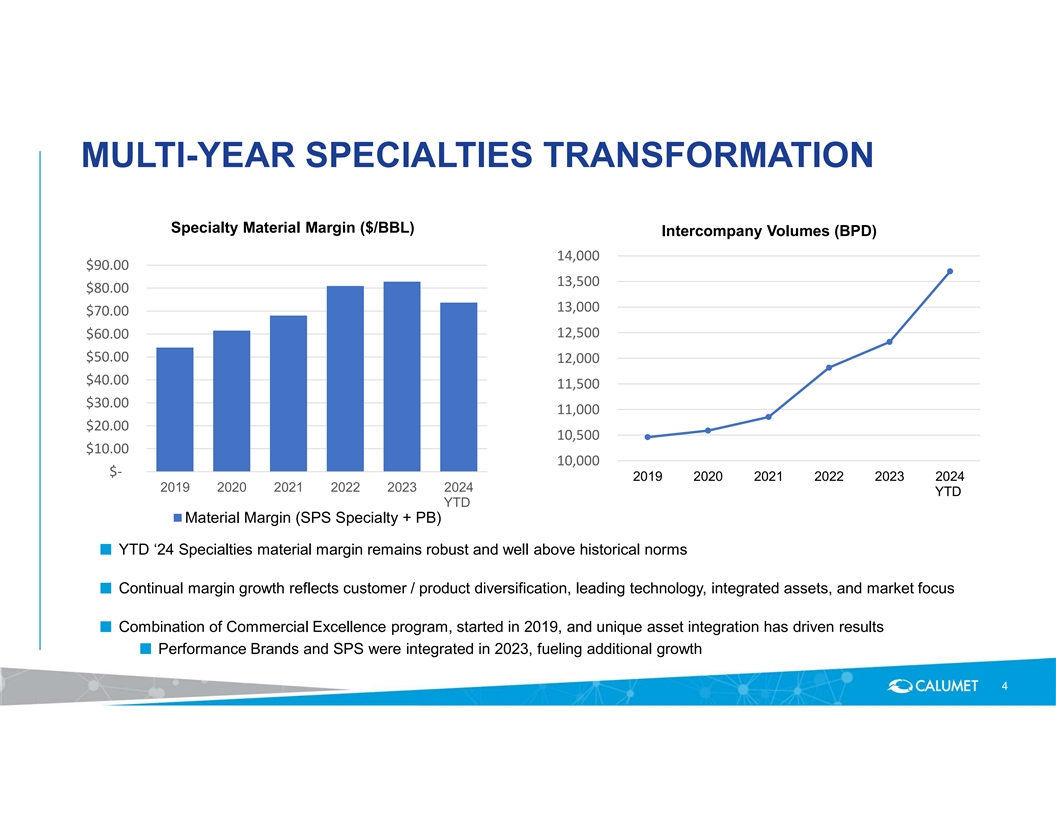
MULTI-YEAR SPECIALTIES TRANSFORMATION Specialty Material Margin ($/BBL) Intercompany Volumes (BPD) 14,000 $90.00 13,500 $80.00 13,000 $70.00 12,500 $60.00 $50.00 12,000 $40.00 11,500 $30.00 11,000 $20.00 10,500 $10.00 10,000 $- 2019 2020 2021 2022 2023 2024 2019 2020 2021 2022 2023 2024 YTD YTD Material Margin (SPS Specialty + PB) ■ YTD ‘24 Specialties material margin remains robust and well above historical norms ■ Continual margin growth reflects customer / product diversification, leading technology, integrated assets, and market focus ■ Combination of Commercial Excellence program, started in 2019, and unique asset integration has driven results ■ Performance Brands and SPS were integrated in 2023, fueling additional growth 4
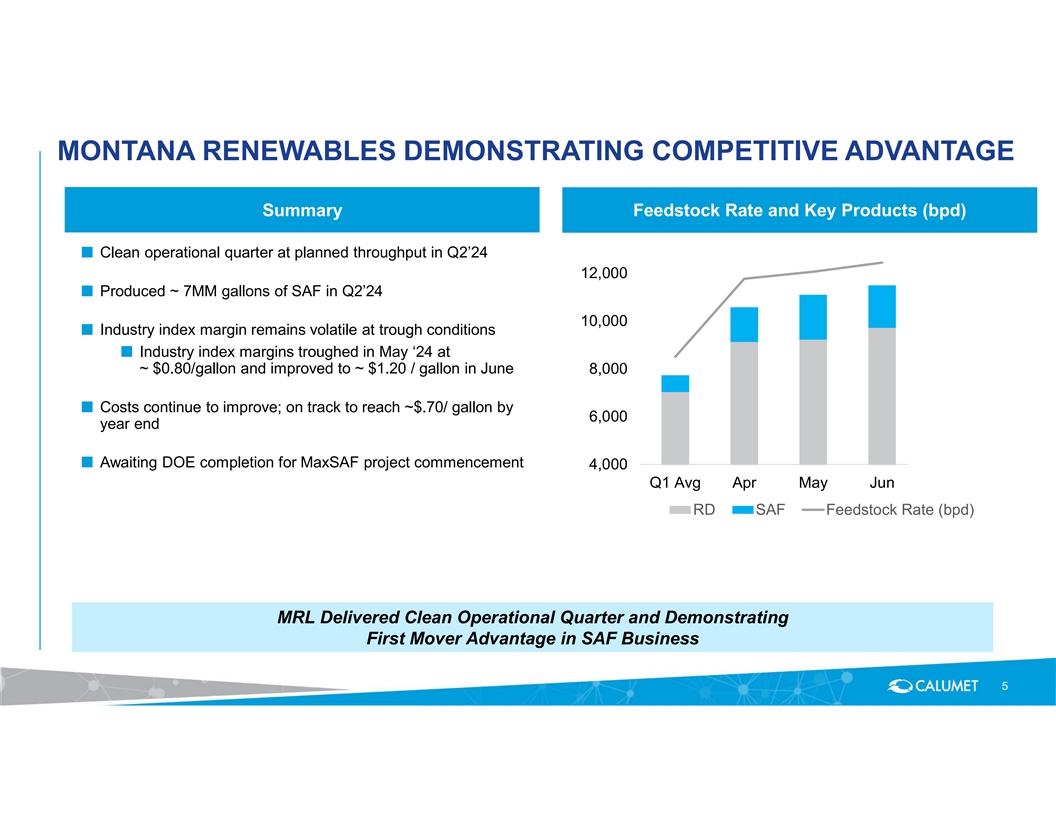
MONTANA RENEWABLES DEMONSTRATING COMPETITIVE ADVANTAGE Summary Feedstock Rate and Key Products (bpd) ■ Clean operational quarter at planned throughput in Q2’24 12,000 ■ Produced ~ 7MM gallons of SAF in Q2’24 10,000 ■ Industry index margin remains volatile at trough conditions ■ Industry index margins troughed in May ‘24 at ~ $0.80/gallon and improved to ~ $1.20 / gallon in June 8,000 ■ Costs continue to improve; on track to reach ~$.70/ gallon by 6,000 year end ■ Awaiting DOE completion for MaxSAF project commencement 4,000 Q1 Avg Apr May Jun RD SAF Feedstock Rate (bpd) M MR RL L D De elliiv ve er re ed d C Clle ea an n O Op pe er ra at tiio on na all Q Qu ua ar rt te er r a an nd d D De em mo on ns st tr ra at tiin ng g F Fiir rs st t M Mo ov ve er r A Ad dv va an nt ta ag ge e iin n S SA AF F B Bu us siin ne es ss s 5
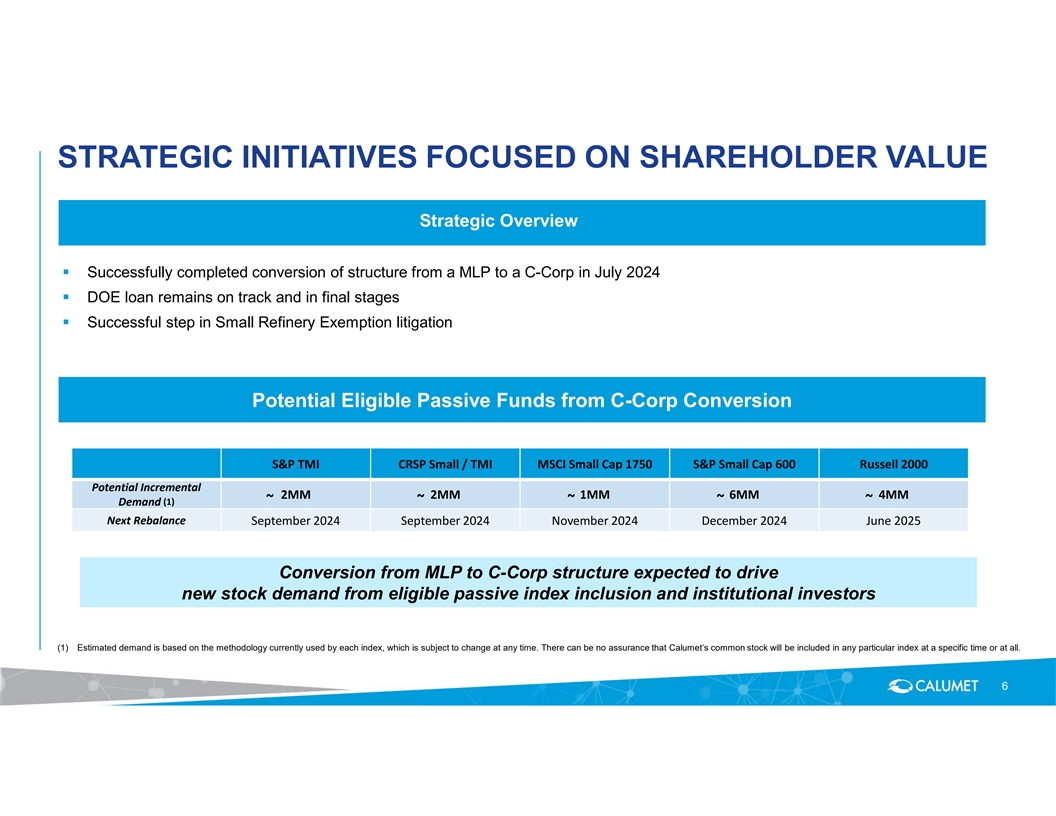
STRATEGIC INITIATIVES FOCUSED ON SHAREHOLDER VALUE Strategic Overview § Successfully completed conversion of structure from a MLP to a C-Corp in July 2024 § DOE loan remains on track and in final stages § Successful step in Small Refinery Exemption litigation Potential Eligible Passive Funds from C-Corp Conversion S&P TMI CRSP Small / TMI MSCI Small Cap 1750 S&P Small Cap 600 Russell 2000 Potential Incremental 2MM 2MM 1MM 6MM 4MM ~ ~ ~ ~ ~ Demand (1) Next Rebalance September 2024 September 2024 November 2024 December 2024 June 2025 C Co on nv ve er rs siio on n f fr ro om m M ML LP P t to o C C- -C Co or rp p s st tr ru uc ct tu ur re e e ex xp pe ec ct te ed d t to o d dr riiv ve e n ne ew w s st to oc ck k d de em ma an nd d f fr ro om m e elliig giib blle e p pa as ss siiv ve e iin nd de ex x iin nc cllu us siio on n a an nd d iin ns st tiit tu ut tiio on na all iin nv ve es st to or rs s (1) Estimated demand is based on the methodology currently used by each index, which is subject to change at any time. There can be no assurance that Calumet’s common stock will be included in any particular index at a specific time or at all. 6
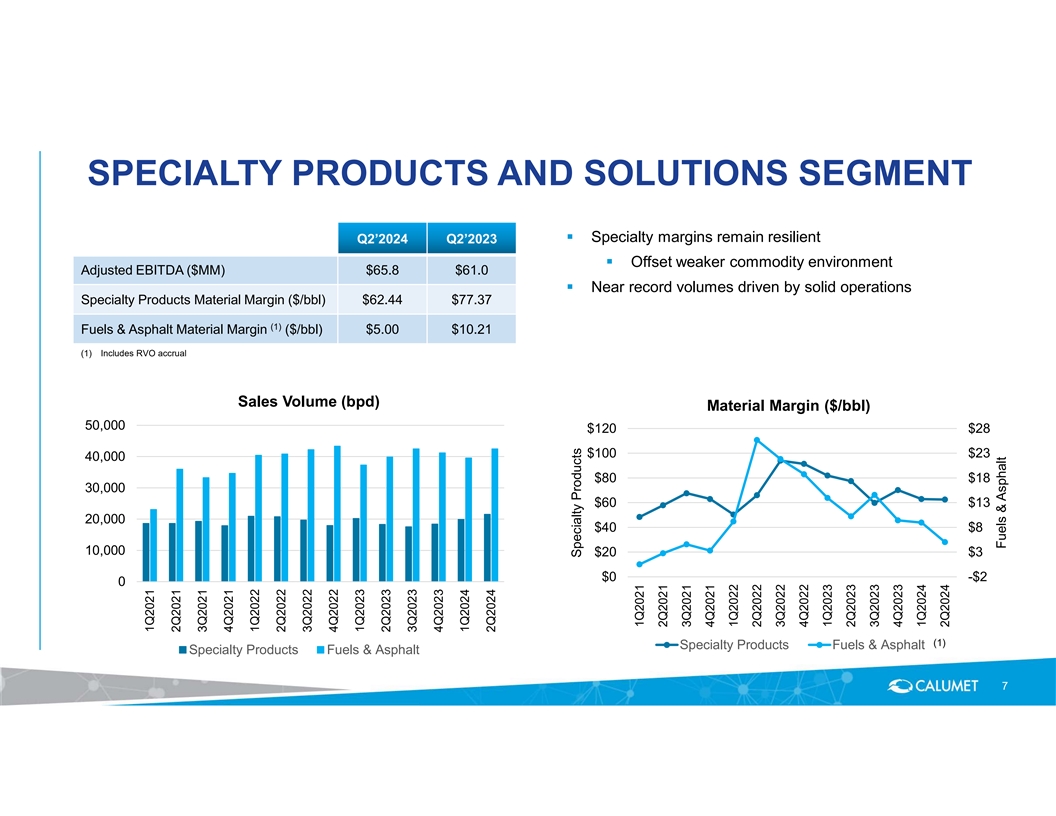
SPECIALTY PRODUCTS AND SOLUTIONS SEGMENT § Specialty margins remain resilient Q2’2024 Q2’2023 § Offset weaker commodity environment Adjusted EBITDA ($MM) $65.8 $61.0 § Near record volumes driven by solid operations Specialty Products Material Margin ($/bbl) $62.44 $77.37 (1) Fuels & Asphalt Material Margin ($/bbl) $5.00 $10.21 (1) Includes RVO accrual Sales Volume (bpd) Material Margin ($/bbl) 50,000 $120 $28 $100 $23 40,000 $80 $18 30,000 $60 $13 20,000 $40 $8 10,000 $20 $3 $0 -$2 0 (1) Specialty Products Fuels & Asphalt Specialty Products Fuels & Asphalt 7 1Q2021 2Q2021 3Q2021 4Q2021 1Q2022 2Q2022 3Q2022 4Q2022 1Q2023 2Q2023 3Q2023 4Q2023 1Q2024 2Q2024 Specialty Products 1Q2021 2Q2021 3Q2021 4Q2021 1Q2022 2Q2022 3Q2022 4Q2022 1Q2023 2Q2023 3Q2023 4Q2023 1Q2024 2Q2024 Fuels & Asphalt
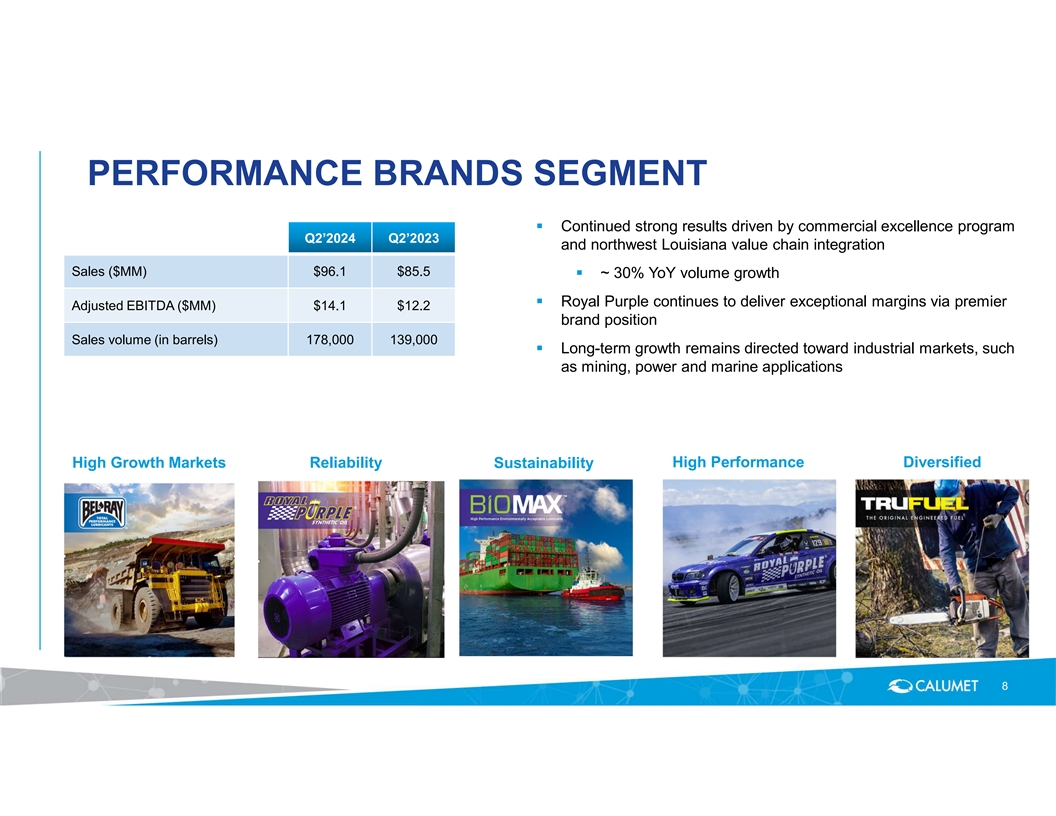
PERFORMANCE BRANDS SEGMENT § Continued strong results driven by commercial excellence program Q2’2024 Q2’2023 and northwest Louisiana value chain integration Sales ($MM) $96.1 $85.5 § ~ 30% YoY volume growth § Royal Purple continues to deliver exceptional margins via premier Adjusted EBITDA ($MM) $14.1 $12.2 brand position Sales volume (in barrels) 178,000 139,000 § Long-term growth remains directed toward industrial markets, such as mining, power and marine applications High Growth Markets Reliability Sustainability High Performance Diversified 8
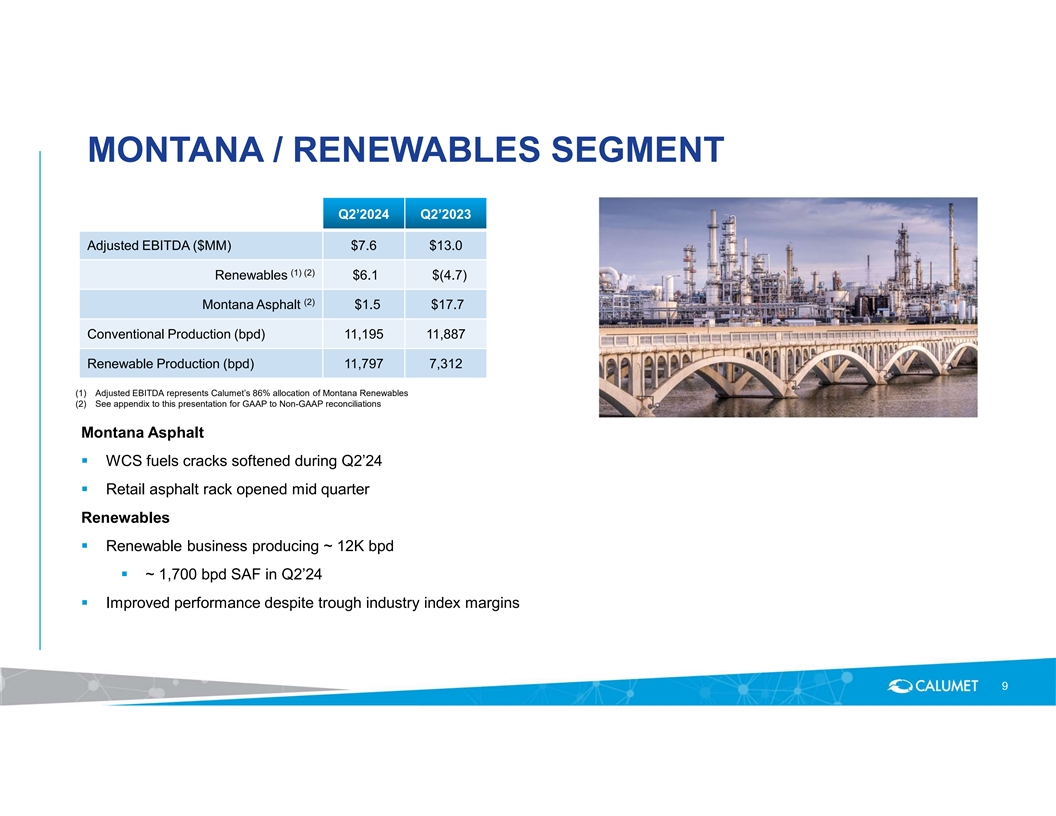
MONTANA / RENEWABLES SEGMENT Q2’2024 Q2’2023 Adjusted EBITDA ($MM) $7.6 $13.0 (1) (2) Renewables $6.1 $(4.7) (2) Montana Asphalt $1.5 $17.7 Conventional Production (bpd) 11,195 11,887 Renewable Production (bpd) 11,797 7,312 (1) Adjusted EBITDA represents Calumet’s 86% allocation of Montana Renewables (2) See appendix to this presentation for GAAP to Non-GAAP reconciliations Montana Asphalt § WCS fuels cracks softened during Q2’24 § Retail asphalt rack opened mid quarter Renewables § Renewable business producing ~ 12K bpd § ~ 1,700 bpd SAF in Q2’24 § Improved performance despite trough industry index margins 9
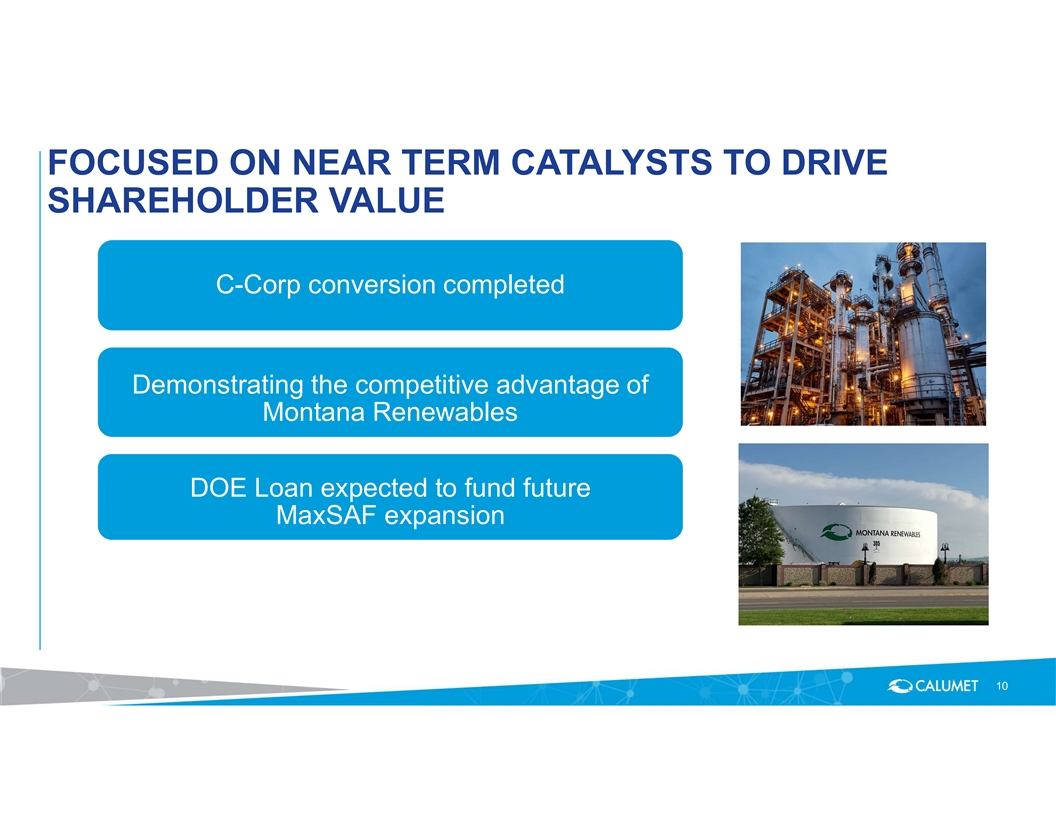
FOCUSED ON NEAR TERM CATALYSTS TO DRIVE SHAREHOLDER VALUE C-Corp conversion completed Demonstrating the competitive advantage of Montana Renewables DOE Loan expected to fund future MaxSAF expansion 10
Appendix © 2024 Calumet, Inc. All Rights Reserved. Not to be copied, shared, or reproduced in any media without the express written permission of Calumet, Inc.
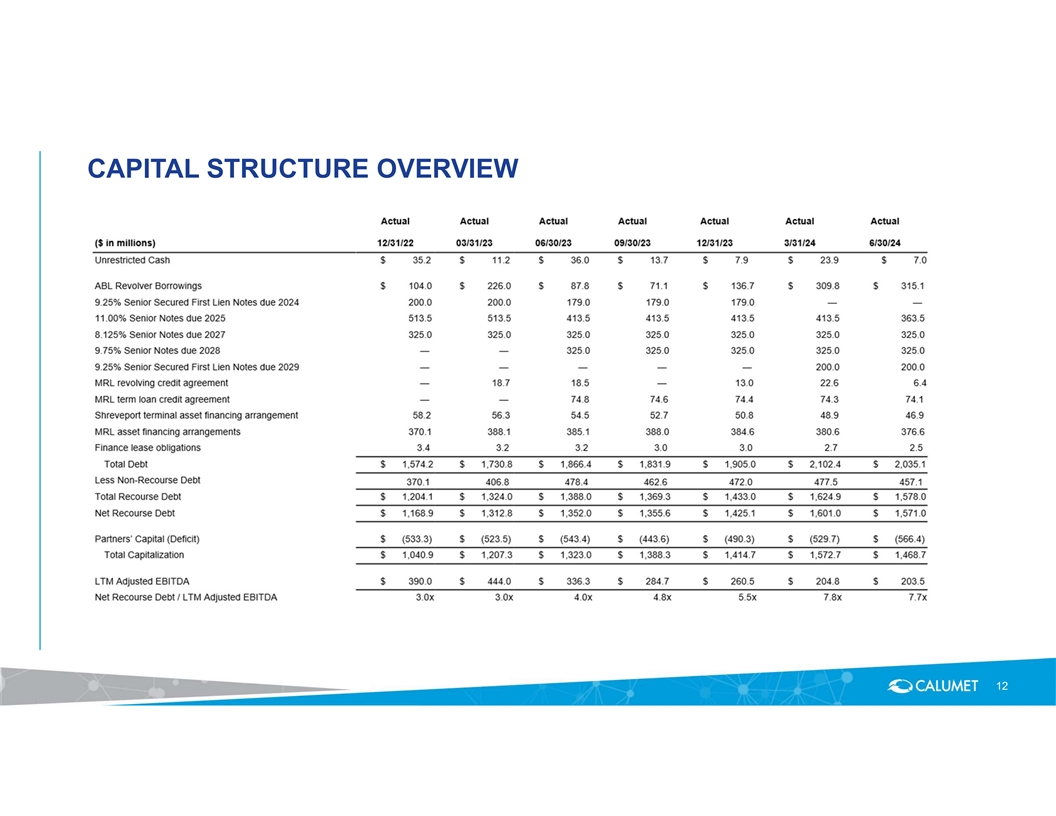
CAPITAL STRUCTURE OVERVIEW 12

RECONCILIATION OF NET INCOME (LOSS) TO ADJUSTED EBITDA 13
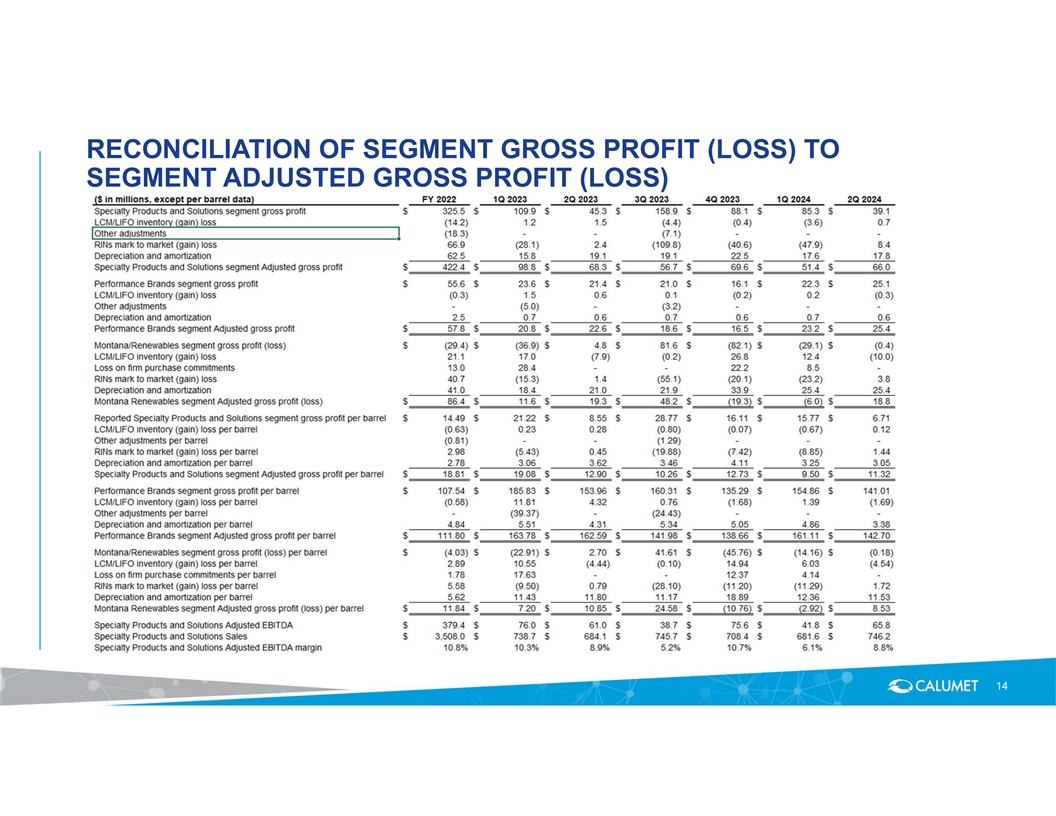
RECONCILIATION OF SEGMENT GROSS PROFIT (LOSS) TO SEGMENT ADJUSTED GROSS PROFIT (LOSS) 14
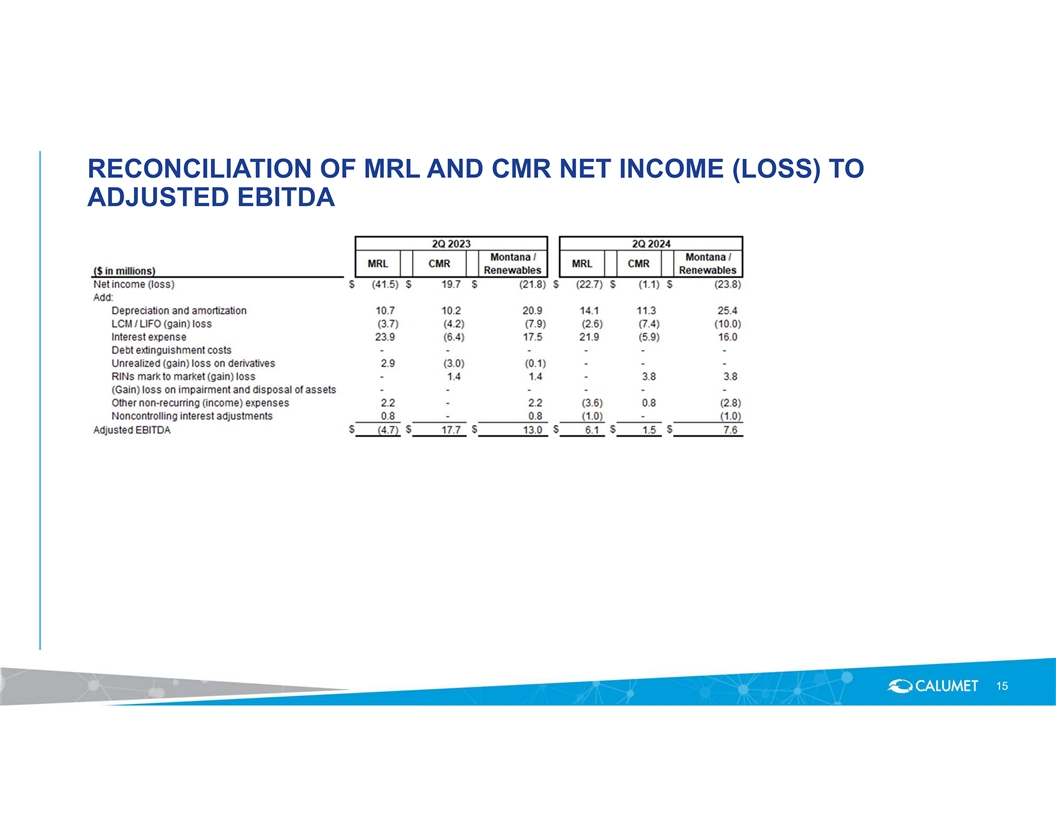
RECONCILIATION OF MRL AND CMR NET INCOME (LOSS) TO ADJUSTED EBITDA 15


