Exhibit 99.1

| Growing Forward Deutsche Bank Alternative Energy, Utilities, & Power Conference May 11, 2010 Thomas J. Webb Executive Vice President and CFO |
| This presentation contains "forward-looking statements" as defined in Rule 3b-6 of the Securities Exchange Act of 1934, as amended, Rule 175 of the Securities Act of 1933, as amended, and relevant legal decisions. The forward-looking statements are subject to risks and uncertainties. They should be read in conjunction with "FORWARD-LOOKING STATEMENTS AND INFORMATION" and "RISK FACTORS" sections of CMS Energy's and Consumers Energy's Form 10-K for the year ended December 31 and as updated in subsequent 10-Qs. CMS Energy's and Consumers Energy's "FORWARD-LOOKING STATEMENTS AND INFORMATION" and "RISK FACTORS" sections are incorporated herein by reference and discuss important factors that could cause CMS Energy's and Consumers Energy's results to differ materially from those anticipated in such statements. The presentation also includes non-GAAP measures when describing CMS Energy's results of operations and financial performance. A reconciliation of each of these measures to the most directly comparable GAAP measure is included in the appendix and posted on our website at www.cmsenergy.com. CMS Energy expects 2010 reported earnings to be about the same as adjusted earnings. Reported earnings could vary because of several factors. CMS Energy is not providing reported earnings guidance reconciliation because of the uncertainties associated with those factors. |
| Highlights Utility investment - visible: EPS growth of 6%-8% annually Operating cash flow growth of ^$100 million annually NOLs - avoid new equity near term Regulatory framework -- constructive Risks -- mitigated Dividend payout ratio -- growing |
| Recent Announcements Union ratified contract Five-year duration Increased benefit cost sharing Increased operational flexibility Big Rock decommissioning ($85 million) MPSC authorized refund over 7 months Supports Company's alternative Management transition |
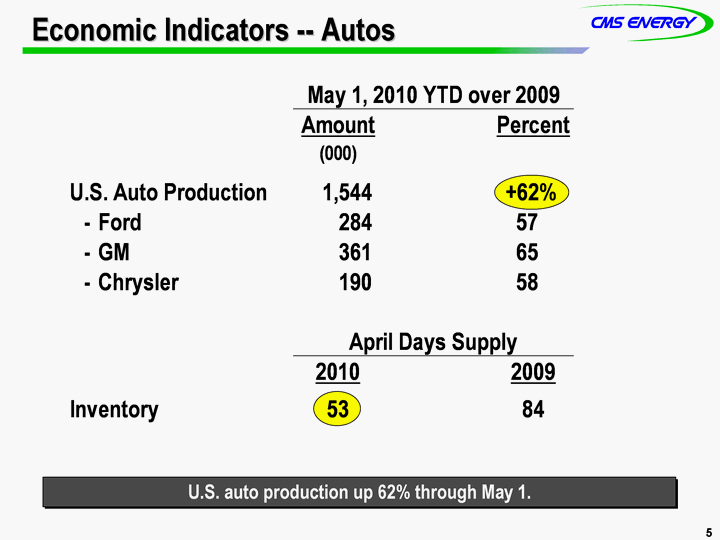
| Economic Indicators -- Autos U.S. auto production up 62% through May 1. |
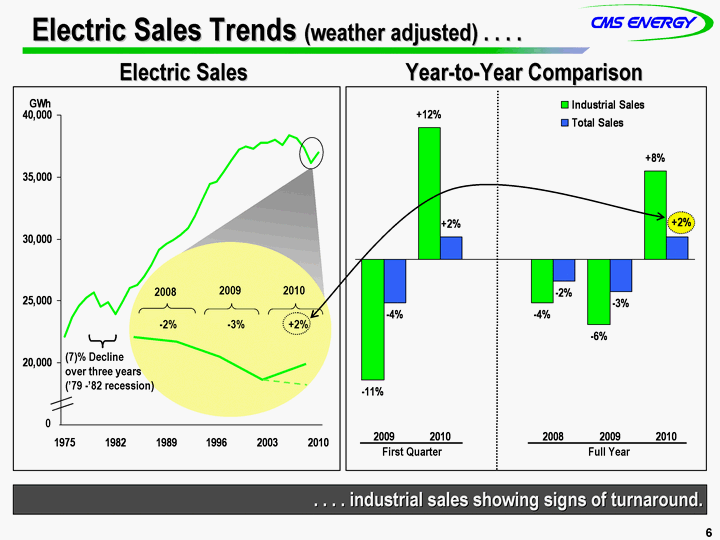
| Electric Sales Trends (weather adjusted) . . . . 1975 1976 1977 1978 1979 1980 1981 1982 1983 1984 1985 1986 1987 1988 1989 1990 1991 1992 1993 1994 1995 1996 1997 1998 1999 2000 2001 2002 2003 2004 2005 2006 2007 2008 2009 2010 August Plan 22145 23722 24572 25237 25707 24533 24875 23916 24893 26051 26305 26977 27928 29143 29623 29894 30325 30877 31868 33177 34465 34622 35462 36355 37234 37463 37301 37792 37746 38017 37586 38372 38098 37339 36123 36958 Revised Potential 37339 36000 Electric Sales Year-to-Year Comparison 0 (7)% Decline over three years ('79 -'82 recession) 2008 2009 - -2% - -3% .. . . . industrial sales showing signs of turnaround. 2010 +2% 2009 2010 2008 2009 2010 Industrial Sales -0.11 0.12 -0.04 -0.06 0.08 Total Sales -0.04 0.02 -0.02 -0.03 0.02 First Quarter Full Year |
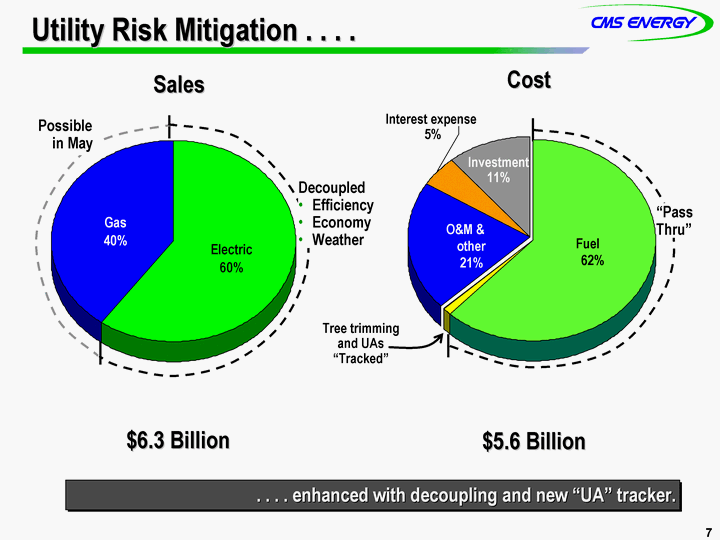
| Utility Risk Mitigation . . . . Electric Gas Revenue 0.6 0.4 Sales $6.3 Billion $5.6 Billion Interest expense 5% Tree trimming and UAs "Tracked" .. . . . enhanced with decoupling and new "UA" tracker. Decoupled Efficiency Economy Weather Possible in May Cost Fuel 62% O&M & other 21% Investment 11% "Pass Thru" |

| Business Strategy Maintain safe, excellent operations Invest in Utility $7 billion over next 5 years Fair and timely recovery Deliver 6%-8% adjusted EPS growth $1.26 in 2009 $1.35 guidance 2010 Grow dividend payout to: 44% in 2010 Peer average in future Generate strong cash flow $100 million annually Liquidity Strategy Outcome Regulated rate base growth story. |
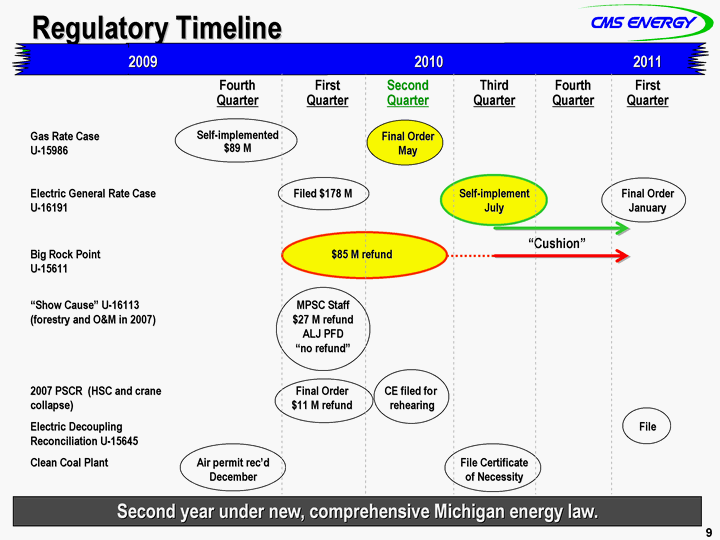
| Regulatory Timeline Second year under new, comprehensive Michigan energy law. 2009 2010 2010 2010 2010 2010 2010 2010 2010 2010 2011 Fourth Quarter Fourth Quarter First Quarter First Quarter Second Quarter Third Quarter Fourth Quarter Fourth Quarter First Quarter Gas Rate Case U-15986 Self-implemented $89 M Self-implemented $89 M Final Order May Electric General Rate Case U-16191 Filed $178 M Filed $178 M Filed $178 M Self-implement July Final Order January Big Rock Point U-15611 $85 M refund $85 M refund $85 M refund $85 M refund $85 M refund "Show Cause" U-16113 (forestry and O&M in 2007) MPSC Staff $27 M refund ALJ PFD "no refund" MPSC Staff $27 M refund ALJ PFD "no refund" MPSC Staff $27 M refund ALJ PFD "no refund" 2007 PSCR (HSC and crane collapse) Final Order $11 M refund Final Order $11 M refund CE filed for rehearing Electric Decoupling Reconciliation U-15645 File Clean Coal Plant Air permit rec'd December File Certificate of Necessity "Cushion" |
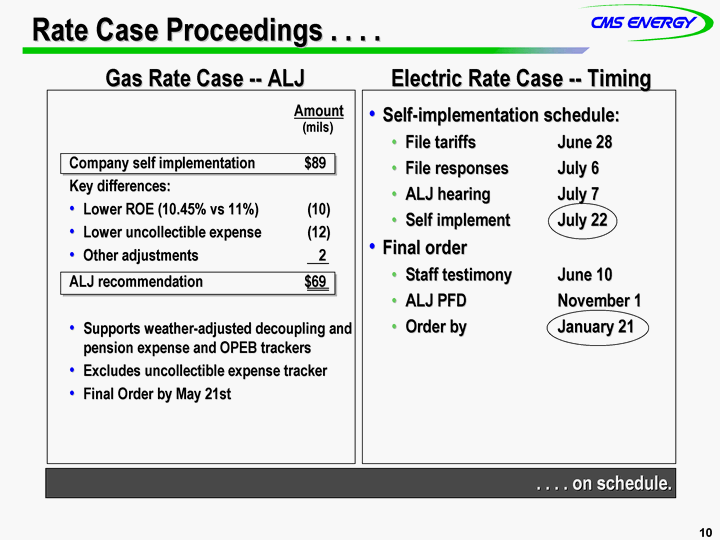
| Rate Case Proceedings . . . . Amount (mils) Company self implementation $89 Key differences: Lower ROE (10.45% vs 11%) (10) Lower uncollectible expense (12) Other adjustments 2 ALJ recommendation $69 Supports weather-adjusted decoupling and pension expense and OPEB trackers Excludes uncollectible expense tracker Final Order by May 21st Self-implementation schedule: File tariffs June 28 File responses July 6 ALJ hearing July 7 Self implement July 22 Final order Staff testimony June 10 ALJ PFD November 1 Order by January 21 .. . . . on schedule. Electric Rate Case -- Timing Gas Rate Case -- ALJ |
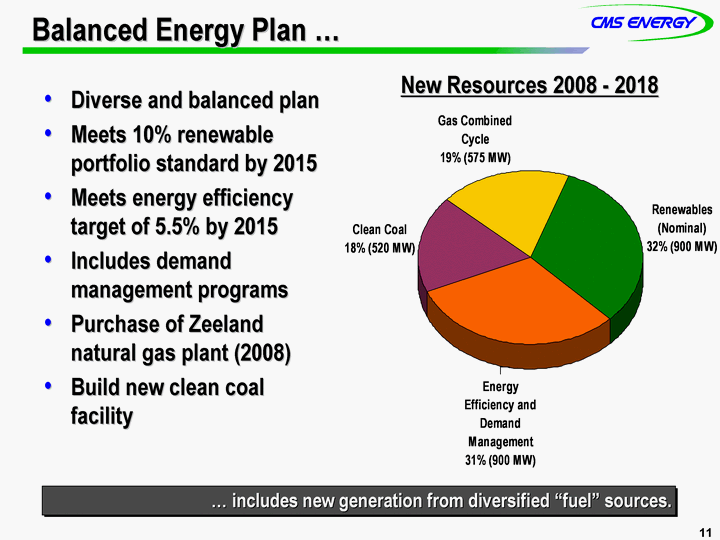
| Balanced Energy Plan ... Diverse and balanced plan Meets 10% renewable portfolio standard by 2015 Meets energy efficiency target of 5.5% by 2015 Includes demand management programs Purchase of Zeeland natural gas plant (2008) Build new clean coal facility Renewables (Nominal) Energy Efficiency and Demand Management Clean Coal Gas Combined Cycle 32 31 18 19 New Resources 2008 - 2018 .... includes new generation from diversified "fuel" sources. |
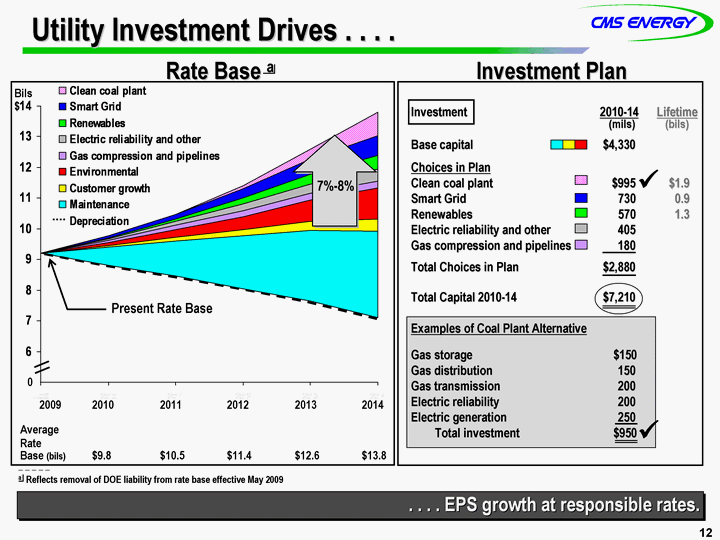
| Investment Plan 2008 2009 2010 2011 2012 2013 2014 Depreciation 7.851 8.729 9.2 8.811 8.45 8.053 7.654 7.093 Maintenance 0.58 1.151 1.718 2.282 2.816 Customer growth 0.058 0.123 0.204 0.3 0.399 Environmental 0.104 0.242 0.423 0.705 1.03 Gas compression and pipelines 0.078 0.143 0.182 0.204 0.213 Electric reliability and other 0.054 0.127 0.225 0.316 0.392 Renewables 0.02 0.072 0.211 0.316 0.444 Smart Grid 0.06 0.148 0.301 0.493 0.657 Clean coal plant 0.008 0.018 0.085 0.331 0.756 7%-8% Utility Investment Drives . . . . Rate Base a Bils $ Present Rate Base 2009 2010 2011 2012 2013 2014 Average Rate Base (bils) $9.8 $10.5 $11.4 $12.6 $13.8 .. . . . EPS growth at responsible rates. Investment 2010-14 Lifetime (mils) (bils) Base capital $ 4,330 Choices in Plan Clean coal plant $ 995 $1.9 Smart Grid 730 0.9 Renewables 570 1.3 Electric reliability and other 405 Gas compression and pipelines 180 Total Choices in Plan $ 2,880 Total Capital 2010-14 $ 7,210 Examples of Coal Plant Alternative Gas storage $150 Gas distribution 150 Gas transmission 200 Electric reliability 200 Electric generation 250 Total investment $950 _ _ _ _ _ a Reflects removal of DOE liability from rate base effective May 2009 0 ? ? |
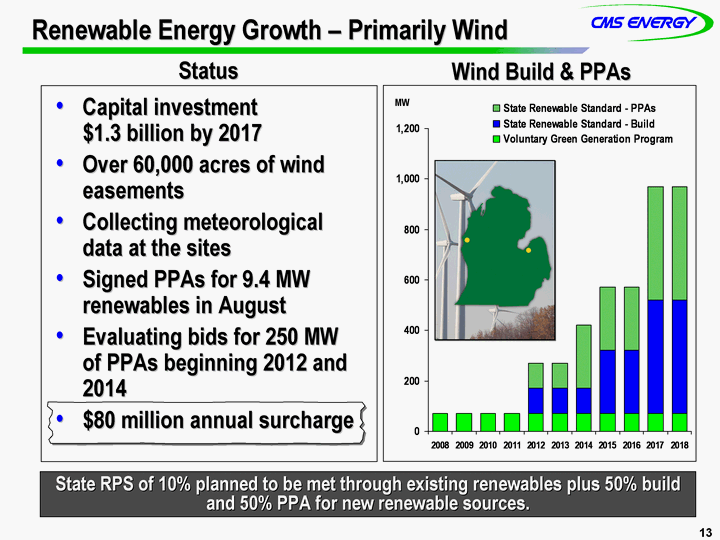
| Renewable Energy Growth - Primarily Wind Capital investment $1.3 billion by 2017 Over 60,000 acres of wind easements Collecting meteorological data at the sites Signed PPAs for 9.4 MW renewables in August Evaluating bids for 250 MW of PPAs beginning 2012 and 2014 $80 million annual surcharge 2008 2009 2010 2011 2012 2013 2014 2015 2016 2017 2018 Voluntary Green Generation Program 71 71 71 71 71 71 71 71 71 71 71 State Renewable Standard - Build 100 100 100 250 250 450 450 State Renewable Standard - PPAs 100 100 250 250 250 450 450 State RPS of 10% planned to be met through existing renewables plus 50% build and 50% PPA for new renewable sources. Status Wind Build & PPAs MW |
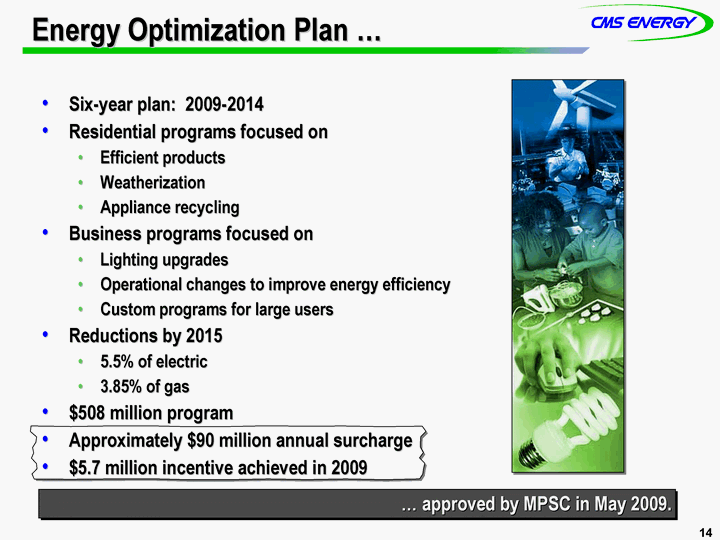
| Energy Optimization Plan ... Six-year plan: 2009-2014 Residential programs focused on Efficient products Weatherization Appliance recycling Business programs focused on Lighting upgrades Operational changes to improve energy efficiency Custom programs for large users Reductions by 2015 5.5% of electric 3.85% of gas $508 million program Approximately $90 million annual surcharge $5.7 million incentive achieved in 2009 .... approved by MPSC in May 2009. |
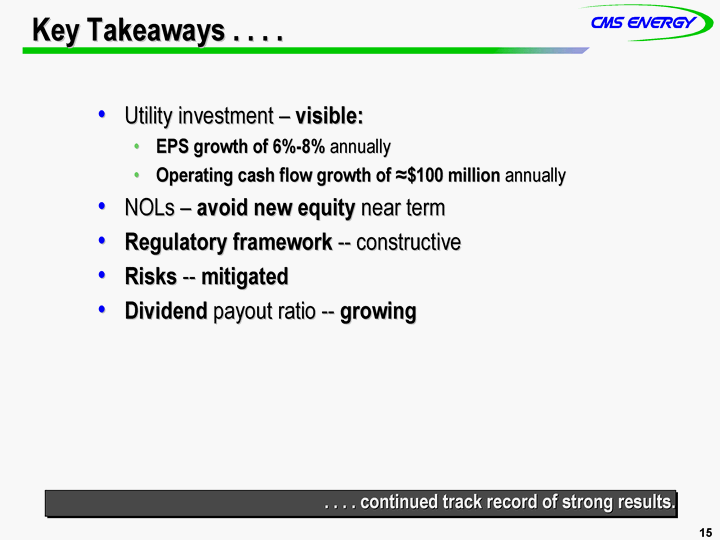
| Key Takeaways . . . . Utility investment - visible: EPS growth of 6%-8% annually Operating cash flow growth of ^$100 million annually NOLs - avoid new equity near term Regulatory framework -- constructive Risks -- mitigated Dividend payout ratio -- growing .. . . . continued track record of strong results. |

 ELECTRIC RATE CASE U-16191*
On January 22, 2010, Consumers Energy filed an application with the Michigan Public Service Commission seeking an increase in its electric generation and distribution rates based on a June 2011 test year. The request seeks authority to recover new investment in system reliability, environmental compliance and technology enhancements. These investments are part of the Company’s Growing Forward strategy which calls for investing more than $6 billion in utility operations over the next five years. The proposed overall rate of return is based on an 11.0% authorized return on equity. If approved, the request would increase customer rates by an average of 5.2%. The $178 million request is detailed below.
| | | | | | | |
| Item | | $ Millions | | | Explanation |
| 1. O&M | | $ | 49 | | | Generation reliability and environmental: $25
Technology: $24 |
| 2. Gross Margin | | | 5 | | | Reduced third-party revenues; lower sales will be addressed in sales decoupling mechanism. |
| 3. Investment | | | 106 | | | Net plant (distribution and generation reliability, environmental and technology): $72
Working capital: $29
Depreciation and property taxes: $21
DOE Liability: ($5)
Taxes, AFUDC, and other: ($11) |
| 4. Cost of Capital | | | 18 | | | Higher return on equity (11% vs. 10.7%): $12
Other capitalization costs: $6 |
| | | | | | |
| Total | | $ | 178 | | | |
| | | | | | |
| | | | | | | | | | | | | | | | | |
| Ratemaking | | Existing | | As Filed | | | | | | After-Tax |
| Capital Structure | | (U-15645) | | Percent of Total | | Annual Cost | | Weighted Costs |
| Long Term Debt | | | 44.80 | % | | | 41.77 | % | | | 5.92 | % | | | 2.47 | % |
| Short Term Debt | | | 0.78 | | | | 1.51 | | | | 3.96 | | | | 0.06 | |
| Preferred Stock | | | 0.48 | | | | 0.44 | | | | 4.46 | | | | 0.02 | |
| Common Equity | | | 40.51 | | | | 41.49 | (1) | | | 11.00 | | | | 4.56 | |
| Deferred FIT | | | 12.80 | | | | 14.26 | | | | 0.00 | | | | 0.00 | |
| JDITC/Other | | | 0.63 | | | | 0.53 | | | | 8.50 | | | | 0.05 | |
| | | | | | | | | | | | | | | | | |
| | | | 100.00 | % | | | 100.00 | % | | | | | | | 7.16 | %(2) |
| | | | | | | | | | | | | | | | | |
| | | | | | | | | |
| | | Existing | | |
| Rate Base and Return | | (U-15645) | | As Filed |
| Rate Base ($ billions) | | $ | 6.16 | | | $ | 6.97 | |
| Return on Rate Base | | | 6.98 | % | | | 7.16 | % |
| Return on Equity | | | 10.70 | % | | | 11.00 | % |
| | |
| (1) | | Equivalent to 49.57% on a financial basis. |
| |
| (2) | | Equivalent to 10.10% pre-tax basis. |
ELECTRIC RATE CASE SCHEDULE
| | | |
|
| Staff & Intervenors File Testimony | | June 10, 2010 |
| Consumers Files Self-implementation Rates | | June 28, 2010 |
| Rebuttal Testimony | | July 1, 2010 |
| Motions to Strike Testimony | | July 8, 2010 |
| Replies to Motions to Strike | | July 13, 2010 |
| Self-implementation Under PA 286 | | July 22, 2010 |
| Cross of all Witnesses | | July 15-28, 2010 |
| Initial Briefs | | August 26, 2010 |
| Reply Briefs | | September 16, 2010 |
| Proposal for Decision | | November 1, 2010 |
| Commission Order | | By January 21, 2011 |
| | |
| * | | Electric Rate Case U-16191 can be accessed at the Michigan Public Service Commission’s website.
http://efile.mpsc.cis.state.mi.us/efile/electric.html |
Appendix-1
GAS RATE CASE U-15986* On March 24, 2010, the Administrative Law Judge (ALJ) filed his Proposal for Decision (PFD) in Consumers Energy’s request for gas rate relief. If adopted, the ALJ’s recommendation would result in a base rate increase of $69 million, which is $20 million less than the amount implemented by the Company in November. The ALJ’s recommended increase is $4 million less than the MPSC’s recommendation (revised per their brief filed on January 27, 2010). The ALJ recommended approval of the revenue decoupling mechanism proposed by the Company, with a modification to reflect weather-normal consumption. He also recommended approval of the pension and OPEB equalization mechanisms (PEM and OEM). He recommended, however, that the MPSC not approve the Company’s proposed Uncollectibles Expense True-Up Mechanism (UETM). Details comparing the ALJ’s position with both the Company’s self-implemented amount and the MPSC Staff’s revised position are provided below:
| | | | | | | | | | | | | | | |
| | | Company | | | Revised | | | | | | |
| | | Self | | | MPSC | | | ALJ | | | Explanation of Variance |
| Item | | Implement | | | Staff(1) | | | PFD | | | Between Company and ALJ |
| | | (mils) | | | (mils) | | | (mils) | | | |
| 1. O&M | | $ | 17 | | | $ | 12 | | | $ | 12 | | | Uncollectible accounts expense: $(12)
Standard retirement units: $7 |
| 2. Sales | | | 41 | | | | 38 | | | | 35 | | | Higher throughput: $(3); (273 Bcf vs. 272 Bcf)
Miscellaneous revenues: $(3) |
| 3. Investment | | | 23 | | | | 23 | | | | 24 | | | Standard retirement units: $1; Shift from Capital to O&M |
| 4. Cost of Capital | | | 8 | | | | 0 | | | | (2 | ) | | Lower Return on Equity: $(10); (10.45% vs. 11.00%) |
| | | | | | | | | | | | | | | |
| | | | | | | | | | | | |
| Total | | $ | 89 | | | $ | 73 | | | $ | 69 | | | |
| | | | | | | | | | | | |
| | | | | | | | | | | | | | | | | |
| Ratemaking | | Existing | | Company | | Revised | | ALJ |
| Capital Structure | | (U-15506) | | Self Implement | | MPSC Staff | | PFD |
| Long Term Debt | | | 42.71 | % | | | 43.43 | % | | | 43.58 | % | | | 43.58 | % |
| Short Term Debt | | | 0.66 | | | | 0.58 | | | | 0.34 | | | | 0.59 | |
| Preferred Stock | | | 0.49 | | | | 0.46 | | | | 0.46 | | | | 0.46 | |
| Common Equity | | | 41.78 | | | | 41.07 | (2) | | | 40.78 | | | | 40.78 | |
| Deferred Taxes | | | 12.94 | | | | 13.17 | | | | 13.30 | | | | 13.30 | |
| JDITC/Other | | | 1.42 | | | | 1.29 | | | | 1.54 | | | | 1.29 | |
| | | | | | | | | | | | | | | | | |
| | | | 100.00 | % | | | 100.00 | % | | | 100.00 | % | | | 100.00 | % |
| | | | | | | | | | | | | | | | | |
| | | | | | | | | | | | | | | | | |
| Rate Base and Return | | Existing | | Company | | Revised | | ALJ |
| Percentage | | (U-15506) | | Self Implement | | MPSC Staff | | PFD |
| Rate Base ($ billions) | | $ | 2.52 | | | $ | 2.76 | | | $ | 2.75 | | | $ | 2.75 | |
| Return on Rate Base | | | 7.03 | % | | | 7.28 | % | | | 7.06 | % | | | 6.99 | % |
| Return on Equity | | | 10.55 | % | | | 11.00 | % | | | 10.70 | % | | | 10.45 | % |
GAS RATE CASE SCHEDULE — UPDATED AS OF MARCH 25, 2010
| | | |
|
| Exceptions | | April 7, 2010 |
| Replies to Exceptions | | April 21, 2010 |
| Commission Order | | May 21, 2010 |
| | |
| (1) | | The Company assumes this is Staff’s recommended revenue deficiency, based on positions taken in their brief |
| |
| (2) | | Equivalent to 48.34% on a financial basis. |
| |
| * | | Gas Rate Case U-15986 can be accessed at the Michigan Public Service Commission’s website.
http://efile.mpsc.cis.state.mi.us/efile/gas.html |
Appendix-2
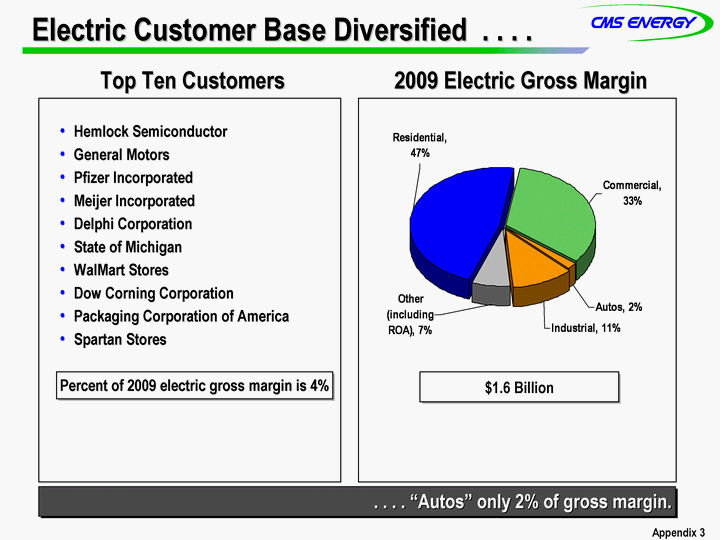
| Electric Customer Base Diversified . . . . Hemlock Semiconductor General Motors Pfizer Incorporated Meijer Incorporated Delphi Corporation State of Michigan WalMart Stores Dow Corning Corporation Packaging Corporation of America Spartan Stores Percent of 2009 electric gross margin is 4% Top Ten Customers Residential Commercial Autos Industrial Other (including ROA) 0.47 0.33 0.02 0.11 0.07 $1.6 Billion .. . . . "Autos" only 2% of gross margin. 2009 Electric Gross Margin Appendix 3 |
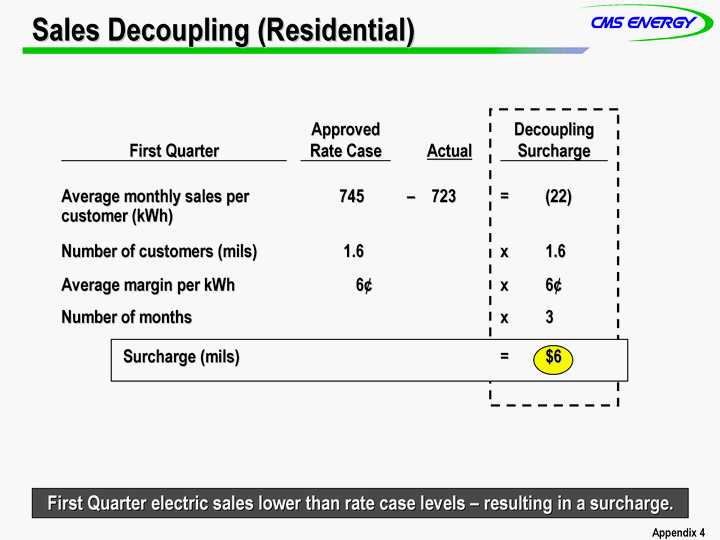
| Sales Decoupling (Residential) First Quarter Approved Rate Case Actual Decoupling Surcharge Average monthly sales per customer (kWh) 745 - 723 = (22) Number of customers (mils) 1.6 x 1.6 Average margin per kWh 6¢ x 6¢ Number of months x 3 Surcharge (mils) = $6 First Quarter electric sales lower than rate case levels - resulting in a surcharge. Appendix 4 |
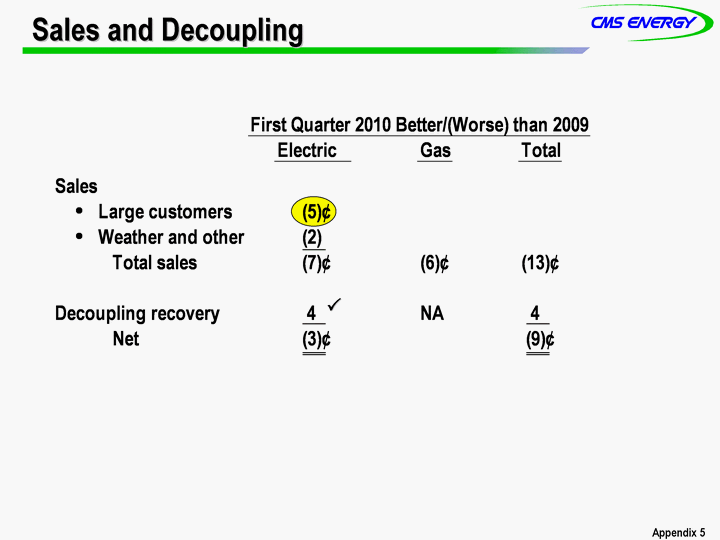
| Sales and Decoupling ? Appendix 5 |
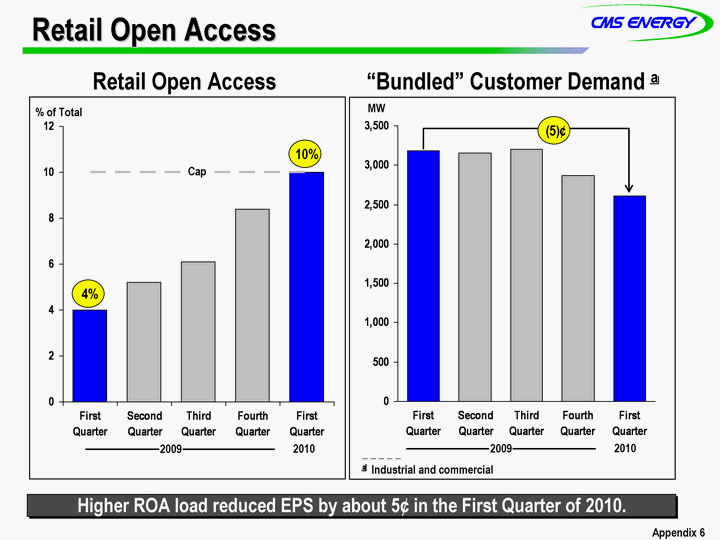
| Retail Open Access Retail Open Access Higher ROA load reduced EPS by about 5¢ in the First Quarter of 2010. First Quarter Second Quarter Third Quarter Fourth Quarter First Quarter 4 5.2 6.1 8.4 10 10 10 10 10 10 % of Total 2010 2009 10% First Quarter Second Quarter Third Quarter Fourth Quarter First Quarter 3185 3160 3204 2865 2607 "Bundled" Customer Demand a MW 2010 2009 (5)¢ Cap _ _ _ _ _ a Industrial and commercial 4% Appendix 6 |
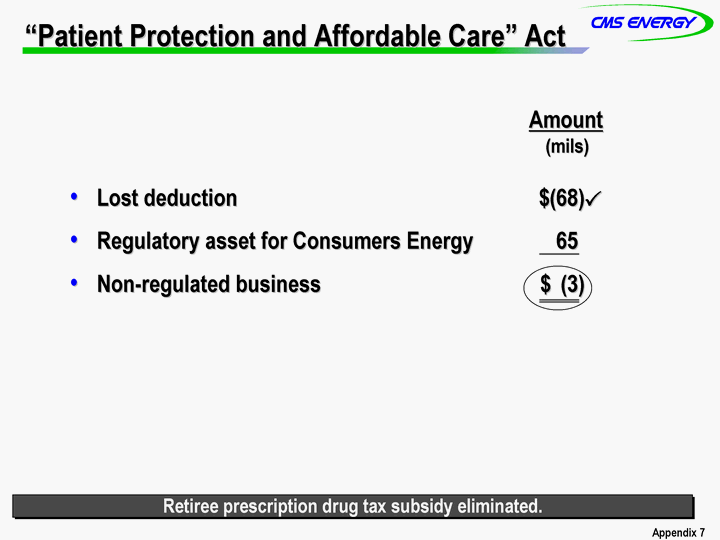
| "Patient Protection and Affordable Care" Act Amount (mils) Lost deduction $(68) Regulatory asset for Consumers Energy 65 Non-regulated business $ (3) Retiree prescription drug tax subsidy eliminated. ? Appendix 7 |
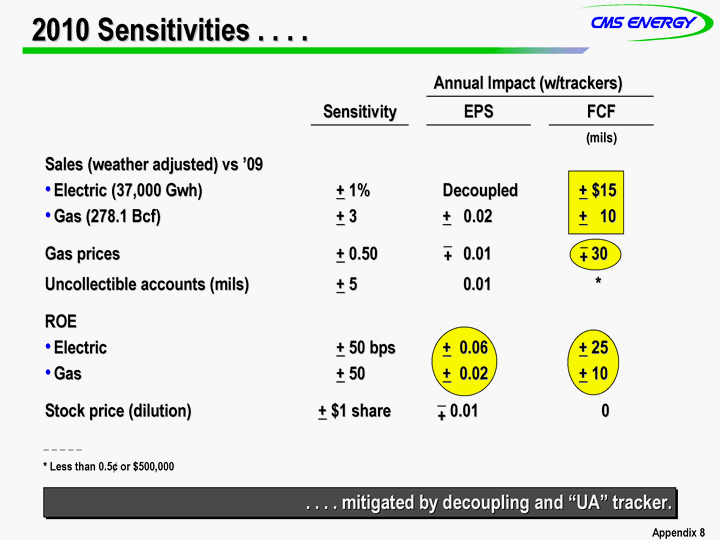
| 2010 Sensitivities . . . . _ _ _ _ _ * Less than 0.5¢ or $500,000 .. . . . mitigated by decoupling and "UA" tracker. Annual Impact (w/trackers) Annual Impact (w/trackers) Annual Impact (w/trackers) Sensitivity EPS FCF (mils) Sales (weather adjusted) vs '09 Electric (37,000 Gwh) Gas (278.1 Bcf) + 1% + 3 Decoupled + 0.02 + $15 + 10 Gas prices + 0.50 0.01 30 Uncollectible accounts (mils) + 5 0.01 * ROE Electric Gas + 50 bps + 50 + 0.06 + 0.02 + 25 + 10 Stock price (dilution) + $1 share 0.01 0 + + + Appendix 8 |
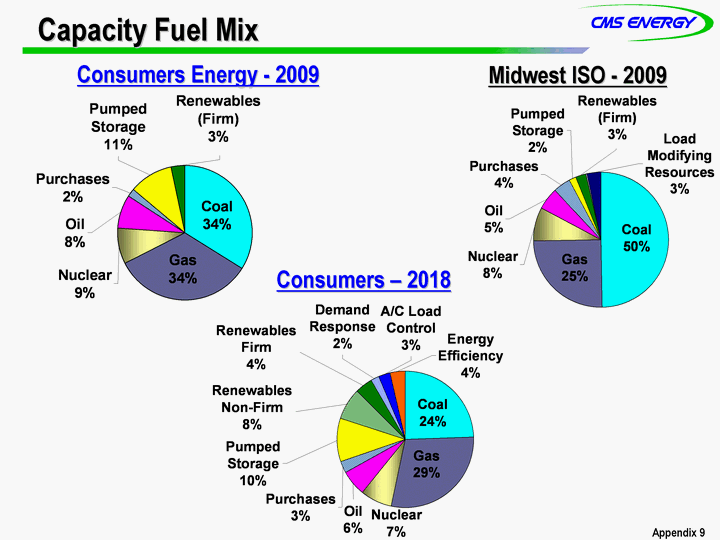
| Capacity Fuel Mix Capacity Fuel Mix Capacity Fuel Mix Capacity Fuel Mix Midwest ISO - 2009 Consumers Energy - 2009 Consumers - 2018 Appendix 9 |
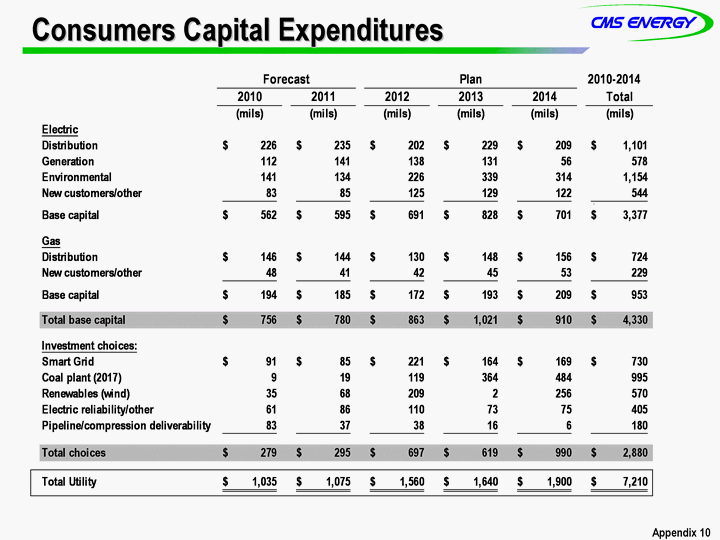
| Consumers Capital Expenditures Appendix 10 |
MATURITY SCHEDULE OF CMS AND CECO LONG-TERM DEBT & PREFERRED SECURITIES
AS OF 03/31/2010
Reflects change in reporting outstanding amount for QUIPS, which now excludes subordinated notes; related to consolidation of CMS Energy Trust I per ASU No. 2009-17
| | | | | | | | | | | | | | | | | |
| | | | | | | | | Maturity | | | Amount | | | |
| F/V | | | S/U | | | or Call Date | | | (000’s) | | | DEBT/ CO |
| SHORT-TERM DEBT: | | | | | | |
| | F | | | | S | | | | 05/15/10 | | | $ | 250,000 | | | 4% FMBs (CECo) |
| | F | | | | S | | | | 06/15/10 | | | | 30,000 | | | 3.375% Fixed PCRBs (CECo) |
| | F | | | | S | | | | 06/15/10 | | | | 27,900 | | | 4.25% PCRBs (CECo) |
| | F | | | | U | | | | 08/01/10 | | | | 67,291 | | | 7.75% Sr Unsec Notes (CMS) |
| | F | | | | U | | | SHORT-TERM | | | 139,730 | | | *3.375% Convertible Sr Notes Put Date (CMS) |
| | | | | | | | | | | | | | | | |
| | | | | | | | | | | | | $ | 514,921 | | | |
| | | | | | | | | | | | | | | | | |
| LONG-TERM DEBT: | | | | | | |
| | F | | | | U | | | | 04/15/11 | | | $ | 213,653 | | | 8.5% Sr Notes (CMS) |
| | F | | | | U | | | | 12/01/11 | | | | 287,500 | | | *2.875% Convertible Sr Unsec Notes Put Date (CMS) |
| | | | | | | | | | | | | | | | |
| | | | | | | | | | | | | $ | 501,153 | | | |
| | F | | | | U | | | | 02/01/12 | | | | 150,000 | | | 6.3% Senior Notes (CMS) |
| | F | | | | S | | | | 02/15/12 | | | | 300,000 | | | 5% Series L FMBs (CECo) |
| | | | | | | | | | | | | | | | |
| | | | | | | | | | | | | $ | 450,000 | | | |
| | V | | | | U | | | | 01/15/13 | | | $ | 150,000 | | | Floating Rate Sr Notes (CMS) |
| | F | | | | S | | | | 04/15/13 | | | | 375,000 | | | 5.375% Series B FMBs (CECo) |
| | | | | | | | | | | | | | | | |
| | | | | | | | | | | | | $ | 525,000 | | | |
| | F | | | | S | | | | 02/15/14 | | | $ | 200,000 | | | 6% FMBs (CECo) |
| | F | | | | U | | | | 06/15/14 | | | | 172,500 | | | 5.5% Convertible Sr NotesPut Date(CMS) |
| | F | | | | S | | | | 03/15/15 | | | | 225,000 | | | 5% FMBs Series N (CECo) |
| | F | | | | U | | | | 12/15/15 | | | | 125,000 | | | 6.875% Sr Notes (CMS) |
| | F | | | | S | | | | 08/15/16 | | | | 350,000 | | | 5.5% Series M FMBs (CECo) |
| | F | | | | S | | | | 02/15/17 | | | | 250,000 | | | 5.15% FMBs (CECo) |
| | F | | | | U | | | | 07/17/17 | | | | 250,000 | | | 6.55% Sr Notes (CMS) |
| | F | | | | S | | | | 03/01/18 | | | | 180,000 | | | 6.875% Sr Notes (CECo) |
| | V | | | | S | | | | 04/15/18 | | | | 67,700 | | | VRDBs to replace PCRBs (CECo) |
| | F | | | | S | | | | 09/15/18 | | | | 250,000 | | | 5.65% FMBs (CECo) |
| | F | | | | S | | | | 03/15/19 | | | | 350,000 | | | 6.125% FMBs (CECo) |
| | F | | | | U | | | | 06/15/19 | | | | 300,000 | | | 8.75% Sr Notes (CMS) |
| | F | | | | S | | | | 09/15/19 | | | | 500,000 | | | 6.70% FMBs (CECo) |
| | F | | | | U | | | | 2/1/2020 | | | | 300,000 | | | 6.25% Sr Notes (CMS) |
| | F | | | | S | | | | 04/15/20 | | | | 300,000 | | | 5.65% FMBs (CECo) |
| | F | | | | U | | | | 07/15/27 | | | | 28,667 | | | QUIPS 7.75%(CMS)Pref Sec |
| | V | | | | S | | | | 04/01/35 | | | | 35,000 | | | PCRBs (CECo) |
| | F | | | | S | | | | 04/15/35 | | | | 137,883 | | | 5.65% FMBs IQ Notes (CECo) |
| | F | | | | S | | | | 09/15/35 | | | | 175,000 | | | 5.80% FMBs (CECo) |
| | | | | | | | | | | | | | | | |
| | | | | | | | | | | | | $ | 4,196,750 | | | |
| | | | | | | | | | | | | $ | 6,187,824 | | | TOTAL |
| | | | | | | | | | | | | | | | |
| | | | | | | | | | | | | | | | | |
| | | | | | | | | | | | | $ | 6,159,157 | | | TOTAL EXCLUDING PREFERRED SECURITIES |
| | | | | | | | | | | | | | | | |
| |
| Various Maturity Dates/No Maturity Date Available: |
| | | | | | | | | | | | | | 234,861 | | | CECo Securitization Bonds (Long-Term & Short-Term) after 01/20/10 payment |
| | | | | | | | | | | | | | 227,118 | | | CECo Capital lease rental commitments (Long-Term & Short-Term) as of 03/31/10 |
| | | | | | | | | | | | | | 162,840 | | | CECo DOE Liability as of 03/31/10 |
| | | | | | | | | | | | | | 239,698 | | | EnerBank (Long-Term & Short-Term) Discount Brokered CDs as of 03/31/10 (CMS) |
| | | | | | | | | | | | | | (36,048 | ) | | CMS Net unamortized discount as of 03/31/10 |
| | | | | | | | | | | | | | (4,727 | ) | | CECo Net unamortized discount as of 03/31/10 |
| | | | | | | | | | | | | | | | |
| | | | | | | | | | | | | $ | 7,011,565 | | | GRAND TOTAL INCLUDING CMS ENERGY, CONSUMERS & OTHER CMS ENTERPRISES SUBSIDIARIES, INCLUDING PREFERRED SECURITIES |
| | |
| * | | — Date that issue can be put to the Company is used instead of maturity date |
| |
| | | Status Codes: F-Fixed rate; V-Variable rate; S-Secured; U-Unsecured |
Appendix-11
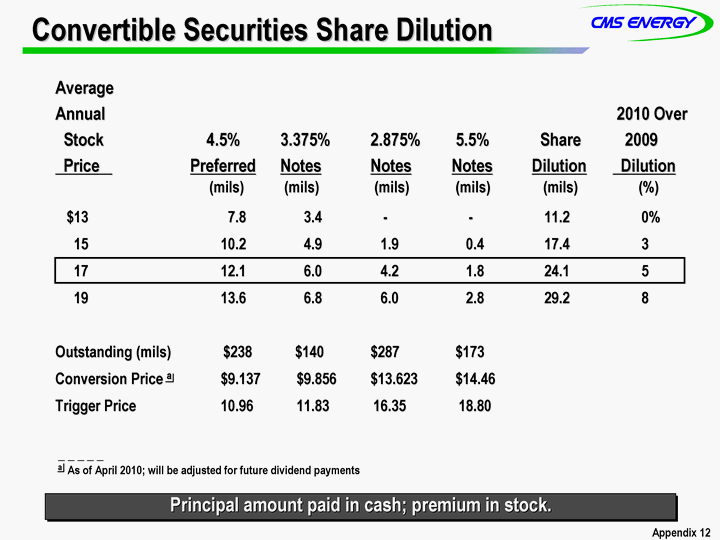
| Convertible Securities Share Dilution Average Annual 2010 Over Stock 4.5% 3.375% 2.875% 5.5% Share 2009 Price Preferred Notes Notes Notes Dilution Dilution (mils) (mils) (mils) (mils) (mils) (%) $13 7.8 3.4 - - 11.2 0% 15 10.2 4.9 1.9 0.4 17.4 3 17 12.1 6.0 4.2 1.8 24.1 5 19 13.6 6.8 6.0 2.8 29.2 8 Outstanding (mils) $238 $140 $287 $173 Conversion Price a $9.137 $9.856 $13.623 $14.46 Trigger Price 10.96 11.83 16.35 18.80 Principal amount paid in cash; premium in stock. _ _ _ _ _ a As of April 2010; will be adjusted for future dividend payments Appendix 12 |
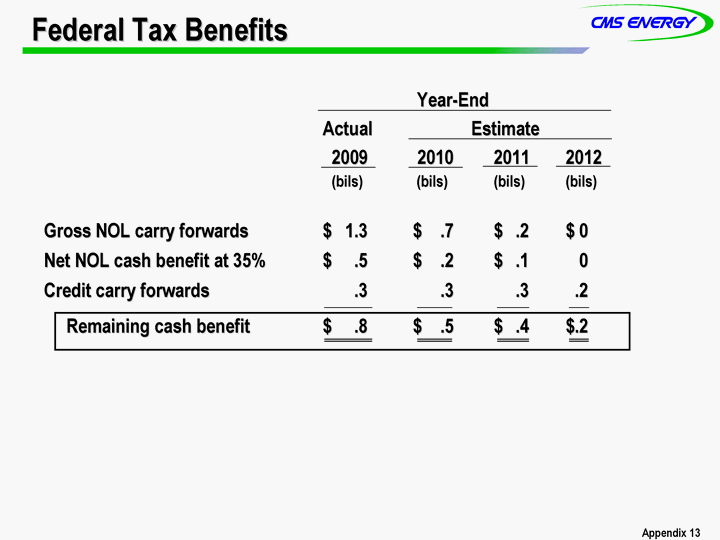
| Federal Tax Benefits Appendix 13 Year-End Actual Estimate 2009 2010 2011 2012 (bils) (bils) (bils) (bils) Gross NOL carry forwards $ 1.3 $ .7 $ .2 $ 0 Net NOL cash benefit at 35% $ .5 $ .2 $ .1 0 Credit carry forwards .3 .3 .3 .2 Remaining cash benefit $ .8 $ .5 $ .4 $.2 |
CMS ENERGY CORPORATION
Earnings By Quarter and Year GAAP Reconciliation
(Unaudited)
| | | | | | | | | | | | | | | | | | | | | |
| (In millions, except per share amounts) | | 2009 |
| |
| | | 1Q | | 2Q | | 3Q | | 4Q | | Dec YTD |
| | |
Reported net income — GAAP | | $ | 70 | | | $ | 75 | | | $ | 67 | | | $ | 6 | | | $ | 218 | |
| |
After-tax items: | | | | | | | | | | | | | | | | | | | | |
| Electric and gas utility | | | — | | | | — | | | | — | | | | 79 | | | | 79 | |
| Enterprises | | | * | | | | 16 | | | | 2 | | | | 4 | | | | 22 | |
| Corporate interest and other | | | * | | | | 1 | | | | 1 | | | | (1 | ) | | | 1 | |
| Discontinued operations (income) loss | | | 1 | | | | (25 | ) | | | 1 | | | | 3 | | | | (20 | ) |
| |
Adjusted income — non-GAAP | | $ | 71 | | | $ | 67 | | | $ | 71 | | | $ | 91 | | | $ | 300 | |
| |
| | | | | | | | | | | | | | | | | | | | | |
Average shares outstanding, basic | | | 226.6 | | | | 226.9 | | | | 227.3 | | | | 227.8 | | | | 227.2 | |
Average shares outstanding, diluted | | | 233.2 | | | | 234.6 | | | | 238.5 | | | | 243.0 | | | | 237.9 | |
| | | | | | | | | | | | | | | | | | | | | |
| |
Reported earnings per share — GAAP | | $ | 0.30 | | | $ | 0.32 | | | $ | 0.28 | | | $ | 0.02 | | | $ | 0.91 | |
| |
After-tax items: | | | | | | | | | | | | | | | | | | | | |
| Electric and gas utility | | | — | | | | — | | | | — | | | | 0.33 | | | | 0.33 | |
| Enterprises | | | * | | | | 0.07 | | | | 0.01 | | | | 0.02 | | | | 0.09 | |
| Corporate interest and other | | | * | | | | * | | | | * | | | | (* | ) | | | 0.01 | |
| Discontinued operations (income) loss | | | 0.01 | | | | (0.11 | ) | | | 0.01 | | | | 0.01 | | | | (0.08 | ) |
| |
Adjusted earnings per share — non-GAAP | | $ | 0.31 | | | $ | 0.28 | | | $ | 0.30 | | | $ | 0.38 | | | $ | 1.26 | |
| |
| | |
| Note: Year-to-date (YTD) EPS may not equal sum of quarters due to share count differences. |
| |
| * | | Less than $500 thousand or $0.01 per share. |
Consumers Energy
Gross Margin Reconciliation
December 31, 2009
Reconciliation of reported measures prepared in accordance with
Generally Accepted Accounting Principles (GAAP) versus non-GAAP measures
in millions (unaudited)
| | | | | | | | | | | | | |
| Year Ended December 31, 2009 | | Electric | | Gas utility | | Consolidated |
| |
Reported Operating Revenue — GAAP | | $ | 3,407 | | | $ | 2,556 | | | $ | 5,963 | |
| Less intersystem sales, net | | | 94 | | | | — | | | | 94 | |
| |
Adjusted Operating Revenue — non-GAAP | | $ | 3,313 | | | $ | 2,556 | | | $ | 5,869 | |
| | | | | | | | | | | | | |
| Energy costs: | | | | | | | | | | | | |
| Fuel for electric generation | | | 460 | | | | — | | | | 460 | |
| Purchased and interchange power | | | 1,151 | | | | — | | | | 1,151 | |
| Purchased power — related parties | | | 81 | | | | — | | | | 81 | |
| Cost of gas | | | — | | | | 1,778 | | | | 1,778 | |
| | | |
Gross margin — non-GAAP | | $ | 1,621 | | | $ | 778 | | | $ | 2,399 | |
| | | | | | | | | | | | | |
| Other operating and maintenance expenses | | | 646 | | | | 399 | | | | 1,045 | |
| Depreciation and amortization | | | 441 | | | | 118 | | | | 559 | |
| General taxes | | | 149 | | | | 60 | | | | 209 | |
| Loss (gain) on asset sales, net | | | (9 | ) | | | — | | | | (9 | ) |
| |
| Total Operating Expenses | | $ | 2,919 | | | $ | 2,355 | | | $ | 5,274 | |
| | | | | | | | | | | | | |
Adjusted Operating Income — non-GAAP | | $ | 394 | | | $ | 201 | | | $ | 595 | |
| Plus intersystem sales, net | | | 94 | | | | — | | | | 94 | |
| |
Reported Operating Income — GAAP | | $ | 488 | | | $ | 201 | | | $ | 689 | |
| |
2009A–2