Exhibit 99.1

| Barclays Capital Energy/Power Conference September 15, 2010 Thomas J. Webb Executive Vice President and CFO Growing Forward |
| This presentation contains "forward-looking statements" as defined in Rule 3b-6 of the Securities Exchange Act of 1934, as amended, Rule 175 of the Securities Act of 1933, as amended, and relevant legal decisions. The forward-looking statements are subject to risks and uncertainties. They should be read in conjunction with "FORWARD-LOOKING STATEMENTS AND INFORMATION" and "RISK FACTORS" sections of CMS Energy's and Consumers Energy's Form 10-K for the year ended December 31 and as updated in subsequent 10-Qs. CMS Energy's and Consumers Energy's "FORWARD-LOOKING STATEMENTS AND INFORMATION" and "RISK FACTORS" sections are incorporated herein by reference and discuss important factors that could cause CMS Energy's and Consumers Energy's results to differ materially from those anticipated in such statements. The presentation also includes non-GAAP measures when describing CMS Energy's results of operations and financial performance. A reconciliation of each of these measures to the most directly comparable GAAP measure is included in the appendix and posted on our website at www.cmsenergy.com. CMS Energy expects 2010 reported earnings to be about the same as adjusted earnings. Reported earnings could vary because of several factors. CMS Energy is not providing reported earnings guidance reconciliation because of the uncertainties associated with those factors. |
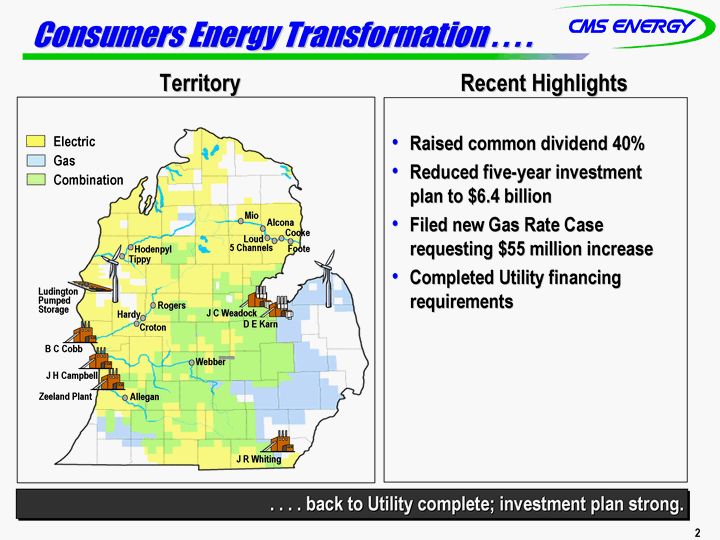
| Consumers Energy Transformation . . . . Raised common dividend 40% Reduced five-year investment plan to $6.4 billion Filed new Gas Rate Case requesting $55 million increase Completed Utility financing requirements Ludington Pumped Storage B C Cobb J H Campbell D E Karn J C Weadock J R Whiting Mio Alcona Cooke Foote Loud 5 Channels Hodenpyl Tippy Rogers Hardy Croton Webber Allegan Electric Gas Combination Recent Highlights Territory .. . . . back to Utility complete; investment plan strong. Zeeland Plant |
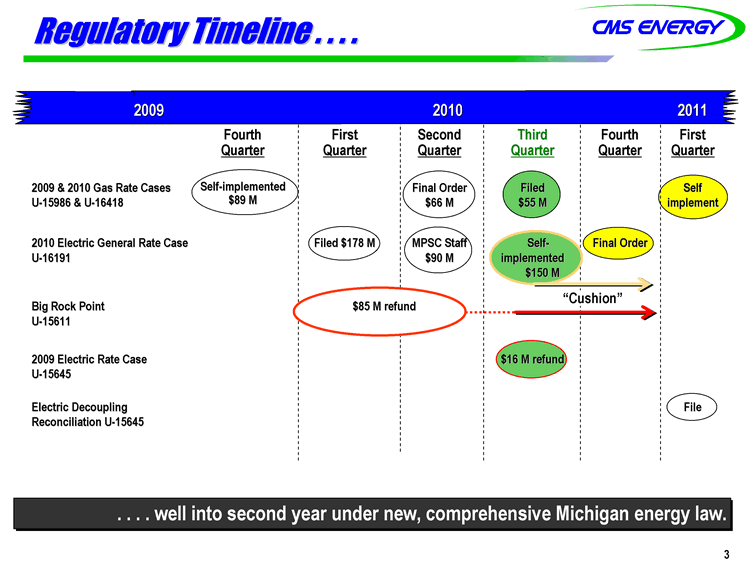
| Regulatory Timeline . . . . .. . . . well into second year under new, comprehensive Michigan energy law. "Cushion" 2009 2010 2010 2010 2010 2010 2010 2010 2010 2010 2011 Fourth Quarter First Quarter First Quarter First Quarter Second Quarter Third Quarter Fourth Quarter Fourth Quarter First Quarter 2009 & 2010 Gas Rate Cases U-15986 & U-16418 Self-implemented $89 M Final Order $66 M Filed $55 M Self implement 2010 Electric General Rate Case U-16191 Filed $178 M Filed $178 M Filed $178 M MPSC Staff $90 M Self-implemented $150 M Final Order Final Order Big Rock Point U-15611 $85 M refund $85 M refund $85 M refund $85 M refund $85 M refund 2009 Electric Rate Case U-15645 $16 M refund Electric Decoupling Reconciliation U-15645 File |
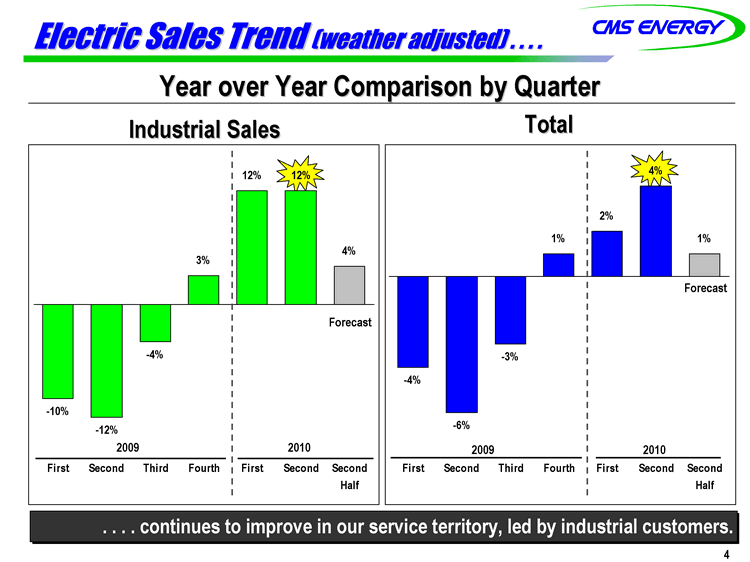
| Electric Sales Trend (weather adjusted) . . . . First Second Third Fourth First Second Second Half Industrial Sales -0.1 -0.12 -0.04 0.03 0.12 0.12 0.04 Total Sales 0.01 0.02 0.04 0.03 -0.01 Industrial Sales .. . . . continues to improve in our service territory, led by industrial customers. Total 2009 2010 Year over Year Comparison by Quarter First Second Third Fourth First Second Second Half Total sales -0.04 -0.06 -0.03 0.01 0.02 0.04 0.01 Total Sales 0.01 0.02 0.04 0.03 -0.01 2009 2010 Forecast Forecast |
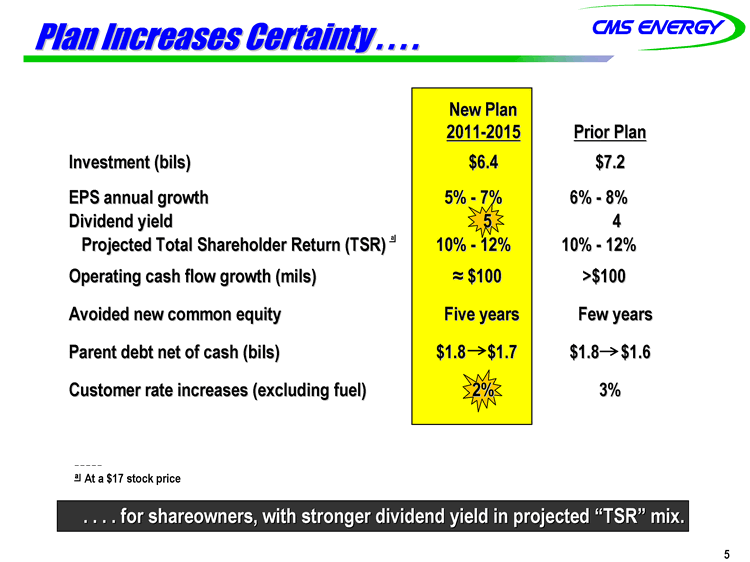
| Plan Increases Certainty . . . . .. . . . for shareowners, with stronger dividend yield in projected "TSR" mix. New Plan 2011-2015 Prior Plan Investment (bils) $6.4 $7.2 EPS annual growth Dividend yield Projected Total Shareholder Return (TSR) 5% - 7% 5 10% - 12% 6% - 8% 4 10% - 12% Operating cash flow growth (mils) ^ $100 >$100 Avoided new common equity Five years Few years Parent debt net of cash (bils) $1.8 $1.7 $1.8 $1.6 Customer rate increases (excluding fuel) 2% 3% _ _ _ _ _ a At a $17 stock price a |
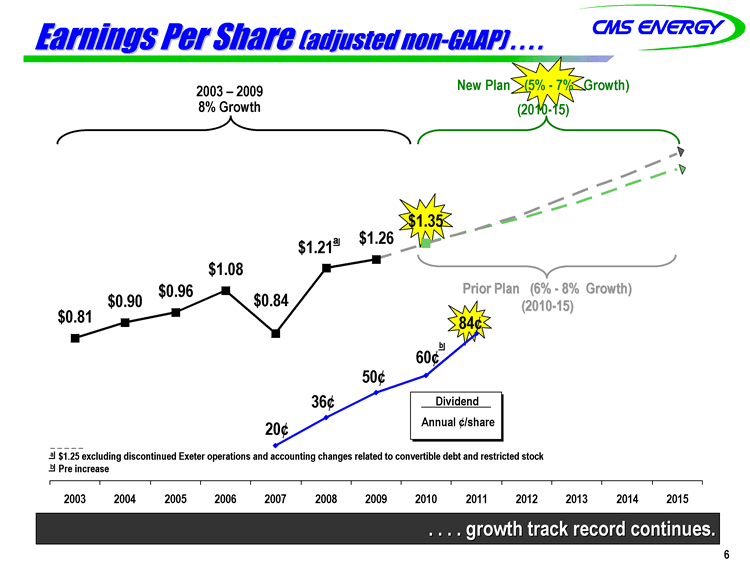
| 2003 2004 2005 2006 2007 2008 2009 2010 2011 2012 2013 2014 2015 History 0.81 0.9 0.96 1.08 0.84 1.21 1.26 2009 Plan 1.35 1.43 1.5 1.58 1.68 1.77 Earnings Per Share (adjusted non-GAAP) . . . . New Plan (5% - 7% Growth) (2010-15) Prior Plan (6% - 8% Growth) (2010-15) .. . . . growth track record continues. 2003 - 2009 8% Growth Dividend Annual ¢/share _ _ _ _ _ a $1.25 excluding discontinued Exeter operations and accounting changes related to convertible debt and restricted stock b Pre increase b |
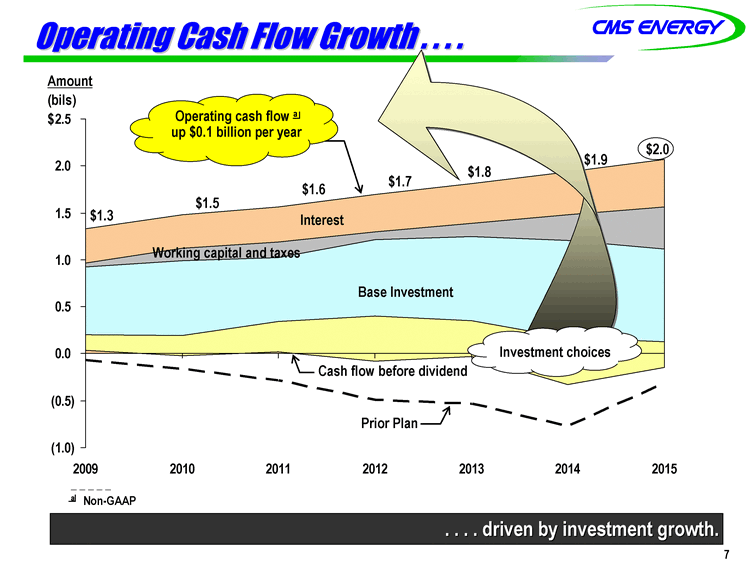
| Operating Cash Flow Growth . . . . .. . . . driven by investment growth. 2008 2009 2010 2011 2012 2013 2014 2015 CF after Capex -598 39 -22 20 -76 -31 -326 -144 73 160 220 325 479 384 497 271 CF after dividends 756 726 790 676 814 898 1032 987 CF after working capital 81 113 137 166 184 210 230 250 CF after interest 698 44 138 165 82 141 278 452 Operating cash flow 335 362 355 379 400 417 456 505 Amount (bils) $ Operating cash flow a up $0.1 billion per year $1.9 Interest Working capital and taxes Base Investment $1.3 $1.6 $1.7 $1.8 $1.5 $2.0 Cash flow before dividend Investment choices _ _ _ _ _ a Non-GAAP Prior Plan |
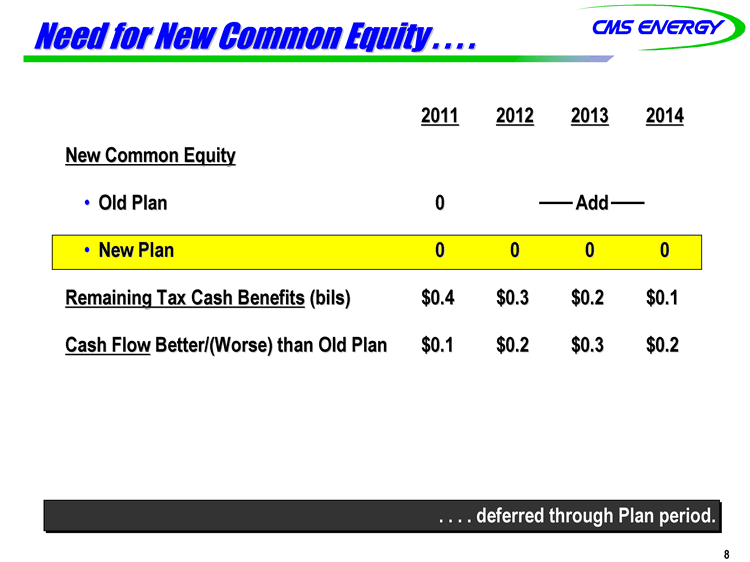
| Need for New Common Equity . . . . .. . . . deferred through Plan period. 2011 2012 2013 2014 New Common Equity Old Plan 0 Add New Plan 0 0 0 0 Remaining Tax Cash Benefits (bils) $0.4 $0.3 $0.2 $0.1 Cash Flow Better/(Worse) than Old Plan $0.1 $0.2 $0.3 $0.2 |
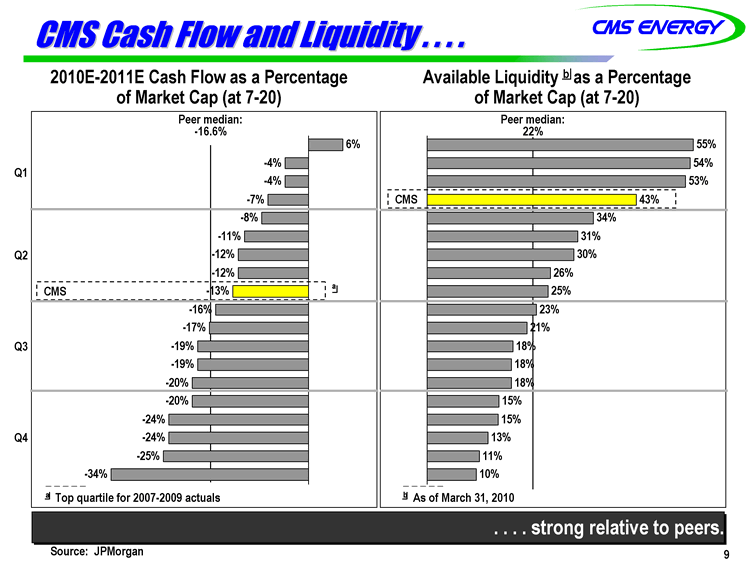
| CMS Cash Flow and Liquidity . . . . .. . . . strong relative to peers. Available Liquidity b as a Percentage of Market Cap (at 7-20) 2010E-2011E Cash Flow as a Percentage of Market Cap (at 7-20) 0.06 -0.04 -0.04 -0.07 -0.08 -0.11 -0.12 -0.12 CMS -0.13 Source: JPMorgan _ _ _ _ _ a Top quartile for 2007-2009 actuals a Peer median: - -16.6% 0.55 0.544 0.534 CMS 0.432 Peer median: 22% _ _ _ _ _ b As of March 31, 2010 Q1 Q2 Q3 Q4 |
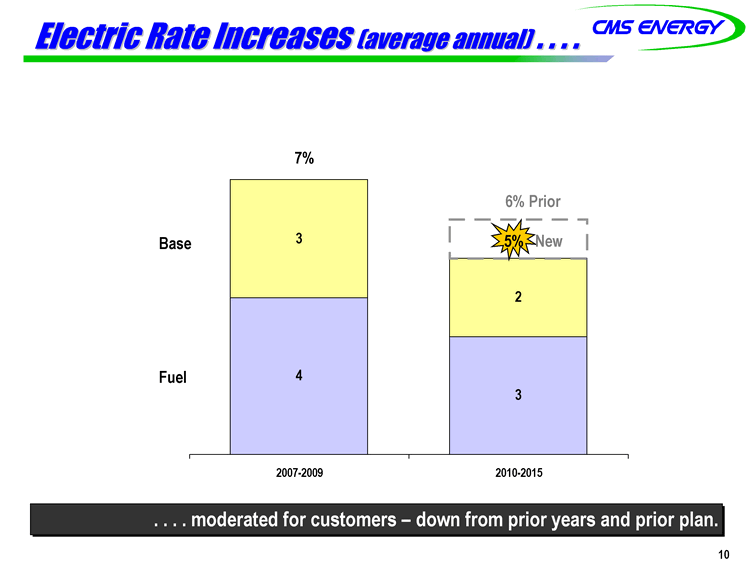
| Electric Rate Increases (average annual) . . . . .. . . . moderated for customers - down from prior years and prior plan. 2007-2009 2010-2015 Fuel (including CO2) 4 3 Base 3 2 1 7% 5% New Fuel Base 6% Prior |
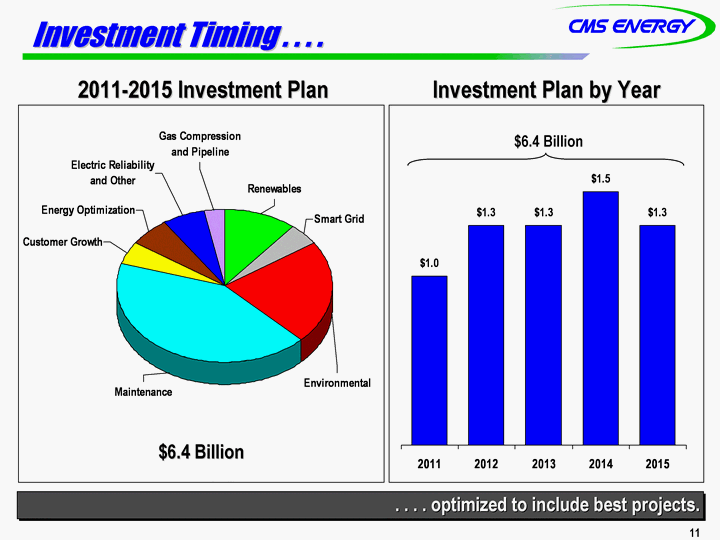
| Investment Timing . . . . .. . . . optimized to include best projects. Renewables Smart Grid Environmental Maintenance Customer Growth Energy Optimization Electric Reliability and Other Gas Compression and Pipeline 0.7 0.3 1.4 2.7 0.3 0.4 0.4 0.2 2011-2015 Investment Plan $6.4 Billion 2011 2012 2013 2014 2015 1 1.3 1.3 1.5 1.3 Investment Plan by Year $6.4 Billion |
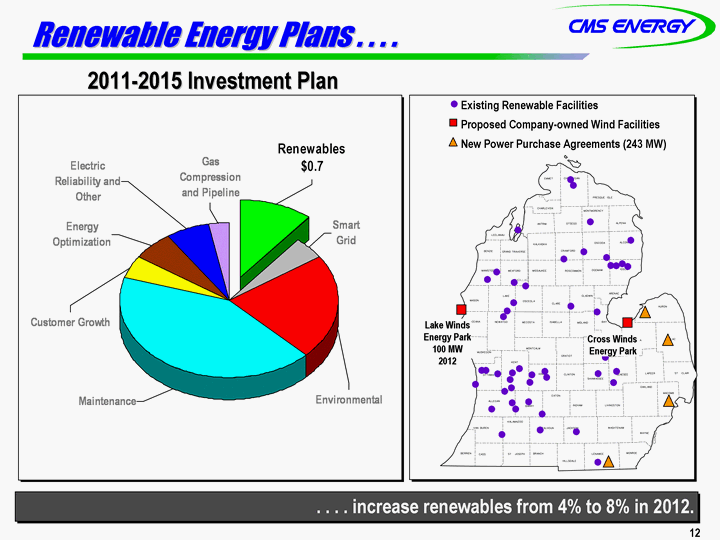
| Renewables Smart Grid Environmental Maintenance Customer Growth Energy Optimization Electric Reliability and Other Gas Compression and Pipeline 0.7 0.3 1.4 2.7 0.3 0.4 0.4 0.2 2011-2015 Investment Plan Renewable Energy Plans . . . . .. . . . increase renewables from 4% to 8% in 2012. ^ ^ ^ ^ ^ ^ ^ ^ ^ ^ ^ ^ ^ ^ ^ ^ ^ ^ ^ ^ ^ ^ ^ ^ ^ ^ ^ ^ ^ ^ ^ ^ ^ ^ ^ ^ ^ ^ ^ ^ ^ ^ ^ ^ ^ ^ ^ Existing Renewable Facilities Proposed Company-owned Wind Facilities New Power Purchase Agreements (243 MW) ^ Cross Winds Energy Park Lake Winds Energy Park 100 MW 2012 |
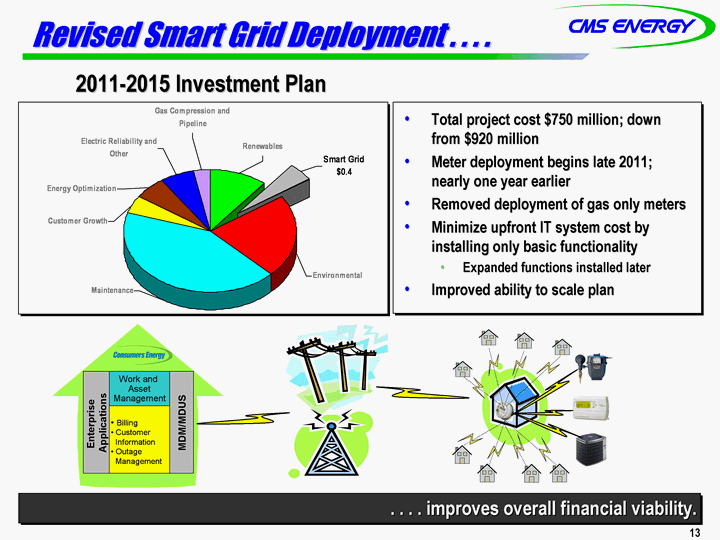
| Renewables Smart Grid Environmental Maintenance Customer Growth Energy Optimization Electric Reliability and Other Gas Compression and Pipeline 0.7 0.3 1.4 2.7 0.3 0.4 0.4 0.2 Revised Smart Grid Deployment . . . . Total project cost $750 million; down from $920 million Meter deployment begins late 2011; nearly one year earlier Removed deployment of gas only meters Minimize upfront IT system cost by installing only basic functionality Expanded functions installed later Improved ability to scale plan .. . . . improves overall financial viability. 2011-2015 Investment Plan Billing Customer Information Outage Management Work and Asset Management Enterprise Applications MDM/MDUS |
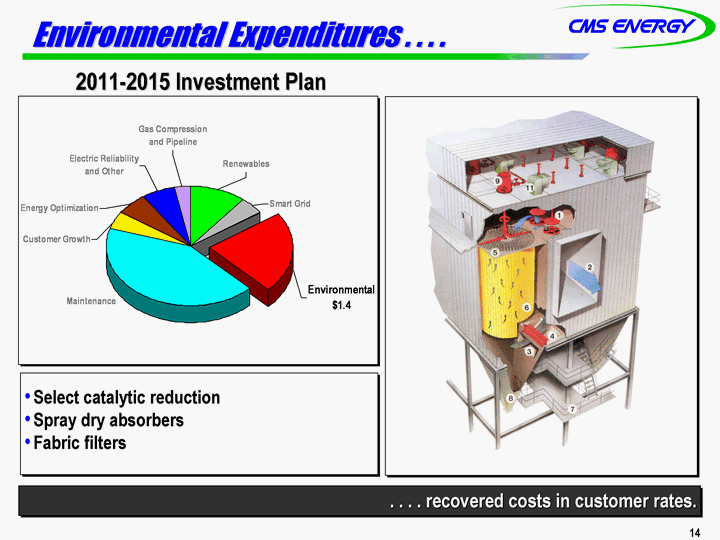
| Renewables Smart Grid Environmental Maintenance Customer Growth Energy Optimization Electric Reliability and Other Gas Compression and Pipeline 0.7 0.3 1.4 2.7 0.3 0.4 0.4 0.2 Environmental Expenditures . . . . .. . . . recovered costs in customer rates. Select catalytic reduction Spray dry absorbers Fabric filters 2011-2015 Investment Plan |
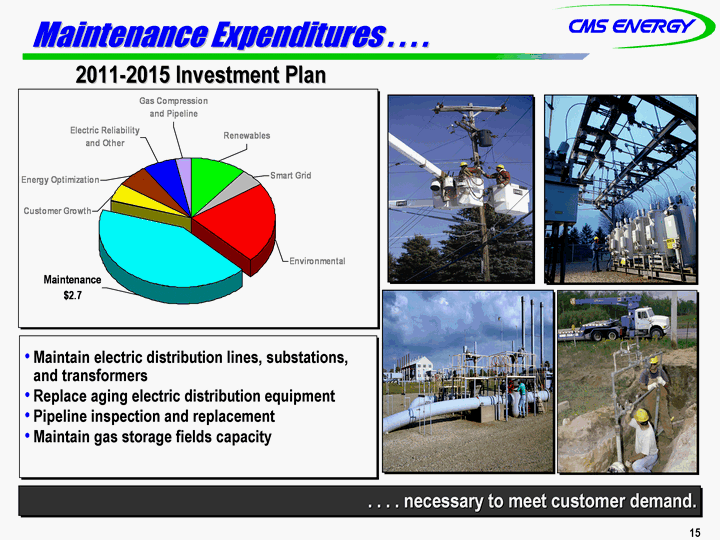
| Renewables Smart Grid Environmental Maintenance Customer Growth Energy Optimization Electric Reliability and Other Gas Compression and Pipeline 0.7 0.3 1.4 2.7 0.3 0.4 0.4 0.2 Maintenance Expenditures . . . . .. . . . necessary to meet customer demand. Maintain electric distribution lines, substations, and transformers Replace aging electric distribution equipment Pipeline inspection and replacement Maintain gas storage fields capacity 2011-2015 Investment Plan |
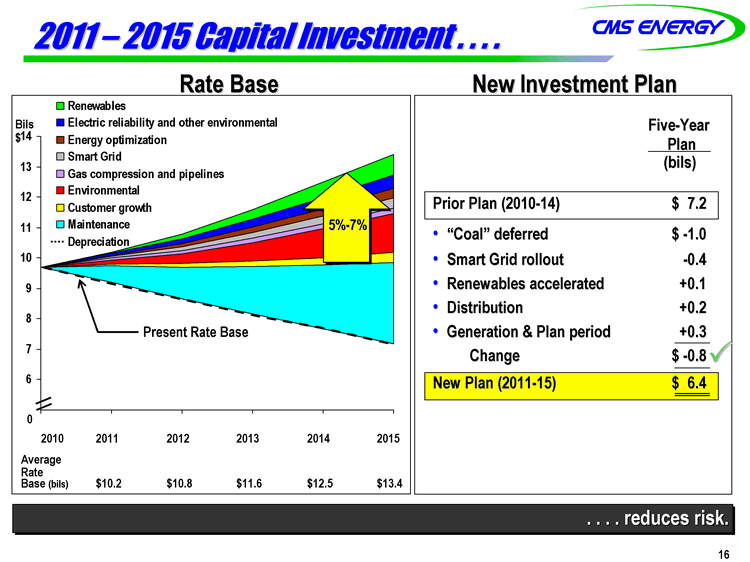
| New Investment Plan .. . . . reduces risk. 2008 2009 2010 2011 2012 2013 2014 2015 Depreciation 7.851 8.729 9.2 9.7 9.196 8.65 8.164 7.661 7.169 Maintenance 0.55 1.049 1.554 2.107 2.691 Customer growth 0.057 0.116 0.179 0.246 0.317 Environmental 0.125 0.311 0.598 0.941 1.294 Gas compression and pipelines 0.07 0.125 0.153 0.167 0.18 Smart Grid 0.052 0.121 0.196 0.259 0.329 Energy optimization 0.028 0.093 0.168 0.244 0.32 Electric reliability and other environmental 0.073 0.156 0.254 0.351 0.438 Renewables 0.045 0.175 0.331 0.52 0.656 5%-7% Bils $ Present Rate Base 2010 2011 2012 2013 2014 2015 Average Rate Base (bils) $10.2 $10.8 $11.6 $12.5 $13.4 0 Rate Base 2011 - 2015 Capital Investment . . . . Five-Year Plan (bils) Prior Plan (2010-14) $ 7.2 "Coal" deferred $ - 1.0 Smart Grid rollout - 0.4 Renewables accelerated + 0.1 Distribution + 0.2 Generation & Plan period + 0.3 Change $ - 0.8 New Plan (2011-15) $ 6.4 ? |
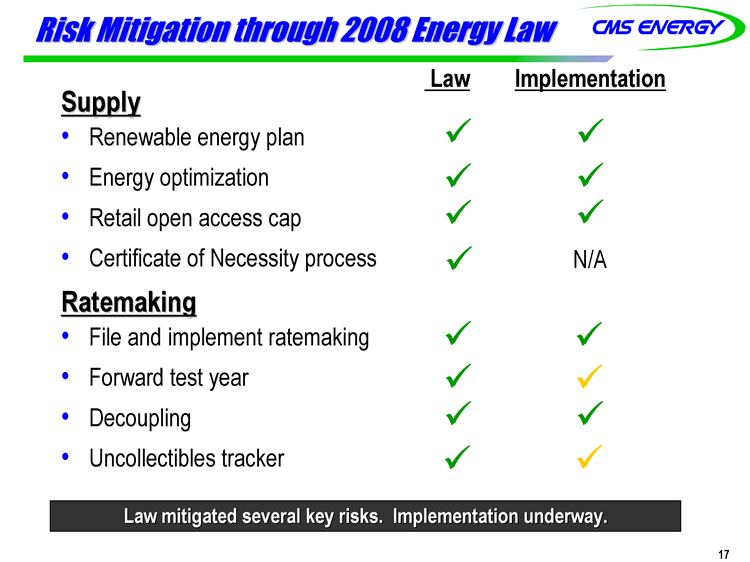
| Risk Mitigation through 2008 Energy Law Supply Renewable energy plan Energy optimization Retail open access cap Certificate of Necessity process Ratemaking File and implement ratemaking Forward test year Decoupling Uncollectibles tracker ? ? ? ? ? ? Law Implementation ? ? ? N/A ? ? Law mitigated several key risks. Implementation underway. ? ? ? ? |
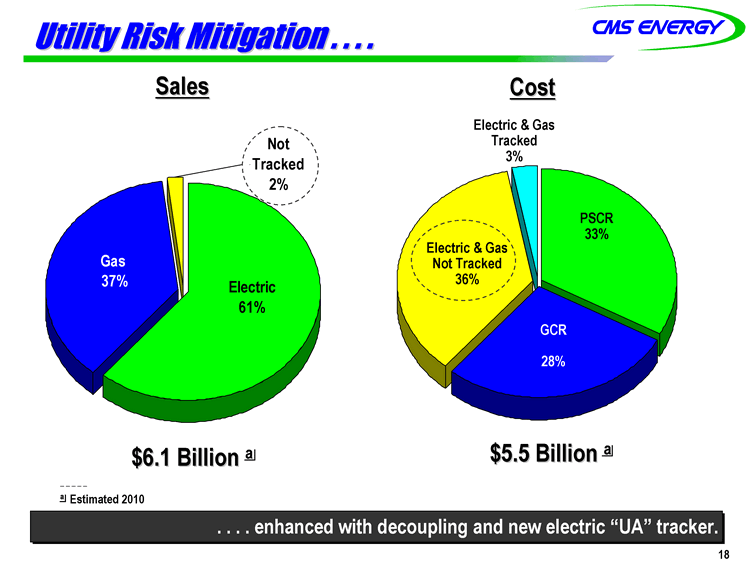
| Utility Risk Mitigation . . . . .. . . . enhanced with decoupling and new electric "UA" tracker. Electric Gas Not Tracked Revenue 0.61 0.37 0.02 $6.1 Billion a Sales E&G Not Tracked 21% PSCR GCR E&G tracked East 33 28 36 3 PSCR 33% GCR 28% Electric & Gas Not Tracked 36% $5.5 Billion a Cost Electric & Gas Tracked 3% _ _ _ _ _ a Estimated 2010 |
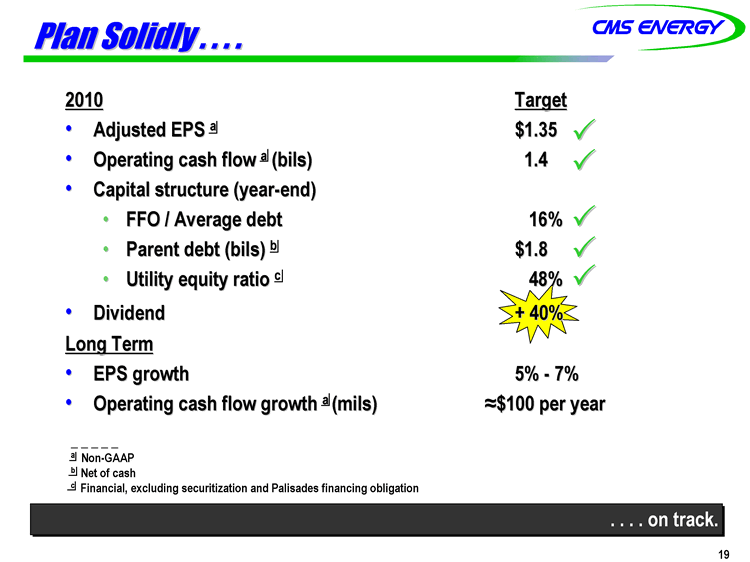
| Plan Solidly . . . . 2010 Target Adjusted EPS a $1.35 Operating cash flow a (bils) 1.4 Capital structure (year-end) FFO / Average debt 16% Parent debt (bils) b $1.8 Utility equity ratio c 48% Dividend + 40% Long Term EPS growth 5% - 7% Operating cash flow growth a (mils) ^$100 per year _ _ _ _ _ a Non-GAAP b Net of cash c Financial, excluding securitization and Palisades financing obligation .. . . . on track. ? ? ? ? ? |
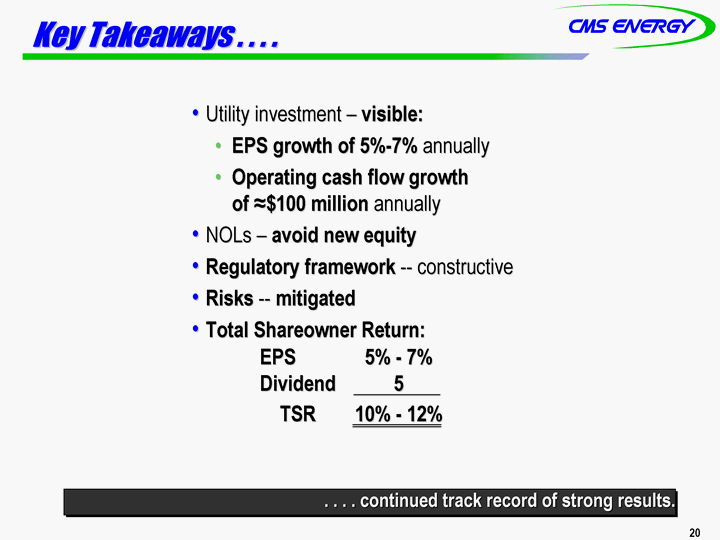
| Key Takeaways . . . . .. . . . continued track record of strong results. Utility investment - visible: EPS growth of 5%-7% annually Operating cash flow growth of ^$100 million annually NOLs - avoid new equity Regulatory framework -- constructive Risks -- mitigated Total Shareowner Return: EPS 5% - 7% Dividend 5 TSR 10% - 12% |
ELECTRIC RATE CASE U-16191*
| On January 22, 2010, Consumers Energy filed an application with the Michigan Public Service Commission seeking an increase of $178 million in its electric generation and distribution rates based on a test year of 12 months ending June 2011. On June 10, 2010, the MPSC staff filed a recommendation of $90 million based on a 10.35% ROE. The Staff suggested that its recommendation be adjusted upward by $25 million if the Company’s requested economic development sales tracker is not adopted by the Commission. The Staff also suggested that cap ex placed in service in 2011 be deferred for future recovery, rather than included in customer rates at this time. The Company plans to self implement a rate increase of $150 million, and filed a tariff sheet supporting this increase on July 13. The Commission approved the Company’s request and the self implemented rate increase will become effective on July 22, 2010. Below is a comparison of the Company’s self implemented amount to the MPSC Staff’s filed position. |
| | | | | | | | | | | | | | | |
| | | Company | | | | | | | Company | | | |
| | | Self | | | MPSC | | | B/(W) | | | |
| | | Implement | | | Staff | | | Staff | | | |
| Item | | (Mils) | | | (Mils) | | | (Mils) | | | Remarks |
| 1.O&M | | $ | 21 | | | $ | 25 | | | $ | (4 | ) | | Corporate restructuring: ($18) O&M savings |
| | | | | | | | | | | | | | | Technology: $8 Staff update for 2009 |
| | | | | | | | | | | | | | | Corporate: $4 NEIL refund |
| | | | | | | | | | | | | | | DOE Liability Interest: $2 |
| | | | | | | | | | | | | | | |
| 2. Gross Margin | | | 5 | | | | 4 | | | | 1 | | | Miscellaneous revenues |
| | | | | | | | | | | | | | | |
| 3. Investment | | | 106 | | | | 80 | | | | 26 | | | Net Plant: $25 2011 Capex |
| | | | | | | | | | | | | | | Working Capital: $6 |
| | | | | | | | | | | | | | | Depreciation expense: $6 |
| | | | | | | | | | | | | | | Taxes: ($5) |
| | | | | | | | | | | | | | | AFUDC: ($6) |
| | | | | | | | | | | | | | | |
| 4. Cost of Capital | | | 18 | | | | (19 | ) | | | 37 | | | Return on equity (11% vs 10.35%): $30 |
| | | | | | | | | | | | | | | Capital structure: $9 Increased deferred taxes |
| | | | | | | | | | | | | | | Debt costs: ($2) |
| | | | | | | | | | | | |
| Total | | $ | 150 | | | $ | 90 | | | $ | 60 | | | |
| | | | | | | | | | | | |
| | | | | | | | | | | | | |
| Ratemaking | | Existing | | Consumers | | MPSC |
| Capital Structure % | | (U-15645) | | Filing | | Staff Filing |
| Long Term Debt | | | 44.80 | % | | | 41.77 | % | | | 40.62 | % |
| Short Term Debt | | | 0.78 | | | | 1.51 | | | | 1.51 | |
| Preferred Stock | | | 0.48 | | | | 0.44 | | | | 0.44 | |
| Common Equity | | | 40.51 | (1) | | | 41.49 | (2) | | | 41.59 | (3) |
| Deferred FIT | | | 12.80 | | | | 14.26 | | | | 15.30 | |
| JDITC/Other | | | 0.63 | | | | 0.53 | | | | 0.54 | |
| | | | | | | | | | | | | |
| | | | 100.00 | % | | | 100.00 | % | | | 100.00 | % |
| | | | | | | | | | | | | |
| | |
| (1) | | Equivalent to 47.23% on a financial basis |
| |
| (2) | | Equivalent to 49.57% on a financial basis |
| |
| (3) | | Equivalent to 50.32% on a financial basis |
| | | | | | | | | | | | | |
| Rate Base and Return | | Existing | | Consumers | | MPSC |
| Percentage | | (U-15645) | | Self Implement | | Staff Filing |
| Rate Base ($ billions) | | $ | 6.16 | | | $ | 6.97 | | | $ | 6.69 | |
| Return on Rate Base | | | 6.98 | % | | | 7.16 | % | | | 6.83 | % |
| Return on Equity | | | 10.70 | % | | | 11.00 | % | | | 10.35 | % |
ELECTRIC RATE CASE SCHEDULE
| | | |
|
| Self Implement Rate Increase – $150 million | | July 22, 2010 |
| Cross of all Witnesses | | July 15 – 28, 2010 |
| Initial Briefs | | August 26, 2010 |
| Reply Briefs | | September 16, 2010 |
| Proposal for Decision | | No PFD – Commission will read the record. |
| Decision | | By January 20, 2011 (expected in fourth quarter) |
| | |
| * | | Electric Rate Case U-16191 can be accessed at the Michigan Public Service Commission’s website. http://efile.mpsc.cis.state.mi.us/efile/electric.html |
Appendix-1
GAS RATE CASE U-16418*
On August 13, 2010, Consumers Energy filed an application with the Michigan Public Service Commission seeking an increase in its gas delivery and transportation rates based on a 2011 test year. The Company requests an authorized ROE of 11%, and proposes a full decoupling mechanism, including weather. If approved, this request would add about $2.95 per month, or about 3.4%, to the typical residential customer’s average monthly bill. The $55 million revenue deficiency is detailed below.
| | | | | | | |
| Item | | $ Millions | | | Explanation |
| 1. O&M | | $ | 16 | | | Gas operations expense: $13 |
| | | | | | | Lost & unaccounted for and company use gas: $3 |
| | | | | | | |
| 2. Margin | | | 4 | | | Miscellaneous revenues |
| | | | | | | |
| 3. Investment | | | 30 | | | Net plant: $19 |
| | | | | | | Working capital: $(2) |
| | | | | | | Depreciation and property taxes: $10 |
| | | | | | | Taxes, AFUDC and other: $3 |
| | | | | | | |
| 4. Cost of Capital | | | 5 | | | Return on equity: $8 (11.00% vs 10.55%) |
| | | | | | | Capital structure and lower debt costs: $(3) |
| | | | | | |
| Total | | $ | 55 | | | |
| | | | | | |
| | | | | | | | | | | | | | | | | |
| Ratemaking | | Existing | | As Filed | | | | | | After-Tax |
| Capital Structure | | (U-15986) | | Percent of Total | | Annual Cost | | Weighted Costs |
| Long Term Debt | | | 43.58 | % | | | 41.86 | % | | | 5.95 | % | | | 2.49 | % |
| Short Term Debt | | | 0.59 | | | | 1.82 | | | | 3.46 | | | | 0.06 | |
| Preferred Stock | | | 0.46 | | | | 0.42 | | | | 4.46 | | | | 0.02 | |
| Common Equity | | | 40.78 | | | | 40.51 | (1) | | | 11.00 | | | | 4.46 | |
| Deferred Taxes | | | 13.30 | | | | 14.33 | | | | 0.00 | | | | 0.00 | |
| JDITC/Other | | | 1.29 | | | | 1.06 | | | | 6.67 | | | | 0.07 | |
| | | | | | | | | | | | | | | | | |
| | | | 100.00 | % | | | 100.00 | % | | | | | | | 7.10 | % |
| | | | | | | | | | | | | | | | | |
| | | | | | | | | |
| | | Existing | | |
| Rate Base and Return Percentage | | (U-15986) | | As Filed |
| Rate Base ($ billions) | | $ | 2.74 | | | $ | 2.90 | |
| Return on Rate Base | | | 7.02 | % | | | 7.10 | % |
| Return on Equity | | | 10.55 | % | | | 11.00 | % |
| | |
| (1) | | Equivalent to 48.93% on financial basis. |
| |
| * | | Gas Rate Case U-16418 can be accessed at the Michigan Public Service Commission’s website.http://efile.mpsc.cis.state.mi.us/efile/gas.html |
Appendix-2
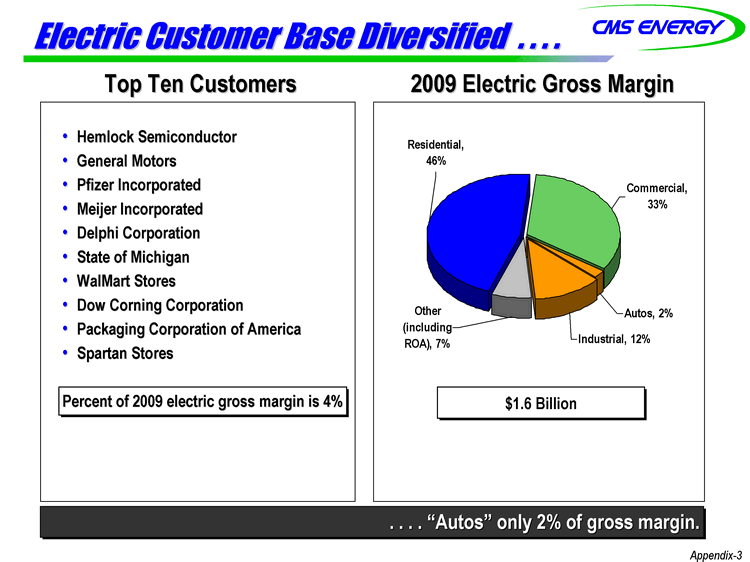
| Electric Customer Base Diversified . . . . Hemlock Semiconductor General Motors Pfizer Incorporated Meijer Incorporated Delphi Corporation State of Michigan WalMart Stores Dow Corning Corporation Packaging Corporation of America Spartan Stores Percent of 2009 electric gross margin is 4% Top Ten Customers Residential Commercial Autos Industrial Other (including ROA) 0.46 0.33 0.02 0.12 0.07 $1.6 Billion .. . . . "Autos" only 2% of gross margin. 2009 Electric Gross Margin Appendix-3 |
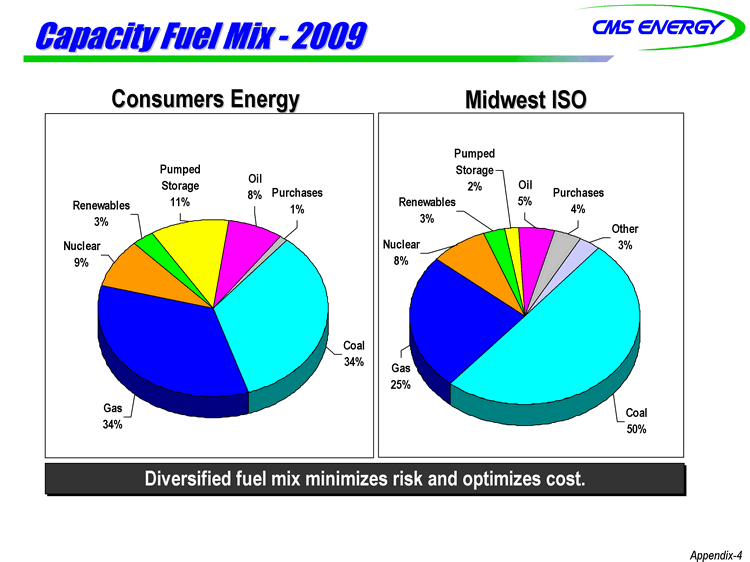
| Capacity Fuel Mix - 2009 Consumers Energy Coal Gas Nuclear Renewables Pumped Storage Oil Purchases Other 2009 0.5 0.25 0.08 0.03 0.02 0.05 0.04 0.03 Midwest ISO Diversified fuel mix minimizes risk and optimizes cost. Coal Gas Nuclear Renewables Pumped Storage Oil Purchases 2009 0.34 0.34 0.09 0.03 0.11 0.08 0.01 Appendix-4 |
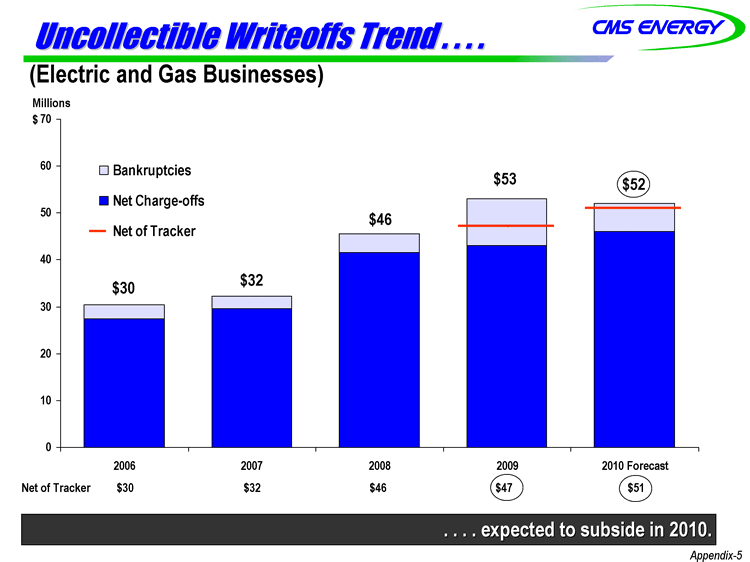
| Uncollectible Writeoffs Trend . . . . .. . . . expected to subside in 2010. Millions $ 2006 2007 2008 2009 2010 Forecast Net of Tracker 47 51 Net Charge-offs 27.4 29.6 41.5 43 46 Bankruptcies 3 2.6 4.1 10 6 Net of Tracker $30 $32 $46 $47 $51 (Electric and Gas Businesses) Appendix-5 |
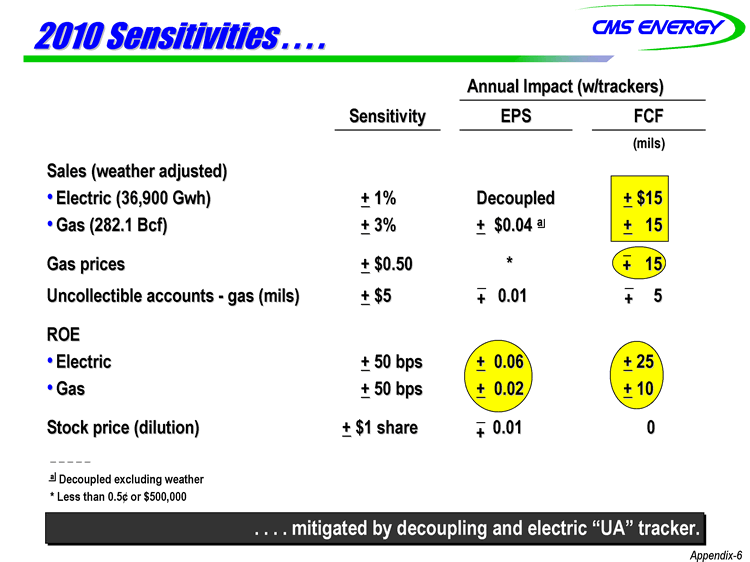
| 2010 Sensitivities . . . . _ _ _ _ _ a Decoupled excluding weather * Less than 0.5¢ or $500,000 .. . . . mitigated by decoupling and electric "UA" tracker. Annual Impact (w/trackers) Annual Impact (w/trackers) Annual Impact (w/trackers) Sensitivity EPS FCF (mils) Sales (weather adjusted) Electric (36,900 Gwh) Gas (282.1 Bcf) + 1% + 3% Decoupled + $0.04 a + $15 + 15 Gas prices + $0.50 * 15 Uncollectible accounts - gas (mils) + $5 0.01 5 ROE Electric Gas + 50 bps + 50 bps + 0.06 + 0.02 + 25 + 10 Stock price (dilution) + $1 share 0.01 0 + + + + Appendix-6 |
MATURITY SCHEDULE OF CMS AND CECO LONG-TERM DEBT & PREFERRED SECURITIES
AS OF 07/31/2010
Reflects 7/15/10 payment of $563K of IQ Notes survivors’ option puts (CECo)
| | | | | | | | | | | | | |
| | | | | Maturity | | | Amount | | | |
| F/V | | S/U | | or Call Date | | | (000’s) | | | DEBT/ CO |
| SHORT-TERM DEBT: | | | | | | |
| | | | | | | | | | | | | |
| F | | U | | | 08/01/10 | | | $ | 67,291 | | | 7.75% Sr Unsec Notes (CMS) |
| F | | U | | | 04/15/11 | | | | 213,653 | | | 8.5% Sr Notes (CMS) |
| F | | U | | | SHORT-TERM | | | 139,730 | | | *3.375% Convertible Sr Notes (Next Put Date 07/15/13) (CMS) |
| | | | | | | | | | | | |
| | | | | | | | | $ | 420,674 | | | |
| | | | | | | | | | | | | |
| LONG-TERM DEBT: | | | | | | |
| F | | U | | | 12/01/11 | | | $ | 287,500 | | | *2.875% Convertible Sr Unsec NotesPut Date (CMS) |
| | | | | | | | | | | | |
| | | | | | | | | $ | 287,500 | | | |
| F | | U | | | 02/01/12 | | | $ | 150,000 | | | 6.3% Senior Notes (CMS) |
| F | | S | | | 02/15/12 | | | | 300,000 | | | 5% Series L FMBs (CECo) |
| | | | | | | | | | | | |
| | | | | | | | | $ | 450,000 | | | |
| V | | U | | | 01/15/13 | | | $ | 150,000 | | | Floating Rate Sr Notes (CMS) |
| F | | S | | | 04/15/13 | | | | 375,000 | | | 5.375% Series B FMBs (CECo) |
| | | | | | | | | | | | |
| | | | | | | | | $ | 525,000 | | | |
| F | | S | | | 02/15/14 | | | $ | 200,000 | | | 6% FMBs (CECo) |
| F | | U | | | 06/15/14 | | | | 172,500 | | | 5.5% Convertible Sr NotesPut Date(CMS) |
| F | | S | | | 03/15/15 | | | | 225,000 | | | 5% FMBs Series N (CECo) |
| F | | U | | | 12/15/15 | | | | 125,000 | | | 6.875% Sr Notes (CMS) |
| F | | S | | | 08/15/16 | | | | 350,000 | | | 5.5% Series M FMBs (CECo) |
| F | | S | | | 02/15/17 | | | | 250,000 | | | 5.15% FMBs (CECo) |
| F | | U | | | 07/17/17 | | | | 250,000 | | | 6.55% Sr Notes (CMS) |
| F | | S | | | 03/01/18 | | | | 180,000 | | | 6.875% Sr Notes (CECo) |
| V | | S | | | 04/15/18 | | | | 67,700 | | | VRDBs to replace PCRBs (CECo) |
| F | | S | | | 09/15/18 | | | | 250,000 | | | 5.65% FMBs (CECo) |
| F | | S | | | 03/15/19 | | | | 350,000 | | | 6.125% FMBs (CECo) |
| F | | U | | | 06/15/19 | | | | 300,000 | | | 8.75% Sr Notes (CMS) |
| F | | S | | | 09/15/19 | | | | 500,000 | | | 6.70% FMBs (CECo) |
| F | | U | | | 2/1/2020 | | | | 300,000 | | | 6.25% Sr Notes (CMS) |
| F | | S | | | 04/15/20 | | | | 300,000 | | | 5.65% FMBs (CECo) |
| F | | U | | | 07/15/27 | | | | 28,667 | | | QUIPS 7.75%(CMS)Pref Sec |
| V | | S | | | 04/01/35 | | | | 35,000 | | | PCRBs (CECo) |
| F | | S | | | 04/15/35 | | | | 136,676 | | | 5.65% FMBs IQ Notes (CECo) |
| F | | S | | | 09/15/35 | | | | 175,000 | | | 5.80% FMBs (CECo) |
| | | | | | | | | | | | |
| | | | | | | | | $ | 4,195,543 | | | |
| | | | | | | | | | | | |
| | | | | | | | | $ | 5,878,717 | | | TOTAL |
| | | | | | | | | | | | |
| | | | | | | | | | | | | |
| | | | | | | | | $ | 5,850,050 | | | TOTAL EXCLUDING PREFERRED SECURITIES |
| | | | | | | | | | | | |
| | | | | | | | | | | | | |
| | | | | | Various Maturity Dates/No Maturity Date Available: |
| | | | | | | | | $ | 218,085 | | | CECo Securitization Bonds (Long-Term & Short-Term) after 07/20/10 payment |
| | | | | | | | | | 220,977 | | | CECo Capital lease rental commitments (Long-Term & Short-Term) as of 06/30/10 |
| | | | | | | | | | 162,922 | | | CECo DOE Liability as of 07/31/10 |
| | | | | | | | | | 280,040 | | | EnerBank (Long-Term & Short-Term) Discount Brokered CDs as of 06/30/10 (CMS) |
| | | | | | | | | | (33,090 | ) | | CMS Net unamortized discount as of 06/30/10 |
| | | | | | | | | | (4,512 | ) | | CECo Net unamortized discount as of 06/30/10 |
| | | | | | | | | | | | |
| | | | | | | | | | | | | |
| | | | | | | | | $ | 6,723,137 | | | GRAND TOTAL |
| | | | | | | | | | | | |
| | |
| * | — | Date that issue can be put to the Company is used instead of maturity date |
Status Codes: F-Fixed rate; V-Variable rate; S-Secured; U-Unsecured
Appendix-7
CMS Energy
Earnings Reconciliation By Quarter and Year
December 31
Reconciliation of reported measures prepared in accordance with
Generally Accepted Accounting Principles (GAAP) versus non-GAAP measures
| | | | | | | | | | | | | | | | | | | | | |
| | | Unaudited Quarters | |
| (millions, except per share amounts) | | 1Q03 | | | 2Q03 | | | 3Q03 | | | 4Q03 | | | FY 2003 | |
| |
Reported net income | | $ | 82 | | | $ | (65 | ) | | $ | (69 | ) | | $ | 8 | | | $ | (44 | ) |
| |
After-tax items: | | | | | | | | | | | | | | | | | | | | |
| Electric and gas utility other | | | | | | | | | | | | | | | 30 | | | | 30 | |
| Enterprises other | | | 5 | | | | 7 | | | | 62 | | | | 37 | | | | 111 | �� |
| Corporate other | | | 1 | | | | | | | | 19 | | | | 4 | | | | 24 | |
| Discontinued operations | | | (31 | ) | | | 53 | | | | (2 | ) | | | (43 | ) | | | (23 | ) |
| Cumulative accounting changes | | | 24 | | | | | | | | | | | | | | | | 24 | |
| |
Ongoing earnings (non-GAAP) | | $ | 81 | | | $ | (5 | ) | | $ | 10 | | | $ | 36 | | | $ | 122 | |
| |
| | | | | | | | | | | | | | | | | | | | | |
Average shares outstanding, basic | | | 144.1 | | | | 144.1 | | | | 152.2 | | | | 161.1 | | | | 150.4 | |
| | | | | | | | | | | | | | | | | | | | | |
Average shares outstanding, diluted | | | 165.0 | | | | 144.1 | | | | 152.2 | | | | 161.1 | | | | 150.4 | |
| | | | | | | | | | | | | | | | | | | | | |
| |
Reported earnings per share | | $ | 0.52 | | | $ | (0.45 | ) | | $ | (0.46 | ) | | $ | 0.05 | | | $ | (0.30 | ) |
| |
After-tax items | | | | | | | | | | | | | | | | | | | | |
| Electric and gas utility other | | | | | | | | | | | | | | | 0.19 | | | | 0.21 | |
| Enterprises other | | | 0.03 | | | | 0.05 | | | | 0.41 | | | | 0.23 | | | | 0.74 | |
| Corporate other | | | | | | | | | | | 0.12 | | | | 0.02 | | | | 0.16 | |
| Discontinued operations | | | (0.19 | ) | | | 0.37 | | | | (0.01 | ) | | | (0.27 | ) | | | (0.16 | ) |
| Cumulative accounting changes | | | 0.14 | | | | | | | | | | | | | | | | 0.16 | |
| |
Ongoing earnings per share (non-GAAP) | | $ | 0.50 | | | $ | (0.03 | ) | | $ | 0.06 | | | $ | 0.22 | | | $ | 0.81 | |
| |
| | |
| Note: | | Year-to-date (YTD) EPS may not equal sum of quarters due to share count differences. |
2003 A-1
CMS Energy
Earnings Reconciliation By Quarter and Year
Reconciliation of reported measures prepared in accordance with
Generally Accepted Accounting Principles (GAAP) versus non-GAAP measures
| | | | | | | | | | | | | | | | | | | | | |
| | | Unaudited | | | 31-Dec | |
| (millions, except per share amounts) | | 1Q04* | | | 2Q04 | | | 3Q04 | | | 4Q04 | | | FY 2004 | |
| | | | |
Reported net income — GAAP | | $ | (9 | ) | | $ | 16 | | | $ | 56 | | | $ | 47 | | | $ | 110 | |
| | | | |
After-tax items: | | | | | | | | | | | | | | | | | | | | |
| Electric and gas utility other | | | | | | | | | | | | | | | (67 | ) | | | (67 | ) |
| Enterprises other | | | 88 | | | | | | | | (29 | ) | | | 48 | | | | 107 | |
| Corporate other | | | (7 | ) | | | | | | | (1 | ) | | | 1 | | | | (7 | ) |
| Discontinued operations | | | 2 | | | | | | | | (8 | ) | | | 10 | | | | 4 | |
| Cumulative accounting changes | | | 2 | | | | | | | | | | | | | | | | 2 | |
| | | | |
Adjusted earnings, including M-T-M | | $ | 76 | | | $ | 16 | | | $ | 18 | | | $ | 39 | | | $ | 149 | |
| Mark-to-market impacts | | NM | | | | (13 | ) | | | 9 | | | | 9 | | | | 5 | |
| | | | |
Adjusted earnings, excluding M-T-M | | $ | 76 | | | $ | 3 | | | $ | 27 | | | $ | 48 | | | $ | 154 | |
| | | | |
| | | | | | | | | | | | | | | | | | | | | |
Average shares outstanding, basic | | | 161.1 | | | | 161.2 | | | | 161.5 | | | | 190.2 | | | | 168.6 | |
| | | | | | | | | | | | | | | | | | | | | |
Average shares outstanding, diluted | | | 161.1 | | | | 164.2 | | | | 165.0 | | | | 194.0 | | | | 172.1 | |
| | | | | | | | | | | | | | | | | | | | | |
| | | | |
Reported earnings per share — GAAP | | $ | (0.06 | ) | | $ | 0.10 | | | $ | 0.34 | | | $ | 0.24 | | | $ | 0.64 | |
| | | | |
After-tax items | | | | | | | | | | | | | | | | | | | | |
| Electric and gas utility other | | | | | | | | | | | | | | | (0.35 | ) | | | (0.39 | ) |
| Enterprises other | | | 0.56 | | | | | | | | (0.17 | ) | | | 0.25 | | | | 0.62 | |
| Corporate other | | | (0.05 | ) | | | | | | | (0.01 | ) | | | 0.01 | | | | (0.03 | ) |
| Discontinued operations | | | 0.01 | | | | | | | | (0.05 | ) | | | 0.05 | | | | 0.02 | |
| Cumulative accounting changes | | | 0.01 | | | | | | | | | | | | | | | | 0.01 | |
| | | | |
| | | | | | | | | | | | | | | | | | | | | |
Adjusted earnings per share, including M-T-M | | $ | 0.47 | | | $ | 0.10 | | | $ | 0.11 | | | $ | 0.20 | | | $ | 0.87 | |
| Mark-to-market impacts | | NM | | | | (0.08 | ) | | | 0.06 | | | | 0.05 | | | | 0.03 | |
| | | | |
| | | | | | | | | | | | | | | | | | | | | |
Adjusted earnings per share, excluding M-T-M | | $ | 0.47 | | | $ | 0.02 | | | $ | 0.17 | | | $ | 0.25 | | | $ | 0.90 | |
| | | | |
| | |
| Note: | | Year-to-date & full-year EPS may not equal sum of quarters due to share count differences. |
| |
| * | | Quarterly amounts differ from amounts previously reported due to accelerating the measurement date on our benefit plans by one month and the remeasurement of our post retirement obligation. |
| |
| NM: | | Not meaningful. |
2004 A-1
CMS Energy
Earnings Reconciliation By Quarter and Year
Reconciliation of reported measures prepared in accordance with
Generally Accepted Accounting Principles (GAAP) versus non-GAAP measures
| | | | | | | | | | | | | | | | | | | | | |
| | | Unaudited | | | 31-Dec | |
| (millions, except per share amounts) | | 1Q05 | | | 2Q05 | | | 3Q05 | | | 4Q05 | | | FY 2005 | |
| | | | |
Reported net income — GAAP | | $ | 150 | | | $ | 27 | | | $ | (265 | ) | | $ | (6 | ) | | $ | (94 | ) |
| | | | |
After-tax items: | | | | | | | | | | | | | | | | | | | | |
| Electric and gas utility other | | | | | | | | | | | | | | | | | | | | |
| Enterprises other | | | (2 | ) | | | (1 | ) | | | (1 | ) | | | 13 | | | | 9 | |
| Corporate other | | | | | | | 1 | | | | | | | | 8 | | | | 9 | |
| Discontinued operations | | | | | | | | | | | | | | | (14 | ) | | | (14 | ) |
| Asset impairment | | | | | | | | | | | 385 | | | | | | | | 385 | |
| | | | |
Adjusted earnings, including M-T-M | | $ | 148 | | | $ | 27 | | | $ | 119 | | | $ | 1 | | | $ | 295 | |
| Mark-to-market impacts | | | (75 | ) | | | 19 | | | | (75 | ) | | | 40 | | | | (91 | ) |
| | | | |
Adjusted earnings, excluding M-T-M | | $ | 73 | | | $ | 46 | | | $ | 44 | | | $ | 41 | | | $ | 204 | |
| | | | |
| | | | | | | | | | | | | | | | | | | | | |
Average shares outstanding, basic | | | 195.3 | | | | 217.9 | | | | 219.6 | | | | 218.5 | | | | 211.8 | |
| | | | | | | | | | | | | | | | | | | | | |
Average shares outstanding, diluted | | | 206.3 | | | | 228.9 | | | | 219.6 | | | | 218.5 | | | | 211.8 | |
| | | | | | | | | | | | | | | | | | | | | |
| | | | |
Reported earnings per share — GAAP | | $ | 0.74 | | | $ | 0.12 | | | $ | (1.21 | ) | | $ | (0.03 | ) | | $ | (0.44 | ) |
| | | | |
After-tax items | | | | | | | | | | | | | | | | | | | | |
| Electric and gas utility other | | | | | | | | | | | | | | | | | | | | |
| Enterprises other | | | (0.01 | ) | | NM | | NM | | | 0.06 | | | | 0.04 | |
| Corporate other | | | | | | NM | | | | | | | 0.03 | | | | 0.04 | |
| Discontinued operations | | | | | | | | | | | | | | | (0.06 | ) | | | (0.07 | ) |
| Asset impairment | | | | | | | | | | | 1.75 | | | | | | | | 1.82 | |
| | | | |
Adjusted earnings per share, including M-T-M | | $ | 0.73 | | | $ | 0.12 | | | $ | 0.54 | | | $ | 0.00 | | | $ | 1.39 | |
| Mark-to-market impacts | | | (0.36 | ) | | | 0.08 | | | | (0.34 | ) | | | 0.19 | | | | (0.43 | ) |
| | | | |
Adjusted earnings per share, excluding M-T-M | | $ | 0.37 | | | $ | 0.20 | | | $ | 0.20 | | | $ | 0.19 | | | $ | 0.96 | |
| | | | |
Note: Year-to-date & full-year EPS may not equal sum of quarters due to share count differences.
2005 A-1
CMS Energy
Earnings Reconciliation By Quarter and Year
Reconciliation of reported measures prepared in accordance with
Generally Accepted Accounting Principles (GAAP) versus non-GAAP measures
| | | | | | | | | | | | | | | | | | | | | |
| | | Unaudited | | | | |
| | | 2006 | | | 2006 | |
| (In millions, except per share amounts) | | 1Q | | | 2Q | | | 3Q | | | 4Q | | | Dec YTD | |
| | | | |
Reported net income — GAAP | | $ | (27 | ) | | $ | 72 | | | $ | (103 | ) | | $ | (32 | ) | | $ | (90 | ) |
| | | | |
After-tax items: | | | | | | | | | | | | | | | | | | | | |
| Electric and gas utility other | | | — | | | | — | | | | — | | | | — | | | | — | |
| Enterprises other | | | — | | | | — | | | | (29 | ) | | | 25 | | | | (4 | ) |
| Corporate interest and other | | | 2 | | | | (15 | ) | | | 4 | | | | 82 | | | | 73 | |
| Discontinued operations (gain) | | | (1 | ) | | | (2 | ) | | | (1 | ) | | | (2 | ) | | | (6 | ) |
| Asset impairment charges | | | — | | | | — | | | | 169 | | | | — | | | | 169 | |
| | | | |
Adjusted earnings, including MTM | | $ | (26 | ) | | $ | 55 | | | $ | 40 | | | $ | 73 | | | $ | 142 | |
| Mark-to-market impacts | | | 74 | | | | 21 | | | | 30 | | | | (13 | ) | | | 112 | |
| | | | |
Adjusted earnings, excluding MTM | | $ | 48 | | | $ | 76 | | | $ | 70 | | | $ | 60 | | | $ | 254 | |
| | | | |
| | | | | | | | | | | | | | | | | | | | | |
Average shares outstanding, basic | | | 219.1 | | | | 219.6 | | | | 220.1 | | | | 220.6 | | | | 219.9 | |
Average shares outstanding, diluted | | | 219.1 | | | | 229.6 | | | | 220.1 | | | | 220.6 | | | | 219.9 | |
| | | | | | | | | | | | | | | | | | | | | |
| | | | |
Reported earnings per share — GAAP | | $ | (0.12 | ) | | $ | 0.31 | | | $ | (0.47 | ) | | $ | (0.15 | ) | | $ | (0.41 | ) |
| | | | |
After-tax items | | | | | | | | | | | | | | | | | | | | |
| Electric and gas utility other | | | — | | | | — | | | | — | | | | — | | | | — | |
| Enterprises other | | | — | | | | — | | | | (0.13 | ) | | | 0.11 | | | | (0.02 | ) |
| Corporate other | | | 0.01 | | | | (0.07 | ) | | | 0.02 | | | | 0.38 | | | | 0.27 | |
| Discontinued operations | | | (0.01 | ) | | | (0.01 | ) | | | — | | | | (0.01 | ) | | | (0.03 | ) |
| Asset impairment charges | | | — | | | | — | | | | 0.76 | | | | — | | | | 0.76 | |
| | | | |
Adjusted earnings per share, including MTM | | $ | (0.12 | ) | | $ | 0.23 | | | $ | 0.18 | | | $ | 0.33 | | | $ | 0.57 | |
| Mark-to-market impacts | | | 0.34 | | | | 0.10 | | | | 0.13 | | | | (0.06 | ) | | | 0.51 | |
| | | | |
Adjusted earnings per share, excluding MTM | | $ | 0.22 | | | $ | 0.33 | | | $ | 0.31 | | | $ | 0.27 | | | $ | 1.08 | |
| | | | |
| | |
| Note: | | Year-to-date (YTD) EPS may not equal sum of quarters due to share count differences. |
| |
| NM: | | Not Meaningful. |
2006 A-1
CMS Energy Corporation
Earnings By Quarter and Year GAAP Reconciliation
(Unaudited)
| | | | | | | | | | | | | | | | | | | | | |
| | | (In millions, except per share amounts) |
| | | 2007 |
| | | 1Q | | 2Q | | 3Q | | 4Q | | Dec YTD |
| | | |
| | | | | | | | | | | | | | | | | | | | | |
Reported net income (loss) — GAAP | | | ($215 | ) | | $ | 33 | | | $ | 82 | | | | ($127 | ) | | | ($227 | ) |
| |
After-tax items: | | | | | | | | | | | | | | | | | | | | |
| Electric and gas utility | | | 4 | | | | — | | | | — | | | | — | | | | 4 | |
| Enterprises | | | 49 | | | | 19 | | | | (10 | ) | | | 222 | | | | 280 | |
| Corporate interest and other | | | (81 | ) | | | 32 | | | | 9 | | | | (38 | ) | | | (78 | ) |
| Discontinued operations (income) loss | | | 178 | | | | (91 | ) | | | — | | | | 2 | | | | 89 | |
| Asset impairment charges, net | | | 157 | | | | 25 | | | | (49 | ) | | | — | | | | 133 | |
| |
Adjusted income — non-GAAP | | $ | 92 | | | $ | 18 | | | $ | 32 | | | $ | 59 | | | $ | 201 | |
| |
| | | | | | | | | | | | | | | | | | | | | |
Average shares outstanding, basic | | | 221.5 | | | | 222.6 | | | | 223.0 | | | | 223.4 | | | | 222.6 | |
Average shares outstanding, diluted | | | 221.5 | | | | 222.6 | | | | 241.3 | | | | 223.4 | | | | 222.6 | |
| | | | | | | | | | | | | | | | | | | | | |
| |
Reported earnings (loss) per share — GAAP | | | ($0.97 | ) | | $ | 0.15 | | | $ | 0.34 | | | | ($0.57 | ) | | | ($1.02 | ) |
| |
After-tax items: | | | | | | | | | | | | | | | | | | | | |
| Electric and gas utility | | | 0.01 | | | | — | | | | — | | | | — | | | | (0.07 | ) |
| Enterprises | | | 0.23 | | | | 0.08 | | | | (0.04 | ) | | | 0.99 | | | | 1.25 | |
| Corporate interest and other | | | (0.36 | ) | | | 0.15 | | | | 0.03 | | | | (0.17 | ) | | | (0.32 | ) |
| Discontinued operations (income) loss | | | 0.80 | | | | (0.41 | ) | | | — | | | | 0.01 | | | | 0.40 | |
| Asset impairment charges, net | | | 0.71 | | | | 0.11 | | | | (0.20 | ) | | | — | | | | 0.60 | |
| |
Adjusted earnings per share — non-GAAP | | $ | 0.42 | | | $ | 0.08 | | | $ | 0.13 | | | $ | 0.26 | | | $ | 0.84 | |
| |
| | | | | | | | | | | | | | | | | | | | | |
| | | (In millions, except per share amounts) |
| | | 2008 |
| | | 1Q | | 2Q | | 3Q | | 4Q | | Dec YTD |
| | | |
| | | | | | | | | | | | | | | | | | | | | |
Reported net income — GAAP | | $ | 103 | | | $ | 46 | | | $ | 79 | | | $ | 61 | | | $ | 289 | |
| |
After-tax items: | | | | | | | | | | | | | | | | | | | | |
| Electric and gas utility | | | — | | | | 1 | | | | 6 | | | | 5 | | | | 12 | |
| Enterprises | | | * | | | | (4 | ) | | | (* | ) | | | 1 | | | | (3 | ) |
| Corporate interest and other | | | — | | | | — | | | | (6 | ) | | | 1 | | | | (5 | ) |
| Discontinued operations (income) loss | | | (* | ) | | | 1 | | | | (1 | ) | | | * | | | | * | |
| |
Adjusted income — non-GAAP | | $ | 103 | | | $ | 44 | | | $ | 78 | | | $ | 68 | | | $ | 293 | |
| |
| | | | | | | | | | | | | | | | | | | | | |
Average shares outstanding, basic | | | 223.5 | | | | 223.7 | | | | 224.1 | | | | 224.5 | | | | 223.9 | |
Average shares outstanding, diluted | | | 236.6 | | | | 239.1 | | | | 234.3 | | | | 226.6 | | | | 234.8 | |
| | | | | | | | | | | | | | | | | | | | | |
| |
Reported earnings per share — GAAP | | $ | 0.44 | | | $ | 0.19 | | | $ | 0.34 | | | $ | 0.27 | | | $ | 1.23 | |
| |
After-tax items: | | | | | | | | | | | | | | | | | | | | |
| Electric and gas utility | | | — | | | | 0.01 | | | | 0.02 | | | | 0.03 | | | | 0.05 | |
| Enterprises | | | * | | | | (0.02 | ) | | | 0.01 | | | | * | | | | (0.01 | ) |
| Corporate interest and other | | | — | | | | — | | | | (0.03 | ) | | | * | | | | (0.02 | ) |
| Discontinued operations (income) loss | | | (* | ) | | | 0.01 | | | | (0.01 | ) | | | * | | | | * | |
| |
Adjusted earnings per share — non-GAAP | | $ | 0.44 | | | $ | 0.19 | | | $ | 0.33 | | | $ | 0.30 | | | $ | 1.25 | |
| |
| | |
| Note: | | Year-to-date (YTD) EPS may not equal sum of quarters due to share count differences. |
| |
| * | | Less than $500 thousand or $0.01 per share. |
2008 A-1
CMS Energy Corporation
Earnings By Quarter and Year GAAP Reconciliation
(Unaudited)
| | | | | | | | | | | | | | | | | | | | | |
| (In millions, except per share amounts) | | 2009 | |
| | | 1Q | | | 2Q | | | 3Q | | | 4Q | | | Dec YTD | |
| | | |
| |
Reported net income — GAAP | | $ | 70 | | | $ | 75 | | | $ | 67 | | | $ | 6 | | | $ | 218 | |
| |
After-tax items: | | | | | | | | | | | | | | | | | | | | |
| Electric and gas utility | | | — | | | | — | | | | — | | | | 79 | | | | 79 | |
| Enterprises | | | * | | | | 16 | | | | 2 | | | | 4 | | | | 22 | |
| Corporate interest and other | | | * | | | | 1 | | | | 1 | | | | (1 | ) | | | 1 | |
| Discontinued operations (income) loss | | | 1 | | | | (25 | ) | | | 1 | | | | 3 | | | | (20 | ) |
| |
Adjusted income — non-GAAP | | $ | 71 | | | $ | 67 | | | $ | 71 | | | $ | 91 | | | $ | 300 | |
| |
| | | | | | | | | | | | | | | | | | | | | |
Average shares outstanding, basic | | | 226.6 | | | | 226.9 | | | | 227.3 | | | | 227.8 | | | | 227.2 | |
Average shares outstanding, diluted | | | 233.2 | | | | 234.6 | | | | 238.5 | | | | 243.0 | | | | 237.9 | |
| | | | | | | | | | | | | | | | | | | | | |
| |
Reported earnings per share — GAAP | | $ | 0.30 | | | $ | 0.32 | | | $ | 0.28 | | | $ | 0.02 | | | $ | 0.91 | |
| |
After-tax items: | | | | | | | | | | | | | | | | | | | | |
| Electric and gas utility | | | — | | | | — | | | | — | | | | 0.33 | | | | 0.33 | |
| Enterprises | | | * | | | | 0.07 | | | | 0.01 | | | | 0.02 | | | | 0.09 | |
| Corporate interest and other | | | * | | | | * | | | | * | | | | (* | ) | | | 0.01 | |
| Discontinued operations (income) loss | | | 0.01 | | | | (0.11 | ) | | | 0.01 | | | | 0.01 | | | | (0.08 | ) |
| |
Adjusted earnings per share — non-GAAP | | $ | 0.31 | | | $ | 0.28 | | | $ | 0.30 | | | $ | 0.38 | | | $ | 1.26 | |
| |
| | |
| Note: | | Year-to-date (YTD) EPS may not equal sum of quarters due to share count differences. |
| |
| * | | Less than $500 thousand or $0.01 per share. |
2009 A-1
Consumers Energy
2009 Cash Flow GAAP Reconciliation (in millions) (unaudited)
| | | | | | | | | | | | | | | | | | | | | | | | | | | | | | | | | | | | | | | | | | | | | | | |
| | | | | | | Reclassifications From Sources and Uses to Statement of Cash Flows | | | | |
| Presentation Sources and Uses | | | Tax | | | Interest | | | Pension | | | Accts/Rec | | | Capital | | | Securitization | | | Operating | | | Preferred | | | Common | | | Consolidated Statements of Cash Flows |
| | | non-GAAP | | | Sharing | | | Payments | | | Contribution | | | Financing | | | Lease Pymts | | | Debt Pymts | | | Activites | | | Dividends | | | Dividends | | | GAAP | | | |
| Description | | Amount | | | Operating | | | as Operating | | | as Operating | | | as Operating | | | as Financing | | | as Financing | | | as Investing | | | as Financing | | | as Financing | | | Amount | | | Description |
| Cash at year end 2008 | | $ | 69 | | | $ | — | | | $ | — | | | $ | — | | | $ | — | | | $ | — | | | $ | — | | | $ | — | | | $ | — | | | $ | — | | | $ | 69 | | | Cash at year end 2008 |
| | | | | | | | | | | | | | | | | | | | | | | | | | | | | | | | | | | | | | | | | | | | | | | |
Sources | | | | | | | | | | | | | | | | | | | | | | | | | | | | | | | | | | | | | | | | | | | | | | |
| Operating | | $ | 1,315 | | | $ | (82 | ) | | $ | (224 | ) | | $ | — | | | $ | — | | | $ | 23 | | | $ | 34 | | | $ | (35 | ) | | $ | — | | | $ | — | | | $ | 1,031 | | | |
| Other working capital | | | 210 | | | | — | | | | — | | | | (199 | ) | | | (120 | ) | | | — | | | | — | | | | — | | | | — | | | | — | | | | (109 | ) | | Net cash provided by operating activities |
| | | | | | | | | | | | | | | | | | | | | | | | | | | | | | | | | | | | |
| Sources | | $ | 1,525 | | | $ | (82 | ) | | $ | (224 | ) | | $ | (199 | ) | | $ | (120 | ) | | $ | 23 | | | $ | 34 | | | $ | (35 | ) | | $ | — | | | $ | — | | | $ | 922 | | | |
| | | | | | | | | | | | | | | | | | | | | | | | | | | | | | | | | | | | | | | | | | | | | | | |
Uses | | | | | | | | | | | | | | | | | | | | | | | | | | | | | | | | | | | | | | | | | | | | | | |
| Interest and preferred dividends | | $ | (226 | ) | | $ | — | | | $ | 224 | | | $ | — | | | $ | — | | | $ | — | | | $ | — | | | $ | 35 | | | $ | 2 | | | $ | — | | | $ | 35 | | | |
| Pension Contribution | | | (199 | ) | | | — | | | | — | | | | 199 | | | | — | | | | — | | | | — | | | | — | | | | — | | | | — | | | | — | | | |
| Capital expenditures | | | (885 | ) | | | — | | | | — | | | | — | | | | — | | | | — | | | | — | | | | — | | | | — | | | | — | | | | (885 | ) | | |
| Dividends/tax sharing to CMS | | | (367 | ) | | | 82 | | | | — | | | | — | | | | — | | | | — | | | | — | | | | — | | | | — | | | | 285 | | | | — | | | Net cash provided by investing activities |
| | | | | | | | | | | | | | | | | | | | | | | | | | | | | | | | | | | | |
| Uses | | $ | (1,677 | ) | | $ | 82 | | | $ | 224 | | | $ | 199 | | | $ | — | | | $ | — | | | $ | — | | | $ | 35 | | | $ | 2 | | | $ | 285 | | | $ | (850 | ) | | |
| | | | | | | | | | | | | | | | | | | | | | | | | | | | | | | | | | | | |
| | | | | | | | | | | | | | | | | | | | | | | | | | | | | | | | | | | | | | | | | | | | | | | |
Cash flow | | $ | (152 | ) | | $ | — | | | $ | — | | | $ | — | | | $ | (120 | ) | | $ | 23 | | | $ | 34 | | | $ | — | | | $ | 2 | | | $ | 285 | | | $ | 72 | | | Cash flow from operating and investing activities |
| | | | | | | | | | | | | | | | | | | | | | | | | | | | | | | | | | | | | | | | | | | | | | | |
Financing | | | | | | | | | | | | | | | | | | | | | | | | | | | | | | | | | | | | | | | | | | | | | | |
| Equity | | $ | 100 | | | $ | — | | | $ | — | | | $ | — | | | $ | — | | | $ | — | | | $ | — | | | $ | — | | | $ | (2 | ) | | $ | — | | | $ | 98 | | | |
| New Issues | | | 500 | | | | — | | | | — | | | | — | | | | — | | | | — | | | | — | | | | — | | | | — | | | | — | | | | 500 | | | |
| Retirements | | | (353 | ) | | | — | | | | — | | | | — | | | | — | | | | (23 | ) | | | (34 | ) | | | — | | | | — | | | | (285 | ) | | | (695 | ) | | |
| Other | | | (5 | ) | | | — | | | | — | | | | — | | | | — | | | | — | | | | — | | | | — | | | | — | | | | — | | | | (5 | ) | | |
| Net short-term financing | | | (120 | ) | | | — | | | | — | | | | — | | | | 120 | | | | — | | | | — | | | | — | | | | — | | | | — | | | | — | | | Net cash provided by financing activities |
| | | | | | | | | | | | | | | | | | | | | | | | | | | | | | | | | | | | |
| Financing | | $ | 122 | | | $ | — | | | $ | — | | | $ | — | | | $ | 120 | | | $ | (23 | ) | | $ | (34 | ) | | $ | — | | | $ | (2 | ) | | $ | (285 | ) | | $ | (102 | ) | | |
| | | | | | | | | | | | | | | | | | | | | | | | | | | | | | | | | | | | |
| | | | | | | | | | | | | | | | | | | | | | | | | | | | | | | | | | | | | | | | | | | | | | | |
Net change in cash | | $ | (30 | ) | | $ | — | | | $ | — | | | $ | — | | | $ | — | | | $ | — | | | $ | — | | | $ | — | | | $ | — | | | $ | — | | | $ | (30 | ) | | Net change in cash |
| | | | | | | | | | | | | | | | | | | | | | | | | | | | | | | | | | | | |
| | | | | | | | | | | | | | | | | | | | | | | | | | | | | | | | | | | | | | | | | | | | | | | |
Cash at year end 2009 | | $ | 39 | | | $ | — | | | $ | — | | | $ | — | | | $ | — | | | $ | — | | | $ | — | | | $ | — | | | $ | — | | | $ | — | | | $ | 39 | | | Cash at year end 2009 |
| | | | | | | | | | | | | | | | | | | | | | | | | | | | | | | | | | | | |
2009 A-2
CMS Energy Parent
2009 Cash Flow GAAP Reconciliation (in millions) (unaudited)
| | | | | | | | | | | | | | | | | | | | | | | | | | | | | | | | | | | |
| | | | | | | Reclassifications From Sources and Uses to Statement of Cash Flows | | | | |
| Presentation Sources and Uses | | | Interest | | | Overheads & | | | Other | | | Preferred | | | Pref Stk | | | Cash From | | | Consolidated Statements of Cash Flows |
| | | non-GAAP | | | Payments | | | Tax Payments | | | Uses (a) | | | Dividends | | | Retirement | | | Consolidated | | | GAAP | | | |
| Description | | Amount | | | as Operating | | | as Operating | | | as Operating | | | as Financing | | | as Operating | | | Companies | | | Amount | | | Description |
| Cash at year end 2008 | | $ | 117 | | | $ | — | | | $ | — | | | $ | — | | | $ | — | | | $ | — | | | $ | 21 | | | $ | 138 | | | Cash at year end 2008 |
| | | | | | | | | | | | | | | | | | | | | | | | | | | | | | | | | | | |
Sources | | | | | | | | | | | | | | | | | | | | | | | | | | | | | | | | | | |
| Consumers Energy dividends/tax sharing | | $ | 367 | | | $ | (125 | ) | | $ | (19 | ) | | $ | — | | | $ | — | | | $ | (7 | ) | | $ | — | | | $ | 216 | | | |
| Enterprises | | | 16 | | | | — | | | | — | | | | (34 | ) | | | — | | | | — | | | | 13 | | | | (5 | ) | | |
| | | | | | | | | | | | | | | | | | | | | | | | | | | |
| Sources | | $ | 383 | | | $ | (125 | ) | | $ | (19 | ) | | $ | (34 | ) | | $ | — | | | $ | (7 | ) | | $ | 13 | | | $ | 211 | | | Net cash provided by operating activities |
| | | | | | | | | | | | | | | | | | | | | | | | | | | | | | | | | | | |
Uses | | | | | | | | | | | | | | | | | | | | | | | | | | | | | | | | | | |
| Interest and preferred dividends | | $ | (136 | ) | | $ | 125 | | | $ | — | | | $ | — | | | $ | 11 | | | $ | — | | | $ | — | | | $ | — | | | |
| Overhead and Federal tax payments | | | (19 | ) | | | — | | | | 19 | | | | — | | | | — | | | | — | | | | — | | | | — | | | |
| Pension Contributions | | | (7 | ) | | | — | | | | — | | | | 7 | | | | — | | | | — | | | | — | | | | — | | | |
| Equity infusions | | | (100 | ) | | | — | | | | — | | | | 27 | | | | — | | | | — | | | | (82 | ) | | | (155 | ) | | |
| | | | | | | | | | | | | | | | | | | | | | | | | | | |
| Uses (a) | | $ | (292 | ) | | $ | 125 | | | $ | 19 | | | $ | 34 | | | $ | 11 | | | $ | — | | | $ | (82 | ) | | $ | (185 | ) | | Net cash provided byinvesting activities |
| | | | | | | | | | | | | | | | | | | | | | | | | | | |
| | | | | | | | | | | | | | | | | | | | | | | | | | | | | | | | | | | |
Cash flow | | $ | 91 | | | $ | — | | | $ | — | | | $ | — | | | $ | 11 | | | $ | (7 | ) | | $ | (69 | ) | | $ | 26 | | | Cash flow from operating and investing activities |
| | | | | | | | | | | | | | | | | | | | | | | | | | | | | | | | | | | |
Financing and dividends | | | | | | | | | | | | | | | | | | | | | | | | | | | | | | | | | | |
| New Issues | | $ | 473 | | | $ | — | | | $ | — | | | $ | — | | | $ | (11 | ) | | $ | 7 | | | $ | 71 | | | $ | 540 | | | |
| Retirements | | | (473 | ) | | | — | | | | — | | | | — | | | | — | | | | — | | | | — | | | | (473 | ) | | |
| Net short-term financing | | | (80 | ) | | | — | | | | — | | | | — | | | | — | | | | — | | | | — | | | | (80 | ) | | |
| Other | | | 8 | | | | — | | | | — | | | | — | | | | — | | | | — | | | | — | | | | 8 | | | |
| Common dividend | | | (113 | ) | | | — | | | | — | | | | — | | | | — | | | | — | | | | — | | | | (113 | ) | | |
| | | | | | | | | | | | | | | | | | | | | | | | | | | |
| Financing | | $ | (185 | ) | | $ | — | | | $ | — | | | $ | — | | | $ | (11 | ) | | $ | 7 | | | $ | 71 | | | $ | (118 | ) | | Net cash provided by financing activities |
| | | | | | | | | | | | | | | | | | | | | | | | | | | |
| | | | | | | | | | | | | | | | | | | | | | | | | | | | | | | | | | | |
Net change in cash | | $ | (94 | ) | | $ | — | | | $ | — | | | $ | — | | | $ | — | | | $ | — | | | $ | 2 | | | $ | (92 | ) | | Net change in cash |
| | | | | | | | | | | | | | | | | | | | | | | | | | | | | | | | | | | |
Changes in Cash included in asset held for sale | | $ | — | | | $ | — | | | $ | — | | | $ | — | | | $ | — | | | $ | — | | | $ | 5 | | | $ | 5 | | | Changes in Cash included in asset held for sale |
| | | | | | | | | | | | | | | | | | | | | | | | | | | |
| | | | | | | | | | | | | | | | | | | | | | | | | | | | | | | | | | | |
Cash at year end 2009 | | $ | 23 | | | $ | — | | | $ | — | | | $ | — | | | $ | — | | | $ | — | | | $ | 28 | | | $ | 51 | | | Cash at year end 2009 |
| | | | | | | | | | | | | | | | | | | | | | | | | | | |
| | |
| (a) | | Includes other and roundings |
2009 A-3
Consolidated CMS Energy
2009 Consolidation of Consumers Energy and CMS Energy Parent Statements of Cash Flow (in millions) (unaudited)
| | | | | | | | | | | | | | | | | | | | | | | |
| | | | | | | | | | | Eliminations/Reclassifications | | | | |
| | | | | | | | | | | to Arrive at the Consolidated | | | | |
| | | | | | | | | | | Statement of Cash Flows | | | | |
| Statements of Cash Flows | | | Consumers | | | Equity | | | | |
| | | Consumers | | | CMS Parent | | | Common Dividend | | | Infusions to | | | Consolidated Statements of Cash Flows |
| Description | | Amount | | | Amount | | | as Financing | | | Consumers | | | Amount | | | Description |
Cash at year end 2008 | | $ | 69 | | | $ | 138 | | | $ | — | | | $ | — | | | $ | 207 | | | Cash at year end 2008 |
| | | | | | | | | | | | | | | | | | | | | | | |
Net cash provided by operating activities | | $ | 922 | | | $ | 211 | | | $ | (285 | ) | | $ | — | | | $ | 848 | | | Net cash provided by operating activities |
| | | | | | | | | | | | | | | | | | | | | | | |
Net cash provided by investing activities | | | (850 | ) | | | (185 | ) | | | — | | | | 100 | | | | (935 | ) | | Net cash provided by investing activities |
| | | | | | | | | | | | | | | | | | | | | | | |
| | | | | | | | | | | | | | | | | |
Cash flow from operating and investing activities | | $ | 72 | | | $ | 26 | | | $ | (285 | ) | | $ | 100 | | | $ | (87 | ) | | Cash flow from operating and investing activities |
| | | | | | | | | | | | | | | | | | | | | | | |
Net cash provided by financing activities | | $ | (102 | ) | | $ | (118 | ) | | $ | 285 | | | $ | (100 | ) | | $ | (35 | ) | | Net cash provided by financing activities |
| | | | | | | | | | | | | | | | | | | | | | | |
| | | | | | | | | | | | | | | | | |
Net change in cash | | $ | (30 | ) | | $ | (92 | ) | | $ | — | | | $ | — | | | $ | (122 | ) | | Net change in cash |
| | | | | | | | | | | | | | | | | | | | | | | |
Changes in Cash included in asset held for sale | | $ | — | | | $ | 5 | | | $ | — | | | $ | — | | | $ | 5 | | | Changes in Cash included in asset held for sale |
| | | | | | | | | | | | | | | | | | | | | | | |
| | | | | | | | | | | | | | | | | |
Cash at year end 2009 | | $ | 39 | | | $ | 51 | | | $ | — | | | $ | — | | | $ | 90 | | | Cash at year end 2009 |
| | | | | | | | | | | | | | | | | |
2009 A-4
CMS Energy
Reconciliation of 2009 Operating Cash Flow Target to GAAP Operating Activities
(unaudited)
| | | | | | | | | |
| | | Amount | | | | | |
| | | (mils) | | | | | |
| | | | | | | | | |
| Consumers Operating (Consumers PTOI + Depreciation) | | $ | 1,315 | | | | | |
| Enterprises (Project Cash Flows) | | | 16 | | | | | |
| | | | | | | | |
Operating Cash Flow | | $ | 1,331 | | | non-GAAP |
| | | | | | | | | |
| Other operating activies including taxes, interest payments and working capital | | | (483 | ) | | | | |
| | | | | | | | | |
| | | | | | | |
Net cash provided by operating activites | | $ | 848 | | | GAAP |
| | | | | | | | |
2009 A-5
Consumers Energy
2010 Forecasted Cash Flow GAAP Reconciliation (in millions) (unaudited)
| | | | | | | | | | | | | | | | | | | | | | | | | | | | | | | | | | | | | | | | | | | |
| | | | | | | Reclassifications From Sources and Uses to Statement of Cash Flows | | | Consolidated |
| Presentation Sources and Uses | | | Tax | | | Interest | | | Pension | | | Accts/Rec | | | Capital | | | Securitization | | | Preferred | | | Common | | | Statements of Cash Flows |
| | | non-GAAP | | | Sharing | | | Payments | | | Contribution | | | Financing | | | Lease Pymts | | | Debt Pymts | | | Dividends | | | Dividends | | | GAAP | | | |
| Description | | Amount | | | Operating | | | as Operating | | | as Operating | | | as Operating | | | as Financing | | | as Financing | | | as Financing | | | as Financing | | | Amount | | | Description |
| Cash at year end 2009 | | $ | 39 | | | $ | — | | | $ | — | | | $ | — | | | $ | — | | | $ | — | | | $ | — | | | $ | — | | | $ | — | | | $ | 39 | | | Cash at year end 2009 |
| | | | | | | | | | | | | | | | | | | | | | | | | | | | | | | | | | | | | | | | | | | |
Sources | | | | | | | | | | | | | | | | | | | | | | | | | | | | | | | | | | | | | | | | | | |
| Operating | | $ | 1,450 | | | $ | (235 | ) | | $ | (221 | ) | | $ | — | | | $ | — | | | $ | 23 | | | $ | 35 | | | $ | — | | | $ | — | | | $ | 1,052 | | | |
| Other working capital | | | (135 | ) | | | — | | | | — | | | | (97 | ) | | | (50 | ) | | | — | | | | — | | | | — | | | | — | | | | (282 | ) | | |
| | | | | | | | | | | | | | | | | | | | | | | | | | | | | | | | | |
| Sources | | $ | 1,315 | | | $ | (235 | ) | | $ | (221 | ) | | $ | (97 | ) | | $ | (50 | ) | | $ | 23 | | | $ | 35 | | | $ | — | | | $ | — | | | $ | 770 | | | Net cash provided by operating activities |
| | | | | | | | | | | | | | | | | | | | | | | | | | | | | | | | | | | | | | | | | | | |
Uses | | | | | | | | | | | | | | | | | | | | | | | | | | | | | | | | | | | | | | | | | | |
| Interest and preferred dividends | | $ | (223 | ) | | $ | — | | | $ | 221 | | | $ | — | | | $ | — | | | $ | — | | | $ | — | | | $ | 2 | | | $ | — | | | $ | — | | | |
| Pension Contribution | | | (97 | ) | | | — | | | | — | | | | 97 | | | | — | | | | — | | | | — | | | | — | | | | — | | | | — | | | |
| Capital expenditures | | | (1,010 | ) | | | — | | | | — | | | | — | | | | — | | | | — | | | | — | | | | — | | | | — | | | | (1,010 | ) | | |
| Dividends/tax sharing to CMS | | | (570 | ) | | | 235 | | | | — | | | | — | | | | — | | | | — | | | | — | | | | — | | | | 335 | | | | — | | | |
| | | | | | | | | | | | | | | | | | | | | | | | | | | | | | | | | |
| Uses | | $ | (1,900 | ) | | $ | 235 | | | $ | 221 | | | $ | 97 | | | $ | — | | | $ | — | | | $ | — | | | $ | 2 | | | $ | 335 | | | $ | (1,010 | ) | | Net cash provided by investing activities |
| | | | | | | | | | | | | | | | | | | | | | | | | | | | | | | | | |
| |
Cash flow | | $ | (585 | ) | | $ | — | | | $ | — | | | $ | — | | | $ | (50 | ) | | $ | 23 | | | $ | 35 | | | $ | 2 | | | $ | 335 | | | $ | (240 | ) | | Cash flow from operating and investing activities |
Financing | | | | | | | | | | | | | | | | | | | | | | | | | | | | | | | | | | | | | | | | | | |
| Equity | | $ | 250 | | | $ | — | | | $ | — | | | $ | — | | | $ | — | | | $ | — | | | $ | — | | | $ | (2 | ) | | $ | — | | | $ | 248 | | | |
| New Issues | | | 550 | | | | — | | | | — | | | | — | | | | — | | | | — | | | | — | | | | — | | | | — | | | | 550 | | | |
| Retirements | | | (310 | ) | | | — | | | | — | | | | — | | | | — | | | | (23 | ) | | | (35 | ) | | | — | | | | (335 | ) | | | (703 | ) | | |
| Net short-term financing & other | | | 81 | | | | — | | | | — | | | | — | | | | 50 | | | | — | | | | — | | | | — | | | | — | | | | 131 | | | |
| | | | | | | | | | | | | | | | | | | | | | | | | | | | | | | | | |
| Financing | | $ | 571 | | | $ | — | | | $ | — | | | $ | — | | | $ | 50 | | | $ | (23 | ) | | $ | (35 | ) | | $ | (2 | ) | | $ | (335 | ) | | $ | 226 | | | Net cash provided by financing activities |
| | | | | | | | | | | | | | | | | | | | | | | | | | | | | | | | | | | | | | | | | | | |
| | | | | | | | | | | | | | | | | | | | | | | | | | | | | | | | | |
Net change in cash | | $ | (14 | ) | | $ | — | | | $ | — | | | $ | — | | | $ | — | | | $ | — | | | $ | — | | | $ | — | | | $ | — | | | $ | (14 | ) | | Net change in cash |
| | | | | | | | | | | | | | | | | | | | | | | | | | | | | | | | | | | | | | | | | | | |
| | | | | | | | | | | | | | | | | | | | | | | | | | | | | | | | | |
Cash at year end 2010 | | $ | 25 | | | $ | — | | | $ | — | | | $ | — | | | $ | — | | | $ | — | | | $ | — | | | $ | — | | | $ | — | | | $ | 25 | | | Cash at year end 2010 |
| | | | | | | | | | | | | | | | | | | | | | | | | | | | | | | | |
2010 A-1
CMS Energy Parent
2010 Forecasted Cash Flow GAAP Reconciliation (in millions) (unaudited)
| | | | | | | | | | | | | | | | | | | | | | | | | | | | | | | |
| | | | | | | Reclassifications From Sources and Uses to Statement of Cash Flows | | | | |
| | | | | | | | | | | | | | | | | | | | | | | | | | | Consolidated |
| Presentation Sources and Uses | | | Interest | | | Overheads & | | | Other | | | Preferred | | | Cash From | | | Statements of Cash Flows |
| | | non-GAAP | | | Payments | | | Tax Payments | | | Uses (a) | | | Dividends | | | Consolidated | | | GAAP | | | |
| Description | | Amount | | | as Operating | | | as Operating | | | as Operating | | | as Financing | | | Companies | | | Amount | | | Description |
| Cash at year end 2009 | | $ | 23 | | | $ | — | | | $ | — | | | $ | — | | | $ | — | | | $ | 28 | | | $ | 51 | | | Cash at year end 2009 |
| | | | | | | | | | | | | | | | | | | | | | | | | | | | | | | |
Sources | | | | | | | | | | | | | | | | | | | | | | | | | | | | | | |
| Consumers Energy dividends/tax sharing | | $ | 570 | | | $ | (124 | ) | | $ | (30 | ) | | $ | — | | | $ | — | | | $ | — | | | $ | 416 | | | |
| Enterprises | | | 35 | | | | | | | | | | | | | | | | | | | | | | | | 35 | | | |
| Insurance settlement | | | 50 | | | | — | | | | — | | | | (45 | ) | | | — | | | | 5 | | | | 10 | | | |
| | | | | | | | | | | | | | | | | | | | | | | | |
| Sources | | $ | 655 | | | $ | (124 | ) | | $ | (30 | ) | | $ | (45 | ) | | $ | — | | | $ | 5 | | | $ | 461 | | | Net cash provided by operating activities |
| |
Uses | | | | | | | | | | | | | | | | | | | | | | | | | | | | | | |
| Interest and preferred dividends | | $ | (135 | ) | | $ | 124 | | | $ | — | | | $ | — | | | $ | 11 | | | $ | — | | | $ | — | | | |
| Overhead and Federal tax payments | | | (30 | ) | | | — | | | | 30 | | | | — | | | | — | | | | — | | | | — | | | |
| Pension Contributions | | | (3 | ) | | | — | | | | — | | | | 3 | | | | — | | | | — | | | | — | | | |
| Equity infusions | | | (250 | ) | | | — | | | | — | | | | 42 | | | | — | | | | (48 | ) | | | (256 | ) | | |
| | | | | | | | | | | | | | | | | | | | | | | | |
| Uses (a) | | $ | (460 | ) | | $ | 124 | | | $ | 30 | | | $ | 45 | | | $ | 11 | | | $ | (48 | ) | | $ | (298 | ) | | Net cash provided by investing activities |
| |
| | | | | | | | | | | | | | | | | | | | | | | | |
Cash flow | | $ | 195 | | | $ | — | | | $ | — | | | $ | — | | | $ | 11 | | | $ | (43 | ) | | $ | 163 | | | Cash flow from operating and investing activities |
| | | | | | | | | | | | | | | | | | | | | | | | | | | | | | | |
Financing and dividends | | | | | | | | | | | | | | | | | | | | | | | | | | | | | | |
| New Issues | | $ | 300 | | | $ | — | | | $ | — | | | $ | — | | | $ | (11 | ) | | $ | 26 | | | $ | 315 | | | |
| Retirements | | | (80 | ) | | | — | | | | — | | | | — | | | | — | | | | — | | | | (80 | ) | | |
| Net short-term financing & other | | | (21 | ) | | | — | | | | — | | | | — | | | | — | | | | — | | | | (21 | ) | | |
| Common dividend | | | (137 | ) | | | — | | | | — | | | | — | | | | — | | | | — | | | | (137 | ) | | |
| | | | | | | | | | | | | | | | | | | | | | | | |
| Financing | | $ | 62 | | | $ | — | | | $ | — | | | $ | — | | | $ | (11 | ) | | $ | 26 | | | $ | 77 | | | Net cash provided by financing activities |
| |
| | | | | | | | | | | | | | | | | | | | | | | | |
Net change in cash | | $ | 257 | | | $ | — | | | $ | — | | | $ | — | | | $ | — | | | $ | (17 | ) | | $ | 240 | | | Net change in cash |
| |
| | | | | | | | | | | | | | | | | | | | | | | | |
Cash at year end 2010 | | $ | 280 | | | $ | — | | | $ | — | | | $ | — | | | $ | — | | | $ | 11 | | | $ | 291 | | | Cash at year end 2010 |
| | | | | | | | | | | | | | | | | | | | | | | | |
| | |
| (a) | | Includes other and roundings |
2010 A-2
Consolidated CMS Energy
2010 Forecasted Consolidation of Consumers Energy and CMS Energy Parent Statements of Cash Flow (in millions) (unaudited)
| | | | | | | | | | | | | | | | | | | | | | | |
| | | | | | | | | | | Eliminations/Reclassifications | | | | |
| | | | | | | | | | | to Arrive at the Consolidated | | | | |
| | | | | | | | | | | Statement of Cash Flows | | | | |
| Statements of Cash Flows | | | Consumers | | | Equity | | | Consolidated Statements |
| | | Consumers | | | CMS Parent | | | Common Dividend | | | Infusions to | | | of Cash Flows |
| Description | | Amount | | | Amount | | | as Financing | | | Consumers | | | Amount | | | Description |
Cash at year end 2009 | | $ | 39 | | | $ | 51 | | | $ | — | | | $ | — | | | $ | 90 | | | Cash at year end 2009 |
| | | | | | | | | | | | | | | | | | | | | | | |
Net cash provided by operating activities | | $ | 770 | | | $ | 461 | | | $ | (335 | ) | | $ | — | | | $ | 896 | | | Net cash provided by operating activities |
| | | | | | | | | | | | | | | | | | | | | | | |
Net cash provided by investing activities | | | (1,010 | ) | | | (298 | ) | | | — | | | | 250 | | | | (1,058 | ) | | Net cash provided by investing activities |
| | | | | | | | | | | | | | | | | | |
| |
Cash flow from operating and investing activities | | $ | (240 | ) | | $ | 163 | | | $ | (335 | ) | | $ | 250 | | | $ | (162 | ) | | Cash flow from operating and investing activities |
| | | | | | | | | | | | | | | | | | | | | | | |
Net cash provided by financing activities | | $ | 226 | | | $ | 77 | | | $ | 335 | | | $ | (250 | ) | | $ | 388 | | | Net cash provided by financing activities |
| | | | | | | | | | | | | | | | | | | | | | | |
| | | | | | | | | | | | | | | | | | |
Net change in cash | | $ | (14 | ) | | $ | 240 | | | $ | — | | | $ | — | | | $ | 226 | | | Net change in cash |
| | | | | | | | | | | | | | | | | | | | | | | |
| | | | | | | | | | | | | | | | | | |
Cash at year end 2010 | | $ | 25 | | | $ | 291 | | | $ | — | | | $ | — | | | $ | 316 | | | Cash at year end 2010 |
| | | | | | | | | | | | | | | | | | |
2010 A-3
CMS Energy
Reconciliation of 2010 Operating Cash Flow Target to GAAP Operating Activities
(unaudited)
| | | | | | | |
| | | Amount | | | |
| | | (mils) | | | |
| | | | | | | |
| Consumers Operating (Consumers PTOI + Depreciation) | | $ | 1,450 | | | |
| Enterprises (Project Cash Flows) | | | 35 | | | |
| | | | | | | |
Operating Cash Flow | | $ | 1,485 | | | non-GAAP |
| | | | | | | |
| Other operating activies including taxes, interest payments and working capital | | | (589 | ) | | |
| | | | | | | |
| | | | | | | |
Net cash provided by operating activites | | $ | 896 | | | GAAP |
| | | | | | | |
2010 A-4


