
| Growing Forward Dave Joos, President and CEO Tom Webb, Executive VP and CFO Boston Meetings - March 2008 |
| This presentation contains forward-looking statements. Actual results may differ materially from those anticipated in such statements as a result of various factors discussed in our SEC filings. The presentation also includes non-GAAP measures when describing CMS Energy's results of operations and financial performance. A reconciliation of each of these measures to the most directly comparable GAAP measure is posted on our website at www.cmsenergy.com. CMS Energy expects 2008 reported earnings to be about the same as adjusted earnings. Reported earnings could vary because of gains or charges relating to previously sold assets and business operations or other factors. CMS Energy is not providing reported earnings guidance reconciliation because of the uncertainties associated with those factors. |
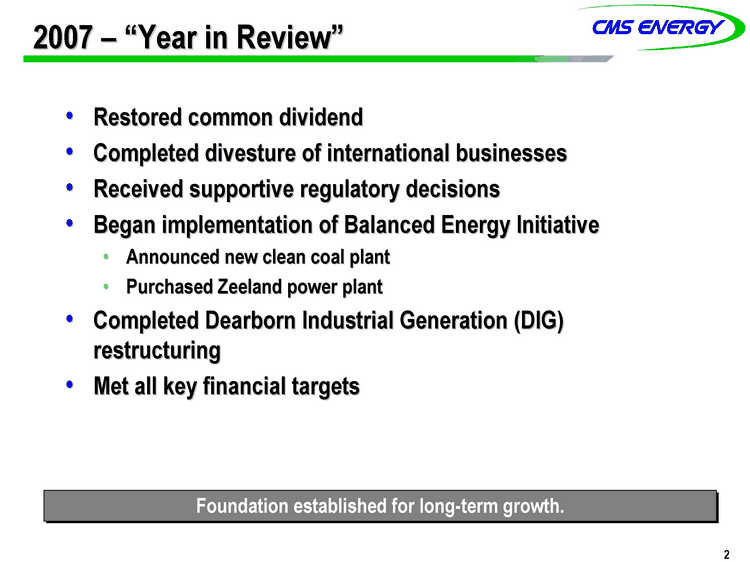
| 2007 - "Year in Review" Restored common dividend Completed divesture of international businesses Received supportive regulatory decisions Began implementation of Balanced Energy Initiative Announced new clean coal plant Purchased Zeeland power plant Completed Dearborn Industrial Generation (DIG) restructuring Met all key financial targets Foundation established for long-term growth. |
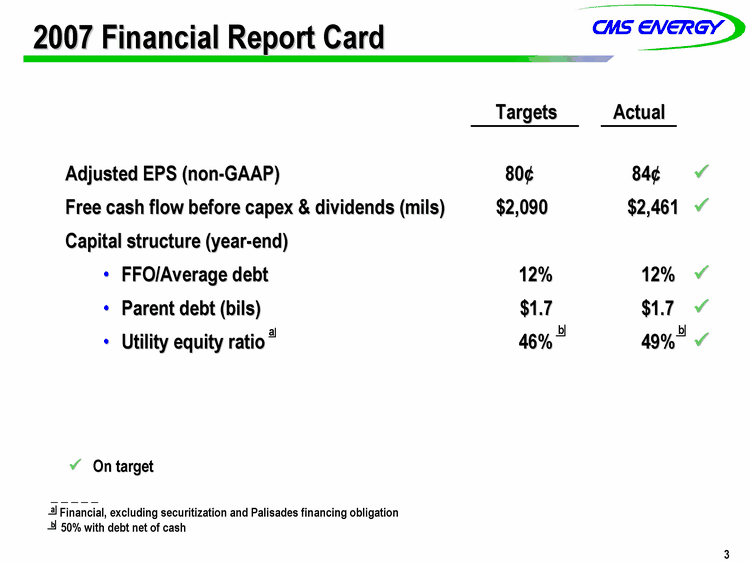
| 2007 Financial Report Card Targets Actual Adjusted EPS (non-GAAP) 80¢ 84¢ ? Free cash flow before capex & dividends (mils) $2,090 $2,461 ? Capital structure (year-end) FFO/Average debt 12% 12% ? Parent debt (bils) $1.7 $1.7 ? Utility equity ratio 46% 49% ? ? On target _ _ _ _ _ a Financial, excluding securitization and Palisades financing obligation b 50% with debt net of cash a b b |
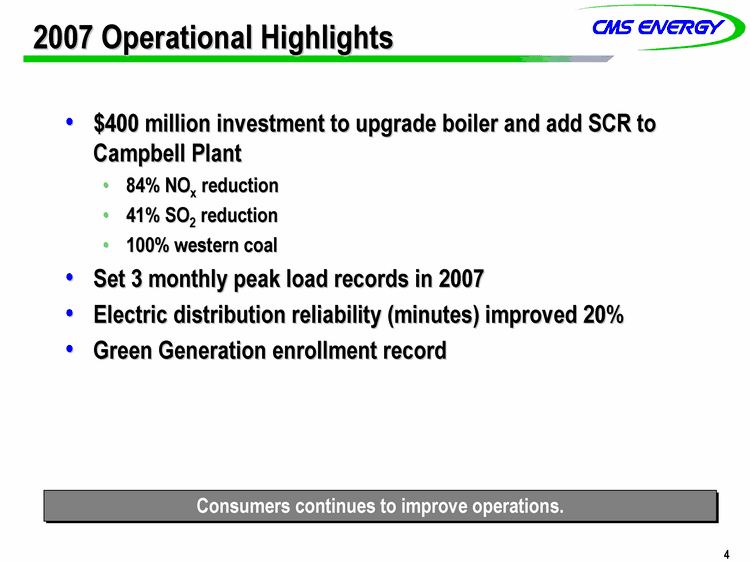
| 2007 Operational Highlights $400 million investment to upgrade boiler and add SCR to Campbell Plant 84% NOx reduction 41% SO2 reduction 100% western coal Set 3 monthly peak load records in 2007 Electric distribution reliability (minutes) improved 20% Green Generation enrollment record Consumers continues to improve operations. |
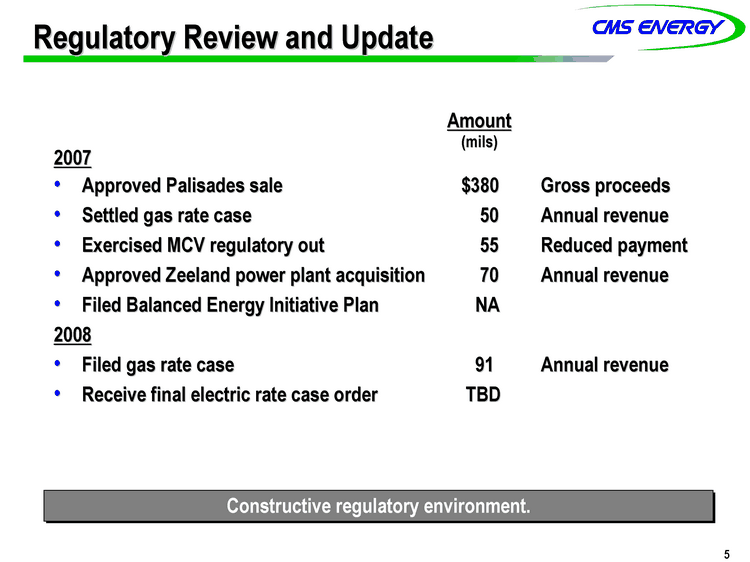
| Regulatory Review and Update Amount (mils) 2007 Approved Palisades sale $380 Gross proceeds Settled gas rate case 50 Annual revenue Exercised MCV regulatory out 55 Reduced payment Approved Zeeland power plant acquisition 70 Annual revenue Filed Balanced Energy Initiative Plan NA 2008 Filed gas rate case 91 Annual revenue Receive final electric rate case order TBD Constructive regulatory environment. |
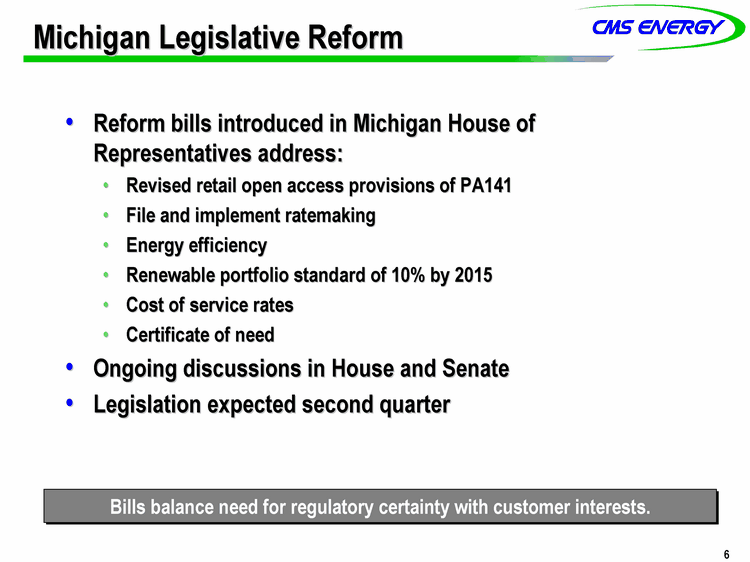
| Michigan Legislative Reform Reform bills introduced in Michigan House of Representatives address: Revised retail open access provisions of PA141 File and implement ratemaking Energy efficiency Renewable portfolio standard of 10% by 2015 Cost of service rates Certificate of need Ongoing discussions in House and Senate Legislation expected second quarter Bills balance need for regulatory certainty with customer interests. |
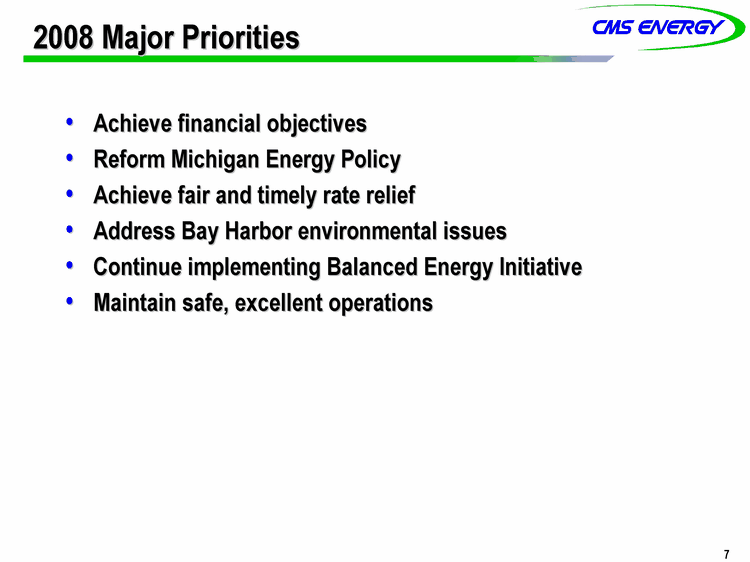
| 2008 Major Priorities Achieve financial objectives Reform Michigan Energy Policy Achieve fair and timely rate relief Address Bay Harbor environmental issues Continue implementing Balanced Energy Initiative Maintain safe, excellent operations |
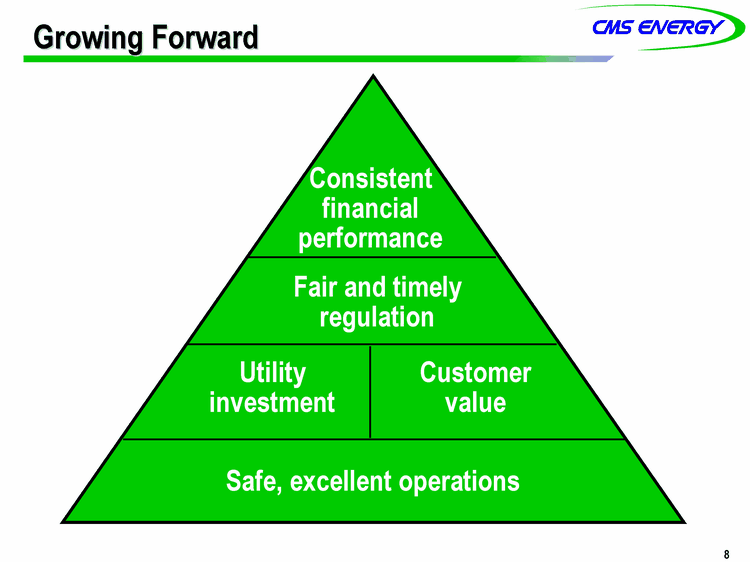
| Growing Forward Consistent financial performance Fair and timely regulation Utility investment Customer value Safe, excellent operations |
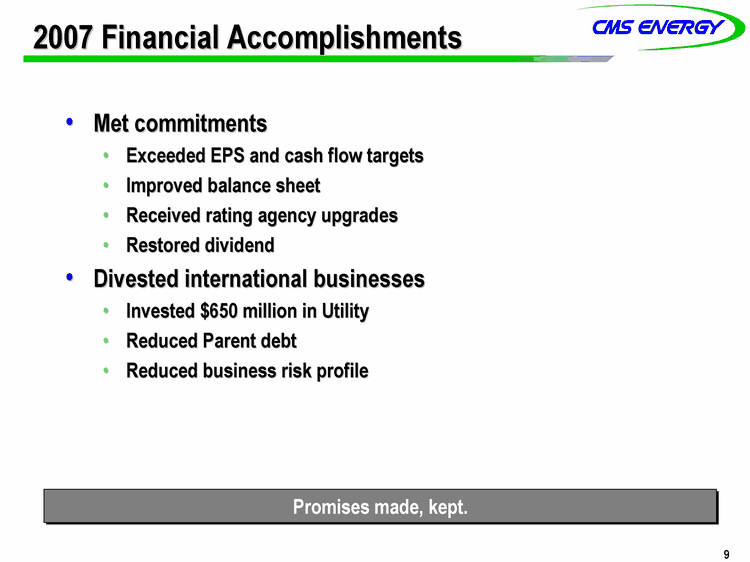
| 2007 Financial Accomplishments Met commitments Exceeded EPS and cash flow targets Improved balance sheet Received rating agency upgrades Restored dividend Divested international businesses Invested $650 million in Utility Reduced Parent debt Reduced business risk profile Promises made, kept. |
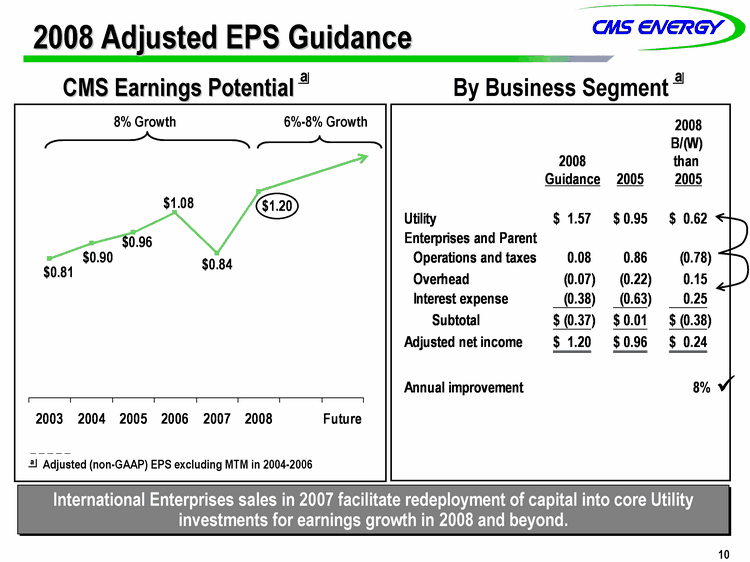
| 2008 Adjusted EPS Guidance International Enterprises sales in 2007 facilitate redeployment of capital into core Utility investments for earnings growth in 2008 and beyond. 2003 2004 2005 2006 2007 2008 Future 0.81 0.9 0.96 1.08 0.84 1.2 CMS Earnings Potential _ _ _ _ _ a Adjusted (non-GAAP) EPS excluding MTM in 2004-2006 By Business Segment a a 8% Growth 6%-8% Growth ? |
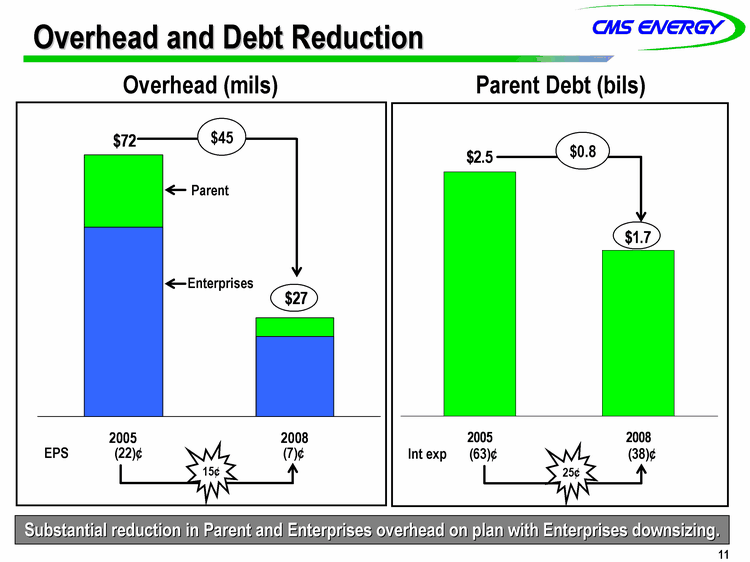
| Overhead and Debt Reduction 2005 2008 Utility 28.4 27.4 Enterprises 52 22 Parent 20 5 Substantial reduction in Parent and Enterprises overhead on plan with Enterprises downsizing. EPS (22)¢ (7)¢ $45 Parent Enterprises 2005 2008 Debt 2.5 1.7 Int exp (63)¢ (38)¢ $0.8 Overhead (mils) Parent Debt (bils) 15¢ 25¢ |
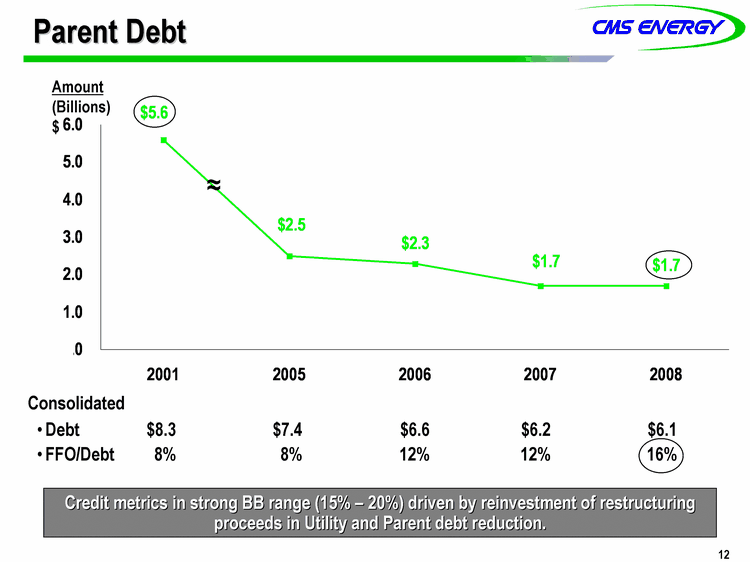
| 2001 2005 2006 2007 2008 2009 2008 Budget 5.6 2.5 2.3 1.7 1.7 1.7 Consolidated Debt $8.3 $7.4 $6.6 $6.2 $6.1 FFO/Debt 8% 8% 12% 12% 16% Amount (Billions) $ ^ Parent Debt Credit metrics in strong BB range (15% - 20%) driven by reinvestment of restructuring proceeds in Utility and Parent debt reduction. |
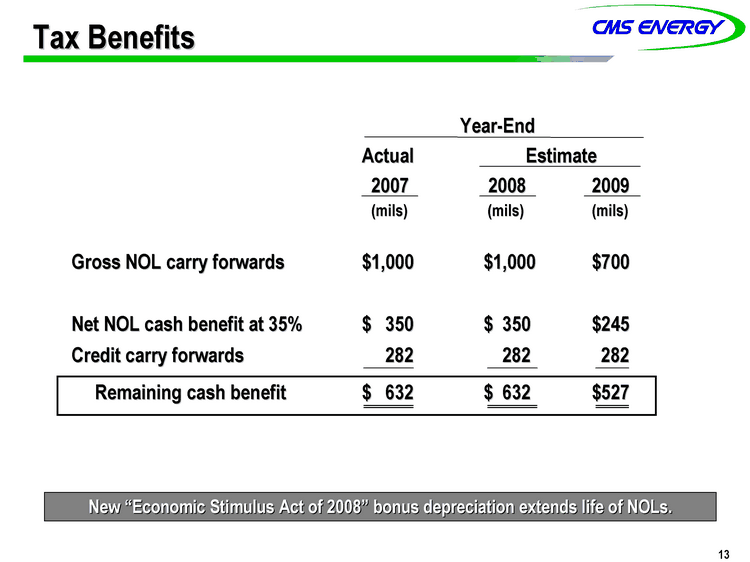
| Tax Benefits Year-End Actual Estimate 2007 2008 2009 (mils) (mils) (mils) Gross NOL carry forwards $1,000 $1,000 $700 Net NOL cash benefit at 35% $ 350 $ 350 $245 Credit carry forwards 282 282 282 Remaining cash benefit $ 632 $ 632 $527 New "Economic Stimulus Act of 2008" bonus depreciation extends life of NOLs. |
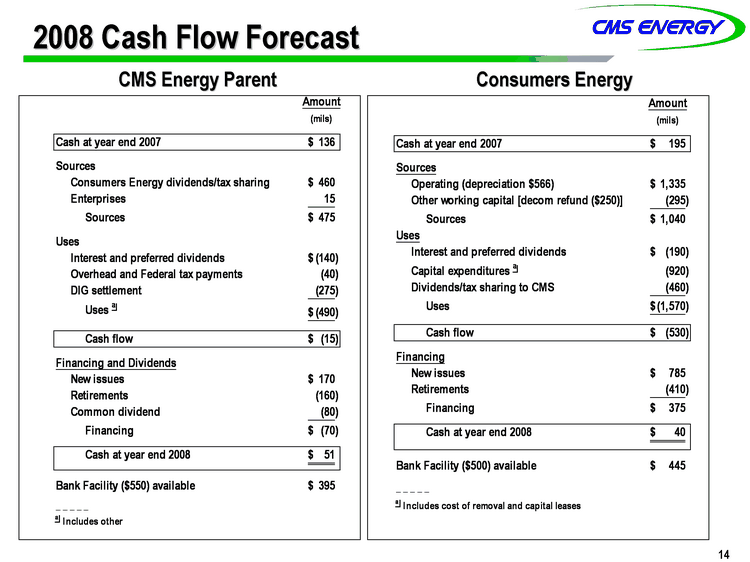
| 2008 Cash Flow Forecast CMS Energy Parent Consumers Energy |
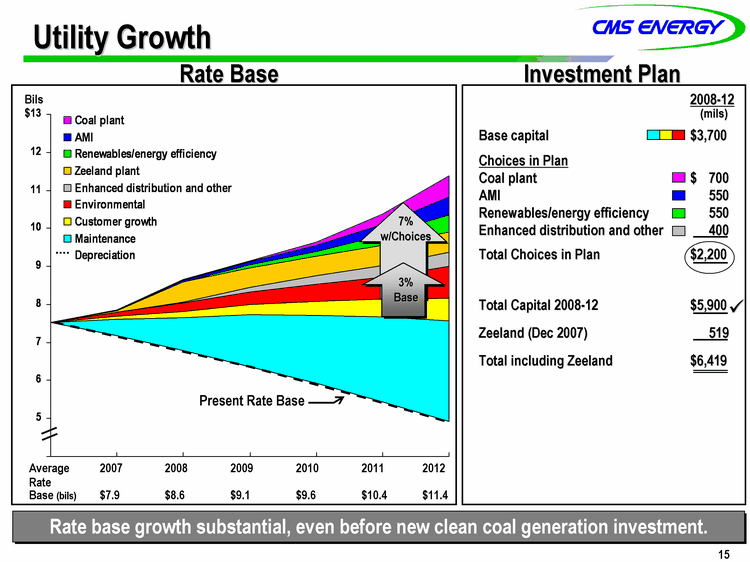
| Utility Growth 2007 2008 2009 2010 2011 2012 Depreciation 7.534 7.173 6.785 6.366 5.918 5.436 4.926 Maintenance 0.429 0.86 1.371 1.802 2.229 2.638 Customer growth 0.091 0.171 0.254 0.355 0.472 0.594 Environmental 0.107 0.215 0.339 0.453 0.585 0.849 Enhanced distribution and other 0 0.033 0.118 0.221 0.307 0.369 Zeeland plant 0.043 0.519 0.519 0.519 0.524 0.528 Renewables/energy efficiency 0 0.019 0.067 0.129 0.263 0.458 AMI 0.004 0.035 0.087 0.163 0.301 0.474 Coal plant 0.004 0.011 0.019 0.084 0.264 0.542 2008-12 (mils) Base capital $ 3,700 Choices in Plan Coal plant $ 700 AMI 550 Renewables/energy efficiency 550 Enhanced distribution and other 400 Total Choices in Plan $ 2,200 Total Capital 2008-12 $ 5,900 Zeeland (Dec 2007) 519 Total including Zeeland $ 6,419 Investment Plan Rate Base Bils $ Present Rate Base Average 2007 2008 2009 2010 2011 2012 Rate Base (bils) $7.9 $8.6 $9.1 $9.6 $10.4 $11.4 3% Base 7% w/Choices ? Rate base growth substantial, even before new clean coal generation investment. |
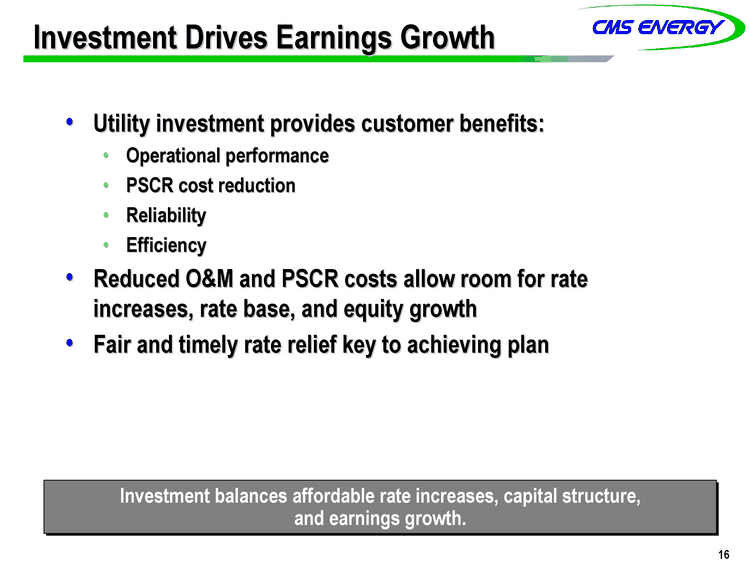
| Investment Drives Earnings Growth Utility investment provides customer benefits: Operational performance PSCR cost reduction Reliability Efficiency Reduced O&M and PSCR costs allow room for rate increases, rate base, and equity growth Fair and timely rate relief key to achieving plan Investment balances affordable rate increases, capital structure, and earnings growth. |
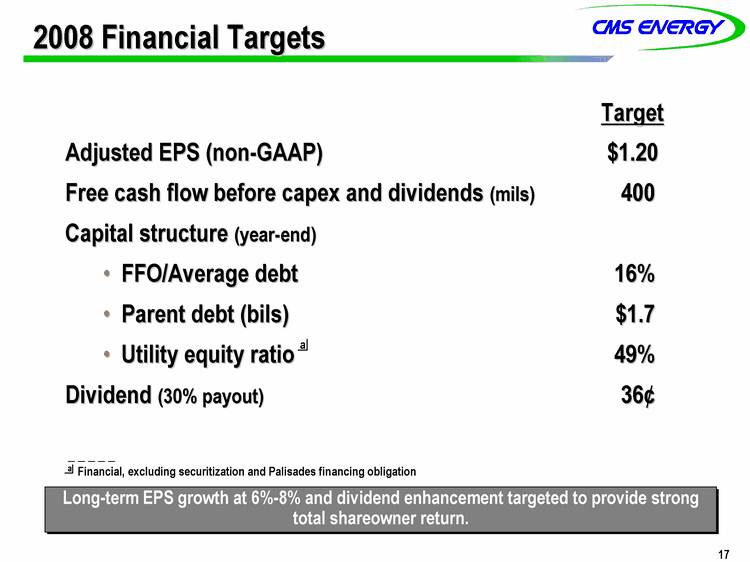
| 2008 Financial Targets Target Adjusted EPS (non-GAAP) $1.20 Free cash flow before capex and dividends (mils) 400 Capital structure (year-end) FFO/Average debt 16% Parent debt (bils) $1.7 Utility equity ratio 49% Dividend (30% payout) 36¢ _ _ _ _ _ a Financial, excluding securitization and Palisades financing obligation a Long-term EPS growth at 6%-8% and dividend enhancement targeted to provide strong total shareowner return. |
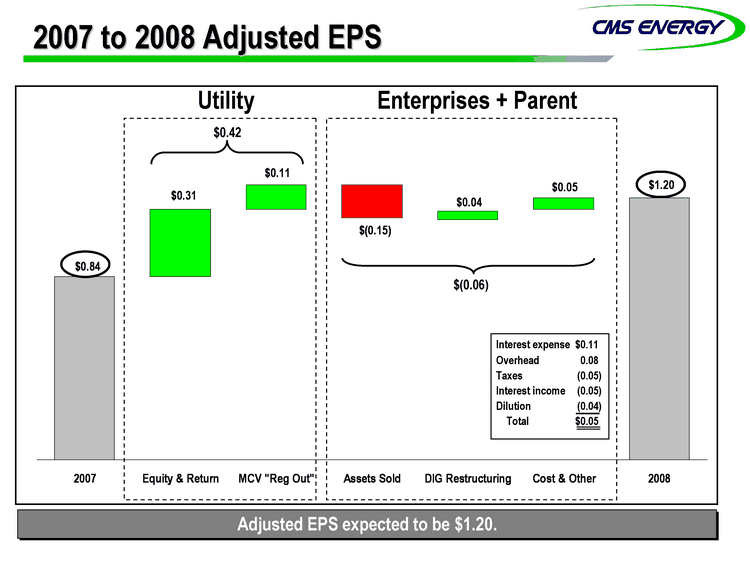
| 2007 to 2008 Adjusted EPS 2007 Equity & Return MCV "Reg Out" Assets Sold DIG Restructuring Cost & Other 2008 Grey 0.84 1.2 no fill 0.84 1.15 1.11 1.1 1.15 Red 0.15 Green 0.31 0.11 0.04 0.05 Utility Enterprises + Parent $0.42 $(0.06) Interest expense $0.11 Overhead 0.08 Taxes (0.05) Interest income (0.05) Dilution (0.04) Total $0.05 Adjusted EPS expected to be $1.20. |
ELECTRIC RATE CASE U-15245*
MPSC Staff Recommendation for Final
On November 6, 2007 the MPSC Staff filed their position on Consumers Energy’s request for final electric rate relief and recovery of Zeeland Plant costs. Staff is recommending a $203 million rate increase to earn an authorized return on equity of 10.6%. The Staff confirms the Zeeland position they put forth in the interim phase of the case with an update for the impact of the test year capital structure of the acquisition. The Staff is rejecting the Company’s proposal for a surcharge to recover the return on nuclear legacy investment. Staff supports the entirety of the Company’s rate design proposal, as well as our proposed Energy Efficiency Program.
| | | | | | | | | | | |
| | | Company | | MPSC Staff | | |
| Item | | $ Millions | | $ Millions | | Variance Explanation |
Base Rate Impacts | | | | | | | | | | |
| | | | | | | | | | | |
| O&M | | $ | 110 | | | $ | 113 | | | Distribution & Customer: $3 |
| | | | | | | | | | | |
| Rate of Return | | | 31 | | | | (1 | ) | | Lower equity capitalization |
| | | | | | | | | | | (41.2% v. 41.5%): $(2) |
| | | | | | | | | | | Lower return on equity |
| | | | | | | | | | | (10.6% v. 11.25%): $(24) |
| | | | | | | | | | | Other capitalization/costs: $(6) |
| | | | | | | | | | | |
| Rate Base | | | 53 | | | | 41 | | | Lower working capital due to increased sale of |
| | | | | | | | | | | receivables: $(12) |
| | | | | | | | | | | |
| Book Depreciation | | | 34 | | | | 32 | | | Lower depreciation related to new investment: $(2) |
| | | | | | | | | | | |
| Gross Margin | | | (151 | ) | | | (151 | ) | | Returning ROA (879 MW v. 350 MW), |
| | | | | | | | | | | Sales growth (2006 v. 2003) |
| | | | | | | | | | | |
| Taxes & Other | | | 64 | | | | 70 | | | Increased property, MSBT, FIT and reduced AFUDC |
| | | | | | | | | | | offset: $6 |
| | | | | | | | | | | |
| Palisades | | | (164 | ) | | | (164 | ) | | Removal of Palisades revenue requirement from |
| | | | | | | | | | | current base rates |
| | | | | | | | | | | |
Zeeland Plant(1) | | | 92 | | | | 78 | | | Lower ROE recommendation, O&M at |
| | | | | | | | | | | |
| | | | | | | | | | | 2006 levels, and lower property tax |
| | | | | | | | | | | expense: $(14) |
| | | $ | 69 | | | $ | 18 | | | |
| | | | | | | | | | | |
Other Impacts | | | | | | | | | | |
| | | | | | | | | | | |
| Remove Palisades PSCR Base Rate Recovery | | $ | 167 | | | $ | 167 | | | Elimination of base recovery credit in PSCR |
| Credit | | | | | | | | | | |
| | | | | | | | | | | |
| Nuclear Legacy Investment Surcharge | | | 13 | | | | 0 | | | Staff recommends recovery of spent fuel storage, |
| | | | | | | | | | | decommissioning and site restoration shortfall be |
| | | | | | | | | | | included in a future decommissioning case: $(13) |
| | | | | | | | | | | |
Palisades Transaction Costs(1) | | | 28 | | | | 13 | | | Staff disallows $2 million in fees, recommends |
| | | | | | | | | | | sharing of transactions costs between |
| | | | | | | | | | | shareholders and customers: $(15) |
| | | | | | | | | | | |
Energy Efficiency Surcharge(2) | | | 5 | | | | 5 | | | Initial Energy Efficiency Program surcharge to |
| | | | | | | | | | | |
| | | | | | | | | | | recover administrative and low income costs |
| | | | | | | | | | | |
| | | $ | 282 | | | $ | 203 | | | |
| | | | | | | | | | | |
| | | | | | | | | | | | | |
| | | | | | | Company | | |
| | | | | | | July Update | | MPSC Staff |
| Ratemaking | | Existing | | Percent of | | Final Relief |
| Capital Structure | | (U-14347) | | Total | | Filing |
| Long Term Debt | | | 45.28 | % | | | 41.54 | % | | | 41.66 | % |
| Short Term Debt | | | 1.10 | | | | 0.81 | | | | 0.81 | |
| Preferred Stock | | | 0.53 | | | | 0.50 | | | | 0.50 | |
| Common Equity | | | 36.32 | | | | 42.02 | (3) | | | 41.55 | |
| Deferred FIT | | | 15.91 | | | | 14.40 | | | | 14.74 | |
| JDITC/Other | | | 0.86 | | | | 0.73 | | | | 0.74 | |
| | | | | | | | | | | | | |
| | | | 100.00 | % | | | 100.00 | % | | | 100.00 | % |
| | | | | | | | | | | | | |
| | | | | | | | | | | | | |
| Rate Base and Return | | Existing | | | | |
| Percentage | | (U-14347) | | July Update | | MPSC Staff |
| Rate Base — $(billion) | | $ | 4.84 | | | $ | 5.64 | (4) | | $ | 5.53 | (4) |
| Return on Rate Base | | | 6.78 | % | | | 7.19 | % | | | 6.77 | % |
| Return on Equity | | | 11.15 | % | | | 11.25 | % | | | 10.60 | % |
ELECTRIC RATE CASE SCHEDULE
| | | |
| Reply Briefs on Zeeland and Interim | | November 9, 2007 |
| |
| Rebuttal Testimony on Final Rate Relief | | November 20, 2007 |
| Motions to Strike Final Testimony | | November 27, 2007 |
| Replies to Motions to Strike | | November 30, 2007 |
| Cross of all Witnesses | | December 3-14, 2007 |
| Initial Briefs | | January 14, 2008 |
| Reply Briefs | | January 31, 2008 |
| Proposal for Decision (PFD) | | No later than March 27, 2008 |
| |
| Exceptions | | 21 days following PFD |
| |
| Replies to Exceptions | | 14 days following Exceptions |
| |
| | |
| (1) | | May 2007 supplement. |
| |
| (2) | | July 2007 update. |
| |
| (3) | | Equivalent to 49.99% financial basis. |
| |
| (4) | | Includes $524 million of Zeeland Plant investment. |
*Electric Rate Case U-15245 can be accessed at the Michigan Public Service Commission’s website.
http://efile.mpsc.cis.state.mi.us/efile/electric.html
GAS RATE CASE U-15506*
On February 15, 2008, Consumers Energy filed an application with the Michigan Public Service Commission seeking an increase in its gas delivery and transportation rates based on a 2009 test year. The request seeks authority to implement a revenue decoupling mechanism for the residential rate class, which enables the Company to recover appropriate operating and maintenance expenses to ensure continued reliable service to customers. The decoupling mechanism also removes the impact of the energy efficiency and conservation programs on revenues. The proposed capital structure includes an 11.00% authorized return on equity. If approved, the request would add about $3.00 per month, or about 3.5%, to the typical residential customer’s average monthly bill. The $91 million revenue deficiency is detailed below.
| | | | | | | |
| Item | | $ Millions | | Explanation |
| 1. O&M | | $ | 28 | | | Conservation: $9
|
| | | | | | | Company use and LUAF: $6
|
| | | | | | | Other: $13 |
| | | | | | | |
| 2. Rate of Return | | | 25 | | | Higher capitalization: $20
|
| | | | | | | Higher debt costs: $5 |
| | | | | | | |
| 3. Rate Base | | | 38 | | | Working capital: $13
|
| | | | | | | Net plant (new investment, |
| | | | | | | primarily distribution plant to |
| | | | | | | serve new customers, CEA |
| | | | | | | project): $25 |
| | | | | | | |
| 4. Book Depreciation | | | 19 | | | New investment, primarily |
| | | | | | | distribution plant to serve new |
| | | | | | | customers |
| | | | | | | |
| 5. Gross Margin | | | 18 | | | Lower throughput: $29
|
| | | | | | | Miscellaneous revenues: ($11) |
| | | | | | | |
| 6. Taxes | | | 13 | | | Increased general taxes, new |
| | | | | | | Michigan Business Tax, offset |
| | | | | | | by lower federal income taxes |
| | | | | | | |
| 7. U-15190 Settlement | | | (50 | ) | | U-14547 used as base since |
| | | | | | | settlement agreement did not |
| | | | | | | identify specific cost of |
| | | | | | | service items |
| 8. Total Base Rate Increase | | $ | 91 | | | |
| | | | | | | |
| | | | | | | | | | | | | | | | | |
| Ratemaking | | Existing | | As Filed | | | | | | After-Tax |
| Capital Structure | | (U-14547)(2) | | Percent of Total | | Annual Cost | | Weighted Costs |
| Long Term Debt | | | 46.77 | % | | | 42.06 | % | | | 5.97 | % | | | 2.51 | % |
| Short Term Debt | | | 1.04 | | | | 0.68 | | | | 5.34 | | | | 0.04 | |
| Preferred Stock | | | 0.51 | | | | 0.51 | | | | 4.46 | | | | 0.02 | |
| Common Equity | | | 35.06 | | | | 42.88 | | | | 11.00 | | | | 4.72 | |
| Deferred FIT | | | 15.09 | | | | 12.42 | | | | 0.00 | | | | 0.00 | |
| JDITC/Other | | | 1.53 | | | | 1.45 | | | | | | | | 0.11 | |
| | | | 100.00 | % | | | 100.00 | % | | | | | | | 7.40 | %(1) |
| | | | | | | | | |
| Rate Base and Return | | Existing | | |
| Percentage | | (U-14547))(2) | | As Filed |
| Rate Base | | $2.25 billion | | $2.58 billion |
| Return on Rate Base | | | 6.69 | % | | | 7.40 | % |
| Return on Equity | | | 11.00 | % | | | 11.00 | % |
| | |
| (1) | | Equivalent to 10.55% pre-tax basis. |
| |
| (2) | | Amounts are those authorized in the Company’s fully litigated Case U-14547 prior to the rates established in U-15190. The order in Case No. U-15190 was the result of a partial settlement agreement. The Settlement Agreement did not identify specific cost of service items. |
| |
| * | | Gas Rate Case U-15506 can be accessed at the Michigan Public Service Commission’s website.http://efile.mpsc.cis.state.mi.us/efile/gas.html |
MATURITY SCHEDULE OF CMS AND CECO LONG-TERM DEBT & PREFERRED SECURITIES
AS OF 02/29/2008
| | | | | | | | | | | |
| | | | | Maturity | | Amount | | | |
| F/V | | S/U | | or Call Date | | (000's) | | | DEBT/ CO |
| | | | | | | | | | | |
| SHORT-TERM DEBT: |
| | | | | | | | | | | |
| F | | U | | SHORT-TERM | | | 150,000 | | | *3.375% Convertible Sr Notes 7/15/08Put Date(CMS) |
| F | | S | | 04/15/08 | | | 249,500 | | | 4.25% Series A FMBs (CECo) |
| F | | S | | 02/17/09 | | | 200,000 | | | 4.8% FMBs(CECo) |
| | | | | | | | | | |
| | | | | | | | 599,500 | | | |
| | | | | | | | | | |
| | | | | | | | | | | |
| LONG-TERM DEBT: |
| | | | | | | | | | | |
| F | | S | | 08/15/09 | | | 150,000 | | | 4.4% Series K FMBs(CECo) |
| | | | | | | | | | |
| | | | | | | | 150,000 | | | |
| | | | | | | | | | |
| F | | S | | 05/15/10 | | | 250,000 | | | 4% $250MM FMBs( CECo) |
| F | | S | | 06/15/10 | | | 30,000 | | | 3.375% Fixed PCRBs(CECo) |
| V | | S | | 06/15/10 | | | 27,900 | | | PCRBs (CECo) |
| F | | U | | 08/01/10 | | | 300,000 | | | 7.75% Sr Unsec Notes (CMS) |
| | | | | | | | | | |
| | | | | | | | 607,900 | | | |
| | | | | | | | | | |
| F | | U | | 04/15/11 | | | 300,375 | | | 8.5% Sr Notes (CMS) |
| F | | U | | 12/01/11 | | | 287,500 | | | *2.875% Convertible Sr Unsec NotesPut Date(CMS) |
| | | | | | | | | | |
| | | | | | | | 587,875 | | | |
| | | | | | | | | | |
| F | | U | | 02/01/12 | | | 150,000 | | | 6.3% Senior Notes (CMS) |
| F | | S | | 02/15/12 | | | 300,000 | | | 5% Series L FMBs(CECo) |
| V | | U | | 01/15/13 | | | 150,000 | | | Floating Rate Sr Notes (CMS) |
| F | | S | | 04/15/13 | | | 375,000 | | | 5.375% Series B FMBs (CECo) |
| F | | S | | 02/15/14 | | | 200,000 | | | 6% FMBs(CECo) |
| F | | S | | 03/15/15 | | | 225,000 | | | 5% FMBsSeries N (CECo) |
| F | | U | | 12/15/15 | | | 125,000 | | | 6.875% Sr Notes (CMS) |
| F | | S | | 08/15/16 | | | 350,000 | | | 5.5% Series M FMBs(CECo) |
| F | | S | | 02/15/17 | | | 250,000 | | | 5.15% FMBs (CECo) |
| F | | U | | 07/17/17 | | | 250,000 | | | 6.55% Sr Notes (CMS) |
| F | | S | | 03/01/18 | | | 180,000 | | | 6.875% Sr Notes (CECo) |
| V | | S | | 04/15/18 | | | 67,700 | | | PCRBs (CECo) |
| F | | S | | 04/15/20 | | | 300,000 | | | 5.65% FMBs (CECo) |
| F | | U | | 07/15/27 | | | 177,835 | | | QUIPS 7.75%(CMS)Pref Sec** |
| V | | S | | 04/01/35 | | | 35,000 | | | PCRBs (CECo) |
| F | | S | | 04/15/35 | | | 144,291 | | | 5.65% FMBsIQ Notes (CECo) |
| F | | S | | 09/15/35 | | | 175,000 | | | 5.80% FMBs (CECo) |
| | | | | | | | | | |
| | | | | | | | 3,454,826 | | | |
| | | | | | | | | | |
| | | | | | | $ | 5,400,101 | | | GRAND TOTAL |
| | | | | | | | | | |
| | | | | | | | | | | |
| | | | | | | $ | 5,222,266 | | | GRAND TOTAL EXCLUDING PREFERRED SECURITIES |
| | | | | | | | | | |
| | | | | | | | | | | |
| | | | | Various Maturity Dates/No Maturity Date Available: |
| | | | | | | | 301,314 | | | CECo Securitization Bonds after 01/20/08 payment |
| | | | | | | | 254,557 | | | CECo Capital lease rental commitments as of 12/31/07 |
| | | | | | | | 160,304 | | | CECo DOE Liability as of 02/29/08 |
| | | | | | | | 153,424 | | | EnerBank (Long-Term & Short-Term) Discount Brokered CDs as of 12/31/07 (CMS) |
| | | | | | | | 83,098 | | | CMS Enterprises Debt as of 12/31/07 |
| | | | | | | | | | |
| | | | | | | $ | 6,352,798 | | | GRAND TOTAL INCLUDING CMS ENERGY, CONSUMERS & OTHER CMS |
| | | | | | | | | | |
| | | | | | | | | | | ENTERPRISES SUBSIDIARIES, INCLUDING PREFERRED SECURITIES |
| | |
| * | | — Date that issue can be put to the Company is used instead of maturity date |
| |
| ** | | —Includes subordinated notes amounts associated with preferred securities. Issue amount: $172.5MM QUIPS. |
Status Codes: F-Fixed rate; V-Variable rate; S-Secured; U-Unsecured


