Exhibit 99.1

| Growing Forward Investor Meeting March 2009 Thomas J. Webb Executive Vice President and Chief Financial Officer |
| 1 This presentation contains "forward-looking statements" as defined in Rule 3b-6 of the Securities Exchange Act of 1934, as amended, Rule 175 of the Securities Act of 1933, as amended, and relevant legal decisions. The forward-looking statements are subject to risks and uncertainties. They should be read in conjunction with "FORWARD-LOOKING STATEMENTS AND INFORMATION" and "RISK FACTORS" each found in the MANAGEMENT'S DISCUSSION AND ANALYSIS sections of CMS Energy's Form 10-K and Consumers Energy's Form 10-K each for the Year Ended December 31, 2008. CMS Energy's and Consumers Energy's "FORWARD-LOOKING STATEMENTS AND INFORMATION" and "RISK FACTORS" sections are incorporated herein by reference and discuss important factors that could cause CMS Energy's and Consumers Energy's results to differ materially from those anticipated in such statements. The presentation also includes non-GAAP measures when describing CMS Energy's results of operations and financial performance. A reconciliation of each of these measures to the most directly comparable GAAP measure is included in the appendix and posted on our website at www.cmsenergy.com. CMS Energy expects 2009 reported earnings to be about the same as adjusted earnings. Reported earnings could vary because of several factors. CMS Energy is not providing reported earnings guidance reconciliation because of the uncertainties associated with those factors. |
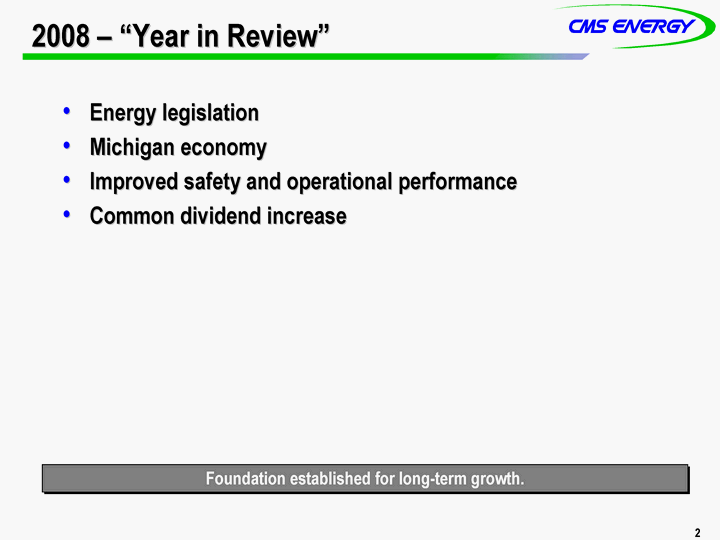
| 2 2008 - "Year in Review" Energy legislation Michigan economy Improved safety and operational performance Common dividend increase Foundation established for long-term growth. |
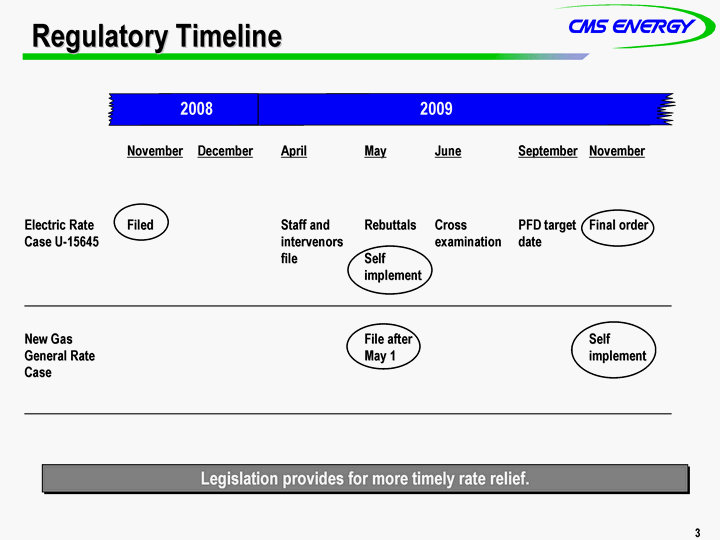
| 3 Oct-07 Nov-07 Dec-07 Jan-08 Feb-08 Mar-08 Apr-08 May-08 Jun-08 Jul-08 Aug-08 Sep-08 Oct-08 Nov-08 Dec-08 Jan-09 Feb- 09 Mar-09 Regulatory Timeline November December April May June September November Electric Rate Case U-15645 Filed Staff and intervenors file Rebuttals Self implement Cross examination PFD target date Final order New Gas General Rate Case File after May 1 Self implement 2008 2009 Legislation provides for more timely rate relief. |
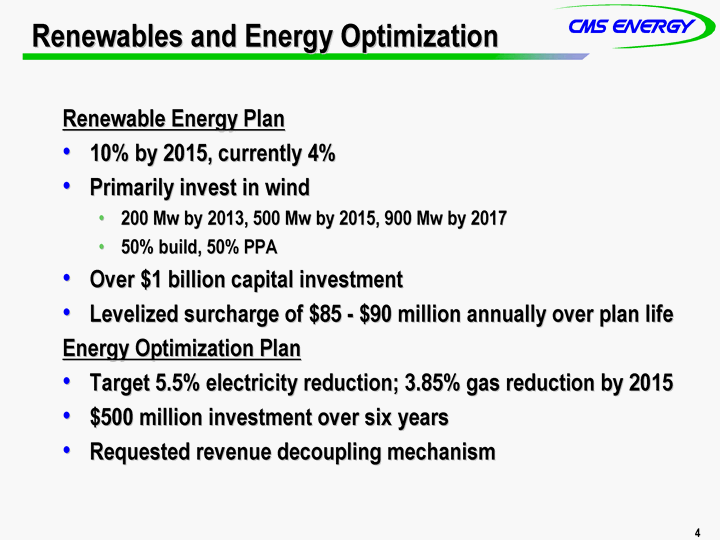
| 4 Renewables and Energy Optimization Renewable Energy Plan 10% by 2015, currently 4% Primarily invest in wind 200 Mw by 2013, 500 Mw by 2015, 900 Mw by 2017 50% build, 50% PPA Over $1 billion capital investment Levelized surcharge of $85 - $90 million annually over plan life Energy Optimization Plan Target 5.5% electricity reduction; 3.85% gas reduction by 2015 $500 million investment over six years Requested revenue decoupling mechanism |
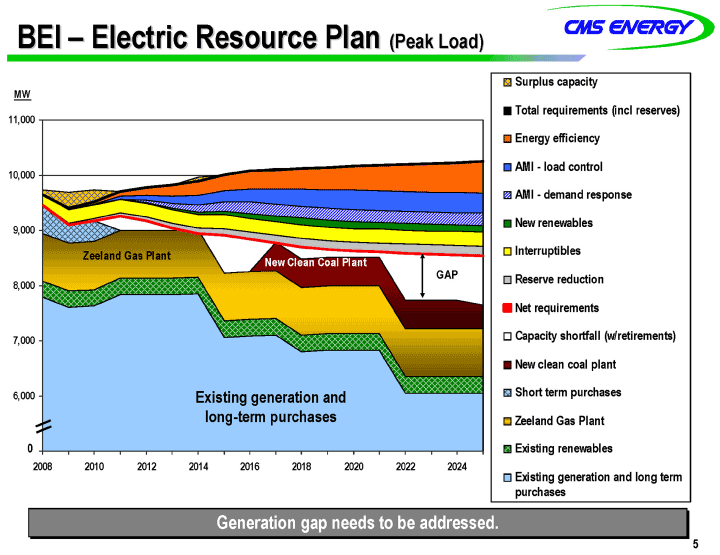
| 5 BEI - Electric Resource Plan (Peak Load) 0 Generation gap needs to be addressed. Existing generation and long-term purchases |
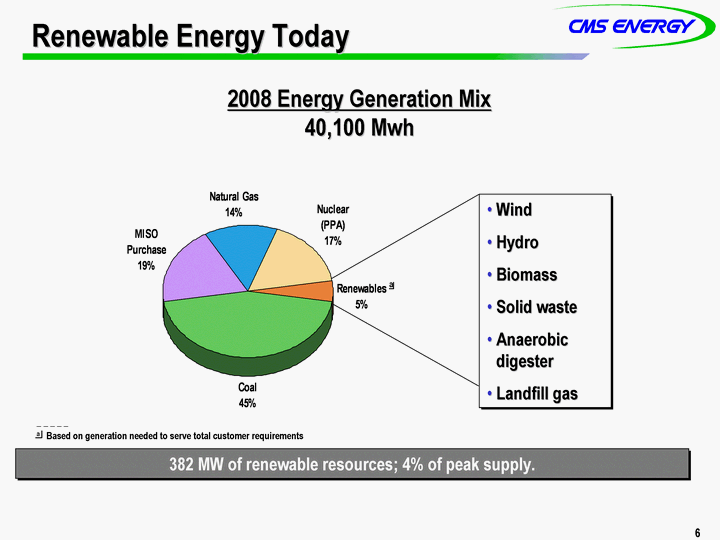
| 6 Renewable Energy Today 2008 Energy Generation Mix 40,100 Mwh Wind Hydro Biomass Solid waste Anaerobic digester Landfill gas Nuclear (PPA) Renewables Coal MISO Purchase Natural Gas 17 5 45 19 14 382 MW of renewable resources; 4% of peak supply. a _ _ _ _ _ a Based on generation needed to serve total customer requirements |
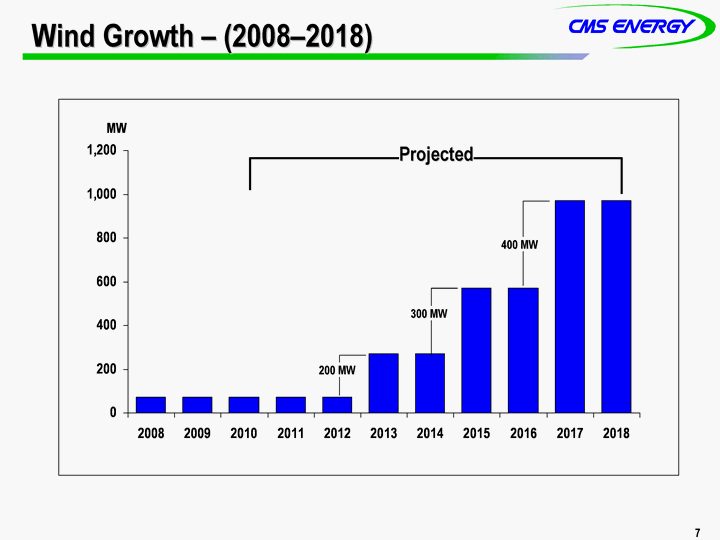
| 7 Wind Growth - (2008-2018) 2008 2009 2010 2011 2012 2013 2014 2015 2016 2017 2018 71 71 71 71 71 271 271 571 571 971 971 Projected 200 MW 300 MW 400 MW |
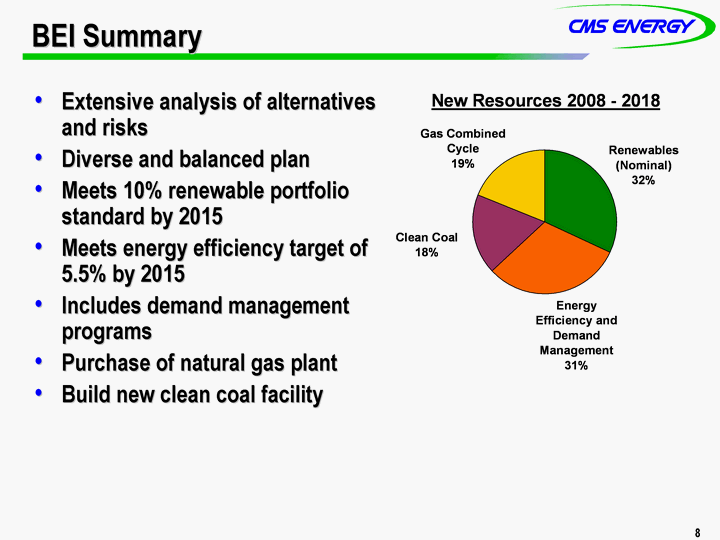
| 8 BEI Summary Extensive analysis of alternatives and risks Diverse and balanced plan Meets 10% renewable portfolio standard by 2015 Meets energy efficiency target of 5.5% by 2015 Includes demand management programs Purchase of natural gas plant Build new clean coal facility Build new clean coal facility Build new clean coal facility Build new clean coal facility Build new clean coal facility Build new clean coal facility Build new clean coal facility Build new clean coal facility Build new clean coal facility Build new clean coal facility Build new clean coal facility Build new clean coal facility |
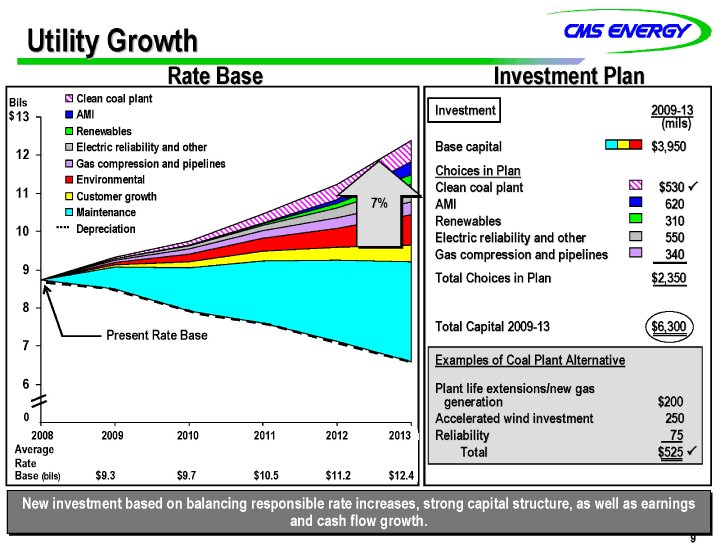
| 9 2008 2009 2010 2011 2012 2031 Depreciation 7.851 8.729 8.486 7.922 7.592 7.123 6.597 Maintenance 0.574 1.132 1.644 2.117 2.616 Customer growth 0.077 0.156 0.244 0.337 0.431 Environmental 0.057 0.19 0.341 0.501 0.797 Zeeland plant 0.481 0.481 0.481 0.481 0.481 Gas compression and pipelines 0.064 0.143 0.211 0.279 0.342 Electric reliability and other 0.022 0.077 0.137 0.254 0.444 Renewables 0.005 0.023 0.039 0.122 0.26 AMI 0.006 0.011 0.019 0.095 0.348 Clean coal plant 0.029 0.096 0.238 0.408 0.556 7% Utility Growth Rate Base Bils $ Present Rate Base 2008 2009 2010 2011 2012 2013 Average Rate Base (bils) $9.3 $9.7 $10.5 $11.2 $12.4 New investment based on balancing responsible rate increases, strong capital structure, as well as earnings and cash flow growth. 0 Investment 2009-13 (mils) Base capital $ 3,950 Choices in Plan Clean coal plant $ 530 ? AMI 620 Renewables 310 Electric reliability and other 550 Gas compression and pipelines 340 Total Choices in Plan $ 2,350 Total Capital 2009-13 $ 6,300 Examples of Coal Plant Alternative Plant life extensions/new gas generation $200 Accelerated wind investment 250 Reliability 75 Total $525 ? Investment Plan |
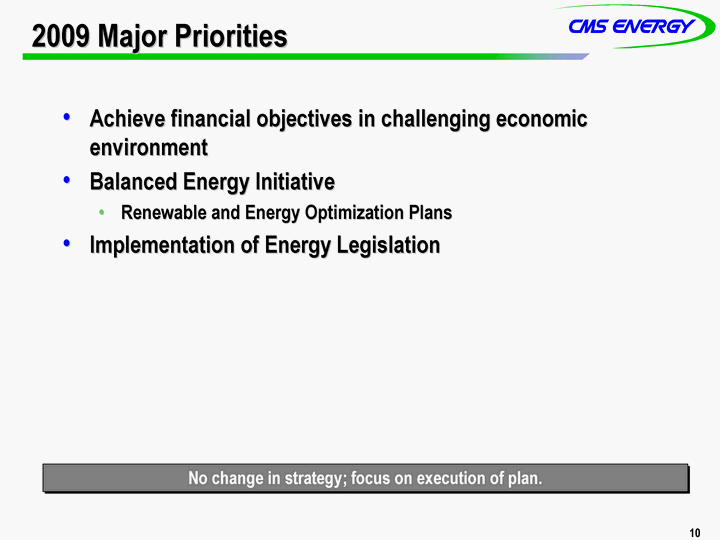
| 10 2009 Major Priorities Achieve financial objectives in challenging economic environment Balanced Energy Initiative Renewable and Energy Optimization Plans Implementation of Energy Legislation No change in strategy; focus on execution of plan. |
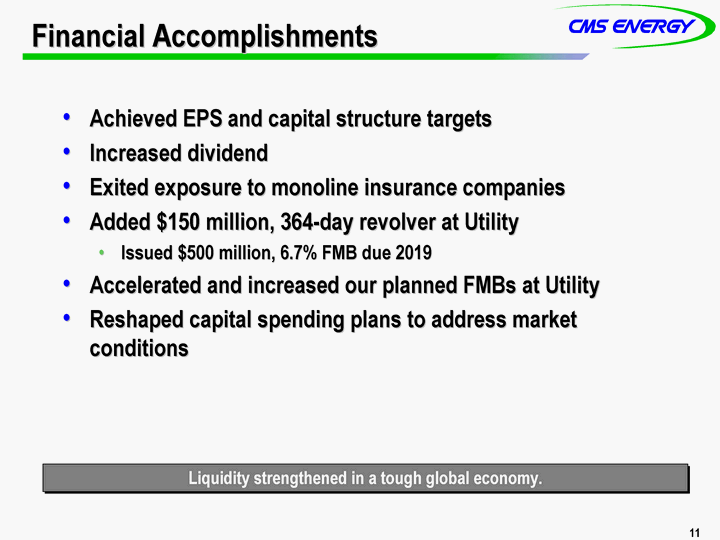
| 11 Financial Accomplishments Achieved EPS and capital structure targets Increased dividend Exited exposure to monoline insurance companies Added $150 million, 364-day revolver at Utility Issued $500 million, 6.7% FMB due 2019 Accelerated and increased our planned FMBs at Utility Reshaped capital spending plans to address market conditions Liquidity strengthened in a tough global economy. |
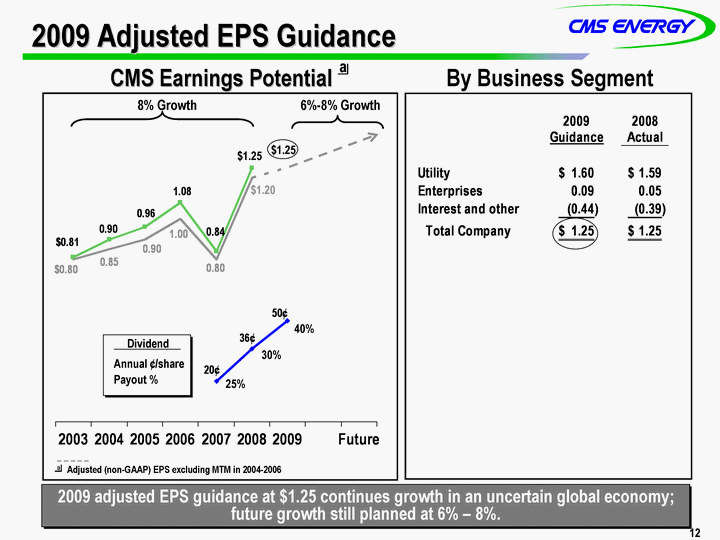
| 12 2009 Adjusted EPS Guidance 2009 adjusted EPS guidance at $1.25 continues growth in an uncertain global economy; future growth still planned at 6% - 8%. 2003 2004 2005 2006 2007 2008 2009 Future 0.81 0.9 0.96 1.08 0.84 1.25 0.8 0.85 0.9 1 0.8 1.2 1.25 CMS Earnings Potential By Business Segment a 8% Growth 6%-8% Growth Dividend Annual ¢/share Payout % 25% 30% 40% _ _ _ _ _ a Adjusted (non-GAAP) EPS excluding MTM in 2004-2006 $1.25 $1.20 $1.25 |
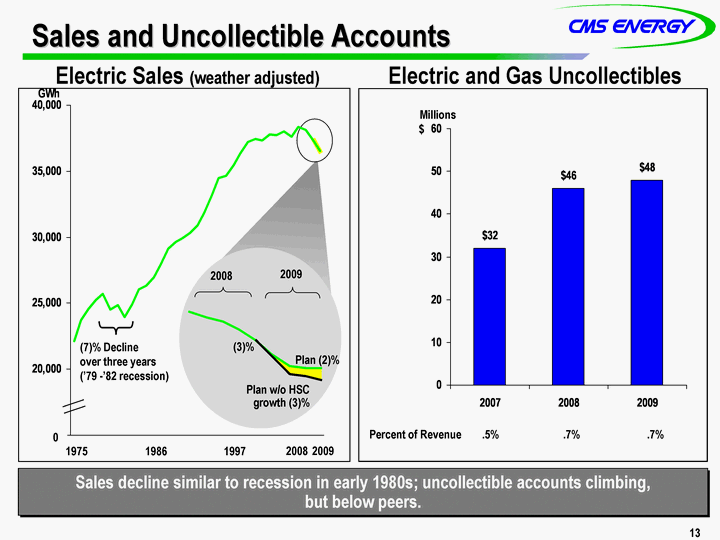
| 13 Sales and Uncollectible Accounts Electric Sales (weather adjusted) Sales decline similar to recession in early 1980s; uncollectible accounts climbing, but below peers. Electric and Gas Uncollectibles 2009 1975 1986 1997 2008 2007 2008 2009 CMS 32 46 48 Peers 0.8 0.9 0.9 Millions $ Percent of Revenue .5% .7% .7% (7)% Decline over three years ('79 -'82 recession) Plan w/o HSC growth (3)% Plan (2)% 2008 2009 (3)% 1975 1976 1977 1978 1979 1980 1981 1982 1983 1984 1985 1986 1987 1988 1989 1990 1991 1992 1993 1994 1995 1996 1997 1998 1999 2000 2001 2002 2003 2004 2005 2006 2007 2008 2009 August Plan 22145 23722 24572 25237 25707 24533 24875 23916 24893 26051 26305 26977 27928 29143 29623 29894 30325 30877 31868 33177 34465 34622 35462 36355 37234 37463 37301 37792 37746 38017 37586 38372 38098 37339 36536 Revised Potential 37339 36208 0 |
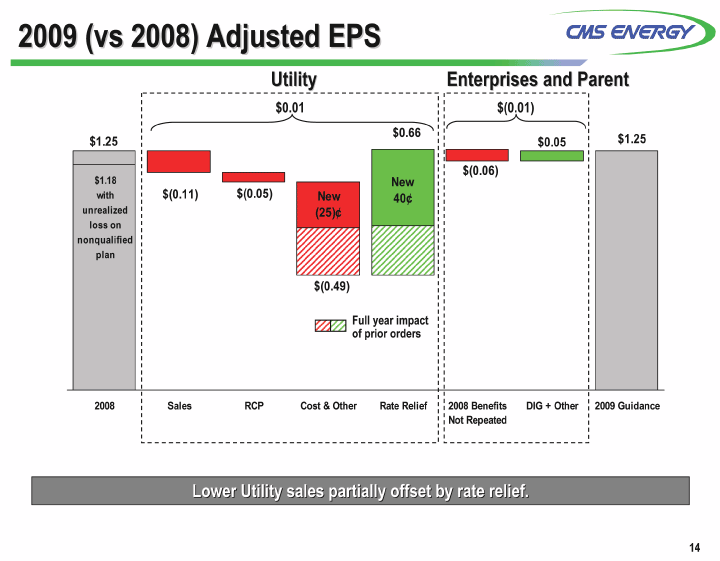
| 14 2009 (vs 2008) Adjusted EPS Lower Utility sales partially offset by rate relief. Utility 2008 Sales RCP Cost & Other Rate Relief 2008 Benefits Not Repeated Energy Legislation DIG + Other 2009 Guidance grey bars 1.18 1.25 spacer 1.14 1.09 0.6 0.6 1.2 1.2 1.2 red 0.07 0.11 0.05 0.25 0.26 0.06 green 0.24 0.4 0.01 0.05 Enterprises and Parent $0.01 $(0.01) Full year impact of prior orders |
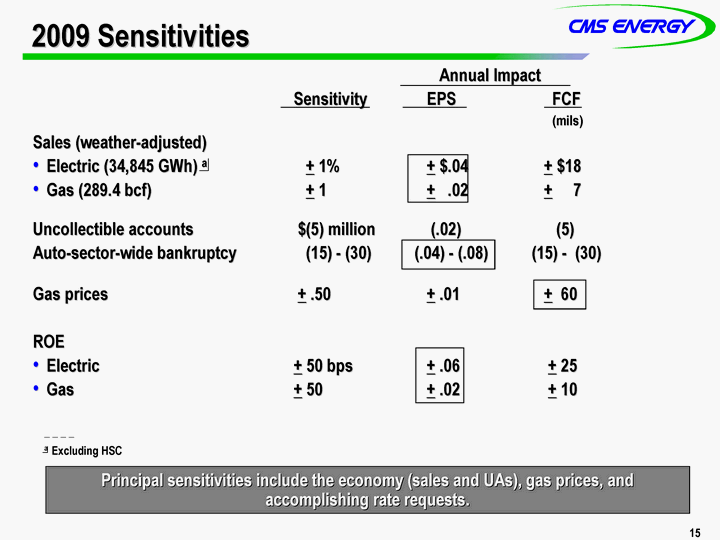
| 15 2009 Sensitivities Annual Impact Sensitivity EPS FCF (mils) Sales (weather-adjusted) Electric (34,845 GWh) a + 1% + $.04 + $18 Gas (289.4 bcf) + 1 + .02 + 7 Uncollectible accounts $(5) million (.02) (5) Auto-sector-wide bankruptcy (15) - (30) (.04) - (.08) (15) - (30) Gas prices + .50 + .01 + 60 ROE Electric + 50 bps + .06 + 25 Gas + 50 + .02 + 10 Principal sensitivities include the economy (sales and UAs), gas prices, and accomplishing rate requests. _ _ _ _ a Excluding HSC |
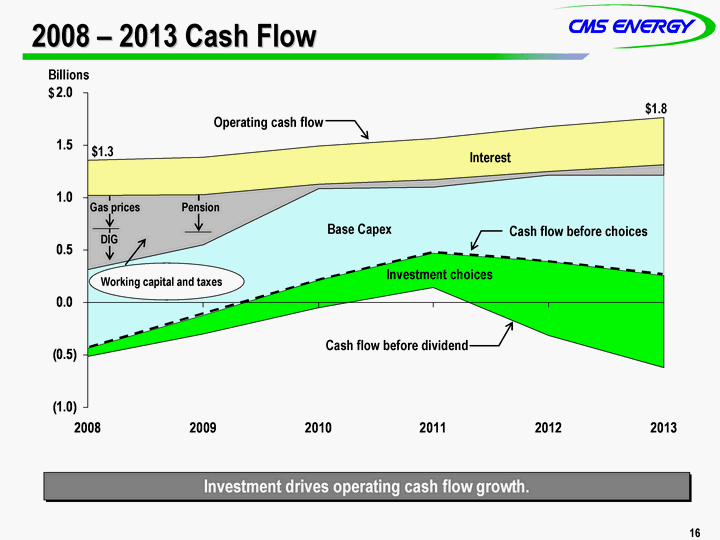
| 16 2008 - 2013 Cash Flow 2008 2009 2010 2011 2012 2013 CF after Capex -517 -300 -49 146 -313 -622 81 182 265 323 707 877 CF after working capital 748 669 870 633 818 960 CF after interest 711 477 41 70 41 96 Operating cash flow 335 357 367 394 424 454 Billions $ Cash flow before dividend Operating cash flow Interest Base Capex Investment choices Investment drives operating cash flow growth. Cash flow before choices $1.3 $1.8 Pension Gas prices DIG Working capital and taxes |
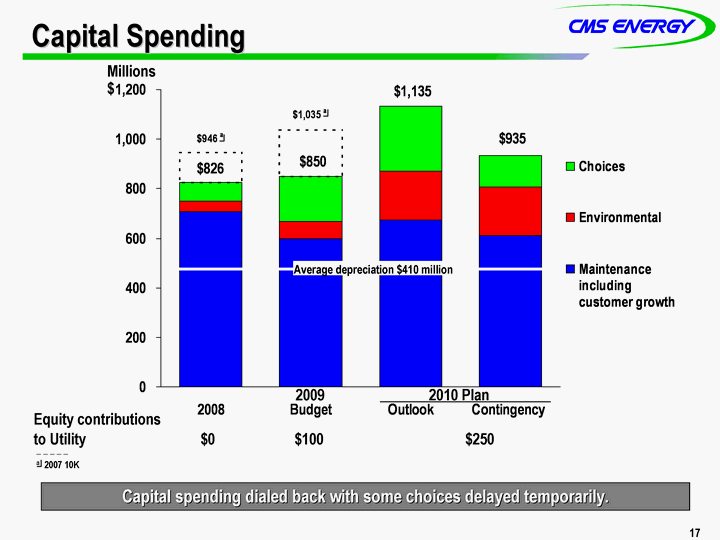
| 17 Capital Spending 2008 Budget Outlook Contingency Maintenance including customer growth 706 600 674 611.3 Environmental 45 69 197 197.1 Choices 75 181 264 125.1 120 186 Capital spending dialed back with some choices delayed temporarily. Average depreciation $410 million Equity contributions to Utility $0 $100 $250 2009 2010 Plan _ _ _ _ _ a 2007 10K Millions $ |
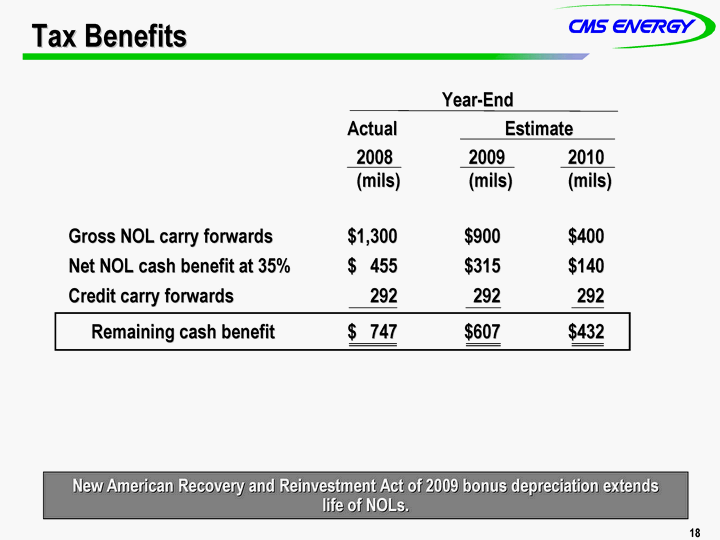
| 18 Tax Benefits Year-End Actual Estimate 2008 2009 2010 (mils) (mils) (mils) Gross NOL carry forwards $1,300 $900 $400 Net NOL cash benefit at 35% $ 455 $315 $140 Credit carry forwards 292 292 292 Remaining cash benefit $ 747 $607 $432 New American Recovery and Reinvestment Act of 2009 bonus depreciation extends life of NOLs. |
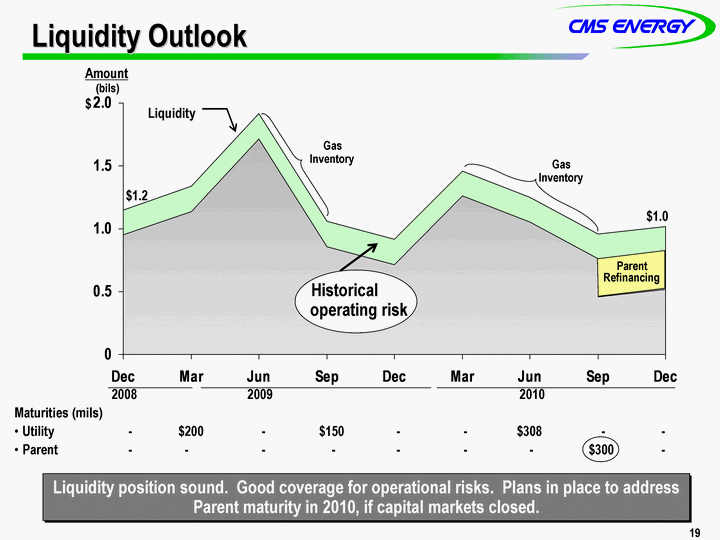
| 19 Liquidity Outlook Liquidity position sound. Good coverage for operational risks. Plans in place to address Parent maturity in 2010, if capital markets closed. Oct Dec Mar Jun Sep Dec Mar Jun Sep Dec Blank Liquidity 1505 1150 1337 1917 1057 915 1460 1252 960 1020 Cash 670 950 1137 1717 857 715 1260 1052 760 820 460 520 $1.2 Amount (bils) $ $1.0 Gas Inventory 2008 2009 2010 Maturities (mils) Utility - $200 - $150 - - $308 - - Parent - - - - - - - $300 - Gas Inventory Parent Refinancing Historical operating risk |
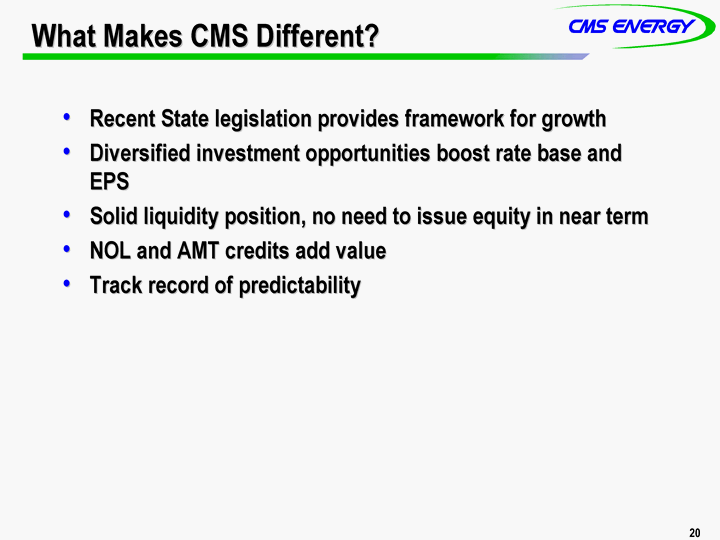
| 20 What Makes CMS Different? Recent State legislation provides framework for growth Diversified investment opportunities boost rate base and EPS Solid liquidity position, no need to issue equity in near term NOL and AMT credits add value Track record of predictability |

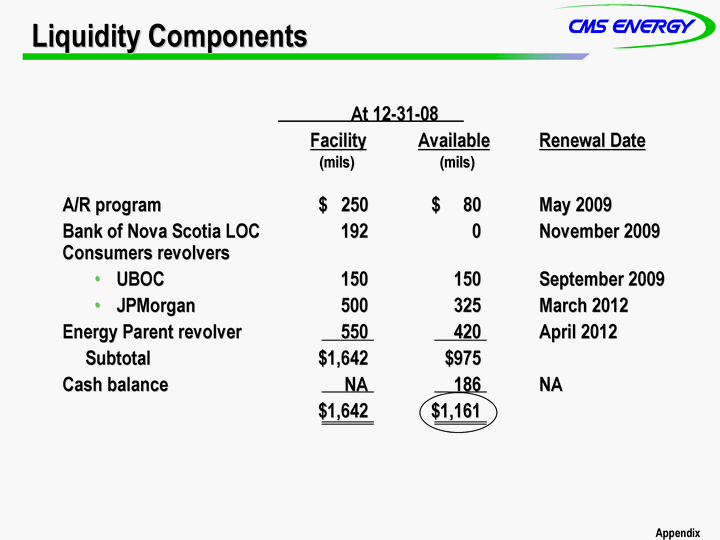
| Liquidity Components At 12-31-08 Facility Available Renewal Date (mils) (mils) A/R program $ 250 $ 80 May 2009 Bank of Nova Scotia LOC 192 0 November 2009 Consumers revolvers UBOC 150 150 September 2009 JPMorgan 500 325 March 2012 Energy Parent revolver 550 420 April 2012 Subtotal $1,642 $975 Cash balance NA 186 NA $1,642 $1,161 Appendix |
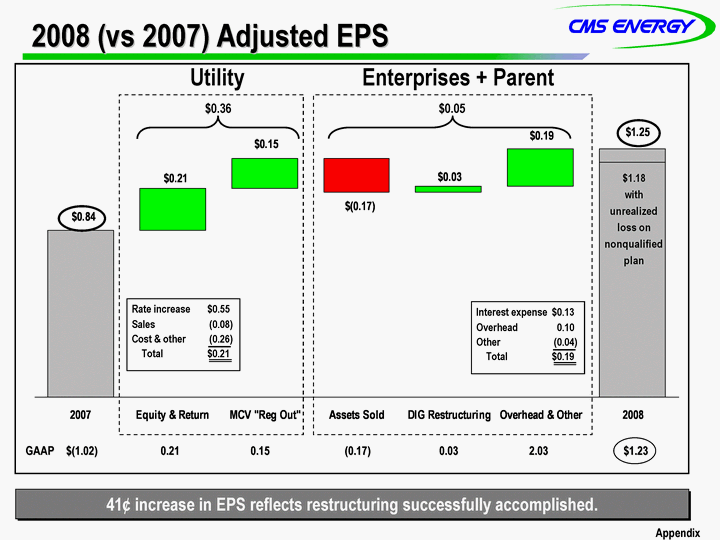
| 2008 (vs 2007) Adjusted EPS 2007 Equity & Return MCV "Reg Out" Assets Sold DIG Restructuring Overhead & Other 2008 Grey 0.84 1.18 no fill 0.84 1.05 1.03 1.03 1.06 Red 0 0.17 0.07 Green 0.21 0.15 0.03 0.19 Utility Enterprises + Parent $0.36 $0.05 Interest expense $0.13 Overhead 0.10 Other (0.04) Total $0.19 Rate increase $0.55 Sales (0.08) Cost & other (0.26) Total $0.21 41¢ increase in EPS reflects restructuring successfully accomplished. GAAP $(1.02) 0.21 0.15 (0.17) 0.03 2.03 $1.23 Appendix |
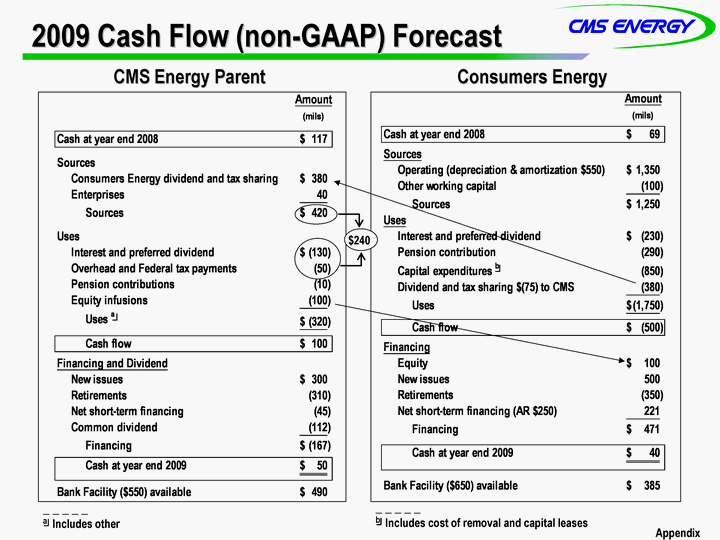
| 2009 Cash Flow (non-GAAP) Forecast CMS Energy Parent Consumers Energy Appendix _ _ _ _ _ a Includes other _ _ _ _ _ b Includes cost of removal and capital leases $240 |
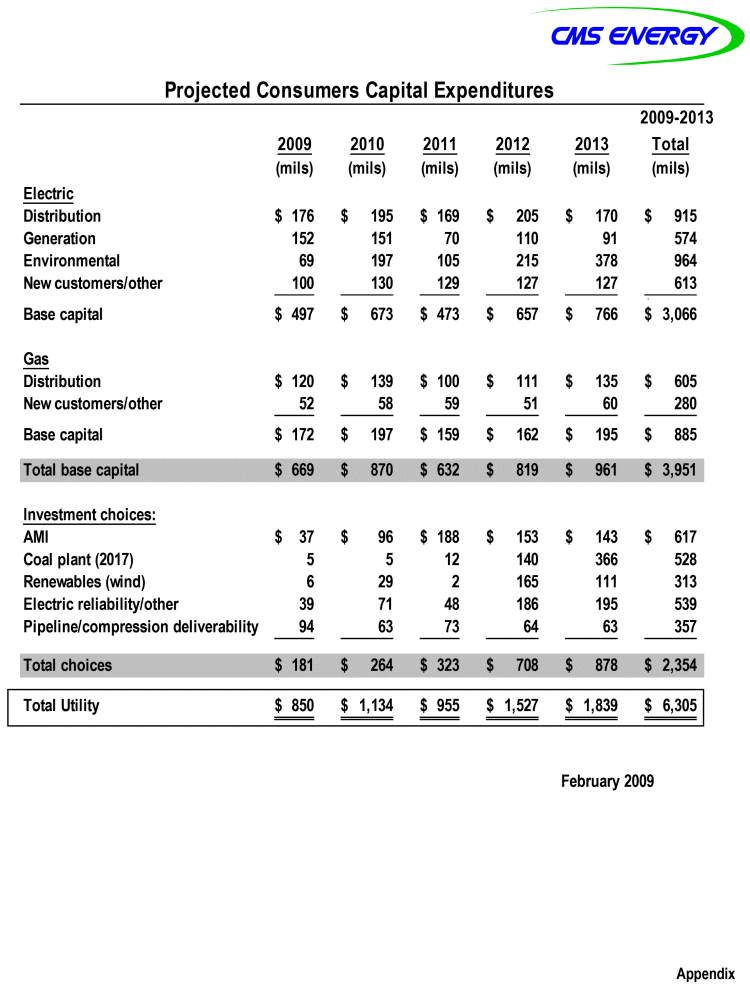
| 2Projected Consumers Capital Expenditures 2009 2013 -2009 2010 2011 2012 2013 Total (mils) (mils) (mils) (mils) (mils) (mils) Electric Distribution $ 176 $ 195 $ 169 $ 205 $ 170 $ 915 Generation 152 151 70 110 91 574 Environmental 69 197 105 215 378 964 New customers/other 100 130 129 127 127 613 $ Base capital $ 497 $ 673 $ 473 $ 657 $ 766 $ 3,066 Gas Distribution $ 120 $ 139 $ 100 $ 111 $ 135 $ 605 New customers/other 52 58 59 51 60 280 Base capital $ 172 $ 197 $ 159 $ 162 $ 195 $ 885 Total base capital $669 $870 $632 $819 $961 $3,951 Investment choices: AMI $ 37 $ 96 $ 188 $ 153 $ 143 $ 617 Coal plant (2017) 5 5 12 140 366 528 Renewables (wind) 6 29 2 165 111 313 Electric reliability/other 39 71 48 186 195 539 Pipeline/compression deliverability 94 63 73 64 63 357 Total choices $181 $264 $323 $708 $878 $2,354 Total Utility $850 $1,134 $955 $1,527 $1,839 $6,305 February 2009 Appendix |
CMS Energy
Earnings Reconciliation By Quarter and Year
December 31
Reconciliation of reported measures prepared in accordance with
Generally Accepted Accounting Principles (GAAP) versus non-GAAP measures
| | | | | | | | | | | | | | | | | | | | | |
| | | Unaudited Quarters |
| (millions, except per share amounts) | | 1Q03 | | 2Q03 | | 3Q03 | | 4Q03 | | FY 2003 |
| |
Reported net income | | $ | 82 | | | $ | (65 | ) | | $ | (69 | ) | | $ | 8 | | | $ | (44 | ) |
| |
After-tax items: | | | | | | | | | | | | | | | | | | | | |
| Electric and gas utility other | | | | | | | | | | | | | | | 30 | | | | 30 | |
| Enterprises other | | | 5 | | | | 7 | | | | 62 | | | | 37 | | | | 111 | |
| Corporate other | | | 1 | | | | | | | | 19 | | | | 4 | | | | 24 | |
| Discontinued operations | | | (31 | ) | | | 53 | | | | (2 | ) | | | (43 | ) | | | (23 | ) |
| Cumulative accounting changes | | | 24 | | | | | | | | | | | | | | | | 24 | |
| |
Ongoing earnings (non-GAAP) | | $ | 81 | | | $ | (5 | ) | | $ | 10 | | | $ | 36 | | | $ | 122 | |
| |
| | | | | | | | | | | | | | | | | | | | | |
Average shares outstanding, basic | | | 144.1 | | | | 144.1 | | | | 152.2 | | | | 161.1 | | | | 150.4 | |
| | | | | | | | | | | | | | | | | | | | | |
Average shares outstanding, diluted | | | 165.0 | | | | 144.1 | | | | 152.2 | | | | 161.1 | | | | 150.4 | |
| | | | | | | | | | | | | | | | | | | | | |
| |
Reported earnings per share | | $ | 0.52 | | | $ | (0.45 | ) | | $ | (0.46 | ) | | $ | 0.05 | | | $ | (0.30 | ) |
| |
After-tax items | | | | | | | | | | | | | | | | | | | | |
| Electric and gas utility other | | | | | | | | | | | | | | | 0.19 | | | | 0.21 | |
| Enterprises other | | | 0.03 | | | | 0.05 | | | | 0.41 | | | | 0.23 | | | | 0.74 | |
| Corporate other | | | | | | | | | | | 0.12 | | | | 0.02 | | | | 0.16 | |
| Discontinued operations | | | (0.19 | ) | | | 0.37 | | | | (0.01 | ) | | | (0.27 | ) | | | (0.16 | ) |
| Cumulative accounting changes | | | 0.14 | | | | | | | | | | | | | | | | 0.16 | |
| |
Ongoing earnings per share (non-GAAP) | | $ | 0.50 | | | $ | (0.03 | ) | | $ | 0.06 | | | $ | 0.22 | | | $ | 0.81 | |
| |
Note: Year-to-date (YTD) EPS may not equal sum of quarters due to share count differences.
2003A-1
CMS Energy
Earnings Reconciliation By Quarter and Year
Reconciliation of reported measures prepared in accordance with
Generally Accepted Accounting Principles (GAAP) versus non-GAAP measures
| | | | | | | | | | | | | | | | | | | | | |
| | | Unaudited | | 31-Dec | |
| (millions, except per share amounts) | | 1Q04* | | | 2Q04 | | | 3Q04 | | | 4Q04 | | | FY 2004 | |
| | | | |
Reported net income — GAAP | | $ | (9 | ) | | $ | 16 | | | $ | 56 | | | $ | 47 | | | $ | 110 | |
| | | | |
After-tax items: | | | | | | | | | | | | | | | | | | | | |
| Electric and gas utility other | | | | | | | | | | | | | | | (67 | ) | | | (67 | ) |
| Enterprises other | | | 88 | | | | | | | | (29 | ) | | | 48 | | | | 107 | |
| Corporate other | | | (7 | ) | | | | | | | (1 | ) | | | 1 | | | | (7 | ) |
| Discontinued operations | | | 2 | | | | | | | | (8 | ) | | | 10 | | | | 4 | |
| Cumulative accounting changes | | | 2 | | | | | | | | | | | | | | | | 2 | |
| | | | |
Adjusted earnings, including M-T-M | | $ | 76 | | | $ | 16 | | | $ | 18 | | | $ | 39 | | | $ | 149 | |
| Mark-to-market impacts | | NM | | | | (13 | ) | | | 9 | | | | 9 | | | | 5 | |
| | | | |
Adjusted earnings, excluding M-T-M | | $ | 76 | | | $ | 3 | | | $ | 27 | | | $ | 48 | | | $ | 154 | |
| | | | |
| |
Average shares outstanding, basic | | | 161.1 | | | | 161.2 | | | | 161.5 | | | | 190.2 | | | | 168.6 | |
| | | | | | | | | | | | | | | | | | | | | |
Average shares outstanding, diluted | | | 161.1 | | | | 164.2 | | | | 165.0 | | | | 194.0 | | | | 172.1 | |
| | | | | | | | | | | | | | | | | | | | | |
| | | | |
Reported earnings per share — GAAP | | $ | (0.06 | ) | | $ | 0.10 | | | $ | 0.34 | | | $ | 0.24 | | | $ | 0.64 | |
| | | | |
After-tax items | | | | | | | | | | | | | | | | | | | | |
| Electric and gas utility other | | | | | | | | | | | | | | | (0.35 | ) | | | (0.39 | ) |
| Enterprises other | | | 0.56 | | | | | | | | (0.17 | ) | | | 0.25 | | | | 0.62 | |
| Corporate other | | | (0.05 | ) | | | | | | | (0.01 | ) | | | 0.01 | | | | (0.03 | ) |
| Discontinued operations | | | 0.01 | | | | | | | | (0.05 | ) | | | 0.05 | | | | 0.02 | |
| Cumulative accounting changes | | | 0.01 | | | | | | | | | | | | | | | | 0.01 | |
| | | | |
Adjusted earnings per share, including M-T-M | | $ | 0.47 | | | $ | 0.10 | | | $ | 0.11 | | | $ | 0.20 | | | $ | 0.87 | |
| Mark-to-market impacts | | NM | | | | (0.08 | ) | | | 0.06 | | | | 0.05 | | | | 0.03 | |
| | | | |
Adjusted earnings per share, excluding M-T-M | | $ | 0.47 | | | $ | 0.02 | | | $ | 0.17 | | | $ | 0.25 | | | $ | 0.90 | |
| | | | |
Note: Year-to-date & full-year EPS may not equal sum of quarters due to share count differences.
| | | |
| * | | Quarterly amounts differ from amounts previously reported due to accelerating the measurement date on our benefit plans by one month and the remeasurement of our post retirement obligation. |
NM: Not meaningful.
2004A-1
CMS Energy
Earnings Reconciliation By Quarter and Year
Reconciliation of reported measures prepared in accordance with
Generally Accepted Accounting Principles (GAAP) versus non-GAAP measures
| | | | | | | | | | | | | | | | | | | | | |
| | | Unaudited | | 31-Dec | |
| (millions, except per share amounts) | | 1Q05 | | 2Q05 | | 3Q05 | | 4Q05 | | FY 2005 | |
| | | | | |
Reported net income — GAAP | | $ | 150 | | | $ | 27 | | | $ | (265 | ) | | $ | (6 | ) | | $ | (94 | ) |
| | | | | |
After-tax items: | | | | | | | | | | | | | | | | | | | | |
| Electric and gas utility other | | | | | | | | | | | | | | | | | | | | |
| Enterprises other | | | (2 | ) | | | (1 | ) | | | (1 | ) | | | 13 | | | | 9 | |
| Corporate other | | | | | | | 1 | | | | | | | | 8 | | | | 9 | |
| Discontinued operations | | | | | | | | | | | | | | | (14 | ) | | | (14 | ) |
| Asset impairment | | | | | | | | | | | 385 | | | | | | | | 385 | |
| | | | | |
Adjusted earnings, including M-T-M | | $ | 148 | | | $ | 27 | | | $ | 119 | | | $ | 1 | | | $ | 295 | |
| Mark-to-market impacts | | | (75 | ) | | | 19 | | | | (75 | ) | | | 40 | | | | (91 | ) |
| | | | | |
Adjusted earnings, excluding M-T-M | | $ | 73 | | | $ | 46 | | | $ | 44 | | | $ | 41 | | | $ | 204 | |
| | | | | |
| | | | | | | | | | | | | | | | | | | | | |
Average shares outstanding, basic | | | 195.3 | | | | 217.9 | | | | 219.6 | | | | 218.5 | | | | 211.8 | |
| | | | | | | | | | | | | | | | | | | | | |
Average shares outstanding, diluted | | | 206.3 | | | | 228.9 | | | | 219.6 | | | | 218.5 | | | | 211.8 | |
| | | | | | | | | | | | | | | | | | | | | |
| | | | | |
Reported earnings per share — GAAP | | $ | 0.74 | | | $ | 0.12 | | | $ | (1.21 | ) | | $ | (0.03 | ) | | $ | (0.44 | ) |
| | | | | |
After-tax items | | | | | | | | | | | | | | | | | | | | |
| Electric and gas utility other | | | | | | | | | | | | | | | | | | | | |
| Enterprises other | | | (0.01 | ) | | NM | | NM | | | 0.06 | | | | 0.04 | |
| Corporate other | | | | | | NM | | | | | | | 0.03 | | | | 0.04 | |
| Discontinued operations | | | | | | | | | | | | | | | (0.06 | ) | | | (0.07 | ) |
| Asset impairment | | | | | | | | | | | 1.75 | | | | | | | | 1.82 | |
| | | | | |
Adjusted earnings per share, including M-T-M | | $ | 0.73 | | | $ | 0.12 | | | $ | 0.54 | | | $ | 0.00 | | | $ | 1.39 | |
| Mark-to-market impacts | | | (0.36 | ) | | | 0.08 | | | | (0.34 | ) | | | 0.19 | | | | (0.43 | ) |
| | | | | |
Adjusted earnings per share, excluding M-T-M | | $ | 0.37 | | | $ | 0.20 | | | $ | 0.20 | | | $ | 0.19 | | | $ | 0.96 | |
| | | | | | |
Note: Year-to-date & full-year EPS may not equal sum of quarters due to share count differences.
2005A-1
CMS Energy
Earnings Reconciliation By Quarter and Year
Reconciliation of reported measures prepared in accordance with
Generally Accepted Accounting Principles (GAAP) versus non-GAAP measures
| | | | | | | | | | | | | | | | | | | | | |
| | | Unaudited | | |
| | | 2006 | | 2006 | |
| (In millions, except per share amounts) | | 1Q | | 2Q | | 3Q | | 4Q | | Dec YTD | |
| | | | | |
Reported net income — GAAP | | $ | (27 | ) | | $ | 72 | | | $ | (103 | ) | | $ | (32 | ) | | $ | (90 | ) |
| | | | | |
After-tax items: | | | | | | | | | | | | | | | | | | | | |
| Electric and gas utility other | | | — | | | | — | | | | — | | | | — | | | | — | |
| Enterprises other | | | — | | | | — | | | | (29 | ) | | | 25 | | | | (4 | ) |
| Corporate interest and other | | | 2 | | | | (15 | ) | | | 4 | | | | 82 | | | | 73 | |
| Discontinued operations (gain) | | | (1 | ) | | | (2 | ) | | | (1 | ) | | | (2 | ) | | | (6 | ) |
| Asset impairment charges | | | — | | | | — | | | | 169 | | | | — | | | | 169 | |
| | | | | |
Adjusted earnings, including MTM | | $ | (26 | ) | | $ | 55 | | | $ | 40 | | | $ | 73 | | | $ | 142 | |
| Mark-to-market impacts | | | 74 | | | | 21 | | | | 30 | | | | (13 | ) | | | 112 | |
| | | | | |
Adjusted earnings, excluding MTM | | $ | 48 | | | $ | 76 | | | $ | 70 | | | $ | 60 | | | $ | 254 | |
| | | | | |
| | | | | | | | | | | | | | | | | | | | | |
Average shares outstanding, basic | | | 219.1 | | | | 219.6 | | | | 220.1 | | | | 220.6 | | | | 219.9 | |
Average shares outstanding, diluted | | | 219.1 | | | | 229.6 | | | | 220.1 | | | | 220.6 | | | | 219.9 | |
| | | | | | | | | | | | | | | | | | | | | |
| | | | | |
Reported earnings per share — GAAP | | $ | (0.12 | ) | | $ | 0.31 | | | $ | (0.47 | ) | | $ | (0.15 | ) | | $ | (0.41 | ) |
| | | | | |
After-tax items | | | | | | | | | | | | | | | | | | | | |
| Electric and gas utility other | | | — | | | | — | | | | — | | | | — | | | | — | |
| Enterprises other | | | — | | | | — | | | | (0.13 | ) | | | 0.11 | | | | (0.02 | ) |
| Corporate other | | | 0.01 | | | | (0.07 | ) | | | 0.02 | | | | 0.38 | | | | 0.27 | |
| Discontinued operations | | | (0.01 | ) | | | (0.01 | ) | | | — | | | | (0.01 | ) | | | (0.03 | ) |
| Asset impairment charges | | | — | | | | — | | | | 0.76 | | | | — | | | | 0.76 | |
| | | | | |
Adjusted earnings per share, including MTM | | $ | (0.12 | ) | | $ | 0.23 | | | $ | 0.18 | | | $ | 0.33 | | | $ | 0.57 | |
| Mark-to-market impacts | | | 0.34 | | | | 0.10 | | | | 0.13 | | | | (0.06 | ) | | | 0.51 | |
| | | | | |
Adjusted earnings per share, excluding MTM | | $ | 0.22 | | | $ | 0.33 | | | $ | 0.31 | | | $ | 0.27 | | | $ | 1.08 | |
| | | | | |
Note: Year-to-date (YTD) EPS may not equal sum of quarters due to share count differences.
2006A-1
CMS Energy Corporation
Earnings By Quarter and Year GAAP Reconciliation
(Unaudited)
| | | | | | | | | | | | | | | | | | | | | |
| | | (In millions, except per share amounts) |
| | | 2007 |
| | | 1Q | | 2Q | | 3Q | | 4Q | | Dec YTD |
| | | |
Reported net income (loss) — GAAP | | $ | (215 | ) | | $ | 33 | | | $ | 82 | | | $ | (127 | ) | | $ | (227 | ) |
| |
After-tax items: | | | | | | | | | | | | | | | | | | | | |
| Electric and gas utility | | | 4 | | | | — | | | | — | | | | — | | | | 4 | |
| Enterprises | | | 49 | | | | 19 | | | | (10 | ) | | | 222 | | | | 280 | |
| Corporate interest and other | | | (81 | ) | | | 32 | | | | 9 | | | | (38 | ) | | | (78 | ) |
| Discontinued operations (income) loss | | | 178 | | | | (91 | ) | | | — | | | | 2 | | | | 89 | |
| Asset impairment charges, net | | | 157 | | | | 25 | | | | (49 | ) | | | — | | | | 133 | |
| |
Adjusted income — non-GAAP | | $ | 92 | | | $ | 18 | | | $ | 32 | | | $ | 59 | | | $ | 201 | |
| |
| | | | | | | | | | | | | | | | | | | | | |
Average shares outstanding, basic | | | 221.5 | | | | 222.6 | | | | 223.0 | | | | 223.4 | | | | 222.6 | |
Average shares outstanding, diluted | | | 221.5 | | | | 222.6 | | | | 241.3 | | | | 223.4 | | | | 222.6 | |
| | | | | | | | | | | | | | | | | | | | | |
| |
Reported earnings (loss) per share — GAAP | | $ | (0.97 | ) | | $ | 0.15 | | | $ | 0.34 | | | $ | (0.57 | ) | | $ | (1.02 | ) |
| |
After-tax items: | | | | | | | | | | | | | | | | | | | | |
| Electric and gas utility | | | 0.01 | | | | — | | | | — | | | | — | | | | (0.07 | ) |
| Enterprises | | | 0.23 | | | | 0.08 | | | | (0.04 | ) | | | 0.99 | | | | 1.25 | |
| Corporate interest and other | | | (0.36 | ) | | | 0.15 | | | | 0.03 | | | | (0.17 | ) | | | (0.32 | ) |
| Discontinued operations (income) loss | | | 0.80 | | | | (0.41 | ) | | | — | | | | 0.01 | | | | 0.40 | |
| Asset impairment charges, net | | | 0.71 | | | | 0.11 | | | | (0.20 | ) | | | — | | | | 0.60 | |
| |
Adjusted earnings per share — non-GAAP | | $ | 0.42 | | | $ | 0.08 | | | $ | 0.13 | | | $ | 0.26 | | | $ | 0.84 | |
| |
| | | | | | | | | | | | | | | | | | | | | |
| | | (In millions, except per share amounts) |
| | | 2008 |
| | | 1Q | | 2Q | | 3Q | | 4Q | | Dec YTD |
| | | |
Reported net income — GAAP | | $ | 103 | | | $ | 46 | | | $ | 79 | | | $ | 61 | | | $ | 289 | |
| |
After-tax items: | | | | | | | | | | | | | | | | | | | | |
| Electric and gas utility | | | — | | | | 1 | | | | 6 | | | | 5 | | | | 12 | |
| Enterprises | | | * | | | | (4 | ) | | | (* | ) | | | 1 | | | | (3 | ) |
| Corporate interest and other | | | — | | | | — | | | | (6 | ) | | | 1 | | | | (5 | ) |
| Discontinued operations (income) loss | | | (* | ) | | | 1 | | | | (1 | ) | | | * | | | | * | |
| |
Adjusted income — non-GAAP | | $ | 103 | | | $ | 44 | | | $ | 78 | | | $ | 68 | | | $ | 293 | (a) |
| |
| |
Average shares outstanding, basic | | | 223.5 | | | | 223.7 | | | | 224.1 | | | | 224.5 | | | | 223.9 | |
Average shares outstanding, diluted | | | 236.6 | | | | 239.1 | | | | 234.3 | | | | 226.6 | | | | 234.8 | |
| |
| |
Reported earnings per share — GAAP | | $ | 0.44 | | | $ | 0.19 | | | $ | 0.34 | | | $ | 0.27 | | | $ | 1.23 | |
| |
After-tax items: | | | | | | | | | | | | | | | | | | | | |
| Electric and gas utility | | | — | | | | 0.01 | | | | 0.02 | | | | 0.03 | | | | 0.05 | |
| Enterprises | | | * | | | | (0.02 | ) | | | 0.01 | | | | * | | | | (0.01 | ) |
| Corporate interest and other | | | — | | | | — | | | | (0.03 | ) | | | * | | | | (0.02 | ) |
| Discontinued operations (income) loss | | | (* | ) | | | 0.01 | | | | (0.01 | ) | | | * | | | | * | |
| |
Adjusted earnings per share — non-GAAP | | $ | 0.44 | | | $ | 0.19 | | | $ | 0.33 | | | $ | 0.30 | | | $ | 1.25 | |
| |
| | |
| Note: | | Year-to-date (YTD) EPS may not equal sum of quarters due to share count differences.
* Less than $500 thousand or $0.01 per share. |
2008A-1
CMS ENERGY CORPORATION
Earnings Segment Results GAAP Reconciliation
(Unaudited)
| | | | | | | | | | | | | | | | | |
| | | Three Months Ended | | | Twelve Months Ended | |
| December 31 | | 2008 | | | 2007 | | | 2008 | | | 2007 | |
| |
Electric Utility | | | | | | | | | | | | | | | | |
| Reported | | $ | 0.17 | | | $ | 0.17 | | | $ | 1.16 | | | $ | 0.88 | |
| Dilution Impact | | | — | | | | — | | | | — | | | | (0.06 | ) |
| Unrealized Investment Loss | | | 0.02 | | | | — | | | | 0.03 | | | | — | |
| Asset Sales Loss and Other, net | | | — | | | | — | | | | * | | | | 0.01 | |
| | | | | | | | | | | | | |
| Adjusted | | $ | 0.19 | | | $ | 0.17 | | | $ | 1.19 | | | $ | 0.83 | |
| | | | | | | | | | | | | |
| | | | | | | | | | | | | | | | | |
Gas Utility | | | | | | | | | | | | | | | | |
| Reported | | $ | 0.19 | | | $ | 0.15 | | | $ | 0.38 | | | $ | 0.39 | |
| Dilution Impact | | | — | | | | — | | | | — | | | | (0.03 | ) |
| Unrealized Investment Loss | | | 0.01 | | | | — | | | | 0.02 | | | | — | |
| Asset Sales Loss and Other, net | | | — | | | | — | | | | — | | | | 0.01 | |
| | | | | | | | | | | | | |
| Adjusted | | $ | 0.20 | | | $ | 0.15 | | | $ | 0.40 | | | $ | 0.37 | |
| | | | | | | | | | | | | |
| | | | | | | | | | | | | | | | | |
Enterprises | | | | | | | | | | | | | | | | |
| Reported | | $ | 0.01 | | | $ | (0.97 | ) | | $ | 0.06 | | | $ | (1.75 | ) |
| Unrealized Investment Loss | | | * | | | | — | | | | 0.01 | | | | — | |
| Asset Impairment Charges, net of insurance recoveries | | | — | | | | — | | | | — | | | | 0.55 | |
| Asset Sales (Gain) Loss and Other, net | | | — | | | | 0.99 | | | | (0.02 | ) | | | 1.25 | |
| | | | | | | | | | | | | |
| Adjusted | | $ | 0.01 | | | $ | 0.02 | | | $ | 0.05 | | | $ | 0.05 | |
| | | | | | | | | | | | | |
| | | | | | | | | | | | | | | | | |
Corporate Interest and Other | | | | | | | | | | | | | | | | |
| Reported | | $ | (0.10 | ) | | $ | 0.09 | | | $ | (0.37 | ) | | $ | (0.14 | ) |
| Dilution Impact | | | — | | | | — | | | | — | | | | 0.03 | |
| Unrealized Investment Loss | | | * | | | | — | | | | 0.01 | | | | — | |
| Asset Impairment Charges, net of insurance recoveries | | | — | | | | — | | | | — | | | | 0.05 | |
| Asset Sales Gain and Other, net | | | — | | | | (0.17 | ) | | | (0.03 | ) | | | (0.35 | ) |
| | | | | | | | | | | | | |
| Adjusted | | $ | (0.10 | ) | | $ | (0.08 | ) | | $ | (0.39 | ) | | $ | (0.41 | ) |
| | | | | | | | | | | | | |
| | | | | | | | | | | | | | | | | |
Discontinued Operations | | | | | | | | | | | | | | | | |
| Reported | | $ | — | | | $ | (0.01 | ) | | $ | — | | | $ | (0.40 | ) |
| Discontinued Operations Loss | | | — | | | $ | 0.01 | | | | — | | | | 0.40 | |
| | | | | | | | | | | | | |
| Adjusted | | $ | — | | | $ | — | | | $ | — | | | $ | — | |
| | | | | | | | | | | | | |
| | | | | | | | | | | | | | | | | |
Totals | | | | | | | | | | | | | | | | |
| Reported | | $ | 0.27 | | | $ | (0.57 | ) | | $ | 1.23 | | | $ | (1.02 | ) |
| Discontinued Operations Loss | | | — | | | | 0.01 | | | | — | | | | 0.40 | |
| Dilution Impact | | | — | | | | — | | | | — | | | | (0.06 | ) |
| Unrealized Investment Loss | | | 0.03 | | | | — | | | | 0.07 | | | | — | |
| Asset Impairment Charges, net of insurance recoveries | | | — | | | | — | | | | — | | | | 0.60 | |
| Asset Sales (Gain) Loss and Other, net | | | — | | | | 0.82 | | | | (0.05 | ) | | | 0.92 | |
| | | | | | | | | | | | | |
| Adjusted | | $ | 0.30 | | | $ | 0.26 | | | $ | 1.25 | | | $ | 0.84 | |
| | | | | | | | | | | | | |
| |
| Average Common Shares Outstanding Diluted (in millions) | | | 226.6 | | | | 223.4 | | | | 234.8 | | | | 222.6 | |
| | | | | | | | | | | | | |
| | |
| * | | Less than $0.01 per share. |
2008A-2
Consumers Energy
2008 Cash Flow GAAP Reconciliation (in millions) (unaudited)
| | | | | | | | | | | | | | | | | | | | | | | | | | | | | | | | | | | | | | | | | | | | | |
| | | | | | | Reclassifications From Sources and Uses to Statement of Cash Flows | | | | |
| Presentation Sources and Uses | | | Tax | | | Interest | | | Accts/Rec | | | Capital | | | Securitization | | | Operating | | | Preferred | | | Common | | | Consolidated Statements of Cash Flows |
| | | non-GAAP | | | Sharing | | | Payments | | | Financing | | | Lease Pymts | | | Debt Pymts | | | Activites | | | Dividends | | | Dividends | | | GAAP | | | | |
| Description | | Amount | | | Operating | | | as Operating | | | as Operating | | | as Financing | | | as Financing | | | as Investing | | | as Financing | | | as Financing | | | Amount | | | Description |
| Cash at year end 2007 | | $ | 195 | | | $ | — | | | $ | — | | | $ | — | | | $ | — | | | $ | — | | | $ | — | | | $ | — | | | $ | — | | | $ | 195 | | | Cash at year end 2007
|
| | | | | | | | | | | | | | | | | | | | | | | | | | | | | | | | | | | | | | | | | | | | | |
Sources | | | | | | | | | | | | | | | | | | | | | | | | | | | | | | | | | | | | | | | | | | | | |
| Operating | | $ | 1,330 | | | $ | (71 | ) | | $ | (196 | ) | | $ | — | | | $ | 26 | | | $ | 32 | | | $ | 1 | | | $ | — | | | $ | — | | | $ | 1,122 | | | | | |
| Other working capital | | | (418 | ) | | | — | | | | — | | | | 170 | | | | — | | | | — | | | | — | | | | — | | | | — | | | | (248 | ) | | |
| | | | | | | | | | | | | | | | | | | | | | | | | | | | | | | | | | |
| Sources | | $ | 912 | | | $ | (71 | ) | | $ | (196 | ) | | $ | 170 | | | $ | 26 | | | $ | 32 | | | $ | 1 | | | $ | — | | | $ | — | | | $ | 874 | | | Net cash provided byoperating activities
|
| | | | | | | | | | | | | | | | | | | | | | | | | | | | | | | | | | | | | | | | | | | | | |
Uses | | | | | | | | | | | | | | | | | | | | | | | | | | | | | | | | | | | | | | | | | | | | |
| Interest and preferred dividends | | $ | (198 | ) | | $ | — | | | $ | 196 | | | $ | — | | | $ | — | | | $ | — | | | $ | (1 | ) | | $ | 2 | | | $ | — | | | $ | (1 | ) | | | | |
| Capital expenditures | | | (823 | ) | | | — | | | | — | | | | — | | | | — | | | | — | | | | — | | | | — | | | | — | | | | (823 | ) | | | | |
| Dividends/tax sharing to CMS | | | (368 | ) | | | 71 | | | | — | | | | — | | | | — | | | | — | | | | — | | | | — | | | | 297 | | | | — | | | |
| | | | | | | | | | | | | | | | | | | | | | | | | | | | | | | | | | |
| Uses | | $ | (1,389 | ) | | $ | 71 | | | $ | 196 | | | $ | — | | | $ | — | | | $ | — | | | $ | (1 | ) | | $ | 2 | | | $ | 297 | | | $ | (824 | ) | | Net cash provided byinvesting activities
|
| | | | | | | | | | | | | | | | | | | | | | | | | | | | | | | | | | | | | | | | | | | | | |
| | | | | | | | | | | | | | | | | | | | | | | | | | | | | | | | | | |
Cash flow | | $ | (477 | ) | | $ | — | | | $ | — | | | $ | 170 | | | $ | 26 | | | $ | 32 | | | $ | — | | | $ | 2 | | | $ | 297 | | | $ | 50 | | | Cash flow from operating and investing activities
|
| | | | | | | | | | | | | | | | | | | | | | | | | | | | | | | | | | | | | | | | | | | | | |
Financing | | | | | | | | | | | | | | | | | | | | | | | | | | | | | | | | | | | | | | | | | | | | |
| New Issues | | $ | 686 | | | $ | — | | | $ | — | | | $ | — | | | $ | — | | | $ | — | | | $ | — | | | $ | (2 | ) | | $ | — | | | $ | 684 | | | | | |
| Retirements | | | (505 | ) | | | — | | | | — | | | | — | | | | (26 | ) | | | (32 | ) | | | — | | | | — | | | | (297 | ) | | | (860 | ) | | | | |
| Net short-term financing | | | 170 | | | | — | | | | — | | | | (170 | ) | | | — | | | | — | | | | — | | | | — | | | | — | | | | — | | | |
| | | | | | | | | | | | | | | | | | | | | | | | | | | | | | | | | | |
| Financing | | $ | 351 | | | $ | — | | | $ | — | | | $ | (170 | ) | | $ | (26 | ) | | $ | (32 | ) | | $ | — | | | $ | (2 | ) | | $ | (297 | ) | | $ | (176 | ) | | Net cash provided byfinancing activities
|
| | | | | | | | | | | | | | | | | | | | | | | | | | | | | | | | | | | | | | | | | | | | | |
| | | | | | | | | | | | | | | | | | | | | | | | | | | | | | | | | | |
Net change in cash | | $ | (126 | ) | | $ | — | | | $ | — | | | $ | — | | | $ | — | | | $ | — | | | $ | — | | | $ | — | | | $ | — | | | $ | (126 | ) | | Net change in cash
|
| | | | | | | | | | | | | | | | | | | | | | | | | | | | | | | | | | | | | | | | | | | | | |
| | | | | | | | | | | | | | | | | | | | | | | | | | | | | | | | | | |
Cash at year end 2008 | | $ | 69 | | | $ | — | | | $ | — | | | $ | — | | | $ | — | | | $ | — | | | $ | — | | | $ | — | | | $ | — | | | $ | 69 | | | Cash at year end 2008
|
| | | | | | | | | | | | | | | | | | | | | | | | | | | | | | | | | | |
2008A-3
CMS Energy Parent
2008 Cash Flow GAAP Reconciliation (in millions) (unaudited)
| | | | | | | | | | | | | | | | | | | | | | | | | | | | | | | | | | | | | |
| | | | | | | Reclassifications From Sources and Uses to Statement of Cash Flows | | | | |
| Presentation Sources and Uses | | | Interest | | | Overheads & | | | DIG | | | Other | | | Preferred | | | Cash From | | | Consolidated Statements of Cash Flows |
| | | non-GAAP | | | Payments | | | Tax Payments | | | Settlement | | | Uses (a) | | | Dividends | | | Consolidated | | | GAAP | | | | |
| Description | | Amount | | | as Operating | | | as Operating | | | as Operating | | | as Operating | | | as Financing | | | Companies | | | Amount | | | Description |
| Cash at year end 2007 | | $ | 136 | | | $ | — | | | $ | — | | | $ | — | | | $ | — | | | $ | — | | | $ | 17 | | | $ | 153 | | | Cash at year end 2007
|
| | | | | | | | | | | | | | | | | | | | | | | | | | | | | | | | | | | | | |
Sources | | | | | | | | | | | | | | | | | | | | | | | | | | | | | | | | | | | | |
| Consumers Energy dividends/tax sharing | | $ | 368 | | | $ | (126 | ) | | $ | (15 | ) | | $ | — | | | $ | — | | | $ | — | | | $ | — | | | $ | 227 | | | | | |
| Enterprises | | | 28 | | | | — | | | | — | | | | (275 | ) | | | (11 | ) | | | — | | | | 13 | | | | (245 | ) | | |
| | | | | | | | | | | | | | | | | | | | | | | | | | | | |
| Sources | | $ | 396 | | | $ | (126 | ) | | $ | (15 | ) | | $ | (275 | ) | | $ | (11 | ) | | $ | — | | | $ | 13 | | | $ | (18 | ) | | Net cash provided byoperating activities
|
| | | | | | | | | | | | | | | | | | | | | | | | | | | | | | | | | | | | | |
Uses | | | | | | | | | | | | | | | | | | | | | | | | | | | | | | | | | | | | |
| Interest and preferred dividends | | $ | (137 | ) | | $ | 126 | | | $ | — | | | $ | — | | | $ | — | | | $ | 11 | | | $ | — | | | $ | — | | | | | |
| Overhead and Federal tax payments | | | (15 | ) | | | — | | | | 15 | | | | — | | | | — | | | | — | | | | — | | | | — | | | | | |
| DIG settlement | | | (275 | ) | | | — | | | | — | | | | 275 | | | | 11 | | | | — | | | | (17 | ) | | | (6 | ) | | |
| | | | | | | | | | | | | | | | | | | | | | | | | | | | |
| Uses (a) | | $ | (436 | ) | | $ | 126 | | | $ | 15 | | | $ | 275 | | | $ | 11 | | | $ | 11 | | | $ | (17 | ) | | $ | (15 | ) | | Net cash provided byinvesting activities
|
| | | | | | | | | | | | | | | | | | | | | | | | | | | | | | | | | | | | | |
| | | | | | | | | | | | | | | | | | | | | | | | | | | | |
Cash flow | | $ | (40 | ) | | $ | — | | | $ | — | | | $ | — | | | $ | — | | | $ | 11 | | | $ | (4 | ) | | $ | (33 | ) | | Cash flow from operating and investing activities
|
| | | | | | | | | | | | | | | | | | | | | | | | | | | | | | | | | | | | | |
Financing and dividends | | | | | | | | | | | | | | | | | | | | | | | | | | | | | | | | | | | | |
| New Issues | | $ | 8 | | | $ | — | | | $ | — | | | $ | — | | | $ | — | | | $ | (11 | ) | | $ | 14 | | | $ | 11 | | | | | |
| Retirements | | | (11 | ) | | | — | | | | — | | | | — | | | | — | | | | — | | | | — | | | | (11 | ) | | | | |
| Net short-term financing | | | 105 | | | | — | | | | — | | | | — | | | | — | | | | — | | | | — | | | | 105 | | | | | |
| Common dividend | | | (81 | ) | | | — | | | | — | | | | — | | | | — | | | | — | | | | — | | | | (81 | ) | | |
| | | | | | | | | | | | | | | | | | | | | | | | | | | | |
| Financing | | $ | 21 | | | $ | — | | | $ | — | | | $ | — | | | $ | — | | | $ | (11 | ) | | $ | 14 | | | $ | 24 | | | Net cash provided byfinancing activities
|
| |
| | | | | | | | | | | | | | | | | | | | | | | | | | | | |
Net change in cash | | $ | (19 | ) | | $ | — | | | $ | — | | | $ | — | | | $ | — | | | $ | — | | | $ | 10 | | | $ | (9 | ) | | Net change in cash
|
| |
| | | | | | | | | | | | | | | | | | | | | | | | | | | | |
Cash at year end 2008 | | $ | 117 | | | $ | — | | | $ | — | | | $ | — | | | $ | — | | | $ | — | | | $ | 27 | | | $ | 144 | | | Cash at year end 2008
|
| | | | | | | | | | | | | | | | | | | | | | | | | | | | |
| | |
| (a) | | Includes other and roundings |
2008A-4
Consolidated CMS Energy
2008 Consolidation of Consumers Energy and CMS Energy Parent Statements of Cash Flow(in millions) (unaudited)
| | | | | | | | | | | | | | | | | | | | | | | |
| | | | | | | | | | | Eliminations/Reclassifications to Arrive at the | | | | |
| | | | | | | | | | | Consolidated Statement of Cash Flows | | | | |
| Statements of Cash Flows | | | Consumers | | | Equity | | | | |
| | | Consumers | | | CMS Parent | | | Common Dividend | | | Infusions to | | | Consolidated Statements of Cash Flows |
| Description | | Amount | | | Amount | | | as Financing | | | Consumers | | | Amount | | | Description |
Cash at year end 2007 | | $ | 195 | | | $ | 153 | | | $ | — | | | $ | — | | | $ | 348 | | | Cash at year end 2007 |
| |
Net cash provided by operating activities | | $ | 874 | | | $ | (18 | ) | | $ | (297 | ) | | $ | — | | | $ | 559 | | | Net cash provided by operating activities |
| |
Net cash provided by investing activities | | | (824 | ) | | | (15 | ) | | | — | | | | — | | | | (839 | ) | | Net cash provided by investing activities |
| |
| | | | | | | | | | | | | | | | | | |
Cash flow from operating and investing activities | | $ | 50 | | | $ | (33 | ) | | $ | (297 | ) | | $ | — | | | $ | (280 | ) | | Cash flow from operating and investing activities |
| |
Net cash provided by financing activities | | $ | (176 | ) | | $ | 24 | | | $ | 297 | | | $ | — | | | $ | 145 | | | Net cash provided by financing activities |
| |
| | | | | | | | | | | | | | | | | | |
Net change in cash | | $ | (126 | ) | | $ | (9 | ) | | $ | — | | | $ | — | | | $ | (135 | ) | | Net change in cash |
| |
| | | | | | | | | | | | | | | | | | |
Cash at year end 2008 | | $ | 69 | | | $ | 144 | | | $ | — | | | $ | — | | | $ | 213 | | | Cash at year end 2008 |
| | | | | | | | | | | | | | | | | | |
2008A-5
CMS Energy
Reconciliation of 2008 Free Cash Flow to GAAP Free Cash Flow
(unaudited)
| | | | | | | |
| | | Amount | | | |
| | | (mils) | | | |
Statement of cash flows | | | | | | |
| |
| Operating activities | | $ | 559 | | | |
| Investing activities | | | (839 | ) | | |
| |
| | | | | | |
Cash flow from operating and investing activities | | $ | (280 | ) | | SCF changes |
| | | | | | |
| | | | | | | |
Adjustments to reconcile free cash flow | | | | | | |
| Reclassify financing activities as operating | | | | | | |
| Capital lease payments | | $ | (26 | ) | | |
| Securitization debt retirements | | | (32 | ) | | |
| Preferred dividend payments | | | (13 | ) | | |
| | | | | | | |
| Reclassify operating activities as financing | | | | | | |
| Accounts receivable financing | | | (170 | ) | | |
| | | | | | | |
| Reclassify Consolidating Cash | | | 4 | | | |
| |
| | | | | | |
Total free cash flow before dividends | | $ | (517 | ) | | Free cash flow changes |
| | | | | | |
| | | | | | | |
| Addback capex | | | | | | |
| Consumers Energy | | | 823 | | | |
| Enterprises | | | 3 | | | |
| | | | | | | |
| Rounding | | | — | | | |
| | | | | | | |
| | | | | | |
Free cash flow before dividends and capex | | $ | 309 | | | |
| | | | | | |
2008A-6
Consumers Energy
2009 Forecasted Cash Flow GAAP Reconciliation (in millions) (unaudited)
| | | | | | | | | | | | | | | | | | | | | | | | | | | | | | | | | | | | | | | |
| | | | | | | Reclassifications From Sources and Uses to Statement of Cash Flows | | | | |
| Presentation Sources and Uses | | | Tax | | | Interest | | | Accts/Rec | | | Capital | | | Securitization | | | Preferred | | | Common | | | Consolidated Statements of Cash Flows |
| | | non-GAAP | | | Sharing | | | Payments | | | Financing | | | Lease Pymts | | | Debt Pymts | | | Dividends | | | Dividends | | | GAAP | | | |
| Description | | Amount | | | Operating | | | as Operating | | | as Operating | | | as Financing | | | as Financing | | | as Financing | | | as Financing | | | Amount | | | Description |
| Cash at year end 2008 | | $ | 69 | | | $ | — | | | $ | — | | | $ | — | | | $ | — | | | $ | — | | | $ | — | | | $ | — | | | $ | 69 | | | Cash at year end 2008 |
| |
Sources | | | | | | | | | | | | | | | | | | | | | | | | | | | | | | | | | | | | | | |
| Operating | | $ | 1,350 | | | $ | (75 | ) | | $ | (228 | ) | | $ | — | | | $ | 26 | | | $ | 34 | | | $ | — | | | $ | — | | | $ | 1,107 | | | |
| Other working capital | | | (100 | ) | | | — | | | | — | | | | 80 | | | | — | | | | — | | | | — | | | | — | | | | (20 | ) | | |
| | | | | | | | | | | | | | | | | | | | | | | | | | | | | | |
| Sources | | $ | 1,250 | | | $ | (75 | ) | | $ | (228 | ) | | $ | 80 | | | $ | 26 | | | $ | 34 | | | $ | — | | | $ | — | | | $ | 1,087 | | | Net cash provided by operating activities |
| | | | | | | | | | | | | | | | | | | | | | | | | | | | | | | | | | | | | | | |
Uses | | | | | | | | | | | | | | | | | | | | | | | | | | | | | | | | | | | | | | |
| Interest and preferred dividends | | $ | (230 | ) | | $ | — | | | $ | 228 | | | $ | — | | | $ | — | | | $ | — | | | $ | 2 | | | $ | — | | | $ | — | | | |
| Pension Contribution | | | (290 | ) | | | — | | | | — | | | | — | | | | — | | | | — | | | | — | | | | — | | | | (290 | ) | | |
| Capital expenditures | | | (850 | ) | | | — | | | | — | | | | — | | | | — | | | | — | | | | — | | | | — | | | | (850 | ) | | |
| Dividends/tax sharing to CMS | | | (380 | ) | | | 75 | | | | — | | | | — | | | | — | | | | — | | | | — | | | | 305 | | | | — | | | |
| | | | | | | | | | | | | | | | | | | | | | | | | | | | | | |
| Uses | | $ | (1,750 | ) | | $ | 75 | | | $ | 228 | | | $ | — | | | $ | — | | | $ | — | | | $ | 2 | | | $ | 305 | | | $ | (1,140 | ) | | Net cash provided by investing activities |
| |
| | | | | | | | | | | | | | | | | | | | | | | | | | | | | | |
Cash flow | | $ | (500 | ) | | $ | — | | | $ | — | | | $ | 80 | | | $ | 26 | | | $ | 34 | | | $ | 2 | | | $ | 305 | | | $ | (53 | ) | | Cash flow from operating and investing activities |
| | | | | | | | | | | | | | | | | | | | | | | | | | | | | | | | | | | | | | | |
Financing | | | | | | | | | | | | | | | | | | | | | | | | | | | | | | | | | | | | | | |
| Equity | | $ | 100 | | | $ | — | | | $ | — | | | $ | — | | | $ | — | | | $ | — | | | $ | (2 | ) | | $ | — | | | $ | 98 | | | |
| New Issues | | | 500 | | | | — | | | | — | | | | — | | | | — | | | | — | | | | — | | | | — | | | | 500 | | | |
| Retirements | | | (350 | ) | | | — | | | | — | | | | — | | | | (26 | ) | | | (34 | ) | | | — | | | | (305 | ) | | | (715 | ) | | |
| Net short-term financing | | | 221 | | | | — | | | | — | | | | (80 | ) | | | — | | | | — | | | | — | | | | — | | | | 141 | | | |
| | | | | | | | | | | | | | | | | | | | | | | | | | | | | | |
| Financing | | $ | 471 | | | $ | — | | | $ | — | | | $ | (80 | ) | | $ | (26 | ) | | $ | (34 | ) | | $ | (2 | ) | | $ | (305 | ) | | $ | 24 | | | Net cash provided by financing activities |
| |
| | | | | | | | | | | | | | | | | | | | | | | | | | | | | | |
Net change in cash | | $ | (29 | ) | | $ | — | | | $ | — | | | $ | — | | | $ | — | | | $ | — | | | $ | — | | | $ | — | | | $ | (29 | ) | | Net change in cash |
| |
| | | | | | | | | | | | | | | | | | | | | | | | | | | | | | |
Cash at year end 2009 | | $ | 40 | | | $ | — | | | $ | — | | | $ | — | | | $ | — | | | $ | — | | | $ | — | | | $ | — | | | $ | 40 | | | Cash at year end 2009 |
| | | | | | | | | | | | | | | | | | | | | | | | | | | | | | |
2009A-1
CMS Energy Parent
2009 Forecasted Cash Flow GAAP Reconciliation (in millions) (unaudited)
| | | | | | | | | | | | | | | | | | | | | | | | | | | | | | | |
| | | | | | | Reclassifications From Sources and Uses to Statement of Cash Flows | | | | |
| Presentation Sources and Uses | | | Interest | | | Overheads & | | | Other | | | Preferred | | | Cash From | | | Consolidated Statements of Cash Flows |
| | | non-GAAP | | | Payments | | | Tax Payments | | | Uses (a) | | | Dividends | | | Consolidated | | | GAAP | | | |
| Description | | Amount | | | as Operating | | | as Operating | | | as Operating | | | as Financing | | | Companies | | | Amount | | | Description |
| Cash at year end 2008 | | $ | 117 | | | $ | — | | | $ | — | | | $ | — | | | $ | — | | | $ | 27 | | | $ | 144 | | | Cash at year end 2008 |
| |
Sources | | | | | | | | | | | | | | | | | | | | | | | | | | | | | | |
| Consumers Energy dividends/tax sharing | | $ | 380 | | | $ | (119 | ) | | $ | (50 | ) | | $ | — | | | $ | — | | | $ | — | | | $ | 211 | | | |
| Enterprises | | | 40 | | | | — | | | | — | | | | (40 | ) | | | — | | | | — | | | | — | | | |
| | | | | | | | | | | | | | | | | | | | | | | | |
| Sources | | $ | 420 | | | $ | (119 | ) | | $ | (50 | ) | | $ | (40 | ) | | $ | — | | | $ | — | | | $ | 211 | | | Net cash provided by operating activities |
| | | | | | | | | | | | | | | | | | | | | | | | | | | | | | | |
Uses | | | | | | | | | | | | | | | | | | | | | | | | | | | | | | |
| Interest and preferred dividends | | $ | (130 | ) | | $ | 119 | | | $ | — | | | $ | — | | | $ | 11 | | | $ | — | | | $ | — | | | |
| Overhead and Federal tax payments | | | (50 | ) | | | — | | | | 50 | | | | — | | | | — | | | | — | | | | — | | | |
| Pension Contributions | | | (10 | ) | | | — | | | | — | | | | 10 | | | | — | | | | — | | | | — | | | |
| Equity infusions | | | (100 | ) | | | — | | | | — | | | | 30 | | | | — | | | | (50 | ) | | | (120 | ) | | |
| | | | | | | | | | | | | | | | | | | | | | | | |
| Uses (a) | | $ | (320 | ) | | $ | 119 | | | $ | 50 | | | $ | 40 | | | $ | 11 | | | $ | (50 | ) | | $ | (150 | ) | | Net cash provided by investing activities |
| |
| | | | | | | | | | | | | | | | | | | | | | | | |
Cash flow | | $ | 100 | | | $ | — | | | $ | — | | | $ | — | | | $ | 11 | | | $ | (50 | ) | | $ | 61 | | | Cash flow from operating and investing activities |
| | | | | | | | | | | | | | | | | | | | | | | | | | | | | | | |
Financing and dividends | | | | | | | | | | | | | | | | | | | | | | | | | | | | | | |
| New Issues | | $ | 300 | | | $ | — | | | $ | — | | | $ | — | | | $ | (11 | ) | | $ | 50 | | | $ | 339 | | | |
| Retirements | | | (310 | ) | | | — | | | | — | | | | — | | | | — | | | | — | | | | (310 | ) | | |
| Net short-term financing | | | (45 | ) | | | — | | | | — | | | | — | | | | — | | | | — | | | | (45 | ) | | |
| Common dividend | | | (112 | ) | | | — | | | | — | | | | — | | | | — | | | | — | | | | (112 | ) | | |
| | | | | | | | | | | | | | | | | | | | | | | | |
| Financing | | $ | (167 | ) | | $ | — | | | $ | — | | | $ | — | | | $ | (11 | ) | | $ | 50 | | | $ | (128 | ) | | Net cash provided by financing activities |
| |
| | | | | | | | | | | | | | | | | | | | | | | | |
Net change in cash | | $ | (67 | ) | | $ | — | | | $ | — | | | $ | — | | | $ | — | | | $ | — | | | $ | (67 | ) | | Net change in cash |
| | | | | | | | | | | | | | | | | | | | | | | | |
| | | | | | | | | | | | | | | | | | | | | | | | | | | | | | | |
Cash at year end 2009 | | $ | 50 | | | $ | — | | | $ | — | | | $ | — | | | $ | — | | | $ | 27 | | | $ | 77 | | | Cash at year end 2009 |
| | | | | | | | | | | | | | | | | | | | | | | | |
| | |
| (a) | | Includes other and roundings |
2009A-2
Consolidated CMS Energy
2009 Forecasted Consolidation of Consumers Energy and CMS Energy Parent Statements of Cash Flow (in millions) (unaudited)
| | | | | | | | | | | | | | | | | | | | | | | |
| | | | | | | | | | | Eliminations/Reclassifications to Arrive at the | | | | |
| | | | | | | | | | | Consolidated Statement of Cash Flows | | | | |
| Statements of Cash Flows | | | Consumers | | | Equity | | | | |
| | | Consumers | | | CMS Parent | | | Common Dividend | | | Infusions to | | | Consolidated Statements of Cash Flows |
| Description | | Amount | | | Amount | | | as Financing | | | Consumers | | | Amount | | | Description |
Cash at year end 2008 | | $ | 195 | | | $ | 153 | | | $ | — | | | $ | — | | | $ | 348 | | | Cash at year end 2008 |
| |
Net cash provided by operating activities | | $ | 1,087 | | | $ | 211 | | | $ | (305 | ) | | $ | — | | | $ | 993 | | | Net cash provided by operating activities |
| |
Net cash provided by investing activities | | | (1,140 | ) | | | (150 | ) | | | — | | | | 100 | | | | (1,190 | ) | | Net cash provided by investing activities |
| |
| | | | | | | | | | | | | | | | | | |
Cash flow from operating and investing activities | | $ | (53 | ) | | $ | 61 | | | $ | (305 | ) | | $ | 100 | | | $ | (197 | ) | | Cash flow from operating and investing activities |
| |
Net cash provided by financing activities | | $ | 24 | | | $ | (128 | ) | | $ | 305 | | | $ | (100 | ) | | $ | 101 | | | Net cash provided by financing activities |
| |
| | | | | | | | | | | | | | | | | | |
Net change in cash | | $ | (29 | ) | | $ | (67 | ) | | $ | — | | | $ | — | | | $ | (96 | ) | | Net change in cash |
| |
| | | | | | | | | | | | | | | | | | |
Cash at year end 2009 | | $ | 166 | | | $ | 86 | | | $ | — | | | $ | — | | | $ | 252 | | | Cash at year end 2009 |
| | | | | | | | | | | | | | | | | | |
2009A-3
CMS Energy
Reconciliation of 2009 Forecasted Free Cash Flow to GAAP Free Cash Flow
(unaudited)
| | | | | | | |
| | | Amount | | | |
| | | (mils) | | | |
Statement of cash flows | | | | | | |
| |
| Operating activities | | $ | 993 | | | |
| Investing activities | | | (1,190 | ) | | |
| | | | | | | |
| | | | | | |
Cash flow from operating and investing activities | | $ | (197 | ) | | SCF changes |
| | | | | | |
| | | | | | | |
Adjustments to reconcile free cash flow | | | | | | |
| Reclassify financing activities as operating | | | | | | |
| Capital lease payments | | $ | (26 | ) | | |
| Securitization debt retirements | | | (34 | ) | | |
| Preferred dividend payments | | | (13 | ) | | |
| | | | | | | |
| Reclassify operating activities as financing | | | | | | |
| Accounts receivable financing | | | (80 | ) | | |
| | | | | | | |
| Reclassify Consolidating Cash | | | 50 | | | |
| |
| | | | | | |
Total free cash flow before dividends | | $ | (300 | ) | | Free cash flow changes |
| | | | | | |
| | | | | | | |
| Addback capex | | | | | | |
| Consumers Energy | | | 850 | | | |
| Enterprises | | | — | | | |
| | | | | | | |
| Rounding | | | — | | | |
| |
| | | | | | |
Free cash flow before dividends and capex | | $ | 550 | | | |
| | | | | | |
2009A-4


