Exhibit 99.1

| Growing Forward Investor Meetings March 2009 David W. Joos President and Chief Executive Officer Laura L. Mountcastle Vice President and Treasurer |
| This presentation contains "forward-looking statements" as defined in Rule 3b-6 of the Securities Exchange Act of 1934, as amended, Rule 175 of the Securities Act of 1933, as amended, and relevant legal decisions. The forward-looking statements are subject to risks and uncertainties. They should be read in conjunction with "FORWARD-LOOKING STATEMENTS AND INFORMATION" and "RISK FACTORS" each found in the MANAGEMENT'S DISCUSSION AND ANALYSIS sections of CMS Energy's Form 10-K and Consumers Energy's Form 10-K each for the Year Ended December 31, 2008. CMS Energy's and Consumers Energy's "FORWARD-LOOKING STATEMENTS AND INFORMATION" and "RISK FACTORS" sections are incorporated herein by reference and discuss important factors that could cause CMS Energy's and Consumers Energy's results to differ materially from those anticipated in such statements. The presentation also includes non-GAAP measures when describing CMS Energy's results of operations and financial performance. A reconciliation of each of these measures to the most directly comparable GAAP measure is included in the appendix and posted on our website at www.cmsenergy.com. CMS Energy expects 2009 reported earnings to be about the same as adjusted earnings. Reported earnings could vary because of several factors. CMS Energy is not providing reported earnings guidance reconciliation because of the uncertainties associated with those factors. |
| 2008 - "Year in Review" Energy legislation Michigan economy Improved safety and operational performance Common dividend increase Foundation established for long-term growth. |

| Oct-07 Nov-07 Dec-07 Jan-08 Feb-08 Mar-08 Apr-08 May-08 Jun-08 Jul-08 Aug-08 Sep-08 Oct-08 Nov-08 Dec-08 Jan-09 Feb- 09 Mar-09 Regulatory Timeline November December April May June September November Electric Rate Case U-15645 Filed Staff and intervenors file Rebuttals Self implement Cross examination PFD target date Final order New Gas General Rate Case File after May 1 Self implement 2008 2009 Legislation provides for more timely rate relief. |
| 2009 Electric Rate Case Amount (mils) Capital Investment Recovery $ 104 Higher O&M 50 Sales decline and mix 43 Rate of Return (11%) 17 Total Request $ 214 Sales tracker Uncollectible accounts tracker File and implement Remaining Palisades refund could be used to offset partially the rate increase Lower fuel pass through costs also help to offset increases Simpler than normal case. The Rate Case Risk Mitigation Factors |
| Renewables and Energy Optimization Renewable Energy Plan 10% by 2015, currently 4% Primarily invest in wind 200 Mw by 2013, 500 Mw by 2015, 900 Mw by 2017 50% build, 50% PPA Over $1 billion capital investment Levelized surcharge of $85 - $90 million annually over plan life Energy Optimization Plan Target 5.5% electricity reduction; 3.85% gas reduction by 2015 $500 million investment over six years Requested revenue decoupling mechanism Levelized surcharge of $90 million annually through 2014 |
| BEI - Electric Resource Plan (Peak Load) 0 Generation gap needs to be addressed. Existing generation and long-term purchases |
| Renewable Energy Today 2008 Energy Generation Mix 40,100 Mwh Wind Hydro Biomass Solid waste Anaerobic digester Landfill gas Nuclear (PPA) Renewables Coal MISO Purchase Natural Gas 17 5 45 19 14 382 MW of renewable resources provide 5% of total energy. a _ _ _ _ _ a Based on generation needed to serve total customer requirements |
| Wind Growth - (2008-2018) 2008 2009 2010 2011 2012 2013 2014 2015 2016 2017 2018 71 71 71 71 71 271 271 571 571 971 971 Projected 200 MW 300 MW 400 MW |
| BEI Summary Extensive analysis of alternatives and risks Diverse and balanced plan Meets 10% renewable portfolio standard by 2015 Meets energy efficiency target of 5.5% by 2015 Includes demand management programs Purchase of Zeeland natural gas plant Build new clean coal facility Renewables (Nominal) Energy Efficiency and Demand Management Clean Coal Gas Combined Cycle 32 31 18 19 New Resources 2008 - 2018 |
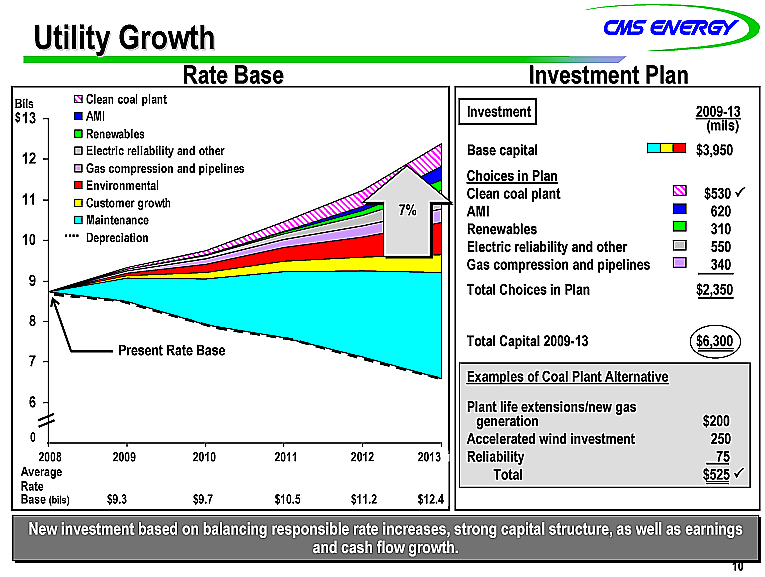
| 2008 2009 2010 2011 2012 2031 Depreciation 7.851 8.729 8.486 7.922 7.592 7.123 6.597 Maintenance 0.574 1.132 1.644 2.117 2.616 Customer growth 0.077 0.156 0.244 0.337 0.431 Environmental 0.057 0.19 0.341 0.501 0.797 Zeeland plant 0.481 0.481 0.481 0.481 0.481 Gas compression and pipelines 0.064 0.143 0.211 0.279 0.342 Electric reliability and other 0.022 0.077 0.137 0.254 0.444 Renewables 0.005 0.023 0.039 0.122 0.26 AMI 0.006 0.011 0.019 0.095 0.348 Clean coal plant 0.029 0.096 0.238 0.408 0.556 7% Utility Growth Rate Base Bils $ Present Rate Base 2008 2009 2010 2011 2012 2013 Average Rate Base (bils) $9.3 $9.7 $10.5 $11.2 $12.4 New investment based on balancing responsible rate increases, strong capital structure, as well as earnings and cash flow growth. 0 Investment 2009-13 (mils) Base capital $ 3,950 Choices in Plan Clean coal plant $ 530 ? AMI 620 Renewables 310 Electric reliability and other 550 Gas compression and pipelines 340 Total Choices in Plan $ 2,350 Total Capital 2009-13 $ 6,300 Examples of Coal Plant Alternative Plant life extensions/new gas generation $200 Accelerated wind investment 250 Reliability 75 Total $525 ? Investment Plan |
| Financial Accomplishments Achieved EPS and capital structure targets Increased dividend Exited exposure to monoline insurance companies Added $150 million, 364-day revolver at Utility Accelerated and increased our planned FMBs at Utility Issued $500 million, 6.7% FMB due 2019 Reshaped capital spending plans to address market conditions Liquidity strengthened in a tough global economy. |
| 2009 Adjusted EPS Guidance 2009 adjusted EPS guidance at $1.25 continues growth in an uncertain global economy; future growth still planned at 6% - 8%. 2003 2004 2005 2006 2007 2008 2009 Future 0.81 0.9 0.96 1.08 0.84 1.25 0.8 0.85 0.9 1 0.8 1.2 1.25 CMS Earnings Potential By Business Segment a 8% Growth 6%-8% Growth Dividend Annual ¢/share Payout % 25% 30% 40% _ _ _ _ _ a Adjusted (non-GAAP) EPS excluding MTM in 2004-2006 $1.25 $1.20 $1.25 |
| 2008 - 2013 Cash Flow 2008 2009 2010 2011 2012 2013 CF after Capex -517 -300 -49 146 -313 -622 81 182 265 323 707 877 CF after working capital 748 669 870 633 818 960 CF after interest 711 477 41 70 41 96 Operating cash flow 335 357 367 394 424 454 Billions $ Cash flow before dividend Operating cash flow Interest Base Capex Investment choices Investment drives operating cash flow growth. Cash flow before choices $1.3 $1.8 Pension Gas prices DIG Working capital and taxes |
| Capital Spending 2008 Budget Outlook Contingency Maintenance including customer growth 706 600 674 611.3 Environmental 45 69 197 197.1 Choices 75 181 264 125.1 120 186 Capital spending dialed back with some choices delayed temporarily. Average depreciation $410 million Equity contributions to Utility $0 $100 $250 2009 2010 Plan _ _ _ _ _ a 2007 10K Millions $ |

| Liquidity Outlook Liquidity position sound. Good coverage for operational risks. Plans in place to address Parent maturity in 2010, if capital markets closed. Oct Dec Mar Jun Sep Dec Mar Jun Sep Dec Blank Liquidity 1505 1150 1337 1917 1057 915 1460 1252 960 1020 Cash 670 950 1137 1717 857 715 1260 1052 760 820 460 520 $1.2 Amount (bils) $ $1.0 Gas Inventory 2008 2009 2010 Maturities (mils) Utility - $200 - $150 - - $308 - - Parent - - - - - - - $300 - Gas Inventory Parent Refinancing Historical operating risk |
| What Makes CMS Different? Recent State legislation provides framework for growth Diversified investment opportunities boost rate base and EPS Solid liquidity position, no need to issue equity in near term NOL and AMT credits add value Track record of predictability |
| Liquidity Components At 03-27-09 Facility Available Renewal Date (mils) (mils) A/R program $ 250 $ 250 May 2009 Bank of Nova Scotia LOC 192 0 November 2009 Consumers revolvers UBOC 150 150 September 2009 JPMorgan 500 328 March 2012 Energy Parent revolver 550 487 April 2012 Subtotal $1,642 $1, 215 Cash balance a NA 799 NA $1,642 $2,014 Adequate liquidity at Parent and Utility. _ _ _ _ _ a Includes proceeds from $500 million FMB offering Appendix |
| Tax Benefits Year-End Actual Estimate 2008 2009 2010 (mils) (mils) (mils) Gross NOL carry forwards $1,300 $900 $400 Net NOL cash benefit at 35% $ 455 $315 $140 Credit carry forwards 292 292 292 Remaining cash benefit $ 747 $607 $432 New American Recovery and Reinvestment Act of 2009 bonus depreciation extends life of NOLs. Appendix |
| 2009 Sensitivities Annual Impact Sensitivity EPS FCF (mils) Sales (weather-adjusted) Electric (34,845 GWh) a + 1% + $.04 + $18 Gas (289.4 bcf) + 1 + .02 + 7 Uncollectible accounts $(5) million (.02) (5) Auto-sector-wide bankruptcy (15) - (30) (.04) - (.08) (15) - (30) Gas prices + .50 + .01 + 60 ROE Electric + 50 bps + .06 + 25 Gas + 50 + .02 + 10 Principal sensitivities include the economy (sales and UAs), gas prices, and accomplishing rate requests. _ _ _ _ a Excluding HSC Appendix |
| Consumers Capital Expenditures Appendix |
MATURITY SCHEDULE OF CMS AND CECO LONG-TERM DEBT & PREFERRED SECURITIES
AS OF 02/28/2009
Reflects maturity of $200MM 4.8% FMBs & return of $20K due to overpayment of IQ puts; both CECo
| | | | | | | | | | | | | |
| | | | | Maturity | | Amount | | | | |
| F/V | | S/U | | or Call Date | | (000’s) | | | DEBT/ CO | |
| SHORT-TERM DEBT: | | | | | | | | | | |
| | | | | | | | | | | | | |
| F | | S | | 08/15/09 | | $ | 150,000 | | | 4.4% Series K FMBs (CECo) |
| | | | | | | | | | | | | |
| LONG-TERM DEBT: | | | | | | | | | | |
| | | | | | | | | | | | | |
| F | | S | | 05/15/10 | | $ | 250,000 | | | 4% $250MM FMBs (CECo) |
| F | | S | | 06/15/10 | | | 30,000 | | | 3.375% Fixed PCRBs (CECo) |
| F | | S | | 06/15/10 | | | 27,900 | | | 4.25% PCRBs (CECo) |
| F | | U | | 08/01/10 | | | 300,000 | | | 7.75% Sr Unsec Notes (CMS) |
| | | | | | | | | | | | |
| | | | | | | $ | 607,900 | | | | | |
| F | | U | | 04/15/11 | | $ | 300,375 | | | 8.5% Sr Notes (CMS) |
| F | | U | | 12/01/11 | | | 287,500 | | | *2.875% Convertible Sr Unsec Notes Put Date (CMS) |
| | | | | | | | | | | | |
| | | | | | | $ | 587,875 | | | | | |
| F | | U | | 02/01/12 | | $ | 150,000 | | | 6.3% Senior Notes (CMS) |
| F | | S | | 02/15/12 | | | 300,000 | | | 5% Series L FMBs (CECo) |
| V | | U | | 01/15/13 | | | 150,000 | | | Floating Rate Sr Notes (CMS) |
| F | | S | | 04/15/13 | | | 375,000 | | | 5.375% Series B FMBs (CECo) |
| F | | S | | 02/15/14 | | | 200,000 | | | 6% FMBs (CECo) |
| F | | S | | 03/15/15 | | | 225,000 | | | 5% FMBs Series N (CECo) |
| F | | U | | 12/15/15 | | | 125,000 | | | 6.875% Sr Notes (CMS) |
| F | | S | | 08/15/16 | | | 350,000 | | | 5.5% Series M FMBs (CECo) |
| F | | S | | 02/15/17 | | | 250,000 | | | 5.15% FMBs (CECo) |
| F | | U | | 07/17/17 | | | 250,000 | | | 6.55% Sr Notes (CMS) |
| F | | S | | 03/01/18 | | | 180,000 | | | 6.875% Sr Notes (CECo) |
| V | | S | | 04/15/18 | | | 67,700 | | | VRDBs to replace PCRBs CECo) |
| F | | S | | 09/15/18 | | | 250,000 | | | 5.65% FMBs (CECo) |
| F | | S | | 03/15/19 | | | 350,000 | | | 6.125% FMBs (CECo) |
| F | | S | | 04/15/20 | | | 300,000 | | | 5.65% FMBs (CECo) |
| F | | U | | 07/15/23 | | | 140,000 | | | 3.375% Convertible Sr Notes (CMS) |
| F | | U | | 07/15/27 | | | 177,835 | | | QUIPS 7.75%(CMS)Pref Sec** |
| V | | S | | 04/01/35 | | | 35,000 | | | PCRBs (CECo) |
| F | | S | | 04/15/35 | | | 141,139 | | | 5.65% FMBs IQ Notes (CECo) |
| F | | S | | 09/15/35 | | | 175,000 | | | 5.80% FMBs (CECo) |
| | | | | | | | | | | | |
| | | | | | | $ | 4,191,674 | | | | | |
| | | | | | | $ | 5,387,449 | | | GRAND TOTAL |
| | | | | | | | | | | | |
| | | | | | | | | | | | | |
| | | | | | | $ | 5,209,614 | | | GRAND TOTAL EXCLUDING PREFERRED SECURITIES |
| | | | | | | | | | | | |
| | | | | | | | | | | | | |
Various Maturity Dates/No Maturity Date Available:
|
| | | | | | | $ | 268,827 | | | CECo Securitization Bonds (Long-Term & Short-Term) after 01/20/09 payment |
| | | | | | | | 230,853 | | | CECo Capital lease rental commitments (Long-Term & Short-Term) as of 12/31/08 |
| | | | | | | | 786 | | | CMS Enterprises (Genesee) Capital lease rental commitments (Long-Term & Short-Term) as of 12/31/08 |
| | | | | | | | 162,591 | | | CECo DOE Liability as of 02/28/09 |
| | | | | | | | 175,847 | | | EnerBank (Long-Term & Short-Term) Discount Brokered CDs as of 12/31/08 (CMS) |
| | | | | | | | (3,708 | ) | | CMS Net unamortized discount as of 12/31/08 |
| | | | | | | | (5,648 | ) | | CECo Net unamortized discount as of 12/31/08 |
| | | | | | | | 76,261 | | | CMS Enterprises Debt as of 12/31/08 |
| | | | | | | | | | | | |
| | | | | | | $ | 6,293,259 | | | GRAND TOTAL INCLUDING CMS ENERGY, CONSUMERS & OTHER CMS |
| | | | | | | | | | | ENTERPRISES SUBSIDIARIES, INCLUDING PREFERRED SECURITIES |
| | |
| *— | | Date that issue can be put to the Company is used instead of maturity date |
| |
| **— | | Includes subordinated notes amounts associated with preferred securities. Issue amount: $172.5MM QUIPS. |
Status Codes: F-Fixed rate; V-Variable rate; S-Secured; U-Unsecured
| | | |
| | ELECTRIC RATE CASE U-15645* |
On November 14, 2008, Consumers Energy filed an application with the Michigan Public Service Commission seeking an increase in its electric generation and distribution rates based on a 2009 test year. The request seeks authority to recover new investment in system reliability, environmental compliance and technology enhancements. These investments are part of the Company’s Growing Forward strategy which calls for investing more than $6 billion in utility operations over the next five years. The filing also requests sales and uncollectibles tracker mechanisms. The proposed overall rate of return is based on an 11.0% authorized return on equity. This is the first Consumers Energy rate case to be filed under the regulatory framework established in new energy laws, which allows for self-implementation 6 months after filing. If approved, the request would increase customer rates by an average of 6%. The $214 million request is detailed below.
| | | | | | | | | |
| Item | | $ Millions | | | Explanation |
| 1. O&M | | $ | 50 | | | General inflation: $21 |
| | | | | | | System reliability, uncollectibles, environmental compliance and technology: $29 |
| | | | | | | | | |
| 2. Rate of Return | | | 17 | | | Higher return on equity (11.00% vs. 10.70%): $11 |
| | | | | | | Other capitalization/costs: $6 |
| | | | | | | | | |
| 3. Rate Base | | | 76 | | | Net Plant (distribution reliability, generation reliability, environmental compliance, technology): $56 |
| | | | | | | Working Capital: $20 |
| | | | | | | | | |
| 4. Book Depreciation | | | 14 | | | Related to new investment |
| | | | | | | | | |
| 5. Property Taxes | | | 9 | | | Related to new investment |
| | | | | | | | | |
| 6. Gross Margin | | | 43 | | | Primarily due to customer mix and sales decline, 2009 sales forecast 36.2 GWh |
| | | | | | | | | |
| 7. Other | | | 5 | | | General Taxes, Income Taxes, AFUDC, and Other |
| | | | | | | | |
| | | | | | | | | |
| 8. Total | | $ | 214 | | | | | |
| | | | | | | | |
| | | | | | | | | | | | | | | | | |
| Ratemaking | | Existing | | As Filed | | | | | | After-Tax |
| Capital Structure % | | (U-15245) | | Percent of Total | | Annual Cost | | Weighted Costs |
| Long Term Debt | | | 41.55 | % | | | 44.51 | % | | | 5.85 | % | | | 2.60 | % |
| Short Term Debt | | | 0.81 | | | | 0.77 | | | | 5.99 | | | | 0.05 | |
| Preferred Stock | | | 0.50 | | | | 0.47 | | | | 4.46 | | | | 0.02 | |
| Common Equity | | | 41.75 | | | | 40.88 | (1) | | | 11.00 | | | | 4.50 | |
| Deferred FIT | | | 14.65 | | | | 12.73 | | | | 0.00 | | | | 0.00 | |
| JDITC/Other | | | 0.74 | | | | 0.64 | | | | | | | | 0.05 | |
| | | | | | | | | | | | | | | | | |
| | | | 100.00 | % | | | 100.00 | % | | | | | | | 7.22 | %(2) |
| | | | | | | | | | | | | | | | | |
| | | | | | | | | |
| Rate Base and Return | | Existing | | |
| Percentage | | (U-15245) | | As Filed |
| Rate Base | | $5.53 billion | | $6.27 billion |
| Return on Rate Base | | | 6.93 | % | | | 7.22 | % |
| Return on Equity | | | 10.70 | % | | | 11.00 | % |
| | |
| (1) | | Equivalent to 47.61% on a financial basis. |
| |
| (2) | | Equivalent to 10.12% pre-tax basis. |
ELECTRIC RATE CASE SCHEDULE
| | | |
| Staff & Intervenors File Testimony | | April 27, 2009 |
| | | |
| Rebuttal Testimony | | May 18, 2009 |
| | | |
| Motions to Strike Testimony | | May 29, 2009 |
| | | |
| Replies to Motions to Strike | | June 4, 2009 |
| | | |
| Cross of all Witnesses | | June 8-19, 2009 |
| | | |
| Initial Briefs | | July 9, 2009 |
| | | |
| Reply Briefs | | July 23, 2009 |
| | | |
| Proposal for Decision | | September 2, 2009 (target) |
| | | |
| Decision | | By November 14, 2009 |
| | |
| * | | Electric Rate Case U-15645 can be accessed at the Michigan Public Service Commission’s website. http://efile.mpsc.cis.state.mi.us/efile/electric.html |
CMS Energy
Earnings Reconciliation By Quarter and Year
December 31
Reconciliation of reported measures prepared in accordance with
Generally Accepted Accounting Principles (GAAP) versus non-GAAP measures
| | | | | | | | | | | | | | | | | | | | | |
| | | Unaudited Quarters |
| (millions, except per share amounts) | | 1Q03 | | 2Q03 | | 3Q03 | | 4Q03 | | FY 2003 |
| |
Reported net income | | $ | 82 | | | $ | (65 | ) | | $ | (69 | ) | | $ | 8 | | | $ | (44 | ) |
| |
After-tax items: | | | | | | | | | | | | | | | | | | | | |
| Electric and gas utility other | | | | | | | | | | | | | | | 30 | | | | 30 | |
| Enterprises other | | | 5 | | | | 7 | | | | 62 | | | | 37 | | | | 111 | |
| Corporate other | | | 1 | | | | | | | | 19 | | | | 4 | | | | 24 | |
| Discontinued operations | | | (31 | ) | | | 53 | | | | (2 | ) | | | (43 | ) | | | (23 | ) |
| Cumulative accounting changes | | | 24 | | | | | | | | | | | | | | | | 24 | |
| |
Ongoing earnings (non-GAAP) | | $ | 81 | | | $ | (5 | ) | | $ | 10 | | | $ | 36 | | | $ | 122 | |
| |
| | | | | | | | | | | | | | | | | | | | | |
Average shares outstanding, basic | | | 144.1 | | | | 144.1 | | | | 152.2 | | | | 161.1 | | | | 150.4 | |
| | | | | | | | | | | | | | | | | | | | | |
Average shares outstanding, diluted | | | 165.0 | | | | 144.1 | | | | 152.2 | | | | 161.1 | | | | 150.4 | |
| | | | | | | | | | | | | | | | | | | | | |
| |
Reported earnings per share | | $ | 0.52 | | | $ | (0.45 | ) | | $ | (0.46 | ) | | $ | 0.05 | | | $ | (0.30 | ) |
| |
After-tax items | | | | | | | | | | | | | | | | | | | | |
| Electric and gas utility other | | | | | | | | | | | | | | | 0.19 | | | | 0.21 | |
| Enterprises other | | | 0.03 | | | | 0.05 | | | | 0.41 | | | | 0.23 | | | | 0.74 | |
| Corporate other | | | | | | | | | | | 0.12 | | | | 0.02 | | | | 0.16 | |
| Discontinued operations | | | (0.19 | ) | | | 0.37 | | | | (0.01 | ) | | | (0.27 | ) | | | (0.16 | ) |
| Cumulative accounting changes | | | 0.14 | | | | | | | | | | | | | | | | 0.16 | |
| |
Ongoing earnings per share (non-GAAP) | | $ | 0.50 | | | $ | (0.03 | ) | | $ | 0.06 | | | $ | 0.22 | | | $ | 0.81 | |
| |
Note: Year-to-date (YTD) EPS may not equal sum of quarters due to share count differences.
2003A-1
CMS Energy
Earnings Reconciliation By Quarter and Year
Reconciliation of reported measures prepared in accordance with
Generally Accepted Accounting Principles (GAAP) versus non-GAAP measures
| | | | | | | | | | | | | | | | | | | | | |
| | | Unaudited | | 31-Dec | |
| (millions, except per share amounts) | | 1Q04* | | | 2Q04 | | | 3Q04 | | | 4Q04 | | | FY 2004 | |
| | | | |
Reported net income — GAAP | | $ | (9 | ) | | $ | 16 | | | $ | 56 | | | $ | 47 | | | $ | 110 | |
| | | | |
After-tax items: | | | | | | | | | | | | | | | | | | | | |
| Electric and gas utility other | | | | | | | | | | | | | | | (67 | ) | | | (67 | ) |
| Enterprises other | | | 88 | | | | | | | | (29 | ) | | | 48 | | | | 107 | |
| Corporate other | | | (7 | ) | | | | | | | (1 | ) | | | 1 | | | | (7 | ) |
| Discontinued operations | | | 2 | | | | | | | | (8 | ) | | | 10 | | | | 4 | |
| Cumulative accounting changes | | | 2 | | | | | | | | | | | | | | | | 2 | |
| | | | |
Adjusted earnings, including M-T-M | | $ | 76 | | | $ | 16 | | | $ | 18 | | | $ | 39 | | | $ | 149 | |
| Mark-to-market impacts | | NM | | | | (13 | ) | | | 9 | | | | 9 | | | | 5 | |
| | | | |
Adjusted earnings, excluding M-T-M | | $ | 76 | | | $ | 3 | | | $ | 27 | | | $ | 48 | | | $ | 154 | |
| | | | |
| |
Average shares outstanding, basic | | | 161.1 | | | | 161.2 | | | | 161.5 | | | | 190.2 | | | | 168.6 | |
| | | | | | | | | | | | | | | | | | | | | |
Average shares outstanding, diluted | | | 161.1 | | | | 164.2 | | | | 165.0 | | | | 194.0 | | | | 172.1 | |
| | | | | | | | | | | | | | | | | | | | | |
| | | | |
Reported earnings per share — GAAP | | $ | (0.06 | ) | | $ | 0.10 | | | $ | 0.34 | | | $ | 0.24 | | | $ | 0.64 | |
| | | | |
After-tax items | | | | | | | | | | | | | | | | | | | | |
| Electric and gas utility other | | | | | | | | | | | | | | | (0.35 | ) | | | (0.39 | ) |
| Enterprises other | | | 0.56 | | | | | | | | (0.17 | ) | | | 0.25 | | | | 0.62 | |
| Corporate other | | | (0.05 | ) | | | | | | | (0.01 | ) | | | 0.01 | | | | (0.03 | ) |
| Discontinued operations | | | 0.01 | | | | | | | | (0.05 | ) | | | 0.05 | | | | 0.02 | |
| Cumulative accounting changes | | | 0.01 | | | | | | | | | | | | | | | | 0.01 | |
| | | | |
Adjusted earnings per share, including M-T-M | | $ | 0.47 | | | $ | 0.10 | | | $ | 0.11 | | | $ | 0.20 | | | $ | 0.87 | |
| Mark-to-market impacts | | NM | | | | (0.08 | ) | | | 0.06 | | | | 0.05 | | | | 0.03 | |
| | | | |
Adjusted earnings per share, excluding M-T-M | | $ | 0.47 | | | $ | 0.02 | | | $ | 0.17 | | | $ | 0.25 | | | $ | 0.90 | |
| | | | |
Note: Year-to-date & full-year EPS may not equal sum of quarters due to share count differences.
| | | |
| * | | Quarterly amounts differ from amounts previously reported due to accelerating the measurement date on our benefit plans by one month and the remeasurement of our post retirement obligation. |
NM: Not meaningful.
2004A-1
CMS Energy
Earnings Reconciliation By Quarter and Year
Reconciliation of reported measures prepared in accordance with
Generally Accepted Accounting Principles (GAAP) versus non-GAAP measures
| | | | | | | | | | | | | | | | | | | | | |
| | | Unaudited | | 31-Dec | |
| (millions, except per share amounts) | | 1Q05 | | 2Q05 | | 3Q05 | | 4Q05 | | FY 2005 | |
| | | | | |
Reported net income — GAAP | | $ | 150 | | | $ | 27 | | | $ | (265 | ) | | $ | (6 | ) | | $ | (94 | ) |
| | | | | |
After-tax items: | | | | | | | | | | | | | | | | | | | | |
| Electric and gas utility other | | | | | | | | | | | | | | | | | | | | |
| Enterprises other | | | (2 | ) | | | (1 | ) | | | (1 | ) | | | 13 | | | | 9 | |
| Corporate other | | | | | | | 1 | | | | | | | | 8 | | | | 9 | |
| Discontinued operations | | | | | | | | | | | | | | | (14 | ) | | | (14 | ) |
| Asset impairment | | | | | | | | | | | 385 | | | | | | | | 385 | |
| | | | | |
Adjusted earnings, including M-T-M | | $ | 148 | | | $ | 27 | | | $ | 119 | | | $ | 1 | | | $ | 295 | |
| Mark-to-market impacts | | | (75 | ) | | | 19 | | | | (75 | ) | | | 40 | | | | (91 | ) |
| | | | | |
Adjusted earnings, excluding M-T-M | | $ | 73 | | | $ | 46 | | | $ | 44 | | | $ | 41 | | | $ | 204 | |
| | | | | |
| | | | | | | | | | | | | | | | | | | | | |
Average shares outstanding, basic | | | 195.3 | | | | 217.9 | | | | 219.6 | | | | 218.5 | | | | 211.8 | |
| | | | | | | | | | | | | | | | | | | | | |
Average shares outstanding, diluted | | | 206.3 | | | | 228.9 | | | | 219.6 | | | | 218.5 | | | | 211.8 | |
| | | | | | | | | | | | | | | | | | | | | |
| | | | | |
Reported earnings per share — GAAP | | $ | 0.74 | | | $ | 0.12 | | | $ | (1.21 | ) | | $ | (0.03 | ) | | $ | (0.44 | ) |
| | | | | |
After-tax items | | | | | | | | | | | | | | | | | | | | |
| Electric and gas utility other | | | | | | | | | | | | | | | | | | | | |
| Enterprises other | | | (0.01 | ) | | NM | | NM | | | 0.06 | | | | 0.04 | |
| Corporate other | | | | | | NM | | | | | | | 0.03 | | | | 0.04 | |
| Discontinued operations | | | | | | | | | | | | | | | (0.06 | ) | | | (0.07 | ) |
| Asset impairment | | | | | | | | | | | 1.75 | | | | | | | | 1.82 | |
| | | | | |
Adjusted earnings per share, including M-T-M | | $ | 0.73 | | | $ | 0.12 | | | $ | 0.54 | | | $ | 0.00 | | | $ | 1.39 | |
| Mark-to-market impacts | | | (0.36 | ) | | | 0.08 | | | | (0.34 | ) | | | 0.19 | | | | (0.43 | ) |
| | | | | |
Adjusted earnings per share, excluding M-T-M | | $ | 0.37 | | | $ | 0.20 | | | $ | 0.20 | | | $ | 0.19 | | | $ | 0.96 | |
| | | | | | |
Note: Year-to-date & full-year EPS may not equal sum of quarters due to share count differences.
2005A-1
CMS Energy
Earnings Reconciliation By Quarter and Year
Reconciliation of reported measures prepared in accordance with
Generally Accepted Accounting Principles (GAAP) versus non-GAAP measures
| | | | | | | | | | | | | | | | | | | | | |
| | | Unaudited | | |
| | | 2006 | | 2006 | |
| (In millions, except per share amounts) | | 1Q | | 2Q | | 3Q | | 4Q | | Dec YTD | |
| | | | | |
Reported net income — GAAP | | $ | (27 | ) | | $ | 72 | | | $ | (103 | ) | | $ | (32 | ) | | $ | (90 | ) |
| | | | | |
After-tax items: | | | | | | | | | | | | | | | | | | | | |
| Electric and gas utility other | | | — | | | | — | | | | — | | | | — | | | | — | |
| Enterprises other | | | — | | | | — | | | | (29 | ) | | | 25 | | | | (4 | ) |
| Corporate interest and other | | | 2 | | | | (15 | ) | | | 4 | | | | 82 | | | | 73 | |
| Discontinued operations (gain) | | | (1 | ) | | | (2 | ) | | | (1 | ) | | | (2 | ) | | | (6 | ) |
| Asset impairment charges | | | — | | | | — | | | | 169 | | | | — | | | | 169 | |
| | | | | |
Adjusted earnings, including MTM | | $ | (26 | ) | | $ | 55 | | | $ | 40 | | | $ | 73 | | | $ | 142 | |
| Mark-to-market impacts | | | 74 | | | | 21 | | | | 30 | | | | (13 | ) | | | 112 | |
| | | | | |
Adjusted earnings, excluding MTM | | $ | 48 | | | $ | 76 | | | $ | 70 | | | $ | 60 | | | $ | 254 | |
| | | | | |
| | | | | | | | | | | | | | | | | | | | | |
Average shares outstanding, basic | | | 219.1 | | | | 219.6 | | | | 220.1 | | | | 220.6 | | | | 219.9 | |
Average shares outstanding, diluted | | | 219.1 | | | | 229.6 | | | | 220.1 | | | | 220.6 | | | | 219.9 | |
| | | | | | | | | | | | | | | | | | | | | |
| | | | | |
Reported earnings per share — GAAP | | $ | (0.12 | ) | | $ | 0.31 | | | $ | (0.47 | ) | | $ | (0.15 | ) | | $ | (0.41 | ) |
| | | | | |
After-tax items | | | | | | | | | | | | | | | | | | | | |
| Electric and gas utility other | | | — | | | | — | | | | — | | | | — | | | | — | |
| Enterprises other | | | — | | | | — | | | | (0.13 | ) | | | 0.11 | | | | (0.02 | ) |
| Corporate other | | | 0.01 | | | | (0.07 | ) | | | 0.02 | | | | 0.38 | | | | 0.27 | |
| Discontinued operations | | | (0.01 | ) | | | (0.01 | ) | | | — | | | | (0.01 | ) | | | (0.03 | ) |
| Asset impairment charges | | | — | | | | — | | | | 0.76 | | | | — | | | | 0.76 | |
| | | | | |
Adjusted earnings per share, including MTM | | $ | (0.12 | ) | | $ | 0.23 | | | $ | 0.18 | | | $ | 0.33 | | | $ | 0.57 | |
| Mark-to-market impacts | | | 0.34 | | | | 0.10 | | | | 0.13 | | | | (0.06 | ) | | | 0.51 | |
| | | | | |
Adjusted earnings per share, excluding MTM | | $ | 0.22 | | | $ | 0.33 | | | $ | 0.31 | | | $ | 0.27 | | | $ | 1.08 | |
| | | | | |
Note: Year-to-date (YTD) EPS may not equal sum of quarters due to share count differences.
2006A-1
CMS Energy Corporation
Earnings By Quarter and Year GAAP Reconciliation
(Unaudited)
| | | | | | | | | | | | | | | | | | | | | |
| | | (In millions, except per share amounts) |
| | | 2007 |
| | | 1Q | | 2Q | | 3Q | | 4Q | | Dec YTD |
| | | |
Reported net income (loss) — GAAP | | $ | (215 | ) | | $ | 33 | | | $ | 82 | | | $ | (127 | ) | | $ | (227 | ) |
| |
After-tax items: | | | | | | | | | | | | | | | | | | | | |
| Electric and gas utility | | | 4 | | | | — | | | | — | | | | — | | | | 4 | |
| Enterprises | | | 49 | | | | 19 | | | | (10 | ) | | | 222 | | | | 280 | |
| Corporate interest and other | | | (81 | ) | | | 32 | | | | 9 | | | | (38 | ) | | | (78 | ) |
| Discontinued operations (income) loss | | | 178 | | | | (91 | ) | | | — | | | | 2 | | | | 89 | |
| Asset impairment charges, net | | | 157 | | | | 25 | | | | (49 | ) | | | — | | | | 133 | |
| |
Adjusted income — non-GAAP | | $ | 92 | | | $ | 18 | | | $ | 32 | | | $ | 59 | | | $ | 201 | |
| |
| | | | | | | | | | | | | | | | | | | | | |
Average shares outstanding, basic | | | 221.5 | | | | 222.6 | | | | 223.0 | | | | 223.4 | | | | 222.6 | |
Average shares outstanding, diluted | | | 221.5 | | | | 222.6 | | | | 241.3 | | | | 223.4 | | | | 222.6 | |
| | | | | | | | | | | | | | | | | | | | | |
| |
Reported earnings (loss) per share — GAAP | | $ | (0.97 | ) | | $ | 0.15 | | | $ | 0.34 | | | $ | (0.57 | ) | | $ | (1.02 | ) |
| |
After-tax items: | | | | | | | | | | | | | | | | | | | | |
| Electric and gas utility | | | 0.01 | | | | — | | | | — | | | | — | | | | (0.07 | ) |
| Enterprises | | | 0.23 | | | | 0.08 | | | | (0.04 | ) | | | 0.99 | | | | 1.25 | |
| Corporate interest and other | | | (0.36 | ) | | | 0.15 | | | | 0.03 | | | | (0.17 | ) | | | (0.32 | ) |
| Discontinued operations (income) loss | | | 0.80 | | | | (0.41 | ) | | | — | | | | 0.01 | | | | 0.40 | |
| Asset impairment charges, net | | | 0.71 | | | | 0.11 | | | | (0.20 | ) | | | — | | | | 0.60 | |
| |
Adjusted earnings per share — non-GAAP | | $ | 0.42 | | | $ | 0.08 | | | $ | 0.13 | | | $ | 0.26 | | | $ | 0.84 | |
| |
| | | | | | | | | | | | | | | | | | | | | |
| | | (In millions, except per share amounts) |
| | | 2008 |
| | | 1Q | | 2Q | | 3Q | | 4Q | | Dec YTD |
| | | |
Reported net income — GAAP | | $ | 103 | | | $ | 46 | | | $ | 79 | | | $ | 61 | | | $ | 289 | |
| |
After-tax items: | | | | | | | | | | | | | | | | | | | | |
| Electric and gas utility | | | — | | | | 1 | | | | 6 | | | | 5 | | | | 12 | |
| Enterprises | | | * | | | | (4 | ) | | | (* | ) | | | 1 | | | | (3 | ) |
| Corporate interest and other | | | — | | | | — | | | | (6 | ) | | | 1 | | | | (5 | ) |
| Discontinued operations (income) loss | | | (* | ) | | | 1 | | | | (1 | ) | | | * | | | | * | |
| |
Adjusted income — non-GAAP | | $ | 103 | | | $ | 44 | | | $ | 78 | | | $ | 68 | | | $ | 293 | (a) |
| |
| | | | | | | | | | | | | | | | | | | | | |
Average shares outstanding, basic | | | 223.5 | | | | 223.7 | | | | 224.1 | | | | 224.5 | | | | 223.9 | |
Average shares outstanding, diluted | | | 236.6 | | | | 239.1 | | | | 234.3 | | | | 226.6 | | | | 234.8 | |
| | | | | | | | | | | | | | | | | | | | | |
| |
Reported earnings per share — GAAP | | $ | 0.44 | | | $ | 0.19 | | | $ | 0.34 | | | $ | 0.27 | | | $ | 1.23 | |
| |
After-tax items: | | | | | | | | | | | | | | | | | | | | |
| Electric and gas utility | | | — | | | | 0.01 | | | | 0.02 | | | | 0.03 | | | | 0.05 | |
| Enterprises | | | * | | | | (0.02 | ) | | | 0.01 | | | | * | | | | (0.01 | ) |
| Corporate interest and other | | | — | | | | — | | | | (0.03 | ) | | | * | | | | (0.02 | ) |
| Discontinued operations (income) loss | | | (* | ) | | | 0.01 | | | | (0.01 | ) | | | * | | | | * | |
| |
Adjusted earnings per share — non-GAAP | | $ | 0.44 | | | $ | 0.19 | | | $ | 0.33 | | | $ | 0.30 | | | $ | 1.25 | |
| |
| | |
| |
| Note: | | Year-to-date (YTD) EPS may not equal sum of quarters due to share count differences. |
| |
| * | | Less than $500 thousand or $0.01 per share. |
2008 A-1
CMS ENERGY CORPORATION
Earnings Segment Results GAAP Reconciliation
(Unaudited)
| | | | | | | | | | | | | | | | | |
| | | Three Months Ended | | | Twelve Months Ended | |
| December 31 | | 2008 | | | 2007 | | | 2008 | | | 2007 | |
| |
Electric Utility | | | | | | | | | | | | | | | | |
| Reported | | $ | 0.17 | | | $ | 0.17 | | | $ | 1.16 | | | $ | 0.88 | |
| Dilution Impact | | | — | | | | — | | | | — | | | | (0.06 | ) |
| Unrealized Investment Loss | | | 0.02 | | | | — | | | | 0.03 | | | | — | |
| Asset Sales Loss and Other, net | | | — | | | | — | | | | * | | | | 0.01 | |
| | | | | | | | | | | | | |
| Adjusted | | $ | 0.19 | | | $ | 0.17 | | | $ | 1.19 | | | $ | 0.83 | |
| | | | | | | | | | | | | |
| | | | | | | | | | | | | | | | | |
Gas Utility | | | . | | | | | | | | | | | | | |
| Reported | | $ | 0.19 | | | $ | 0.15 | | | $ | 0.38 | | | $ | 0.39 | |
| Dilution Impact | | | — | | | | — | | | | — | | | | (0.03 | ) |
| Unrealized Investment Loss | | | 0.01 | | | | — | | | | 0.02 | | | | — | |
| Asset Sales Loss and Other, net | | | — | | | | — | | | | — | | | | 0.01 | |
| | | | | | | | | | | | | |
| Adjusted | | $ | 0.20 | | | $ | 0.15 | | | $ | 0.40 | | | $ | 0.37 | |
| | | | | | | | | | | | | |
| | | | | | | | | | | | | | | | | |
Enterprises | | | | | | | | | | | | | | | | |
| Reported | | $ | 0.01 | | | $ | (0.97 | ) | | $ | 0.06 | | | $ | (1.75 | ) |
| Unrealized Investment Loss | | | * | | | | — | | | | 0.01 | | | | — | |
| Asset Impairment Charges, net of insurance recoveries | | | — | | | | — | | | | — | | | | 0.55 | |
| Asset Sales (Gain) Loss and Other, net | | | — | | | | 0.99 | | | | (0.02 | ) | | | 1.25 | |
| | | | | | | | | | | | | |
| Adjusted | | $ | 0.01 | | | $ | 0.02 | | | $ | 0.05 | | | $ | 0.05 | |
| | | | | | | | | | | | | |
| | | | | | | | | | | | | | | | | |
Corporate Interest and Other | | | | | | | | | | | | | | | | |
| Reported | | $ | (0.10 | ) | | $ | 0.09 | | | $ | (0.37 | ) | | $ | (0.14 | ) |
| Dilution Impact | | | — | | | | — | | | | — | | | | 0.03 | |
| Unrealized Investment Loss | | | * | | | | — | | | | 0.01 | | | | — | |
| Asset Impairment Charges, net of insurance recoveries | | | — | | | | — | | | | — | | | | 0.05 | |
| Asset Sales Gain and Other, net | | | — | | | | (0.17 | ) | | | (0.03 | ) | | | (0.35 | ) |
| | | | | | | | | | | | | |
| Adjusted | | $ | (0.10 | ) | | $ | (0.08 | ) | | $ | (0.39 | ) | | $ | (0.41 | ) |
| | | | | | | | | | | | | |
| | | | | | | | | | | | | | | | | |
Discontinued Operations | | | | | | | | | | | | | | | | |
| Reported | | $ | — | | | $ | (0.01 | ) | | $ | — | | | $ | (0.40 | ) |
| Discontinued Operations Loss | | | — | | | $ | 0.01 | | | | — | | | | 0.40 | |
| | | | | | | | | | | | | |
| Adjusted | | $ | — | | | $ | — | | | $ | — | | | $ | — | |
| | | | | | | | | | | | | |
| | | | | | | | | | | | | | | | | |
Totals | | | | | | | | | | | | | | | | |
| Reported | | $ | 0.27 | | | $ | (0.57 | ) | | $ | 1.23 | | | $ | (1.02 | ) |
| Discontinued Operations Loss | | | — | | | | 0.01 | | | | — | | | | 0.40 | |
| Dilution Impact | | | — | | | | — | | | | — | | | | (0.06 | ) |
| Unrealized Investment Loss | | | 0.03 | | | | — | | | | 0.07 | | | | — | |
| Asset Impairment Charges, net of insurance recoveries | | | — | | | | — | | | | — | | | | 0.60 | |
| Asset Sales (Gain) Loss and Other, net | | | — | | | | 0.82 | | | | (0.05 | ) | | | 0.92 | |
| | | | | | | | | | | | | |
| Adjusted | | $ | 0.30 | | | $ | 0.26 | | | $ | 1.25 | | | $ | 0.84 | |
| | | | | | | | | | | | | |
| | | | | | | | | | | | | | | | | |
| Average Common Shares Outstanding — Diluted (in millions) | | | 226.6 | | | | 223.4 | | | | 234.8 | | | | 222.6 | |
| | | | | | | | | | | | | |
| | |
| * | | Less than $0.01 per share. |
2008 A-2
Consumers Energy
2008 Cash Flow GAAP Reconciliation (in millions) (unaudited)
| | | | | | | | | | | | | | | | | | | | | | | | | | | | | | | | | | | | | | | | | | | |
| | | | | | | Reclassifications From Sources and Uses to Statement of Cash Flows | | | | |
| Presentation Sources and Uses | | | Tax | | | Interest | | | Accts/Rec | | | Capital | | | Securitization | | | Operating | | | Preferred | | | Common | | | Consolidated Statements of Cash Flows |
| | | non-GAAP | | | Sharing | | | Payments | | | Financing | | | Lease Pymts | | | Debt Pymts | | | Activites | | | Dividends | | | Dividends | | | GAAP | | | |
| Description | | Amount | | | Operating | | | as Operating | | | as Operating | | | as Financing | | | as Financing | | | as Investing | | | as Financing | | | as Financing | | | Amount | | | Description |
| Cash at year end 2007 | | $ | 195 | | | $ | — | | | $ | — | | | $ | — | | | $ | — | | | $ | — | | | $ | — | | | $ | — | | | $ | — | | | $ | 195 | | | Cash at year end 2007 |
| | | | | | | | | | | | | | | | | | | | | | | | | | | | | | | | | | | | | | | | | | | |
Sources | | | | | | | | | | | | | | | | | | | | | | | | | | | | | | | | | | | | | | | | | | |
| Operating | | $ | 1,330 | | | $ | (71 | ) | | $ | (196 | ) | | $ | — | | | $ | 26 | | | $ | 32 | | | $ | 1 | | | $ | — | | | $ | — | | | $ | 1,122 | | | |
| Other working capital | | | (418 | ) | | | — | | | | — | | | | 170 | | | | — | | | | — | | | | — | | | | — | | | | — | | | | (248 | ) | | Net cash provided by operating activities |
| | | | | | | | | | | | | | | | | | | | | | | | | | | | | | | | | |
| Sources | | $ | 912 | | | $ | (71 | ) | | $ | (196 | ) | | $ | 170 | | | $ | 26 | | | $ | 32 | | | $ | 1 | | | $ | — | | | $ | — | | | $ | 874 | | | |
| | | | | | | | | | | | | | | | | | | | | | | | | | | | | | | | | | | | | | | | | | | |
Uses | | | | | | | | | | | | | | | | | | | | | | | | | | | | | | | | | | | | | | | | | | |
| Interest and preferred dividends | | $ | (198 | ) | | $ | — | | | $ | 196 | | | $ | — | | | $ | — | | | $ | — | | | $ | (1 | ) | | $ | 2 | | | $ | — | | | $ | (1 | ) | | |
| Capital expenditures | | | (823 | ) | | | — | | | | — | | | | — | | | | — | | | | — | | | | — | | | | — | | | | — | | | | (823 | ) | | |
| Dividends/tax sharing to CMS | | | (368 | ) | | | 71 | | | | — | | | | — | | | | — | | | | — | | | | — | | | | — | | | | 297 | | | | — | | | Net cash provided byinvesting activities |
| | | | | | | | | | | | | | | | | | | | | | | | | | | | | | | | | |
| Uses | | $ | (1,389 | ) | | $ | 71 | | | $ | 196 | | | $ | — | | | $ | — | | | $ | — | | | $ | (1 | ) | | $ | 2 | | | $ | 297 | | | $ | (824 | ) | | |
| | | | | | | | | | | | | | | | | | | | | | | | | | | | | | | | | | | | | | | | | | | |
| | | | | | | | | | | | | | | | | | | | | | | | | | | | | | | | | |
Cash flow | | $ | (477 | ) | | $ | — | | | $ | — | | | $ | 170 | | | $ | 26 | | | $ | 32 | | | $ | — | | | $ | 2 | | | $ | 297 | | | $ | 50 | | | Cash flow from operating and investing activities |
| | | | | | | | | | | | | | | | | | | | | | | | | | | | | | | | | | | | | | | | | | | |
Financing | | | | | �� | | | | | | | | | | | | | | | | | | | | | | | | | | | | | | | | | | | | | |
| New Issues | | $ | 686 | | | $ | — | | | $ | — | | | $ | — | | | $ | — | | | $ | — | | | $ | — | | | $ | (2 | ) | | $ | — | | | $ | 684 | | | |
| Retirements | | | (505 | ) | | | — | | | | — | | | | — | | | | (26 | ) | | | (32 | ) | | | — | | | | — | | | | (297 | ) | | | (860 | ) | | |
| Net short-term financing | | | 170 | | | | — | | | | — | | | | (170 | ) | | | — | | | | — | | | | — | | | | — | | | | — | | | | — | | | Net cash provided by financing activities |
| | | | | | | | | | | | | | | | | | | | | | | | | | | | | | | | | |
| Financing | | $ | 351 | | | $ | — | | | $ | — | | | $ | (170 | ) | | $ | (26 | ) | | $ | (32 | ) | | $ | — | | | $ | (2 | ) | | $ | (297 | ) | | $ | (176 | ) | | |
| | | | | | | | | | | | | | | | | | | | | | | | | | | | | | | | | | | | | | | | | | | |
| | | | | | | | | | | | | | | | | | | | | | | | | | | | | | | | | |
Net change in cash | | $ | (126 | ) | | $ | — | | | $ | — | | | $ | — | | | $ | — | | | $ | — | | | $ | — | | | $ | — | | | $ | — | | | $ | (126 | ) | | Net change in cash |
| |
| | | | | | | | | | | | | | | | | | | | | | | | | | | | | | | | | |
Cash at year end 2008 | | $ | 69 | | | $ | — | | | $ | — | | | $ | — | | | $ | — | | | $ | — | | | $ | — | | | $ | — | | | $ | — | | | $ | 69 | | | Cash at year end 2008 |
| | | | | | | | | | | | | | | | | | | | | | | | | | | | | | | | | |
2008 A-3
CMS Energy Parent
2008 Cash Flow GAAP Reconciliation (in millions) (unaudited)
| | | | | | | | | | | | | | | | | | | | | | | | | | | | | | | | | | | |
| | | | | | | Reclassifications From Sources and Uses to Statement of Cash Flows | | | | |
| Presentation Sources and Uses | | | | | | Interest | | | Overheads & | | | DIG | | | Other | | | Preferred | | | Cash From | | | Consolidated Statements of Cash Flows |
| | | non-GAAP | | | Payments | | | Tax Payments | | | Settlement | | | Uses (a) | | | Dividends | | | Consolidated | | | GAAP | | | |
| Description | | Amount | | | as Operating | | | as Operating | | | as Operating | | | as Operating | | | as Financing | | | Companies | | | Amount | | | Description |
| Cash at year end 2007 | | $ | 136 | | | $ | — | | | $ | — | | | $ | — | | | $ | — | | | $ | — | | | $ | 17 | | | $ | 153 | | | Cash at year end 2007 |
| | | | | | | | | | | | | | | | | | | | | | | | | | | | | | | | | | | |
Sources | | | | | | | | | | | | | | | | | | | | | | | | | | | | | | | | | | |
| Consumers Energy dividends/tax sharing | | $ | 368 | | | $ | (126 | ) | | $ | (15 | ) | | $ | — | | | $ | — | | | $ | — | | | $ | — | | | $ | 227 | | | |
| Enterprises | | | 28 | | | | — | | | | — | | | | (275 | ) | | | (11 | ) | | | — | | | | 13 | | | | (245 | ) | | Net cash provided by operating activities |
| | | | | | | | | | | | | | | | | | | | | | | | | | | |
| Sources | | $ | 396 | | | $ | (126 | ) | | $ | (15 | ) | | $ | (275 | ) | | $ | (11 | ) | | $ | — | | | $ | 13 | | | $ | (18 | ) | | |
| | | | | | | | | | | | | | | | | | | | | | | | | | | | | �� | | | | | | |
Uses | | | | | | | | | | | | | | | | | | | | | | | | | | | | | | | | | | |
| | | | | | | | | | | | | | | | | | | | | | | | | | |
| Interest and preferred dividends | | $ | (137 | ) | | $ | 126 | | | $ | — | | | $ | — | | | $ | — | | | $ | 11 | | | $ | — | | | $ | — | | | |
| Overhead and Federal tax payments | | | (15 | ) | | | — | | | | 15 | | | | — | | | | — | | | | — | | | | — | | | | — | | | |
| DIG settlement | | | (275 | ) | | | — | | | | — | | | | 275 | | | | 11 | | | | — | | | | (17 | ) | | | (6 | ) | | Net cash provided by investing activities |
| | | | | | | | | | | | | | | | | | | | | | | | | | | |
| Uses (a) | | $ | (436 | ) | | $ | 126 | | | $ | 15 | | | $ | 275 | | | $ | 11 | | | $ | 11 | | | $ | (17 | ) | | $ | (15 | ) | | |
| | | | | | | | | | | | | | | | | | | | | | | | | | | | | | | | | | | |
Cash flow | | $ | (40 | ) | | $ | — | | | $ | — | | | $ | — | | | $ | — | | | $ | 11 | | | $ | (4 | ) | | $ | (33 | ) | | Cash flow from operating and investing activities |
| | | | | | | | | | | | | | | | | | | | | | | | | | | | | | | | | | | |
Financing and dividends | | | | | | | | | | | | | | | | | | | | | | | | | | | | | | | | | | |
| New Issues | | $ | 8 | | | $ | — | | | $ | — | | | $ | — | | | $ | — | | | $ | (11 | ) | | $ | 14 | | | $ | 11 | | | |
| Retirements | | | (11 | ) | | | — | | | | — | | | | — | | | | — | | | | — | | | | — | | | | (11 | ) | | |
| Net short-term financing | | | 105 | | | | — | | | | — | | | | — | | | | — | | | | — | | | | — | | | | 105 | | | |
| Common dividend | | | (81 | ) | | | — | | | | — | | | | — | | | | — | | | | — | | | | — | | | | (81 | ) | | Net cash provided by financing activities |
| | | | | | | | | | | | | | | | | | | | | | | | | | | |
| Financing | | $ | 21 | | | $ | — | | | $ | — | | | $ | — | | | $ | — | | | $ | (11 | ) | | $ | 14 | | | $ | 24 | | | |
| | | | | | | | | | | | | | | | | | | | | | | | | | | | | | | | | | | |
| | | | | | | | | | | | | | | | | | | | | | | | | | | |
Net change in cash | | $ | (19 | ) | | $ | — | | | $ | — | | | $ | — | | | $ | — | | | $ | — | | | $ | 10 | | | $ | (9 | ) | | Net change in cash |
| |
| | | | | | | | | | | | | | | | | | | | | | | | | | | |
Cash at year end 2008 | | $ | 117 | | | $ | — | | | $ | — | | | $ | — | | | $ | — | | | $ | — | | | $ | 27 | | | $ | 144 | | | Cash at year end 2008 |
| | | | | | | | | | | | | | | | | | | | | | | | | | | |
| | |
| (a) | | Includes other and roundings |
2008 A-4
Consolidated CMS Energy
2008 Consolidation of Consumers Energy and CMS Energy Parent Statements of Cash Flow (in millions) (unaudited)
| | | | | | | | | | | | | | | | | | | | | | | | | |
| | | | | | | | | | | Eliminations/Reclassifications to Arrive at the | | | | |
| | | | | | | | | | | Consolidated Statement of Cash Flows | | | | |
| Statements of Cash Flows | | | Consumers | | | Equity | | | | |
| | | Consumers | | | CMS Parent | | | Common Dividend | | | Infusions to | | | Consolidated Statements of Cash Flows |
| Description | | Amount | | | Amount | | | as Financing | | �� | Consumers | | | Amount | | | Description |
Cash at year end 2007 | | $ | 195 | | | $ | 153 | | | $ | — | | | $ | — | | | $ | 348 | | | Cash at year end 2007 |
| |
Net cash provided by operating activities | | $ | 874 | | | $ | (18 | ) | | $ | (297 | ) | | $ | — | | | $ | 559 | | | Net cash provided by operating activities |
| |
Net cash provided by investing activities | | | (824 | ) | | | (15 | ) | | | — | | | | — | | | | (839 | ) | | Net cash provided by investing activities |
| | | | | | | | | | | | | | | | | | | | |
| |
Cash flow from operating and investing activities | | $ | 50 | | | $ | (33 | ) | | $ | (297 | ) | | $ | — | | | $ | (280 | ) | | Cash flow from operating and investing activities |
| |
Net cash provided by financing activities | | $ | (176 | ) | | $ | 24 | | | $ | 297 | | | $ | — | | | $ | 145 | | | Net cash provided by financing activities |
| |
| | | | | | | | | | | | | | | | | | | | |
Net change in cash | | $ | (126 | ) | | $ | (9 | ) | | $ | — | | | $ | — | | | $ | (135 | ) | | Net change in cash |
| |
| | | | | | | | | | | | | | | | | | | | |
Cash at year end 2008 | | $ | 69 | | | $ | 144 | | | $ | — | | | $ | — | | | $ | 213 | | | Cash at year end 2008 |
| | | | | | | | | | | | | | | | | | | | |
2008 A-5
CMS Energy
Reconciliation of 2008 Free Cash Flow to GAAP Free Cash Flow
(unaudited)
| | | | | | | | | |
| | | Amount | | | | | |
| | | (mils) | | | | | |
Statement of cash flows | | | | | | | | |
| | | | | | | | | |
| Operating activities | | $ | 559 | | | | | |
| Investing activities | | | (839 | ) | | | | |
| | | | | | | | | |
| | | | | | | | |
Cash flow from operating and investing activities | | $ | (280 | ) | | SCF changes |
| | | | | | | | |
| | | | | | | | | |
Adjustments to reconcile free cash flow | | | | | | | | |
| Reclassify financing activities as operating | | | | | | | | |
| Capital lease payments | | $ | (26 | ) | | | | |
| Securitization debt retirements | | | (32 | ) | | | | |
| Preferred dividend payments | | | (13 | ) | | | | |
| | | | | | | | | |
| Reclassify operating activities as financing | | | | | | | | |
| Accounts receivable financing | | | (170 | ) | | | | |
| | | | | | | | | |
| Reclassify Consolidating Cash | | | 4 | | | | | |
| | | | | | | | | |
| | | | | | | | |
Total free cash flow before dividends | | $ | (517 | ) | | Free cash flow changes |
| | | | | | | | |
| | | | | | | | | |
| Addback capex | | | | | | | | |
| Consumers Energy | | | 823 | | | | | |
| Enterprises | | | 3 | | | | | |
| | | | | | | | | |
| Rounding | | | — | | | | | |
| | | | | | | | | |
| | | | | | | | |
Free cash flow before dividends and capex | | $ | 309 | | | | | |
| | | | | | | | |
2008 A-6
Consumers Energy
2009 Forecasted Cash Flow GAAP Reconciliation (in millions) (unaudited)
| | | | | | | | | | | | | | | | | | | | | | | | | | | | | | | | | | | | | | | | | |
| | | | | | | Reclassifications From Sources and Uses to Statement of Cash Flows | | | | |
| Presentation Sources and Uses | | | Tax | | | Interest | | | Accts/Rec | | | Capital | | | Securitization | | | Preferred | | | Common | | | Consolidated Statements of Cash Flows | |
| | | non-GAAP | | | Sharing | | | Payments | | | Financing | | | Lease Pymts | | | Debt Pymts | | | Dividends | | | Dividends | | | GAAP | | | | |
| Description | | Amount | | | Operating | | | as Operating | | | as Operating | | | as Financing | | | as Financing | | | as Financing | | | as Financing | | | Amount | | | Description | |
| Cash at year end 2008 | | $ | 69 | | | $ | — | | | $ | — | | | $ | — | | | $ | — | | | $ | — | | | $ | — | | | $ | — | | | $ | 69 | | | Cash at year end 2008 |
| |
Sources | | | | | | | | | | | | | | | | | | | | | | | | | | | | | | | | | | | | | | | | |
| Operating | | $ | 1,350 | | | $ | (75 | ) | | $ | (228 | ) | | $ | — | | | $ | 26 | | | $ | 34 | | | $ | — | | | $ | — | | | $ | 1,107 | | | | | |
| Other working capital | | | (100 | ) | | | — | | | | — | | | | 80 | | | | — | | | | — | | | | — | | | | — | | | | (20 | ) | | Net cash provided by operating activities |
| | | | | | | | | | | | | | | | | | | | | | | | | | | | | | | | |
| Sources | | $ | 1,250 | | | $ | (75 | ) | | $ | (228 | ) | | $ | 80 | | | $ | 26 | | | $ | 34 | | | $ | — | | | $ | — | | | $ | 1,087 | | | | | |
| | | | | | | | | | | | | | | | | | | | | | | | | | | | | | | | | | | | | | | | | |
Uses | | | | | | | | | | | | | | | | | | | | | | | | | | | | | | | | | | | | | | | | |
| Interest and preferred dividends | | $ | (230 | ) | | $ | — | | | $ | 228 | | | $ | — | | | $ | — | | | $ | — | | | $ | 2 | | | $ | — | | | $ | — | | | | | |
| Pension Contribution | | | (290 | ) | | | — | | | | — | | | | — | | | | — | | | | — | | | | — | | | | — | | | | (290 | ) | | | | |
| Capital expenditures | | | (850 | ) | | | — | | | | — | | | | — | | | | — | | | | — | | | | — | | | | — | | | | (850 | ) | | | | |
| Dividends/tax sharing to CMS | | | (380 | ) | | | 75 | | | | — | | | | — | | | | — | | | | — | | | | — | | | | 305 | | | | — | | | Net cash provided by investing activities |
| | | | | | | | | | | | | | | | | | | | | | | | | | | | | | | | |
| Uses | | $ | (1,750 | ) | | $ | 75 | | | $ | 228 | | | $ | — | | | $ | — | | | $ | — | | | $ | 2 | | | $ | 305 | | | $ | (1,140 | ) | | | | |
| | | | | | | | | | | | | | | | | | | | | | | | | | | | | | | | | | | | | | | | | |
| | | | | | | | | | | | | | | | | | | | | | | | | | | | | | | | |
Cash flow | | $ | (500 | ) | | $ | — | | | $ | — | | | $ | 80 | | | $ | 26 | | | $ | 34 | | | $ | 2 | | | $ | 305 | | | $ | (53 | ) | | Cash flow from operating and investing activities |
| | | | | | | | | | | | | | | | | | | | | | | | | | | | | | | | | | | | | | | | | |
Financing | | | | | | | | | | | | | | | | | | | | | | | | | | | | | | | | | | | | | | | | |
| Equity | | $ | 100 | | | $ | — | | | $ | — | | | $ | — | | | $ | — | | | $ | — | | | $ | (2 | ) | | $ | — | | | $ | 98 | | | | | |
| New Issues | | | 500 | | | | — | | | | — | | | | — | | | | — | | | | — | | | | — | | | | — | | | | 500 | | | | | |
| Retirements | | | (350 | ) | | | — | | | | — | | | | — | | | | (26 | ) | | | (34 | ) | | | — | | | | (305 | ) | | | (715 | ) | | | | |
| Net short-term financing | | | 221 | | | | — | | | | — | | | | (80 | ) | | | — | | | | — | | | | — | | | | — | | | | 141 | | | Net cash provided by financing activities |
| | | | | | | | | | | | | | | | | | | | | | | | | | | | | | | | |
| Financing | | $ | 471 | | | $ | — | | | $ | — | | | $ | (80 | ) | | $ | (26 | ) | | $ | (34 | ) | | $ | (2 | ) | | $ | (305 | ) | | $ | 24 | | | | | |
| | | | | | | | | | | | | | | | | | | | | | | | | | | | | | | | | | | | | | | | | |
| | | | | | | | | | | | | | | | | | | | | | | | | | | | | | | | |
Net change in cash | | $ | (29 | ) | | $ | — | | | $ | — | | | $ | — | | | $ | — | | | $ | — | | | $ | — | | | $ | — | | | $ | (29 | ) | | Net change in cash |
| | | | | | | | | | | | | | | | | | | | | | | | | | | | | | | | | | | | | | | | | |
| | | | | | | | | | | | | | | | | | | | | | | | | | | | | | | | |
Cash at year end 2009 | | $ | 40 | | | $ | — | | | $ | — | | | $ | — | | | $ | — | | | $ | — | | | $ | — | | | $ | — | | | $ | 40 | | | Cash at year end 2009 |
| | | | | | | | | | | | | | | | | | | | | | | | | | | | | | | | |
2009 A-1
CMS Energy Parent
2009 Forecasted Cash Flow GAAP Reconciliation (in millions) (unaudited)
| | | | | | | | | | | | | | | | | | | | | | | | | | | | | | | | | |
| | | | | | | Reclassifications From Sources and Uses to Statement of Cash Flows | | | | |
| Presentation Sources and Uses | | | Interest | | | Overheads & | | | Other | | | Preferred | | | Cash From | | | Consolidated Statements of Cash Flows | |
| | | non-GAAP | | | Payments | | | Tax Payments | | | Uses (a) | | | Dividends | | | Consolidated | | | GAAP | | | | |
| Description | | Amount | | | as Operating | | | as Operating | | | as Operating | | | as Financing | | | Companies | | | Amount | | | Description | |
| Cash at year end 2008 | | $ | 117 | | | $ | — | | | $ | — | | | $ | — | | | $ | — | | | $ | 27 | | | $ | 144 | | | Cash at year end 2008 |
| | | | | | | | | | | | | | | | | | | | | | | | | | | | | | | | | |
Sources | | | | | | | | | | | | | | | | | | | | | | | | | | | | | | | | |
| Consumers Energy dividends/tax sharing | | $ | 380 | | | $ | (119 | ) | | $ | (50 | ) | | $ | — | | | $ | — | | | $ | — | | | $ | 211 | | | | | |
| Enterprises | | | 40 | | | | — | | | | — | | | | (40 | ) | | | — | | | | — | | | | — | | | Net cash provided by operating activities |
| | | | | | | | | | | | | | | | | | | | | | | | | | |
| Sources | | $ | 420 | | | $ | (119 | ) | | $ | (50 | ) | | $ | (40 | ) | | $ | — | | | $ | — | | | $ | 211 | | | | | |
| | | | | | | | | | | | | | | | | | | | | | | | | | | | | | | | | |
Uses | | | | | | | | | | | | | | | | | | | | | | | | | | | | | | | | |
| Interest and preferred dividends | | $ | (130 | ) | | $ | 119 | | | $ | — | | | $ | — | | | $ | 11 | | | $ | — | | | $ | — | | | | | |
| Overhead and Federal tax payments | | | (50 | ) | | | — | | | | 50 | | | | — | | | | — | | | | — | | | | — | | | | | |
| Pension Contributions | | | (10 | ) | | | — | | | | — | | | | 10 | | | | — | | | | — | | | | — | | | | | |
| Equity infusions | | | (100 | ) | | | — | | | | — | | | | 30 | | | | — | | | | (50 | ) | | | (120 | ) | | Net cash provided by investing activities |
| | | | | | | | | | | | | | | | | | | | | | | | | | |
| Uses (a) | | $ | (320 | ) | | $ | 119 | | | $ | 50 | | | $ | 40 | | | $ | 11 | | | $ | (50 | ) | | $ | (150 | ) | | | | |
| | | | | | | | | | | | | | | | | | | | | | | | | | | | | | | | | |
| | | | | | | | | | | | | | | | | | | | | | | | | | |
Cash flow | | $ | 100 | | | $ | ��� | | | $ | — | | | $ | — | | | $ | 11 | | | $ | (50 | ) | | $ | 61 | | | Cash flow from operating and investing activities |
| | | | | | | | | | | | | | | | | | | | | | | | | | | | | | | | | |
Financing and dividends | | | | | | | | | | | | | | | | | | | | | | | | | | | | | | | | |
| New Issues | | $ | 300 | | | $ | — | | | $ | — | | | $ | — | | | $ | (11 | ) | | $ | 50 | | | $ | 339 | | | | | |
| Retirements | | | (310 | ) | | | — | | | | — | | | | — | | | | — | | | | — | | | | (310 | ) | | | | |
| Net short-term financing | | | (45 | ) | | | — | | | | — | | | | — | | | | — | | | | — | | | | (45 | ) | | | | |
| Common dividend | | | (112 | ) | | | — | | | | — | | | | — | | | | — | | | | — | | | | (112 | ) | | Net cash provided by financing activities |
| | | | | | | | | | | | | | | | | | | | | | | | | | |
| Financing | | $ | (167 | ) | | $ | — | | | $ | — | | | $ | — | | | $ | (11 | ) | | $ | 50 | | | $ | (128 | ) | | | | |
| | | | | | | | | | | | | | | | | | | | | | | | | | | | | | | | | |
| | | | | | | | | | | | | | | | | | | | | | | | | | |
Net change in cash | | $ | (67 | ) | | $ | — | | | $ | — | | | $ | — | | | $ | — | | | $ | — | | | $ | (67 | ) | | Net change in cash |
| | | | | | | | | | | | | | | | | | | | | | | | | | | | | | | | | |
| | | | | | | | | | | | | | | | | | | | | | | | | | |
Cash at year end 2009 | | $ | 50 | | | $ | — | | | $ | — | | | $ | — | | | $ | — | | | $ | 27 | | | $ | 77 | | | Cash at year end 2009 |
| | | | | | | | | | | | | | | | | | | | | | | | | | |
| | |
| (a) | | Includes other and roundings |
2009 A-2
Consolidated CMS Energy
2009 Forecasted Consolidation of Consumers Energy and CMS Energy Parent Statements of Cash Flow (in millions) (unaudited)
| | | | | | | | | | | | | | | | | | | | | | | | | |
| | | | | | | | | | | Eliminations/Reclassifications to Arrive at the | | | | |
| | | | | | | | | | | Consolidated Statement of Cash Flows | | | | |
| Statements of Cash Flows | | | Consumers | | | Equity | | | | |
| | | Consumers | | | CMS Parent | | | Common Dividend | | | Infusions to | | | Consolidated Statements of Cash Flows | |
| Description | | Amount | | | Amount | | | as Financing | | | Consumers | | | Amount | | | Description | |
Cash at year end 2008 | | $ | 195 | | | $ | 153 | | | $ | — | | | $ | — | | | $ | 348 | | | Cash at year end 2008 |
| | | | | | | | | | | | | | | | | | | | | | | | | |
Net cash provided by operating activities | | $ | 1,087 | | | $ | 211 | | | $ | (305 | ) | | $ | — | | | $ | 993 | | | Net cash provided by operating activities |
| | | | | | | | | | | | | | | | | | | | | | | | | |
Net cash provided by investing activities | | | (1,140 | ) | | | (150 | ) | | | — | | | | 100 | | | | (1,190 | ) | | Net cash provided by investing activities |
| | | | | | | | | | | | | | | | | | | | | | | | | |
| | | | | | | | | | | | | | | | | | | | |
Cash flow from operating and investing activities | | $ | (53 | ) | | $ | 61 | | | $ | (305 | ) | | $ | 100 | | | $ | (197 | ) | | Cash flow from operating and investing activities |
| | | | | | | | | | | | | | | | | | | | | | | | | |
Net cash provided by financing activities | | $ | 24 | | | $ | (128 | ) | | $ | 305 | | | $ | (100 | ) | | $ | 101 | | | Net cash provided by financing activities |
| | | | | | | | | | | | | | | | | | | | | | | | | |
| | | | | | | | | | | | | | | | | | | | |
Net change in cash | | $ | (29 | ) | | $ | (67 | ) | | $ | — | | | $ | — | | | $ | (96 | ) | | Net change in cash |
| | | | | | | | | | | | | | | | | | | | | | | | | |
| | | | | | | | | | | | | | | | | | | | |
Cash at year end 2009 | | $ | 166 | | | $ | 86 | | | $ | — | | | $ | — | | | $ | 252 | | | Cash at year end 2009 |
| | | | | | | | | | | | | | | | | | | | |
2009 A-3
| |
CMS Energy
Reconciliation of 2009 Forecasted Free Cash Flow to GAAP Free Cash Flow
(unaudited) |
| | | | | | | | | |
| | | Amount | | | | | |
| | | (mils) | | | | | |
Statement of cash flows | | | | | | | | |
| | | | | | | | | |
| Operating activities | | $ | 993 | | | | | |
| Investing activities | | | (1,190 | ) | | | | |
| | | | | | | | | |
| | | | | | | | |
Cash flow from operating and investing activities | | $ | (197 | ) | | SCF changes |
| | | | | | | | |
| | | | | | | | | |
Adjustments to reconcile free cash flow | | | | | | | | |
| Reclassify financing activities as operating | | | | | | | | |
| Capital lease payments | | $ | (26 | ) | | | | |
| Securitization debt retirements | | | (34 | ) | | | | |
| Preferred dividend payments | | | (13 | ) | | | | |
| | | | | | | | | |
| Reclassify operating activities as financing | | | | | | | | |
| Accounts receivable financing | | | (80 | ) | | | | |
| | | | | | | | | |
| Reclassify Consolidating Cash | | | 50 | | | | | |
| | | | | | | | | |
| | | | | | | | |
Total free cash flow before dividends | | $ | (300 | ) | | Free cash flow changes |
| | | | | | | | |
| | | | | | | | | |
| Addback capex | | | | | | | | |
| Consumers Energy | | | 850 | | | | | |
| Enterprises | | | — | | | | | |
| | | | | | | | | |
| Rounding | | | — | | | | | |
| | | | | | | | | |
| | | | | | | | |
Free cash flow before dividends and capex | | $ | 550 | | | | | |
| | | | | | | | |
2009 A-4