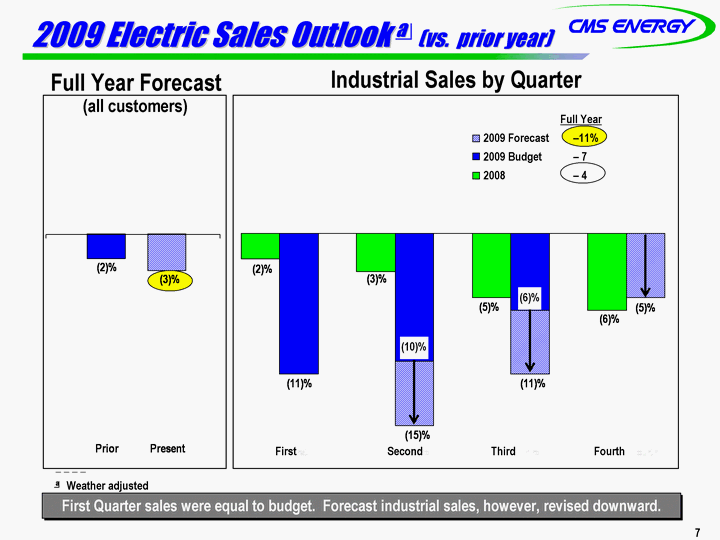
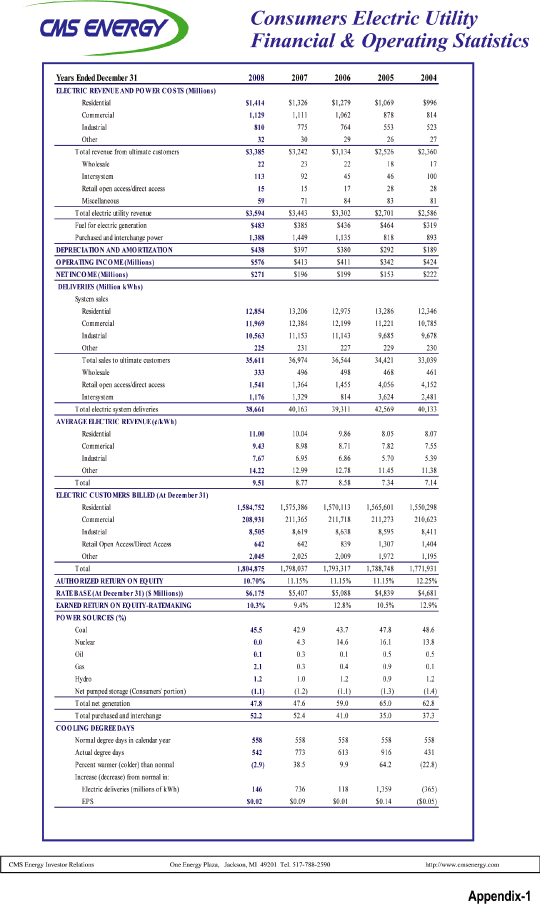
| RATE BASE (At December 31) ($ Millions)) 2008 2007 2006 2005 2004 —— —— —— —— —— —ELECTRIC REVENUE AND POWER COSTS (Millions) Residential$ 1,414$ 1,326 $ 1,279 $ 1,069 $ 996 Commercial1,1291,111 1,062 878 814 Industrial810775 764 553 523 Other3230 29 26 27 Total revenue from ultimate customers$ 3,385$ 3,242 $ 3,134 $ 2,526 $ 2,360 Wholesale2223 22 18 17 Intersystem11392 45 46 100 Retail open access/direct access1515 17 28 28 Miscellaneous5971 84 83 81 Total electric utility revenue$ 3,594$ 3,443 $ 3,302 $ 2,701 $ 2,586 Fuel for electric generation$ 483$ 385 $ 436 $ 464 $ 319 Purchased and interchange power1,3881,449 1,135 818 893DEPRECIATION AND AMORTIZATION $ 438$ 397 $ 380 $ 292 $ 189OPERATING INCOME (Millions) $ 576$ 413 $ 411 $ 342 $ 424NET INCOME (Millions) $ 271$ 196 $ 199 $ 153 $ 222DELIVERIES (Million kWhs) System sales Residential12,85413,206 12,975 13,286 12,346 Commercial11,96912,384 12,199 11,221 10,785 Industrial10,56311,153 11,143 9,685 9,678 Other225231 227 229 230 Total sales to ultimate customers35,61136,974 36,544 34,421 33,039 Wholesale333496 498 468 461 Retail open access/direct access1,5411,364 1,455 4,056 4,152 Intersystem1,1761,329 814 3,624 2,481 Total electric system deliveries38,66140,163 39,311 42,569 40,133AVERAGE ELECTRIC REVENUE (¢/kWh) Residential11.0010.04 9.86 8.05 8.07 Commerical9.438.98 8.71 7.82 7.55 Industrial7.676.95 6.86 5.70 5.39 Other14.2212.99 12.78 11.45 11.38 Total9.518.77 8.58 7.34 7.14ELECTRIC CUSTOMERS BILLED (At December 31) Residential1,584,7521,575,386 1,570,113 1,565,601 1,550,298 Commercial208,931211,365 211,718 211,273 210,623 Industrial8,5058,619 8,638 8,595 8,411 Retail Open Access/Direct Access642642 839 1,307 1,404 Other2,0452,025 2,009 1,972 1,195 Total1,804,8751,798,037 1,793,317 1,788,748 1,771,931AUTHORIZED RETURN ON EQUITY 10.70%11.15% 11.15% 11.15% 12.25%RATE BASE (At December 31) ($ Millions)) $ 6,175$ 5,407 $ 5,088 $ 4,839 $ 4,681EARNED RETURN ON EQUITY-RATEMAKING 10.3%9.4% 12.8% 10.5% 12.9%POWER SOURCES (%) Coal45.542.9 43.7 47.8 48.6 Nuclear0.04.3 14.6 16.1 13.8 Oil0.10.3 0.1 0.5 0.5 Gas2.10.3 0.4 0.9 0.1 Hydro1.21.0 1.2 0.9 1.2 Net pumped storage (Consumers’ portion)(1.1)(1.2) (1.1) (1.3) (1.4) Total net generation47.847.6 59.0 65.0 62.8 Total purchased and interchange52.252.4 41.0 35.0 37.3COOLING DEGREE DAYS Normal degree days in calendar year558558 558 558 558 Actual degree days542773 613 916 431 Percent warmer (colder) than normal(2.9)38.5 9.9 64.2 (22.8) Increase (decrease) from normal in: Electric deliveries (millions of kWh)146736 118 1,359 (365) EPS$ 0.02$ 0.09 $ 0.01 $ 0.14 ($0.05) |
