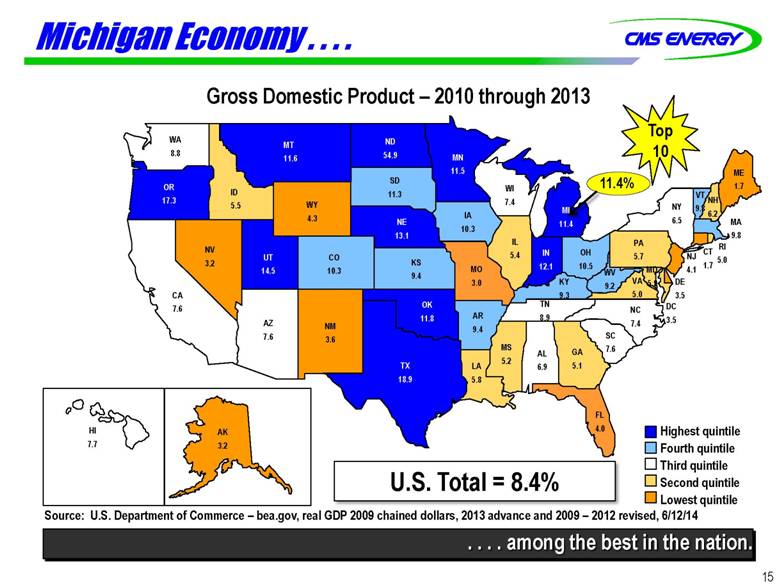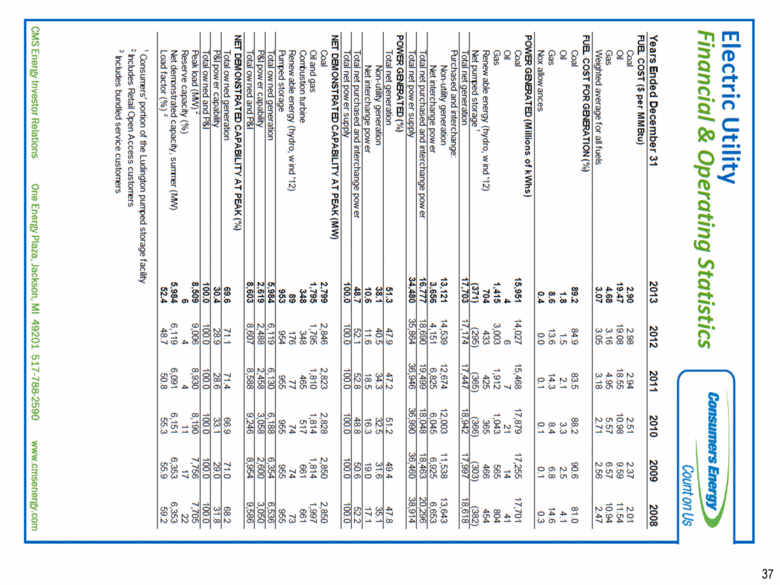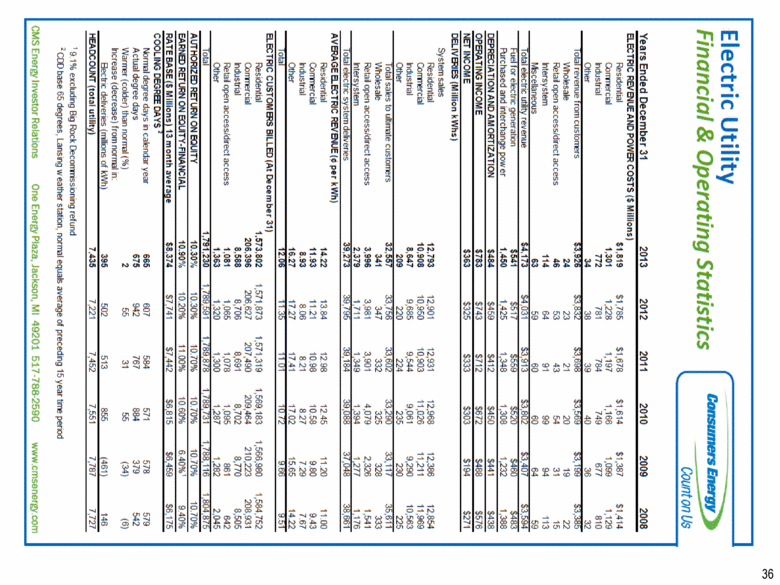
| 36 Electric Utility Financial & Operating Statistics Consumers Energy Count on Us Years Ended December 31 2013 2012 2011 2010 2009 2008 ELECTRIC REVENUE AND POWER COSTS ($ Millions) Residential $1,319 $1,785 $1,678 $1,614 $1,387 $1,414 Commercial 1,301 1,228 1,197 1,166 1,099 1,129 Industrial 772 781 784 749 677 810 Other 34 38 39 40 36 32 Total revenue from customers $3,926 $3,832 $3,698 $3,569 $3,199 $3,385 Wholesale 24 23 21 20 19 22 Retail open access/direct access 46 53 43 54 31 15 Intersystem 114 64 91 99 94 113 Miscellaneous 69 59 60 60 64 59 Total electric utility revenue $4,173 $4,031 $3,913 $3,802 $3,407 $3,594 Fuel for electric generation $541 $517 $559 $520 $460 $483 Purchased and interchange power 1,450 1,425 1,348 1,308 1,232 1,388 DEPRECIATION AND AMORTIZATION $484 $459 $412 $450 $441 $438 OPERATING INCOME $783 $743 $712 $672 $488 $576 NET INCOME $363 $325 $333 $303 $194 $271 DELIVERIES (Million k Whs) System sales Residential 12,793 12,901 12,931 12,968 12,386 12,854 Commercial 10,908 10,950 10,903 11,026 11,211 11,969 Industrial 8,647 9,685 9,544 9,061 9,290 10,563 Other 209 220 224 235 230 225 Total sales to ultimate customers 32,667 33,756 33,602 33,290 33,117 35,611 Wholesale 341 347 332 325 328 333 Retail open access/direct access 3,996 3,981 3,901 4,079 2,326 1,541 Intersystem 2,379 1,711 1,349 1,394 1,277 1,176 Total electric system deliveries 39,273 39,795 39,184 39,088 37,048 38,661 AVERAGE ELECTRIC REVENUE(¢ per kWh) Residential 14.22 13.84 12.98 12.45 11.20 11.00 Commercial 11.93 11.21 10.98 10.58 9.80 9.43 Industrial 8.93 8.06 8.21 8.27 7.29 7.67 Other 16.27 17.27 17.41 17.02 15.65 14.22 Total 12.06 11.35 11.01 10.72 9.66 9.51 ELECTRIC CUSTOMERS BILLED (At December 31) Residential 1,573,602 1,571,873 1,571,319 1,569,183 1,566,980 1,584,752 Commercial 206,396 206,627 207,490 209,464 210,223 208,931 Industrial 8,588 8,706 8,691 8,702 8,770 8,505 Retail open access/direct access 1,081 1,065 1,078 1,095 861 642 Other 1,363 1,320 1,300 1,287 1,282 2,045 Total 1,791,230 1,789,591 1,789,878 1,789,731 1,788,116 1,804,875 AUTHORIZED RETURN ON EQUITY 10.30% 10.30% 10.70% 10.70% 10.70% 10.70% EARNED RETURN ON EQUITY-FINANCIAL 10.90% 10.20% 11.00% 10.60% 6.40%(1) 9.40% RATE BASE ($ Millions) 13 month average $8,374 $7,741 $7,442 $6,815 $6,459 $6,175 COOLING DEGREE DAYS(2) Normal degree days in calendar year 665 607 584 571 578 579 Actual degree days 675 942 767 884 379 542 Warmer (colder) than normal (%) 2 55 31 55 (34) (6) Increase (decrease) from normal in: Electric deliveries (millions of kWh) 395 502 513 855 (461) 146 HEADCOUNT (total utility) 7,435 7,221 7,452 7,551 7,787 7,727 (1) 9.1% excluding Big Rock Decommissioning refund (2) CDO base 65 degrees, Lansing weather station, normal equals average of preceding 15 year time period CMS Energy Investor Relations One Energy Plaza, Jackson, Ml 49201 517-788-2590 www.cmsenergy.com |